Mites as biological tags of their hosts
9
Mites as biological tags of their hosts NADIA BRUYNDONCKX,* FRANC ¸ OIS BIOLLAZ,* SYLVAIN DUBEY,† JE ´ RO ˆ ME GOUDET* and PHILIPPE CHRISTE* *Department of Ecology and Evolution, University of Lausanne, CH 1015 Lausanne, Switzerland, †School of Biological Sciences, University of Sydney, Heydon-Laurence Bld, A08, Science Road, Sydney, NSW 2006, Australia Abstract Movements and spatial distribution of host populations are expected to shape the genetic structure of their parasite populations. Comparing the genetic patterns of both interacting species may improve our understanding of their evolutionary history. Moreover, genetic analyses of parasites with horizontal transmission may serve as indicators of historical events or current demographic processes that are not apparent in the genetic signature of their hosts. Here, we compared mitochondrial variation in populations of the ectoparasitic mite Spinturnix myoti with the genetic pattern of its host, the Maghrebian bat Myotis punicus in North Africa and in the islands of Corsica and Sardinia. Mite mitochondrial differentiation among populations was correlated with both host mitochondrial and nuclear differentiation, suggesting spatial co-differentiation of the lineages of the two interacting species. Therefore our results suggest that parasite dispersal is exclusively mediated by host movements, with open water between landmasses as a main barrier for host and parasite dispersal. Surprisingly the unique presence of a continental European mite lineage in Corsica was inconsistent with host phylogeographical history and strongly suggests the former presence of European mouse-eared bats on this island. Parasites may thus act as biological tags to reveal the presence of their now locally extinct host. Keywords: Corsica, mtDNA, North Africa, population genetics, Sardinia, Spinturnicidae Received 9 February 2010; revision received 21 April 2010; accepted 27 April 2010 Introduction Comparative phylogeographical studies can expand our understanding of the ecology and evolutionary history of host and parasite populations (Nieberding & Olivieri 2007). For parasites, hosts represent a patchy and dynamic resource that varies spatially and temporally. At the population level, demography, movements and distribution of hosts are the main factors determining genetic structure of parasite populations, especially for parasites without free-living stages or with low dis- persal ability (Nadler 1995; Criscione et al. 2005; Huyse et al. 2005; Whiteman & Parker 2005; Barrett et al. 2008; McCoy 2009; Biollaz et al. 2010). Although evidence for vertical transmission is difficult to ascertain (see e.g. Schwarz et al. 2008), vertically transmitted parasites are assumed to best retain the genealogical history of their host (Rannala & Michalakis 2003; Wirth et al. 2005). However, horizontally transmitted parasites can also provide information on ecological history of their hosts by revealing non-reproductive interactions (Criscione & Blouin 2004; Whiteman et al. 2004). The population genetics of such parasites could serve as indicators of historical events or current demographic processes that are not apparent in the genetic signature of their hosts. For example, Reed et al. (2004) have used parasite genealogies to infer direct contact between modern and archaic humans. The aims of this study were to assess the phylogeo- graphic pattern of one parasite species, to investigate how constraints imposed by the host’s spatial distribu- tion influence parasite genetic structure and to evaluate whether parasites may be used as biological tags of their hosts. As a model system, we used the wing mite Spinturnix myoti parasitizing three closely related bat Correspondence: Nadia Bruyndonckx, Fax: +41216924165; E-mail: [email protected] Ó 2010 Blackwell Publishing Ltd Molecular Ecology (2010) 19, 2770–2778 doi: 10.1111/j.1365-294X.2010.04699.x
-
Upload
independent -
Category
Documents
-
view
1 -
download
0
Transcript of Mites as biological tags of their hosts

Molecular Ecology (2010) 19, 2770–2778 doi: 10.1111/j.1365-294X.2010.04699.x
Mites as biological tags of their hosts
NADIA BRUYNDONCKX,* FRANCOIS BIOLLAZ,* SYLVAIN DUBEY,† J EROME GOUDET* and
PHILIPPE CHRISTE*
*Department of Ecology and Evolution, University of Lausanne, CH 1015 Lausanne, Switzerland, †School of Biological Sciences,
University of Sydney, Heydon-Laurence Bld, A08, Science Road, Sydney, NSW 2006, Australia
Corresponde
E-mail: nadia
Abstract
Movements and spatial distribution of host populations are expected to shape the genetic
structure of their parasite populations. Comparing the genetic patterns of both
interacting species may improve our understanding of their evolutionary history.
Moreover, genetic analyses of parasites with horizontal transmission may serve as
indicators of historical events or current demographic processes that are not apparent in
the genetic signature of their hosts. Here, we compared mitochondrial variation in
populations of the ectoparasitic mite Spinturnix myoti with the genetic pattern of its host,
the Maghrebian bat Myotis punicus in North Africa and in the islands of Corsica and
Sardinia. Mite mitochondrial differentiation among populations was correlated with
both host mitochondrial and nuclear differentiation, suggesting spatial co-differentiation
of the lineages of the two interacting species. Therefore our results suggest that parasite
dispersal is exclusively mediated by host movements, with open water between
landmasses as a main barrier for host and parasite dispersal. Surprisingly the unique
presence of a continental European mite lineage in Corsica was inconsistent with host
phylogeographical history and strongly suggests the former presence of European
mouse-eared bats on this island. Parasites may thus act as biological tags to reveal the
presence of their now locally extinct host.
Keywords: Corsica, mtDNA, North Africa, population genetics, Sardinia, Spinturnicidae
Received 9 February 2010; revision received 21 April 2010; accepted 27 April 2010
Introduction
Comparative phylogeographical studies can expand our
understanding of the ecology and evolutionary history
of host and parasite populations (Nieberding & Olivieri
2007). For parasites, hosts represent a patchy and
dynamic resource that varies spatially and temporally.
At the population level, demography, movements and
distribution of hosts are the main factors determining
genetic structure of parasite populations, especially for
parasites without free-living stages or with low dis-
persal ability (Nadler 1995; Criscione et al. 2005; Huyse
et al. 2005; Whiteman & Parker 2005; Barrett et al. 2008;
McCoy 2009; Biollaz et al. 2010). Although evidence for
vertical transmission is difficult to ascertain (see e.g.
Schwarz et al. 2008), vertically transmitted parasites are
nce: Nadia Bruyndonckx, Fax: +41216924165;
assumed to best retain the genealogical history of their
host (Rannala & Michalakis 2003; Wirth et al. 2005).
However, horizontally transmitted parasites can also
provide information on ecological history of their hosts
by revealing non-reproductive interactions (Criscione &
Blouin 2004; Whiteman et al. 2004). The population
genetics of such parasites could serve as indicators of
historical events or current demographic processes that
are not apparent in the genetic signature of their hosts.
For example, Reed et al. (2004) have used parasite
genealogies to infer direct contact between modern and
archaic humans.
The aims of this study were to assess the phylogeo-
graphic pattern of one parasite species, to investigate
how constraints imposed by the host’s spatial distribu-
tion influence parasite genetic structure and to evaluate
whether parasites may be used as biological tags of their
hosts. As a model system, we used the wing mite
Spinturnix myoti parasitizing three closely related bat
� 2010 Blackwell Publishing Ltd
POPULATION GENETI CS OF SPINTURNIX MYOTI 2771
species in the Western Palearctic region: the Maghrebian
bat, Myotis punicus, the greater and the lesser mouse-
eared bats, M. myotis and M. blythii. Bats are flying and
nocturnal mammals with cryptic lifestyles and the survey
of their parasites may give more insight into their ecology
and evolutionary history. Spinturnicid mite are ectopara-
sites living exclusively on the wing membranes of their
bat hosts (Deunff & Beaucournu 1981). They are direct
(no intermediate host), obligate (no free-living stage) and
contact transmitted parasites that cannot survive sepa-
rately from their host for more than a few hours (Giorgi
et al. 2004). As these mites depend strictly on host body
contact for dispersal, they are especially suitable for
inferring the history and ecology of their hosts. Unlike in
other mammal host-parasite systems, adult female bats
are more heavily parasitized than males (Zahn & Rupp
2004; Lucan 2006; Christe et al. 2007). Female bat aggre-
gation within breeding colonies (facilitating vertical and
horizontal transmission) combined with a decrease in
immune defences during pregnancy may constitute opti-
mal conditions for parasite reproduction (Christe et al.
2000). Indeed, several studies showed that Spinturnix
synchronize their reproduction with that of their hosts,
with an increase in both prevalence and intensity during
the reproductive period (Christe et al. 2000; Lucan 2006;
Lourenco & Palmeirim 2007, 2008; Reckardt & Kerth
2009). Prevalence and intensity are lower on individual
bats during spring and autumn and their reproductive
activity is greatly reduced during hibernation (Rudnick
1960; Deunff & Beaucournu 1981; Lourenco & Palmeirim
2007, 2008). The precise generation time of Spinturnix is
still not known but much shorter than that of its host.
M. punicusM. punicus
Ifriouado
Wintimdouine
Cap Bon
Mediterranean SeaCadiz
SatignyAgliè
Naters
Malaga
M. myotisM. blythii
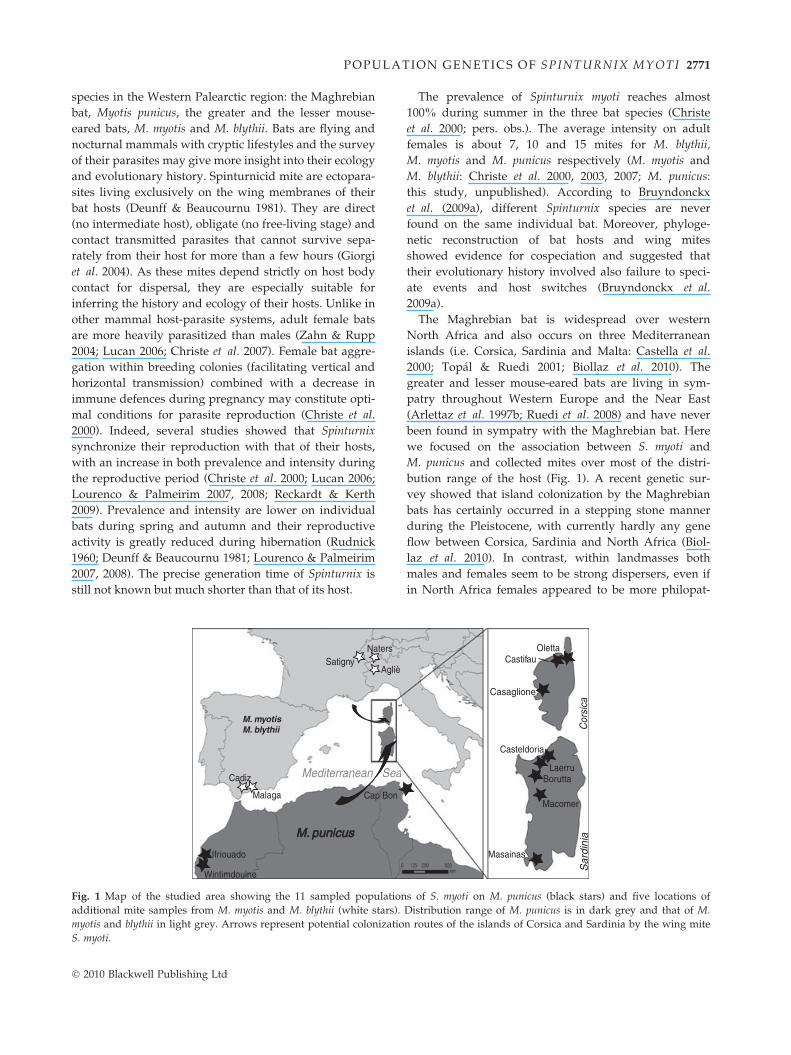
Fig. 1 Map of the studied area showing the 11 sampled population
additional mite samples from M. myotis and M. blythii (white stars).
myotis and blythii in light grey. Arrows represent potential colonizatio
S. myoti.
� 2010 Blackwell Publishing Ltd
The prevalence of Spinturnix myoti reaches almost
100% during summer in the three bat species (Christe
et al. 2000; pers. obs.). The average intensity on adult
females is about 7, 10 and 15 mites for M. blythii,
M. myotis and M. punicus respectively (M. myotis and
M. blythii: Christe et al. 2000, 2003, 2007; M. punicus:
this study, unpublished). According to Bruyndonckx
et al. (2009a), different Spinturnix species are never
found on the same individual bat. Moreover, phyloge-
netic reconstruction of bat hosts and wing mites
showed evidence for cospeciation and suggested that
their evolutionary history involved also failure to speci-
ate events and host switches (Bruyndonckx et al.
2009a).
The Maghrebian bat is widespread over western
North Africa and also occurs on three Mediterranean
islands (i.e. Corsica, Sardinia and Malta: Castella et al.
2000; Topal & Ruedi 2001; Biollaz et al. 2010). The
greater and lesser mouse-eared bats are living in sym-
patry throughout Western Europe and the Near East
(Arlettaz et al. 1997b; Ruedi et al. 2008) and have never
been found in sympatry with the Maghrebian bat. Here
we focused on the association between S. myoti and
M. punicus and collected mites over most of the distri-
bution range of the host (Fig. 1). A recent genetic sur-
vey showed that island colonization by the Maghrebian
bats has certainly occurred in a stepping stone manner
during the Pleistocene, with currently hardly any gene
flow between Corsica, Sardinia and North Africa (Biol-
laz et al. 2010). In contrast, within landmasses both
males and females seem to be strong dispersers, even if
in North Africa females appeared to be more philopat-
CastifauOletta
Casaglione
Casteldoria
BoruttaLaerru
Macomer
Masainas
Cor
sica
Sar
dini
a
s of S. myoti on M. punicus (black stars) and five locations of
Distribution range of M. punicus is in dark grey and that of M.
n routes of the islands of Corsica and Sardinia by the wing mite

2772 N. BRUYNDON CKX ET AL.
ric than males (Biollaz et al. 2010). Based on our know-
ledge of the host and the life style of the parasite, we
expect mite genetic patterns to reflect that of its host i.e.
more population differentiation between landmasses
than within landmasses. Moreover, if mites followed
their hosts in the colonization processes, we expect a
lower genetic diversity in insular populations.
Methods
Sampling
In spring and summer 2006, we collected mites in 11 col-
onies of M. punicus in North Africa, Corsica and Sardinia
covering most of the known distribution area of the host
(Fig. 1). Most nursery colonies were composed of adult
females and a few males living in natural caves or aban-
doned mines. To avoid disturbance during lactation, bats
were caught before or at the end of the breeding season
directly inside the nursery colonies during the day or
mist-netted at the entrance of the cave at night. Animals
were kept in separate textile bags to avoid contamination
between individuals. Mites were collected with soft for-
ceps from the bat wing membranes and preserved in
ethanol 90% until processing. Five to seven mites per
colony, each from a distinct bat, were used for the
genetic analyses. As S. myoti is present on three host
species, we added in the phylogenetic analysis some
S. myoti samples of M. myotis and M. blythii from five
colonies in Spain, Switzerland and Italy (Fig. 1).
Mite DNA amplification and analyses
DNA was extracted from each mite using a standard
proteinase K-phenol chloroform method (Sambrook
et al. 1989). We amplified and sequenced the 16S rRNA
gene (16S) and the cytochrome oxydase subunit I (COI)
as described in Bruyndonckx et al. (2009a). All products
were analysed on an ABI Prism 3100 genetic analyzer
(Applied Biosystems). Mite sequences were aligned and
edited with SEQUENCE NAVIGATOR (Parker 1997).
We used ARLEQUIN 3.1 (Excoffier et al. 2005) to assess
the number of haplotypes (N), haplotype diversity (h)
and nucleotide diversity (p) within each population.
Mean uncorrected genetic p-distances between colonies
within and among landmasses (Corsica, Sardinia and
North Africa) were calculated with MEGA 3.1 (Kumar
et al. 2004). We constructed the haplotype network using
the method of statistical parsimony implemented in the
software TCS 1.21 (Clement et al. 2000). Evolutionary rela-
tionships among all haplotypes of S. myoti populations
were estimated by constructing phylogenetic trees using
Bayesian and maximum-likelihood (ML) analyses. The
Bayesian analysis was carried out using MrBayes 3.1
(Huelsenbeck et al. 2001), based on the most appropriate
models of DNA substitution determined using MrMo-
deltest 2.2 (Nylander 2004). This model (hLRT criterion)
was a GTR + I + G (Rodriguez et al. 1990; Yang 1994).
The Markov chain was run for 5 000 000 generations and
sampled once every 1000 generations; burn-in was set to
the first 1500 trees. To ensure convergence in the Bay-
esian analysis, two independent runs were performed.
The ML analysis was performed with PhyML 3.0 software
(Guindon & Gascuel 2003), with the same parameters for
the substitution model as suggested by MrModeltest 2.2.
We generated bootstrap values based on 1000 resampled
data sets. The trees were rooted using two specimens of a
closely related species of the same genus, S. andegavinus
(EU784873–EU784927 and EU784874–EU784928).
A hierarchical analysis of molecular variance (AMOVA)
(Excoffier et al. 1992), inferred with ARLEQUIN 3.1 (Excof-
fier et al. 2005), was used to estimate F-statistics which
incorporate information on nucleotide differences
between haplotypes. Hence the proportions of variation
among landmasses (Flandmass-total), between colonies
within landmasses (Fcolonies-landmass) and within colonies
(Findividuals-colonies) were estimated. The significance of
these F-statistic values was assessed through rando-
mizations using 10 000 permutations. We calculated
pairwise F-statistics among all colonies with the same
software. To test whether F-statistics are sensitive to
distances between haplotypes, we performed the same
analyses based only on haplotypic frequencies.
We used BEAST v.1.4.8 (Drummond & Rambaut 2007)
to infer the time to the most recent common ancestor
(TMRCA) of Sardinian populations. Because Corsican
populations shared their unique haplotype with a Spa-
nish population, it was not possible to infer the TMRCA
of Corsican populations. We specified a relaxed clock
with an uncorrelated lognormal distribution (Drum-
mond et al. 2006) and a speciation Yule process as the
tree prior. The rate of molecular evolution in Spinturni-
cid mites is unknown, as such we specified a prior dis-
tribution on evolutionary rate (1.3 ± 0.3% ⁄ Myr) on the
basis of the pairwise 16S and CO mutation rates of
Arthropods (Brower 1994) and of the Orders Opiliones
and Scorpiones (Gantenbein & Largiader 2003; Thomas
& Hedin 2008; Ben Othmen et al. 2009). We performed
two independent runs of 10 000 000 generations sam-
pling every 1000 steps and removing 10% of the initial
samples as burn-in. To control for convergence and to
visualize the results, we used the program TRACER v.1.4
(Drummond & Rambaut 2007).
Host and parasite comparison
Host mitochondrial and nuclear FST values were
obtained from Biollaz et al. (2010), which included indi-
� 2010 Blackwell Publishing Ltd

POPULATION GENETI CS OF SPINTURNIX MYOTI 2773
vidual hosts of parasites sequenced in the present
study. We calculated mite pairwise FST mito based on
haplotypic frequencies only and tested the correlation
between mite and host FST mito and between mite FST
mito and host FST nucl, all measured as FST ⁄ (1 ) FST). To
determine if parasites were tracking host inter-colony
gene flow, we used a Mantel test in FSTAT 2.9.4 (Goudet
2002) to test the correlation between ectoparasite and
host genetic distances. The colony of Masainas (Sardi-
nia) was removed due to low host sample size.
Results
Mite genetic analyses
Among the 58 S. myoti associated with M. punicus
sequenced, 21 different 16S ⁄ COI haplotypes were
detected (one in Corsica, nine in Sardinia and 11 in
North Africa, Table 1). The 963 aligned nucleotides con-
sisted of 42 variable sites of which 32 were parsimony-
informative. 16S and COI haplotypes were deposited in
GenBank under accession numbers FJ225940–961 and
FJ225883–904, respectively. A detailed list of the sam-
pling localities, number of mites analysed per colony
and mtDNA haplotypes per population are provided in
Table 1.
The Bayesian and ML consensus trees (Fig. 2)
revealed three well-supported clades corresponding to
Table 1 Description of molecular variability of the 11 S. myoti popul
five populations from continental Europe
Locality Roost Host species
Corsica Castifau Mine M. punicus 5
Oletta Cave M. punicus 5
Casaglione Building M. punicus 5
Sardinia Casteldoria Mine M. punicus 5
Borutta Cave M. punicus 5
Laerru Cave M. punicus 5
Macomer Mine M. punicus 5
Masainas Cave M. punicus 5
Tun. Cap Bon Cave M. punicus 6
Moro. Wintimdouine Cave M. punicus 5
Ifriouado Cave M. punicus 7
Cont. Europe Cadiz Cave M. myotis 4
Malaga Cave M. myotis 4
Aglie Building M. myotis 3
Naters Attic M. myoti ⁄ blythii 2
Satigny Attic M. myotis 1
The following parameters were estimated: number of individuals sequ
haplotype diversity (H), nucleotide diversity (p) and distribution of ha
number of individuals per haplotype. Numbers in bold indicate haplo
� 2010 Blackwell Publishing Ltd
the same geographical groups defined by the haplotype
network (Fig. 3). Unlike host phylogenetic pattern
(Fig. 4), the first parasite clade covered Corsica and
continental Europe with the same haplotype (c1) pre-
sent all over Corsica and in Spain (Table 1, Figs. 2 and
3). The second clade comprised the North African
populations and the last one the Sardinian populations
(Figs. 2–4). We found no shared haplotypes between
those three regions (Figs. 2 and 3). The uncorrected
genetic p-distances were 1.5% between Corsica and
Sardinia, 2.0% between Corsica and North Africa and
finally 2.5% between Sardinia and North Africa. The
percentage of divergence within Corsica was null,
0.002% within Sardinia and 0.003% within North
Africa. The haplotype number per population ranged
from 1 to 6 (mean = 2.9, Table 1). Haplotype diversity
ranged from 0.0 to 1.0 (mean = 0.587, Table 1) and
nucleotide diversity (%) from 0.0 to 0.402 (mean =
0.152; Table 1). Genetic diversity indices (N, h, p) were
higher in North African populations than in Sardinian
populations, which in turn were higher than Corsican
populations.
In agreement with the heterogeneity of haplotype
distribution, the hierarchical AMOVA showed an impo-
rtant differentiation between landmasses (Flandmass-total =
0.91, P < 0.001; Table 2), whereas populations within
landmasses where not significantly differentiated
(Fcolonies-landmass = 0.10, P = 0.072; Table 2). When
ations associated with M. punicus sampled in this study and the
n N H p% Haplotype (no of individuals)
1 0.0 0 c1(5)
1 0.0 0 c1(5)
1 0.0 0 c1(5)
1 0.0 0
3 0.7 0.229 s1(1), s2(1), s3(3)
3 0.7 0.229 s3(3), s4(1), s5(1)
3 0.8 0.229 s3(2), s5(2), s6(1)
3 0.7 0.125 s2(1), s5(3), s7(1)
3 0.7 0.145 s5(3), s8(1), s9(1)
3 0.7 0.191
6 1.0 0.402 t1(1), t2(1), tm3(1), t4(1), t5(1), t6(1)
4 0.9 0.125 m1(1), m2(1), tm3(2), m4(1)
4 0.9 0.188 tm3(2), m4(2), m5(2), m6(1)
4.7 0.9 0.238
4 1 0.277 e1(1), e2(1), e3(1), e4(1)
3 0.8 0.156 c1(2), e3(1), e5(1)
3 1 0.277 e6(1), e7(1), e8(1)
⁄ 4 4 0.8 0.360 e8(1), e9(1) ⁄ e9(2), e10(1), e11(1)
e12(1)
enced per colony (n), total number of haplotypes (N),
plotypes among populations. Numbers in bracket indicate the
types that are shared between two or more localities.

t6m1t4
t2
t1
m5
t5m4 m2
m6
s2
s3
s8
s6
s1
s7
s5
s4
s9
e9
e7
e6
e11
e10e2
e3
e4e1
c1 e5e12
tm3
e8
Europe
13 steps 9 steps
12–58–917
individuals perhaplotypes
North Africa
Corsica
Corsica SardiniaTunisiaMorrocoContinental Europeon M. myotis/blythii
Sardinia
Fig. 3 Haplotype network based on 33 haplotypes of S. myoti
evidenced by sequencing 16S and COI mitochondrial genes of
76 mites from 11 colonies of M. punicus in North Africa, Sardi-
nia and Corsica and five colonies of M. myotis ⁄ blythii in Spain,
Switzerland and Italy. Numbers correspond to the mutational
steps observed between clades and the size of the circle is pro-
portional to the numbers of haplotypes represented.
S. andegavinusS. andegavinus
s1s2
s3s8
73/1
s4s5
s6s7s9
t1t2
tm3m1m2m6
43/0.68
t4t5
t6m4
m5
e1e2e3
e4e10
c1e12
e5
20/0.79
e6
38/0.92
e7e8
e9e11
98/1
69/0.94
98/0.99
100/1
0.1
Corsica &
C
ontinental Europe
Sardinia
North A
frica
Fig. 2 Bayesian consensus tree representing the relationships
between Corsican, Sardinian, Tunisian, Moroccan and conti-
nental European haplotypes of S. myoti, with maximum likeli-
hood bootstrap values and Bayesian posterior probabilities. S.
andegavinus is used as outgroup.
2774 N. BRUYNDON CKX ET AL.
samples from continental Europe were included,
populations between and within landmasses were sig-
nificantly differentiated (Flandmass-total = 0.86, P < 0.001;
Fcolonies-landmass = 0.19, P = 0.002; Table 2), reflecting the
high diversity on continental Europe. Those patterns
were confirmed by pairwise FST values (Table 2): com-
parisons between pairs of colonies from different land-
masses were all significant, except Corsican populations
that were similar to a Spanish one (Malaga), while none
were significant within landmasses, except the Sardi-
nian most southern population (Masainas), which was
slightly different from the most northern one (Casteldo-
ria). Patterns of differentiation between colonies were
similar but less marked when genetic distances were
based only on haplotypic frequencies.
The result of the analysis with Beast suggested that
the most recent common ancestor (TMRCA) of Sardi-
nian populations dates back to the Mid Pleistocene
(mean: 0.354Ma, 95% HPD: 0.127–0.669Ma). This result
is in accordance with that of its host, which was
estimated to date back to the Early-Mid Pleistocene
(Biollaz et al. 2010). However, this dating should be
taken with cautious as regards no mutation rate of clo-
sely related parasitic mites is known.
Host and parasite comparison
We applied simple Mantel test analyses to examine the
correlations among genetic distances of the host and the
parasite. Mantel test analyses revealed that mite inter-
population FST mito values were highly correlated with
their host genetic values. This correlation was more pro-
nounced with host FST nuc than with host FST mito values
(r = 0.763, P < 0.001; r = 0.508, P = 0.002, respectively).
This correlation mainly reflected the population distri-
bution over the different landmasses, as revealed by a
statistically non-significant correlation when landmasses
are taken into account in the analysis.
Discussion
This study suggests that S. myoti and its host, the Ma-
ghrebian bat, share a common genetic and geographic
structure. As expected, mite populations of Corsica,
Sardinia and North Africa were highly differentiated
with no shared haplotypes. Mite dispersal across water
is currently totally hampered reflecting the bat genetic
pattern (Biollaz et al. 2010). Moreover, mites seemed to
� 2010 Blackwell Publishing Ltd

S. andegavinus
S. andegavinus
98/1
69/0.94
98/0.99
100/1
0.1
Continental Europe
Sardinia
N. leisleri
M. myotis
0.1
78/0.97
86/0.76
83/0.74
75/0.96
76/0.88
52/0.72
M. myotis
Morocco
Tunisia
M. punicus
S. myoti
Corsica
Fig. 4 Graphical display of parasite (left side) and host (right side) bayesian consensus trees. The links represent the association
between host and parasite clades.
Table 2 Hierarchical AMOVA among (A) eleven populations of
Spinturnix myoti partitioned by geographical landmasses
(North Africa, Sardinia, Corsica), (B) including four popula-
tions from continental Europe. Asterisks indicate significant P
values
Source of
variation df
Sum of
squares
Variance
components
% of
variation FST
(A) Among
landmasses
2 337.1 8.86466 91.3 0.91***
Among colonies
within landmasses
8 9.5 0.08105 0.83 0.10
Within colonies 47 35.9 0.76373 7.87
Total 57 382.5 9.70943
(B) Among
landmasses
3 388.4 6.89100 86.2 0.86***
Among colonies
within landmasses
11 21.3 0.21208 2.65 0.19**
Within colonies 60 53.5 0.89131 11.15
Total 74 463.2 7.99439
POPULATION GENETI CS OF SPINTURNIX MYOTI 2775
have followed their bat hosts in the island colonization
process and colonized the island of Sardinia during the
Pleistocene. However, one notable exception, decreasing
the similarity between host and parasite patterns, is the
colonization of the island of Corsica: Corsican parasites
originate from continental Europe whereas their hosts
have a North African origin.
Maghrebian bats from Corsica, despite their close phy-
logenetic relationship with those of Sardinia (Biollaz
� 2010 Blackwell Publishing Ltd
et al. 2010), harbour mites genetically similar to those
infesting M. myotis ⁄ blythii from continental Europe. As
mites cannot survive more than a couple of hours with-
out their host (Giorgi et al. 2004), the presence of this
continental European mite lineage on the island of
Corsica is best explained by a direct switch from
M. myotis ⁄ blythii to M. punicus. However, M. punicus cur-
rently does not occur in sympatry with M. myotis nor
with M. blythii. The best explanation to elucidate the
presence of continental European mites on Corsican bats
is therefore the occurrence of mouse-eared bats on Cor-
sica once in the past. Competitive exclusion may explain
the nowadays unique presence of Maghrebian bats in
Corsica, as its ecological niche is similar to that of mouse-
eared bats (Arlettaz et al. 1997a; b; Castella et al. 2000).
The presence of one unique mite haplotype in Corsica
might result from two successive bottlenecks: the first
one when mouse-eared bats colonized Corsica from
continental Europe, potentially during the Pleistocene
variation of the sea level and the second one during
our hypothesized host switch between the mouse-eared
bat and Maghrebian bat when they co-occurred in Cor-
sica. Competitive exclusion may also explain the now-
adays absence of Sardinian mite lineages in Corsica.
Only experimental survival tests of different parasite
lineages in competition on the same host might permit
to test this hypothesis.
The time of the most common ancestor of the Sardi-
nian populations of S. myoti was estimated to date back

Table 3 Estimates of FST between 15 populations of S. myoti
Cast. Olet. Casagl. Castel. Boru. Laer. Mac. Mas. Cap. Wint. Ifr. Cadiz Mala. Naters
Corsica Castifau
Oletta 0
Casaglione 0 0
Sardinia Casteldoria 0.92** 0.92** 0.92**
Borutta 0.92** 0.92** 0.92** )0.12
Laerru 0.92** 0.92** 0.92** 0.02 )0.12
Macomer 0.95** 0.95** 0.95** 0.34 0.2 )0.01
Masainas 0.95** 0.95** 0.95** 0.35* 0.22 0.04 )0.05
Tun. Cap Bon 0.88** 0.88** 0.88** 0.87** 0.87** 0.87** 0.88** 0.88**
Morocco Wintimdouine 0.97** 0.97** 0.97** 0.93** 0.93** 0.93** 0.95** 0.94** 0.12
Ifriouado 0.94** 0.94** 0.94** 0.92** 0.92** 0.92** 0.93** 0.93** 0.05 0.08
Cont. Europe Cadiz 0.40** 0.40** 0.40** 0.86** 0.85** 0.84** 0.87** 0.87** 0.82** 0.90** 0.89*
Malaga 0.06 0.06 0.06 0.87** 0.87** 0.86** 0.90** 0.89** 0.84** 0.93** 0.91** 0.02
Naters 0.53** 0.53** 0.53** 0.83** 0.82** 0.82** 0.84** 0.83** 0.80** 0.86** 0.86* 0.40* 0.38*
Aglie 0.71* 0.71* 0.71* 0.84* 0.83* 0.83* 0.87* 0.86* 0.82* 0.91* 0.90* 0.39* 0.41* 0.09
*P < 0.05, **P < 0.01 and ***P < 0.001; Populations are abbreviated as followed: Cast.: Castifau; Olet.: Oletta; Casagl.: Casaglione;
Castel.: Casteldoria; Boru.: Borutta; Laer.: Laerru; Mac.: Macomer; Mas.: Masainas; Cap.: Cap Bon; Wint.: Wintimdouine; Ifr.:
Ifriouado; Mala.: Malaga. Tun.: Tunisia.
2776 N. BRUYNDON CKX ET AL.
to the Mid Pleistocene, suggesting that mites have fol-
lowed the Maghrebian bat in Sardinia. Indeed, Biollaz
et al. (2010) showed that Sardinia and Corsica coloniza-
tion by the Maghrebian bat might have occurred in a
stepping stone manner during the Pleistocene. The
emergence of land bridges due to the low sea level
during the successive glacial periods favoured first the
colonization of Sardinia and then the colonization of
Corsica from Sardinia. The expected and observed
lower haplotype and nucleotide diversity in Sardinian
mites compared to North African mainland may thus
results from a strong bottleneck during the colonization
events (Frankham 1996). This ‘island syndrome’ has
been poorly investigated in parasite species but has
been reported in the nematode Heligmosomoides polygyrus
infesting Apodemus sylvaticus and Mus musculus (Nieber-
ding et al. 2006). Finally, the presence of the same mite
haplotype in Corsica and Spain prevents the dating of the
most common ancestor of Corsican populations.
Alternative hypotheses to explain the presence of a
continental European mite lineage in Corsica would
require the presence of the parasite S. myoti on other
bat species inhabiting Corsica. This latter scenario
would imply two host-switches and seems unlikely
since we found that co-roosting bat species harboured
their own specific Spinturnix species (more than 10% of
divergence) in Corsica (Bruyndonckx et al. 2009a). A
very recent colonization from the mainland seems also
unlikely since the minimal distance between Corsica
and Italy is approximately 80 km, a distance much lar-
ger than the strait of Bonifacio (12 km) that has been
shown to represent a strong barrier to gene flow
between Corsica and Sardinia for the Maghrebian bats
(Biollaz et al. 2010). Other alternatives would require
improbable scenarios of colonization, recolonization and
extinction in Europe and Corsica.
Spinturnix myoti exhibited an important and signifi-
cant population genetic structure between Corsica,
Sardinia and North Africa, while within those three
regions populations were not genetically differentiated.
This latter result is consistent with a very high gene
flow among mite populations within landmasses, a pat-
tern that differs from the genetic structure of bats in
North Africa (Biollaz et al. 2010). Indeed, the Maghre-
bian bats showed a male-biased dispersal, with females
being highly philopatric, resulting in a high mitochon-
drial differentiation between Tunisian and Moroccan
colonies (Biollaz et al. 2010). Mite dispersal among
remote colonies may occur via males and females
during mating where territorial males may form loose
lecks (Horacek & Gaisler 1986). Parasite transmission
during mating has been recently suggested to strongly
influence population genetics in the mite S. bechsteini
infesting the Bechstein’s bat (Myotis bechsteinii)
(Bruyndonckx et al. 2009b). Moreover, in North Africa,
bats have been reported to hibernate from time to time in
small clusters which could give opportunities for mite
dispersal (Kowalski et al. 1986). A detailed picture of
mite movements can be revealed in the future through
the use of microsatellite markers which development is
currently in progress. Other studies on the importance of
host movements on the genetic structure of parasite
populations have been previously documented, for
example in nematodes of Ungulates (Blouin et al. 1995),
in trematodes that infect salmonid fishes (Criscione &
Blouin 2004) and in seabird ticks (McCoy et al. 2003).
� 2010 Blackwell Publishing Ltd

POPULATION GENETI CS OF SPINTURNIX MYOTI 2777
In addition to their use in detecting cryptic species
(Criscione & Blouin 2004), refuges during glaciations
(Nieberding et al. 2004; Toon & Hughes 2008), former
contacts (Reed et al. 2004) and demography (Biek et al.
2006) of their hosts, we show that a parasite with both
vertical and horizontal transmission might also reveal
the past co-occurrence and contact of different host spe-
cies that allowed the exchange of parasite lineages. The
past distribution of presently extinct populations of host
plants was similarly highlighted by the genetic pattern
of its symbiont (Anderson et al. 2004). In conclusion, the
population structure of S. myoti is highly dependent on
host movements. This contact transmitted parasite
appears to be a good proxy to detect the former presence
of a nowadays locally extinct host species, i.e. mouse-
eared bats in Corsica, that would have been virtually
impossible to reveal without good fossil evidence.
Acknowledgements
We are grateful to many people who assisted with the collec-
tion of specimens especially G. Beuneux (Groupe Chiropteres
Corse), C. Ibanes, J. Quetglas, A. Popa-Lisseanu, J. Juste (Esta-
cion Biologica de Donana, Sevilla), J. Ramon and Olvido
(Malaga), M. Muccedda (Sardinia), Chef de la brigade de chasse
de Nabeul (Tunisia), L. Faouzi, A. Ighous (Morocco), E. Patriar-
ca, P. Debernardi (Italy), R. Arlettaz, P. Roduit (Suisse). Thanks
to G. Devevey, G. Emaresi, P. Fontanillas, A. Horn, Ana Popa-
Lisseanu, L. Keller, 3 anonymous referees and F. Balloux for
useful comments on the manuscript and F. Witsenburg for the
English revision of the manuscript. This work is supported by
the Swiss National Science Foundation 31003A_120479.
References
Anderson B, Olivieri I, Lourmas M, Stewart BA (2004)
Comparative population genetic structures and local
adaptation of two mutualists. Evolution, 58, 1730–1747.
Arlettaz R, Perrin N, Hausser J (1997a) Trophic resource
partitioning and competition between the two sibling bat
species Myotis myotis and Myotis blythii. Journal of Animal
Ecology, 66, 897–911.
Arlettaz R, Ruedi M, Ibanez C, Palmeirim J, Hausser J (1997b)
A new perspective on the zoogeography of the sibling
mouse-eared bat species Myotis myotis and Myotis blythii:
morphological, genetical and ecological evidence. Journal of
Zoology (London), 242, 45–62.
Barrett LG, Thrall PH, Burdon JJ, Linde CC (2008) Life history
determines genetic structure and evolutionary potential of
host-parasite interactions. Trends in Ecology and Evolution, 23,
678–685.
Ben Othmen A, Said K, Mahamdallie SS et al. (2009)
Phylogeography of Androctonus species (Scorpiones:
Buthidae) in Tunisia: Diagnostic characters for linking
species to scorpionism. Acta Tropica, 112, 77–85.
Biek R, Drummond AJ, Poss M (2006) A virus reveals
population structure and recent demographic history of its
carnivore host. Science, 311, 538–541.
� 2010 Blackwell Publishing Ltd
Biollaz F, Bruyndonckx N, Beuneux G et al. (2010) Genetic
isolation of insular populations of the Maghrebian bat Myotis
punicus in the Mediterranean Basin. Journal of Biogeography,
DOI: 10.1111/j.1365-2699.2010.02282.x.
Blouin MS, Yowell CA, Courtney CH, Dame JB (1995) Host
movement and the genetic-structure of populations of
parasitic nematodes. Genetics, 141, 1007–1014.
Brower AVZ (1994) Rapid morphological radiation and
convergence among races of the butterfly Heliconius erato
inferred from patterns of mitochondrial-DNA evolution.
Proceedings of the National Academy of Sciences, USA, 91, 6491–
6495.
Bruyndonckx N, Dubey S, Ruedi M, Christe P (2009a)
Molecular cophylogenetic relationships between European
bats and their ectoparasitic mites (Acari, Spinturnicidae).
Molecular Phylogenetics and Evolution, 51, 227–237.
Bruyndonckx N, Henry I, Christe P, Kerth G (2009b) Spatio-
temporal population genetic structure of the parasitic mite
Spinturnix bechsteini is shaped by its own demography and the
social system of its bat host. Molecular Ecology, 18, 3581–3592.
Castella V, Ruedi M, Excoffier L et al. (2000) Is the Gibraltar Strait
a barrier to gene flow for the bat Myotis myotis (Chiroptera:
Vespertilionidae)? Molecular Ecology, 9, 1761–1772.
Christe P, Arlettaz R, Vogel P (2000) Variation in intensity of a
parasitic mite (Spinturnix myoti) in relation to the
reproductive cycle and immunocompetence of its bat host
(Myotis myotis). Ecology Letters, 3, 207–212.
Christe P, Giorgi MS, Vogel P, Arlettaz R (2003) Differential
species-specific ectoparasitic mite intensities in two
intimately coexisting sibling bat species: resource- mediated
host attractiveness or parasite specialization? Journal of
Animal Ecology, 72, 866–872.
Christe P, Glaizot O, Evanno G et al. (2007) Host sex and
ectoparasites choice: preference for, and higher survival on
female hosts. Journal of Animal Ecology, 76, 703–710.
Clement M, Posada D, Crandall KA (2000) TCS: a computer
program to estimate gene genealogies. Molecular Ecology, 9,
1657–1659.
Criscione CD, Blouin MS (2004) Life cycles shape parasite
evolution: comparative population genetics of salmon
trematodes. Evolution, 58, 198–202.
Criscione CD, Poulin R, Blouin MS (2005) Molecular ecology of
parasites: elucidating ecological and microevolutionary
processes. Molecular Ecology, 14, 2247–2257.
Deunff J, Beaucournu J-C (1981) Phenologie et variations du
dermecos chez quelques especes de Spinturnicidae (Acarina,
Mesostigmata). Annales de Parasitologie Humaine et Comparee,
56, 203–244.
Drummond AJ, Rambaut A (2007) BEAST: Bayesian
evolutionary analysis by sampling trees. BMC Evolutionary
Biology, 7, 214.
Drummond AJ, Ho SYW, Phillips MJ, Rambaut A (2006)
Relaxed phylogenetics and dating with confidence. PLoS
Biology, 4, 699–710.
Excoffier L, Smouse PE, Quattro JM (1992) Analysis of
molecular variance inferred from metric distances among
DNA haplotypes—application to human mitochondrial-DNA
restriction data. Genetics, 131, 479–491.
Excoffier L, Laval G, Schneider S (2005) Arlequin ver. 3.0: An
integrated software package for population genetics data
analysis. Evolutionary Bioinformatics Online, 1, 47–50.
2778 N. BRUYNDON CKX ET AL.
Gantenbein B, Largiader CR (2003) The phylogeographic
importance of the Strait of Gibraltar as a gene flow barrier in
terrestrial arthropods: a case study with the scorpion Buthus
occitanus as model organism. Molecular Phylogenetics and
Evolution, 28, 119–130.
Giorgi MS, Arlettaz R, Guillaume F et al. (2004) Causal
mechanisms underlying host specificity in bat ectoparasites.
Oecologia, 138, 648–654.
Goudet J (2002) FSTAT 2.9.3.2, A Program to Estimate and Test
Gene Diversities and Fixation Indices (updated from Goudet
1995). Lausanne, Switzerland, Available at: http://
www2.unil.ch/popgen/softwares/fstat.htm.
Guindon S, Gascuel O (2003) A simple, fast, and accurate
algorithm to estimate large phylogenies by maximum
likelihood. Systematic Biology, 52, 696–704.
Horacek I, Gaisler J (1986) The mating system of Myotis blythi.
Myotis, 23-24, 125–129.
Huelsenbeck JP, Ronquist F, Nielsen R, Bollback JP (2001)
Evolution—Bayesian inference of phylogeny and its impact
on evolutionary biology. Science, 294, 2310–2314.
Huyse T, Poulin R, Theron A (2005) Speciation in parasites: a
population genetics approach. Trends in Parasitology, 21, 469–
475.
Kowalski K, Gaisler J, Bessam H, Issaad C, Ksantini H (1986)
Annual life-cycle of cave bats in Northern Algeria. Acta
Theriologica, 31, 185–206.
Kumar S, Tamura K, Nei M (2004) MEGA3: integrated
software for molecular evolutionary genetics analysis and
sequence alignment. Briefings in Bioinformatics, 5, 150–163.
Lourenco SI, Palmeirim JM (2007) Can mite parasitism affect
the condition of bat hosts? Implications for the social
structure of colonial bats. Journal of Zoology (London), 273,
161–168.
Lourenco S, Palmeirim JM (2008) Which factors regulate the
reproduction of ectoparasites of temperate-zone cave-
dwelling bats? Parasitology Research, 104, 127–134.
Lucan RK (2006) Relationships between the parasitic mite
Spinturnix andegavinus (Acari: Spinturnicidae) and its bat
host, Myotis daubentonii (Chiroptera: Vespertilionidae):
seasonal, sex- and age-related variation in infestation and
possible impact of the parasite on the host condition and
roosting behaviour. Folia Parasitologica (Ceske Budejovice), 53,
147–152.
McCoy KD (2009) Host-parasite determinants of parasite
population structure: lessons from bats and mites on the
importance of time. Molecular Ecology, 18, 3545–3547.
McCoy KD, Boulinier T, Tirard C, Michalakis Y (2003) Host-
dependent genetic structure of parasite populations:
differential dispersal of seabird tick host races. Evolution, 57,
288–296.
Nadler SA (1995) Microevolution and the genetic-structure of
parasite populations. Journal of Parasitology, 81, 395–403.
Nieberding CM, Olivieri I (2007) Parasites: proxies for host
genealogy and ecology? Trends in Ecology and Evolution, 22,
156–165.
Nieberding C, Morand S, Libois R, Michaux JR (2004) A
parasite reveals cryptic phylogeographic history of its host.
Proceedings of the Royal Society of London Series B: Biological
Sciences, 271, 2559–2568.
Nieberding C, Morand S, Libois R, Michaux JR (2006) Parasites
and the island syndrome: the colonization of the western
Mediterranean islands by Heligmosomoides polygyrus
(Dujardin, 1845). Journal of Biogeography, 33, 1212–1222.
Nylander JAA (2004) MrModeltest 2.2. Department of
Systematic Zoology, Evolutionary Biology Centre, Uppsala
University, Sweden.
Parker SR (1997) Sequence Navigator. Multiple sequence
alignment software. Methods in Molecular Biology, 70, 145–154.
Rannala B, Michalakis Y (2003) Population genetics and
cospeciation: from process to pattern. In: Tangled Trees:
Phylogeny, Cospeciation and Coevolution (ed. Page RDM), pp.
120–143. The University of Chicago Press, Chicago.
Reckardt K, Kerth G (2009) Does the mode of transmission
between hosts affect the host choice strategies of parasites?
Implications from a field study on bat fly and wing mite
infestation of Bechstein’s bats. Oikos, 118, 183–190.
Reed DL, Smith VS, Hammond SL, Rogers AR, Clayton DH
(2004) Genetic analysis of lice supports direct contact
between modern and archaic humans. PLoS Biology, 2, 1972–
1983.
Rodriguez F, Oliver JL, Marin A, Medina JR (1990) The general
stochastic-model of nucleotide substitution. Journal of
Theoretical Biology, 142, 485–501.
Rudnick A (1960) A revision of the mites of the family
Spinturnicidae. University of California Press, 17, 157–284.
Ruedi M, Walter S, Fischer MC et al. (2008) Italy as a major ice
age refuge area for the bat Myotis myotis (Chiroptera:
Vespertilionidae) in Europe. Molecular Ecology, 17, 1801–1814.
Sambrook JE, Fritsch F, Manitatis T (1989) Molecular Cloning: A
Laboratory Manual, 2nd edn. Cold Spring Harbor Laboratory
Press, New York.
Schwarz S, Morelli G, Kusecek B et al. (2008) Horizontal
versus familial transmission of Helicobacter pylori. Plos
Pathogens, 4, e1000 180.
Thomas SM, Hedin M (2008) Multigenic phylogeographic
divergence in the paleoendemic southern Appalachian
opilionid Fumontana deprehendor Shear (Opiliones, Laniatores,
Triaenonychidae). Molecular Phylogenetics and Evolution, 46,
645–658.
Toon A, Hughes J (2008) Are lice good proxies for host
history? A comparative analysis of the Australian magpie,
Gymnorhina tibicen, and two species of feather louse. Heredity,
101, 127–135.
Topal G, Ruedi M (2001) Myotis blythii (Tomes, 1857)—Kleines
Mausohr. In: Handbuch der Saugetiere Europas Bd 4 ⁄ I(Fledertiere) (ed. Krapp F), pp. 209–255. AULA-Verlag GmbH,
Wiebelsheim, Germany.
Whiteman NK, Parker PG (2005) Using parasites to infer host
population history: a new rationale for parasite conservation.
Animal Conservation, 8, 175–181.
Whiteman NK, Santiago-Alarcon D, Johnson KP, Parker PG
(2004) Differences in straggling rates between two genera of
dove lice (Insecta: Phthiraptera) reinforce population genetic
and cophylogenetic patterns. International Journal for
Parasitology, 34, 1113–1119.
Wirth T, Meyer A, Achtman M (2005) Deciphering host
migrations and origins by means of their microbes. Molecular
Ecology, 14, 3289–3306.
Yang Z (1994) Estimating the pattern of nucleotide
substitution. Journal of Molecular Evolution, 39, 105–111.
Zahn A, Rupp D (2004) Ectoparasite load in European
vespertilionid bats. Journal of Zoology (London), 262, 383–391.
� 2010 Blackwell Publishing Ltd