
Potential geographic distribution of two invasive cassava green mites
10
Potential geographic distribution of two invasive cassava green mites Soroush Parsa • Nicolas A. Hazzi • Qing Chen • Fuping Lu • Beatriz Vanessa Herrera Campo • John Stephen Yaninek • Aymer Andre ´s Va ´squez-Ordo ´n ˜ez Received: 11 June 2014 / Accepted: 2 December 2014 Ó Springer International Publishing Switzerland 2014 Abstract The cassava green mites Mononychellus tanajoa and M. mcgregori are highly invasive species that rank among the most serious pests of cassava globally. To guide the development of appropriate risk mitigation measures preventing their introduction and spread, this article estimates their potential geographic distribution using the maximum entropy approach to distribution modeling. We compiled 1,232 occurrence records for M. tanajoa and 99 for M. mcgregori, and relied on the WorldClim climate database as a source of environmental predictors. To mitigate the potential impact of uneven sampling efforts, we applied a distance correction filter resulting in 429 occurrence records for M. tanajoa and 55 for M. mcgregori. To test for environmental biases in our occurrence data, we developed models trained and tested with records from different continents, before developing the definitive models using the full record sets. The geographically-structured models revealed good cross-validation for M. tanajoa but not for M. mcgregori, likely reflecting a subtropical bias in M. mcgregori’s invasive range in Asia. The definitive models exhibited very good performance and predicted different potential distribution patterns for the two species. Relative to M. tanajoa, M. mcgregori seems better adapted to survive in locations lacking a pronounced dry season, for example across equatorial climates. Our results should help decision-makers assess the site-specific risk of cassava green mite establishment, and develop proportional risk mitigation measures to prevent their introduction and spread. S. Parsa (&) Á B. V. Herrera Campo Á A. A. Va ´squez-Ordo ´n ˜ez Centro Internacional de Agricultura Tropical (CIAT), Apartado Ae ´reo 6713, Cali, Colombia e-mail: [email protected] N. A. Hazzi Programa Acade ´mico de Biologı ´a, Seccio ´n de Entomologı ´a, Universidad del Valle, Cali, Colombia Q. Chen Á F. Lu Environment and Plant Protection Institute, China Academy of Tropical Agriculture Sciences (CATAS), Haikou, China J. S. Yaninek Department of Entomology, Purdue University, 901 W. State Street, West Lafayette, IN 47907, USA 123 Exp Appl Acarol DOI 10.1007/s10493-014-9868-x
-
Upload
universidaddelvallecolombia -
Category
Documents
-
view
1 -
download
0
Transcript of Potential geographic distribution of two invasive cassava green mites
Potential geographic distribution of two invasive cassavagreen mites
Soroush Parsa • Nicolas A. Hazzi • Qing Chen • Fuping Lu •
Beatriz Vanessa Herrera Campo • John Stephen Yaninek •
Aymer Andres Vasquez-Ordonez
Received: 11 June 2014 / Accepted: 2 December 2014� Springer International Publishing Switzerland 2014
Abstract The cassava green mites Mononychellus tanajoa and M. mcgregori are highly
invasive species that rank among the most serious pests of cassava globally. To guide the
development of appropriate risk mitigation measures preventing their introduction and
spread, this article estimates their potential geographic distribution using the maximum
entropy approach to distribution modeling. We compiled 1,232 occurrence records for M.
tanajoa and 99 for M. mcgregori, and relied on the WorldClim climate database as a source
of environmental predictors. To mitigate the potential impact of uneven sampling efforts,
we applied a distance correction filter resulting in 429 occurrence records for M. tanajoa and
55 for M. mcgregori. To test for environmental biases in our occurrence data, we developed
models trained and tested with records from different continents, before developing the
definitive models using the full record sets. The geographically-structured models revealed
good cross-validation for M. tanajoa but not for M. mcgregori, likely reflecting a subtropical
bias in M. mcgregori’s invasive range in Asia. The definitive models exhibited very good
performance and predicted different potential distribution patterns for the two species.
Relative to M. tanajoa, M. mcgregori seems better adapted to survive in locations lacking a
pronounced dry season, for example across equatorial climates. Our results should help
decision-makers assess the site-specific risk of cassava green mite establishment, and
develop proportional risk mitigation measures to prevent their introduction and spread.
S. Parsa (&) � B. V. Herrera Campo � A. A. Vasquez-OrdonezCentro Internacional de Agricultura Tropical (CIAT), Apartado Aereo 6713, Cali, Colombiae-mail: [email protected]
N. A. HazziPrograma Academico de Biologıa, Seccion de Entomologıa, Universidad del Valle, Cali, Colombia
Q. Chen � F. LuEnvironment and Plant Protection Institute, China Academy of Tropical Agriculture Sciences(CATAS), Haikou, China
J. S. YaninekDepartment of Entomology, Purdue University, 901 W. State Street, West Lafayette, IN 47907, USA
123
Exp Appl AcarolDOI 10.1007/s10493-014-9868-x
These results should be particularly timely to help address the recent detection of M.
mcgregori in Southeast Asia.
Keywords Cassava green mite � Manihot esculenta � Mononychellus tanajoa �Mononychellus mcgregori � Pest risk map � Species distribution modeling
Introduction
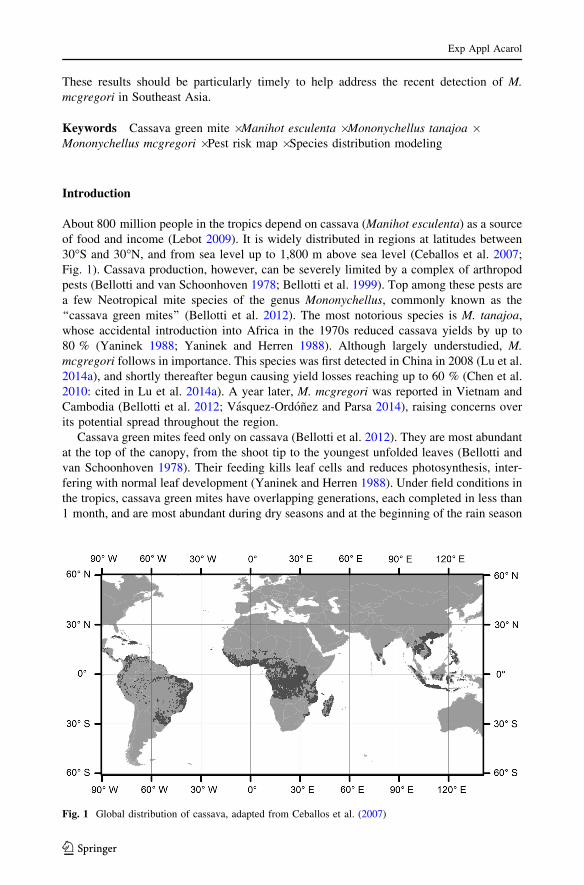
About 800 million people in the tropics depend on cassava (Manihot esculenta) as a source
of food and income (Lebot 2009). It is widely distributed in regions at latitudes between
30�S and 30�N, and from sea level up to 1,800 m above sea level (Ceballos et al. 2007;
Fig. 1). Cassava production, however, can be severely limited by a complex of arthropod
pests (Bellotti and van Schoonhoven 1978; Bellotti et al. 1999). Top among these pests are
a few Neotropical mite species of the genus Mononychellus, commonly known as the
‘‘cassava green mites’’ (Bellotti et al. 2012). The most notorious species is M. tanajoa,
whose accidental introduction into Africa in the 1970s reduced cassava yields by up to
80 % (Yaninek 1988; Yaninek and Herren 1988). Although largely understudied, M.
mcgregori follows in importance. This species was first detected in China in 2008 (Lu et al.
2014a), and shortly thereafter begun causing yield losses reaching up to 60 % (Chen et al.
2010: cited in Lu et al. 2014a). A year later, M. mcgregori was reported in Vietnam and
Cambodia (Bellotti et al. 2012; Vasquez-Ordonez and Parsa 2014), raising concerns over
its potential spread throughout the region.
Cassava green mites feed only on cassava (Bellotti et al. 2012). They are most abundant
at the top of the canopy, from the shoot tip to the youngest unfolded leaves (Bellotti and
van Schoonhoven 1978). Their feeding kills leaf cells and reduces photosynthesis, inter-
fering with normal leaf development (Yaninek and Herren 1988). Under field conditions in
the tropics, cassava green mites have overlapping generations, each completed in less than
1 month, and are most abundant during dry seasons and at the beginning of the rain season
Fig. 1 Global distribution of cassava, adapted from Ceballos et al. (2007)
Exp Appl Acarol
123
(Bellotti and van Schoonhoven 1978). Early rains cause a flush of new leaf growth that
promotes their rapid population growth (Yaninek et al. 1989). Continued rains eventually
help suppress them to sub-economic levels through a combination of plant compensation
and rainfall mortality (Yaninek et al. 1989). Green mites can also be suppressed to sub-
economic levels by phytoseiid mites (Bellotti et al. 2012), which have been successfully
deployed in classical biological control against M. tanajoa in Africa (Yaninek and Hanna
2003). A similar effort has been advocated to control M. mcgregori in Asia (Bellotti et al.
2012), but its potential remains to be investigated.
Pest risk maps, based on models estimating climatic suitability for a species, are
important decision-support tools for the management of invasive pests (Venette et al.
2010). They can be based on two complementary approaches: (1) the mechanistic or
deductive approach, which relies on the species’ physiological data (Kearney and Porter
2009); and (2) the correlative or inductive approach, which relies on the species’ occur-
rence data (Elith and Leathwick 2009). When a pest’s biology is still poorly known,
correlative models provide the most rapid and effective means to develop risk maps
(Venette et al. 2010).
This article responds to the need to better assess and address the risk of invasive cassava
green mites, emphasizing the invasion of M. mcgregori in Asia. Our principal objective
was to develop correlative models predicting their potential geographic distribution,
therefore guiding site-specific risk mitigation strategies. The resulting risk maps could also
be used to identify exploration sites for natural enemies with a high probability of
establishment in the affected locations.
Materials and methods
Occurrence data
We compiled occurrence data (i.e. presence-only) from three sources. Native distribution
records for both species originated from a database submitted by the International Center
for Tropical Agriculture (CIAT, its Spanish acronym) to the Global Biodiversity Infor-
mation Facility (GBIF; Vasquez-Ordonez and Parsa 2014). Because this source covers
areas where the species co-occur, and may be misidentified without proper mounting, we
only extracted specimen-based records from it. Exotic distribution records of M. tanajoa in
Africa originated from a database compiled by the International Institute of Tropical
Agriculture (IITA), as part of the monitoring efforts of their Africa-wide Biological
Control Programme (ABCP; Yaninek 1988; Yaninek and Herren 1988). Exotic distribution
records of M. mcgregori in Asia originated partly from specimen-based records submitted
to GBIF (Vasquez-Ordonez and Parsa 2014) and partly from published records reporting
its invasion in Hainan, China (Lu et al. 2012). This last source originally misreported the
species as M. tanajoa, subsequently correcting its identification after submitting samples
for verification to CIAT’s Arthropod Reference Collection. Subsequent publications by the
authors report the species as M. mcgregori (e.g., Lu et al. 2014a). To mitigate the impact of
uneven sampling in our occurrence data (see Reddy and Davalos 2003; Peterson et al.
2014; Radosavljevic and Anderson 2014), we applied a distance correction by taking only
one point within a radius of 5 km for the Andean region, 10 km for the African highlands,
12 km for the Caribbean, and 25 km for the African lowlands. During exploratory anal-
yses, we found that these distances resulted in a sampling intensity proportional to the
Exp Appl Acarol
123
region’s environmental heterogeneity, without unduly reducing our record set. Distance
correction resulted in 429 spatially-filtered occurrence records for M. tanajoa and 55 for M.
mcgregori.
Environmental data
Our source of environmental data for species distribution modeling was the WorldClim
database (Hijmans et al. 2005), from which we obtained 19 bioclimatic predictor layers
summarizing annual trends, seasonality and extremes in temperature and precipitation at a
spatial resolution of 30 arc-seconds (i.e. 1 km2). As advocated by Peterson et al. (2007), we
first extracted all 19 bioclimatic predictors for our occurrence records and examined their
pairwise correlations to select a subset of uncorrelated predictors (Pearson’s |r| \ 0.70). To
facilitate model interpretation, our selection favored variables capturing annual trends over
quarterly or monthly trends. We therefore selected: (1) Annual Mean Temperature (Bio01),
(2) Mean Diurnal Range (Bio02), (3) Isothermality (Bio03), (4) Temperature Seasonality
(Bio04), (5) Annual Precipitation (Bio12), and (6) Precipitation Seasonality (Bio15).
Distribution modeling
Our species distribution modeling relied on the maximum entropy approach implemented
in Maxent (version 3.3.3 k; Elith et al. 2011; Phillips et al. 2004, 2006), one of the best
performing methods to model presence-only occurrence data (Elith et al. 2006). The
uncorrelated bioclimatic variables were used as environmental layers to predict species
occurrences. Following general recommendations for background selection (Barve et al.
2011; Radosavljevic and Anderson 2014), the study area was delimited by the tropical
region of the continent(s) containing the training records, between the latitudes 39�S and
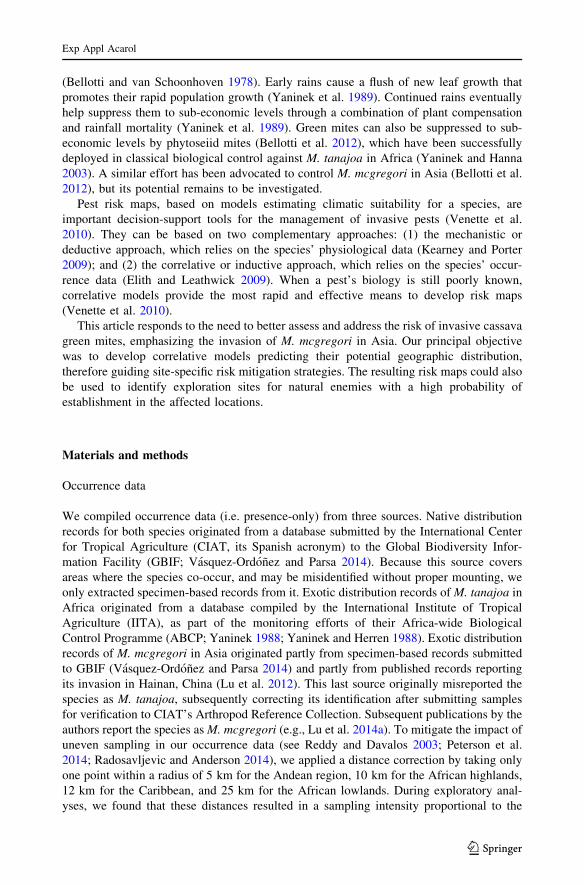
Fig. 2 Global occurrence records for Mononychellus tanajoa and M. mcgregori compiled from fieldobservations and collection specimens of the International Center for Tropical Agriculture (CIAT) and theInternational Institute of Tropical Agriculture (IITA)
Exp Appl Acarol
123
31�N. The models for both species were run selecting the auto features, logistic output and
random seed, and the maximum number of background points maintained at 10,000. To
ensure model convergence, we increased the maximum iterations to 5,000, maintaining the
convergence threshold at 0.00001. To maximize model sensitivity, we explored a range of
regularization coefficients (1–4; Merow et al. 2013; Radosavljevic and Anderson 2014),
arriving at a value of 1 for M. tanajoa and 3 for M. mcgregori. The Jackknife test was
performed to estimate the importance of the environmental predictors. We developed
geographically-structured models trained and tested with records from different continents,
a practice recommended for invasive species risk assessments (Jimenez-Valverde et al.
2011). The definitive models were based on the full datasets. To assess model performance,
17.5
20.0
22.5
25.0
27.5
30.0
8.0
10.0
12.0
14.0
16.0
18.0Bio02
Bio01
40
50
60
70
80
90
100Bio03
750
1500
2250
3000
3750
4500Bio04
750
1500
2250
3000
3750
4500Bio12
20
40
60
80
100
120
140Bio15
Am
eric
a
Asi
a
Afri
ca
Am
eric
a
Am
eric
a
Asi
a
Afri
ca
Am
eric
a
M. mcgregori M. tanajoa M. mcgregori M. tanajoa
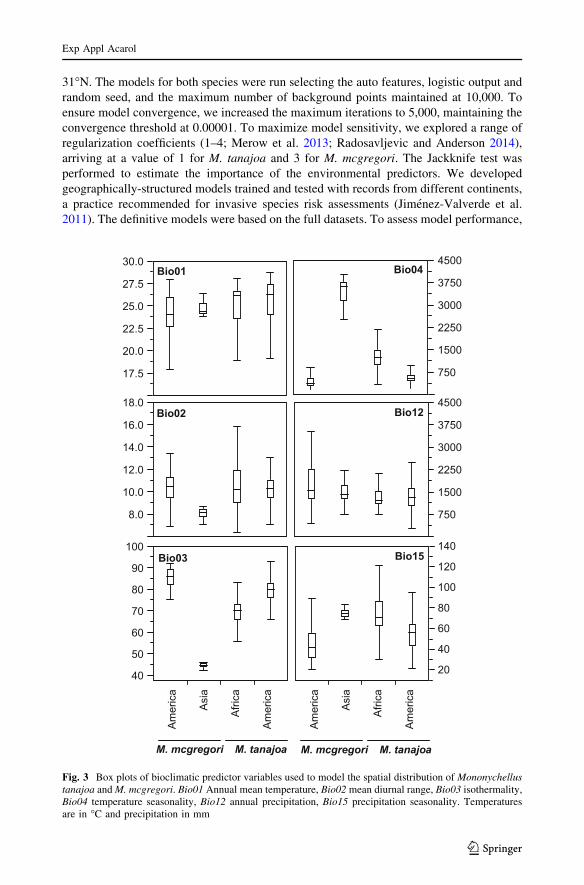
Fig. 3 Box plots of bioclimatic predictor variables used to model the spatial distribution of Mononychellustanajoa and M. mcgregori. Bio01 Annual mean temperature, Bio02 mean diurnal range, Bio03 isothermality,Bio04 temperature seasonality, Bio12 annual precipitation, Bio15 precipitation seasonality. Temperaturesare in �C and precipitation in mm
Exp Appl Acarol
123
we used the Area Under the Curve (AUC), following the guidelines of Baldwin (2009):
AUC [ 0.9: ‘‘very good,’’ 0.9 [ AUC [ 0.7: ‘‘good’’, AUC \ 0.7: ‘‘uninformative.’’
Results
A total of 1,232 occurrence records for M. tanajoa and 99 for M. mcgregori were com-
piled. Out of these, only 617 M. tanajoa records and 86 M. mcgregori records were spa-
tially unique. Their distribution shows some level of geographic overlap within their native
range in South America (Fig. 2). Outside this range, M. tanajoa occurrence is restricted to
Africa and M. mcgregori to Southeast Asia (Fig. 2).
An examination of the Pearson’s correlation matrix for the bioclimatic variables
revealed significant multicolinearity (|r| \ 0.70), leading to the selection of Bio01–Bio04,
Bio12 and Bio15 as environmental predictors for our models. Bio01 was correlated with
Max Temperature of Warmest Month (Bio05), Min Temperature of Coldest Month
(Bio06), Mean Temperature of Wettest Quarter (Bio08), Mean Temperature of Driest
Quarter (Bio09), Mean Temperature of Warmest Quarter (Bio10), and Mean Temperature
of Coldest Quarter (Bio11). Bio02 was correlated with Temperature Annual Range
(Bio07). Bio03 and Bio04 were not correlated with any other bioclimatic variable. Bio12
was correlated with Precipitation of Wettest Month (Bio13), Precipitation of Wettest
Quarter (Bio16), Precipitation of Warmest Quarter (Bio18), and Precipitation of Coldest
Quarter (Bio19). Finally, Bio15 was only correlated with Precipitation of Driest Quarter
(Bio17). Boxplots showing the ranges for these uncorrelated environmental predictors for
both species and across continents are presented in Fig. 3.
The results from our geographically-structured model evaluations are presented in
Table 1. AUCs reveal ‘‘good’’ cross-validation for M. tanajoa but not for M. mcgregori,
suggesting M. mcgregori’s invasive occurrence falls outside its previously-known climatic
range. This inference is supported by the boxplots in Fig. 3, particularly for Bio03 and
Bio04. For both species, predictions were ‘‘very good’’ within the training region.
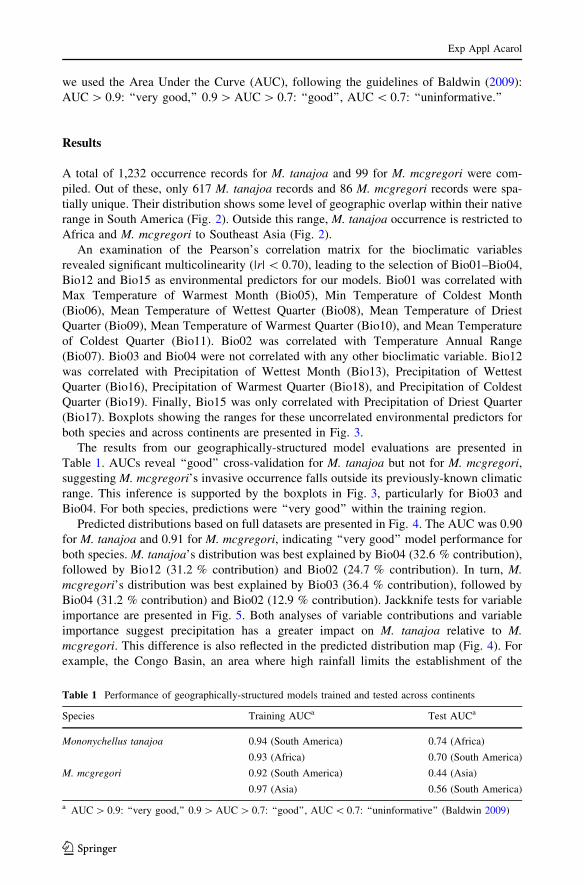
Predicted distributions based on full datasets are presented in Fig. 4. The AUC was 0.90
for M. tanajoa and 0.91 for M. mcgregori, indicating ‘‘very good’’ model performance for
both species. M. tanajoa’s distribution was best explained by Bio04 (32.6 % contribution),
followed by Bio12 (31.2 % contribution) and Bio02 (24.7 % contribution). In turn, M.
mcgregori’s distribution was best explained by Bio03 (36.4 % contribution), followed by
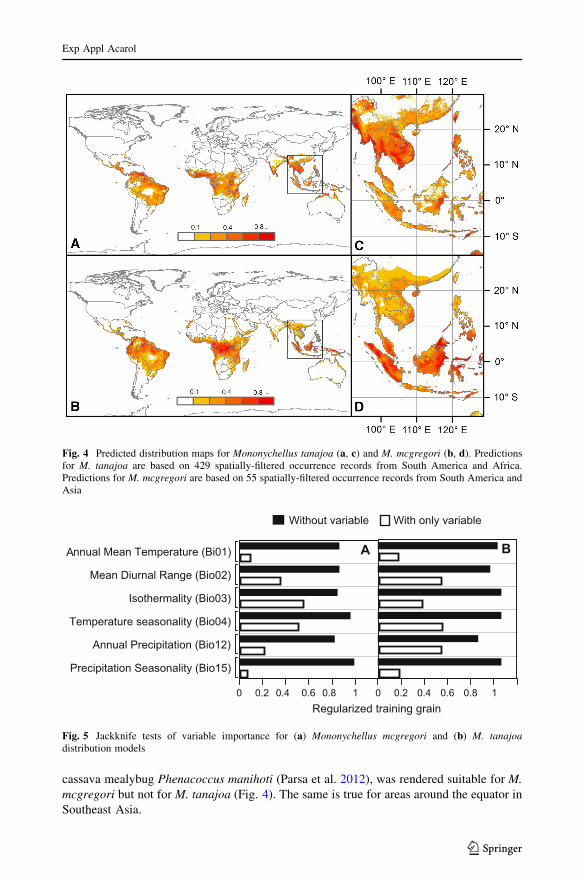
Bio04 (31.2 % contribution) and Bio02 (12.9 % contribution). Jackknife tests for variable
importance are presented in Fig. 5. Both analyses of variable contributions and variable
importance suggest precipitation has a greater impact on M. tanajoa relative to M.
mcgregori. This difference is also reflected in the predicted distribution map (Fig. 4). For
example, the Congo Basin, an area where high rainfall limits the establishment of the
Table 1 Performance of geographically-structured models trained and tested across continents
Species Training AUCa Test AUCa
Mononychellus tanajoa 0.94 (South America) 0.74 (Africa)
0.93 (Africa) 0.70 (South America)
M. mcgregori 0.92 (South America) 0.44 (Asia)
0.97 (Asia) 0.56 (South America)
a AUC [ 0.9: ‘‘very good,’’ 0.9 [ AUC [ 0.7: ‘‘good’’, AUC \ 0.7: ‘‘uninformative’’ (Baldwin 2009)
Exp Appl Acarol
123
cassava mealybug Phenacoccus manihoti (Parsa et al. 2012), was rendered suitable for M.
mcgregori but not for M. tanajoa (Fig. 4). The same is true for areas around the equator in
Southeast Asia.
Fig. 4 Predicted distribution maps for Mononychellus tanajoa (a, c) and M. mcgregori (b, d). Predictionsfor M. tanajoa are based on 429 spatially-filtered occurrence records from South America and Africa.Predictions for M. mcgregori are based on 55 spatially-filtered occurrence records from South America andAsia
Precipitation Seasonality (Bio15)
Annual Precipitation (Bio12)
Temperature seasonality (Bio04)
Isothermality (Bio03)
Mean Diurnal Range (Bio02)
Annual Mean Temperature (Bi01)
0 0.2 0.4 0.6 0.8 10 0.2 0.4 0.6 0.8 1
With only variableWithout variable
Regularized training grain
A B
Fig. 5 Jackknife tests of variable importance for (a) Mononychellus mcgregori and (b) M. tanajoadistribution models
Exp Appl Acarol
123
Discussion
Our main objective was to predict the potential distribution of M. tanajoa and M.
mcgregori in order to guide the development of appropriate risk mitigation measures.
These measures could include the passage of phytosanitary regulations, the establishment
of pest-surveillance networks, and the development of emergency response plans to
address their potential incursion (Venette et al. 2010). Our predictions should therefore be
most valuable for major cassava growing regions that are highly suitable for the species,
but where the species are still absent. In Southeast Asia, for example, these locations
include Thailand and Vietnam for M. tanajoa and Indonesia for M. mcgregori. These three
countries alone accounted for over 70 % of the 4.2 million hectares of cassava produced in
the region in 2013 (FAOSTAT 2014).
Given the magnitude and spatial coverage of our database, we suspect the risk maps
presented here represent the best approximation to M. tanajoa and M. mcgregori’s
potential distribution available to date. A previous effort to model M. tanajoa relied on
only 215 occurrence records (Herrera Campo et al. 2011), and generated broadly similar
predictions to ours, albeit rendering high-rainfall locations more suitable for the species
than our model. Our predictions, based on 429 spatially-filtered records, rendered the same
locations relatively unsuitable, but are more consistent with previous research demon-
strating rainfall is a primary mortality factor limiting M. tanajoa populations (Gutierrez
et al. 1988; Yaninek et al. 1989). Previous models of M. mcgregori may be less reliable, as
they utilized M. tanajoa and M. mcgregori occurrence records jointly as data inputs (Lu
et al. 2012, 2014b), potentially biasing the latter’s predicted distribution.
Our geographically-structured models suggest the invasive range of M. mcgregori
shares little climatic similarity with its known native range in the Americas. The differ-
ences are particularly acute with respect to isothermality and temperature seasonality,
likely reflecting a tropical bias in our native distribution records and a subtropical bias in
our invasive distribution records. As indicated by AUC of the definitive M. mcgregori
model, however, the biases were corrected by deploying the full occurrence dataset.
Our results suggest that unlike M. tanajoa, M. mcgregori typically occurs in locations
with no pronounced dry season. Its ability to survive in those locations, however, does not
necessarily imply an ability to reach economic status. It is generally believed that cassava
green mites need a dry season lasting 2–6 months with rainfall below 60 mm/month to
become economic pests (Bellotti et al. 1987, 2012). This condition is met across the
locations where M. mcgregori was reported as an invasive pest in Asia. However, the
extent to which M. mcgregori may impact cassava during the wet season, or in locations
without a dry season, merits empirical attention.
For locations where cassava green mites are already established as invasive pests,
classical biological control by phytoseiid predators should be considered. Based on their
climatic homology to potential target areas, our predictions suggest Colombia’s inter-
Andean valleys rank among the best sites to import them from. Explorations conducted in
Colombia during the mid-1980s identified 46 phytoseiid species associated with cassava
mites (Bellotti et al. 1987). The list includes Typhlodromalus aripo, a predator introduced
into Africa to target M. tanajoa, resulting in a highly successful case of classical biological
control (Yaninek and Hanna 2003). Efforts to test the potential of T. aripo or an alternative
phytoseiid predator against M. mcgregori in Asia are therefore warranted.
Acknowledgments We thank Rodrigo Zuniga for his curatorial work at CIAT’s Arthropod ReferenceCollection (CIATARC). We also thank the International Institute of Tropical Agriculture (IITA) for
Exp Appl Acarol
123
generously sharing their M. tanajoa distribution database with us. Emmanuel Zapata and Julian Ramirez(CIAT) kindly helped with GIS methods. This research was supported by the Research Program on Roots,Tubers, and Bananas (RTB) of the Consultative Group on International Agriculture Research (CGIAR).
References
Baldwin RA (2009) Use of maximum entropy modeling in wildlife research. Entropy 11:854–866Barve N, Barve V, Jimenez-Valverde A, Lira-Noriega A, Maher SP, Peterson AT, Soberon J, Villalobos F
(2011) The crucial role of the accessible area in ecological niche modeling and species distributionmodeling. Ecol Modell 222:1810–1819
Bellotti AC, van Schoonhoven A (1978) Mite and insect pests of cassava. Annu Rev Entomol 23:39–67Bellotti AC, Mesa N, Serrano M, Guerrero J, Herrera C (1987) Taxonomic inventory and survey activity for
natural enemies of cassava green mites in the Americas. Int J Trop Insect Sci 8:845–849Bellotti AC, Smith L, Lapointe SL (1999) Recent advances in cassava pest management. Annu Rev Entomol
44:343–370Bellotti AC, Herrera Campo BV, Hyman G (2012) Cassava production and pest management: present and
potential threats in a changing environment. Trop Plant Biol 5:39–72Ceballos H, Fregene M, Perez JC, Morante N, Calle F (2007) Cassava genetic improvement. In: Kang MS,
Priyadarshan PM (eds) Breeding major food staples. Blackwell, Ames, pp 365–391Chen Q, Lu F, Huang G, Li K, Ye J, Zhang Z (2010) General survey and safety assessment of cassava pests.
Chin J Trop Crops 31:819–827Elith J, Leathwick JR (2009) Species distribution models: ecological explanation and prediction across
space and time. Annu Rev Ecol Evol Syst 40:677–697Elith J, Graham CH, Anderson RP, Dudik M, Ferrier S, Guisan A, Hijmans RJ, Huettmann F, Leathwick JR,
Lehmann A (2006) Novel methods improve prediction of species distributions from occurrence data.Ecography 29:129–151
Elith J, Phillips SJ, Hastie T, Dudık M, Chee YE, Yates CJ (2011) A statistical explanation of maxent forecologists. Divers Distrib 17:43–57
FAOSTAT (2014) Cassava. http://faostat.fao.org/site/567/default.aspx#ancor. Accessed 28 Nov 2014Gutierrez A, Yaninek JS, Wermelinger B, Herren H, Ellis C (1988) Analysis of biological control of cassava
pests in Africa. III. Cassava green mite Mononychellus tanajoa. J Appl Ecol 25:941–950Herrera Campo BV, Hyman G, Bellotti AC (2011) Threats to cassava production: known and potential
geographic distribution of four key biotic constraints. Food Sec 3:329–345Hijmans RJ, Cameron SE, Parra JL, Jones PG, Jarvis A (2005) Very high resolution interpolated climate
surfaces for global land areas. Int J Climatol 25:1965–1978Jimenez-Valverde A, Peterson AT, Soberon J, Overton J, Aragon P, Lobo JM (2011) Use of niche models in
invasive species risk assessments. Biol Invasions 13:2785–2797Kearney M, Porter W (2009) Mechanistic niche modelling: combining physiological and spatial data to
predict species’ ranges. Ecol Lett 12:334–350Lebot V (2009) Tropical root and tuber crops: cassava, sweet potato, yams and aroids. CABI, WallingfordLu H, Ma Q, Chen Q, Lu F, Xu X (2012) Potential geographic distribution of the cassava green mite
Mononychellus tanajoa in Hainan, China. Afr J Agric Res 7:1206–1213Lu F, Chen Q, Chen Z, Lu H, Xu X, Jing F (2014a) Effects of heat stress on development, reproduction and
activities of protective enzymes in Mononychellus mcgregori. Exp Appl Acarol 63:267–284Lu H, Lu F, Xu XL, Chen Q (2014b) Potential geographic distribution areas of Mononychellus mcgregori in
Guangxi province. Appl Mech Mater 522:1051–1054Merow C, Smith MJ, Silander JA (2013) A practical guide to MaxEnt for modeling species’ distributions:
what it does, and why inputs and settings matter. Ecography 36:1058–1069Parsa S, Kondo T, Winotai A (2012) The cassava mealybug (Phenacoccus manihoti) in asia: first records,
potential distribution, and an identification key. PLoS ONE 7:e47675Peterson AT, Papes M, Eaton M (2007) Transferability and model evaluation in ecological niche modeling:
a comparison of GARP and Maxent. Ecography 30:550–560Peterson AT, Moses LM, Bausch DG (2014) Mapping transmission risk of Lassa Fever in West Africa: the
importance of quality control, sampling bias, and error weighting. PLoS ONE 9(8):e100711. doi:10.1371/journal.pone.0100711
Phillips SJ, Dudık M, Schapire RE (2004) A maximum entropy approach to species distribution modeling.Proceedings of the 21st international conference on machine learning. ACM Press, New York,pp 655–662
Exp Appl Acarol
123
Phillips SJ, Anderson RP, Schapire RE (2006) Maximum entropy modeling of species geographic distri-butions. Ecol Modell 190:231–259
Radosavljevic A, Anderson RP (2014) Making better Maxent models of species distributions: complexity,overfitting and evaluation. J Biogeogr 41:629–643
Reddy S, Davalos L (2003) Geographical sampling bias and its implications for conservation priorities inAfrica. J Biogeogr 30:1719–1727
Vasquez-Ordonez AA, Parsa S (2014) A geographic distribution database of Mononychellus mites (Acari,Tetranychidae) on cassava (Manihot Esculenta). ZooKeys 407:1–8
Venette RC, Kriticos DJ, Magarey RD, Koch FH, Baker RH, Worner SP, Raboteaux NNG, McKenney DW,Dobesberger EJ, Yemshanov D (2010) Pest risk maps for invasive alien species: a roadmap forimprovement. Bioscience 60:349–362
Yaninek JS (1988) Continental dispersal of the cassava green mite, an exotic pest in Africa, and implicationsfor biological control. Exp Appl Acarol 4:211–224
Yaninek JS, Hanna R (2003) Cassava green mite in africa: a unique example of successful classicalbiological control of a mite pest on a continental scale. In: Neuenschwander P (ed) Biological controlin IPM systems in Africa. CABI, Wallingford, pp 61–75
Yaninek JS, Herren H (1988) Introduction and spread of the cassava green mite, Mononychellus tanajoa(Bondar) (Acari: Tetranychidae), an exotic pest in Africa and the search for appropriate controlmethods: a review. Bull Entomol Res 78:1–13
Yaninek JS, Herren H, Gutierrez AP (1989) Dynamics of Mononychellus tanajoa (Acari: Tetranychidae) inAfrica: seasonal factors affecting phenology and abundance. Environ Entomol 18:625–632
Exp Appl Acarol
123