The impact of animated videos on attraction -Mira Wehbe ...
152
THE IMPACT OF ANIMATED VIDEOS ON ATTRACTION, ATTENTION, UNDRSTANDING, RECALL AND KNOWLEDGE OF LEBANESE ONLINE USERS A Thesis presented to the Faculty of Humanities at Notre Dame University-Louaize In Partial Fulfillment of the Requirements for the Degree Masters of Arts in Media Studies Advertising by Mira Wehbe Spring 2019
-
Upload
khangminh22 -
Category
Documents
-
view
1 -
download
0
Transcript of The impact of animated videos on attraction -Mira Wehbe ...

THE IMPACT OF ANIMATED VIDEOS ON ATTRACTION, ATTENTION, UNDRSTANDING, RECALL AND KNOWLEDGE OF LEBANESE ONLINE USERS
A Thesis
presented to
the Faculty of Humanities
at Notre Dame University-Louaize
In Partial Fulfillment
of the Requirements for the Degree
Masters of Arts in Media Studies
Advertising
by
Mira Wehbe
Spring 2019

© COPYRIGHT
By
Mira Wehbe
2019
All Rights Reserved

Notre Dame University - LouaizeFaculty of Humanities
Department of Media Studies
We hereby approve the thesis of
Mira Wehbe
Candidate for the degree of Masters of Artin Media Studies/Advertising
~-ti2Dr. Jessica El-Khoury Committee Member
Dr.Chri~= Committee Member
Committee Member
Dr. Mana Bou Zeid
CHAIp.PEnSOi'i
IMEO!ASTUDIES
Chairperson

Table of Contents
Abstract
Chapter1:Introduction..............................................................................................................1
Chapter2:LiteratureReview....................................................................................................3
2.1DefinitionofAnimation..................................................................................................................3
2.2EffectivenessofAnimation............................................................................................................4
2.3AttentiontoAdvertisement...........................................................................................................5
2.4EffectofAnimationonAttention.................................................................................................9
2.5MemoryofAdvertisement..........................................................................................................10
2.6EffectofAnimationonRecognitionandRecall...................................................................11
2.7AnimationCombinedwithVideo(AnimatedVideo).........................................................13
2.8ConclusionofLiterature..............................................................................................................18
Chapter3:TheoreticalFramework......................................................................................22
3.1TheUsesandGratificationsTheory........................................................................................22
3.2TheCognitiveTheoryofMultimediaLearning....................................................................25
3.3InformationGraphics...................................................................................................................28
3.3aConceptofAppealorAttention...............................................................................................30
3.3bConceptofComprehensionorCognition............................................................................41
3.3c:ConceptsofRetentionorRecall............................................................................................47
ResearchQuestionsandHypotheses...................................................................................54
Chapter4:Methodology............................................................................................................55
4.1SamplingandProcedure.............................................................................................................55
4.2StructureoftheStudy...................................................................................................................56

4.3Variables...........................................................................................................................................58
IndependentVariables........................................................................................................................58
AnimatedVideo.................................................................................................................................58
OnlineArticle.....................................................................................................................................58
DependentVariables..........................................................................................................................60
PriorKnowledge..........................................................................................................................................60
Recall.........................................................................................................................................................60
Attraction.................................................................................................................................................61
Attention...................................................................................................................................................61
Understanding........................................................................................................................................62
PostExposureKnowledge..................................................................................................................62
LevelofKnowledge...............................................................................................................................63
Consumerbehavior..............................................................................................................................63
UsesandGratificationtheory...........................................................................................................63
Chapter5:DataAnalysisandResults...................................................................................65
5.1.R1aAttraction................................................................................................................................65
5.1.R1bAttention.................................................................................................................................66
5.1.H1aAttraction................................................................................................................................68
5.1.H1bAttention.................................................................................................................................69
5.2R2Understanding..........................................................................................................................70
5.3R3Recall............................................................................................................................................71
5.3H2Recall...........................................................................................................................................74
5.4R4aPriorKnowledgeandPostKnowledge..........................................................................75
5.4R4bLevelofKnowledge..............................................................................................................77
5.4H3PriorKnowledgeandPostKnowledge............................................................................78

5.5ConsumerBehavior:UsesandGratificationsTheory.......................................................78
Chapter6:Discussion................................................................................................................81
6.1AttractionandAttention.............................................................................................................81
6.2Understanding................................................................................................................................84
6.3Recall..................................................................................................................................................88
6.4aPriorKnowledgeandPostKnowledge.................................................................................92
6.4bLevelofKnowledge.....................................................................................................................94
6.5ConsumerBehavior:UsesandGratificationsTheory.......................................................96
Chapter7:LimitationsandSuggestions..............................................................................98
Chapter8:Conclusion.............................................................................................................100
References..................................................................................................................................101
AppendixA:AnimatedVideoQuestionnaire..................................................................104
AppendixB:OnlineArticleQuestionnaire......................................................................121
AppendixC:PriorKnowledgeandPostKnowledgeforAnimatedVideo.............139
AppendixD:PriorKnowledgeandPostKnowledgeforOnlineArticle................140
AppendixE:AnimatedVideoResponses..........................................................................141
Table1:Attraction(AnimatedVideo).........................................................................................141
Table2:Attention(AnimatedVideo)...........................................................................................141
Table3:Understanding(AnimatedVideo)................................................................................142
Table4:Recall(AnimatedVideo)..................................................................................................142
Table5:ConsumerBehavior:UsesandGratificationTheory:(AnimatedVideo).......144

Abstract
With the rise of the digital age, the number of advertisements on digital platforms keeps
growing. Consumers are now more active when searching for information to gratify their needs
and increase their knowledge on the medium. This makes it challenging for advertisers and
marketers to always stay up to date and create new tactics to grab consumers’ attention.
Competition is now stronger than ever, thus the need is to think beyond the propositions of their
products and services to provide a unique value to potential consumers. Recently, there has been
a significant rise in the use of online videos especially animated video as a medium to educate,
entertain, inspire, and engage potential customers at the sale cycle. They have become the preferred
content medium for conveying complex information for (B2B) Business-to-Business, (B2C)
Business-to-Consumer and (C2C) Consumer-to-Consumer around the world.
Using the uses and gratifications theory with the cognitive multimedia theory, as well as the
concepts of attention, comprehension, and recall, this study, therefore, examines the impact of
animated videos (2D format), in terms of attraction, attention, understanding, recall and knowledge
on Lebanese online users.
Keywords: Animated Video, Online Article, Brand, Attraction, Attention, Recall,
Understanding, Knowledge, Consumer Behavior, Uses and Gratification Theory, Cognitive
Multimedia Theory, Information Graphics, Lebanese Online Users.

ANIMATED VIDEOS 1
Chapter 1: Introduction
One of the advantages of the internet is the availability of information within a fraction of a
second. Consumers, therefore, tend to seek information online rather than through other types of
media. In today’s age, online media opens a variety of information for online users such as news,
videos, as well as opening new avenues for online education (Ritchie, 2012, p. 30). However, the
overload of information can create knowledge gaps shortly after gaining the knowledge. But this
is not an option anymore; the knowledge gap is a necessity to be able to process the enormous
amount of data being consumed on daily basis (Ritchie, 2012, p. 12). The new information age in
which we live has changed the way people process information (Ritchie, 2012, p. 12). There is an
excess amount of information to be taken in; therefore new communication methods have to be
created to ensure that people retain the information they are exposed to (Ritchie, 2012, p.12).
Among other information, online users are constantly exposed to online advertisement
whether they are shopping, searching for information, or simply web surfing (Kuisma, Simola,
Uusitalo & Öörni, 2010). This overload of advertisements creates advertising clutter defined as a
high number of online ads appearing on a single online page. This clutter increases advertisement
avoidance and reduces consumers’ memory of online advertisement (Cho & Cheon 2004; Ha &
McCann 2008; McCoy et al. 2007). Besides, in today’s business world, consumers have become
more aware of the traditional advertising and marketing strategies used online (Ritchie, 2012,
p.12). Businesses, therefore, need to find new ways to attract and maintain customers, other than
using tactics like hard-sell advertisements (Ritchie, 2012, p.12). Hence, online advertisers are
using animation as part of a variety of advertising techniques to grab customer’s attention and help
them identify with their advertisements (Kuisma, Simola, Uusitalo & Öörni, 2010). Competition
is now stronger than ever, and brands need to think beyond the propositions of their products and

ANIMATED VIDEOS 2
services to provide a unique value to their customers. The purpose of brand communication is not
only to inform but also to entertain. Consumers are interested in real and interesting knowledge;
otherwise they will not retain that knowledge (Ritchie, 2012, p.12).
New technologies are used to reduce production time and costs, thus making animation a more
common tool used in television commercials and interactive advertising (Furniss, 2006; Frierson,
1994; Furniss, 1991; Matthew, Lapierre, Vaala, & Linebarger, 2001). Many researchers have
conducted studies on how animation and format affect online consumers’ attention and memory
of online advertisement (Kuisma, Simola, Uusitalo & Öörni, 2010). However, none have studied
the effect of these online advertisement specifically animated video (2D format), on the attraction,
attention, understanding, recall and knowledge of Lebanese online users. Using the uses and
gratifications theory with the cognitive multimedia theory, as well as the concepts of attention,
comprehension, and recall, this study, therefore, examines the impact of animated videos (2D
format), in terms of attraction, attention, understanding, recall and knowledge on Lebanese online
users. More specifically, to investigate the topic, this study conduct an online experiment on two
groups; the first group will be exposed to an animated video while the second will be exposed to
an online article with the same content.
The objective of the study is to investigate the effectiveness of animated videos used by brands
and their impact on grabbing online users’ attention, enhancing their recall of information and
increasing their knowledge through conveying complex facts within a very short time, as well as
understanding why online users gravitate towards these types of videos.

ANIMATED VIDEOS 3
Chapter 2: Literature Review
This chapter provides a review of the literature with regards to the 2D animation format and
its impact. Therefore, an initial overview and definition of animation especially 2D animation will
be dealt with first. The chapter, then, discusses different academic articles that deal with the
animation effects. After defining animation, the chapter discusses simultaneity effectiveness of
animation, attention to ads, effect of animation on attention, memory of ads, effect of animation
on recognition and recall, animation combined with video (animated video) and a conclusion of
literature.
2.1 Definition of Animation
“Animation offers a medium of storytelling and visual entertainment which can bring pleasure
and information to people of all ages everywhere in the world” (Walt Disney, 1920).
Many scholars and researchers introduced different definitions of the word animation.
According to Baecker and Small (1990), “Animation is defined as a dynamic visual statement,
form, or structure that evolves through movement over time.” Another definition was given by
Furniss (2006) who stated that the creation of animation is generated by a series of still images
such as drawings, objects, people that are placed in several positions, and are moving over a time
frame. Animation refers to several techniques usually classified into different categories used in
different domains. It includes simple animation, traditional animation, computer graphic
animation: two-dimensional (2D) vector-based animation and three-dimensional (3D) computer
animation, motion graphics animation and stop motion animation, which will be discussed in
details later on (Furniss, 2006; Frierson, 1994; Furniss, 1991; Matthew, Lapierre, Vaala, &
Linebarger, 2001). The two-dimensional (2D) animation is rendered in celluloid, which is defined
according to the New Oxford American Dictionary as “a transparent flammable plastic made in

ANIMATED VIDEOS 4
sheets from camphor and nitrocellulose, formerly used for cinematographic film such as motion-
picture and X-ray film”, or in traditional cartoon (Matthew, Lapierre, Vaala, & Linebarger, 2001).
However, new technological advances in digital media paved the way for the use of new and
improved techniques such as three-dimensional (3D) objects made out of clay and computer-
generated animation (Jin, 2011).
Animation is seen as а source of illusion. According to Baecker and Small (1990), it is defined
as a sequence of still and continuous images that changes quickly to create an illusion of motion.
This illusion emphasizes the difference between а real action and an animation. Furniss (2006)
mentioned that animation creates a true representation of the real world because it can reproduce
the true nature of what we are seeing on screen. In advertising, the term animation is related to
cartoons. The use of popular animated characters on children’s food products, for instance, will
affect their assessment of taste (Matthew, Lapierre, Vaala, & Linebarger, 2001). Simon stressed
that “animation offers advertising clients a powerful tool: The opportunity to showcase a product
or service via a detailed virtual tour on the Internet” (Gorn, 1982, p. 25).
2.2 Effectiveness of Animation
Studies on the effectiveness of animation in online advertising have focused specially on the
examination of the absence versus the presence of animation and their results.
Many findings suggest that online advertisements have little effect on consumer’s attention
because they are not catchy and the consumer forgets them almost instantly. (Benway & Lane
1998; Burke et al. 2005; Cho & Cheon 2004; Drèze & Hussherr 2003; Stenfors, Morén, &
Balkenius 2003). Even though, the use of animation with such online advertisements has proven
to be disruptive, it tends to be a powerful and effective tool when associated with a video (Briggs
& Stipp, 1999). Animation has proven to be one of the most important attention grabbing factors

ANIMATED VIDEOS 5
in attracting consumers’ attention to internet advertising (Kuisma, Simola, Uusitalo & Öörni,
2010). Findings have then shown the positive, neutral and even negative effects of animation on
attention and ad memory, and the negative effects when animation is excessive (Sundar &
Kalyanaraman 2004; Yoo & Kim 2005).
2.3 Attention to Advertisement
Many studies agree that sensorial and cognitive capacities for information processing are key
to consumer’s willingness to allocate their limited attention to online ads (Lutz & Huitt 2003;
McInnis & Jaworski 1989; Petty, Cacioppo, & Schumann 1983). By studying the change in visual
attention and eye movements, it has been shown that both are related (Hoffman 1998; Posner 1980)
while processing complex information such as reading text and viewing pictures (Rayner, 1998).
In addition, pictures gain faster attraction and attention by helping the viewer determine the subject
of the story (Holmqvist & Wartenberg, 2005).
According to Yantis & Gibson (1994), visual attention can be affected by a number of
variables/properties an object has such as its shape, color, and size. In addition, different factors
such as content, characteristics, and advertising clutter play another major role on the attention of
online users (Calder, Malthouse, & Schaedel 2009). In recent years, advertisers and marketers have
been trying to find new ways to grab people’s attention (Ritchie, 2012). There is a high demand
for consumers’ attention with the increasing number of new brands, new products and new
services. By using social media tools such as blogs, social platforms (Facebook, Instagram, Twitter
and Vimeo), and online communities advertisers and marketers are able to promote brands, engage
customers and create brand relationships with clients (Ritchie, 2012). “At the same time,
consumers have been armed with all sorts of tools to avoid paying attention to advertisements,
including DVRs, ad blockers, and mobile devices that allow them to shift their attention to content

ANIMATED VIDEOS 6
of their choosing” (Teixeira, 2015). Due to our competitive environment, companies need to know
how to use the best technics to capture and retain consumer’s attention. The amount of attention
consumers give to ads can be predictable depending on brands, products or services, as well as,
the media environment and characteristics of the message vehicle used in the ad to grab consumers’
attention (Calder, Malthouse, & Schaedel 2009).
Media environments such as television and internet allow advertisers to combine sound and
motion with pictorial and textual advertising stimuli (Ha and McCann 2008). Since online
environments provide online users with search engines and interactivity (Kuisma, Simola, Uusitalo
& Öörni, 2010) as stated in the introduction, these users are more oriented and active than other
media users who are identified as passive (Ha & McCann 2008). Consumers can turn off the TV
and or the radio whenever the commercial break begins or watch it while turning off the sound.
This is limited in online environments, where consumers by trying to avoid looking at
advertisements, their peripheral attention may always be caught by them (Ha & McCann 2008). In
the cinema, for instance, people tend to pay much attention to ads and trailers projected in front of
them, as they are more or less captive audiences. On the other hand, people who watch TV with a
computer in their lap or a mobile phone by their side or in their hands, tend to pay less attention to
what is happening on the television screen. “Therefore, the best content for ads depends on the
context in which viewers will be exposed to these ads, and the predicted level of attention that they
are likely to provide” (Teixeira, 2015). Below is a table showing how attention levels and therefore
advertising strategies differ depending on the context:

ANIMATED VIDEOS 7
Figure 1: Optimize Video Advertising for Your Audience’s Attention Level
Advertisers and marketers need to create good content in their ads to engage and persuade the
audience. In the pre-internet era, people mainly accessed information about new brands, products
or services through TV advertisements. They were able and willing to pay more attention to
promotional or informational content watched on television. “With the ubiquity of on-demand
information, that’s no longer the case; in general today’s consumers will pay significantly more
attention to content designed to entertain them. This holds true for B2B and B2C audiences alike”
(Teixeira, 2015).
However, in the cinema, consumers are attentive. While sitting inside a dark room, they
probably don’t have any access to competing content, but this is changing sometimes as people
are now using their smart-phone inside the cinema. In this context, advertisers and marketers can
assume that their audience will pay attention to their ads so they can focus on persuasion and spend
more of the ad time imparting product information (Teixeira, 2015). “While not devoid of
entertaining content, it [the ad] also doesn’t shy away from explaining exactly how the product is
used, even narrating its benefits and prominently showing the brand” (Teixeira, 2015). Unlike
people who watch cinema, people who watch television have a lot of other alternatives vying for
their attention. Consumers can change the channel, pick up their smart phone, and walk into the
kitchen to have a snack’ pause and then fast-forward through commercials or even turn off the TV

ANIMATED VIDEOS 8
(Teixeira T., 2015). In an experiment done by Teixeira (2015) 88 video ads of various food and
beverage products were shown. Participants were told that they could skip any ad they chose. An
algorithm was used to measure their facial reactions. The time and intensity of emotional
engagement each ad provoked was measured. Participants were then asked to purchase one of the
products they saw. Correlation was then made between the purchasing choices and the intensity
with which each advertisement engaged consumer attention. “As a result, the Pepsi ad, ‘Love
Hurts’ resulted in the highest rate of sales conversion despite not being the most engaging”
(Teixeira T., 2015). Results showed that if the ads were too emotional, the sales would decrease
because consumers focus on content and do not pay much attention to the persuasive aspects of
the ad. Results also showed that “entertainment presented after the first exposure of the brand
always improves purchases while entertainment presented before the brand always diminishes it”
(Teixeira T., 2015). Good television advertising grabs audience’s attention in the first five seconds.
But sometimes, audiences are not even watching the TV or paying attention to the advertisement.
Therefore, advertisers and marketers need to capture their attention when the ad is ongoing:
… When a television is on in the background during the typically busy “early evening” time slots, when younger audiences also called the multitasks, make up the bulk of viewers or when your advertisement will play in the middle of a “pod” of commercials (Teixeira T., 2015).
An advertisement for Target Australia, for example, used attractive music, colorful images, “stop-
motion animation that makes it eye-catchingly disjointed and artsy” (Teixeira, 2015). Eventually,
the video ad draws audiences’ in, after attracting the viewers to the ad; at the end it provides
minimal information about the brand. It was found that immediately after the Target ad was aired
on TV, the company’s website saw a 30% increase in traffic for two minutes and this increase
translated in a considerable sales hike up.

ANIMATED VIDEOS 9
Attention considerably depends on the context the ads are placed in. In Times Square in
Manhattan, for instance, only brands with strong brand equity can grab viewer’s attention. Add to
that, few brand categories can avoid consumers’ skipping of their ads (Teixeira, 2015). The ad
should have a strong appeal. A good example would be the Duracell ad, which turned into a viral
sensation with 16 million views on YouTube within the span of two weeks. Duracell used celebrity
actor Kevin Jorgeson in their ad, thereby getting his followers engaged and interested in the ad,
prompting them to share the video online. “A viral ad can be “engineered” by reaching out to
influencers, well-connected bloggers, Internet personalities and opinion leaders to have them be
the initial distributor to their online audiences” (Teixeira, 2015). These influencers’ people start
the snowball rolling and after that the ad goes viral. In fact, viral ads got transformed from a form
of earned media into a form of paid media. For any ad to have its effect, it has to grab people’s
attention first. As mentioned, people’s attention spans are shorter than before and more brands
compete for attention. Therefore nowadays, it is much more complicated and expensive to grab
and hold the audience attention. Today’s advertisers and marketers must think of how to entertain
the audience’s to grab their attention and hold it in order to provide relevant information. They
should understand the attention potential of each medium and context to start their media buying
strategy to know exactly which one is the most effective and how much time and effort to spend
on each step (Teixeira, 2015).
2.4 Effect of Animation on Attention
As stated before, advertising clutter increases advertisement avoidance on the Internet (Cho
& Cheon 2004; Ha & McCann 2008). Therefore, online advertisers should ask many questions
before launching their online advertising campaigns. For example, do consumers see and recognize
our ad?

ANIMATED VIDEOS 10
Kuisma, Simola, Uusitalo and Öörni (2010), found that animation used for online ads had
little or no effect on attention. Another study conducted by Yoo and Kim (2005) proposes that ad
animation and amounts of attention given to the ads create a positive relationship between the two
and animated ads are more likely to grab a consumer’s attention than static ads. In contrast, Hong,
Thong, and Tam (2004) suggest that during a visual search, online users are more likely to pay
attention to animation when their searching is animation otherwise animation effect can decrease
attention. In addition to that, research suggests that during a targeted search, online users do not
pay attention to online ad (Burke et al. 2005; Diaper & Waeland 2000; Drèze & Hussherr, 2003).
But the use of animation inside a video as a form of a viral video spread online would make the ad
stand out (Ritchie, 2012). Animation can attract audience attention and get them to have a deeper
interest in the ad (Hassan, G, H., 2016).
2.5 Memory of Advertisement
Multiple studies conducted on the effectiveness of an advertisement have shown that
evaluating effectiveness is about how well the consumers can recall and recognize the ad.
According to Alba, Hutchinson, and Lynch (1991) as well as Reeves and Thorson (1986),
measures of memorization may vary depending on the delay between the exposure and the
measurement time. In addition, many debates tend to choose whether recall or recognition is the
more useful indicator of memorizing (Du Plessis, 1994), categorizing recall with short-term
memories and recognition with long term ones, both measures have proven to be powerful when
it comes to how long the consumers were exposed to the ad (Radach et al. 2003). Moreover, no
correlation was established between high recall or recognition rates and the attractiveness of the
advertisement (Aaker, Batra, & Myers 1992).

ANIMATED VIDEOS 11
Many advertisers would expect people to generate highly memorable activities if they pay
more attention to an ad but according to conventional memory measures, such as recall and
recognition, this is not reliable (Tavassoli, 2008). Ha & McCann (2008) found that, in an online
environment, online advertisements tend to generate situations in which the consumers’ sensorial
capacity becomes heavily overloaded. As a consequence, their memory performance tends to be
very low versus their ad avoidance threshold, which would be high.
2.6 Effect of Animation on Recognition and Recall
Many researchers have tried to find a link between adding animation to an ad and recall or
recognition of the ad by the consumer. Some of the studies targeting online ads suggested that
animation could improve recalling and/or recognizing this type of ads, but the results obtained
were not conclusive. Bayles (2002) asserted that half of the research participants did not remember
seeing the banner ad while searching for information on the web. This led her to deduce that no
correlation exists between recall and animation. While she only used two banners in her
experiment, Burke et al. (2005) increased their number to 100 which turned out to be unhelpful
because the results were supportive of Bayles’ findings: a poor overall recognition level was
noticed with a hit rate of only 20%. Interestingly, the static banners were memorized much more
accurately than the animated ones. Other studies questioning the effectiveness of animated ads
reached the same conclusion. Yoo and Kim (2005) stipulated that animation attracts attention and
enhances the recognition of banners when its rate remains moderate but does not have a significant
impact on recall. Sundar and Kalyanaraman (2004) noticed that adding a high rate of animation in
an ad would generate high arousal without improving memory results. Both studies concluded that
an excess animation in ads reduces recognition accuracy. In contrast, it was found that there is a
correlation between visual attention and memory performance in that visual memory can recall

ANIMATED VIDEOS 12
visual objects regardless of whether consumers can or cannot report them (Brockmole &
Henderson 2005; Williams, Henderson, & Zacks 2005). Some ads that lack focal visual attention
may leave implicit memory traces thus, affecting the evaluation of the advertised brand by
consumers (Janiszewski 1993; Yoo 2007).
In summary, many studies lacked conclusive results about whether recognition and recall were
improved by animation. However, using eye fixation analysis, it was found that consumers could
still remember banners on which they did not focus (Burke et al., 2005). This may indicate that,
“There is no clear correlation between the number and duration of eye fixations and memory
(Velichkovsky, Helmert, & Pannasch 2005), but that memory effects can still take place.” Add to
that and based on the hierarchy-of-effects model, it was assumed that if animation increases
attention, it should also have some effect on memory. A study conducted by Kuisma, Simola,
Uusitalo and Öörni (2010), examines the effectiveness of online advertisement on the attention
and memory of online users. They utilized a web page by using stimuli according to the original
layout of the former home page of teleoperator TeliaSonera’s consumer portal. They measured the
effect of different ads and format through eye-fixation matrix. They used recognition and recall
tests for memory effects. This study was based on an experimental design with a sample of 30
average educated adults’ participants, both male and female with an age range between 20 and 46.
Attention was measured using 4 different experimental conditions: 1) both ads were static, 2) both
ads were animated, 3) the banner was static and the skyscraper was animated, 4) the banner was
animated and the skyscraper was static. Memory was measured using 2x2 (animation vs. static and
banners vs. skyscraper) with a subject factorial design. The results found for attention showed that
animation with skyscrapers has a positive impact on attention measured by the relative frequency
of eye fixations, but a negative one on the attention to banners. Results for memorization showed

ANIMATED VIDEOS 13
that animated ads were more effective for recognition than static ads. This effect was more
significant for banners than for skyscrapers.
2.7 Animation Combined with Video (Animated Video)
YouTube has become the most popular online platform that is showing an increase in the use
of video format (Statista, 2015). Apart from YouTube, there are different online platforms such as
Vimeo, Wistia, and Sprout Video that many people use to upload and watch video on them. In
addition, all social media platforms such as Facebook, Instagram, Snapchat support videos in their
posts and stories, making it easier for advertiser and marketers to promote their brands and for
people to watch something they are interested in.
Videos are one of the most powerful media tools used to capture and convey information
(Hampapur & Jain, 1998). Due to its universal media platform, videos contain visual elements that
are combined together with other media elements in order to present engaging content to potential
consumers. Videos have the characteristics of moving pictures, visualization with audio support,
storytelling or conveying messages, which are very suitable for learners among other type of media
(Yuen, M., Koo, A., Woods, P. 2018). According to Graham (2015) video platforms are often
created for advertisements, e-learning courses and explainer videos. The explainer video industry
keeps on moving up in the world today.
Early in 2017, these short visual content can be found in many places including the news, TV, Website, Social media platforms: Facebook, Instagram… Animated explainers videos provide amazing result when it comes to showing viewers’ problem and immediately offering a solution to it (Oentoro, 2018).
They are a good educational media tool due to their eye-catching visuals, snappy animation, and
narrative audio. They are an obvious center of attention that is very hard to skip or miss. This is

ANIMATED VIDEOS 14
why animated explainer videos are frequently used today as a marketing tool to execute any
business marketing strategy to the right target audience.
Global companies use this short movie form to tell their stories; they can benefit various industries and cover different topics such as health, travel, tech and science, finance, fashion, food, film... A user can advertise almost anything on the web by using them!(Oentoro, 2018). Gallardo-Echenique, Marqués-Molías, Bullen, and Strijbos, (2015) stated that animated
videos, which are one to three minutes long maximum, are attractive and interesting to watch. The
presence of digital and visual effects such as dynamic movement, animation, sound, colors,
transition, changing compositions, camera angles and/or any other innovative film/movie
technologies catches the viewer’s attention and draws them directly to the message. “Many digital
learners might struggle to search for information online, struggle to make sense of the information
obtained or struggle to vet and integrate online content into their learning” (Gallardo-Echenique,
Marqués-Molías, Bullen, & Strijbos, 2015). One of many advantages of animation is making any
video’s message easier to understand. Through animation “even the most abstract ideas can be
visualized, simplified and specifically tailored to any audience” (Alexander, 2011; McClean, 2007;
Wang, 2012). In order to reach the target audience, as well as the people who are not very interested
in the topic presented, animated explainer video can be created to present topic in a way that any
viewer can relate to and become engaged with it. By combining moving image with an audiovisual
text, the information concerning the topic can be easily conveyed to the audience in a more concise
and exiting way. Using a human-friendly voice-over that guides the scenario will also help the
viewer understand the topic better, line-by-line each point of the interesting topic (Sebastian, &
Tim, 2012). Through animated video, information can be developed through visuals and animation
in a specific look and feel while using few text and words. Adding to that, what makes a great-
animated video is the use of a consistent visual language so more people are engaged with the

ANIMATED VIDEOS 15
content. It is nice to vary the graphics interpretation but it is better for them to be consistent to
create an aesthetic mood. Videos take the viewers through a journey by using step-by-step process.
By doing so, the viewers become more engaged with the video (Sebastian & Tim, 2012).
Therefore, animated videos are now becoming one of the most favorite tools used by advertisers
and marketers for every kind of business for promoting anything online companies to any fresh
startup (Marin, ND). At the script stage, copywriters and designers consider different executions
in order to transform the static text into an animated video (Sebastian, & Tim, 2012). Animated
videos can be made in different styles, and each style can catch the viewer’s attention differently
(Marin, ND) because they are all based on animation while conveying the message to the viewers.
-Whiteboard animation: is a classical and traditional definition of an explanatory video content
used to create video series. The illustrator draws using a pen, image after image on a clean
whiteboard to explain the concepts to the audience. It is the simplest form of a 2D animation
video style for corporate purposes. It is known for its most effective type of explainer
video due to its minimalistic design that allows the viewers to concentrate only on the content
(Oentoro, 2018).
- Motion Graphic Animation: This kind of video animation conveys an explanation through
simple animated graphics. It is designed to be engaging and easy to follow by the audience
due to the constant movement style used in the video. “If you want to pitch your brilliant ideas
to investors or create a character for your brand, motion graphic looks awesome and can get
them in awe. Motion graphics are designed to be entertainment, communication, and
marketing content” (Oentoro, 2018). They are in high demand, and every movement created
needs a great amount of attention to details especially if it’s about transition between
compositions, frames and movement of small objects. This is why most of the times motion

ANIMATED VIDEOS 16
graphics is taking a bigger amount of the animators’ time and clients budget compared to other
styles of animated videos (Oentoro, 2018).
- Kinetic typography animation delivers any message through words only. It is quite common
on the internet, and as its name suggests, it relies greatly on text and number, accompanied by
background music and voice over. “It has the power to inspire someone’s mind, express an
idea and way of thinking, as well as move people’s feelings” (Oentoro, 2018).
- Cartoon animation focuses on cartoons not only for kids but also used as a more fun, and
adventurous concept for adults. Lots of colors, sound effects, expressive characters, and
detailed environmental elements are used to keep potential viewers engaged. In addition, some
add composed music to empower the story, make it more engaging, while others avoid
background music to focus only on the story narration (Oentoro, 2018).
-Silhouette animation shows a character as a silhouette with added expressions and the
company’s color instead of the usual basic color (Oentoro, 2018).
-Live action + animation is a mix between both live action and animation. The live action part
can be personal and build trust, while the animation part can be entertaining and illustrative.
The person IS filmed on a coma green background to get a high-quality camera filming and
then the video is placed on adobe after effects program in order to add any animation to it
(Oentoro, 2018).
-Live action + animation is a mix between both live action and animation. The live action part
can be personal and build trust, while the animation part can be entertaining and illustrative.
The person is filmed on a coma green background to get a high-quality camera filming and
then the video is placed on adobe after effects program in order to add any animation to it
(Oentoro, 2018).
ANIMATED VIDEOS 17
-Stop motion animation is all based on taking photos, frame by frame, one photo after the
other where the camera is placed fixed on a tripod without movement. By drawing a character,
manually or digitally, photos should be taken after each movement, then a change in the
element of that image is made like moving the hand, for example and then take another photo.
After being done with the drawing and taking a lot of pictures, the pictures are placed together
inside adobe after effects program to get the final stop-motion style video (Oentoro,
2018). Stop-motion animation techniques include object animation, pixilation, puppet
animation, clay animation, and cutout animation. Object animation is one of the most widely
used stop-motion techniques. In this type of animation, simple non-drawn objects such as
toys, Lego, blocks, dolls are used to create the animation. Pixilation uses people as stop-
motion characters in a similar way. Puppet animation is the most commonly used technique
in stop motion. Models are manipulated in order to imitate movement by incremental
adjustments of limbs and expressions for each frame. Clay animation or claymation, is another
forms of stop motion. Each animated piece, either character or background, is "deformable"
because it is made out of malleable substance clay. Cutout animation is really simple in terms
of look and movement, which can either be its main strength or weakness. Cutout animation
features characters and objects that are cut out of piece of paper and then animated frame by
frame. “However, since it’s not demanding on the eyes, no fancy animation, the audience can
really concentrate on listening to and grabbing the message.” On the other hand, this kind of
video can be somewhat plain or boring for potential viewers who are attracted to color and
movement (Oentoro, 2018). Digital cutout animation is a more elaboration version, which is
richer in the features with color and movement that simpler cutout style is lacking (Oentoro,
2018).

ANIMATED VIDEOS 18
-Animated stick figures are based on stick figures. “This animation style breathes a life into
the drawing of your 5-year old daughter, and that is a simplicity at its finest” (Oentoro, 2018).
-Animated video and infographics is like the motion graphic video that aims to explain,
educate or inform the audience based on a script through simple animated graphics. It is all
about information “packed with a lot of facts, data, numbers, charts, and other kinds of
statistics.” Having all these data animated is very helpful in avoiding putting the viewer to
sleep while reading through the data (Oentoro, 2018). For example, if the animated video talks
about the importance of eating healthy food, this can result of changing people’s attitude from
eating junk food to eating healthy food and this all depends on the way the information are
translated to the viewers through the animated video (Sebastian, & Tim, 2012).
-Screen captures is the best style used to explain products, websites or applications. Mostly it
is an animated version of the website or the mobile app that shows the viewer how to use the
website and navigate through it or how to use the mobile app step-by-step concept. It is used
as a very helpful tool to improve customers’ experience. “Most videos that intend to become
a tutorial or a how-to video, would want to use animated screen caps to make it easy to
understand” (Oentoro, 2018).
2.8 Conclusion of Literature
The literature demonstrated that “Animation is defined as a dynamic visual statement,
form, or structure that evolves through movement over time” (Baecker and Small, 1990). The
creation of animation is generated by a series of still and continuous images that changes overtime
to create an illusion of motion. Animation includes simple animation, traditional animation,
computer graphic animation: two-dimensional (2D) vector-based animation and three-dimensional
(3D) computer animation, motion graphics animation and stop motion animation. Furniss (2006)

ANIMATED VIDEOS 19
mentioned that animation creates a true representation of the real world because it can reproduce
the true nature of what we are seeing on screen.
Studies on the effectiveness of animation in online advertising have focused specially on
the examination of absence versus the presence of animation and their results. Online
advertisements have little effect on consumer’s attention because they are not catchy and the
consumer forgets them almost instantly.
Many studies agree that sensorial and cognitive capacities for information processing are
key to consumer’s willingness to allocate their limited attention to online ads. In addition, pictures
gain faster attention by helping the viewer determine the subject of the story. In addition, different
factors such as content, characteristics, and advertising clutter play a major role on the attention of
online users. The amount of attention consumers give to ads can be predictable depending on
brands, products or services. All this depends on the media environment and characteristics of the
message vehicle used in the ad to grab consumers’ attention (Calder, Malthouse, & Schaedel
2009).
The effect of animation on attention has been extensively studied. Ad animation and
amounts of attention given to the ads create a positive relationship between the two and animated
ads are more likely to grab a consumer’s attention than static ads. In contrast, Hong, Thong, and
Tam (2004) suggest that during a visual search, online users are more likely to pay attention to
animation when their searching is animation otherwise animation effect can decrease attention
capture. In addition to that, research suggests that during instructed/targeted search, online users
do not pay attention to online ads. Animation can attract audience attention and get them to have
a deeper interest in the ad (Hassan, G, H., 2016).

ANIMATED VIDEOS 20
Multiple studies conducted on evaluating the effectiveness of advertisements have shown
in how well the consumers can recall and recognize the ad. Measures of memorization may vary
depending on the delay between the exposure and the measurement time. In addition, many debates
tend to choose whether recall or recognition is the more useful indicator of memorizing (Du
Plessis, 1994), categorizing recall with short-term memories and recognition with long-term ones.
Online advertisements tend to generate situations in which the consumers’ sensorial capacity
becomes heavily overloaded. As a consequence, their memory performance tends to be very low
versus their ad avoidance level, which would be high (Ha & McCann, 2008).
Many researchers have tried to find a link between adding animation to an advertisement
in order to be recalled or recognized by the consumers. Some of the studies targeting online ads
suggested that animation could improve recalling and/or recognizing this type of ads. But an excess
of animation in advertisement reduces the recognition accuracy without improving memory. In
contrast, there is a correlation between visual attention and memory performance; adding that
visual memory can keep and remember visual objects regardless of whether consumers can or
cannot report them.
YouTube has become the most popular online video platform that is showing an increase
in the use of video format. As well as, social media platform such as Facebook and Instagram
support videos in their posts and stories, which make it easier for advertiser to advertise their
brands and for people to watch something they are interested in. Videos are one of the most
powerful media tools used to capture and convey information. Animated explainers videos provide
amazing result when it comes to showing viewers’ problem and immediately offering a solution
to it” (Oentoro, 2018). They are a good educational media tool due to their eye-catching
visuals, snappy animations, and narrative audio. The presence of digital and visual effects such as

ANIMATED VIDEOS 21
dynamic movement, sound, colors, transition, changing compositions, camera angles and/or any
other innovative film/movie technologies catches the viewer’s attention and draws them directly
to the message. One of many advantages of animation is making any video’s message easier to
understand. Through animation “even the most abstract ideas can be visualized, simplified and
specifically tailored to any audience” (Alexander, 2011; McClean, 2007; Wang, 2012 Through
animated explainer video, animation and information can be developed in a specific look and feel
while using fewer text and words.
Finally, animated videos can be made in different styles, and each style can catch the viewer’s
attention differently (Marin, ND) because they are all based on animation while conveying the
message to the viewers.

ANIMATED VIDEOS 22
Chapter 3: Theoretical Framework
This chapter first discusses the uses and gratifications theory. It first provide an overview of
this theory, and then discuss how it can be applied to this study along with the cognitive theory of
multimedia learning and the five elements of multimedia. The last section of the chapter discusses
information graphics along with the concepts of appeal or attention, comprehension or cognition
and retention or recall.
3.1 The Uses and Gratifications Theory
The uses and gratifications theory was developed in the early 1950s to formally deny the fact
that people are subjected to mass media influence, therefore considered as mass media victims. By
rejecting this idea, this theoretical framework endows the consumer with agency. This was
explained by Blumler and Katz (1974), they pointed at how an audience member uses a medium
to seek specific information, targeting a precise need, in an attempt to shift the focus from the
purpose of the communicator to the receiver. The receiver is then truly considered as an active
consumer of media, playing a prominent role in choosing the medium that will best meet his/her
desires and achieve gratification. This result meets Mark Levy and Sven Windahl’s (1985)
definition of active consumer of the media, who also said that the audience activity in the
communication process is selective and oriented towards a purpose and a need.
Unlike other theories dealing with media consumption, the uses and gratifications theory
supports the idea of active consumer giving the consumer power to choose what to consume and
how to satisfy his/her needs. Media use, by consumers of the media, is then goal oriented. From
the theoretical perspective of the uses and gratifications theory, and according to Katz, Blumler
and Gurevitch’s (1974) users are knowledgeable enough to choose the media that will satisfy their
needs. They mostly use the media for five reasons:

ANIMATED VIDEOS 23
1) Cognitive needs: to enhance their knowledge by being well informed or educated or by
curiosity and exploration
2) Affective needs: to have an aesthetic and emotional experiences
3) Personal identity: to search for personal stability, to have self-confidence, self-respect
4) Integration and social interaction: to enhance their social connection with the outside world
such as family and friendship
5) Escapism: to help escape the daily life stress and to entertain themselves. From an
entertainment perspective, people would come up with different ways to entertain themselves.
Some would turn on the television, others the radio and others get into the web. We can
imagine hundreds of ways privileging a medium over another and all of these at the whim of
the consumer.
“The uses and gratifications theory suggests that users are “active consumers” who have control
over their media consumption, and have adequate self-awareness of their media use, interests, and
motives to be able to interpret and integrate media into their daily lives” (Katz et al., 1974; Levy
& Windahl, 1985; Wang, 2014).
Animated videos form yet another media choice. The uses and gratifications theory assumes
that consumers are using a particular media in an attempt to satisfy their cognitive needs among
others without forgetting that each individual has their own social and psychological reasons that
affect how this medium would be manipulated to satisfy these needs. Due to its engaging type of
content, consumers most likely use animated videos for educational purposes to gratify their needs
and/or curiosity for education. Therefore, while getting informed, they are being entertained at the
same time. Besides investigating the use of animated videos, this thesis investigates the impact of
these videos on consumers’ attention and memory. Even though attention and memory are not

ANIMATED VIDEOS 24
necessarily linked to the uses and gratification theory, privileging a medium over another may
have an implicit impact on how a consumer would recall and remember the information he/she has
been exposed to. As this study is focused on learning, so it will focus on the uses and gratification
of animated videos used online for knowledge and entertained enhancement. Therefore the uses
and gratifications theory was applied in an educational media perspective where users who are
potential learners are consciously choosing a specific medium that could satisfy their learning
needs. “They are able to recognize their reasons for making media choices while gaining
satisfaction in the media use process.”
Stafford, Stafford and Schkade (2004) identified that users could gain three types of
gratifications through Internet use; these are
-“Content gratification that is gained from the use of the video e.g. the need for researching
or finding specific information”
-“Process gratification that is gained from the experience of purposeful or random navigating
in its functional process”
-“Social gratification that is gained when video uses enables the forming and deepening of
social ties.”
Similarly, online users would be able to gain these gratifications through the use of online
video. This thesis investigated content gratification with respect to online users who use video for
learning process. Therefore, applying this framework to the study along with the cognitive theory
of multimedia learning with the five elements of multimedia and the concepts of appeal or
attention, comprehension or cognition and retention or recall will add important layers as to how
and to what effect animated videos are used. Several gratification factors will be investigated in
the thesis including easy understanding, entertaining, and educating.

ANIMATED VIDEOS 25
So far, in literature dealing with animated videos, the uses and gratifications model was
scarcely used. This could be very beneficial and informative when investigating consumers of
animated videos. Consumers of such online videos have the choice of watching or skipping them,
making them the active subject.
3.2 The Cognitive Theory of Multimedia Learning
“Video designs that comply to the Cognitive Theory of Multimedia Learning are generally
more engaging, more memorable, and are more effective in presenting complex information and
processes compared to text-based or visual-based medium [static images]” (Mayer, 2005; Mayer
& Moreno, 1998). The cognitive theory of multimedia learning suggests that a combination of
multimedia elements such as visual elements (text words, graphics form and animation) and audio
elements (voice over, music and video) facilitate active learning. This theory is strongly related to
the information-processing model, “which emphasizes on how multimedia representation, sensory
memory, working memory and long-term memory are interconnected” (Mayer, 2005; Mayer &
Moreno, 1998). It explains how cognitive activities are made such as selecting words, and selecting
images, organizing words and organizing images, and more importantly how these new
information are integrated coherently with the learner’s prior knowledge in working memory and
long-term memory (Mayer, 2005; Mayer & Moreno, 1998). This will lead to the meaning-making
process, which is called learning. The cognitive activities demand a high level of attention and
reflection from the learner’s perspective. Videos in the multimedia format presented in small
chunks with a conversational voice could engage and sustain learners’ attention (Mayer, 2005;
Mayer & Moreno, 1998). The benefits of learning through video include enhanced motivation and
satisfaction (Moreno & Mayer, 2007; O’ Shea, Stone, & Delahunty, 2015), as well as improved
retention (Whatley & Ahmad, 2007).

ANIMATED VIDEOS 26
Figure 2 Cognitive Theory of Multimedia Learning
By definition, multimedia means using varied techniques of information content for digital
formatting to inform or entertain the audience. The five-multimedia elements are texts, graphics,
animation, audio and video. Any combination of these elements can make any topic more
understandable to the viewer while enhancing any media platform such as TV, social media or
website (Sebastian & Tim, 2012).
Text is the most fundamental and common multimedia element. It is used as headlines,
subtitles, and slogans. “Its purpose is to express specific information or reinforce information in
other media. It involves the use of text types (font), sizes, colors and background color” (Simply
Effective, ND). Text helps convey t the intended message. Although pictures grab the viewers’
attention, text can be used as an alternative just in case the picture does not load in a visitor’s
browser, by simply clicking on text links to access other media or related information (Simply
Effective, ND). In addition, texts can be used to highlight important facts. Therefore texts are used
in a large typeface font, easy to read, with a black color or with a color that attract the viewer to
read the given information. Sometimes when the text is not that important but should help the
viewer understand more the content, it is used in small typeface font allowing the viewer to pause
the video and read (Sebastian & Tim, 2012).

ANIMATED VIDEOS 27
The second multimedia element is graphics. Humans being are generally visually oriented.
“Images including photographs, illustrations, drawings, clip art, icons or any other non-text
elements on a website or in social media are an example of graphics” (Simply Effective, ND).
Graphics can attract the viewers’ attention quicker than text. The graphics are still/static type of
pictures with no movement and accompany a text to illustrate the point or the idea made in that
text. In a multimedia context, graphics can be used as a slide shows or galleries that are included
in a website or social media platform so visitors can view and go through. “They may have click
ability that leads the viewer to another element, such as audio or video” (Simply Effective, ND).
The third multimedia element is animation. Animation is the most creative multimedia
element. As mention previously “animation is a series of images put together to give the effect of
movement.” Animation can be used into 2 forms: 2D and 3D. Animation is used to illustrate
concepts that involve movement “by adding visual interest or bring attention to important
information or links in an entertaining way” (Simply Effective, ND). Animation can also include
interactive effects allowing visitors to engage with the animation action using their mouse and
keyboard. “Animation is a dynamic and media-rich content that stays within one container on a
page – a very powerful form of communication” (Simply Effective, ND). Animation can divide a
huge amount of text into small points to make it more understandable to the viewers.
The forth multimedia element is audio. Audio or sound enhances any social media platform
or website. “It is a multimedia application also called the audio or sound elements that uses
dialogue, recorded narration, music and sound effects” (Simply Effective, ND). In order to catch,
hold and focus on the audience’s attention, sound can be used to deliver information to viewers,
and help reinforce their comprehension of the information presented:
For example, audio narration can be used to describe what is being seen in an animation clip enhancing the understanding of what the clip is all about. Featuring related music and special

ANIMATED VIDEOS 28
sound effects are also very effective multimedia applications that can add to the visitor’s experience (Simply Effective, ND). The fifth and last multimedia element is video. “Video is a visual multimedia application that
combines a sequence of images to form moving pictures and sound” (Simply Effective, ND).
Video is the most viral multimedia element that can be used especially on social media platforms
like Facebook, Instagram, Youtube and other websites. They all provide and integrate this
capability, which “allow[s] advertisers and marketers to share relevant videos on these platforms”
(Simply Effective, ND). Videos became popular because of their powerful effect on people.
Through video, people can get and understand a lot of information in only few seconds. “Short
videos can be a smart marketing advantage and an excellent way to differentiate yourself from
your competitors.” To sell itself the company should grab viewers’ attention by showing them
something important, in other words, “showcase a new product, build brand awareness, or even
promote an upcoming event” (Simply Effective, ND).
3.3 Information Graphics
In his book Infographics: The Power of Visual Story Telling, Lankow (2012) identified three
requirements that must exist in verbal and visual communication methods; these are: Appeal or
Attention, Comprehension or Cognition and Retention or Recall (Lankow, Ritchie and Crooks
2012):
1. Appeal or Attention: Communication should engage a voluntary audience (Lankow,
2. Comprehension or Cognition: Communication should effectively provide knowledge that
enables a clear understanding of the information
3. Retention or Recall: Communication should impart memorable knowledge.

ANIMATED VIDEOS 29
Figure 3 Infographic priorities by application
To attract and engage more viewers to its content, a good visual design should always look
appealing (Ritchie, 2012). In addition, to make it more comprehensible and understandable, a good
visual design should use scientifically proven information design methods (Hassan, 2016). “Just
as ‘a picture is worth a thousand words’ a simple graph can replace a table full of numbers. This
kind of basic visualization allows viewers to understand the message” (Ritchie, 2012). Finally, to
make it more memorable, a good visual design should “target the visual system of the human brain
that process data and create memories” (Hassan, 2016). This means that any visual display should
be based on those three requirements in order to convey a communicated message properly
(Ritchie, 2012). Despite the fact that those three requirements simultaneously formulate the core
essence of excellence in communication graphics (Hassan, 2016), it is false to assume that one
form of visual information will work on all. It is necessary to vary the approaches. A design with

ANIMATED VIDEOS 30
the objective to solely give information to the viewer for analysis is created differently than a
design with the goal of appealing and entertaining while informing (Ritchie, 2012).
3.3a Concept of Appeal or Attention
This section discusses the concept of appeal or attention. According to the Oxford Journal of
Medicine, the philosopher William James (1890) in his book, The Principles of Psychology gives
the best definition of attention:
It [attention] is the taking possession by the mind, in clear and vivid form, of one out of what seem several simultaneously possible objects or trains of thought.” Focalization, concentration, of consciousness is of its essence. It implies withdrawal from some things in order to deal effectively with others, and is a condition, which has a real opposite in the confused, dazed, scatterbrained state.
In other words, attention is defined as a mental faculty of considering or taking notice of
someone or something. Kandel (2009, p.339) states “attention is like a filter,” while talking about
animals that have a broad range of sensory stimuli, but yet focus only on one stimulus or on few
of them and at the same time ignoring others. We are living in the new Information Age, which
has changed the way people process information (Ritchie, 2012), where “various information
inputs and mediums stimulate our senses and pervade nearly every aspect of our daily lives”
(Hassan, G, H., 2016). In 2010, Google CEO Eric Schmidt famously stated, “We now create more
information in two days than we created from the dawn of man up until 2003.” It is becoming
increasingly difficult to find new ways to attract viewers’ attention due to the enormous amount
of information created and distributed every day (Ritchie, 2012). We are now living in the age of
constant distraction (Sherbill, ND). People are now being overloaded with information that ranges
from breaking news to funny pictures to Facebook updates (Ritchie, 2012).
In addition, according to the U.S. National Library of Medicine (1998), the average attention
span is eight seconds. According to Associated Press (1998) finds, attention spans are shrinking

ANIMATED VIDEOS 31
and decreasing from one year to the other. In 1998, attention span was around 12 minutes. Then it
decreased to 5 minutes in 2008 and around 8 seconds in 2015 till nowadays (Sherbill, ND).
Attention span is the most fundamental challenge today. Attention is like rising above the noise to
focus on one thing taking possession of the audiences mind out of the busy-ness and trains of
thought” (Sherbill, ND). The main question is how to rise above the noise that is distracting people
and prospects every minute of the day. It is important here to understand how human beings take
in information through their senses (Sebastian & Tim, 2012). There are five senses: sight (visual
perception), hearing (auditory perception), smell (olfactory perception), taste (gustative
perception) and touch (tactile perception). Sight and hearing are the most important senses used
while watching animated videos since the information presented is perceived through them:
The human eye can only see a fragment of its visual field clearly, which is why the human
being scans the surrounding with three to five saccades every second. The brain controls these
leaps of the eye and brings these individual images together into an overall impression
(Sebastian, & Tim, 2012).
Thus, the human eye should always be led by something that grabs and focus its attention
(Sebastian & Tim, 2012). Designers and motion graphics animator use various means to grab and
focus their attention and orient them. The viewer’s attention can be focused by means of
movements, colors, forms, sound, voice over, and camera angles (Sebastian, M. & Tim, F., 2012).
To maintain the viewers’ attention only one object should be the point of interest at any given time
due to the viewer’s limited time to perceive and understand the given information. Therefore, to
use this limited time as efficiently as possible to convey the message smoothly, attention must
always be focused on the significant part of the graphic. In any animated video, the significant
elements and the corresponding focused information should be embossed and should stand out of

ANIMATED VIDEOS 32
the background to be perceived and understood by the viewers as clearly as possible (Sebastian,
M. & Tim, F., 2012).
Viewers’ attention can be focused through movements. Moving elements grab the viewers’
eyes; they can be used in animated videos, in animated advertising banners on websites to attract
the viewers’ eye. But if a repetition of this moving animation with these advertising banners was
found to be irritating to the viewer’s eye, it distracts them from the initial message. “If the
movement is overused, or perceived as regular and repetitive, the viewers’ gaze will turn away
after a time” (Sebastian & Tim, 2012). Human attention is not focused only on one single subject
but rather it can be navigated to other subjects. Hence, animation alone does not focus the viewers’
attention but using specific elements such as effects, arrows moving up and down will generate
the human gaze (Sebastian & Tim, 2012).
Colors can also attract attention. Colorful focuses are more effective and powerful than the
use of black and white colors. When designers or animators want to pick a color to use, they should
pay attention to the background. There is different color modes used to focus the viewer’s attention
such as blinking, softening and coloring. Blinking refers to “changing the shade or graduation
within a shade” (Sebastian & Tim, 2012). It is most used for small focuses. For example, it can be
use for marking sites on maps. Thus, blinking any object inside the video will attract the viewers’
attention to it and make it the point of interest. The time between the use of different blinks should
be no longer than half a second where two to three blinks are enough to direct the viewers’ eye
and attention. Softening refers to “desaturation of the area color around the point of interest, where
the point of interest retains its color fully.” This entails changing in the color saturation of
surrounding elements (from colored background to slow darkening effect of the background which
help the viewer’s eye on the point of interest). Coloring refers to “coloring the point of interest by

ANIMATED VIDEOS 33
replacing it by a stimulation color.” It is mostly used on maps where large areas such as countries
can be emphasized by a stimulating color. This will orient the viewers’ eye to this specific area to
make them understand the graphic (Sebastian & Tim, 2012).
Form as well can attract and focus attention. There are different forms that can be used to
focus the viewer’s attention such as scaling, outlining and marking. Scaling refers to the change in
the object size within a graphic. This can be used to direct the viewers’ eye to a certain form
making it a point of interest. It can be repeated rhythmically so the viewers’ focus will stay on the
same object. Outlining refers to demarcating an area; it is used to cover up visualizations as little
as possible. It can have an effect on the viewers’ eye by animating its scale. Outlining is mostly
used to indicate circles or radii on maps. Marking refers to “emphasizing a point with a form.” It
can be used as a geometric form such as “square, circle, and triangle” to mark the viewers’ eye to
a specific areas. All of these technics can be combined in a graphical video (Sebastian, & Tim,
2012).
As mentioned previously, visual elements can be used to reinforce the viewers’ eye, attention
and perspective but this can be also being accomplished with the use of sound. It is important that
the sound follows the visual graphic allowing the viewers to connect with the graphic. “Sound,
like animations, should only be employed in a way that contributes to understanding or temporarily
reduce other atmospherically sound elements in order for them to focus attention effectively.”
When designers or animators want to choose the right sound, they have to think clearly whether
the sound is produced or real and whether to associate it with the specific graphical object. For
example, this will depend on the animation if it is an abstract form like a circle then the sound will
be an artificial sound effect. But if it is a real object, it can be combined with real sound effects
that best describe the graphical object (Sebastian & Tim, 2012).

ANIMATED VIDEOS 34
Besides sound, “voice over can name or enumerate visual elements and thus make them the
point of interest” (Sebastian & Tim, 2012). The use of voice over for directional instruction or
narrative scripts offers a variety of ways to grab the viewers’ eyes movements. “It can also identify
visual properties of significant elements, ” a good example would be a voice over saying that
“Pressing and holding the red bottom will restart the computer” (Sebastian, & Tim, 2012).
As for focusing using the camera angle, the camera always directs the viewers’ eye, attention
and perspectives through zoom, tracking shot, and changing in depth of field. Zoom is mostly used
when big areas need more focused in. By zooming in, the viewer will have access in details to the
one part focused on without losing the situation’s overview. It gives an added advantage to part of
the visualization that is the most important while moving the focus on the not important ones.
Hence, the composition will be filed with this significant zoomed in element so the viewer can
concentrate on it. Tracking is like zoom. “A tracking shot makes the relevant part of the graphic
the viewers’ focus” (Sebastian & Tim, 2012). It can track numerous areas of an object, timeline,
and map, thereby making processes evident by using the appropriate camera angle and movements.
It should always be used as 90-degree angle to the display area to avoid distortion. Depth of field
works closely to soften elements outside the point of interest. It sharpens the focused elements of
the graphics while blurring the background and moving out the elements that are not important
(Sebastian & Tim, 2012).
Besides discussing factors that focus the attention, it is important to understand what attention
means on a neuroscientific level. Much research shows how attention works on the brain. In her
study, Sandra Kuhlman discusses two types of neurons that exist in the brain; these neurons are
responsible for the learning process. First the inhibitory neurons “are the neurons that prevents
new information from being absorbed” and second, the excitatory neurons “are the neurons that
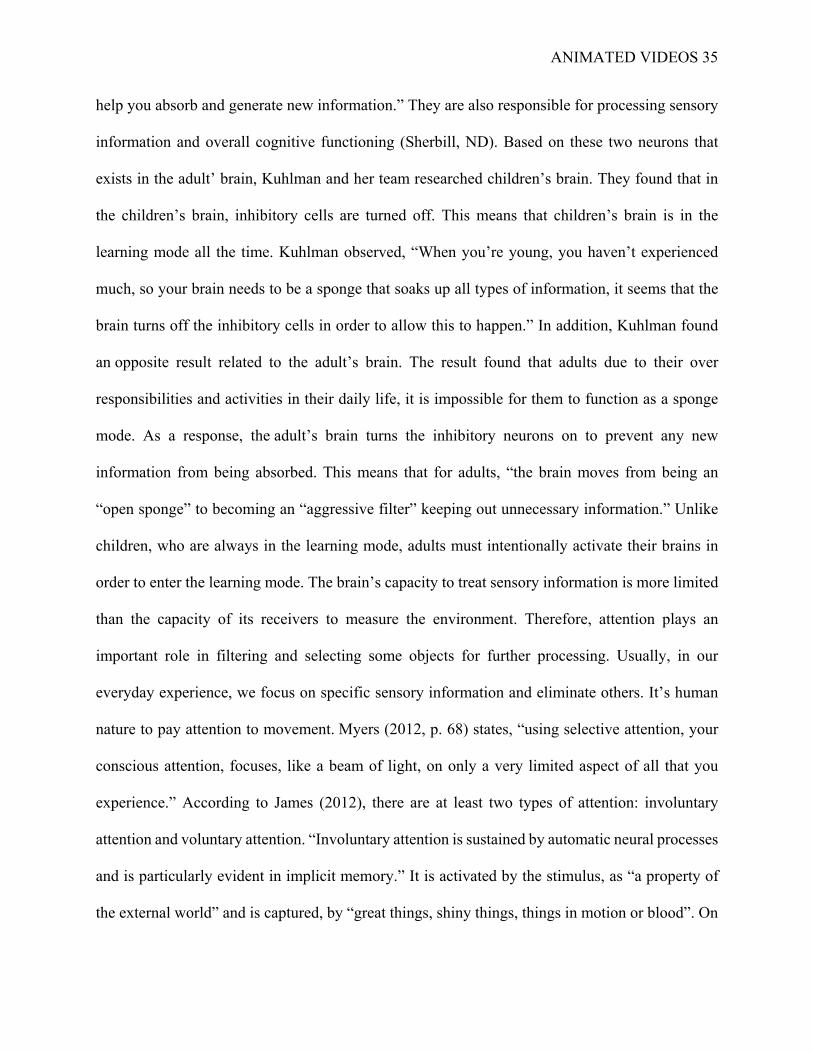
ANIMATED VIDEOS 35
help you absorb and generate new information.” They are also responsible for processing sensory
information and overall cognitive functioning (Sherbill, ND). Based on these two neurons that
exists in the adult’ brain, Kuhlman and her team researched children’s brain. They found that in
the children’s brain, inhibitory cells are turned off. This means that children’s brain is in the
learning mode all the time. Kuhlman observed, “When you’re young, you haven’t experienced
much, so your brain needs to be a sponge that soaks up all types of information, it seems that the
brain turns off the inhibitory cells in order to allow this to happen.” In addition, Kuhlman found
an opposite result related to the adult’s brain. The result found that adults due to their over
responsibilities and activities in their daily life, it is impossible for them to function as a sponge
mode. As a response, the adult’s brain turns the inhibitory neurons on to prevent any new
information from being absorbed. This means that for adults, “the brain moves from being an
“open sponge” to becoming an “aggressive filter” keeping out unnecessary information.” Unlike
children, who are always in the learning mode, adults must intentionally activate their brains in
order to enter the learning mode. The brain’s capacity to treat sensory information is more limited
than the capacity of its receivers to measure the environment. Therefore, attention plays an
important role in filtering and selecting some objects for further processing. Usually, in our
everyday experience, we focus on specific sensory information and eliminate others. It’s human
nature to pay attention to movement. Myers (2012, p. 68) states, “using selective attention, your
conscious attention, focuses, like a beam of light, on only a very limited aspect of all that you
experience.” According to James (2012), there are at least two types of attention: involuntary
attention and voluntary attention. “Involuntary attention is sustained by automatic neural processes
and is particularly evident in implicit memory.” It is activated by the stimulus, as “a property of
the external world” and is captured, by “great things, shiny things, things in motion or blood”. On

ANIMATED VIDEOS 36
the other hand, involuntary attention, is related for example to the driving act while paying
attention to the road and traffic; it is a particular feature of explicit memory and comes from the
internal need to process stimuli that are not automatically raised. But while talking about how to
grab audience’s attention on social media, advertisers and marketers have to understand the adult’s
brain in order to know how to activate their neurons. Adults would pay more attention to a message
that triggers their emotions. “Emotions are the secret key to unlock the audience’s excitatory
neurons to activate their brains so they’re in learning mode” (Sherbill, ND). Many believe that this
mystery is solved with the design. As Steve Jobs once said, “good design not only garners
additional appeal for an item, it can also actually incite an emotional reaction” (Ritchie, 2012).
Consumers, whether they realize it or not, are mostly design focused. Designs that continue to
attract new fans and followers allow for the connection of consumers to these brands (Ritchie,
2012). A great design is a necessity to differentiate one product from another, one brand from
another, “making it stand out and sell successfully, even if it is composed of the same features as
similar products” (Hassan, 2016). “When talking about data design or visualization, there is no
difference to deal with it in the same way a product is designed to target high sales figures”
(Hassan, 2016). Aesthetic appeal is still beneficial even if the aim is to purely present information
(Ritchie, 2012). This is now applied to business and brand communication where there purpose is
not only to inform but also to entertain the consumers. Consumers interested in knowledge would
retain that knowledge. Therefore design is needed to attract and maintain attention. It is safe to
assume that a person would rather watch a multimedia display of information than to read a lengthy
article about the same topic. Therefore, formats need to be efficient, engaging and entertaining
because the visualization can allow for the information to be digested and understood easily
(Ritchie, 2012). It is not enough for content to be visual but also visually interesting. A study done
ANIMATED VIDEOS 37
at the University of Saskatchewan presented a simple chart and an illustration chart displaying
both the same information, proved that most participants tend to prefer a more illustrated style of
data design over plain ones (Hassan, G, H., 2016).
Figure 3 Illustrative Nigel Holmes graphic with simplified equivalent.
Another example of Steve Jobs when, in 2007, he got in front of his adoring audience when
introducing iPhone, he began his presentation by first touching emotion. He said, “This is a day
I’ve been looking forward to for two and a half years. Every once in a while a revolutionary product
comes along that changes everything.” Those are words that touch the heart of the audience and not
their brain. He didn’t need to give logistical details to the audience that he’s been anticipating this
moment for two and a half years. Because their brains didn't need this information neither the
definition of a “revolution” or how to qualify, “changes everything.” The Institute of Neuroscience
and Psychology at the University of Glasgow shows that humans have only four core-emotions to
be triggered by communications strategy; they are Happy, Sad, Afraid/Surprised and
Angry/Disgusted. The emotion related to surprise includes excitement, anticipation, shock, secret,
and mystery. Happy would include love, contribution, kindness, and compassion. The Steve Jobs’
presentation cited above, during the 2007 iPhone launch triggered two emotions. The statement
“I’ve been looking forward to…” activated the emotions Happy and Surprise. First “Happy”,
because it means there is something new and valuable coming out, which makes people feel

ANIMATED VIDEOS 38
emotionally happy and second surprised because of excitement and anticipation. But if he was
only triggering the brain without actually activating the audience’s emotion, he will be only
informing them of the new product being released. He could have said: “We completed the
manufacturing of a new product.” But Steve Jobs is not like everyone else; he did not state
straightforward information about iPhone because no one cares about a new product. It’s not the
product that will get the excitement of people – it’s the message behind this specific product. When
Dell releases a new product, for instance, their customers, unlike those of Apple, would not wait
overnight outside the store to buy it:
Steve Jobs’ words did activate his audience’s excitatory neurons so they’d be open, eager
and excited to learn more from him. Without leveraging the emotion within those words,
the audience would have responded to corporate messaging the way most people do simply
by ignoring it (Sherbill, n.d.).
Nowadays the smart way to grab online users’ attention is by using content marketing. Content
marketing is a new way of creating and distributing valuable and relevant content on digital
platform in order to engage and entertain a potential target audience (Goldstein J., 2013). To create
an effective content marketing video, a lot of time and effort are invested to ensure that the
audience’s attention is held until the video comes to an end. When an online user starts watching
an online video, “they will navigate away within 10 seconds about 20% of the time. By the time
20 seconds has passed, over a third of your audience is gone” (Blue Wave Marketing, 2016). To
hold the viewer’s attention, the following advice suggested by Marin (ND) should be taken into
consideration:
- Place the animated video above the fold. In order to reach its highest potential, animated
video should be placed directly on the landing page. It should be exactly the first thing
ANIMATED VIDEOS 39
any viewer sees when they want to enter the website so it can quickly grab and hold their
attention. Adding to that, it will “increase a website’s average visit time from 8 seconds
to 2 minutes”, help the SEO strategy (search engine optimization) and also explain any
product or service in a matter of seconds (Marin V., ND).
- Use wise thumbnail selection on the animated video. “Thumbnails are still images that
work as preview for the YouTube video and as a powerful marketing and SEO elements.”
Because by selecting the right thumbnails, more viewers will be engaged to watch the
animated video (Marin V., ND).
- Use custom made animated video while taking advantage of the animation. To increase
sales, potential viewers need to get the message set inside the animated video. The best
way to attract their attention is through custom made animated video. Michael Lewis
(2016) from the University of Pittsburgh found “that animated characters are capable of
capturing user’s attention, engaging them in active task and entertaining them.” That’s
why the most successful companies in the world have been using animated characters.
Examples include Nike Athletes, Coca-Cola Polar Bear, Anthropomorphized M&M,
Nestle Granny and McDonalds Farm Animals. Other than characters. The animated video
should include, a storyline, animation design, music and sound effects (Marin V., ND).
Another way to use animated videos effectively is by using plenty of bright colors with
specific colors of the brand. Animated videos are the perfect way to really explore
creativity. The more creative the animated video is, the more it will grab the audience’s
attention (Blue Wave Marketing, 2016).
- Focus only on the target audience. As mention previously, the most effective way to grab
and hold potential audience’s attention is by telling a story they would like to hear. This

ANIMATED VIDEOS 40
means that the animated video’s story should focus especially on the target audience and
their problem. The animated video script and storyline created should showcase their
lifestyle, the problem they are facing and how the brand will be a solution in order for
them to buy and use it (Marin V., ND).
- Set clear expectations, a good and descriptive headline with the perfect use of keywords
and hash tags will make the animated video easy to find while allowing users to set a very
clear expectation of what the video content is all about. If users felt there was a variance
between their expectations and what the video is delivering, they will navigate away
quickly. In general, videos should not be longer than 1 or 2 minutes. The shorter the
animated video, around 30s, the more people will be able to watch it all the way through
(Blue Wave Marketing, 2016).
- Make the beginning count. As previously mentioned, the first 10 to 20 seconds of any
animated video sets the tone This is when the potential viewers will make the decision to
watch the whole animated video or skip it or find something else to watch. (Blue Wave
Marketing, 2016).
- Use your audience’s emotions. Once potential audiences are emotionally invested in the
message, they’re going to finish the animated videos and be more willing to learn
something or make a change Therefore, the animated video should be strategic and target
one of the four core emotions: happy, sad, surprise, and anger. But mostly, trying to make
the viewer angry or sad is not a good idea, so making them happy and surprise is better.
Finally, by using descriptive language that resonates with the target audience, by making sure
the video content is relevant to the viewers, by moving away any confusing information and by
being true to the message and the brand, the animated video will be worth watching (Blue Wave

ANIMATED VIDEOS 41
Marketing, 2016). For greater effectiveness, it is important to upload the animated video on all
social media platforms, such as YouTube, Facebook, Instagram, and a website landing page.
3.3b Concept of Comprehension or Cognition
As previously motioned, emotions are one of the main factors to trigger and hold the
audience’s attention. By triggering the emotions, the audience’s excitatory neurons will be
activated and they will enter the learning mode. Therefore, we have to see which mode they learn
best in (Hassan, 2016). Neil Fleming observed over 9,000 classroom lessons in Lincoln University
in New Zealand; he discovered that adults learn and recall given information in three different
modes – the VAK model (Ritchie, 2012). V for Visual learner (still or dynamic visual) is the ability
to learn and understand information presented in pictures, and other visual graphics like graphs,
diagrams, charts, and illustrations (Hassan, 2016). A for Auditory learner (narration, music, and
sound effects) is the ability to comprehend by hearing the information spoken (Hassan, 2016). And
K for Kinesthetic learners (feel or tactile) is the ability to comprehend through touch and physical
activities (Hassan, 2016).
Figure 4 Neil Fleming’s model of thinking (VAK model)
As we are living in an online digital world, where visual learning becomes increasingly
popular, people must see something in order to understand it. Many claim that they learn better

ANIMATED VIDEOS 42
visually (Ritchie, 2012). Colin Ware (2012) in Information Visualization: Perception for Design
states, “We are able to acquire more information through our visual system than we do through all
other senses combined.” Thus, visual would be the primary learning and comprehension method.
He describes that the human brain utilizes different methods in order to comprehend information
through visuals quickly and efficiently without any extra effort and time:
The human visual system is a pattern seeker of enormous power and subtlety. The eye and
the visual cortex of the brain form a massive parallel processor that provides the highest-
bandwidth channel into human cognitive centers. At higher levels of processing, perception
and cognition are closely interrelated, which is why the words understanding and seeing are
synonymous (Ware 2012).
By using our visual attention, our brain plays the role of a pattern seeker while using many natural
features that make sense of various visual elements; the brain detects differences and groups
similar shapes and objects together in order to save the data processing time and perceive bigger
objects as a whole. The perception process happens in a fraction of a second, started by a quick-
eye visualization of an attribute and sending the images for processing by the brain unconsciously,
without any recognized or extra mental efforts. In contrast, the attentive perception is when the
visual system excels conscience effort and time trying to make proper perception of the visual
elements. The first unconscious perception happens, as mentioned, extremely fast without extra
effort and can even recognize several attributes simultaneously. While the later takes more time
and effort to perceive data and takes place in a sequential manner (Hassan, 2016; Ware 2012).
These effects are shown through the testing of pre-attentive attribute figures. Figure 5 and 6
exemplifies the most common pre-attentive attribute (Color & Shade) created by Stephen Few.

ANIMATED VIDEOS 43
Figure 5 Pre-attentive Processing Test 1. The most common pre-attentive attribute (Color &
Shade)
Figure 6 Pre-attentive Processing Test 2. The most common pre-attentive attribute (Color &
Shade)
People were asked to count how many number “7’s” are in Fig. 5, which present numbers
with same color. This was not impossible, but required some effort from the brain and takes a
sequential conscious process to accomplish while using more time. On the other hand, the number
of “7’s” in Fig. 6 would be easily recognized without any conscious effort from the brain, which
is time consuming. This was due to the use of one pre-attentive attribute applied to number “7’s”
which is colored in blue. Apparently, the number 7 was more easily recognized and counted
directly (Ritchie, 2012). Other pre-attentive attributes consist of many elements such as forms:
including orientation, line length and width, size, shape, curvature, added marks, enclosure
(Hassan, 2016). Colors including: intensity, and hue and finally special position including 2D
position.

ANIMATED VIDEOS 44
Figure 7 Pre-attentive attributes. (Tapping the Power of Visual Perception, 2004, Stephen
Few)
If these attributes are used correctly, they could be very beneficial to the consumer
comprehension of the information. By creating effective visual displays and information designs,
designers of infographics or animated video (Ritchie, 2012) can create visual displays that can be
perceived effectively and effortlessly by the human brain (Ritchie, 2012). This reaction is
involuntary and human focus will go wherever our eyes lead it. There is a strong correlation
between the eye and the brain and this is very useful when communicating to people who don’t
have a lot of time or a long attention span (Ritchie, 2012). Yet using text descriptions cannot be
ignored. Ware explains the value of both texts and images by stating “images are better for spatial
structures, location, and detail, whereas words are better for representing procedural information,
logical conditions, and abstract verbal concepts” (Ware, 2012, p. 304). There is no need to choose
between the two. The most effective visualization is the one that uses both descriptions as well as
narratives, especially in editorial applications (Ware, 2012).
Here are three examples of each mode of learning stated above through various
communication and marketing channels.

ANIMATED VIDEOS 45
1. VISUAL
To show the power of visual learning, Kellogg’s cereal is an example. To draw their audience
in, they don’t merely show the words (like this image):
Figure 8 Kellogg’s cereal black and white
They visually grab the attention (with this image):
Figure 9 Kellogg’s cereal colors
In fact, in this single image, metaphorical elements were used on the visual level in order to
grab the audience attention through the use of colors.
2. AUDIO
To show the power of audio learning, Star Wars opening scene is an example. Imagine people
have to read the Star Wars introduction without any music. It would be boring. “In fact, when
George Lucas showed the first screenings of Star Wars to friends, they weren’t impressed. They
were only impressed when they saw the movie with John Williams’ musical score that the movie

ANIMATED VIDEOS 46
became something magical and ultra-powerful. It’s because audio affects the way we absorb
information (Sherbill, ND). A study done by a team of Montreal neuroscientists discovered how
the body and the brain respond to music. The results were that when people listen to music they
enjoy it; their body emits all the symptoms of being emotionally awakened. The pupils in the eyes
open widely, the pulse rise, the blood pressure rise, and the cerebellum (the part in our brain
associated with movement in the body), becomes active. In other words, audio activates the brain
and the entire body (Sherbill, ND).
3. KINESTHETIC
Learning is more effective when information is turned into a kinesthetic experience or is
associated with real life. In other words, this can be done through tactile or physical movement.
For example, in a video or in a presentation, the way of leaning can be done by anchoring the
content with emotion. When people feel the content, they absorb it powerfully and want more of
it.
To sum up, “animation activates the cognitive adult brain through the use of dynamic visuals,
audio and by creating an emotional experience” (Sherbill, ND, p.139). By incorporating all three-
learning mode of visual, auditory, and kinesthetic simultaneously, the human brain’s excitatory
neurons are fully activated. “There’s simply no other medium that does this because animation is
the perfect cognitive experience” (Sherbill, ND, p.140).
Figure 11 Font Text: sun. Figure 12 Picture: sun. Figure 13 Illustration: sun.

ANIMATED VIDEOS 47
Looking at the three images of the sun, it can be noticed that The third graphic simultaneously
invokes a variety of association’s emotion with the brain in just one image which are: Happiness,
Personal, Summer, Friendliness, Enthusiasm, Brightness and Fun (Sherbill, ND, p.145). “This is
why many companies are obsessed with using animated videos for their marketing, internal
communications, knowledge and information management” (Sherbill, ND, p.145). Short animated
videos functions as a way to fully engage any company’s customers by activating all their three
learning modes simultaneously better than any other medium.
3.3c Concept of Retention or Recall
This section discuses the concept of retention or recall. The best definition of recall is by the
dictionary “the action or faculty of remembering something learned or experienced” (Hassan,
2016) the factors that best help the human brain to store information for a long period of time tobe
recalled directly when needed (Hassan, 2016) are:
1- The difficulty of the content especially if it is related to science and medicine.
2- The importance of the content to the learner: the more important it is, the more interested
the person is in learning it).
3- The way the content is introduced to the learner whether it is delivered through plain text,
video presentation or illustrated information.
4- The reviews or revisions of the content by the learner after the first learning
5- The psychological factors affecting the learner’s brain (stress, anxiety and sleep).
In contrast, information retention and learning are an essential factor to reach any successful
teaching process (Hassan, 2016). Marketers, salespeople, brand evangelists, and publishers use
constantly various methods such as animated video to achieve a higher information retention
percentage by the audience (Ritchie, 2012). To improve information retention, it is a must to know

ANIMATED VIDEOS 48
how information’s are stored in the memory of human brain (Hassan, 2016). Since there are
different types of memory, it is undefined which visualization method is the best to use (Ritchie,
2012). In 1968, Richard Atkinson and Richard Shiffrin published a paper titled “Human memory:
A Proposed System and its Control Processes” where they developed a model that best describes
the human memory It shows that the human memory has three separate components that allow
information storage; these component are sensory memory, short-term memory and long-term
memory.
1- Sensory Memory (or Iconic memory): Information is stored in a fraction of second, unless
it is analyzed and connected to something already existing in the brain (Ritchie, 2012). Sensory
means senses so human beings acquire it first by their senses. Using their eyes and then through
viewing the objects, the human visual system retains anything it sees for a very short time.
2- Short-Term Memory (or Visual Working Memory): it has a limited capacity in processing
visual information. “An average of only five items or less can be held in the visual working
memory” (Hassan, 2016). This is why “it is not suitable to use more than four to five colors or
pictograms to identify different phenomena on maps and charts. Most readers are not likely to
remember what they represent” (Cairo, 2013). Visual Working Memory comes as a bridge between
sensory and long-term memory. “When a sensory or iconic memory subject needs extra
explanation, visual working… get[s] the needed extra non-visual information from the long- term
memory, in order to comprehend the subject” (Hassan, 2016). This all takes about 100
milliseconds. Humans are able to understand much more quickly with vision transmission than
with any other combination of sensory perception and processing because vision transmits huge
amounts of information into the brain, and the brain in turn accesses to its stored knowledge in
order to provide meaning (Ritchie, 2012).

ANIMATED VIDEOS 49
3- Long-Term Memory: is the most permanent memory that stores information related to our
experiences and the associated emotions, which we retain for a long period of time, and will help
us process new information (Hassan, 2016). It is further divided into three parts: episodic memory:
main device for remembering images and scenes already experienced, and the feelings that come
within it; semantic memory: storage of common knowledge that has no specific context or
experience linked with it; and procedural memory: recall how to do something involuntarily such
as typing, tying a tie, driving a car (Ritchie, 2012).
“The limited capacity theory suggests that the processing of information by the human being
involves continuous and simultaneous operation of several sub-processes, including encoding,
storage, and retrieval” (Lang 2000). The human brain is limited; not all the information can be
taken in, encoded, and stored inside the memory to be used later on for retrieval. However,
according to Sunder and Kalyanaraman (2004), objects “which produce orienting responses in
consumers, may need greater allocation of cognitive resources in encoding and storing the content
inside the objects” and since animation combines orienting and moving elements, it can attract
consumers’ attention, allocate “more cognitive resources to encode and store animated
components on a website in their memory in relation to non-animated elements.” Therefore,
infographic and animated video help improve cognition and retention. As previously mentioned,
how learners are introduced to the material, by using proper method and format makes a big
difference. Therefore the method will be data designed in an infographic-animated style, with more
use of visual elements and graphics than pure text. It can be static infographics (printed materials,
posters, or digital static displays published online), animated videos, digital motion graphics,
infographic videos, or interaction information design (online or delivered as games on DVD). All
theses format will help greatly improve retention and lessen forgetfulness (Hassan, 2016).

ANIMATED VIDEOS 50
Infographic has been shown to help improve cognition and retention of information (Ritchie, 2012)
while providing the human brain with visual elements, pictures graphics that are easy to associate
and able to reach the memory system (Hassan, G, H., 2016). The human brain can recall easily
familiar symbols, scenes and patterns, allowing us to quickly connect with already stored
information and understand what we are seeing (Ritchie, 2012).
A study conducted by Scott Bateman et al (2010) from the University of Saskatchewan
suggests that “the more illustration-based the design is, the more its ability to retain and recall.”
Participants were asked to look at alternating graphics, some plain and some in Holmes’s
illustrative style. Then, the group was split into an immediate recall group and a long-term recall
group. After seeing all the graphics, the immediate recall group played a five-minute game to clear
their memory and then they were questioned about the information in each graphic. The long-term
group was instructed to come back in two to three weeks for their recall session. The questions
were about the graphic’s subject, the categories displayed within it, the general trend of the chart,
and whether there was a value judgment presented in the chart (perceived opinion that the graphic’s
creator had presented). There was not much of a difference in retention for the immediate recall
group between the plain and Holmes’s graphics, but there was a difference in their identification
of whether a value judgment had been perceived. However, with the long-term recall group, there
was a significant difference in the ability to recall information in all areas. Holmes’s graphics stuck
with users more, on all levels (Ritchie, 2012). The results shows a significant ability where
participants recalled different types of information such as subject, categories and trends) “when
presented within a more visual illustrative-based design than when presented within a text only
design” (Hassan, 2016). He explains the findings by telling that the more use of images and
illustrations in the design the more it facilitates the process of building deeper memories. While

ANIMATED VIDEOS 51
providing extra iconic pictures to associate with information this is how long-term memory works
and consequently benefits from (Ritchie, 2012). Bateman comes up with three possibilities for this
outcome: Additional imagery made it possible for people to encode information deeply, since there
were more visual items to recall. The varied style of Holmes gave it a unique advantage in making
it more memorable than the plain graphics (which all had the same look). As described earlier in
the appeal study, it may go back to user preference. Perhaps the participants’ emotional responses
to the graphic and the imagery used, together helped to embed the image in their memories
(Hassan, 2016).
All of these elements and tools used in infographics are not only associated with the appeal
factor, but also with comprehension and retention. Other than making an infographic look good,
they assist and make sure that the readers understand and retain the message, which is. When
readers are attracted to an infographic not only aesthetically, it creates a deeper connection with
the information, which makes it more likely to be remembered (Ritchie, 2012). In addition, many
other researches support the notion that “pictures or graphics are valuable in building long-term
memories and information recall” (Hassan, 2016). Gambrell and Jawitz (1993) in the “Mental
imagery, text illustrations, and children’s story comprehension and recall” claim that by adding
illustrations and images to instructional text will improve the abilities in terms of comprehension
and recall of narrative text in fourth-grade children (Hassan, 2016). Therefore, the use of visual
elements and illustrations as an effective tool in the animated video or infographics static or
dynamic will help improve the comprehension and recall level (Ritchie, 2012). Variety of methods
exists to create aesthetically pleasing visual displays of data. Lankow (2012) said that design style
can vary, but there are devices that can be used to make understanding and retention easier. He
provides three different devices also called illustrative designs to be considered when creating

ANIMATED VIDEOS 52
illustrative infographics and include: Visual Metaphor, Symbols and Iconography and Decorative
Framing (Hassan, 2016). Visual Metaphor is created using illustrations that indicate or represent a
certain subject of the infographic (Ritchie, 2012), for example “using a panther image or
illustration to represent something that is very fast and speedy like a sports car.” (Hassan, G, H.,
2016). Using universally known visual elements such as symbols and icons, instead of verbal
explanations, symbols and iconography are created. They are used in animated video or
infographics static/dynamic to minimize the use of extra text. An example is the blue Twitter bird,
which represents the Twitter social media platform, or a heart shape that represents love (Hassan,
G, H., 2016). However, in order to make sure which icons to use for which content, cultural issues
should be taken into accounts. They should be well recognized and understood by the target
audience in order to capture the intended message (Ritchie, 2012). The third element or decorative
framing is
The use of illustrative or iconic elements to add visual interest to the data and information in
the animated video or infographic static/dynamic helps to engage the audience with the data
communicated on a personal level and consequently increase information retention (Hassan,
2016).
For example, the use of an icon or an illustration of a soda bottle, for instance, next to text that
talks about beverages or drinks makes it more appealing (Ritchie, 2012). When viewers get
attracted to these small detailed design elements, they become connected with them on an
emotional level that may lead to a deeper interest and retention of the information (Hassan, 2016).
In conclusion, attractive colors and shades, decorative elements and symbols or icons, all are
powerful tools to communicate a specific message (Hassan, 2016). The integration of those
illustrations elements is crucial to the success of the design. Illustrative design could have reverse

ANIMATED VIDEOS 53
effects. Therefore, it is crucial to determine when the design will distract from or support the
message. Sometimes, data is distorted accidentally or purposely. Illustrations should complement
and be in parallel with visualization elements and they should never mislead the viewers (Ritchie,
2012).

ANIMATED VIDEOS 54
Research Questions and Hypotheses
This thesis seeks to examine and understand the effectiveness of animated videos used by
brands to promote their products, grab online users’ attention and enhance their recall of
information using the uses and gratification theory as well as the concepts of attention and recall.
To fulfill the objective of the thesis, the following research questions and hypotheses will be
studied:
R1: Does the use of animated video grab online users’ attraction and attention?
R2: Does the use of animated videos help online users understand the subject treated?
R3: Does the use of animated videos enhance online users’ recall of information?
R4: Do animated videos affect online users’ level of knowledge?
H1: Online users in searching for specific topic or information are more likely to be
attracted and pay attention to animated video than reading an online article of this
particular information.
H2: Online users searching for specific topic or information are more likely to
recall the animated message than reading an online article of this particular
information.
H3: Online users seeking information are more likely to watch animated videos to a)
satisfy and b) increase their knowledge about a specific topic than reading an online
article.

ANIMATED VIDEOS 55
Chapter 4: Methodology
This chapter covers the methodological approach used for the study. It is divided into three
main areas: the sampling and procedure, the structure of the study, and the variables with their
conceptual and operational definition. The study will use the quantitative research to investigate
the research questions and hypotheses.
4.1 Sampling and Procedure
To answer the research questions and hypothesis, this study applied a non-probability
sampling technique. An available sample or what is also known as convenience sample and
selective sampling were used to choose the target audience that was contacted through different
social media platforms such as WhatsApp (contact list), Instagram (followers), Facebook (Friends)
and university classrooms. This sample was selected for purposes of accessibility and time
efficiency. The links (video and article questionnaire) derived from Google Form were sent to
potential individuals to be filled out.
The online experiment is a comparison between an animated video and an online article of the
same topic. Both included the same content. The participants who were exposed to the animated
video were different than those exposed to the online article, thus a between-subject assessment
was used. To make sure that the statements for the post-test questionnaire were understood clearly
as well as the conditions (e.g., were clearly presented), a manipulation check was done before the
study through pilot testing on a small sub-sample. Problematic issues with wording and language
barriers were resolved. For example, English captions were inserted on the animated video.
One experimental group watched the animated video while another group read the online
article about the same topic. The animated video (Figure A) was previously created by Bank
Byblos. However, to keep the same style and conditions in order not to introduce threats to validity,

ANIMATED VIDEOS 56
the researcher created the online article (Figure B) to match in style, font, color, and images,
including the transcription of the same statements used in the video.
Participants initially gathered were 252 for both conditions. Outliers and other participants
who did not take their time to answer the questions were removed; therefore 241 were left. They
were asked to participate in the study in March 2019. Participants (N=241) were divided into two
groups in order to get exposure to different stimuli (animated video (n=116) and online article
(n=125)).
4.2 Structure of the Study
Participants were asked to provide their consent for their voluntary participation. According
to the purpose of the study, the designed surveys were divided into six sections. In the first section,
participants had to answer demographics questions, such as gender, age, education level and
employment, as well as physiographic characteristics, such as cards usage and from which bank
and their financial education level. In the second section, participants had to fill out prior
knowledge questions about the topic presented including the difference between debit cards and
credit cards. In the third section, and after been exposed to either one of both conditions assigned,
participants were asked to carefully watching the animated video or reading the online article
presented. In the forth section, they were asked to fill out questions directly related to the content,
which include testing the dependent variables: recall, attention and understanding. In the fifth
section, participants were asked again to fill out knowledge after questions about the topic
presented; these were formed of the same questions asked previously in the prior knowledge in the
second section. And finally, in the sixth section, general questions about consumer behavior in
relation to type of preferred content were asked to the participants. The participants were made

ANIMATED VIDEOS 57
aware that the content was not in any particular way an endorsement to the company presented.
The questionnaire was used to measure the dependent variables or outcomes.
Participants ranged in age from 18 to 60 (M = 28.95; SD = 6.103). Out of the 241 participants,
48.1% were male and 51.9% were female; 6.2% were high school graduates, 46.5% held a bachelor
degree, 43.2% had a master’s degree, and 3.7% held a doctorate or Ph.D degree and other .4%
certificate such as technical institutes, primary and mid school. 66.4% were employed, 7.1% were
unemployed, and 26.5% were self-employed. They were asked also to specify which bankcard
they hold; therefore, 42.7% of participants answered that they had both debit and credit cards,
43.2% had the debit card, 8.7% had credit card and 5.4% don’t use any bankcard. They were asked
to specify the bank from which they had their credit or debit cards. 16.6% had a Byblos Bank
credit card, 8.7% had Bank Audi credit card and the rest 74.7% have their credit cards from
different banks such as FNB, Credit Libanais, BLC Bank, BLF, Bloom, SGBL, Saradar Bank,
Bank of Beirut, BBAC, Cedrus, BLF, Fransabank, Bank Med, Lebanese Swiss Bank, IBL, and
Other: Samba - Amex - Fab - ADCB - HSBC - Wells Fargo - BNC - Qib - First Abu Dhabi Bank
- LGB. 19.9% had Byblos Bank debit cards, 19.5% had Bank Audi debit cards and the rest 60.6%
had their debit cards from different banks like those listed above. It can be concluded that the
majority of the participants use debit cards and are more familiar with their features than the use
and the features of credit cards.
And finally, they were asked to rate using a Likert-type scale from 1 = very bad to 5 =
excellent, how much they consider themselves financially informed. 46.9% of participants
considered themselves fairly financially educated, 36.9% well financially educated, 8.7%
considered themselves excellent financially educated, 6.6% bad financially educated, and finally,
0.8% of participants considered themselves very bad financially educated.

ANIMATED VIDEOS 58
4.3 Variables
In this study, the variables that were measured include: the independent variables or stimulus,
which are an animated video versus an online article, and the dependent variables, which are
demographics and psychographics, prior knowledge, recall, attention, attraction, understanding,
knowledge after, consumer behavior along with the uses and gratifications variables. All the
variables measured are detailed below.
Independent Variables
Animated Video: It is a video format that is graphically designed to convey complex
information to a specific target group within a short period of time. This independent variable will
be operationalized as a media stimulus or in other words an animated video showing the difference
between debit and credit card created by Byblos Bank.
Online Article: It is a written document published in an electronic medium. In this study the
online article was not a traditional one but it was custom made especially for this thesis derived
from the animated video for consistency of the measure. This independent variable will be
operationalized as a media stimulus or in other words an online article showing the difference
between debit and credit card created for Byblos Bank.

ANIMATED VIDEOS 59
Both the animated video and online article have the same content same graphics but each
group of participants was exposed to either animated video or online article.

ANIMATED VIDEOS 60
Dependent Variables
Prior Knowledge: It is made of “facts, information, and skills acquired by a person through
experience or education; the theoretical or practical understanding of a subject” (New Oxford
American Dictionary). In order to measure this dependent variable, which is the effect of animated
video and or online article on their level of knowledge about the topic, participants were tested
under the Pre-test-Post-test procedure (Zhang et al., 2006)
For the Pre-test, subjects in section two of the survey took a test, which included three
questions concerning the topic of the animated video and the online article. These multiple-choice
questions were asked before watching the animated video or reading the online article such. The
questions were derived from the animated video or online article. The purpose of this test was to
examine how much the respondents already knew about the topic. These questions relate to the
concept of comprehension or cognition mentioned in the theoretical framework.
Recall. It is to “Bring the memory (a fact, event, or situation) back into one’s mind, or thought
of someone or something to (a person or their mind), especially so as to recount it to others;
remember” (New Oxford American Dictionary). After the participants had watched the animated
video or read the online article, this dependent variable was measured with open-ended responses
asking the participants to identify the main points they remembered after watching the animated
video or reading or the online article. The responses followed a Likert-type scale from 1 = strongly
disagree to 5 = strongly agree. It included seven statements (such as the animated video/article:
Helped me remember the content, Specified that with Debit Cards, money used will be deducted
from your bank account, Using relevant icons and visuals help me remember the information more
effectively…) (Animated video recall (α=.847; M =4.045; SD=.708); Online article recall
(α=.806; M=3.402; SD=.617). In addition, participants were asked to specify the color of each

ANIMATED VIDEOS 61
card they remembered (Debit and Credit Card) by asking them to identify the gender of the voice
narrator, and for which Bank this animated video or online article was created. Then, they were
asked to identify the purpose of the animated video or online article based on a multiple choice
answers, how many times they think they need to watch or read the animated video or online article
in order to recall the content, and if they remembered watching or reading any animated video or
online article made by Bank Byblos previously and if yes on which platform. All questions were
asked to see if everything was understood in order to have a better recognition and recall of the
information to increase their level of knowledge. All questions were derived from the concept of
retention or recall mentioned in the theoretical framework.
Attraction: It is “The action or power of evoking interest, pleasure, or liking for someone or
something” (New Oxford American Dictionary). After the participants had watched the animated
video or read the online article, this dependent variable was measured using nine criteria (such as
topic, colors, graphics…). They derived from the concept of appeal or attention mentioned in the
theoretical framework. Then it was followed up with an open-ended responses asking the
participants what they liked or disliked about the animated video or the online article. (Animated
video attraction (α=.912; M=4.011; SD=.675); Online article attraction (α=.784; M=2.076;
SD=.417).
Attention. It is “A mental faculty of considering or taking notice of someone or something;
the regarding of someone or something as interesting or important” (New Oxford American
Dictionary). Alternatively, “attention refers to our ability to focus our awareness on a specific
stimulus or stimuli, allowing for a limited but more intense appraisal of our current experience.”
After the participants watched the animated video or read the online article, this dependent variable
was measured using a Likert-type scale from 1 = strongly disagree to 5 = strongly agree. It included

ANIMATED VIDEOS 62
seven statements (such as It grabbed my attention, The use of icons and visuals grabbed my
attention, It was easy to follow…). It derived from the concept of appeal or attention mentioned in
the theoretical framework. (Animated video attention (α=.901; M=4.200; SD=.636); Online
article attention (α=.764; M=2.198; SD=.411).
Understanding. It is “The ability to understand something through comprehension” (New
Oxford American Dictionary). This variable was measured using a Likert-type scale from 1 =
strongly disagree to 5 = strongly agree. It included six statements (such as the animated
video/article: Helped me understand the topic, Helped me understand more about how the cards
works from my Bank ATM to another Bank ATM, Reading the text on the screen allowed me to
understand the content more…) These sets of questions were followed up by questions asking the
participants if they were able to hear clearly what was being said, and if they felt that the animated
video was of an appropriate length for understanding the information and if the topic discussed in
the animated video or online article was interesting in order for them to understand and learn more.
These questions are related to the concept of comprehension or cognition mentioned in the
theoretical framework. (Animated video understanding (α=.821; M=4.036; SD=.605); Online
article understanding (α=.815; M=3.968; SD=.641).
Post Exposure Knowledge. It refers to the “Facts, information, and skills acquired by a
person through experience or education; the theoretical or practical understanding of a subject.”
Here, it is related to the cognitive needs, which are associated with increasing intelligence, gaining
information and pursuing knowledge. To measure this dependent variable, participants were tested
under the Pre-test-Post-test procedure (Zhang et al., 2006). For the post-test, the participants in
section five took a test similar to the test they had taken in section two, which included three
questions concerning the topic of the animated video and the online article (what is the difference

ANIMATED VIDEOS 63
between Debit cards and Credit cards); Those questions were derived from the reference animated
video or online article. The purpose of this test was to examine how much the respondents learned
about the topic. These questions derived from the Concept of Comprehension or Cognition
mentioned in the theoretical framework.
Level of Knowledge is “A level of description of the knowledge of an agent that is
independent of the agent's internal symbol-level representation. As well, if they feel that the
animated video or online article allow them to satisfy and gain more knowledge about the topic
after watching or reading it, they were asked as well how much it teach them about the content
presented, as well as asking them if they think that Bank Byblos is making their financial
knowledge better by creating this kind of animated videos or online articles. They were asked if
they would recommend it to their friends and family so they could increase their knowledge
regarding this subject, and finally if they were interested in watching or reading and learning more
about different topics related to financial education.
Consumer behavior. It was tested by asking the participants to rate either the animated video
they watched or the online article they read; based on their attention, understanding, recall, and
knowledge of the given topic. This dependent variable was measured by asking participants who
had watched the animated video or read the online article using a Likert-type scale from 1 =
strongly disagree to 5 = strongly agree to answer twelve statements (such as I prefer watching
animated videos rather than reading online articles because they make me understand any topic
way easier, While searching for any type of information concerning a particular topic, I prefer
reading online article to satisfy and increase my knowledge about this particular topic)).
Uses and Gratification theory. The uses and gratifications theory refers to the satisfactions
people get from using a particular media channel. By measuring the above in relation to consumer

ANIMATED VIDEOS 64
behavior (preferences) and cognition as well as attraction (e.g., emotional factor) thus one can
make inferences into why participants would chose one sort of content over the other. This
dependent variable was measured using some statements in the consumer behavior section derived
from uses and gratification needs scale suggested by Rubin (1981).

ANIMATED VIDEOS 65
Chapter 5: Data Analysis and Results
This chapter presents what the quantitative research reveals. It discusses how each research
question and hypothesis was tested. Research questions 1 through 4, were analyzed using
descriptive statistics and hypotheses 1 through 3, were examined using an Independent t-test and
Chi-Square given its ability to perform overall comparisons. Data was entered into the Statistical
Package for the Social Sciences (SPSS) version 22 was cleaned out for any outliers and such cases
were eliminated. The findings will be discussed in the light of the literature review to see where
they diverge from and converge with the literature. The subjects’ score on the dependent variables
are tabulated and the data are analyzed.
5.1. R1a Attraction
R1: Does the use of animated videos grab online users’ attraction and attention?
The participants (N=116) were asked to rate what attracted them the most while watching the
animated video was it the topic, the brand, the animation/movement, the design/graphics, the
colors, the voice over, the music”, the text” and or the sound effect. For topic, 83.6% of participants
were mostly attracted to topic presented in the animated video, while 12.1% were neutral and 4.3%
disagreed. Followed by the brand, 55.1% of participants were mostly attracted to the animated
video because of the brand, which was Byblos Bank, 33.6% were neutral about it and 11.2%
disagreed. Followed by the animation/movement, 86.3% of participants were mostly attracted to
the use the animation and movement in the animated video, 10.3% were neutral about it and 3.4%
disagreed. For the design/graphics, 88% of participants were mostly attracted to the design and
graphics used in the animated video, 9.5% were neutral about it and 2.6% disagreed. When it came
to colors, 75.8% of participants were mostly attracted to the colors used in the animated video,
20.7% were neutral about it and 3.5% disagreed. Followed by the voice over, 75% of participants

ANIMATED VIDEOS 66
were mostly attracted to the voice over and narration used in the animated video, 19.8% were
neutral about it and 5.2% disagreed. Followed by the music, 71.5% of participants were attracted
to the background music used in the animated video, 23.3% were neutral about it and 5.2%
disagreed. Followed by the text, 71.6% of participants were attracted to the text used on the screen
in the animated video, 24.1% were neutral about it and 4.3% disagreed. And finally, for the sound
effect, 62.8% of participants were attracted to the sound effects used in the animated video, 32.8%
were neutral about it and 4.3% disagreed.
5.1. R1b Attention
R1: Does the use of animated videos grab online users’ attention and attraction?
After watching the animated video, participants were asked to rate the level of
agreement/disagreement in relation to the video they just saw. Out of a total of 116 participants
who watched the animated video 87.1% revealed that the animated video they watched grabbed
their attention, 12.1% were neutral meaning it has neither positive nor negative on their attention
and .9% disagreed. 70.6% of participants claimed that the use of music grabbed their attention,
26.7% were neutral and 2.6% disagreed. When asked about the use of icons and visuals, 83.6% of
participants claimed that the use of icons and visuals grabbed their attention, 14.7% were neutral
and 1.8% disagreed. Similarly, 82.8% of participants claimed that the combination of the text
written and the voice narration helped in portraying the given information, 15.5% were neutral and
1.7% disagreed. 81.1% of participants claimed that the combination of the animation and the voice
narration held their attention and helped them follow to the end, 16.4% were neutral and 2.6%
disagreed. And finally, 90.5% of participants claimed that the video was easy to follow, 6.9% were
neutral and 2.6% disagreed.

ANIMATED VIDEOS 67
After that, an open-ended response asked the participants (N=116) to specify what they liked
and disliked about the animated video they watched. These responses supported the previous
question regarding what attracted them the most while watching the animated video. Their
responses mostly focused on the overall aesthetic of the animated video. Most participants said
that the animated video was overall well organized and transmitted to the viewer in an easy, clear
and clean way. They liked the mood, style and its simplicity, which is the 2D graphics, as well as,
the flow of information. They liked that it was a short animated video, which goes straight to the
point, and uses a simple Arabic language. The combination of animation, graphic/design/colors,
and voice over/narration helped them a lot with the content and the information presented and
while making it easy to grasp, the animation/movement helped by simplifying the information
presented in an easy way by making it more understanding, entertaining, interactive, educating
and informative while watching it.
Participants mentioned that the topic emphasizing the fact that every person needed to know
and understand the difference between both cards (debit and credit card) before signing up for any
card because lots of them make lots of mistakes that might lead to financial crises. They mentioned
how the use of design/graphics can simplify complex topics, and make them more accessible and
easier to understand. Watching the animated video made it easier from them to understand and
absorb the given information.
Participants said that that the animated video improved their knowledge. Some said that they
liked the background music and the transition used in the animated video. The music is trademark
for all the animated videos created by Bank Byblos.
In contrast, some participants disliked that it was a bit fast, because they had to pause and
repeat a few points or watch the video twice to understand the message. They also disliked that it

ANIMATED VIDEOS 68
contained lots of written text because they don’t like to read lot of sentences and thought that
hearing the information verbally with the use of animation and voice over would have been
enough. Some said that the text used on the screen was a bit small to read and that the transition
used in the animation could have been more appealing.
Few said they disliked the animated video because it was made for Byblos Bank brand. They
didn’t like the male voice that was monotone and they would have preferred having a female voice.
They also didn’t like the use of music, which was a bit loud in comparison to the voice over that
was presenting the information.
Few said that it was an irrelevant video since they knew most of the facts and they would have
preferred getting new information that was not common regarding debit and credit cards. They
suggested that the video should have expanded more about the use of credit card since lots of
people use debit cards and that banks in general did not educate their customers about the use of
both cards.
5.1. H1a Attraction
H1: Online users in searching for specific topic or information are more likely to be attracted
and pay attention to animated video than reading an online article with this particular information.
Hypothesis 1a was supported. Independent t-test indicated that there was a significant
statistical difference between animated videos and articles in relation to attraction. The animated
videos (M=4.011, SD=.675) were more likely to attract people than online articles (M=2.076,
SD=.417) (Welch’s t (188.825) = 26.543, p <.05).

ANIMATED VIDEOS 69
Table 1: Attraction to Animated Videos
5.1. H1b Attention
Hypothesis 1b was supported. Independent t-test indicated that there was a significant
statistical difference between animated videos and articles in relation to attention. People were
more likely to pay attention to animated videos (M=4.200, SD=.636) than online articles
(M=2.198, SD=.411) (Welch’s t (194.332) = 28.789, p <.05).
Table 2: Attention to Animated Videos
The animated video I just watched SD D N A SA All numbers are in percentages.
1. Topic 1.7 2.6 12.1 49.1 34.5
2. Brand 3.4 7.8 33.6 35.3 19.8
3. Animation/Movement 1.7 1.7 10.3 39.7 46.6
4. Design/Graphics 1.7 .9 9.5 44.0 44.0
5. Colors .9 2.6 20.7 40.5 35.3
6. Voice over .9 4.3 19.8 37.1 37.9
7. Music .9 4.3 23.3 43.1 28.4
8. Text 1.7 2.6 24.1 48.3 23.3
9. Sound Effect .9 3.4 32.8 35.3 27.6
The animated video I just watched SD D N A SA All numbers are in percentages.
It grabbed my attention .9 0 12.1 56.9 30.2
The use of music grabbed my attention .9 1.7 26.7 35.3 35.3

ANIMATED VIDEOS 70
5.2 R2 Understanding
R2: Does the use of animated videos help online users understand the subject treated?
After watching the animated video, participants were asked to rate the level of
agreement/disagreement with the following statements in relation to their understanding of the
video they had just watched.
Out of 116 participants who had watched the animated video, 90.5% participants claimed that
the animated video they watched helped them understand the topic - the difference between debit
cards versus credit cards, 8.6% were neutral about it and .9% disagreed. Likewise, 83.6% of
participants claimed that the animated video they watched helped them understand more about
how the cards work from their bank’s ATM to another bank’s ATM, 13.8% were neutral and 2.6%
disagreed. When asked whether reading the text on the screen allowed them to understand the
content more, 68.1% of participants claimed that it did, 26.7% were neutral about it and 5.2%
disagreed. Similarly, 83.6% of participants claimed that using relevant icons and visuals help them
understand the information more effectively, while 16.4% were neutral about it and no one
disagreed. And finally, 50% of participants claimed that using the credit card or debit card was the
only way for them to understand the difference, 19% were neutral about it and 31.1% disagreed.
The use of icons and visuals grabbed my attention
.9 .9 14.7 44.8 38.8
The combination of the text written and the voice narration helped in portraying the given information
1.7 0 15.5 43.1 39.7
The combination of the animation and the voice narration hold my attention and helped me follow to the end
.9 1.7 16.4 34.5 46.6
It was easy to follow .9 1.7 6.9 37.9 52.6

ANIMATED VIDEOS 71
The participants were then asked if they were able to hear clearly what was being said. Out
of a total of 116 participants who watched the animated video revealed that 94.8% claimed that
yes, they could hear what was being said clearly, while 5.1% claimed that they could only
understand some of what was being said. Not all of it was clear.
When asked if they felt that this animated video was of an appropriate length for understanding
the given information, 93.1% claimed that it was, while 6.9% claimed that it wasn’t.
Table 3: Understanding of Animated Video
5.3 R3 Recall
R3: Does the use of animated videos enhance online users’ recall of information?
After watching the animated video, an open-ended response question asked participants to
identify the main points they remembered from it. These responses were supporting the previous
animated video they just watched. Their responses were mostly focusing on the main points the
participants remembered in general after watching it. Most said they remember that Debit card is
using money in their own bank account without extra fees but commission are applied when using
The animated video I just watched SD D N A SA All numbers are in percentages.
Helped me understand the topic = the difference between the use of Debit Card versus Credit Card
.9 0 8.6 43.1 47.4
Helped me understand more about how the cards work from my Bank ATM to another Bank ATM
0 2.6 13.8 47.4 36.2
Reading the text on the screen allowed me to understand the content more
2.6 2.6 26.7 42.2 25.9
Using relevant icons and visuals help me understand the information more effectively
0 0 16.4 44.8 38.8
Using the Credit Card or Debit Card is the only way for me to understand the difference
14.7 16.4 19.0 28.4 21.6

ANIMATED VIDEOS 72
it in anther ATM, Credit card is borrowing money from the bank and the amount should be settled
at the end of the month. Both cards have commissions and annual fees, and other similar sentences.
After that, they were asked to rate the level of agreement/disagreement with the following
statements in relation to the video they just saw. Out of a total of 116 participants who have
watched the animated video, 86.3% claimed that the animated video they watched helped them
remember the content, 12.1% were neutral about it meaning it has neither positive nor negative on
their understanding level and 1.7% disagreed. 88.8% of participants recalled that with debit cards,
money used would be deduced from their bank account, 8.6% were neutral about it and 2.6%
disagreed. Likewise, 46.5% of participants agreed that with debit cards, money used will be
registered on their card, 12.1% were neutral about it and 41.4% disagreed. 82.7% of participants
recalled that with debit cards, there was no need to for settlement at the end of the month, 6.9%
were neutral about it and 10.4% disagreed. 87.9% recalled that with credit cards, they can choose
to pay the total amount at the end of the month or settle part of it according to their card terms,
8.6% were neutral about it and 3.5% disagreed. When asked about reading the text on the, 70.6%
of participants claimed that reading the text on the screen allowed them to recall the content, 24.1%
were neutral about it and 5.3% disagreed. Similarly, 76.7% of participants claimed that listening
to the information allowed them to further recall the content presented, 17.2% were neutral about
it and 6% disagreed. And finally, 76.8% of participants claimed using relevant icons and visuals
help them remember the information more effectively, 19.8% were neutral about it and 3.4%
disagreed.
After that, participants were asked to recall the color of both cards while highlighting their
difference by specifying which the color of each. For the credit card color, 50% of participants
recalled that it was gold, 21.6% were recalled that it was blue, 17.2% recalled that it was orange,

ANIMATED VIDEOS 73
6.9% recalled that it was platinum and 4.3% recalled that it was black; comparing to the debit card
color, 69.8% of participants recalled that it was blue, 13.8% were recalled that it was gold, 8.6%
recalled that it was orange, 6.9% recalled that it was platinum and .9% recalled that it was black.
Participants were then asked to identify the gender of the voice narrator. 96.6% of participants
remembered having a male voice while 3.4% remembered having a female voice.
After that, participants were asked to identify for which bank the animated video was created.
94% of participants identified Byblos Bank, while 4.3% of participants picked Bank Audi and
1.7% choose any other option suggested.
Participants were also asked to identify the purpose of the animated video they had just
watched by picking from the multiple choice responses presented. Therefore, 71.6% picked the
correct answer, which was all of the above and 26.7% picked one or two or three out of the four
right answers in the multiple choice, which are the first answer, the purpose was the difference
between the use of Debit Card versus Credit Card, and/or the second answer, which is With Debit
Cards, money used will be deduced from your bank account, and/or the third answer which is With
Credit Cards, money used will be registered on your card, and/or the forth answer which is With
Debit Cards, no need to pay any amount at the end of the month and or the fifth answer which is
With Credit Cards, choose to pay the total amount at the end of the month or settle part of it
according to your card terms. And only 1.7% picked none of the above.
The participants were asked about the number of times they thought they needed to watch the
animated video to recall the content. 63.8% of participants said they needed to watch it once to
recall the content, while 34.5% of participants said they needed to watch it twice, and finally 1.7%
of participants said, they needed more than three times to watch the animated video in order to
recall the content.
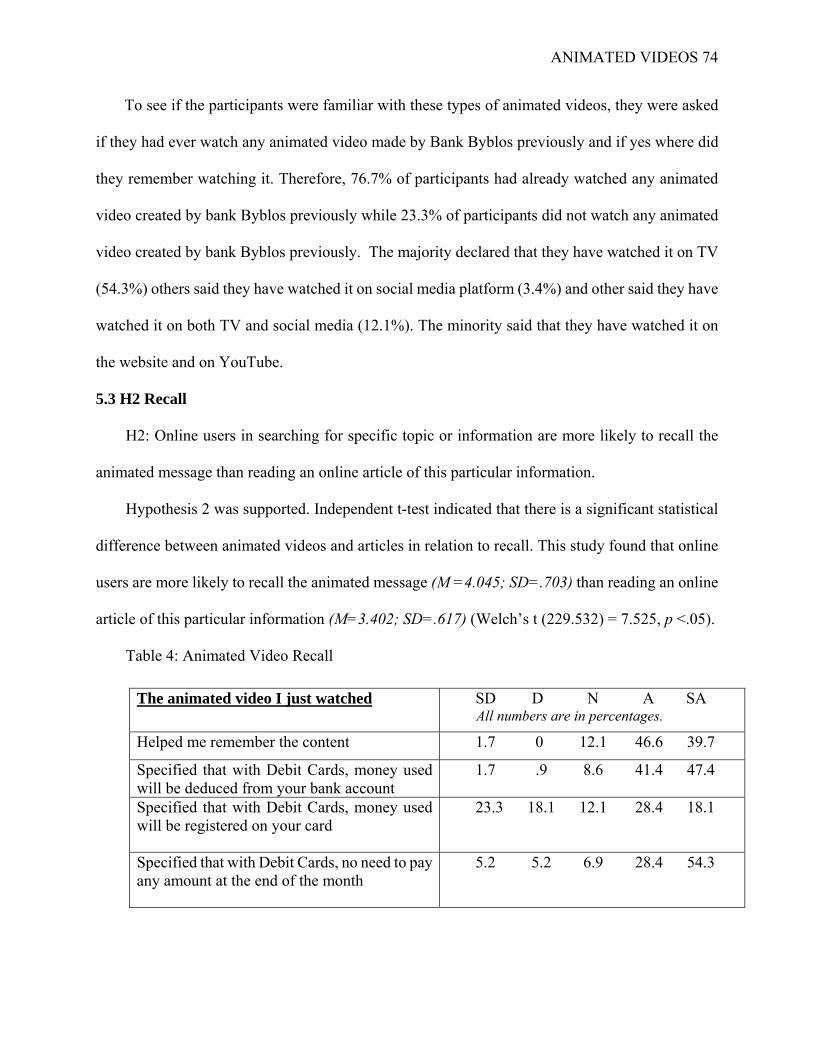
ANIMATED VIDEOS 74
To see if the participants were familiar with these types of animated videos, they were asked
if they had ever watch any animated video made by Bank Byblos previously and if yes where did
they remember watching it. Therefore, 76.7% of participants had already watched any animated
video created by bank Byblos previously while 23.3% of participants did not watch any animated
video created by bank Byblos previously. The majority declared that they have watched it on TV
(54.3%) others said they have watched it on social media platform (3.4%) and other said they have
watched it on both TV and social media (12.1%). The minority said that they have watched it on
the website and on YouTube.
5.3 H2 Recall
H2: Online users in searching for specific topic or information are more likely to recall the
animated message than reading an online article of this particular information.
Hypothesis 2 was supported. Independent t-test indicated that there is a significant statistical
difference between animated videos and articles in relation to recall. This study found that online
users are more likely to recall the animated message (M =4.045; SD=.703) than reading an online
article of this particular information (M=3.402; SD=.617) (Welch’s t (229.532) = 7.525, p <.05).
Table 4: Animated Video Recall
The animated video I just watched
SD D N A SA All numbers are in percentages.
Helped me remember the content 1.7 0 12.1 46.6 39.7
Specified that with Debit Cards, money used will be deduced from your bank account
1.7 .9 8.6 41.4 47.4
Specified that with Debit Cards, money used will be registered on your card
23.3 18.1 12.1 28.4 18.1
Specified that with Debit Cards, no need to pay any amount at the end of the month
5.2 5.2 6.9 28.4 54.3

ANIMATED VIDEOS 75
5.4 R4a Prior Knowledge and Post Knowledge
R4: Does animated videos affect online users’ level of knowledge?
Before watching the animated video, participants were asked to check all that apply regarding
their prior knowledge of the use of both debit card and credit card. Out of a total of 116 participants,
revealed as mentioned in Table 1, (see Appendix C), 37.9% identified the right answer for the first
question regarding the use of both debit card and credit card which was all of the above, 50%
identified one or two right answers: both cards have annual fees, both cards have fees to renew the
card and or both cards have commissions, and 12.1% picked the incorrect answer which was none
of the above. So 87.9% of participants already knew about the use of both debit card and credit
card. After watching the animated video, participants answered the same exact questions asked
previously. Out of a total of 116 participants, revealed as mentioned in Table 1, (see Appendix C),
44.8% identified the right answer for the first question regarding the use of both debit card and
credit card which was all of the above, 44% identified one or two of the correct answers: both
cards have annual fees, both cards have fees to renew the card and or both cards have commissions,
and 11.2% picked the incorrect answer which was none of the above. So 88.8% of participants
knew about the use of both debit card and credit card. After that, participants checked all that apply
Specified that with Credit Cards, choose to pay the total amount at the end of the month or settle part of it according to your card terms
2.6 .9 8.6 35.3 52.6
Reading the text on the screen allowed me to recall the content
2.6 2.6 24.1 35.3 35.3
Listening to the information allowed me to recall more the content presented
2.6 3.4 17.2 35.3 41.4
Using relevant icons and visuals help me remember the information more effectively
1.7 1.7 19.8 30.2 46.6

ANIMATED VIDEOS 76
regarding their prior knowledge for the use of debit card alone. Out of a total of 116 participants,
revealed as mentioned in Table 1, (see Appendix C), 77.6% picked the right answers for the second
question regarding the use of debit card, which was using available money in your bank account,
no extra charge fees applicable when paying with the card, paying with the card is subject to its
limit and the money available and commissions are applied when using the card in another agent
ATM and 22.4% picked the incorrect answer which was none of the above or any other sentence
related to the use of credit card. After watching the animated video, participants were asked to
check all that apply regarding the same exact questions asked previously to test their post
knowledge for the use of debit card alone. Out of a total of 116 participants, revealed as mentioned
in Table 1, (see Appendix C), 63.8% picked the right answer regarding the use of debit card, while
36.2% picked the incorrect answer, which was none of the above, or any other sentence related to
the use of credit card. Following, participants checked all that apply regarding their prior
knowledge for the use of credit card alone. Out of a total of 116 participants, revealed as mentioned
in Table 1, (see Appendix C), 23.3% picked the right answer for the second question regarding the
use of debit card, and 76.7% picked the incorrect answer which was none of the above or any other
sentence related to the use of credit card. But after watching the animated video, participants were
asked to check all that apply regarding the same exact questions asked previously to test their
knowledge after for the use of credit card alone. Out of a total of 116 participants, revealed as
mentioned in Table 1, (see Appendix C), 24.1% picked the right answer for the second question
regarding the use of debit card, which was using available money in your bank account, Extra
charge fees are applicable on the balance due by the end of the month, paying the remaining
balance fully or partially at your convenience but a minimum amount should be paid every month
and commissions are applied when withdrawing money from any ATM and 75.9% picked the

ANIMATED VIDEOS 77
incorrect answer which was none of the above or any other sentence related to the use of credit
card.
5.4 R4b Level of Knowledge
After that participants were asked if they thought that the topic discussed in this animated
video was interesting in order for them to learn more. Out of a total of 116 participants who
watched the animated video 95.7% claimed that yes, the topic discussed in this animated video
was interesting in order for them to learn more about the topic, while 4.3% claimed that no, it
wasn’t an interesting topic and did not help them satisfy and gain more knowledge about the topic.
Participants were asked how much the animated video they watched taught them about the
content presented. 62.1% of participants said that it taught them a lot about the difference between
Debit card and Credit card, while 17.2% of participants said that it taught them a bit about the
difference between Debit card and Credit card, and 20% of participants said that they already knew
the knowledge presented.
Participants were also asked if they thought that Bank Byblos was making their financial
knowledge better by creating these animated videos. 95.7% of participants agreed and mentioned
that they would recommend them to their friends and family, while 4.3% of participants didn’t
agree and wouldn’t recommend this animated video to their friends and family.
Participants were asked if after seeing this animated video, would make interested in watching
and learning more about different topics related to financial education. 81% of participants said
yes, they would be interested in watching and learning more about different topics related to
financial education, while 2.6% of participants said they will not be interested in watching and
learning more about different topics related to financial education and 16.7% of participants said
maybe they would watching and learning more.

ANIMATED VIDEOS 78
5.4 H3 Prior Knowledge and Post Knowledge
H3: Online users who are seeking information are more likely to watch animated videos to a)
satisfy and b) increase their knowledge about a specific topic than reading an online article.
Hypothesis 3 was not supported. Chi-square analysis indicated that there wasn’t a significant
statistical difference between participants exposed to the animated video versus the online article
in relation to correct responses on knowledge base questions. However, the test indicated that
people prefer the animated video to satisfy and gain knowledge (X2 = 12.627, p <.05), to learn
about topics related to financial education (X2 = 12.945, p <.05), and that the video teaches them
about the content presented (X2 = 12.078, p <.05).
5.5 Consumer Behavior: Uses and Gratifications Theory
After watching the animated video or reading the online article presented to both test groups,
participants were asked to evaluate them both on attention, understanding, recall, and knowledge
of the given topic. 52.6% of participants said it was an excellent video, 41.4% it was good and 6%
said it was okay while none said it was bad. As for the online article, 28.8% of participants said it
was excellent, 49.6% said it was good and 18.4% said it was okay while 1.6% said it was bad and
very bad.
In addition to the previous results, a further step was used to evaluate consumer’s preferences
and attitudes towards the subjects on the topics of both animated videos and online article. Here,
ten statements were assessed based on a rating scale. 80.9% prefer watching animated videos to
reading online articles because they helped them understand the topic, 13.7% were neutral about
it and 5.3% disagreed. 22% prefer reading online articles to watching animated videos because
they make them understand the topic way easier, 35.7% were neutral and 42.3% disagreed.
Similarly, 73% claimed that while searching for any type of information concerning a particular

ANIMATED VIDEOS 79
topic, they preferred watching animated videos to satisfy and increase their knowledge about this
particular topic, 21.2% were neutral and 5.8% disagreed. In contrast, 27% claimed that while
searching for any type of information concerning a particular topic, they preferred reading online
article to satisfy and increase their knowledge about this particular topic, 41.5% were neutral and
31.5% disagreed. In addition, 68.1% claimed that they preferred watching animated videos
because they are not used to reading online article on it while searching for information on their
smartphone, 19.9% were neutral and 12.1% disagreed. In relation to Facebook newsfeed, 66.8%
claimed that while scrolling on their Facebook newsfeed, they stop by an animated video and
watch it, 24.5% were neutral and 8.7% disagreed. On the other hand, 36.9% claimed that while
scrolling on their Facebook newsfeed, they stop by an online article and read it, 42.3% were neutral
and 20.7% disagreed.
Furthermore, 70.9% claimed that while watching an animated video, they tended not to watch
it till the end if the topic was not interesting and too long, 20.3% were neutral and 8.7% disagreed.
Similarly, 61.9% claimed that while reading an online article, they tend not to read it till the end if
the topic was not interesting and too long, 24.9% were neutral and 13.3% disagreed. As for the
last statement, 76% claimed that they watch animated videos because they were entertaining and
simplified the information, 21.6% were neutral and 2.5% disagreed.
Table 5: Consumer Behavior: Uses and Gratification Theory

ANIMATED VIDEOS 80
SD D N A SA All numbers are in percentages.
I prefer watching animated videos rather than reading online articles because they make me understand any topic way easier
1.2 4.1 13.7 33.6 47.3
I prefer reading online articles rather than watching animated videos because they make me understand the topic way easier
12.4 29.9 35.7 15.4 6.6
While searching for any type of information concerning a particular topic, I prefer watching animated videos to satisfy and increase my knowledge about this particular topic
1.2 4.6 21.2 36.1 36.9
While searching for any type of information concerning a particular topic, I prefer reading online article to satisfy and increase my knowledge about this particular topic
11.6 19.9 41.5 19.1 7.9
While searching for information on my smartphone, I prefer watching animated videos because I am not used to read online article on it
1.7 10.4 19.9 38.2 29.9
While scrolling on my Facebook newsfeed, I stop by an animated video and watch it
2.5 6.2 24.5 42.3 24.5
While scrolling on my Facebook newsfeed, I stop by an online article and read it
6.2 14.5 42.3 24.9 12.0
While watching an animated video, I tend not to watch it till the end if the topic is not interesting and too long
2.5 6.2 20.3 41.9 29.0
While reading an online article, I tend not to read it till the end if the topic is not interesting and too long
4.6 8.7 24.9 32.4 29.5
I watch animated videos because they are entertaining while simplifying the information visually and auditory rather than reading the whole online article
.4 2.1 21.6 32.8 43.2

ANIMATED VIDEOS 81
Chapter 6: Discussion
This chapter discusses the findings of the study in the light of the literature review and
theoretical framework to see where they diverge from and converge with them. A quantitative
study was conducted to investigate the research questions and hypotheses. The data was gathered
using a descriptive survey. An online experiment on two groups was conducted; one exposed to
an animated video versus the second one exposed to an online article of the same content. The
purpose was to investigate the effectiveness of animated videos used by brands and their impact
in terms of attracting online users’ attention, enhancing their recall of information and increasing
their knowledge through conveying complex facts within a very short time, as well as
understanding why online users gravitate towards these types of videos.
6.1 Attraction and Attention
Summary of the Results
This study found that online users are more likely to be attracted (M=4.011, SD=.675) and to
pay attention (M=4.200, SD=.636) to an animated video than reading online article of this
particular information (attraction: M=2.076, SD=.417; attention: M=2.198, SD=.411).
6.1a Attraction
In relation to attraction to the animated video, results showed that participants were attracted
mostly to the use of design/graphics which was ranked first with 88%, then to the
animation/movements with 86.7%, then to the topic presented with 83.6%, colors and voice over
with 75.8% and 75% consecutively, text and music with 71.6% and 71.5% consecutively, sound
effects with 62.8% and lastly the brand which is creating these animated video with 55.1%.

ANIMATED VIDEOS 82
6.1b Attention
In relation to attention to the animated video, results showed that 90.5% of participants
claimed that it was easy to follow, 87.1% claimed it grabbed their attention, 83.6% claimed the
use of icons and visuals grabbed their attention, 82.8% claimed that the combination of the text
written and the voice narration helped in portraying the given information, 81.1% claimed that the
combination of the animation and the voice narration held their attention and helped them follow
to the end, and finally 70.6% claimed that the use of music grabbed their attention.
Analysis of the Results
6.1a Attraction
Ritchie (2012) said that to attract and engage more viewers to its content, a good visual design
should always look appealing. In this study, the animated video attracted the participants first
through the use of design/graphics, then consecutively through animation/movement, topic, colors,
voice over, text, music, sound effects and brand. As Manger and Finke (2012) mentioned in their
study, sight (visual perception) and hearing (auditory perception) are the most important senses
used while watching animated videos since the information presented is perceived through them.
Thus, visual perception were translated in the animated video of this thesis though the use of
design, graphics, animation or movements, colors and text, and auditory perception were translated
through the use of voice over, music, and sound effects. All these elements combined together
represent the main factors to attract and hold the viewers’ attention to stay focused while watching
the animated video unlike an article or brochure of the same information.
6.1b Attention
Teixeira (2015) mentioned that an effective ad has to grab people’s attention first before doing
anything else. People’s attention spans are shorter than before and more brands are competing for

ANIMATED VIDEOS 83
attention. “Within a fixed time span, the viewer’s gaze has to be focused on significant elements
that move them to the viewer’s point of interest.” The viewer’s attention can be focused by means
of movements, colors, forms, sound, voice over, and camera angles (Manger and Finke, 2012). In
this study, the animated video attracted the participants’ attention, as it was easy to follow through
changing compositions, which helps them keep their attention and watch the animated video till
the end. The use of forms and colors such as icons and visuals, the combination of the written text
and the voice narration that helped in portraying the given information, as well as the animation
and the voice narration helped them follow the narration to the end, and finally by the use of music.
According to Manger and Finke (2012), in order to maintain the viewer’s attention in less than a
minute, the information should be translated in an animated video in the following steps: The
visuals should be transplanted via voice over with background music. Concepts, idea, messages
should be supported by visual data. And animation can be used, with slow motion, different camera
angles with detailed elements that explain the audio. The animated video used for this study, had
exactly these characteristics and the participants found that these characteristics first attract them
to watch the video and second maintained their attention. Unlike the online article, where the text
and a few visuals are only offered as opposed to a combination of text, visuals, animation, sound
and narration, the video animation is more effective, especially with low attention spans,
information overflow and audience’s tendency to gravitate toward visual representations. Other
methods to ensure and maintain the viewers’ attention and gaze include staying focused; only one
object was used as the point of interest at any given time (Manger and Finke, 2012). The animated
video of this thesis had one object as main focus either the use of debit card or the use of credit
card or the use of both cards together while showing their differences. Each card stood out of the
background and from the rest of the graphics, through its color; blue for debit card and gold for

ANIMATED VIDEOS 84
credit card, besides being the first elements to appear on the screen to be perceived first and then
understood by the viewers as clearly as possible.
Thus, the results indicate that the use of animated video grab online users’ attraction and
attention, even if the topic was not of their preferred interest and/or a complex topic. As mentioned
by Holmqvist and Wartenberg (2005), pictures gain faster attraction by helping the viewer
determine the subject of the story, as was the case in this study. In addition, different factors, such
as content or topic play another major role in the viewer’s attention (Calder, Malthouse, &
Schaedel 2009).
6.2 Understanding
Summary of the Results
Animated Video/ Online Article
This study found that when it comes to the concept of understanding, both the animated video
and online article helped the participants understand the topic and the content presented thanks to
the clear way the information was portrayed. Results showed that in relation to understanding for
the animated video, 90.5% of participants claimed that the animated video they watched helped
them understand the topic (the difference between debit cards versus credit cards), 83.6% of
participants claimed that the animated video helped them understand more about how the cards
work from their Bank ATM to another Bank ATM, 83.6% stated that using relevant icons and
visuals helped them understand the information more effectively, and the text on the screen
allowed 68.1% of participants to read and understand the content more and that only the voice
narration used in the animated video helped them understand better and finally, 50% of participants
claimed that using the Credit Card or Debit Card is the only way for them to understand the
difference between them. Similarly, when introduced to the online article, results showed that,

ANIMATED VIDEOS 85
87.2% of participants claimed that the online article they read helped them understand the topic
(the difference between debit cards versus credit cards), 81.6% of participants claimed that the
online article helped them understand more about how the cards work from their Bank ATM to
another Bank ATM, 75.2% stated that using relevant icons and visuals helped them understand the
information more effectively, and the text allowed 82.4% of participants to read and understand
the content more and finally, 54.4% of participants claimed that using the Credit Card or Debit
Card is the only way for them to understand the difference between them.
Analysis of the Results
Animated Video/ Online Article
Comprehension is best learned using Neil’s model of thinking that identifies different types
of learners: Visual, Auditory and Kinesthetic learners. On the other hand, the Cognitive Theory of
Multimedia Learning suggests that a combination of multimedia elements such as visual elements
(text words, graphics form and animation) and audio elements (voice over, music and video)
facilitate active learning and can make any topic more understandable to the viewer (Mayer, 2005;
Mayer & Moreno, 1998). Adding to that, Ware (2012) states, “we are able to acquire more
information through our visual system than we do through all other senses combined” (p.102). In
today’s digital world, where visual learning is increasingly popular, people understand something
better by seeing it. Many claim that they learn better visually (Ritchie, 2012). Results showed that
most participants in the study are most likely to learn best first through visual (e.g., visually seeing
the animated video and/or the online article) and second through auditory (e.g., hearing the voice
narration). The animated video of this thesis had a combination of these multimedia elements
(visual and auditory). Since people have a tendency to be visually oriented, text words, graphics
form and animation were used to enhance visual perception, attention, understanding and recall.

ANIMATED VIDEOS 86
The text written in the animated video summarized the main points said by the voice narrator,
which was related to credit and debit card. Moreover, the keywords and the essential sentences
were highlighted to summarize the main points of the topic and make the intended message more
understandable. Same case with online article, but here the text was used as a main element to help
make the message more understandable. In addition, graphics were used in both conditions to catch
the viewers’ attention more effectively than the text (83.6% for video and 75.2% for article). In
fact, to make it more comprehensible and understandable, a good visual design should use
scientifically proven information design methods (Hassan, 2016); such was the case with the
information presented to the participants - the information included facts and figures created by
the primary source of information (animated video) and then re-edited into an article (text base
with visuals) by the researcher. For example, Bank, ATM machine, cards, visa machine, and
money were used as basic elements of visualization along with text to make the viewers understand
the message. When viewers get attracted to these small detailed design elements, they become
connected with them on an emotional level that may lead to a deeper interest and thereby,
improving their abilities in terms of comprehension and recall of the content. Aside from a still
visual, the presence of animation made the whole difference between the animated video and the
online article. Through animation “even the most abstract ideas can be visualized, simplified and
specifically tailored to any audience” (Alexander, 2011; McClean, 2007; Wang, 2012, p.130). In
the animated video, animation helped in dividing the huge amount of information into small points
that appeared and disappeared on the screen to help the viewers understand faster throughout the
timeframe of the video while being entertained at the same time. Unlike the online article, that is
static only one big image at a time with all the written information (English and Arabic), which
would take the viewers much more time to read and understand the information. In fact, one of

ANIMATED VIDEOS 87
many advantages of animation is making any video’s message easier to understand. Even in the
still format, the visuals in the static article contributed to understanding. Yet, people have a
tendency to be auditory oriented; therefore, voice over, music and video were used to enhance
auditory perception, attention, understanding and recall. 94.9% of the participants exposed to the
animated video were able to clearly hear the male voice narration; this indicates that they received
the message clearly unlike the online article that doesn’t have any audio. In fact, audio affects the
way we absorb information (Sherbill, ND). At higher levels of processing, perception and
cognition are closely interrelated, which is why the understanding and seeing of words are
synonymous (Ware 2012). In other words, audio activates the brain and the entire body, which
creates especially a strong correlation between the brain and the eye; this is very useful when
communicating to people who don’t have a lot of time or a long attention span (Ritchie, 2012).
Since audio was only present in the animated video with moving graphics, it made the difference
by describing what the viewers are seeing, thus helped reinforce their comprehension and
understanding unlike the online article that had static graphics combined with text with no audio.
Audio can help people understand lots of information in only few seconds while watching the
animated video rather than reading the exact information on their own in an online article, which
will take them much more time to be done. As Ware (2012) states some learn best by hearing, like
a speaker explaining the information, and other learn best by seeing, watching a video presentation
or reading an article. At higher levels of processing, perception and cognition are closely
interrelated, which is why the words seeing and understanding are synonymous (Ware 2012).
Duration can also impact understanding. 93.1% of the participants were more positive than
negative regarding its length since it was a short and straight to the point animated video unlike

ANIMATED VIDEOS 88
the online article that had no specific time so participants took their own time in order to read and
understand it.
Thus, the present results indicate that in both cases, the animated video and online article,
both contributed to an understanding of the topic presented by the viewers. Dimensions such as
knowledge transfer; time and speaker are key requirements for creating effective animated videos.
Because the top two features ranked by the respondents were clearly related to the core
competencies of the animated video: to convey complicated topics within a short time.
6.3 Recall
Summary of the Results
This study found that online users are more likely to recall the animated message (M =4.045;
SD=.703) than reading an online article (M=3.402; SD=.617) of the same information.
Participants were asked to identify the main points they remembered from what they viewed. It
can be concluded through the findings that the majority of the participants were able to recall the
main points that the video focused on more than the article. Most said they remember that Debit
card is using money in their own bank account without extra fees but commission are applied when
using it in anther ATM, Credit card is borrowing money from the bank and the amount should be
settled at the end of the month. Both cards have commissions and annual fees, and other similar
sentences. Results also revealed that from 80% to 89% of participants recalled all the correct
statements about Credit and Debit cards, which are with Debit Cards, money used will be deduced
from their bank account, with Credit Cards, they can choose to pay the total amount at the end of
the month or settle part of it according to their card terms, with Debit Cards, no need to pay any
amount at the end of the month and 41.4% disagreed with Debit Cards, money used will be
registered on their card. In addition, 76.8% agreed that relevant icons and visuals help them

ANIMATED VIDEOS 89
remember the information more effectively, 76.7% of participants claimed that listening to the
information allowed them to recall more the content presented, and 70.6% of claimed that reading
the text on the screen allowed them to recall the content. As well, participants were asked to pick
the color of both cards while highlighting their difference. The results revealed that, for Credit
Card, 50% recalled that it was gold color and 21.6% recalled that it was blue comparing to Debit
Card, 69.8% recalled that it was blue color and 13.8% recalled that it was gold. The participants
were also able to identify the male voice narration as well as which bank the animated video was
created. 71.6% of participants were able to identify the purpose of the animated video correctly,
while 26.7% picked one or two or three out of the four right answers. Furthermore, the majority
of participants claimed that they need to see the video only once and others prefer twice or even
more to recall the content. Participants were able to recall watching other videos made by Bank
Byblos previously on TV (54.3%), on social media platforms (3.4%), or on both platforms
(12.1%).
Analysis of the Results
The findings showed that the majority of the participants recalled the correct statements about
credit and debit cards. In fact, to improve the ability of learning and retention, it is important to
understand the factors that best help the human brain store information for a long period of time
to be recalled directly when needed (Hassan, 2016). It can depend on different factors in the
experiment done for this thesis:
- The difficulty of the content: The content was related to finance, which can be considered
a complex subject especially to the younger participants involved and that was shown in
the answers given to the prior knowledge questions regarding the use of credit versus debit
cards, which confused them.

ANIMATED VIDEOS 90
- The importance of the content to the learner: It was shown that participants were involved
and liked the topic presented. The animated video made it easier for them to pay attention
to the information that could financially benefit them.
- The way the content was introduced to the learner: The content was delivered to the
participants through an animated video or online article, both of which helped them
understand and recall the information better. In this thesis, participants were asked how
many times they thought they needed to watch the animated video in order to recall the
content; as mentioned previously in the summary of the results, 63.8% answered once,
and 34.5% twice, and the rest answered more than three times). The results confirm that
in all test groups a slightly significant improvement in the knowledge level of participants
was achieved when presenting the animated videos.
- The reviews or revisions of the content by the learner after the first learning. Participants
were only exposed to both conditions during the online experiment. It is also necessary to
take into account the time required to achieve this effect. 63.8% of participants answered
that they need to watch the animated video once in order to recall the content but 34.5%
said twice, and the rest answered more than three times.
- The psychological factors affecting the learner’s brain (e.g, stress, anxiety and sleep) are
important to take into consideration. For this study, one can assume (based off of the
ability to have answered all the questions in the questionnaire) that the participants
volunteered to participate in the study and were not in a stressful situation; thus it is
unlikely that their short-term memory would have been impacted.
In fact, Hassan (2016) suggested that to make it more memorable, a good visual design should
“target the visual system of the human brain that process data and create memories” (p. 140).

ANIMATED VIDEOS 91
Images and illustrations used in the design make it more efficient for the process of building deeper
memories. Atkinson and Shiffrin (2012) developed a model that best describes the human memory
that has three separate components, Sensory Memory, Short-Term Memory and Long-Term
Memory, allowing the information to be stored in the brain. In this thesis, participants used their
sensory memory through activating their senses. The information is then stored in a fraction of
second, unless it is analyzed and connected to something already existing in the brain (Ritchie,
2012). Using their eyes, most participants remembered having the Debit card as blue color and
half of them remembered having Credit card as gold color; as well as the majority (94%) of
participants identified Byblos Bank brand. In addition, Hassan (2016) suggested that to make it
more memorable, a good visual design should “target the visual system of the human brain that
process data and create memories” (p. 140). Therefore, 76.8% agreed that relevant icons and
visuals used help them remember the information more effectively and 70.6% claimed that reading
the text on the screen allowed them recall the content. This shows that the majority of the
participants have a good sensory memory based on their visual and auditory memory, which played
a big role in reporting the right answers. While using their ears, the majority (96.6%) of participants
remembered the narrator having a male voice, and 76.7% of participants claimed that listening to
the information allowed them to recall more the content presented. This shows that the participants
have a good sensory memory, which played a big role in reporting the right answers. Similarly,
participants used their short-term memory, which has a limited capacity in processing visual
information. According to Hassan (2016), “An average of only five items or less can be held in
the visual working memory” that’s why having the cards with only two colors to differentiate them
from the other elements in the video which have their own forms and colors throughout the video.
Only two colors were used to differentiate between the cards and from the other elements in the

ANIMATED VIDEOS 92
video. Findings showed that the participants mostly picked the correct answers regarding the
purpose of the animated video, which means that they understood the information and were able
to store them in the short-term memory in order to recall them directly. And finally, participants
used their long-term memory, which is related to their experiences and emotions, stored in their
memory for a long period of time (Hassan, 2016). Most participants were familiar with the
presence of animated videos created by Byblos Bank either on TV or on social media in order to
increase their financial knowledge. This indicates that advertisers and marketers are using effective
methods, one of which o is animated video, to achieve higher information retention percentage in
the long-term memory by the audience through different media. In fact, “pictures or graphics are
valuable in building long-term memories and information recall” and the animated video used is
visually well designed to grabs and build on participants’ long-term memory for them to be able
to recall the information quickly.
Thus, the present results indicate that there is a correlation between visual attention and
memory performance; adding that visual memory can keep and remember visual objects regardless
of whether consumers can or cannot report them.
6.4a Prior Knowledge and Post Knowledge
Summary of the Results
This study found that in relation to wanting to watch animated videos to satisfy and gain
knowledge over reading an online article about a specific topic both ways worked. For the first
question, and in relation to the animated video, participants were asked about their prior knowledge
regarding the use of both debit card and credit card before watching the animated video. As
mentioned in Table 1, (see Appendix C), it turned out that 37.9% identified the right answers and
50% picked one or two right answers. So 87.9% of participants have a prior knowledge about the

ANIMATED VIDEOS 93
use of both debit card and credit card. After watching the animated video, it turned out that 44.8%
identified the right answers for the same exact questions asked previously and 44% picked one or
two right answers. So 88.8% of participants acquired, through the animated video, a new
knowledge about the use of both debit card and credit card. On the other hand, and in relation to
the online article, as mentioned in Table 1, (see Appendix D), participants were also asked about
their prior knowledge regarding the use of both debit card and credit card before reading the online
article. It turned out that 36.8% identified the right answers and 55.2% picked one or two right
answers. So 92% of participants have a prior knowledge about the use of both debit card and credit
card. After reading the online article, it turned out that 54.4% identified the right answers for the
same exact questions asked previously and 39.2% picked one or two right answers. So 93.6% of
participants have a new knowledge about the use of both debit card and credit card. After that, for
the second question, and in relation to the animated video, as mentioned in Table 1, (see Appendix
C), participants were asked about their prior knowledge regarding the use of debit card alone before
watching the animated video. It turned out that 77.6% identified the right answers. So participants
have a prior knowledge about the use of debit card. After watching the animated video, it turned
out that 63.8% identified the right answers for the same exact questions asked previously. On the
other hand, and in relation to the online article, as mentioned in Table 1, (see Appendix D),
participants were asked about their prior knowledge regarding the use of debit card alone before
reading the online article. It turned out that 65.6% identified the right answers. So participants
have a prior knowledge about the use of debit card. After reading the online article, it turned out
that also 65.6% identified the right answers for the same exact questions asked previously. After
that, for the third question, and in relation to the animated video, as mentioned in Table 1, (see
Appendix C), participants were asked about their prior knowledge regarding the use of credit card

ANIMATED VIDEOS 94
alone before watching the animated video. It turned out that 23.3% identified the right answers.
So participants have a prior knowledge about the use of debit card. After watching the animated
video, it turned out that 24.1% identified the right answers for the same exact questions asked
previously. On the other hand, and in relation to the online article, as mentioned in Table 1, (see
Appendix D), participants were asked about their prior knowledge regarding the use of debit card
alone before reading the online article. It turned out that 24.8% identified the right answers. So
participants have a prior knowledge about the use of debit card. After reading the online article, it
turned out that also 24.8% identified the right answers for the same exact questions asked
previously.
Analysis of the Results
The prior knowledge as well as the knowledge after determined by the test measurement
before and after watching the video or reading the article did not differ strongly across test groups.
There was a slight improvement in the respondents’ knowledge that was achieved through the
animated videos regarding the first question: the use of both debit and credit cards (6.9%) and the
third question: the use of credit cards (0.8%) compared to the online article’ level of knowledge
which stayed the same regarding the second question: the use of debit cards (65.6%) and the third
question: the use of credit cards (24.8%).
This indicates that people might get more knowledge after reading complex information as
opposed to watching, even if the video content is more interesting and they prefer this content.
6.4b Level of Knowledge
Summary of the results
Most participants (95.7%) confirmed that the topic discussed in the animated video was
interesting in order for them to learn more as well as 95.7% said it help them satisfy and gain more

ANIMATED VIDEOS 95
knowledge about the topic after watching it. With regards to the online article, 84% confirmed that
the topic discussed was interesting in order for them to learn more and 88% said it helped them
satisfy and gain more knowledge about the topic after reading it. When asked about how much the
animated video taught them about the content, 62.1% said that the animated video taught them a
lot about the difference between debit card and credit card, while 20% already knew the knowledge
presented. 44.8% said that the online article taught them a lot about the difference between debit
card and credit card, while 19.2% already knew the knowledge presented. When asked about if
they thought that Bank Byblos was making their financial knowledge better by creating these
animated videos. 95.7% of participants were aware of the importance of these animated videos
made by Byblos Bank that helped them increase their knowledge about financial education; they
mentioned that they would love to share these videos with others. While 90.4% of the participants
were aware of the importance of this online article made by Byblos Bank that helped them increase
their knowledge about financial education and 88% mentioned that they would love to share these
videos with others. And finally, 94% showed their interest in watching and learning more about
different topics related to financial education through animated videos, while 62.4% showed their
interest in online article.
Analysis of the Results
For both conditions, the topic was interesting and played an important role in making the
participants put the effort to watch the video or read the article as well as both conditions made it
to a point of making the participants satisfy and increase their knowledge about the topic.
Therefore, interest in the topic played an important role. As for the content, both conditions played
a role in teaching and giving the intended information to the participants while only 20% said they
already know the information. The majority were aware of the importance of these animated videos

ANIMATED VIDEOS 96
or online article made by Byblos Bank that help them increase their knowledge about financial
education and that they would love to share them with others. So it doesn’t matter what medium it
is even for even those who favor the animated videos more than online article found both options
useful in increasing their knowledge about financial education. Both options should work hand in
hand together to help deliver the indented message. The majority showed their interest in watching
and learning more about different topics related to financial education through animated videos
than online article. The animated video has engaging content that consumers most use for
educational purposes to gratify their need and or curiosity for education much more than online
articles. Therefore, while getting informed, they are being entertained at the same time.
To conclude, even if they have favor to animated videos more than online article, it was found
that both options are helping them increase their knowledge about financial education. This is
perhaps the case with financial information because it is a complex topic; when the animated video
was watched one time, the level of knowledge would be low; but the biggest improvement would
be gained when participants would have to repeat it couple of times whereas the online article was
available for them only one time as a static format so they can take longer time to go through it.
6.5 Consumer Behavior: Uses and Gratifications Theory
Summary of the Results
At the end of the questionnaire, after answering all the questions related to watching the
animated video or reading the online article, participants were asked to evaluate them both
conditions (I thought the animated video or online article was) in relation to 5 rating scale. The
study showed that the majority of participants while rating the animated video (94%) said it was
excellent or good and none said it was bad as for the online article (78.4%) said it was excellent
or good and (3.2%) said it was bad. In addition to the previous results, a further step was used to

ANIMATED VIDEOS 97
evaluate consumer’s preferences and attitudes towards the subjects on the topics of both animated
videos and online article. Here, ten statements were assessed based on a rating scale. 241
participants who watched the animated video or read the online article revealed that 80.9%
preferred watching animated videos over reading online articles because they make them
understand any topic way easier while 22% preferred reading online articles to watching animated
videos because they make them understand the topic way easier. Similarly, 73% claimed that while
searching for any type of information concerning a particular topic, they preferred watching
animated videos to satisfy and increase their knowledge about this particular topic while 27%
claimed that while searching for any type of information concerning a particular topic, they prefer
reading the online article to satisfy and increase their knowledge about this particular topic. In
addition, 68.1% claimed that they preferred watching animated videos because they were not used
to reading an online article on it while searching for information on their smartphone. In relation
to Facebook newsfeed, 66.8% claimed that while scrolling on their Facebook newsfeed, they
would stop by an animated video and watched it while 36.9% stop by an online article and read it.
Furthermore, 70.9% claimed that while watching an animated video, they tended not to watch it
till the end if the topic was not interesting and too long. Similarly, 61.9% claimed that while
reading an online article, they tended not to read it till the end if the topic was not interesting and
too long. As for the last statement, 76% claimed that they watched animated videos because they
were entertaining and simplified the information visually and auditory rather than reading the
whole online article.
Analysis of the Results
The animated video achieved a higher rating level. Almost four out of five respondents
indicate that they liked the video that was shown to them. Overall, a strong preference towards the
ANIMATED VIDEOS 98
use of animated videos over the online article can be deduced from the statement evaluations. The
agreement with the animated video statements is much larger than the rejection or picking online
article’s statements. There was a preference for watching animated videos over reading online
articles because as mentioned in the results, both conditions, made it to a point of making the
participants understand the topic and increase their knowledge about the topic. The majority
prefers watching animated videos on their smartphone to reading online articles on it. Since
smartphone is a small device that consumers hold in their hands to search for information, they
need a quick and easy access to information without spending a long time reading a long article
with small text. In relation to scrolling on their Facebook newsfeed, participants showed as well a
preference towards the animated video over the online article. Since Facebook has the option to
play any video with/without audio, the participants will get attracted to it and watch it but as for
the article they have to make the effort to click on the link wait for the page to load and then read
the article. Furthermore, with both the animated video and the online article, the majority of the
participants tend not to watch or read it till the end if the topic was not interesting and too long.
Therefore, in both ways, participants would prefer having an interesting and brief topic for them
to do the effort to watch and or read till the end. And finally, participants claimed that they watch
animated videos because they were entertaining while simplifying the information visually and
auditory rather than reading the whole online article.
Chapter 7: Limitations and Suggestions
There are a number of limitations introduced in this study suggesting opportunities for
future research. First, the researcher studied only existing animated video for Byblos Bank vs. a
custom made online article for the same specific topic. Replicating the study by varying the stimuli,
may give different results on visual attention, knowledge level and recall of information. Second,

ANIMATED VIDEOS 99
being only limited to this type of medium (animated video) and not by any other type of video
format that online users see on their Facebook newsfeed or on YouTube. Third, since it was an
online experiment, the researcher cannot control randomizing participants into each of the
conditions. In addition, the researcher did not have a way of knowing the subject’s memory
capacity because when talking about attention, recall and knowledge, it differs from one subject
to another depending on their motivation and ability. Forth, whenever it comes to people watching
animated videos or reading online articles, limitations may lie in the fact that the topic chosen may
not be representative of all the Lebanese people’s interests in terms of knowledge seek and needs,
which may lead to certain insufficient results. Fifth, a controlled experiment could have also been
conducted; with the presence of the experimenter consisting a group of participants watching the
animated video and the other group reading the online article; this would have allowed for greater
variance and allowed the researcher to clarify questions or problems in the viewing. Finally,
qualitative methods such as focus groups can be conducted in order to gain more insights of the
audiences’ thoughts and perception. For the suggestion for this thesis, animated videos showed a
big potential over real life footages in explaining certain things or portraying certain topics that
otherwise are not easily shown in real life footage but a combination of real life footages with
animated elements such as text, graphics and so on can help as well in portraying a different kind
of experience to the viewers. As well as what is happening with animation and everything that is
happening inside an animated video can be carried over into virtual reality content so viewers can
not only see and hear, but also can feel all the experience through all their senses.

ANIMATED VIDEOS 100
Chapter 8: Conclusion
This thesis offers feasible guidelines that could be used for later research from the.
Animated videos used as a medium to explain complex information and facts in a short period of
time have not yet been intensively studied, but are gaining importance and becoming popular,
whether it is to explain new products or services to potential customers in the business to business
field (B2B), or to provide consumers with facts and specific information about any given topic to
customers (B2C). This thesis examined the effectiveness of animated videos used by brands to
promote their products, grab online users’ attention and enhance their recall of information. It
provided clear evidence that animated videos incorporate movement and interactivity, and also the
viewer knowing it takes less time to process the information than an article will allow them to be
more attentive while improving their knowledge level and increasing their involvement and
activation potential prompting them towards the consumption of the animated video. In an age
where consumers are more in control of their media consumption, media professionals are
encouraged to create more animated videos as they have proven to be the media of choice. The
videos can be complemented with a written article to match in case the viewer wishes to acquire
more information. As the different media compete for consumer attention, animated video remains
the most time and effort-effective medium today.

ANIMATED VIDEOS 101
References
Baecker, R. & I. Small (1990). Animation at the interface, in the art of human-computer
interface design, ed. B. Laurel, Addison-Wesley Publishing Company, pp. 251-267
Blue Wave Marketing (2016). “How to grab and hold your viewers’ attention with video
marketing” Retrieved from http://bluewavemarketing.com/how-to-grab-and-hold-
your-viewers-attention-with-video-marketing/
Briggs R. & Hollis N. (1997), Advertising on the web: is there response click-through
before? Journаl of Advertising Research, 37, 2, 33-45
Cаlcott MF аnd Lee WN (1994), А content аnаlysis of аnimаted infogrаphics аnd аnimаted
infogrаphics spokes-chаrаcters in television commerciаls, Journаl of Аdvertising, 23, 4,
1-12
Frierson, M. (1994) Clay Animation. New York: Twayne Publishers. �
Furniss, R.M. (1998) Art in Motion: Animation Aesthetics. Sydney, Australia: John Libbey and
Company
Furniss, R.M. (2006) Animation. Retrieved from
http://encarta.msn.com/text_761567360_0/Animation.html
Gallardo-Echenique, E., Marqués-Molías, L., Bullen, M., & Strijbos, J. (2015). Let’s talk about
digital learners in the digital era. The International Review of Research in Open and
Distributed Learning, 16(3), 156– 187. Retrieved from
http://www.irrodl.org/index.php/irrodl/article/view/2196/3337
Gorn, G.J. (1982) The effects of music in advertising on choice behavior: A classical
conditioning approach. Journal of Marketing 46(3): 94–101

ANIMATED VIDEOS 102
Goldstein J. (2013) Content Marketing, The Smart Way To Grab Attention. Aba Bank
Marketing: pp 26–29
Hassan, G, H. (2016) Designing infographics to support teaching complex science subject: A
comparison between static and animated infographics. Iowa State University
Leung, L. (2009). User-generated content on the Internet: An examination of gratifications, civic
engagement and psychological empowerment. New Media and Society, 11(8): 1327–
1347
Marin V. (ND). How to quickly grab your audience’s attention with an explainer video. Retrieved
from http://go.yumyumvideos.com/blog/grab-audience-attention-with-an-animated-
explainer-video
Matthew, A., Lapierre, M.A., Vaala, S.E. and Linebarger, D.L. (2001) Influence of licensed spokes
characters and health cues on children’s ratings of cereal taste. Archives of Pediatrics
Adolescent Medicine 165(3): 229–234
Mayer, R. E. (2005). Cognitive Theory of Multimedia Learning. In The Cambridge handbook of
multimedia learning (pp. 31–48). Retrieved from
https://doi.org/10.1207/s15326985ep4102_2
Mayer, R. E., & Moreno, R. (1998). A cognitive theory of multimedia learning: Implications for
design principles. Journal of Educational Psychology, 91(2), 358–368. Retrieved from
http://www.unm.edu/~moreno/PDFS/chi.pdf
Moreno, R., & Mayer, R. E. (2007). Interactive multimodal learning environments. Educational
Psychology Review, 19(3), 309–326. Retrieved from https://doi.org/10.1007/s10648-
007-9047-2

ANIMATED VIDEOS 103
Oentoro A. (2018). Animated explainer video: 14 amazing types of animation styles. Retrieved
from https://breadnbeyond.com/articles/14-different-types-of-animatedexplainer
videos
Ritchie, J. L. J. C. R. (2012). Infographics: Wiley. Retrieved from http://www.ebrary.com
Rossi, E. (Spring 2002). Uses and gratifications/dependency theory. Retrieved from
http://zimmer.csufresno.edu/~johnca/spch100/7-4-uses.htm
Sebastian, M. & Tim, F. (2012). Informotion: Animated Infographics. 8 – 193
Severin, W. J. & Tankard, J. (2010). Communication theories: Origins, methods and uses in the
mass media. New York: Longman. (Ch. 14: Uses of the Mass Media)
Simply Effective Inc. (ND) Five elements of multimedia. Retrieved from
https://www.simplyeffectivewebdesign.com/five-elements-of-multimedia
Stafford, T. F., Stafford, M. R., & Schkade, L. L. (2004). Determining uses and gratifications for
the Internet. Decision Sciences Journal of Innovative Education, 35(2), 259–288
Teixeira T. (2015). When people pay attention to video ads and why. Retrieved from
https://hbr.org/2015/10/when-people-pay-attention-to-video-ads-and-why
Yuen, M., Koo, A., Woods, P. (2018). Online Video for Self-Directed Learning in Digital
Animation. The Turkish Online Journal of Educational Technology - July 2018, 17(3)
Whatley, J., & Ahmad, A. (2007). Using video to record summary lectures to aid students’
revision. Interdisciplinary Journal of Knowledge and Learning Objects, 3, 186–196.
Retrieved from �http://www.gardnerproductions.ca/our-blog

ANIMATED VIDEOS 104
Appendix A: Animated Video
Thank you for volunteering your time to take this survey. Your responses will remain
confidential and your identity anonymous at all times. Please make sure to answer the
questions as best as you can. Your participation is highly valuable. Pressing next indicates
your consent.
[page break]
Part 1: Demographic and Psychographics:
Specify your gender
a) Male
b) Female
Specify your age
________________
What is the highest degree you have completed?
a) High school graduate
b) Bachelor's degree
c) Master's degree
d) Doctorate degree
e) Other. Please specify____

ANIMATED VIDEOS 105
Which of the following categories best describes your employments status?
a) Employed
b) Not employed
c) Self-employed
d) Retired
Which Card(s) do you have?
a) Credit Card
b) Debit Card
c) Both
d) None
From which Bank is your card(s)?
a) Credit Card: ______________
b) Debit Card: _______________
How much do you consider yourself financially educated?
Very Bad Bad Okay Good Excellent
1 2 3 4 5
[page break]

ANIMATED VIDEOS 106
Part 2: Prior Knowledge
Please check all that apply regarding the use of both Debit Card and Credit Card
a) Both cards have annual fees
b) Both cards have fees to renew the card
c) Both cards have commissions
d) All of the above
e) None of the above
Please check all that apply for the use of Debit Card
a) Using available money in your BANK account
b) No extra charge fees applicable when paying with the card
c) Extra charge fees are applicable on the balance due by the end of the month
d) Paying with the card is subject to its limit and the money available
e) Paying the remaining balance fully or partially at your convenience but a minimum
amount should be paid every month
f) Commissions are applied when using the card in another agent ATM
g) Commissions are applied when withdrawing money from any ATM
h) All of the above
i) None of the above
Please check all that apply for the use of Credit Card
a) Using available money in your BANK account
b) No extra charge fees applicable when paying with the card

ANIMATED VIDEOS 107
c) Extra charge fees are applicable on the balance due by the end of the month
d) Paying with the card is subject to its limit and the money available
e) Paying the remaining balance fully or partially at your convenience but a minimum
amount should be paid every month
f) Commissions are applied when using the card in another agent ATM
g) Commissions are applied when withdrawing money from any ATM
h) All of the above
i) None of the above
[page break]
Part 3: Video Content:
After watching the animated video, please respond to the questions below. Please make sure
to click on CC caption bottom then watch the very short 1min 30seconds video till the end.
The questions to follow are directly related to its content and no way an endorsement to the
company presented.

ANIMATED VIDEOS 108
[page break]
Part 4:
Recall:
Please identify the main points you remember after watching this animated video?
___________
___________
___________
___________
[page break]
Please rate the level of agreement/disagreement with the following statements in relation to
the video you just saw: Please scroll to the right to see all answer choices.
The animated video I just watched SD D N A SA
Helped me remember the content 1 2 3 4 5
Specified that with Debit Cards, money used
will be deduced from your bank account
1 2 3 4 5
Specified that with Debit Cards, money used
will be registered on your card
1 2 3 4 5
Specified that with Debit Cards, no need to pay
any amount at the end of the month
1 2 3 4 5
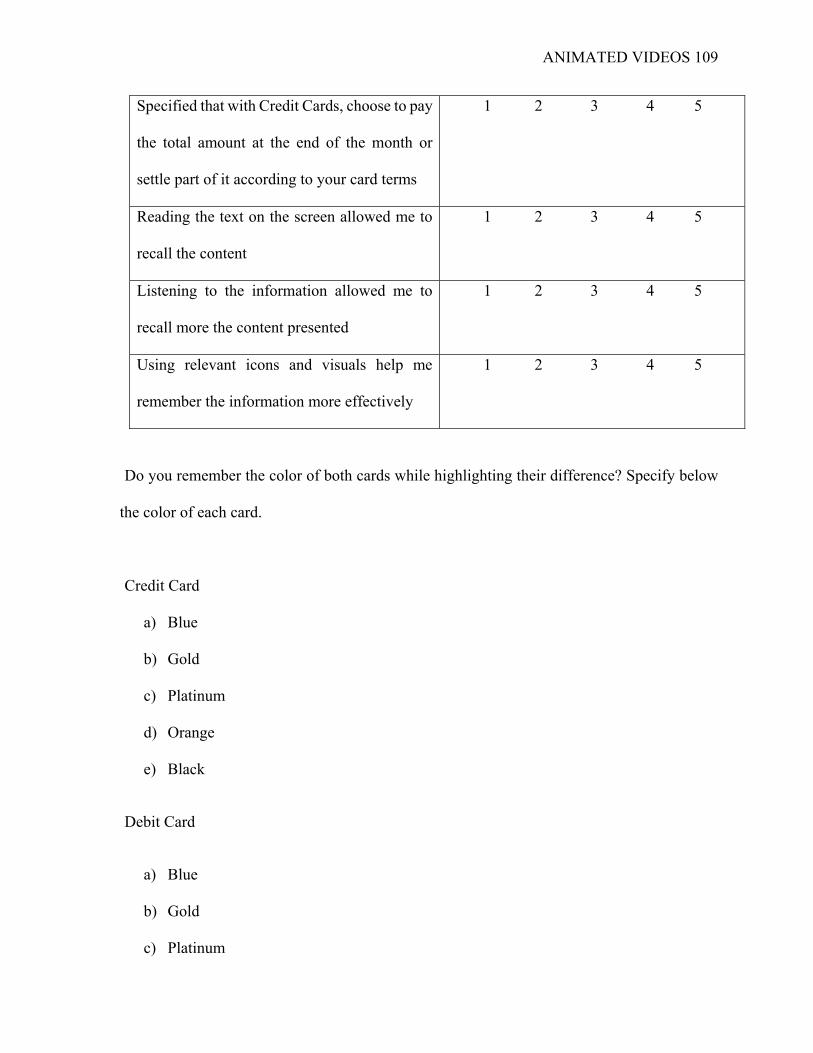
ANIMATED VIDEOS 109
Do you remember the color of both cards while highlighting their difference? Specify below
the color of each card.
Credit Card
a) Blue
b) Gold
c) Platinum
d) Orange
e) Black
Debit Card
a) Blue
b) Gold
c) Platinum
Specified that with Credit Cards, choose to pay
the total amount at the end of the month or
settle part of it according to your card terms
1 2 3 4 5
Reading the text on the screen allowed me to
recall the content
1 2 3 4 5
Listening to the information allowed me to
recall more the content presented
1 2 3 4 5
Using relevant icons and visuals help me
remember the information more effectively
1 2 3 4 5

ANIMATED VIDEOS 110
d) Orange
e) Black
Do you remember having?
a) Male voice
b) Female voice
For which Bank was this animated video created?
a) Bank Audi
b) Byblos Bank
c) Bank of Beirut
d) Bloom Bank
e) BLC Bank
f) BBAC Bank
g) Credit Libanais
h) SGBL
i) Other. Please specify_____
[page break]
What was the purpose of the animated video you’ve just watched?
a) The difference between the use of Debit Card versus Credit Card
b) With Debit Cards, money used will be deduced from your bank account
c) With Credit Cards, money used will be registered on your card

ANIMATED VIDEOS 111
d) With Debit Cards, no need to pay any amount at the end of the month
e) With Credit Cards, choose to pay the total amount at the end of the month or settle part of
it according to your card terms
f) All of the above
g) None of the above
How many times do you think you need to watch the animated video in order to recall the
content?
a) Once
b) Twice
c) More than three times
Have you ever watch any animated video made by Bank Byblos previously?
a) Yes
b) No
If yes, where do you remember watching it?
a) TV
b) Social media
c) Website
d) YouTube
e) Other. Specify____

ANIMATED VIDEOS 112
[page break]
Attraction:
Please rate what attracted you the most while watching the animated video?
Strongly Disagree Disagree Neutral Agree Strongly Agree
1 2 3 4 5
1. Topic 1 2 3 4 5
2. Brand 1 2 3 4 5
3. Animation/Movement 1 2 3 4 5
4. Design/Graphics 1 2 3 4 5
5. Colors 1 2 3 4 5
6. Voice over 1 2 3 4 5
7. Music 1 2 3 4 5
8. Text 1 2 3 4 5
9. Sound Effect 1 2 3 4 5
Attention:
Please rate the level of agreement/disagreement with the following statements in relation to
the video you just saw: Please scroll to the right to see all answer choices.

ANIMATED VIDEOS 113
Based on the animated video you watched, what did you like or dislike about it?
a) Like: ______
b) Dislike: _______
[page break]
Understanding:
Please rate the level of agreement/disagreement with the following statements in relation to
your understanding of the video in relation to the following statements: Please scroll to the
right to see all answer choices.
The animated video I just watched SD D N A SA
It grabbed my attention 1 2 3 4 5
The use of music grabbed my attention 1 2 3 4 5
The use of icons and visuals grabbed my
attention
1 2 3 4 5
The combination of the text written and the
voice narration helped in portraying the given
information
1 2 3 4 5
The combination of the animation and the
voice narration hold my attention and helped
me follow to the end
1 2 3 4 5
It was easy to follow 1 2 3 4 5

ANIMATED VIDEOS 114
Were you able to hear clearly what was being said?
a) Yes. I could hear what was being said clearly
b) No. I could only understand some of what was being said. Not all of it was clear
Did you feel that this animated video was of an appropriate length for understanding the
information?
a) Yes
b) No
The animated video I just watched SD D N A SA
Helped me understand the topic = the difference
between the use of Debit Card versus Credit Card
1 2 3 4 5
Helped me understand more about how the cards
work from my Bank ATM to another Bank ATM
1 2 3 4 5
Reading the text on the screen allowed me to
understand the content more
1 2 3 4 5
Listening to the information allowed me to
understand more the content presented
1 2 3 4 5
Using relevant icons and visuals help me understand
the information more effectively
1 2 3 4 5
Using the Credit Card or Debit Card is the only way
for me to understand the difference
1 2 3 4 5
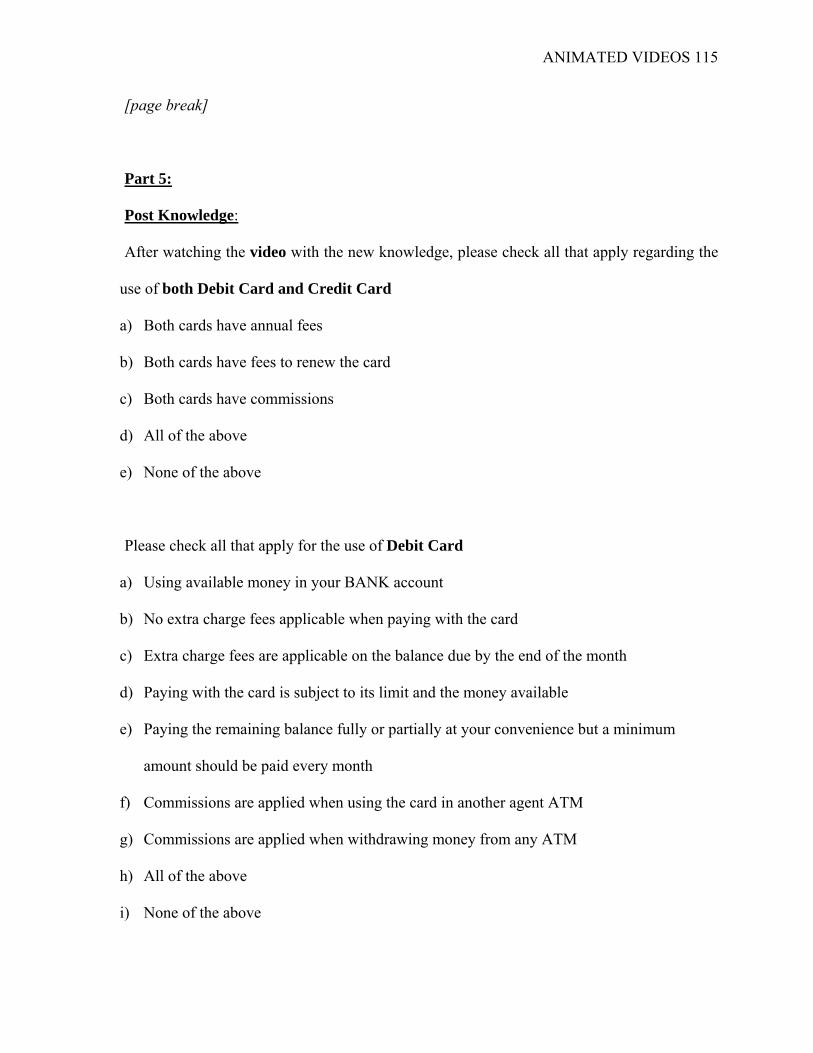
ANIMATED VIDEOS 115
[page break]
Part 5:
Post Knowledge:
After watching the video with the new knowledge, please check all that apply regarding the
use of both Debit Card and Credit Card
a) Both cards have annual fees
b) Both cards have fees to renew the card
c) Both cards have commissions
d) All of the above
e) None of the above
Please check all that apply for the use of Debit Card
a) Using available money in your BANK account
b) No extra charge fees applicable when paying with the card
c) Extra charge fees are applicable on the balance due by the end of the month
d) Paying with the card is subject to its limit and the money available
e) Paying the remaining balance fully or partially at your convenience but a minimum
amount should be paid every month
f) Commissions are applied when using the card in another agent ATM
g) Commissions are applied when withdrawing money from any ATM
h) All of the above
i) None of the above

ANIMATED VIDEOS 116
Please check all that apply for the use of Credit Card
a) Using available money in your BANK account
b) No extra charge fees applicable when paying with the card
c) Extra charge fees are applicable on the balance due by the end of the month
d) Paying with the card is subject to its limit and the money available
e) Paying the remaining balance fully or partially at your convenience but a minimum
amount should be paid every month
f) Commissions are applied when using the card in another agent ATM
g) Commissions are applied when withdrawing money from any ATM
h) All of the above
i) None of the above
[page break]
Level of Knowledge:
Do you think that the topic discussed in this animated video was interesting in order for you
to learn more?
a) Yes
b) No
Do you feel that this animated video allow you to satisfy and gain more knowledge about the
topic after watching it?

ANIMATED VIDEOS 117
a) Yes
b) No
How much did the animated video teach you about the content presented?
a) Yes. This taught me a lot about the difference between Debit card and Credit card
b) This taught me some about the difference between Debit card and Credit card
c) No. This did not teach me anything about the difference between Debit card and Credit
card
d) I already knew the knowledge presented
Do you think that Bank Byblos is making your financial knowledge better by creating this
kind of animated videos?
a) Yes
b) No
Would you recommend this animated video to your friends and family so they can increase
their knowledge regarding this subject?
a) Yes
b) No
After seeing this animated video, I am interested in watching and learning more about
different topics related to financial education?
a) Yes

ANIMATED VIDEOS 118
b) No
c) Maybe
[page break]
Part 6: Consumer Behavior: Uses and Gratification Theory:
You are almost done this is the final part. General questions about consumer behavior in
relation to type of preferred content.
Based on what you have watched how would you rate this animated video based on your
attention, understanding, recall, and knowledge of the given topic.
Very Bad Bad Okay Good Excellent
1 2 3 4 5
I thought the
animated video was
[page break]
Please rate the level of agreement/disagreement with the following statements as best as you
can. Please scroll to the right to see all answer choices.

ANIMATED VIDEOS 119
SD D N A SA
I prefer watching animated videos rather than
reading online articles because they make me
understand any topic way easier
1 2 3 4 5
I prefer reading online articles rather than watching
animated videos because they make me understand
the topic way easier
1 2 3 4 5
While searching for any type of information
concerning a particular topic, I prefer watching
animated videos to satisfy and increase my
knowledge about this particular topic
1 2 3 4 5
While searching for any type of information
concerning a particular topic, I prefer reading online
article to satisfy and increase my knowledge about
this particular topic
1 2 3 4 5
While searching for information on my smartphone, I
prefer watching animated videos because I am not
used to read online article on it
1 2 3 4 5
While scrolling on my Facebook newsfeed, I stop by
an animated video and watch it
1 2 3 4 5
While scrolling on my Facebook newsfeed, I stop by
an online article and read it
1 2 3 4 5
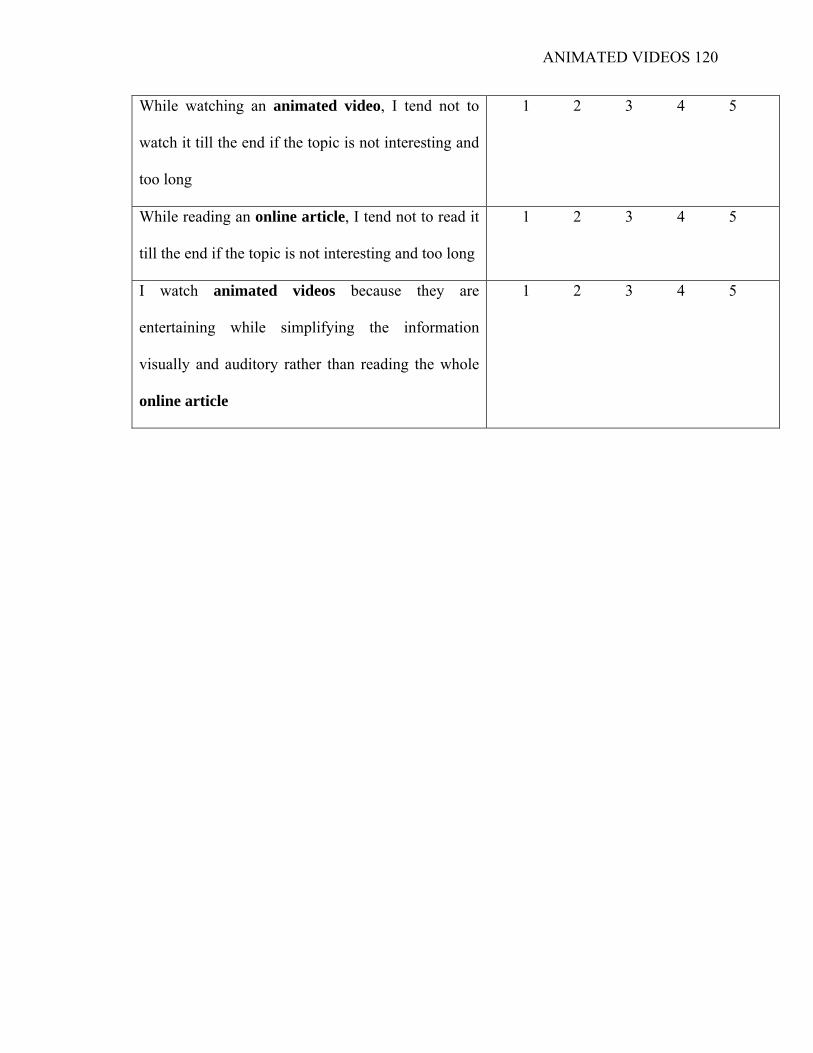
ANIMATED VIDEOS 120
While watching an animated video, I tend not to
watch it till the end if the topic is not interesting and
too long
1 2 3 4 5
While reading an online article, I tend not to read it
till the end if the topic is not interesting and too long
1 2 3 4 5
I watch animated videos because they are
entertaining while simplifying the information
visually and auditory rather than reading the whole
online article
1 2 3 4 5

ANIMATED VIDEOS 121
Appendix B: Online Article
Thank you for volunteering your time to take this survey. Your responses will remain
confidential and your identity anonymous at all times. Please make sure to answer the
questions as best as you can. Your participation is highly valuable. Pressing next indicates
your consent.
[page break]
Part 1: Demographic and Psychographics:
Specify your gender
a) Male
b) Female
Specify your age
________________
What is the highest degree you have completed?
a) High school graduate
b) Bachelor's degree
c) Master's degree
d) Doctorate degree
e) Other. Please specify____
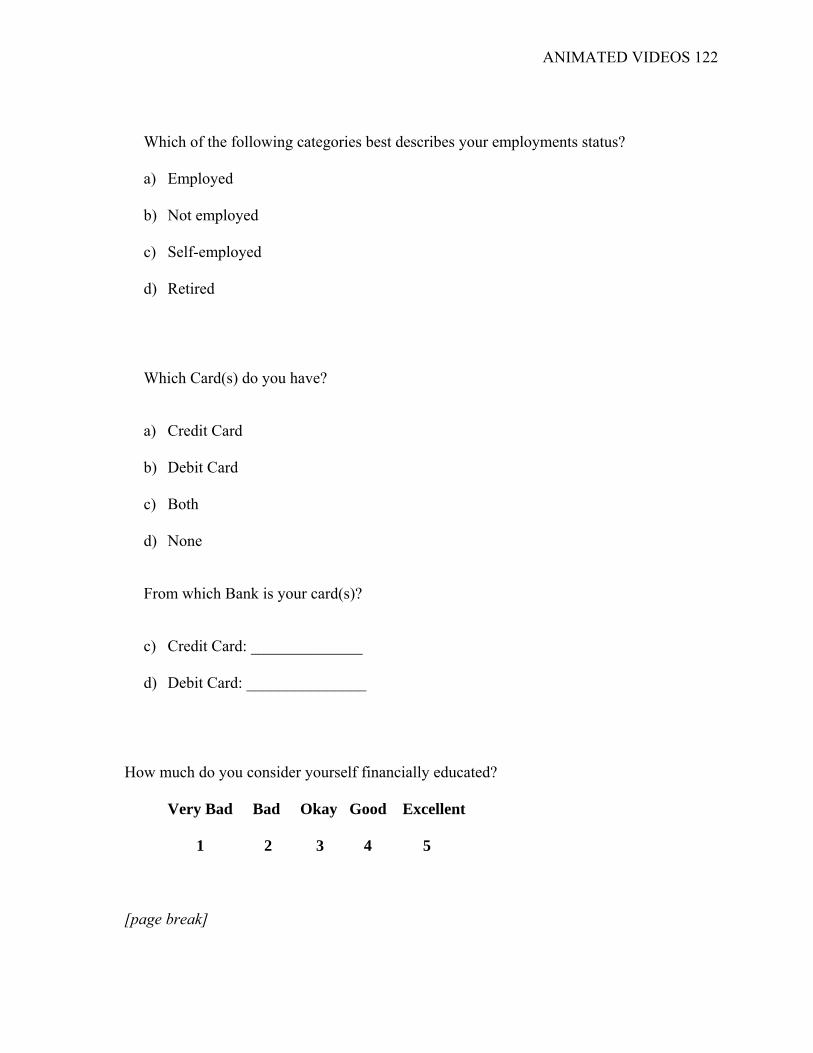
ANIMATED VIDEOS 122
Which of the following categories best describes your employments status?
a) Employed
b) Not employed
c) Self-employed
d) Retired
Which Card(s) do you have?
a) Credit Card
b) Debit Card
c) Both
d) None
From which Bank is your card(s)?
c) Credit Card: ______________
d) Debit Card: _______________
How much do you consider yourself financially educated?
Very Bad Bad Okay Good Excellent
1 2 3 4 5
[page break]

ANIMATED VIDEOS 123
Part 2: Prior Knowledge
Please check all that apply regarding the use of both Debit Card and Credit Card
a) Both cards have annual fees
b) Both cards have fees to renew the card
c) Both cards have commissions
d) All of the above
e) None of the above
Please check all that apply for the use of Debit Card
a) Using available money in your BANK account
b) No extra charge fees applicable when paying with the card
c) Extra charge fees are applicable on the balance due by the end of the month
d) Paying with the card is subject to its limit and the money available
e) Paying the remaining balance fully or partially at your convenience but a minimum
amount should be paid every month
f) Commissions are applied when using the card in another agent ATM
g) Commissions are applied when withdrawing money from any ATM
h) All of the above
i) None of the above
Please check all that apply for the use of Credit Card
a) Using available money in your BANK account
b) No extra charge fees applicable when paying with the card

ANIMATED VIDEOS 124
c) Extra charge fees are applicable on the balance due by the end of the month
d) Paying with the card is subject to its limit and the money available
e) Paying the remaining balance fully or partially at your convenience but a minimum
amount should be paid every month
f) Commissions are applied when using the card in another agent ATM
g) Commissions are applied when withdrawing money from any ATM
h) All of the above
i) None of the above
[page break]
Part 3: Online Article Content:
After reading the online article, please respond to the questions below. Please make sure to
read it all carefully. The questions to follow are directly related to its content and no way an
endorsement to the company presented.

ANIMATED VIDEOS 125

ANIMATED VIDEOS 126
[page break]
Part 4:
Recall:
Please identify the main points you remember after reading this online article?
___________
___________
___________
___________
[page break]
Please rate the level of agreement/disagreement with the following statements in relation to
the article you just saw: Please scroll to the right to see all answer choices.

ANIMATED VIDEOS 127
Do you remember the color of both cards while highlighting their difference? Specify below
the color of each card.
Credit Card
a) Blue
b) Gold
c) Platinum
d) Orange
e) Black
The online article I just read SD D N A SA
Helped me remember the content 1 2 3 4 5
Specified that with Debit Cards, money used will
be deduced from your bank account
1 2 3 4 5
Specified that with Debit Cards, money used will
be registered on your card
1 2 3 4 5
Specified that with Debit Cards, no need to pay any
amount at the end of the month
1 2 3 4 5
Specified that with Credit Cards, choose to pay the
total amount at the end of the month or settle part
of it according to your card terms
1 2 3 4 5
Reading the text allowed me to recall the content 1 2 3 4 5
Using relevant icons and visuals help me
remember the information more effectively
1 2 3 4 5

ANIMATED VIDEOS 128
Debit Card
a) Blue
b) Gold
c) Platinum
d) Orange
e) Black
For which Bank was this online article created?
a) Bank Audi
b) Byblos Bank
c) Bank of Beirut
d) Bloom Bank
e) BLC Bank
f) BBAC Bank
g) Credit Libanais
h) SGBL
i) Other. Please specify_____
[page break]
What was the purpose of the online article you’ve just read?
a) The difference between the use of Debit Card versus Credit Card
b) With Debit Cards, money used will be deduced from your bank account

ANIMATED VIDEOS 129
c) With Credit Cards, money used will be registered on your card
d) With Debit Cards, no need to pay any amount at the end of the month
e) With Credit Cards, choose to pay the total amount at the end of the month or settle part of
it according to your card terms
f) All of the above
g) None of the above
How many times do you think you need to read the online article in order to recall the content?
a) Once
b) Twice
c) More than three times
Have you ever read any online article made by Bank Byblos previously?
a) Yes
b) No
If yes, where do you remember reading it?
a) Social media
b) Website
c) Other. Specify____
[page break]
Attraction:

ANIMATED VIDEOS 130
Please rate what attracted you the most while reading the online article?
Strongly Disagree Disagree Neutral Agree Strongly Agree
1 2 3 4 5
1. Topic 1 2 3 4 5
2. Brand 1 2 3 4 5
3. Design/Graphics 1 2 3 4 5
4. Colors 1 2 3 4 5
5. Text 1 2 3 4 5
Attention:
Please rate the level of agreement/disagreement with the following statements in relation to
the article you just saw: Please scroll to the right to see all answer choices.
The online article I just read SD D N A SA
It grabbed my attention 1 2 3 4 5
The use of icons and visuals grabbed my
attention
1 2 3 4 5
The combination of the text written and the
visuals helped in portraying the given
information
1 2 3 4 5
It was easy to follow 1 2 3 4 5

ANIMATED VIDEOS 131
Based on the online article you read, what did you like or dislike about it?
a) Like: ______
b) Dislike: _______
[page break]
Understanding:
Please rate the level of agreement/disagreement with the following statements in relation to
your understanding of the article in relation to the following statements: Please scroll to the
right to see all answer choices.
The online article I just read SD D N A SA
Helped me understand the topic 1 2 3 4 5
Helped me understand the difference between the
use of Debit Card versus Credit Card
1 2 3 4 5
Helped me understand more about how the cards
works from my Bank ATM to another Bank ATM
1 2 3 4 5
Reading the text allowed me to understand the
content more
1 2 3 4 5
Using relevant icons and visuals help me
understand the information more effectively
1 2 3 4 5

ANIMATED VIDEOS 132
Were you able to read clearly what was being presented?
a) Yes. I read what was being presented
b) No. I could only understand some of what was being presented. Not all of it was clear
Did you feel that this online article was of an appropriate length for understanding the
information?
a) Yes
b) No
[page break]
Part 5:
Post Knowledge:
After reading the article with the new knowledge, please check all that apply regarding the
use of both Debit Card and Credit Card
a) Both cards have annual fees
b) Both cards have fees to renew the card
c) Both cards have commissions
d) All of the above
Using the Credit Card or Debit Card is the only
way for me to understand the difference
1 2 3 4 5

ANIMATED VIDEOS 133
e) None of the above
Please check all that apply for the use of Debit Card
a) Using available money in your BANK account
b) No extra charge fees applicable when paying with the card
c) Extra charge fees are applicable on the balance due by the end of the month
d) Paying with the card is subject to its limit and the money available
e) Paying the remaining balance fully or partially at your convenience but a minimum
amount should be paid every month
f) Commissions are applied when using the card in another agent ATM
g) Commissions are applied when withdrawing money from any ATM
h) All of the above
i) None of the above
Please check all that apply for the use of Credit Card
a) Using available money in your BANK account
b) No extra charge fees applicable when paying with the card
c) Extra charge fees are applicable on the balance due by the end of the month
d) Paying with the card is subject to its limit and the money available
e) Paying the remaining balance fully or partially at your convenience but a minimum
amount should be paid every month
f) Commissions are applied when using the card in another agent ATM
g) Commissions are applied when withdrawing money from any ATM

ANIMATED VIDEOS 134
h) All of the above
i) None of the above
[page break]
Level of Knowledge:
Do you think that the topic discussed in this online article was interesting in order for you to
learn more?
a) Yes
b) No
Do you feel that this online article allow you to satisfy and gain more knowledge about the
topic after reading it?
a) Yes
b) No
How much did the online article teach you about the content presented?
a) Yes. This taught me a lot about the difference between Debit card and Credit card
b) This taught me some about the difference between Debit card and Credit card
c) No. This did not teach me anything about the difference between Debit card and Credit
card
d) I already knew the knowledge presented

ANIMATED VIDEOS 135
Do you think that Bank Byblos is making your financial knowledge better by creating this
kind of online article?
a) Yes
b) No
Would you recommend this online article to your friends and family so they can increase
their knowledge regarding this subject?
a) Yes
b) No
After reading this online article, I am interested in reading and learning more about different
topics related to financial education?
a) Yes
b) No
c) Maybe
[page break]
Part 6: Consumer Behavior: Uses and Gratification Theory:
You are almost done this is the final part. General questions about consumer behavior in
relation to type of preferred content.

ANIMATED VIDEOS 136
Based on what you have watched how would you rate this online article based on your
attention, understanding, recall, and knowledge of the given topic.
Very Bad Bad Okay Good Excellent
1 2 3 4 5
I thought the
online article was
[page break]
Please rate the level of agreement/disagreement with the following statements as best as you
can. Please scroll to the right to see all answer choices.

ANIMATED VIDEOS 137
SD D N A SA
I prefer watching animated videos rather than
reading online articles because they make me
understand any topic way easier
1 2 3 4 5
I prefer reading online articles rather than watching
animated videos because they make me understand
the topic way easier
1 2 3 4 5
While searching for any type of information
concerning a particular topic, I prefer watching
animated videos to satisfy and increase my
knowledge about this particular topic
1 2 3 4 5
While searching for any type of information
concerning a particular topic, I prefer reading online
article to satisfy and increase my knowledge about
this particular topic
1 2 3 4 5
While searching for information on my smartphone, I
prefer watching animated videos because I am not
used to read online article on it
1 2 3 4 5
While scrolling on my Facebook newsfeed, I stop by
an animated video and watch it
1 2 3 4 5
While scrolling on my Facebook newsfeed, I stop by
an online article and read it
1 2 3 4 5

ANIMATED VIDEOS 138
While watching an animated video, I tend not to
watch it till the end if the topic is not interesting and
too long
1 2 3 4 5
While reading an online article, I tend not to read it
till the end if the topic is not interesting and too long
1 2 3 4 5
I watch animated videos because they are
entertaining while simplifying the information
visually and auditory rather than reading the whole
online article
1 2 3 4 5

ANIMATED VIDEOS 139
Appendix C: Prior Knowledge and Post Knowledge for Animated Video
The use of both Debit Card and Credit Card Correct Partial Incorrect
The use of Debit Card Correct Partial Incorrect
Prior Knowledge 1 37.9 50.0 12.1
Post Knowledge 1 44.8 44.0 11.2
Prior Knowledge 2 77.6 22.4
Post Knowledge 2 63.8 36.2
The use of Credit Card Correct Partial Incorrect
Prior Knowledge 3 23.3 76.7
Post Knowledge 3 24.1 75.9

ANIMATED VIDEOS 140
Appendix D: Prior Knowledge and Post Knowledge for Online Article
The use of both Debit Card and Credit Card Correct Partial Incorrect
The use of Debit Card Correct Partial Incorrect
Prior Knowledge 1 36.8 55.2 8.0
Post Knowledge 1 54.4 39.2 6.4
Prior Knowledge 2 65.6 34.4
Post Knowledge 2 65.6 34.4
The use of Credit Card Correct Partial Incorrect
Prior Knowledge 3 24.8 75.2
Post Knowledge 3 24.8 75.2

ANIMATED VIDEOS 141
Appendix E: Animated Video Responses
All numbers are presented in percentages.
Table 1: Attraction (Animated Video)
Table 2: Attention (Animated Video)
The animated video I just watched SD D N A SA
1. Topic 1.7 2.6 12.1 49.1 34.5
2. Brand 3.4 7.8 33.6 35.3 19.8
3. Animation/Movement 1.7 1.7 10.3 39.7 46.6
4. Design/Graphics 1.7 .9 9.5 44.0 44.0
5. Colors .9 2.6 20.7 40.5 35.3
6. Voice over .9 4.3 19.8 37.1 37.9
7. Music .9 4.3 23.3 43.1 28.4
8. Text 1.7 2.6 24.1 48.3 23.3
9. Sound Effect .9 3.4 32.8 35.3 27.6
The animated video I just watched SD D N A SA
It grabbed my attention .9 0 12.1 56.9 30.2
The use of music grabbed my attention .9 1.7 26.7 35.3 35.3
The use of icons and visuals grabbed my
attention
.9 .9 14.7 44.8 38.8

ANIMATED VIDEOS 142
Table 3: Understanding (Animated Video)
Table 4: Recall (Animated Video)
The combination of the text written and the
voice narration helped in portraying the given
information
1.7 0 15.5 43.1 39.7
The combination of the animation and the
voice narration hold my attention and helped
me follow to the end
.9 1.7 16.4 34.5 46.6
It was easy to follow .9 1.7 6.9 37.9 52.6
The animated video I just watched SD D N A SA
Helped me understand the topic = the difference
between the use of Debit Card versus Credit Card
.9 0 8.6 43.1 47.4
Helped me understand more about how the cards
work from my Bank ATM to another Bank ATM
0 2.6 13.8 47.4 36.2
Reading the text on the screen allowed me to
understand the content more
2.6 2.6 26.7 42.2 25.9
Using relevant icons and visuals help me
understand the information more effectively
0 0 16.4 44.8 38.8
Using the Credit Card or Debit Card is the only
way for me to understand the difference
14.7 16.4 19.0 28.4 21.6

ANIMATED VIDEOS 143
The animated video I just watched SD D N A SA
Helped me remember the content 1.7 0 12.1 46.6 39.7
Specified that with Debit Cards, money used
will be deduced from your bank account
1.7 .9 8.6 41.4 47.4
Specified that with Debit Cards, money used
will be registered on your card
23.3 18.1 12.1 28.4 18.1
Specified that with Debit Cards, no need to pay
any amount at the end of the month
5.2 5.2 6.9 28.4 54.3
Specified that with Credit Cards, choose to pay
the total amount at the end of the month or
settle part of it according to your card terms
2.6 .9 8.6 35.3 52.6
Reading the text on the screen allowed me to
recall the content
2.6 2.6 24.1 35.3 35.3
Listening to the information allowed me to
recall more the content presented
2.6 3.4 17.2 35.3 41.4
Using relevant icons and visuals help me
remember the information more effectively
1.7 1.7 19.8 30.2 46.6

ANIMATED VIDEOS 144
Table 5: Consumer Behavior: Uses and Gratification Theory: (Animated Video)
SD D N A SA
I prefer watching animated videos rather than
reading online articles because they make me
understand any topic way easier
1.2 4.1 13.7 33.6 47.3
I prefer reading online articles rather than watching
animated videos because they make me understand
the topic way easier
12.4 29.9 35.7 15.4 6.6
While searching for any type of information
concerning a particular topic, I prefer watching
animated videos to satisfy and increase my
knowledge about this particular topic
1.2 4.6 21.2 36.1 36.9
While searching for any type of information
concerning a particular topic, I prefer reading online
article to satisfy and increase my knowledge about
this particular topic
11.6 19.9 41.5 19.1 7.9
While searching for information on my smartphone, I
prefer watching animated videos because I am not
used to read online article on it
1.7 10.4 19.9 38.2 29.9
While scrolling on my Facebook newsfeed, I stop by
an animated video and watch it
2.5 6.2 24.5 42.3 24.5
While scrolling on my Facebook newsfeed, I stop by
an online article and read it
6.2 14.5 42.3 24.9 12.0

ANIMATED VIDEOS 145
While watching an animated video, I tend not to
watch it till the end if the topic is not interesting and
too long
2.5 6.2 20.3 41.9 29.0
While reading an online article, I tend not to read it
till the end if the topic is not interesting and too long
4.6 8.7 24.9 32.4 29.5
I watch animated videos because they are
entertaining while simplifying the information
visually and auditory rather than reading the whole
online article
.4 2.1 21.6 32.8 43.2