
Molecular modeling of the genesis of the active phase of a ...
245
HAL Id: tel-03434989 https://tel.archives-ouvertes.fr/tel-03434989 Submitted on 18 Nov 2021 HAL is a multi-disciplinary open access archive for the deposit and dissemination of sci- entific research documents, whether they are pub- lished or not. The documents may come from teaching and research institutions in France or abroad, or from public or private research centers. L’archive ouverte pluridisciplinaire HAL, est destinée au dépôt et à la diffusion de documents scientifiques de niveau recherche, publiés ou non, émanant des établissements d’enseignement et de recherche français ou étrangers, des laboratoires publics ou privés. Molecular modeling of the genesis of the active phase of a supported catalyst Amit Sahu To cite this version: Amit Sahu. Molecular modeling of the genesis of the active phase of a supported catalyst. Catalysis. Université de Lyon, 2021. English. NNT: 2021LYSEN037. tel-03434989
-
Upload
khangminh22 -
Category
Documents
-
view
3 -
download
0
Transcript of Molecular modeling of the genesis of the active phase of a ...

HAL Id: tel-03434989https://tel.archives-ouvertes.fr/tel-03434989
Submitted on 18 Nov 2021
HAL is a multi-disciplinary open accessarchive for the deposit and dissemination of sci-entific research documents, whether they are pub-lished or not. The documents may come fromteaching and research institutions in France orabroad, or from public or private research centers.
L’archive ouverte pluridisciplinaire HAL, estdestinée au dépôt et à la diffusion de documentsscientifiques de niveau recherche, publiés ou non,émanant des établissements d’enseignement et derecherche français ou étrangers, des laboratoirespublics ou privés.
Molecular modeling of the genesis of the active phase ofa supported catalyst
Amit Sahu
To cite this version:Amit Sahu. Molecular modeling of the genesis of the active phase of a supported catalyst. Catalysis.Université de Lyon, 2021. English. �NNT : 2021LYSEN037�. �tel-03434989�

Numéro National de Thèse : 2021LYSEN037
THESE DE DOCTORAT DE L’UNIVERSITE DE LYON
opérée par
l’Ecole Normale Supérieure de Lyon
Ecole Doctorale N°206
Ecole Doctorale de Chimie (Chimie, Procédés, Environnment)
Discipline : Chimie
Soutenue publiquement le 27/09/2021, par :
Amit SAHU
Molecular modeling of the genesis of the
active phase of a supported catalyst Modélisation moléculaire de la genèse de la phase active d’un catalyseur supporté
Devant le jury composé de :
Monica Calatayud, Professeure des universités, Sorbonne Université Rapporteure
Jean-François Paul, Professeur des universités, Université de Lille 1 Rapporteur
Valerie Briois, Directrice de Recherche, Synchrotron SOLEIL Examinatrice
Victor Mougel, Professeur Assistant, ETH Zürich (Suisse) Examinateur
Pascal Raybaud, Chercheur EPIC H.D.R., IFP Energies nouvelles Directeur de thèse
Stephan Steinmann, Chargé de Recherche CNRS, ENS de Lyon Co-Encadrant


~ i ~
Acknowledgments
First and foremost, I would like to thank my thesis director Pascal Raybaud for providing
me the opportunity to perform research under his guidance. His expertise was immensely
valuable in the progress of the project. His consistent support, discussions, and
encouragement for attending the conferences have been exceptional. Every conversation
with him inspires me to observe the problem from a different angle and improves my
understanding. I want to thank my co-supervisor, Stephan N. Steinmann, for his valuable
advice, ideas on various calculations, insightful feedback, and enriching scientific
discussions. His mastery over the methodological part has been exceptionally helpful in
enhancing my knowledge. I am grateful to both of my supervisors for reviewing the thesis
and their valuable corrections. Particularly to Pascal, who has also done the proofreading
for this thesis. It won’t be an exaggeration if I say I was fortunate enough to find such
amazing supervisors.
I would also like to thank Luc Nougier, Director of the Catalysis, Biocatalysis, and
Separation Direction, Mathieu Digne and Magalie Roy-Auberger, my Department Chiefs
(Catalysis by sulfides). Marie-Claude Beaufils, Executive Assistant, for taking care of my
administrative work, IFPEN and ENS-Lyon for providing me funding and facilities to work.
I thank the providers of all the high-performance computational resources we have used
in this thesis: CINES, IDRIS, ENER440. Apart from that, I would also like to thank IACS for
selecting me for Young Scientists Travel Support Prize, though I could not use it due to
COVID.
Furthermore, this work wouldn’t have been possible without various discussions and an
excellent scientific environment with Jérôme Rey, Céline Chizallet, Manuel Corral Valero,
Christèle Legens, and Charlie Blons. Specifically, to Jérôme for his help with IRC analysis
and determining TS for complex cases.
Discussion on several occasions as internal meetings (or coffee breaks) with Pierre-Louis,
Virgile, Antoine, Etienne, Soundar, and Sourav on various experimental aspects of the
MoS3 phase and Carine, David, Tangui, Masoud, Thomas, Adrian, Adrian on theoretical
aspects have been constructive.

~ ii ~
I thank Laureline for being a great office mate for the first two years and accompanying
me whenever I changed the office. She and Nathalie have helped me a lot during the
beginning of my PhD with many paperwork. PhD is not a short race; it is like running a
marathon, so support is needed from all aspects of life. I am fortunate to have amazing
friends and colleagues as Elsy, Sharmin, Adrian, Adrien, Thomas, Gabriel, Aleksandra,
Giulia, Flor, Catarina, Julien, Hanane, Corentin, Anand, Danish, Anvesh, and all other IFPEN
and ENS Lyon PhD students. They have supported me or helped me in various stages of
my three-year journey and created a pleasant ambiance for work.
I would also like to thank my flatmate Frederic Scheffler for being very welcoming when
I first arrived in France. He made my transition to the country smooth. He accommodated
me as one of his family members. He, Jeanne, and Corentin have provided emotional
strength and moral support, and thanks to my rabbit for being with me during the
confinement.
Thanks to Prof. Monica Calatayud and Prof. Jean-François Paul for reviewing the thesis
and providing their valuable feedback. I also would like to thank Victor Mougel and
Valerie Briois for accepting the invitation to be the thesis examiners.
Last but not least, I cannot thank my friends and family back in India enough, who have
always been supportive and encouraging. It would not have been possible for me to be
here without their help and guidance. I am grateful to them for their invaluable
contribution to my life.
« This work is part of the project IDEXLYON funded by the French National Research Agency
(ANR-16-IDEX-0005), the Commissariat-General for Investment (CGI) and awarded of M€ 25
(for 4 years) by the French Government within the framework of the Investissements d'Avenir
program ("Investment for the Future") »

~ iii ~

~ iv ~
Abstract
The genesis of industrially used MoS2 based catalysts involves a crucial activation step
where the sulfo-reduction of a Mo-oxide precursor occurs on the 𝛾−alumina support.
However, the complex mechanisms and various trisulfides or oxysulfides intermediates
are still poorly rationalized at the molecular scale. This thesis investigates key
mechanisms and intermediates involved in the transformation of 𝛾−alumina supported
Mo-oxide oligomers into Mo-sulfided ones by means of state-of-the-art density functional
theory (DFT) simulation.
In the first part, we determine the sulfidation mechanisms and free energy profiles of the
transformation of (100) 𝛾−alumina supported Mo3O9 oligomers (cyclic and chain
conformers) into Mo3S9. We unveil the activation energies for various O/S exchanges
under H2S as a function of O sites of Mo3OxSy intermediates. The structural and
spectroscopic features of these intermediates are compared to available experimental
data. We quantify the reduction paths of Mo3O3S6 oxysulfides and Mo3S9 trisulfides
oligomers into Mo3S6 disulfides under H2. We analyze the effects of the cluster’s nuclearity
as well as reconstruction.
In the second part, we focus on the non-supported MoS3 intermediate involved in the
activation process. We simulate the energetic, structural, and spectroscopic features of
0D-, 1D- and 2D-MoS3 polymorphs and revisit the interpretation of their IR spectrum. The
growth energy evolution and the computed IR spectra suggest the coexistence of various
polymorphs (chain or triangular) as a function of their size. Molecular dynamics reveals
how small triangular oligomers reconstruct into MoS3 patches resembling embryos of the
2D 1T’-MoS2 phase. We propose plausible transformation paths from one polymorph to
another. We finally discuss the possible role of the support on the stabilization of chain
and triangular conformers.
This thesis provides an atomic-scale understanding of the Mo sulfides activation crucial
for optimizing the resulting catalytic properties.

~ v ~
~ vi ~
Re sume
La genèse des catalyseurs industriels de type MoS2 implique une étape d’activation
cruciale durant laquelle la sulfo-réduction d’un précurseur Mo-oxide intervient sur le
support 𝛾−alumine. Cependant, les mécanismes complexes et multiples intermédiaires
(trisulfures et oxysulfures) demeurent encore mal compris à l’échelle moléculaire. Cette
thèse examine les mécanismes-clés et les intermédiaires impliqués dans la
transformation d’oligomères Mo-oxides supportés sur 𝛾−alumines en oligomères Mo-
sulfurés en employant la simulation quantique dans le formalisme de la théorie de la
fonctionnelle de la densité (DFT).
Dans la première partie, nous déterminons les mécanismes de sulfuration et les profils
d’énergie libre du processus de transformation des oligomères Mo3O9 (cycliques ou
chaines) supportés sur la surface (100) d’alumine−𝛾 en Mo3S9. Nous quantifions les
énergies d’activation pour divers échanges O/S en présence d’H2S pour différents sites O
des intermédiaires Mo3OxSy. Les caractéristiques structurales et spectroscopiques de ces
intermédiaires sont comparées aux données expérimentales disponibles. Nous
quantifions les voies réactionnelles de réduction des oligomères oxysulfures Mo3O3S6 et
trisulfures Mo3S9 en disulfures Mo3S6 en présence d’H2. Nous analysons les effets de la
nucléarité des oligomères et de leur reconstruction.
Dans la seconde partie, nous nous focalisons sur les intermédiaires MoS3 impliqués dans
le processus d’activation. Nous simulons les propriétés énergétiques, structurales et
spectroscopiques des polymorphes of 0D-, 1D- et 2D-MoS3 et revisitons l’interprétation
de leur spectre infrarouge. L’évolution de la croissance énergétique et des spectres
infrarouges calculés suggère la coexistence de divers polymorphes (de type chaine ou
triangle) en fonction de leur taille. Les dynamiques moléculaires révèlent que de petits
oligomères triangulaires se reconfigurent en feuillets MoS3 semblables à des embryons de
la phase 2D 1T’-MoS2. Nous proposons une hypothèse sur la manière dont ces
polymorphes se transforment. Finalement, nous discutons le possible rôle du support sur
la stabilisation des conformères de type chaine ou triangle.
Cette thèse propose une compréhension à l’échelle atomique de l’activation des sulfides
Mo, cruciale pour l’optimisationdes propriétés catalytiques finales.

~ vii ~

~ viii ~
“We think there is color, we think there is sweet, we think there is bitter, but in reality, there
are atoms and a void.”
- Democritus
“The atoms or elementary particles themselves are not real; they form a world of potentialities
or possibilities rather than one of things or facts”
- Werner Heisenberg
"The fundamental laws necessary for the mathematical treatment of a large part of physics
and the whole of chemistry are thus completely known, and the difficulty lies only in the fact
that application of these laws leads to equations that are too complex to be solved."
- Paul Dirac
“One is almost tempted to say... at last I can almost see a bond. But that will never be, for a
bond does not really exist at all: it is a most convenient fiction which, as we have seen, is
convenient both to experimental and theoretical chemists. “
- Charles Alfed Coulson
“Each new insight into how the atoms in their interactions express themselves in structure and
transformations, not only of inanimate matter, but particularly also of the living matter,
provides a thrill.”
- Henry Taube

~ ix ~

~ x ~

~ xi ~
“To my Mom and Dad, who took me to the School…”
ACKNOWLEDGMENTS .................................................................................................................... I
ABSTRACT....................................................................................................................................IV
RESUME ......................................................................................................................................VI
INTRODUCTION ................................................................................................ 1
BIBLIOGRAPHY.................................................................................................. 9
APPLICATIONS OF MOS2/MOS3 BASED NANOMATERIALS ...................................................................10 2.1.1. New energy applications ...............................................................................................10 2.1.2. Hydrodesulfurization .....................................................................................................13 2.1.3. Catalyst preparation and activation .............................................................................16 2.1.4. The challenging MoS3 Phase .........................................................................................24 DFT STUDIES OF ALUMINA SUPPORT AND ALUMINA SUPPORTED MO-OXIDES AND MO-SULFIDES ...............29
2.2.5. Alumina surfaces ...........................................................................................................30 2.2.6. Description of Mo-oxide on the support........................................................................34 2.2.7. Sulfidation of Mo-oxide .................................................................................................35 2.2.8. Alumina supported MoS2 ...............................................................................................36 CONCLUSIONS AND STRATEGY OF THE THESIS ....................................................................................38
METHODS AND COMPUTATIONAL DETAILS ...................................................... 43
DENSITY FUNCTIONAL THEORY ......................................................................................................43 3.1.1. Hohenberg and Kohn theorems ....................................................................................45 3.1.2. Kohn-Sham DFT .............................................................................................................46 3.1.3. Exchange-Correlation functional ...................................................................................49 3.1.4. Dispersion Corrections ...................................................................................................51 3.1.5. Solving KS-equations self-consistently ..........................................................................52 3.1.6. Plane-wave basis set .....................................................................................................53 3.1.7. Projector augmented wave method ..............................................................................54 3.1.8. Ab initio molecular dynamics (AIMD) ............................................................................56 SIMULATION OF SPECTROSCOPIC PROPERTIES ....................................................................................57
3.2.9. Vibrational analysis within harmonic approximations..................................................57 3.2.10. Core level shift and binding energies ............................................................................61 APPROACH TO FIND MINIMUM ENERGY PATHS AND SADDLE POINTS ......................................................63
3.3.11. The NEB method ............................................................................................................65 3.3.12. CI-NEB method ..............................................................................................................66 3.3.13. The Dimer method .........................................................................................................67 3.3.14. Intrinsic Reaction coordinate (IRC) ................................................................................69 CONCLUSIONS ............................................................................................................................70
GENESIS OF MOS2 FROM MO-OXIDE PRECURSORS ON 𝜸-ALUMINA .................. 73
INTRODUCTION ...........................................................................................................................73 METHODS ..................................................................................................................................77 RESULTS ....................................................................................................................................81
4.3.1. Oxides precursors interaction with 𝜸-alumina ..............................................................81 4.3.2. Oxygen/Sulfur exchange Mo-oxides on alumina ..........................................................85 4.3.3. Mechanism and kinetics of O/S exchange from MoO3 to MoS3 (step I and II) ..............91 4.3.4. Transformation of Mo3S9 trisulfides into Mo3S6 disulfides (step IV) .............................99 4.3.5. Reduction of oxysulfides to disulfides by H2 (step III) ..................................................102 DISCUSSION .............................................................................................................................105
4.4.6. Sulfidation from Mo3O9 to Mo3O3S6 (step I) ................................................................105 4.4.7. Competition between sulfidation from Mo3O3S6 to Mo3S9 (step II) and reduction from Mo3O3S6 to Mo3S6 (step III) ............................................................................................................107 4.4.8. Chain to triangular cluster reconstruction ..................................................................108 4.4.9. Mobility and growth of intermediates ........................................................................111 4.4.10. Size effects ...................................................................................................................112 CONCLUSIONS ..........................................................................................................................114
AMORPHOUS MOS3: SIZE-DEPENDENT STRUCTURAL PROPERTIES, SPECTROSCOPIC, AND ENERGETIC ANALYSIS .............................................................................. 117
INTRODUCTION .........................................................................................................................117 METHODS ................................................................................................................................119 STRUCTURE ANALYSIS .................................................................................................................121
5.3.1. 0D- and 1D-model of triangular oligomers (TO) .........................................................121 5.3.2. 0D and 1D-Chains: Open-ring (OR), wave-like (WL), linear (L), and helical (HL). ........124 5.3.3. MoS3 patches with 1T’-MoS2 like structure .................................................................127 5.3.4. Energetics analysis ......................................................................................................132 SPECTROSCOPIC ANALYSIS ...........................................................................................................135
5.4.5. Comparison of the simulation of [Mo3S13]0, [Mo3S13]2- and [Mo3S9]0 clusters with the reference [Mo3S13
2-] compounds ...................................................................................................135 5.4.6. IR spectrum of TO polymorphs ....................................................................................137 5.4.7. IR spectrum of chain-like (OR, R, and WL) polymorphs ...............................................139 DISCUSSION .............................................................................................................................141 CONCLUSIONS ..........................................................................................................................145
CONCLUSIONS AND PERSPECTIVES ................................................................ 149
SULFO-REDUCTION OF MO-OXIDES ON SUPPORTED ALUMINA ............................................................149 MOS3 PHASE: TRIANGULAR, CHAIN, RING, OR HYBRID?.....................................................................152 IMPACT OF THE SUPPORT ............................................................................................................153 OPEN QUESTIONS AND PERSPECTIVES ............................................................................................153
REFERENCES ............................................................................................................................. 158
APPENDIX A - THERMOCHEMISTRY ............................................................................................ 172
APPENDIX B - COMPLEMENTARY ANALYSIS ON MO-OXIDES ....................................................... 175
B1. GAS-PHASE ANALYSIS.................................................................................................................175 B1.1 Geometry analysis ...........................................................................................................175 B1.2 Sulfidation in the gas phase .............................................................................................175 B1.3 Thermodynamics of gas-phase sulfidation ......................................................................176
B2. ALUMINA SUPPORTED MO3O9 AND ITS SULFIDATION .......................................................................176 B2.1 Vacancy creation on supported Mo3O9............................................................................176 B2.2 Cyclic-Mo3O9 sulfidation ..................................................................................................177 B2.3 Chain1-Mo3O9 sulfidation through path-1.......................................................................177 B2.4 Chain-1-Mo3O9 through path-2 .......................................................................................178 B2.5 Most relevant-Mo3O9 to Mo3S9 sulfidation path .............................................................178 B2.6 Chain-2-Mo3O9 sulfidation ...............................................................................................178
B3. THERMODYNAMICS OF SULFIDATION OF SUPPORTED MO3O9.............................................................178 B4. KINETICS OF SULFIDATION OF SUPPORTED MO3O9 ...........................................................................180
B4.1 Electronic energy plot for various O/S exchange of supported chain-1-Mo3O9 ..............180 B4.2 Electronic energy plot for O/S exchange supported cyclic Mo3O9 ...................................181 B4.3 Energetic span analysis for the kinetics of cyclic-Mo3O9 O/S exchange ..........................184 B4.4 Electronic energy plots for removing oxygen from Mo3O3S6(step-III) .............................184 B4.5 Electronic energy plots for removing sulfur from Mo3S9 (step-IV) ...................................185
B5. O/S EXCHANGE ON SUPPORTED MO1O3 (MONOMER) .....................................................................186 B5.1 Terminal oxygen site ........................................................................................................186 B5.2 Interfacial oxygen site ......................................................................................................187
B6. FREQUENCY ANALYSIS ................................................................................................................188
APPENDIX C - COMPLEMENTARY ANALYSIS ON VARIOUS ASPECTS OF MOS3 POLYMORPHS ......... 192
C1. STRUCTURAL ANALYSIS ...............................................................................................................192 C2. SPECTROSCOPIC ANALYSIS ...........................................................................................................197
APPENDIX D - HYDRODESULFURIZATION OF DIBENZOTHIOPHENE ON COMOS EDGE ................... 203

Introduction
Sahu, A. 1
Introduction
Due to global warming and climate change issues, there is an urgent need to find
alternative ways to make energy cleaner and efficient than ever before. The effects are
alarming and would be disastrous for the forthcoming generation.
There are several reasons for that, the increasing concentration of greenhouse gases
being one of them. Fossil fuels cannot be entirely removed from prospective scenarios
because the perpetual population growth causes an immense increase in world energy
demand and inherent intensive energy consumption by developed countries. Moreover,
as the living standard in developing countries continues to improve, the rise in energy
consumption is intensifying. The increase in energy consumption gives an additional
burden to satisfy the growing energy demand by other energy sources and reduce fossil
fuel dependency.
The most significant contributors to this growing energy demand are the developing
countries. For the most part, they are still dependent on coal, even though the renewable
energy sector in China, and to some extent in India as well, is growing faster than ever
before. The energy balance needs to be maintained promptly [1].
This stability can be maintained by including more renewable and green energy
contributions to fulfill the world's energy demand while maintaining the environmental
equilibrium. On the one hand, to satisfy the world's growing energy demand, we need
new and efficient energy sources. On the other hand, taking care of the ecological balance
is the most crucial challenge humanity has ever faced. Immediate actions need to be taken
in this direction; otherwise, the alarming rate of increasing global temperature and the
abrupt change in climate conditions can have a detrimental effect on humanity's survival.
Two possible strategies exist to address this issue. The first one is to find out renewable
energy resources and making them more efficient, economical, and user-friendly. The
second one is to reduce the carbon footprints in existing energy resources, including the
Introduction
Sahu, A. 2
use of fossil fuels in a better and more efficient way. However, the critical challenges in
the field of renewables are energy storage and efficiency.
Many attempts have been made to improve the energy efficiency of chemical processes
thanks to a wide range of catalysts and energy storage capacity by innovative storage
materials. Reducing the carbon footprints in exiting technology, energy consumption, and
production would require global cooperation among all power sectors, from the producer
to the consumer. Several promising efforts are being made to counter the issues
mentioned above.
Despite the relatively rapid change in the power sector, the world's power-related CO2
emissions are rising uninterruptedly because of already locked-in emissions in existing
systems. Thus, the extensive lifespan and efficiency of these existing bodies cause more
trouble to change them. For example, a coal-fired power plant's average life span is forty
years, and it is accountable for 30% of global energy-related CO2 emissions today
(international agency report) [2]. Therefore, there is a desperate need to improve the
existing systems. The world's energy demand was increased by about 2.9% in 2018; it is
the fastest growth since 2010 and is driven mainly by China and India [3]. Despite a
historical Covid-19 crisis resulting in a drop in energy demand by 2% in 2020, these
observations remain constant for 2021 [4]. More than forty countries have agreed to
reach NetZero, a new initiative of the EU climate foundation, by 2050 [5]. Meaning that
these countries will try to achieve an ambitious net balance between total CO2 emissions
produced and emissions captured from the atmosphere.
Though many assuring efforts are being made, we cannot get away from oil. Oil remains
a significant contributor to world energy mixture, and it contributes to world energy
consumption by about 35%. In 2018, the world's oil production was 98 million barrels
per day [2], which approximately consumes about 2.3x10⁵ tons of catalyst per year. The
use of such a vast amount of oil requires stringent constraints from higher administrative
authorities on oil specifications in order to reduce the adverse effects of burning oil. These
constraints have several scales to remove harmful carcinogenic elements from crude oil.
Usually, the limitations are based on concentrations of CO, NOx, SOx, particulates, and
other impurities. According to European Union's standards, the sulfur content of diesel
Introduction
Sahu, A. 3
should not exceed more than ten ppm [6]. The environmental regulations are getting
incrementally stringent due to the alarming rate of climate change. It makes the task of
refining the crude oil more challenging. Oil refineries used the hydrodesulfurization
(HDS) process to refine the crude oil to reach such specifications.
The residual content of heteroelements such as S and N, cetane number, smoke point, and
density are the various specifications that should be respected as directed by authorities.
Different chemical conversions are used to meet these specifications. Hydrotreatment
(HDT) is performed in order to meet some of them. Therefore, HDT is an essential process
in petroleum refining. In particular, it is a process to remove heteroatom species,
carcinogenic metals to make cleaner fuels. The catalysts used in the HDS/HDT process are
usually heterogeneous catalysts, commonly made of bimetallic sulfided nanomaterials
such as NiWS, CoMoS, or NiMoS. The majority of them are supported on alumina.
Several parameters need to be considered at various catalyst life cycle stages to generate
an optimal catalytic active phase. Some of them are the effect of support, the interaction
of active phase precursors with support during the impregnation steps, the impact of the
sulfo-reductive conditions during activation and reaction, and the active phase dispersion
[7]. Conventionally, Mo-content to catalyst reaction is about 10% by weight, and Mo to
promoter ratio is about 0.3 (Ni-Co/Mo). The reactions occur at the interface of MoS2-
nanoparticles and the fluid phase [7].
According to Sabatier's principle [8], an efficient and optimal catalyst should
appropriately balance adsorption and desorption steps. High barriers in adsorption steps
and very low barriers in the desorption step are generally considered inadequate.
Catalyst interactions with reaction components should indeed be optimal. A weak
interaction would not give enough time to allow the chemical substances to react, and a
strong interaction would poison the catalyst's reactivity [9].
In heterogeneous catalysis, the Sabatier principle implies that when the catalytic activity
of the various elements is plotted across the periodic table for the desired reaction, it gives
rise to a "volcano plot." The peak of this volcano curve shows the most reactive catalyst.
Introduction
Sahu, A. 4
Both the left and the right-hand side elements across the peak are not optimal catalysts
due to too strong or weak intermediates' adsorption.
The most commonly best-known sulfided bimetallic catalysts are CoMoS, NiMoS, NiWS,
and trimetallic CoMoWS, NiMoWS. These are the catalysts that come very close to the top
of the volcano curves [10]. The catalytic activities of combining two elements Co/Ni with
Mo/W, were higher than those of catalysts taken individually. This phenomenon is known
as the synergetic effect when combining two components shows higher efficiency than
the individual sum of its constituents.
Much research has been undertaken to understand this effect on Co(Ni)MoS systems.
Certain complexities are involved in this process, starting from the preparation, the
genesis of the active phase, the interaction of the precursors with support, the role of this
support, the generated intermediate species, and the active sites, etc.
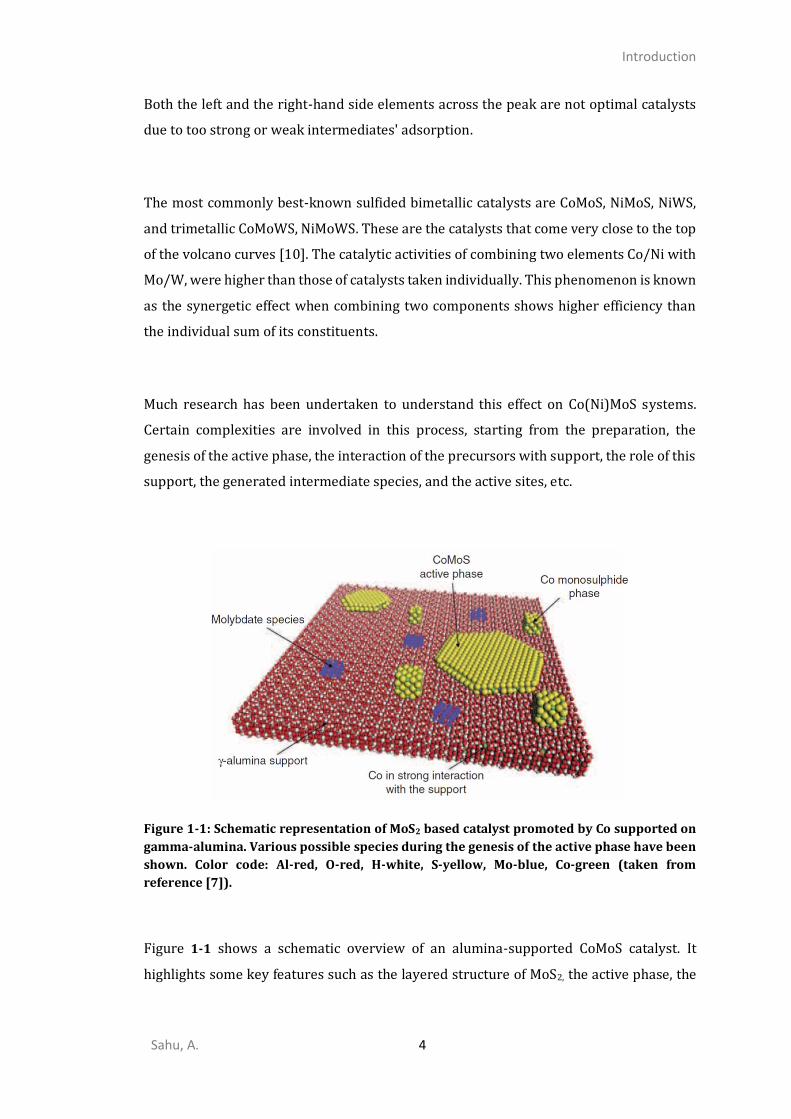
Figure 1-1: Schematic representation of MoS2 based catalyst promoted by Co supported on
gamma-alumina. Various possible species during the genesis of the active phase have been
shown. Color code: Al-red, O-red, H-white, S-yellow, Mo-blue, Co-green (taken from
reference [7]).
Figure 1-1 shows a schematic overview of an alumina-supported CoMoS catalyst. It
highlights some key features such as the layered structure of MoS2, the active phase, the
Introduction
Sahu, A. 5
promoter Co, some of the remaining Mo-oxide species on alumina, and the strongly
interacted single atom Co with alumina.
The nature of the active sites, the chemical role and the allocation of Co/Ni promoters, the
exact morphology of the active phase, and reaction conditions are the main intricacies
faced. They result directly from the various steps involved in the genesis of the supported
active phase.
At the industrial and laboratory scales, one of the most widely used protocols of the
preparation of heterogeneous supported catalysts involves three main steps: the
impregnation in a water solvent firstly, the drying/calcination secondly and the activation
(reduction, sulfidation) thirdly[7, 11, 12]. Among these, the activation step is still highly
challenging because it is the last step before the catalyst is placed in reaction conditions.
Providing an atomic-scale description and rationalization of the precursor's evolution
from its dried phase to the sulfided active phase on support would allow more accurate
control of this crucial step. This is particularly true for HDT catalysts, where it is
empirically invoked that the metal-support interactions between an −alumina support
and various molybdenum, tungsten, cobalt, or nickel oxide precursors play a crucial role
in driving the formations of mixed oxide phases (Co(Ni)Al2O4, or AlMo6)[13] which might
be detrimental to the shape of the wished Co(Ni)Mo(W)S phase during activation.
The support itself has a substantial impact on the sulfided active phase's morphology, a
dispersion that directly affects the activity of the catalyst. At a macroscopic scale, the
mechanical strength of support will decide on the shape and size of the catalyst's pellets.
At a mesoscopic scale, the porosity of the catalyst affects the diffusion of oxide precursors
during the impregnation of the active phase and the diffusion of the reactants. At an
atomistic scale, the sites and acid-base properties of the surface sites of the support
influence the anchoring (nucleation) and growth of the active phase.
During the impregnation process, the Molybdenum oxidic precursor disperses on the
alumina support. After drying or calcination, these highly distributed Mo-oxide species
must undergo a sulfidation process to obtain the active phase. The most commonly used
Introduction
Sahu, A. 6
sources for sulfidation are H2S (and hydrocarbon feedstock in industrial conditions) at
~350°C and H2, providing a reducing environment either in gas-phase or liquid phase
conditions.
Regarding the sulforeduction of molybdenum oxide precursor, numerous experimental
analyses (XPS, RAMAN, EXAFS, and TPS) described in Chapter 2 have been used in order
to understand the activation steps better and revealed two main intricate pathways
involving Mo-oxysulfide (MoOxSy) intermediates and/or MoS3 intermediate before the
formation of the targeted MoS2 phase. Thus, better control of the genesis pathways
leading selectively to MoS2 could give rise to the suitable design of the catalyst.
These pathways may depend on various preparation conditions such as the hydration
state of the oxide precursor, sulfo-reductive conditions such as temperature, pressure, or
even the presence of organic/inorganic additives. However, the precise nature of oxide
species, the propensity of oxide species towards sulfidation, the role of various anchoring
sites of alumina, the detailed mechanistic pathway, and the intermediates involved in the
activation process remains challenging to elucidate at a molecular or even atomic scale.
Hence, we will attempt to address the several issues that might arise during the HDS
catalyst's activation step using density functional theory (DFT) calculations.
A systematic DFT study is indeed required to quench the quest for a more accurate
atomistic scale description of the activation step of the genesis of the active phase. There
already exists a reliable atomistic model of -alumina [14, 15] and its interaction with
oxide precursors [16, 17]. However, a theoretical study based on quantum simulation on
the genesis of an active MoS2 phase on -alumina starting from oxide precursors does not
exist, to the best of our knowledge.
This thesis is organized into six chapters (including this general introduction). The second
chapter will provide a concise but relevant literature review on the broad context and the
current understanding of the preparation and activation of the HDS catalyst. It pinpoints
the existing knowledge and the still open questions on Mo-oxide to Mo-sulfide
transformation on support involving the key MoS3-intermediate-phase. The third chapter

Introduction
Sahu, A. 7
will present the Kohn-Sham density functional theory methods used for our theoretical
investigations and the relevant chosen computational parameters. The fourth chapter will
describe the results we have obtained on the Mo-oxides' structural thermodynamic and
kinetics aspects. The oxide interaction with support, lability of O/S exchange, and
transformation from MoS3 phase to disulfide phase will also be underlined. Following the
insights from the previous chapter, the structural investigation of the MoS3 polymorphs
is extensively explored in chapter five. We will also unveil insights into the dynamic
evolution of the amorphous MoS3 towards a more condensed and crystallized structure
by ab-initio molecular dynamics. In particular, this part of the DFT study will shed more
light on the amorphous MoS3 phase, which is substantially essential not only in the
context of HDS but also for emerging new energy applications. In the sixth chapter, we
will propose some perspectives where this work can be continued in the future.

Introduction
Sahu, A. 8
Bibliography
Sahu, A. 9
Bibliography
A considerable amount of research has been done to understand the intrinsic nature of
the catalyst and its activity in hydrodesulfurization (HDS) [7]. However, during the last
decade, MoS2/MoS3 based nanomaterials have renewed massive attention from the
scientific community due to their versatile properties, making them helpful for a variety
of applications as catalysts for different electrochemical and photochemical processes
(hydrogen evolution reaction (HER), CO2 reduction), biomass conversion, or as
photodetectors and biosensors... There are also various new emerging applications of
MoS3, such as materials for energy, a cathode for Li-S or K-S batteries, supercapacitor, or
material for capturing elemental Hg from industrial waste, and bio-sensors. [18–28]
Molybdenum disulfide (MoS2) is a layered material consisting of S-Mo-S layers exhibiting
structural similarities to graphene. However, the bulk MoS2 can occur in four different
crystalline structures: 1H-single layer primitive cells with AA stacking and hexagonal
arrangement, 2H- double-layer primitive cell with ABAB stacking and hexagonal
arrangement, 1T-single layer primitive cell with AA stacking tetragonal arrangement, and
3R triple-layer primitive cell with ABCABC stacking and rhombohedral arrangement
(Figure 2-1)[29, 30]. Nanolayers of MoS2-phase are of the most interest for HDS catalytic
applications and can be seen as a monolayer of finite size (about 3-4 nm), the edges of
which depend on the influence of HDS conditions [31–33]. MoS2 based nanomaterials
exhibit reasonably well-defined structures, unlike amorphous a-MoS3 based
nanomaterials. Structural understanding about the MoS3 phase and types of S species
present in the system remains limited [34–42]. A better knowledge of the local structure
of a-MoS3 would enable us to improve the rationalization of its catalytic properties.
In what follows, we will first highlight the role of MoS2/MoS3 based nanomaterials in new
energy applications. Then we will briefly discuss the HDS process, the nature of the
catalyst in detail, followed by the preparation of this catalyst. We report the current state
of atomistic scale comprehension of various aspects of the HDS process such as nature of
support, precursors and involved intermediates, active phase. Finally, we point out the
existing gaps in our understanding of the activation process of HDS catalyst, justifying our
DFT approach to fill some of these gaps and lay out the plan of the thesis.

Bibliography
Sahu, A. 10
Figure 2-1: Schemes of commonly existing MoS2 polytypes (extracted from ref [29])
Applications of MoS2/MoS3 based nanomaterials
2.1.1. New energy applications
Low cost, excellent chemical stability, and high activity towards hydrogen evolution
reaction (HER) make materials more attractive than noble metals such as Pt. Although,
the first study on molybdenum sulfide for HER was reported by Tributsch and Bennett in
1977[43], the momentum was gained during the past decade. The progress is plodded
due to low activity of bulk-MoS2 and deficiency of available active sites. Due to
technological advancement, MoSx (MoS3 and MoS2) nanostructures (not bulk) have shown
more significant catalytic activity by increasing the number of active sites and reducing
hydrogen interaction energy.
In 2005, Nørskov and co-workers computationally predicted that the edge sites (under
coordinated S atoms) of MoS2 would be catalytically more active than others for HER by
estimating the bond energies and exchange current for HER[44, 45]. Jaramillo’s further
experiments on nanoclusters of MoS2 supported by Au(111)validated this prediction[46].
The electrochemical hydrogen generation has a linear dependence on the edge length of
MoS2 nanoclusters. After identifying the active sites, many investigations have been
performed to improve the intrinsic activity edge sites. The coverages of S atoms on MoS2
edges affect the absorptions of atomic H and the binding energy of H2 significantly,

Bibliography
Sahu, A. 11
depending on the size of MoS2 nano-sheets. The lowest adsorption energy of atomic
hydrogen on crystalline MoS2 was observed on 50% S coverage on edge sites.
Several efforts have been made to improve the catalytic activity of MoS2, which includes
phase engineering, defect generation, and heteroatom doping such as Pt, Ni, Rh, Pd, and
Ag[18, 19, 47–51]. Doping with these heteroatoms can enhance the intrinsic activity of
the catalyst by reducing the binding energy of adsorbed hydrogen. Furthermore, this
results in higher hydrogen coverage and lower value GH[18], where GH is the Gibbs free
energy of adsorbed hydrogen on the catalytic surface which should be zero for the ideal
catalytic surface.
However, MoS2 exhibits various polymorphs with different atomic configurations, such as
2H-MoS2 and 1T-MoS2; these are the most extensively investigated polymorphs. 1T-MoS2
has high atomic conductivity (metallic phase) compared to 2H-MoS2 (semiconductor),
giving rise to better HER activity compared to 2H. But, the metastable nature of the 1T
phase makes the experimental synthesis very complicated. Besides synthesizing the 1T
phase, a number of authors attempted to engineer the 2H phase by doping of heteroatoms
on the basal plane of MoS2. Doping will perturb the nearest neighbor interaction and basal
plane structure, causing the change in adsorption energy of H with the active sites. Pt
doping on MoS2 nano-sheets is also identified as an enhancer for HER activity[26].
Enhancing the diffusion of hydrogen and conductivity of MoS2 has a positive effect on
catalytic activity on HER.
Apart from crystalline MoS2, MoS3 or (2+x) also attracted researchers’ attention to simple
preparation conditions such as electrodeposition, thermal decomposition, and wet
synthesis[52]. Apart from the complicated synthesis process, its complex amorphous
structure makes it more challenging to identify the active sites than in MoS2. The
structural complexity is still in the debate in the literature (Triangular vs. Chain will be
discussed later section). In the recent past, it has been confirmed that S atoms present in
the a-MoSx act as an active catalyst site by the operando Raman spectroscopic technique.
Also, the linear dependence of HER’s turnover frequency (TOFs) on the percentage of
higher energies S species presents in the catalyst by XPS, which indicates S22- as an active
site of the catalyst. The possible structural changes might occur on MoS3 during HER. The
Bibliography
Sahu, A. 12
optimal level of S-vacancy and staining on MoS2 nanosheets also enhance the HER activity
of the catalyst[53].
The pH effect on the HER activity of anodically electrodeposited a-MoSx films was
investigated by Escalera et al. [19]. Enhancement in HER activity was observed in the pH
range of 4-6; however, the activity slows down if pH increases beyond eight, which
confirms slight acidic mediums help to improve activity, but an alkaline environment is
detrimental for catalytic activity. The significant structural changes occur due to cleavage
of S22-br and the reduction of S22-term, and Raman spectra confirm the partial oxidation of
Mo.
Cyclic voltammetry reveals that HER performance increases in the pH range of 3-5 while
the structure is more stable. Furthermore, oxysulfide species are more active in this range
rather than pure sulfide[19]. In addition to that, the cleavage of S22- also creates more
unsaturated S sites, which also enlarge the HER activity[19]. Several investigations [46,
53–56] reveal that unsaturated sulfur atoms on molybdenum sulfide play an essential role
in catalytic activity. These unsaturated S atoms on the edge of MoS2 adsorb the H atom
with a small amount of free energy. Moreover, MoS3 exhibits more catalytic activity than
the bulk-MoS2 in the presence of many defects and unsaturated sites available in a-MoS3,
which gives rise to high hydrogen coverage at low adsorption energy cost [19, 53].
It is observed that MoSx can also be used for CO reduction to CH4 (known as CO
methanation). It was reported that activated H and SH groups are necessary to cleave the
C-O bond and successively hydrogenation process. The presence of more S2- bridging
species would enhance the activity of HER as well as CO methanation [25, 57].
Furthermore, it has been reported that TiO2 supported MoS3 also shows efficient catalytic
activity for photocatalytic water splitting along with CO2 reduction simultaneously [25].
Last but not least, a-MoS3 has some unique advantages due to its amorphous nature
compared to crystalline MoS2[58]. a-MoS3 shows a very high specific capacity and
excellent rate capability due to its unique molecular structure, which leads to improved
Lithium-ion battery performance[20]. MoS3 also outperforms all the existing MoS2 based
electrodes.[21] Explanations of the hypotheses were linked by 1D-chain like the structure
Bibliography
Sahu, A. 13
of MoS3, which are bridged by sulfides and disulfides ligands and has lower diffusion
barrier for Na ions. [28]
2.1.2. Hydrodesulfurization
In today’s scenario, refineries worldwide are struggling to comply with the ever more
stringent conditions to produce cleaner fuels, which is indispensable to reduce pollution
effects. Hydrotreatment (HDT) is an essential industrial catalytic process used in oil
refineries to eliminate heteroatomic species such as nitrogen and sulfur atoms by
hydrodenitrogenation (HDN) and hydrodesulfurization (HDS). More rigorous constraints
by environmental authorities make the refining processes more challenging. In order to
meet these stringent regulations, a large part of research is devoted to improving the
efficiency of the HDT process, either by enhancing the catalytic activity of the existing
catalyst by tweaking or designing or synthesizing a new, more efficient catalyst.
Hydrodesulfurization Process
Hydrodesulfurisation is a catalytic chemical process to remove sulfur from crude oil to
meet the required specifications of reaching less than ten ppm S in gasoline and diesel.
Abundant sulfur-containing fuels not only have an unpleasant odor, but also combustion
products of these oils are irritating, corrosive, and cause the emission of SOx, which plays
an essential role in acid rain. Long-term exposure to combustion products (diesel
particulates) of high sulfur content fuel could result in adverse health issues such as
cardiovascular diseases, cancer, elevated blood pressure, etc. [59]. Sulfur occurs in three
different forms in crude oil: free sulfur (elemental sulfur), hydrogen sulfide (H2S), and
organic sulfur compounds (thiophene and dibenzothiophene derivatives). Organic sulfur
(in particular alkyl-dibenzothiophene) is the most critical to remove sulfur because these
molecular compounds are the most refractory ones[7].
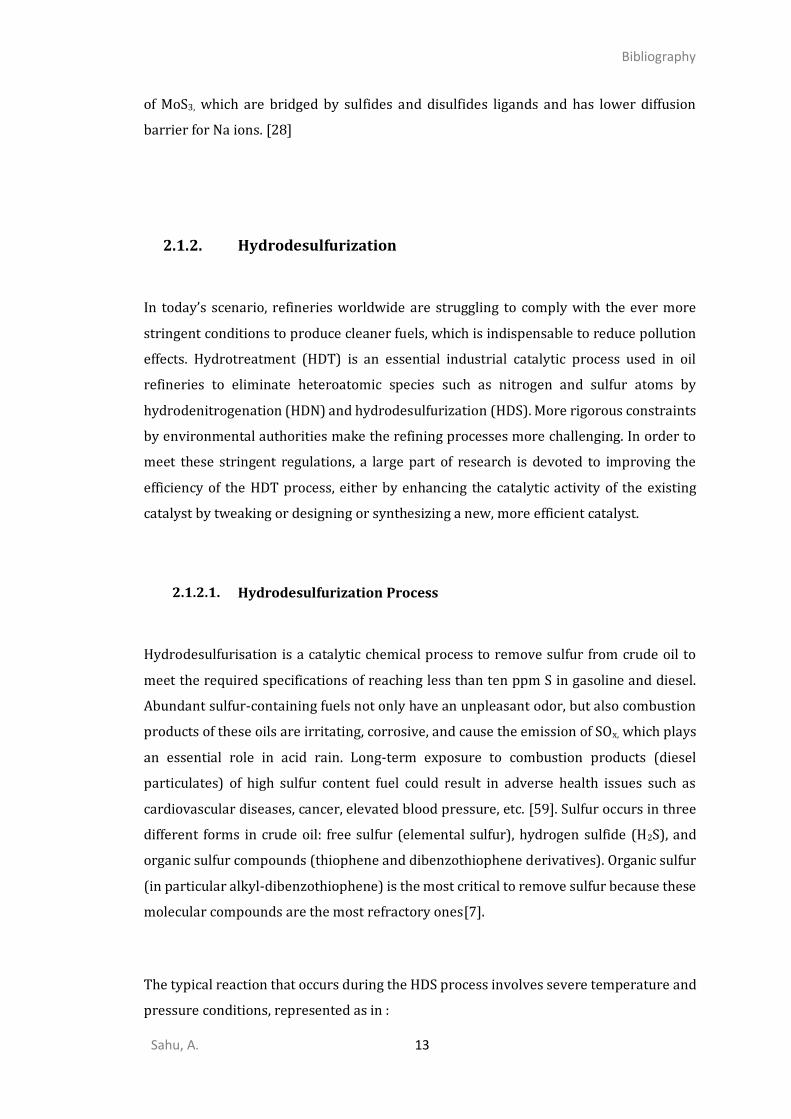
The typical reaction that occurs during the HDS process involves severe temperature and
pressure conditions, represented as in :
Bibliography
Sahu, A. 14
Figure 2-2: HDS of DBT via direct desulfurization pathway and hydrogenating pathway [60].
The feedstock is a complex mixture of hydrocarbons containing various heteroatoms such
as sulfur, nitrogen, metals. These hydrocarbons consist predominantly of 5 or 6
membered aromatic ring structures such as thiophene, dibenzothiophene... Sulfur is an
enormously prolific heteroatom in the feedstock and may vary 0.1% to 5% depending on
the crude origin. Some of the most abundant sulfur-containing organosulfur compounds
are thiols, thiophenes, sulfides, and disulfides.
Many of these organosulfur compounds are very stable and extremely difficult to remove.
The organosulfur compounds are primarily consisting of alkyl-substitutes thiophenes and
(di)benzothiophenes. Several detailed mechanistic pathways have been reported,
including DFT approaches [61–64], but they broadly agree on some fundamental reaction
steps that are present throughout the spectrum: chemisorption of an organosulfur
compound on the active site, dissociative adsorption of hydrogen on the active phase near
the organosulfur compound, and hydrogenolysis of C-S bond [7, 61–64]. Although this is
not the core objective of the present thesis, we also investigated by DFT calculations some
relevant mechanisms for the C-S bond scissions of DBT compounds catalyzed by MoS2
based catalyst [60]. The reader interested in this aspect may refer to Appendix-D.
Nature of the supported catalyst
Conventionally, HDS catalysts are transition metal dichalcogenides, mainly group VI
metal sulfides, supported by thermally stable pours materials with the larger surface area
S
S
SHH
+2H
+4H2 HYD
+H2S
+3/2H2
ab
a
ab
+H2S
Bibliography
Sahu, A. 15
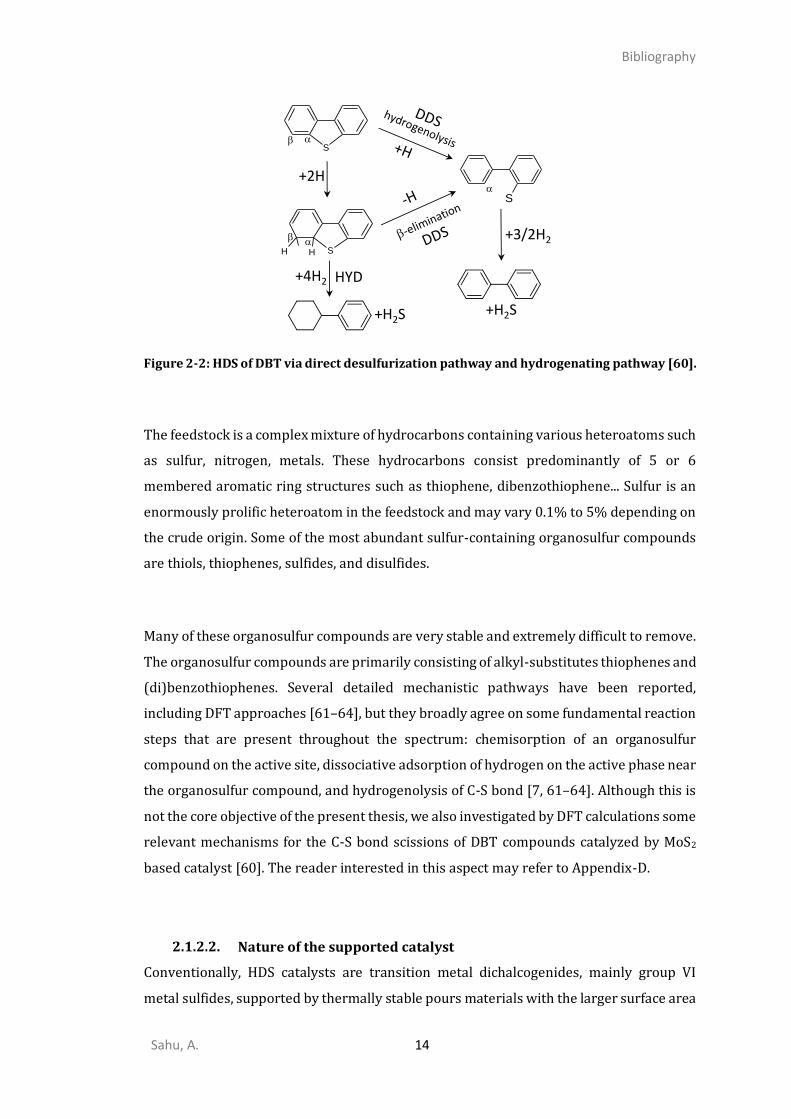
such as alumina[65], TiO2-anatase[66], silica[67], or silica-alumina[66], and promoted by
Co, Ni, [11]. A molecular view of this active phase obtained by simulation is reported in
ref[68] (Figure 2-3).
Figure 2-3: Molecular model of an equilibrium morphology of CoMoS phase with mixed Mo-
Co sites on Mo-edge [68]. Ball color code: blue-Mo, yellow-S, and green-Co.
The active phase of the catalyst is dispersed on supports which are industrially -alumina
or amorphous silica-alumina. Every part of the HDS catalyst has its own fundamental role
to play in the final catalytic activity. The support effect is also one of them, and it greatly
helps for the dispersion MoS2 phase. -alumina and silica-alumina are the most widely
used support for the HDT/HDS process due to their thermal and mechanical stabilities
and tunable porous properties [69, 70].
Among alternative supports, TiO2 supported MoS2 (non-promoted) catalysts are 4 to 5
folds more effective than -alumina even at the same coverage of Mo on the surface[71,
72]. Many authors have tried to solve this puzzle and suggested several effects for the
more significant activity of the catalyst: impact of geometry [73], orientation [74], Ti self-
promotion, and electronic effects [75][76]. TEM images indicate the small size of MoS2
slabs on TiO2 and low stacking compared to other supports[66]. Further DFT study
revealed that the epitaxial interaction of MoS2 nanoparticles with TiO2 surface favors the
dispersion and changes the morphology of the MoS2 nanoparticles[77].
Bibliography
Sahu, A. 16
However, the impact of the promoter is subject to support. For example, cobalt and nickel
promotion enhances the activity of -alumina supported MoS2 catalyst enormously (by
several orders of magnitude), whereas for TiO2 supported MoS2[66], this effect is more
moderate[69, 70]. Several reasons are invoked: the Ni sulfidation before Mo drives the
formation of Ni2S3, causing lower promotion on NiMoS phase[78]. In contrast, the positive
effect of the promotor on the activity of -alumina supported MoS2 is primarily due to less
pre-sulfidation of Ni. Moreover, DFT calculations have also shown that the strong
interaction of MoS2 nano-particles with the TiO2 surfaces through the MoS2 edge may
prevent the addition of Co or Ni at these edges, which negatively impact the formation of
the mixed Co(Ni)MoS phase.
A typical molecular view of alumina support CoMoS on alumina support has been
represented in Figure 1-1. The structure of the active phase is not unique and may vary
according to Co coverage. Apart from the CoMoS phase, other species such as Co9S8 are
also known to exist but remain poorly active. Mostly the CoMoS phase is responsible for
catalytic activity.
However, the MoS2 active phase is not always perfectly sulfided, and it remains a certain
amount (10-20%) of Mo5+ or Mo6+ present in oxysulfides or even oxides which were
identified by XPS [79]. This residual refractory phase may be detrimental for the final HDS
activity, and it may result from the whole preparation/synthesis/activation process of the
catalyst described in what follows.
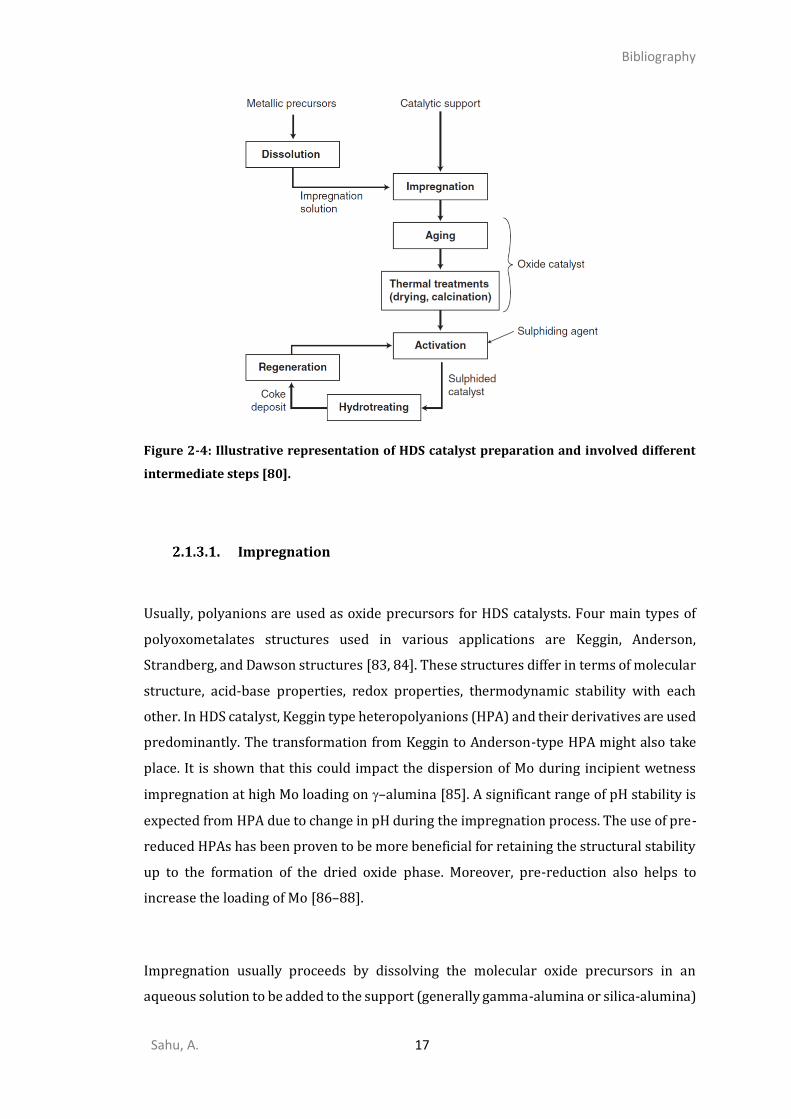
2.1.3. Catalyst preparation and activation
Conventional preparation of the catalyst involves three main steps: impregnation of the
support with oxide precursors in water solvent followed by thermal treatment such as
drying (120-150 C) or calcination if required (300-500 C) is performed (Figure 2-4).
Finally, catalytic activation by a sulfo-reductive process at 350C[80]. Nowadays, organic
and inorganic additives are used to change the chemical properties or increase metal
solubility[81, 82].
Bibliography
Sahu, A. 17
Figure 2-4: Illustrative representation of HDS catalyst preparation and involved different
intermediate steps [80].
Impregnation
Usually, polyanions are used as oxide precursors for HDS catalysts. Four main types of
polyoxometalates structures used in various applications are Keggin, Anderson,
Strandberg, and Dawson structures [83, 84]. These structures differ in terms of molecular
structure, acid-base properties, redox properties, thermodynamic stability with each
other. In HDS catalyst, Keggin type heteropolyanions (HPA) and their derivatives are used
predominantly. The transformation from Keggin to Anderson-type HPA might also take
place. It is shown that this could impact the dispersion of Mo during incipient wetness
impregnation at high Mo loading on –alumina [85]. A significant range of pH stability is
expected from HPA due to change in pH during the impregnation process. The use of pre-
reduced HPAs has been proven to be more beneficial for retaining the structural stability
up to the formation of the dried oxide phase. Moreover, pre-reduction also helps to
increase the loading of Mo [86–88].
Impregnation usually proceeds by dissolving the molecular oxide precursors in an
aqueous solution to be added to the support (generally gamma-alumina or silica-alumina)
Bibliography
Sahu, A. 18
in an acidic environment. Routinely used impregnation methods are dry impregnation
(also known as incipient wetness impregnation) and excess impregnation. In dry
impregnation, the support’s pore volume is filled with active phase precursors solution,
which requires an almost equal volume of impregnation solution as pore volume of the
support. In excess impregnation (equilibrium adsorption), the support is immersed in the
volume of impregnation solution, which requires a large amount of solution-phase than
the support’s pore volume.[7]
The chemical process involved during impregnation
Ammonium heptamolybdate (NH4)6Mo7O24 is the most extensively studied precursor
used in the literature for oxide precursors of HDS catalyst. Earlier studies performed on
the impregnation of ammonium heptamolybdate on –alumina support considered
adsorption only as a well-known interaction phenomenon [89]. However, Mo occurs as
polymeric species at low pH, but in the acidic pH range, it exists monomeric species of
(MoO42-)[90]. Thus, later, more complex phenomena [91, 92] described in what follows
were described during impregnation of ammonium-heptamolybdate. Based on NMR and
IR-RAMAN studies, the formation of heteropolyanion formation was verified [93, 94].
Usually, heptamolybdate (Mo7O246-) anion is stable in an acidic medium with a typical pH
value range is 2-5. The zero-point charge (ZCP) of alumina support is around pH 8-9. If
the pH of the solution increases beyond 5, heptamolybdate tends to depolymerize into
monomeric species according to the following scheme:
2-1
Mo7O246 −
+ 8HO− → 7MoO42−
+ 4H2O
This solution interacts with support, and acid-base reactions take place, which usually
occurs between acid-base sites (hydroxyl group) of support and impregnated solution. As
a consequence of this reaction, the pH value increases until it reaches the Zero Charge
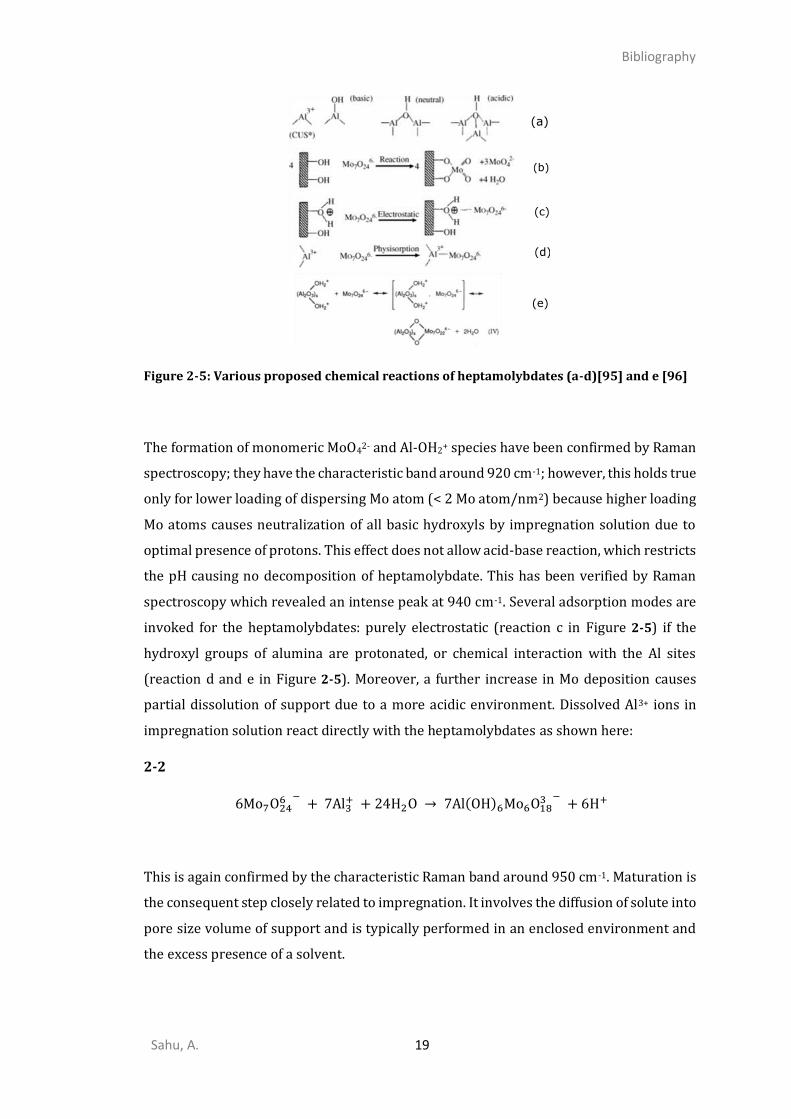
Point (ZCP) of support. According to the literature, several possible interaction modes of
the molybdate species with the surface depend on the Mo concentration (Figure 2-5).
Bibliography
Sahu, A. 19
Figure 2-5: Various proposed chemical reactions of heptamolybdates (a-d)[95] and e [96]
The formation of monomeric MoO42- and Al-OH2+ species have been confirmed by Raman
spectroscopy; they have the characteristic band around 920 cm-1; however, this holds true
only for lower loading of dispersing Mo atom (< 2 Mo atom/nm2) because higher loading
Mo atoms causes neutralization of all basic hydroxyls by impregnation solution due to
optimal presence of protons. This effect does not allow acid-base reaction, which restricts
the pH causing no decomposition of heptamolybdate. This has been verified by Raman
spectroscopy which revealed an intense peak at 940 cm-1. Several adsorption modes are
invoked for the heptamolybdates: purely electrostatic (reaction c in Figure 2-5) if the
hydroxyl groups of alumina are protonated, or chemical interaction with the Al sites
(reaction d and e in Figure 2-5). Moreover, a further increase in Mo deposition causes
partial dissolution of support due to a more acidic environment. Dissolved Al3+ ions in
impregnation solution react directly with the heptamolybdates as shown here:
2-2
6Mo7O246 −
+ 7Al3+ + 24H2O → 7Al(OH)6Mo6O18
3 − + 6H+
This is again confirmed by the characteristic Raman band around 950 cm-1. Maturation is
the consequent step closely related to impregnation. It involves the diffusion of solute into
pore size volume of support and is typically performed in an enclosed environment and
the excess presence of a solvent.

Bibliography
Sahu, A. 20
Thermal Treatment (Drying and Calcination)
Drying is performed to remove the excess solvent from the system; usually, the
temperature is set close to the solvent’s boiling point (~100C for aqueous solution). The
quality of the active phase could be damaged by inadequately applied drying due to
various complexities involved in this process, such as temperature gradient created by
evaporation of solvent and heat transfer by conduction and radiation. Removing the
solution with this process gives potential risk to the inhomogeneous distribution of
molecular species and might start precipitating if it reaches the required saturation limit.
The use of a chelating agent (organic molecules) has been proposed to overcome this
issue[97]. Calcination is further thermal treatment after drying but is not mandatory if
the catalyst is already activated. Calcination requires high thermal treatment (~350C) to
obtain a calcined oxide catalyst. Calcination is crucial because it removes unenviable ions
which might be present after drying. However, If the use of organic additive is involved,
calcination should be avoided due to the potential risk of additive decomposition,
nullifying the effect of additives. It also plays a crucial role in forming a dispersed oxide
phase which significantly differs from the drying step because at high temperature. It
breaks down the molecular clusters and creates a highly dispersed phase with a strong
interaction with the support, which might be detrimental for the activation step and the
resulting catalytic activity.
Sarrazin et al. have performed an FTIR spectroscopy on low Mo surface coverage up to 2
Mo atom-nm-2 after calcination. This study indicates that the “basic,” higher frequencies
3795 and 3770 cm-1, hydroxyl groups present on -alumina are involved in the interaction
with molybdate species, whereas the “neutral” and “acidic” ones with intermediate
frequencies (3730 cm-1 and 3695 cm-1) are not [96]. We will come back to a more detailed
analysis of these alumina surface hydroxyls in section-2.1.4.
Bibliography
Sahu, A. 21
Activation
The activation step is the key and final step towards the genesis of the final HDT catalyst.
It will also be at the core of the present thesis work. Once the catalyst is impregnated,
dried, and calcinated (if required), activation is performed by placing the catalyst in the
sulfo-reductive environment at a high temperature (~350 C). The gas-phase sulfidic
environment typically requires a 15% H2S/H2 mixture; however, dimethyl disulfide
(DMDS) is also used as a precursor for in-situ H2S generation in a liquid phase sulfidation
environment. H2S is used as a sulfur source in laboratory conditions (gas phase
sulfidation); however, DMDS, CS2, or excessive sulfur-containing feedstock (liquid phase
sulfidation) are being used for industrial sulfidation. It has been reported that the
sulfidation process (transition temperature), particularly in the presence of Co or Ni
promoter precursors, might be influenced by the nature of the sulfiding agent (either
liquid or gaseous) [98, 99]. Nevertheless, we will not address this question, and here, we
focus on the possible activation mechanisms invoked so far.
Whether it is a gas phase sulfidation or liquid, the layered MoS2 phase has always been
formed. The large polyoxomolybdate precursors are thus sulfided and transformed into
MoS2-slabs decorated by Ni/Co. The average change in the size of the active phase under
sulfidation conditions has been identified by TEM. The highest number of particles were
observed, around 200 C, based on the geometrical model of Kasztelan [33]. It indicates
early-stage sulfide particles or nucleation before they start to agglomerate and form a
layered structure. However, due to a lack of complete sulfidation, Al-O-Mo anchoring
points would still exist. Some studies suggest that these very anchoring sites would lead
to high active phase dispersion [77, 100, 101]. Moreover, the morphology of the final MoS2
phase (triangle vs. hexagonal) is dependent on the sulfiding condition [32] and on the
strength of the metal-support interaction [80].
This process involves all the intermediates steps required from Molybdenum oxide
species to MoS2 on support. To get a highly dispersed, fully sulfided, and optimally
promoted MoS2 catalyst, an appropriate sulfidation condition is needed. In the literature,
it is proposed from experimental analyses (XPS [79, 102, 103], RAMAN [104], EXAFS [105,
106], TPS [107]) that the activation steps may go through two main intricate pathways:
the first one involves oxysulfide (MoOxSy) intermediates and the second one, a “MoS3”
Bibliography
Sahu, A. 22
intermediate phase. Thus, the better control of the genesis pathway leading selectively to
the MoS2 or MoS3 phases could have some appealing applications in this area.
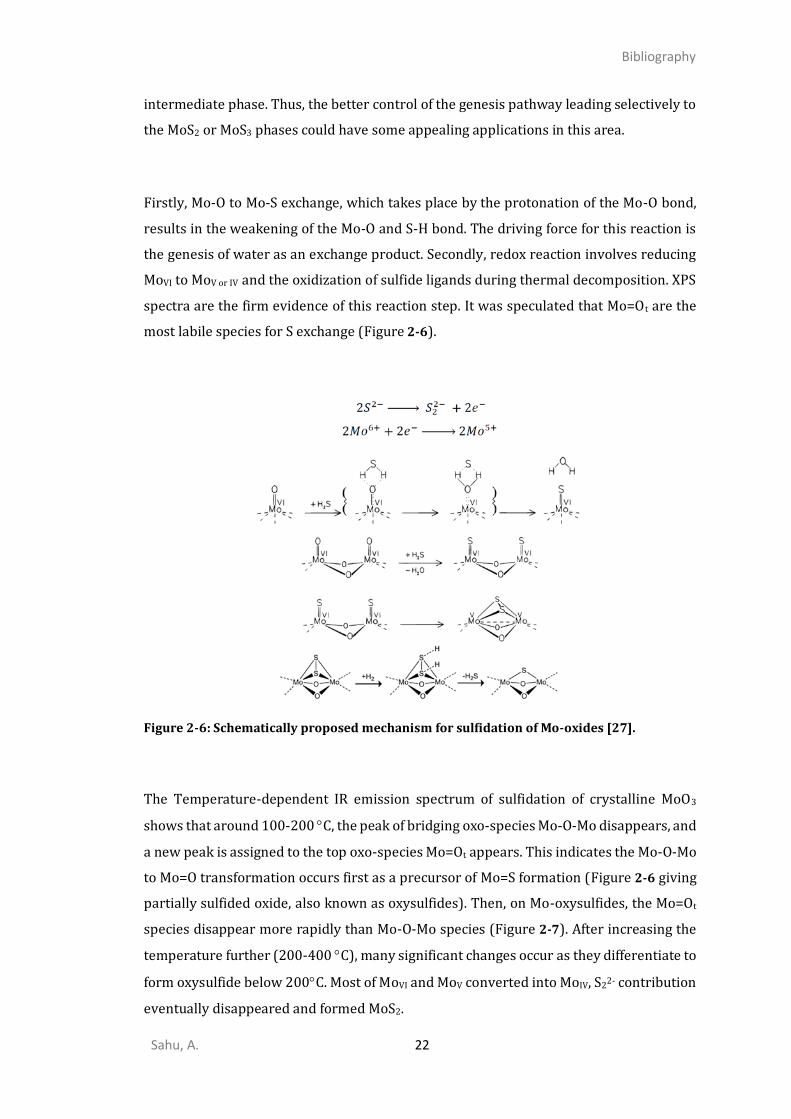
Firstly, Mo-O to Mo-S exchange, which takes place by the protonation of the Mo-O bond,
results in the weakening of the Mo-O and S-H bond. The driving force for this reaction is
the genesis of water as an exchange product. Secondly, redox reaction involves reducing
MoVI to MoV or IV and the oxidization of sulfide ligands during thermal decomposition. XPS
spectra are the firm evidence of this reaction step. It was speculated that Mo=Ot are the
most labile species for S exchange (Figure 2-6).
Figure 2-6: Schematically proposed mechanism for sulfidation of Mo-oxides [27].
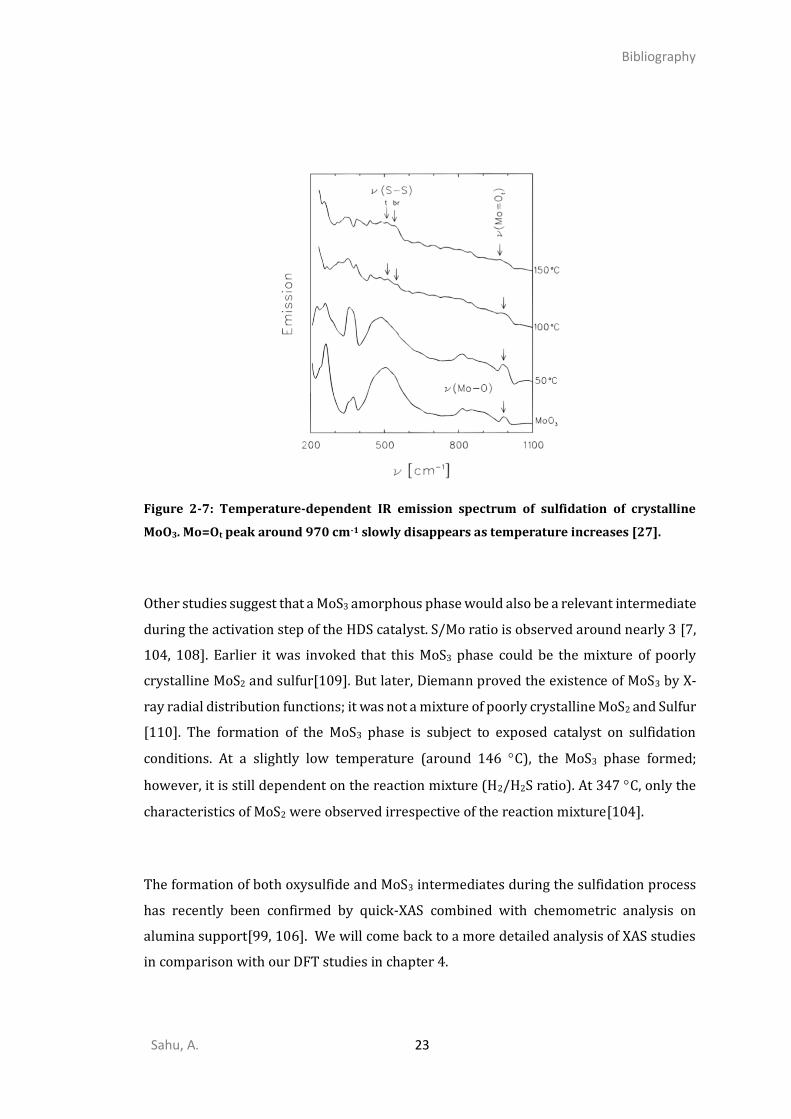
The Temperature-dependent IR emission spectrum of sulfidation of crystalline MoO3
shows that around 100-200 C, the peak of bridging oxo-species Mo-O-Mo disappears, and
a new peak is assigned to the top oxo-species Mo=Ot appears. This indicates the Mo-O-Mo
to Mo=O transformation occurs first as a precursor of Mo=S formation (Figure 2-6 giving
partially sulfided oxide, also known as oxysulfides). Then, on Mo-oxysulfides, the Mo=Ot
species disappear more rapidly than Mo-O-Mo species (Figure 2-7). After increasing the
temperature further (200-400 C), many significant changes occur as they differentiate to
form oxysulfide below 200C. Most of MoVI and MoV converted into MoIV, S22- contribution
eventually disappeared and formed MoS2.
Bibliography
Sahu, A. 23
Figure 2-7: Temperature-dependent IR emission spectrum of sulfidation of crystalline
MoO3. Mo=Ot peak around 970 cm-1 slowly disappears as temperature increases [27].
Other studies suggest that a MoS3 amorphous phase would also be a relevant intermediate
during the activation step of the HDS catalyst. S/Mo ratio is observed around nearly 3 [7,
104, 108]. Earlier it was invoked that this MoS3 phase could be the mixture of poorly
crystalline MoS2 and sulfur[109]. But later, Diemann proved the existence of MoS3 by X-
ray radial distribution functions; it was not a mixture of poorly crystalline MoS2 and Sulfur
[110]. The formation of the MoS3 phase is subject to exposed catalyst on sulfidation
conditions. At a slightly low temperature (around 146 C), the MoS3 phase formed;
however, it is still dependent on the reaction mixture (H2/H2S ratio). At 347 C, only the
characteristics of MoS2 were observed irrespective of the reaction mixture[104].
The formation of both oxysulfide and MoS3 intermediates during the sulfidation process
has recently been confirmed by quick-XAS combined with chemometric analysis on
alumina support[99, 106]. We will come back to a more detailed analysis of XAS studies
in comparison with our DFT studies in chapter 4.
Bibliography
Sahu, A. 24
However, we cannot exclude that these different possible pathways may depend on
various experimental conditions such as hydration state of precursor temperature,
pressure, and sulfur-reductive environment and might also depend on the precursors. It
also can be affected by the presence of organic and inorganic additives [105].
2.1.4. The challenging MoS3 Phase
As discussed before, the MoS3 phase requires to pay more and more attention because of
its versatile properties valuable for various mature and emerging applications. Despite a
very diverse range of use, many challenging questions remain open on the structural and
electronic properties of MoS3 due to its amorphous nature (Figure 2-8 a). Also,
researchers recently tried to use MoS3 as a precursor for HDS catalyst to produce highly
dispersed MoS2 phase on -alumina to improve the resulting activity of the catalyst[111].
Many experimental studies [36, 40, 41, 112–115] and very few theoretical ones [38, 39]
have been undertaken better understand the electronic and physicochemical properties
of the MoS3 phase. However, the atomic scale’s information available in the literature is
still scarce or ambiguous. There is still an ongoing debate on the precise structural
building blocks (triangular or chain) of a-MoS3 depending on the characterization
techniques used.
Many of these exciting properties of a-MoS3 are supposed to originate from its intriguing
amorphous 1D- or 2D-nano-structure, where Mo atoms are interconnected by various
types of sulfur atoms such as S2- and S22- species. These versatile species are suspected to
improve the reactivity towards the different key reactants involved in the targeted
applications: diffusion of cations in battery materials[21, 28], activation of H2 in HER[19,
53, 56, 116, 117], and HDS reaction[27], and specific interaction with Hg.[24]
Nevertheless, despite these wide ranges of potential applications of MoS3, challenging
questions remain open regarding its structural, electronic, and spectroscopic features.
Indeed, the amorphous nature of MoS3 makes it difficult to precisely identify the type and
local structure of these active sulfur sites in order to rationalize their reactivity better.
Bibliography
Sahu, A. 25
Since the early 70’ several experimental studies have been devoted to the a-MoS3
phase.[34, 36, 37, 40–42, 110, 112–115, 118–122] However, the atomistic picture of a-
MoS3 remains uncertain. In particular, there is historical and still vivid debate on the
nature of the structural building block, either Mo3 triangular (Figure 2-8 a)[39, 40, 123]
or Mo chain-like (Figure 2-8 d-e),[34, 41, 42, 120] and the oxidation states of Mo atoms,
which also depends on the characterization techniques used.
Earlier studies based on radial distribution function (RDF), extended X-ray absorption
spectroscopy (EXAFS), magnetic susceptibility, and X-ray photoelectron spectroscopy
(XPS) proposed a chain-like model along with the Mo oxidation state five.[34, 41] EXAFS
data suggested that two types of Mo-Mo bonds would be present in a-MoS3: one short
bond at 2.74 Å and one long at 3.14 Å (Figure 2-8 f).[41, 118] So, every metal atom would
be involved in a Mo-Mo pair generating alternatively short Mo-Mo bond and longer Mo-
Mo bond connecting each dimer. However, many subsequent EXAFS studies identified
only one small Mo-Mo bond at 2.75-2.77 Å.[35, 120–122]
Based on an extensive EXAFS study, Cramer et al. proposed two possible models, a chain-
like and cyclic Mo3 model with two possible oxidation states Mo5+(S2-)2(S22-)1/2 and
Mo4+(S2-)(S22-) respectively, admitting that EXAFS cannot distinguish them.[35] By
combining low angle X-ray diffraction (XRD) and theoretical models, Chien et al.
preferentially suggested a Mo5+ chain-like model with two Mo-Mo bonds: one short at 2.80
Å and a very long one at 3.40 Å.[34] Such a chain like the model was inspired by other
potentially existing crystalline transition metal trisulfides where metal atom connected
with three sulfur atoms along the chain with molecular formula MV(S2-)2(S22-)1/2. However,
these linear structures are challenging to recover nowadays in the crystallographic
database (ICSD or Pearson). For TiS3, such a linear structure has been invoked in the
presence of Strontium [124]. For many MS3 materials (M=Ti, Zr, Hf, Nb, Ta), a 2D-layered
structure was proposed, such as NbS3 [125, 126]. However, for MoS3, such a well-defined
structure has never been resolved.
Bibliography
Sahu, A. 26
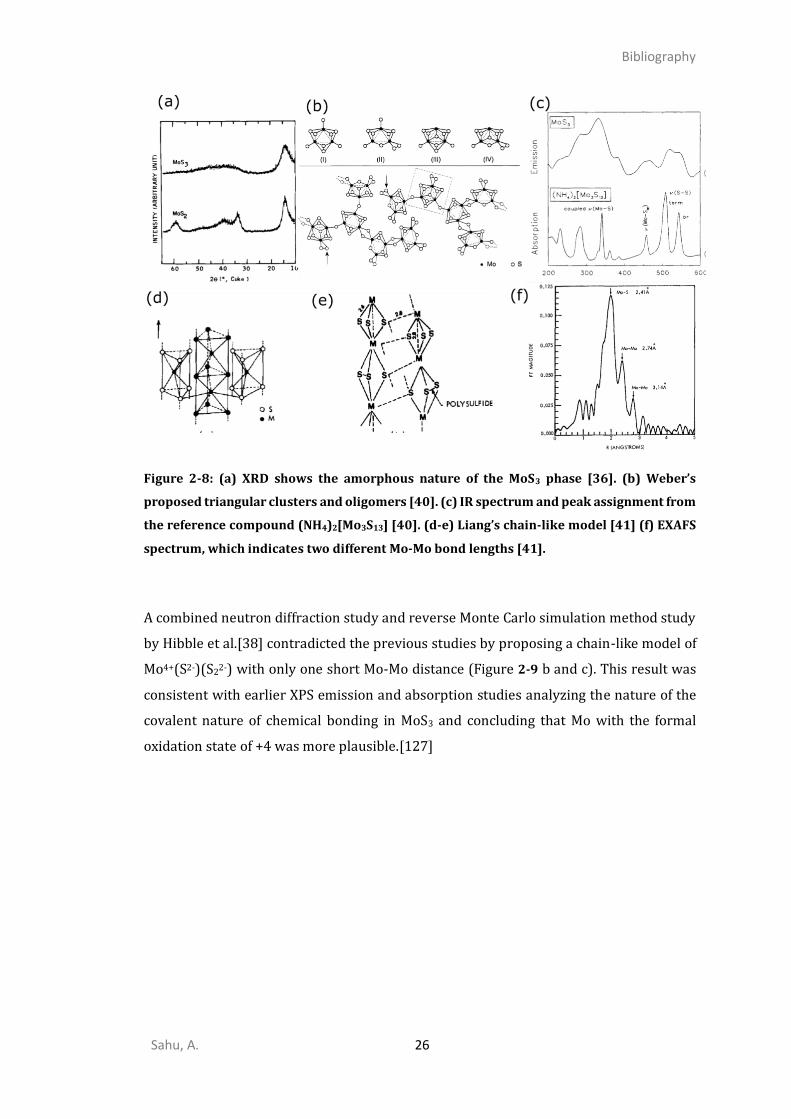
Figure 2-8: (a) XRD shows the amorphous nature of the MoS3 phase [36]. (b) Weber’s
proposed triangular clusters and oligomers [40]. (c) IR spectrum and peak assignment from
the reference compound (NH4)2[Mo3S13] [40]. (d-e) Liang’s chain-like model [41] (f) EXAFS
spectrum, which indicates two different Mo-Mo bond lengths [41].
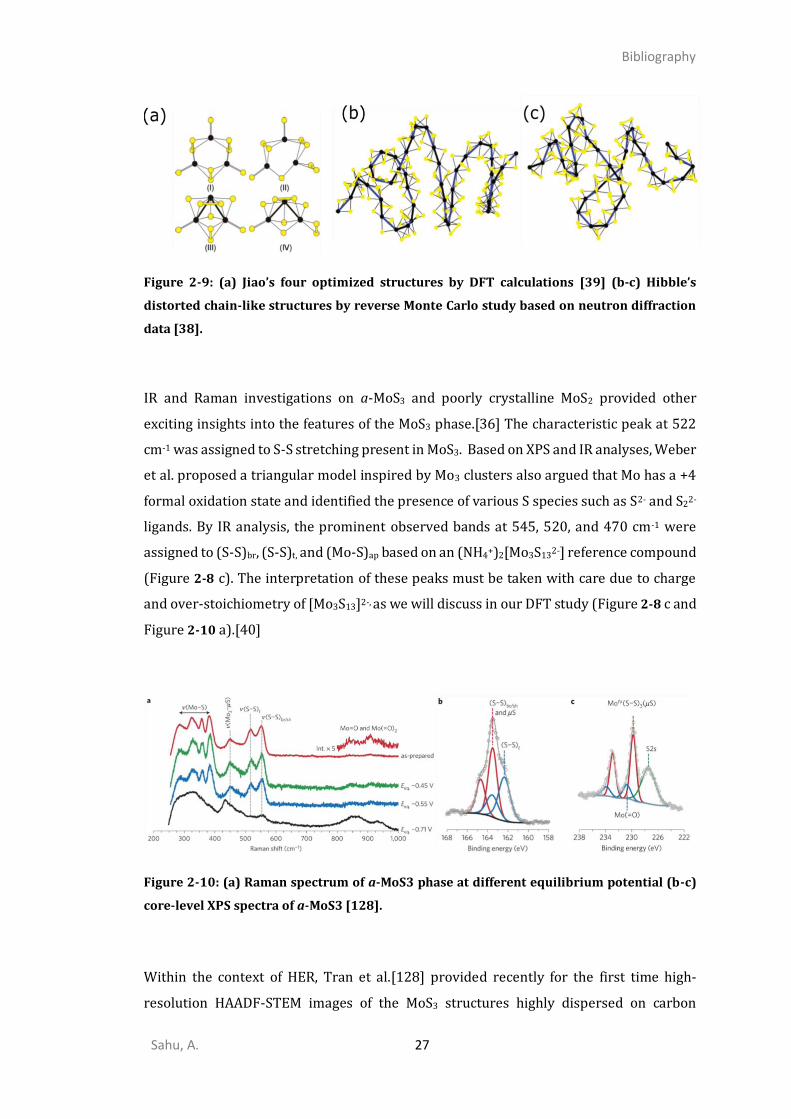
A combined neutron diffraction study and reverse Monte Carlo simulation method study
by Hibble et al.[38] contradicted the previous studies by proposing a chain-like model of
Mo4+(S2-)(S22-) with only one short Mo-Mo distance (Figure 2-9 b and c). This result was
consistent with earlier XPS emission and absorption studies analyzing the nature of the
covalent nature of chemical bonding in MoS3 and concluding that Mo with the formal
oxidation state of +4 was more plausible.[127]
Bibliography
Sahu, A. 27
Figure 2-9: (a) Jiao’s four optimized structures by DFT calculations [39] (b-c) Hibble’s
distorted chain-like structures by reverse Monte Carlo study based on neutron diffraction
data [38].
IR and Raman investigations on a-MoS3 and poorly crystalline MoS2 provided other
exciting insights into the features of the MoS3 phase.[36] The characteristic peak at 522
cm-1 was assigned to S-S stretching present in MoS3. Based on XPS and IR analyses, Weber
et al. proposed a triangular model inspired by Mo3 clusters also argued that Mo has a +4
formal oxidation state and identified the presence of various S species such as S2- and S22-
ligands. By IR analysis, the prominent observed bands at 545, 520, and 470 cm-1 were
assigned to (S-S)br, (S-S)t, and (Mo-S)ap based on an (NH4+)2[Mo3S132-] reference compound
(Figure 2-8 c). The interpretation of these peaks must be taken with care due to charge
and over-stoichiometry of [Mo3S13]2-, as we will discuss in our DFT study (Figure 2-8 c and
Figure 2-10 a).[40]
Figure 2-10: (a) Raman spectrum of a-MoS3 phase at different equilibrium potential (b-c)
core-level XPS spectra of a-MoS3 [128].
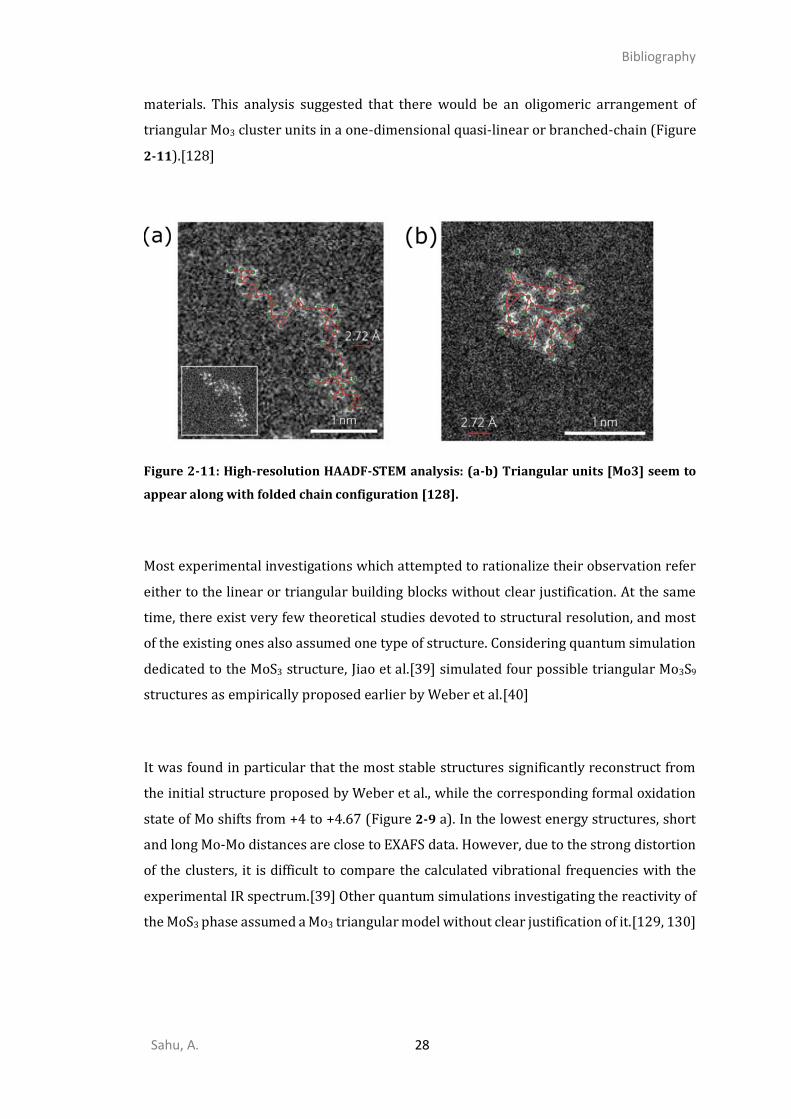
Within the context of HER, Tran et al.[128] provided recently for the first time high-
resolution HAADF-STEM images of the MoS3 structures highly dispersed on carbon
Bibliography
Sahu, A. 28
materials. This analysis suggested that there would be an oligomeric arrangement of
triangular Mo3 cluster units in a one-dimensional quasi-linear or branched-chain (Figure
2-11).[128]
Figure 2-11: High-resolution HAADF-STEM analysis: (a-b) Triangular units [Mo3] seem to
appear along with folded chain configuration [128].
Most experimental investigations which attempted to rationalize their observation refer
either to the linear or triangular building blocks without clear justification. At the same
time, there exist very few theoretical studies devoted to structural resolution, and most
of the existing ones also assumed one type of structure. Considering quantum simulation
dedicated to the MoS3 structure, Jiao et al.[39] simulated four possible triangular Mo3S9
structures as empirically proposed earlier by Weber et al.[40]
It was found in particular that the most stable structures significantly reconstruct from
the initial structure proposed by Weber et al., while the corresponding formal oxidation
state of Mo shifts from +4 to +4.67 (Figure 2-9 a). In the lowest energy structures, short
and long Mo-Mo distances are close to EXAFS data. However, due to the strong distortion
of the clusters, it is difficult to compare the calculated vibrational frequencies with the
experimental IR spectrum.[39] Other quantum simulations investigating the reactivity of
the MoS3 phase assumed a Mo3 triangular model without clear justification of it.[129, 130]
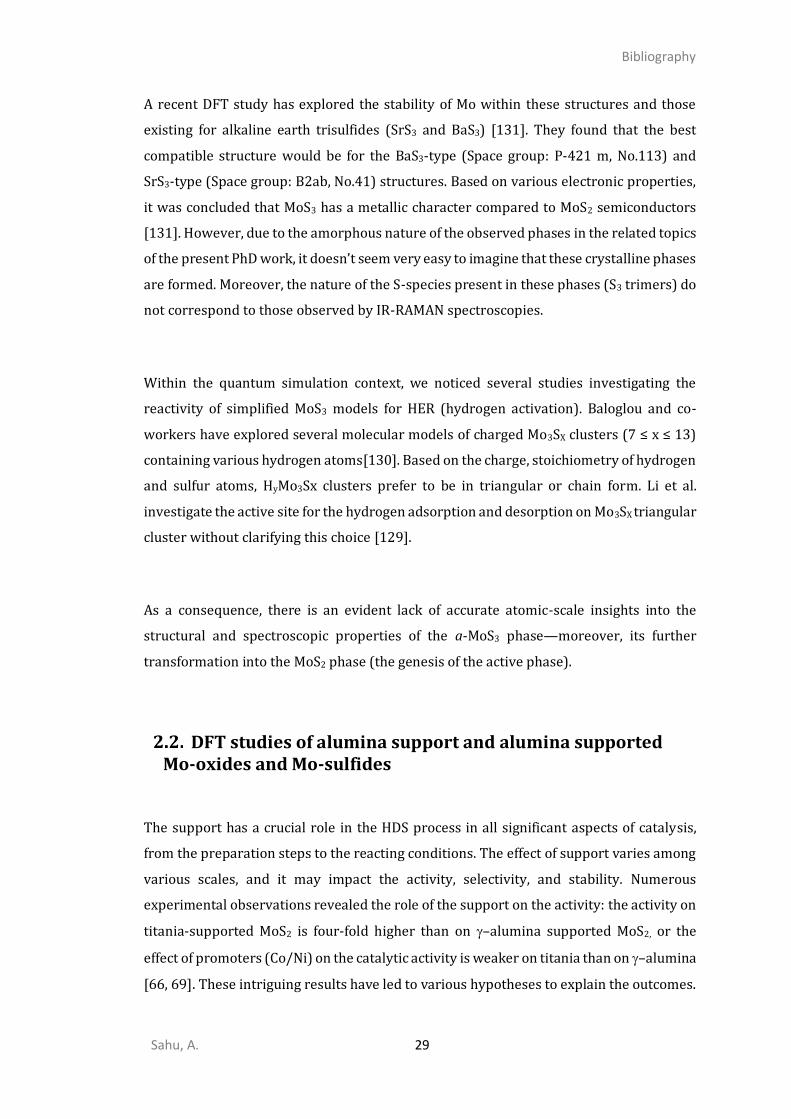
Bibliography
Sahu, A. 29
A recent DFT study has explored the stability of Mo within these structures and those
existing for alkaline earth trisulfides (SrS3 and BaS3) [131]. They found that the best
compatible structure would be for the BaS3-type (Space group: P-421 m, No.113) and
SrS3-type (Space group: B2ab, No.41) structures. Based on various electronic properties,
it was concluded that MoS3 has a metallic character compared to MoS2 semiconductors
[131]. However, due to the amorphous nature of the observed phases in the related topics
of the present PhD work, it doesn’t seem very easy to imagine that these crystalline phases
are formed. Moreover, the nature of the S-species present in these phases (S3 trimers) do
not correspond to those observed by IR-RAMAN spectroscopies.
Within the quantum simulation context, we noticed several studies investigating the
reactivity of simplified MoS3 models for HER (hydrogen activation). Baloglou and co-
workers have explored several molecular models of charged Mo3SX clusters (7 ≤ x ≤ 13)
containing various hydrogen atoms[130]. Based on the charge, stoichiometry of hydrogen
and sulfur atoms, HyMo3Sx clusters prefer to be in triangular or chain form. Li et al.
investigate the active site for the hydrogen adsorption and desorption on Mo3SX triangular
cluster without clarifying this choice [129].
As a consequence, there is an evident lack of accurate atomic-scale insights into the
structural and spectroscopic properties of the a-MoS3 phase—moreover, its further
transformation into the MoS2 phase (the genesis of the active phase).
DFT studies of alumina support and alumina supported Mo-oxides and Mo-sulfides
The support has a crucial role in the HDS process in all significant aspects of catalysis,
from the preparation steps to the reacting conditions. The effect of support varies among
various scales, and it may impact the activity, selectivity, and stability. Numerous
experimental observations revealed the role of the support on the activity: the activity on
titania-supported MoS2 is four-fold higher than on –alumina supported MoS2, or the
effect of promoters (Co/Ni) on the catalytic activity is weaker on titania than on –alumina
[66, 69]. These intriguing results have led to various hypotheses to explain the outcomes.
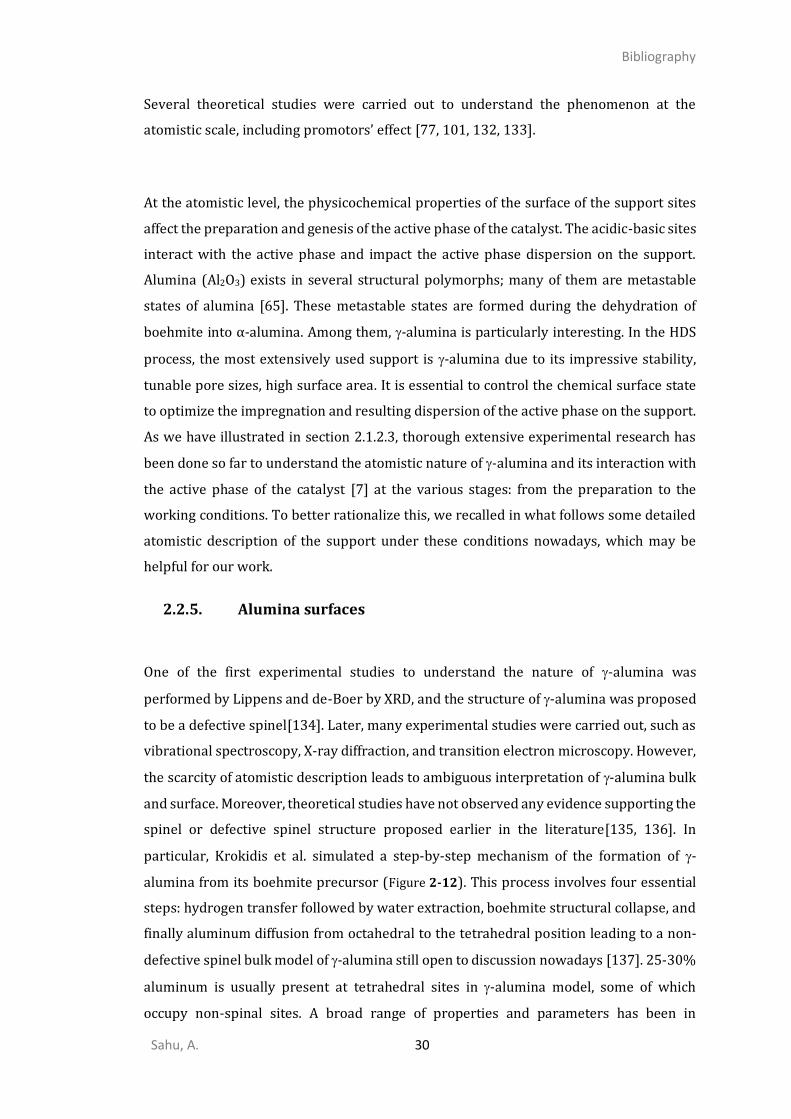
Bibliography
Sahu, A. 30
Several theoretical studies were carried out to understand the phenomenon at the
atomistic scale, including promotors’ effect [77, 101, 132, 133].
At the atomistic level, the physicochemical properties of the surface of the support sites
affect the preparation and genesis of the active phase of the catalyst. The acidic-basic sites
interact with the active phase and impact the active phase dispersion on the support.
Alumina (Al2O3) exists in several structural polymorphs; many of them are metastable
states of alumina [65]. These metastable states are formed during the dehydration of
boehmite into α-alumina. Among them, -alumina is particularly interesting. In the HDS
process, the most extensively used support is -alumina due to its impressive stability,
tunable pore sizes, high surface area. It is essential to control the chemical surface state
to optimize the impregnation and resulting dispersion of the active phase on the support.
As we have illustrated in section 2.1.2.3, thorough extensive experimental research has
been done so far to understand the atomistic nature of -alumina and its interaction with
the active phase of the catalyst [7] at the various stages: from the preparation to the
working conditions. To better rationalize this, we recalled in what follows some detailed
atomistic description of the support under these conditions nowadays, which may be
helpful for our work.
2.2.5. Alumina surfaces
One of the first experimental studies to understand the nature of -alumina was
performed by Lippens and de-Boer by XRD, and the structure of -alumina was proposed
to be a defective spinel[134]. Later, many experimental studies were carried out, such as
vibrational spectroscopy, X-ray diffraction, and transition electron microscopy. However,
the scarcity of atomistic description leads to ambiguous interpretation of -alumina bulk
and surface. Moreover, theoretical studies have not observed any evidence supporting the
spinel or defective spinel structure proposed earlier in the literature[135, 136]. In
particular, Krokidis et al. simulated a step-by-step mechanism of the formation of -
alumina from its boehmite precursor (Figure 2-12). This process involves four essential
steps: hydrogen transfer followed by water extraction, boehmite structural collapse, and
finally aluminum diffusion from octahedral to the tetrahedral position leading to a non-
defective spinel bulk model of -alumina still open to discussion nowadays [137]. 25-30%
aluminum is usually present at tetrahedral sites in -alumina model, some of which
occupy non-spinal sites. A broad range of properties and parameters has been in
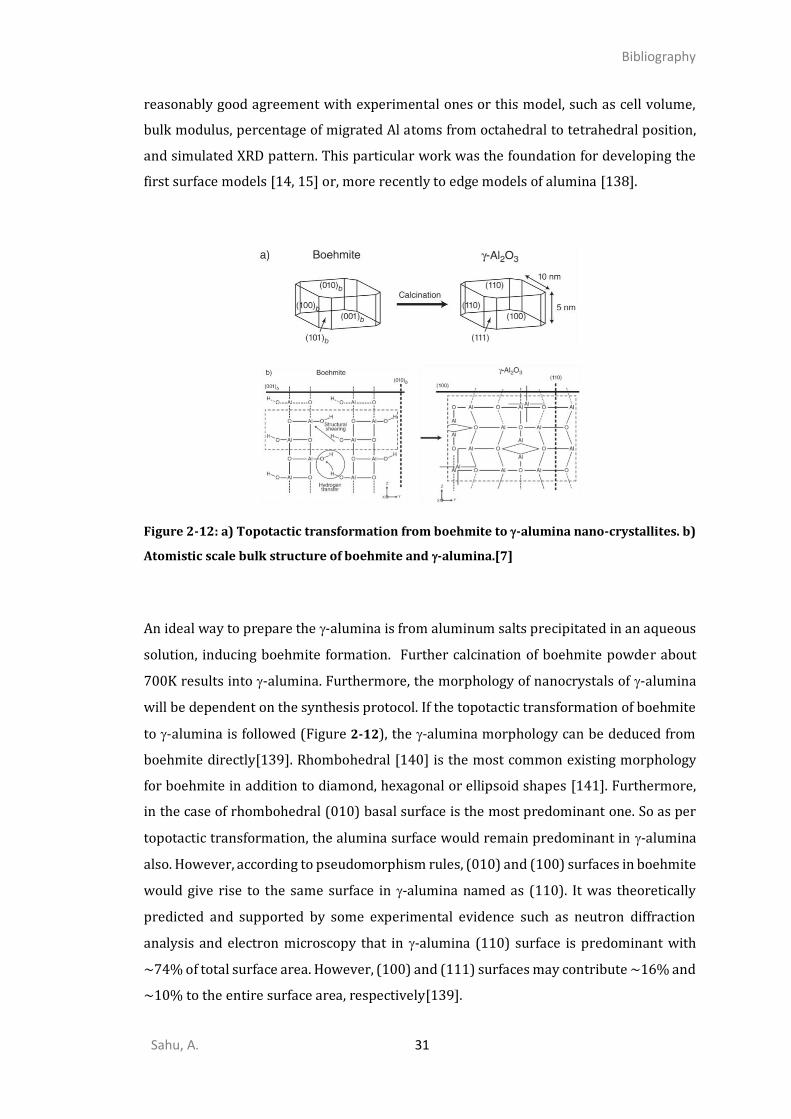
Bibliography
Sahu, A. 31
reasonably good agreement with experimental ones or this model, such as cell volume,
bulk modulus, percentage of migrated Al atoms from octahedral to tetrahedral position,
and simulated XRD pattern. This particular work was the foundation for developing the
first surface models [14, 15] or, more recently to edge models of alumina [138].
Figure 2-12: a) Topotactic transformation from boehmite to -alumina nano-crystallites. b)
Atomistic scale bulk structure of boehmite and -alumina.[7]
An ideal way to prepare the -alumina is from aluminum salts precipitated in an aqueous
solution, inducing boehmite formation. Further calcination of boehmite powder about
700K results into -alumina. Furthermore, the morphology of nanocrystals of -alumina
will be dependent on the synthesis protocol. If the topotactic transformation of boehmite
to -alumina is followed (Figure 2-12), the -alumina morphology can be deduced from
boehmite directly[139]. Rhombohedral [140] is the most common existing morphology
for boehmite in addition to diamond, hexagonal or ellipsoid shapes [141]. Furthermore,
in the case of rhombohedral (010) basal surface is the most predominant one. So as per
topotactic transformation, the alumina surface would remain predominant in -alumina
also. However, according to pseudomorphism rules, (010) and (100) surfaces in boehmite
would give rise to the same surface in -alumina named as (110). It was theoretically
predicted and supported by some experimental evidence such as neutron diffraction
analysis and electron microscopy that in -alumina (110) surface is predominant with
~74% of total surface area. However, (100) and (111) surfaces may contribute ~16% and
~10% to the entire surface area, respectively[139].
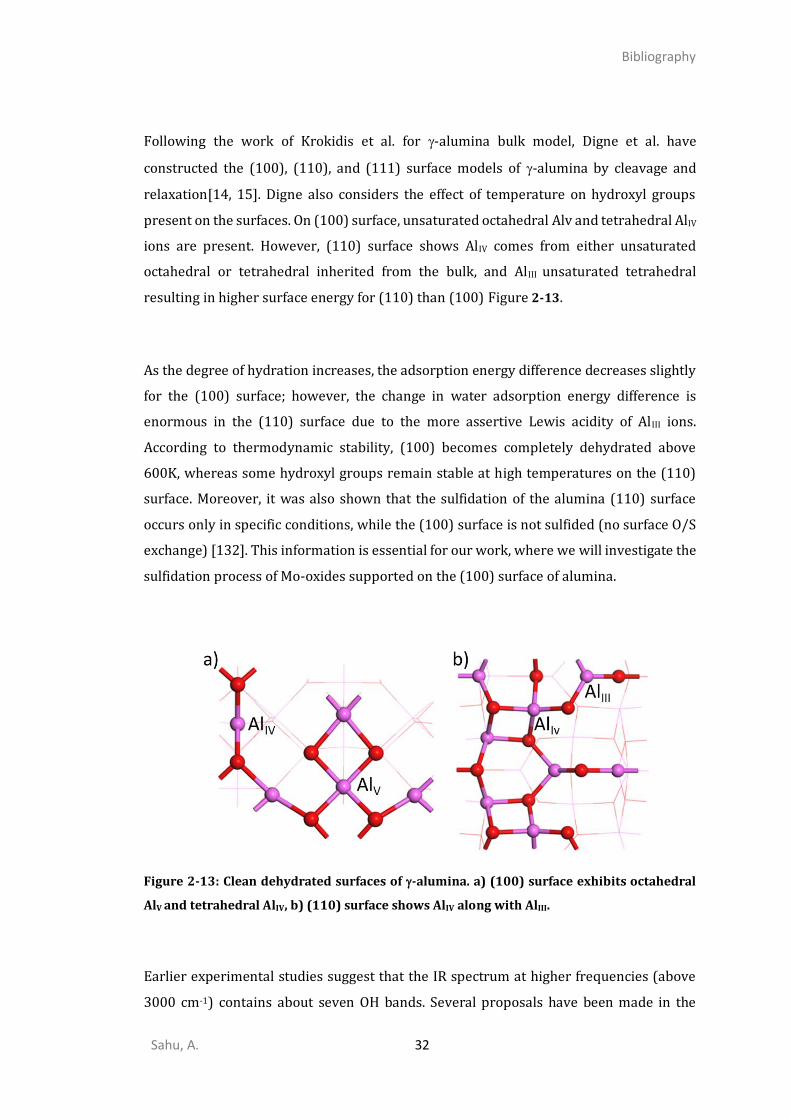
Bibliography
Sahu, A. 32
Following the work of Krokidis et al. for -alumina bulk model, Digne et al. have
constructed the (100), (110), and (111) surface models of -alumina by cleavage and
relaxation[14, 15]. Digne also considers the effect of temperature on hydroxyl groups
present on the surfaces. On (100) surface, unsaturated octahedral Alv and tetrahedral AlIV
ions are present. However, (110) surface shows AlIV comes from either unsaturated
octahedral or tetrahedral inherited from the bulk, and AlIII unsaturated tetrahedral
resulting in higher surface energy for (110) than (100) Figure 2-13.
As the degree of hydration increases, the adsorption energy difference decreases slightly
for the (100) surface; however, the change in water adsorption energy difference is
enormous in the (110) surface due to the more assertive Lewis acidity of AlIII ions.
According to thermodynamic stability, (100) becomes completely dehydrated above
600K, whereas some hydroxyl groups remain stable at high temperatures on the (110)
surface. Moreover, it was also shown that the sulfidation of the alumina (110) surface
occurs only in specific conditions, while the (100) surface is not sulfided (no surface O/S
exchange) [132]. This information is essential for our work, where we will investigate the
sulfidation process of Mo-oxides supported on the (100) surface of alumina.
Figure 2-13: Clean dehydrated surfaces of -alumina. a) (100) surface exhibits octahedral
AlV and tetrahedral AlIV, b) (110) surface shows AlIV along with AlIII.
Earlier experimental studies suggest that the IR spectrum at higher frequencies (above
3000 cm-1) contains about seven OH bands. Several proposals have been made in the
Bibliography
Sahu, A. 33
literature to explain the nature of the hydroxyl groups. The first proposition was made by
Tsyganenko et al., who claimed five prominent OH peaks such as tripled bridge OH (3700
cm-1), bridged OH (3740 cm-1), OH linked to AlV (3730 cm-1), terminal OH (3790 cm-1), and
OH related to AlIII (3800-3770 cm-1)[142]. The second proposal made by Knozinger and
Ratnasamy considered the different crystal planes effect and indicates morphology
dependence of OH bands[143]. Later, Busca proposed explaining the multiplicity of OH
bands, that it is essential to understand cation vacancies present on the surface (Figure
2-14)[144]. The degree of aluminum crystallinity has also been proposed as one factor
that can influence the OH band.
Digne et al. performed the DFT calculation and calculated the vibrational frequencies of
OH groups for various hydroxyl coverage on the surface[14, 15]. Different OH bands have
surface orientation dependence according to DFT calculations, indicating the IR peaks to
be sensitive towards morphology as Knozinger and Ratnasamy proposed. However, they
somehow revisited each band’s previous assignment according to the coordination
number of OH groups and Al sites. Furthermore, vacancy is not required to explain the
spectra. µ1-OH has three different peaks related to AlIV(100), AlVI (100), and AlV(110). µ3-
OH has the lowest frequency, followed by µ2-OH and µ1-OH, aligning with the Busca
study(Figure 2-14)[144].
Figure 2-14: OH stretching frequencies calculated by DFT [14, 15] and compared with
experimental [145] frequencies.[7, 14, 15] (figure taken from ref. [7])
Bibliography
Sahu, A. 34
At this stage, it is essential to underline that this knowledge of the nature of surface
hydroxyls may become crucial for a better understanding of its interaction with the active
phase precursors or with the activated phase, as underlined in the previous sections.
2.2.6. Description of Mo-oxide on the support
As it is proposed in the literature for various catalytic applications (not only HDS),
molybdenum oxides can be found in a highly dispersed form on various oxide surfaces
and could even exist as isolated MoOx species [16, 100, 146, 147]. With the help of
different experimental techniques such as Raman, IR, and EXAFS, it is speculated that
molybdenum centers may exist as tetrahedral or square pyramidal coordination on
alumina along with mono-oxo or di-oxo under dry conditions [100, 148–152]. DFT
investigations have been undertaken to understand the interactions between various
Mo/W-oxide forms supported by Al2O3 [17, 153], TiO2 [154–157], and SiO2[158]. Some of
them have studied on larger polyoxometalates on a support such as Mo8S26 [156], while
others have focused on tiny entities of Mo-oxides as small as monomer and dimers
supported on alumina [17, 153] and titania [154, 155]. As our study concerns Mo-oxides
on alumina, we will concentrate mainly on those studies in more detail.
Several plausible mono-oxo and di-oxo Mo centers for MoO3 and Mo2O6 species have been
studied on -alumina (100) and (110) surfaces using DFT [17, 153]. Monomers were
observed to be more stable than dimers on the (110) surface; however, a reverse effect
was witnessed on the (100) surface. This indicated the presence of monomeric species on
the surface even at high Mo loading and was later verified by Raman spectroscopy[159].
For monomers, di-oxo Mo-center is more stable on (100) surface but mono-oxo Mo-center
on (110). However, mono-oxo Mo-centers were observed to be more stable on (110)
surface than monomers. But, one of the molybdenum centers is di-oxo, and another one
is mono-oxo for the most stable dimer on (100) surface.
Recently, multilayers of α-MoO3 on two different -alumina models have also been
considered using DFT. Monolayers of MoO3 were more stable than the bilayers on -
alumina. Interfacial interaction takes place through charge transfer from the surface of -
alumina to α-MoO3. -alumina supported MoO3 was observed to be more active than
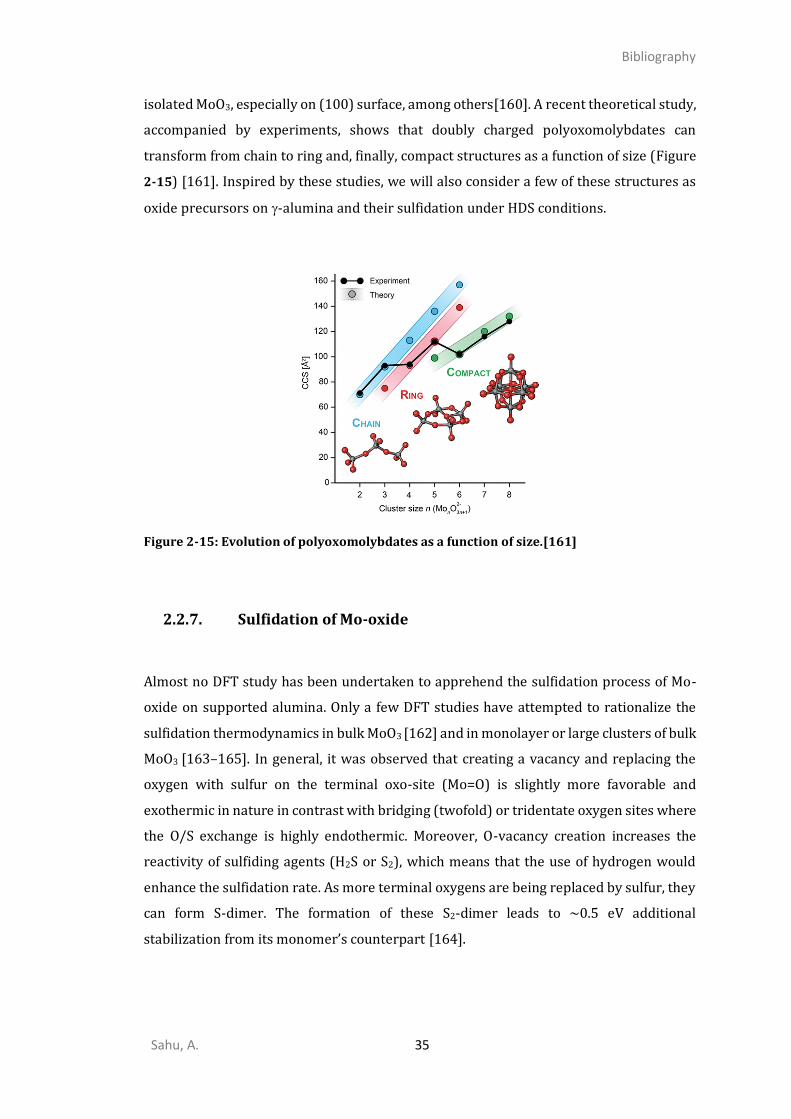
Bibliography
Sahu, A. 35
isolated MoO3, especially on (100) surface, among others[160]. A recent theoretical study,
accompanied by experiments, shows that doubly charged polyoxomolybdates can
transform from chain to ring and, finally, compact structures as a function of size (Figure
2-15) [161]. Inspired by these studies, we will also consider a few of these structures as
oxide precursors on -alumina and their sulfidation under HDS conditions.
Figure 2-15: Evolution of polyoxomolybdates as a function of size.[161]
2.2.7. Sulfidation of Mo-oxide
Almost no DFT study has been undertaken to apprehend the sulfidation process of Mo-
oxide on supported alumina. Only a few DFT studies have attempted to rationalize the
sulfidation thermodynamics in bulk MoO3 [162] and in monolayer or large clusters of bulk
MoO3 [163–165]. In general, it was observed that creating a vacancy and replacing the
oxygen with sulfur on the terminal oxo-site (Mo=O) is slightly more favorable and
exothermic in nature in contrast with bridging (twofold) or tridentate oxygen sites where
the O/S exchange is highly endothermic. Moreover, O-vacancy creation increases the
reactivity of sulfiding agents (H2S or S2), which means that the use of hydrogen would
enhance the sulfidation rate. As more terminal oxygens are being replaced by sulfur, they
can form S-dimer. The formation of these S2-dimer leads to ~0.5 eV additional
stabilization from its monomer’s counterpart [164].
Bibliography
Sahu, A. 36
Alternatively, a danish DFT study investigated the thermochemistry of sulfur-oxygen
exchange at the edges of the MoS2 nano-crystallite [54] to identify the possible residual
Mo-O chemical bonds after sulfidation. It was suggested that the S-edge is the most
difficult to sulfide and maybe the location of residual oxidized Mo sites.
Interestingly, one experimental study proposed kinetic modeling of the sulfidation
process of MoO3 supported on alumina [166]. The kinetic model analyzes the two-step
process: sulfidation of MoO3 and growth of MoS2 phase, for which it evaluates the
respective apparent activation energies of 23 kJ/mol and 43 kJ/mol.
To the best of our knowledge, only one DFT study reported thermodynamic trends in
thiolysis energies of Mo oxide precursors as a function of various supports described by
molecular clusters [167]. The authors proposed a correlation between thiolysis energy
descriptor and sulfidation degree and/or dispersion. However, we may ask to which
extent the small size clusters represent the support and how the kinetic effect may impact
these results.
As a consequence, almost no DFT study has been undertaken combining the
thermodynamic and kinetic effect of support on the sulfo-reductive mechanisms of Mo-
oxide species. Therefore, it is essential to understand the sulfidation process at the
molecular level and the evolution of oxide precursors under a sulfiding environment.
2.2.8. Alumina supported MoS2
Addressing the reactions of the “genesis” of the MoS2 based active phase remains far more
challenging primarily for two reasons: the first one is due to the complexity of the
supported system itself, and the second one is the complexity of the molecular
mechanisms involved during the sulforeduction process.
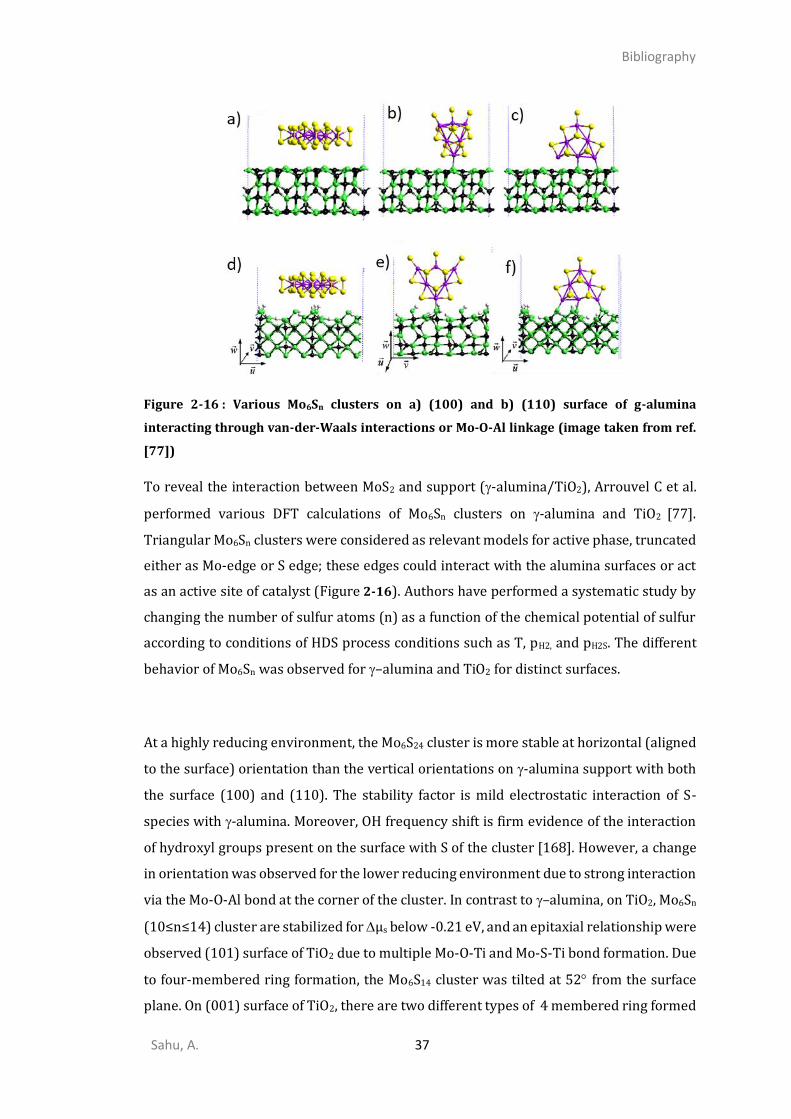
Bibliography
Sahu, A. 37
Figure 2-16 : Various Mo6Sn clusters on a) (100) and b) (110) surface of g-alumina
interacting through van-der-Waals interactions or Mo-O-Al linkage (image taken from ref.
[77])
To reveal the interaction between MoS2 and support (-alumina/TiO2), Arrouvel C et al.
performed various DFT calculations of Mo6Sn clusters on -alumina and TiO2 [77].
Triangular Mo6Sn clusters were considered as relevant models for active phase, truncated
either as Mo-edge or S edge; these edges could interact with the alumina surfaces or act
as an active site of catalyst (Figure 2-16). Authors have performed a systematic study by
changing the number of sulfur atoms (n) as a function of the chemical potential of sulfur
according to conditions of HDS process conditions such as T, pH2, and pH2S. The different
behavior of Mo6Sn was observed for –alumina and TiO2 for distinct surfaces.
At a highly reducing environment, the Mo6S24 cluster is more stable at horizontal (aligned
to the surface) orientation than the vertical orientations on -alumina support with both
the surface (100) and (110). The stability factor is mild electrostatic interaction of S-
species with -alumina. Moreover, OH frequency shift is firm evidence of the interaction
of hydroxyl groups present on the surface with S of the cluster [168]. However, a change
in orientation was observed for the lower reducing environment due to strong interaction
via the Mo-O-Al bond at the corner of the cluster. In contrast to –alumina, on TiO2, Mo6Sn
(10≤n≤14) cluster are stabilized for µs below -0.21 eV, and an epitaxial relationship were
observed (101) surface of TiO2 due to multiple Mo-O-Ti and Mo-S-Ti bond formation. Due
to four-membered ring formation, the Mo6S14 cluster was tilted at 52 from the surface
plane. On (001) surface of TiO2, there are two different types of 4 membered ring formed
Bibliography
Sahu, A. 38
Mo-S-Ti-S-Mo and Mo-O-Ti-O-Mo, which affect the orientation of Mo6S14 cluster with
respect to the TiO2 (001) and (101) surfaces.
Effect of promotors has also been investigated using DFT by Costa D et al. [101] for CoMoS
nanocluster on -alumina. The weakening of edge interactions was observed through Co
promotion. The smaller particle size of MoS2 was observed in the case of Co promotion
compared to the non-promoted case due to weaker adhesion energy and ligand effect of
promotor on -alumina. The reason behind different HDS activity was indicated to be a
lower S-edge/Mo-edge ratio on TiO2 than -alumina. Moreover, the promotion effect
weakens the interaction between the active phase (MoS2) and support.
Although this work did not investigate the sulfidation mechanism, it is an example that
illustrates how the chemical interaction with the support may impact the stability and
orientation of MoS2 layers. This residual chemical interaction through Mo-O-Al bonds may
result from the sulfo-reductive activation process. Thus, one of the critical questions is
understanding better how the sulfidation process transforms Mo-oxides to Mo-disulfides
on support like alumina.
Conclusions and strategy of the thesis
As we have underlined in this chapter, there exists a very diverse range of applications
for MoS3 − MoS2 based nanomaterials. These are widely used in HDS catalyst and have
been suspected of offering new applications as HER catalysis, cathode material for
batteries, solid lubricant, mercury capture, and many others. Despite these various
applications and the intense research on MoS3, the atomistic scale understanding of the
MoS3 phase remains still uncertain. The rational knowledge of Mo-oxides to Mo-sulfides
reduction, precise nature of oxide precursors, and involved intermediate species remains
insufficient.
To the best of our knowledge, no theoretical study based on density functional theory
(DFT) investigated the sulfo-reduction mechanisms of Mo-oxides on supported alumina
with a consistent comparison between oxysulfide and trisulfide pathways for the sulfo-
reduction as invoked in the experimental literature. A clearer atomistic scale description
Bibliography
Sahu, A. 39
is also needed to elucidate the anchoring sites of alumina for oxide precursors and how
they may influence the sulfidation steps. Additionally, the structure (chain vs. triangular)
and stability of the amorphous MoS3 phase remain to be highlighted to reveal the sites of
MoS3 as a catalyst for the diversified appliance.
We believe that this DFT study will give more refined insights into the mechanistic
insights about the sulfidation process and the nature of crucial intermediate such as the
MoS3 phase and provide some comprehension about morphology and its evolution as a
function of size. Furthermore, it will serve as a companionway to improve the control of
the activation step, in particular by identifying the O-sites which are the most reluctant to
sulfidation from a thermodynamic or kinetic aspect is mandatory.
The first part of the research project reported in Chapter 4, which is the core of the thesis,
will investigate the effect of the alumina support on the various possible sulfo-reduction
mechanisms oxides clusters for the small size, such as monomer, dimer, and trimer. Since
the large size Mo-oxide cluster would be difficult to simulate at a DFT level due to
expensive computational simulation time. A precise description of these small entities
containing relevant O-sites to be sulfided would enable us to rationalize the behavior of
bigger-size Mo-oxide precursors appropriately. Moreover, it has been shown that such
depolymerized Mo-oxides could be involved in the liquid sulfidation process. Starting
from such molecular oxide precursors, their thermodynamic stability (and structures) on
(100) -alumina surfaces will be calculated, which can be correlated with available EXAFS
and spectroscopic data. After that, we will probe the lability of oxygen sites for
sulfur/oxygen replacement, transformation into oxy-sulfides, and their thermodynamic
trends. The role of alumina anchoring sites will also be examined as it has been invoked
in the literature.
The sulfidation likelihood will be complemented by a systematic kinetic investigation of
these O/S exchanges. Further conversion of oxy-sulfides to MoS3 or direct transformation
to MoS2-active phase by the sulfo-reductive process will also be explored along with MoS3
to MoS2 transformation. It will be interesting to examine how these intermediate steps
will appear on a thermodynamic scale because MoS3 coexists as competing steps with
Bibliography
Sahu, A. 40
other oxy-sulfide intermediates. The effect of temperature would also be considered to
mimic the conditions of the experiment.
The critical question about the growth of the sulfided phase, whether it starts at the
trisulfide phase or subsequent to disulfide phase formation, would depend on the
transformation-kinetics of the trisulfide phase to disulfide phase. To answer this question,
the effect of size and diffusion of these species on support must be contemplated. We will
also propose some aspects of these questions in this study, such as interaction energy and
size effect on small entities.
The second part of the research project reported in Chapter 5 will deal with the
investigation of non-supported structures of the MoS3 phase and its growth which may be
considered to a continuity of the previous part. Therefore, we have neglected the effect
of support on the growing part of the MoS3 phase to see if it can be considered as a
precursor of the targeted MoS2 phase. We will thus simulate various plausible structures
for MoS3 clusters and increase their degree of complexities. We will take advantage of
already proposed structures for the MoS3 phase and endeavor the other possibilities
based on chemical intuitions. After finding the most prominent structures for the
respective size, we will directly compare triangular and chain-like models. Structural
analysis will be compared with EXAFS, and the IR spectrum of relevant polymorphs will
be compared with available experimental IR of the bulk-MoS3 phase. The thermodynamic
stability will reveal the most stable structures among all the explored ones without
support.
Additionally, we will probe the critical spectroscopic descriptors on the phase and
calculate the IR spectrum, moreover, its comparison with the experimental IR spectrum.
This will provide insights into the effect of size on spectroscopic descriptors. We also
revisit the experimental IR peak assignment. To explore the large potential energy
surface, Ab Initio Molecular Dynamics will also be performed. Finally, we will propose
some mechanistic pathways to transform one cluster into another.
Overall, we hope that this thesis will enable the reader to push further his current
understanding of the genesis of one relevant catalytic active phase supported on alumina

Bibliography
Sahu, A. 41
through quantum simulation approaches. Since quantum simulation will be the
fundamental technique used in the present research work, we present in Chapter 3 the
fundamental aspects of the computational methods used….

Bibliography
Sahu, A. 42
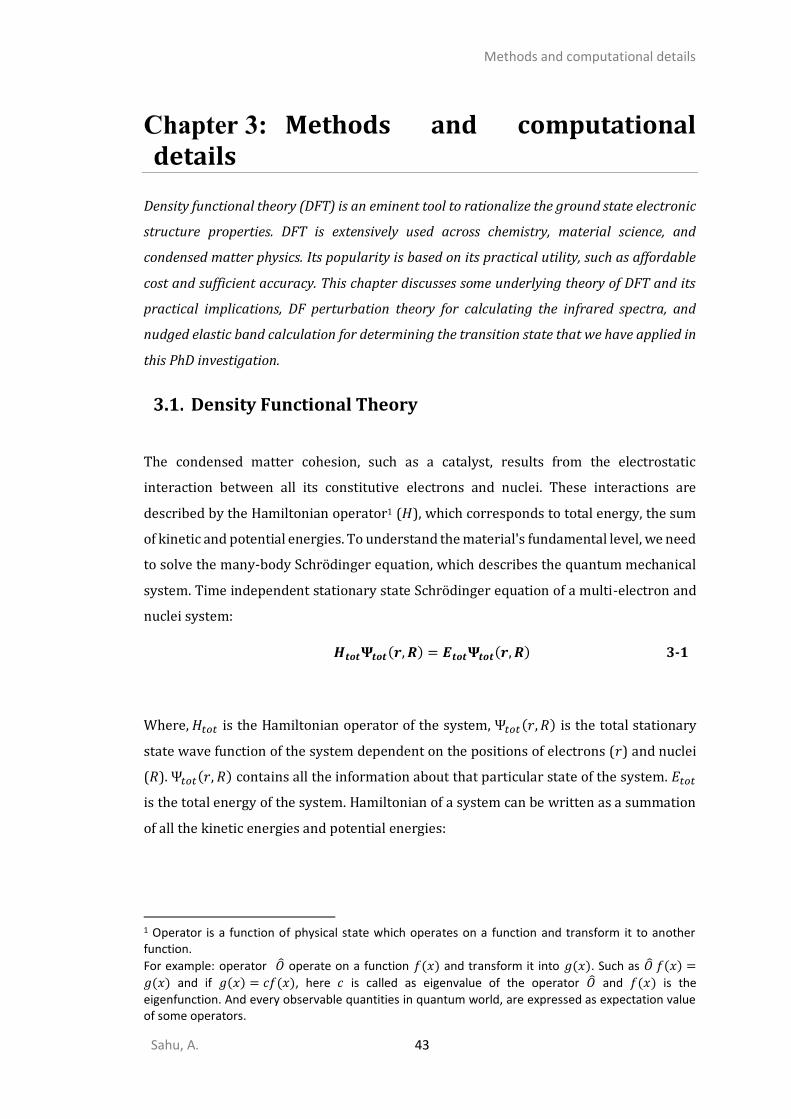
Methods and computational details
Sahu, A. 43
Methods and computational details
Density functional theory (DFT) is an eminent tool to rationalize the ground state electronic
structure properties. DFT is extensively used across chemistry, material science, and
condensed matter physics. Its popularity is based on its practical utility, such as affordable
cost and sufficient accuracy. This chapter discusses some underlying theory of DFT and its
practical implications, DF perturbation theory for calculating the infrared spectra, and
nudged elastic band calculation for determining the transition state that we have applied in
this PhD investigation.
Density Functional Theory
The condensed matter cohesion, such as a catalyst, results from the electrostatic
interaction between all its constitutive electrons and nuclei. These interactions are
described by the Hamiltonian operator1 (𝐻), which corresponds to total energy, the sum
of kinetic and potential energies. To understand the material's fundamental level, we need
to solve the many-body Schrödinger equation, which describes the quantum mechanical
system. Time independent stationary state Schrödinger equation of a multi-electron and
nuclei system:
𝑯𝒕𝒐𝒕𝚿𝒕𝒐𝒕(𝒓, 𝑹) = 𝑬𝒕𝒐𝒕𝚿𝒕𝒐𝒕(𝒓, 𝑹) 3-1
Where, 𝐻𝑡𝑜𝑡 is the Hamiltonian operator of the system, Ψ𝑡𝑜𝑡(𝑟, 𝑅) is the total stationary
state wave function of the system dependent on the positions of electrons (𝑟) and nuclei
(𝑅). Ψ𝑡𝑜𝑡(𝑟, 𝑅) contains all the information about that particular state of the system. 𝐸𝑡𝑜𝑡
is the total energy of the system. Hamiltonian of a system can be written as a summation
of all the kinetic energies and potential energies:
1 Operator is a function of physical state which operates on a function and transform it to another function.
For example: operator �̂� operate on a function 𝑓(𝑥) and transform it into 𝑔(𝑥). Such as �̂� 𝑓(𝑥) =
𝑔(𝑥) and if 𝑔(𝑥) = 𝑐𝑓(𝑥), here 𝑐 is called as eigenvalue of the operator �̂� and 𝑓(𝑥) is the eigenfunction. And every observable quantities in quantum world, are expressed as expectation value of some operators.
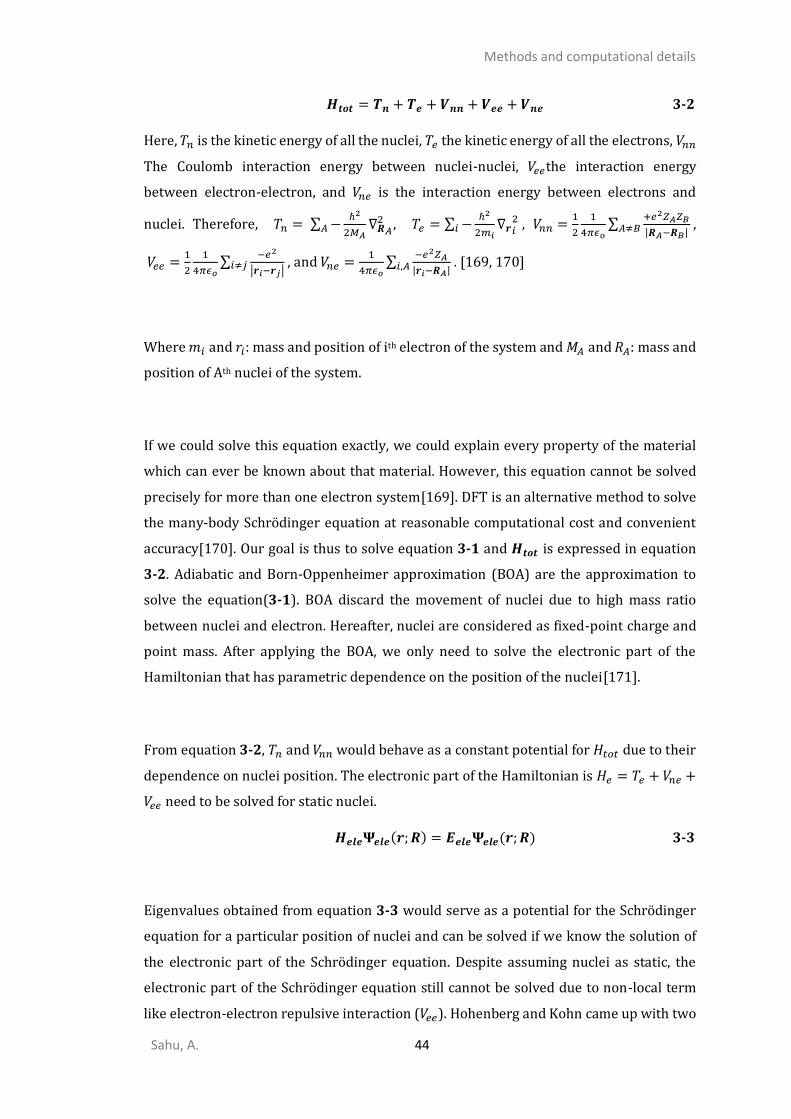
Methods and computational details
Sahu, A. 44
𝑯𝒕𝒐𝒕 = 𝑻𝒏 + 𝑻𝒆 + 𝑽𝒏𝒏 + 𝑽𝒆𝒆 + 𝑽𝒏𝒆 3-2
Here, 𝑇𝑛 is the kinetic energy of all the nuclei, 𝑇𝑒 the kinetic energy of all the electrons, 𝑉𝑛𝑛
The Coulomb interaction energy between nuclei-nuclei, 𝑉𝑒𝑒the interaction energy
between electron-electron, and 𝑉𝑛𝑒 is the interaction energy between electrons and
nuclei. Therefore, 𝑇𝑛 = ∑ −ℏ2
2𝑀𝐴∇𝑹
2𝐴𝐴 , 𝑇𝑒 = ∑ −
ℏ2
2𝑚𝑖∇𝒓𝑖
2𝑖 , 𝑉𝑛𝑛 =
1
2
1
4𝜋𝜖𝑜∑
+𝑒2𝑍𝐴𝑍𝐵
|𝑹𝐴−𝑹𝐵|𝐴≠𝐵 ,
𝑉𝑒𝑒 =1
2
1
4𝜋𝜖𝑜∑
−𝑒2
|𝒓𝑖−𝒓𝑗|𝑖≠𝑗 , and 𝑉𝑛𝑒 =1
4𝜋𝜖𝑜∑
−𝑒2𝑍𝐴
|𝒓𝑖−𝑹𝐴|𝑖,𝐴 . [169, 170]
Where 𝑚𝑖 and 𝑟𝑖: mass and position of ith electron of the system and 𝑀𝐴 and 𝑅𝐴: mass and
position of Ath nuclei of the system.
If we could solve this equation exactly, we could explain every property of the material
which can ever be known about that material. However, this equation cannot be solved
precisely for more than one electron system[169]. DFT is an alternative method to solve
the many-body Schrödinger equation at reasonable computational cost and convenient
accuracy[170]. Our goal is thus to solve equation 3-1 and 𝑯𝒕𝒐𝒕 is expressed in equation
3-2. Adiabatic and Born-Oppenheimer approximation (BOA) are the approximation to
solve the equation(3-1). BOA discard the movement of nuclei due to high mass ratio
between nuclei and electron. Hereafter, nuclei are considered as fixed-point charge and
point mass. After applying the BOA, we only need to solve the electronic part of the
Hamiltonian that has parametric dependence on the position of the nuclei[171].
From equation 3-2, 𝑇𝑛 and 𝑉𝑛𝑛 would behave as a constant potential for 𝐻𝑡𝑜𝑡 due to their
dependence on nuclei position. The electronic part of the Hamiltonian is 𝐻𝑒 = 𝑇𝑒 + 𝑉𝑛𝑒 +
𝑉𝑒𝑒 need to be solved for static nuclei.
𝑯𝒆𝒍𝒆𝚿𝒆𝒍𝒆(𝒓; 𝑹) = 𝑬𝒆𝒍𝒆𝚿𝒆𝒍𝒆(𝒓; 𝑹) 3-3
Eigenvalues obtained from equation 3-3 would serve as a potential for the Schrödinger
equation for a particular position of nuclei and can be solved if we know the solution of
the electronic part of the Schrödinger equation. Despite assuming nuclei as static, the
electronic part of the Schrödinger equation still cannot be solved due to non-local term
like electron-electron repulsive interaction (𝑉𝑒𝑒). Hohenberg and Kohn came up with two
Methods and computational details
Sahu, A. 45
theorems, which transform the equation from the position as a fundamental variable to
the density as a fundamental variable without losing any information about the system.
This reduces the dimensionality of the many-body Schrödinger equation from 3N
(positions) to 3 (density) [170].
3.1.1. Hohenberg and Kohn theorems
Theorem 1: For any system of interacting particles in an external potential Vext(r), the
density is uniquely determined (in other words, the external potential is a unique functional2
of the density and vice versa).[172]
This theorem says that there cannot be two different external potentials that give rise to
the same ground-state density. So, total energy can be written in terms of ground-state
electron density 𝜌0 as follows:
𝑬𝟎[𝝆𝟎] = 𝑻[𝛒𝟎] + 𝑬𝒆𝒆[𝝆𝟎] + 𝑬𝒆𝒙𝒕[𝝆𝟎] 3-4
Where 𝐸𝑒𝑥𝑡[𝜌0] is coming from external potential 𝐸𝑒𝑥𝑡[𝜌0] = ∫ 𝜌(𝑟)𝑉𝑒𝑥𝑡 𝑑𝑟.
Here in equation 3-4, the first term is system dependent, and the second one is universally
valid (independent of Vext), which is known as Hohenberg-Kohn functional 𝐹𝐻𝐾[𝜌0]. If we
know the form of 𝐹𝐻𝐾 functional, we can get the ground state energy. This 𝐹𝐻𝐾 , also known
as universal functional, is entirely independent of the system taken into account.
However, the explicit form of the two terms, i.e., 𝑇[ρ0] and 𝐸𝑒𝑒[𝜌0] is not known. 𝐸𝑒𝑒[𝜌0]
could be written as electron-electron interaction and non-classical interaction
corrections:
𝑬𝒆𝒆[𝝆 ] = ∫ ∫ (
𝝆(𝒓𝟏)𝝆(𝒓𝟐)
𝒓𝟏𝟐) 𝒅𝒓𝟏𝒅𝒓𝟐 + 𝑬𝒏𝒄𝒍[𝝆]
3-5
where 𝜌(𝑟) = ⟨Ψ0|𝜌|Ψ0⟩ = ∫ Π𝑖=1𝑁 𝑑𝑟𝑖|Ψ0(𝑟1𝑟2𝑟3 … 𝑟𝑁)|2 𝑎𝑛𝑑 𝑁 = ∫ 𝜌(𝑟)𝑑𝑟.
2 A function maps numbers onto (real or complex) numbers, 𝑓: ℝ → ℝ: 𝑥 ↦ 𝑓(𝑥), and Functional usually referred as “function of a function” which means A functional maps functions onto (real or complex) numbers 𝐹: ℱ → ℂ: 𝑓 ↦ ℱ[𝑓].
Methods and computational details
Sahu, A. 46
The first term in equation 3-5 also includes the spurious interaction of the electrons with
itself. An additional self-interaction correction term included in 𝐸𝑛𝑐𝑙[𝜌] to correct the self-
interaction error. This non-classical term of electron-electron interaction (𝐸𝑛𝑐𝑙[𝜌]) also
contains exchange-correlation due to the fact that electrons are indistinguishable
particles, so their exchange energy would also need to be considered. However, the
explicit form of this (𝐸𝑛𝑐𝑙[𝜌]) functional is not known. Only the ground state density
contains the information about positions and charges of the nuclei, allowing the mapping
from density to an external potential.
Theorem 2: A universal functional for the energy 𝑬 [𝝆(𝒓)] can be defined in terms of
density. The exact ground state is the global minimum value of this functional.[172]
The ground state energy can be obtained variationally: the density that minimizes the
total energy is the ground state energy. The corresponding density would be the exact
ground-state density.
𝑬𝟎[𝝆𝟎] ≤ 𝑬[𝝆] = 𝑻[𝝆] + 𝑬𝒆𝒙𝒕[𝝆] + 𝑬𝒆𝒆[𝝆] = 𝐦𝐢𝐧𝚿→𝛒𝟎
⟨𝚿|�̂�|𝚿⟩ 3-6
Any trial density 𝜌(𝑟) defines its Hamiltonian H and its own wave function Ψ and this
wave function can now be taken as a trial wave function for the Hamiltonian generated
from true external potential Vext. Hohenberg-Kohn framework illustrated that the ground
state wavefunction itself could determine the Hamiltonian.
3.1.2. Kohn-Sham DFT
Even after reformulating the problem from wavefunction to density that reduces the 3N
dimensional equation to 3 dimensions, it still remains unsolvable. One year after
Hohenberg and Kohn’s paper, Kohn and Sham suggested a practical way to compute the
Hohenberg-Kohn functional (𝐹𝐻𝐾 = 𝑇[ρ0] + 𝐸𝑒𝑒[𝜌0]). They mapped the system of
interacting electrons onto a fictitious scenario of non-interacting ones, however having
the exact same electron density. This provides a set of independent particle equations
which are practically possible to solve numerically.
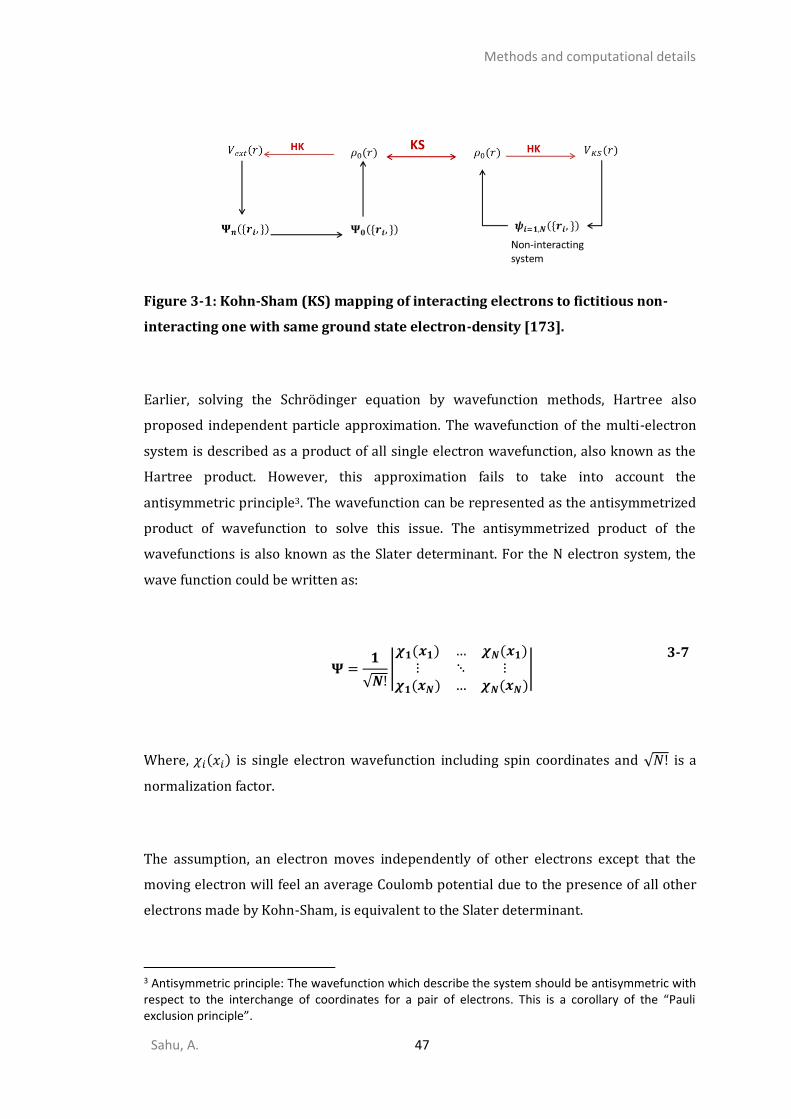
Methods and computational details
Sahu, A. 47
Figure 3-1: Kohn-Sham (KS) mapping of interacting electrons to fictitious non-
interacting one with same ground state electron-density [173].
Earlier, solving the Schrödinger equation by wavefunction methods, Hartree also
proposed independent particle approximation. The wavefunction of the multi-electron
system is described as a product of all single electron wavefunction, also known as the
Hartree product. However, this approximation fails to take into account the
antisymmetric principle3. The wavefunction can be represented as the antisymmetrized
product of wavefunction to solve this issue. The antisymmetrized product of the
wavefunctions is also known as the Slater determinant. For the N electron system, the
wave function could be written as:
𝚿 =
𝟏
√𝑵!|𝝌𝟏(𝒙𝟏) … 𝝌𝑵(𝒙𝟏)
⋮ ⋱ ⋮𝝌𝟏(𝒙𝑵) … 𝝌𝑵(𝒙𝑵)
| 3-7
Where, 𝜒𝑖(𝑥𝑖) is single electron wavefunction including spin coordinates and √𝑁! is a
normalization factor.
The assumption, an electron moves independently of other electrons except that the
moving electron will feel an average Coulomb potential due to the presence of all other
electrons made by Kohn-Sham, is equivalent to the Slater determinant.
3 Antisymmetric principle: The wavefunction which describe the system should be antisymmetric with respect to the interchange of coordinates for a pair of electrons. This is a corollary of the “Pauli exclusion principle”.
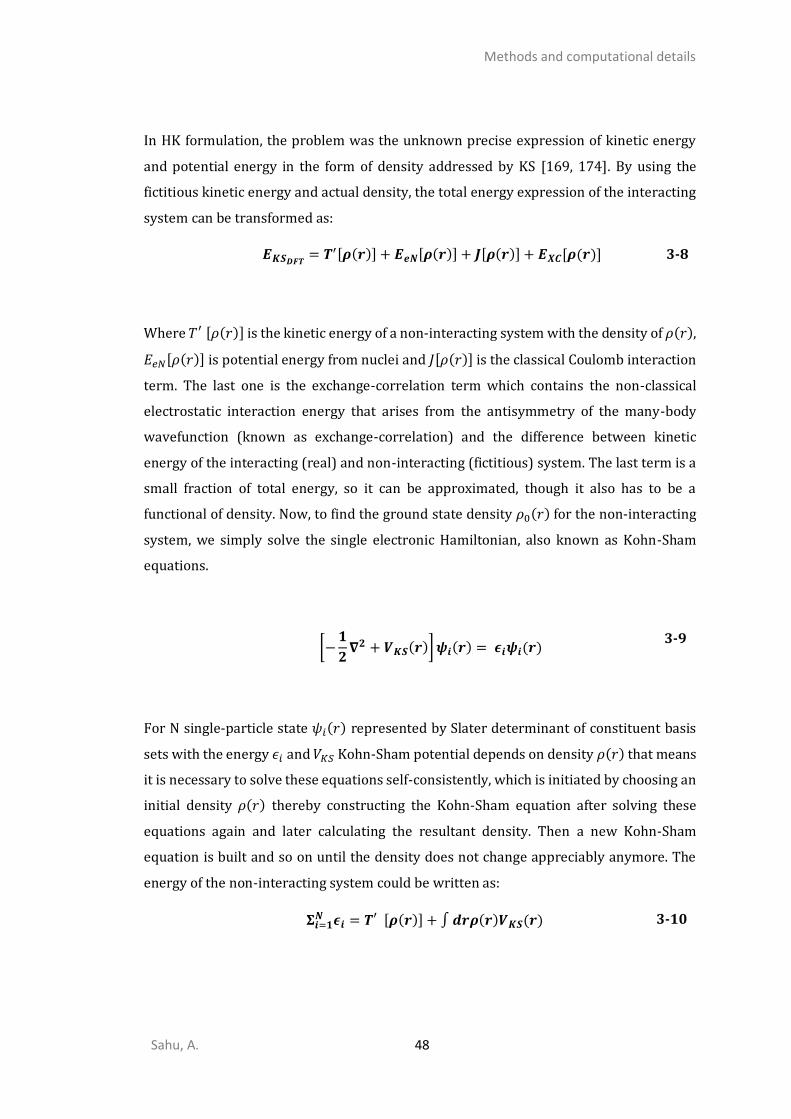
Methods and computational details
Sahu, A. 48
In HK formulation, the problem was the unknown precise expression of kinetic energy
and potential energy in the form of density addressed by KS [169, 174]. By using the
fictitious kinetic energy and actual density, the total energy expression of the interacting
system can be transformed as:
𝑬𝑲𝑺𝑫𝑭𝑻= 𝑻′[𝝆(𝒓)] + 𝑬𝒆𝑵[𝝆(𝒓)] + 𝑱[𝝆(𝒓)] + 𝑬𝑿𝑪[𝝆(𝒓)] 3-8
Where 𝑇′ [𝜌(𝑟)] is the kinetic energy of a non-interacting system with the density of 𝜌(𝑟),
𝐸𝑒𝑁[𝜌(𝑟)] is potential energy from nuclei and 𝐽[𝜌(𝑟)] is the classical Coulomb interaction
term. The last one is the exchange-correlation term which contains the non-classical
electrostatic interaction energy that arises from the antisymmetry of the many-body
wavefunction (known as exchange-correlation) and the difference between kinetic
energy of the interacting (real) and non-interacting (fictitious) system. The last term is a
small fraction of total energy, so it can be approximated, though it also has to be a
functional of density. Now, to find the ground state density 𝜌0(𝑟) for the non-interacting
system, we simply solve the single electronic Hamiltonian, also known as Kohn-Sham
equations.
[−
𝟏
𝟐𝛁𝟐 + 𝑽𝑲𝑺(𝒓)] 𝝍𝒊(𝒓) = 𝝐𝒊𝝍𝒊(𝒓)
3-9
For N single-particle state 𝜓𝑖(𝑟) represented by Slater determinant of constituent basis
sets with the energy 𝜖𝑖 and 𝑉𝐾𝑆 Kohn-Sham potential depends on density 𝜌(𝑟) that means
it is necessary to solve these equations self-consistently, which is initiated by choosing an
initial density 𝜌(𝑟) thereby constructing the Kohn-Sham equation after solving these
equations again and later calculating the resultant density. Then a new Kohn-Sham
equation is built and so on until the density does not change appreciably anymore. The
energy of the non-interacting system could be written as:
𝚺𝒊=𝟏𝑵 𝝐𝒊 = 𝑻′ [𝝆(𝒓)] + ∫ 𝒅𝒓𝝆(𝒓)𝑽𝑲𝑺(𝒓) 3-10
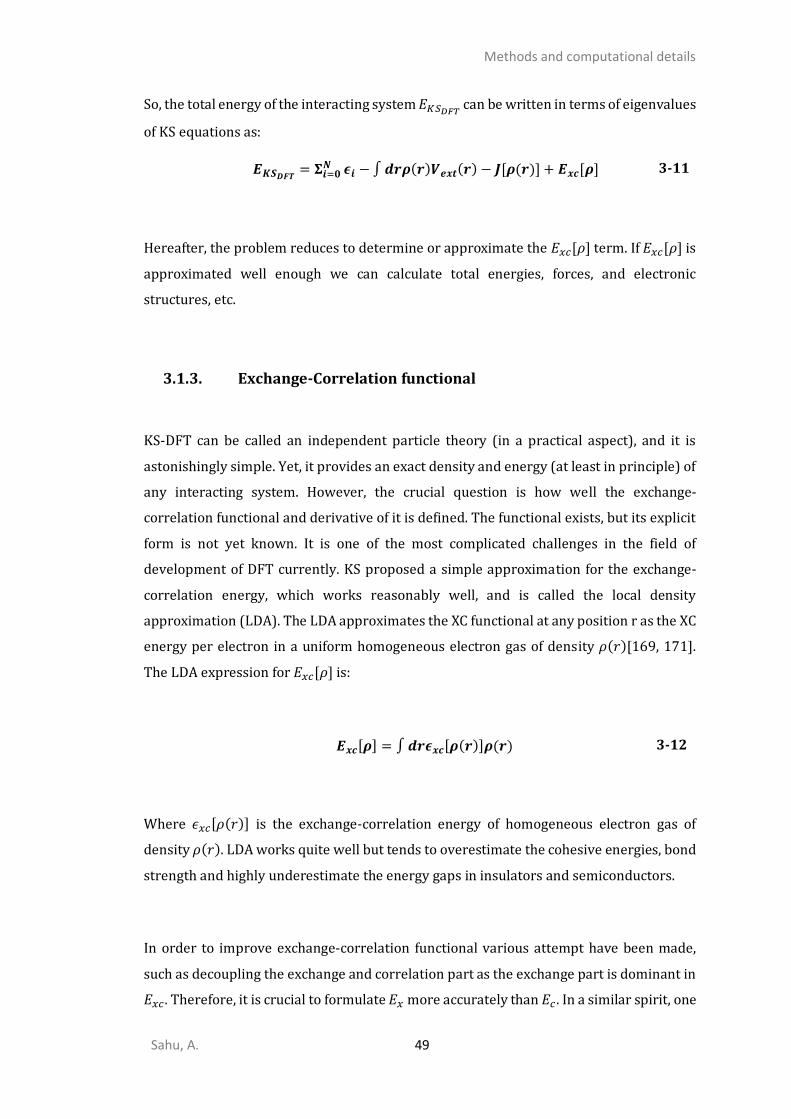
Methods and computational details
Sahu, A. 49
So, the total energy of the interacting system 𝐸𝐾𝑆𝐷𝐹𝑇 can be written in terms of eigenvalues
of KS equations as:
𝑬𝑲𝑺𝑫𝑭𝑻= 𝚺𝒊=𝟎
𝑵 𝝐𝒊 − ∫ 𝒅𝒓𝝆(𝒓)𝑽𝒆𝒙𝒕(𝒓) − 𝑱[𝝆(𝒓)] + 𝑬𝒙𝒄[𝝆] 3-11
Hereafter, the problem reduces to determine or approximate the 𝐸𝑥𝑐[𝜌] term. If 𝐸𝑥𝑐[𝜌] is
approximated well enough we can calculate total energies, forces, and electronic
structures, etc.
3.1.3. Exchange-Correlation functional
KS-DFT can be called an independent particle theory (in a practical aspect), and it is
astonishingly simple. Yet, it provides an exact density and energy (at least in principle) of
any interacting system. However, the crucial question is how well the exchange-
correlation functional and derivative of it is defined. The functional exists, but its explicit
form is not yet known. It is one of the most complicated challenges in the field of
development of DFT currently. KS proposed a simple approximation for the exchange-
correlation energy, which works reasonably well, and is called the local density
approximation (LDA). The LDA approximates the XC functional at any position r as the XC
energy per electron in a uniform homogeneous electron gas of density 𝜌(𝑟)[169, 171].
The LDA expression for 𝐸𝑥𝑐[𝜌] is:
𝑬𝒙𝒄[𝝆] = ∫ 𝒅𝒓𝝐𝒙𝒄[𝝆(𝒓)]𝝆(𝒓) 3-12
Where 𝜖𝑥𝑐[𝜌(𝑟)] is the exchange-correlation energy of homogeneous electron gas of
density 𝜌(𝑟). LDA works quite well but tends to overestimate the cohesive energies, bond
strength and highly underestimate the energy gaps in insulators and semiconductors.
In order to improve exchange-correlation functional various attempt have been made,
such as decoupling the exchange and correlation part as the exchange part is dominant in
𝐸𝑥𝑐 . Therefore, it is crucial to formulate 𝐸𝑥 more accurately than 𝐸𝑐 . In a similar spirit, one
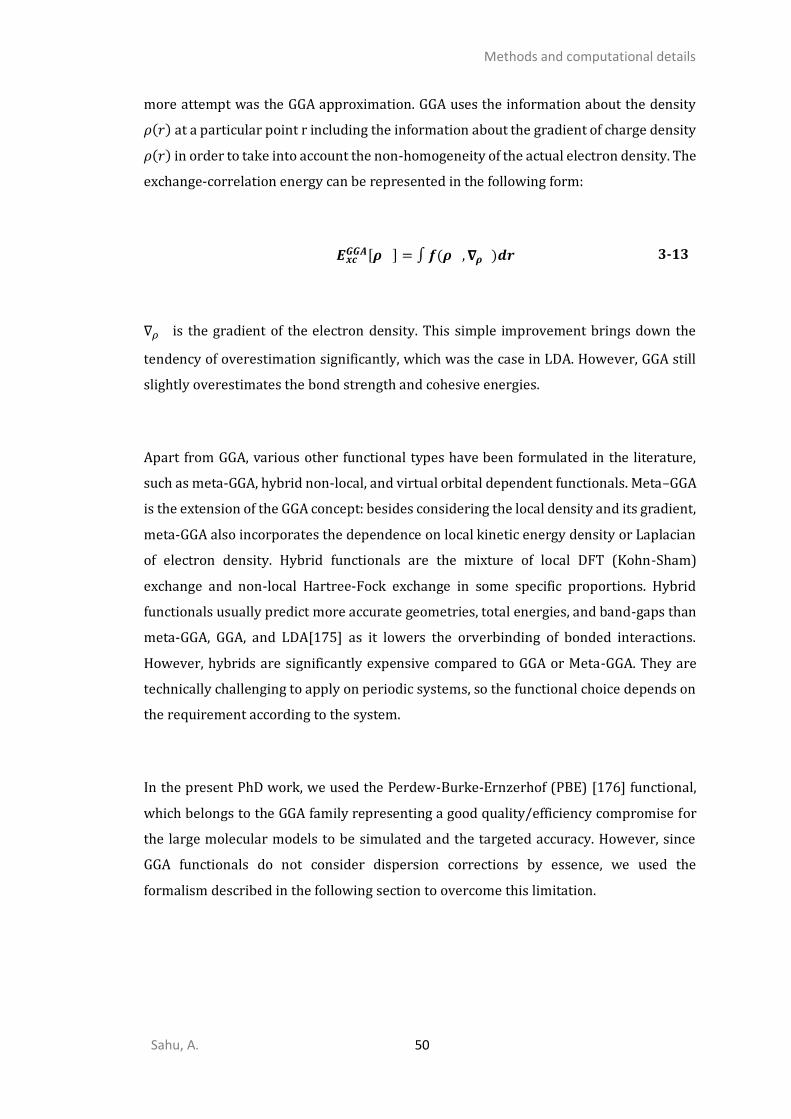
Methods and computational details
Sahu, A. 50
more attempt was the GGA approximation. GGA uses the information about the density
𝜌(𝑟) at a particular point r including the information about the gradient of charge density
𝜌(𝑟) in order to take into account the non-homogeneity of the actual electron density. The
exchange-correlation energy can be represented in the following form:
𝑬𝒙𝒄𝑮𝑮𝑨[𝝆 ] = ∫ 𝒇(𝝆 , 𝛁𝝆 )𝒅𝒓 3-13
∇𝜌 is the gradient of the electron density. This simple improvement brings down the
tendency of overestimation significantly, which was the case in LDA. However, GGA still
slightly overestimates the bond strength and cohesive energies.
Apart from GGA, various other functional types have been formulated in the literature,
such as meta-GGA, hybrid non-local, and virtual orbital dependent functionals. Meta–GGA
is the extension of the GGA concept: besides considering the local density and its gradient,
meta-GGA also incorporates the dependence on local kinetic energy density or Laplacian
of electron density. Hybrid functionals are the mixture of local DFT (Kohn-Sham)
exchange and non-local Hartree-Fock exchange in some specific proportions. Hybrid
functionals usually predict more accurate geometries, total energies, and band-gaps than
meta-GGA, GGA, and LDA[175] as it lowers the orverbinding of bonded interactions.
However, hybrids are significantly expensive compared to GGA or Meta-GGA. They are
technically challenging to apply on periodic systems, so the functional choice depends on
the requirement according to the system.
In the present PhD work, we used the Perdew-Burke-Ernzerhof (PBE) [176] functional,
which belongs to the GGA family representing a good quality/efficiency compromise for
the large molecular models to be simulated and the targeted accuracy. However, since
GGA functionals do not consider dispersion corrections by essence, we used the
formalism described in the following section to overcome this limitation.
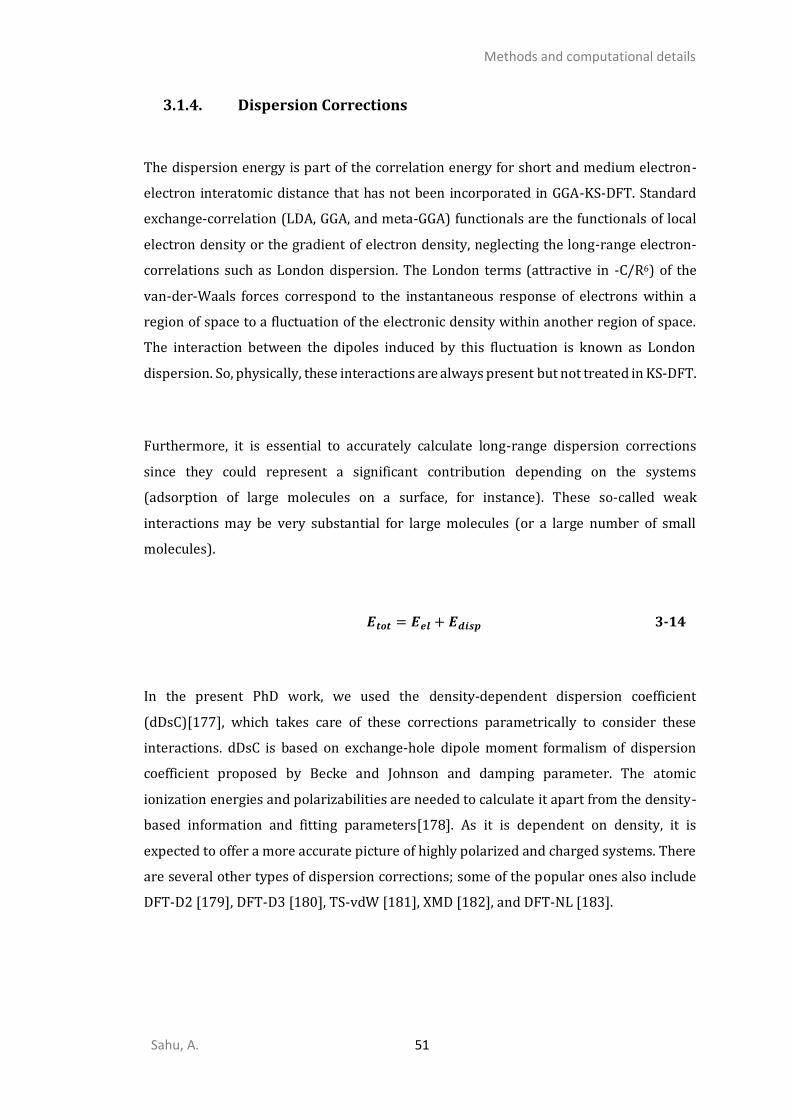
Methods and computational details
Sahu, A. 51
3.1.4. Dispersion Corrections
The dispersion energy is part of the correlation energy for short and medium electron-
electron interatomic distance that has not been incorporated in GGA-KS-DFT. Standard
exchange-correlation (LDA, GGA, and meta-GGA) functionals are the functionals of local
electron density or the gradient of electron density, neglecting the long-range electron-
correlations such as London dispersion. The London terms (attractive in -C/R6) of the
van-der-Waals forces correspond to the instantaneous response of electrons within a
region of space to a fluctuation of the electronic density within another region of space.
The interaction between the dipoles induced by this fluctuation is known as London
dispersion. So, physically, these interactions are always present but not treated in KS-DFT.
Furthermore, it is essential to accurately calculate long-range dispersion corrections
since they could represent a significant contribution depending on the systems
(adsorption of large molecules on a surface, for instance). These so-called weak
interactions may be very substantial for large molecules (or a large number of small
molecules).
𝑬𝒕𝒐𝒕 = 𝑬𝒆𝒍 + 𝑬𝒅𝒊𝒔𝒑 3-14
In the present PhD work, we used the density-dependent dispersion coefficient
(dDsC)[177], which takes care of these corrections parametrically to consider these
interactions. dDsC is based on exchange-hole dipole moment formalism of dispersion
coefficient proposed by Becke and Johnson and damping parameter. The atomic
ionization energies and polarizabilities are needed to calculate it apart from the density-
based information and fitting parameters[178]. As it is dependent on density, it is
expected to offer a more accurate picture of highly polarized and charged systems. There
are several other types of dispersion corrections; some of the popular ones also include
DFT-D2 [179], DFT-D3 [180], TS-vdW [181], XMD [182], and DFT-NL [183].
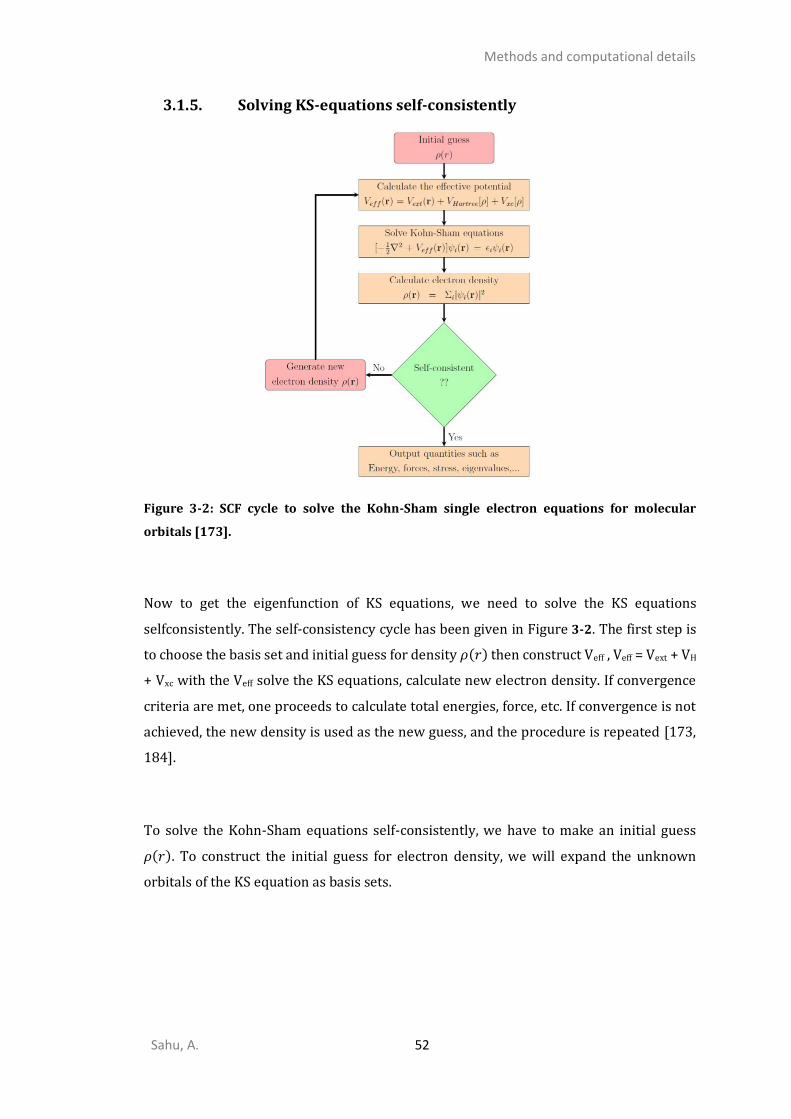
Methods and computational details
Sahu, A. 52
3.1.5. Solving KS-equations self-consistently
Figure 3-2: SCF cycle to solve the Kohn-Sham single electron equations for molecular
orbitals [173].
Now to get the eigenfunction of KS equations, we need to solve the KS equations
selfconsistently. The self-consistency cycle has been given in Figure 3-2. The first step is
to choose the basis set and initial guess for density 𝜌(𝑟) then construct Veff , Veff = Vext + VH
+ Vxc with the Veff solve the KS equations, calculate new electron density. If convergence
criteria are met, one proceeds to calculate total energies, force, etc. If convergence is not
achieved, the new density is used as the new guess, and the procedure is repeated [173,
184].
To solve the Kohn-Sham equations self-consistently, we have to make an initial guess
𝜌(𝑟). To construct the initial guess for electron density, we will expand the unknown
orbitals of the KS equation as basis sets.
Methods and computational details
Sahu, A. 53
3.1.6. Plane-wave basis set
Basis sets are essential to solve the Schrödinger equation numerically, whether by
wavefunction or density-functional-based methods. Most of the electronic structure
methods are dependent on some kind of basis function. The unknown wavefunction of
the system has to be expanded in terms of these basis functions in order to solve the
equations numerically. These have usually been referred to as a set of non-orthogonal
single electron functions used to build molecular orbitals. Molecular orbitals (MOs) are
the linear combination of atomic orbitals (LCAO-MO approximation). In computational
chemistry, an orbital is a single electron function. Depending on the requirement, the
properties of basis sets change. For example, atomic-centered basis sets are commonly
used for molecules, but plane-wave basis sets are for condensed matter or periodic
systems.
There are thus two dominant classes of basis set available in quantum chemistry: Plane-
wave basis sets and localized basis sets. We have used the plane-wave basis set in our PhD
investigation; therefore, we will discuss them in more detail.
The use of plane-wave for solids or periodic systems has many advantages over localized
basis sets. The easy transformation from real space to reciprocal space representations,
simplicity for calculating Hellmann-Feynman forces-stress (see equation 3-20-3-23), and
no basis sets superposition error4 (BSSE) are primary.
For periodic systems, the use of plane waves is beneficial because each electronic
wavefunction can be written as a product of a plane wave and lattice part:
𝛟𝒌(𝒓) = 𝒆𝒊𝒌⋅𝒓𝒖𝒌(𝒓) 3-15
4 BSSE is the error arising due to overlap of atomic centered basis sets of an interacting molecule. As the interatomic distance shrinks among individual atoms, the consisting basis set changes to minimize the total energy of the system. This change in basis set (used in energy minimization) as a function of interatomic distance would lead to an overestimation of interaction energy (known as BSSE).
Methods and computational details
Sahu, A. 54
Where index 𝑘 represents a set of plane waves within the primitive unit cell of the periodic
system and 𝑢𝑘(𝑟) possesses the same periodicity as the unit-cell5 and can be expanded
as:
𝒖𝒌(𝒓) = 𝟏/𝛀 𝚺𝑮𝑪𝒌,𝑮𝒆𝒊𝑮⋅𝒓 3-16
Where G is the reciprocal lattice vector and Ω is the volume of the unit cell. The plane
waves (ϕ𝑘(𝑟)) that appear in the above expansion (equation 3-15) can be represented as
a grid in reciprocal space. Each electron occupies a state of definite 𝑘. In principle, infinite
number of plane waves are required to describe the electron's wavefunction perfectly,
but in practice, higher-order terms of the Fourier component have negligible contribution
[185]. So we can truncate the expansion at some value of |k + G| as:
𝑬𝒄𝒖𝒕 =
ℏ𝟐|𝒌 + 𝑮|𝟐
𝟐𝒎=
ℏ𝟐
𝟐𝒎𝑮𝒄𝒖𝒕
𝟐 3-17
Using the finite number of plane waves will introduce some error that can be reduced by
systematically improving the convergence of the property of interest while increasing the
number of plane waves. Despite having many advantages such as orthogonal, simple to
calculate, an easy transformation from real to reciprocal space, and being independent of
atomic position, using plane waves has some disadvantages. A large number of basis sets
are required to describe the KS orbitals accurately. The scaling size of the basis set
depends on the simulation volume that makes the large vacuum-containing cells
expensive to simulate. The requirement of a considerable number of basis functions can
be reduced by using pseudopotential and frozen core approximation that we will discuss
next.
3.1.7. Projector augmented wave method
From the perspective of chemical interactions, core electrons6 are not involved in the
bonding and in some physical and chemical properties which define the system. Those
are influenced mainly by relatively loosely bonded valence electrons. Thus, we can
5 In a periodic system potential (𝑉) satisfies 𝑉(𝑟 + 𝑅) = 𝑉(𝑟) condition, where R is Bravais lattice vector and 𝑢𝑘(𝑟 + 𝑅) = 𝑢𝑘(𝑟). 6 Core electrons usually defined as the rare gas configuration. These are tightly bounded inner electrons, occupied low energy levels and commonly unaffected by chemical reactions. As they don’t participate during the reaction, the wavefunction of core electrons doesn’t change significantly. Valence electrons are, in contrast, outermost electrons which participate in chemical reactions and wavefunctions of valence electrons change substantially after reaction.
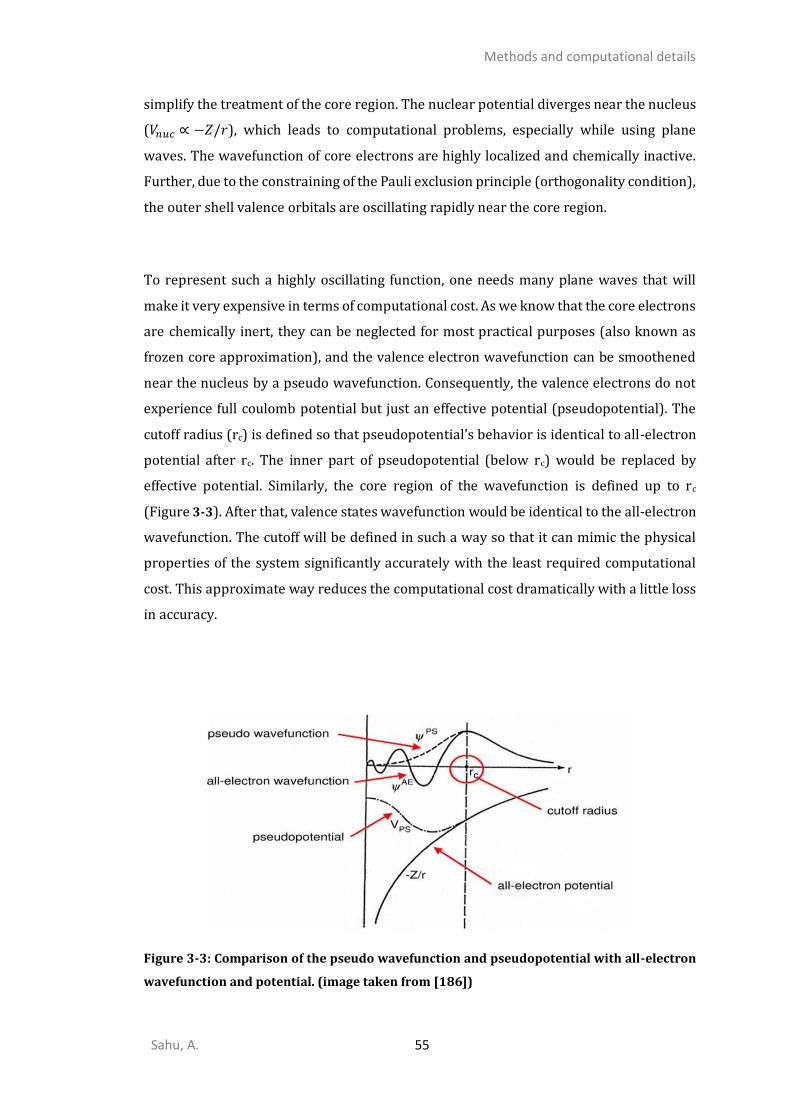
Methods and computational details
Sahu, A. 55
simplify the treatment of the core region. The nuclear potential diverges near the nucleus
(𝑉𝑛𝑢𝑐 ∝ −𝑍/𝑟), which leads to computational problems, especially while using plane
waves. The wavefunction of core electrons are highly localized and chemically inactive.
Further, due to the constraining of the Pauli exclusion principle (orthogonality condition),
the outer shell valence orbitals are oscillating rapidly near the core region.
To represent such a highly oscillating function, one needs many plane waves that will
make it very expensive in terms of computational cost. As we know that the core electrons
are chemically inert, they can be neglected for most practical purposes (also known as
frozen core approximation), and the valence electron wavefunction can be smoothened
near the nucleus by a pseudo wavefunction. Consequently, the valence electrons do not
experience full coulomb potential but just an effective potential (pseudopotential). The
cutoff radius (rc) is defined so that pseudopotential's behavior is identical to all-electron
potential after rc. The inner part of pseudopotential (below rc) would be replaced by
effective potential. Similarly, the core region of the wavefunction is defined up to rc
(Figure 3-3). After that, valence states wavefunction would be identical to the all-electron
wavefunction. The cutoff will be defined in such a way so that it can mimic the physical
properties of the system significantly accurately with the least required computational
cost. This approximate way reduces the computational cost dramatically with a little loss
in accuracy.
Figure 3-3: Comparison of the pseudo wavefunction and pseudopotential with all-electron
wavefunction and potential. (image taken from [186])

Methods and computational details
Sahu, A. 56
Pseudopotential and linearized augmented plane wave (LAPW) methods are a specific
case of the projector augmented wave (PAW) method. PAW was proposed by Blöchl in
order to improve the efficiency of pseudopotential methods and reduce the
computational cost. The PAW method allows us to transform the all-electron
wavefunction to auxiliary wavefunctions by some transformation operator while
conserving the orthogonality between the core and the valence orbitals. Beyond
augmentation radius, auxiliary wavefunctions and all-electron wavefunction behave
identically. But within the augmentation sphere, pseudo wavefunctions are approximated
by frozen core approximation[187]. By unifying the all-electron and pseudopotential
methods, the PAW approach provides a much more computationally efficient way to solve
KS-equations[188].
3.1.8. Ab initio molecular dynamics (AIMD)
Born-Oppenheimer molecular dynamics (BOMD)
Ab initio molecular dynamics is a powerful tool to generate the finite-temperature
dynamical geometries by solving Newton’s equation of motion from calculated forces
from electronic structure calculations. AIMD is one step ahead of static nuclei KS-DFT. A
structural minimization of static nuclei system is highly dependent on the initial guessed
geometry. Thanks to AIMD, the system's dynamical properties can be computed at finite
temperature, in principle independent of the starting point.
The system consists of N nuclei and Ne electrons; within the BOA, nuclei of the system are
considered to be point charges and point masses during the ground state. The obtained
energy from Kohn-Sham equations is the nuclei's function (which we deemed to be fixed).
Derivative of this energy concerning nuclei coordinates would act as interatomic
potential. This potential is required to compute the instantaneous force in Newton’s
equation of motion to move the atom. Therefore, the calculated gradient of energy
(obtained by DFT at a fixed position of nuclei) will provide the force responsible for the
motion of nuclei. For a given time step, new positions would be calculated, and the process
would be repeated. During the course of dynamics, we assume that the electrons will stay
in the adiabatic ground state; nuclei will move on the ground state potential energy
Methods and computational details
Sahu, A. 57
surface and follow classical Newton’s equation of motions. Newton’s equations of motion
for nuclei within the framework of BOA can be written as[189, 190]:
𝑴𝑨𝑹�̈�(𝒕) = −𝛁𝐑 𝐦𝐢𝐧𝝍
⟨𝚿𝟎|𝑯𝒆𝒍𝒆|𝚿𝟎⟩ 3-18
𝑀𝐴 is the mass of Ath nuclei, 𝑅�̈�(𝑡) is velocity gradient, ∇Ris differential operator, Ψ0 is
ground state wavefunction solved at particular R and 𝐻𝑒𝑙𝑒 is electronic Hamiltonian
parametrically dependence on R. In most simplistic case of AIMD, we solve the equation
3-18 numerically at every time step.
In the present PhD work, we have used a simplified scheme for AIMD based on a velocity-
scaled algorithm to accelerate the exploration of some configurational states of complex
systems.
Simulation of spectroscopic properties
3.2.9. Vibrational analysis within harmonic approximations
The vibrational frequencies, 𝜈, would be evaluated by the eigenvalues of Hessian matrices
of the potential energy surface E(R) within the BO approximation, scaled by nuclear
masses[191].
𝒅𝒆𝒕 |
𝟏
√𝑴𝑨𝑴𝑩
𝝏𝟐𝑬(𝑹)
𝝏𝑹𝑨𝝏𝑹𝑩− 𝝂𝟐| = 𝟎
3-19
MA, MB, and RA, RB are the mass and atomic positions of nuclei A and B, respectively, and 𝜈
is the frequency of the normal mode. It is important to point out that the underlying
theory of vibrational mode is within the harmonic approximation, which means the
interatomic potential energy is expanded to second-order. The resulting Hamiltonian
would be the sum of all the independent harmonic oscillators. The Hellmann-Feynman
theorem assures that the non-degenerate eigenvalue of the first derivative of Hamiltonian
concerning any parameter 𝜆 corresponds to the first derivative of energy eigenvalue of
that Hamiltonian.
Methods and computational details
Sahu, A. 58
𝝏𝑬
𝝏𝝀= ⟨𝚿 |
𝝏𝑯𝝀
𝝏𝝀| 𝚿 ⟩
3-20
Here, Ψ and E are the eigenfunction and eigenvalue of the operator 𝐻𝜆 respectively and
𝐻𝜆 has parametric dependence on 𝜆. As we already discussed earlier, within the BOA,
Hamiltonian has parametric reliance on nuclei position. So for nucleus A, the electronic
ground state would be[191]:
𝑭𝑨 = −
𝝏𝑬(𝑹)
𝝏𝑹𝑨= − ⟨ 𝚿 (𝒓, 𝑹) |
𝝏𝑯𝑹
𝝏𝑹𝑨| 𝚿 (𝒓, 𝑹)⟩
3-21
After combining equations 3-20 and 3-21, we can write the 𝐹𝐴 as:
𝑭𝑨 = −∫
𝝆 (𝒓)𝝏𝑽𝒏𝒆(𝒓)
𝝏𝑹𝑨 𝒅𝒓 −
𝝏𝑬(𝑹)
𝝏𝑹𝑨
3-22
Where Vne is the electron-nucleus interaction (equation 3-22), ρ(𝑟) is ground state
electron density, and FA is the force felt when atom A is displaced. By derivating the
Hellman-Feynman forces concerning ionic positions are hessian matrices, also known as
the matrices of interatomic force constants[191]:
𝝏𝟐𝑬(𝑹)
𝝏𝑹𝑨𝝏𝑹𝑩 ≡ −
𝝏𝑭𝑨
𝝏𝑹𝑩
3-23
Finite difference methods for vibrational modes and frequencies
The force-constant matrix is calculated by displacing each atom in the unit cell from its
equilibrium position and calculating the restraining force on every other atom of the unit
cell. This method is also called frozen phonons due to the fixed amplitude of displacement
while calculating its derivative. A schematic of this method is shown in Figure 3-4. The
finite difference method is straightforward and straightforward to implement; therefore,
available for semilocal DFT, hybrid DFT, forcefields, or dynamical mean-field theory but
limited to the small size of supercells. However, because this method requires the
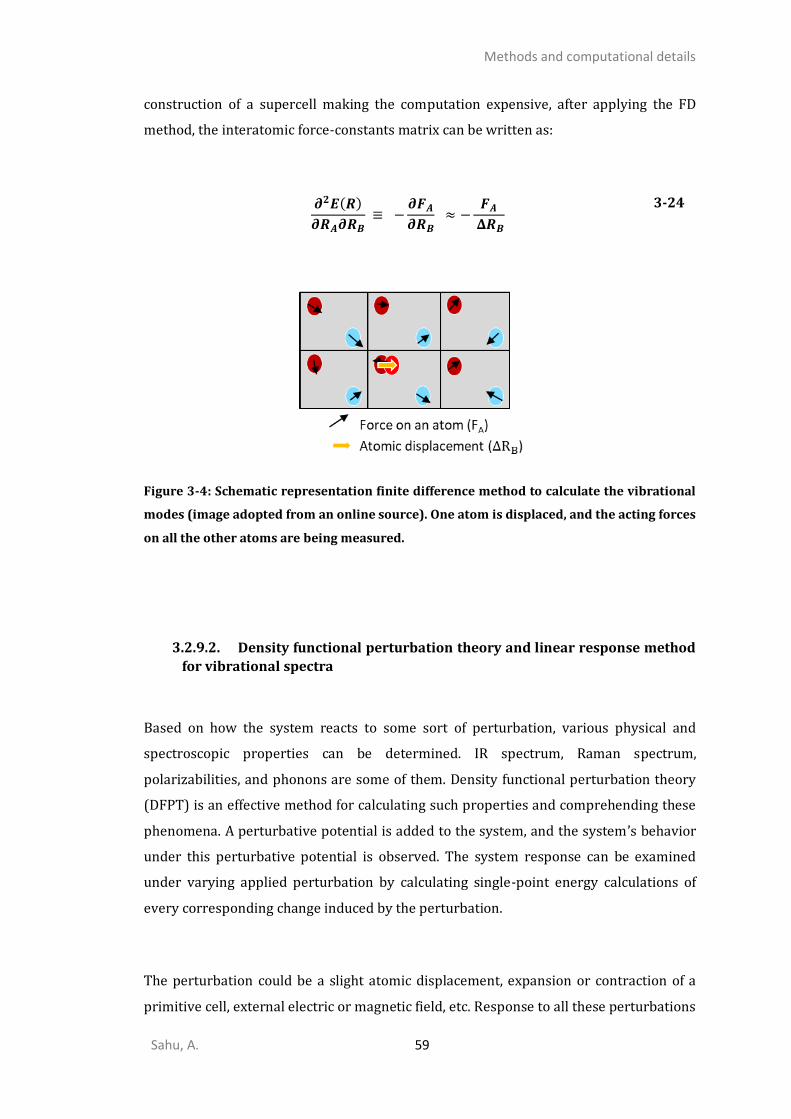
Methods and computational details
Sahu, A. 59
construction of a supercell making the computation expensive, after applying the FD
method, the interatomic force-constants matrix can be written as:
𝝏𝟐𝑬(𝑹)
𝝏𝑹𝑨𝝏𝑹𝑩 ≡ −
𝝏𝑭𝑨
𝝏𝑹𝑩 ≈ −
𝑭𝑨
𝚫𝑹𝑩
3-24
Figure 3-4: Schematic representation finite difference method to calculate the vibrational
modes (image adopted from an online source). One atom is displaced, and the acting forces
on all the other atoms are being measured.
Density functional perturbation theory and linear response method
for vibrational spectra
Based on how the system reacts to some sort of perturbation, various physical and
spectroscopic properties can be determined. IR spectrum, Raman spectrum,
polarizabilities, and phonons are some of them. Density functional perturbation theory
(DFPT) is an effective method for calculating such properties and comprehending these
phenomena. A perturbative potential is added to the system, and the system’s behavior
under this perturbative potential is observed. The system response can be examined
under varying applied perturbation by calculating single-point energy calculations of
every corresponding change induced by the perturbation.
The perturbation could be a slight atomic displacement, expansion or contraction of a
primitive cell, external electric or magnetic field, etc. Response to all these perturbations
Methods and computational details
Sahu, A. 60
mentioned above would give insight into specific properties of the system. The
observation of the response to the electric field can be used to elucidate various linear
optical properties, Born effective charges (BEC), and vibrational frequencies[192]. For
equilibrium geometry, the forces acting on individual nuclei should be zero. In DFPT, the
Hessian matrix is calculated in the following way:
𝝏𝟐𝑬(𝑹)
𝝏𝑹𝑨𝝏𝑹𝑩 ≡ −
𝝏𝑭𝑨
𝝏𝑹𝑩
= ∫𝝏𝝆𝑹(𝒓)
𝝏𝑹𝑩
𝝏𝑽𝒏𝒆(𝒓)
𝝏𝑹𝑨𝒅𝒓 + ∫ 𝝆𝑹(𝒓)
𝝏𝟐𝑽𝒏𝒆(𝒓)
𝝏𝑹𝑨𝝏𝑹𝑩𝒅𝒓 +
𝝏𝟐𝑬𝒊𝒐𝒏(𝑹)
𝝏𝑹𝑨𝝏𝑹𝑩
3-25
Where RA and RB and atomic parameters. This expression closely links the second
derivatives of the total energy to the ground state electron density 𝜌𝑅(𝑟) and the linear
response of the charge density to a displacement of the ions, 𝜕𝜌𝑅(𝑟)
𝜕𝑅𝐵 . 𝑉𝑛𝑒(𝑟) is the electron-
ion interaction and 𝐸𝑖𝑜𝑛(𝑅) the direct ion-ion interaction.
The DFPT approach has been implemented in VASP for PAW potentials[192] as well as its
application for vibrational spectroscopy of adsorbed molecules on the surface [193].
Within the framework of dipole approximation[194], the intensity of active infrared
modes is directly proportional to the square of the change in dipole moment along the
normal mode direction:
𝑰𝝀 ∝ |𝑫(𝝀) − 𝑫𝟎|𝟐 3-26
D(𝜆) is the new dipole moment after displacing the atom in the direction of vibrational
mode 𝜆, and D0 is the permanent dipole moment when the system is at equilibrium. The
intensity can be calculated by evaluating the first order in Taylor series expansion of the
dipole moment:
Methods and computational details
Sahu, A. 61
𝑰𝝀 ∝ ∑ || ∑ 𝛁𝒊𝜷𝑫𝜶𝒆𝒊𝜷(𝝀)
𝒊=𝟏,𝑵𝜷=𝟏,𝟑
||
𝜶=𝟏,𝟑
𝟐
3-27
Where, ∇𝑖𝛽𝐷𝛼 is the first derivative of polarization vector with respect to ionic
coordinates, also known as Born effective charge (BEC) tensor and 𝑒𝑖𝛽(𝜆) is the 𝛽
component of polarization vector of vibrational mode 𝜆. [195, 196] Moreover, the BEC
tensor of an atom 𝑖 can be calculated in the following way:
𝛁𝒊𝜷𝑫𝜶 = 𝒁𝒊
𝜶𝜷=
𝝏𝟐𝑬𝒕𝒐𝒕
𝝏𝜺𝜷𝝏𝝉𝜶
3-28
Where, 𝐸𝑡𝑜𝑡 is the total energy of the cell, 𝜀𝛽 is the electric field along the direction 𝜷 and
𝜏𝛼 is the atomic displacement along the direction 𝛼 of the lattice. The electric field 𝜀𝛽 is
generated due to the long-range character of Coulomb interactions [195].
We have used this approach for all IR-spectra plotted in the PhD thesis and to evaluate
the vibrational contribution of some thermodynamic analyses after checking that it is
equivalent to the finite difference method described before. For the sake of simplicity, the
standard method for evaluating various thermodynamic terms with the use of vibrational
frequencies are reported in Appendix A.
3.2.10. Core level shift and binding energies
X-ray photoelectron spectroscopy is a crucial technique to understand surface chemistry
and, more particularly, analyze the chemical states of key elements of the materials. The
distinction among various chemical forms is based on core level atomic binging energy
(BE). The shift of core level binding energy with respect to its reference gives insights into
the chemical environment around the targeted atom. Calculating the binding energy
involves initial and final state approximations. Initial state approximation assumes the
Methods and computational details
Sahu, A. 62
energy level of core orbitals is directly related to core electron energy based on
Koopman’s theorem [197], and final state approximation assumes the energy of excited
state would be related to the core orbital energy of the excited state. Here, the energy of
the excited state can be obtained by calculating the energy of the system (E(nc -1)) where
one electron is transferred to the lowest unoccupied molecular orbital (LUMO) from one
of its particular atom’s core and creating a system with core-hole [198, 199]. Therefore,
the BE expression can be written as:
𝑩𝑬 = 𝑬(𝒏𝒄 − 𝟏) − 𝑬(𝒏𝒄) 3-29
E(nc) is the ground state energy, and E(nc-1) is the energy of the excited state; the
difference between these two states will provide information about the binding energy of
the electron that is being excited of the particular atom. VASP implementation of PAW
formalism of all-electron method with frozen core approximation allows us to generate
the corresponding energy of core orbitals of the respective atom. A system with a core-
hole can be created by putting an additional nuclear charge to the core of the system along
with one electron in a valence state to keep the charge neutrality. This is also known as
the Z+1 approximation. The binding energy in equation 3-29 can be evaluated by the
Slater-Janak theorem [200, 201].
𝑩𝑬 = 𝑬(𝒏𝒄 − 𝟏) − 𝑬(𝒏𝒄) ~ − 𝝐𝒄 (𝒏𝒄 −
𝟏
𝟐)
3-30
Where, −𝜖𝑐(𝑛𝑐 − 1/2) is the Kohn-Sham eigenvalues of the given core level eigen state
with half electron decrease in the occupation. We can not compare the direct BE because
the reference is not the same in theory and experiments. But the difference in BE (ΔBE)
can be directly compared with experimentally obtained XPS data.
Other possibilities consider that one or half electron is removed from the system and kept
in a vacuum (JSn and FSn in Figure 3-5). All these approaches work well for molecules and
clusters, and the JSn approach also shows more promising results for molecular moieties
on the surfaces than FS, JS, and FSn [202]. In our investigation, we have tested FS and JS
approach on the MoS3 polymorphs. We did not observe any significant difference between
them, and here we report only the data on the FS approach.
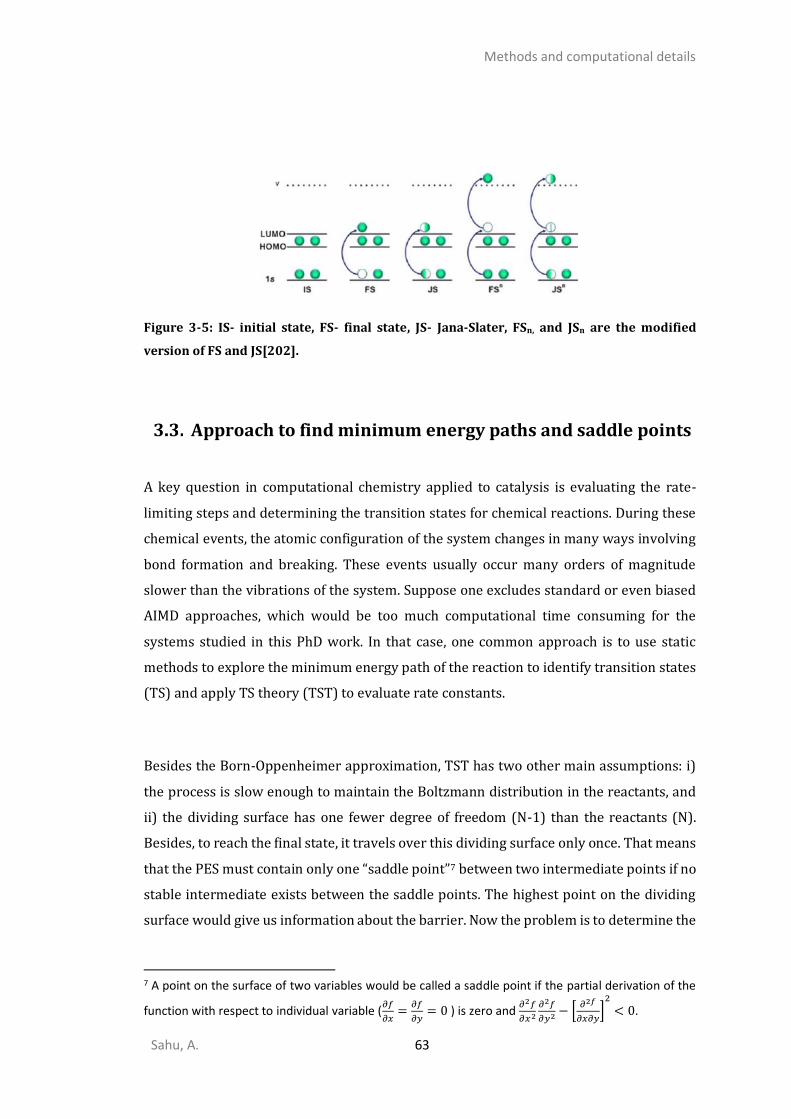
Methods and computational details
Sahu, A. 63
Figure 3-5: IS- initial state, FS- final state, JS- Jana-Slater, FSn, and JSn are the modified
version of FS and JS[202].
Approach to find minimum energy paths and saddle points
A key question in computational chemistry applied to catalysis is evaluating the rate-
limiting steps and determining the transition states for chemical reactions. During these
chemical events, the atomic configuration of the system changes in many ways involving
bond formation and breaking. These events usually occur many orders of magnitude
slower than the vibrations of the system. Suppose one excludes standard or even biased
AIMD approaches, which would be too much computational time consuming for the
systems studied in this PhD work. In that case, one common approach is to use static
methods to explore the minimum energy path of the reaction to identify transition states
(TS) and apply TS theory (TST) to evaluate rate constants.
Besides the Born-Oppenheimer approximation, TST has two other main assumptions: i)
the process is slow enough to maintain the Boltzmann distribution in the reactants, and
ii) the dividing surface has one fewer degree of freedom (N-1) than the reactants (N).
Besides, to reach the final state, it travels over this dividing surface only once. That means
that the PES must contain only one “saddle point”7 between two intermediate points if no
stable intermediate exists between the saddle points. The highest point on the dividing
surface would give us information about the barrier. Now the problem is to determine the
7 A point on the surface of two variables would be called a saddle point if the partial derivation of the
function with respect to individual variable (𝜕𝑓
𝜕𝑥=
𝜕𝑓
𝜕𝑦= 0 ) is zero and
𝜕2𝑓
𝜕𝑥2
𝜕2𝑓
𝜕𝑦2 − [𝜕2𝑓
𝜕𝑥𝜕𝑦]
2
< 0.
Methods and computational details
Sahu, A. 64
saddle point of this diving surface, which is challenging. The reaction coordinate of this
saddle point would correspond to the transition mode of the process that will be normal
mode with imaginary frequency.
The minimum energy path (MEP) is commonly used to determine the reaction
coordinates for transitions (rare events). MEP may include one or more minima,
corresponding to the stable intermediates between the initial and the final point. Given
that case, MEP will exhibit two or more maxima, indicating a corresponding saddle point.
To estimate the rate accurately, one needs to find the highest saddle point along with MEP
that will correspond to the rate-limiting step. The first-order saddle points are a
maximum in one direction and a minimum in all others. This will be obtained by
minimizing all the degrees of freedom except one that will be maximized. [203]
Once the saddle point is known, we can evaluate the activation energy that will give
insights into the reaction rate. The energy difference between the initial image and the
saddle point (𝐸𝐴) estimates the exponential term in the empirical Arrhenius rate
equation8 or even more precisely in the Eyring-Polanyi equation. This equation assumes
that the nuclei are classical particles; activated complex, we call them now transition
state, are in quasi-equilibrium with reactants and products; and the TS would be
converted into reactants or products once they are formed. The Eyring-Polanyi equation
states as following [205, 206]:
𝒌 =
𝜿𝒌𝑩𝑻
𝒉𝒆−
𝚫𝑮‡
𝑹𝑻 3-31
Where 𝜅 is the transmission coefficient, 𝑘𝐵 is the Boltzmann’s constant, h is Planck’s
constant, and Δ𝐺‡ is the Gibbs energy of activation. The transmission coefficient is the
fraction of flux going through TS and converted into a product; if we assume the reaction
is non-reversible, this coefficient would be equal to 1. The Gibbs energy can breakdown
into two components, and the equation can be rewritten as (for 𝜅 = 1 ):
𝒌 =
𝒌𝑩𝑻
𝒉𝒆−
𝚫𝑺‡
𝑹 𝒆−𝚫𝑯‡
𝑹𝑻 3-32
8 Swedish chemist Svante Arrhenius proposed that the rate constant of a reaction would exponentially
decay based on the ratio of activation energy and temperature: 𝑘 = 𝐴𝑒−𝐸𝐴/𝑅𝑇 , where 𝐸𝐴 is the activation energy of the, R is gas constant, T is kelvin temperature and A is frequency factor. [204].

Methods and computational details
Sahu, A. 65
Δ𝑆‡ and Δ𝐻‡ is the entropy of the activation and enthalpy of activation, respectively.
If we determine the activated complex (transition state or saddle point), we can directly
deduce the rate constant of the reaction by DFT calculations of Δ𝑆‡ and Δ𝐻‡ (see
appendix-A). Several methods have been proposed in the literature to estimate MEPs and
saddle points. We will describe only the ones that have been used in this PhD project:
Nudged Elastic Band (NEB), Climbing image (CI)-NEB, dimer methods, and intrinsic
reaction coordinates (IRC). [203]
3.3.11. The NEB method
The nudged elastic band (NEB) method connects the initial point (reactants), I, and the
final point (product), F, with several images between I and F through a spring (elastic
band). These images can be generated through linear interpolation of initial (I) and final
(F) image. After the image has been generated, an optimization algorithm is applied to
minimize these images along with MEP. Apart from providing an estimate of the saddle
point, the NEB method also theoretically allows us to have a global overview of the
potential energy landscape.
These generated images are relaxed towards the MEP by implementing a force projecting
scheme. In this scheme, the potential forces operate perpendicular to the elastic band, and
spring forces operate along with the band (Figure 3-6). These force projections are made
by defining a tangent along the path (𝜏 ) as the unit vector from the lower energy image
to the neighboring higher energy image. To avoid the abrupt change in the 𝜏 direction, a
linear interpolation between neighboring images is used. The force component on NEB
image 𝑖 is defined as:
𝑭𝒊𝑵𝑬𝑩 = 𝑭𝒊
⊥ + 𝑭𝒊∥ 3-33
Where 𝑭𝑖⊥ is the force component perpendicular to the elastic band and 𝐹𝑖
∥ is the parallel
to elastic band which is spring force.
𝑭𝒊⊥ = −𝛁𝐄(𝑰𝒊) + 𝛁𝐄(𝑰𝒊) ⋅ 𝝉�̂�𝝉�̂� 3-34
And the spring force
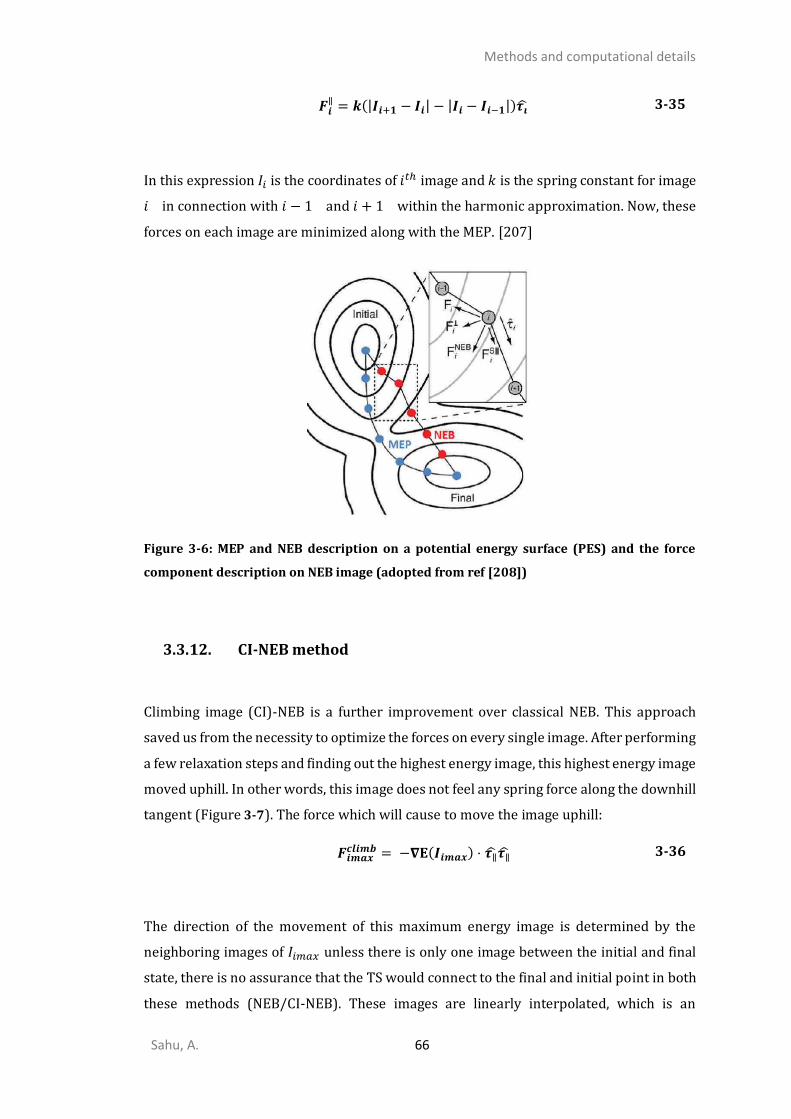
Methods and computational details
Sahu, A. 66
𝑭𝒊∥ = 𝒌(|𝑰𝒊+𝟏 − 𝑰𝒊| − |𝑰𝒊 − 𝑰𝒊−𝟏|)𝝉�̂� 3-35
In this expression 𝐼𝑖 is the coordinates of 𝑖𝑡ℎ image and 𝑘 is the spring constant for image
𝑖 in connection with 𝑖 − 1 and 𝑖 + 1 within the harmonic approximation. Now, these
forces on each image are minimized along with the MEP. [207]
Figure 3-6: MEP and NEB description on a potential energy surface (PES) and the force
component description on NEB image (adopted from ref [208])
3.3.12. CI-NEB method
Climbing image (CI)-NEB is a further improvement over classical NEB. This approach
saved us from the necessity to optimize the forces on every single image. After performing
a few relaxation steps and finding out the highest energy image, this highest energy image
moved uphill. In other words, this image does not feel any spring force along the downhill
tangent (Figure 3-7). The force which will cause to move the image uphill:
𝑭𝒊𝒎𝒂𝒙𝒄𝒍𝒊𝒎𝒃 = −𝛁𝐄(𝑰𝒊𝒎𝒂𝒙) ⋅ 𝝉∥̂𝝉∥̂ 3-36
The direction of the movement of this maximum energy image is determined by the
neighboring images of 𝐼𝑖𝑚𝑎𝑥 unless there is only one image between the initial and final
state, there is no assurance that the TS would connect to the final and initial point in both
these methods (NEB/CI-NEB). These images are linearly interpolated, which is an

Methods and computational details
Sahu, A. 67
approximate way to have an idea about the MEP. In order to confirm that the observed TS
connect the initial and final image, we have to perform intrinsic reaction coordinate (IRC)
analysis (section 3.3.14). [209–211]
Figure 3-7: (a) The CI-NEB method between the reactant (R) and product (P). (b)
Comparison of potential energy surface calculated by NEB and CI-NEB, and the difference in
saddle point [209].
Force-based optimizers are commonly used to minimize the energy for every image on
the current path towards the MEP and saddle point. In general, quasi-Newton and quick-
min are the default VASP force-based optimizers used for NEB/CI-NEB. The Henkelman
group has developed several complementary force-based optimizers such as conjugate
gradient (CG), Limited-memory Broyden-Fletcher-Goldfarb-Shannon(L-BFGS), Global-
LBFGS, Fast internal relaxation engine (FIRE), and steepest descents (SD). [208]
In this thesis, we have mainly used the VASP default optimizer that is CG, where the TS
was not very complex. However, in some cases, where the complicated TS is involved, CG
optimization doesn’t converge, FIRE or L-BFGS have been utilized. Predominantly, for
DBT hydrogenolysis (appendix : D), we have used the L-BFGS and FIRE; FIRE is more
robust in the case of troublesome convergence issues.
3.3.13. The Dimer method
To determine the saddle point when the final state is not known is even more challenging
than the earlier problem of finding the saddle point when the final image is known.
Usually, this search requires the second derivatives of the energy with respect to the
atomic coordinates, which means the entire Hessian matrix has to be calculated. Besides,
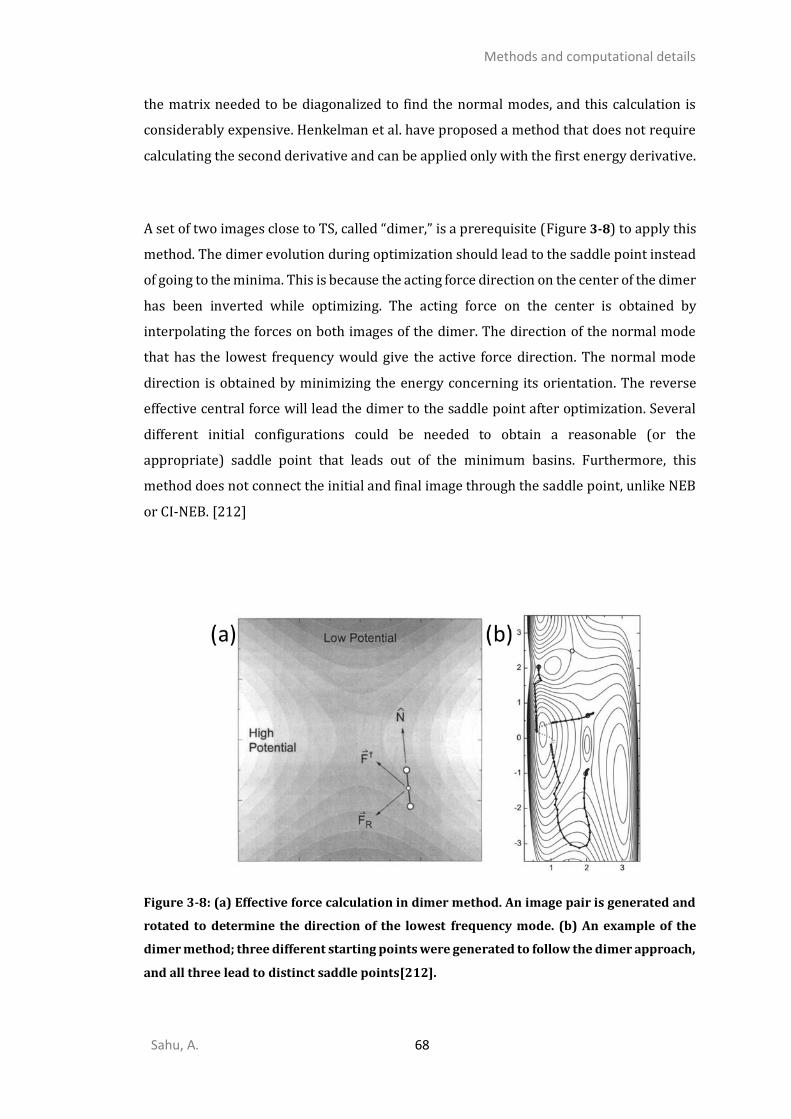
Methods and computational details
Sahu, A. 68
the matrix needed to be diagonalized to find the normal modes, and this calculation is
considerably expensive. Henkelman et al. have proposed a method that does not require
calculating the second derivative and can be applied only with the first energy derivative.
A set of two images close to TS, called “dimer,” is a prerequisite (Figure 3-8) to apply this
method. The dimer evolution during optimization should lead to the saddle point instead
of going to the minima. This is because the acting force direction on the center of the dimer
has been inverted while optimizing. The acting force on the center is obtained by
interpolating the forces on both images of the dimer. The direction of the normal mode
that has the lowest frequency would give the active force direction. The normal mode
direction is obtained by minimizing the energy concerning its orientation. The reverse
effective central force will lead the dimer to the saddle point after optimization. Several
different initial configurations could be needed to obtain a reasonable (or the
appropriate) saddle point that leads out of the minimum basins. Furthermore, this
method does not connect the initial and final image through the saddle point, unlike NEB
or CI-NEB. [212]
Figure 3-8: (a) Effective force calculation in dimer method. An image pair is generated and
rotated to determine the direction of the lowest frequency mode. (b) An example of the
dimer method; three different starting points were generated to follow the dimer approach,
and all three lead to distinct saddle points[212].
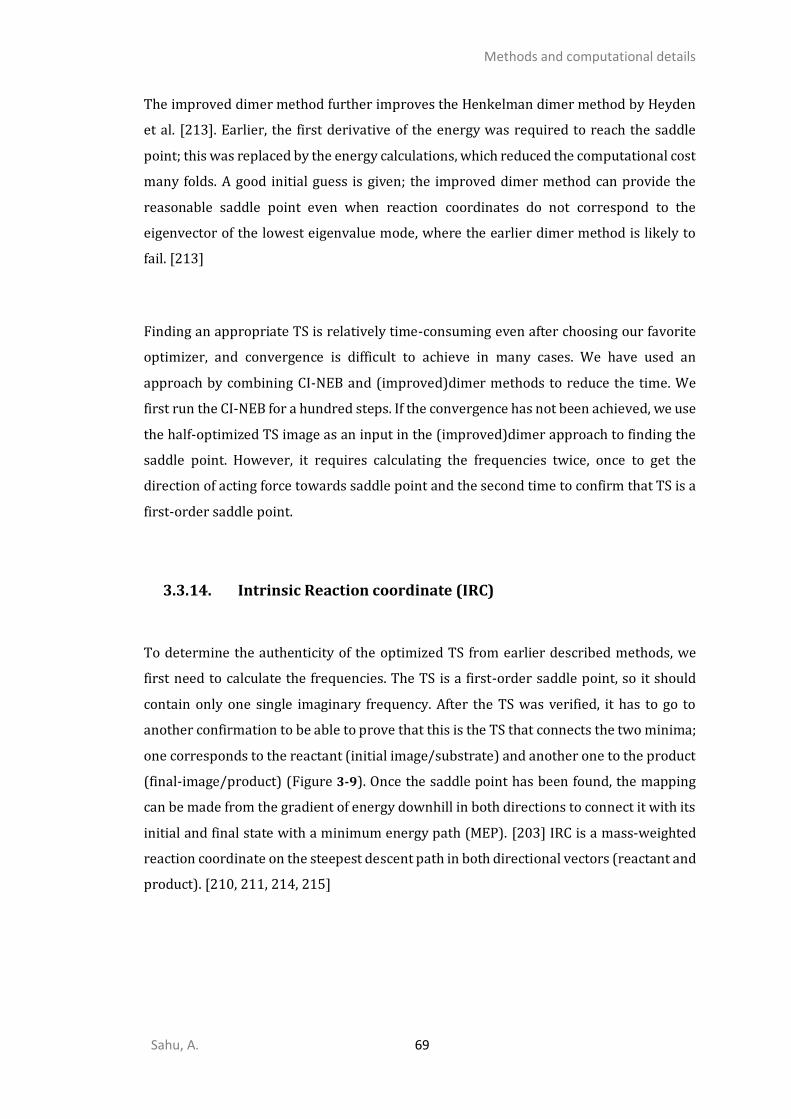
Methods and computational details
Sahu, A. 69
The improved dimer method further improves the Henkelman dimer method by Heyden
et al. [213]. Earlier, the first derivative of the energy was required to reach the saddle
point; this was replaced by the energy calculations, which reduced the computational cost
many folds. A good initial guess is given; the improved dimer method can provide the
reasonable saddle point even when reaction coordinates do not correspond to the
eigenvector of the lowest eigenvalue mode, where the earlier dimer method is likely to
fail. [213]
Finding an appropriate TS is relatively time-consuming even after choosing our favorite
optimizer, and convergence is difficult to achieve in many cases. We have used an
approach by combining CI-NEB and (improved)dimer methods to reduce the time. We
first run the CI-NEB for a hundred steps. If the convergence has not been achieved, we use
the half-optimized TS image as an input in the (improved)dimer approach to finding the
saddle point. However, it requires calculating the frequencies twice, once to get the
direction of acting force towards saddle point and the second time to confirm that TS is a
first-order saddle point.
3.3.14. Intrinsic Reaction coordinate (IRC)
To determine the authenticity of the optimized TS from earlier described methods, we
first need to calculate the frequencies. The TS is a first-order saddle point, so it should
contain only one single imaginary frequency. After the TS was verified, it has to go to
another confirmation to be able to prove that this is the TS that connects the two minima;
one corresponds to the reactant (initial image/substrate) and another one to the product
(final-image/product) (Figure 3-9). Once the saddle point has been found, the mapping
can be made from the gradient of energy downhill in both directions to connect it with its
initial and final state with a minimum energy path (MEP). [203] IRC is a mass-weighted
reaction coordinate on the steepest descent path in both directional vectors (reactant and
product). [210, 211, 214, 215]
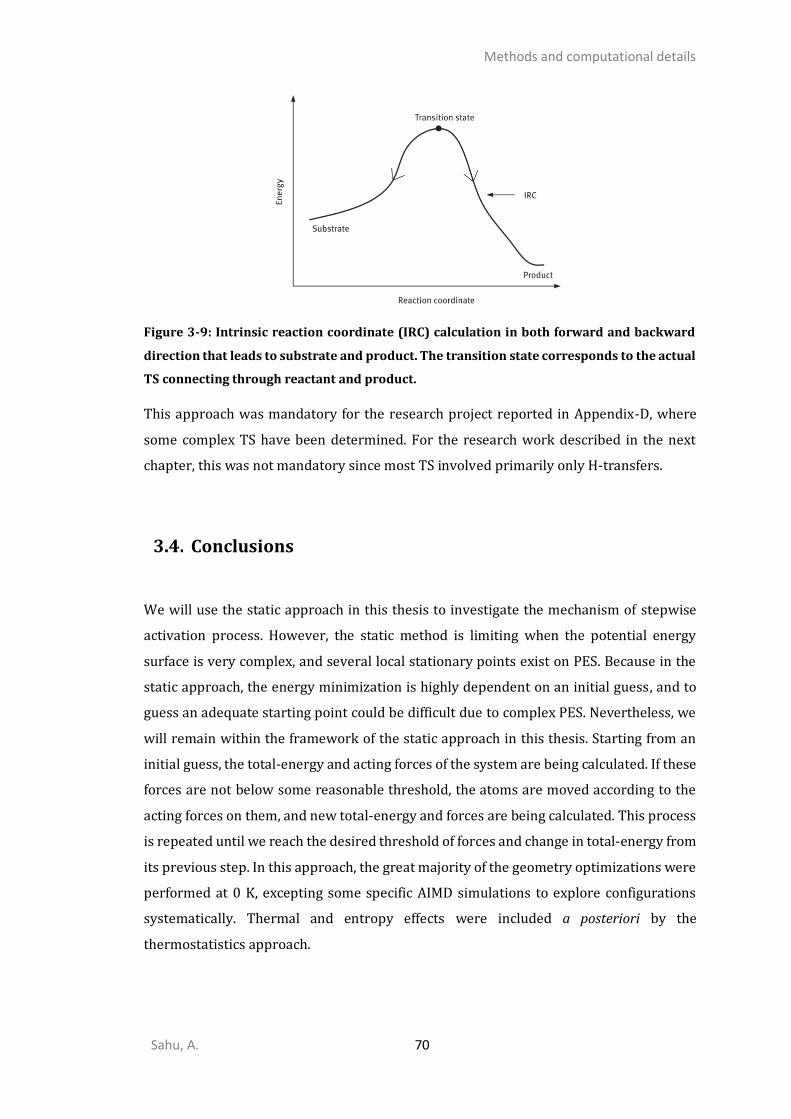
Methods and computational details
Sahu, A. 70
Figure 3-9: Intrinsic reaction coordinate (IRC) calculation in both forward and backward
direction that leads to substrate and product. The transition state corresponds to the actual
TS connecting through reactant and product.
This approach was mandatory for the research project reported in Appendix-D, where
some complex TS have been determined. For the research work described in the next
chapter, this was not mandatory since most TS involved primarily only H-transfers.
Conclusions
We will use the static approach in this thesis to investigate the mechanism of stepwise
activation process. However, the static method is limiting when the potential energy
surface is very complex, and several local stationary points exist on PES. Because in the
static approach, the energy minimization is highly dependent on an initial guess, and to
guess an adequate starting point could be difficult due to complex PES. Nevertheless, we
will remain within the framework of the static approach in this thesis. Starting from an
initial guess, the total-energy and acting forces of the system are being calculated. If these
forces are not below some reasonable threshold, the atoms are moved according to the
acting forces on them, and new total-energy and forces are being calculated. This process
is repeated until we reach the desired threshold of forces and change in total-energy from
its previous step. In this approach, the great majority of the geometry optimizations were
performed at 0 K, excepting some specific AIMD simulations to explore configurations
systematically. Thermal and entropy effects were included a posteriori by the
thermostatistics approach.
Methods and computational details
Sahu, A. 71
This chapter presented a brief summary of the underlying theory and methods we have
used in this thesis. We have described the approximation used in theory and their
limitations in some cases, basis set and exchange-correlation functional for the
investigation, methods to search the TS NEB, CI-NEB, dimer, and calculating the
frequencies and IR spectra (FD and DFPT). The methods section of the upcoming chapters
will describe specific details about the computational methods, parameters, and used
cutoff. We have used DFT as implemented in VASP with plane-wave basis sets, PBE
exchange-correlation functional within GGA approximation, PAW pseudopotential, and
dDsC dispersion correction. The choice of the basis sets, pseudopotentials, and dispersion
corrections are based on the earlier benchmarks done in the group.

Methods and computational details
Sahu, A. 72

Genesis of MoS2 from Mo-oxide precursors on 𝜸-alumina
Sahu, A. 73
Genesis of MoS2 from Mo-oxide precursors on 𝜸-alumina
The genesis of the MoS2 phase by activation of the HDS catalyst is one of the crucial and
complex processes in the refining industry. The activation dependency on several influencing
parameters challenges having an enviable understanding of the process. This chapter
explores how sulfidation occurs on Mo-oxides through our model oxide precursors, involved
intermediates, and what path sulfidation prefers to go after oxysulfide vs. trisulfide on the
(100)-surface of −alumina.
Introduction
As highlighted in the general introduction, MoS2 based materials represent a wide interest
for various catalytic and electrocatalytic applications such as hydrodesulfurization
process, hydrogen evolution reaction, etc. However, the catalytic performances strongly
depend on the sulfidation state resulting from the preparation steps. More particularly,
the final activation step is crucial for the transformation of the oxide precursor into the
targeted sulfided Mo material.
As detailed in the bibliography, the preparation of such Mo disulfides may require specific
Mo oxides precursors (such as polyoxomolybdates) impregnated on oxide support (such
as alumina) followed by various possible thermal treatments (drying/calcination). The
resulting supported Mo-oxides are finally activated by sulforeduction under H2/H2S gas
phase or with organo-sulfur compounds in the liquid phase at elevated temperature
(350°C).[7]
The activation step of -alumina supported molybdenum oxide precursor by sulfo-
reductive treatment remains a crucial step for the genesis of the industrial disulfide
molybdenum (MoS2) based active phase. Therefore, to improve the resulting properties
of these catalysts, it remains critical to understand better the genesis and activation steps
of these active phases from their oxide precursors.
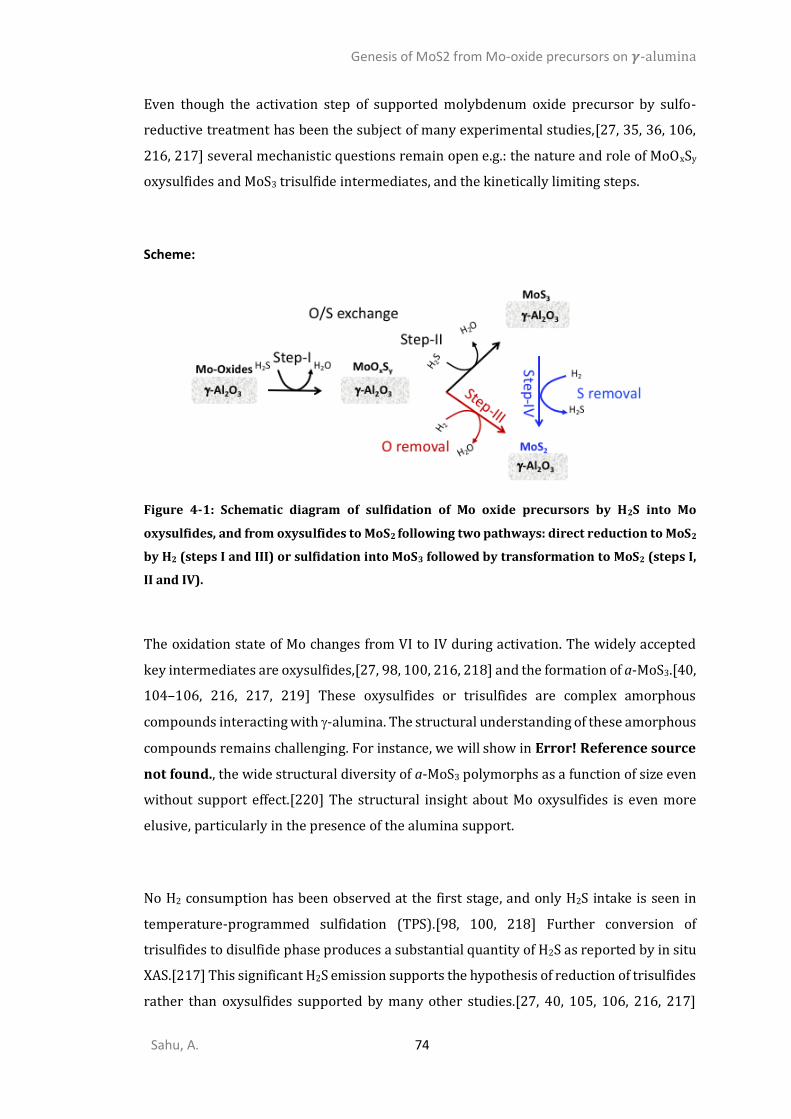
Genesis of MoS2 from Mo-oxide precursors on 𝜸-alumina
Sahu, A. 74
Even though the activation step of supported molybdenum oxide precursor by sulfo-
reductive treatment has been the subject of many experimental studies,[27, 35, 36, 106,
216, 217] several mechanistic questions remain open e.g.: the nature and role of MoOxSy
oxysulfides and MoS3 trisulfide intermediates, and the kinetically limiting steps.
Scheme:
Figure 4-1: Schematic diagram of sulfidation of Mo oxide precursors by H2S into Mo
oxysulfides, and from oxysulfides to MoS2 following two pathways: direct reduction to MoS2
by H2 (steps I and III) or sulfidation into MoS3 followed by transformation to MoS2 (steps I,
II and IV).
The oxidation state of Mo changes from VI to IV during activation. The widely accepted
key intermediates are oxysulfides,[27, 98, 100, 216, 218] and the formation of a-MoS3.[40,
104–106, 216, 217, 219] These oxysulfides or trisulfides are complex amorphous
compounds interacting with -alumina. The structural understanding of these amorphous
compounds remains challenging. For instance, we will show in Error! Reference source
not found., the wide structural diversity of a-MoS3 polymorphs as a function of size even
without support effect.[220] The structural insight about Mo oxysulfides is even more
elusive, particularly in the presence of the alumina support.
No H2 consumption has been observed at the first stage, and only H2S intake is seen in
temperature-programmed sulfidation (TPS).[98, 100, 218] Further conversion of
trisulfides to disulfide phase produces a substantial quantity of H2S as reported by in situ
XAS.[217] This significant H2S emission supports the hypothesis of reduction of trisulfides
rather than oxysulfides supported by many other studies.[27, 40, 105, 106, 216, 217]
Genesis of MoS2 from Mo-oxide precursors on 𝜸-alumina
Sahu, A. 75
Furthermore, it has been shown by some studies that H2S is the key reactant to allow the
formation of the MoS2 phase even without H2 uptake at an early stage.[98, 100, 104, 218,
221]. Therefore, if the MoS3 intermediate is involved, the activation process is proposed
to occur in two stages: O/S exchange with H2S[107, 218] leading to MoS3-phase[103, 104,
216] from MoO3-like species (steps I and II in Figure 4-1), followed by its transformation
to MoS2 phase thanks to H2 reduction (step IV). However, the possibility of direct
reduction of oxysulfide to the disulfide phase also exists (step-III).
At the same time, the various Mo-oxysulfides intermediate (MoIVOxSy, MoVOxSy, MoVIOxSy,)
supported on alumina are highly reactive towards sulfidation. Thus, identifying and
characterizing them remains crucial but challenging from an experimental point of view.
Time-resolved XAS and Raman spectroscopy on NiMo catalyst supported by Al2O3 gave
some essential insights due to its capacity to resolve pure spectra of intermediate species
by using multivariate curve regression with altering least-squares (MCR-ALS) method for
curve fitting.[222] Probing the intermediates is accomplished by using the solid
dehydrating condition that reduces the catalyst’s reactivity towards H2S.[223, 224] In
particular, in situ EXAFS enabled to follow the evolution of key bond lengths such as Mo-
O, Mo-S, Mo-Mo…[99, 106, 217] and to reveal some key intermediates such as MoOxSy and
MoS3. Also, by in situ Laser Raman Spectroscopy, the disappearance of some characteristic
top oxo-species Mo-Ot and the appearance of S22- and S2- species was analyzed as a
function of temperature.[217]
In addition, the final active state and respective intermediates could also be affected by
various other factors such as type of sulfidation (liquid or gas phase),[98, 99, 225], the
pressure of H2/H2S,[226] and chelating agent[219] added at impregnation. Gas-phase
sulfidation is commonly performed at 10-15% H2/H2S and 350-400°C, and liquid phase
sulfidation using real feed stoke (gasoil) and/or dimethyl-disulfide (DMDS) along with H2
flow. Therefore, the source of H2S may be dissolved in the liquid phase once it is generated
through DMDS decomposition at 230°C. This induces that sulfidation starts at a relatively
higher temperature around 230 °C in comparison with the gas phase where it starts as
early as around room temperature.[99, 227, 228] After 230 °C, as soon as the DMDS
dissociated and H2S is available for sulfidation, oxysulfide intermediates are rapidly
transformed into MoS3 and finally into MoS2. The initial slow rate might not be due to the
Genesis of MoS2 from Mo-oxide precursors on 𝜸-alumina
Sahu, A. 76
liquid phase’s intrinsic slower reactivity but rather because no H2S sulfiding agent is
available before the decomposition of DMDS.[98]
The key descriptors: Mo-Ot, Mo-O-Mo, Mo-S-Mo, Mo-Mo, and Mo-Al were identified for
both types of sulfidation. In addition, the absence of a shorter Mo-S bond leads to specific
proposals for oxysulfide intermediates.[99] Another exciting difference revealed by in-
situ XAS is that during liquid phase sulfidation, the delayed sulfidation temperature
induces the depolymerization of the polyoxomolybdate precursor between 80 to
230°C.[99] Hence, the smaller Mo-oxide oligomers (as small as dimers or trimers) highly
dispersed on the support are generated and will be the relevant oxide species involved in
sulfidation. For that reason, as explained in what follows, we will consider such Mo-oxide
oligomers as the starting species for the investigation of sulforeduction mechanisms.
Moreover, the gas phase sulfidation gives 1.5-1.8 times higher MoS2 stacking than that of
the liquid phase with similar mean particle size, and an increase in pressure affects the
activation positively. Furthermore, the remaining Mo, which is not sulfided, could be
independent oxidic or oxysulfide species separated from MoS2 stacked phase[226]
interpreted from Mo-O EXAFS data.
From a theoretical point of view, as it was presented in the bibliography, some DFT
studies focused on the stability of Mo-oxide oligomers either as isolated charged
polyoxomolybdates[154–157] or supported on alumina.[17, 153] Other DFT studies
focused on the interfacial structures of MoS2 clusters[33, 68, 229, 230] on alumina,[74,
77, 101] as a function of sulfo-reductive conditions found in the reactive environment or
on the thiolysis mechanisms of Mo-O-X linkages for X being various elements composing
the support such as Ti, Al, Si…[16, 167, 231]
However, to the best of our knowledge, there exists no published DFT investigation of the
sulfidation of Mo-oxides. In particular, numerous open questions remain about the
molecular-scale mechanisms of S/O exchanges and reduction steps involved in the
activation of Mo-oxides primarily when dispersed on a support such as an alumina.
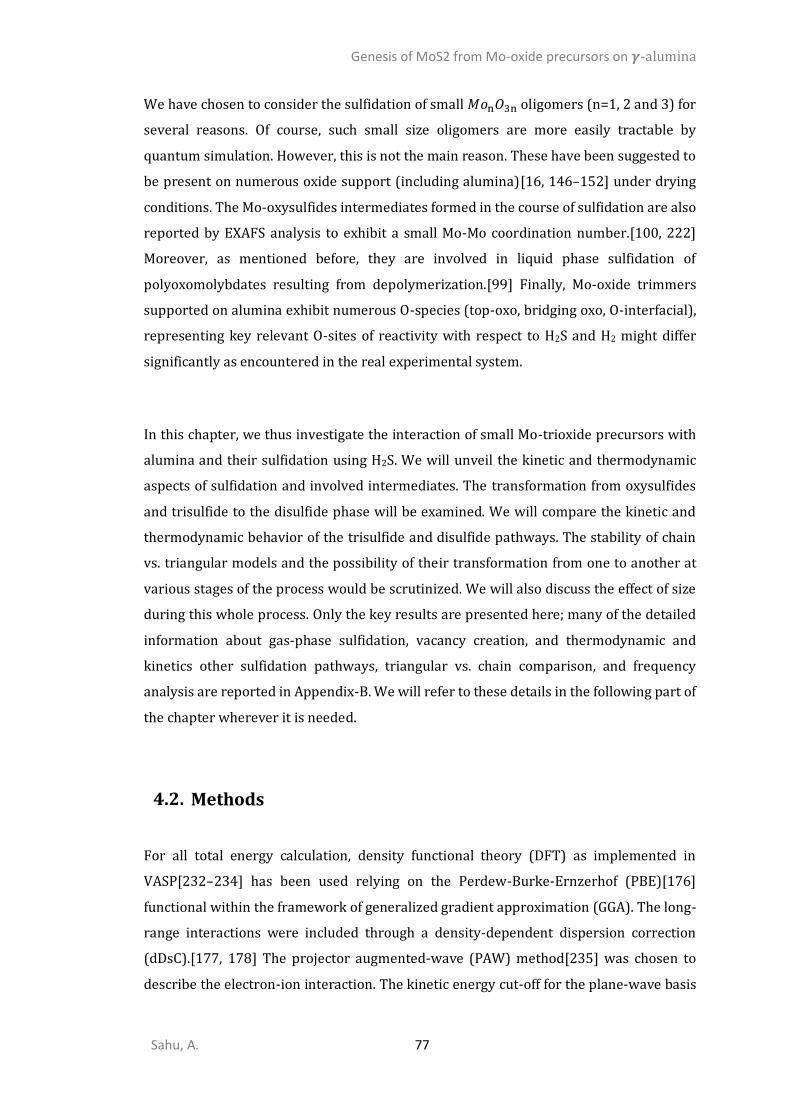
Genesis of MoS2 from Mo-oxide precursors on 𝜸-alumina
Sahu, A. 77
We have chosen to consider the sulfidation of small 𝑀𝑜n𝑂3n oligomers (n=1, 2 and 3) for
several reasons. Of course, such small size oligomers are more easily tractable by
quantum simulation. However, this is not the main reason. These have been suggested to
be present on numerous oxide support (including alumina)[16, 146–152] under drying
conditions. The Mo-oxysulfides intermediates formed in the course of sulfidation are also
reported by EXAFS analysis to exhibit a small Mo-Mo coordination number.[100, 222]
Moreover, as mentioned before, they are involved in liquid phase sulfidation of
polyoxomolybdates resulting from depolymerization.[99] Finally, Mo-oxide trimmers
supported on alumina exhibit numerous O-species (top-oxo, bridging oxo, O-interfacial),
representing key relevant O-sites of reactivity with respect to H2S and H2 might differ
significantly as encountered in the real experimental system.
In this chapter, we thus investigate the interaction of small Mo-trioxide precursors with
alumina and their sulfidation using H2S. We will unveil the kinetic and thermodynamic
aspects of sulfidation and involved intermediates. The transformation from oxysulfides
and trisulfide to the disulfide phase will be examined. We will compare the kinetic and
thermodynamic behavior of the trisulfide and disulfide pathways. The stability of chain
vs. triangular models and the possibility of their transformation from one to another at
various stages of the process would be scrutinized. We will also discuss the effect of size
during this whole process. Only the key results are presented here; many of the detailed
information about gas-phase sulfidation, vacancy creation, and thermodynamic and
kinetics other sulfidation pathways, triangular vs. chain comparison, and frequency
analysis are reported in Appendix-B. We will refer to these details in the following part of
the chapter wherever it is needed.
Methods
For all total energy calculation, density functional theory (DFT) as implemented in
VASP[232–234] has been used relying on the Perdew-Burke-Ernzerhof (PBE)[176]
functional within the framework of generalized gradient approximation (GGA). The long-
range interactions were included through a density-dependent dispersion correction
(dDsC).[177, 178] The projector augmented-wave (PAW) method[235] was chosen to
describe the electron-ion interaction. The kinetic energy cut-off for the plane-wave basis
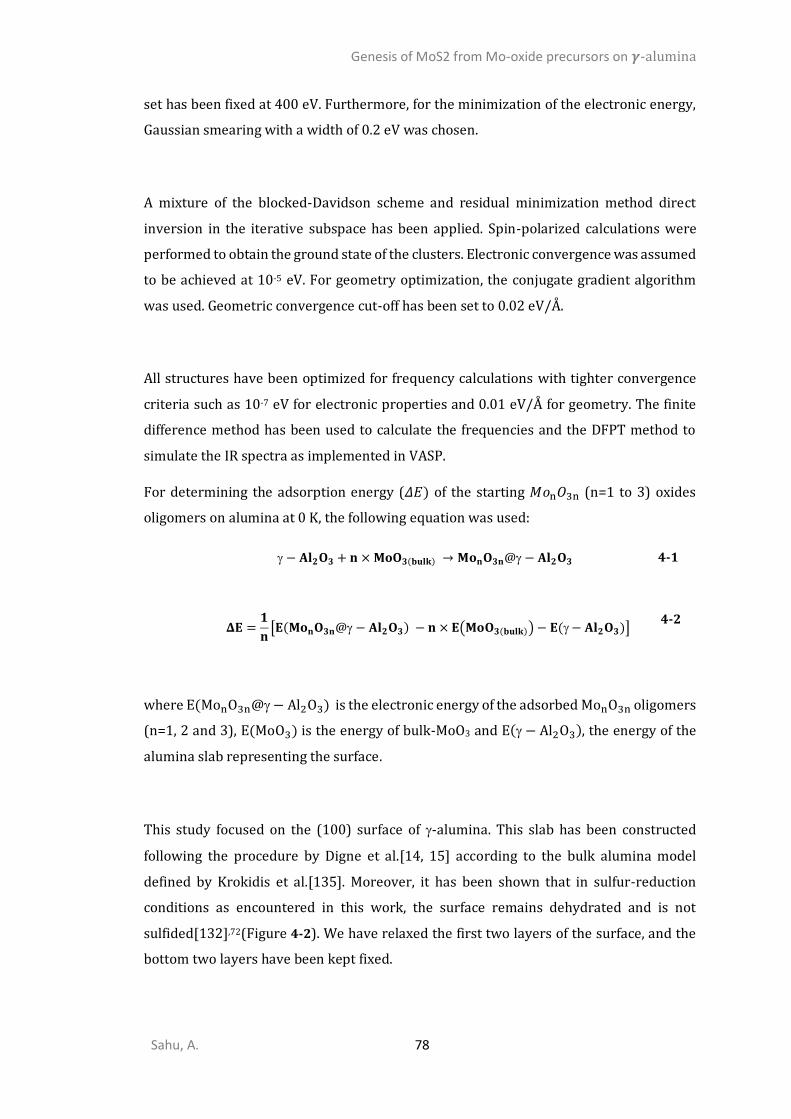
Genesis of MoS2 from Mo-oxide precursors on 𝜸-alumina
Sahu, A. 78
set has been fixed at 400 eV. Furthermore, for the minimization of the electronic energy,
Gaussian smearing with a width of 0.2 eV was chosen.
A mixture of the blocked-Davidson scheme and residual minimization method direct
inversion in the iterative subspace has been applied. Spin-polarized calculations were
performed to obtain the ground state of the clusters. Electronic convergence was assumed
to be achieved at 10-5 eV. For geometry optimization, the conjugate gradient algorithm
was used. Geometric convergence cut-off has been set to 0.02 eV/Å.
All structures have been optimized for frequency calculations with tighter convergence
criteria such as 10-7 eV for electronic properties and 0.01 eV/Å for geometry. The finite
difference method has been used to calculate the frequencies and the DFPT method to
simulate the IR spectra as implemented in VASP.
For determining the adsorption energy (𝛥𝐸) of the starting 𝑀𝑜n𝑂3n (n=1 to 3) oxides
oligomers on alumina at 0 K, the following equation was used:
− 𝐀𝐥𝟐𝐎𝟑 + 𝐧 × 𝐌𝐨𝐎𝟑(𝐛𝐮𝐥𝐤) → 𝐌𝐨𝐧𝐎𝟑𝐧@ − 𝐀𝐥𝟐𝐎𝟑 4-1
𝚫𝐄 =𝟏
𝐧[𝐄(𝐌𝐨𝐧𝐎𝟑𝐧@ − 𝐀𝐥𝟐𝐎𝟑) − 𝐧 × 𝐄(𝐌𝐨𝐎𝟑(𝐛𝐮𝐥𝐤)) − 𝐄( − 𝐀𝐥𝟐𝐎𝟑)]
4-2
where E(MonO3n@ − Al2O3) is the electronic energy of the adsorbed MonO3n oligomers
(n=1, 2 and 3), E(MoO3) is the energy of bulk-MoO3 and E( − Al2O3), the energy of the
alumina slab representing the surface.
This study focused on the (100) surface of -alumina. This slab has been constructed
following the procedure by Digne et al.[14, 15] according to the bulk alumina model
defined by Krokidis et al.[135]. Moreover, it has been shown that in sulfur-reduction
conditions as encountered in this work, the surface remains dehydrated and is not
sulfided[132],72(Figure 4-2). We have relaxed the first two layers of the surface, and the
bottom two layers have been kept fixed.

Genesis of MoS2 from Mo-oxide precursors on 𝜸-alumina
Sahu, A. 79
Figure 4-2: Molecular model of the (100) surface of 𝜸-alumina[132]. a) side view and b) top
view of the surface. Balls and sticks represent the movable slab, and lines represent the
fixed slab. (Color code−Red: O, pink: Al).
Once we have identified the most stable adsorption site for the Mo-oxide cluster on the
surface, we assume that the adsorbed cluster will not move or diffuse on the surface in
the course of the sulfo-reduction mechanism. This assumption is based on the strong Mo-
oxide or Mo-oxysulfide support interaction shown later in the results section. This does
not exclude that locally the anchoring sites evolve as a function of sulfidation.
To determine the O/S exchange thermochemistry energy at 0K, which occurs through H2S
adsorption either on oxide-cluster or support, we used the following equation:
𝐌𝐨𝐧𝐎𝟑𝐧@ − 𝐀𝐥𝟐𝐎𝟑 + 𝐱𝐇𝟐𝐒 → 𝐌𝐨𝐧𝐎𝟑𝐧−𝐱𝐒𝐱@ − 𝐀𝐥𝟐𝐎𝟑 + 𝐱𝐇𝟐𝐎 4-3
𝚫𝐄 = [𝐄(𝐌𝐨𝐧𝐎𝟑𝐧−𝐱𝐒𝐱@ − 𝐀𝐥𝟐𝐎𝟑) + 𝐱𝐄(𝐇𝟐𝐎) − 𝐄(𝐌𝐨𝐧𝐎𝟑𝐧@ − 𝐀𝐥𝟐𝐎𝟑)
− 𝐱𝐄(𝐇𝟐𝐒)]
4-4
where E(MonO3n−xSx@ − Al2O3) is the energy of alumina supported oxysulfide after x
number of O/S exchanges, E(H2O) is the energy of water, E(MonO3n@ − Al2O3) is the
energy of pure oxide, and E(H2S) is the energy of H2S. To calculate the energy change
during a single O/S exchange, we have used the following equation:
𝑴𝒐𝒏𝑶𝟑𝒏−𝒙𝑺𝒙@ − 𝐀𝐥𝟐𝐎𝟑 + 𝑯𝟐𝑺 → 𝑴𝒐𝒏𝑶𝟑𝒏−𝒙−𝟏𝑺𝒙+𝟏@ − 𝐀𝐥𝟐𝐎𝟑 + 𝑯𝟐𝑶 4-5
𝚫𝐄 = [
𝐄(𝐌𝐨𝐧𝐎𝟑𝐧−𝐱−𝟏𝐒𝐱+𝟏@ − 𝐀𝐥𝟐𝐎𝟑) + 𝐄(𝐇𝟐𝐎)
−𝐄(𝐌𝐨𝐧𝐎𝟑𝐧−𝐱𝐒𝐱@ − 𝐀𝐥𝟐𝐎𝟑) − 𝐄(𝐇𝟐𝐒)]
4-6
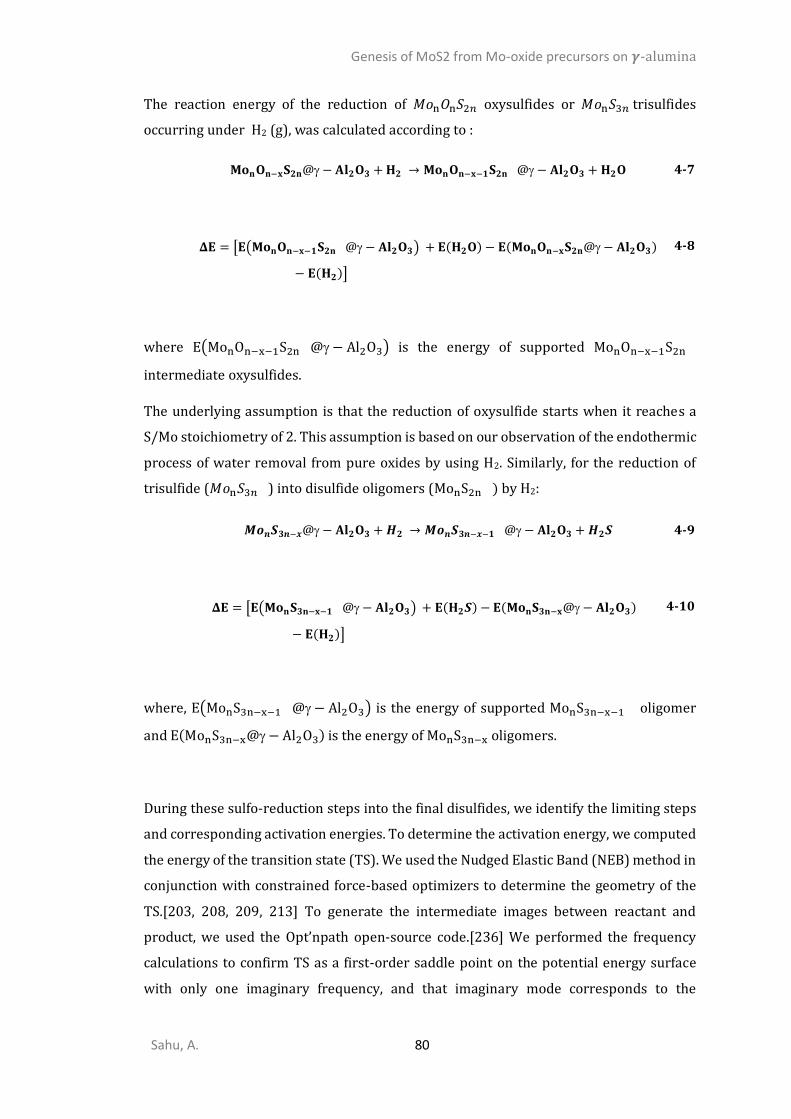
Genesis of MoS2 from Mo-oxide precursors on 𝜸-alumina
Sahu, A. 80
The reaction energy of the reduction of 𝑀𝑜n𝑂n𝑆2𝑛 oxysulfides or 𝑀𝑜n𝑆3𝑛 trisulfides
occurring under H2 (g), was calculated according to :
𝐌𝐨𝐧𝐎𝐧−𝐱𝐒𝟐𝐧@ − 𝐀𝐥𝟐𝐎𝟑 + 𝐇𝟐 → 𝐌𝐨𝐧𝐎𝐧−𝐱−𝟏𝐒𝟐𝐧 @ − 𝐀𝐥𝟐𝐎𝟑 + 𝐇𝟐𝐎 4-7
𝚫𝐄 = [𝐄(𝐌𝐨𝐧𝐎𝐧−𝐱−𝟏𝐒𝟐𝐧 @ − 𝐀𝐥𝟐𝐎𝟑) + 𝐄(𝐇𝟐𝐎) − 𝐄(𝐌𝐨𝐧𝐎𝐧−𝐱𝐒𝟐𝐧@ − 𝐀𝐥𝟐𝐎𝟑)
− 𝐄(𝐇𝟐)]
4-8
where E(MonOn−x−1S2n @ − Al2O3) is the energy of supported MonOn−x−1S2n
intermediate oxysulfides.
The underlying assumption is that the reduction of oxysulfide starts when it reaches a
S/Mo stoichiometry of 2. This assumption is based on our observation of the endothermic
process of water removal from pure oxides by using H2. Similarly, for the reduction of
trisulfide (𝑀𝑜n𝑆3𝑛 ) into disulfide oligomers (MonS2n ) by H2:
𝑴𝒐𝒏𝑺𝟑𝒏−𝒙@ − 𝐀𝐥𝟐𝐎𝟑 + 𝑯𝟐 → 𝑴𝒐𝒏𝑺𝟑𝒏−𝒙−𝟏 @ − 𝐀𝐥𝟐𝐎𝟑 + 𝑯𝟐𝑺 4-9
𝚫𝐄 = [𝐄(𝐌𝐨𝐧𝐒𝟑𝐧−𝐱−𝟏 @ − 𝐀𝐥𝟐𝐎𝟑) + 𝐄(𝐇𝟐𝑺) − 𝐄(𝐌𝐨𝐧𝐒𝟑𝐧−𝐱@ − 𝐀𝐥𝟐𝐎𝟑)
− 𝐄(𝐇𝟐)]
4-10
where, E(MonS3n−x−1 @ − Al2O3) is the energy of supported MonS3n−x−1 oligomer
and E(MonS3n−x@ − Al2O3) is the energy of MonS3n−x oligomers.
During these sulfo-reduction steps into the final disulfides, we identify the limiting steps
and corresponding activation energies. To determine the activation energy, we computed
the energy of the transition state (TS). We used the Nudged Elastic Band (NEB) method in
conjunction with constrained force-based optimizers to determine the geometry of the
TS.[203, 208, 209, 213] To generate the intermediate images between reactant and
product, we used the Opt’npath open-source code.[236] We performed the frequency
calculations to confirm TS as a first-order saddle point on the potential energy surface
with only one imaginary frequency, and that imaginary mode corresponds to the
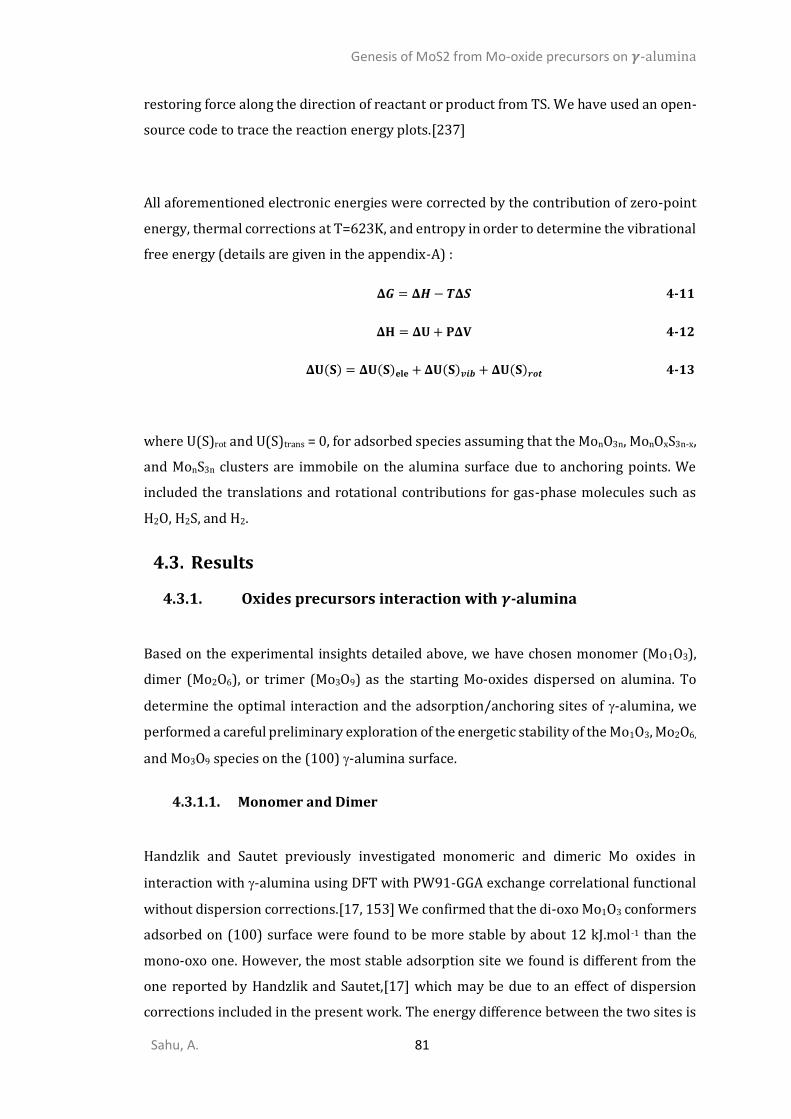
Genesis of MoS2 from Mo-oxide precursors on 𝜸-alumina
Sahu, A. 81
restoring force along the direction of reactant or product from TS. We have used an open-
source code to trace the reaction energy plots.[237]
All aforementioned electronic energies were corrected by the contribution of zero-point
energy, thermal corrections at T=623K, and entropy in order to determine the vibrational
free energy (details are given in the appendix-A) :
𝚫𝑮 = 𝚫𝑯 − 𝑻𝚫𝑺 4-11
𝚫𝐇 = 𝚫𝐔 + 𝐏𝚫𝐕 4-12
𝚫𝐔(𝐒) = 𝚫𝐔(𝐒)𝐞𝐥𝐞 + 𝚫𝐔(𝐒)𝒗𝒊𝒃 + 𝚫𝐔(𝐒)𝒓𝒐𝒕 4-13
where U(S)rot and U(S)trans = 0, for adsorbed species assuming that the MonO3n, MonOxS3n-x,
and MonS3n clusters are immobile on the alumina surface due to anchoring points. We
included the translations and rotational contributions for gas-phase molecules such as
H2O, H2S, and H2.
Results
4.3.1. Oxides precursors interaction with 𝜸-alumina
Based on the experimental insights detailed above, we have chosen monomer (Mo1O3),
dimer (Mo2O6), or trimer (Mo3O9) as the starting Mo-oxides dispersed on alumina. To
determine the optimal interaction and the adsorption/anchoring sites of -alumina, we
performed a careful preliminary exploration of the energetic stability of the Mo1O3, Mo2O6,
and Mo3O9 species on the (100) -alumina surface.
Monomer and Dimer
Handzlik and Sautet previously investigated monomeric and dimeric Mo oxides in
interaction with -alumina using DFT with PW91-GGA exchange correlational functional
without dispersion corrections.[17, 153] We confirmed that the di-oxo Mo1O3 conformers
adsorbed on (100) surface were found to be more stable by about 12 kJ.mol-1 than the
mono-oxo one. However, the most stable adsorption site we found is different from the
one reported by Handzlik and Sautet,[17] which may be due to an effect of dispersion
corrections included in the present work. The energy difference between the two sites is
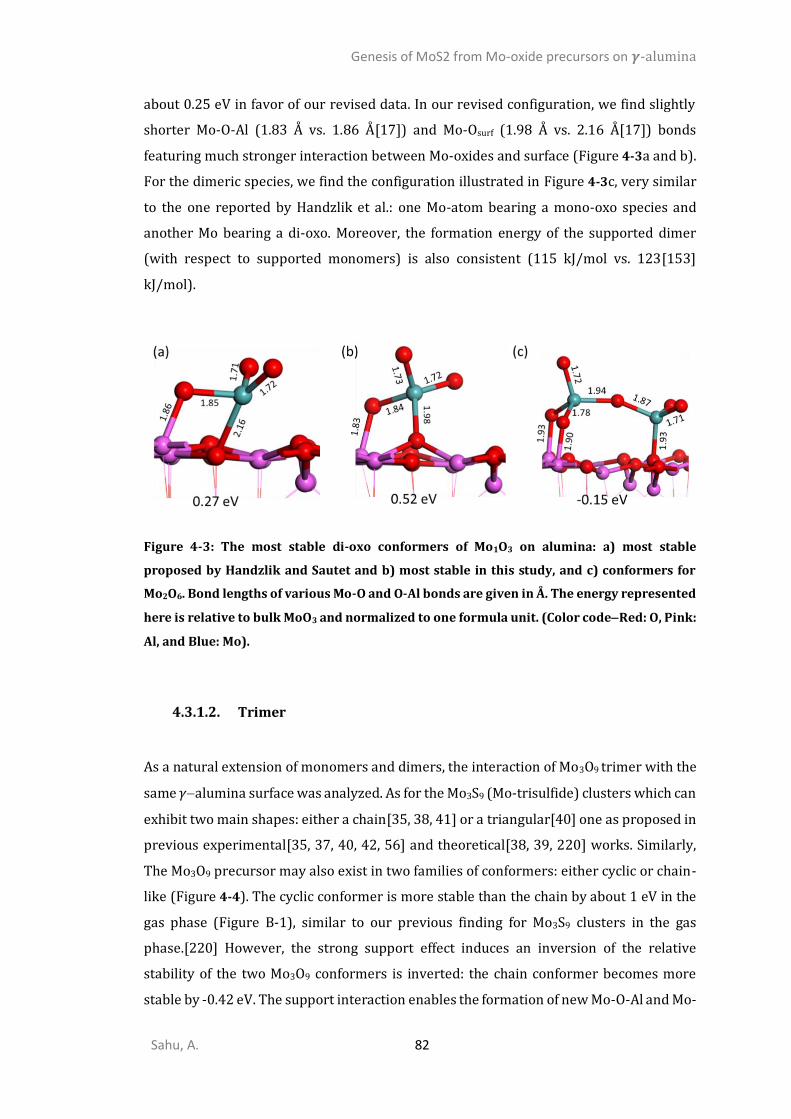
Genesis of MoS2 from Mo-oxide precursors on 𝜸-alumina
Sahu, A. 82
about 0.25 eV in favor of our revised data. In our revised configuration, we find slightly
shorter Mo-O-Al (1.83 Å vs. 1.86 Å[17]) and Mo-Osurf (1.98 Å vs. 2.16 Å[17]) bonds
featuring much stronger interaction between Mo-oxides and surface (Figure 4-3a and b).
For the dimeric species, we find the configuration illustrated in Figure 4-3c, very similar
to the one reported by Handzlik et al.: one Mo-atom bearing a mono-oxo species and
another Mo bearing a di-oxo. Moreover, the formation energy of the supported dimer
(with respect to supported monomers) is also consistent (115 kJ/mol vs. 123[153]
kJ/mol).
Figure 4-3: The most stable di-oxo conformers of Mo1O3 on alumina: a) most stable
proposed by Handzlik and Sautet and b) most stable in this study, and c) conformers for
Mo2O6. Bond lengths of various Mo-O and O-Al bonds are given in Å. The energy represented
here is relative to bulk MoO3 and normalized to one formula unit. (Color code−Red: O, Pink:
Al, and Blue: Mo).
Trimer
As a natural extension of monomers and dimers, the interaction of Mo3O9 trimer with the
same 𝛾−alumina surface was analyzed. As for the Mo3S9 (Mo-trisulfide) clusters which can
exhibit two main shapes: either a chain[35, 38, 41] or a triangular[40] one as proposed in
previous experimental[35, 37, 40, 42, 56] and theoretical[38, 39, 220] works. Similarly,
The Mo3O9 precursor may also exist in two families of conformers: either cyclic or chain-
like (Figure 4-4). The cyclic conformer is more stable than the chain by about 1 eV in the
gas phase (Figure B-1), similar to our previous finding for Mo3S9 clusters in the gas
phase.[220] However, the strong support effect induces an inversion of the relative
stability of the two Mo3O9 conformers is inverted: the chain conformer becomes more
stable by -0.42 eV. The support interaction enables the formation of new Mo-O-Al and Mo-
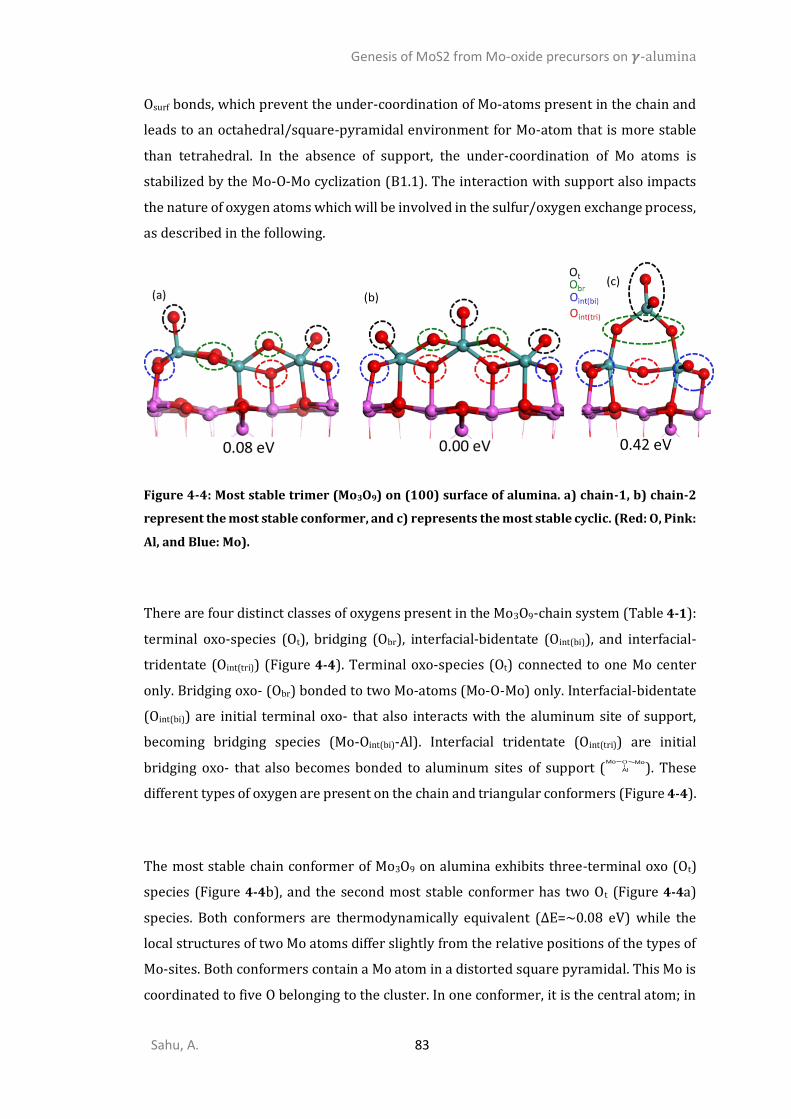
Genesis of MoS2 from Mo-oxide precursors on 𝜸-alumina
Sahu, A. 83
Osurf bonds, which prevent the under-coordination of Mo-atoms present in the chain and
leads to an octahedral/square-pyramidal environment for Mo-atom that is more stable
than tetrahedral. In the absence of support, the under-coordination of Mo atoms is
stabilized by the Mo-O-Mo cyclization (B1.1). The interaction with support also impacts
the nature of oxygen atoms which will be involved in the sulfur/oxygen exchange process,
as described in the following.
Figure 4-4: Most stable trimer (Mo3O9) on (100) surface of alumina. a) chain-1, b) chain-2
represent the most stable conformer, and c) represents the most stable cyclic. (Red: O, Pink:
Al, and Blue: Mo).
There are four distinct classes of oxygens present in the Mo3O9-chain system (Table 4-1):
terminal oxo-species (Ot), bridging (Obr), interfacial-bidentate (Oint(bi)), and interfacial-
tridentate (Oint(tri)) (Figure 4-4). Terminal oxo-species (Ot) connected to one Mo center
only. Bridging oxo- (Obr) bonded to two Mo-atoms (Mo-O-Mo) only. Interfacial-bidentate
(Oint(bi)) are initial terminal oxo- that also interacts with the aluminum site of support,
becoming bridging species (Mo-Oint(bi)-Al). Interfacial tridentate (Oint(tri)) are initial
bridging oxo- that also becomes bonded to aluminum sites of support (O
Al
MoMo
). These
different types of oxygen are present on the chain and triangular conformers (Figure 4-4).
The most stable chain conformer of Mo3O9 on alumina exhibits three-terminal oxo (Ot)
species (Figure 4-4b), and the second most stable conformer has two Ot (Figure 4-4a)
species. Both conformers are thermodynamically equivalent (ΔE=~0.08 eV) while the
local structures of two Mo atoms differ slightly from the relative positions of the types of
Mo-sites. Both conformers contain a Mo atom in a distorted square pyramidal. This Mo is
coordinated to five O belonging to the cluster. In one conformer, it is the central atom; in
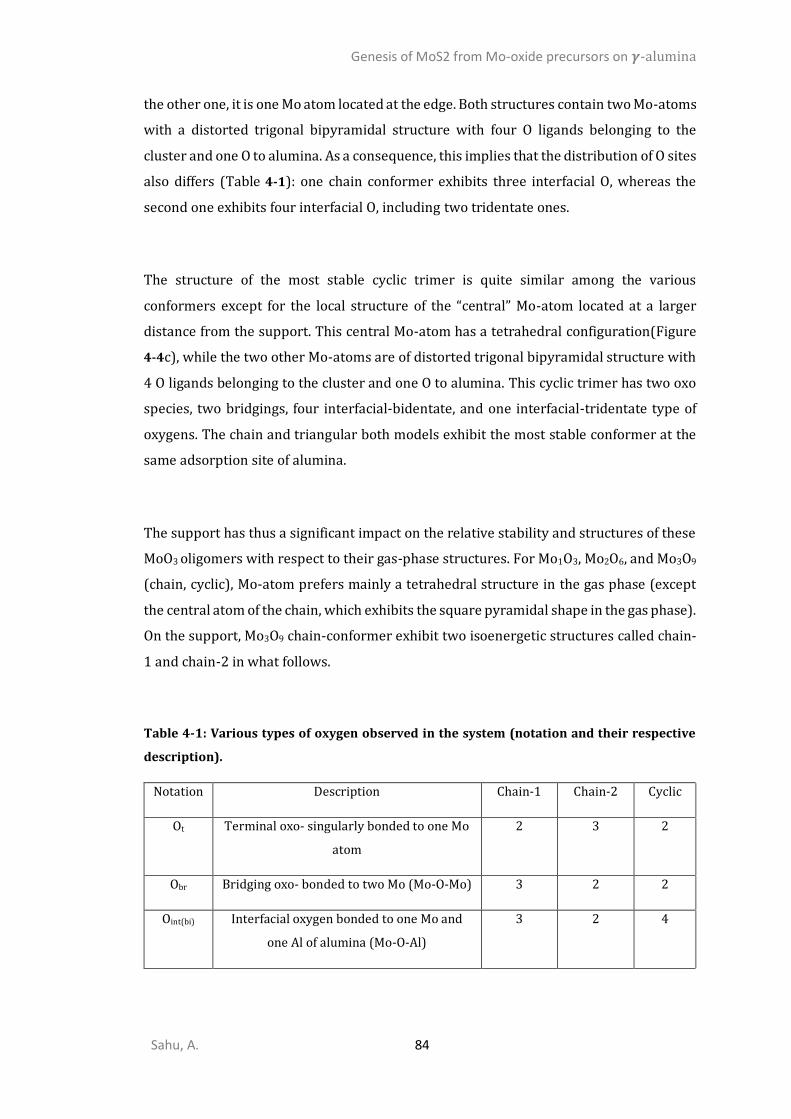
Genesis of MoS2 from Mo-oxide precursors on 𝜸-alumina
Sahu, A. 84
the other one, it is one Mo atom located at the edge. Both structures contain two Mo-atoms
with a distorted trigonal bipyramidal structure with four O ligands belonging to the
cluster and one O to alumina. As a consequence, this implies that the distribution of O sites
also differs (Table 4-1): one chain conformer exhibits three interfacial O, whereas the
second one exhibits four interfacial O, including two tridentate ones.
The structure of the most stable cyclic trimer is quite similar among the various
conformers except for the local structure of the “central” Mo-atom located at a larger
distance from the support. This central Mo-atom has a tetrahedral configuration(Figure
4-4c), while the two other Mo-atoms are of distorted trigonal bipyramidal structure with
4 O ligands belonging to the cluster and one O to alumina. This cyclic trimer has two oxo
species, two bridgings, four interfacial-bidentate, and one interfacial-tridentate type of
oxygens. The chain and triangular both models exhibit the most stable conformer at the
same adsorption site of alumina.
The support has thus a significant impact on the relative stability and structures of these
MoO3 oligomers with respect to their gas-phase structures. For Mo1O3, Mo2O6, and Mo3O9
(chain, cyclic), Mo-atom prefers mainly a tetrahedral structure in the gas phase (except
the central atom of the chain, which exhibits the square pyramidal shape in the gas phase).
On the support, Mo3O9 chain-conformer exhibit two isoenergetic structures called chain-
1 and chain-2 in what follows.
Table 4-1: Various types of oxygen observed in the system (notation and their respective
description).
Notation Description Chain-1 Chain-2 Cyclic
Ot Terminal oxo- singularly bonded to one Mo
atom
2 3 2
Obr Bridging oxo- bonded to two Mo (Mo-O-Mo) 3 2 2
Oint(bi) Interfacial oxygen bonded to one Mo and
one Al of alumina (Mo-O-Al)
3 2 4

Genesis of MoS2 from Mo-oxide precursors on 𝜸-alumina
Sahu, A. 85
Oint(tri) Interfacial oxygen bonded to two Mo of
cluster and on Al of support (O
Al
MoMo
)
1 2 1
Osurf Oxygen from support interacting with Mo of
the cluster
2 2 2
4.3.2. Oxygen/Sulfur exchange Mo-oxides on alumina
Thermodynamic aspects
The supported oxide oligomers are expected to undergo a sulfo-reduction process to form
oxysulfides or trisulfides intermediates, followed by their further transformation to the
final disulfide phase. The cyclic conformers are more stable in the gas phase than the chain
along the entire sulfidation path leading to the trisulfide phase (Figure B-5). By contrast,
the support reverses this, which highlights the strong effect of alumina (Figure 4-5). Thus,
on alumina, we will focus on the chain conformers. The thermodynamic analysis of the
oxygen/sulfur exchange involving H2S as reactant and H2O as a product (Figure 4-5) will
give insights into which oxygens are easily exchangeable and which ones are more energy
demanding in order to select the most relevant paths for the subsequent kinetic analysis
According to the various types of oxygen sites identified earlier (Table 4-1), we examined
the O/S exchange for chain-1, chain-2, and cyclic (Figure 4-5). Two possible paths (path-
1 and -2) were found for the chain-1 conformer.
The O/S replacement on path-1 of chain-1 occurs in a more homogeneous way than on
path-2 (Figure B-8 and Figure B-9). On path-1, the three Mo-atoms become all partially
sulfided (connected to one S-atom, Figure B-8) at step 2 already, whereas on path-2, only
two Mo-atoms are sulfided up till 5’ (Figure B-9). The first two steps of path-1 and path-2
are similar and involve bridging O-sites in O/S exchange. However, the main difference
arises at the third and fourth steps where path-1 replaces the terminal oxygen, while
path-2 prefers the interfacial (Oint(bi)).

Genesis of MoS2 from Mo-oxide precursors on 𝜸-alumina
Sahu, A. 86
Even though step three is slightly less promising for path-2, the gain in free energy at the
4th step for path-2 is huge, about -0.8 eV (Figure 4-5). This enhanced stability comes from
the formation of S2-dimer replacing two adjacent Oint(bi) by S. Path-1 favors the
replacement Oint(bi) and Oint(tri) after the bridging and terminal oxygen. At step seven, path-
1 can be linked to path-2 by dissociation the half-bridged dimer formed at step 6 and
creating a new dimer with S appeared at step 7. The dissociation requires activation
energy of 0.45 eV, and the formation of new terminal S2 dimer results in -0.5 eV
stabilization.
Thus, we propose that either the two paths co-exist or that a mixed solution combining
path-1 until step 7 and a transition to path-2 after step 7 will lead to the formation of the
most stable chain-Mo3S9. Path-2 also discards the compatibility of chain-2 as the formed
trisulfide is almost 1 eV less stable.
Figure 4-5: Thermodynamic energy profile of O/S exchange a) at 0 K for various Mo-oxide
on alumina with alumina adsorbed Mo1O3 as a reference and b) electronic energy at 0 K and
Gibbs free energy at 625 K for the chain-1-trimer Mo3O9 according to path-1 and path-2 with
alumina adsorbed Mo3O9 as reference. The possible transition between Path-1 to Path-2
exists at step 7.
Chain-2 (Figure B-11) and cyclic (Figure B-7) conformers follow the general trend of O/S
exchange: the bridging and terminal oxo-sites are being replaced first, followed by Oint(bi)
and Oint(tri). The possibility of a similar effect of Oint(bi) being replaced first and leading to
the formation of S2-dimer providing additional stability also exists for chain-2 and cyclic
conformers. The appearance of the S2-dimer increases the stability of chain-2 and cyclic
by 0.44 eV and 0.46 eV from their non-dimer states, respectively. This observation is
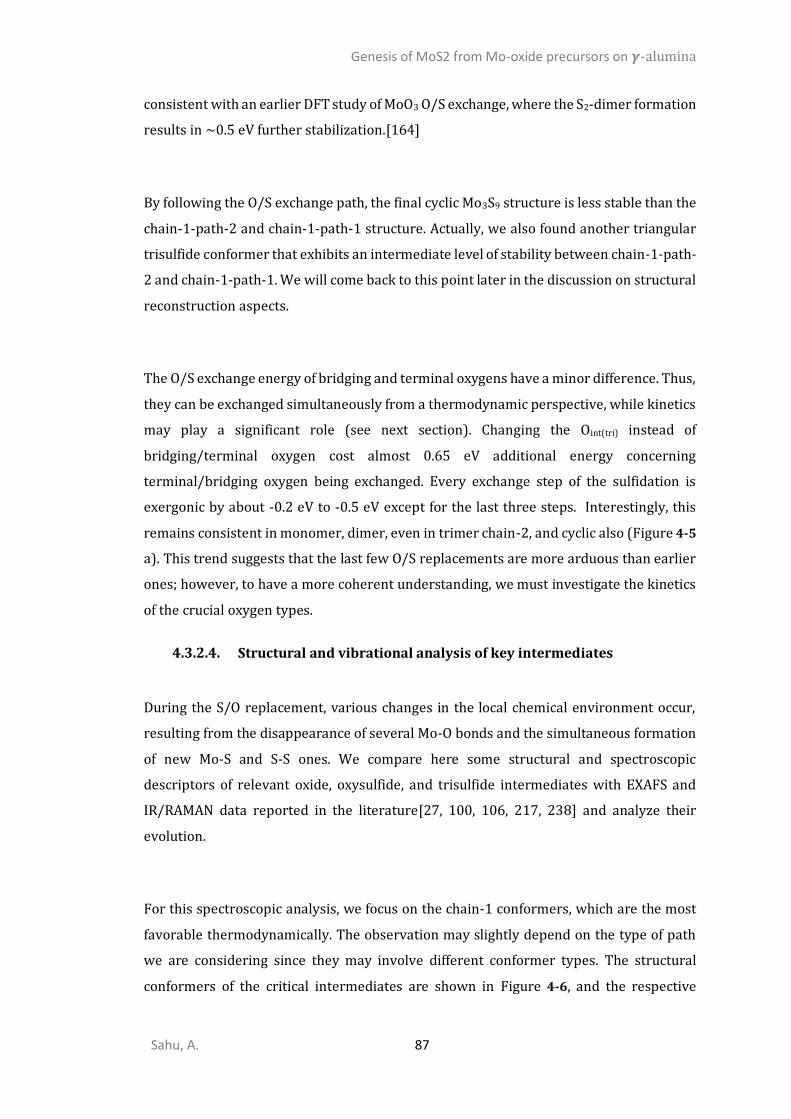
Genesis of MoS2 from Mo-oxide precursors on 𝜸-alumina
Sahu, A. 87
consistent with an earlier DFT study of MoO3 O/S exchange, where the S2-dimer formation
results in ~0.5 eV further stabilization.[164]
By following the O/S exchange path, the final cyclic Mo3S9 structure is less stable than the
chain-1-path-2 and chain-1-path-1 structure. Actually, we also found another triangular
trisulfide conformer that exhibits an intermediate level of stability between chain-1-path-
2 and chain-1-path-1. We will come back to this point later in the discussion on structural
reconstruction aspects.
The O/S exchange energy of bridging and terminal oxygens have a minor difference. Thus,
they can be exchanged simultaneously from a thermodynamic perspective, while kinetics
may play a significant role (see next section). Changing the Oint(tri) instead of
bridging/terminal oxygen cost almost 0.65 eV additional energy concerning
terminal/bridging oxygen being exchanged. Every exchange step of the sulfidation is
exergonic by about -0.2 eV to -0.5 eV except for the last three steps. Interestingly, this
remains consistent in monomer, dimer, even in trimer chain-2, and cyclic also (Figure 4-5
a). This trend suggests that the last few O/S replacements are more arduous than earlier
ones; however, to have a more coherent understanding, we must investigate the kinetics
of the crucial oxygen types.
Structural and vibrational analysis of key intermediates
During the S/O replacement, various changes in the local chemical environment occur,
resulting from the disappearance of several Mo-O bonds and the simultaneous formation
of new Mo-S and S-S ones. We compare here some structural and spectroscopic
descriptors of relevant oxide, oxysulfide, and trisulfide intermediates with EXAFS and
IR/RAMAN data reported in the literature[27, 100, 106, 217, 238] and analyze their
evolution.
For this spectroscopic analysis, we focus on the chain-1 conformers, which are the most
favorable thermodynamically. The observation may slightly depend on the type of path
we are considering since they may involve different conformer types. The structural
conformers of the critical intermediates are shown in Figure 4-6, and the respective
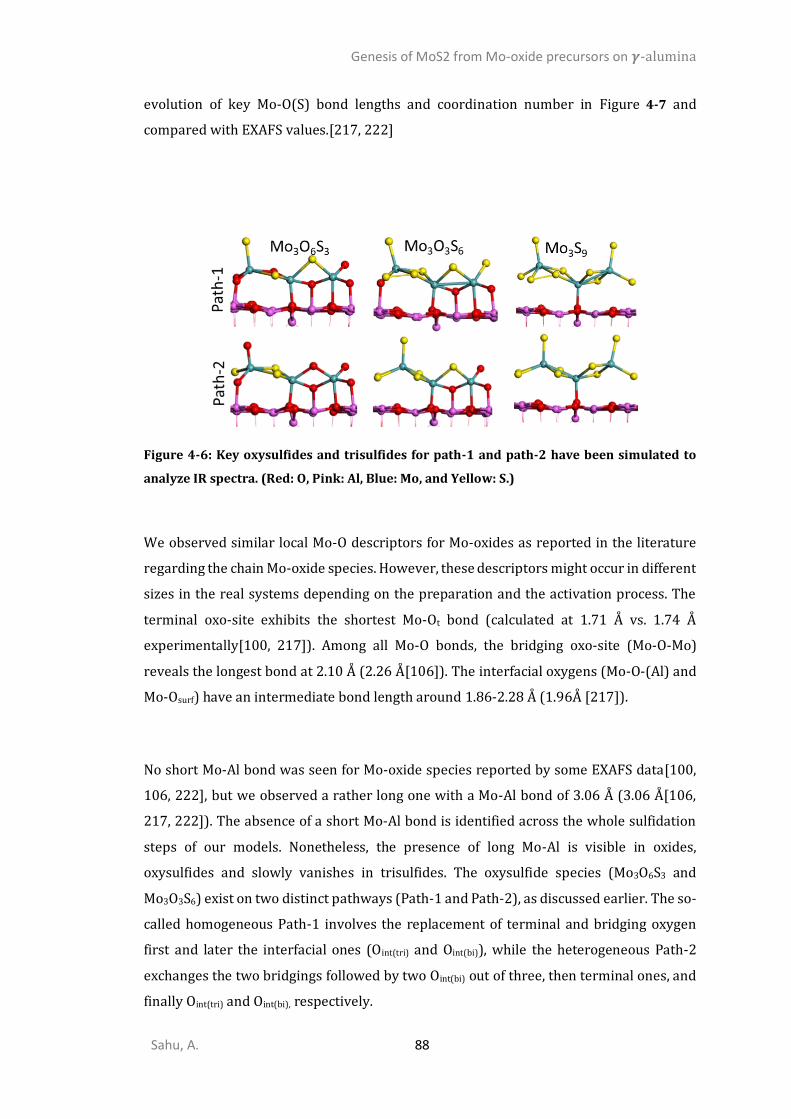
Genesis of MoS2 from Mo-oxide precursors on 𝜸-alumina
Sahu, A. 88
evolution of key Mo-O(S) bond lengths and coordination number in Figure 4-7 and
compared with EXAFS values.[217, 222]
Figure 4-6: Key oxysulfides and trisulfides for path-1 and path-2 have been simulated to
analyze IR spectra. (Red: O, Pink: Al, Blue: Mo, and Yellow: S.)
We observed similar local Mo-O descriptors for Mo-oxides as reported in the literature
regarding the chain Mo-oxide species. However, these descriptors might occur in different
sizes in the real systems depending on the preparation and the activation process. The
terminal oxo-site exhibits the shortest Mo-Ot bond (calculated at 1.71 Å vs. 1.74 Å
experimentally[100, 217]). Among all Mo-O bonds, the bridging oxo-site (Mo-O-Mo)
reveals the longest bond at 2.10 Å (2.26 Å[106]). The interfacial oxygens (Mo-O-(Al) and
Mo-Osurf) have an intermediate bond length around 1.86-2.28 Å (1.96Å [217]).
No short Mo-Al bond was seen for Mo-oxide species reported by some EXAFS data[100,
106, 222], but we observed a rather long one with a Mo-Al bond of 3.06 Å (3.06 Å[106,
217, 222]). The absence of a short Mo-Al bond is identified across the whole sulfidation
steps of our models. Nonetheless, the presence of long Mo-Al is visible in oxides,
oxysulfides and slowly vanishes in trisulfides. The oxysulfide species (Mo3O6S3 and
Mo3O3S6) exist on two distinct pathways (Path-1 and Path-2), as discussed earlier. The so-
called homogeneous Path-1 involves the replacement of terminal and bridging oxygen
first and later the interfacial ones (Oint(tri) and Oint(bi)), while the heterogeneous Path-2
exchanges the two bridgings followed by two Oint(bi) out of three, then terminal ones, and
finally Oint(tri) and Oint(bi), respectively.
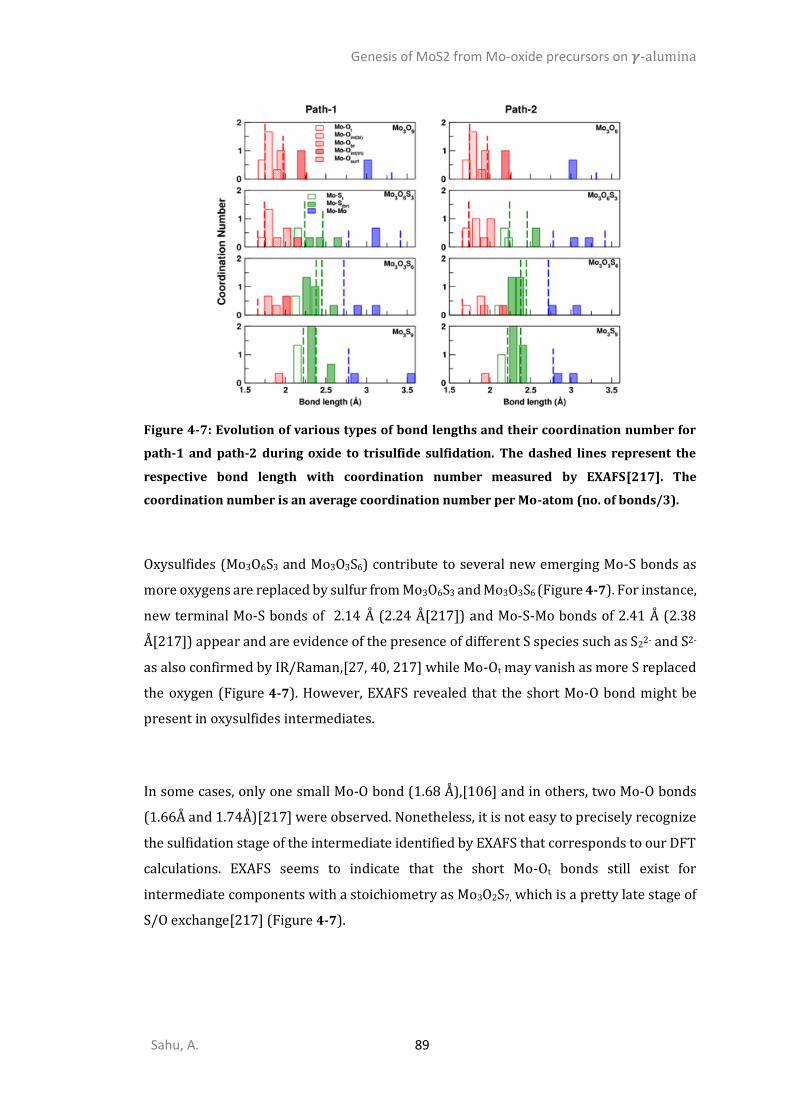
Genesis of MoS2 from Mo-oxide precursors on 𝜸-alumina
Sahu, A. 89
Figure 4-7: Evolution of various types of bond lengths and their coordination number for
path-1 and path-2 during oxide to trisulfide sulfidation. The dashed lines represent the
respective bond length with coordination number measured by EXAFS[217]. The
coordination number is an average coordination number per Mo-atom (no. of bonds/3).
Oxysulfides (Mo3O6S3 and Mo3O3S6) contribute to several new emerging Mo-S bonds as
more oxygens are replaced by sulfur from Mo3O6S3 and Mo3O3S6 (Figure 4-7). For instance,
new terminal Mo-S bonds of 2.14 Å (2.24 Å[217]) and Mo-S-Mo bonds of 2.41 Å (2.38
Å[217]) appear and are evidence of the presence of different S species such as S22- and S2-
as also confirmed by IR/Raman,[27, 40, 217] while Mo-Ot may vanish as more S replaced
the oxygen (Figure 4-7). However, EXAFS revealed that the short Mo-O bond might be
present in oxysulfides intermediates.
In some cases, only one small Mo-O bond (1.68 Å),[106] and in others, two Mo-O bonds
(1.66Å and 1.74Å)[217] were observed. Nonetheless, it is not easy to precisely recognize
the sulfidation stage of the intermediate identified by EXAFS that corresponds to our DFT
calculations. EXAFS seems to indicate that the short Mo-Ot bonds still exist for
intermediate components with a stoichiometry as Mo3O2S7, which is a pretty late stage of
S/O exchange[217] (Figure 4-7).
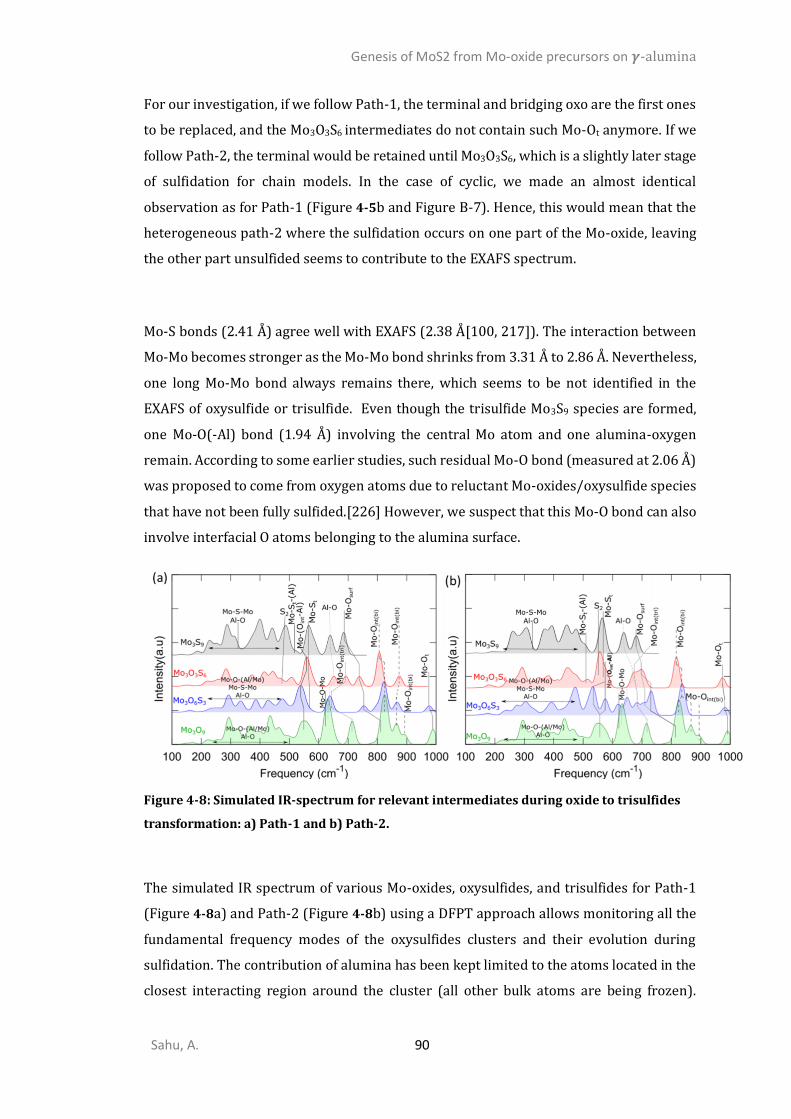
Genesis of MoS2 from Mo-oxide precursors on 𝜸-alumina
Sahu, A. 90
For our investigation, if we follow Path-1, the terminal and bridging oxo are the first ones
to be replaced, and the Mo3O3S6 intermediates do not contain such Mo-Ot anymore. If we
follow Path-2, the terminal would be retained until Mo3O3S6, which is a slightly later stage
of sulfidation for chain models. In the case of cyclic, we made an almost identical
observation as for Path-1 (Figure 4-5b and Figure B-7). Hence, this would mean that the
heterogeneous path-2 where the sulfidation occurs on one part of the Mo-oxide, leaving
the other part unsulfided seems to contribute to the EXAFS spectrum.
Mo-S bonds (2.41 Å) agree well with EXAFS (2.38 Å[100, 217]). The interaction between
Mo-Mo becomes stronger as the Mo-Mo bond shrinks from 3.31 Å to 2.86 Å. Nevertheless,
one long Mo-Mo bond always remains there, which seems to be not identified in the
EXAFS of oxysulfide or trisulfide. Even though the trisulfide Mo3S9 species are formed,
one Mo-O(-Al) bond (1.94 Å) involving the central Mo atom and one alumina-oxygen
remain. According to some earlier studies, such residual Mo-O bond (measured at 2.06 Å)
was proposed to come from oxygen atoms due to reluctant Mo-oxides/oxysulfide species
that have not been fully sulfided.[226] However, we suspect that this Mo-O bond can also
involve interfacial O atoms belonging to the alumina surface.
Figure 4-8: Simulated IR-spectrum for relevant intermediates during oxide to trisulfides
transformation: a) Path-1 and b) Path-2.
The simulated IR spectrum of various Mo-oxides, oxysulfides, and trisulfides for Path-1
(Figure 4-8a) and Path-2 (Figure 4-8b) using a DFPT approach allows monitoring all the
fundamental frequency modes of the oxysulfides clusters and their evolution during
sulfidation. The contribution of alumina has been kept limited to the atoms located in the
closest interacting region around the cluster (all other bulk atoms are being frozen).
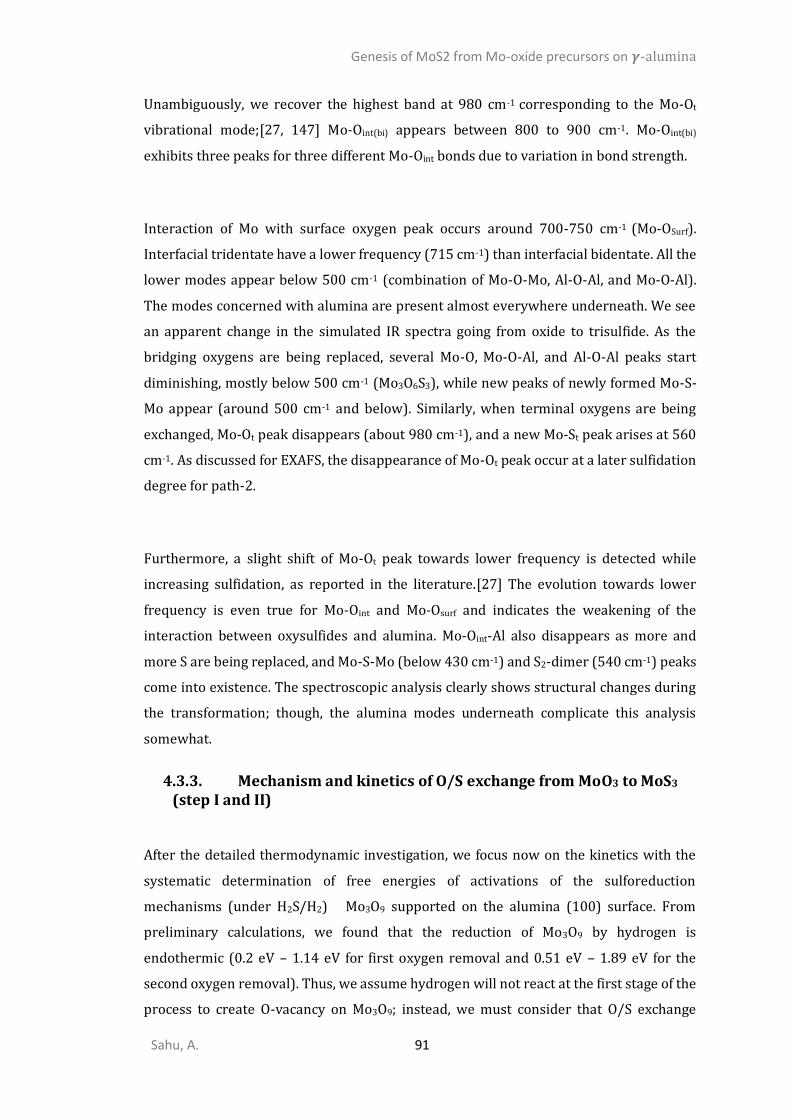
Genesis of MoS2 from Mo-oxide precursors on 𝜸-alumina
Sahu, A. 91
Unambiguously, we recover the highest band at 980 cm-1 corresponding to the Mo-Ot
vibrational mode;[27, 147] Mo-Oint(bi) appears between 800 to 900 cm-1. Mo-Oint(bi)
exhibits three peaks for three different Mo-Oint bonds due to variation in bond strength.
Interaction of Mo with surface oxygen peak occurs around 700-750 cm-1 (Mo-OSurf).
Interfacial tridentate have a lower frequency (715 cm-1) than interfacial bidentate. All the
lower modes appear below 500 cm-1 (combination of Mo-O-Mo, Al-O-Al, and Mo-O-Al).
The modes concerned with alumina are present almost everywhere underneath. We see
an apparent change in the simulated IR spectra going from oxide to trisulfide. As the
bridging oxygens are being replaced, several Mo-O, Mo-O-Al, and Al-O-Al peaks start
diminishing, mostly below 500 cm-1 (Mo3O6S3), while new peaks of newly formed Mo-S-
Mo appear (around 500 cm-1 and below). Similarly, when terminal oxygens are being
exchanged, Mo-Ot peak disappears (about 980 cm-1), and a new Mo-St peak arises at 560
cm-1. As discussed for EXAFS, the disappearance of Mo-Ot peak occur at a later sulfidation
degree for path-2.
Furthermore, a slight shift of Mo-Ot peak towards lower frequency is detected while
increasing sulfidation, as reported in the literature.[27] The evolution towards lower
frequency is even true for Mo-Oint and Mo-Osurf and indicates the weakening of the
interaction between oxysulfides and alumina. Mo-Oint-Al also disappears as more and
more S are being replaced, and Mo-S-Mo (below 430 cm-1) and S2-dimer (540 cm-1) peaks
come into existence. The spectroscopic analysis clearly shows structural changes during
the transformation; though, the alumina modes underneath complicate this analysis
somewhat.
4.3.3. Mechanism and kinetics of O/S exchange from MoO3 to MoS3 (step I and II)
After the detailed thermodynamic investigation, we focus now on the kinetics with the
systematic determination of free energies of activations of the sulforeduction
mechanisms (under H2S/H2) Mo3O9 supported on the alumina (100) surface. From
preliminary calculations, we found that the reduction of Mo3O9 by hydrogen is
endothermic (0.2 eV – 1.14 eV for first oxygen removal and 0.51 eV – 1.89 eV for the
second oxygen removal). Thus, we assume hydrogen will not react at the first stage of the
process to create O-vacancy on Mo3O9; instead, we must consider that O/S exchange
Genesis of MoS2 from Mo-oxide precursors on 𝜸-alumina
Sahu, A. 92
utilizing H2S adsorption and H2O removal is thermodynamically favored, which is in line
with the proposal earlier made by Muijsers et al.[103].
However, we will address the question at which stage the reduction by H2 becomes
competitive with H2S or even more advantageous. For simplicity, it is reasonable to
assume that hydrogen will play its role after oxysulfides have enough S species to be
transformed into MoS2 without using additional H2S to fulfill the requirement of deficient
S. In that way, we can comprehend whether it is reasonable to undergo further sulfidation
until MoS3 (proposed by many experimental investigations[35, 36, 40, 104, 105, 216, 218,
219] or follow a more direct reduction from some oxysulfide intermediate to MoS2 (as
suggested by others[27, 98, 100, 216, 218]). Moreover, The hypothesis of using the first
H2S is also in line with some experimental observations that observed MoS2 formation
even without the explicit use of H2.[104, 221] Thus, we will first focus on the role of H2S
and its reactivity on oxides/oxysulfides to trisulfides conversion (Figure 4-1 step-II), and
further, we will analyze the possible role of H2 to allow the transformation either from
trisulfide to disulfide (Figure 4-1, step-IV), or from oxysulfide to disulfide (Figure 4-1,
step-III)
Oxygen to sulfur exchange by H2S will involve four crucial steps: i) adsorption and
activation of H2S, ii) H2S dissociation with the formation of SH, OH, iii) proton transfer
(formation of H2O), and iv) desorption of water.
i) * + H2S(g) → *-SH2 H2S adsorption
ii) *-O + *-SH2 → *-OH + *-SH H2S dissociation
iii) *-OH + *-SH → *-OH2 + *-S Proton transfer
iv) *-OH2 → * + H2O(g) H2O desorption
Total *-O + H2S (g) → *-S + H2O (g)
Apart from these four main steps, there might be some supplementary ones such as SH or
OH reorientation, S migration. We have examined all four types of oxygen sites as
described in Figure 4-4 and their respective O/S replacement mechanism steps.
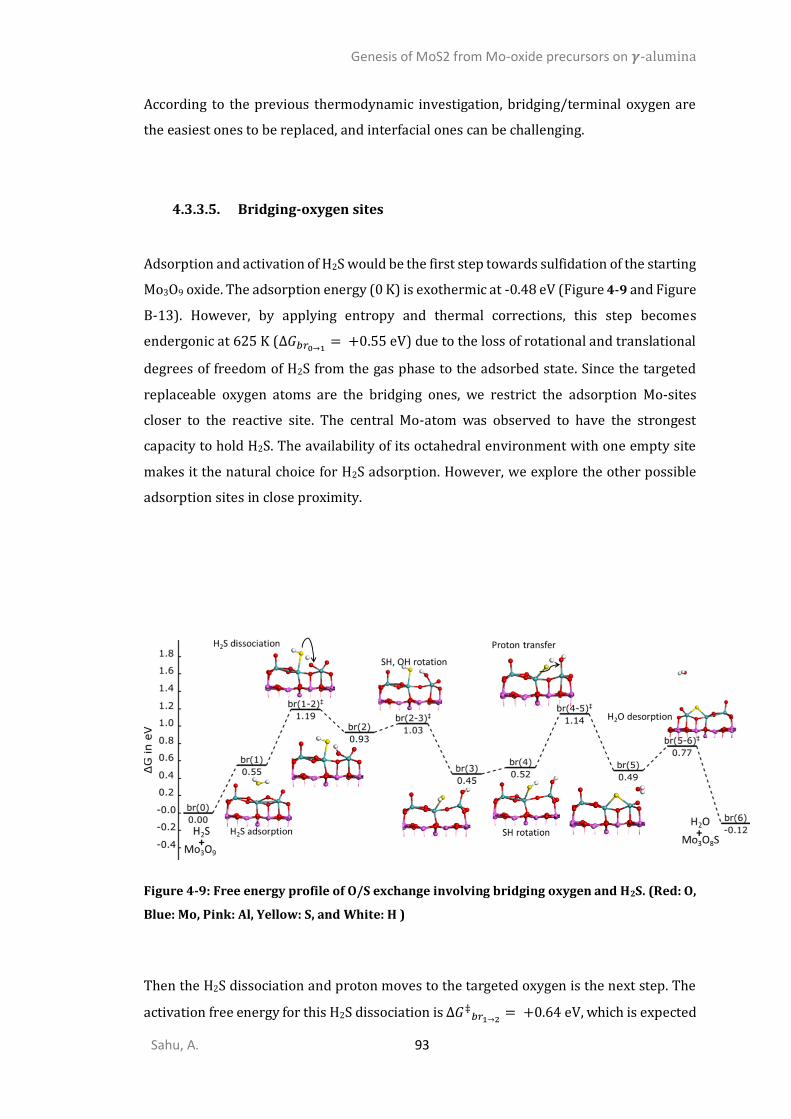
Genesis of MoS2 from Mo-oxide precursors on 𝜸-alumina
Sahu, A. 93
According to the previous thermodynamic investigation, bridging/terminal oxygen are
the easiest ones to be replaced, and interfacial ones can be challenging.
Bridging-oxygen sites
Adsorption and activation of H2S would be the first step towards sulfidation of the starting
Mo3O9 oxide. The adsorption energy (0 K) is exothermic at -0.48 eV (Figure 4-9 and Figure
B-13). However, by applying entropy and thermal corrections, this step becomes
endergonic at 625 K (Δ𝐺𝑏𝑟0→1= +0.55 eV) due to the loss of rotational and translational
degrees of freedom of H2S from the gas phase to the adsorbed state. Since the targeted
replaceable oxygen atoms are the bridging ones, we restrict the adsorption Mo-sites
closer to the reactive site. The central Mo-atom was observed to have the strongest
capacity to hold H2S. The availability of its octahedral environment with one empty site
makes it the natural choice for H2S adsorption. However, we explore the other possible
adsorption sites in close proximity.
Figure 4-9: Free energy profile of O/S exchange involving bridging oxygen and H2S. (Red: O,
Blue: Mo, Pink: Al, Yellow: S, and White: H )
Then the H2S dissociation and proton moves to the targeted oxygen is the next step. The
activation free energy for this H2S dissociation is Δ𝐺‡𝑏𝑟1→2
= +0.64 eV, which is expected
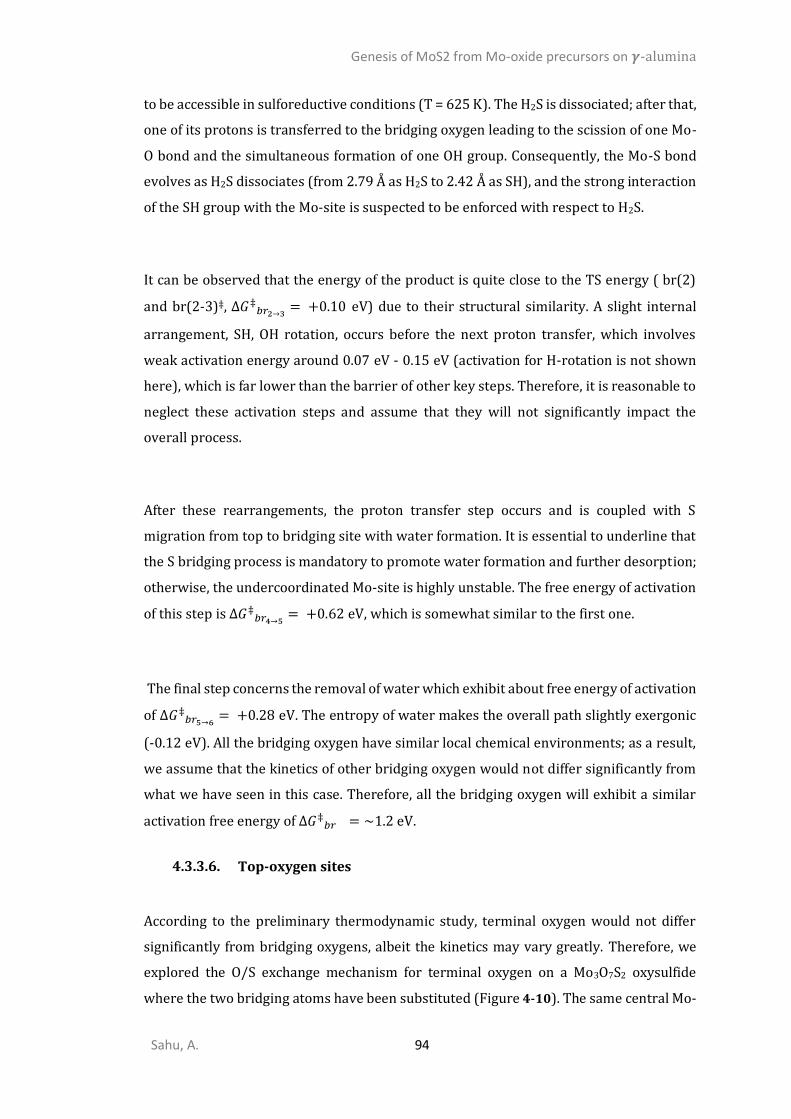
Genesis of MoS2 from Mo-oxide precursors on 𝜸-alumina
Sahu, A. 94
to be accessible in sulforeductive conditions (T = 625 K). The H2S is dissociated; after that,
one of its protons is transferred to the bridging oxygen leading to the scission of one Mo-
O bond and the simultaneous formation of one OH group. Consequently, the Mo-S bond
evolves as H2S dissociates (from 2.79 Å as H2S to 2.42 Å as SH), and the strong interaction
of the SH group with the Mo-site is suspected to be enforced with respect to H2S.
It can be observed that the energy of the product is quite close to the TS energy ( br(2)
and br(2-3)‡, Δ𝐺‡𝑏𝑟2→3
= +0.10 eV) due to their structural similarity. A slight internal
arrangement, SH, OH rotation, occurs before the next proton transfer, which involves
weak activation energy around 0.07 eV - 0.15 eV (activation for H-rotation is not shown
here), which is far lower than the barrier of other key steps. Therefore, it is reasonable to
neglect these activation steps and assume that they will not significantly impact the
overall process.
After these rearrangements, the proton transfer step occurs and is coupled with S
migration from top to bridging site with water formation. It is essential to underline that
the S bridging process is mandatory to promote water formation and further desorption;
otherwise, the undercoordinated Mo-site is highly unstable. The free energy of activation
of this step is Δ𝐺‡𝑏𝑟4→5
= +0.62 eV, which is somewhat similar to the first one.
The final step concerns the removal of water which exhibit about free energy of activation
of Δ𝐺‡𝑏𝑟5→6
= +0.28 eV. The entropy of water makes the overall path slightly exergonic
(-0.12 eV). All the bridging oxygen have similar local chemical environments; as a result,
we assume that the kinetics of other bridging oxygen would not differ significantly from
what we have seen in this case. Therefore, all the bridging oxygen will exhibit a similar
activation free energy of Δ𝐺‡𝑏𝑟 = ~1.2 eV.
Top-oxygen sites
According to the preliminary thermodynamic study, terminal oxygen would not differ
significantly from bridging oxygens, albeit the kinetics may vary greatly. Therefore, we
explored the O/S exchange mechanism for terminal oxygen on a Mo3O7S2 oxysulfide
where the two bridging atoms have been substituted (Figure 4-10). The same central Mo-
Genesis of MoS2 from Mo-oxide precursors on 𝜸-alumina
Sahu, A. 95
site exhibits a slightly weaker molecular adsorption of H2S, consequently higher
Δ𝐺 𝑡0→1= +0.79 eV in contrast with the previously discussed O/S exchange. Moreover,
the free energy of H2S dissociation is about +0.97 with a corresponding activation free
energy barrier (Δ𝐺‡𝑡1→2
= +0.18 eV) that is lower than the bridging O/S exchange due to
the proximity of available terminal oxygen, and no Mo-O bond scission is required at this
step. Here again, the energy of the product is similar to the TS ( t(1-2) and t(2)) due to
their structural similarity.
Figure 4-10: Free energy profile of O/S exchange involving terminal oxygen and H2S. (Red:
O, Blue: Mo, Pink: Al, Yellow: S, and White: H )
After subsequent SH/OH rotation ( t(2) → t(3) ), the second proton transfer takes place.
This step is also coupled with S migration (from top to bridging site) in a similar manner
as the bridging O. The proton transfer associated with S migration is the rate-limiting step
for terminal O/S exchange, and it is significantly higher (+0.43 eV) than the rate-limiting
step of bridging one with the cost of Δ𝐺‡𝑡3→4
= +0.92 eV activation energy. The excessive
activation energy could be because of a concerted mechanism. After water formation,
migration of S from bridging site to top site is one more easy, intermediate step that is a
precursor to the water desorption.
No activation was observed for S migration in this case. Δ𝐺‡𝑡5→6
= +0.15 eV energy is
required to take out the water from the system. As in the previous case (bridging), the S
atom stabilizes the O-vacancies on top of the Mo site, which also justifies why the S/O
exchange is preferred to the alternative direct O-removal by H2, for instance. The creation
of O-vacancies on top of the Mo site in the Mo3O9 cluster upon H2/H2O exchange is
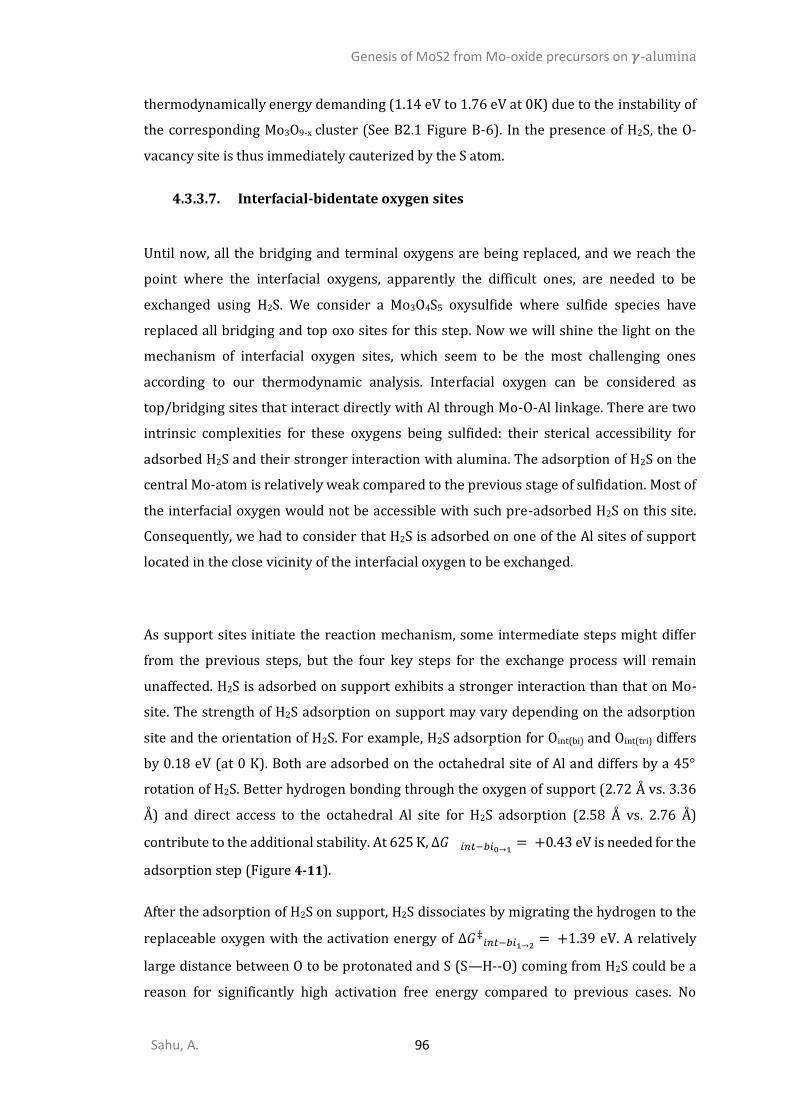
Genesis of MoS2 from Mo-oxide precursors on 𝜸-alumina
Sahu, A. 96
thermodynamically energy demanding (1.14 eV to 1.76 eV at 0K) due to the instability of
the corresponding Mo3O9-x cluster (See B2.1 Figure B-6). In the presence of H2S, the O-
vacancy site is thus immediately cauterized by the S atom.
Interfacial-bidentate oxygen sites
Until now, all the bridging and terminal oxygens are being replaced, and we reach the
point where the interfacial oxygens, apparently the difficult ones, are needed to be
exchanged using H2S. We consider a Mo3O4S5 oxysulfide where sulfide species have
replaced all bridging and top oxo sites for this step. Now we will shine the light on the
mechanism of interfacial oxygen sites, which seem to be the most challenging ones
according to our thermodynamic analysis. Interfacial oxygen can be considered as
top/bridging sites that interact directly with Al through Mo-O-Al linkage. There are two
intrinsic complexities for these oxygens being sulfided: their sterical accessibility for
adsorbed H2S and their stronger interaction with alumina. The adsorption of H2S on the
central Mo-atom is relatively weak compared to the previous stage of sulfidation. Most of
the interfacial oxygen would not be accessible with such pre-adsorbed H2S on this site.
Consequently, we had to consider that H2S is adsorbed on one of the Al sites of support
located in the close vicinity of the interfacial oxygen to be exchanged.
As support sites initiate the reaction mechanism, some intermediate steps might differ
from the previous steps, but the four key steps for the exchange process will remain
unaffected. H2S is adsorbed on support exhibits a stronger interaction than that on Mo-
site. The strength of H2S adsorption on support may vary depending on the adsorption
site and the orientation of H2S. For example, H2S adsorption for Oint(bi) and Oint(tri) differs
by 0.18 eV (at 0 K). Both are adsorbed on the octahedral site of Al and differs by a 45°
rotation of H2S. Better hydrogen bonding through the oxygen of support (2.72 Å vs. 3.36
Å) and direct access to the octahedral Al site for H2S adsorption (2.58 Å vs. 2.76 Å)
contribute to the additional stability. At 625 K, Δ𝐺 𝑖𝑛𝑡−𝑏𝑖0→1= +0.43 eV is needed for the
adsorption step (Figure 4-11).
After the adsorption of H2S on support, H2S dissociates by migrating the hydrogen to the
replaceable oxygen with the activation energy of Δ𝐺‡𝑖𝑛𝑡−𝑏𝑖1→2
= +1.39 eV. A relatively
large distance between O to be protonated and S (S—H--O) coming from H2S could be a
reason for significantly high activation free energy compared to previous cases. No
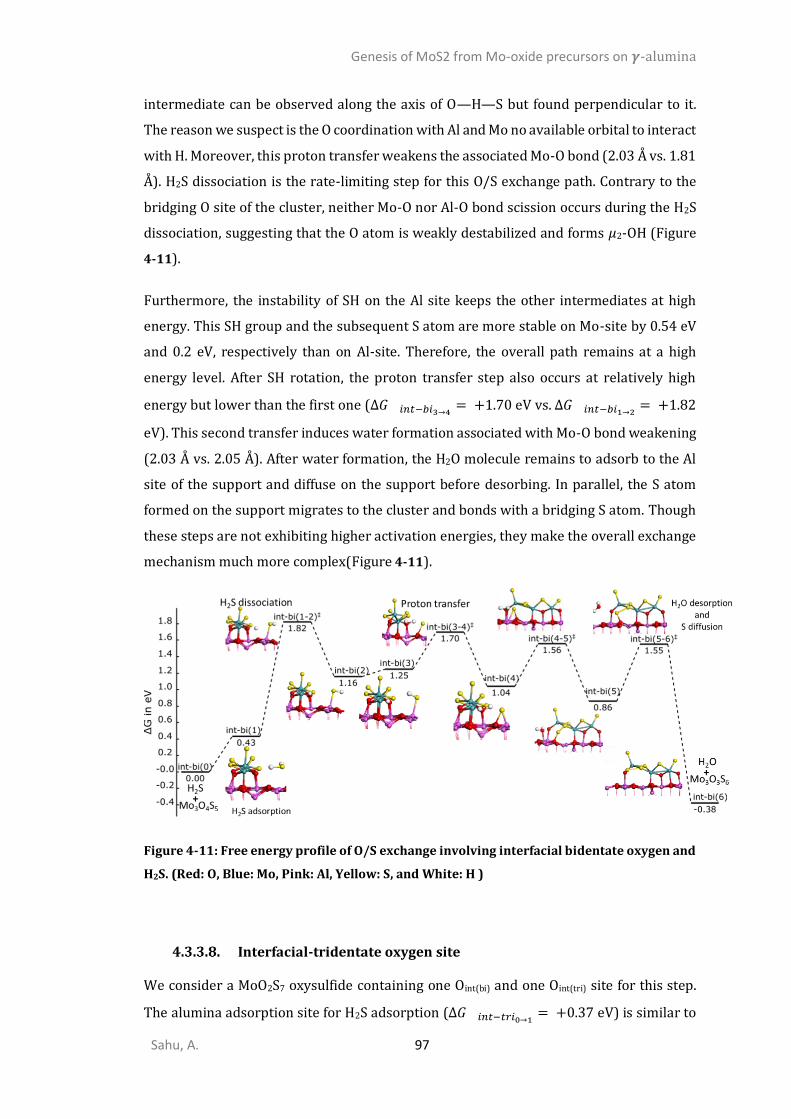
Genesis of MoS2 from Mo-oxide precursors on 𝜸-alumina
Sahu, A. 97
intermediate can be observed along the axis of O—H—S but found perpendicular to it.
The reason we suspect is the O coordination with Al and Mo no available orbital to interact
with H. Moreover, this proton transfer weakens the associated Mo-O bond (2.03 Å vs. 1.81
Å). H2S dissociation is the rate-limiting step for this O/S exchange path. Contrary to the
bridging O site of the cluster, neither Mo-O nor Al-O bond scission occurs during the H2S
dissociation, suggesting that the O atom is weakly destabilized and forms 𝜇2-OH (Figure
4-11).
Furthermore, the instability of SH on the Al site keeps the other intermediates at high
energy. This SH group and the subsequent S atom are more stable on Mo-site by 0.54 eV
and 0.2 eV, respectively than on Al-site. Therefore, the overall path remains at a high
energy level. After SH rotation, the proton transfer step also occurs at relatively high
energy but lower than the first one (Δ𝐺 𝑖𝑛𝑡−𝑏𝑖3→4= +1.70 eV vs. Δ𝐺 𝑖𝑛𝑡−𝑏𝑖1→2
= +1.82
eV). This second transfer induces water formation associated with Mo-O bond weakening
(2.03 Å vs. 2.05 Å). After water formation, the H2O molecule remains to adsorb to the Al
site of the support and diffuse on the support before desorbing. In parallel, the S atom
formed on the support migrates to the cluster and bonds with a bridging S atom. Though
these steps are not exhibiting higher activation energies, they make the overall exchange
mechanism much more complex(Figure 4-11).
Figure 4-11: Free energy profile of O/S exchange involving interfacial bidentate oxygen and
H2S. (Red: O, Blue: Mo, Pink: Al, Yellow: S, and White: H )
Interfacial-tridentate oxygen site
We consider a MoO2S7 oxysulfide containing one Oint(bi) and one Oint(tri) site for this step.
The alumina adsorption site for H2S adsorption (Δ𝐺 𝑖𝑛𝑡−𝑡𝑟𝑖0→1= +0.37 eV) is similar to

Genesis of MoS2 from Mo-oxide precursors on 𝜸-alumina
Sahu, A. 98
the previous case, while the subsequent mechanism will be significantly different. Indeed,
the hydrogen of H2S cannot directly reach the targeted oxygen site; it has first to diffuse
on the alumina surface. Hence, the H2S dissociation occurs by hydrogen migration from
the S-atom of H2S to a neighboring alumina µ3-oxygen and transforms into µ2-OH with a
weak activation energy of Δ𝐺‡𝑖𝑛𝑡−𝑡𝑟𝑖1→2
= +0.37 eV (Figure 4-12). Thereafter, it is
transferred to the Oint(tri) atom forming µ3-OH. This H2S dissociation exhibits a rather high
activation free energy (Δ𝐺‡𝑖𝑛𝑡−𝑡𝑟𝑖2→3
= +1.00 eV).
Figure 4-12: Free energy profile of O/S exchange involving interfacial tridentate oxygen and
H2S. (Red: O, Blue: Mo, Pink: Al, Yellow: S, and White: H )
As for the Oint(bi), none of the Mo-O or Al-O bonds is broken, so that a 𝜇3-OH group is
formed, and resulting the energy levels will remain relatively high along the reaction path.
At this moment, the SH proton is not within the proximity of the Oint(tri), and the S atom is
also too far away to exchange it. After SH rotation, this group diffuses on alumina and
binds to an available terminal sulfide to form a Mo-S-S-H species with a lower activation
free energy (Δ𝐺‡𝑖𝑛𝑡−𝑡𝑟𝑖4→5
= +0.42 eV). Through this S-S-H species, the proton is more
easily accessible to oxygen and can be transferred smoothly with a moderate activation
free energy of Δ𝐺‡𝑖𝑛𝑡−𝑡𝑟𝑖5→6
= +0.41 eV (Figure 4-12).
Once water is formed; one Mo-O bond is broken while keeping water in strong interaction
with alumina and Mo, which makes the water desorption step very demanding with
Δ𝐺‡𝑖𝑛𝑡−𝑡𝑟𝑖6→7
= +0.73 eV, similar to the Oint(bi) site in contrast with water desorption from
the cluster. In general, we observe that water desorption from support is kinetically more
limited than from the Mo site of the cluster (~0.7 eV vs. 0.23 eV), where the exchanged S
atom helps for this step. After the desorption of water, the O-vacancy should be replaced
by S, which currently exists as S-S dimer with terminal S. The splitting of the S-S bond
requires an activation free energy of Δ𝐺‡𝑖𝑛𝑡−𝑡𝑟𝑖7→8
= +0.92 eV (Figure 4-12).
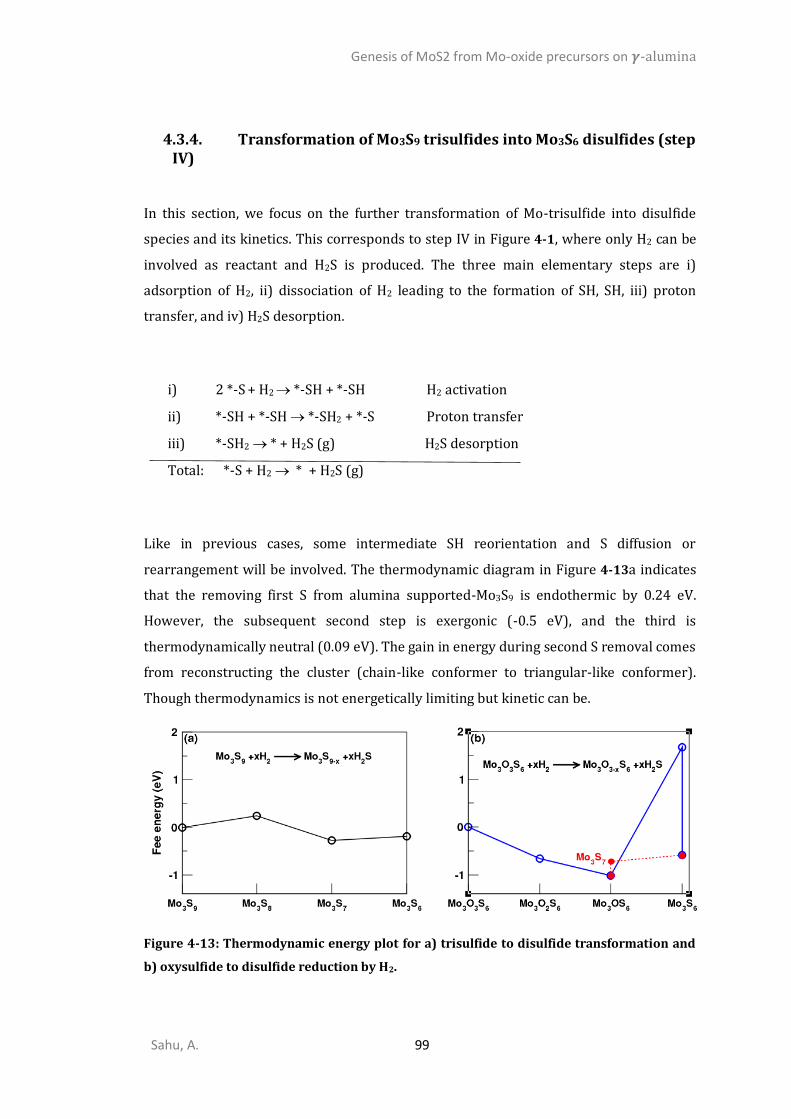
Genesis of MoS2 from Mo-oxide precursors on 𝜸-alumina
Sahu, A. 99
4.3.4. Transformation of Mo3S9 trisulfides into Mo3S6 disulfides (step IV)
In this section, we focus on the further transformation of Mo-trisulfide into disulfide
species and its kinetics. This corresponds to step IV in Figure 4-1, where only H2 can be
involved as reactant and H2S is produced. The three main elementary steps are i)
adsorption of H2, ii) dissociation of H2 leading to the formation of SH, SH, iii) proton
transfer, and iv) H2S desorption.
i) 2 *-S + H2 → *-SH + *-SH H2 activation
ii) *-SH + *-SH → *-SH2 + *-S Proton transfer
iii) *-SH2 → * + H2S (g) H2S desorption
Total: *-S + H2 → * + H2S (g)
Like in previous cases, some intermediate SH reorientation and S diffusion or
rearrangement will be involved. The thermodynamic diagram in Figure 4-13a indicates
that the removing first S from alumina supported-Mo3S9 is endothermic by 0.24 eV.
However, the subsequent second step is exergonic (-0.5 eV), and the third is
thermodynamically neutral (0.09 eV). The gain in energy during second S removal comes
from reconstructing the cluster (chain-like conformer to triangular-like conformer).
Though thermodynamics is not energetically limiting but kinetic can be.
Figure 4-13: Thermodynamic energy plot for a) trisulfide to disulfide transformation and
b) oxysulfide to disulfide reduction by H2.
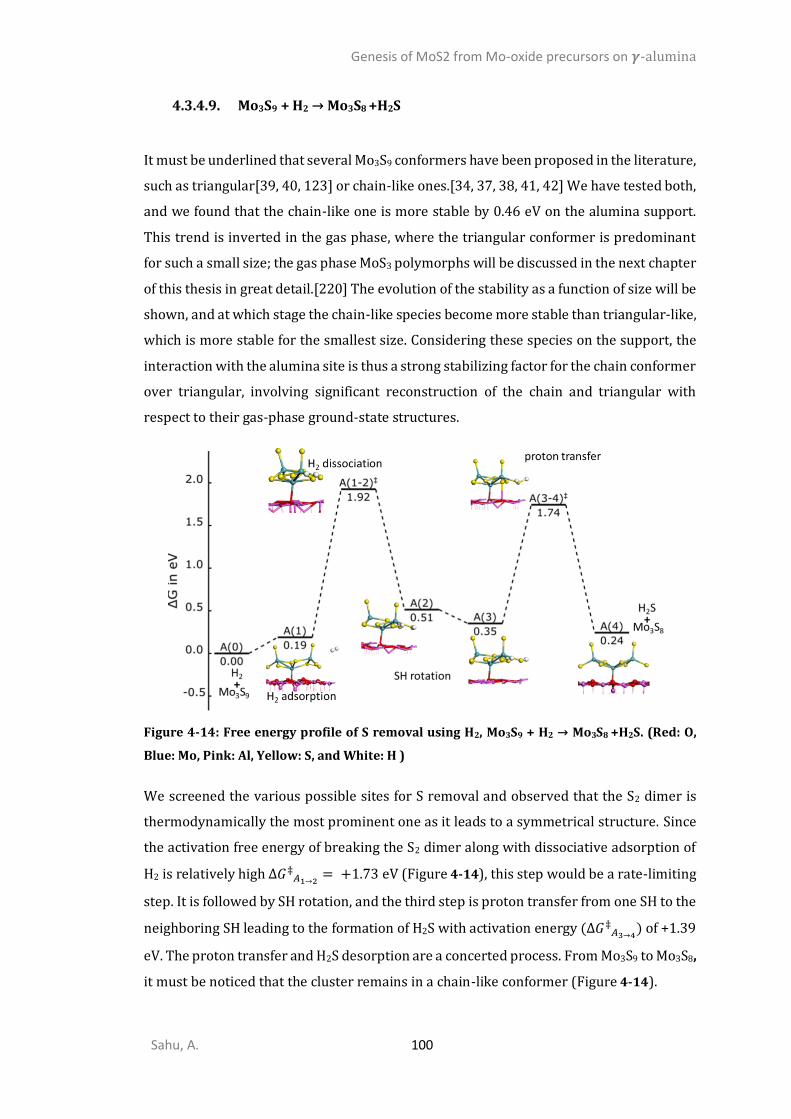
Genesis of MoS2 from Mo-oxide precursors on 𝜸-alumina
Sahu, A. 100
Mo3S9 + H2 → Mo3S8 +H2S
It must be underlined that several Mo3S9 conformers have been proposed in the literature,
such as triangular[39, 40, 123] or chain-like ones.[34, 37, 38, 41, 42] We have tested both,
and we found that the chain-like one is more stable by 0.46 eV on the alumina support.
This trend is inverted in the gas phase, where the triangular conformer is predominant
for such a small size; the gas phase MoS3 polymorphs will be discussed in the next chapter
of this thesis in great detail.[220] The evolution of the stability as a function of size will be
shown, and at which stage the chain-like species become more stable than triangular-like,
which is more stable for the smallest size. Considering these species on the support, the
interaction with the alumina site is thus a strong stabilizing factor for the chain conformer
over triangular, involving significant reconstruction of the chain and triangular with
respect to their gas-phase ground-state structures.
Figure 4-14: Free energy profile of S removal using H2, Mo3S9 + H2 → Mo3S8 +H2S. (Red: O,
Blue: Mo, Pink: Al, Yellow: S, and White: H )
We screened the various possible sites for S removal and observed that the S2 dimer is
thermodynamically the most prominent one as it leads to a symmetrical structure. Since
the activation free energy of breaking the S2 dimer along with dissociative adsorption of
H2 is relatively high Δ𝐺‡𝐴1→2
= +1.73 eV (Figure 4-14), this step would be a rate-limiting
step. It is followed by SH rotation, and the third step is proton transfer from one SH to the
neighboring SH leading to the formation of H2S with activation energy (Δ𝐺‡𝐴3→4
) of +1.39
eV. The proton transfer and H2S desorption are a concerted process. From Mo3S9 to Mo3S8,
it must be noticed that the cluster remains in a chain-like conformer (Figure 4-14).
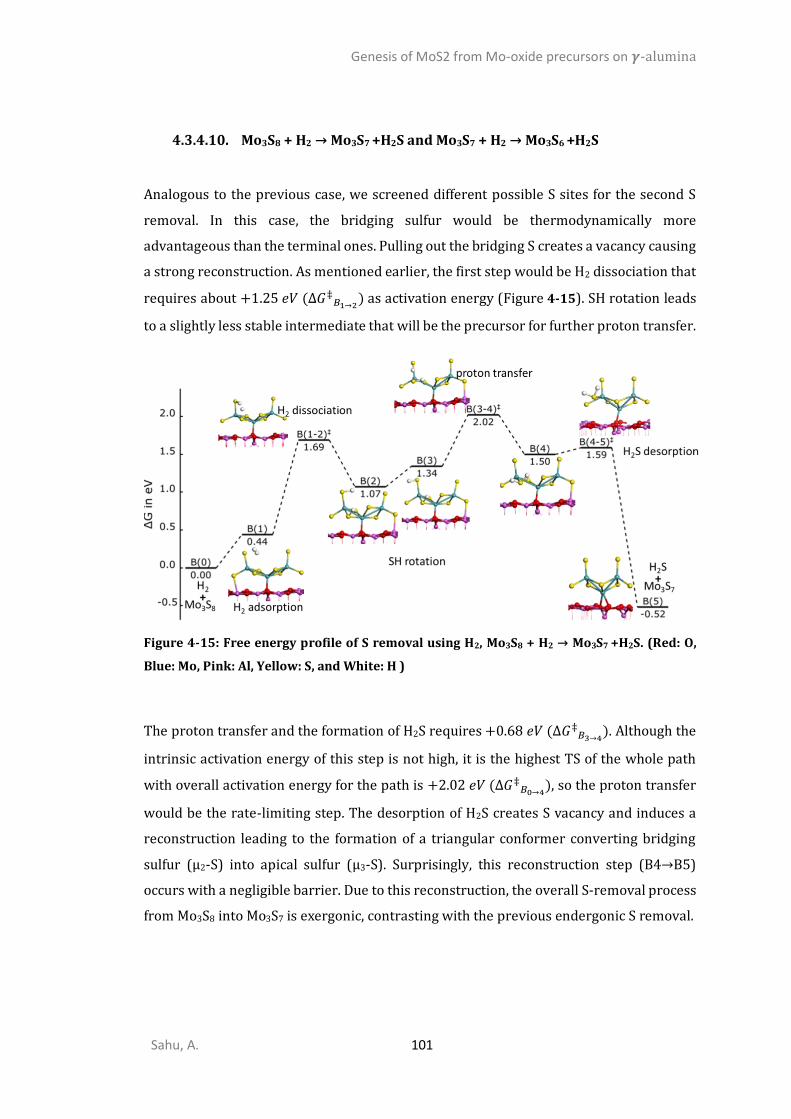
Genesis of MoS2 from Mo-oxide precursors on 𝜸-alumina
Sahu, A. 101
Mo3S8 + H2 → Mo3S7 +H2S and Mo3S7 + H2 → Mo3S6 +H2S
Analogous to the previous case, we screened different possible S sites for the second S
removal. In this case, the bridging sulfur would be thermodynamically more
advantageous than the terminal ones. Pulling out the bridging S creates a vacancy causing
a strong reconstruction. As mentioned earlier, the first step would be H2 dissociation that
requires about +1.25 𝑒𝑉 (Δ𝐺‡𝐵1→2
) as activation energy (Figure 4-15). SH rotation leads
to a slightly less stable intermediate that will be the precursor for further proton transfer.
Figure 4-15: Free energy profile of S removal using H2, Mo3S8 + H2 → Mo3S7 +H2S. (Red: O,
Blue: Mo, Pink: Al, Yellow: S, and White: H )
The proton transfer and the formation of H2S requires +0.68 𝑒𝑉 (Δ𝐺‡𝐵3→4
). Although the
intrinsic activation energy of this step is not high, it is the highest TS of the whole path
with overall activation energy for the path is +2.02 𝑒𝑉 (Δ𝐺‡𝐵0→4
), so the proton transfer
would be the rate-limiting step. The desorption of H2S creates S vacancy and induces a
reconstruction leading to the formation of a triangular conformer converting bridging
sulfur (µ2-S) into apical sulfur (µ3-S). Surprisingly, this reconstruction step (B4→B5)
occurs with a negligible barrier. Due to this reconstruction, the overall S-removal process
from Mo3S8 into Mo3S7 is exergonic, contrasting with the previous endergonic S removal.
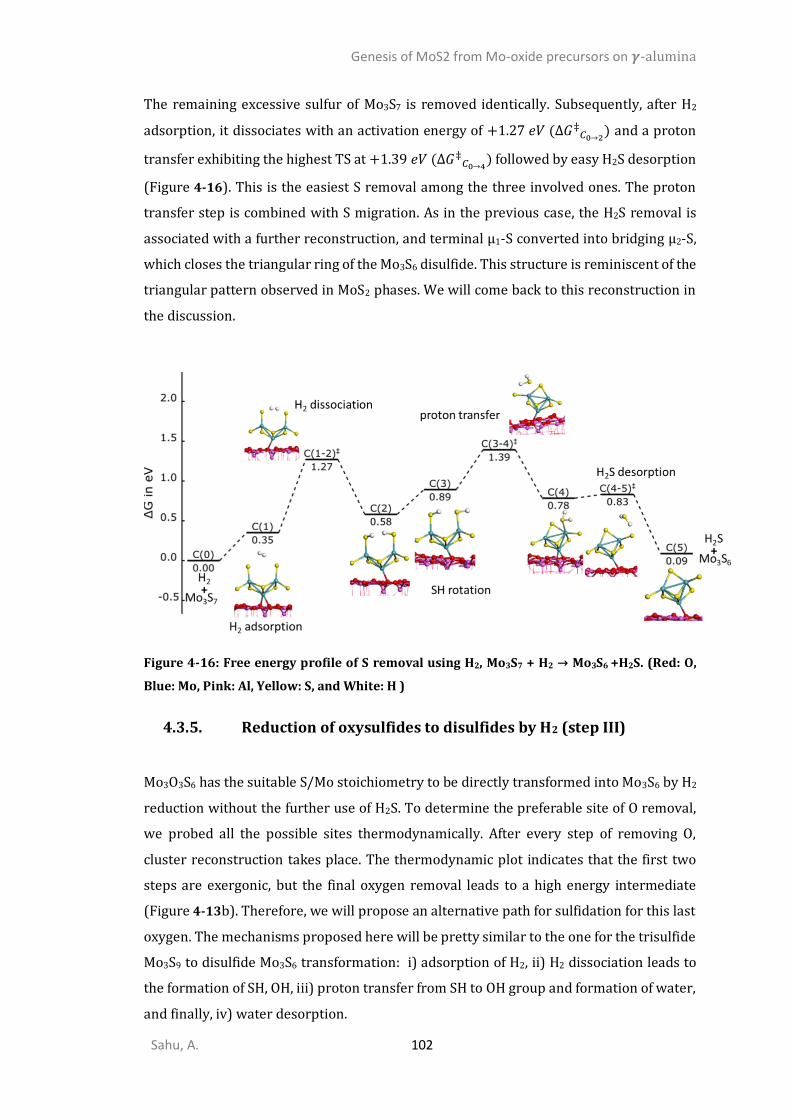
Genesis of MoS2 from Mo-oxide precursors on 𝜸-alumina
Sahu, A. 102
The remaining excessive sulfur of Mo3S7 is removed identically. Subsequently, after H2
adsorption, it dissociates with an activation energy of +1.27 𝑒𝑉 (Δ𝐺‡𝐶0→2
) and a proton
transfer exhibiting the highest TS at +1.39 𝑒𝑉 (Δ𝐺‡𝐶0→4
) followed by easy H2S desorption
(Figure 4-16). This is the easiest S removal among the three involved ones. The proton
transfer step is combined with S migration. As in the previous case, the H2S removal is
associated with a further reconstruction, and terminal µ1-S converted into bridging µ2-S,
which closes the triangular ring of the Mo3S6 disulfide. This structure is reminiscent of the
triangular pattern observed in MoS2 phases. We will come back to this reconstruction in
the discussion.
Figure 4-16: Free energy profile of S removal using H2, Mo3S7 + H2 → Mo3S6 +H2S. (Red: O,
Blue: Mo, Pink: Al, Yellow: S, and White: H )
4.3.5. Reduction of oxysulfides to disulfides by H2 (step III)
Mo3O3S6 has the suitable S/Mo stoichiometry to be directly transformed into Mo3S6 by H2
reduction without the further use of H2S. To determine the preferable site of O removal,
we probed all the possible sites thermodynamically. After every step of removing O,
cluster reconstruction takes place. The thermodynamic plot indicates that the first two
steps are exergonic, but the final oxygen removal leads to a high energy intermediate
(Figure 4-13b). Therefore, we will propose an alternative path for sulfidation for this last
oxygen. The mechanisms proposed here will be pretty similar to the one for the trisulfide
Mo3S9 to disulfide Mo3S6 transformation: i) adsorption of H2, ii) H2 dissociation leads to
the formation of SH, OH, iii) proton transfer from SH to OH group and formation of water,
and finally, iv) water desorption.
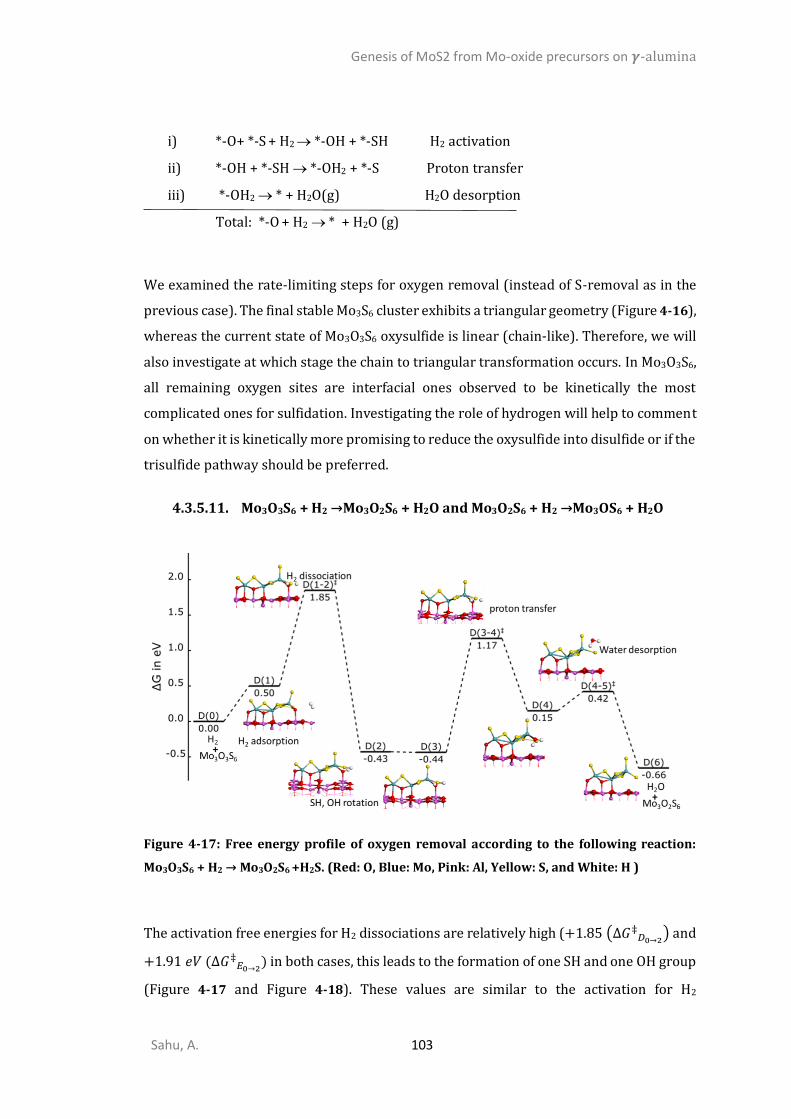
Genesis of MoS2 from Mo-oxide precursors on 𝜸-alumina
Sahu, A. 103
i) *-O+ *-S + H2 → *-OH + *-SH H2 activation
ii) *-OH + *-SH → *-OH2 + *-S Proton transfer
iii) *-OH2 → * + H2O(g) H2O desorption
Total: *-O + H2 → * + H2O (g)
We examined the rate-limiting steps for oxygen removal (instead of S-removal as in the
previous case). The final stable Mo3S6 cluster exhibits a triangular geometry (Figure 4-16),
whereas the current state of Mo3O3S6 oxysulfide is linear (chain-like). Therefore, we will
also investigate at which stage the chain to triangular transformation occurs. In Mo3O3S6,
all remaining oxygen sites are interfacial ones observed to be kinetically the most
complicated ones for sulfidation. Investigating the role of hydrogen will help to comment
on whether it is kinetically more promising to reduce the oxysulfide into disulfide or if the
trisulfide pathway should be preferred.
Mo3O3S6 + H2 →Mo3O2S6 + H2O and Mo3O2S6 + H2 →Mo3OS6 + H2O
Figure 4-17: Free energy profile of oxygen removal according to the following reaction:
Mo3O3S6 + H2 → Mo3O2S6 +H2S. (Red: O, Blue: Mo, Pink: Al, Yellow: S, and White: H )
The activation free energies for H2 dissociations are relatively high (+1.85 (Δ𝐺‡𝐷0→2
) and
+1.91 𝑒𝑉 (Δ𝐺‡𝐸0→2
) in both cases, this leads to the formation of one SH and one OH group
(Figure 4-17 and Figure 4-18). These values are similar to the activation for H2
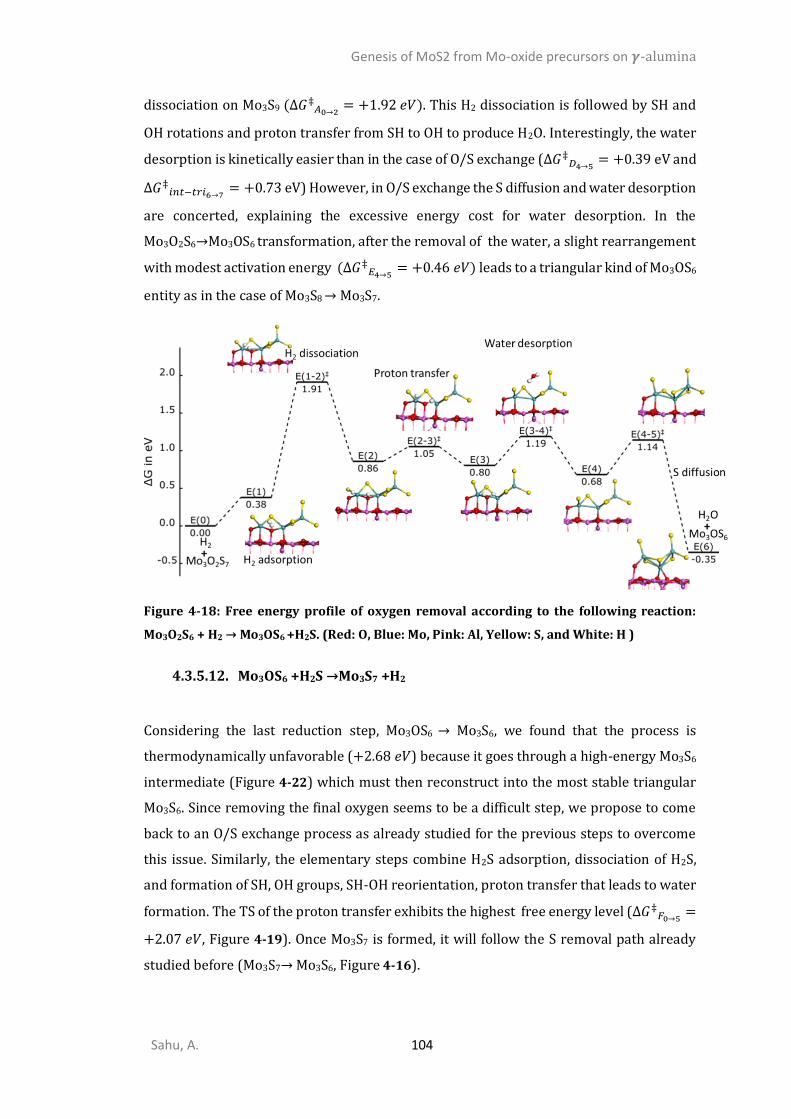
Genesis of MoS2 from Mo-oxide precursors on 𝜸-alumina
Sahu, A. 104
dissociation on Mo3S9 (Δ𝐺‡𝐴0→2
= +1.92 𝑒𝑉). This H2 dissociation is followed by SH and
OH rotations and proton transfer from SH to OH to produce H2O. Interestingly, the water
desorption is kinetically easier than in the case of O/S exchange (Δ𝐺‡𝐷4→5
= +0.39 eV and
Δ𝐺‡𝑖𝑛𝑡−𝑡𝑟𝑖6→7
= +0.73 eV) However, in O/S exchange the S diffusion and water desorption
are concerted, explaining the excessive energy cost for water desorption. In the
Mo3O2S6→Mo3OS6 transformation, after the removal of the water, a slight rearrangement
with modest activation energy (Δ𝐺‡𝐸4→5
= +0.46 𝑒𝑉) leads to a triangular kind of Mo3OS6
entity as in the case of Mo3S8 → Mo3S7.
Figure 4-18: Free energy profile of oxygen removal according to the following reaction:
Mo3O2S6 + H2 → Mo3OS6 +H2S. (Red: O, Blue: Mo, Pink: Al, Yellow: S, and White: H )
Mo3OS6 +H2S →Mo3S7 +H2
Considering the last reduction step, Mo3OS6 → Mo3S6, we found that the process is
thermodynamically unfavorable (+2.68 𝑒𝑉) because it goes through a high-energy Mo3S6
intermediate (Figure 4-22) which must then reconstruct into the most stable triangular
Mo3S6. Since removing the final oxygen seems to be a difficult step, we propose to come
back to an O/S exchange process as already studied for the previous steps to overcome
this issue. Similarly, the elementary steps combine H2S adsorption, dissociation of H2S,
and formation of SH, OH groups, SH-OH reorientation, proton transfer that leads to water
formation. The TS of the proton transfer exhibits the highest free energy level (Δ𝐺‡𝐹0→5
=
+2.07 𝑒𝑉, Figure 4-19). Once Mo3S7 is formed, it will follow the S removal path already
studied before (Mo3S7→ Mo3S6, Figure 4-16).
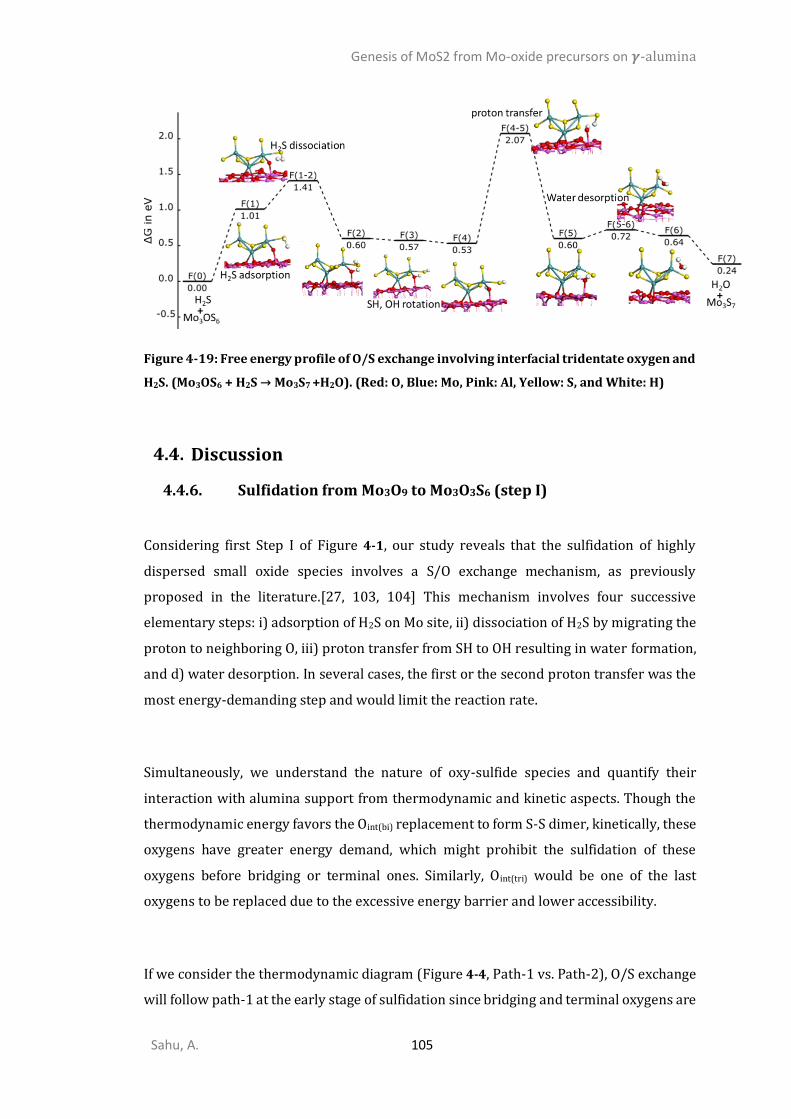
Genesis of MoS2 from Mo-oxide precursors on 𝜸-alumina
Sahu, A. 105
Figure 4-19: Free energy profile of O/S exchange involving interfacial tridentate oxygen and
H2S. (Mo3OS6 + H2S → Mo3S7 +H2O). (Red: O, Blue: Mo, Pink: Al, Yellow: S, and White: H)
Discussion
4.4.6. Sulfidation from Mo3O9 to Mo3O3S6 (step I)
Considering first Step I of Figure 4-1, our study reveals that the sulfidation of highly
dispersed small oxide species involves a S/O exchange mechanism, as previously
proposed in the literature.[27, 103, 104] This mechanism involves four successive
elementary steps: i) adsorption of H2S on Mo site, ii) dissociation of H2S by migrating the
proton to neighboring O, iii) proton transfer from SH to OH resulting in water formation,
and d) water desorption. In several cases, the first or the second proton transfer was the
most energy-demanding step and would limit the reaction rate.
Simultaneously, we understand the nature of oxy-sulfide species and quantify their
interaction with alumina support from thermodynamic and kinetic aspects. Though the
thermodynamic energy favors the Oint(bi) replacement to form S-S dimer, kinetically, these
oxygens have greater energy demand, which might prohibit the sulfidation of these
oxygens before bridging or terminal ones. Similarly, Oint(tri) would be one of the last
oxygens to be replaced due to the excessive energy barrier and lower accessibility.
If we consider the thermodynamic diagram (Figure 4-4, Path-1 vs. Path-2), O/S exchange
will follow path-1 at the early stage of sulfidation since bridging and terminal oxygens are

Genesis of MoS2 from Mo-oxide precursors on 𝜸-alumina
Sahu, A. 106
easily replaceable kinetically. It is also in line with some earlier DFT studies on different
unsupported MoO3 systems.[163–165] Nevertheless, once the second interfacial oxygen
is being replaced (Mo3O3S6→Mo3O2S7), a transition from path-1 to path-2 should occur.
Path-1 corresponds to a more homogeneous S/O exchange process, while path-2 involves
the sulfidation of one side of the Mo3O9 cluster preferentially. If path-2 occurs
preferentially, the oxysulfide intermediate such as Mo3O3S6 will retain the oxo (terminal)
species for a longer sulfidation degree, which would be compatible with EXAFS
observations showing the presence of the smallest Mo-O bonds also for Mo3O3S6.[106,
217]
By considering an energetic span analysis,[239] we compare the energies and free
energies of activation of the TOF determining transition states (TDTS) as shown in Figure
4-20. Analyzing first the effect of entropy and thermal corrections, we notice that these
corrections increase the barriers by +0.6 eV to +0.8 eV for bridging and terminal oxygen,
albeit the rate-limiting step remains unchanged. However, the barriers for Oint(bi) and
Oint(tri) are increased by only +0.4 eV.
Figure 4-20: Step-II of Figure 4-1, a) Electronic energy comparison for various types of O/S
exchange at 0K with respective rate-limiting step, activation energy barrier, and oxygen
type. b) Gibbs free energy comparison various types of O/S exchange at 0K with respective
rate-limiting step, activation energy barrier, and oxygen type.
This entropy effect is found to be directly proportional to the adsorption energy of H2S
either on the Mo cluster or on the support. The weakest H2S adsorption is for terminal
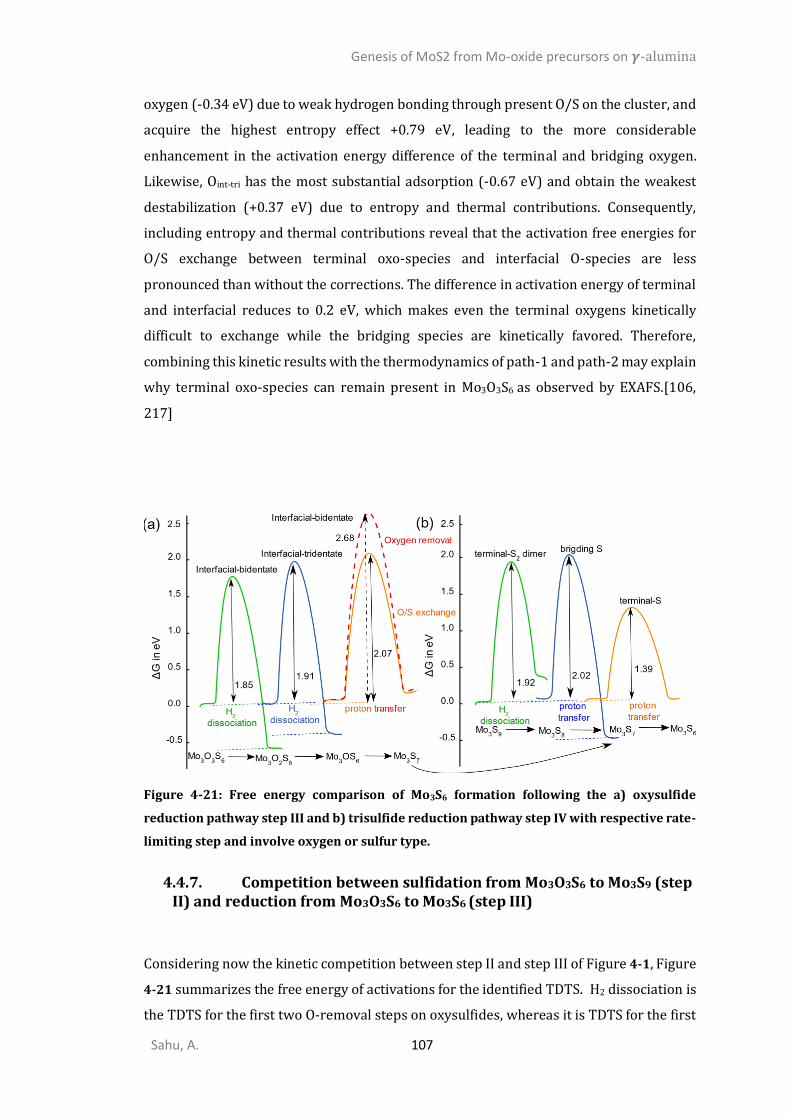
Genesis of MoS2 from Mo-oxide precursors on 𝜸-alumina
Sahu, A. 107
oxygen (-0.34 eV) due to weak hydrogen bonding through present O/S on the cluster, and
acquire the highest entropy effect +0.79 eV, leading to the more considerable
enhancement in the activation energy difference of the terminal and bridging oxygen.
Likewise, Oint-tri has the most substantial adsorption (-0.67 eV) and obtain the weakest
destabilization (+0.37 eV) due to entropy and thermal contributions. Consequently,
including entropy and thermal contributions reveal that the activation free energies for
O/S exchange between terminal oxo-species and interfacial O-species are less
pronounced than without the corrections. The difference in activation energy of terminal
and interfacial reduces to 0.2 eV, which makes even the terminal oxygens kinetically
difficult to exchange while the bridging species are kinetically favored. Therefore,
combining this kinetic results with the thermodynamics of path-1 and path-2 may explain
why terminal oxo-species can remain present in Mo3O3S6 as observed by EXAFS.[106,
217]
Figure 4-21: Free energy comparison of Mo3S6 formation following the a) oxysulfide
reduction pathway step III and b) trisulfide reduction pathway step IV with respective rate-
limiting step and involve oxygen or sulfur type.
4.4.7. Competition between sulfidation from Mo3O3S6 to Mo3S9 (step II) and reduction from Mo3O3S6 to Mo3S6 (step III)
Considering now the kinetic competition between step II and step III of Figure 4-1, Figure
4-21 summarizes the free energy of activations for the identified TDTS. H2 dissociation is
the TDTS for the first two O-removal steps on oxysulfides, whereas it is TDTS for the first
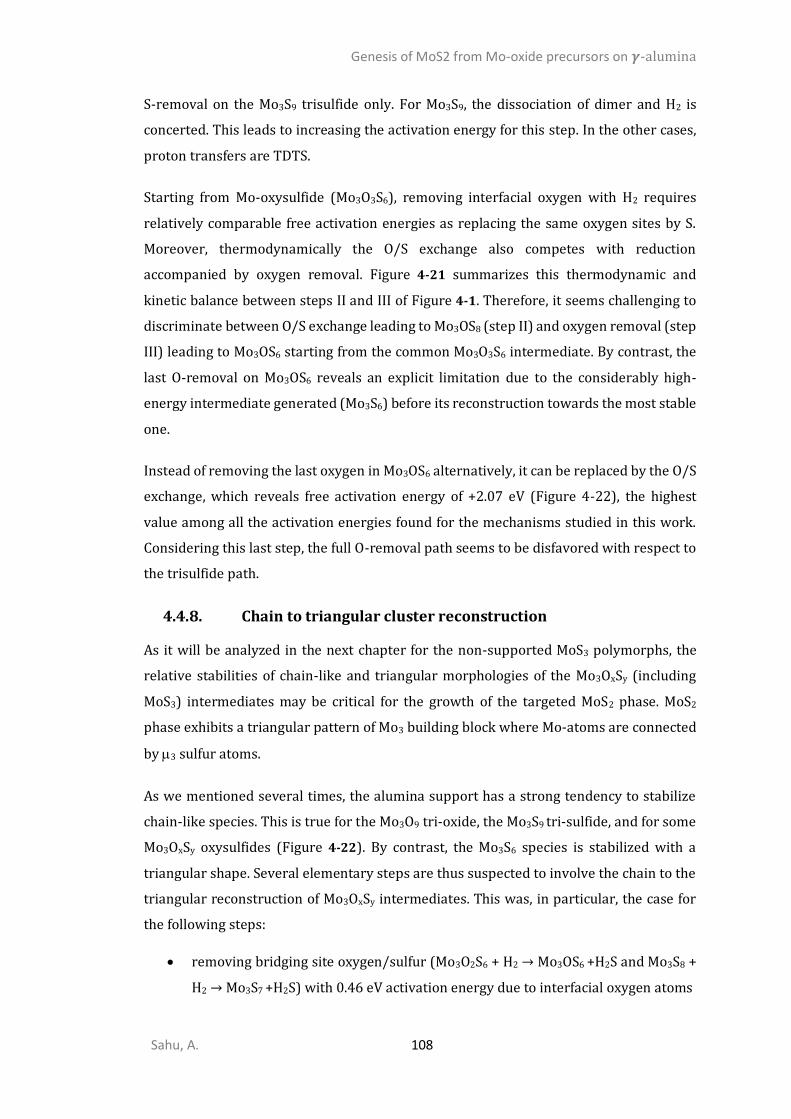
Genesis of MoS2 from Mo-oxide precursors on 𝜸-alumina
Sahu, A. 108
S-removal on the Mo3S9 trisulfide only. For Mo3S9, the dissociation of dimer and H2 is
concerted. This leads to increasing the activation energy for this step. In the other cases,
proton transfers are TDTS.
Starting from Mo-oxysulfide (Mo3O3S6), removing interfacial oxygen with H2 requires
relatively comparable free activation energies as replacing the same oxygen sites by S.
Moreover, thermodynamically the O/S exchange also competes with reduction
accompanied by oxygen removal. Figure 4-21 summarizes this thermodynamic and
kinetic balance between steps II and III of Figure 4-1. Therefore, it seems challenging to
discriminate between O/S exchange leading to Mo3OS8 (step II) and oxygen removal (step
III) leading to Mo3OS6 starting from the common Mo3O3S6 intermediate. By contrast, the
last O-removal on Mo3OS6 reveals an explicit limitation due to the considerably high-
energy intermediate generated (Mo3S6) before its reconstruction towards the most stable
one.
Instead of removing the last oxygen in Mo3OS6 alternatively, it can be replaced by the O/S
exchange, which reveals free activation energy of +2.07 eV (Figure 4-22), the highest
value among all the activation energies found for the mechanisms studied in this work.
Considering this last step, the full O-removal path seems to be disfavored with respect to
the trisulfide path.
4.4.8. Chain to triangular cluster reconstruction
As it will be analyzed in the next chapter for the non-supported MoS3 polymorphs, the
relative stabilities of chain-like and triangular morphologies of the Mo3OxSy (including
MoS3) intermediates may be critical for the growth of the targeted MoS2 phase. MoS2
phase exhibits a triangular pattern of Mo3 building block where Mo-atoms are connected
by 3 sulfur atoms.
As we mentioned several times, the alumina support has a strong tendency to stabilize
chain-like species. This is true for the Mo3O9 tri-oxide, the Mo3S9 tri-sulfide, and for some
Mo3OxSy oxysulfides (Figure 4-22). By contrast, the Mo3S6 species is stabilized with a
triangular shape. Several elementary steps are thus suspected to involve the chain to the
triangular reconstruction of Mo3OxSy intermediates. This was, in particular, the case for
the following steps:
• removing bridging site oxygen/sulfur (Mo3O2S6 + H2 → Mo3OS6 +H2S and Mo3S8 +
H2 → Mo3S7 +H2S) with 0.46 eV activation energy due to interfacial oxygen atoms
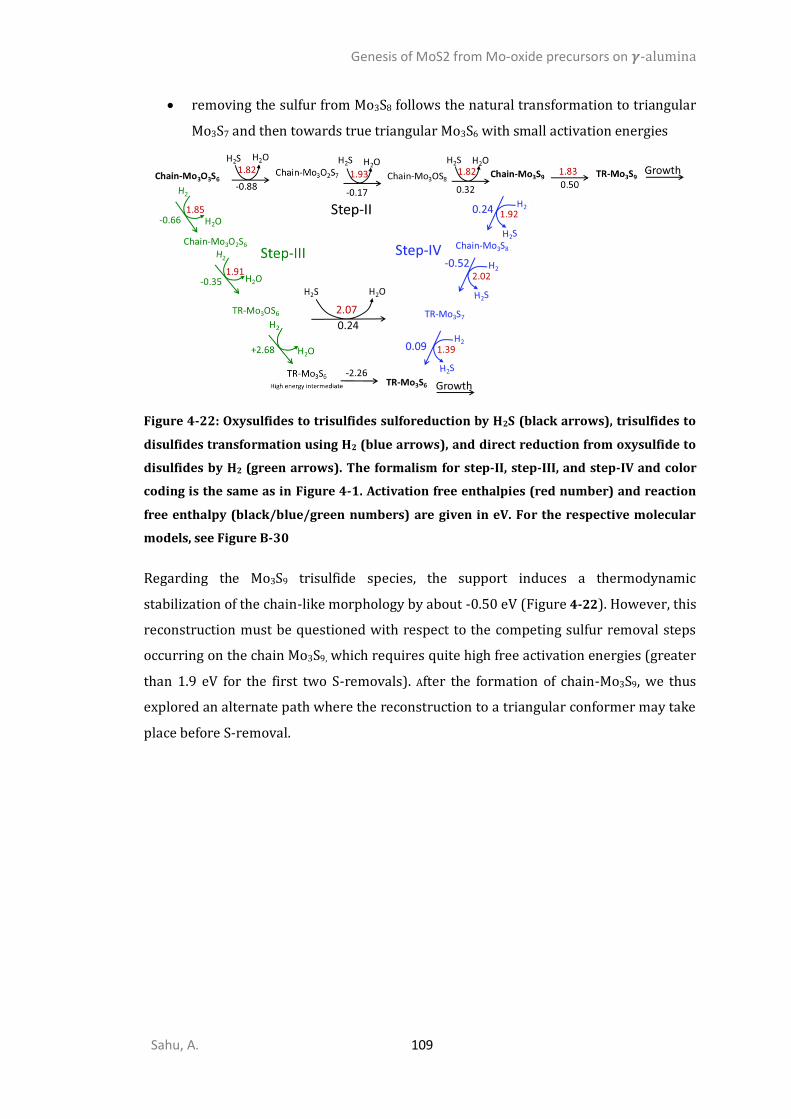
Genesis of MoS2 from Mo-oxide precursors on 𝜸-alumina
Sahu, A. 109
• removing the sulfur from Mo3S8 follows the natural transformation to triangular
Mo3S7 and then towards true triangular Mo3S6 with small activation energies
Figure 4-22: Oxysulfides to trisulfides sulforeduction by H2S (black arrows), trisulfides to
disulfides transformation using H2 (blue arrows), and direct reduction from oxysulfide to
disulfides by H2 (green arrows). The formalism for step-II, step-III, and step-IV and color
coding is the same as in Figure 4-1. Activation free enthalpies (red number) and reaction
free enthalpy (black/blue/green numbers) are given in eV. For the respective molecular
models, see Figure B-30
Regarding the Mo3S9 trisulfide species, the support induces a thermodynamic
stabilization of the chain-like morphology by about -0.50 eV (Figure 4-22). However, this
reconstruction must be questioned with respect to the competing sulfur removal steps
occurring on the chain Mo3S9, which requires quite high free activation energies (greater
than 1.9 eV for the first two S-removals). After the formation of chain-Mo3S9, we thus
explored an alternate path where the reconstruction to a triangular conformer may take
place before S-removal.
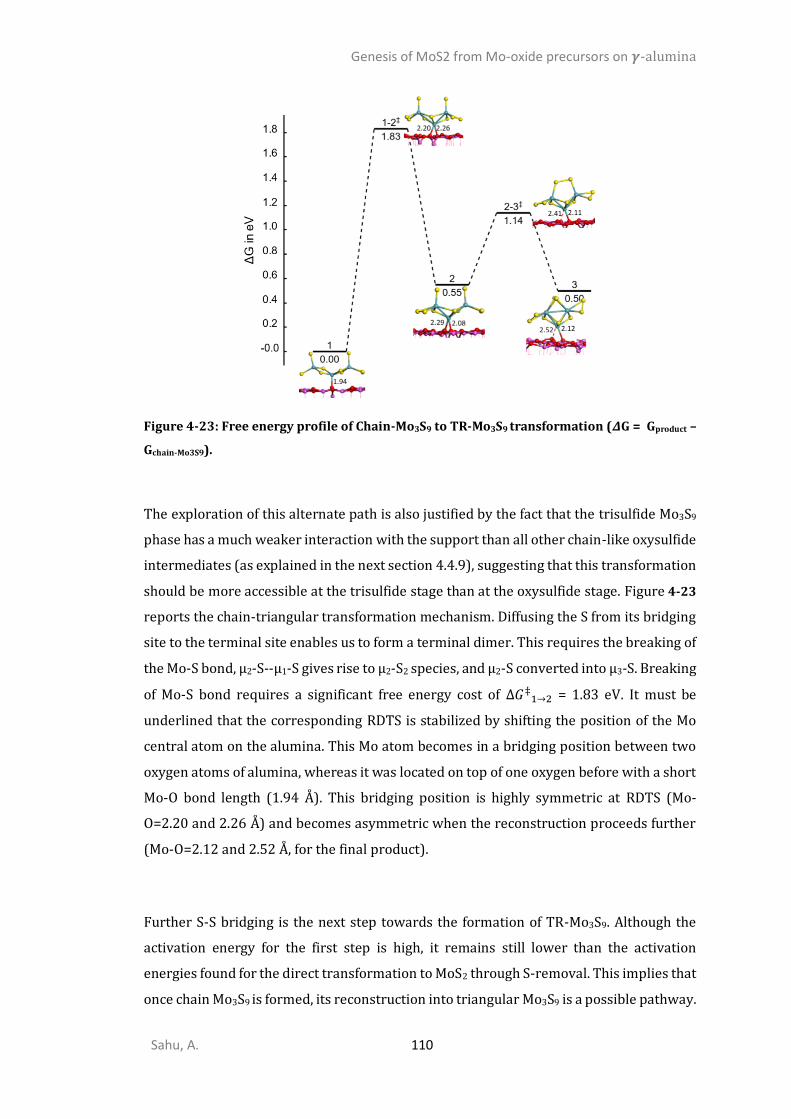
Genesis of MoS2 from Mo-oxide precursors on 𝜸-alumina
Sahu, A. 110
Figure 4-23: Free energy profile of Chain-Mo3S9 to TR-Mo3S9 transformation (𝜟G = Gproduct –
Gchain-Mo3S9).
The exploration of this alternate path is also justified by the fact that the trisulfide Mo3S9
phase has a much weaker interaction with the support than all other chain-like oxysulfide
intermediates (as explained in the next section 4.4.9), suggesting that this transformation
should be more accessible at the trisulfide stage than at the oxysulfide stage. Figure 4-23
reports the chain-triangular transformation mechanism. Diffusing the S from its bridging
site to the terminal site enables us to form a terminal dimer. This requires the breaking of
the Mo-S bond, µ2-S--µ1-S gives rise to µ2-S2 species, and µ2-S converted into µ3-S. Breaking
of Mo-S bond requires a significant free energy cost of Δ𝐺‡1→2 = 1.83 eV. It must be
underlined that the corresponding RDTS is stabilized by shifting the position of the Mo
central atom on the alumina. This Mo atom becomes in a bridging position between two
oxygen atoms of alumina, whereas it was located on top of one oxygen before with a short
Mo-O bond length (1.94 Å). This bridging position is highly symmetric at RDTS (Mo-
O=2.20 and 2.26 Å) and becomes asymmetric when the reconstruction proceeds further
(Mo-O=2.12 and 2.52 Å, for the final product).
Further S-S bridging is the next step towards the formation of TR-Mo3S9. Although the
activation energy for the first step is high, it remains still lower than the activation
energies found for the direct transformation to MoS2 through S-removal. This implies that
once chain Mo3S9 is formed, its reconstruction into triangular Mo3S9 is a possible pathway.
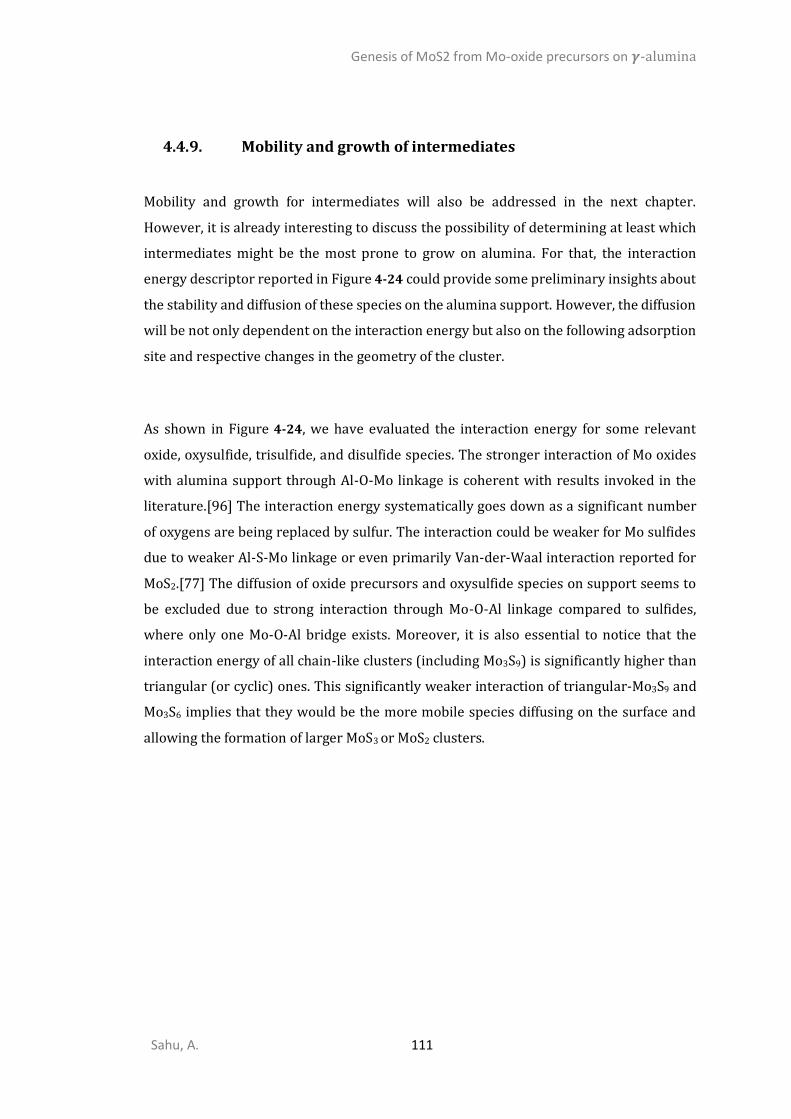
Genesis of MoS2 from Mo-oxide precursors on 𝜸-alumina
Sahu, A. 111
4.4.9. Mobility and growth of intermediates
Mobility and growth for intermediates will also be addressed in the next chapter.
However, it is already interesting to discuss the possibility of determining at least which
intermediates might be the most prone to grow on alumina. For that, the interaction
energy descriptor reported in Figure 4-24 could provide some preliminary insights about
the stability and diffusion of these species on the alumina support. However, the diffusion
will be not only dependent on the interaction energy but also on the following adsorption
site and respective changes in the geometry of the cluster.
As shown in Figure 4-24, we have evaluated the interaction energy for some relevant
oxide, oxysulfide, trisulfide, and disulfide species. The stronger interaction of Mo oxides
with alumina support through Al-O-Mo linkage is coherent with results invoked in the
literature.[96] The interaction energy systematically goes down as a significant number
of oxygens are being replaced by sulfur. The interaction could be weaker for Mo sulfides
due to weaker Al-S-Mo linkage or even primarily Van-der-Waal interaction reported for
MoS2.[77] The diffusion of oxide precursors and oxysulfide species on support seems to
be excluded due to strong interaction through Mo-O-Al linkage compared to sulfides,
where only one Mo-O-Al bridge exists. Moreover, it is also essential to notice that the
interaction energy of all chain-like clusters (including Mo3S9) is significantly higher than
triangular (or cyclic) ones. This significantly weaker interaction of triangular-Mo3S9 and
Mo3S6 implies that they would be the more mobile species diffusing on the surface and
allowing the formation of larger MoS3 or MoS2 clusters.
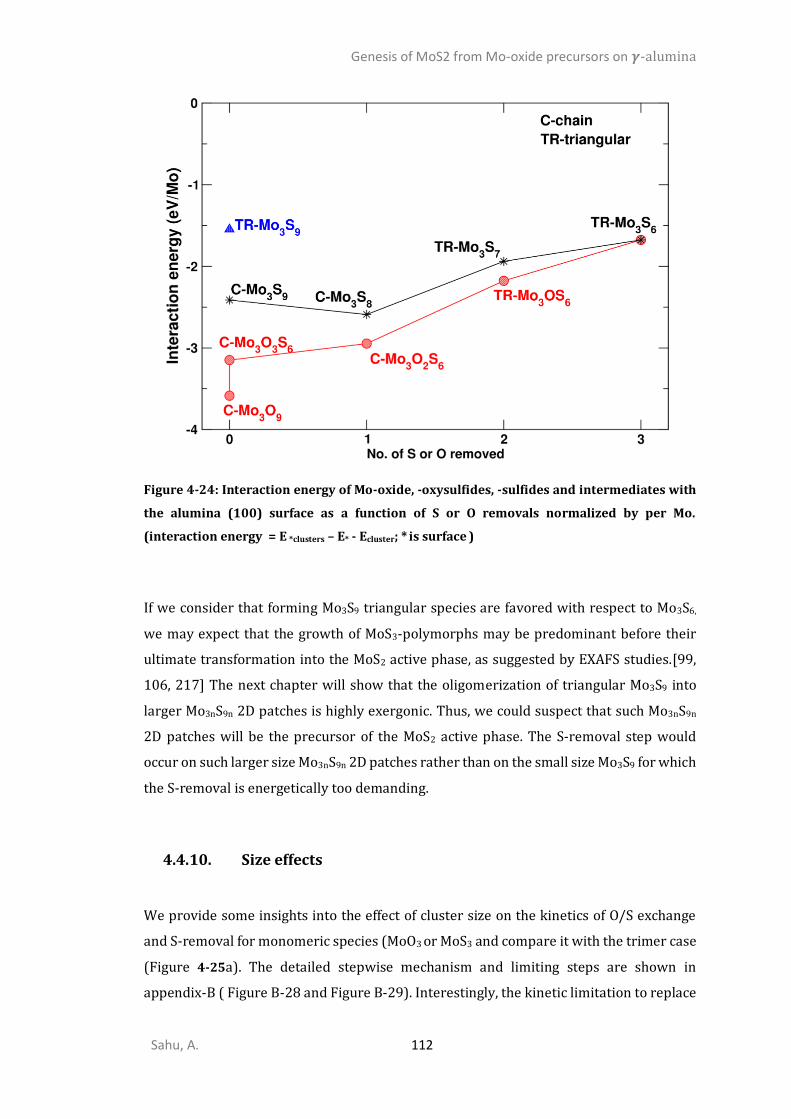
Genesis of MoS2 from Mo-oxide precursors on 𝜸-alumina
Sahu, A. 112
Figure 4-24: Interaction energy of Mo-oxide, -oxysulfides, -sulfides and intermediates with
the alumina (100) surface as a function of S or O removals normalized by per Mo.
(interaction energy = E *clusters – E* - Ecluster; * is surface )
If we consider that forming Mo3S9 triangular species are favored with respect to Mo3S6,
we may expect that the growth of MoS3-polymorphs may be predominant before their
ultimate transformation into the MoS2 active phase, as suggested by EXAFS studies.[99,
106, 217] The next chapter will show that the oligomerization of triangular Mo3S9 into
larger Mo3nS9n 2D patches is highly exergonic. Thus, we could suspect that such Mo3nS9n
2D patches will be the precursor of the MoS2 active phase. The S-removal step would
occur on such larger size Mo3nS9n 2D patches rather than on the small size Mo3S9 for which
the S-removal is energetically too demanding.
4.4.10. Size effects
We provide some insights into the effect of cluster size on the kinetics of O/S exchange
and S-removal for monomeric species (MoO3 or MoS3 and compare it with the trimer case
(Figure 4-25a). The detailed stepwise mechanism and limiting steps are shown in
appendix-B ( Figure B-28 and Figure B-29). Interestingly, the kinetic limitation to replace
Genesis of MoS2 from Mo-oxide precursors on 𝜸-alumina
Sahu, A. 113
interfacial oxygen remains also valid for monomers. Interfacial oxygen exchange costs
1.35 eV as compared to 1.08 eV for terminal oxygen. In both cases, the proton transfer
remains the rate-limiting step. The comparison of the monomer and the trimer reveals
that the O/S exchange for monomer is more advantageous than for trimer, and its
activation free energy is by 0.58 eV lower, while thermodynamic aspects are equivalent.
We suspect the stronger coordination for small Mo1O3 entities compare to larger ones
(Mo3O9); therefore, O/S exchange should be difficult, but we observe the reverse. This
unexpected observation indicates that the sulfidation mechanism is faster with small size
species such as MoO3. In particular, these small entities cannot explain the presence of
residual non-sulfided Mo species as often observed experimentally.[106, 217]
By contrast, the further S removal from Mo1S3 to Mo1S2 is found to be impossible
kinetically (free activation energy of 3.06 eV, Figure 4-25), which is far much greater than
for Mo3S9 species (1.91 eV). At the same time, it is thus more beneficial to sulfide Mo1O3,
and essentially impossible to transform into Mo1S2. However, more calculations are
required to validate this point. This result may indicate that smaller trisulfides entities
are less prone to change into disulfides than larger ones. This would imply that the growth
towards larger Mo3nS9n oligomers (such as 2D patches of 1T’-MoS3 described in the next
chapter) would enhance the S-removal step leading to Mo3nS6n disulfides.
Figure 4-25: Comparison of Gibbs free energy of activation for the monomer (MoO3) and the
trimer (Mo3O9) for O/S exchange using H2S.
Genesis of MoS2 from Mo-oxide precursors on 𝜸-alumina
Sahu, A. 114
As explained before, the growth at the trisulfide state is coherent with the fact that the
triangular-Mo3S9 supported on alumina has the weakest interaction energy (Figure 4-24),
even lower than Mo3S6. It implies that the mobility of Mo3S9 is greater than Mo3S6 or chain-
Mo3S9. Chain-Mo3S9 exhibits almost 1.5 times stronger interaction than that of TR-Mo3S9.
However, further investigations on diffusion barriers and on S-removal on larger size
Mo3nS9n would be required to confirm this hypothesis.
Conclusions
Using DFT calculations, we examined the mechanisms of the genesis of the active phase
on the (100) surface of 𝛾-alumina support in detail. Firstly, we probed the stability of
Mo1O3, Mo2O6, and Mo3O9 on alumina. Secondly, the stability of these models in the gas
phase and on the support have been compared. Structural and spectroscopic properties
were calculated for various critical Mo3OxSy intermediates formed during the S/O
exchange.
Thirdly, the presence of various types of oxygen sites and their chemical reactivity were
investigated. The thermodynamics and kinetics of these different O-sites were analyzed
for the exchange of O/S. The reduction path was inquired. We compared the two
competing pathways, oxysulfide and trisulfide, for the genesis of the active phase by
energetic span analysis. Fourthly, the effect of the size of sulfidation/reduction was
studied. The possibility of transforming one conformer to other (chain to triangular) was
also probed. The impact of entropy and the thermal correction was also considered for
some key pathways and intermediates. Based on current understanding, we propose
some possible routes for the growth of the a-MoS3/active phase.
The support shows a substantial impact on energetics and structures. Cyclic-Mo3O9 and
triangular Mo3S9 are more stable in the gas phase, while support stabilizes the linear
conformers. This thermodynamic trend was also be found to be true for the whole sulfo-
reduction pathway, which revealed the key role of the support interaction to control the
genesis of the sulfide phase.

Genesis of MoS2 from Mo-oxide precursors on 𝜸-alumina
Sahu, A. 115
Four types of specific oxygen sites are present on the Mo3O9 conformers: terminal,
bridging, interfacial bi-, and tri-dentate. They all have specific spectroscopic and
structural features. We monitored the evolution of these critical features during sulfo-
reduction and compared them with available EXAFS data and IR/Raman characteristic
peaks. Thermodynamically, the terminal and bridging oxygens are labile to be exchanged,
and interfacial oxygens are challenging to exchange by using H2S. However, kinetically the
bridging one is the easiest one to be replaced, the terminal one is moderately hard, and
the interfacial ones are the most challenging ones to be replaced.
The trisulfide Mo3S9 route to Mo3S6 is slightly favored over the reduction of Mo3O3S6 to
Mo3S6 due to the last difficult reduction step of Mo3OS6. However, the S-removal on small
Mo3S9 chain-like entities exhibits a high activation free energy (>1.9 eV) instead.
Alternatively, though the chains are more stable for the oxysulfide and trisulfide phase,
we propose that Mo3S9-chain transform into triangular at a competing cost and then
diffuse to condense with other Mo3S9 in order to form larger Mo3nS9n that will transform
into Mo3nS6n. The mobility of these TR-Mo3S9 species would be significantly less
demanding than the Chain-Mo3S9, oxysulfides, and disulfide species as a consequence of
their lower interaction energy with alumina. The formation of the larger MoS3 species on
alumina by the diffusion and sintering of small MoS3 species would need further
investigation. Furthermore, their transformation to the disulfide phase also requires
more attention to confirm the easier sulfur removal with increasing MoS3 cluster size.
For that, it is necessary to determine the structural and energetics of MoS3 polymorphs as
a function of sizes, which is the topic of the next chapter. The investigation will be carried
out in the absence of alumina support to quantify the intrinsic trends related to the MoS3
polymorphs. Moreover, as we have already seen, the tri-sulfides have weaker interaction
than oxides or oxysulfides; this interaction would be even weaker for the larger size.
Therefore, it is reasonable to drop the effect of support while investigating MoS3 phase
stability.

Genesis of MoS2 from Mo-oxide precursors on 𝜸-alumina
Sahu, A. 116
Amorphous MoS3: Size-dependent structural properties, spectroscopic, and energetic analysis
Sahu, A. 117
Amorphous MoS3: Size-dependent structural properties, spectroscopic, and energetic analysis
This chapter reproduced the text published in the paper
https://doi.org/10.1021/acs.cgd.0c00981. [220]
Despite the growing interest in the a-MoS3 phase due to its diversified applications, many
open voids exist about its structural understanding. In this chapter, we undertake some of
them, such as triangular vs. chain, Mo-Mo bond types, sulfur species, and their respective
spectroscopic signature. We also determine the evolution of MoS3 polymorphs as a function
of size and their possible transformation scheme from one polymorph to another.
Introduction
As we have discussed the importance of the MoS3 phase (section 2.1.4), over the past few
decades, amorphous MoS3 (a-MoS3) based nanomaterials have gained significant
attention from the scientific community because of their versatile properties valuable for
industrial applications as well as for numerous emerging applications in new energies.
The a-MoS3 phase was shown to play a crucial role as electro-and photo-chemical (pre-
)catalysts for hydrogen evolution reaction (HER).[128, 240, 241] It was also found to
exhibit attractive capacity and rate capability when used in electrode materials for
batteries.[20, 21, 28, 58, 242] The use of a-MoS3 was also suggested to improve the
recovery of Hg capture from the flue gas.[24, 243] Finally, in the synthesis of industrial
MoS2 based catalysts used in hydrodesulfurization (HDS), a-MoS3 is known to be a key
precursor formed during the activation of the 2H-MoS2 nano-crystalline phase.[7, 104]
Moreover, MoS3 improves the catalytic activity if used as a precursor for the preparation
of the HDS catalyst.[111]
Several experimental[36, 40, 41, 112–115] and a few theoretical[38, 39] approaches have
been applied to provide the atomic-scale understanding of the nature of the MoS3 phase
Amorphous MoS3: Size-dependent structural properties, spectroscopic, and energetic analysis
Sahu, A. 118
and its reactivity. The amorphous nature and attractive properties of its 1D- or 2D nano-
structure make it an intriguing system to study. The presence of various sulfur species
such as S2- and S22- gives flexibility to the structure and is suspected to be a potential active
site for HER or other applications. [19, 53, 56, 116, 117]
Despite the attractive interest of a-MoS3 based nanomaterials, the amorphous nature of
the MoS3 phase makes it challenging to control and understand its chemical reactivity. In
particular, the type of the structural building unit such as Mo3 triangular[39, 40, 123] vs.
Mo chain[34, 41, 42, 120] is still debated. In contrast, the ambivalent interpretation of the
nature of sulfur species (S2-, S22-) and types of present Mo-Mo[41, 118][35, 120–122] bonds
leads to ambiguous interpretations of spectroscopic data and reactivity. IR peak
assignment based on (NH4+)2[Mo3S132-] remains questionable where no µ1-S and µ1-S2
descriptor exist in the reference compound.[40]
By density functional theory (DFT), we simulate the energetic, structural, and
spectroscopic features of relevant 0D-, 1D- and 2D-MoS3 triangular, chain-like
polymorphs. Moreover, we will also shed light on some unprecedented 0D-2D-nano-
structures (ring, wave, and helix) of the MoS3 polymorphs and revisit the interpretation
of EXAFS, IR-RAMAN, and XPS experimental data. To validate the reliability of the newly
proposed structures, we will analyze the various structures and compare them with
available EXAFS data. The relative stability of the multiple polymorphs will be determined
as a function of sizes. We explore how MokS3k clusters of a few k atoms may grow up to
infinite MoS3 polymorphs (periodic replica). The computed IR spectra within the density
functional perturbation theory level will be compared with a reference experimental IR
spectrum of bulk-MoS3.[40] We also discuss the core level shift (Δ𝐵𝐸) with the
corresponding XPS signals. We finally propose the possible transformation of MoS3
polymorphs upon oligomerization by analyzing molecular dynamics simulations and
growth energy profiles. Only the key results are presented here; some of the detailed
information about explored structures for triangulars and chains, and spectroscopic
analysis of various species is given in Appendix-C. We will refer to these details in this
chapter wherever it is needed.
Amorphous MoS3: Size-dependent structural properties, spectroscopic, and energetic analysis
Sahu, A. 119
Methods
For all the calculations, density functional theory (DFT) as implemented in VASP[232–
234] has been used relying on the Perdew-Burke-Ernzerhof (PBE)[176] functional within
the framework of generalized gradient approximation (GGA). The long-range interactions
were included through a density-dependent dispersion correction (dDsC)[177, 178]. The
projector augmented-wave (PAW) method[235] was chosen to describe the electron-ion
interaction. The kinetic energy cut-off for the plane-wave basis set has been fixed at 500
eV. Furthermore, for the minimization of the electronic energy, a Gaussian smearing with
a width of 0.2 eV was chosen. In contrast, a mixture of the blocked-Davidson scheme and
residual minimization method direct inversion in the iterative subspace has been applied.
Spin-polarized calculations were performed to obtain the ground state of the clusters.
Brillouin zone integration has been adapted as a function of each simulated system, either
cluster or periodic structure.
To represent the MoS3 polymorphs, we simulated two types of molecular models: MokS3k
clusters of various finite sizes and periodic structures of infinite size in one dimension. A
large vacuum has been used to minimize the spurious interactions with neighboring
images along with the nonperiodic directions of the respective models. To optimize the
structures of the various polymorphs, the conjugate gradient algorithm was used.
Electronic and geometric convergence cut-off has been set to 10-6 eV and 0.02 eV/Å,
respectively. For the clusters’ geometry optimization, a large cubic supercell was used to
avoid the spurious interactions of the clusters with its periodic images. For the periodic
structures, the ionic positions and cell parameters along the periodic replica have been
optimized.
The exploration of some complex structures has been refined by ab initio molecular
dynamics (AIMD) with the scaled velocity Verlet algorithm to solve Newton’s equations
of motions (time step of 5 fs and T = 1000 K).
For frequency calculations, the structures have been optimized with tighter convergence
criteria such as 10-7 eV for electronic properties and 0.01 eV/Å for geometry. To calculate
the frequencies and corresponding infra-red intensities, the linear response method with
Amorphous MoS3: Size-dependent structural properties, spectroscopic, and energetic analysis
Sahu, A. 120
density functional perturbation theory (DFPT) has been used as implemented in
VASP.[193] We convoluted the IR intensity peaks by a normal distribution with the
variance of 80 cm-1 to compare with the experimental IR.
To calculate the core-level binding energy (BE), we use the Janak-Slater transition state
approach[200, 202, 244], where a half electron is shifted to the lowest unoccupied
molecular orbital (LUMO) from its core rather than creating a full core-hole. We compare
this BE with available XPS data.
For determining the thermodynamic stability of the various oligomers, the following
equation has been used to calculate the relative growth energy 𝛥𝐸 at 0 K:
𝑴𝒐𝟑𝑺𝟗 →
𝟑
𝒌 𝑴𝒐𝒌𝑺𝟑𝒌
5-1
𝜟𝑬 =
𝟑
𝒌[𝑬(𝑴𝒐𝒌𝑺𝟑𝒌) − 𝑬(𝑴𝒐𝟑𝑺𝟗)]
5-2
where 𝐸(𝑀𝑜𝑘𝑆3𝑘) is the electronic energy of the MokS3k cluster or periodic structure, and
𝐸(𝑀𝑜3𝑆9) is the energy of the Mo3S9 cluster used as a reference. The effect of zero-point
energy, thermal corrections, and entropy have been included in calculating the free
energy variation (details are given in appendix C) :
𝜟𝑮 =
𝟑
𝒌[𝑮𝒗𝒊𝒃(𝑴𝒐𝒌𝑺𝟑𝒌) − 𝑮𝒗𝒊𝒃(𝑴𝒐𝟑𝑺𝟗)]
5-3
We have assumed that the MokS3k clusters or infinite structures are immobile, and thus
they have no translational and rotational contributions.
Amorphous MoS3: Size-dependent structural properties, spectroscopic, and energetic analysis
Sahu, A. 121
Structure analysis
5.3.1. 0D- and 1D-model of triangular oligomers (TO)
Inspired by the earlier experimental work by Weber et al.[40], we first optimized the
numerous possible structures of the Mo3S9 triangular monomers. All these structures
differ by the nature, number, and location of sulfur species:
• S22- dimers, either on top (also called µ1-S2 in what follows) or in bridging site (µ2-
S2),
• S2- atoms, either on top (µ1-S), or in the bridging site (µ2-S), or in the hollow site
(µ3-S).
The most stable structure is shown in Figure 5-1a), while other metastable structures
with relative energies are given in Figure C-1 and Figure C-2. This stable structure exhibits
:
• two S22- dimers : one µ1-S2 and one µ2-S2,
• four S2- atoms : two µ1-S, two µ2-S, and one µ3-S.
None of the empirically proposed structures by Weber et al.[40] corresponds to the most
stable one: their energy is at least +0.65 eV higher than the one reported in Figure 5-1a,
see Figure C-1). Weber’s proposals were made on the assumption of the experimentally
observed +4 oxidation state of Mo. Actually, our minimal energy structure of Mo3S9
exhibits an average formal oxidation state of +4.67 (assuming a formal 2e - charge for the
S-atom and S2 dimers). Previous DFT calculations also showed that Weber’s structures
are subject to strong reconstructions, and resulting Mo exhibits formal oxidation states
higher than +4.[39] This apparent discrepancy indicates that such Mo3S9 triangular
monomers are not the dominant species in a-MoS3. Nevertheless, they might co-exist with
other oligomeric structures with an average oxidation state close to +4.
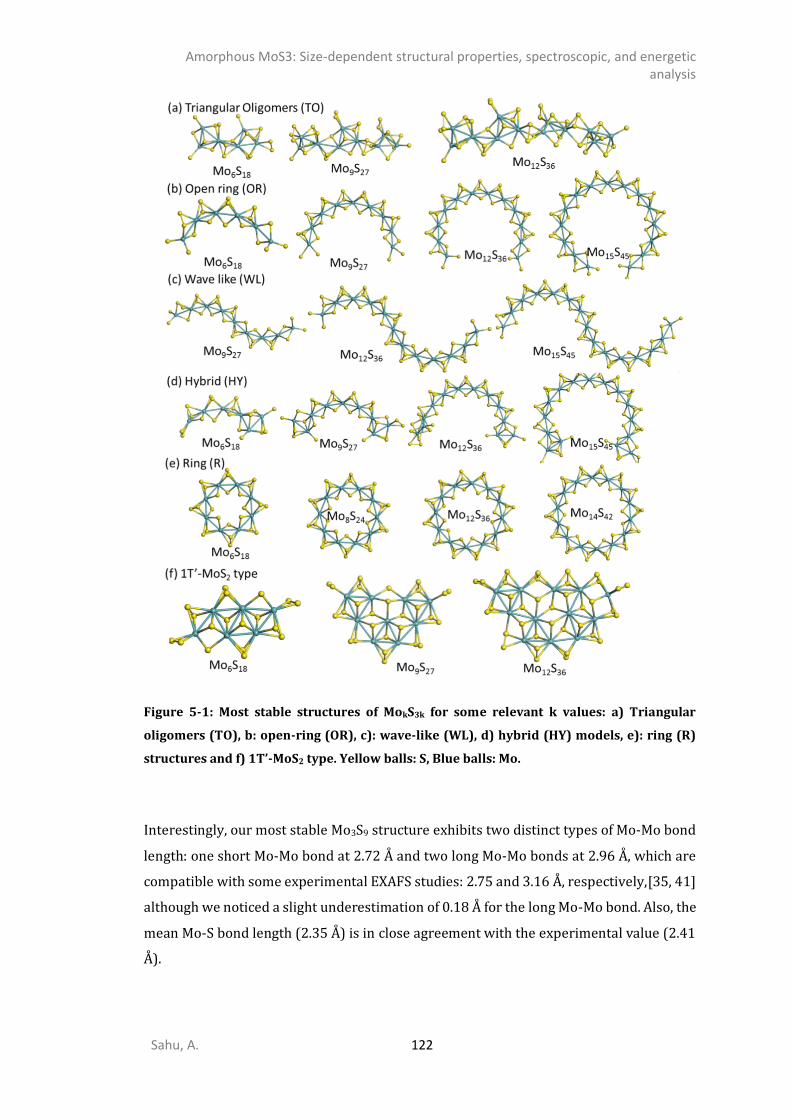
Amorphous MoS3: Size-dependent structural properties, spectroscopic, and energetic analysis
Sahu, A. 122
Figure 5-1: Most stable structures of MokS3k for some relevant k values: a) Triangular
oligomers (TO), b: open-ring (OR), c): wave-like (WL), d) hybrid (HY) models, e): ring (R)
structures and f) 1T’-MoS2 type. Yellow balls: S, Blue balls: Mo.
Interestingly, our most stable Mo3S9 structure exhibits two distinct types of Mo-Mo bond
length: one short Mo-Mo bond at 2.72 Å and two long Mo-Mo bonds at 2.96 Å, which are
compatible with some experimental EXAFS studies: 2.75 and 3.16 Å, respectively,[35, 41]
although we noticed a slight underestimation of 0.18 Å for the long Mo-Mo bond. Also, the
mean Mo-S bond length (2.35 Å) is in close agreement with the experimental value (2.41
Å).
Amorphous MoS3: Size-dependent structural properties, spectroscopic, and energetic analysis
Sahu, A. 123
However, as suggested experimentally, a-MoS3 could actually consist of larger oligomers
made of Mo3S9 triangular clusters interconnected by S species. [40, 128] Exploring the
size effects on triangular oligomers (TO) requires the simulations of various TO
conformers. For Mo6S18 this revealed that the interconnection of two Mo3S9 triangular
units occurs through one S2 dimer and one S atom (initially µ2-S) becoming µ3-S (Figure
5-2a). Hence, this interconnection does not involve only one or two S-atoms as originally
suggested,[40] but three S-atoms. This structural trend is further confirmed for the larger
oligomers Mo9S27, Mo12S36, and Mo15S45 (Figure 5-1b). The average formal oxidation state
of Mo in these oligomeric structures continuously decreases from +4.67 for Mo3S9 to +4.16
for Mo15S45 TO. This evolution is due to the vanishing contribution of µ1-S1 species located
at the edges when size increases. Note that we will call “edges” the two terminal units of
the chain-like model in the following.
To go beyond the 0D structures, we have optimized the corresponding 1D structure of TO
systems. According to the spatial rotation of each Mo3S9 triangular unit along the TO chain,
the smallest periodic structure allowing the chain interconnection between two
neighboring supercells was found for Mo18S54 (Figure 5-3a). For this 1D TO-periodic (TO-
P) chain, no µ1-S species remains as a consequence of periodicity. Moreover, the mean Mo
oxidation state reaches the limit of +4 for TO-P, while it is 4.11 for Mo18S54, both of which
are very close to the experimental value.[40]
Considering the local interatomic distances, the short and long Mo-Mo and Mo-S bond-
lengths slightly expand as a function of the oligomer size (Table C-3). We determine these
bond lengths for the Mo18S54 TO-P structure (Table 5-1) by calculating the pair
correlation functions (PCF, Figure C-5). The short Mo-Mo bond length is about 2.76 Å, and
the long Mo-Mo bond becomes 3.08 Å which is in closer agreement with the experimental
EXAFS data (Table 5-1).[41] As the size of TO increases, the long Mo-Mo bond present in
triangular monomers such as Mo3S9 shortens (Figure 5-2a), while the long Mo-Mo bond is
located at the interconnection of two triangular monomers along the chain. The mean Mo-
S bond length also slightly expands to 2.42 Å with the size increase, in good agreement
with EXAFS.
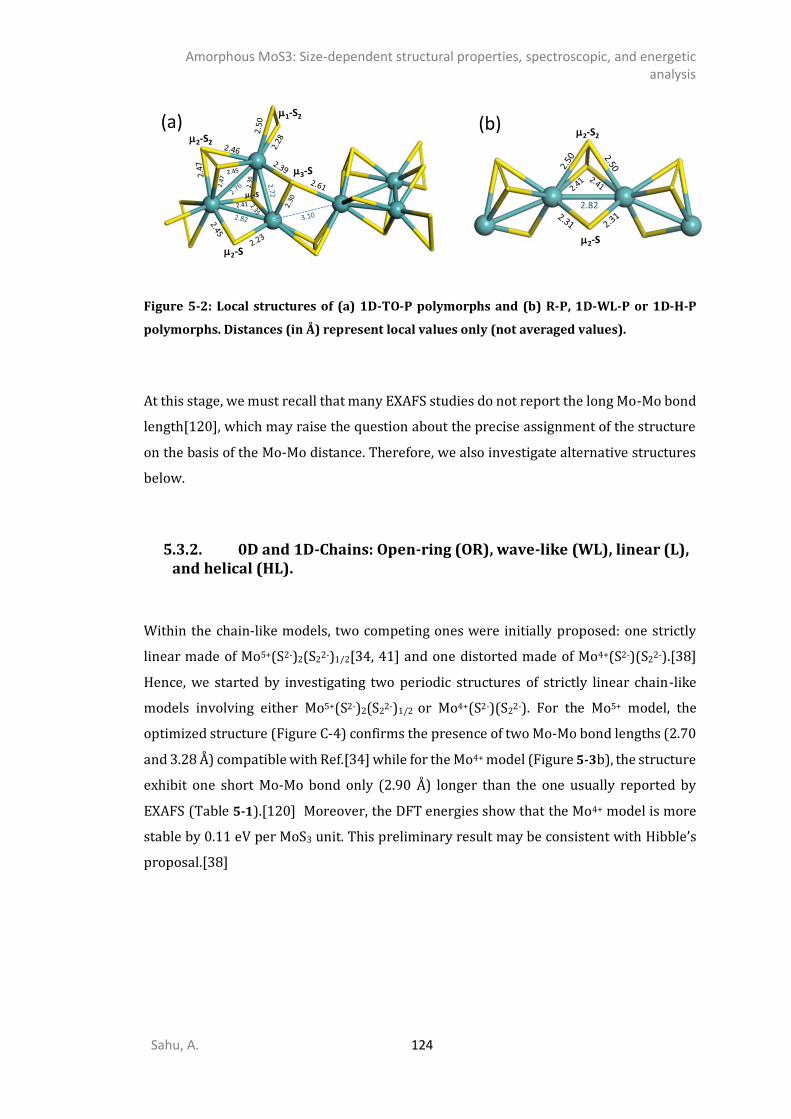
Amorphous MoS3: Size-dependent structural properties, spectroscopic, and energetic analysis
Sahu, A. 124
Figure 5-2: Local structures of (a) 1D-TO-P polymorphs and (b) R-P, 1D-WL-P or 1D-H-P
polymorphs. Distances (in Å) represent local values only (not averaged values).
At this stage, we must recall that many EXAFS studies do not report the long Mo-Mo bond
length[120], which may raise the question about the precise assignment of the structure
on the basis of the Mo-Mo distance. Therefore, we also investigate alternative structures
below.
5.3.2. 0D and 1D-Chains: Open-ring (OR), wave-like (WL), linear (L), and helical (HL).
Within the chain-like models, two competing ones were initially proposed: one strictly
linear made of Mo5+(S2-)2(S22-)1/2[34, 41] and one distorted made of Mo4+(S2-)(S22-).[38]
Hence, we started by investigating two periodic structures of strictly linear chain-like
models involving either Mo5+(S2-)2(S22-)1/2 or Mo4+(S2-)(S22-). For the Mo5+ model, the
optimized structure (Figure C-4) confirms the presence of two Mo-Mo bond lengths (2.70
and 3.28 Å) compatible with Ref.[34] while for the Mo4+ model (Figure 5-3b), the structure
exhibit one short Mo-Mo bond only (2.90 Å) longer than the one usually reported by
EXAFS (Table 5-1).[120] Moreover, the DFT energies show that the Mo4+ model is more
stable by 0.11 eV per MoS3 unit. This preliminary result may be consistent with Hibble’s
proposal.[38]
1-S2
2-S2
3-S
3-S
2-S2-S
2-S2
2.82
(a) (b)
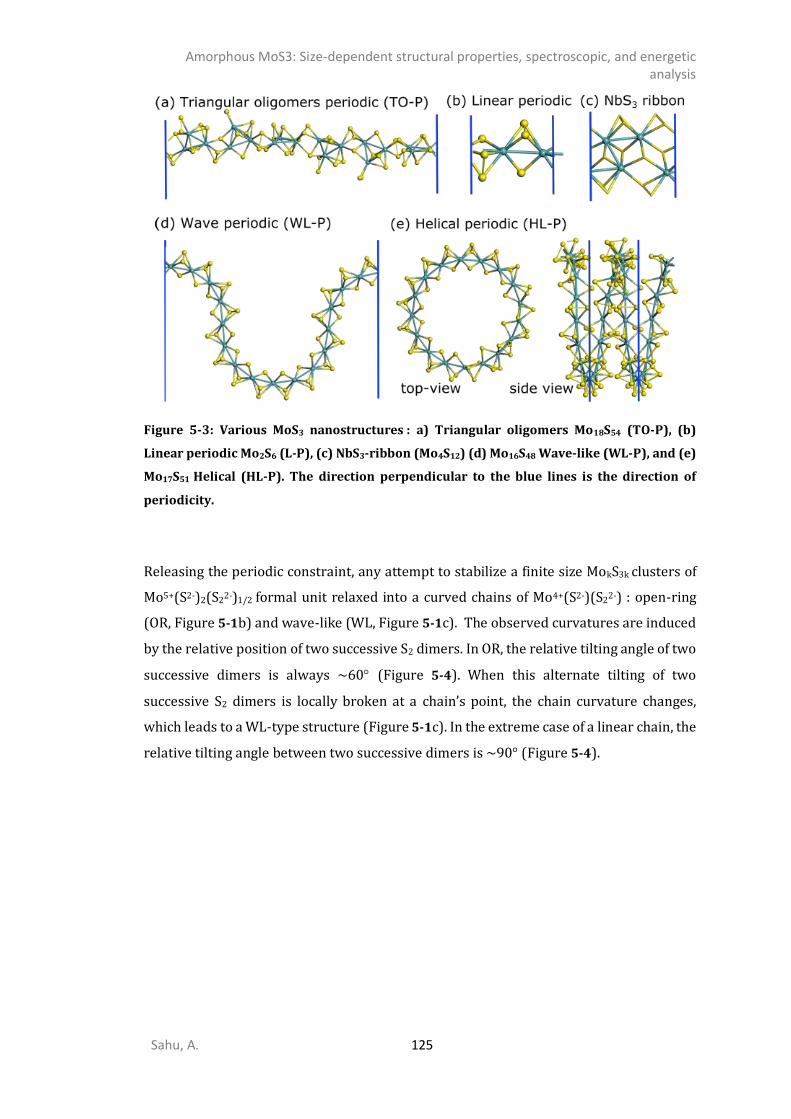
Amorphous MoS3: Size-dependent structural properties, spectroscopic, and energetic analysis
Sahu, A. 125
Figure 5-3: Various MoS3 nanostructures : a) Triangular oligomers Mo18S54 (TO-P), (b)
Linear periodic Mo2S6 (L-P), (c) NbS3-ribbon (Mo4S12) (d) Mo16S48 Wave-like (WL-P), and (e)
Mo17S51 Helical (HL-P). The direction perpendicular to the blue lines is the direction of
periodicity.
Releasing the periodic constraint, any attempt to stabilize a finite size MokS3k clusters of
Mo5+(S2-)2(S22-)1/2 formal unit relaxed into a curved chains of Mo4+(S2-)(S22-) : open-ring
(OR, Figure 5-1b) and wave-like (WL, Figure 5-1c). The observed curvatures are induced
by the relative position of two successive S2 dimers. In OR, the relative tilting angle of two
successive dimers is always ~60 (Figure 5-4). When this alternate tilting of two
successive S2 dimers is locally broken at a chain’s point, the chain curvature changes,
which leads to a WL-type structure (Figure 5-1c). In the extreme case of a linear chain, the
relative tilting angle between two successive dimers is ~90° (Figure 5-4).
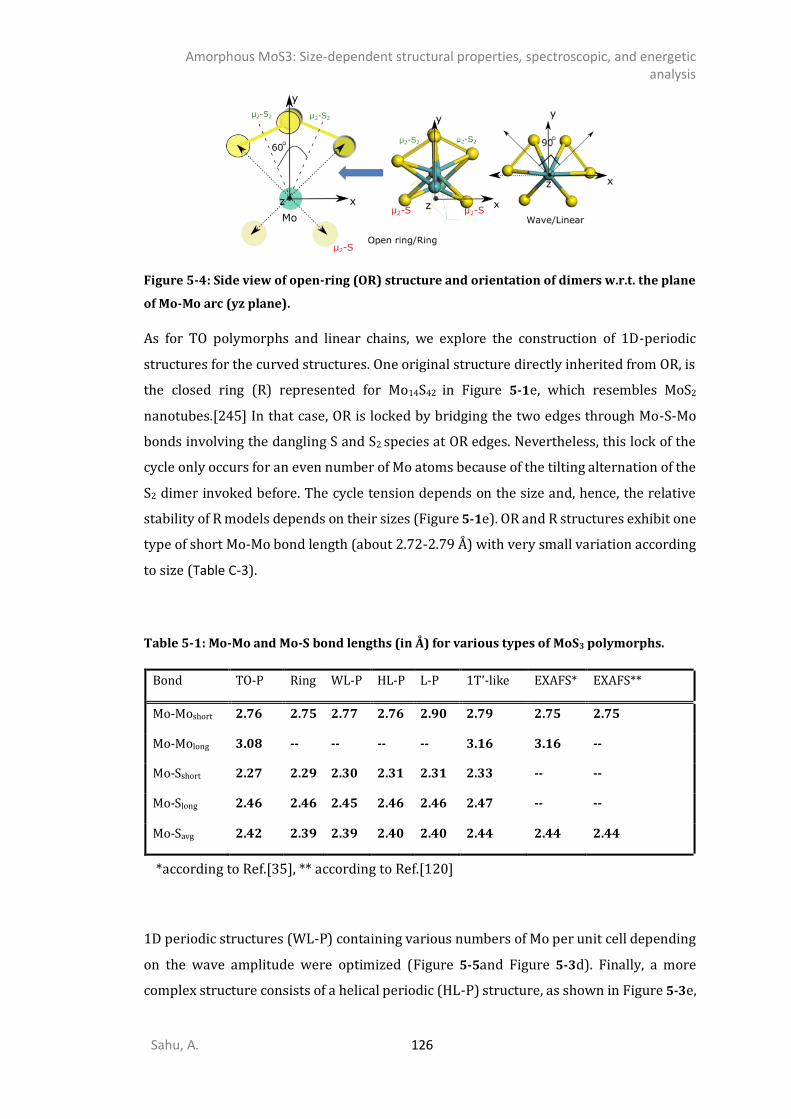
Amorphous MoS3: Size-dependent structural properties, spectroscopic, and energetic analysis
Sahu, A. 126
Figure 5-4: Side view of open-ring (OR) structure and orientation of dimers w.r.t. the plane
of Mo-Mo arc (yz plane).
As for TO polymorphs and linear chains, we explore the construction of 1D-periodic
structures for the curved structures. One original structure directly inherited from OR, is
the closed ring (R) represented for Mo14S42 in Figure 5-1e, which resembles MoS2
nanotubes.[245] In that case, OR is locked by bridging the two edges through Mo-S-Mo
bonds involving the dangling S and S2 species at OR edges. Nevertheless, this lock of the
cycle only occurs for an even number of Mo atoms because of the tilting alternation of the
S2 dimer invoked before. The cycle tension depends on the size and, hence, the relative
stability of R models depends on their sizes (Figure 5-1e). OR and R structures exhibit one
type of short Mo-Mo bond length (about 2.72-2.79 Å) with very small variation according
to size (Table C-3).
Table 5-1: Mo-Mo and Mo-S bond lengths (in Å) for various types of MoS3 polymorphs.
Bond TO-P Ring WL-P HL-P L-P 1T’-like EXAFS* EXAFS**
Mo-Moshort 2.76 2.75 2.77 2.76 2.90 2.79 2.75 2.75
Mo-Molong 3.08 -- -- -- -- 3.16 3.16 --
Mo-Sshort 2.27 2.29 2.30 2.31 2.31 2.33 -- --
Mo-Slong 2.46 2.46 2.45 2.46 2.46 2.47 -- --
Mo-Savg 2.42 2.39 2.39 2.40 2.40 2.44 2.44 2.44
*according to Ref.[35], ** according to Ref.[120]
1D periodic structures (WL-P) containing various numbers of Mo per unit cell depending
on the wave amplitude were optimized (Figure 5-5and Figure 5-3d). Finally, a more
complex structure consists of a helical periodic (HL-P) structure, as shown in Figure 5-3e,
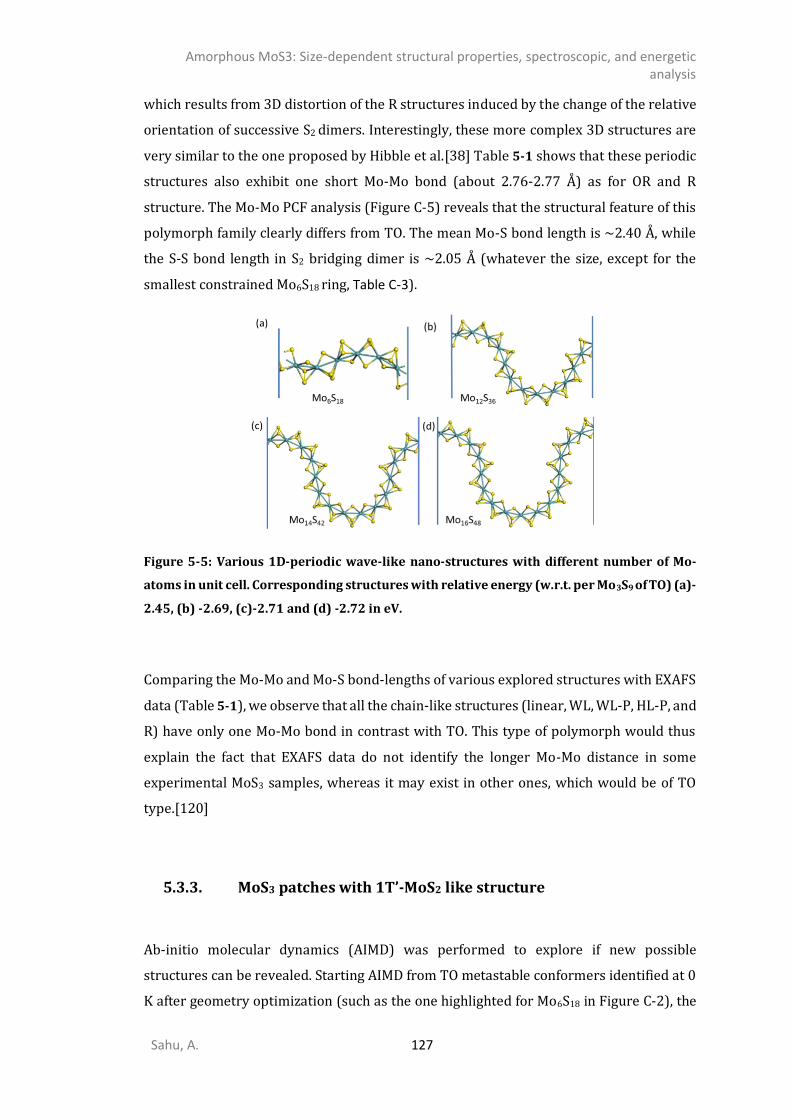
Amorphous MoS3: Size-dependent structural properties, spectroscopic, and energetic analysis
Sahu, A. 127
which results from 3D distortion of the R structures induced by the change of the relative
orientation of successive S2 dimers. Interestingly, these more complex 3D structures are
very similar to the one proposed by Hibble et al.[38] Table 5-1 shows that these periodic
structures also exhibit one short Mo-Mo bond (about 2.76-2.77 Å) as for OR and R
structure. The Mo-Mo PCF analysis (Figure C-5) reveals that the structural feature of this
polymorph family clearly differs from TO. The mean Mo-S bond length is ~2.40 Å, while
the S-S bond length in S2 bridging dimer is ~2.05 Å (whatever the size, except for the
smallest constrained Mo6S18 ring, Table C-3).
Figure 5-5: Various 1D-periodic wave-like nano-structures with different number of Mo-
atoms in unit cell. Corresponding structures with relative energy (w.r.t. per Mo3S9 of TO) (a)-
2.45, (b) -2.69, (c)-2.71 and (d) -2.72 in eV.
Comparing the Mo-Mo and Mo-S bond-lengths of various explored structures with EXAFS
data (Table 5-1), we observe that all the chain-like structures (linear, WL, WL-P, HL-P, and
R) have only one Mo-Mo bond in contrast with TO. This type of polymorph would thus
explain the fact that EXAFS data do not identify the longer Mo-Mo distance in some
experimental MoS3 samples, whereas it may exist in other ones, which would be of TO
type.[120]
5.3.3. MoS3 patches with 1T’-MoS2 like structure
Ab-initio molecular dynamics (AIMD) was performed to explore if new possible
structures can be revealed. Starting AIMD from TO metastable conformers identified at 0
K after geometry optimization (such as the one highlighted for Mo6S18 in Figure C-2), the
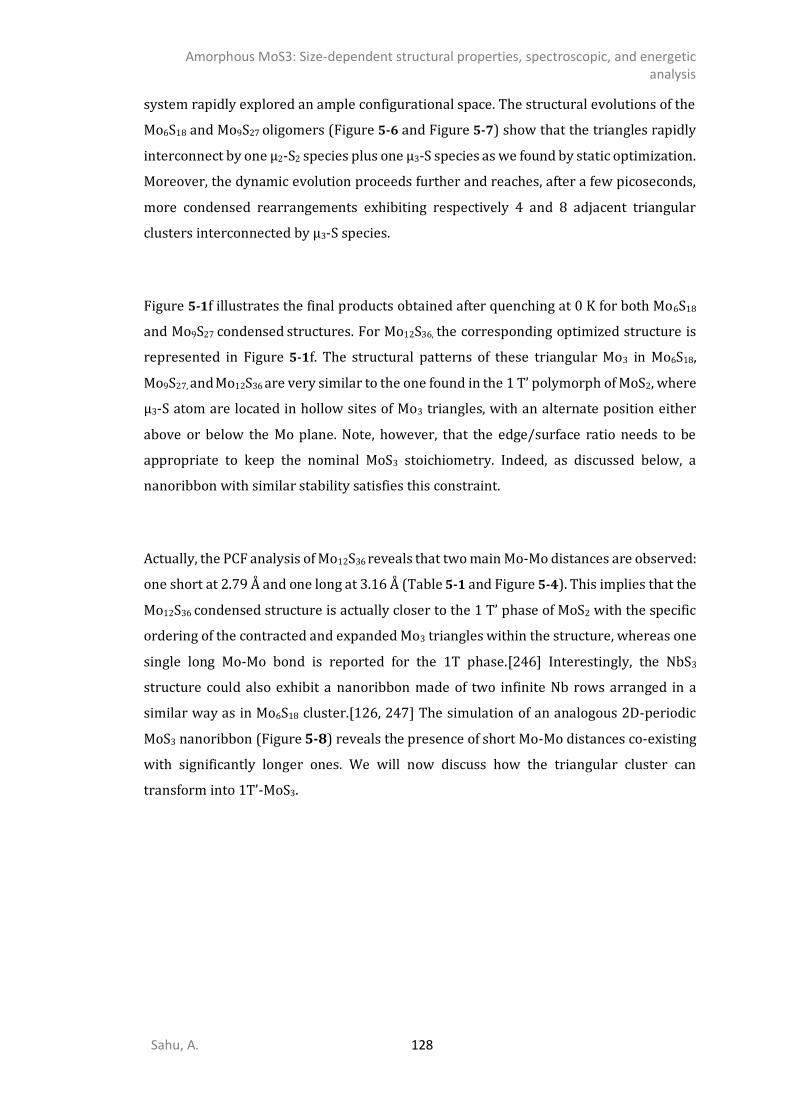
Amorphous MoS3: Size-dependent structural properties, spectroscopic, and energetic analysis
Sahu, A. 128
system rapidly explored an ample configurational space. The structural evolutions of the
Mo6S18 and Mo9S27 oligomers (Figure 5-6 and Figure 5-7) show that the triangles rapidly
interconnect by one µ2-S2 species plus one µ3-S species as we found by static optimization.
Moreover, the dynamic evolution proceeds further and reaches, after a few picoseconds,
more condensed rearrangements exhibiting respectively 4 and 8 adjacent triangular
clusters interconnected by µ3-S species.
Figure 5-1f illustrates the final products obtained after quenching at 0 K for both Mo6S18
and Mo9S27 condensed structures. For Mo12S36, the corresponding optimized structure is
represented in Figure 5-1f. The structural patterns of these triangular Mo3 in Mo6S18,
Mo9S27, and Mo12S36 are very similar to the one found in the 1 T’ polymorph of MoS2, where
µ3-S atom are located in hollow sites of Mo3 triangles, with an alternate position either
above or below the Mo plane. Note, however, that the edge/surface ratio needs to be
appropriate to keep the nominal MoS3 stoichiometry. Indeed, as discussed below, a
nanoribbon with similar stability satisfies this constraint.
Actually, the PCF analysis of Mo12S36 reveals that two main Mo-Mo distances are observed:
one short at 2.79 Å and one long at 3.16 Å (Table 5-1 and Figure 5-4). This implies that the
Mo12S36 condensed structure is actually closer to the 1 T’ phase of MoS2 with the specific
ordering of the contracted and expanded Mo3 triangles within the structure, whereas one
single long Mo-Mo bond is reported for the 1T phase.[246] Interestingly, the NbS3
structure could also exhibit a nanoribbon made of two infinite Nb rows arranged in a
similar way as in Mo6S18 cluster.[126, 247] The simulation of an analogous 2D-periodic
MoS3 nanoribbon (Figure 5-8) reveals the presence of short Mo-Mo distances co-existing
with significantly longer ones. We will now discuss how the triangular cluster can
transform into 1T’-MoS3.
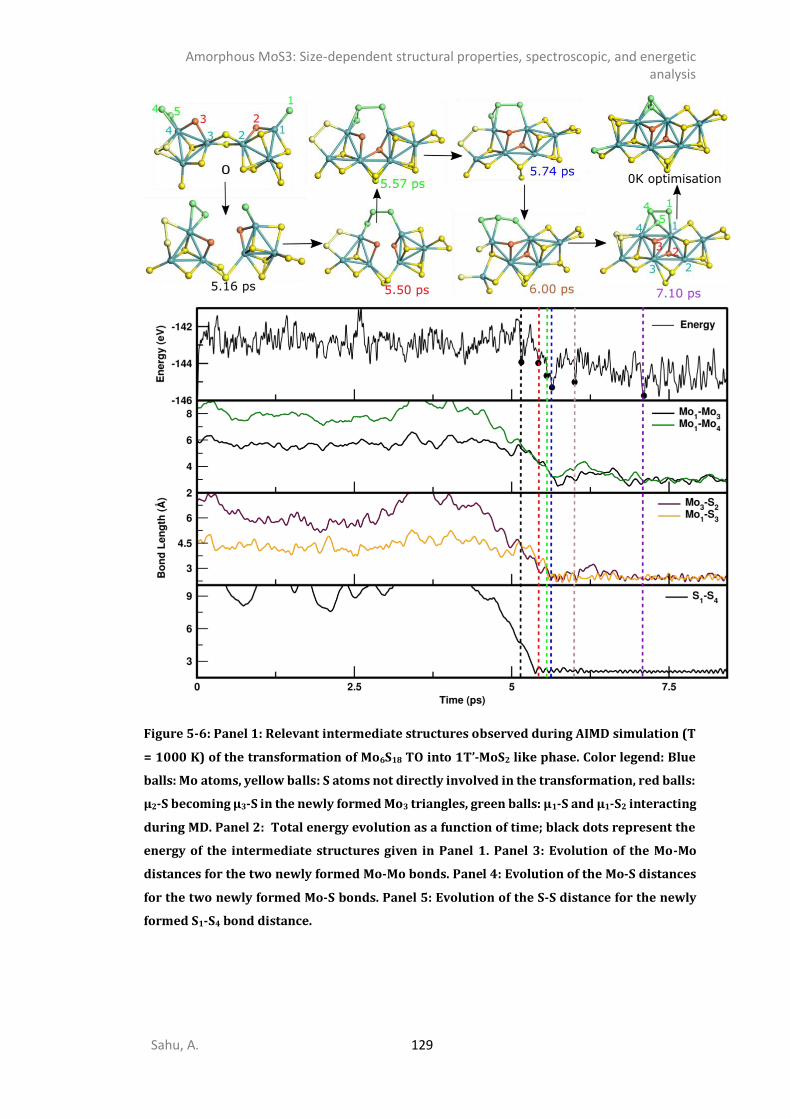
Amorphous MoS3: Size-dependent structural properties, spectroscopic, and energetic analysis
Sahu, A. 129
Figure 5-6: Panel 1: Relevant intermediate structures observed during AIMD simulation (T
= 1000 K) of the transformation of Mo6S18 TO into 1T’-MoS2 like phase. Color legend: Blue
balls: Mo atoms, yellow balls: S atoms not directly involved in the transformation, red balls:
µ2-S becoming µ3-S in the newly formed Mo3 triangles, green balls: µ1-S and µ1-S2 interacting
during MD. Panel 2: Total energy evolution as a function of time; black dots represent the
energy of the intermediate structures given in Panel 1. Panel 3: Evolution of the Mo-Mo
distances for the two newly formed Mo-Mo bonds. Panel 4: Evolution of the Mo-S distances
for the two newly formed Mo-S bonds. Panel 5: Evolution of the S-S distance for the newly
formed S1-S4 bond distance.
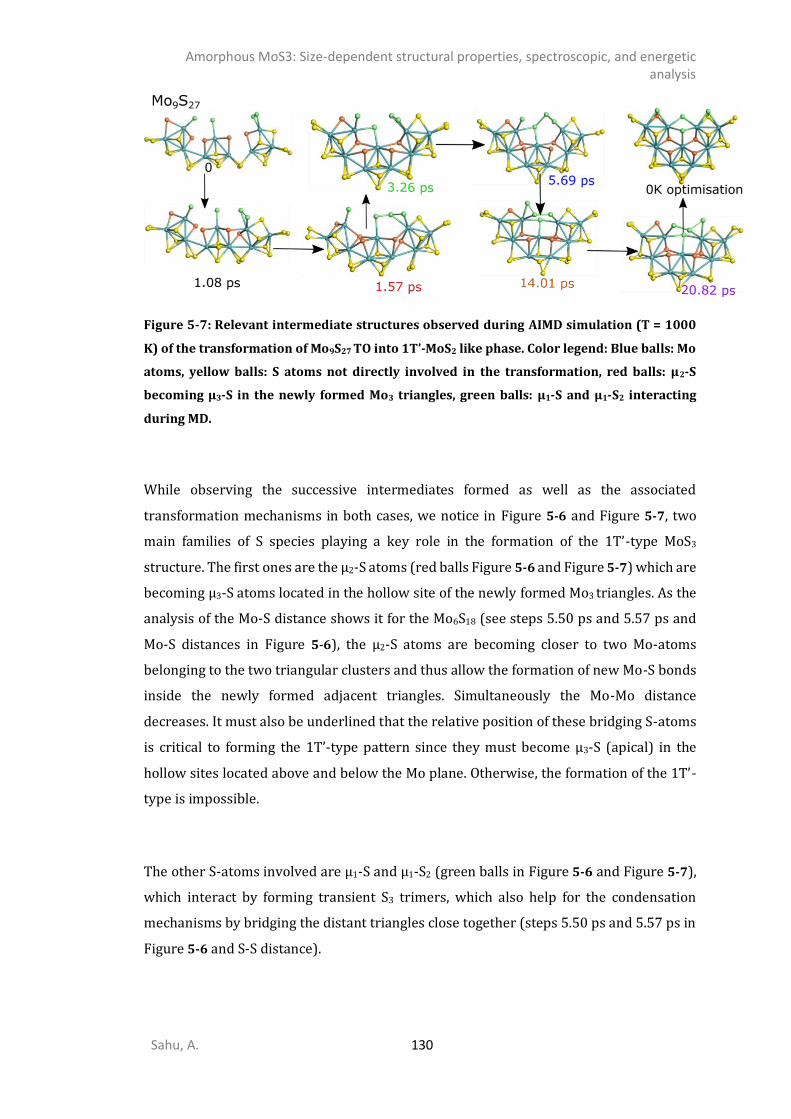
Amorphous MoS3: Size-dependent structural properties, spectroscopic, and energetic analysis
Sahu, A. 130
Figure 5-7: Relevant intermediate structures observed during AIMD simulation (T = 1000
K) of the transformation of Mo9S27 TO into 1T’-MoS2 like phase. Color legend: Blue balls: Mo
atoms, yellow balls: S atoms not directly involved in the transformation, red balls: µ2-S
becoming µ3-S in the newly formed Mo3 triangles, green balls: µ1-S and µ1-S2 interacting
during MD.
While observing the successive intermediates formed as well as the associated
transformation mechanisms in both cases, we notice in Figure 5-6 and Figure 5-7, two
main families of S species playing a key role in the formation of the 1T’-type MoS3
structure. The first ones are the µ2-S atoms (red balls Figure 5-6 and Figure 5-7) which are
becoming µ3-S atoms located in the hollow site of the newly formed Mo3 triangles. As the
analysis of the Mo-S distance shows it for the Mo6S18 (see steps 5.50 ps and 5.57 ps and
Mo-S distances in Figure 5-6), the µ2-S atoms are becoming closer to two Mo-atoms
belonging to the two triangular clusters and thus allow the formation of new Mo-S bonds
inside the newly formed adjacent triangles. Simultaneously the Mo-Mo distance
decreases. It must also be underlined that the relative position of these bridging S-atoms
is critical to forming the 1T’-type pattern since they must become µ3-S (apical) in the
hollow sites located above and below the Mo plane. Otherwise, the formation of the 1T’-
type is impossible.
The other S-atoms involved are µ1-S and µ1-S2 (green balls in Figure 5-6 and Figure 5-7),
which interact by forming transient S3 trimers, which also help for the condensation
mechanisms by bridging the distant triangles close together (steps 5.50 ps and 5.57 ps in
Figure 5-6 and S-S distance).
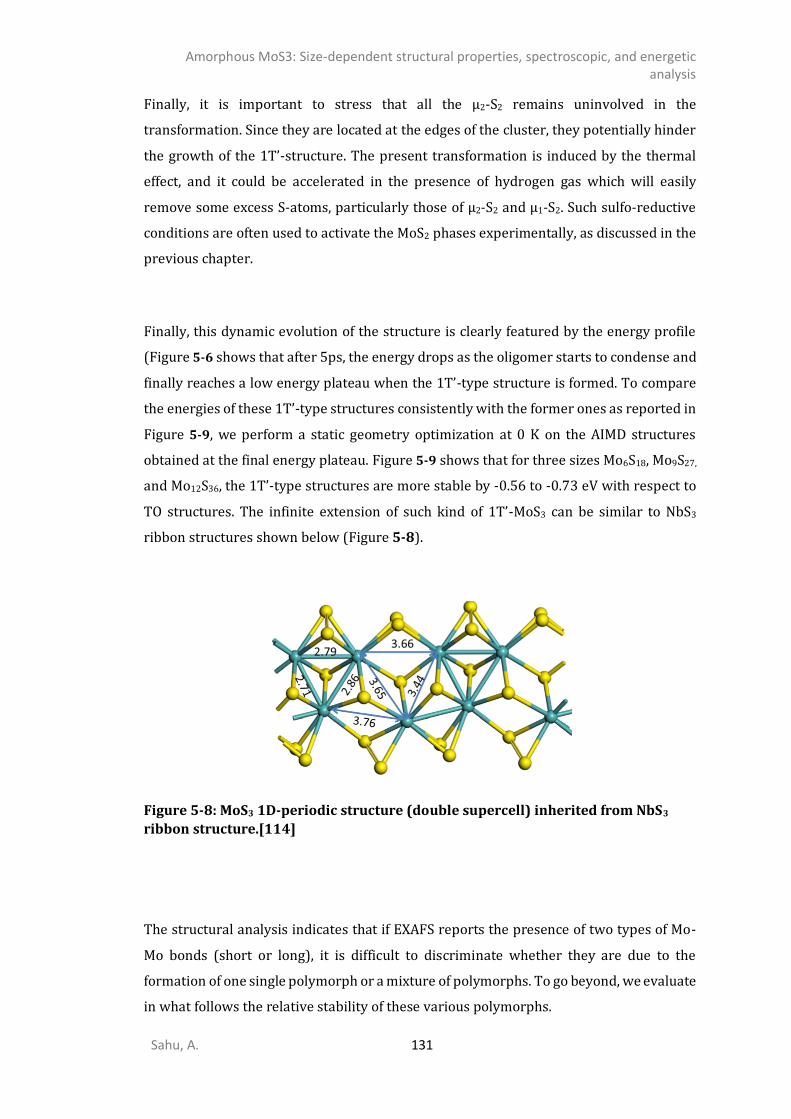
Amorphous MoS3: Size-dependent structural properties, spectroscopic, and energetic analysis
Sahu, A. 131
Finally, it is important to stress that all the µ2-S2 remains uninvolved in the
transformation. Since they are located at the edges of the cluster, they potentially hinder
the growth of the 1T’-structure. The present transformation is induced by the thermal
effect, and it could be accelerated in the presence of hydrogen gas which will easily
remove some excess S-atoms, particularly those of µ2-S2 and µ1-S2. Such sulfo-reductive
conditions are often used to activate the MoS2 phases experimentally, as discussed in the
previous chapter.
Finally, this dynamic evolution of the structure is clearly featured by the energy profile
(Figure 5-6 shows that after 5ps, the energy drops as the oligomer starts to condense and
finally reaches a low energy plateau when the 1T’-type structure is formed. To compare
the energies of these 1T’-type structures consistently with the former ones as reported in
Figure 5-9, we perform a static geometry optimization at 0 K on the AIMD structures
obtained at the final energy plateau. Figure 5-9 shows that for three sizes Mo6S18, Mo9S27,
and Mo12S36, the 1T’-type structures are more stable by -0.56 to -0.73 eV with respect to
TO structures. The infinite extension of such kind of 1T’-MoS3 can be similar to NbS3
ribbon structures shown below (Figure 5-8).
Figure 5-8: MoS3 1D-periodic structure (double supercell) inherited from NbS3
ribbon structure.[114]
The structural analysis indicates that if EXAFS reports the presence of two types of Mo-
Mo bonds (short or long), it is difficult to discriminate whether they are due to the
formation of one single polymorph or a mixture of polymorphs. To go beyond, we evaluate
in what follows the relative stability of these various polymorphs.
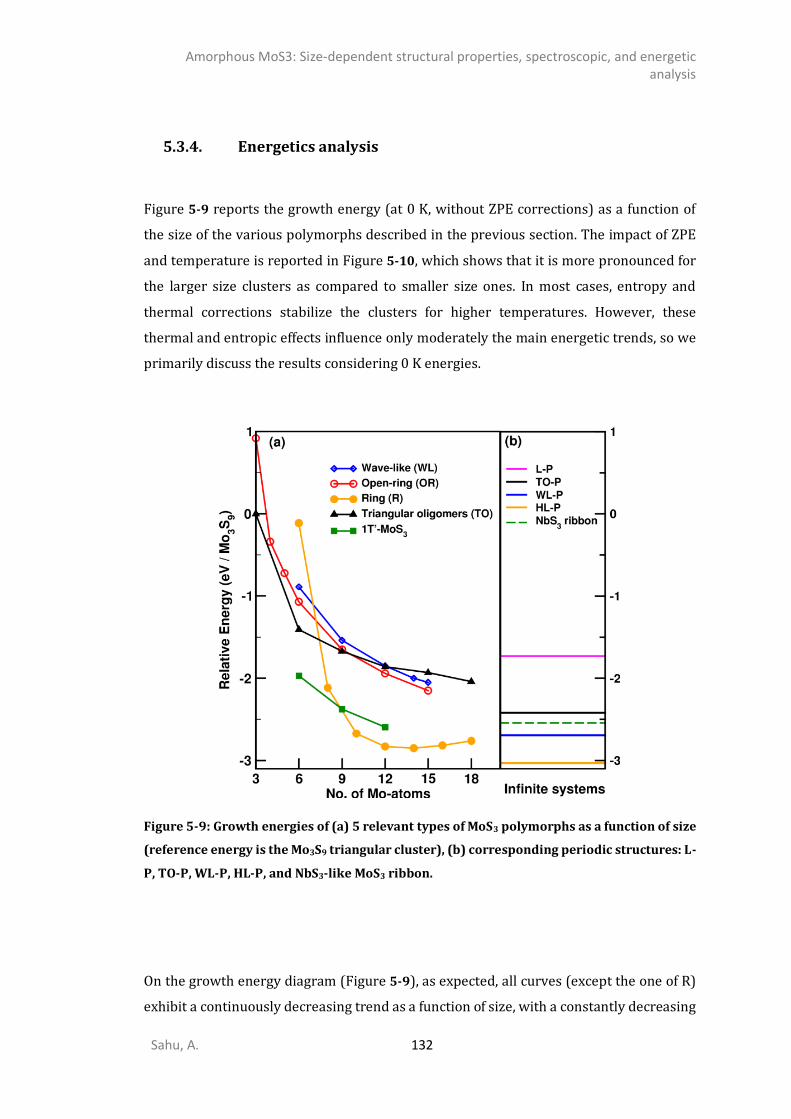
Amorphous MoS3: Size-dependent structural properties, spectroscopic, and energetic analysis
Sahu, A. 132
5.3.4. Energetics analysis
Figure 5-9 reports the growth energy (at 0 K, without ZPE corrections) as a function of
the size of the various polymorphs described in the previous section. The impact of ZPE
and temperature is reported in Figure 5-10, which shows that it is more pronounced for
the larger size clusters as compared to smaller size ones. In most cases, entropy and
thermal corrections stabilize the clusters for higher temperatures. However, these
thermal and entropic effects influence only moderately the main energetic trends, so we
primarily discuss the results considering 0 K energies.
Figure 5-9: Growth energies of (a) 5 relevant types of MoS3 polymorphs as a function of size
(reference energy is the Mo3S9 triangular cluster), (b) corresponding periodic structures: L-
P, TO-P, WL-P, HL-P, and NbS3-like MoS3 ribbon.
On the growth energy diagram (Figure 5-9), as expected, all curves (except the one of R)
exhibit a continuously decreasing trend as a function of size, with a constantly decreasing
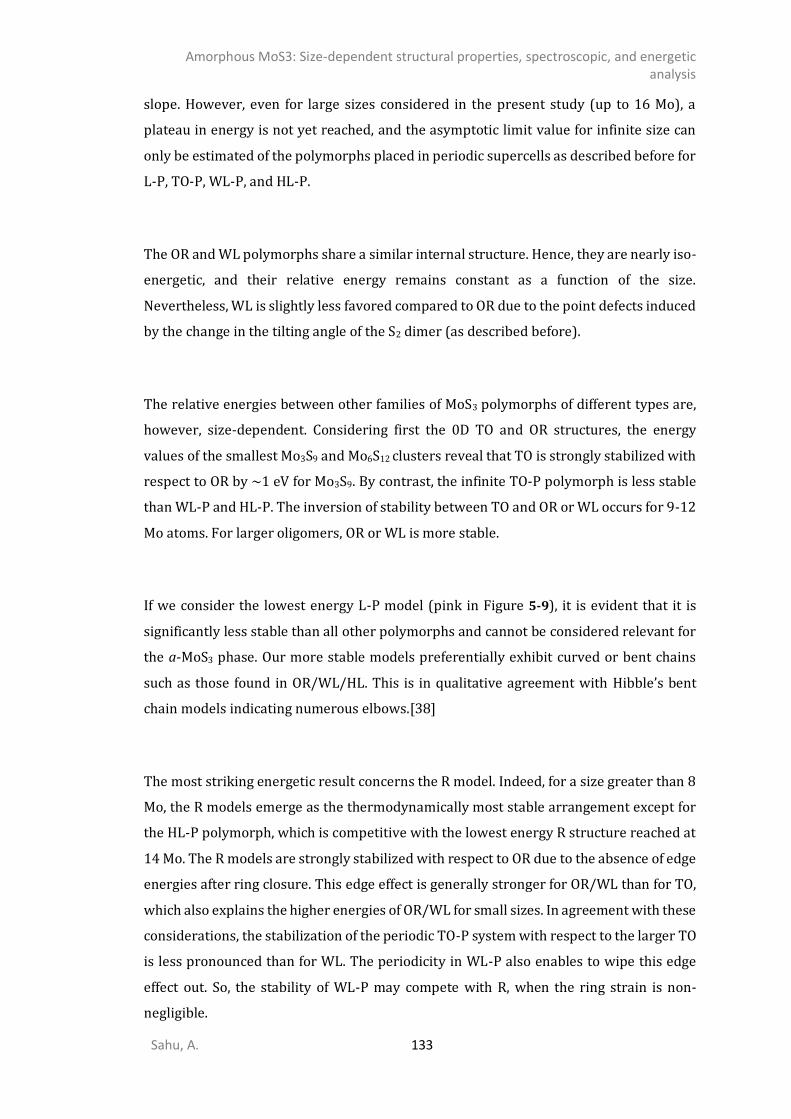
Amorphous MoS3: Size-dependent structural properties, spectroscopic, and energetic analysis
Sahu, A. 133
slope. However, even for large sizes considered in the present study (up to 16 Mo), a
plateau in energy is not yet reached, and the asymptotic limit value for infinite size can
only be estimated of the polymorphs placed in periodic supercells as described before for
L-P, TO-P, WL-P, and HL-P.
The OR and WL polymorphs share a similar internal structure. Hence, they are nearly iso-
energetic, and their relative energy remains constant as a function of the size.
Nevertheless, WL is slightly less favored compared to OR due to the point defects induced
by the change in the tilting angle of the S2 dimer (as described before).
The relative energies between other families of MoS3 polymorphs of different types are,
however, size-dependent. Considering first the 0D TO and OR structures, the energy
values of the smallest Mo3S9 and Mo6S12 clusters reveal that TO is strongly stabilized with
respect to OR by ~1 eV for Mo3S9. By contrast, the infinite TO-P polymorph is less stable
than WL-P and HL-P. The inversion of stability between TO and OR or WL occurs for 9-12
Mo atoms. For larger oligomers, OR or WL is more stable.
If we consider the lowest energy L-P model (pink in Figure 5-9), it is evident that it is
significantly less stable than all other polymorphs and cannot be considered relevant for
the a-MoS3 phase. Our more stable models preferentially exhibit curved or bent chains
such as those found in OR/WL/HL. This is in qualitative agreement with Hibble’s bent
chain models indicating numerous elbows.[38]
The most striking energetic result concerns the R model. Indeed, for a size greater than 8
Mo, the R models emerge as the thermodynamically most stable arrangement except for
the HL-P polymorph, which is competitive with the lowest energy R structure reached at
14 Mo. The R models are strongly stabilized with respect to OR due to the absence of edge
energies after ring closure. This edge effect is generally stronger for OR/WL than for TO,
which also explains the higher energies of OR/WL for small sizes. In agreement with these
considerations, the stabilization of the periodic TO-P system with respect to the larger TO
is less pronounced than for WL. The periodicity in WL-P also enables to wipe this edge
effect out. So, the stability of WL-P may compete with R, when the ring strain is non-
negligible.
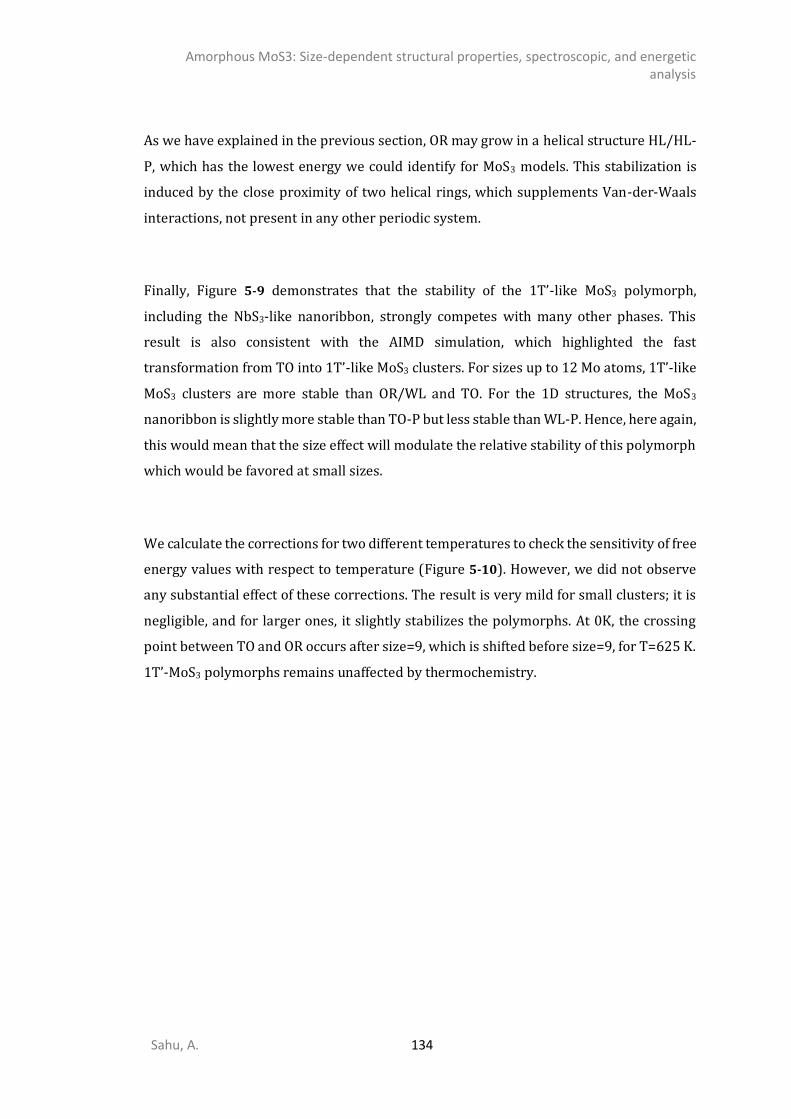
Amorphous MoS3: Size-dependent structural properties, spectroscopic, and energetic analysis
Sahu, A. 134
As we have explained in the previous section, OR may grow in a helical structure HL/HL-
P, which has the lowest energy we could identify for MoS3 models. This stabilization is
induced by the close proximity of two helical rings, which supplements Van-der-Waals
interactions, not present in any other periodic system.
Finally, Figure 5-9 demonstrates that the stability of the 1T’-like MoS3 polymorph,
including the NbS3-like nanoribbon, strongly competes with many other phases. This
result is also consistent with the AIMD simulation, which highlighted the fast
transformation from TO into 1T’-like MoS3 clusters. For sizes up to 12 Mo atoms, 1T’-like
MoS3 clusters are more stable than OR/WL and TO. For the 1D structures, the MoS3
nanoribbon is slightly more stable than TO-P but less stable than WL-P. Hence, here again,
this would mean that the size effect will modulate the relative stability of this polymorph
which would be favored at small sizes.
We calculate the corrections for two different temperatures to check the sensitivity of free
energy values with respect to temperature (Figure 5-10). However, we did not observe
any substantial effect of these corrections. The result is very mild for small clusters; it is
negligible, and for larger ones, it slightly stabilizes the polymorphs. At 0K, the crossing
point between TO and OR occurs after size=9, which is shifted before size=9, for T=625 K.
1T’-MoS3 polymorphs remains unaffected by thermochemistry.
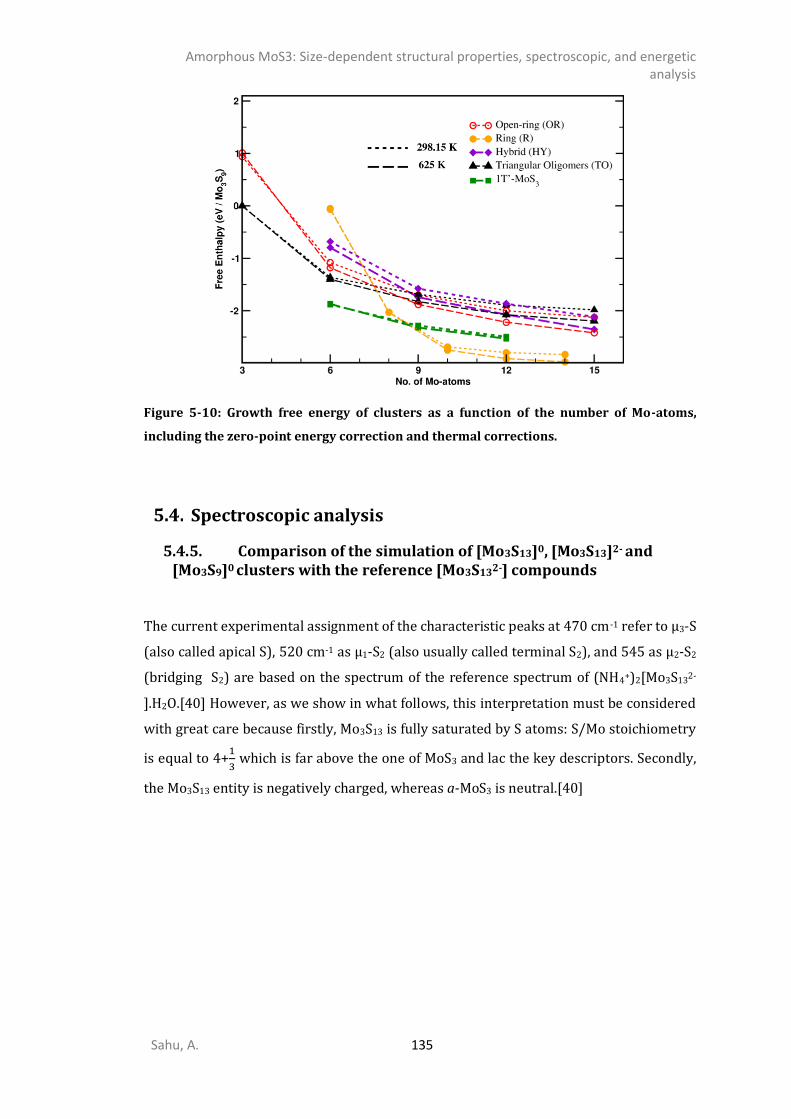
Amorphous MoS3: Size-dependent structural properties, spectroscopic, and energetic analysis
Sahu, A. 135
Figure 5-10: Growth free energy of clusters as a function of the number of Mo-atoms,
including the zero-point energy correction and thermal corrections.
Spectroscopic analysis
5.4.5. Comparison of the simulation of [Mo3S13]0, [Mo3S13]2- and [Mo3S9]0 clusters with the reference [Mo3S132-] compounds
The current experimental assignment of the characteristic peaks at 470 cm-1 refer to µ3-S
(also called apical S), 520 cm-1 as µ1-S2 (also usually called terminal S2), and 545 as µ2-S2
(bridging S2) are based on the spectrum of the reference spectrum of (NH4+)2[Mo3S13
2-
].H2O.[40] However, as we show in what follows, this interpretation must be considered
with great care because firstly, Mo3S13 is fully saturated by S atoms: S/Mo stoichiometry
is equal to 4+1
3 which is far above the one of MoS3 and lac the key descriptors. Secondly,
the Mo3S13 entity is negatively charged, whereas a-MoS3 is neutral.[40]
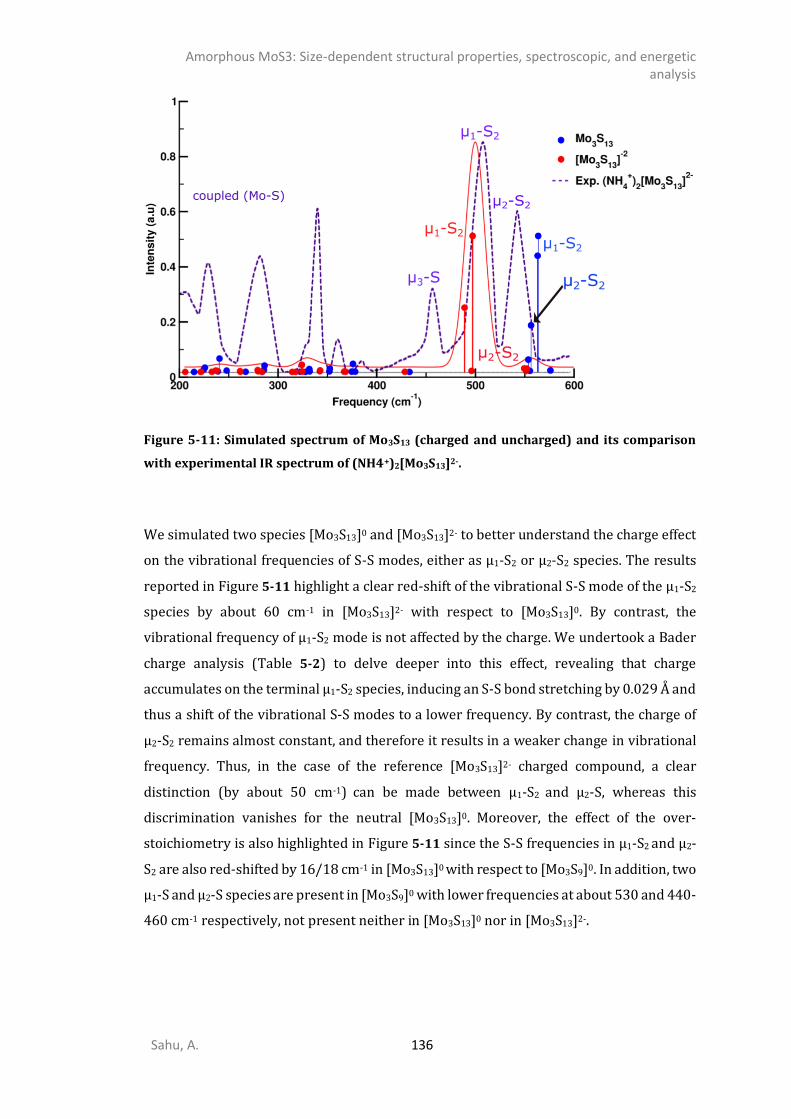
Amorphous MoS3: Size-dependent structural properties, spectroscopic, and energetic analysis
Sahu, A. 136
Figure 5-11: Simulated spectrum of Mo3S13 (charged and uncharged) and its comparison
with experimental IR spectrum of (NH4+)2[Mo3S13]2-.
We simulated two species [Mo3S13]0 and [Mo3S13]2- to better understand the charge effect
on the vibrational frequencies of S-S modes, either as µ1-S2 or µ2-S2 species. The results
reported in Figure 5-11 highlight a clear red-shift of the vibrational S-S mode of the µ1-S2
species by about 60 cm-1 in [Mo3S13]2- with respect to [Mo3S13]0. By contrast, the
vibrational frequency of µ1-S2 mode is not affected by the charge. We undertook a Bader
charge analysis (Table 5-2) to delve deeper into this effect, revealing that charge
accumulates on the terminal µ1-S2 species, inducing an S-S bond stretching by 0.029 Å and
thus a shift of the vibrational S-S modes to a lower frequency. By contrast, the charge of
µ2-S2 remains almost constant, and therefore it results in a weaker change in vibrational
frequency. Thus, in the case of the reference [Mo3S13]2- charged compound, a clear
distinction (by about 50 cm-1) can be made between µ1-S2 and µ2-S, whereas this
discrimination vanishes for the neutral [Mo3S13]0. Moreover, the effect of the over-
stoichiometry is also highlighted in Figure 5-11 since the S-S frequencies in µ1-S2 and µ2-
S2 are also red-shifted by 16/18 cm-1 in [Mo3S13]0 with respect to [Mo3S9]0. In addition, two
µ1-S and µ2-S species are present in [Mo3S9]0 with lower frequencies at about 530 and 440-
460 cm-1 respectively, not present neither in [Mo3S13]0 nor in [Mo3S13]2-.

Amorphous MoS3: Size-dependent structural properties, spectroscopic, and energetic analysis
Sahu, A. 137
Table 5-2: Bond lengths, Bader charges, and vibrational frequency of S2 and S species
present in [Mo3S13]0, [Mo3S13]-2 and [Mo3S9]0
S-S bond (Å) charge on S2 Vib. Freq. (cm-1)
Exp. µ1-S2 - - 505
µ2-S2 - - 545
[Mo3S13]0 µ1-S2 1.999 6.29 560
µ2-S2 2.028 6.41 555
µ3-S - - 436
[Mo3S13]2- µ1-S2 2.028 6.54 500
µ2-S2
µ3-S
2.032
-
6.49
-
550
431
[Mo3S9]0 µ1-S2 2.053 6.64 542
µ2-S2 2.057 6.37 539
µ1-S - - 532, 527
µ2-S - - 443, 466
µ3-S - - 422
As a consequence, the IR assignment of MoS3 exclusively based on the (NH4+)2[Mo3S132-]
reference could be seriously misleading. In particular, the usual empirical assignment of
the characteristic peaks at 520 cm-1 for µ1-S2 and 545 cm-1 for µ2-S2 is not confirmed. From
this, we can thus indicate that the µ1-S2 or µ2-S2 would be challenging to differentiate,
while other species such as µ1-S or µ2-S have never been invoked for the IR assignment,
whereas they exist in [Mo3S13]0 as well as in larger TO identified.
5.4.6. IR spectrum of TO polymorphs
As discussed in the previous section, the empirical IR assignment of MoS3 based on
(NH4+)2[Mo3S13]2- reference compound[40] must be questioned due to the effects of the
2e- charge and S/Mo over-stoichiometry involved in this reference compound. Weber et
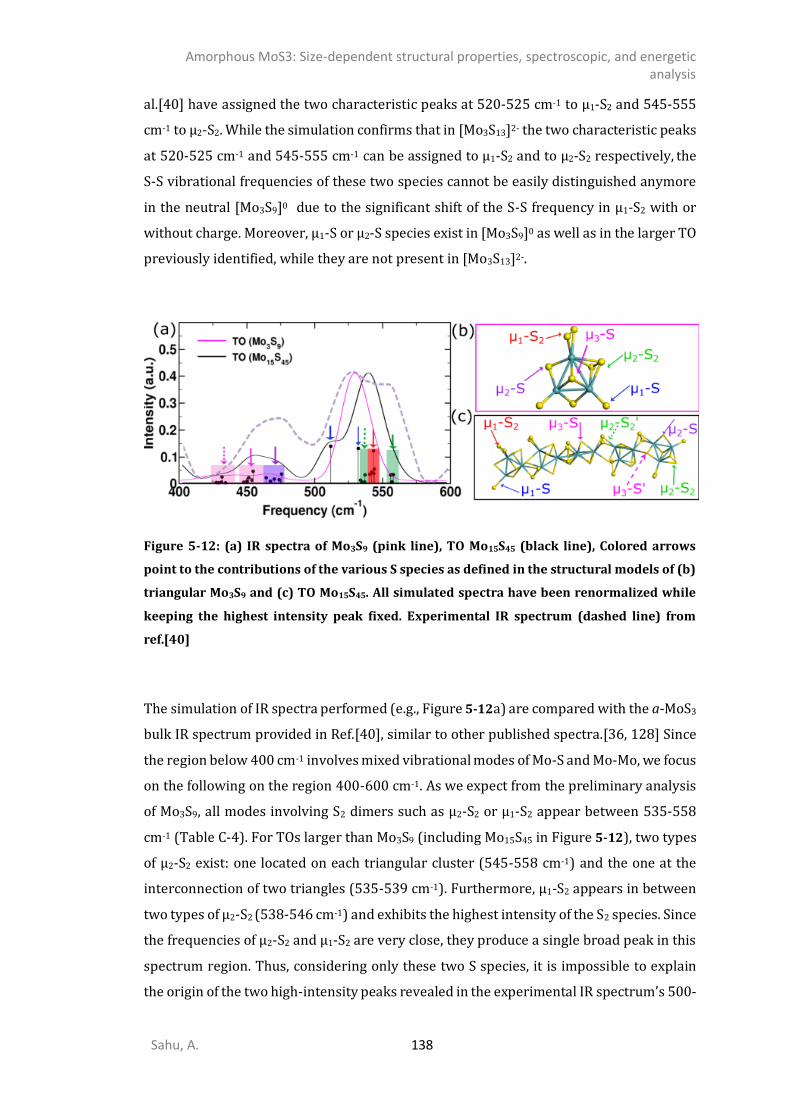
Amorphous MoS3: Size-dependent structural properties, spectroscopic, and energetic analysis
Sahu, A. 138
al.[40] have assigned the two characteristic peaks at 520-525 cm-1 to µ1-S2 and 545-555
cm-1 to µ2-S2. While the simulation confirms that in [Mo3S13]2- the two characteristic peaks
at 520-525 cm-1 and 545-555 cm-1 can be assigned to µ1-S2 and to µ2-S2 respectively, the
S-S vibrational frequencies of these two species cannot be easily distinguished anymore
in the neutral [Mo3S9]0 due to the significant shift of the S-S frequency in µ1-S2 with or
without charge. Moreover, µ1-S or µ2-S species exist in [Mo3S9]0 as well as in the larger TO
previously identified, while they are not present in [Mo3S13]2-.
Figure 5-12: (a) IR spectra of Mo3S9 (pink line), TO Mo15S45 (black line), Colored arrows
point to the contributions of the various S species as defined in the structural models of (b)
triangular Mo3S9 and (c) TO Mo15S45. All simulated spectra have been renormalized while
keeping the highest intensity peak fixed. Experimental IR spectrum (dashed line) from
ref.[40]
The simulation of IR spectra performed (e.g., Figure 5-12a) are compared with the a-MoS3
bulk IR spectrum provided in Ref.[40], similar to other published spectra.[36, 128] Since
the region below 400 cm-1 involves mixed vibrational modes of Mo-S and Mo-Mo, we focus
on the following on the region 400-600 cm-1. As we expect from the preliminary analysis
of Mo3S9, all modes involving S2 dimers such as µ2-S2 or µ1-S2 appear between 535-558
cm-1 (Table C-4). For TOs larger than Mo3S9 (including Mo15S45 in Figure 5-12), two types
of µ2-S2 exist: one located on each triangular cluster (545-558 cm-1) and the one at the
interconnection of two triangles (535-539 cm-1). Furthermore, µ1-S2 appears in between
two types of µ2-S2 (538-546 cm-1) and exhibits the highest intensity of the S2 species. Since
the frequencies of µ2-S2 and µ1-S2 are very close, they produce a single broad peak in this
spectrum region. Thus, considering only these two S species, it is impossible to explain
the origin of the two high-intensity peaks revealed in the experimental IR spectrum’s 500-
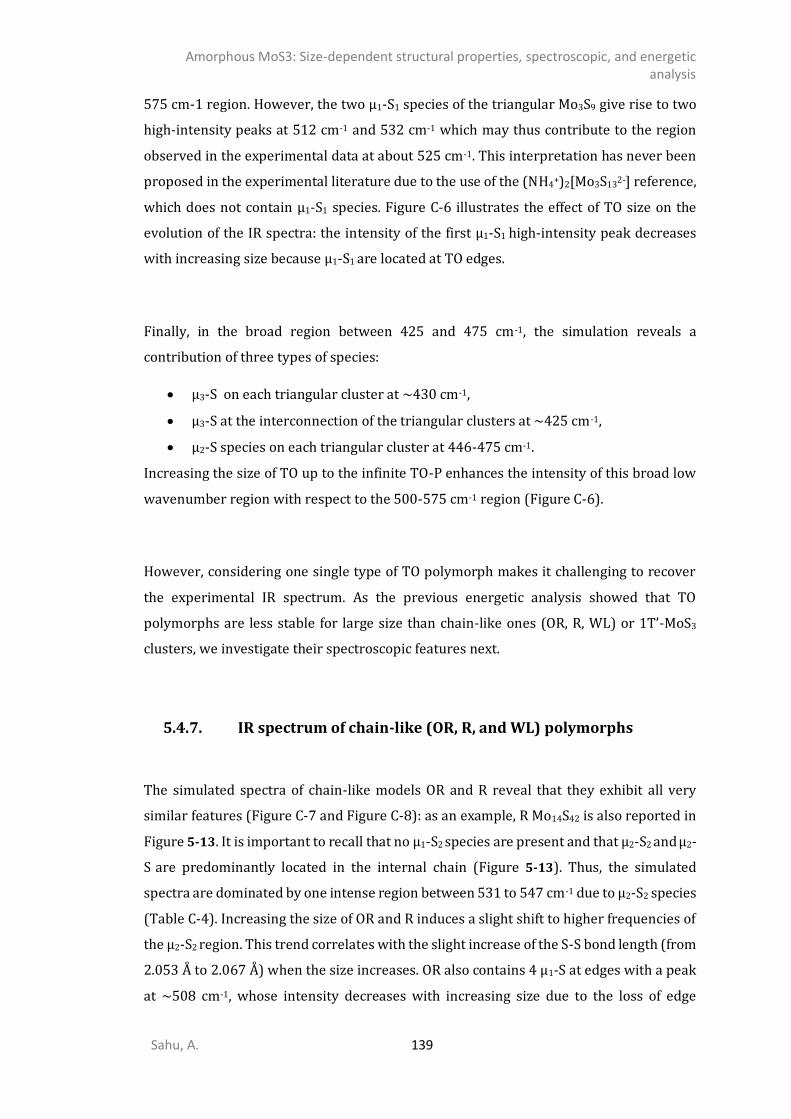
Amorphous MoS3: Size-dependent structural properties, spectroscopic, and energetic analysis
Sahu, A. 139
575 cm-1 region. However, the two µ1-S1 species of the triangular Mo3S9 give rise to two
high-intensity peaks at 512 cm-1 and 532 cm-1 which may thus contribute to the region
observed in the experimental data at about 525 cm-1. This interpretation has never been
proposed in the experimental literature due to the use of the (NH4+)2[Mo3S132-] reference,
which does not contain µ1-S1 species. Figure C-6 illustrates the effect of TO size on the
evolution of the IR spectra: the intensity of the first µ1-S1 high-intensity peak decreases
with increasing size because µ1-S1 are located at TO edges.
Finally, in the broad region between 425 and 475 cm-1, the simulation reveals a
contribution of three types of species:
• µ3-S on each triangular cluster at ~430 cm-1,
• µ3-S at the interconnection of the triangular clusters at ~425 cm-1,
• µ2-S species on each triangular cluster at 446-475 cm-1.
Increasing the size of TO up to the infinite TO-P enhances the intensity of this broad low
wavenumber region with respect to the 500-575 cm-1 region (Figure C-6).
However, considering one single type of TO polymorph makes it challenging to recover
the experimental IR spectrum. As the previous energetic analysis showed that TO
polymorphs are less stable for large size than chain-like ones (OR, R, WL) or 1T’-MoS3
clusters, we investigate their spectroscopic features next.
5.4.7. IR spectrum of chain-like (OR, R, and WL) polymorphs
The simulated spectra of chain-like models OR and R reveal that they exhibit all very
similar features (Figure C-7 and Figure C-8): as an example, R Mo14S42 is also reported in
Figure 5-13. It is important to recall that no µ1-S2 species are present and that µ2-S2 and µ2-
S are predominantly located in the internal chain (Figure 5-13). Thus, the simulated
spectra are dominated by one intense region between 531 to 547 cm-1 due to µ2-S2 species
(Table C-4). Increasing the size of OR and R induces a slight shift to higher frequencies of
the µ2-S2 region. This trend correlates with the slight increase of the S-S bond length (from
2.053 Å to 2.067 Å) when the size increases. OR also contains 4 µ1-S at edges with a peak
at ~508 cm-1, whose intensity decreases with increasing size due to the loss of edge
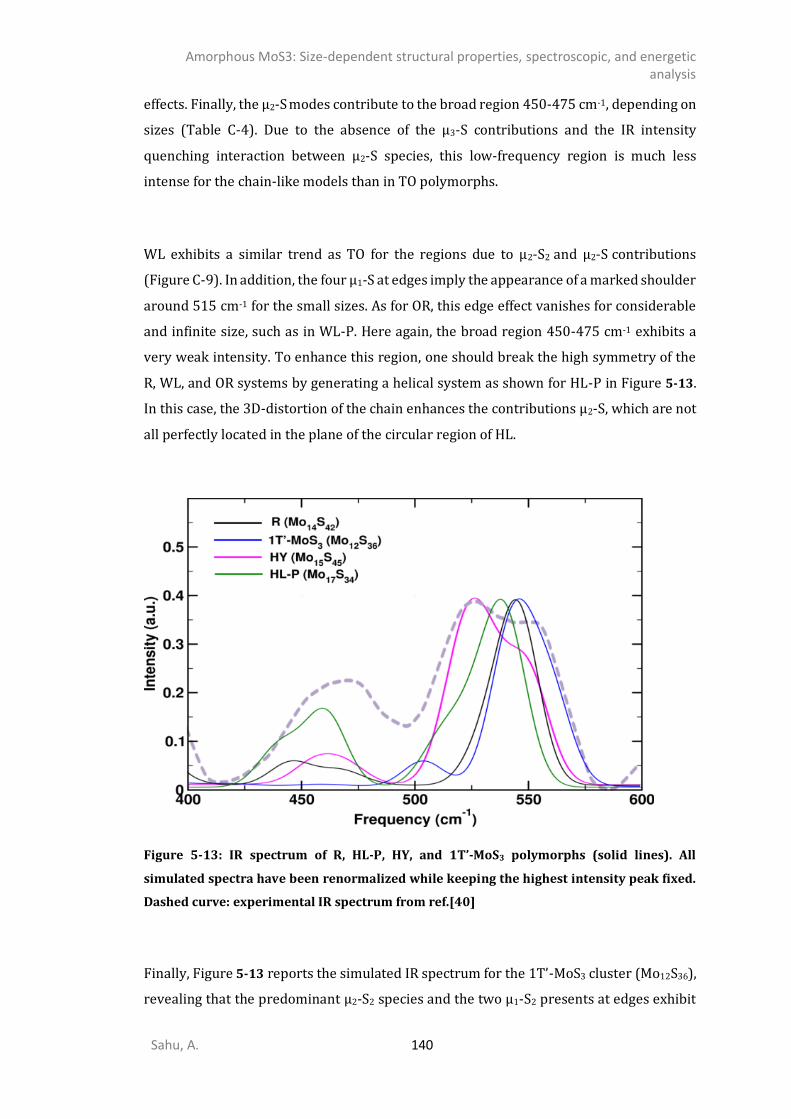
Amorphous MoS3: Size-dependent structural properties, spectroscopic, and energetic analysis
Sahu, A. 140
effects. Finally, the µ2-S modes contribute to the broad region 450-475 cm-1, depending on
sizes (Table C-4). Due to the absence of the µ3-S contributions and the IR intensity
quenching interaction between µ2-S species, this low-frequency region is much less
intense for the chain-like models than in TO polymorphs.
WL exhibits a similar trend as TO for the regions due to µ2-S2 and µ2-S contributions
(Figure C-9). In addition, the four µ1-S at edges imply the appearance of a marked shoulder
around 515 cm-1 for the small sizes. As for OR, this edge effect vanishes for considerable
and infinite size, such as in WL-P. Here again, the broad region 450-475 cm-1 exhibits a
very weak intensity. To enhance this region, one should break the high symmetry of the
R, WL, and OR systems by generating a helical system as shown for HL-P in Figure 5-13.
In this case, the 3D-distortion of the chain enhances the contributions µ2-S, which are not
all perfectly located in the plane of the circular region of HL.
Figure 5-13: IR spectrum of R, HL-P, HY, and 1T’-MoS3 polymorphs (solid lines). All
simulated spectra have been renormalized while keeping the highest intensity peak fixed.
Dashed curve: experimental IR spectrum from ref.[40]
Finally, Figure 5-13 reports the simulated IR spectrum for the 1T’-MoS3 cluster (Mo12S36),
revealing that the predominant µ2-S2 species and the two µ1-S2 presents at edges exhibit

Amorphous MoS3: Size-dependent structural properties, spectroscopic, and energetic analysis
Sahu, A. 141
a slightly broad region at about 550 cm-1, which matches well the high-frequency region
of the experimental spectrum.
Discussion
Our revisited assignment of the IR spectrum of MoS3 reveals that the higher region at 545-
555 cm-1 is assigned to both µ1-S2 and µ2-S2 when they exist as in TO polymorphs (with at
least 6 Mo), or to µ2-S2 only as in chain-like models (R, OR, WL, HL), or to edges of 1T’-
MoS3. The IR region at 520-525 cm-1 is reproduced only if µ1-S species are present either
at the edges of the chain-like and TO models or on the triangular Mo3S9.
Moreover, the energetic analysis showed that TO models are thermodynamically stable
only for the smallest size as Mo3S9, whereas for larger sizes, the chain-like (OR, R, WL, HL)
or the 1T’-MoS3 cluster become more stable. Hence, the MoS3 phase is actually constituted
of various polymorphs as a function of the size of the oligomers. This is reflected in the IR
spectrum resulting from the contribution of these multiple polymorphs. At this stage, we
can propose the two following possible combinations of polymorphs:
• Triangular Mo3S9 (contributing to the region 520-525 cm-1) and 1T’-MoS3 cluster
such as Mo12S36 or even NbS3-ribbon for larger size (contributing to the region 545-
555 cm-1)
• Triangular Mo3S9 (contributing to the region 520-525 cm-1) and larger chain-like
models such as OR, R, WL, or HL (contributing to the region 545-555 cm-1 and to the
region 520-525 cm-1 when µ1-S species are present at edges).
To further investigate the combination of Triangular Mo3S9 with chain-like models, we
simulated a Hybrid (HY) structure combining both one OR structure with two triangular
Mo3S9 clusters located at its edges (Figure 5-1d). As expected, this composite structure
recovers the two high-frequency regions (Figure 5-13) of the experimental spectrum. The
µ1-S species of the triangular Mo3S9 give rise to a broad region at 520 cm-1 (Figure C-10).
In addition, one µ1-S2 of the triangular Mo3S9 and µ2-S2 of the triangles and of the OR chain
gives rise to the upper part of the experimental spectrum (533-552 cm-1). With increasing
size, this upper region gains relative intensity due to more numerous µ2-S2 contributions
with respect to µ1-S. Similarly, the lowest broad region between 450 and 500 cm-1 is also
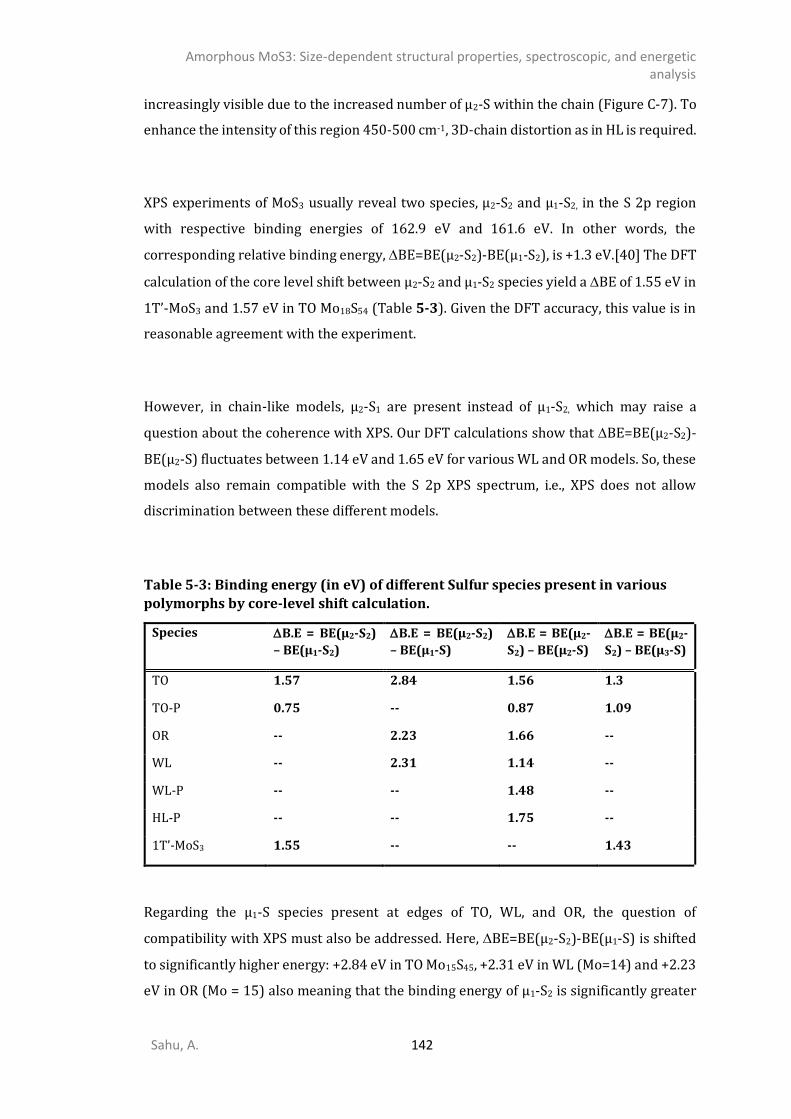
Amorphous MoS3: Size-dependent structural properties, spectroscopic, and energetic analysis
Sahu, A. 142
increasingly visible due to the increased number of µ2-S within the chain (Figure C-7). To
enhance the intensity of this region 450-500 cm-1, 3D-chain distortion as in HL is required.
XPS experiments of MoS3 usually reveal two species, µ2-S2 and µ1-S2, in the S 2p region
with respective binding energies of 162.9 eV and 161.6 eV. In other words, the
corresponding relative binding energy, BE=BE(µ2-S2)-BE(µ1-S2), is +1.3 eV.[40] The DFT
calculation of the core level shift between µ2-S2 and µ1-S2 species yield a BE of 1.55 eV in
1T’-MoS3 and 1.57 eV in TO Mo18S54 (Table 5-3). Given the DFT accuracy, this value is in
reasonable agreement with the experiment.
However, in chain-like models, µ2-S1 are present instead of µ1-S2, which may raise a
question about the coherence with XPS. Our DFT calculations show that BE=BE(µ2-S2)-
BE(µ2-S) fluctuates between 1.14 eV and 1.65 eV for various WL and OR models. So, these
models also remain compatible with the S 2p XPS spectrum, i.e., XPS does not allow
discrimination between these different models.
Table 5-3: Binding energy (in eV) of different Sulfur species present in various
polymorphs by core-level shift calculation.
Species B.E = BE(µ2-S2)
– BE(µ1-S2)
B.E = BE(µ2-S2)
– BE(µ1-S)
B.E = BE(µ2-
S2) – BE(µ2-S)
B.E = BE(µ2-
S2) – BE(µ3-S)
TO 1.57 2.84 1.56 1.3
TO-P 0.75 -- 0.87 1.09
OR -- 2.23 1.66 --
WL -- 2.31 1.14 --
WL-P -- -- 1.48 --
HL-P -- -- 1.75 --
1T’-MoS3 1.55 -- -- 1.43
Regarding the µ1-S species present at edges of TO, WL, and OR, the question of
compatibility with XPS must also be addressed. Here, BE=BE(µ2-S2)-BE(µ1-S) is shifted
to significantly higher energy: +2.84 eV in TO Mo15S45, +2.31 eV in WL (Mo=14) and +2.23
eV in OR (Mo = 15) also meaning that the binding energy of µ1-S2 is significantly greater
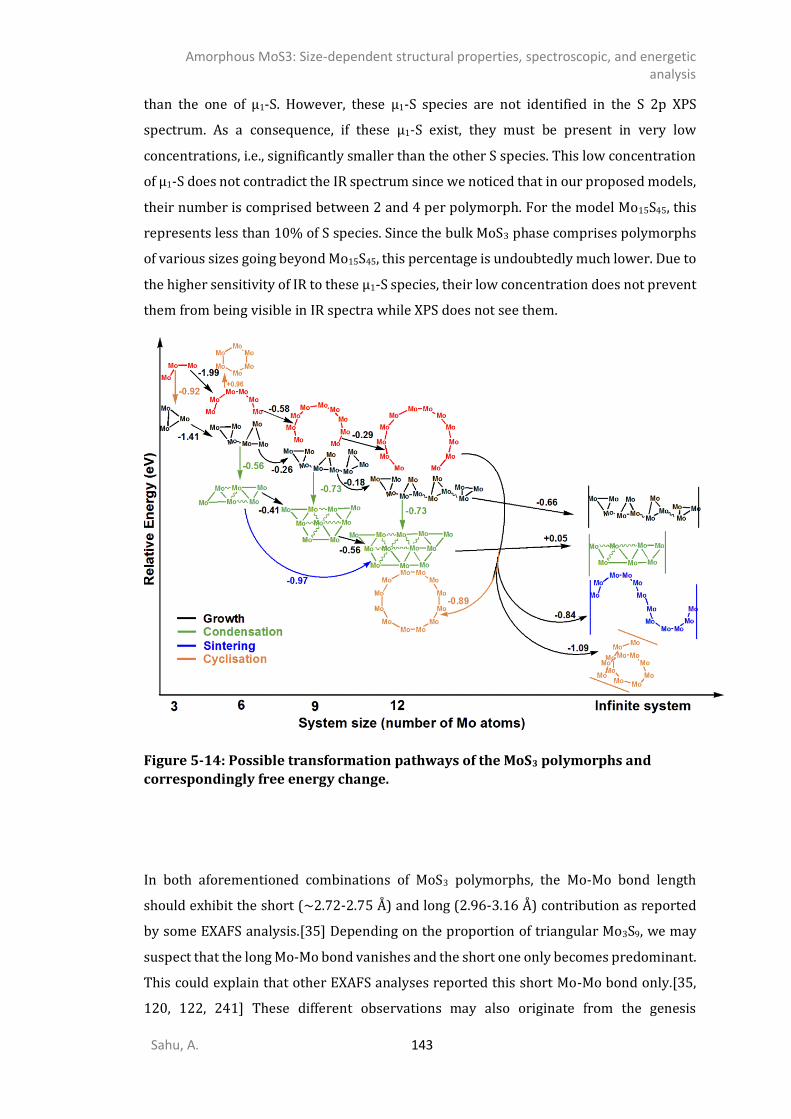
Amorphous MoS3: Size-dependent structural properties, spectroscopic, and energetic analysis
Sahu, A. 143
than the one of µ1-S. However, these µ1-S species are not identified in the S 2p XPS
spectrum. As a consequence, if these µ1-S exist, they must be present in very low
concentrations, i.e., significantly smaller than the other S species. This low concentration
of µ1-S does not contradict the IR spectrum since we noticed that in our proposed models,
their number is comprised between 2 and 4 per polymorph. For the model Mo15S45, this
represents less than 10% of S species. Since the bulk MoS3 phase comprises polymorphs
of various sizes going beyond Mo15S45, this percentage is undoubtedly much lower. Due to
the higher sensitivity of IR to these µ1-S species, their low concentration does not prevent
them from being visible in IR spectra while XPS does not see them.
Figure 5-14: Possible transformation pathways of the MoS3 polymorphs and
correspondingly free energy change.
In both aforementioned combinations of MoS3 polymorphs, the Mo-Mo bond length
should exhibit the short (~2.72-2.75 Å) and long (2.96-3.16 Å) contribution as reported
by some EXAFS analysis.[35] Depending on the proportion of triangular Mo3S9, we may
suspect that the long Mo-Mo bond vanishes and the short one only becomes predominant.
This could explain that other EXAFS analyses reported this short Mo-Mo bond only.[35,
120, 122, 241] These different observations may also originate from the genesis
Amorphous MoS3: Size-dependent structural properties, spectroscopic, and energetic analysis
Sahu, A. 144
(synthesis pathway) of the MoS3 phase, which may result in atomically different a-MoS3
phases depending on the experimental conditions.
As illustrated by the thermodynamic energy plot (Figure 5-9), the triangular Mo3S9 is the
most stable one for the smallest size. If the nucleation of MoS3 starts from such triangular
clusters, it is highly improbable that it transforms into a chain-like OR Mo3S9 because of
the high reaction endergonicity (G~1 eV at T=298.15 K, Figure 5-10). Concomitantly, if
the nucleation generates OR Mo3S9, the reverse reaction to TO is exergonic. For larger TO,
the transformation into chain-like oligomers (OR, R, WL, HL) would be
thermodynamically favored (Figure 5-10). Although further investigations are needed, it
is strongly suspected that the kinetic limitations of breaking several Mo-S and Mo-Mo
bonds to open the interconnected triangular Mo3S9 clusters will prevent the
transformation from TO into the chain-like polymorphs. Hence, the formation of chain-
like polymorphs would need to be promoted during the genesis of the Mo3S9 embryos
through specific reaction conditions (precursors or even support effects).
Assuming that the triangular Mo3S9 clusters are first formed, they could grow by
connecting one to each other to form TO oligomers of increasing sizes. Nevertheless, as
we have shown by AIMD, the small TO intermediates Mo6S18, Mo9S27, and Mo12S36 are
prone to be further transformed into 1T’-MoS3 clusters through a condensation step
(Figure 5-14). This striking dynamic behavior reveals that metastable TO conformers
might readily convert into a 1T’-like MoS3 polymorph.
The TO into 1T’-MoS3 transformation is exergonic (G~-0.56 eV to -0.73 eV for the three
Mo6S18, Mo9S27, and Mo12S36 clusters). As revealed by the AIMD simulation, this
condensation mechanism occurs if the relative positions of the various dimeric and
monomeric S species are optimal. Otherwise, it is blocked, and the oligomerization of the
triangular species can continue. Once the first embryos of the 1T’-MoS3 phase are
generated in the form of the structures identified by our AIMD, they could probably follow
a sintering process to produce larger MoS3 ribbons inspired by the NbS3 structure.[114,
126] Note that the transformation of TO-P into MoS3 ribbons (NbS3-like) is also exergonic.
Amorphous MoS3: Size-dependent structural properties, spectroscopic, and energetic analysis
Sahu, A. 145
In the present AIMD simulations (constant chemical composition), the obtained 1T’-like
phase is thus over-stoichiometric with respect to 1T’-MoS2, and the excess S atoms are
located at the edges of the 1T’-nanostructure.
Similarly, over-stoichiometric triangular or hexagonal nanostructures have been
reported for 2H-MoS2.[32, 248] The removal of the excess sulfur from the edge sites in the
presence of H2 as it is usual in sulfo-reductive conditions may lead to 1T’-MoS2[7], which
can further transform into 2H-MoS2.[249–256] The easy formation of the 1T’-MoS3 cluster
also justifies the above proposal of coexistence of triangular Mo3S9 and 1T’-MoS3 clusters
to recover the experimental IR spectrum.
However, we cannot exclude that right from the early stage; the nucleation forms a chain
like a cluster (if stabilized by support effect or nature of precursor) which rapidly grows
by adding “linearly” other Mo atoms before transforming into TO that is energetically
preferred in the gas-phase for small clusters. Furthermore, if the growth of OR proceeds
further, the cyclization process from OR to R would be likely considering the significant
free energy gain (G~-0.89 eV at T=298.15 K, for Mo12S36). The fact that such ring
structures have not been yet reported so far may indicate that the first scenario is
common. However, we propose that the improvement of synthesis or characterization
methods could allow for identifying the R structures. Alternatively, the reconstruction of
the terminal units of the OR structures could result in the HY structures where triangular
clusters and a chain are interconnected. We have shown above that the simulated IR
spectrum of these HY polymorphs is also compatible with the experimental one.
Conclusions
By means of DFT calculations, the present work provided a detailed analysis of the
structural, energetic, and spectroscopic properties of the a-MoS3 amorphous phase. The
challenging question of the amorphous nature of this phase was addressed by identifying
several structures of possible conformers such as chain-like and triangular oligomers
either previously invoked in the experimental literature or newly proposed. By simulating
cluster models and periodic structures, we showed how size effects impact the relative
stability of these various polymorphs.

Amorphous MoS3: Size-dependent structural properties, spectroscopic, and energetic analysis
Sahu, A. 146
We first ruled out the strictly linear models of Mo5+(S2-)2(S22-)1/2[34, 41] and of Mo4+(S2-
)(S22-), which are both significantly less stable than triangular models or curved chains.
The curvature is induced by the specific orientation of S2 dimers as found in open-ring
(OR), ring (R), wave-like (WL), or helical (HL) structures.
For small sizes, the triangular Mo3S9 is more stable than the chain-like models.
Nevertheless, the free energy rapidly becomes favorable to chain-like models when
increasing size. In particular, for the largest oligomers studied here (Mo15S45), OR and R
becomes more stable than TO, while the periodic structures such WL-P and HL-P confirm
that chain-like models are favored.
To the best of our knowledge, the stable ring structures were never observed
experimentally. So, as a first perspective to favor the formation of this appealing ring
structure, we suggest that experimental studies may explore alternative synthesis
pathways to prevent the formation of triangular clusters and to prompt the cyclization
process.
We proposed possible transformation pathways for the MoS3 oligomers: from their
nucleation to growth, accompanied eventually by condensation and cyclization steps. In
particular, the AIMD simulation revealed the easy transformation of the MoS3 TOs into a
so-called “1T’-MoS3” phase with the typical structural pattern of the 1T’-MoS2 phase. The
corresponding periodic structure should be MoS3-ribbon inherited from the NbS3 phase.
Our large variety of explored structures allowed us to revisit the interpretation of
experimental EXAFS, IR, and XPS spectra. The DFPT simulation of IR spectra highlighted
the particular contribution of the Mo-S mode of µ1-S species in the 525 cm-1 region. In
comparison, the S-S modes of µ1-S2 and µ2-S2 contribute to the 550 cm-1 region. The core-
level shift calculations reveal the XPS compatibility of all S species, excepting µ1-S species
present at the edges of the chain-like model or in the triangular Mo3S9, which, therefore,
should at most exist in very low concentrations. To recover the IR spectrum, we proposed
relevant combinations of polymorphs. These combinations of polymorphs may also
explain why EXAFS data report either one or two types of Mo-Mo bond lengths depending
on the relative concentrations of each polymorph. The curved chain-like model contains

Amorphous MoS3: Size-dependent structural properties, spectroscopic, and energetic analysis
Sahu, A. 147
only one short Mo-Mo bond, whereas the TO model contains one short and one long Mo-
Mo bond length.
This in-depth theoretical study of the MoS3 phase provides a rational understanding of
the amorphous MoS3 phase, which could be helpful in improving its reactivity as well as
the genesis of MoS2 phases (1T or 2H) used in many applications: hydrotreatment,
hydrogen evolution reaction, storage materials… We propose in the general conclusions
to revisit the principal results of the genesis of the MoS2 phase obtained in Chapter 4 and
5.

Conclusions and perspectives
In this thesis, we have addressed four objectives under the critical questions of the genesis of
the 𝛾-alumina-supported MoS2 catalyst. The first objective was to understand the interaction
of oxide precursors and the nature of alumina anchoring sites, how the support influences the
structure (triangular vs. chain), and the stability of molybdenum oxide precursors
represented by small oligomers. The second objective was devoted to the mechanistic insights
into the sulfo-reduction of these molybdenum oxide precursors and the impact of the support.
We provided a fundamental understanding and a quantitative analysis by identifying the
various types of oxygen sites and their potentiality towards sulfo-reduction. The combination
of thermodynamics and kinetics of the process offers information on the involved
intermediates and limiting steps. In particular, the competition of oxysulfide and trisulfide
pathways has been examined. The third objective was to probe various key effects on two
sulfidation pathways: the size of Mo-oxysulfide and trisulfide oligomers and structural
reconstruction (triangular vs. linear). Finally, the fourth objective was to determine the nature
of the MoS3 phase, growth, and morphological evolution (chain vs. triangular) as a function of
size (in the absence of any support effect). We have attempted to make the bridge with
numerous experimental data (IR, EXAFS, XPS…) published in the literature for each objective.
In what follows, we summarize the critical findings related to these objectives. Besides, we
highlight the limitation of the current study and the questions which still remain open.
Therefore, we will also propose some further DFT investigations in the spirit of unfolding
those challenges.
Sulfo-reduction of Mo-oxides on supported alumina
Monomer (Mo1O3), dimer (Mo2O6), and trimer (Mo3O9) as a model of oxide precursors have
been investigated on the (100) surface of alumina. The support has a considerable effect on
the conformation of Mo-oxides and their stability. Mo2O6 structures are modified by support
with respect to its gas-phase conformer. The support stabilizes the chain-Mo3O9 vs. cyclic-
Mo3O9 through the anchoring point of Mo-Ol-Al and Mo-Osurf linkage. Indeed, the support
reverses the relative stability between the two arrangements with respect to the gas-phase.
The support also leads to a stronger deformation of chain-Mo3O9 compared to the cyclic model.
The larger the deformation of the structure from its gas phase, the greater the impact on
Conclusions and perspectives
Sahu, A. 150
stability was observed. Four chemically different classes of oxygens were found on supported
Mo-oxides: terminal (Ot), bridging (Obr), interfacial-bidentate (Oint-bi), and interfacial-
tridentate (Oint-tri). These oxygens, with their various chemical environment, play a crucial role
during sulfo-reduction.
O/S exchange is the most commonly invoked chemical phenomenon in the literature for the
sulfidation process. Generally, O/S exchange is thermodynamically favorable and results in an
energy gain of 0.3-0.5 eV. However, thermodynamically neutral or even endergonic steps, for
some last couple of O/S exchanges, suggest intrinsic difficulties at the end of the process.
Terminal and bridging oxygens are equally prone to exchange and more favorable than Oint
thermodynamically. If two adjacent interfacial oxygens are first exchanged (heterogeneous
sulfidation), an S2-dimer can be formed, which provides a strong stabilization (~1 eV). This
stabilizing effect of the dimer is also consistent in other chains and cyclic-Mo3O9 models.
Moreover, the S2-dimer formation is also an indication of reducing the oxidation state of Mo.
We propose an interpretation of EXAFS data based on the simulated oxysulfide intermediates'
analysis and suspect that the short Mo-Ot bonds observed in EXAFS are the signature of a
heterogeneously sulfided Mo-oxysulfides.
Regarding the mechanisms, the necessary steps to replace the oxygen with sulfur are H2S
adsorption, H2S dissociation, proton transfer, and water desorption. In most cases, the H2S
dissociation or the proton transfer step is the rate-limiting step (for Ot, Obr, and Oint-bi).
However, Oint-tri is limited by water desorption and sulfur diffusion. Bridging oxygen (Obr) is
the easiest to be replaced by sulfur, requiring ~1.2 eV. The terminal oxygens (Ot) are
moderately expensive and feature an activation free energy of ~1.6 eV. However, for
interfacial oxygen atoms, due to strong interaction with support, the interfacial oxygens
demand excessive energy for sulfidation (larger than 1.7 eV). If we follow this path till the end,
a trisulfide Mo3S9 oligomer with a chain-like structure anchored on the support is obtained
(Figure 6-1).
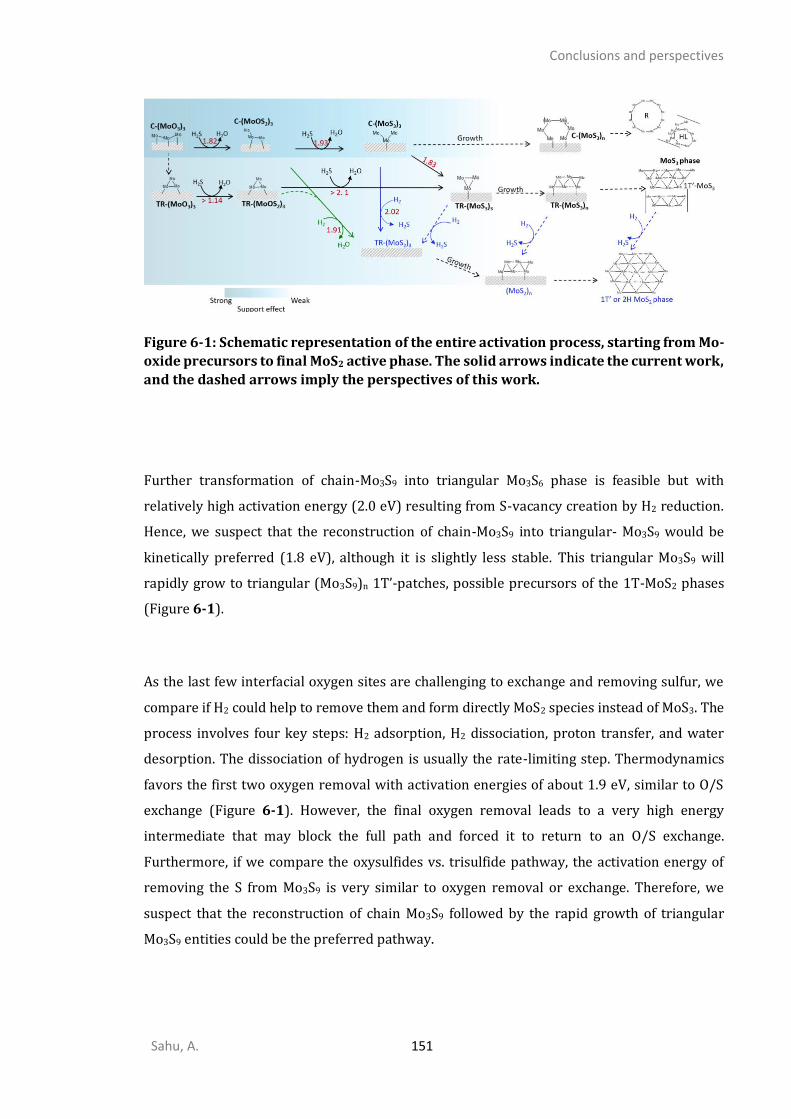
Conclusions and perspectives
Sahu, A. 151
Figure 6-1: Schematic representation of the entire activation process, starting from Mo-
oxide precursors to final MoS2 active phase. The solid arrows indicate the current work,
and the dashed arrows imply the perspectives of this work.
Further transformation of chain-Mo3S9 into triangular Mo3S6 phase is feasible but with
relatively high activation energy (2.0 eV) resulting from S-vacancy creation by H2 reduction.
Hence, we suspect that the reconstruction of chain-Mo3S9 into triangular- Mo3S9 would be
kinetically preferred (1.8 eV), although it is slightly less stable. This triangular Mo3S9 will
rapidly grow to triangular (Mo3S9)n 1T’-patches, possible precursors of the 1T-MoS2 phases
(Figure 6-1).
As the last few interfacial oxygen sites are challenging to exchange and removing sulfur, we
compare if H2 could help to remove them and form directly MoS2 species instead of MoS3. The
process involves four key steps: H2 adsorption, H2 dissociation, proton transfer, and water
desorption. The dissociation of hydrogen is usually the rate-limiting step. Thermodynamics
favors the first two oxygen removal with activation energies of about 1.9 eV, similar to O/S
exchange (Figure 6-1). However, the final oxygen removal leads to a very high energy
intermediate that may block the full path and forced it to return to an O/S exchange.
Furthermore, if we compare the oxysulfides vs. trisulfide pathway, the activation energy of
removing the S from Mo3S9 is very similar to oxygen removal or exchange. Therefore, we
suspect that the reconstruction of chain Mo3S9 followed by the rapid growth of triangular
Mo3S9 entities could be the preferred pathway.
Conclusions and perspectives
Sahu, A. 152
The evaluation of the interaction energies of oxides, oxysulfides, trisulfides, and disulfides
species with the support revealed that oxides have the strongest interaction with alumina,
dominated mainly by Mo-O-Al linkage, whereas the disulfides and trisulfides exhibit the
weakest ones. Interestingly, triangular-Mo3S9 demonstrates the weakest interaction with
alumina, which may enhance their surface diffusion and growth. Moreover, since the kinetics
of sulfo-reduction of monomeric Mo1O3 species is far more complicated, we deduce that the
growth of TR-Mo3S9 is more probable. However, this point should be validated by further
investigations as proposed in the perspectives.
MoS3 phase: triangular, chain, ring, or hybrid?
Using DFT, we systematically examined not only the various proposed models of MoS3 either
by theoretical investigations or by experimental observations such as triangles and chains but
also some unprecedented ones such as ring, helical, and 1T’-MoS3. We have compared the
effect of size and their structural stability. The strictly linear MoS3 is significantly less stable
than the triangular or curved chains and is therefore not part of the likely constituents of
amorphous MoS3.
We have compared some of the key descriptors such as Mo-Mo and Mo-S bonds with available
EXAFS data for our investigation models. Triangular models have two Mo-Mo bonds as
proposed by some EXAFS, and chain models have only a short Mo-Mo bond as described by
others. For the smallest size (No. of Mo-atoms (n) = 3), MoS3 is most stable as triangular; for
size n=6 and 9, it is most stable as 1T’-MoS3; and for size n > 9, it is most stable as a ring, based
on thermodynamic energy. Curved-chain models are more stable for a larger size than
triangular oligomers. Even for the infinite size, the helical structure, which is an extension of
the open-ring model, is the most stable one, followed by wavelike and NbS3-ribbon.
We re-examine the IR-peak assignment for various models. We found a discrepancy with the
earlier peak assignment based on the over-sulfided Mo3S13 compound. The terminal and
bridging-S2 do not give rise to two different peaks but instead, appear at a similar frequency.
Not a single model is able to reproduce the amorphous bulk-MoS3 spectrum, so we suspect the
presence of a mixture of various structures in the experimental bulk-MoS3 samples, such as
triangular, open-ring, hybrid, and a so-called 1T’-MoS3.
Conclusions and perspectives
Sahu, A. 153
We showed the transformation pathways from one polymorph to another, indicating at what
stage the transformation could occur. By utilizing AIMD, we have revealed how triangular
(Mo3S3)n may evolve to a 1T’-MoS3 phase resembling the 1T-MoS2 phase. The latter phase
would then be transformed by S-diffusion into 2H-MoS2.
Impact of the support
The easy transformation of triangular (Mo3S9)n into 1T’-MoS3 2D patches as revealed by AIMD,
induces that this process could be a favorable pathway for the further evolution of TR-Mo3S9
toward the 1T-MoS2. However, this process will be possible only if the support does not favor
the formation of C-Mo3S9 (Figure 6-1). The stabilization of TR-Mo3S9 could be inherited from
the cyclic-Mo3O9 precursors, which are stabilized in the absence of support, as shown by our
calculations. Hence, a weakening of Mo-support interaction could be beneficial not only to the
removal of O-species (particularly those located at the interface) but also to favor triangular
species' formation, acting as the first embryos of the MoS2 phase.
However, if a too weak metal support interaction takes place, chain-like MoS3 polymorphs
(such as helical or ring) become thermodynamically stabilized upon growing (for a size
greater than 9 in the gas phase), as shown by our calculations. Once these long-chain MoS3
polymorphs are formed, it may be difficult to reconstruct them into triangular entities, which
may restrict further MoS2 formation (see the whole scheme in Figure 6-1).
Hence, even if more investigations are required, we suspect that an intermediate metal-
support interaction that stabilizes triangular entities should be sought in order to optimize
the genesis of the MoS2 phase.
Open questions and perspectives
We have tried to unfold many challenging aspects of the genesis of the active phase on
supported alumina. However, several interesting questions remain open. We propose in what
follows some short-term and a few long-term perspectives to tackle those issues.
Conclusions and perspectives
Sahu, A. 154
In the short term, we plan to investigate the TR-Mo3S9 to TR-Mo3S6 transformation through S-
removal and compare the required activation energies with the chain-Mo3S9 to TR-Mo3S6 that
we already determined. This will allow determining if the structure of Mo3S9 influences the S-
removal step.
Moreover, we need to calculate the S removal for larger triangular MoS3 structures to provide
a better comprehension of the size effect of the MoS3 phase on supported alumina.
Furthermore, we will determine the energy barriers for the diffusion of the chain-Mo3S9
entities on the O-sites of the (100) surface of alumina.
In the longer term, the growth of the MoS3 and MoS2 phases should also be investigated. To
have a clearer perspective about at which step the growth begins, whether the MoS3 grows
first and then transforms into MoS2 or small MoS3 transforms into MoS2, and these MoS2
patches grow afterward. As we know, the strength of interaction with support and activation
required to remove the S from MoS3 has a considerable impact on the growth of the trisulfide
or disulfide phase. Calculating the S removal barrier for large MoS3 species, diffusion barriers,
and sintering barriers would help to understand what may happen during this process.
Moreover, we think that the growth, if it occurs at the trisulfide stage, should be in triangular
form because the chain could be inadequate precursors for MoS2 transformation.
However, our understanding will remain limited to the (100) alumina surface within this
project. As the (110) surface is significantly different, it is crucial to understand what happens
on the (110) surface. The stability, evolution, and kinetics of many species, which we have
investigated, should be considered for the future on (110) surface of alumina. On the (110)
surface, sites are much more complex due to the presence of OH species which may impact the
whole sulfidation process, particularly the steps involving interfacial O atoms. Moreover, the
presence of the AlIV site is known to have stronger interaction and could impact the stability
of the triangular vs. chain throughout the reaction path.
Furthermore, we have investigated the Mo3O9 species that are still very small compared to
what might be present in some preparation protocols. Therefore, the extension on the effect
of Mo-oxides size could also be considered.
Conclusions and perspectives
Sahu, A. 155
From a methodological point of view, due to the great number of DFT data collected so far, this
study can be combined with microkinetic models such as kinetic-Monte-Carlo or mean-field
microkinetic models for the entire process to bridge the gap between its atomic-scale insights
and macroscopic properties such as rate of reaction, reaction barriers, and order of the
reaction.
Considering alternative applications, a-MoS3 has shown potential application for HER. The
activity of HER can be investigated on our newly proposed MoS3 models as a function of size
and morphologies. We could explore the active sites and their reactivity based on the size and
morphology of MoS3 polymorphs.
Similarly, we could also propose to investigate more precisely the electronic properties of such
MoS3 polymorphs. Preliminary results have shown that they would be semi-conductors that
could be beneficial for photocatalysis applications.
Last but not least, the study could also be extended to understand the nature of the interaction
with toxic metals, such as Hg, by creating the defects, as a-MoS3 has been shown a potential
candidate for Hg capturing. We can also investigate which model suits what kind of
application.


REFERENCES
[1] IEA. World Energy Outlook – 2020. https://www.iea.org/reports/world-energy-outlook-2020?mode=overview.
[2] IEA. World Energy Outlook 2019: Paris, France, 2019. [3] BP. Full report – BP Statistical Review of World Energy 2019. [4] IEA. Oil Market Report - May 2021 – Analysis - IEA. https://www.iea.org/fuels-and-
technologies/oil. [5] Basset, L. Net-zero 2050 - European Climate Foundation. https://europeanclimate.org/net-
zero-2050/. [6] Office, P. European Parliament and of the Council, Directive 2009/30/EC. [7] Toulhoat, H.; Raybaud, P. Catalysis by transition metal sulphides: From molecular theory to
industrial application; Editions Technip: Paris, France, 2013. [8] Sabatier, P. La catalyse en chimie organique; Nouveau Monde: Paris, 1920. [9] Masel, R.I. Principles of adsorption and reaction on solid surfaces; Wiley: New York,
Chichester, 1996. [10] Toulhoat, H.; Raybaud, P. Kinetic interpretation of catalytic activity patterns based on
theoretical chemical descriptors. J. Catal., 2003, 216, 63–72. [11] Munnik, P.; Jongh, P.E. de; Jong, K.P. de. Recent Developments in the Synthesis of
Supported Catalysts. Chem. Rev., 2015, 115, 6687–6718. [12] Che, M. Interfacial Coordination Chemistry. In: Guczi, Solymosi et al. (Ed.) 1993 – Studies in
Surface Science; Vol. 75; pp. 31–68. [13] Carrier, X.; La d'Espinose de Caillerie, J.-B.; Lambert, J.-F.; Che, M. The Support as a Chemical
Reagent in the Preparation of WOx/γ-Al2O3 Catalysts: Formation and Deposition of Aluminotungstic Heteropolyanions. J. Am. Chem. Soc., 1999, 121, 3377–3381.
[14] Digne, M.; Sautet, P.; Raybaud, P.; Euzen, P.; Toulhoat, H. Hydroxyl Groups on γ-Alumina Surfaces: A DFT Study. J. Catal., 2002, 211, 1–5.
[15] Digne, M.; Sautet, P.; Raybaud, P.; Euzen, P.; Toulhoat, H. Use of DFT to achieve a rational understanding of acid-basic properties of γ-alumina surfaces. J. Catal., 2004, 226, 54–68.
[16] Handzlik, J.; Sautet, P. Active sites of olefin metathesis on molybdena-alumina system: A periodic DFT study. J. Catal., 2008, 256, 1–14.
[17] Handzlik, J.; Sautet, P. Structure of Isolated Molybdenum(VI) Oxide Species on γ-Alumina: A Periodic Density Functional Theory Study. J. Phys. Chem. C, 2008, 112, 14456–14463.
[18] Yan, Y.; Xia, B.; Xu, Z.; Wang, X. Recent Development of Molybdenum Sulfides as Advanced Electrocatalysts for Hydrogen Evolution Reaction. ACS Catal., 2014, 4, 1693–1705.
[19] Escalera-López, D.; Lou, Z.; Rees, N.V. Benchmarking the Activity, Stability, and Inherent Electrochemistry of Amorphous Molybdenum Sulfide for Hydrogen Production. Adv. Energy Mater., 2019, 9, 1802614–1802631.
[20] Matsuyama, T.; Deguchi, M.; Hayashi, A.; Tatsumisago, M.; Ozaki, T.; Togawa, Y.; Mori, S. Structure Analyses of Amorphous MoS3 Active Materials in All-solid-state Lithium Batteries. Electrochemistry, 2015, 83, 889–893.
[21] Ye, H.; Ma, L.; Zhou, Y.; Wang, L.; Han, N.; Zhao, F.; Deng, J.; Wu, T.; Li, Y.; Lu, J. Amorphous MoS3 as the sulfur-equivalent cathode material for room-temperature Li-S and Na-S batteries. Proc. Natl. Acad. Sci. U S A, 2017, 114, 13091–13096.
[22] Sun, J.; Wang, R.; Yuan, C. MoS3 nanoparticles on reduced graphene oxide. Mater. Today, 2018, 21, 193–194.
[23] Lince, J.R.; Pluntze, A.M.; Jackson, S.A.; Radhakrishnan, G.; Adams, P.M. Tribochemistry of MoS3 Nanoparticle Coatings. Tribol. Lett., 2014, 53, 543–554.
[24] Mei, J.; Wang, C.; Kong, L.; Liu, X.; Hu, Q.; Zhao, H.; Yang, S. Outstanding Performance of Recyclable Amorphous MoS3 Supported on TiO2 for Capturing High Concentrations of

Sahu, A. 159
Gaseous Elemental Mercury: Mechanism, Kinetics, and Application. Environ. Sci. Technol., 2019, 53, 4480–4489.
[25] Zhang, W.; Zhou, T.; Hong, J.; Xu, R. MoS3 loaded TiO2 nanoplates for photocatalytic water and carbon dioxide reduction. J. Energy Chem., 2016, 25, 500–506.
[26] Seo, B.; Joo, S.H. Recent advances in unveiling active sites in molybdenum sulfide-based electrocatalysts for the hydrogen evolution reaction. Nano Converg., 2017, 4, 19–30.
[27] Weber, T.; Muijsers, J.C.; van Wolput, J.H.M.C.; Verhagen, C.P.J.; Niemantsverdriet, J.W. Basic Reaction Steps in the Sulfidation of Crystalline MoO3 to MoS2, As Studied by X-ray Photoelectron and Infrared Emission Spectroscopy. J. Phys. Chem., 1996, 100, 14144–14150.
[28] Ye, H.; Wang, L.; Deng, S.; Zeng, X.; Nie, K.; Duchesne, P.N.; Wang, B.; Liu, S.; Zhou, J.; Zhao, F.; Han, N.; Zhang, P.; Zhong, J.; Sun, X.; Li, Y.; Li, Y.; Lu, J. Amorphous MoS3 Infiltrated with Carbon Nanotubes as an Advanced Anode Material of Sodium-Ion Batteries with Large Gravimetric, Areal, and Volumetric Capacities. Adv. Energy Mater., 2017, 7, 1601602–1601611.
[29] He, Z.; Que, W. Molybdenum disulfide nanomaterials: Structures, properties, synthesis and recent progress on hydrogen evolution reaction. Appl. Mater. Today, 2016, 3, 23–56.
[30] Lv, R.; Robinson, J.A.; Schaak, R.E.; Du Sun; Sun, Y.; Mallouk, T.E.; Terrones, M. Transition Metal Dichalcogenides and Beyond: Synthesis, Properties, and Applications of Single- and Few-Layer Nanosheets. Acc. Chem. Res., 2015, 48, 56–64.
[31] Raybaud, P.; Hafner, J.; Kresse, G.; Kasztelan, S.; Toulhoat, H. Ab Initio Study of the H2–H2S/MoS2 Gas–Solid Interface: The Nature of the Catalytically Active Sites. J. Catal., 2000, 189, 129–146.
[32] Schweiger, H.; Raybaud, P.; Kresse, G.; Toulhoat, H. Shape and Edge Sites Modifications of MoS2 Catalytic Nanoparticles Induced by Working Conditions: A Theoretical Study. J. Catal., 2002, 207, 76–87.
[33] Kasztelan, S.; Toulhoat, H.; Grimblot, J.; Bonnelle, J.P. A geometrical model of the active phase of hydrotreating catalysts. Appl. Catal., 1984, 13, 127–159.
[34] Chien, F.Z.; Moss, S.C.; Liang, K.S.; Chianelli, R.R. Local and intermediate-range structure of amorphous MoS3: Model calculation study. Phys. Rev. B, 1984, 29, 4606–4615.
[35] Cramer, S.P.; Liang, K.S.; Jacobson, A.J.; Chang, C.H.; Chianelli, R.R. EXAFS studies of amorphous molybdenum and tungsten trisulfides and triselenides. Inorg. Chem., 1984, 23, 1215–1221.
[36] Chang, C.H.; Chan, S.S. Infrared and Raman studies of amorphous MoS3 and poorly crystalline MoS2. J. Catal., 1981, 72, 139–148.
[37] Hibble, S.J.; Feaviour, M.R.; Almond, M.J. Chemical excision from amorphous MoS3; a quantitative EXAFS study. J. Chem. Soc., Dalton Trans., 2001, 935–940.
[38] Hibble, S.J.; Wood, G.B. Modeling the structure of amorphous MoS3: a neutron diffraction and reverse Monte Carlo study. J. Am. Chem. Soc., 2004, 126, 959–965.
[39] Jiao, H.; Li, Y.-W.; Delmon, B.; Halet, J.-F. The Structure and Possible Catalytic Sites of Mo3S9 as a Model of Amorphous Molybdenum Trisulfide: A Computational Study. J. Am. Chem. Soc., 2001, 123, 7334–7339.
[40] Weber, T.; Muijsers, J.C.; Niemantsverdriet, J.W. Structure of Amorphous MoS3. J. Phys. Chem., 1995, 99, 9194–9200.
[41] Liang, K.S.; Cramer, S.P.; Johnston, D.C.; Chang, C.H.; Jacobson, A.J.; deNeufville, J.P.; Chianelli, R.R. Amorphous MoS3 and WS3. J. Non-Cryst. Solids, 1980, 42, 345–356.
[42] Hibble, S.J.; Walton, R.I.; Pickup, D.M.; Hannon, A.C. Amorphous MoS3: Clusters or chains? The structural evidence. J. Non-Cryst. Solids, 1998, 232-234, 434–439.
[43] Tributsch, H.; Bennett, J.C. Electrochemistry and photochemistry of MoS2 layer crystals. I. J. Electroanal. Chem., 1977, 81, 97–111.
[44] Nørskov, J.K.; Bligaard, T.; Logadottir, A.; Kitchin, J.R.; Chen, J.G.; Pandelov, S.; Stimming, U. Trends in the Exchange Current for Hydrogen Evolution. J. Electrochem. Soc., 2005, 152, J23-J26.
Sahu, A. 160
[45] Hinnemann, B.; Moses, P.G.; Bonde, J.; Jørgensen, K.P.; Nielsen, J.H.; Horch, S.; Chorkendorff, I.; Nørskov, J.K. Biomimetic Hydrogen Evolution: MoS2 Nanoparticles as Catalyst for Hydrogen Evolution. J. Am. Chem. Soc., 2005, 127, 5308–5309.
[46] Jaramillo, T.F.; Jørgensen, K.P.; Bonde, J.; Nielsen, J.H.; Horch, S.; Chorkendorff, I. Identification of Active Edge Sites for Electrochemical H2 Evolution from MoS2 Nanocrystals. Science, 2007, 317, 100–102.
[47] Zhang, L.; Wu, L.; Li, J.; Lei, J. Electrodeposition of amorphous molybdenum sulfide thin film for electrochemical hydrogen evolution reaction. BMC Chem., 2019, 13, 88–97.
[48] Deng, J.; Li, H.; Xiao, J.; Tu, Y.; Deng, D.; Yang, H.; Tian, H.; Li, J.; Ren, P.; Bao, X. Triggering the electrocatalytic hydrogen evolution activity of the inert two-dimensional MoS2 surface via single-atom metal doping. Energy Environ. Sci., 2015, 8, 1594–1601.
[49] Gao, G.; Sun, Q.; Du, A. Activating Catalytic Inert Basal Plane of Molybdenum Disulfide to Optimize Hydrogen Evolution Activity via Defect Doping and Strain Engineering. J. Phys. Chem. C, 2016, 120, 16761–16766.
[50] Merki, D.; Hu, X. Recent developments of molybdenum and tungsten sulfides as hydrogen evolution catalysts. Energy Environ. Sci., 2011, 4, 3878–3888.
[51] Shang, C.; Fang, Y.Q.; Zhang, Q.; Wang, N.Z.; Wang, Y.F.; Liu, Z.; Lei, B.; Meng, F.B.; Ma, L.K.; Wu, T.; Wang, Z.F.; Zeng, C.G.; Huang, F.Q.; Sun, Z.; Chen, X.H. Superconductivity in the metastable 1T' and 1T''' phase of MoS2 crystals. Phys. Rev. B, 2018, 98, 184513–184523.
[52] Morales-Guio, C.G.; Hu, X. Amorphous Molybdenum Sulfides as Hydrogen Evolution Catalysts. Acc. Chem. Res., 2014, 47, 2671–2681.
[53] Ting, L.R.L.; Deng, Y.; Ma, L.; Zhang, Y.-J.; Peterson, A.A.; Yeo, B.S. Catalytic Activities of Sulfur Atoms in Amorphous Molybdenum Sulfide for the Electrochemical Hydrogen Evolution Reaction. ACS Catal., 2016, 6, 861–867.
[54] Hinnemann, B.; Nørskov, J.K.; Topsøe, H. A Density Functional Study of the Chemical Differences between Type I and Type II MoS2-Based Structures in Hydrotreating Catalysts. J. Phys. Chem. B, 2005, 109, 2245–2253.
[55] Tsai, C.; Li, H.; Park, S.; Park, J.; Han, H.S.; Nørskov, J.K.; Zheng, X.; Abild-Pedersen, F. Electrochemical generation of sulfur vacancies in the basal plane of MoS2 for hydrogen evolution. Nat. Commun., 2017, 8, 15113–15121.
[56] Deng, Y.; Ting, L.R.L.; Neo, P.H.L.; Zhang, Y.-J.; Peterson, A.A.; Yeo, B.S. Operando Raman Spectroscopy of Amorphous Molybdenum Sulfide (MoSx) during the Electrochemical Hydrogen Evolution Reaction: Identification of Sulfur Atoms as Catalytically Active Sites for H+ Reduction. ACS Catal., 2016, 6, 7790–7798.
[57] Yin, Z.; Zhao, J.; Wang, B.; Xu, Y.; Li, Z.; Ma, X. Insight for the effect of bridging S22- in
molybdenum sulfide catalysts toward sulfur-resistant methanation. Appl. Surf. Sci., 2019, 471, 670–677.
[58] Chang, U.; Lee, J.T.; Yun, J.-M.; Lee, B.; Lee, S.W.; Joh, H.-I.; Eom, K.; Fuller, T.F. In Situ Self-Formed Nanosheet MoS3/Reduced Graphene Oxide Material Showing Superior Performance as a Lithium-Ion Battery Cathode. ACS nano, 2019, 13, 1490–1498.
[59] Dockery, D.W.; Pope, C.A.; Xu, X.; Spengler, J.D.; Ware, J.H.; Fay, M.E.; Ferris, B.G.; Speizer, F.E. An Association between Air Pollution and Mortality in Six U.S. Cities. N. Engl. J. Med., 1993, 329, 1753–1759.
[60] Dumon, A.S.; Sahu, A.; Raybaud, P. Hydrogenolysis and β–elimination mechanisms for C-S bond scission of dibenzothiophene on CoMoS edge sites. J. Catal., 2021, In press.
[61] Daage, M.; Chianelli, R.R. Structure-Function Relations in Molybdenum Sulfide Catalysts: The "Rim-Edge" Model. J. Catal., 1994, 149, 414–427.
[62] Singhal, G.H.; Espino, R.L.; Sobel, J.E.; Huff, G.A. Hydrodesulfurization of sulfur heterocyclic compounds: Kinetics of dibenzothiophene. J. Catal., 1981, 67, 457–468.
[63] Bataille, F.; Lemberton, J.-L.; Michaud, P.; Pérot, G.; Vrinat, M.; Lemaire, M.; Schulz, E.; Breysse, M.; Kasztelan, S. Alkyldibenzothiophenes Hydrodesulfurization-Promoter Effect, Reactivity, and Reaction Mechanism. J. Catal., 2000, 191, 409–422.
Sahu, A. 161
[64] Egorova, M.; Prins, R. Hydrodesulfurization of dibenzothiophene and 4,6-dimethyldibenzothiophene over sulfided NiMo/γ-Al2O3, CoMo/γ-Al2O3, and Mo/γ-Al2O3 catalysts. J. Catal., 2004, 225, 417–427.
[65] Euzen, P.; Raybaud, P.; Krokidis, X.; Toulhoat, H.; Le Loarer, J.-L.; Jolivet, J.-P.; Froidefond, C. Alumina. In: Handbook of Porous Solids. Schth, F., Sing, K.S.W., Weitkamp, J., Eds.; Wiley-VCH Verlag GmbH: Weinheim, Germany, 2002; pp. 1591–1677.
[66] Ramirez, J.; Fuentes, S.; Díaz, G.; Vrinat, M.; Breysse, M.; Lacroix, M. Hydrodesulphurization activity and characterization of sulphided molybdenum and cobalt—molybdenum catalysts comparison of alumina-, silica—alumina- and titania-supported catalysts. Appl. Catal., 1989, 52, 211–223.
[67] Huirache-Acuña, R.; Nava, R.; Peza-Ledesma, C.L.; Lara-Romero, J.; Alonso-Núez, G.; Pawelec, B.; Rivera-Muñoz, E.M. SBA-15 Mesoporous Silica as Catalytic Support for Hydrodesulfurization Catalysts—Review. Materials, 2013, 6, 4139–4167.
[68] Krebs, E.; Silvi, B.; Raybaud, P. Mixed sites and promoter segregation: A DFT study of the manifestation of Le Chatelier's principle for the Co(Ni)MoS active phase in reaction conditions. Catal. Today, 2008, 130, 160–169.
[69] Breysse, M.; Afanasiev, P.; Geantet, C.; Vrinat, M. Overview of support effects in hydrotreating catalysts. Catal. Today, 2003, 86, 5–16.
[70] Breysse, M.; Geantet, C.; Afanasiev, P.; Blanchard, J.; Vrinat, M. Recent studies on the preparation, activation and design of active phases and supports of hydrotreating catalysts. Catal. Today, 2008, 130, 3–13.
[71] Breysse, M.; Portefaix, J.L.; Vrinat, M. Support effects on hydrotreating catalysts. Catal. Today, 1991, 10, 489–505.
[72] Luck, F. A Review of Support Effects on the Activity and Selectivity of Hydrotreating Catalysts. Bull. Soc. Chim. Belges, 1991, 100, 781–800.
[73] Vrinat, M.; Breysse, M.; Geantet, C.; Ramirez, J.; Massoth, F. Effect of MoS2 morphology on the HDS activity of hydrotreating catalysts. Catal. Lett., 1994, 26, 25–35.
[74] Shimada, H. Morphology and orientation of MoS2 clusters on Al2O3 and TiO2 supports and their effect on catalytic performance. Catal. Today, 2003, 86, 17–29.
[75] Ramirez, J.; Cedeño, L.; Busca, G. The Role of Titania Support in Mo-Based Hydrodesulfurization Catalysts. J. Catal., 1999, 184, 59–67.
[76] Ramírez, J.; Macías, G.; Cedeño, L.; Gutiérrez-Alejandre, A.; Cuevas, R.; Castillo, P. The role of titania in supported Mo, CoMo, NiMo, and NiW hydrodesulfurization catalysts: Analysis of past and new evidences. Catal. Today, 2004, 98, 19–30.
[77] Arrouvel, C.; Breysse, M.; Toulhoat, H.; Raybaud, P. A density functional theory comparison of anatase (TiO2)- and γ-Al2O3-supported MoS2 catalysts. J. Catal., 2005, 232, 161–178.
[78] Beer, V. de; van der Aalst, M.; Machiels, C.J.; Schuit, G. The CoOMoO3 γ-Al2O3 catalyst: VII. Influence of the support. J. Catal., 1976, 43, 78–89.
[79] Gandubert, A.D.; Krebs, E.; Legens, C.; Costa, D.; Guillaume, D.; Raybaud, P. Optimal promoter edge decoration of CoMoS catalysts: A combined theoretical and experimental study. Catal. Today, 2008, 130, 149–159.
[80] Digne, M.; Marchand, K.; Bourges, P. Monitoring Hydrotreating Catalysts Synthesis and Deactivation using Raman Spectrometry. Oil & Gas Science and Technology - Rev. IFP, 2007, 62, 91–99.
[81] Costa, V.; Marchand, K.; Digne, M.; Geantet, C. New insights into the role of glycol-based additives in the improvement of hydrotreatment catalyst performances. Catal. Today, 2008, 130, 69–74.
[82] Iwamoto, R.; Grimblot, J. Influence of Phosphorus on the Properties of Alumina-Based Hydrotreating Catalysts. Adv. Catal., 1999, 44, 417–503.
[83] Souchay, P. Polyanions et polycations; Gauthier-Villars: Paris, 1963. [84] Pope, M.T.; Jeannin, Y.; Fournier, M. Heteropoly and Isopoly Oxometalates; Springer Berlin:
Berlin, 1983.
Sahu, A. 162
[85] Shopov, D. Heterogeneous catalysis: Proceedings of the sixth International Symposium; Pub. House of the Bulgarian Academy of Sciences: Sofia, 1987.
[86] Griboval, A.; Blanchard, P.; Payen, E.; Fournier, M.; Dubois, J.L. Alumina supported HDS catalysts prepared by impregnation with new heteropolycompounds. Comparison with catalysts prepared by conventional Co–Mo–P coimpregnation. Catal. Today, 1998, 45, 277–283.
[87] Griboval, A.; Blanchard, P.; Gengembre, L.; Payen, E.; Fournier, M.; Dubois, J.L.; Bernard, J.R. Hydrotreatment Catalysts Prepared with Heteropolycompound: Characterisation of the Oxidic Precursors. J. Catal., 1999, 188, 102–110.
[88] Griboval, A.; Blanchard, P.; Payen, E.; Fournier, M.; Dubois, J.; Bernard, J. Characterization and catalytic performances of hydrotreatment catalysts prepared with silicium heteropolymolybdates: Comparison with phosphorus doped catalysts. Appl. Catal. A, 2001, 217, 173–183.
[89] Wang, L. On the genesis of molybdena-alumina catalyst. J. Catal., 1980, 66, 251–255. [90] Kasztelan, S.; Grimblot, J.; Bonnelle, J.P.; Payen, E.; Toulhoat, H.; Jacquin, Y. Preparation of
Co-Mo-γAl2O3 and Ni-Mo-γAl2O3 catalysts by pH regulation of molybdenum solution. characterization of supported species and hydrogenation activities. Appl. Catal., 1983, 7, 91–112.
[91] Spanos, N.; Lycourghiotis, A. Molybdenum-oxo Species Deposited on Alumina by Adsorption: III. Advances in the Mechanism of Mo(VI) Deposition. J. Catal., 1994, 147, 57–71.
[92] Vissenberg, M.J.; Joosten, L.J.M.; Heffels, M.M.E.H.; van Welsenes, A.J.; Beer, V.H.J. de; van Santen, R.A. Tungstate versus Molybdate Adsorption on Oxidic Surfaces: A Chemical Approach. J. Phys. Chem. B, 2000, 104, 8456–8461.
[93] Goncharova, O.I.; Boreskov, G.K.; Yurieva, T.M.; Yurchenko, E.N.; Boldyreva, N.N. Active state of molybdenum in molybdenum-alumina catalysts for propylene oxidation. React. Kinet. Catal. L., 1981, 16, 349–353.
[94] Le Bihan, L.; Blanchard, P.; Fournier, M.; Grimblot, J.; Payen, E. Raman spectroscopic evidence for the existence of 6-molybdoaluminate entities on an Mo/Al2O3 oxidic precursor. J. Chem. Soc., Faraday Trans., 1998, 94, 937–940.
[95] Blanchard, P.; Lamonier, C.; Griboval, A.; Payen, E. New insight in the preparation of alumina supported hydrotreatment oxidic precursors: A molecular approach. Appl. Catal. A, 2007, 322, 33–45.
[96] Sarrazin, P.; Kasztelan, S.; Zanier-Szydlowski, N.; Bonnelle, J.P.; Grimblot, J. Interaction of oxomolybdenum species with γ-alumina and γ-alumina modified by silicon. The silica/γ-alumina system. J. Phys. Chem., 1993, 97, 5947–5953.
[97] van Dillen, A.; Terörde, R.J.; Lensveld, D.J.; Geus, J.W.; Jong, K.P. de. Synthesis of supported catalysts by impregnation and drying using aqueous chelated metal complexes. J. Catal., 2003, 216, 257–264.
[98] Texier, S.; Berhault, G.; Pérot, G.; Diehl, F. Activation of alumina-supported hydrotreating catalysts by organosulfides or H2S: Effect of the H2S partial pressure used during the activation process. Appl. Catal. A, 2005, 293, 105–119.
[99] Lesage, C.; Devers, E.; Legens, C.; Fernandes, G.; Roudenko, O.; Briois, V. High pressure cell for edge jumping X-ray absorption spectroscopy: Applications to industrial liquid sulfidation of hydrotreatment catalysts. Catal. Today, 2019, 336, 63–73.
[100] Leliveld, R.G.; van Dillen, A.J.; Geus, J.W.; Koningsberger, D.C. The Sulfidation of γ-Alumina and Titania Supported (Cobalt)Molybdenum Oxide Catalysts Monitored by EXAFS. J. Catal., 1997, 171, 115–129.
[101] Costa, D.; Arrouvel, C.; Breysse, M.; Toulhoat, H.; Raybaud, P. Edge wetting effects of γ-Al2O3 and anatase-TiO2 supports by MoS2 and CoMoS active phases: A DFT study. J. Catal., 2007, 246, 325–343.

Sahu, A. 163
[102] Jong, A.M. de; Borg, H.J.; van IJzendoorn, L.J.; Soudant, V.G.F.M.; Beer, V.H.J. de; van Veen, J.A.R.; Niemantsverdriet, J.W. Sulfidation mechanism by molybdenum catalysts supported on silica/silicon(100) model support studied by surface spectroscopy. J. Phys. Chem., 1993, 97, 6477–6483.
[103] Muijsers, J.C.; Weber, T.; Vanhardeveld, R.M.; Zandbergen, H.W.; Niemantsverdriet, J.W. Sulfidation Study of Molybdenum Oxide Using MoO3/SiO2/Si(100) Model Catalysts and Mo3
IV-Sulfur Cluster Compounds. J. Catal., 1995, 157, 698–705. [104] Payen, E.; Kasztelan, S.; Houssenbay, S.; Szymanski, R.; Grimblot, J. Genesis and
characterization by laser Raman spectroscopy and high-resolution electron microscopy of supported molybdenum disulfide crystallites. J. Phys. Chem., 1989, 93, 6501–6506.
[105] Nicosia, D.; Prins, R. The effect of phosphate and glycol on the sulfidation mechanism of CoMo/Al2O3 hydrotreating catalysts: An in situ QEXAFS study. J. Catal., 2005, 231, 259–268.
[106] Rochet, A.; Baubet, B.; Moizan, V.; Pichon, C.; Briois, V. Co-K and Mo-K edges Quick-XAS study of the sulphidation properties of Mo/Al2O3 and CoMo/Al2O3 catalysts. C. R. Chim., 2016, 19, 1337–1351.
[107] Scheffer, B.; van Oers, E.M.; Arnoldy, P.; Beer, V. de; Moulijn, J.A. Sulfidability and HDS activity of Co-Mo/Al2O3 catalysts. Appl. Catal., 1986, 25, 303–311.
[108] Boer, M. de; van Dillen, A.J.; Koningsberger, D.C.; Geus, J.W. The Structure of Highly Dispersed SiO2-Supported Molybdenum Oxide Catalysts during Sulfidation. J. Phys. Chem., 1994, 98, 7862–7870.
[109] Stevens, G.C.; Edmonds, T. Electron spectroscopy for chemical analysis spectra of molybdenum sulfides. J. Catal., 1975, 37, 544–547.
[110] Diemann, E. Radiale Verteilungsfunktionen. V. Strukturuntersuchungen an nichtkristallinem Molybdäntrisulfid, Wolframtrisulfid und Molybdäntriselenid. Zeitschrift für anorganische und allgemeine Chemie, 1977, 432, 127–135.
[111] Gao, Y.; Han, W.; Long, X.; Nie, H.; Li, D. Preparation of hydrodesulfurization catalysts using MoS3 nanoparticles as a precursor. Appl. Catal. B, 2018, 224, 330–340.
[112] Bhattacharya, R.N.; Lee, C.Y.; Pollak, F.H.; Schleich, D.M. Optical study of amorphous MoS3: Determination of the fundamental energy gap. J. Non-Cryst. Solids, 1987, 91, 235–242.
[113] Johnston, D.C.; Jacobson, A.J.; Silbernagel, B.G.; Frysinger, S.P.; Rich, S.M.; Gebhard, L.A. Magnetic susceptibility and electron spin resonance as probes of different magnetic species in MoS3. J. Catal., 1984, 89, 244–249.
[114] Sourisseau, C.; Gorochov, O.; Schleich, D. Comparative IR and Raman studies of various amorphous MoS3 and LixMoS3 phases. Mater. Sci. Eng., 1989, 3, 113–117.
[115] Wang, J.; Ng, S.H.; Chew, S.Y.; Wexler, D.; Wang, G.X.; Liu, H.K. Characterization of Nanosize Molybdenum Trisulfide for Lithium Batteries and MoS3 Structure Confirmation via Electrochemistry. Electrochem. Solid-State Lett., 2007, 10, A204-A207.
[116] Afanasiev, P.; Jobic, H.; Lorentz, C.; Leverd, P.; Mastubayashi, N.; Piccolo, L.; Vrinat, M. Low-Temperature Hydrogen Interaction with Amorphous Molybdenum Sulfides MoSx. J. Phys. Chem. C, 2009, 113, 4139–4146.
[117] Kibsgaard, J.; Jaramillo, T.F.; Besenbacher, F. Building an appropriate active-site motif into a hydrogen-evolution catalyst with thiomolybdate [Mo3S13]2− clusters. Nat. Chem., 2014, 6, 248–253.
[118] Huntley, D.R.; Parham, T.G.; Merrill, R.P.; Sienko, M.J. An EXAFS study of the thermal decomposition of molybdenum trisulfide. Inorg. Chem., 1983, 22, 4144–4146.
[119] G.F. Khudorozhko, I.P. Asanov, L.N. Maealov, E.A. Kravtsova. The study of electronic structure of molybdenum and tungsten trisulfides and their lithium intercalates by x-ray electron and x-ray emission and absorption spectroscopy. J. Electron Spectrosc., 1994, 68, 199–209.

Sahu, A. 164
[120] Hibble, S.J.; Rice, D.A.; Pickup, D.M.; Beer, M.P. Mo K-edge EXAFS and S K-edge absorption studies of the amorphous molybdenum sulfides MoS4.7, MoS3, and MoS3.nH2O (n ~ 2). Inorg. Chem., 1995, 34, 5109–5113.
[121] Hédoire, C.-E.; Cadot, E.; Villain, F.; Davidson, A.; Louis, C.; Breysse, M. Preparation and characterization of molybdenum sulfide supported on β-zeolites obtained from [Mo3S4(H2O)9]4+ precursor. Appl. Catal. A, 2006, 306, 165–174.
[122] Lassalle-Kaiser, B.; Merki, D.; Vrubel, H.; Gul, S.; Yachandra, V.K.; Hu, X.; Yano, J. Evidence from in situ X-ray absorption spectroscopy for the involvement of terminal disulfide in the reduction of protons by an amorphous molybdenum sulfide electrocatalyst. J. Am. Chem. Soc., 2015, 137, 314–321.
[123] Müller, A.; Diemann, E.; Krickemeyer, E.; Walberg, H.J.; Bögge, H.; Armatage, A. [Mo3(IV)S(S2)6]2- from amorphous MoS3 by the reaction with OH- and R= 0.015 strucutre of (NH4)2[Mo3(IV)S(S2)6] Eur. J. Solid State Inorg. Chem., 1993, 30, 565–572.
[124] Onoda, M. Crystal Structures of Columnar Composite Crystals SrxTiS3 (x=1.1-1.2). Nihon Kessho Gakkaishi, 1995, 37, 309–314.
[125] M, S.D.; G, D.; P, C.E. Raman Scattering in Fullerenes. J. Raman Spectrosc., 1996, 27, 351–371.
[126] Rijnsdorp, J.; Jellinek, F. The crystal structure of niobium trisulfide, NbS3. J. Solid State Chem., 1978, 25, 325–328.
[127] Khudorozhko, G.F.; Asanov, I.P.; Mazalov, L.N.; Kravtsova, É.A.; Parygina, G.K.; Fedorov, V.E.; Mironov, Y.V. X-ray photoelectron, emission, and absorption studies of the electronic structure of molybdenum and tungsten trisulfides and their intercalates. J. Struct. Chem., 1994, 35, 823–833.
[128] Tran, P.D.; Tran, T.V.; Orio, M.; Torelli, S.; Truong, Q.D.; Nayuki, K.; Sasaki, Y.; Chiam, S.Y.; Yi, R.; Honma, I.; Barber, J.; Artero, V. Coordination polymer structure and revisited hydrogen evolution catalytic mechanism for amorphous molybdenum sulfide. Nat. Mater., 2016, 15, 640–646.
[129] Li, Y.; Yu, Y.; Huang, Y.; Nielsen, R.A.; Goddard, W.A.; Li, Y.; Cao, L. Engineering the Composition and Crystallinity of Molybdenum Sulfide for High-Performance Electrocatalytic Hydrogen Evolution. ACS Catal., 2015, 5, 448–455.
[130] Baloglou, A.; Ončák, M.; Grutza, M.-L.; van der Linde, C.; Kurz, P.; Beyer, M.K. Structural Properties of Gas Phase Molybdenum Sulfide Clusters [Mo3S13]2-, [HMo3S13]-, and [H3Mo3S13]+ as Model Systems of a Promising Hydrogen Evolution Catalyst. J. Phys. Chem. C, 2019, 123, 8177–8186.
[131] Pan, Y.; Guan, W. Prediction of new stable structure, promising electronic and thermodynamic properties of MoS3: Ab initio calculations. J. Power Sources, 2016, 325, 246–251.
[132] Arrouvel, C.; Toulhoat, H.; Breysse, M.; Raybaud, P. Effects of PH2O, PH2S, PH2 on the surface properties of anatase-TiO2 and γ-Al2O3: a DFT study. J. Catal., 2004, 226, 260–272.
[133] Larmier, K.; Chizallet, C.; Raybaud, P. Tuning the Metal–Support Interaction by Structural Recognition of Cobalt‐Based Catalyst Precursors. Angew. Chem. Int. Ed. Engl., 2015, 54, 6824–6827.
[134] Lippens, B.C.; Boer, J.H. de. Study of phase transformations during calcination of aluminum hydroxides by selected area electron diffraction. Acta Crystallographica, 1964, 17, 1312–1321.
[135] Krokidis, X.; Raybaud, P.; Gobichon, A.-E.; Rebours, B.; Euzen, P.; Toulhoat, H. Theoretical Study of the Dehydration Process of Boehmite to γ-Alumina. J. Phys. Chem. B, 2001, 105, 5121–5130.
[136] Wolverton, C.; Hass, K.C. Phase stability and structure of spinel-based transition aluminas. Phys. Rev. B, 2000, 63, 24102.
[137] Prins, R. Location of the Spinel Vacancies in γ-Al2O3. Angew. Chem. Int. Ed. Engl., 2019, 58, 15548–15552.
Sahu, A. 165
[138] Batista, A.T.; Wisser, D.; Pigeon, T.; Gajan, D.; Diehl, F.; Rivallan, M.; Catita, L.; Gay, A.-S.; Lesage, A.; Chizallet, C.; Raybaud, P. Beyond γ-Al2O3 crystallite surfaces: The hidden features of edges revealed by solid-state 1H NMR and DFT calculations. J. Catal., 2019, 378, 140–143.
[139] Raybaud, P.; Digne, M.; Iftimie, R.; Wellens, W.; Euzen, P.; Toulhoat, H. Morphology and Surface Properties of Boehmite (γ-AlOOH): A Density Functional Theory Study. J. Catal., 2001, 201, 236–246.
[140] Lippens, B.C. Structure and texture of aluminas, April 26, 1961. [141] Santos, P.d.S.; Coelho, A.C.V.; Santos, H.d.S.; Kiyohara, P.K. Hydrothermal synthesis of
well-crystallised boehmite crystals of various shapes. Mat. Res., 2009, 12, 437–445. [142] Tsyganenko, A.A.; Filimonov, V.N. Infrared spectra of surface hydroxyl groups and
crystalline structure of oxides. J. Mol. Struct., 1973, 19, 579–589. [143] Knözinger, H.; Ratnasamy, P. Catalytic Aluminas: Surface Models and Characterization of
Surface Sites. Catal. Rev., 1978, 17, 31–70. [144] Busca, G.; Lorenzelli, V.; Ramis, G.; Willey, R.J. Surface sites on spinel-type and corundum-
type metal oxide powders. Langmuir, 1993, 9, 1492–1499. [145] Ballinger, T.H.; Yates, J.T. IR spectroscopic detection of Lewis acid sites on alumina using
adsorbed carbon monoxide. Correlation with aluminum-hydroxyl group removal. Langmuir, 1991, 7, 3041–3045.
[146] Ohler, N.; Bell, A.T. Study of the Elementary Processes Involved in the Selective Oxidation of Methane over MoOx/SiO2. J. Phys. Chem. B, 2006, 110, 2700–2709.
[147] J.L.G. Fierro. Metal Oxides: Chemistry and applications; CRC PRESS, 2006. [148] Stencel, J.M.; Makovsky, L.E.; Sarkus, T.A.; Vries, J. de; Thomas, R.; Moulijn, J.A. Raman
spectroscopic investigation of the effect of H2O on the molybdenum surface species in MoO3-Al2O3 catalysts. J. Catal., 1984, 90, 314–322.
[149] Hu, H.; Wachs, I.E.; Bare, S.R. Surface Structures of Supported Molybdenum Oxide Catalysts: Characterization by Raman and Mo L3-Edge XANES. J. Phys. Chem., 1995, 99, 10897–10910.
[150] Xiong, G.; Li, C.; Feng, Z.; Ying, P.; Xin, Q.; Liu, J. Surface Coordination Structure of Molybdate with Extremely Low Loading on γ-Alumina Characterized by UV Resonance Raman Spectroscopy. J. Catal., 1999, 186, 234–237.
[151] Desikan, A.N.; Huang, L.; Oyama, S.T. Structure and dispersion of molybdenum oxide supported on alumina and titania. J. Chem. Soc., Faraday Trans., 1992, 88, 3357–3365.
[152] Mestl, G.; Srinivasan, T.K.K. Raman Spectroscopy of Monolayer-Type Catalysts: Supported Molybdenum Oxides. Catal. Rev., 1998, 40, 451–570.
[153] Handzlik, J.; Sautet, P. Structure of Dimeric Molybdenum(VI) Oxide Species on γ-Alumina: A Periodic Density Functional Theory Study. J. Phys. Chem. C, 2010, 114, 19406–19414.
[154] Hamraoui, K.; Cristol, S.; Payen, E.; Paul, J.-F. Computational Investigation of TiO2-Supported Isolated Oxomolybdenum Species. J. Phys. Chem. C, 2007, 111, 3963–3972.
[155] Hamraoui, K.; Cristol, S.; Payen, E.; Paul, J.-F. Structure and reducibility of titania-supported monomeric and dimeric molybdenum oxide entities studied by DFT calculations. J. Mol. Struct. THEOCHEM, 2009, 903, 73–82.
[156] Tougerti, A.; Berrier, E.; Mamede, A.-S.; La Fontaine, C.; Briois, V.; Joly, Y.; Payen, E.; Paul, J.-F.; Cristol, S. Synergy between XANES Spectroscopy and DFT to Elucidate the Amorphous Structure of Heterogeneous Catalysts: TiO2-Supported Molybdenum Oxide Catalysts. Angew. Chem. Int. Ed., 2013, 52, 6440–6444.
[157] Hu, H.; Oliveira de Souza, D.; Berrier, E.; Paul, J.-F.; La Fontaine, C.; Briois, V.; Cristol, S.; Tougerti, A. Investigation of the Reducibility of Supported Oxomolybdate Species for Mapping of Active Centers of Partial Oxidation Reaction: In Situ Mo K-Edge XAS and DFT Study. J. Phys. Chem. C, 2019, 123, 18325–18335.
[158] Kiani, D.; Sourav, S.; Taifan, W.; Calatayud, M.; Tielens, F.; Wachs, I.E.; Baltrusaitis, J. Existence and Properties of Isolated Catalytic Sites on the Surface of β-Cristobalite-Supported, Doped Tungsten Oxide Catalysts (WOx/β-SiO2, Na-WOx/β-SiO2, Mn-WOx/β-SiO2)
Sahu, A. 166
for Oxidative Coupling of Methane (OCM): A Combined Periodic DFT and Experimental Study. ACS Catal., 2020, 10, 4580–4592.
[159] Drake, T.L.; Stair, P.C. Multiwavelength Raman Spectroscopic Characterization of Alumina-Supported Molybdenum Oxide Prepared by Vapor Deposition. Top. Catal., 2017, 60, 1618–1630.
[160] Yu, M.; Qu, W.; Xu, S.; Wang, L.; Liu, B.; Zhang, L.; Peng, J. Interfacial stability, electronic property, and surface reactivity of α-MoO3/γ-Al2O3 composites: DFT and DFT + U calculations. Comput. Mater. Sci., 2018, 153, 217–227.
[161] Marianski, M.; Seo, J.; Mucha, E.; Thomas, D.A.; Jung, S.; Schlögl, R.; Meijer, G.; Trunschke, A.; Helden, G. von. Structural Characterization of Molybdenum Oxide Nanoclusters Using Ion Mobility Spectrometry–Mass Spectrometry and Infrared Action Spectroscopy. J. Phys. Chem. C, 2019, 123, 7845–7853.
[162] Shahrokhi, M.; Raybaud, P.; Le Bahers, T. On the understanding of the optoelectronic properties of S-doped MoO3 and O-doped MoS2 bulk systems: a DFT perspective. J. Mater. Chem. C, 2020, 8, 9064–9074.
[163] Hong, S.; Tiwari, S.; Krishnamoorthy, A.; Nomura, K.; Sheng, C.; Kalia, R.K.; Nakano, A.; Shimojo, F.; Vashishta, P. Sulfurization of MoO3 in the Chemical Vapor Deposition Synthesis of MoS2 Enhanced by an H2S/H2 Mixture. J. Phys. Chem. Lett., 2021, 12, 1997–2003.
[164] Shi, X.-R.; Wang, J.; Hermann, K. Theoretical Cluster Studies on the Catalytic Sulfidation of MoO3. J. Phys. Chem. C, 2010, 114, 6791–6801.
[165] Misawa, M.; Tiwari, S.; Hong, S.; Krishnamoorthy, A.; Shimojo, F.; Kalia, R.K.; Nakano, A.; Vashishta, P. Reactivity of Sulfur Molecules on MoO3 (010) Surface. J. Phys. Chem. Lett., 2017, 8, 6206–6210.
[166] Lai, W.; Xu, Y.; Zhao, Y.; Zheng, J.; Yi, X.; Fang, W. Modeling the kinetics of sulfidation over NiMo/Al2O3 catalyst for thiophene hydrodesulfurization. React. Kinet. Mech. Catal., 2015, 115, 635–649.
[167] Joshi, Y.V.; Ghosh, P.; Daage, M.; Delgass, W.N. Support effects in HDS catalysts: DFT analysis of thiolysis and hydrolysis energies of metal–support linkages. J. Catal., 2008, 257, 71–80.
[168] Topsoe, N.Y.; Topsoe, H. FTIR Studies of Mo/Al2O3-Based Catalysts: I. Morphology and Structure of Calcined and Sulfided Catalysts. J. Catal., 1993, 139, 631–640.
[169] Thijssen, J.M. Computational physics; Cambridge University Press: Cambridge, 2013. [170] Koch, W.; Holthausen, M.C. A Chemist's Guide to Density Functional Theory; Wiley-VCH:
Weinheim, 2015. [171] Frank, J. Introduction to Computational Chemistry; John Wiley & Sons, Inc, 2006. [172] Hohenberg, P.; Kohn, W. Inhomogeneous Electron Gas. Phys. Rev., 1964, 136, B864-B871. [173] Martin, R.M. Electronic Structure: Basic Theory and Practical Methods; Cambridge
University Press: Cambridge, 2004. [174] Kohn, W.; Sham, L.J. Self-Consistent Equations Including Exchange and Correlation
Effects. Phys. Rev., 1965, 140, A1133-A1138. [175] Hafner, J. Ab‐initio simulations of materials using VASP: Density‐functional theory and
beyond. J. Comput. Chem., 2008, 29, 2044–2078. [176] Perdew, J.P.; Burke, K.; Ernzerhof, M. Generalized Gradient Approximation Made Simple.
Phys. Rev. Lett., 1996, 77, 3865–3868. [177] Steinmann, S.N.; Corminboeuf, C. A generalized-gradient approximation exchange hole
model for dispersion coefficients. J. Chem. Phys., 2011, 134, 44117–44122. [178] Steinmann, S.N.; Corminboeuf, C. Comprehensive Benchmarking of a Density-Dependent
Dispersion Correction. J. Chem. Theory Comput., 2011, 7, 3567–3577. [179] Grimme, S. Semiempirical GGA-type density functional constructed with a long-range
dispersion correction. J. Comput. Chem., 2006, 27, 1787–1799.
Sahu, A. 167
[180] Grimme, S.; Antony, J.; Ehrlich, S.; Krieg, H. A consistent and accurate ab initio parametrization of density functional dispersion correction (DFT-D) for the 94 elements H-Pu. J. Chem. Phys., 2010, 132, 154104-15423.
[181] Tkatchenko, A.; Scheffler, M. Accurate Molecular Van Der Waals Interactions from Ground-State Electron Density and Free-Atom Reference Data. Phys. Rev. Lett., 2009, 102, 73005–73009.
[182] Becke, A.D.; Johnson, E.R. Exchange-hole dipole moment and the dispersion interaction: High-order dispersion coefficients. J. Chem. Phys., 2006, 124, 14104.
[183] Vydrov, O.A.; van Voorhis, T. Nonlocal van der Waals density functional: The simpler the better. J. Chem. Phys., 2010, 133, 244103–244112.
[184] Payne, M.C.; Teter, M.P.; Allan, D.C.; Arias, T.A.; Joannopoulos, J.D. Iterative minimization techniques for ab initio total-energy calculations: Molecular dynamics and conjugate gradients. Rev. Mod. Phys., 1992, 64, 1045–1097.
[185] Sholl, D.S.; Steckel, J.A. Density Functional Theory; John Wiley & Sons, Inc: Hoboken, NJ, USA, 2009.
[186] François, X.C. DFT with plane waves, pseudopotentials: Paris, April 2010. [187] Barth, U. von; Gelatt, C.D. Validity of the frozen-core approximation and pseudopotential
theory for cohesive energy calculations. Phys. Rev. B, 1980, 21, 2222–2228. [188] Blöchl, P.E. Projector augmented-wave method. Phys. Rev. B, 1994, 50, 17953–17979. [189] Kühne, T.D. Second generation Car-Parrinello molecular dynamics. WIREs Comput. Mol.
Sci., 2014, 4, 391–406. [190] Paquet, E.; Viktor, H.L.; Atalay, Y. Computational Methods for Ab Initio Molecular
Dynamics. Adv. chem., 2018, 2018, 9839641–9839655. [191] Pick, R.M.; Cohen, M.H.; Martin, R.M. Microscopic Theory of Force Constants in the
Adiabatic Approximation. Phys. Rev. B, 1970, 1, 910–920. [192] Gajdoš, M.; Hummer, K.; Kresse, G.; Furthmüller, J.; Bechstedt, F. Linear optical
properties in the projector-augmented wave methodology. Phys. Rev. B, 2006, 73, 45112. [193] Karhánek, D.; Bučko, T.; Hafner, J. A density-functional study of the adsorption of
methane-thiol on the (111) surfaces of the Ni-group metals: II. Vibrational spectroscopy. J. Phys. Condens. Matter., 2010, 22, 265006–265015.
[194] Brüesch, P. Phonons: Theory and Experiments II: Experiments and Interpretation of Experimental Results; Springer: Berlin, Heidelberg, 1986.
[195] Baroni, S.; Gironcoli, S. de; Dal Corso, A.; Giannozzi, P. Phonons and related crystal properties from density-functional perturbation theory. Rev. Mod. Phys., 2001, 73, 515–562.
[196] Esfarjani, K.; Hashi, Y.; Onoe, J.; Takeuchi, K.; Kawazoe, Y. Vibrational modes and IR analysis of neutral photopolymerized C60 dimers. Phys. Rev. B, 1998, 57, 223–229.
[197] Koopmans, T. Über die Zuordnung von Wellenfunktionen und Eigenwerten zu den Einzelnen Elektronen Eines Atoms. Physica, 1934, 1, 104–113.
[198] Johansson, B.; Mårtensson, N. Core-level binding-energy shifts for the metallic elements. Phys. Rev. B, 1980, 21, 4427–4457.
[199] Köhler, L.; Kresse, G. Density functional study of CO on Rh(111). Phys. Rev. B, 2004, 70, 165405–165414.
[200] Janak, J.F. Proof that ∂E/∂ni= ε in density-functional theory. Phys. Rev. B, 1978, 18, 7165–7168.
[201] Lizzit, S.; Baraldi, A.; Groso, A.; Reuter, K.; Ganduglia-Pirovano, M.V.; Stampfl, C.; Scheffler, M.; Stichler, M.; Keller, C.; Wurth, W.; Menzel, D. Surface core-level shifts of clean and oxygen-covered Ru(0001). Phys. Rev. B, 2001, 63, 205419–205433.
[202] Pueyo Bellafont, N.; Viñes, F.; Hieringer, W.; Illas, F. Predicting core level binding energies shifts: Suitability of the projector augmented wave approach as implemented in VASP. J. Comput. Chem., 2017, 38, 518–522.
[203] Henkelman, G.; Jóhannesson, G.; Jónsson, H. Methods for Finding Saddle Points and Minimum Energy Paths, 269–302.
Sahu, A. 168
[204] Arrhenius, S. Über die Dissociationswärme und den Einfluss der Temperatur auf den Dissociationsgrad der Elektrolyte. Zeitschrift für Physikalische Chemie, 1889, 4U, 96–116.
[205] Eyring, H. The Activated Complex in Chemical Reactions. J. Chem. Phys., 1935, 3, 107–115.
[206] Evans, M.G.; Polanyi, M. Some applications of the transition state method to the calculation of reaction velocities, especially in solution. Transactions of the Faraday Society, 1935, 31, 875–894.
[207] Henkelman, G.; Jónsson, H. Improved tangent estimate in the nudged elastic band method for finding minimum energy paths and saddle points. J. Chem. Phys., 2000, 113, 9978–9985.
[208] Sheppard, D.; Terrell, R.; Henkelman, G. Optimization methods for finding minimum energy paths. J. Chem. Phys., 2008, 128, 134106–134116.
[209] Henkelman, G.; Uberuaga, B.P.; Jónsson, H. A climbing image nudged elastic band method for finding saddle points and minimum energy paths. J. Chem. Phys., 2000, 113, 9901–9904.
[210] Fukui, K. Formulation of the reaction coordinate. J. Phys. Chem., 1970, 74, 4161–4163. [211] Fukui, K. The path of chemical reactions - the IRC approach. Acc. Chem. Res., 1981, 14,
363–368. [212] Olsen, R.A.; Kroes, G.J.; Henkelman, G.; Arnaldsson, A.; Jónsson, H. Comparison of
methods for finding saddle points without knowledge of the final states. J. Chem. Phys., 2004, 121, 9776–9792.
[213] Heyden, A.; Bell, A.T.; Keil, F.J. Efficient methods for finding transition states in chemical reactions: Comparison of improved dimer method and partitioned rational function optimization method. J. Chem. Phys., 2005, 123, 224101–224115.
[214] Deng, L.; Ziegler, T. The determination of intrinsic reaction coordinates by density functional theory. Int. J. Quantum Chem., 1994, 52, 731–765.
[215] Deng, L.; Ziegler, T.; Fan, L. A combined density functional and intrinsic reaction coordinate study on the ground state energy surface of H2CO. J. Chem. Phys., 1993, 99, 3823–3835.
[216] Cattaneo, R.; Weber, T.; Shido, T.; Prins, R. A Quick EXAFS Study of the Sulfidation of NiMo/SiO2 Hydrotreating Catalysts Prepared with Chelating Ligands. J. Catal., 2000, 191, 225–236.
[217] Rochet, A.; Baubet, B.; Moizan, V.; Devers, E.; Hugon, A.; Pichon, C.; Payen, E.; Briois, V. Intermediate Species Revealed during Sulfidation of Bimetallic Hydrotreating Catalyst: A Multivariate Analysis of Combined Time-Resolved Spectroscopies. J. Phys. Chem. C, 2017, 121, 18544–18556.
[218] Arnoldy, P.; van den Heijkant, J.; Bok, G.D. de; Moulijn, J.A. Temperature-programmed sulfiding of MoO3Al2O3 catalysts. J. Catal., 1985, 92, 35–55.
[219] Cattaneo, R.; Rota, F.; Prins, R. An XAFS Study of the Different Influence of Chelating Ligands on the HDN and HDS of γ-Al2O3-Supported NiMo Catalysts. J. Catal., 2001, 199, 318–327.
[220] Sahu, A.; Steinmann, S.N.; Raybaud, P. Size-Dependent Structural, Energetic, and Spectroscopic Properties of MoS3 Polymorphs. Crystal Growth & Design, 2020, 20, 7750–7760.
[221] Baubet, B.; Girleanu, M.; Gay, A.-S.; Taleb, A.-L.; Moreaud, M.; Wahl, F.; Delattre, V.; Devers, E.; Hugon, A.; Ersen, O.; Afanasiev, P.; Raybaud, P. Quantitative Two-Dimensional (2D) Morphology–Selectivity Relationship of CoMoS Nanolayers: A Combined High-Resolution High-Angle Annular Dark Field Scanning Transmission Electron Microscopy (HR HAADF-STEM) and Density Functional Theory (DFT) Study. ACS Catal., 2016, 6, 1081–1092.
[222] Rochet, A.; Baubet, B.; Moizan, V.; Devers, E.; Hugon, A.; Pichon, C.; Payen, E.; Briois, V. Influence of the Preparation Conditions of Oxidic NiMo/Al2O3 Catalysts on the Sulfidation

Sahu, A. 169
Ability: A Quick-XAS and Raman Spectroscopic Study. J. Phys. Chem. C, 2015, 119, 23928–23942.
[223] Hardcastle, F.D.; Wachs, I.E. Determination of molybdenum–oxygen bond distances and bond orders by Raman spectroscopy. J. Raman Spectrosc., 1990, 21, 683–691.
[224] Cornac, M.; Janin, A.; Lavalley, J.C. Structure of Mo catalysts supported on silica: IR and gravimetric results. Polyhedron, 1986, 5, 183–186.
[225] Y. Jacquin, J.P. Franck, G. Goubin, A. Elchenberger. 06/19/1985 Patent EP 0064429 B2. [226] van Haandel, L.; Bremmer, G.M.; Hensen, E.; Weber, T. Influence of sulfiding agent and
pressure on structure and performance of CoMo/Al2O3 hydrodesulfurization catalysts. J. Catal., 2016, 342, 27–39.
[227] Eijsbouts, S.; van den Oetelaar, L.C.A.; Louwen, J.N.; van Puijenbroek, R.R.; van Leerdam, G.C. Changes of MoS2 Morphology and the Degree of Co Segregation during the Sulfidation and Deactivation of Commercial Co−Mo/Al2O3 Hydroprocessing Catalysts. Industrial & Engineering Chemistry Research, 2007, 46, 3945–3954.
[228] Frizi, N.; Blanchard, P.; Payen, E.; Baranek, P.; Lancelot, C.; Rebeilleau, M.; Dupuy, C.; Dath, J.P. Genesis of new gas oil HDS catalysts: Study of their liquid phase sulfidation. Catal. Today, 2008, 130, 32–40.
[229] Paul, J.-F.; Cristol, S.; Payen, E. Computational studies of (mixed) sulfide hydrotreating catalysts. Catal. Today, 2008, 130, 139–148.
[230] Arancon, R.; Saab, M.; Morvan, A.; Bonduelle-Skrzypczak, A.; Taleb, A.-L.; Gay, A.-S.; Legens, C.; Ersen, O.; Searles, K.; Mougel, V.; Fedorov, A.; Copéret, C.; Raybaud, P. Combined Experimental and Theoretical Molecular Approach of the Catalytically Active Hydrotreating MoS2 Phases Promoted by 3d Transition Metals. J. Phys. Chem. C, 2019, 123, 24659–24669.
[231] Yamamoto, K.; Chan, K.W.; Mougel, V.; Nagae, H.; Tsurugi, H.; Safonova, O.V.; Mashima, K.; Copéret, C. Silica-supported isolated molybdenum di-oxo species: formation and activation with organosilicon agent for olefin metathesis. Chem. Comm., 2018, 54, 3989–3992.
[232] Kresse, G.; Hafner, J. Ab initio molecular dynamics for liquid metals. Phys. Rev. B, 1993, 47, 558–561.
[233] Kresse, G.; Furthmüller, J. Efficient iterative schemes for ab initio total-energy calculations using a plane-wave basis set. Phys. Rev. B, 1996, 54, 11169–11186.
[234] Kresse, G.; Furthmüller, J. Efficiency of ab-initio total energy calculations for metals and semiconductors using a plane-wave basis set. Comput. Mater. Sci., 1996, 6, 15–50.
[235] Kresse, G.; Joubert, D. From ultrasoft pseudopotentials to the projector augmented-wave method. Phys. Rev. B, 1999, 59, 1758–1775.
[236] Paul Fleurat-Lessard. Opt'n Path. http://pfleurat.free.fr/ReactionPath.php. [237] Angnes, R.A. mechaSVG. https://github.com/ricalmang/mechaSVG. [238] Genuit, D.; Bezverkhyy, I.; Afanasiev, P. Solution preparation of the amorphous
molybdenum oxysulfide MoOS2 and its use for catalysis. J. Solid State Chem., 2005, 178, 2759–2765.
[239] Kozuch, S.; Shaik, S. How to Conceptualize Catalytic Cycles? The Energetic Span Model. Acc. Chem. Res., 2011, 44, 101–110.
[240] Merki, D.; Fierro, S.; Vrubel, H.; Hu, X. Amorphous molybdenum sulfide films as catalysts for electrochemical hydrogen production in water. Chem. Sci., 2011, 2, 1262–1267.
[241] Tang, M.L.; Grauer, D.C.; Lassalle‐Kaiser, B.; Yachandra, V.K.; Amirav, L.; Long, J.R.; Yano, J.; A, P.A. Structural and Electronic Study of an Amorphous MoS3 Hydrogen‐Generation Catalyst on a Quantum‐Controlled Photosensitizer. Angew. Chem. Int. Ed. Engl., 2011, 50, 10203–10207.
[242] Matsuyama, T.; Hayashi, A.; Ozaki, T.; Mori, S.; Tatsumisago, M. Electrochemical properties of all-solid-state lithium batteries with amorphous MoS3 electrodes prepared by mechanical milling. J. Mater. Chem. A, 2015, 3, 14142–14147.
Sahu, A. 170
[243] Fu, W.; Yang, S.; Yang, H.; Guo, B.; Huang, Z. 2D amorphous MoS3 nanosheets with porous network structures for scavenging toxic metal ions from synthetic acid mine drainage. J. Mater. Chem. A, 2019, 7, 18799–18806.
[244] Slater, J.C. Statistical Exchange-Correlation in the Self-Consistent Field. Adv. Quantum Chem., 6, 1–92.
[245] Ansari, R.; Malakpour, S.; Faghihnasiri, M.; Sahmani, S. An ab initio investigation into the elastic, structural and electronic properties of MoS2 nanotubes. Superlattice Microst., 2015, 82, 188–200.
[246] Chou, S.S.; Sai, N.; Lu, P.; Coker, E.N.; Liu, S.; Artyushkova, K.; Luk, T.S.; Kaehr, B.; Brinker, C.J. Understanding catalysis in a multiphasic two-dimensional transition metal dichalcogenide. Nat. Commun., 2015, 6, 8311–8319.
[247] C. Sourrisseau; R.Cavagnat; M. Fouassier, and P. Maraval. Electronic, vibrational and resonance Raman spectra of the layered semiconducting compound NbS3. J. Raman Spectrosc., 1990, 21, 337–349.
[248] Lauritsen, J.V.; Kibsgaard, J.; Helveg, S.; Topsøe, H.; Clausen, B.S.; Lægsgaard, E.; Besenbacher, F. Size-dependent structure of MoS2 nanocrystals. Nature Nanotech., 2007, 2, 53–58.
[249] Kan, M.; Wang, J.Y.; Li, X.W.; Zhang, S.H.; Li, Y.W.; Kawazoe, Y.; Sun, Q.; Jena, P. Structures and Phase Transition of a MoS2 Monolayer. J. Phys. Chem. C, 2014, 118, 1515–1522.
[250] Huang, Q.; Li, X.; Sun, M.; Zhang, L.; Song, C.; Zhu, L.; Chen, P.; Xu, Z.; Wang, W.; Bai, X. The Mechanistic Insights into the 2H-1T Phase Transition of MoS2 upon Alkali Metal Intercalation: From the Study of Dynamic Sodiation Processes of MoS2 Nanosheets. Adv. Mater. Interfaces, 2017, 4, 1700171–1700177.
[251] Zhu, J.; Wang, Z.; Yu, H.; Li, N.; Zhang, J.; Meng, J.; Liao, M.; Zhao, J.; Lu, X.; Du, L.; Yang, R.; Shi, D.; Jiang, Y.; Zhang, G. Argon Plasma Induced Phase Transition in Monolayer MoS2. J. Am. Chem. Soc., 2017, 139, 10216–10219.
[252] Huang, H.H.; Fan, X.; Singh, D.J.; Zheng, W.T. First principles study on 2H-1T' transition in MoS2 with copper. Phys. Chem. Chem. Phys., 2018, 20, 26986–26994.
[253] Oumahi, C.; Barros-Bouchet, M.I. de; Le Mogne, T.; Charrin, C.; Loridant, S.; Geantet, C.; Afanasiev, P.; Thiebaut, B. MoS2 formation induced by amorphous MoS3 species under lubricated friction. RSC Adv., 2018, 8, 25867–25872.
[254] Wang, Z. 2H → 1T′ phase transformation in Janus monolayer MoSSe and MoSTe: An efficient hole injection contact for 2H-MoS2. J. Mater. Chem. C, 2018, 6, 13000–13005.
[255] Jin, Q.; Liu, N.; Chen, B.; Mei, D. Mechanisms of Semiconducting 2H to Metallic 1T Phase Transition in Two-dimensional MoS2 Nanosheets. J. Phys. Chem. C, 2018, 122, 28215–28224.
[256] Xia, Z.; Tao, Y.; Pan, Z.; Shen, X. Enhanced photocatalytic performance and stability of 1T MoS2 transformed from 2H MoS2 via Li intercalation. Results Phys., 2019, 12, 2218–2224.
[257] McQuarrie, D.A. Statistical mechanics; Harper & Row: New York, London, 1976.


Appendix A - Thermochemistry
To check the effect of thermal and zero-point energy corrections, we also incorporate the
vibrational entropy contribution and thermal corrections. We assume the rotational and
translational degree of freedom will not affect the energetics significantly, so we only take into
account the vibrational contribution for the clusters and periodic systems. Furthermore, the
equations described here assumes the system is noninteracting. This approximation will
introduce some errors based on how far the studied system is from the ideal one. Besides that,
the system is assumed to have remained in its ground state. As we know from classical
thermochemistry, the free energy can be represented in terms of internal energy of the system
and entropy contribution:
𝚫𝑮 = 𝚫𝑼 − 𝑻𝚫𝑺 A- 1
Where Δ𝑈 includes the sum of electronic energy and zero-point energy correction (ZPE), we
calculate the ZPE from the sum of all the vibrational modes within the harmonic
approximation at 0K.
𝚫𝑮 = 𝚫𝑬𝒊𝒏𝒕 + 𝒁𝑷𝑽𝑬 − 𝑻𝚫𝑺𝒗𝒊𝒃 A- 2
As we are not considering the electronic, rotational, and translational degree of freedom; we
only consider the vibrational entropy term and can be computed from the following
expression:
𝑺𝒗𝒊𝒃 = 𝑹 𝚺𝒏 (
𝒙𝒏
𝒆𝒙𝒏 − 𝟏− 𝐥𝐧(𝟏 − 𝒆𝒙𝒏 )) A- 3
Here, 𝑥𝑛 = ℎ𝑐𝜈𝑛/𝑘𝑇, for the nth vibrational mode.[257]
Partition function (Q) is a function of state variables such as temperature and volume, which
describes the statistical behavior of the system at thermodynamic equilibrium.
The internal energy of the system can be written in terms of partition function as:
Thermochemistry
Sahu, A. 173
𝑼 − 𝑼(𝟎) = 𝑵𝒌𝑩𝑻𝟐 (
𝝏 𝒍𝒏 𝑸
𝝏𝑻)
𝒗 A- 4
And the entropy of the system can be written as:
𝑺 =
𝑼 − 𝑼(𝟎)
𝑻+ 𝒌 𝒍𝒏 𝑸 A- 5
The enthalpy and Gibbs energy of the system is defined as 𝐻 = 𝑈 + 𝑝𝑉 and 𝐺 = 𝐻 − 𝑇𝑆,
respectively.
We can write G in term of Helmholtz energy as 𝐺 = 𝑈 + 𝑝𝑉 − 𝑇𝑆.
The entropy of the system could be determined using the partition function:
𝑺 = 𝑵𝒌𝑩 + 𝑵𝒌𝑩 𝒍𝒏 (
𝒒(𝑽, 𝑻)
𝑵) + 𝑵𝒌𝑩𝑻 (
𝝏 𝒍𝒏 𝒒
𝝏𝑻)
𝑽
A- 6
𝑺 = 𝑵𝒌𝑩 (𝒍𝒏 (
𝒒(𝑽, 𝑻)
𝑵) + 𝑻 (
𝝏 𝒍𝒏 𝒒
𝝏𝑻)
𝑽)
A- 7
Suppose we assume that all the modes of the motions are independent of each other, such as
rotational, vibration, translational and electronic. Then, the total partition function could be
written as the product of an individual partition function.
𝒒 = 𝜮𝒊𝒆
−𝜷𝝐𝒊 = 𝜮𝒊∈𝒂𝒍𝒍 𝒔𝒕𝒂𝒕𝒆𝒔𝒆−𝜷𝝐𝒊𝑻−𝜷𝝐𝒊
𝑹−𝜷𝝐𝒊𝑽−𝜷𝝐𝒊
𝑬 A- 8
Herein, we assume the rotational and translational would be negligible as compare to
vibrational contribution.
Therefore, within the framework of harmonic approximation, we can write the partition
function as:
𝒒 ≈ 𝒒𝒗 = 𝜫𝒏
𝒆−
𝒉𝝂𝒏𝒌𝑩𝑻
𝟏 − 𝒆𝒉𝝂𝒏𝒌𝑩𝑻
A- 9
Thermochemistry
Sahu, A. 174
Here, n is the number of vibrational modes, ℎ Planck’s constant, 𝜈 frequency of vibrational
mode. Now the vibrational entropy of the system could be written as:
𝑺𝒗𝒊𝒃 = 𝑵𝑨𝒌𝑩 (𝒍𝒏 𝒒𝒗 + 𝑻 (
𝝏𝒒
𝝏𝑻)
𝒗) A- 10
𝑺𝒗𝒊𝒃 = 𝑵𝑨𝒌𝑩 𝜮𝒏 (
𝒉𝒗𝒏/𝒌𝑩𝑻
𝒆𝒉𝒄𝝂𝒏/𝒌𝑩𝑻 − 𝟏− 𝒍𝒏(𝟏 − 𝒆−𝒉𝝂𝒏/𝒌𝑩𝑻)) A- 11
Contribution to internal energy obtained from molecular vibration:
𝑼𝒗𝒊𝒃 = 𝑵𝑨𝒌𝑩 𝜮𝒏𝒉𝝂𝒏/𝒌𝑩𝑻 (
𝟏
𝟐+
𝟏
𝒆𝒉𝒗𝒏/𝒌𝑩𝑻 − 𝟏) A- 12
Zero-point energy has been calculated as the sum over energies of all the vibrational modes.
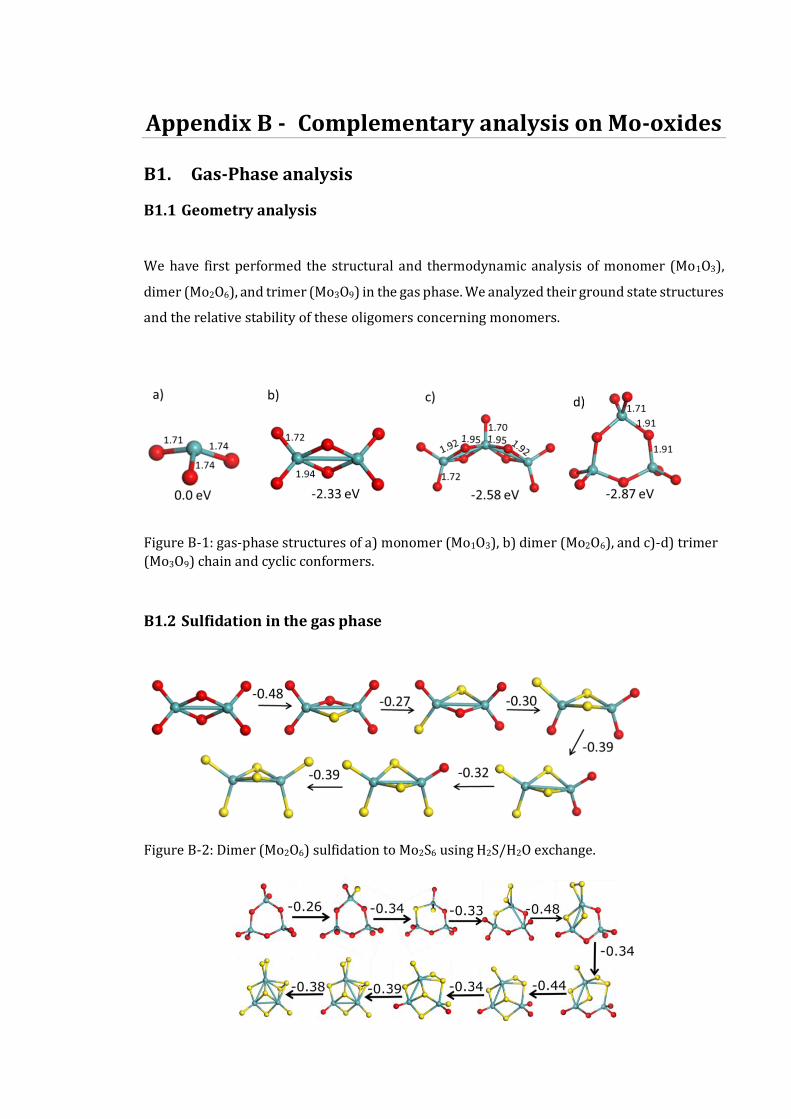
Appendix B - Complementary analysis on Mo-oxides
B1. Gas-Phase analysis
B1.1 Geometry analysis
We have first performed the structural and thermodynamic analysis of monomer (Mo1O3),
dimer (Mo2O6), and trimer (Mo3O9) in the gas phase. We analyzed their ground state structures
and the relative stability of these oligomers concerning monomers.
Figure B-1: gas-phase structures of a) monomer (Mo1O3), b) dimer (Mo2O6), and c)-d) trimer
(Mo3O9) chain and cyclic conformers.
B1.2 Sulfidation in the gas phase
Figure B-2: Dimer (Mo2O6) sulfidation to Mo2S6 using H2S/H2O exchange.
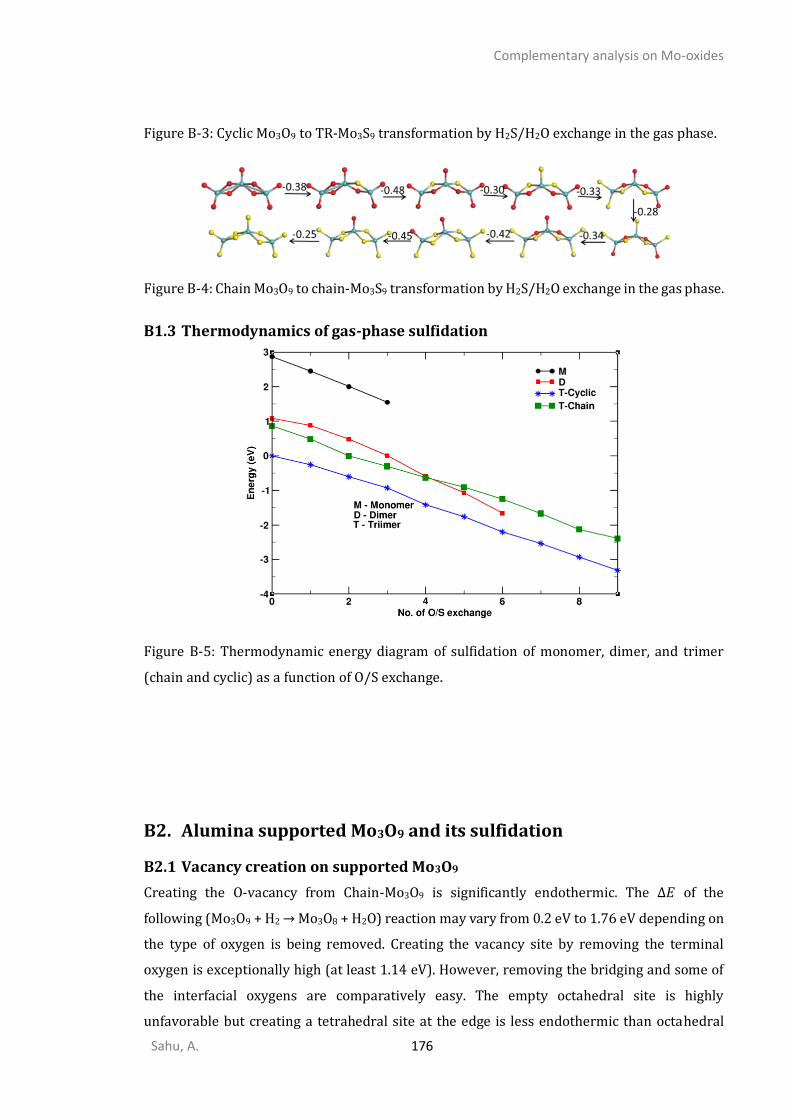
Complementary analysis on Mo-oxides
Sahu, A. 176
Figure B-3: Cyclic Mo3O9 to TR-Mo3S9 transformation by H2S/H2O exchange in the gas phase.
Figure B-4: Chain Mo3O9 to chain-Mo3S9 transformation by H2S/H2O exchange in the gas phase.
B1.3 Thermodynamics of gas-phase sulfidation
Figure B-5: Thermodynamic energy diagram of sulfidation of monomer, dimer, and trimer
(chain and cyclic) as a function of O/S exchange.
B2. Alumina supported Mo3O9 and its sulfidation
B2.1 Vacancy creation on supported Mo3O9
Creating the O-vacancy from Chain-Mo3O9 is significantly endothermic. The Δ𝐸 of the
following (Mo3O9 + H2 → Mo3O8 + H2O) reaction may vary from 0.2 eV to 1.76 eV depending on
the type of oxygen is being removed. Creating the vacancy site by removing the terminal
oxygen is exceptionally high (at least 1.14 eV). However, removing the bridging and some of
the interfacial oxygens are comparatively easy. The empty octahedral site is highly
unfavorable but creating a tetrahedral site at the edge is less endothermic than octahedral
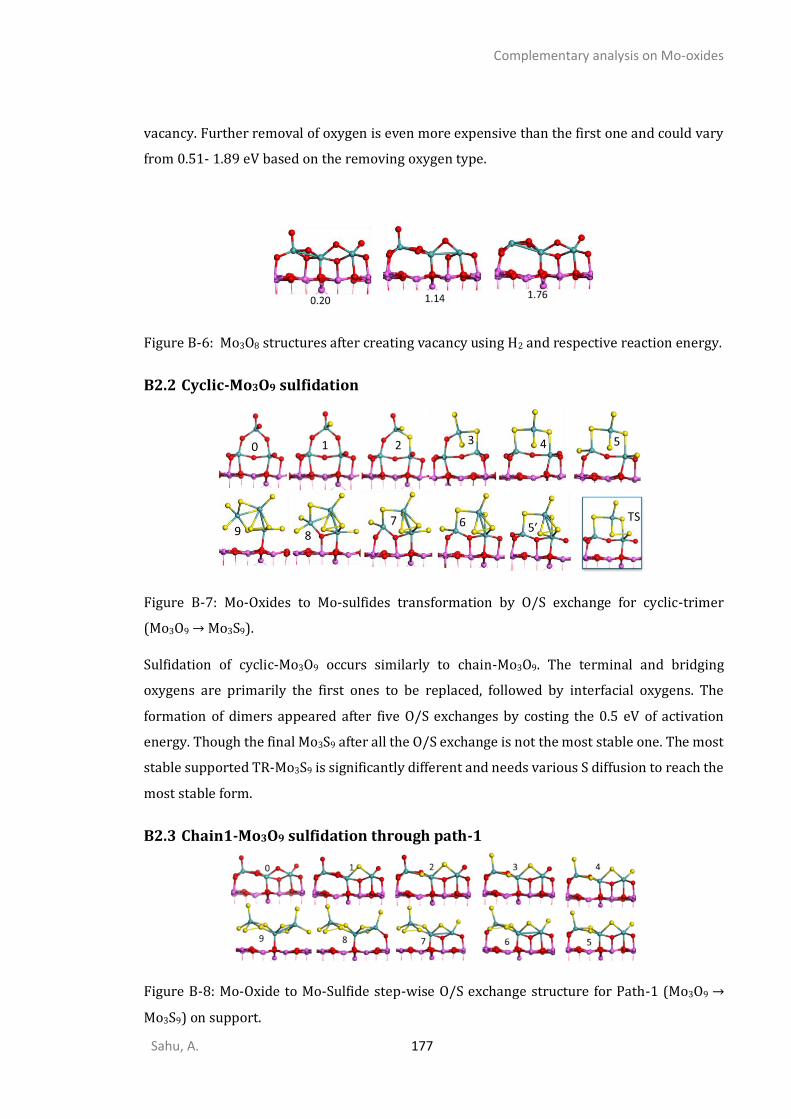
Complementary analysis on Mo-oxides
Sahu, A. 177
vacancy. Further removal of oxygen is even more expensive than the first one and could vary
from 0.51- 1.89 eV based on the removing oxygen type.
Figure B-6: Mo3O8 structures after creating vacancy using H2 and respective reaction energy.
B2.2 Cyclic-Mo3O9 sulfidation
Figure B-7: Mo-Oxides to Mo-sulfides transformation by O/S exchange for cyclic-trimer
(Mo3O9 → Mo3S9).
Sulfidation of cyclic-Mo3O9 occurs similarly to chain-Mo3O9. The terminal and bridging
oxygens are primarily the first ones to be replaced, followed by interfacial oxygens. The
formation of dimers appeared after five O/S exchanges by costing the 0.5 eV of activation
energy. Though the final Mo3S9 after all the O/S exchange is not the most stable one. The most
stable supported TR-Mo3S9 is significantly different and needs various S diffusion to reach the
most stable form.
B2.3 Chain1-Mo3O9 sulfidation through path-1
Figure B-8: Mo-Oxide to Mo-Sulfide step-wise O/S exchange structure for Path-1 (Mo3O9 →
Mo3S9) on support.
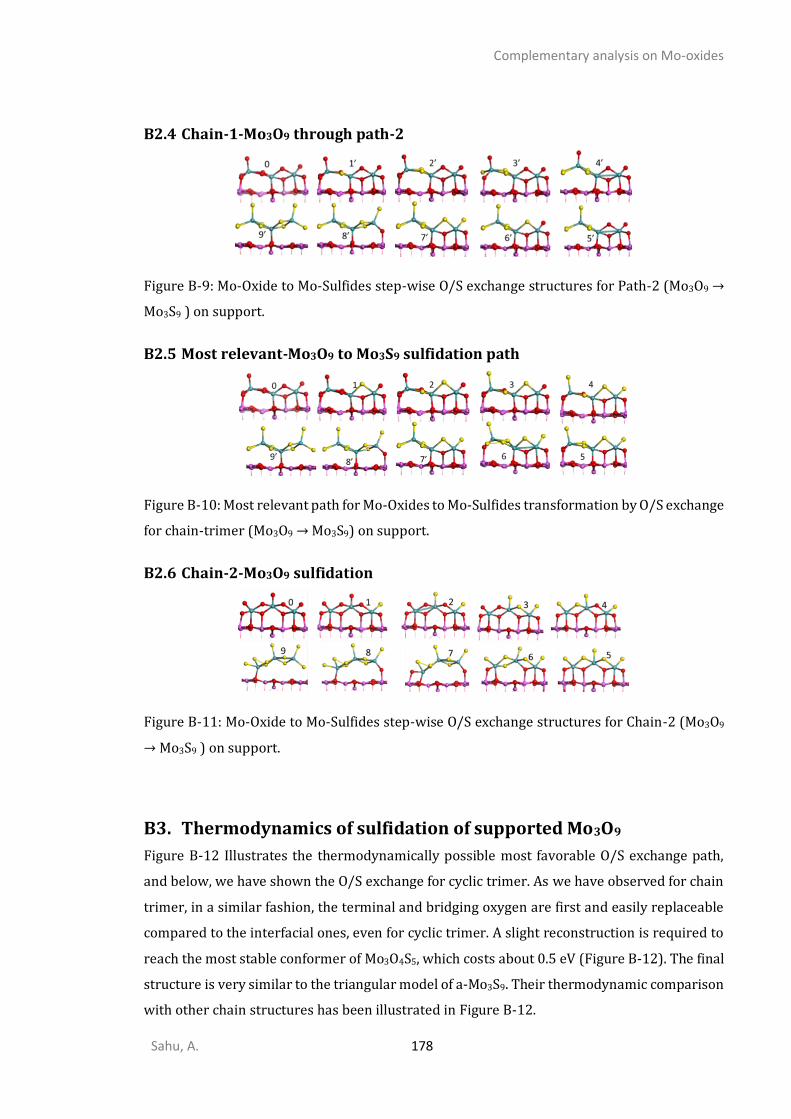
Complementary analysis on Mo-oxides
Sahu, A. 178
B2.4 Chain-1-Mo3O9 through path-2
Figure B-9: Mo-Oxide to Mo-Sulfides step-wise O/S exchange structures for Path-2 (Mo3O9 →
Mo3S9 ) on support.
B2.5 Most relevant-Mo3O9 to Mo3S9 sulfidation path
Figure B-10: Most relevant path for Mo-Oxides to Mo-Sulfides transformation by O/S exchange
for chain-trimer (Mo3O9 → Mo3S9) on support.
B2.6 Chain-2-Mo3O9 sulfidation
Figure B-11: Mo-Oxide to Mo-Sulfides step-wise O/S exchange structures for Chain-2 (Mo3O9
→ Mo3S9 ) on support.
B3. Thermodynamics of sulfidation of supported Mo3O9
Figure B-12 Illustrates the thermodynamically possible most favorable O/S exchange path,
and below, we have shown the O/S exchange for cyclic trimer. As we have observed for chain
trimer, in a similar fashion, the terminal and bridging oxygen are first and easily replaceable
compared to the interfacial ones, even for cyclic trimer. A slight reconstruction is required to
reach the most stable conformer of Mo3O4S5, which costs about 0.5 eV (Figure B-12). The final
structure is very similar to the triangular model of a-Mo3S9. Their thermodynamic comparison
with other chain structures has been illustrated in Figure B-12.
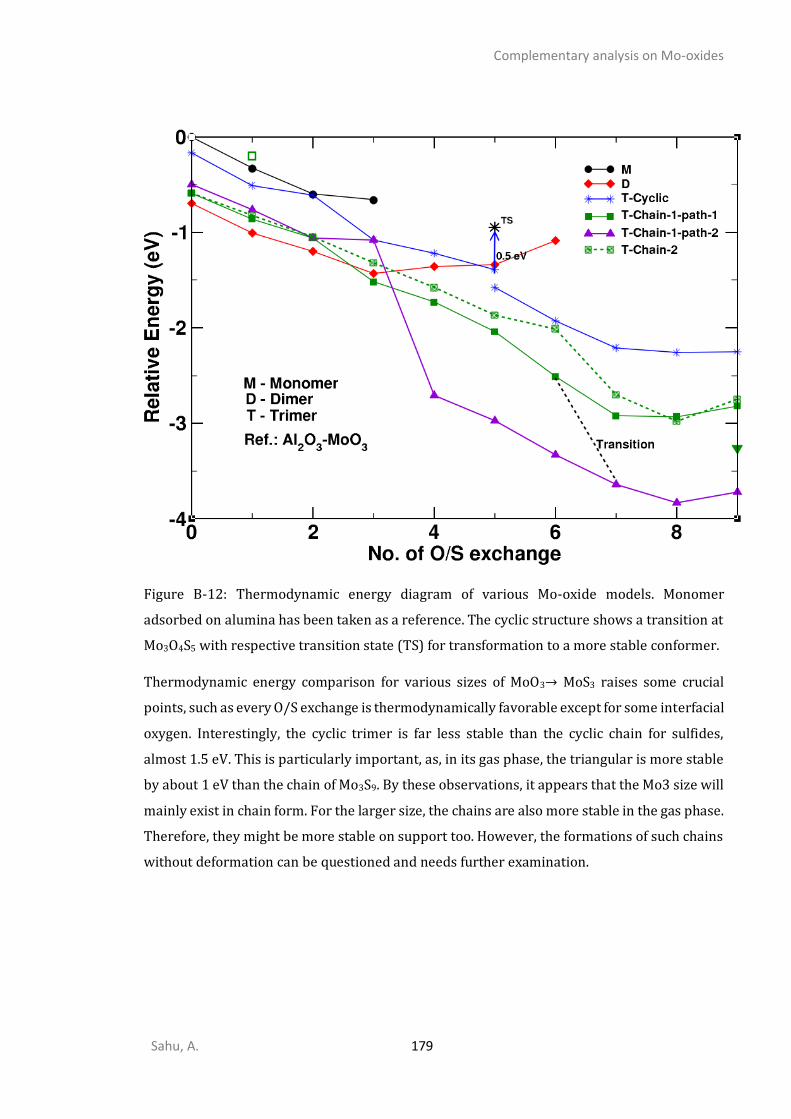
Complementary analysis on Mo-oxides
Sahu, A. 179
Figure B-12: Thermodynamic energy diagram of various Mo-oxide models. Monomer
adsorbed on alumina has been taken as a reference. The cyclic structure shows a transition at
Mo3O4S5 with respective transition state (TS) for transformation to a more stable conformer.
Thermodynamic energy comparison for various sizes of MoO3→ MoS3 raises some crucial
points, such as every O/S exchange is thermodynamically favorable except for some interfacial
oxygen. Interestingly, the cyclic trimer is far less stable than the cyclic chain for sulfides,
almost 1.5 eV. This is particularly important, as, in its gas phase, the triangular is more stable
by about 1 eV than the chain of Mo3S9. By these observations, it appears that the Mo3 size will
mainly exist in chain form. For the larger size, the chains are also more stable in the gas phase.
Therefore, they might be more stable on support too. However, the formations of such chains
without deformation can be questioned and needs further examination.
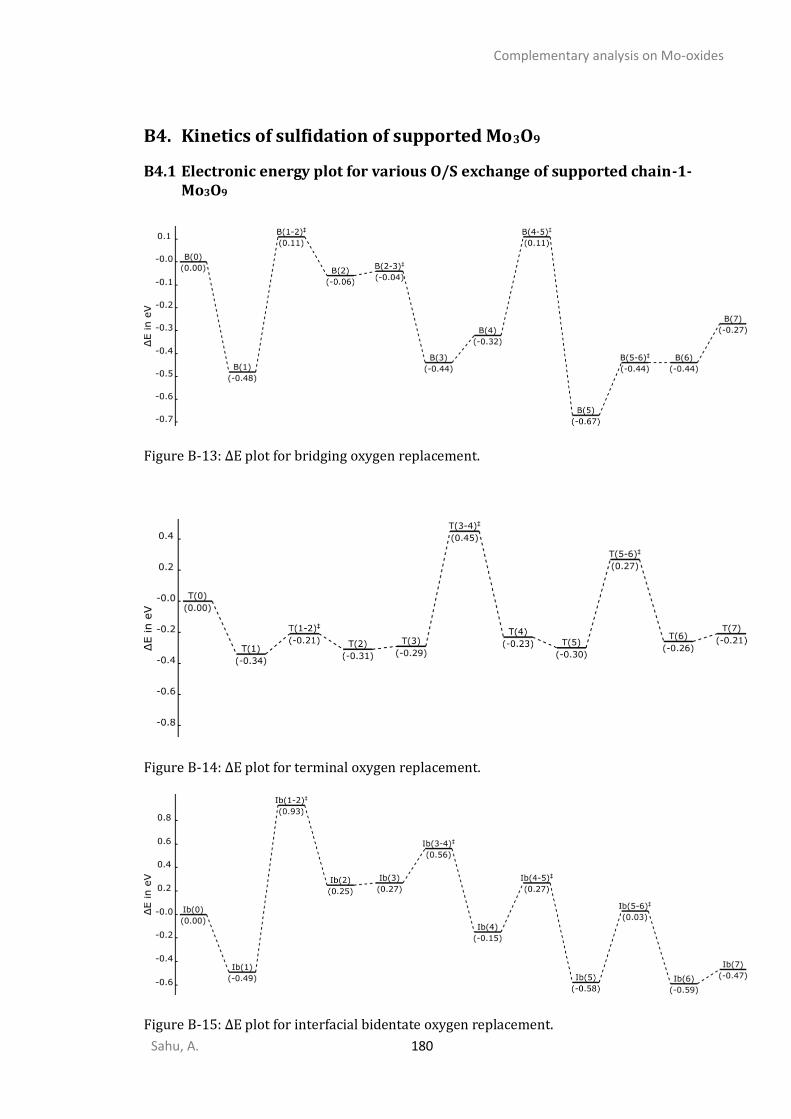
Complementary analysis on Mo-oxides
Sahu, A. 180
B4. Kinetics of sulfidation of supported Mo3O9
B4.1 Electronic energy plot for various O/S exchange of supported chain-1-Mo3O9
Figure B-13: ΔE plot for bridging oxygen replacement.
Figure B-14: ΔE plot for terminal oxygen replacement.
Figure B-15: ΔE plot for interfacial bidentate oxygen replacement.
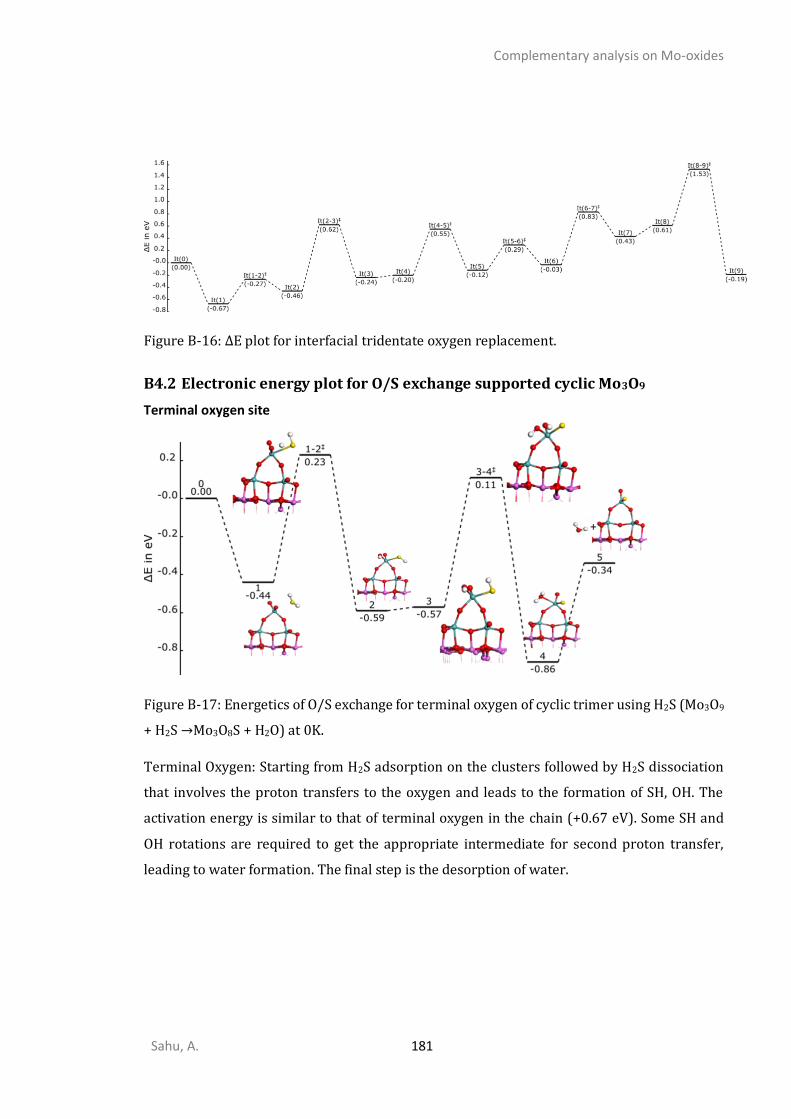
Complementary analysis on Mo-oxides
Sahu, A. 181
Figure B-16: ΔE plot for interfacial tridentate oxygen replacement.
B4.2 Electronic energy plot for O/S exchange supported cyclic Mo3O9
Terminal oxygen site
Figure B-17: Energetics of O/S exchange for terminal oxygen of cyclic trimer using H2S (Mo3O9
+ H2S →Mo3O8S + H2O) at 0K.
Terminal Oxygen: Starting from H2S adsorption on the clusters followed by H2S dissociation
that involves the proton transfers to the oxygen and leads to the formation of SH, OH. The
activation energy is similar to that of terminal oxygen in the chain (+0.67 eV). Some SH and
OH rotations are required to get the appropriate intermediate for second proton transfer,
leading to water formation. The final step is the desorption of water.
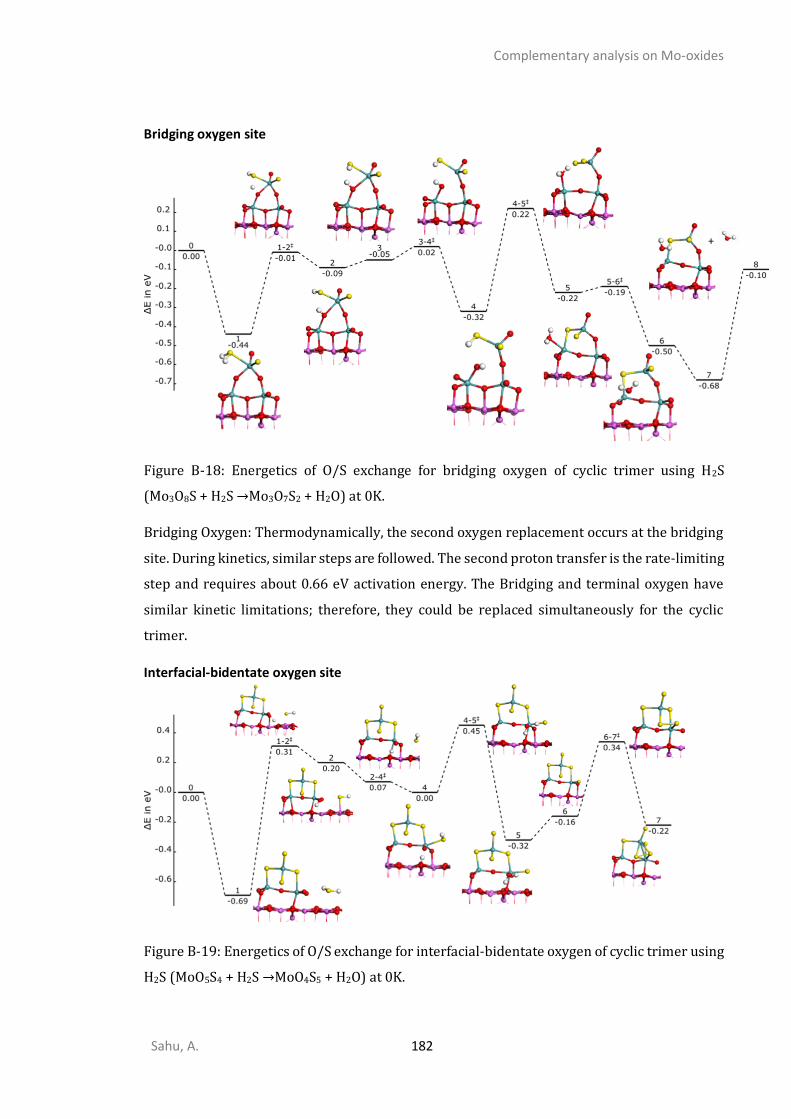
Complementary analysis on Mo-oxides
Sahu, A. 182
Bridging oxygen site
Figure B-18: Energetics of O/S exchange for bridging oxygen of cyclic trimer using H2S
(Mo3O8S + H2S →Mo3O7S2 + H2O) at 0K.
Bridging Oxygen: Thermodynamically, the second oxygen replacement occurs at the bridging
site. During kinetics, similar steps are followed. The second proton transfer is the rate-limiting
step and requires about 0.66 eV activation energy. The Bridging and terminal oxygen have
similar kinetic limitations; therefore, they could be replaced simultaneously for the cyclic
trimer.
Interfacial-bidentate oxygen site
Figure B-19: Energetics of O/S exchange for interfacial-bidentate oxygen of cyclic trimer using
H2S (MoO5S4 + H2S →MoO4S5 + H2O) at 0K.

Complementary analysis on Mo-oxides
Sahu, A. 183
Interfacial bidentate: As in the case of chain IB replacement, the adsorption of H2S takes place
on support. Dissociation of H2S requires about 1 eV, and the rate-limiting step is the second
proton transfer. The energy needed for activation is about 1.14 eV, which is significantly lower
than the energy of the interfacial bidentate chain, approximately 1.42 eV. The desorption is
relatively easy as the water remains on the cluster and does not move to the surface for the
interfacial bidentate chain. Finally, a slight reconstruction of am oxysulfide cluster leads to a
stabler conformer.
Interfacial tridentate oxygen sites
Figure B-20: Energetics of O/S exchange for interfacial tridentate oxygen of cyclic trimer using
H2S (Mo3OS8 + H2S →Mo3S9 + H2O) at 0K.
Interfacial tridentate: These are the most challenging oxygen to be replaced. The activation of
H2S takes place on the surface. The earlier steps are not as expensive as water desorption and
sulfur diffusion> This is similar to the case of the interfacial tridentate chain. The water
desorption step is the second most costly step after sulfur diffusion. Water desorption
requires 1.7 eV and reconstruction >2.5 eV, though entropy correction could change the order
as in the interfacial tridentate chain.
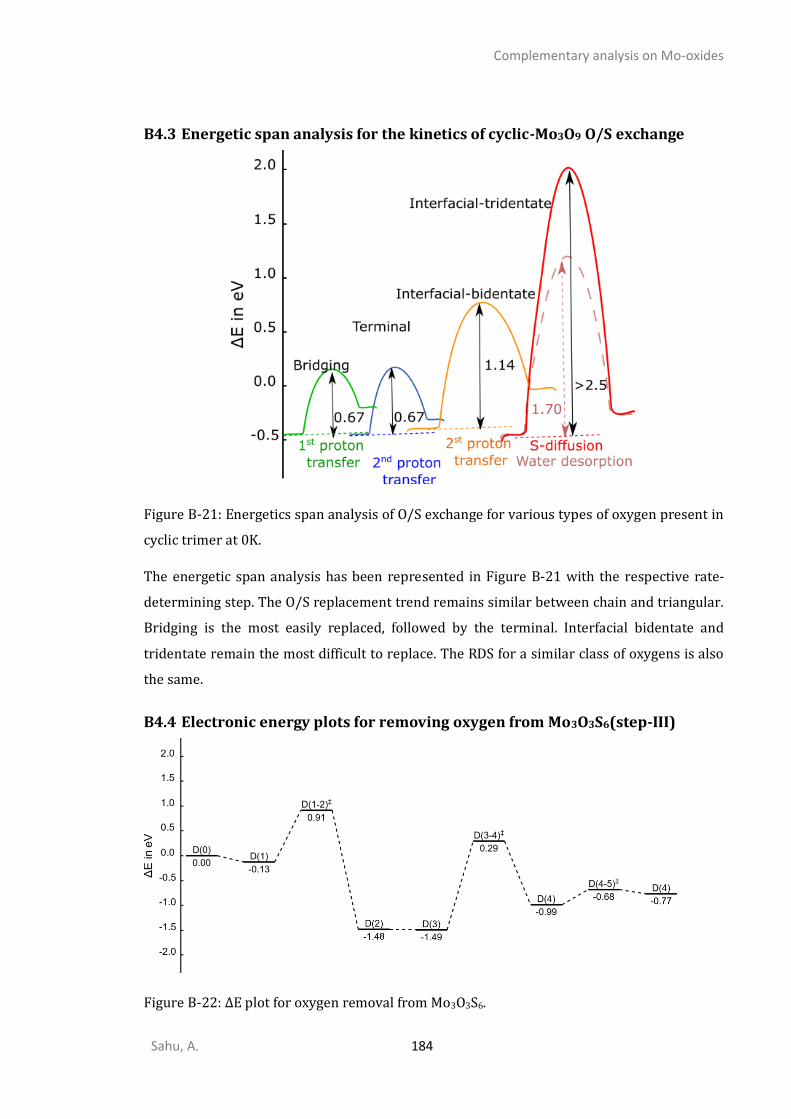
Complementary analysis on Mo-oxides
Sahu, A. 184
B4.3 Energetic span analysis for the kinetics of cyclic-Mo3O9 O/S exchange
Figure B-21: Energetics span analysis of O/S exchange for various types of oxygen present in
cyclic trimer at 0K.
The energetic span analysis has been represented in Figure B-21 with the respective rate-
determining step. The O/S replacement trend remains similar between chain and triangular.
Bridging is the most easily replaced, followed by the terminal. Interfacial bidentate and
tridentate remain the most difficult to replace. The RDS for a similar class of oxygens is also
the same.
B4.4 Electronic energy plots for removing oxygen from Mo3O3S6(step-III)
Figure B-22: ΔE plot for oxygen removal from Mo3O3S6.
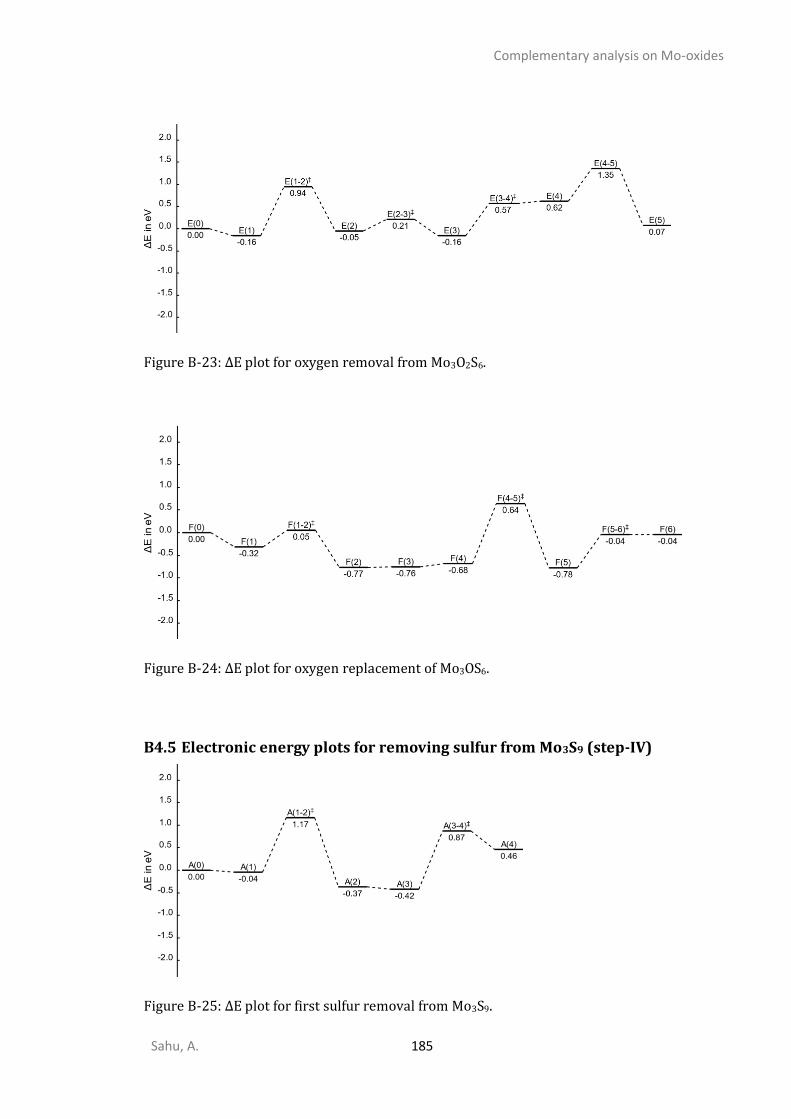
Complementary analysis on Mo-oxides
Sahu, A. 185
Figure B-23: ΔE plot for oxygen removal from Mo3O2S6.
Figure B-24: ΔE plot for oxygen replacement of Mo3OS6.
B4.5 Electronic energy plots for removing sulfur from Mo3S9 (step-IV)
Figure B-25: ΔE plot for first sulfur removal from Mo3S9.
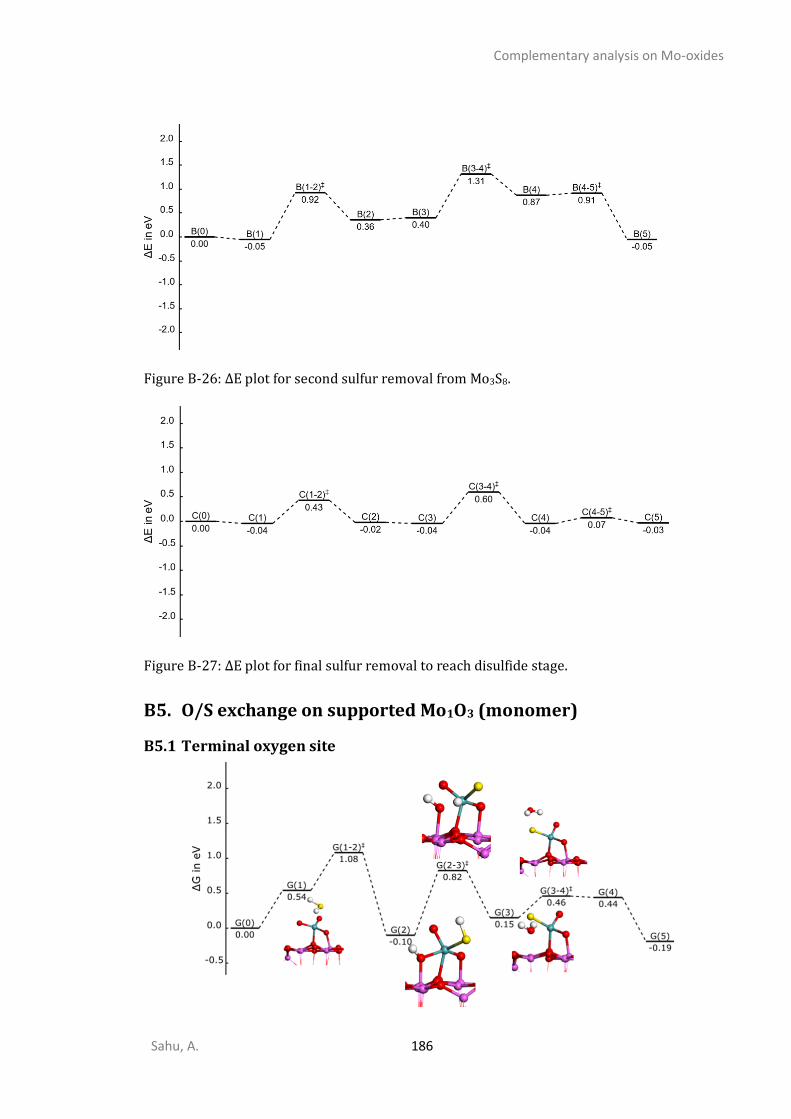
Complementary analysis on Mo-oxides
Sahu, A. 186
Figure B-26: ΔE plot for second sulfur removal from Mo3S8.
Figure B-27: ΔE plot for final sulfur removal to reach disulfide stage.
B5. O/S exchange on supported Mo1O3 (monomer)
B5.1 Terminal oxygen site

Complementary analysis on Mo-oxides
Sahu, A. 187
Figure B-28: Energetics of O/S exchange for terminal oxygen of monomer (MoO3) using H2S
(MoO3 + H2S →MoO2S+ H2O) at 0K.
Sulfidation of Monomer: Gibbs free energy plot of O/S exchange for top-oxo of monomer
(Figure B-28). The dissociation of H2S is the rate-limiting step that costs 1.08 eV. The
formation of water and the desorption of water are the other critical steps in this reaction
mechanism. Overall, the process is exothermic and thermodynamically favorable. We assume
that the second oxo would also be replaced similarly. We further investigated the interfacial
oxygen in a monomer that has an activation energy of 1.35 eV (Figure B-28). This requires
transferring of the second proton from sulfur to oxygen. Overall, the O/S exchange is more
favorable for the monomer than the trimer due to the lower activation energy. Water
desorption is the second most expensive step, as is the case for another interfacial oxygen.
B5.2 Interfacial oxygen site
Figure B-29: Energetics of O/S exchange for interfacial oxygen of monomer using H2S (MoOS2
+ H2S →MoS3 + H2O) at 0K.
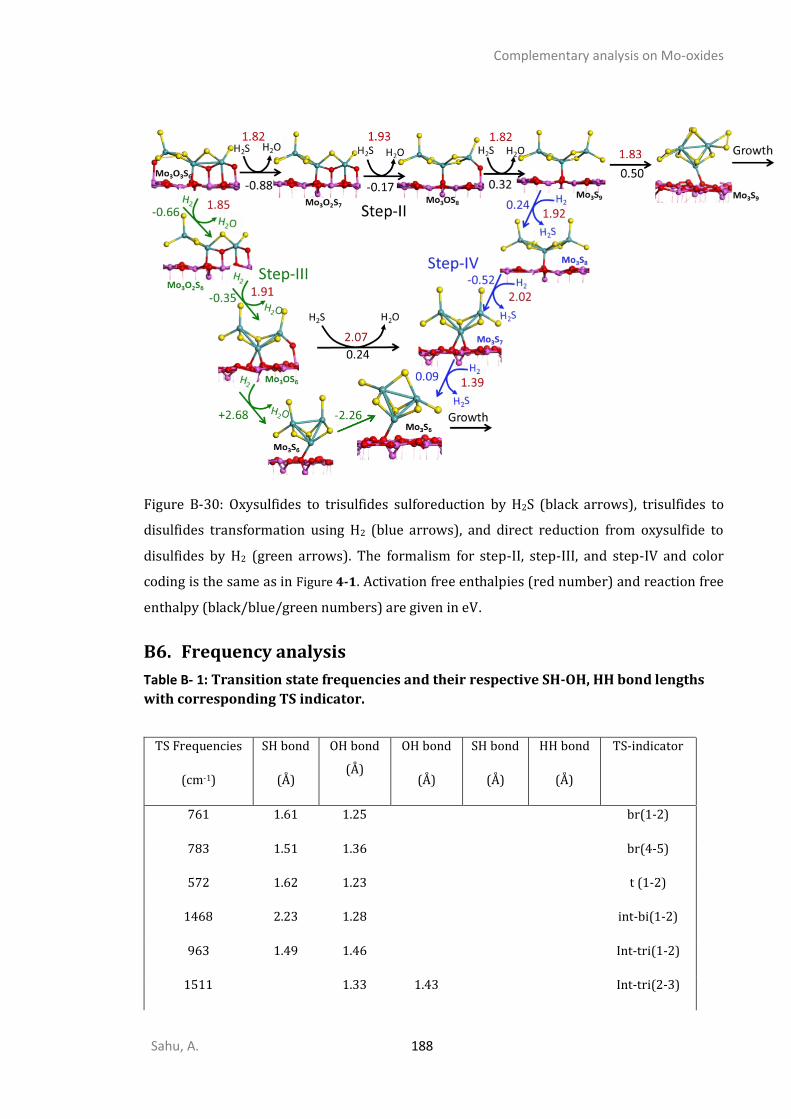
Complementary analysis on Mo-oxides
Sahu, A. 188
Figure B-30: Oxysulfides to trisulfides sulforeduction by H2S (black arrows), trisulfides to
disulfides transformation using H2 (blue arrows), and direct reduction from oxysulfide to
disulfides by H2 (green arrows). The formalism for step-II, step-III, and step-IV and color
coding is the same as in Figure 4-1. Activation free enthalpies (red number) and reaction free
enthalpy (black/blue/green numbers) are given in eV.
B6. Frequency analysis
Table B- 1: Transition state frequencies and their respective SH-OH, HH bond lengths
with corresponding TS indicator.
TS Frequencies
(cm-1)
SH bond
(Å)
OH bond
(Å)
OH bond
(Å)
SH bond
(Å)
HH bond
(Å)
TS-indicator
761 1.61 1.25 br(1-2)
783 1.51 1.36 br(4-5)
572 1.62 1.23 t (1-2)
1468 2.23 1.28 int-bi(1-2)
963 1.49 1.46 Int-tri(1-2)
1511 1.33 1.43 Int-tri(2-3)
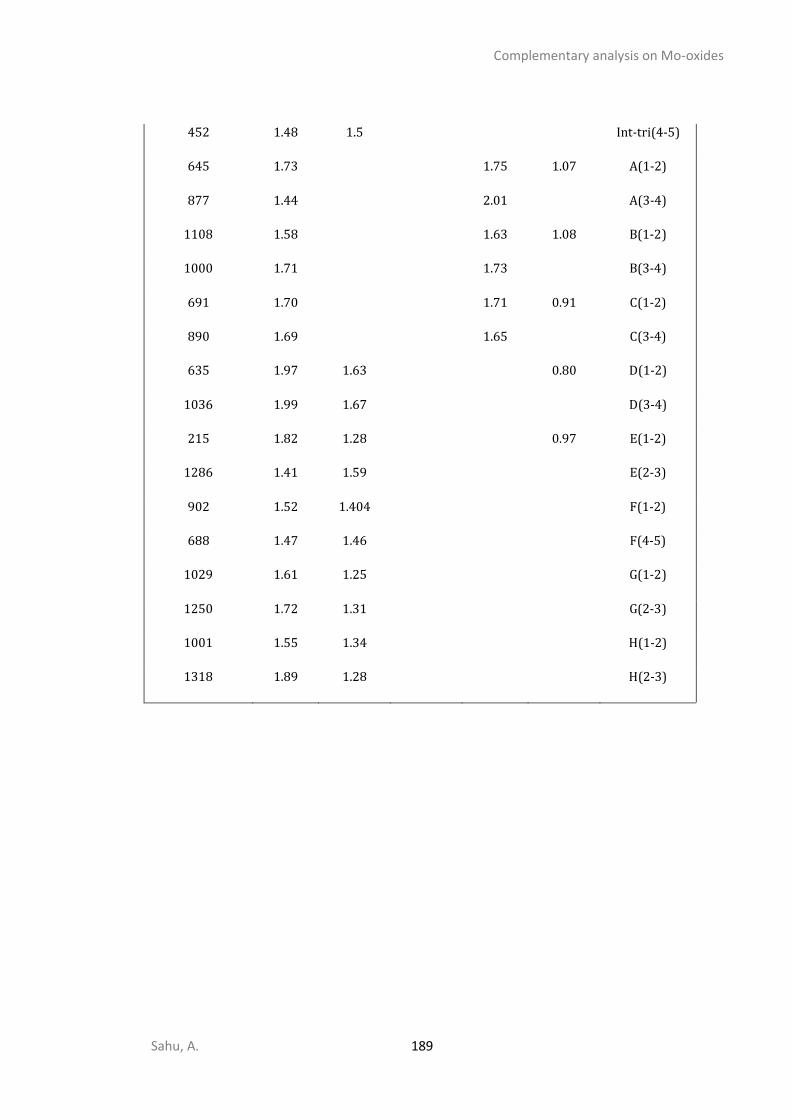
Complementary analysis on Mo-oxides
Sahu, A. 189
452 1.48 1.5 Int-tri(4-5)
645 1.73 1.75 1.07 A(1-2)
877 1.44 2.01 A(3-4)
1108 1.58 1.63 1.08 B(1-2)
1000 1.71 1.73 B(3-4)
691 1.70 1.71 0.91 C(1-2)
890 1.69 1.65 C(3-4)
635 1.97 1.63 0.80 D(1-2)
1036 1.99 1.67 D(3-4)
215 1.82 1.28 0.97 E(1-2)
1286 1.41 1.59 E(2-3)
902 1.52 1.404 F(1-2)
688 1.47 1.46 F(4-5)
1029 1.61 1.25 G(1-2)
1250 1.72 1.31 G(2-3)
1001 1.55 1.34 H(1-2)
1318 1.89 1.28 H(2-3)

Complementary analysis on Mo-oxides
Sahu, A. 190
Table B-2 Vibrational modes of various intermediates of oxides to oxysulfide reduction. Vibrational
modes
Mo3O9 Mo3O6S3 Mo3O3S6 Mo3S9
Path-1 Path-2 Path-1 Path-2 Path-1 Path-2
Alumina
Modes
652, 636,
578, 561,
540, 539,
514, 495,
480, 475,
465, 452,
446, 435,
433, 410,
310, 291,
281, 265,
258, 246
637, 573,
560, 546,
532, 484,
478, 469,
455, 447,
434, 426,
420, 393,
389, 383,
361, 344,
336, 311,
299, 292,
265, 249
704, 680,
648, 617,
580, 572,
536, 533,
508 490,
481, 467,
448, 440,
425, 421,
400, 386,
368, 332,
318, 309
651, 574,
510, 497,
478, 471,
448, 442,
427, 412,
408, 400,
383, 367,
348, 305,
291, 282,
257,
667, 578,
547, 513,
480, 474,
467, 464,
451, 450,
435, 420,
409, 406,
289, 268,
262,
639, 584,
564, 490,
486, 473,
471, 448,
444, 439,
436, 404,
397, 392,
373, 364,
359, 353,
314, 293,
284, 257,
638, 573,
562, 480,
477, 465,
446, 442,
438, 436,
425, 399,
388, 382,
372, 366,
355, 315,
311, 303,
297, 283,
266, 256,
Mo-Ot 991, 989, 978 982, 970 -- 970
Mo-Oint-bi 894, 866,
835, 825,
868, 831,
822, 799
839, 831, 874, 806, 813
Mo-Osurf 816 755 704, 680,
648
738 702, 684 680,
Mo-Oint-tri 715, 625 645 680, 648 692 687
Mo-(O-Al) 578, 557,
544, 539,
514, 495,
480, 475,
466, 435,
352, 335,
552, 532,
530, 511,
497, 455,
444, 434,
426, 420,
393, 383,
361, 344,
314,
580, 536,
533, 517,
508, 421,
368, 318,
309,
577, 556,
539, 497,
336, 319 ,
251
575, 554,
547, 336,
316,
Mo-O-Mo 787, 715,
652, 636,
557, 422,
410, 398,
381, 368,
363, 352,
326, 291,
274, 281,
831, 799,
511, 497,
478, 447,
420, 389,
361, 344,
265, 249,
233, 200
730, 648,
617, 533,
490, 440,
425, 347,
332, 318
548, 553, 501
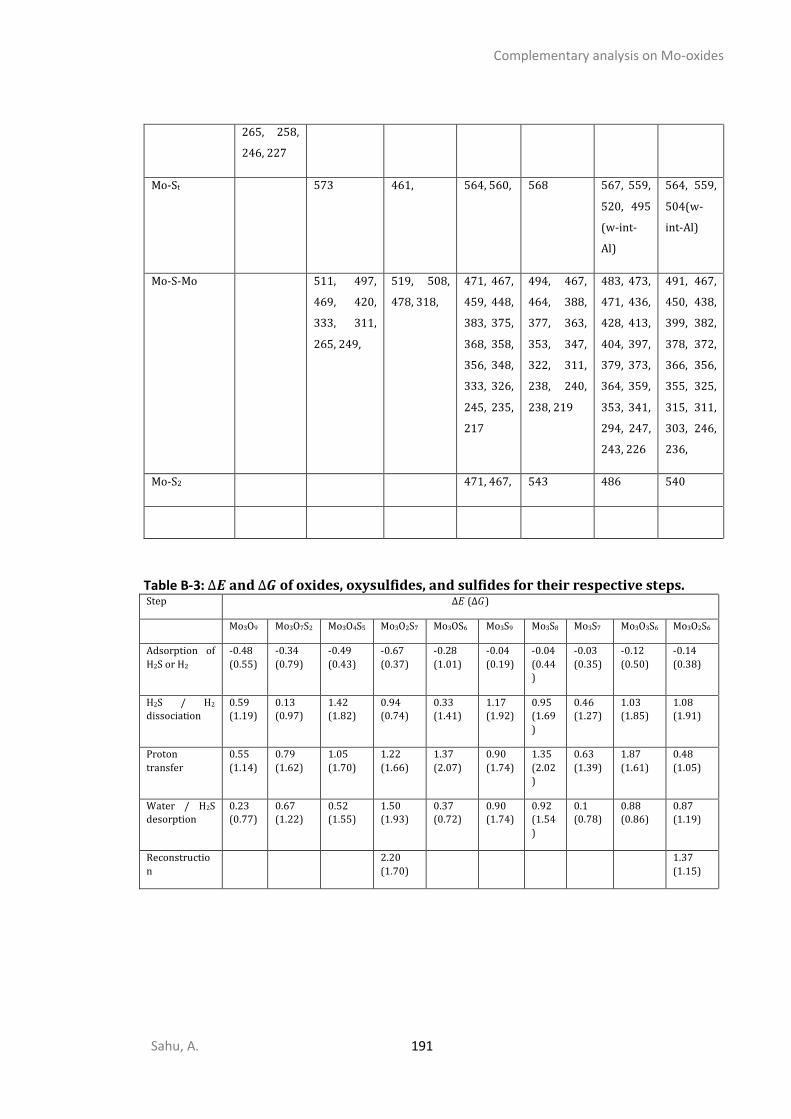
Complementary analysis on Mo-oxides
Sahu, A. 191
265, 258,
246, 227
Mo-St 573 461, 564, 560, 568 567, 559,
520, 495
(w-int-
Al)
564, 559,
504(w-
int-Al)
Mo-S-Mo 511, 497,
469, 420,
333, 311,
265, 249,
519, 508,
478, 318,
471, 467,
459, 448,
383, 375,
368, 358,
356, 348,
333, 326,
245, 235,
217
494, 467,
464, 388,
377, 363,
353, 347,
322, 311,
238, 240,
238, 219
483, 473,
471, 436,
428, 413,
404, 397,
379, 373,
364, 359,
353, 341,
294, 247,
243, 226
491, 467,
450, 438,
399, 382,
378, 372,
366, 356,
355, 325,
315, 311,
303, 246,
236,
Mo-S2 471, 467, 543 486 540
Table B-3: ∆𝑬 and ∆𝑮 of oxides, oxysulfides, and sulfides for their respective steps. Step ∆𝐸 (∆𝐺)
Mo3O9 Mo3O7S2 Mo3O4S5 Mo3O2S7 Mo3OS6 Mo3S9 Mo3S8 Mo3S7 Mo3O3S6 Mo3O2S6
Adsorption of
H2S or H2
-0.48
(0.55)
-0.34
(0.79)
-0.49
(0.43)
-0.67
(0.37)
-0.28
(1.01)
-0.04
(0.19)
-0.04
(0.44
)
-0.03
(0.35)
-0.12
(0.50)
-0.14
(0.38)
H2S / H2 dissociation
0.59 (1.19)
0.13 (0.97)
1.42 (1.82)
0.94 (0.74)
0.33 (1.41)
1.17 (1.92)
0.95 (1.69
)
0.46 (1.27)
1.03 (1.85)
1.08 (1.91)
Proton
transfer
0.55
(1.14)
0.79
(1.62)
1.05
(1.70)
1.22
(1.66)
1.37
(2.07)
0.90
(1.74)
1.35
(2.02)
0.63
(1.39)
1.87
(1.61)
0.48
(1.05)
Water / H2S
desorption
0.23
(0.77)
0.67
(1.22)
0.52
(1.55)
1.50
(1.93)
0.37
(0.72)
0.90
(1.74)
0.92
(1.54
)
0.1
(0.78)
0.88
(0.86)
0.87
(1.19)
Reconstructio
n
2.20
(1.70)
1.37
(1.15)
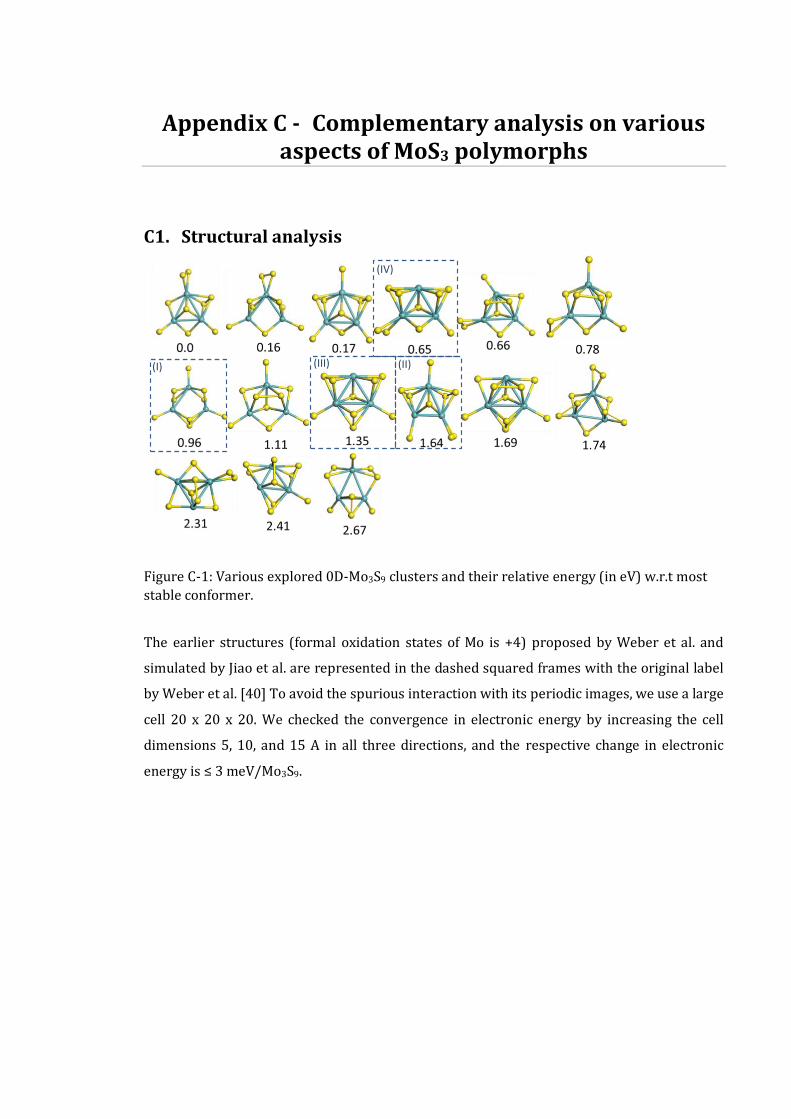
Appendix C - Complementary analysis on various aspects of MoS3 polymorphs
C1. Structural analysis
Figure C-1: Various explored 0D-Mo3S9 clusters and their relative energy (in eV) w.r.t most
stable conformer.
The earlier structures (formal oxidation states of Mo is +4) proposed by Weber et al. and
simulated by Jiao et al. are represented in the dashed squared frames with the original label
by Weber et al. [40] To avoid the spurious interaction with its periodic images, we use a large
cell 20 x 20 x 20. We checked the convergence in electronic energy by increasing the cell
dimensions 5, 10, and 15 A in all three directions, and the respective change in electronic
energy is ≤ 3 meV/Mo3S9.
(I)
(IV)
(III) (II)

Complementary analysis on various aspects of MoS3 polymorphs
Sahu, A. 193
Figure C-2: Various explored 0D-Mo6S18 clusters (triangular dimers) and their relative
energy (in eV) w.r.t the most stable one. The conformer used for the initial configuration of
AIMD is highlighted by a squared frame.
Figure C-3: Various 1D-periodic wave-like nano-structures with different number of Mo-
atoms in unit cell. Corresponding structures with relative energy (w.r.t. per Mo3S9 of TO) (a)-
2.45, (b) -2.69, (c)-2.71 and (d) -2.72 in eV.
Figure C-4: Linear 1D-periodic structures: (a) O.S = +4, R.E. = -1.73 eV, and (b) O.S = +5, R.E. =
-1.29 eV. Relative energy is w.r.t. per Mo3S9 (TO).

Complementary analysis on various aspects of MoS3 polymorphs
Sahu, A. 194
Table C-1: Electronic energy convergence with respect to cell size for various types of
polymorphs, the currently used dimension of the cell is given in the first column for
respective polymorphs. Polymorphs Increment along non periodic(Å) E/Mo3S9 (meV)
TO-Monomer 0 0
(20, 20, 20) 5 2.1
10 2.7
15 3.2
TO-Hexamer 0 0
(26, 40, 23) 5 1.5
10 2.3
15 2.3
TO-Perioic 0 0
(23.16, 34.30, 21.29) 5 1.3
10 1.7
15 3.1
WL-Periodic 0 0
(23.67, 26.35, 37.95) 5 0.5
10 0.7
15 1.6
To treat the low dimentional system in VASP, a large vacuum is required to minimize the
spurious interactions between neighboring cells. We observed, more than 12 Å distance
between periodic images is sufficient to have a good balance between the computational cost
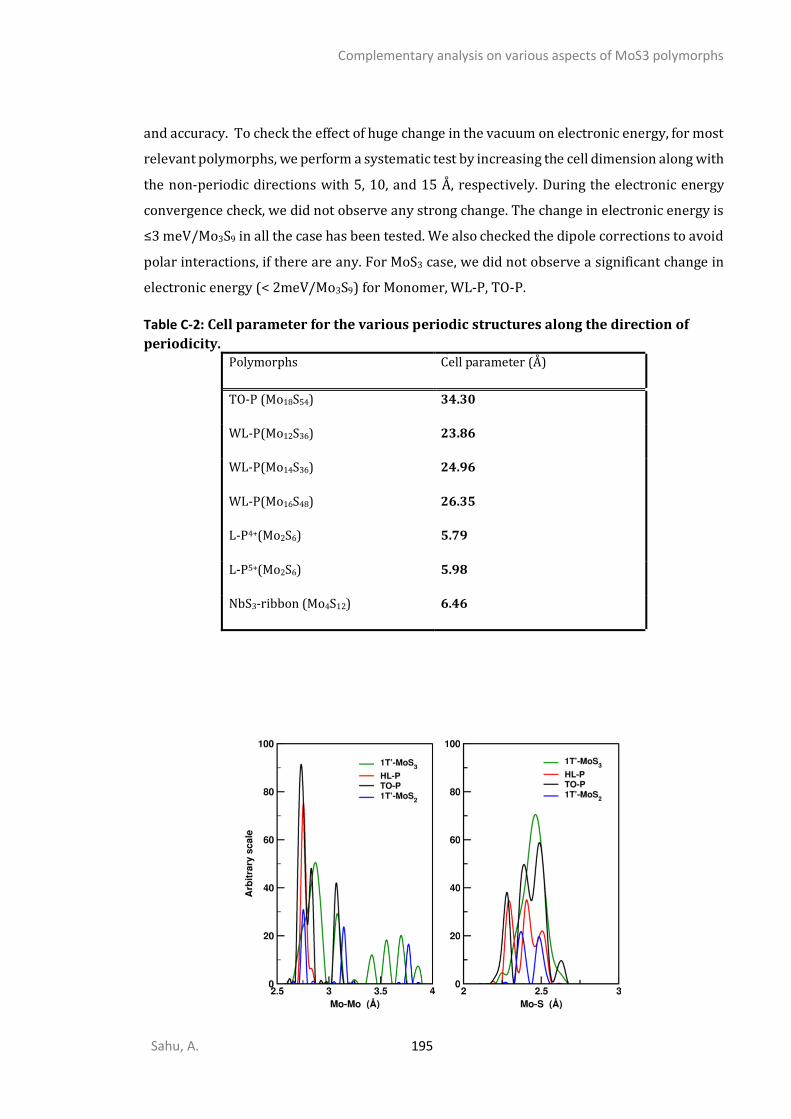
Complementary analysis on various aspects of MoS3 polymorphs
Sahu, A. 195
and accuracy. To check the effect of huge change in the vacuum on electronic energy, for most
relevant polymorphs, we perform a systematic test by increasing the cell dimension along with
the non-periodic directions with 5, 10, and 15 Å, respectively. During the electronic energy
convergence check, we did not observe any strong change. The change in electronic energy is
≤3 meV/Mo3S9 in all the case has been tested. We also checked the dipole corrections to avoid
polar interactions, if there are any. For MoS3 case, we did not observe a significant change in
electronic energy (< 2meV/Mo3S9) for Monomer, WL-P, TO-P.
Table C-2: Cell parameter for the various periodic structures along the direction of
periodicity. Polymorphs Cell parameter (Å)
TO-P (Mo18S54) 34.30
WL-P(Mo12S36) 23.86
WL-P(Mo14S36) 24.96
WL-P(Mo16S48) 26.35
L-P4+(Mo2S6) 5.79
L-P5+(Mo2S6) 5.98
NbS3-ribbon (Mo4S12) 6.46
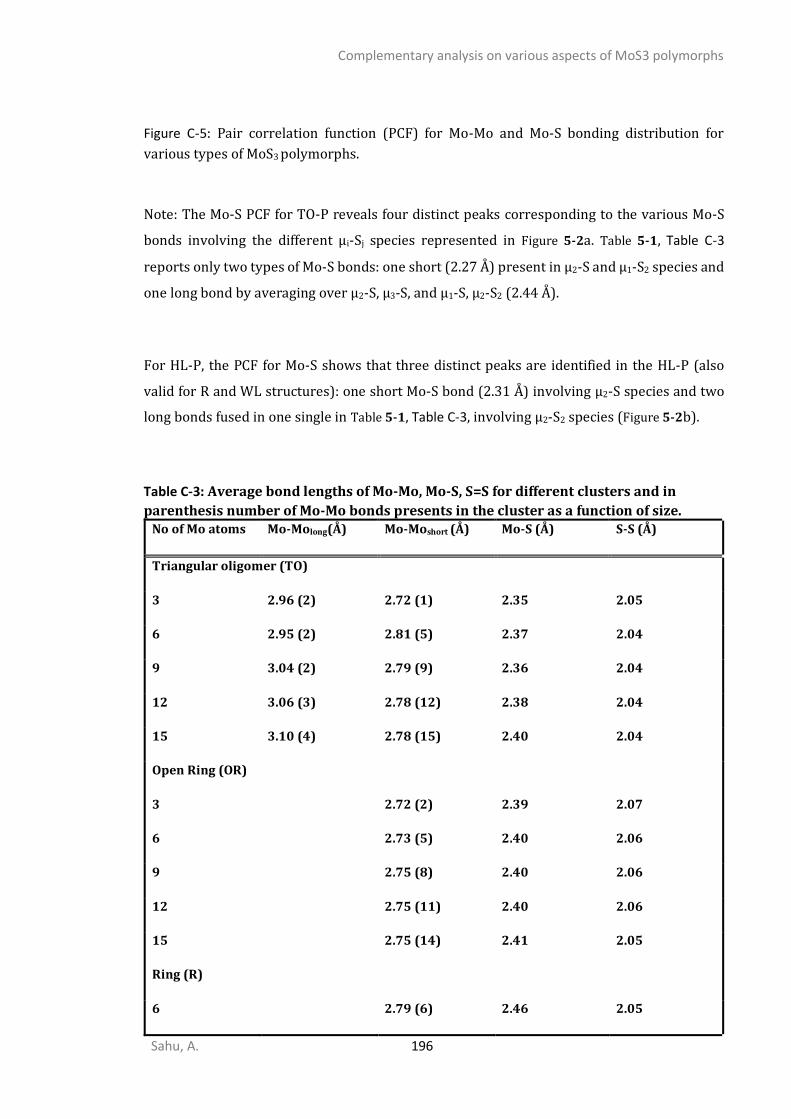
Complementary analysis on various aspects of MoS3 polymorphs
Sahu, A. 196
Figure C-5: Pair correlation function (PCF) for Mo-Mo and Mo-S bonding distribution for
various types of MoS3 polymorphs.
Note: The Mo-S PCF for TO-P reveals four distinct peaks corresponding to the various Mo-S
bonds involving the different µi-Sj species represented in Figure 5-2a. Table 5-1, Table C-3
reports only two types of Mo-S bonds: one short (2.27 Å) present in µ2-S and µ1-S2 species and
one long bond by averaging over µ2-S, µ3-S, and µ1-S, µ2-S2 (2.44 Å).
For HL-P, the PCF for Mo-S shows that three distinct peaks are identified in the HL-P (also
valid for R and WL structures): one short Mo-S bond (2.31 Å) involving µ2-S species and two
long bonds fused in one single in Table 5-1, Table C-3, involving µ2-S2 species (Figure 5-2b).
Table C-3: Average bond lengths of Mo-Mo, Mo-S, S=S for different clusters and in
parenthesis number of Mo-Mo bonds presents in the cluster as a function of size. No of Mo atoms Mo-Molong(Å) Mo-Moshort (Å) Mo-S (Å) S-S (Å)
Triangular oligomer (TO)
3 2.96 (2) 2.72 (1) 2.35 2.05
6 2.95 (2) 2.81 (5) 2.37 2.04
9 3.04 (2) 2.79 (9) 2.36 2.04
12 3.06 (3) 2.78 (12) 2.38 2.04
15 3.10 (4) 2.78 (15) 2.40 2.04
Open Ring (OR)
3 2.72 (2) 2.39 2.07
6 2.73 (5) 2.40 2.06
9 2.75 (8) 2.40 2.06
12 2.75 (11) 2.40 2.06
15 2.75 (14) 2.41 2.05
Ring (R)
6 2.79 (6) 2.46 2.05
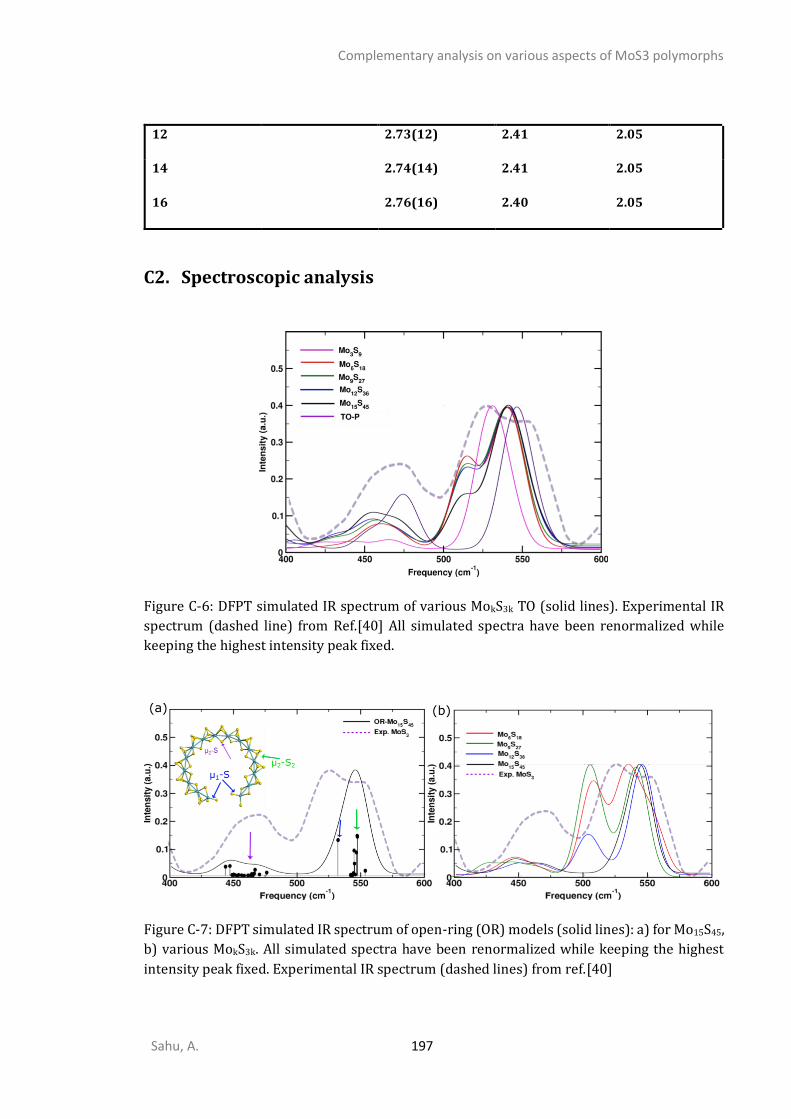
Complementary analysis on various aspects of MoS3 polymorphs
Sahu, A. 197
12 2.73(12) 2.41 2.05
14 2.74(14) 2.41 2.05
16 2.76(16) 2.40 2.05
C2. Spectroscopic analysis
Figure C-6: DFPT simulated IR spectrum of various MokS3k TO (solid lines). Experimental IR
spectrum (dashed line) from Ref.[40] All simulated spectra have been renormalized while
keeping the highest intensity peak fixed.
Figure C-7: DFPT simulated IR spectrum of open-ring (OR) models (solid lines): a) for Mo15S45,
b) various MokS3k. All simulated spectra have been renormalized while keeping the highest
intensity peak fixed. Experimental IR spectrum (dashed lines) from ref.[40]
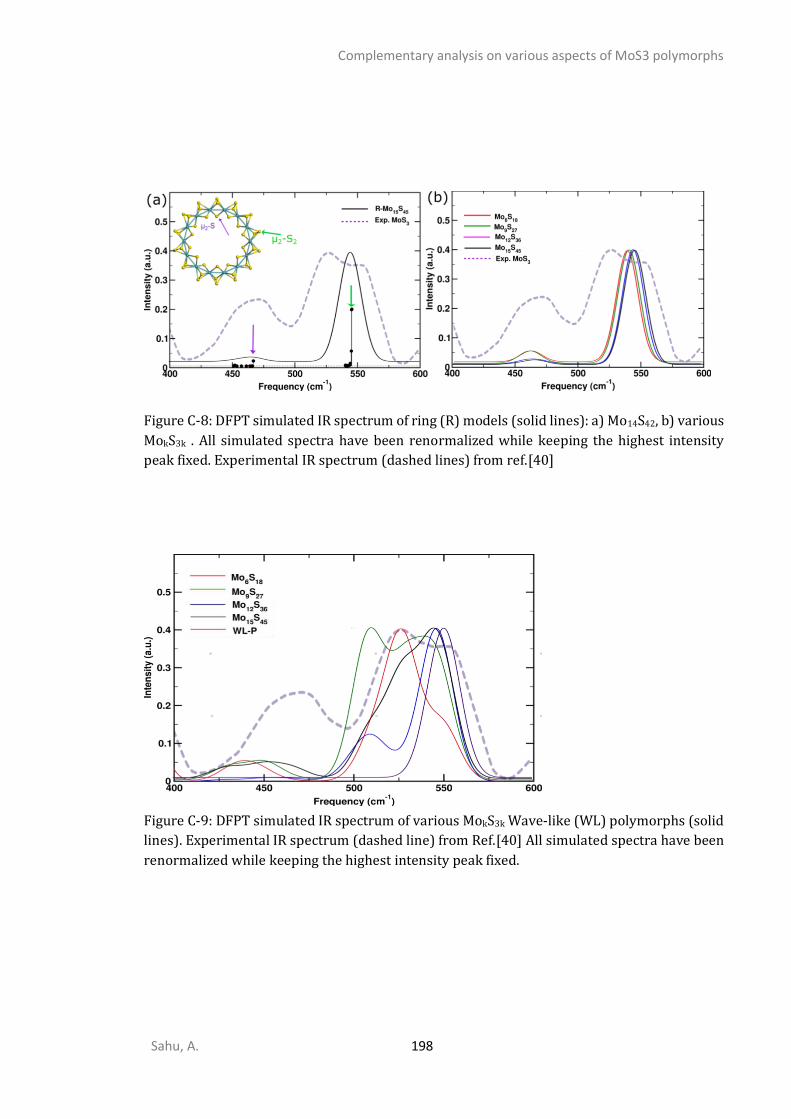
Complementary analysis on various aspects of MoS3 polymorphs
Sahu, A. 198
Figure C-8: DFPT simulated IR spectrum of ring (R) models (solid lines): a) Mo14S42, b) various
MokS3k . All simulated spectra have been renormalized while keeping the highest intensity
peak fixed. Experimental IR spectrum (dashed lines) from ref.[40]
Figure C-9: DFPT simulated IR spectrum of various MokS3k Wave-like (WL) polymorphs (solid
lines). Experimental IR spectrum (dashed line) from Ref.[40] All simulated spectra have been
renormalized while keeping the highest intensity peak fixed.
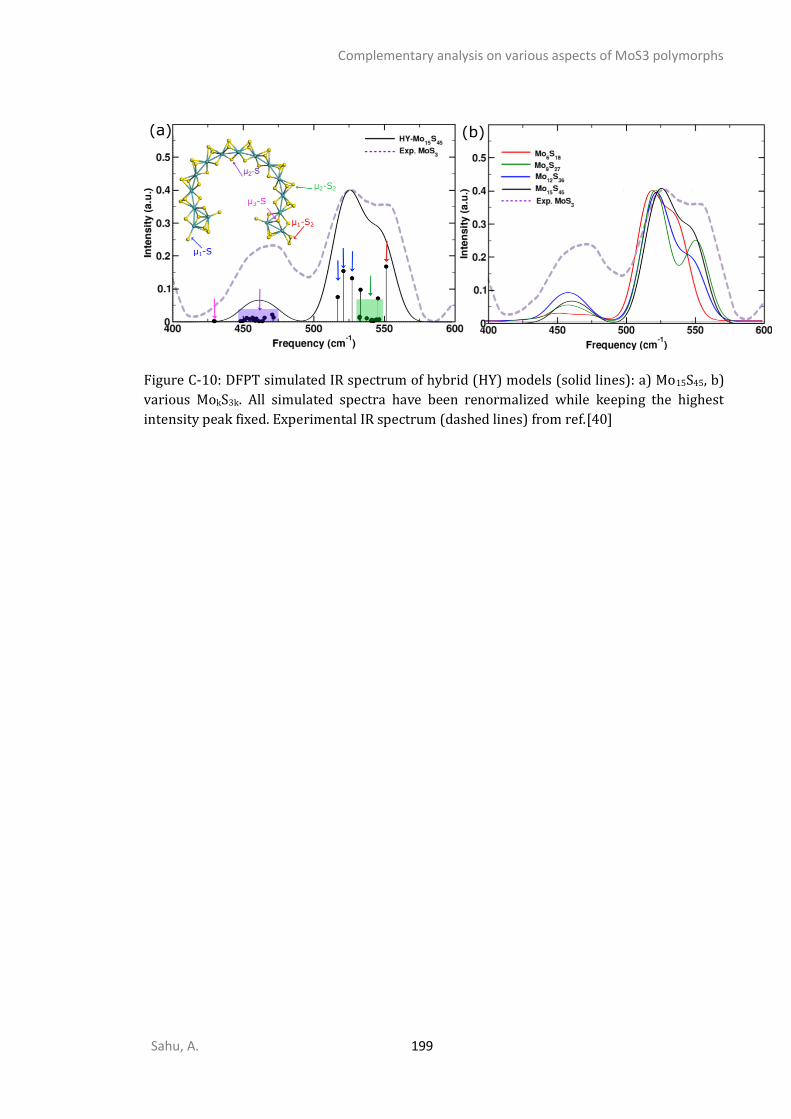
Complementary analysis on various aspects of MoS3 polymorphs
Sahu, A. 199
Figure C-10: DFPT simulated IR spectrum of hybrid (HY) models (solid lines): a) Mo15S45, b)
various MokS3k. All simulated spectra have been renormalized while keeping the highest
intensity peak fixed. Experimental IR spectrum (dashed lines) from ref.[40]
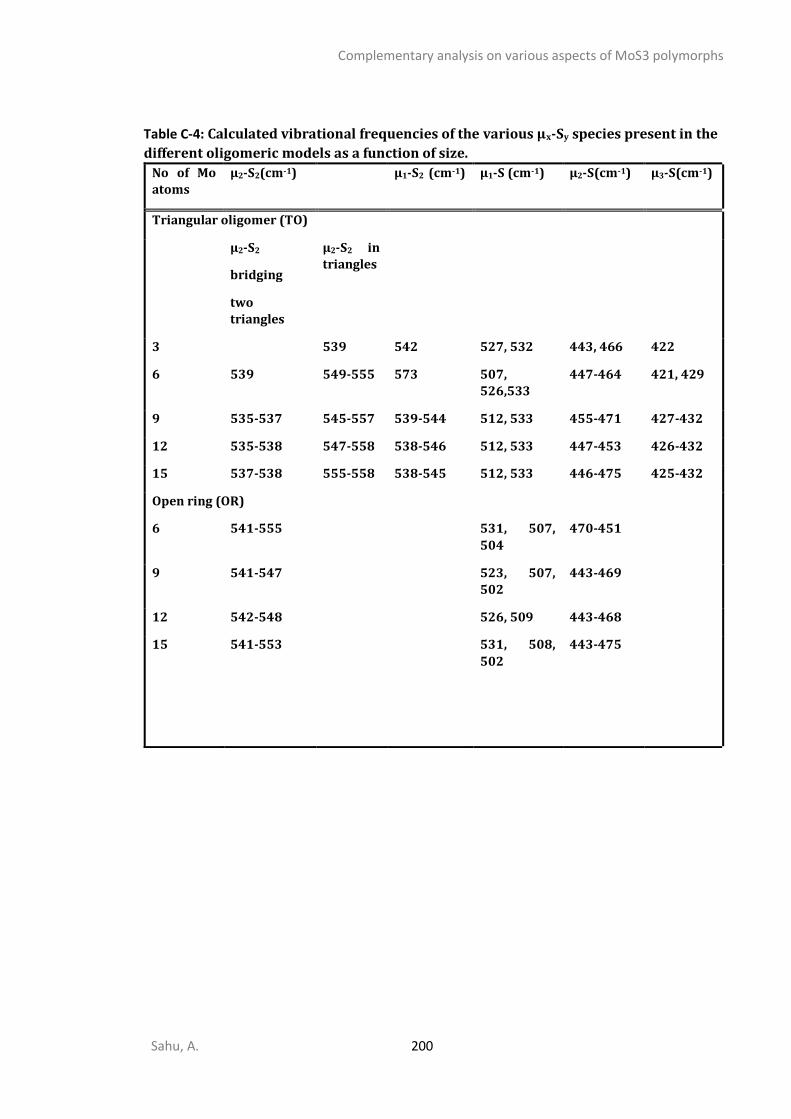
Complementary analysis on various aspects of MoS3 polymorphs
Sahu, A. 200
Table C-4: Calculated vibrational frequencies of the various µx-Sy species present in the
different oligomeric models as a function of size.
No of Mo atoms
µ2-S2(cm-1) µ1-S2 (cm-1) µ1-S (cm-1) µ2-S(cm-1) µ3-S(cm-1)
Triangular oligomer (TO)
µ2-S2
bridging
two triangles
µ2-S2 in triangles
3 539 542 527, 532 443, 466 422
6 539 549-555 573 507,
526,533
447-464 421, 429
9 535-537 545-557 539-544 512, 533 455-471 427-432
12 535-538 547-558 538-546 512, 533 447-453 426-432
15 537-538 555-558 538-545 512, 533 446-475 425-432
Open ring (OR)
6 541-555 531, 507,
504
470-451
9 541-547 523, 507, 502
443-469
12 542-548 526, 509 443-468
15 541-553
531, 508,
502
443-475
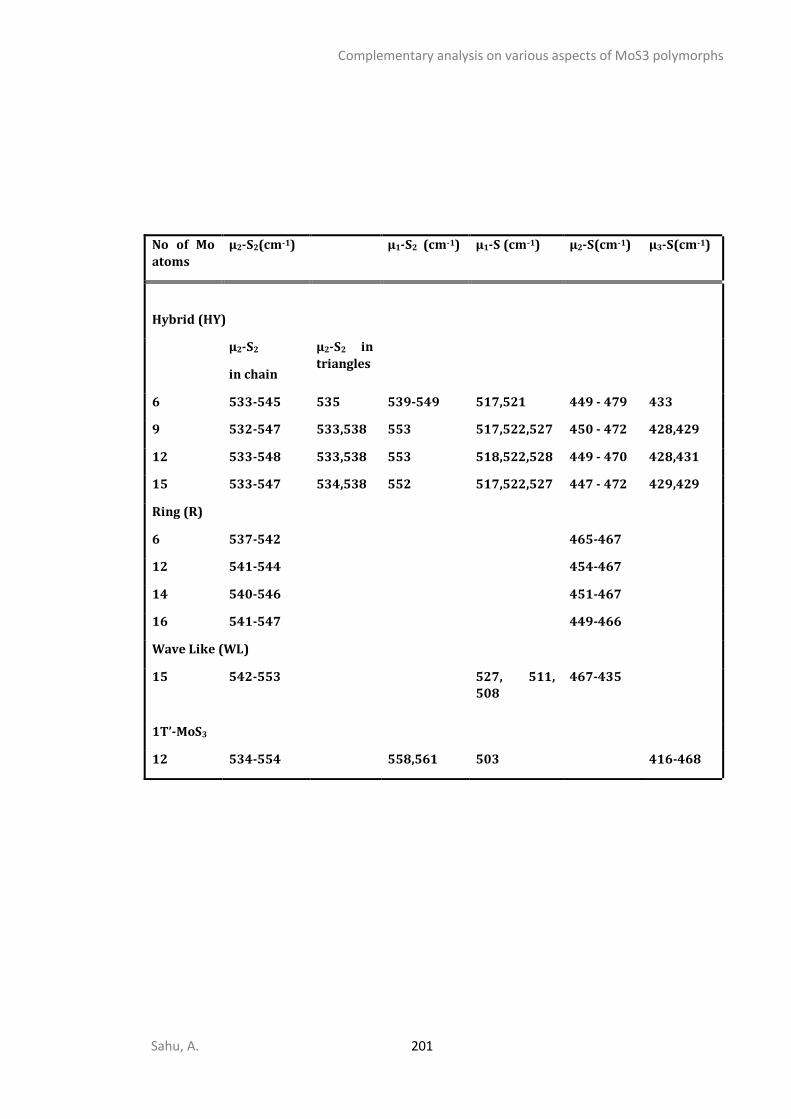
Complementary analysis on various aspects of MoS3 polymorphs
Sahu, A. 201
No of Mo
atoms
µ2-S2(cm-1) µ1-S2 (cm-1) µ1-S (cm-1) µ2-S(cm-1) µ3-S(cm-1)
Hybrid (HY)
µ2-S2
in chain
µ2-S2 in
triangles
6 533-545 535 539-549 517,521 449 - 479 433
9 532-547 533,538 553 517,522,527 450 - 472 428,429
12 533-548 533,538 553 518,522,528 449 - 470 428,431
15 533-547 534,538 552 517,522,527 447 - 472 429,429
Ring (R)
6 537-542 465-467
12 541-544 454-467
14 540-546 451-467
16 541-547 449-466
Wave Like (WL)
15 542-553
527, 511, 508
467-435
1T’-MoS3
12 534-554 558,561 503 416-468

Complementary analysis on various aspects of MoS3 polymorphs
Sahu, A. 202
Appendix D - Hydrodesulfurization of dibenzothiophene on CoMoS edge
Alexandre S. Dumon, Amit Sahu, Pascal Raybaud*
This appendix reproduces the text published in https://doi.org/10.1016/j.jcat.2021.01.030 and
a part of a collaborative side project in which I have been involved with a post-doc A. Dumon. I
contributed to this project by calculating many of the reported TSs for various pathways, thermal
corrections, energy plots, and IRC analysis.
Appendix A - Abstract
Unraveling the mechanisms of hydrodesulfurization (HDS) of dibenzothiophene (DBT) and
the corresponding active sites represents a scientific challenge to improve the intrinsic
performances of Co-promoted MoS2 (CoMoS) catalysts. By using density functional theory
calculations, we compare two historical mechanisms for the C-S bond scission of DBT (direct
desulfurization) : direct hydrogenolysis of DBT and β–elimination of α,β–dihydro-
diobenzothiophene (α,β–DHDBT) on four relevant sites of the two CoMoS M- and S-edges. On
the Co promoted M-edge, the α,β–DHDBT is formed through dihydrogenation which is
kinetically competing with hydrogenolysis (both exhibiting activation free energies, G‡,
smaller than +1.24 eV). On the S-edge, both dihydrogenation and hydrogenolysis exhibit
higher G‡ (> + 1.78 eV). Interestingly, on the S-edge, the β–elimination (E2 type) on the α,β–
DHDBT is found to be kinetically competing (G‡=+1.14 eV). The elimination of Hβ atom
involves a S2 dimer close to the S-vacancy site where DHDBT is adsorbed. Since this leaving Hβ
atom is distinct from the one added at dihydrogenation step, this may explain why direct
desulfurization of 4,6-alkyl substituted DBT compounds is hampered according to the
elimination mechanism. We finally discuss the possible synergy between the two edges of
CoMoS for HDS of DBT.
Keywords: hydrodesulfurization, dibenzothiophene, hydrogenolysis, β–elimination, CoMoS,
edge sites, density functional theory
Appendix B - Introduction
Due to the ever-stronger environmental
concerns, hydrotreatment and more
particularly hydrodesulfurization (HDS)
remain the unique catalytic processes able
to reduce the sulfur contents in diesel and
gasoline so that these fuels meet the 10
ppm regulations. In order to improve the
eco-efficiency of these processes and
optimize the use of metals, it is crucial to
keep on developing improved HDS
catalysts with higher intrinsic activity of
the active phase. The active phase of HDS
catalysts is made of Co or Ni promoted
MoS2 [1-3], and it was historically
Hydrodesulfurization of dibenzothiophene on CoMoS edge
Sahu, A. 204
identified as a so-called “mixed CoMoS
phase” [4, 5]. Since these earlier findings,
many experimental [2, 6-10] and
theoretical [10-13] investigations have
provided an ever deeper atomistic
description of the potentially active sites
located on the edges of the Co(Ni)MoS
nano-crystallites. Nevertheless,
challenging questions remain about the
mechanism of transformation of sulfur
containing polycyclic aromatic molecules
such as derivatives of dibenzothiophene
(DBT) on these edge-sites.
According to numerous experimental
studies, the HDS refractory sulfur
compounds are alkyl-substituted DBT, and
more specifically the 4,6-
dimethyldibenzothiophene (4,6-DMDBT)
[14-17]. It is therefore crucial to better
understand the HDS mechanism of this
family of compounds in order to provide
more efficient catalysts to achieve deep
hydrodesulfurization at a lower energy
process cost. For many years, this question
has been addressed extensively by using
kinetic studies combing both
experimentation and modeling [18-25]. It
is now largely accepted that the HDS of the
family of DBT molecules undergoes via
two-possible pathways: the hydrogenating
(HYD) pathway, leading to
cyclohexylbenzene (CHB) type
compounds, while the second one, the
direct desulfurization pathway (HYD),
leads to biphenyl (BP) type compounds
(Fig. 1) [21, 22, 25]. The probability of
these two main pathways depend on the
type of the DBT derivative and on the
nature of the catalyst. For DBT, the HYD
pathway is preferred on non-promoted
MoS2 active phase, while the DDS pathway
is predominant on Co(Ni)MoS phases. For
4,6-DMDBT, the HYD pathway is preferred
on MoS2 and Co(Ni)MoS[25], and its overall
desulfurization activity is significantly
reduced with respect to DBT.
However, according to experimental
kinetic studies the DDS pathway may
follow two competing mechanisms (Fig. 1).
The first and most direct one, called
hydrogenolysis [26], assumes that the DDS
pathway undergoes via two successive H
additions. The first H addition occurs on
the Cα position of DBT (carbon in position
α to S atom, also numbered C4 carbon in the
chemical nomenclature) and leads to the C-
S bond breaking with the formation of 2-
phenyl-thiophenolate intermediate. The
second H addition on the S atom would
lead to 2-phenyl-thiophenol or
intermediates [21]. The second possible
DDS pathway suggests the formation of an
α,β–dihydro-dibenzothiophene (DHDBT)
intermediate by two H addition on the Cα
and Cβ positions of DBT (Fig. 1) [24, 25,
27]. The DHDBT would be the precursor
for the C-S bond scission with concomitant
β–elimination (E2 type). Moreover, this
alternative mechanism also assumes that
DDS and HYD pathways share the common
DHDBT intermediate, that undergoes
either the β–elimination, or subsequent
hydrogenation steps. This concept of a
common intermediate present at the
crossing roads of DDS and HYD was earlier
proposed by Singhal et al. [22]. However, it
must be underlined that no direct
experimental evidence of the formation of
either DHDBT or 2-phenyl-thiophenol has
been provided so far.

Fig. 1. Hydrodesulfurization of DBT through the DDS and HYD pathways involving either
hydrogenolysis mechanism on DBT [28] or β–elimination mechanism of dihydrogenated DBT
(DHDBT) [25]. Note: for sake of simplicity only the 2-phenyl-thiophenolate is represented but
other intermediates such as 2-phenyl-thiophenol may form on the surface as discussed in the
text.
At a molecular level, scanning tunneling
microscopy (STM) combined with density
functional theory (DFT) simulations have
highlighted the various possible
adsorption modes and energies of DBT
derivatives on CoMoS supported on
Au(111) surface [29-31]. These
investigations reveal in particular how the
underlying gold substrate may influence
the spatial orientation of the DBT
molecules adsorbed on the edge sites. DFT
studies (including dispersion corrections)
also showed that the adsorption energy
and mode of 4,6-DMDBT on NiMoS depend
closely on the nature of edge sites: in
particular, 4,6-DMDBT is adsorbed
perpendicularly with its S-atom located in
a bridging position between two Ni sites of
the S-edge, whereas it is absorbed in a
nearly flat position on the Ni site of the
promoted M-edge[32]. Since it is often
referred that the HYD and DDS pathways
might be controlled by the adsorption
mode (either flat or perpendicular
respectively)[27, 33], distinct activities are
expected for the two edges. A similar
proposal has been made by means of DFT
simulation (without dispersion
corrections) of DBT adsorption on non-
promoted MoS2[34]. However, as the
present work will illustrate it, the link
between the adsorption mode of DBT and
the HYD/DDS pathways is not
straightforward. Regarding the
mechanistic aspects, Weber et al.
investigated by DFT (without dispersion
corrections) the hydrogenolysis
mechanism of DBT on the Ni promoted M-
edge site of a single NiMoS cluster[35], and
shows that the first C-S bond breaking
involves an activation energy of 1.37 eV.
Surprisingly, this event is reported to occur
during the DBT adsorption step on Ni site
through a simultaneous H transfer from
the same Ni site to the Cα atom of DBT. The
possible formation of 2-phenyl-
thiophenolate and 2-phenyl-thiophenol is
also invoked in this study. By means of
periodic DFT (without dispersion
corrections), Paul et al. investigated the
hydrogenolysis of DBT on the promoted S-
edge of a CoMoS catalyst and found that the
activation energy for the first S-C bond
scission is about 1 eV: in this case, the H is
transferred from a neighboring –SH group
to the Cα atom of DBT[36]. More recently,
the periodic DFT calculations of Saric et al.
showed that the thiolate intermediates
(including 2-phenyl-thiophenolate and
methyl substituted 2-phenyl-
S
S
SHH
+2H
+4H2 HYD
+H2S
+3/2H2
ab
a
ab
+H2S
Hydrodesulfurization of dibenzothiophene on CoMoS edge
Sahu, A. 206
thiophenolate) are stabilized
preferentially on coordinatively
unsaturated sites (CUS) of a CoMoS catalyst
(either corner or at the edge) with respect
to brim sites[37]. In addition, by applying a
simplified linear combination of atomic
orbital scheme, activation energies for the
first S-C bond scission on CUS were
estimated at 1.2 eV, according to a
hydrogenolysis mechanism. The same
study shows that the activation energy is
significantly higher on the brim S-edge site
(~1.8 eV) which is partly due to the lower
stability of the thiolate intermediate.
Lastly, Ding et al. reported rather
exhaustive DFT (with dispersion
corrections) calculations of the
hydrogenolysis mechanisms of DBT and
4,6-DMDBT on various edges of a large
NiMoS cluster[38]. They reveal that on a
mixed Ni-Mo site located on the M-edge,
the Cα-S bond breaking during the
hydrogenation involves a significant
rotation of the phenyl group of DBT which
is hindered in the case of 4,6-DMDBT.
Hence, the activation energy increases
from 1.40 eV for DBT to 1.74 eV for 4,6-
DMDBT. Moreover, they reveal that their
activation energies are greater on the Ni
promoted S-edge (1.95 and 2.12 eV,
respectively).
At this stage, none of the published
theoretical studies have investigated if
such DDS pathways can take place on the
partially Co-promoted M-edge proposed.
Numerous studies preferentially assumed
that DBT desulfurization occurs
exclusively on Co sites located on the S-
edge. However, the partial location of Co on
the M-edge has also been shown to be
stable in HDS conditions by some of us[11,
39-42]. Thus, it is one goal of the present
DFT work to explore if hydrogenolysis of
DBT can take place on the partially Co-
promoted edge and to determine the
corresponding activation energies.
Moreover, it is important to address the
alternative DDS pathway involving the
hydrogenation of the Cα and Cβ atoms of
DBT followed by the β–elimination with S-
C bond scission[24, 25]. To the best of our
knowledge, none of the current theoretical
studies has investigated the mechanism
with a first hydrogenation in Cβ position
instead of Cα which may activate the
elimination pathway as earlier proposed
by Mijoin et al.[24]. This less
straightforward pathway seems to be
overlooked by many published studies
without idenfying transition states (TS)
and quantifying energy barriers. Thus, this
will be the second challenge of this work to
identify if the β–elimination pathway can
take place on CoMoS sites.
At a molecular level, scanning tunneling
microscopy (STM) combined with density
functional theory (DFT) simulations have
highlighted the various possible
adsorption modes and energies of DBT
derivatives on CoMoS supported on
Au(111) surface [29-31]. These
investigations reveal in particular how the
underlying gold substrate may influence
the spatial orientation of the DBT
molecules adsorbed on the edge sites. DFT
studies (including dispersion corrections)
also showed that the adsorption energy
and mode of 4,6-DMDBT on NiMoS depend
closely on the nature of edge sites: in
particular, 4,6-DMDBT is adsorbed
perpendicularly with its S-atom located in
a bridging position between two Ni sites of
the S-edge, whereas it is absorbed in a
nearly flat position on the Ni site of the
promoted M-edge[32]. Since it is often
referred that the HYD and DDS pathways
might be controlled by the adsorption
Hydrodesulfurization of dibenzothiophene on CoMoS edge
Sahu, A. 207
mode (either flat or perpendicular
respectively)[27, 33], distinct activities are
expected for the two edges. A similar
proposal has been made by means of DFT
simulation (without dispersion
corrections) of DBT adsorption on non-
promoted MoS2[34]. However, as the
present work will illustrate it, the link
between the adsorption mode of DBT and
the HYD/DDS pathways is not
straightforward. Regarding the
mechanistic aspects, Weber et al.
investigated by DFT (without dispersion
corrections) the hydrogenolysis
mechanism of DBT on the Ni promoted M-
edge site of a single NiMoS cluster[35], and
shows that the first C-S bond breaking
involves an activation energy of 1.37 eV.
Surprisingly, this event is reported to occur
during the DBT adsorption step on Ni site
through a simultaneous H transfer from
the same Ni site to the Cα atom of DBT. The
possible formation of 2-phenyl-
thiophenolate and 2-phenyl-thiophenol is
also invoked in this study. By means of
periodic DFT (without dispersion
corrections), Paul et al. investigated the
hydrogenolysis of DBT on the promoted S-
edge of a CoMoS catalyst and found that the
activation energy for the first S-C bond
scission is about 1 eV: in this case, the H is
transferred from a neighboring –SH group
to the Cα atom of DBT[36]. More recently,
the periodic DFT calculations of Saric et al.
showed that the thiolate intermediates
(including 2-phenyl-thiophenolate and
methyl substituted 2-phenyl-
thiophenolate) are stabilized
preferentially on coordinatively
unsaturated sites (CUS) of a CoMoS catalyst
(either corner or at the edge) with respect
to brim sites[37]. In addition, by applying a
simplified linear combination of atomic
orbital scheme, activation energies for the
first S-C bond scission on CUS were
estimated at 1.2 eV, according to a
hydrogenolysis mechanism. The same
study shows that the activation energy is
significantly higher on the brim S-edge site
(~1.8 eV) which is partly due to the lower
stability of the thiolate intermediate.
Lastly, Ding et al. reported rather
exhaustive DFT (with dispersion
corrections) calculations of the
hydrogenolysis mechanisms of DBT and
4,6-DMDBT on various edges of a large
NiMoS cluster[38]. They reveal that on a
mixed Ni-Mo site located on the M-edge,
the Cα-S bond breaking during the
hydrogenation involves a significant
rotation of the phenyl group of DBT which
is hindered in the case of 4,6-DMDBT.
Hence, the activation energy increases
from 1.40 eV for DBT to 1.74 eV for 4,6-
DMDBT. Moreover, they reveal that their
activation energies are greater on the Ni
promoted S-edge (1.95 and 2.12 eV,
respectively).
At this stage, none of the published
theoretical studies have investigated if
such DDS pathways can take place on the
partially Co-promoted M-edge proposed.
Numerous studies preferentially assumed
that DBT desulfurization occurs
exclusively on Co sites located on the S-
edge. However, the partial location of Co on
the M-edge has also been shown to be
stable in HDS conditions by some of us[11,
39-42]. Thus, it is one goal of the present
DFT work to explore if hydrogenolysis of
DBT can take place on the partially Co-
promoted edge and to determine the
corresponding activation energies.
Moreover, it is important to address the
alternative DDS pathway involving the
hydrogenation of the Cα and Cβ atoms of
DBT followed by the β–elimination with S-
C bond scission[24, 25]. To the best of our
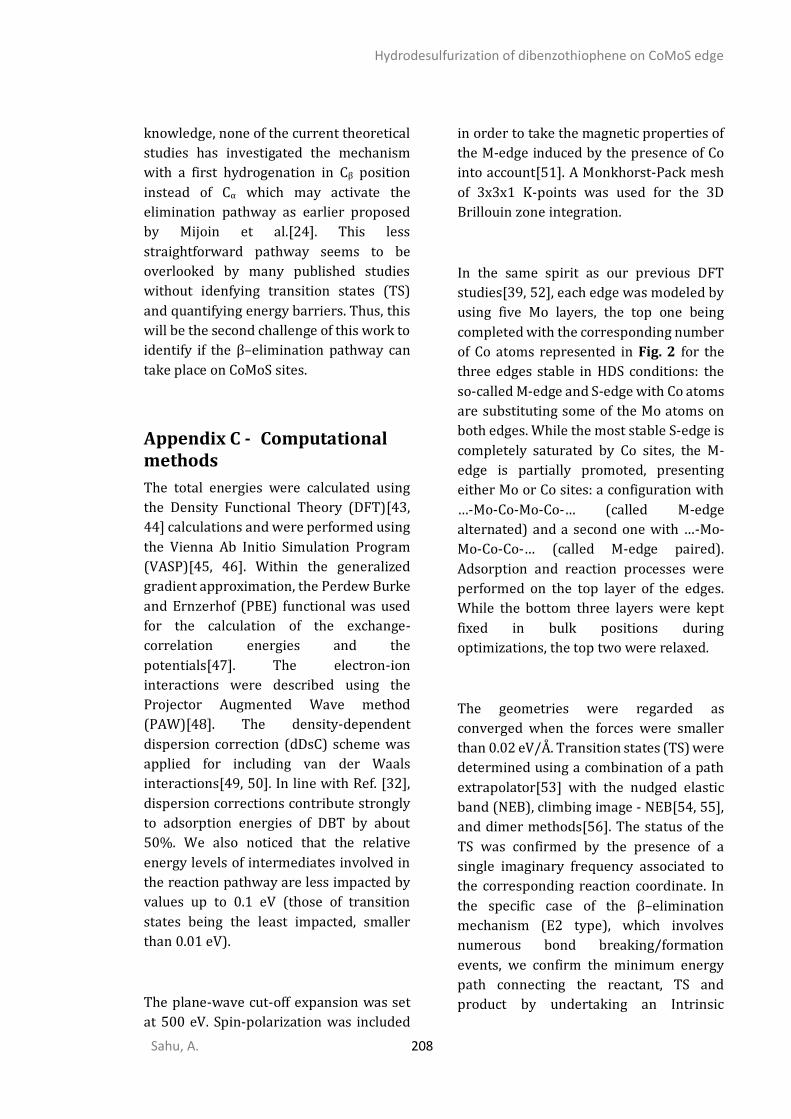
Hydrodesulfurization of dibenzothiophene on CoMoS edge
Sahu, A. 208
knowledge, none of the current theoretical
studies has investigated the mechanism
with a first hydrogenation in Cβ position
instead of Cα which may activate the
elimination pathway as earlier proposed
by Mijoin et al.[24]. This less
straightforward pathway seems to be
overlooked by many published studies
without idenfying transition states (TS)
and quantifying energy barriers. Thus, this
will be the second challenge of this work to
identify if the β–elimination pathway can
take place on CoMoS sites.
Appendix C - Computational methods
The total energies were calculated using
the Density Functional Theory (DFT)[43,
44] calculations and were performed using
the Vienna Ab Initio Simulation Program
(VASP)[45, 46]. Within the generalized
gradient approximation, the Perdew Burke
and Ernzerhof (PBE) functional was used
for the calculation of the exchange-
correlation energies and the
potentials[47]. The electron-ion
interactions were described using the
Projector Augmented Wave method
(PAW)[48]. The density-dependent
dispersion correction (dDsC) scheme was
applied for including van der Waals
interactions[49, 50]. In line with Ref. [32],
dispersion corrections contribute strongly
to adsorption energies of DBT by about
50%. We also noticed that the relative
energy levels of intermediates involved in
the reaction pathway are less impacted by
values up to 0.1 eV (those of transition
states being the least impacted, smaller
than 0.01 eV).
The plane-wave cut-off expansion was set
at 500 eV. Spin-polarization was included
in order to take the magnetic properties of
the M-edge induced by the presence of Co
into account[51]. A Monkhorst-Pack mesh
of 3x3x1 K-points was used for the 3D
Brillouin zone integration.
In the same spirit as our previous DFT
studies[39, 52], each edge was modeled by
using five Mo layers, the top one being
completed with the corresponding number
of Co atoms represented in Fig. 2 for the
three edges stable in HDS conditions: the
so-called M-edge and S-edge with Co atoms
are substituting some of the Mo atoms on
both edges. While the most stable S-edge is
completely saturated by Co sites, the M-
edge is partially promoted, presenting
either Mo or Co sites: a configuration with
…-Mo-Co-Mo-Co-… (called M-edge
alternated) and a second one with …-Mo-
Mo-Co-Co-… (called M-edge paired).
Adsorption and reaction processes were
performed on the top layer of the edges.
While the bottom three layers were kept
fixed in bulk positions during
optimizations, the top two were relaxed.
The geometries were regarded as
converged when the forces were smaller
than 0.02 eV/Å. Transition states (TS) were
determined using a combination of a path
extrapolator[53] with the nudged elastic
band (NEB), climbing image - NEB[54, 55],
and dimer methods[56]. The status of the
TS was confirmed by the presence of a
single imaginary frequency associated to
the corresponding reaction coordinate. In
the specific case of the β–elimination
mechanism (E2 type), which involves
numerous bond breaking/formation
events, we confirm the minimum energy
path connecting the reactant, TS and
product by undertaking an Intrinsic
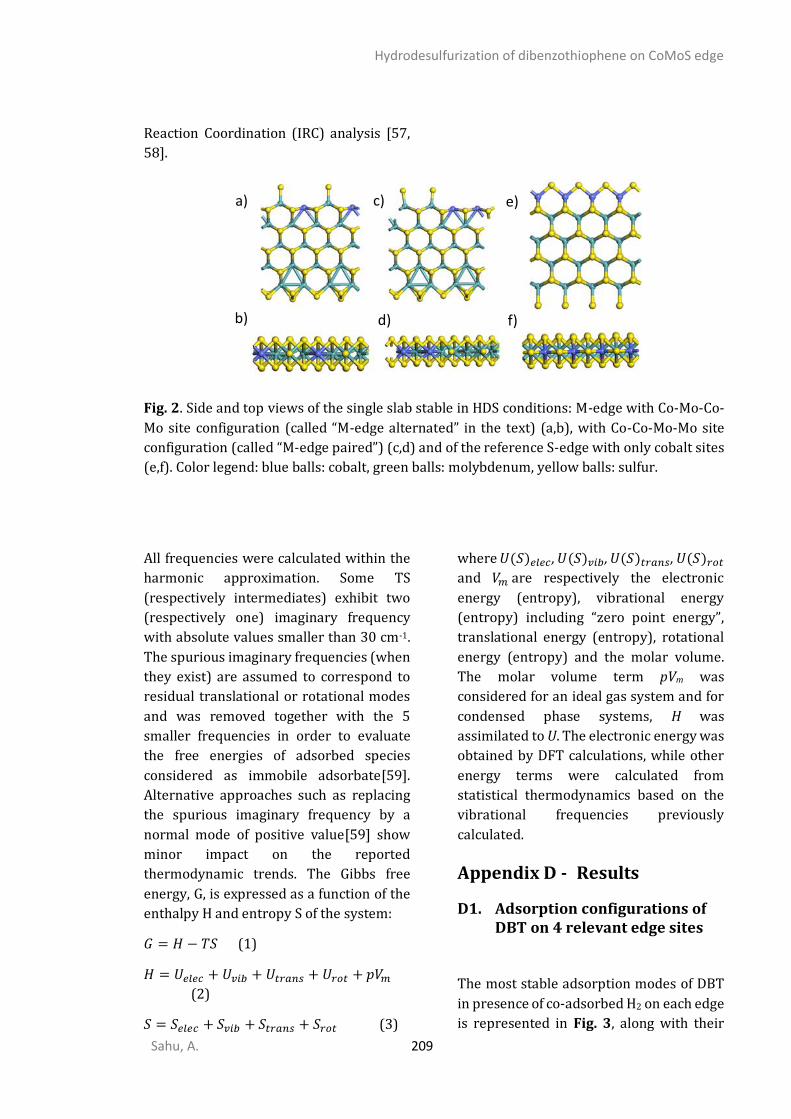
Hydrodesulfurization of dibenzothiophene on CoMoS edge
Sahu, A. 209
Reaction Coordination (IRC) analysis [57,
58].
Fig. 2. Side and top views of the single slab stable in HDS conditions: M-edge with Co-Mo-Co-
Mo site configuration (called “M-edge alternated” in the text) (a,b), with Co-Co-Mo-Mo site
configuration (called “M-edge paired”) (c,d) and of the reference S-edge with only cobalt sites
(e,f). Color legend: blue balls: cobalt, green balls: molybdenum, yellow balls: sulfur.
All frequencies were calculated within the
harmonic approximation. Some TS
(respectively intermediates) exhibit two
(respectively one) imaginary frequency
with absolute values smaller than 30 cm-1.
The spurious imaginary frequencies (when
they exist) are assumed to correspond to
residual translational or rotational modes
and was removed together with the 5
smaller frequencies in order to evaluate
the free energies of adsorbed species
considered as immobile adsorbate[59].
Alternative approaches such as replacing
the spurious imaginary frequency by a
normal mode of positive value[59] show
minor impact on the reported
thermodynamic trends. The Gibbs free
energy, G, is expressed as a function of the
enthalpy H and entropy S of the system:
𝐺 = 𝐻 − 𝑇𝑆 (1)
𝐻 = 𝑈𝑒𝑙𝑒𝑐 + 𝑈𝑣𝑖𝑏 + 𝑈𝑡𝑟𝑎𝑛𝑠 + 𝑈𝑟𝑜𝑡 + 𝑝𝑉𝑚
(2)
𝑆 = 𝑆𝑒𝑙𝑒𝑐 + 𝑆𝑣𝑖𝑏 + 𝑆𝑡𝑟𝑎𝑛𝑠 + 𝑆𝑟𝑜𝑡 (3)
where 𝑈(𝑆)𝑒𝑙𝑒𝑐 , 𝑈(𝑆)𝑣𝑖𝑏 , 𝑈(𝑆)𝑡𝑟𝑎𝑛𝑠 , 𝑈(𝑆)𝑟𝑜𝑡
and 𝑉𝑚 are respectively the electronic
energy (entropy), vibrational energy
(entropy) including “zero point energy”,
translational energy (entropy), rotational
energy (entropy) and the molar volume.
The molar volume term pVm was
considered for an ideal gas system and for
condensed phase systems, H was
assimilated to U. The electronic energy was
obtained by DFT calculations, while other
energy terms were calculated from
statistical thermodynamics based on the
vibrational frequencies previously
calculated.
Appendix D - Results
D1. Adsorption configurations of DBT on 4 relevant edge sites
The most stable adsorption modes of DBT
in presence of co-adsorbed H2 on each edge
is represented in Fig. 3, along with their
a)
b)
c)
d)
e)
f)
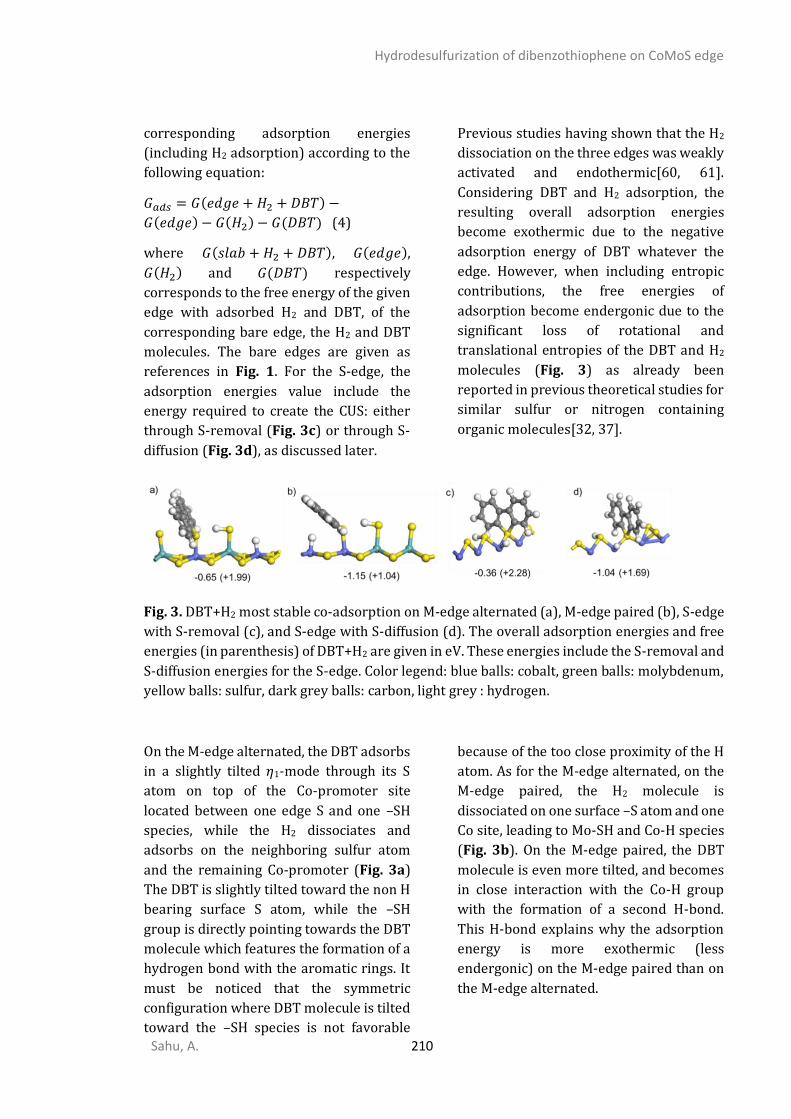
Hydrodesulfurization of dibenzothiophene on CoMoS edge
Sahu, A. 210
corresponding adsorption energies
(including H2 adsorption) according to the
following equation:
𝐺𝑎𝑑𝑠 = 𝐺(𝑒𝑑𝑔𝑒 + 𝐻2 + 𝐷𝐵𝑇) −
𝐺(𝑒𝑑𝑔𝑒) − 𝐺(𝐻2) − 𝐺(𝐷𝐵𝑇) (4)
where 𝐺(𝑠𝑙𝑎𝑏 + 𝐻2 + 𝐷𝐵𝑇), 𝐺(𝑒𝑑𝑔𝑒),
𝐺(𝐻2) and 𝐺(𝐷𝐵𝑇) respectively
corresponds to the free energy of the given
edge with adsorbed H2 and DBT, of the
corresponding bare edge, the H2 and DBT
molecules. The bare edges are given as
references in Fig. 1. For the S-edge, the
adsorption energies value include the
energy required to create the CUS: either
through S-removal (Fig. 3c) or through S-
diffusion (Fig. 3d), as discussed later.
Previous studies having shown that the H2
dissociation on the three edges was weakly
activated and endothermic[60, 61].
Considering DBT and H2 adsorption, the
resulting overall adsorption energies
become exothermic due to the negative
adsorption energy of DBT whatever the
edge. However, when including entropic
contributions, the free energies of
adsorption become endergonic due to the
significant loss of rotational and
translational entropies of the DBT and H2
molecules (Fig. 3) as already been
reported in previous theoretical studies for
similar sulfur or nitrogen containing
organic molecules[32, 37].
Fig. 3. DBT+H2 most stable co-adsorption on M-edge alternated (a), M-edge paired (b), S-edge
with S-removal (c), and S-edge with S-diffusion (d). The overall adsorption energies and free
energies (in parenthesis) of DBT+H2 are given in eV. These energies include the S-removal and
S-diffusion energies for the S-edge. Color legend: blue balls: cobalt, green balls: molybdenum,
yellow balls: sulfur, dark grey balls: carbon, light grey : hydrogen.
On the M-edge alternated, the DBT adsorbs
in a slightly tilted 𝜂1-mode through its S
atom on top of the Co-promoter site
located between one edge S and one –SH
species, while the H2 dissociates and
adsorbs on the neighboring sulfur atom
and the remaining Co-promoter (Fig. 3a)
The DBT is slightly tilted toward the non H
bearing surface S atom, while the –SH
group is directly pointing towards the DBT
molecule which features the formation of a
hydrogen bond with the aromatic rings. It
must be noticed that the symmetric
configuration where DBT molecule is tilted
toward the –SH species is not favorable
because of the too close proximity of the H
atom. As for the M-edge alternated, on the
M-edge paired, the H2 molecule is
dissociated on one surface –S atom and one
Co site, leading to Mo-SH and Co-H species
(Fig. 3b). On the M-edge paired, the DBT
molecule is even more tilted, and becomes
in close interaction with the Co-H group
with the formation of a second H-bond.
This H-bond explains why the adsorption
energy is more exothermic (less
endergonic) on the M-edge paired than on
the M-edge alternated.
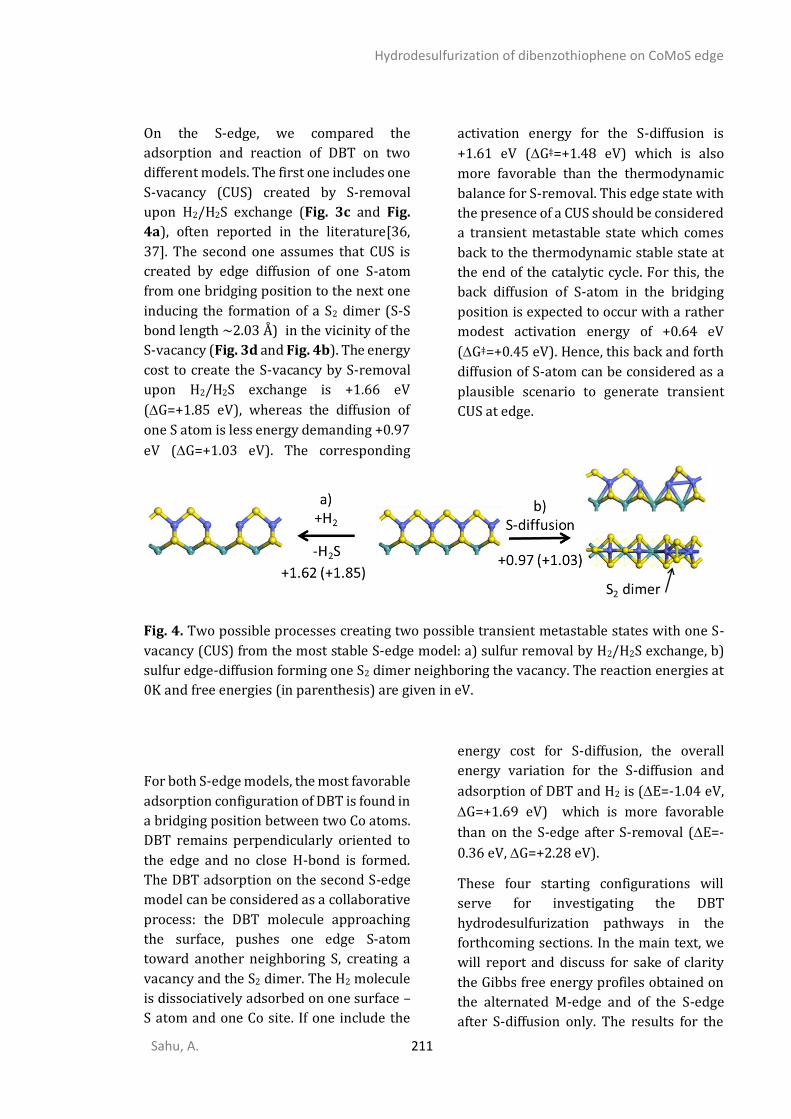
Hydrodesulfurization of dibenzothiophene on CoMoS edge
Sahu, A. 211
On the S-edge, we compared the
adsorption and reaction of DBT on two
different models. The first one includes one
S-vacancy (CUS) created by S-removal
upon H2/H2S exchange (Fig. 3c and Fig.
4a), often reported in the literature[36,
37]. The second one assumes that CUS is
created by edge diffusion of one S-atom
from one bridging position to the next one
inducing the formation of a S2 dimer (S-S
bond length ~2.03 Å) in the vicinity of the
S-vacancy (Fig. 3d and Fig. 4b). The energy
cost to create the S-vacancy by S-removal
upon H2/H2S exchange is +1.66 eV
(G=+1.85 eV), whereas the diffusion of
one S atom is less energy demanding +0.97
eV (G=+1.03 eV). The corresponding
activation energy for the S-diffusion is
+1.61 eV (G‡=+1.48 eV) which is also
more favorable than the thermodynamic
balance for S-removal. This edge state with
the presence of a CUS should be considered
a transient metastable state which comes
back to the thermodynamic stable state at
the end of the catalytic cycle. For this, the
back diffusion of S-atom in the bridging
position is expected to occur with a rather
modest activation energy of +0.64 eV
(G‡=+0.45 eV). Hence, this back and forth
diffusion of S-atom can be considered as a
plausible scenario to generate transient
CUS at edge.
Fig. 4. Two possible processes creating two possible transient metastable states with one S-
vacancy (CUS) from the most stable S-edge model: a) sulfur removal by H2/H2S exchange, b)
sulfur edge-diffusion forming one S2 dimer neighboring the vacancy. The reaction energies at
0K and free energies (in parenthesis) are given in eV.
For both S-edge models, the most favorable
adsorption configuration of DBT is found in
a bridging position between two Co atoms.
DBT remains perpendicularly oriented to
the edge and no close H-bond is formed.
The DBT adsorption on the second S-edge
model can be considered as a collaborative
process: the DBT molecule approaching
the surface, pushes one edge S-atom
toward another neighboring S, creating a
vacancy and the S2 dimer. The H2 molecule
is dissociatively adsorbed on one surface –
S atom and one Co site. If one include the
energy cost for S-diffusion, the overall
energy variation for the S-diffusion and
adsorption of DBT and H2 is (E=-1.04 eV,
G=+1.69 eV) which is more favorable
than on the S-edge after S-removal (E=-
0.36 eV, G=+2.28 eV).
These four starting configurations will
serve for investigating the DBT
hydrodesulfurization pathways in the
forthcoming sections. In the main text, we
will report and discuss for sake of clarity
the Gibbs free energy profiles obtained on
the alternated M-edge and of the S-edge
after S-diffusion only. The results for the
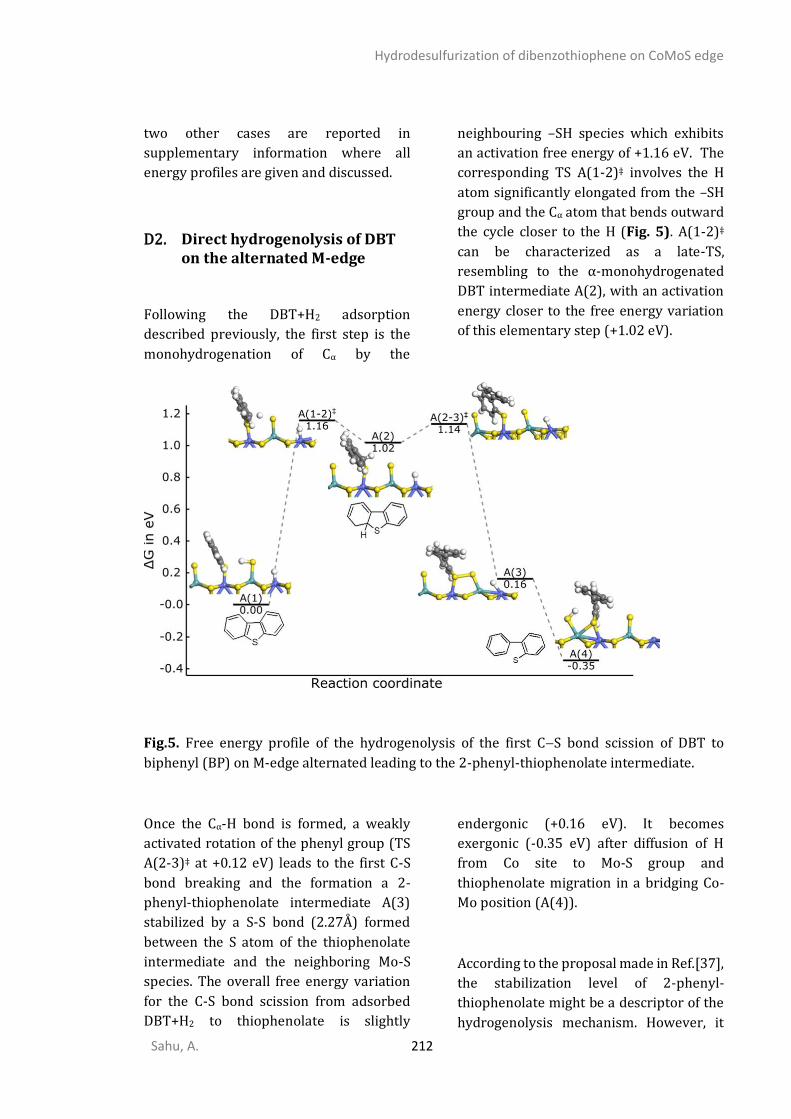
Hydrodesulfurization of dibenzothiophene on CoMoS edge
Sahu, A. 212
two other cases are reported in
supplementary information where all
energy profiles are given and discussed.
D2. Direct hydrogenolysis of DBT on the alternated M-edge
Following the DBT+H2 adsorption
described previously, the first step is the
monohydrogenation of Cα by the
neighbouring –SH species which exhibits
an activation free energy of +1.16 eV. The
corresponding TS A(1-2)‡ involves the H
atom significantly elongated from the –SH
group and the Cα atom that bends outward
the cycle closer to the H (Fig. 5). A(1-2)‡
can be characterized as a late-TS,
resembling to the α-monohydrogenated
DBT intermediate A(2), with an activation
energy closer to the free energy variation
of this elementary step (+1.02 eV).
Fig.5. Free energy profile of the hydrogenolysis of the first C−S bond scission of DBT to
biphenyl (BP) on M-edge alternated leading to the 2-phenyl-thiophenolate intermediate.
Once the Cα-H bond is formed, a weakly
activated rotation of the phenyl group (TS
A(2-3)‡ at +0.12 eV) leads to the first C-S
bond breaking and the formation a 2-
phenyl-thiophenolate intermediate A(3)
stabilized by a S-S bond (2.27Å) formed
between the S atom of the thiophenolate
intermediate and the neighboring Mo-S
species. The overall free energy variation
for the C-S bond scission from adsorbed
DBT+H2 to thiophenolate is slightly
endergonic (+0.16 eV). It becomes
exergonic (-0.35 eV) after diffusion of H
from Co site to Mo-S group and
thiophenolate migration in a bridging Co-
Mo position (A(4)).
According to the proposal made in Ref.[37],
the stabilization level of 2-phenyl-
thiophenolate might be a descriptor of the
hydrogenolysis mechanism. However, it
Hydrodesulfurization of dibenzothiophene on CoMoS edge
Sahu, A. 213
must be noticed that the two TS, A(1-2)‡
and A(2-3)‡, as well as the α-
monohydrogenated DBT intermediate,
A(2), are located at significantly higher
energies (~ +1 eV) than thiophenolate.
This may be an indication that the
thiophenolate stabilization is one
necessary condition but probably not the
sole descriptor for featuring if
hydrogenolysis is kinetically possible or
not. Analyzing the calculated reaction and
activation energies for DBT and alkyl-DBT
HDS on NiMoS sites reported by Ding et al.,
showed that it seems difficult identifying a
direct correlation between the
thiophenolate energy and the activation
energy of hydrogenolysis for the various
edge and corner sites [38]. Actually, the
energy level of the TS is linked to various
effects: the level of instability of α-
monohydrogenated DBT intermediate, the
steric hindrance of the rotational
movement of the phenyl group during the
C-S bond scission and the optimal position
of the –SH groups involved in the H-
transfer (see also further discussion).
Hence, these three kinetic effects cannot be
deciphered by a single descriptor based on
the stability of the 2-phenyl-thiophenolate
intermediate. In addition, depending on
the DFT study, the existence of the α-
monohydrogenated DBT intermediate as
an intermediate is not always reported[36,
38] which is explained by its relative weak
stability with respect to TS A(1-2)‡ and
A(2-3)‡. The potential energy surface in the
vicinity of TS A(1-2)‡, A(2) and A(2-3)‡ will
thus intimately depend on the local nature
of edge site (see also later for the S-edge).
From 2-phenyl-thiophenolate A(4), two
possible pathways can be considered. The
first one involves the formation of 2-
phenyl-thiophenol intermediate leading to
the second C-S bond scission, as described
in details in Fig. S2. The second one
involves a direct C-S bond scission of 2-
phenyl-thiophenolate. For that purpose, a
second H2 molecule adsorption which
leads to the thiophenolate co-adsorbed
with two neighboring Mo-SH groups (Fig.
6). From this configuration, the second Cα
hydrogenation by one SH can proceed in a
similar way as the first one and the TS A(5-
6)‡ exhibits a similar free activation energy
of +1.35 eV. This second C-S bond breaking
step leads to a physisorbed biphenyl (BP).
Similar activation energies are found for
the thiophenol pathway (Fig. S2) and will
be discussed later for the second C-S
scission on the S-edge (section 3.4). These
values remain compatible with previously
calculated activation energies of
hydrogenolysis of alkane thiols on MoS2,
CoMoS and NiMoS edges [62-64]. The fact
that the activation energy of the second Cα-
S bond scission is similar or even slightly
higher than the first one seems to be
counter-intuitive since the conjugaison of
S-lone pair electrons with those of the
aromatic rings is expected to limit the first
C-S bond cleavage. However, our TS
analysis reveals that another effect may
influence the relative activation energies of
the two Cα-S bond scission: the optimal
position of the Mo-SH group to attack the
Cα atom during H-transfer. As illustrated in
Fig. S7, the imaginary frequency of the
reaction mode corresponding to the H-
transfer (leading either to hydrogenolysis
or to hydrogenation as detailed latter) is
mainly correlated to the SH bond length.
This trend indicates that the position and
accessibility of –SH group is a key
parameter for the activation step. In the
case of the second bond C-S cleavage, the
reorientation of the phenyl ring in 2-
phenylthiophenol which becomes parallel
to the edge hinders the optimal position of
the second Cα atom with respect to the
neighboring Mo-SH group. Hence, the C-S
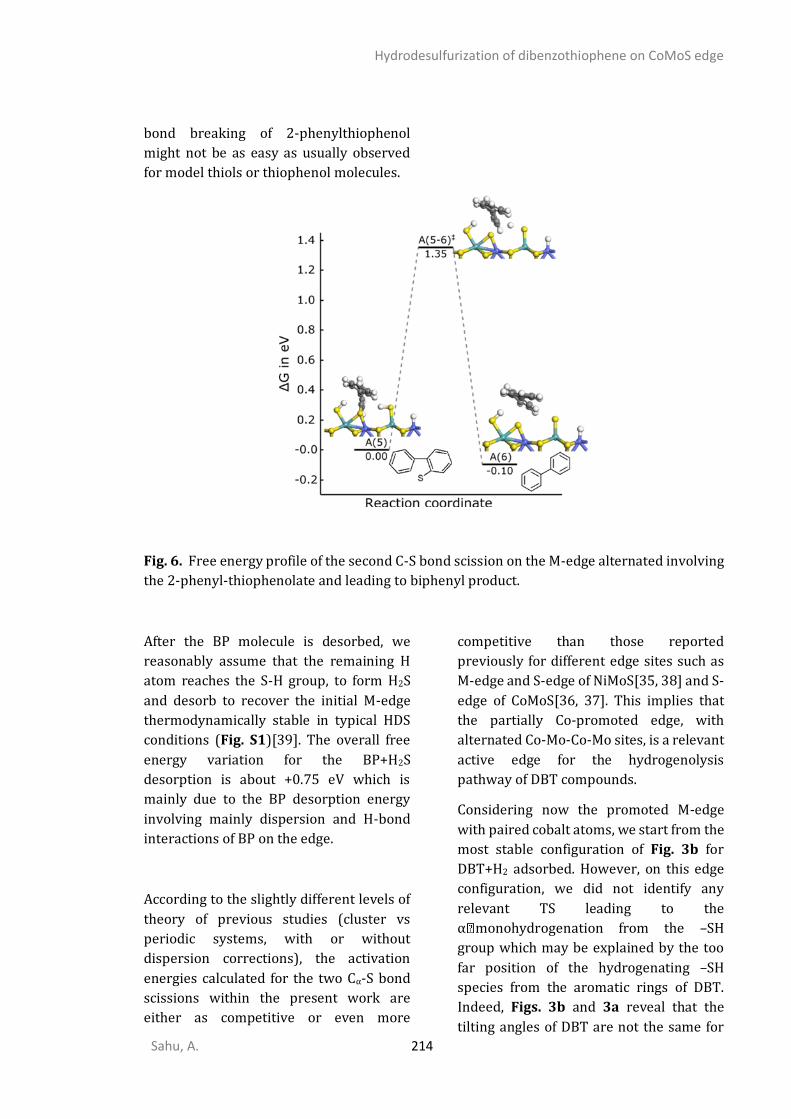
Hydrodesulfurization of dibenzothiophene on CoMoS edge
Sahu, A. 214
bond breaking of 2-phenylthiophenol
might not be as easy as usually observed
for model thiols or thiophenol molecules.
Fig. 6. Free energy profile of the second C-S bond scission on the M-edge alternated involving
the 2-phenyl-thiophenolate and leading to biphenyl product.
After the BP molecule is desorbed, we
reasonably assume that the remaining H
atom reaches the S-H group, to form H2S
and desorb to recover the initial M-edge
thermodynamically stable in typical HDS
conditions (Fig. S1)[39]. The overall free
energy variation for the BP+H2S
desorption is about +0.75 eV which is
mainly due to the BP desorption energy
involving mainly dispersion and H-bond
interactions of BP on the edge.
According to the slightly different levels of
theory of previous studies (cluster vs
periodic systems, with or without
dispersion corrections), the activation
energies calculated for the two Cα-S bond
scissions within the present work are
either as competitive or even more
competitive than those reported
previously for different edge sites such as
M-edge and S-edge of NiMoS[35, 38] and S-
edge of CoMoS[36, 37]. This implies that
the partially Co-promoted edge, with
alternated Co-Mo-Co-Mo sites, is a relevant
active edge for the hydrogenolysis
pathway of DBT compounds.
Considering now the promoted M-edge
with paired cobalt atoms, we start from the
most stable configuration of Fig. 3b for
DBT+H2 adsorbed. However, on this edge
configuration, we did not identify any
relevant TS leading to the
α monohydrogenation from the –SH
group which may be explained by the too
far position of the hydrogenating –SH
species from the aromatic rings of DBT.
Indeed, Figs. 3b and 3a reveal that the
tilting angles of DBT are not the same for
Hydrodesulfurization of dibenzothiophene on CoMoS edge
Sahu, A. 215
the promoted M-edge paired and unpaired
which impact the accessibility of –SH. By
contrast, the Co-H group which is located in
closer interaction with the aromatic will be
involved in these hydrogenation steps. We
tried to hydrogenate in α position from the
Co-H but the monohydrogenated
intermediate is not stable and the H atom
relaxes back to the Co site, while the S-C
bond cleavage was not found as possible
due to steric hindrance during the
rotational movement of the phenyl group.
The alternative possibility of the
hydrogenation in β position will be
discussed in the forthcoming sections.
D3. Dihydrogenation pathways leading to dihydrogenated DBT (DHDBT)
Case of the M-edge sites
As explained in introduction, we
investigate here the alternative DDS
pathway as proposed in the literature[24,
25] which consists in the preliminary
formation of the DHDBT intermediate with
Cα and Cβ hydrogenation occurring on the
same phenyl ring. If we restart our
investigation right after the first
monohydrogenation Cα-H step, the second
monohydrogenation of the molecule may
occur by transferring the second H atom on
Cβ However, our attempts to achieve this
second hydrogen transfer either failed or
involved energy costs greater than the
modest activation energy (+0.12 eV) found
for the first C-S bond breaking during the
rotation of the phenyl ring of α-
monohydrogenated DBT (as described
before). Thus, once α-monohydrogenated
DBT is formed by Cα hydrogenation, its
further Cβ hydrogenation seems to be
unfavored with respect to the easier Cα-S
bond breaking. To some extent, this result
may also explain why many theoretical
studies did not explore this pathway so far
and preferentially follows the
hydrogenolysis step. Alternatively, the
hydrogenation pathway must be initiated
by the hydrogenation of DBT in the Cβ
position as initially suggested by Mijoin et
al.[24]. Starting from DBT+H2 adsorption,
the free energy profile corresponding to
the two Cβ followed by Cα
monohydrogenation steps is reported in
Fig. 7.
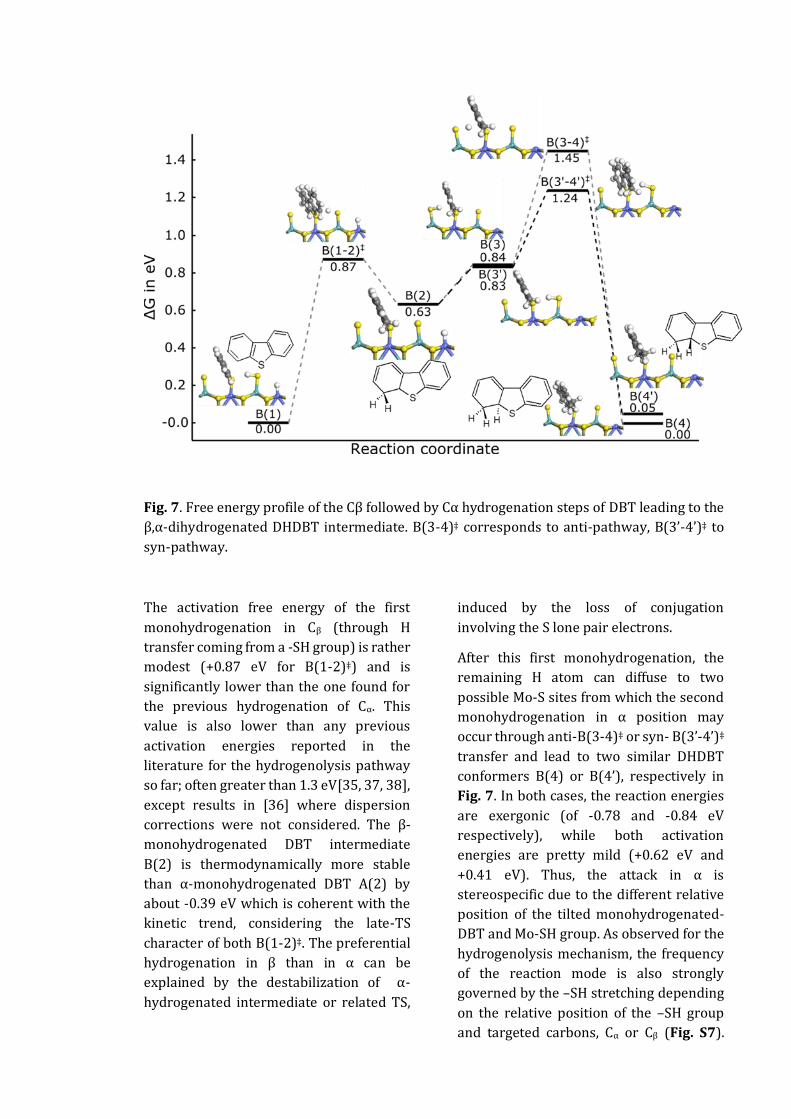
Fig. 7. Free energy profile of the Cβ followed by Cα hydrogenation steps of DBT leading to the
β,α-dihydrogenated DHDBT intermediate. B(3-4)‡ corresponds to anti-pathway, B(3’-4’)‡ to
syn-pathway.
The activation free energy of the first
monohydrogenation in Cβ (through H
transfer coming from a -SH group) is rather
modest (+0.87 eV for B(1-2)‡) and is
significantly lower than the one found for
the previous hydrogenation of Cα. This
value is also lower than any previous
activation energies reported in the
literature for the hydrogenolysis pathway
so far; often greater than 1.3 eV[35, 37, 38],
except results in [36] where dispersion
corrections were not considered. The β-
monohydrogenated DBT intermediate
B(2) is thermodynamically more stable
than α-monohydrogenated DBT A(2) by
about -0.39 eV which is coherent with the
kinetic trend, considering the late-TS
character of both B(1-2)‡. The preferential
hydrogenation in β than in α can be
explained by the destabilization of α-
hydrogenated intermediate or related TS,
induced by the loss of conjugation
involving the S lone pair electrons.
After this first monohydrogenation, the
remaining H atom can diffuse to two
possible Mo-S sites from which the second
monohydrogenation in α position may
occur through anti-B(3-4)‡ or syn- B(3’-4’)‡
transfer and lead to two similar DHDBT
conformers B(4) or B(4’), respectively in
Fig. 7. In both cases, the reaction energies
are exergonic (of -0.78 and -0.84 eV
respectively), while both activation
energies are pretty mild (+0.62 eV and
+0.41 eV). Thus, the attack in α is
stereospecific due to the different relative
position of the tilted monohydrogenated-
DBT and Mo-SH group. As observed for the
hydrogenolysis mechanism, the frequency
of the reaction mode is also strongly
governed by the –SH stretching depending
on the relative position of the –SH group
and targeted carbons, Cα or Cβ (Fig. S7).
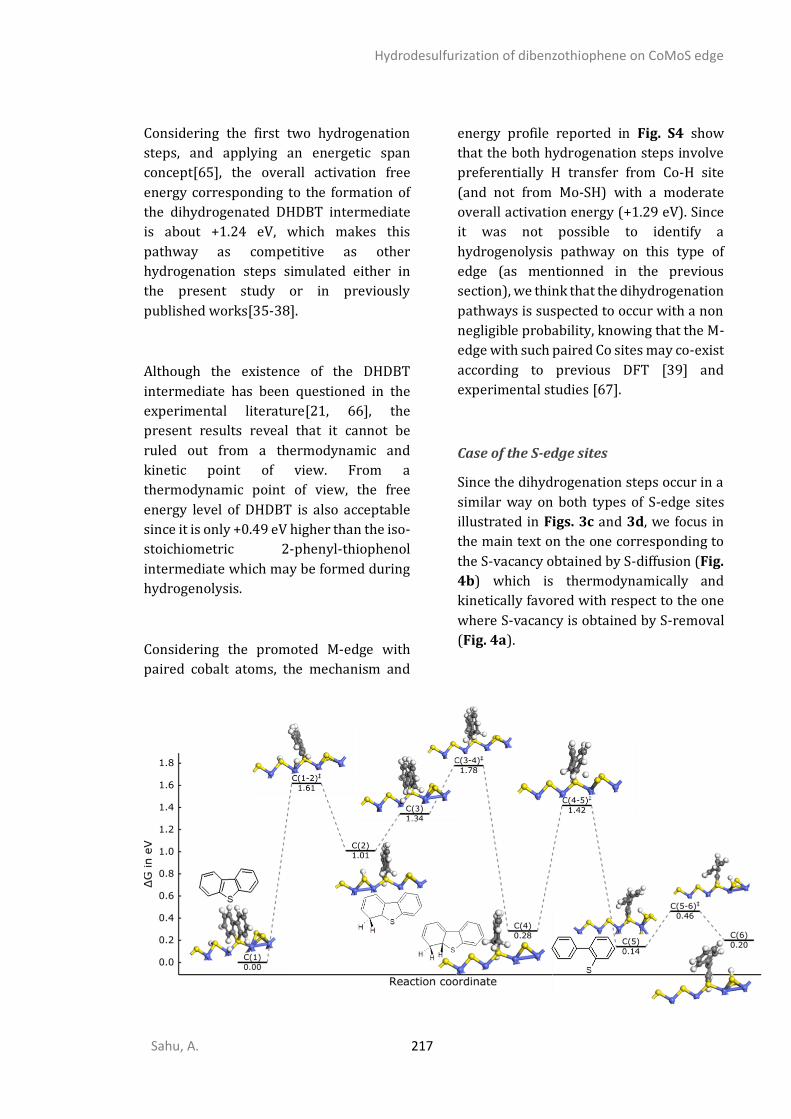
Hydrodesulfurization of dibenzothiophene on CoMoS edge
Sahu, A. 217
Considering the first two hydrogenation
steps, and applying an energetic span
concept[65], the overall activation free
energy corresponding to the formation of
the dihydrogenated DHDBT intermediate
is about +1.24 eV, which makes this
pathway as competitive as other
hydrogenation steps simulated either in
the present study or in previously
published works[35-38].
Although the existence of the DHDBT
intermediate has been questioned in the
experimental literature[21, 66], the
present results reveal that it cannot be
ruled out from a thermodynamic and
kinetic point of view. From a
thermodynamic point of view, the free
energy level of DHDBT is also acceptable
since it is only +0.49 eV higher than the iso-
stoichiometric 2-phenyl-thiophenol
intermediate which may be formed during
hydrogenolysis.
Considering the promoted M-edge with
paired cobalt atoms, the mechanism and
energy profile reported in Fig. S4 show
that the both hydrogenation steps involve
preferentially H transfer from Co-H site
(and not from Mo-SH) with a moderate
overall activation energy (+1.29 eV). Since
it was not possible to identify a
hydrogenolysis pathway on this type of
edge (as mentionned in the previous
section), we think that the dihydrogenation
pathways is suspected to occur with a non
negligible probability, knowing that the M-
edge with such paired Co sites may co-exist
according to previous DFT [39] and
experimental studies [67].
Case of the S-edge sites
Since the dihydrogenation steps occur in a
similar way on both types of S-edge sites
illustrated in Figs. 3c and 3d, we focus in
the main text on the one corresponding to
the S-vacancy obtained by S-diffusion (Fig.
4b) which is thermodynamically and
kinetically favored with respect to the one
where S-vacancy is obtained by S-removal
(Fig. 4a).

Hydrodesulfurization of dibenzothiophene on CoMoS edge
Sahu, A. 218
Fig. 8. Free energy profile of the DDS of DBT through β–dehydrogenation mechanism on the
S-edge with preliminary S-diffusion leading to the formation of one S-vacancy and one
neighboring S2 dimer.
From the H2 molecule dissociated on one S-
atom and on one Co-atom, the Co-H species
preferentially hydrogenates the two C
atoms in α and β positions because of the
unfavored orientation and distances of H
from –SH group and the two C atoms : ~3.5
Å from the S-H to the α and β positions,
compared to ~3 Å from the Co-H to the α
and β positions. So, the first Cα
monohydrogenation occurs through the
Co-H species with an activation free energy
of +1.61 eV (C(1-2)‡) and the second H also
transferred through Co-H with an overall
activation free energy +0.77 eV (including
H diffusion step from –SH to Co-H and then
C(3-4)‡). If we apply for the
dihydrogenation steps the energetic span
concept, we identify an overall activation
free energy of +1.78 eV, which is higher
than all activation free energies found on
the M-edge. Since, a similar trend is
reported for the S-edge site with S-vacancy
after S-removal (Fig. S6), this indicates
that the S-edge is less active for
hydrogenation steps than M-edge.
D4. S-C bond scission of DHDBT according to β-elimination (E2) mechanism
Interestingly, on the promoted S-edge with
S-vacancy and neighboring S2 dimer, the β-
elimination with simultaneous C-S bond
breaking can proceed with a reasonable
activation free energy of +1.14 eV for TS
C(4-5)‡ in Fig. 8. This mechanism involves
three chemical events as described in the
insets of Fig. 9: transfer of H in β position
to the edge S atom, C-S bond scission,
phenyl ring rotation and weakening of the
neighboring S2 dimer.
In order to confirm the validity of this
complex mechanism and more particularly
the connection between the reactant C(4),
TS C(4-5)‡, and product C(4), we undertook
a dedicated IRC analysis. This analysis
clearly shows the key role of the S2 dimer
which captures the Hβ-atom transferred
from the Cβ atom of DHDBT C(4) with the
reactive mode frequency of 925 cm-1.
Interestingly, this mode also fits the
correlation between frequency and SH
bond length previously discussed for the
hydrogenation steps (Fig. S7). In the
starting conformation of DHDBT, the Hβ
involved in the transfer is located in anti-
position to Hα which is the most favorable
position to reach one S of the dimer.
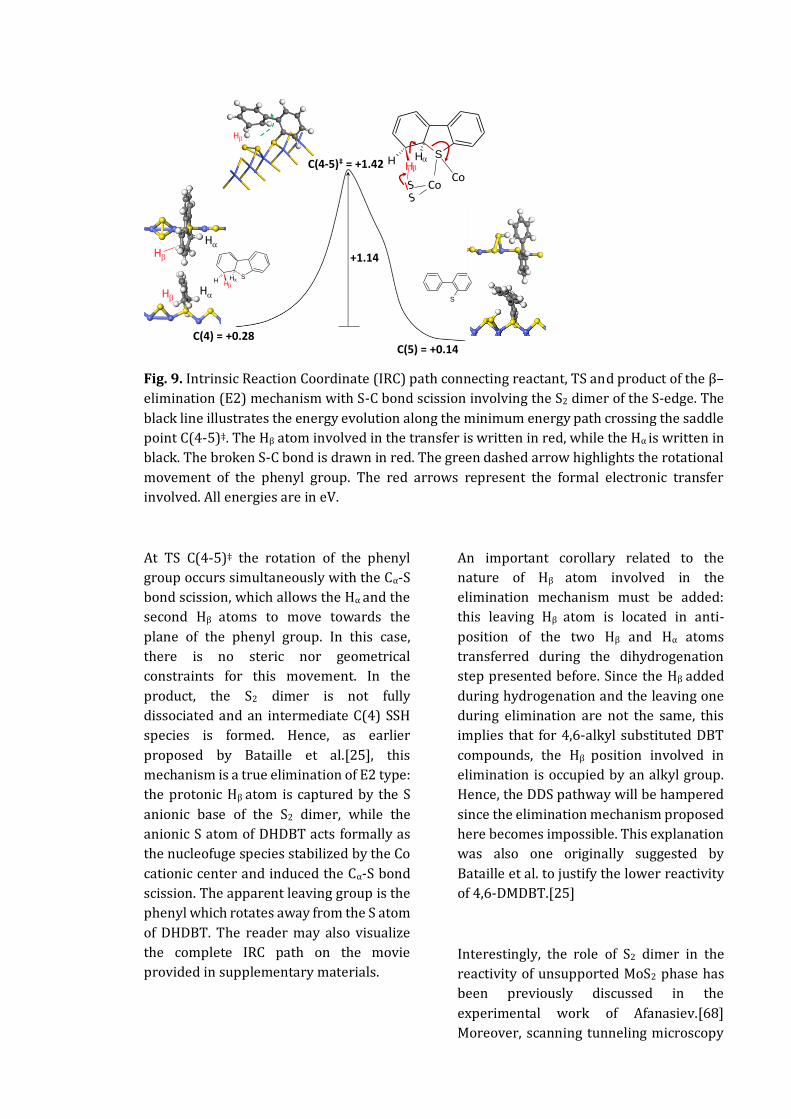
Fig. 9. Intrinsic Reaction Coordinate (IRC) path connecting reactant, TS and product of the β–
elimination (E2) mechanism with S-C bond scission involving the S2 dimer of the S-edge. The
black line illustrates the energy evolution along the minimum energy path crossing the saddle
point C(4-5)‡. The Hβ atom involved in the transfer is written in red, while the Hα is written in
black. The broken S-C bond is drawn in red. The green dashed arrow highlights the rotational
movement of the phenyl group. The red arrows represent the formal electronic transfer
involved. All energies are in eV.
At TS C(4-5)‡ the rotation of the phenyl
group occurs simultaneously with the Cα-S
bond scission, which allows the Hα and the
second Hβ atoms to move towards the
plane of the phenyl group. In this case,
there is no steric nor geometrical
constraints for this movement. In the
product, the S2 dimer is not fully
dissociated and an intermediate C(4) SSH
species is formed. Hence, as earlier
proposed by Bataille et al.[25], this
mechanism is a true elimination of E2 type:
the protonic Hβ atom is captured by the S
anionic base of the S2 dimer, while the
anionic S atom of DHDBT acts formally as
the nucleofuge species stabilized by the Co
cationic center and induced the Cα-S bond
scission. The apparent leaving group is the
phenyl which rotates away from the S atom
of DHDBT. The reader may also visualize
the complete IRC path on the movie
provided in supplementary materials.
An important corollary related to the
nature of Hβ atom involved in the
elimination mechanism must be added:
this leaving Hβ atom is located in anti-
position of the two Hβ and Hα atoms
transferred during the dihydrogenation
step presented before. Since the Hβ added
during hydrogenation and the leaving one
during elimination are not the same, this
implies that for 4,6-alkyl substituted DBT
compounds, the Hβ position involved in
elimination is occupied by an alkyl group.
Hence, the DDS pathway will be hampered
since the elimination mechanism proposed
here becomes impossible. This explanation
was also one originally suggested by
Bataille et al. to justify the lower reactivity
of 4,6-DMDBT.[25]
Interestingly, the role of S2 dimer in the
reactivity of unsupported MoS2 phase has
been previously discussed in the
experimental work of Afanasiev.[68]
Moreover, scanning tunneling microscopy
C(4) = +0.28
C(4-5)‡ = +1.42
C(5) = +0.14
+1.14
a
HbHa
Ha
Hb
S
CoCo
b
SH
H H
SH
H Hb
Hb
a
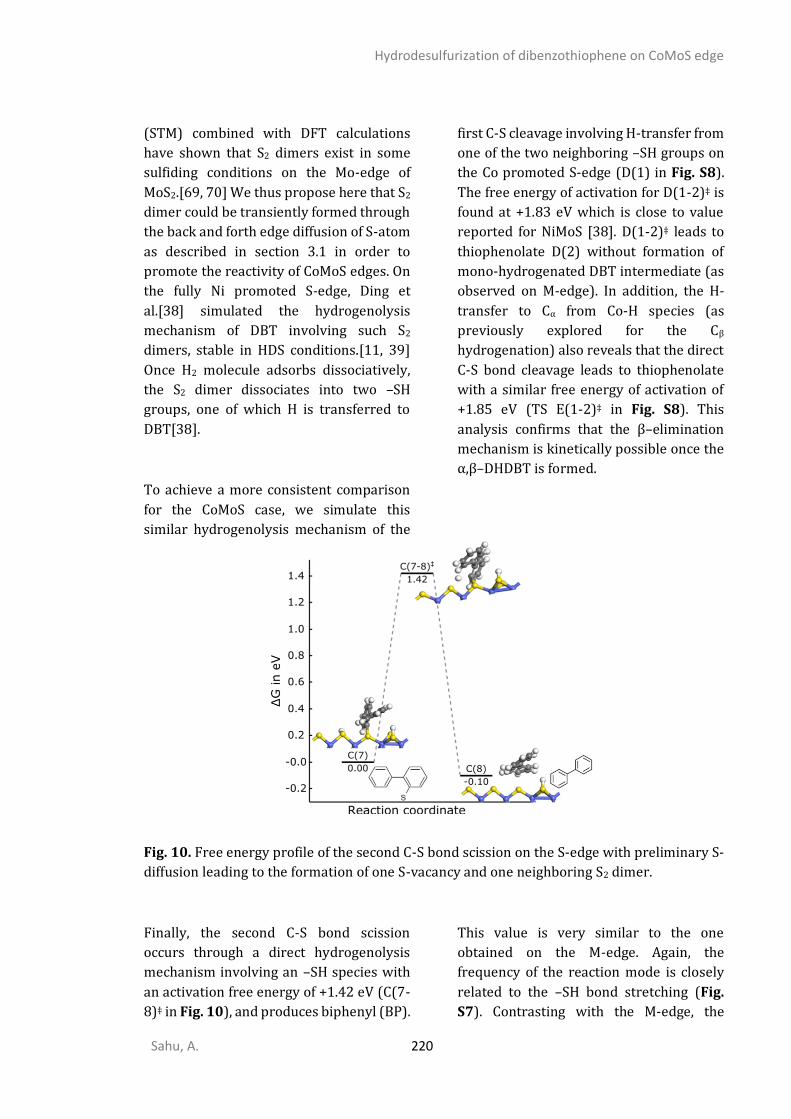
Hydrodesulfurization of dibenzothiophene on CoMoS edge
Sahu, A. 220
(STM) combined with DFT calculations
have shown that S2 dimers exist in some
sulfiding conditions on the Mo-edge of
MoS2.[69, 70] We thus propose here that S2
dimer could be transiently formed through
the back and forth edge diffusion of S-atom
as described in section 3.1 in order to
promote the reactivity of CoMoS edges. On
the fully Ni promoted S-edge, Ding et
al.[38] simulated the hydrogenolysis
mechanism of DBT involving such S2
dimers, stable in HDS conditions.[11, 39]
Once H2 molecule adsorbs dissociatively,
the S2 dimer dissociates into two –SH
groups, one of which H is transferred to
DBT[38].
To achieve a more consistent comparison
for the CoMoS case, we simulate this
similar hydrogenolysis mechanism of the
first C-S cleavage involving H-transfer from
one of the two neighboring –SH groups on
the Co promoted S-edge (D(1) in Fig. S8).
The free energy of activation for D(1-2)‡ is
found at +1.83 eV which is close to value
reported for NiMoS [38]. D(1-2)‡ leads to
thiophenolate D(2) without formation of
mono-hydrogenated DBT intermediate (as
observed on M-edge). In addition, the H-
transfer to Cα from Co-H species (as
previously explored for the Cβ
hydrogenation) also reveals that the direct
C-S bond cleavage leads to thiophenolate
with a similar free energy of activation of
+1.85 eV (TS E(1-2)‡ in Fig. S8). This
analysis confirms that the β–elimination
mechanism is kinetically possible once the
α,β–DHDBT is formed.
Fig. 10. Free energy profile of the second C-S bond scission on the S-edge with preliminary S-
diffusion leading to the formation of one S-vacancy and one neighboring S2 dimer.
Finally, the second C-S bond scission
occurs through a direct hydrogenolysis
mechanism involving an –SH species with
an activation free energy of +1.42 eV (C(7-
8)‡ in Fig. 10), and produces biphenyl (BP).
This value is very similar to the one
obtained on the M-edge. Again, the
frequency of the reaction mode is closely
related to the –SH bond stretching (Fig.
S7). Contrasting with the M-edge, the
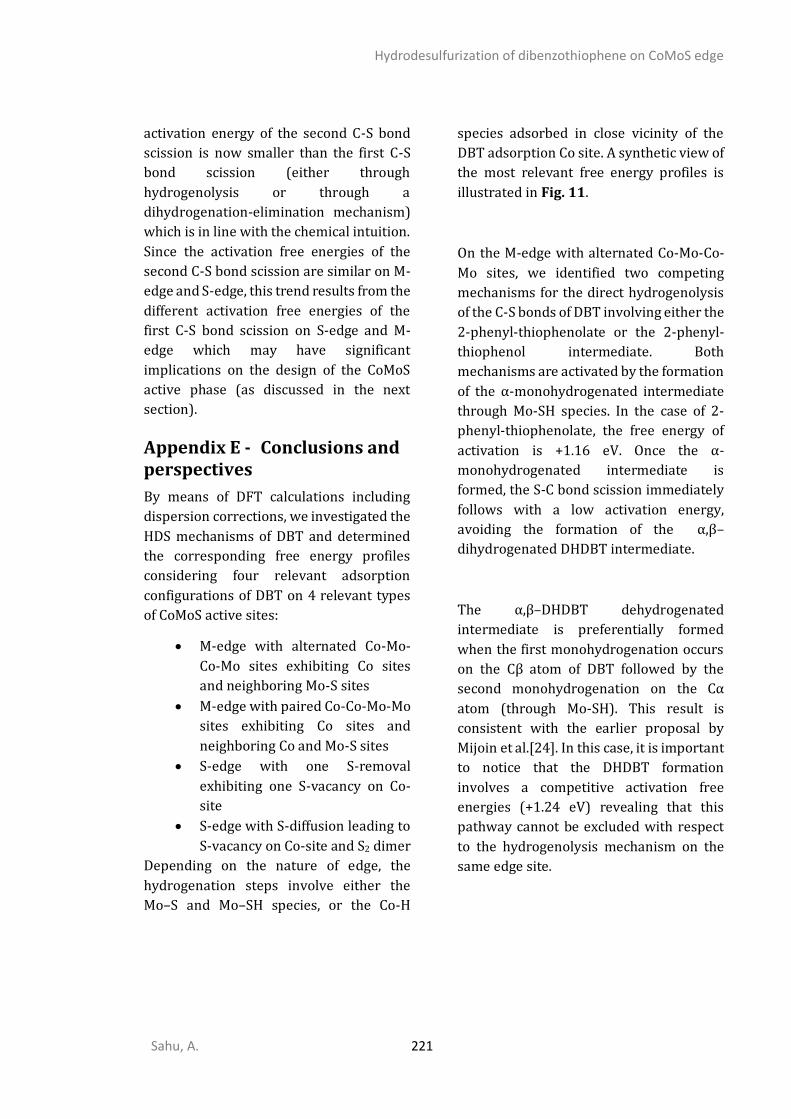
Hydrodesulfurization of dibenzothiophene on CoMoS edge
Sahu, A. 221
activation energy of the second C-S bond
scission is now smaller than the first C-S
bond scission (either through
hydrogenolysis or through a
dihydrogenation-elimination mechanism)
which is in line with the chemical intuition.
Since the activation free energies of the
second C-S bond scission are similar on M-
edge and S-edge, this trend results from the
different activation free energies of the
first C-S bond scission on S-edge and M-
edge which may have significant
implications on the design of the CoMoS
active phase (as discussed in the next
section).
Appendix E - Conclusions and perspectives
By means of DFT calculations including
dispersion corrections, we investigated the
HDS mechanisms of DBT and determined
the corresponding free energy profiles
considering four relevant adsorption
configurations of DBT on 4 relevant types
of CoMoS active sites:
• M-edge with alternated Co-Mo-
Co-Mo sites exhibiting Co sites
and neighboring Mo-S sites
• M-edge with paired Co-Co-Mo-Mo
sites exhibiting Co sites and
neighboring Co and Mo-S sites
• S-edge with one S-removal
exhibiting one S-vacancy on Co-
site
• S-edge with S-diffusion leading to
S-vacancy on Co-site and S2 dimer
Depending on the nature of edge, the
hydrogenation steps involve either the
Mo–S and Mo–SH species, or the Co-H
species adsorbed in close vicinity of the
DBT adsorption Co site. A synthetic view of
the most relevant free energy profiles is
illustrated in Fig. 11.
On the M-edge with alternated Co-Mo-Co-
Mo sites, we identified two competing
mechanisms for the direct hydrogenolysis
of the C-S bonds of DBT involving either the
2-phenyl-thiophenolate or the 2-phenyl-
thiophenol intermediate. Both
mechanisms are activated by the formation
of the α-monohydrogenated intermediate
through Mo-SH species. In the case of 2-
phenyl-thiophenolate, the free energy of
activation is +1.16 eV. Once the α-
monohydrogenated intermediate is
formed, the S-C bond scission immediately
follows with a low activation energy,
avoiding the formation of the α,β–
dihydrogenated DHDBT intermediate.
The α,β–DHDBT dehydrogenated
intermediate is preferentially formed
when the first monohydrogenation occurs
on the Cβ atom of DBT followed by the
second monohydrogenation on the Cα
atom (through Mo-SH). This result is
consistent with the earlier proposal by
Mijoin et al.[24]. In this case, it is important
to notice that the DHDBT formation
involves a competitive activation free
energies (+1.24 eV) revealing that this
pathway cannot be excluded with respect
to the hydrogenolysis mechanism on the
same edge site.
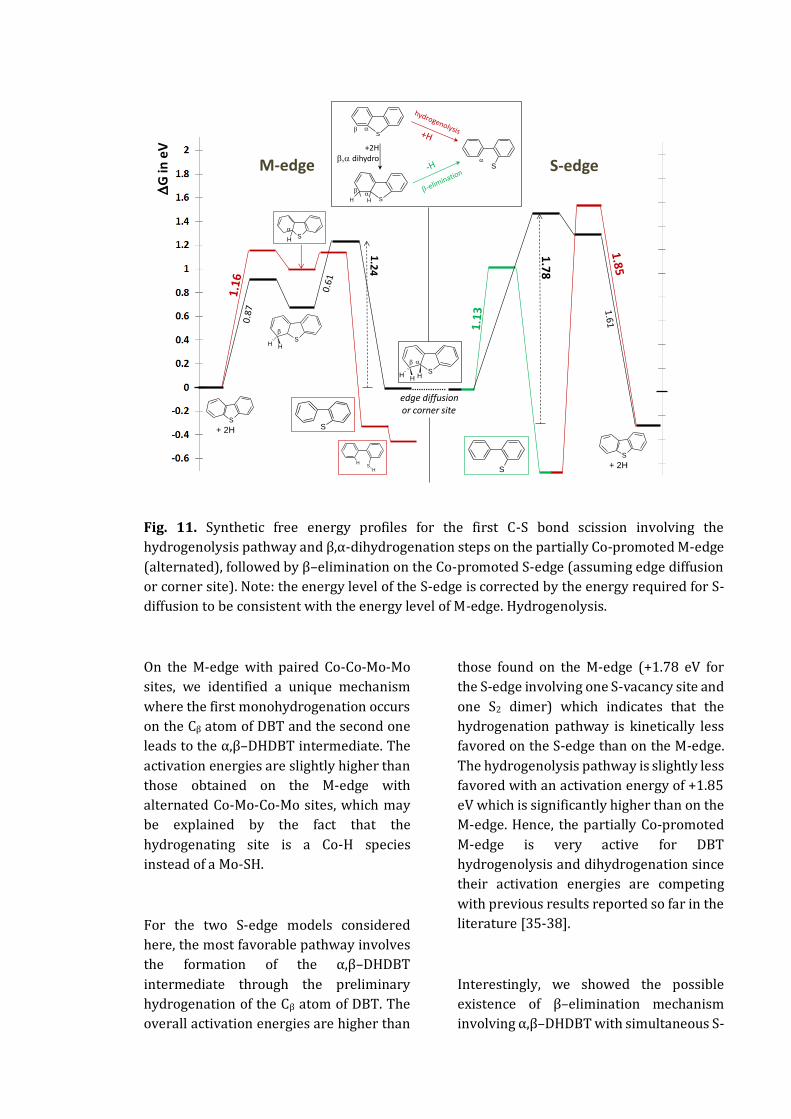
Fig. 11. Synthetic free energy profiles for the first C-S bond scission involving the
hydrogenolysis pathway and β,α-dihydrogenation steps on the partially Co-promoted M-edge
(alternated), followed by β–elimination on the Co-promoted S-edge (assuming edge diffusion
or corner site). Note: the energy level of the S-edge is corrected by the energy required for S-
diffusion to be consistent with the energy level of M-edge. Hydrogenolysis.
On the M-edge with paired Co-Co-Mo-Mo
sites, we identified a unique mechanism
where the first monohydrogenation occurs
on the Cβ atom of DBT and the second one
leads to the α,β–DHDBT intermediate. The
activation energies are slightly higher than
those obtained on the M-edge with
alternated Co-Mo-Co-Mo sites, which may
be explained by the fact that the
hydrogenating site is a Co-H species
instead of a Mo-SH.
For the two S-edge models considered
here, the most favorable pathway involves
the formation of the α,β–DHDBT
intermediate through the preliminary
hydrogenation of the Cβ atom of DBT. The
overall activation energies are higher than
those found on the M-edge (+1.78 eV for
the S-edge involving one S-vacancy site and
one S2 dimer) which indicates that the
hydrogenation pathway is kinetically less
favored on the S-edge than on the M-edge.
The hydrogenolysis pathway is slightly less
favored with an activation energy of +1.85
eV which is significantly higher than on the
M-edge. Hence, the partially Co-promoted
M-edge is very active for DBT
hydrogenolysis and dihydrogenation since
their activation energies are competing
with previous results reported so far in the
literature [35-38].
Interestingly, we showed the possible
existence of β–elimination mechanism
involving α,β–DHDBT with simultaneous S-
+ 2H
SHH
SH
H H
G
in e
V
S
edge diffusion
S
or corner site
SH
S
SH
H2
S
S
SHH
+2Hb,a dihydro
ab
a
ab
b
b
a
a
1.7
8
S-edgeM-edge
+ 2H
S
Hydrodesulfurization of dibenzothiophene on CoMoS edge
Sahu, A. 223
C scission, corresponding to elimination of
E2 type as earlier proposed by Bataille et
al.[25]. The corresponding activation free
energy of +1.13 eV reveals that this
mechanism is strongly competing with the
hydrogenolysis pathway calculated on the
M-edge sites (present work) or on other
sites reported in the literature[35, 37, 38].
For that, the transient local architecture of
the active sites must combine one S-
vacancy (CUS) together with one
neighboring S2 dimer which is directly
involved as active center for the β–
elimination. This architecture results from
the back and forth diffusion process of S-
atom on the edge which involves free
energy barriers compatible with the whole
HDS mechanism. The back and forth S-
diffusion is also more favorable than the S-
removal process. From an experimental
point of view, we hope that future progress
of operando spectroscopies will help to
identify the presence of such transient S2
species during HDS and their role on the β-
elimination pathway.
At this stage, it was not possible to identify
a TS for the β–elimination mechanism on
the M-edge. Due to the rather complex
intrinsic nature of the TS involving several
intricated bond cleavage and formation as
observed on the S-edge, progress on
theoretical approach based on biased ab
initio molecular dynamics will help to solve
this open question.[71] In the present
state, we propose that a possible optimal
scenario for the hydrodesulfurization of
DBT should actually combine both edges as
illustrated in Fig. 11. The M-edge initiates
the formation of the α,β–DHDBT
intermediate at moderate activation
energy. Then, DHDBT should diffuse from
the M-edge to the S-edge. Although more
investigation is required in the future on
this event, diffusion seems possible
considering the very close energy levels of
DHDBT on both edges. Then, β–elimination
mechanism with C-S bond scission occurs
on the S-edge. Since previous studies [10,
37, 38, 70] suggested the specific role of
corner sites, a DHDBT molecule formed on
such a corner site could also benefit from a
synergy effect between the close vicinity of
the two edges. However, such a scenario
requires specific design of the active phase
where partial promotion of the M-edge and
full promotion of the S-edge are
simultaneously present on the CoMoS
nano-crystallites. Standard CoMoS
catalysts may not provide such an optimal
configuration which requires to carefully
tune CoMoS morphology, Co/Mo ratio and
edge distribution of Co atom during the
synthesis or activation steps, as proposed
for other HDS reaction.[9]
Finally, during the β–elimination
mechanism identified here, the leaving Hβ
atom is distinct from the Hβ atom added at
hydrogenation steps. This may explain for
one part, the strong decrease of the DDS
pathway of 4,6-alkyl substituted DBT
compounds where only one Hβ atom is
available. In addition, we suggest to
investigate the impact of akyl substituents
on the rotational movement of the phenyl-
group at transition states and on the
corresponding activation energies
identified in the present work, as a function
of the edge sites. This would also enable to
analyse the origin of the DDS/HYD
pathways as a function of the reactant and
of the active phase features. In order to
better discriminate more clearly between
these mechanisms, it would be also
welcome to establish a microkinetic model
based on the present DFT data.
Aknowledgements
Hydrodesulfurization of dibenzothiophene on CoMoS edge
Sahu, A. 224
The authors would like to thank T. Bučko
(Comenius University in Bratislava) and J.
Rey (IFP Energies nouvelles – Ecole
Normale Supérieure de Lyon) for fruitfull
discussions and advice on IRC analysis.
Fundings
Calculations were performed using HPC
resources (Jean Zay and Occigen) from
GENCI-CINES (Grant A0020806134) and
ENER 440 from IFP Energies nouvelles.
This work is part of the “RatiOnAl Design
for CATalysis” (ROAD4CAT) industrial
chair, project IDEXLYON funded by the
French National Research Agency (ANR-
16-IDEX-0005) and the Commissariat-
General for Investment (CGI) within the
framework of Investissements d’Avenir
program (“Investment for the future”).
References
[1] R. Prins, Handbook of Heterogeneous
Catalysis, Wiley-VHC Verlagsgesellschaft,
Weinheim, 1997.
[2] H. Toulhoat, P. Raybaud, Catalysis by
Transition Metal Sulfides. From molecular
theory to industrial applications., Technip Edition, Paris (France), 2013.
[3] H. Topsøe, B.S. Clausen, F.E. Massoth,
Hydrotreating Catalysis - Science and Technology, Springer-Verlag,
Berlin/Heidelberg, 1996.
[4] H. Topsøe, B.S. Clausen, R. Candia, C.
Wivel, S. Mørup, J. Catal. 68 (1981) 433.
[5] I. Alstrup, I. Chorkendorff, R. Candia,
B.S. Clausen, H. Topsoe, J. Catal. 77 (1982) 397.
[6] B.S. Clausen, H. Topsøe, Hyperfine
Interact. 47 (1989) 203.
[7] S.M.A.M. Bouwens, J.A.R.v. Veen, D.C.
Koningsberger, V.H.J.d. Beer, R. Prins, J.
Phys. Chem. 95 (1991) 123.
[8] J.V. Lauritsen, M.V. Bollinger, E.
Lægsgaard, K.W. Jacobsen, J.K. Nørskov, B.S. Clausen, H. Topsøe, F. Besenbacher, J.
Catal. 221 (2004) 510.
[9] B. Baubet, M. Girleanu, A.-S. Gay, A.-L. Taleb, M. Moreaud, F. Wahl, V. Delattre, E.
Devers, A. Hugon, O. Ersen, P. Afanasiev, P.
Raybaud, ACS Catal. 6 (2016) 1081.
[10] S. Kasztelan, H. Toulhoat, J. Grimblot,
J.P. Bonnelle, Appl. Catal. 13 (1984) 127.
[11] H. Schweiger, P. Raybaud, H. Toulhoat,
J. Catal. 212 (2002) 33.
[12] L.S. Byskov, J.K. Nørskov, B.S. Clausen,
H. Topsøe, J. Catal. 187 (1999) 109.
[13] P. Raybaud, Appl. Catal. A: Gen. 322
(2007) 76.
[14] X.L. Ma, K.Y. Sakanishi, I. Mochida, Ind. Eng. Chem. Res. 33 (1994) 218.
[15] U.T. Turaga, C.S. Song, Catal. Today 86
(2003) 129.
[16] D.D. Whitehurst, T. Isoda, I. Mochida,
Advances in Catalysis, Vol 42 42 (1998)
345.
[17] B.C. Gates, H. Topsøe, Polyhedron 16
(1997) 3213.
[18] M. Daage, R.R. Chianelli, J. Catal. 149 (1994) 414.
[19] E.O. Orozco, M. Vrinat, Appl. Catal. A:
General 170 (1998) 195.
[20] V. Vanrysselberghe, R. Le Gall, G.F.
Froment, Ind. Eng. Chem. Res. 37 (1998)
1235.
[21] M. Egorova, R. Prins, J. Catal. 225
(2004) 417.
[22] G.H. Singhal, R.L. Espino, J.E. Sobel, G.A.
Huff, J. Catal. 67 (1981) 457.
Hydrodesulfurization of dibenzothiophene on CoMoS edge
Sahu, A. 225
[23] V. Lamure-Meille, E. Schulz, M.
Lemaire, M. Vrinat, Applied Catalysis A:
General 131 (1995) 143.
[24] J. Mijoin, G. Perot, F. Bataille, J.L.
Lemberton, M. Breysse, S. Kasztelan, Catal. Lett. 71 (2001) 139.
[25] F. Bataille, J.L. Lemberton, P. Michaud,
G. Perot, M. Vrinat, M. Lemaire, E. Schulz, M. Breysse, S. Kasztelan, J. Catal. 191 (2000)
409.
[26] D.H. Broderick, B.C. Gates, AIChE J. 27 (1981) 663.
[27] V. Meille, E. Schulz, M. Lemaire, M.
Vrinat, J. Catal. 170 (1997) 29.
[28] M. Egorova, R. Prins, J. Catal. 241
(2006) 162.
[29] A.K. Tuxen, H.G. Füchtbauer, B. Temel,
B. Hinnemann, H. Topsøe, K.G. Knudsen, F.
Besenbacher, J.V. Lauritsen, J. Catal. 295
(2012) 146.
[30] J.V. Lauritsen, F. Besenbacher, J. Catal.
328 (2015) 49.
[31] S.S. Gronborg, M. Saric, P.G. Moses, J. Rossmeisl, J.V. Lauritsen, J. Catal. 344
(2016) 121.
[32] S. Humbert, G. Izzet, P. Raybaud, J. Catal. 333 (2016) 78.
[33] D.H. Broderick, A.V. Sapre, B.C. Gates,
H. Kwart, G.C.A. Schuit, J. Catal. 73 (1982) 45.
[34] S. Cristol, J.F. Paul, E. Payen, D.
Bougeard, F. Hutschka, S. Clemendot, J. Catal. 224 (2004) 138.
[35] T. Weber, J.A.R. Van Veen, Catal. Today
130 (2008) 170.
[36] J.-F. Paul, S. Cristol, E. Payen, Catal.
Today 130 (2008) 139.
[37] M. Saric, J. Rossmeisl, P.G. Moses, J. Catal. 358 (2018) 131.
[38] S.J. Ding, Y.S. Zhou, Q. Wei, S.J. Jiang,
W.W. Zhou, Catal. Today 305 (2018) 28.
[39] E. Krebs, B. Silvi, P. Raybaud, Catal.
Today 130 (2008) 160.
[40] A.D. Gandubert, E. Krebs, C. Legens, D. Costa, D. Guillaume, P. Raybaud, Catal.
Today 130 (2008) 149.
[41] A. Travert, C. Dujardin, F. Maugé, E. Veilly, S. Cristol, J.-F. Paul, E. Payen, J. Phys.
Chem. B 110 (2006) 1261.
[42] F. Caron, M. Rivallan, S. Humbert, A. Daudin, S. Bordiga, P. Raybaud, J. Catal. 361
(2018) 62.
[43] P. Hohenberg, W. Kohn, Phys. Rev. B
136 (1964) 864.
[44] W. Kohn, L.J. Sham, Phys. Rev. A 140
(1965) 1133.
[45] G. Kresse, J. Furthmüller, Comput.
Mater. Sci. 6 (1996) 15.
[46] G. Kresse, J. Furthmüller, Phys. Rev. B 54 (1996) 11169.
[47] J.P. Perdew, K. Burke, M. Ernzerhof,
Phys. Rev. Lett. 77 (1996) 3865.
[48] G. Kresse, D. Joubert, Phys. Rev. B 59
(1999) 1758.
[49] S.N. Steinmann, C. Corminboeuf, J. Chem. Phys. 134 (2011).
[50] S.N. Steinmann, C. Corminboeuf, J.
Chem. Theory Comput. 7 (2011) 3567.
[51] M. Saab, P. Raybaud, J. Phys. Chem. C
120 (2016) 10691.
[52] E. Krebs, B. Silvi, A. Daudin, P. Raybaud, J. Catal. 260 (2008) 276.
[53] P. Fleurat-Lessard, Opt'n path
software, http://pfleurat.free.fr/ReactionPath.php,
in.
[54] G. Henkelman, H. Jonsson, J. Chem. Phys. 113 (2000) 9978.
Hydrodesulfurization of dibenzothiophene on CoMoS edge
Sahu, A. 226
[55] G. Henkelman, B.P. Uberuaga, H.
Jonsson, J. Chem. Phys. 113 (2000) 9901.
[56] G. Henkelman, H. Jónsson, J. Chem.
Phys. 111 (1999) 7010.
[57] K. Fukui, The Journal of Physical Chemistry 74 (1970) 4161.
[58] K. Fukui, Acc. Chem. Res. 14 (1981)
363.
[59] B.A. De Moor, M.-F. Reyniers, G.B.
Marin, Phys. Chem. Chem. Phys. 11 (2009)
2939.
[60] A. Travert, H. Nakamura, R.A. van
Santen, S. Cristol, J.F. Paul, E. Payen, J. Am.
Chem. Soc. 124 (2002) 7084.
[61] A.B. Anderson, Z.Y. Alsaigh, W.K. Hall,
J. Phys. Chem. 92 (1988) 803.
[62] T. Todorova, R. Prins, T. Weber, J.
Catal. 236 (2005) 190.
[63] T. Todorova, R. Prins, T. Weber, J.
Catal. 246 (2007) 109.
[64] C. Dupont, R. Lemeur, A. Daudin, P.
Raybaud, J. Catal. 279 (2011) 276.
[65] S. Kozuch, S. Shaik, Acc. Chem. Res. 44 (2011) 101.
[66] Y. Sun, R. Prins, J. Catal. 267 (2009)
193.
[67] Y. Okamoto, M. Kawano, T. Kawabata,
T. Kubota, I. Hiromitsu, J. Phys. Chem. B 109
(2005) 288.
[68] P. Afanasiev, J. Catal. 269 (2010) 269.
[69] M.V. Bollinger, J.V. Lauritsen, K.W. Jacobsen, J.K. Norskov, S. Helveg, F.
Besenbacher, Phys. Rev. Lett. 87 (2001).
[70] H. Schweiger, P. Raybaud, G. Kresse, H. Toulhoat, J. Catal. 207 (2002) 76.
[71] J. Rey, C. Bignaud, P. Raybaud, T.
Bučko, C. Chizallet, Angewandte Chemie International Edition 59 (2020) 18938.

Sahu, A. 227