A Type-A chalcone isomerase mRNA is highly expressed in the root nodules ofElaeagnus umbellate
Upload
independentCategory
view
1download
0
Molecular Dynamics Study of Triosephosphate Isomerase fromTrypanosoma cruziinWater/Decane Mixtures
Norma Dıaz-Vergara and AÄ ngel Pineiro*Departamento de Fisicoquı´mica, Facultad de Quı´mica, UniVersidad Nacional Auto´noma de Me´xico, UNAM,Ciudad UniVersitaria 04510, Me´xico D.F., Mexico
ReceiVed: October 22, 2007; In Final Form: December 10, 2007
A comprehensive study of the triosephosphate isomerase from the parasiteTrypanosoma cruzi(TcTIM) inwater, in decane, and in three water/decane mixtures was performed using molecular dynamics (MD)simulations in a time scale of 40 ns. The structure and dynamics of the enzyme, as well as the solvent molecules’distribution and mobility, were analyzed in detail. In the presence of decane, the amplitudes of the mostimportant internal motions of the enzyme backbone were observed to depend on the solvent concentration:the higher the water concentration, the greater the amplitudes. Contrary to this trend, the amplitudes of theTcTIM motions in pure water were similar to those of the simulation with the lowest water concentration.The enzyme was observed to be almost motionless in pure decane due to a sharp increase of the number ofintramolecular hydrogen bonds. This caused a contraction of the enzyme structure accompanied by a loss ofsecondary structure and of a decrease of the hydrophilic solvent accessible surface. A similar behavior, althoughto a lesser extent, was observed in the simulation at the lowest water concentration. Our results suggest thatthe presence of decane molecules located at specific sites of the enzyme might accelerate its internal movements,although a minimum number of water molecules is needed for the protein to keep its structure and dynamics.Altogether, this work provides new insight into protein and water behavior in organic solvents as well as intothe dynamics of TcTIM itself.
1. Introduction
An interesting relationship connecting rigidity, thermal stabil-ity, and catalytic activity of enzymes has been proposed byseveral authors in the past: the higher the flexibility and activityof the enzyme, the lower its unfolding temperature is.1 There-fore, it appears that, throughout evolution, proteins have soughta balance between flexibility and thermal stability, which allowsthem to achieve their biological function and, at the same time,to preserve a well-defined average structure. Water plays anessential role in this context.2,3 It is well-known that watermolecules located in the vicinity of a solute show differencesin their organization and hence in their thermodynamic,dynamic, and electrostatic properties, when compared to bulkwaters.4-6 The water behavior at a molecular level can bestrongly affected by the presence of cosolvents, and this iscritical for the dynamics of macromolecules.
In the middle 1980s, Zaks and Klibanov found that thecatalytic activity of several enzymes, when they are suspendedin hydrophobic solvents at low water concentrations, is com-parable or even higher than in aqueous solution.7-11 On the basisof their studies, they concluded that the more hydrophobic themain solvent, the less water is needed to maintain proteinactivity.10 Moreover, the same authors claimed that water actsas a lubricant, forming hydrogen bonds with accessible groupsof enzymes and providing them with the flexibility necessaryfor catalysis.10 Such explanations are generally accepted,although no direct evidence has been provided. The activity ofenzymes under those conditions, or when they are trapped in
reverse micelles,12,13became more than a curiosity when severalbiotechnological applications were proposed, taking advantageof this alternative.14-18 To date, no experimental technique hasbeen able to provide a detailed structural-dynamics descriptionof this phenomenon. To survey this issue, a number of MDsimulation studies of proteins in water/organic solvent mixtureshave been performed.19-29 However, the short time scaleemployed (7 ns for the longest trajectories) did not allow theobservation of clear protein structural-dynamic differencesbetween the several conditions considered. In 2003, Soares etal.19 reported the first systematic study of two model proteins(ubiquitin and cutinase) in hexane, under varying hydrationconditions. Although they found correlations between root-mean-square deviations (RMSD), root-mean-square fluctuations(RMSF), and the percentage of water in the system, theiranalysis was performed only over the last 2 ns of 4 ns longtrajectories. No significant protein backbone motions areexpected at that time scale, so the observed fluctuations shouldbe mainly due to the dynamics of the amino acid side chains.A high degree of dispersion, which the authors justified by theprobable unstability of the initial structures, was observed inthese simulations. Yang et al.27 performed MD simulations ofsurfactant-solubilized subtilisin BPN′ in octane, tetrahydrofuran,and acetonitrile at two hydration conditions and at a time scaleof ∼4 ns. The enzyme did not show significant structural ordynamic solvent-dependent differences. Then, the authorsfocused their analysis on the partition of water moleculesbetween the surface of the protein and the organic phase andon the hydration of the active site. Very recently, Micaelo andSoares28 published a comprehensive study of the hydrationmechanism of cutinase in hexane, diisopropyl ether, 3-pen-tanone, ethanol, and acetonitrile with increasing hydration levels
* Corresponding author. E-mail: [email protected]. Current address: De-partment of Applied Physics, Faculty of Physics, University of Santiagode Compostela, E-15782 Santiago de Compostela, Spain.
3529J. Phys. Chem. B2008,112,3529-3539
10.1021/jp7102275 CCC: $40.75 © 2008 American Chemical SocietyPublished on Web 02/27/2008

at a time scale of 7 ns. Slight structural changes were observedin the enzyme, but no analysis of its dynamics was performed.This latter work was mainly focused on the water behavior.These representative studies revealed the lack of MD simulationsat longer time scales that could provide new insight into thestructure and dynamics of enzymes at low water concentrationsas well as into the role of the solvent for protein function.
In the present work, 40 ns long MD simulations of triose-phosphate isomerase from the parasiteTrypanosoma cruzi(TcTIM) in several water/decane mixtures were performed. Asa reference, two simulations of the same enzyme in pure decaneand pure water, respectively, at the same time scale were carriedout. TcTIM is a homodimeric enzyme with 251 residues persubunit, which folds in the so-calledR/â-barrel motif with eightcentralâ-strands surrounded by eightR-helices.30 This enzymewas chosen because it was experimentally proven31 that TIMsfrom other species show a high catalytic activity at low waterconcentrations. Besides, it is a well-liked target for drugs againstAmerican tripanosomiasis, better known as Chagas’ disease.30-37
A detailed analysis of the protein structure and dynamics, aswell as of the solvent molecules’ behavior, was performed underdifferent conditions. The main objective of this work was tolook for concentration-dependent differences in the protein andsolvent behavior that could provide new insight into theunderstanding of the catalytic activity of enzymes in organicmedia. Additionally, the dynamic study of TcTIM in pure waterby itself, one of the reference simulations in this work, couldbe helpful to better understand this enzyme and then to designor improve inhibitors. No MD studies of enzymes in organicsolvents at low water concentrations, and either of TIM inaqueous media, at the time scale of tens of nanoseconds havebeen performed previously.
2. Materials and Methods
2.1. Setup of the Simulation Boxes.Six simulation systemswere built up with one TcTIM molecule and different amountsof water as well as decane, forming a nonpolar phase. Decanewas chosen due to its high hydrophobicity, which ensures thatpractically all water molecules remain close to the protein inthe simulations that involve a mixture of both solvents. Thesystems, as well as the corresponding trajectories, were namedRWa, RWb, W8D, W6D, W4D, and RD. RWa consisted of24 825 pre-equilibrated water molecules solvating the enzymestructure as taken from the Protein Data Bank (PDB ID1TCD),30 with no decane present. The protonation states ofionizable residues corresponded to biological pH (∼7.4). Thesize of the simulation unit cell was chosen so that the distancebetween every protein atom and box walls was larger than 2nm. This system was first simulated for 20 ns, the resultingfinal configuration being denoted by RWa(20). RWa was thenextended for 40 ns more, producing the trajectory named RWb.To build up the system W8D, waters at a distance larger than8 Å from any of the protein atoms were removed fromRWa(20), and the resulting arrangement was enclosed into a
dodecahedron simulation box with the walls at a minimum of2 nm from any of the water molecules. The free space of sucha box was then filled with pre-equilibrated decane molecules.The same procedure as for W8D was repeated using distancesof 6 and 4 Å togive the systems W6D and W4D, respectively.This procedure assures that both the protein and the watermolecules in its immediate vicinity are in equilibrium to eachother in the initial conformations of these three systems. As inprevious studies,19,27 pH memory was assumed for the proteinwhen transferred from pure water to the water/decane solutions.The system RD is analogous to RWa but employing decaneinstead of water as the unique solvent. As in the case of RWb,W8D, W6D, W4D, and RD were simulated for 40 ns. Table 1specifies the number and relative concentration of water anddecane molecules, as well as the time scale and the initial proteinstructure employed in each simulation.
2.2. MD Simulation Parameters.All MD simulations wereperformed using the GROMACS package38-41 version 3.2.1with the GROMOS96 (43a2) force field42,43for the protein anddecane and the simple point charge (SPC) model for water.44
Periodic boundary conditions with rhombic dodecahedron boxesas the basic unit cell in the NTP ensemble were used. Thepressure was maintained by weak coupling45 to a reference valueof 1 bar, with a coupling time of 0.5 ps. The isothermalcompressibility utilized in each simulation was the average ofthe water and decane values, weighted by the concentration ofeach solvent component. Water, decane, and protein werecoupled separately to a temperature bath45 at 298 K, with acoupling constant of 0.1 ps. Nonbonded interactions wereevaluated using a twin range cutoff of 0.9 and 1.4 nm;interactions within the shorter and longer cutoffs were updatedevery step and every five steps, respectively. Beyond the 1.4nm cutoff, a reaction field correction with a dielectric constantε of 78 was employed for all the simulations, including thosewhere the main solvent was decane. Since the dielectric constantapplies only at large distances, no artificial effects were expectedin the protein structure/dynamics nor in the water behavior.Before every MD simulation, an energy minimization using thesteepest descent method was performed to avoid the mostunfavorable interactions. Random initial velocities were assignedto the systems from a Maxwell-Boltzmann distribution at 298K. The equations of motion were integrated using the leapfrogmethod with a time step of 2 fs. The bond lengths and anglesin water were constrained using the SETTLE algorithm,46 whilethe LINCS algorithm47 was used to constrain bond lengthswithin the protein and decane molecules. During the MDsimulations, coordinates, velocities, and energies were storedevery 10 ps for further analysis.
2.3. Analysis of MD Trajectories.The viewers RASMOL48
2.7, VMD49 1.8.2, and PyMOL50 0.99 were employed to roughlyinspect the behavior of both the enzyme and the solvent. Thisfirst screening was used to design a more detailed analysis.RMSD, taking always as a reference the X-ray structure of theprotein, were calculated for all the trajectories. To study the
TABLE 1: List of MD Simulations Including Parameters and Results of Analysis
trajectory
no. ofwater
molecules
No. ofdecane
molecules % watersimulationtime (ns)
initialstructure ID
totalintramolecular
H-bondsradii of
gyration (nm)inter-subunit
distances (nm)hydrophobicSAS (nm2)
hydrophilicSAS (nm2)
RWa 24825 0 100 20 1TCDRWb 24825 0 100 40 RWa(20) 379( 9 2.46( 0.01 3.58( 0.03 117( 2 93( 2W8D 3579 3402 11.80 40 RWa(20) 380( 11 2.50( 0.01 3.66( 0.03 128( 2 90( 2W6D 2336 3208 8.45 40 RWa(20) 388( 10 2.49( 0.01 3.63( 0.02 129( 2 90( 1W4D 1185 2825 5.04 40 RWa(20) 392( 9 2.392( 0.008 3.35( 0.02 127( 2 87( 1RD 0 2587 0 40 1TCD 563( 11 2.345( 0.006 2.28( 0.01 122( 2 58.1( 0.9
3530 J. Phys. Chem. B, Vol. 112, No. 11, 2008 Dıaz-Vergara and Pin˜eiro

mobility of every residue, RMSF values were calculated overthe last 20 ns of the trajectories RWb, W8D, W6D, W4D, andRD, taking also the X-ray structure as a reference. The principalcomponents (PC) of the protein motion were determined fromthe diagonalization of the variance-covariance matrix, providingthe amplitude and the direction of each concerted motion (i.e.,the eigenvalues and the corresponding eigenvectors). Thisanalysis was carried out for the last 20 ns of all the trajectoriesexcept for RWa, employing only atoms of the protein backbone.The trajectories were projected on the eigenvectors with thelargest eigenvalues, and images of the two extreme enzyme-backbone conformations for each of these motions weregenerated. Additionally, the same analysis was also performedover the 40 ns of the whole RWb trajectory. Cluster analysiswas carried out over the last 20 ns of all the trajectories usingthe GROMOS method.51 The RMSD cutoff employed to defineeach cluster was 0.15 nm for trajectories RWb, W8D, W6D,and W4D and 0.10 nm for RD. A detailed screening of theprotein secondary structure was also performed for all thesimulations, by using the definitions of the Dictionary of ProteinSecondary Structure (DPSS).52 RMSD, RMSF, and secondarystructure as a function of time were analyzed by means ofprograms contained in the GROMACS package38-41 version3.2.1, while the analysis of essential protein motions as well asthe cluster determinations were performed by using version 3.3.1of the same package. A number of simple programs weredeveloped to study the distribution and dynamics behavior ofthe solvent molecules around the enzyme. For several framesof every trajectory, the number of oxygens belonging to watermolecules as well as decane carbons at less than 4 Å from everyTcTIM atom were calculated. Additionally, for the last 20 nsof the trajectories that correspond to systems involving water(RWb, W8D, W6D, and W4D), the distances between everyoxygen atom of water molecule and every protein atom weremonitored. Such a computationally expensive analysis allowsthe calculation of the water molecules’ residence time in thevicinity of every TcTIM residue. The number of intramolecularhydrogen bonds of the protein were also calculated for all thetrajectories using a donor-acceptor atom cutoff distance of 3.5Å and a donor-hydrogen-acceptor angle of less than 30°. Theradii of gyration (RoG), as well as hydrophilic and hydrophobiccontributions to the solvent accessible surface (SAS) of theenzyme, were determined throughout all the trajectories. Theobtained values were averaged over the last 20 ns. Tools fromthe GROMACS package were employed to determine theH-bonds, RoG, and SAS.
3. Results and Discussion
3.1. Visual Analysis of Trajectories.In the time scale andunder the simulation conditions employed in this work, the twoTcTIM subunits remained together, and their tertiary structureswere apparently conserved. However, the enzyme conformationarising from the trajectory RD after 40 ns of MD simulationsseems to be smaller than the rest of the conformations, and itmissed severalR-helices (Figure 1). The size of the finalstructure obtained from W4D also appears to be slightly smallerthan those obtained from RWb, W8D, and W6D. Notably, mostof the water molecules in W8D, W6D, and W4D formed acluster in the cavity next to the interface of the two proteinsubunits. The fact that the cluster formation was observed inthe three different trajectories suggests that it is not accidental.Several reasons could explain this grouping; the most evidentarises from the combination of the high hydrophobicity ofdecane, the main solvent in those simulations, together with
the geometry of the protein that provides a nucleation pointaround which a water cluster can grow. The enzyme internalmotions could also contribute to the water aggregation. Theregion of the protein that is in contact with the water clustercan be considered to be relatively hydrophobic but in no way
Figure 1. Initial and final conformations of the TcTIM for all thetrajectories. The time scales and the name of the systems are indicated.For W8D, W6D, and W4D, all waters (orange sticks) and decane-carbonatoms (green balls) at a distance of less than 4 Å are displayed. SubunitsA and B (as referred to in the text) are drawn in blue and red,respectively. The green arrow in the last conformation of RD points tothe region of the enzyme that lost its secondary structure.
Triosephosphate Isomerase fromTrypanosoma cruzi J. Phys. Chem. B, Vol. 112, No. 11, 20083531

more than decane. So, it seems that the major reason for thewater cluster formation, precisely in the protein cavity, is theminimization of the exposure of water molecules to decane. Inaddition to the cluster, a number of water molecules seem toexist, individually or in small groups, fixed to specific sites ofthe protein.
3.2. Protein Structure and Dynamics.As described in theMaterials and Methods, the simulations RWb, W8D, W6D, andW4D started from the same initial conformation: RWa(20)(Figure 1 and Table 1). However, RWb was a direct extensionof RWa, while in the case of W8D, W6D, and W4D, the solventwas partially substituted by decane, giving a starting configu-ration that is not fully equilibrated. After a few nanoseconds,the RMSD of all the trajectories exhibited fluctuations with noclear trends (Figure 2). For instance, the RMSD of W8Dincreased between∼22 and∼30 ns and then decreased torecover, at the end of the trajectory, a value comparable to thatat 10 ns. Notably, the RMSD corresponding to the simulationwith decane as the unique solvent (RD) displayed a behaviorvery similar to that of the other four systems, although itappeared to present less fluctuations. RMSD values are impor-tant but not specific enough because the structure deviation ofthe protein at every time step is represented by just one number.RMSF values for every TcTIM residue were calculated fromthe last 20 ns of the trajectories RWb, W8D, W6D, W4D, andRD (Figure 3a). Accumulated RMSF values (RMSFacc) (i.e.,the sum of amino acid RMSF values for each subunit andtrajectory) were also calculated (Figure 3b). It can be observedthat, in general, loops 5 and 6 (between residues 129-139 and169-179, respectively) presented the highest fluctuations.RMSF values of loop 5 are important for all subunits andtrajectories, while loop 6 of subunits B in W8D and A in W6Dexhibited a much higher mobility than the same loop in theother subunit (Figure 3a). The activity of this enzyme has beencorrelated with a movement of such a loop in just one subunit,with a period of 200-400µs.53,54The movements identified inour trajectories are probably just a flavor of the complete routecovered by loop 6 because only local movements of relativelyhigh frequency could be observed in our simulations. However,the higher fluctuations in W8D and W6D when compared tothose in pure water, with similar RMSD values, suggest thatthe presence of decane might speed up the enzyme dynamics.In general, RMSF residue profiles were similar from onesimulation or subunit to another. Loops 5 and 6 were the amino
acid segments with maximum fluctuations in the two subunitsfor all the simulations, while theâ-strand segments were theregions of lowest fluctuations. Although the differences in theRMSFaccvalues were not extremely large, it is noteworthy thatthe maximum and minimum values corresponded to the systemsW8D and RD, respectively. Except for the trajectory W6D, thesecond subunit always presented RMSFaccvalues slightly higherthan the first one. It is evident from data shown in Figure 3athat the higher mobility of the subunit A in W6D was due tothe motion of its loop 6 in that simulation.
The components with the highest amplitude of the TcTIMmotion during the last 20 ns of all the trajectories were identifiedas explained in the Materials and Methods. These amplitudeswere sorted in decreasing order, and the corresponding valueswere found to decay in an exponential way in all the systems(Figure 4a). Comparison between different systems revealed that,in the presence of decane, the higher the water concentration,the higher the mobility of the enzyme. Remarkably, TcTIM inpure water showed amplitudes comparable to those in W4D,the simulation with the lowest water concentration. The enzymewas clearly more rigid in the pure hydrophobic solvent. Theaccumulated RMSF values, when compared between the dif-ferent systems, show a trend similar to that of the amplitudesof the principal motions of the enzyme. However, the PCanalysis is finer than simple RMSF calculations, and the analysiswas performed considering only the backbone atoms of theenzyme, whose movements are expected to be more directlyrelated to protein function. It has been proposed in the past thatthe amino acid segments with high RMSF values coincide withthe protein regions that first lose their structure in the unfoldingprocesses.55 Thus, the rigidity of the protein observed in puredecane could be related to the higher thermal stability thatenzymes usually present in organic solvents.1 In agreement withRMSF values, PC analysis showed that the most importantmotions of the enzyme in all the simulations involve loops 5and 6. Probably due to the length of the trajectory, no greatstructural differences could be appreciated between the extremesof the projections of the trajectories on the most importanteigenvectors. Attempting to obtain further insight into the proteinmotion, and taking advantage of the fact that the trajectory RWb
was a continuation of RWa, PC analysis was performed for thiswhole trajectory (40 ns long). Again, the PC of the enzymedynamics involved loops 5 and 6. Movie S1 shows the motionwith the highest eigenvalue obtained from this simulation.
Figure 2. RMSD of the TcTIM backbone as a function of time for the trajectories: RWb (green), W8D (red), W6D (black), W4D (blue), and RD(magenta). The crystal structure of the enzyme was employed as a reference in all cases.
3532 J. Phys. Chem. B, Vol. 112, No. 11, 2008 Dıaz-Vergara and Pin˜eiro

Besides that of the loops, a relative movement of the enzymesubunits can be observed. Such a movement could be describedas a shrinking-stretching of the enzyme toward the cavity thathosts the water cluster in W8D, W6D, and W4D, and it couldcontribute to the aggregation of water molecules in that regionin the simulations where the two solvents are present. Theextreme conformations corresponding to the motion observedin the movie are shown in Figure 4b, where the open and closedconformations of loop 6 can be clearly appreciated (Movie S1shows precisely the transition pathway). Similar conformationsof loop 6 have been previously reported for other TIMs, althoughthe period of the transition has been estimated to be of the orderof hundreds of microseconds.56 The observation of this move-
ment in our simulations could be favored by the initial enzymestructure or/and by the simulation conditions. To study thedynamics of this movement, the distance between the center ofmass of the three amino acids of loop 6 that present the highestdisplacement, and one amino acid of loop 7 that is relativelystatic and located in the direction of the movement, werecalculated (Figure 4c). It can be seen that, in general, the distancein subunit A is higher than the distance in subunit B. The twodistances are almost constant for the trajectories W4D and RD,while they are much more variable for the other three trajec-tories. In particular, for RWb, loop 6 of the second subunit seemsto start from an open conformation, and it changes to a closedconformation at∼15 ns. The net displacement of the chosen
Figure 3. (a) RMSF of every TcTIM residue, calculated over the last 20 ns of each trajectory. The name of the system and subunit (A or B) areindicated at the right upper corner of every line. Segments of residues that formR-helices orâ-strands are labeled at the top of the plot. (b)Accumulated RMSF values, calculated by summing the values of each line in panel a for subunits A (black) and B (gray).
Triosephosphate Isomerase fromTrypanosoma cruzi J. Phys. Chem. B, Vol. 112, No. 11, 20083533

group of amino acids is∼0.6 nm in the direction of themeasurement. At least two transitions (closed-open) wereobserved for the same subunit in the trajectory W6D.
As described in the Materials and Methods, an analysis ofstructural clusters over the last 20 ns of all the trajectories wasperformed. The representative structures of every cluster for eachtrajectory were superimposed on each other to show thedifferences between the most visited conformations along thesimulation pathways. The catalytic residues (Lys 14, His 96,and Glu 168) showed a higher mobility in the trajectories RWb,W8D, and W6D than in RD and W4D. Particularly, Lys 14and His 96 were found to be particularly flexible in W8D andW6D, where they exposed a slight rotation around the aliphaticchain in Lys and of the carboxilic head in Glu. In spite of thesefeatures, the average structure of the site appeared to beconserved in all cases.
A detailed analysis of the protein secondary structure wasperformed for all the trajectories as a function of time. Thenumber of residues that form part of theâ-strands was nearlyconstant (∼38 for each subunit) for all the simulations. Evenwhen the global structure of the protein after 40 ns of MDsimulations was preserved, a lack of the number of residuesthat constituteR-helices took place in the trajectory RD (Figure1). In this simulation, such a number fluctuated between 65 and80 for each enzyme subunit, while for the systems containing
water, it took values between 90 and 100. In particular, theshortest helices of theR/â-barrel structure (R3 andR7) in oneof the TcTIM subunits, as well asR8 in the other subunit,unfolded in the trajectory RD (unfold in this context does notnecessarily mean a transition to a random coil but a lack ofstable H-bonds leading to a stretching or distortion of the helix.As seen in Figure 1 for the final conformation of the trajectoryRD, certain order is still present in the unfolded segments,although the structure cannot be defined as a helix on the basisof the DPSS.52). R3 was observed to be unstable in the samesubunit along the remaining four trajectories, including RW.R5 also unfolded during the trajectory W4D, again for the samesubunit as for the system RD. The lack of well-definedR-helicesfor these segments did not appear to be critical for the stabilityof the protein because of their small size (5-8 residues).However, during the simulations of RD, helixR1 also unfoldedin one of the protein subunits. Such a helix consists of 18residues at the beginning of the simulations, which represent asignificant percentage of the overall protein secondary structure(Figure 1).
3.3. Solvent Molecule Distribution and Dynamics.It isevident from Figure 1 that the distribution of solvent moleculesaround the enzyme structure was not homogeneous in the finalconformation of the trajectories W8D, W6D, and W4D.However, the number of water molecules in the vicinity of every
Figure 4. (a) Highest eigenvalues obtained from principal component analysis of the simulations RWb, W8D, W6D, W4D, and RD in green, red,black, blue, and magenta, respectively. (b) The two extreme conformations of the principal TcTIM motion obtained from the trajectory RWb. Onlythe backbones of subunits A (yellow) and B (green) are displayed. The residues of loops 5-7 are in orange, cyan spheres, and magenta, respectively.(c) Distance between the center of mass of the amino acids Gly170-Thr171-Gly172 (loop 6) and Val212 (loop 7) of the subunits A (black) and B(red). The name of the system is indicated at the right upper corner of every plot.
3534 J. Phys. Chem. B, Vol. 112, No. 11, 2008 Dıaz-Vergara and Pin˜eiro

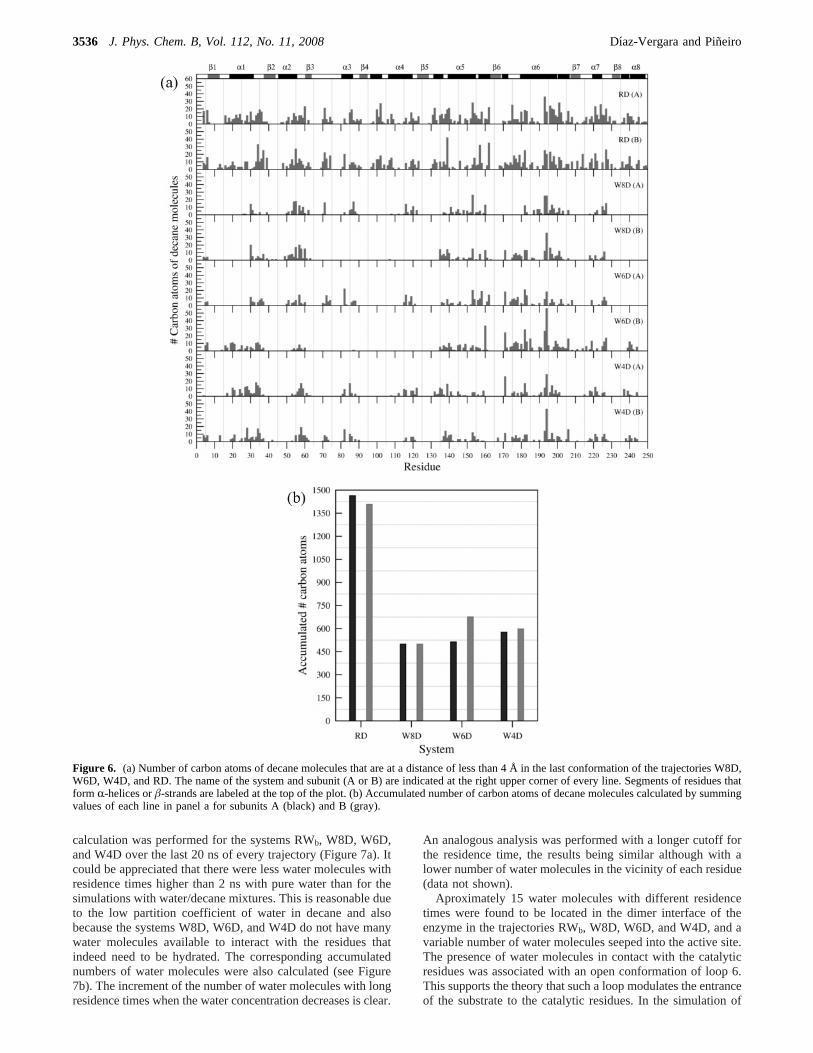
protein residue was almost the same as that in RWb, even thoughthe difference in the total number of waters is important, rangingfrom 24 825 to 1185 (Figure 5a). The profiles for both subunitsin the same system were also very similar. The accumulatednumber of water molecules was calculated (Figure 5b). A similaranalysis was performed for the number of carbon atoms ofdecane molecules at less than 4 Å of every protein residue(Figure 6a). The decane atom distribution was less similaramong systems and protein subunits than the water distribution.Nevertheless, several protein regions with a consistent affinityfor the hydrophobic solvent could be identified such as segmentsof helix 6, loop 6, and loopRâ2 (Figure 6a). This result couldbe used to propose potential binding sites for hydrophobic
ligands, as previously suggested by Mattos and Ringe.57,58Theaccumulated values of the number of decane atoms were alsocalculated (Figure 6b). By comparing Figures 5 and 6, it is clearthat the water molecule distribution around the enzyme wasmore specific than the distribution of the nonpolar solvent. It isworth mentioning that, although the results presented in Figures5 and 6 were obtained from a single conformation of eachsystem, the same analysis was performed for a number of framesthrough the last 20 ns of all the trajectories with no significantvariations.
The residence time values of water molecules were filteredto determine the number of waters that remained at a distanceof less than 4 Å of every residue for more than 2 ns. This
Figure 5. (a) Number of water molecules that are at a distance of less than 4 Å in thelast conformation of the trajectories RWb, W8D, W6D, andW4D. The name of the system and subunit (A or B) are indicated at the right upper corner of every line. Segments of residues that formR-helicesor â-strands are labeled at the top of the plot. (b) Accumulated number of water molecules calculated by summing values of each line in panel afor subunits A (black) and B (gray).
Triosephosphate Isomerase fromTrypanosoma cruzi J. Phys. Chem. B, Vol. 112, No. 11, 20083535
calculation was performed for the systems RWb, W8D, W6D,and W4D over the last 20 ns of every trajectory (Figure 7a). Itcould be appreciated that there were less water molecules withresidence times higher than 2 ns with pure water than for thesimulations with water/decane mixtures. This is reasonable dueto the low partition coefficient of water in decane and alsobecause the systems W8D, W6D, and W4D do not have manywater molecules available to interact with the residues thatindeed need to be hydrated. The corresponding accumulatednumbers of water molecules were also calculated (see Figure7b). The increment of the number of water molecules with longresidence times when the water concentration decreases is clear.
An analogous analysis was performed with a longer cutoff forthe residence time, the results being similar although with alower number of water molecules in the vicinity of each residue(data not shown).
Aproximately 15 water molecules with different residencetimes were found to be located in the dimer interface of theenzyme in the trajectories RWb, W8D, W6D, and W4D, and avariable number of water molecules seeped into the active site.The presence of water molecules in contact with the catalyticresidues was associated with an open conformation of loop 6.This supports the theory that such a loop modulates the entranceof the substrate to the catalytic residues. In the simulation of
Figure 6. (a) Number of carbon atoms of decane molecules that are at a distance of less than 4 Å in thelast conformation of the trajectories W8D,W6D, W4D, and RD. The name of the system and subunit (A or B) are indicated at the right upper corner of every line. Segments of residues thatform R-helices orâ-strands are labeled at the top of the plot. (b) Accumulated number of carbon atoms of decane molecules calculated by summingvalues of each line in panel a for subunits A (black) and B (gray).
3536 J. Phys. Chem. B, Vol. 112, No. 11, 2008 Dıaz-Vergara and Pin˜eiro

RD, no decane molecules were found to be close to the interfacenor to the active site.
3.4. Intramolecular Hydrogen Bonds.It has been proposedthat many enzymes maintain their mobility and activity at lowwater concentrations because, even under those conditions, theycan form hydrogen bonds with the water molecules of theirenvironment.10 In the absence of water, the polar groups of theprotein switch to interact with each other, forming intramolecularH-bonds. The numbers of these H-bonds for trajectories RWb,W8D, W6D, W4D, and RD are shown in Figure 8a. The plotis very clear, showing that all the simulations involving waterexhibited almost the same number of intramolecular H-bonds(see average values in Table 1). However, for the simulation
with decane as a unique solvent, there were no water moleculesavailable, and many more intramolecular H-bonds were formed.The same calculation was performed considering only the aminoacids that form part ofâ-strands orR-helices, obtaining similarresults (Figure 8b). Also in the case of RD, the increment inthe number of H-bonds resulted in a contraction of the TcTIMstructure, which was quantified by measuring the RoG. Theaverage values of these radii over the last 20 ns of everytrajectory are reported in Table 1. The hydrophobic contributionsto the SAS did not vary significantly from one system to another,but the hydrophilic SAS was much lower in RD than in any ofthe other systems. Thus, the contraction of the protein structurein RD involved the formation of H-bonds between the polar
Figure 7. (a) Number of water molecules that are at a distance of less than 4 Å from every TcTIM residue, which remain for at least 2 ns duringthe last 20 ns of the trajectories RWb, W8D, W6D, and W4D. The name of the system and subunit (A or B) are indicated at the right upper cornerof every line. Segments of residues that formR-helices orâ-strands are labeled at the top of the plot. (b) Accumulated number of water moleculescalculated by summing values of each line in panel a for subunits A (black) and B (gray).
Triosephosphate Isomerase fromTrypanosoma cruzi J. Phys. Chem. B, Vol. 112, No. 11, 20083537

hydrophilic groups. Simultaneously, those groups internalizedin the protein to escape from the hydrophobic solvent. Unex-pectedly, the enzyme also reduced its size throughout thesimulation of W4D. Such a contraction cannot be explained inthe same terms as for RD because the reduction of hydrophilicSAS in this system was almost negligible (see Table 1), andthe numbers of H-bonds, as well as the distribution of watermolecules in the vicinity of the residues, were similar to thevalues found for RWb, W8D, and W6D. The distance betweenthe centers of mass of both subunits was calculated for all thesystems, their values being consistently lower for W4D and RDthan for RWb, W8D, and W6D (Table 1). Thus, the reductionof RoG in W4D was due to the two subunits approaching eachother, maintaining the hydrophilic and hydrophobic SAS values.This approach also contributed to the decrease of RoG in RD,and it could be related to the previously mentioned shrinking-stretching of the enzyme structure toward the cavity. Such amotion could not be reversible due to the pressure of the decanemolecules and to the low number of waters present in thissimulation.
4. Conclusion
The effects of the water on the decane concentration ratio inthe structure and dynamics of TcTIM, as well as the behaviorof the solvent molecules in the vicinity of the enzyme, werestudied in detail through MD simulations at a time scale of 40ns. In contrast to recent MD studies performed at much shorter
time scales,27 the enzyme was found to be sensitive to the waterconcentration. The analysis of the protein fluctuations and ofthe PC of the backbone motion revealed that, in the presenceof organic solvents, the higher the water concentration, thehigher the mobility of the enzyme. Nevertheless, TcTIM in purewater showed amplitudes comparable to those in W4D, thesimulation with the lowest water concentration, while it wasclearly more rigid in pure decane. These results suggest thatthe enzyme dynamics speeds up at relatively low waterconcentrations, probably due to the presence of organic solventmolecules attached to specific sites of the protein surface,although there is a threshold in the number of water moleculesneeded for the protein to keep its structure and dynamics. Ouranalysis also provides new insight into the dynamics of TcTIMthat could be helpful in better understanding this enzyme.
Acknowledgment. We thank Prof. Armando Go´mez-Puyou,Universidad Nacional Auto´noma de Me´xico (UNAM), Dr. PilarBrocos (USC), Prof. Miguel Costas (UNAM), and Dr. Hao Fan(UCSF) for their critical reading of the manuscript and for veryuseful suggestions. This work was supported by Grants 41328-Qand J49811-Q from CONACyT and Grant IN105107 fromPAPIIT-UNAM, Mexico. We are grateful to the Direccio´nGeneral de Servicios de Co´mputo Acade´mico (DGSCA) of theUNAM for computer time employed in this work and for theirexcellent services. N.D.-V. is grateful for financial support fromCONACyT.
Figure 8. Number of intramolecular hydrogen bonds of (a) all TcTIM residues and (b) the TcTIM residues that form part ofR-helices andâ-strands,as a function of time, for the trajectories RWb (green), W8D (red), W6D (black), W4D (blue), and RD (magenta).
3538 J. Phys. Chem. B, Vol. 112, No. 11, 2008 Dıaz-Vergara and Pin˜eiro

Supporting Information Available: Movie S1, showing theprojection of the trajectory RWb on the eigenvector with thehighest eigenvalue, obtained by PC analysis. This informationis available free of charge via the Internet at http://pubs.acs.org.
References and Notes
(1) Tuena de Gomez-Puyou, M.; Gomez-Puyou, A.Crit. ReV. Biochem.Mol. Biol. 1998, 33, 53.
(2) Finney, J. L.; Poole, P. L.Commun. Mol. Cell. Biophys.1984, 2,129.
(3) Levy, Y.; Onuchic, J. N.Proc. Natl. Acad. Sci. U.S.A.2004, 101,3325.
(4) Pal, S. K.; Zewail, A. H.Chem. ReV. 2004, 104, 2099.(5) Rupley, J. A.; Careri, G.AdV. Protein Chem.1991, 41, 37.(6) Rupley, J. A.; Gratton, E.; Careri, G.Trends Biochem. Sci.1983,
8, 18.(7) Zaks, A.; Klibanov, A. M.Science (Washington, DC, U.S.)1984,
224, 1249.(8) Zaks, A.; Klibanov, A. M.Proc. Natl. Acad. Sci. U.S.A.1985, 82,
3192.(9) Zaks, A.; Klibanov, A. M.J. Am. Chem. Soc.1986, 108, 2767.
(10) Zaks, A.; Klibanov, A. M.J. Biol. Chem.1988, 263, 8017.(11) Zaks, A.; Klibanov, A. M.J. Biol. Chem.1988, 263, 3194.(12) Gonnelli, M.; Strambini, G. B.J. Phys. Chem.1988, 92, 2854.(13) Strambini, G. B.; Gonnelli, M.J. Phys. Chem.1988, 92, 2850.(14) Bell, G.; Halling, P. J.; Moore, B. D.; Partridge, J.; Rees, D. G.
Trends Biotechnol.1995, 13, 468.(15) Dordick, J. S.Appl. Biochem. Biotechnol.1988, 19, 103.(16) Dordick, J. S.Enzyme Microb. Technol.1989, 11, 194.(17) Klibanov, A. M.CHEMTECH1986, 16, 354.(18) Klibanov, A. M.Trends Biotechnol.1997, 15, 97.(19) Soares, C. M.; Teixeira, V. H.; Baptista, A. M.Biophys. J.2003,
84, 1628.(20) Micaelo, N. M.; Teixeira, V. H.; Baptista, A. M.; Soares, C. M.
Biophys. J.2005, 89, 999.(21) Colombo, G.; Toba, S.; Merz, K. M.J. Am. Chem. Soc.1999, 121,
3486.(22) Norin, M.; Haeffner, F.; Hult, K.; Edholm, O.Biophys. J.1994,
67, 548.(23) Peters, G. H.; van Aalten, D. M. F.; Edholm, O.; Toxvaerd, S.;
Bywater, R.Biophys. J.1996, 71, 2245.(24) Toba, S.; Hartsough, D. S.; Merz, K. M.J. Am. Chem. Soc.1996,
118, 6490.(25) Zheng, Y. J.; Ornstein, R. L.J. Am. Chem. Soc.1996, 118, 4175.(26) Zheng, Y. J.; Ornstein, R. L.Protein Eng.1996, 9, 485.(27) Yang, L.; Dordick, J. S.; Garde, S.Biophys. J.2004, 87, 812.(28) Micaelo, N. M.; Soares, C. M.FEBS Lett.2007, 274, 2424.(29) Zheng, Y. J.; Ornstein, R. L.Biopolymers1996, 38, 791.(30) Maldonado, E.; Soriano-Garcia, M.; Moreno, A.; Cabrera, N.;
Garza-Ramos, G.; de Gomez-Puyou, M. T.; Gomez-Puyou, A.; Perez-Montfort, R. J. Mol. Biol. 1998, 283, 193.
(31) Garza-Ramos, G.; Tuena de Gomez-Puyou, M.; Gomez-Puyou, A.;Gracy, R. W.Eur. J. Biochem.1992, 208, 389.
(32) Gag, X. G.; Maldonado, E.; Perez-Montfort, R.; Garza-Ramos, G.;Tuena de Gomez-Puyou, M.; Gomez-Puyou, A.; Rodriguez-Romero, A.Proc. Natl. Acad. Sci. U.S.A.1999, 96, 10062.
(33) Garza-Ramos, G.; Cabrera, N.; Saavedra-Lira, E.; Tuena de Gomez-Puyou, M.; Ostoa-Saloma, P.; Perez-Montfort, R.; Gomez-Puyou, A.Eur.J. Biochem.1998, 253, 684.
(34) Perez-Montfort, R.; Garza-Ramos, G.; Alcantara, G. H.; Reyes-Vivas, H.; Gao, X. G.; Maldonado, E.; Tuena de Gomez-Puyou, M.; Gomez-Puyou, A.Biochemistry1999, 38, 4114.
(35) Reyes-Vivas, H.; Hernandez-Alcantara, G.; Lopez-Velazquez, G.;Cabrera, N.; Perez-Montfort, R.; Tuena de Gomez-Puyou, M.; Gomez-Puyou, A.Biochemistry2001, 40, 3134.
(36) Tellez-Valencia, A.; Avila-Rios, S.; Perez-Montfort, R.; Rodriguez-Romero, A.; Tuena de Gomez-Puyou, M.; Lopez-Calahorra, F.; Gomez-Puyou, A.Biochem. Biophys. Res. Commun.2002, 295, 958.
(37) Tellez-Valencia, A.; Olivares-Illana, V.; Hernandez-Santoyo, A.;Perez-Montfort, R.; Costas, M.; Rodriguez-Romero, A.; Lopez-Calahorra,F.; Tuena de Gomez-Puyou, M.; Gomez-Puyou, A.J. Mol. Biol.2004, 341,1355.
(38) Berendsen, H. J. C.; van der Spoel, D.; van Drunen, R.Comput.Phys. Commun.1995, 91, 43.
(39) http://www.gromacs.org.(40) Lindahl, E.; Hess, B.; van der Spoel, D.J. Mol. Model.2001, 7,
306.(41) van der Spoel, D.; Lindahl, E.; Hess, B.; Groenhof, G.; Mark, A.
E.; Berendsen, H. J. C.J. Comput. Chem.2005, 26, 1701.(42) Schuler, L. D.; van Gunsteren, W. F.Mol. Simul.2000, 25, 301.(43) Daura, X.; Mark, A. E.; van Gunsteren, W. F.J. Comput. Chem.
1998, 19, 535.(44) Berendsen, H. J. C.; Postma, J. P. M.; van Gunsteren, W. F.;
Hermans, J.Interaction Models for Water in Relation to Protein Hydration;Reidel D. Publishing Company: 1981.
(45) Berendsen, H. J. C.; Postma, J. P. M.; van Gunsteren, W. F.; DiNola,A.; Haak, J. R.J. Chem. Phys.1984, 81, 3684.
(46) Miyamoto, S.; Kollman, P. A.J. Comput. Chem.1992, 13, 952.(47) Hess, B.; Bekker, H.; Berendsen, H. J. C.; Fraaije, J.J. Comput.
Chem.1997, 18, 1463.(48) Sayle, R. A.; Milnerwhite, E. J.Trends Biochem. Sci.1995, 20,
374.(49) Humphrey, W.; Dalke, A.; Schulten, K.J. Mol. Graphics1996,
14, 33.(50) http://pymol.sourceforge.net/.(51) Daura, X.; Gademann, K.; Jaun, B.; Seebach, D.; van Gunsteren,
W. F.; Mark, A. E.Angew. Chem., Int. Ed.1999, 38, 236.(52) Kabsch, W.; Sander, C.Biopolymers1983, 22, 2577.(53) Rozovsky, S.; Jogl, G.; Tong, L.; McDermott, A. E.J. Mol. Biol.
2001, 310, 271.(54) Rozovsky, S.; McDermott, A. E.J. Mol. Biol. 2001, 310, 259.(55) Daggett, V.Chem. ReV. 2006, 106, 1898.(56) Wierenga, R. K.; Noble, M. E.; Davenport, R. C.J. Mol. Biol.1992,
224, 1115.(57) Mattos, C.; Ringe, D.Nat. Biotechnol.1996, 14, 595.(58) Ringe, D.Curr. Opin. Struct. Biol.1995, 5, 825.
Triosephosphate Isomerase fromTrypanosoma cruzi J. Phys. Chem. B, Vol. 112, No. 11, 20083539
Copyright © 2022 FDOKUMEN