Molecular Dynamics of Ethylene Glycol Dimethacrylate Glass Former: Influence of Different...
13
Molecular Dynamics of Ethylene Glycol Dimethacrylate Glass Former: Influence of Different Crystallization Pathways Marı ´a T. Viciosa, † Nata ´lia T. Correia, † Manuel Salmero ´n Sa ´nchez, ‡,§,| Jose ´ L. Go ´mez Ribelles, ‡,§,| and Madalena Dionı ´sio* ,† REQUIMTE, Departamento de Quı ´mica, Faculdade de Cie ˆncias e Tecnologia da UniVersidade NoVa de Lisboa, 2829-516 Caparica, Portugal., Centro de Biomateriales e Ingenierı ´a Tisular, UniVersidad Polite ´cnica de Valencia, Camino de Vera s/n, E-46022 Valencia, Spain, Centro de InVestigacio ´n Prı ´ncipe Felipe, AVda. Autopista del Saler 16, 46013 Valencia, Spain, and CIBER en Bioingenierı ´a, Biomateriales y Nanomedicina, Valencia, Spain ReceiVed: April 7, 2009; ReVised Manuscript ReceiVed: August 3, 2009 The crystallization induced by different thermal treatments of a low molecular weight glass former, ethylene glycol dimethacrylate (EGDMA), was investigated by dielectric relaxation spectroscopy (DRS) and differential scanning calorimetry (DSC). The fully amorphous material, dielectrically characterized for the first time, exhibits three relaxation processes: the R-relaxation related to dynamic glass transition whose relaxation rate obeys a Vogel-Fulcher-Tamman-Hesse (VFTH) law and two secondary processes ( and γ) with Arrhenius temperature dependence. Therefore, the evaluation of distinct crystallization pathways driven by different thermal histories was accomplished by monitoring the mobility changes in the multiple dielectric relaxation processes. Besides isothermal cold-crystallization, nonisothermal crystallizations coming from both the melt and the glassy states were induced. While an amorphous fraction, characterized by a glass transition, remains subsequent to crystallization from the melt, no R-relaxation is detected after the material undergoes nonisothermal cold-crystallization. In the latter, the secondary relaxations persist with a new process that evolves at low frequencies, designated as R′ that was also detected at advanced crystallization states under isothermal cold-crystallization. Under the depletion of the R-relaxation, the -process when detected becomes better resolved keeping the same location prior to crystallization leading to a decoupled temperature dependence relative to the R-process. Introduction The stability of amorphous and crystalline states and the factors that govern their interconversion are fundamental aspects in pharmaceutical 1-3 and food 4 industries. Molecular mobility and thermal history are determinant factors that kinetically drive the transformation pathways, i.e., the conversion between the amorphous and crystalline forms or between different polymor- phic forms, which are determinant in materials preservation. 1,2,5,6 Indeed, significant molecular mobility can persist in the glassy state enabling, for instance, the occurrence of phase transitions such as crystallization. 7-9 In this context, understanding key questions, such as under what conditions an amorphous leads to crystal formation and the relation between temperature and crystallization pathways, is important for stable storage and the shelf life of amorphous pharmaceuticals. The chemical and physical properties exhibited by fully amorphous, partial and wholly crystalline forms of the same substance, are significantly different, whose knowledge is also important for medical purposes. In the present work, ethylene glycol dimethacrylate (EGDMA), used as a cross-linking agent in dental restorative composites 10,11 and ophthalmic applications, 12,13 is used to explore the different aspects concerning molecular mobility and relationship between thermal treatment and transformation pathways since it is able to both vitrify and crystallize. Indeed, EGDMA belongs to the n-ethylene glycol dimethacrylate family that easily circumvents crystallization entering in the supercooled regime and vitrifying upon further cooling. In previous publications by some of us, 14,15 it was shown that n-ethylene glycol dimethacrylates, with 2 e n e 4, have the onset of calorimetric glass transition, T g , at 181, 187, and 190 K, respectively for n ) 2, 3, and 4. Their molecular mobility was investigated by dielectric relaxation spectroscopy, DRS, where besides the R-relaxation process associated with the cooperative character of the molecular motions on approaching the glass transition, two secondary relaxations, and γ in decreasing order of temperature, were detected due to more localized motions that remain active below T g . The γ-process that was attributed to dipolar fluctuations within the ethylene glycol group (see scheme in Experimental Section) revealed to be independent of the size of the ethylene glycol moiety for the three members, while the -relaxation, ascribed to hindered rotations involving COO dipoles, shifts to higher relaxation times with the increase of n. 15 One of the questions that we also addressed previously was how the relaxation processes detected in EGDMA will fit in the trend of the other family members; it will be shown that EGDMA is a glass former whose dynamics behavior follows the general behavior of its counterparts. Due to its high dielectric response and ability to be obtained either as a nearly fully amorphous glass or a nearly fully crystal, depending on the thermal treatment to which it is subjected, EGDMA is a good candidate to study simultaneously the crystallization process and the mobility of the coexistent * Corresponding author. E-mail: [email protected]. † Faculdade de Cie ˆncias e Tecnologia da Universidade Nova de Lisboa. ‡ Universidad Polite ´cnica de Valencia. § Centro de Investigacio ´n Prı ´ncipe Felipe. | CIBER BBN. J. Phys. Chem. B 2009, 113, 14196–14208 14196 10.1021/jp903208k CCC: $40.75 2009 American Chemical Society Published on Web 10/05/2009
-
Upload
univ-lille1 -
Category
Documents
-
view
1 -
download
0
Transcript of Molecular Dynamics of Ethylene Glycol Dimethacrylate Glass Former: Influence of Different...
Molecular Dynamics of Ethylene Glycol Dimethacrylate Glass Former: Influence ofDifferent Crystallization Pathways
Marıa T. Viciosa,† Natalia T. Correia,† Manuel Salmeron Sanchez,‡,§,| Jose L. Gomez Ribelles,‡,§,|
and Madalena Dionısio*,†
REQUIMTE, Departamento de Quımica, Faculdade de Ciencias e Tecnologia da UniVersidade NoVa deLisboa, 2829-516 Caparica, Portugal., Centro de Biomateriales e Ingenierıa Tisular, UniVersidad Politecnicade Valencia, Camino de Vera s/n, E-46022 Valencia, Spain, Centro de InVestigacion Prıncipe Felipe, AVda.Autopista del Saler 16, 46013 Valencia, Spain, and CIBER en Bioingenierıa,Biomateriales y Nanomedicina, Valencia, Spain
ReceiVed: April 7, 2009; ReVised Manuscript ReceiVed: August 3, 2009
The crystallization induced by different thermal treatments of a low molecular weight glass former, ethyleneglycol dimethacrylate (EGDMA), was investigated by dielectric relaxation spectroscopy (DRS) and differentialscanning calorimetry (DSC). The fully amorphous material, dielectrically characterized for the first time,exhibits three relaxation processes: the R-relaxation related to dynamic glass transition whose relaxation rateobeys a Vogel-Fulcher-Tamman-Hesse (VFTH) law and two secondary processes (� and γ) with Arrheniustemperature dependence. Therefore, the evaluation of distinct crystallization pathways driven by differentthermal histories was accomplished by monitoring the mobility changes in the multiple dielectric relaxationprocesses. Besides isothermal cold-crystallization, nonisothermal crystallizations coming from both the meltand the glassy states were induced. While an amorphous fraction, characterized by a glass transition, remainssubsequent to crystallization from the melt, no R-relaxation is detected after the material undergoesnonisothermal cold-crystallization. In the latter, the secondary relaxations persist with a new process thatevolves at low frequencies, designated as R′ that was also detected at advanced crystallization states underisothermal cold-crystallization. Under the depletion of the R-relaxation, the �-process when detected becomesbetter resolved keeping the same location prior to crystallization leading to a decoupled temperature dependencerelative to the R-process.
Introduction
The stability of amorphous and crystalline states and thefactors that govern their interconversion are fundamental aspectsin pharmaceutical1-3 and food4 industries. Molecular mobilityand thermal history are determinant factors that kinetically drivethe transformation pathways, i.e., the conversion between theamorphous and crystalline forms or between different polymor-phic forms, which are determinant in materials preservation.1,2,5,6
Indeed, significant molecular mobility can persist in the glassystate enabling, for instance, the occurrence of phase transitionssuch as crystallization.7-9 In this context, understanding keyquestions, such as under what conditions an amorphous leadsto crystal formation and the relation between temperature andcrystallization pathways, is important for stable storage and theshelf life of amorphous pharmaceuticals.
The chemical and physical properties exhibited by fullyamorphous, partial and wholly crystalline forms of the samesubstance, are significantly different, whose knowledge is alsoimportant for medical purposes. In the present work, ethyleneglycol dimethacrylate (EGDMA), used as a cross-linking agentindentalrestorativecomposites10,11andophthalmicapplications,12,13
is used to explore the different aspects concerning molecularmobility and relationship between thermal treatment and
transformation pathways since it is able to both vitrify andcrystallize. Indeed, EGDMA belongs to the n-ethylene glycoldimethacrylate family that easily circumvents crystallizationentering in the supercooled regime and vitrifying upon furthercooling. In previous publications by some of us,14,15 it was shownthat n-ethylene glycol dimethacrylates, with 2 e n e 4, havethe onset of calorimetric glass transition, Tg, at 181, 187, and190 K, respectively for n ) 2, 3, and 4. Their molecular mobilitywas investigated by dielectric relaxation spectroscopy, DRS,where besides the R-relaxation process associated with thecooperative character of the molecular motions on approachingthe glass transition, two secondary relaxations, � and γ indecreasing order of temperature, were detected due to morelocalized motions that remain active below Tg. The γ-processthat was attributed to dipolar fluctuations within the ethyleneglycol group (see scheme in Experimental Section) revealed tobe independent of the size of the ethylene glycol moiety forthe three members, while the �-relaxation, ascribed to hinderedrotations involving COO dipoles, shifts to higher relaxationtimes with the increase of n.15 One of the questions that wealso addressed previously was how the relaxation processesdetected in EGDMA will fit in the trend of the other familymembers; it will be shown that EGDMA is a glass former whosedynamicsbehavior follows thegeneralbehaviorof itscounterparts.
Due to its high dielectric response and ability to be obtainedeither as a nearly fully amorphous glass or a nearly fully crystal,depending on the thermal treatment to which it is subjected,EGDMA is a good candidate to study simultaneously thecrystallization process and the mobility of the coexistent
* Corresponding author. E-mail: [email protected].† Faculdade de Ciencias e Tecnologia da Universidade Nova de Lisboa.‡ Universidad Politecnica de Valencia.§ Centro de Investigacion Prıncipe Felipe.| CIBER BBN.
J. Phys. Chem. B 2009, 113, 14196–1420814196
10.1021/jp903208k CCC: $40.75 2009 American Chemical SocietyPublished on Web 10/05/2009

amorphous fraction. In particular, the differences in molecularmobility, investigated by DRS, of the remaining amorphousfraction upon both isothermal and nonisothermal crystallizationare evaluated, allowing inferring about the achieved semicrys-talline morphology.
This study also intends to be a further contribution in whatconcerns the influence of crystallization in the R-relaxation ofthe remaining amorphous fraction of a low molecular weightcompound as studied by dielectric relaxation spectroscopy sincethe major studies involve polymers such as PET,16,17 PLLA,18-21
PLLA copolymers,22 polycarbonate/poly(ε-caprolactone)blends,23 aliphatic polyesters,24 and poly(butylene isophthalate).25
As far as we know, the only known studies that have beenpublished regarding nonpolymeric systems include, after thepioneering works of Massalska-Arodz et al. for isopentylcy-anobiphenyl26 and Dobbertin et al. for a terephthalic aciddipropyl ester,27 other glass formers such as isooctyloxycyano-biphenyl,28 sorbitol,29 triphenyl phosphite,30 2-propanol,31 ac-etaminophen,32 and another pharmaceutical drug.33
Crystallization progresses in both low molecular weightcompounds and semicrystalline polymers by the nucleation andgrowth of crystals in the amorphous liquid. The segmentaldynamics of the amorphous region of semicrystalline polymersclose to the crystals or confined by them in small layers hasbeen proved to be different from that of the amorphous liquid,using both relaxation spectroscopy and calorimetric techniques.The presence of a rigid amorphous region situated betweencrystal lamellae has been used to describe the dynamicalbehavior close to the crystallite surfaces (R′-relaxation) asobserved, for example, in PET,16,17,34,35 poly(3-hydroxybu-tyrate),36 and PLLA.18,19,37 Although the crystal morphology andcrystal growth are different in low molecular weight compounds,under certain conditions a new relaxation process evolves alsoin these systems upon isothermal crystallization as found, e.g.,in sorbitol29 and in a terephthalic acid dipropyl ester.27 Dielectricmonitoring of some of these low molecular weight materialspresents features similar to semicrystalline polymers such asthe reduction and broadening of the R-process (e.g., sorbitol,29
triphenyl phosphite,30 and 2-propanol31). Nevertheless, an in-variance of the R-loss peak shape with the progress ofcrystallization is reported for isooctyloxycyanobiphenyl,28 ac-etaminophen,32 and another pharmaceutical drug.33
A detailed dynamical study concerning the time evolutionof intensity, location, and form of the R-relaxation of EGDMAupon isothermal cold-crystallization will be further presented.38
Experimental Section
Materials. Ethyleneglycol dimethacrylate (EGDMA) withstructure: was supplied by Aldrich, cat. nbr. 33,568-1, MW )
198.22, 98% assay, and used as received. The purity of thecompound was verified by 1H NMR δ ppm (CDCl3, 400 MHz):1.93 (6H, CH3), 4.39 (4H, OCH2CH2O), 5.58 (2H, CdCH2),6.11 (2H, CdCH2). The NMR spectrum reveals the presenceof only dimethacrylate-substituted ethyleneglycol, with noevidence of byproducts.
An important reason for choosing this compound is due toits high dielectric strength for the dominating R-process, whichcan be justified by the large dipole moment 5.3-5.4 D asestimated for the isolated molecule.39
Dielectric Relaxation Spectroscopy. Dielectric measure-ments were carried out using the ALPHA-N impedanceanalyzer, covering a frequency range from 10-1 Hz to 1 MHz.A drop of the EGDMA with two silica spacers 50 µm inthickness was placed between two gold-plated electrodes(diameter 20 mm) of a parallel plate capacitor, BDS 1200. Thesample cell was mounted on a cryostat, BDS 1100, and exposedto a heated gas stream being evaporated from a liquid nitrogenDewar. The temperature control is assured by the QuatroCryosystem and performed within ( 0.5 K. Novocontrol GmbHsupplied all these modules.
The molecular mobility of EGDMA was evaluated in theamorphous and semicrystalline sample after the occurrence ofcrystallization differently induced.
The fully amorphous state was only studied between 158 and187 K since cold- crystallization occurred at higher temperatures.Crystallization was induced by three different thermal treatmentsoutlined in Scheme 1.
Method I: Nonisothermal Cold-Crystallization.Stage (1): The sample was cooled down from 298 to 153 K at
13 K ·min-1. As will be shown later, this cooling rate washigh enough to avoid crystallization on cooling.
Stage (2): Dielectric measurements were taken isothermallyincreasing the temperature in different steps from 158 up to273 K: in the temperature range 158 K e T e 178 K and233 K e T e 273 K, the dielectric spectra were recordedevery 5 K; between 178 and 233 K, the spectra were recordedevery 2 or 3 K.Crystallization occurred at temperatures higher than 187 K.
The behavior observed below 187 K corresponds to fullyamorphous EGDMA.
Method II: Isothermal Cold-Crystallization.Stage (1): The sample was cooled down from 298 to 153 K at
a rate of 13 K ·min-1, avoiding crystallization.Stage (2): It was rapidly heated to the crystallization temperature,
Tcr (193 or 197 K); several other temperatures were tested,but full results will be reported elsewhere.38
Stage (3): At Tcr, real-time dielectric measurements were per-formed by scanning successive frequency sweeps from 1 Hzto 1 MHz every 90 s during 2 h.
Stage (4): The sample was quickly cooled down to 153 K.Stage (5): Stage (2) of method I.
Method III: Nonisothermal Melt-Crystallization.Stage (1): The sample was subject to a slow cooling run per-
formed at 1 K ·min-1 from 298 K down to 153 K.Stage (2): Stage (2) of method I.Fresh EGDMA samples were used in each procedure.
SCHEME 1: Schematic Representation of the ThreeExperimental Protocols Described in the Text Used toFollow Cold-Crystallization
Molecular Dynamics of EGDMA Glass Former J. Phys. Chem. B, Vol. 113, No. 43, 2009 14197

Data Analysis. To analyze the dielectric response, the modelfunction introduced by Havriliak-Negami was fitted to bothimaginary and real components of complex permittivity.40
Because multiple peaks are observed in the available frequencywindow, a sum of HN-functions is employed
where j is the index over which the relaxation processes aresummed; ∆ε is the dielectric strength; τHN is the characteristicHN relaxation time; and RHN and �HN are fractional parameters(0 < RHN e 1 and 0 < RHN�HN e 1) describing, respectively,the symmetric and asymmetric broadening of the complexdielectric function.41
From the estimated values of τHN, RHN, and �HN fittingparameters, a model-independent relaxation time, τmax ()1/2πfmax), was determined (see refs 41-43 for details).
Differential Scanning Calorimetry. Differential scanningcalorimetry (DSC) was performed using a Pyris 1 apparatus(Perkin-Elmer). The temperature was calibrated by using zincand indium. The melting heat of indium was used to calibratethe heat flow.
Results
1. Influence of Cooling Rate in Transformation Pathways.Differential Scanning Calorimetry. EGDMA crystallizes orvitrifies on cooling from the equilibrium liquid depending onthe cooling rate. Figure 1 presents DSC thermograms recordedat a heating rate of 10 K ·min-1 after a previous cooling of,respectively, 20 K ·min-1 (curve A) and 1 K ·min-1 (curve B).
The thermogram obtained after the fastest cooling scan (curveA) shows at the lowest temperatures a heat flow jump that isthe characteristic glass transition signature. At higher temper-atures, around 203 K, an exothermic peak characteristic of acrystallization process emerges. At even higher temperatures,an endothermic peak, with minima a few degrees below 273K, is observed due to melting. The Tg determined as thetemperature of the midpoint of the heat capacity increment inthe transition is 175.7 K, and the increment of heat capacity in
the transition is ∆cp(Tg) ) 114.9 J · (K ·mol)-1. The glasstransition is quite narrow, covering just ∆Tg ) 3.5 K. The onsetof the crystallization peak is at 202.0 K, and the maximum ofthe crystallization exotherm is at 202.7 K. Melting starts at 264.8K, and the maximum of the endotherm is at 271.2 K. It isinteresting to note the step in the measured heat flow in thecrystallization transition (see the inset in the right side of Figure1) that indicates the difference between the heat capacity of theliquid (at temperatures in the interval between the glass transitionand the onset of crystallization) and the solid phase (attemperatures above the exotherm). A straight line has beendrawn joining the liquid states just above the glass transitionand just above melting showing that the thermogram in thetemperature interval when the sample is in the solid phase isabove this line. The difference between the heat capacity ofthe solid and the liquid seems to be in the order of magnitudeof the heat capacity increment in the glass transition as it shouldsince the heat capacity of the glass should not be very differentfrom that of the crystal. The area measured in the thermogramfrom 188 K a temperature just above the glass transition (188K) to 293 K, taking the straight dashed line of Figure 1 asbaseline for integration, is slightly endothermic, around 0.8 (0.4 kJ ·mol-1, while the area of the melting peak is 20.2 ( 0.6kJ ·mol-1. This means that after cooling at 20 K ·min-1 a fewpercent of the mass of the sample can be in the crystalline statebefore the glass transition; thus, the heat capacity incrementdetermined from the thermogram can be slightly underestimated.
The discontinuity in the heat flow due to the glass transitionis hardly seen in the DSC thermogram recorded after a previouscooling at 1 K ·min-1 (curve B in Figure 1), as a consequenceof crystallization that occurred at this quite slow cooling rate;the inset at the left top of Figure 1 enhances the respective heatflow step. Thus, the sample at the beginning of the heating scan,at 133 K, is in a semicrystalline state. The melting peak furtherdetected exactly matches that recorded after cooling at 20K ·min-1.
EGDMA is thus a material that exhibits a significant shift(∼60°) between the temperature regions where crystallizationand melting occur.
Dielectric Relaxation Spectroscopy. The influence of cool-ing rate was also evaluated by DRS. Figure 2 presents theisochronal plots of both ε′ and ε′′ at 1 kHz collected in rampexperiments during the descending step to 153 K of crystal-lization methods I (open circles) and III (open triangles) (seeExperimental Section); the corresponding heating runs (isother-mal data acquisition) are represented in filled symbols.
On cooling at 13 K ·min-1 (procedure I), the trace of the realpart of the complex permittivity shows a marked fall just before193 K indicating the transformation, at the measuring frequency,from the supercooled liquid to the glass, which, in the ε′′ trace,corresponds to an intense peak, i.e., the relaxation processassociated to the glass transition. On the other hand, both ε′and ε′′ traces concerning the cooling at 1 K ·min-1 (procedureIII) show a sharp decrease just below 233 K due to crystal-lization. Although strongly depleted, there still exists a relax-ational contribution around 193 K due to the remainingamorphous fraction that shows up at lower temperatures in ε′′,similarly to the previous sample (procedure I) meaning that thesample did not reach full crystallization, being in a semicrys-talline state.
The absence of discontinuity in both ε′ and ε′′ traces uponcooling at a higher rate (procedure I) until the region wherethe R-relaxation evolves leads us to conclude that EGDMAcrystallization was circumvented. The rise observed in ε′ with
Figure 1. DSC thermograms recorded at heating rate of 10 K ·min-1
after a previous cooling run at (A) 20 K ·min-1 and (B) 1 K ·min-1.The inset in the left top side is a closeup of the glass transition regionfor both thermograms A and B where curves were vertically displacedto coincide the initial heat flow; the right-hand inset is a detailedamplified vertical axis of thermogram A.
ε*(f) ) ε∞ + ∑j
∆εj
[1 + (iωτHN)RHNj]�HNj(1)
14198 J. Phys. Chem. B, Vol. 113, No. 43, 2009 Viciosa et al.

the temperature decrease is caused by the expected increase ofthe dielectric strength and can be quantified according to theFrohlich-Kirkwood equation41,44
where µ0 is the dipolar moment of the isolated dipole; g takesinto account the dipole-dipole correlation (for parallel orantiparallel correlations between neighboring dipoles, g > 1 or0 < g < 1, respectively, while for a random orientationdistribution of dipoles, g ) 1); εs and ε∞ are the limits of thereal part of the dielectric permittivity at low and high frequen-cies, respectively, the latter being approximately the permittivityof the glass;26 ε0 is the vacuum permittivity; N/V is the numberof dipoles per unit of volume; and kB is the Boltzmann constant.Thus, from eq 2 the dielectric strength (∆ε ) εs - ε∞) isproportional to µ0
2g/9ε0kBT. If it is assumed that g is constant,an increase in ∆ε from 293 to 198 K of 32% is predicted. Theobserved raise is 30% (from 5.0 to 6.5), close to the predictedvalue, making it reasonable to assume that no dipolar momentis lost due to immobilization that would occur if crystallizationhad taken place. It should be pointed out that in replicatemeasurements it was found that crystallization can be avoidedunder cooling rates down to 6 K ·min-1.
Upon further heating, the fully amorphous sample undergoescold-crystallization45,46 which is visible in the plot just above193 K by an abrupt decrease in both ε′ and ε′′ (filled circles).The jump in both real and imaginary parts to higher valuesobserved around 263 K is due to the melting of the crystallinefraction thus formed.
The melting of the semicrystalline sample obtained by methodIII (filled triangles) occurs in the same temperature region wherethe cold-crystallized sample melts (263 K), which is very closeto the onset of the melting endotherm peak detected in DSCheating thermograms (264.8 K).
Mobility in the Amorphous State. According to thedielectric monitoring, crystallization was avoided in the coolingrun carried out at 13 K ·min-1. Thus, the material is in the glassystate at the beginning of the subsequent heating stage, wheredielectric loss spectra were taken isothermally (stage 2 of methodI in Experimental Section). The ε′′ isotherms between 173 and195 K are shown in Figure 3, and three representative isothermstaken at the lowest temperatures are shown in the inset.
The spectra show a strong relaxation process associated withthe dynamic glass transition, an R-relaxation that dominates atthe lowest temperatures. The intensity of this main relaxationis comparable to the magnitude of the same process in the othermembers of the series.15
The fully amorphous state is only observed for T e 187 K.For higher temperatures, the strength of the R-process startsdecreasing due to cold-crystallization and is reduced essentiallyto zero at 198 K. From 178 to 197 K, the main process is well-defined allowing the HN function (eq 1) to fit the experimentaldata (fitting parameters in Table 1). The estimated shapeparameters are in very close agreement with those of itscounterparts whose values were also included in Table 1,allowing constructing a master curve (not shown).
At the lowest temperatures, three individual HN functionswere necessary to describe the complete spectrum: the mainrelaxation process and the two secondary processes, � and γ(see Introduction). Due to the proximity of the main R-relaxationprocess, only few spectra allowed the �-relaxation to be resolvedin the fitting procedure before the onset of crystallization. Theγ-relaxation is also difficult to define since it always arisesmerged under the more intense �-relaxation; however, it wasalways considered in the fits. The estimated RHN and �HN valuesare (0.50, 0.94) and (0.41, 0.44), respectively, for the �- andγ-processes.
The temperature dependences of the model-independentrelaxation times, τmax, are presented in the relaxation map shownin Figure 4 that also includes the activation plots of the othern-ethylene glycol dimethacrylates (2 e n e 4). Concerning theR-relaxation of EGDMA, no discontinuity is found in itstemperature dependence when comparing τmax taken from thelowest temperatures at which the sample is in the whollyamorphous state (black circles) and at higher temperatures whereτmax was estimated from loss curves strongly depleted due tocrystallization (open circles). Thus, we believe that the reporteddynamical behavior was meaningfully affected by crystallizationbeing not far from the one that would be found for the fullyamorphous material.
The dynamical behavior of the R-process is predominantlynon-Arrhenian contrarily to the glassy state dynamics whererelaxation times obey a linear temperature dependence. Thecurvature of the characteristics relaxation times, τ, in functionof temperature reciprocal is often described by the empiricalVogel-Fulcher-Tamman-Hesse (VFTH) equation47-49
where τ∞, B, and T0, the so-called Vogel temperature, areempirical parameters characteristic of the material. The param-eters obtained from the VFTH fit of the plot of -ln τmax,R vsthe reciprocal of temperature are listed in Table 1, which allowus to estimate the glass transition temperature at τ ) 100 s,50
as 171.4 K.Commonly, the degree of deviation from Arrhenius-type
temperature dependence near Tg provides a useful classification
Figure 2. Isochronal plots of both real, ε′, and imaginary, ε′′, parts ofthe complex permittivity at 1 kHz collected in a cooling ramp from298 to 153 K: at 13 K ·min-1, open circles; and at 1 K ·min-1, opentriangles. The sharp drop around 233 K in the ε′ trace obtained at 1K ·min-1 (triangles) indicates that crystallization occurred which isavoided when cooling is carried out at 13 K ·min-1. Filled gray symbolsrepresent the ε′ and ε′′ traces taken from isothermal data acquisitionon heating after each cooling ramp.
εs - ε∞ )µ0
2gNV
εs(ε∞ + 2)2
3ε0kBT3(2εs + ε∞)(2)
τ(T) ) τ∞ exp( BT - T0
) (3)
Molecular Dynamics of EGDMA Glass Former J. Phys. Chem. B, Vol. 113, No. 43, 2009 14199

of glass formers.51,52 A quantitative measure of the fragility canbe obtained from the steepness index m according the followingequation
Using the VFTH expression (eq 3) together with eq 4, m canbe estimated as
which, for EGDMA, taking the B and T0 values determined forthe VFTH fit to the R-relaxation (Table 1), gives a fragility indexof m ) 70 in line with the behavior of the other members ofthe series, where m increases with the number of ethylene glycolunits.
For the γ-relaxation, the pre-exponential, τ∞, and activationenergy, Ea, values estimated from the Arrhenius temperature
dependence, τ(T) ) τ∞ exp(Ea/RT), are, respectively, (1.2 (0.9) × 10-16 s and 39 ( 3 kJ ·mol-1. Activation parameters forthe �-process will be given in the next section.
Mobility after Nonisothermal Cold-Crystallization (I). The3D plot shown in Figure 5 evidences the relaxation processesfound after the nonisothermal cold-crystallization. Above 197K, the R-process extinguishes allowing the position and shapeof the �-relaxation to be defined unequivocally. The latterbecomes narrower as compared to the amorphous state (RHN
increases from 0.50 to 0.60-0.80). The respective relaxationtimes temperature dependence (see Figure 4) closely followsthe behavior found in the amorphous state. The temperaturedependence taking into account the two sets of data, before(filled black circles) and after (open circles) crystallization,shows the linear behavior represented in Figure 4, from whicha pre-exponential factor of (2 ( 1) × 10-14 s and an activationenergy of 38.5 ( 0.5 kJ ·mol-1 were obtained.
The γ-relaxation, after crystallization, seems to be presentin the high frequency side of the spectra; however, no reliablelocation of its maximum can be provided, which is the reasonwhy no activation parameters are given.
Figure 3. Isothermal dielectric loss spectra obtained between 173 and 195 K, after a cooling ramp carried out at 13 K ·min-1 from 298 to 153 K;in the inset, the isotherms taken below Tg evidence the two secondary processes. All solid lines are the overall HN fit to the experimental dataconsidering a sum of HN individual functions that are exemplified as dashed lines in the inset for the isotherm at 158 K.
TABLE 1: Shape Parameters (rHN, �HN) Obtained from the HN Fitting to the Main Relaxation Process of EGDMAa
EGDMA DEGDMAb TrEGDMAc TeEGDMAb
RHN 0.94 ( 0.02 0.92 ( 0.04 0.95 ( 0.03 0.94 ( 0.03�HN 0.51 ( 0.03 0.52 ( 0.03 0.46 ( 0.03 0.46 ( 0.05τ∞/s (5 ( 5) × 10-21 (7 ( 4) × 10-17 (3 ( 1) × 10-16 (7 ( 4) × 10-15
B/K 2820 ( 586 1695 ( 97 1520 ( 52 1251 ( 87T0/K 117 ( 7 139 ( 2 147 ( 1 154 ( 2Tg (τ )100 s)/K 171.4 179.6 184.9 187.9Tg(DSC)/K 175.7 181 187 190m 70 80 85 90ETg
app/kJ ·mol-1d 229 276 303 325
a VFTH parameters (eq 3), glass transition temperature, Tg, estimated at τ ) 100 s, Tg calorimetric, Tg(DSC), obtained at a heating rate of 10K ·min-1, fragility index, m (eq 5), and apparent activation energy at Tg, ETg
app. The respective data for the other n-ethylene glycoldimethacrylates are included. b Data from ref 15. c Data from ref 14. d The apparent activation energy, Eapp ) R∂ ln τ∂1/T, was determined fromthe VFTH parameters, at Tg, as ETg
app ) RB(1- T0/Tg)2.
m )d log10 τ(T)
d(Tg/T) |T)Tg
(4)
m )BTg
ln 10(Tg - T0)2
(5)
14200 J. Phys. Chem. B, Vol. 113, No. 43, 2009 Viciosa et al.

At these advanced crystallization degrees, another processevolves at the lowest frequencies, designated as R′ (see Figure5). The temperature dependence of its relaxation times isincluded in Figure 4 being nearly Arrhenian with activationparameters: τ∞ ) (1.12 ( 0.08) × 10-12 s and Ea ) 46 ( 4kJ ·mol-1. This process will be further discussed.
Monitoring in Real Time the Mobility during IsothermalCold-Crystallization. Figure 6 shows the real time evolutionof the dielectric loss during the isothermal cold-crystallizationprocess for (a) 193 K and (b) 197 K, in the frequency range
from 0.7 to 105 Hz (see method II in the ExperimentalSection). Above this frequency, an increase in ε′′ is observedwith no physical meaning due to the inaccuracy of measure-ments at so low ε′′ values; therefore, these data are omittedin all spectra.
As a first observation, the decrease of the intensity of theR-relaxation while crystallization progresses is obvious, theextinction occurring faster at the highest temperature (197 K).In this case, the �-relaxation also disappears. Differently, whencrystallization is carried out at 193 K, the �-relaxation becomesresolved from the R-process, while the latter becomes extinct.In both cases, at advanced states of crystallization, anotherrelaxation process evolves in the low-frequency flank of theR-peak, designated R′ as before; this process is better seen inFigure 6b.
A sum of HN functions (eq 1) was fitted to the dielectricdata collected during crystallization considering the followingrelaxations: (i) the R-relaxation, which is the major contributionin the first stages of the crystallization process, (ii) theγ-relaxation, located in the high frequency side of the R-peak,(iii) the R′-process that only becomes significant later on, and(iv) the �-process for crystallization monitored at 193 K thatturns out to be important when the R-relaxation is stronglydepleted. The inset at intermediate crystallization states (seelegend) illustrates the individual relaxations considered for eachTcr.
The parameters of the individual functions used to fit the losspeaks at each Tcr are summarized in Table 2. From the fit ofdielectric spectra, it was further deduced that the R-peak doesnot present any significant changes either in position or in shape.At the end of the 2 h of crystallization, different final stateswere attained at each Tcr exhibiting different relaxation pro-cesses. Concerning the condition attained after crystallizationat 197 K, in spite of its very low dielectric response, the lowfrequency flank denotes the presence of the highly constrainedR′-relaxation. This process is significantly shifted to lowerfrequencies when compared with the position of the absent Rbulk-like process; the γ-relaxation still contributes in the highfrequency region. The major observation relative to the finalstate achieved after crystallization at 193 K is the presence ofthe �-process that is still detected in the latter.
Mobility after Isothermal Cold-Crystallization (II). Toinvestigate the relaxation processes that persist after isother-mal cold-crystallization, stages 4 and 5 of method II werefollowed.
Figure 7 shows the dielectric response measured after thesample being crystallized isothermally at 197 K.
At the lowest temperatures (gray circles), the remaining γ-and R′-processes are difficult to detect in the isotherms, but thelatter is clearly visible as a small peak in the isochronalrepresentation (inset of Figure 7). The spectra do not changesignificantly with temperature up to 213 K. However, from 213to 223 K, ε′′ suddenly increases at low frequencies due to theappearance of conductivity followed by an unexpected decreaseas revealed by an abrupt drop in the inset. This is due to furthercrystallization. The process that emerges at 233 K is probablya MWS effect due to interfacial polarization built up in theinterphases between different crystalline morphologies. Above263 K, the conductivity abruptly increases due to the melting(clearly visible in the inset).
Figure 8 presents, in the temperature range from 158 to 225K, the relaxation spectra of the sample previously cold-crystallized at 193 K. The R′-, �-, and γ-relaxation processesthat remained after isothermal crystallization are observable, the
Figure 4. Relaxation map for amorphous EGDMA (filled circles),between 173 and 187 K, and semicrystalline EGDMA (open circles;for temperatures higher than 187 K), obtained after a cooling run at 13K ·min-1 from 298 down to 153 K (method I). For comparisonpurposes, the activation data of the other n-ethylene glycol dimethacry-lates studied by us, DEGDMA,15 TrEGDMA,14 and TeEGDMA,15 areincluded as gray symbols. The arrows indicate the respective glasstransition temperatures, Tg, at τ ) 100 s. Solid lines are the respectiveArrhenius and VFTH fits; in the latter, since the plot is log10 τ, theestimated B parameter was divided by ln 10.
Figure 5. Three-dimensional plot of the isothermal dielectric lossspectra obtained between 173 and 195 K, after a cooling ramp carriedout at 13 K ·min-1 from 298 to 153 K, evidencing the relaxationsremaining after cold-crystallization; the arrow indicates the positionof the �-process in the glassy state.
Molecular Dynamics of EGDMA Glass Former J. Phys. Chem. B, Vol. 113, No. 43, 2009 14201

�-relaxation being the more prominent. It should be pointedout that in quadruplicate measurements where isothermal cold-crystallization was carried out at 193 K the �-relaxation was
observed in the final state three times, while in one of theexperiments only the R′-process remains (data reported else-where38). Three HN functions were considered in the data
Figure 6. Real time evolution of the dielectric loss collected every six minutes during the isothermal cold-crystallization process over 2 h at (a)193 K and (b) 197 K. Solid lines are the overall fitting curves, taking into account a sum of three HN individual functions, depicted in the inset(dashed and dotted lines) at intermediate crystallization states (a) 58.5 min and (b) 22.5 min.
TABLE 2: Shape Parameters, rHN and �HN, and Relaxation Time, τHN, of the Individual Functions Used to Fit the Loss Peaksduring Real Time Isothermal Crystallization at Each Crystallization Temperature Tcr ) 193 K and Tcr ) 197 Ka
R′ � R γ
RHN (193 K/197 K) 0.40/0.23 0.63/-b 0.94 ( 0.01 0.42/0.42�HN (193 K/197 K) 0.76/1.00 1.00/-b 0.50 ( 0.02 0.44/0.44τHN/s (193 K/197 K) 1.2/0.4 5.5 × 10⁻⁴/-b 1.1 × 10⁻⁴/1.5 × 10-5 3.1 × 10⁻⁵/1.2 × 10-5
a All the parameter values presented in the table were kept fixed during fitting with the exception of those affected by uncertainties. b Thisprocess was not considered in the overall fit since at 197 K EGDMA crystallizes without evidence of the �-process.
14202 J. Phys. Chem. B, Vol. 113, No. 43, 2009 Viciosa et al.

treatment, which are illustrated in Figure 8 for the spectrumcollected at 197 K; the solid line is the overall fit (see fittingparameters in Table 3).
The temperature dependence of the relaxation times of thedifferent processes is plotted in Figure 9 (activation parameters
in Table 3). Figure 9 also presents the relaxation processesobserved in the amorphous material for comparison purposes.
The R′-relaxation is accompanied by a fourth process in itslow frequency side ascribed to interfacial polarization orMaxwell-Wagner-Sillars (MWS) confirmed by an increase inthe real part of the complex permittivity (not shown). Thetemperature dependence of τMWS is included in Figure 9 (opensquares).
Mobility after Nonisothermal Melt-Crystallization (III).As explained before, EGDMA was subjected to nonisothermalcrystallization coming from the melt (see Experimental Section).
An interesting observation is that EGDMA does not undergosignificant further crystallization in the heating run: rememberFigure 2 where there is superposition below 233 K of bothbackward scan (open triangles) which corresponds to the coolingramp measurements and the forward run (filled triangles) thatconcerns isothermal data acquisition upon heating.
Figure 7. Dielectric loss spectra collected isothermally between 153 and 293 K (here shown in steps of 10 K) after 2 h of isothermal cold-crystallization at 197 K (method II). Solid lines are guides for the eyes. The inset shows the corresponding isochronal plot at 1 kHz.
Figure 8. Dielectric loss spectra collected isothermally after 2 h ofisothermal cold-crystallization at 193 K for temperatures between 158and 173 K every 5 K and from 177 to 225 K in steps of 4 K (methodII). The solid lines are guides to the eyes except for the isotherm at197 K (filled symbols) for which the solid line represents the overallfit corresponding to a sum of three individual HN functions (gray dashedlines).
TABLE 3: Shape Parameters Obtained From the HNFitting Procedure and Activation Values for the RelaxationsDetected after Isothermal Cold-Crystallization at 193 K
R′ � γ
RHN 0.61 ( 0.02 0.59 ( 0.05 0.43 ( 0.04�HN 0.767 ( 0.005 1.00 ( 0.00 0.42 ( 0.02Ea/kJ ·mol-1 56 ( 1 37.7 ( 0.3 -a
τ∞/s (8 ( 4) × 10-16 (4.8 ( 0.8) × 10-14 -a
a The temperature dependence of the relaxation times nearlyfollows the linear behavior found in the amorphous material (dataprovided in the text).
Figure 9. Relaxation map for all detected processes in EGDMA afterbeing previously submitted to the different thermal treatments tested(for more details, see Experimental Section). Solid lines are theArrhenius and VFTH fits of the relaxations found in amorphousEGDMA.
Molecular Dynamics of EGDMA Glass Former J. Phys. Chem. B, Vol. 113, No. 43, 2009 14203

Figure 10a presents some representative loss curves collectedbetween 158 and 197 K of EGDMA previously crystallized fromthe melt.
The spectra are dominated by a sharp although low intenseprocess that shows up at the very beginning of measurements,far below the glass transition temperature (Tg ≈ 171 K). Thusit is ascribed to the �-relaxation, and the γ-relaxation is locatedin its high frequency side that, in spite of its low intensity, isnow more visible than in the fully amorphous sample. The�-peak remains clearly visible in the temperature range shown,although influenced by the R-relaxation from temperatures nearbelow and above Tg. To clarify this, a detailed analysis of thespectra is now provided with the help of Figure 10b whichdepicts at 175 and 195 K the individual HN functions consideredto obtain the overall fit.
At 175 K, the R-process emerges in the low frequency sideof the �-relaxation, becoming submerged at 183 K. It overpassesthe �-process at 195 K (Figure 10b) swelling the weak γ-relaxation. Its temperature dependence, included in Figure 9 asfilled triangles, superimposes that of the R-relaxation found inthe amorphous state obeying the same VFTH law.
The strong increase of ε′′ at the lowest frequencies shown inFigure 9b is compatible with an interfacial polarization buildup in the interface of crystalline/amorphous fractions, i.e., aMaxwell-Wagner-Sillars effect (MWS), confirmed by anincrease in the real part of the complex permittivity (not shown).
The activation plots of all detected processes are included inthe relaxation map shown in Figure 9, being evident that theR-, �-, and γ-processes of this semicrystalline specimen follow
the behavior found for amorphous EGDMA. No R′-process wasdetected in this sample.
Discussion
Ramp experiments carried out at different cooling rates byeither DSC or DRS proved that the glass-former EGDMA canbe obtained with different degrees of crystallinity, the slowerrates promoting a higher crystallization, as expected.
From calorimetric results, it was concluded that even at arelatively high cooling rate of 20 K ·min-1 always some degreeof crystallization is observed. On the other hand, DRS measure-ments evidence that at cooling rates in the range from 13 to 6K ·min-1 a fully amorphous material is obtained. Thus, thetransformation pathway can also be critically dependent on thesample geometry. Although in both techniques the amount ofsample is relatively small (around 10 µL), the different waythe liquid allocates in each sample holder could be in the originof different transformations even under similar thermal histories.On the other hand, a fully crystalline material could not beobtained by slow cooling experiments either in DRS or in DSC.Nevertheless, DRS revealed that highly crystalline materialswere obtained as evaluated by the depletion of the dielectricstrength of the remaining processes that in all semicrystallinespecimens investigated is much less than 1% of the originalmagnitude of the main R-relaxation.
Before an overall discussion, the summary of the dynamicscenario found after each thermal treatment is now provided.
Amorphous State. Three relaxation processes were detectedin the amorphous state: the main R-relaxation and two �- and
Figure 10. (a) Dielectric loss spectra obtained after crystallization from the melt (at a cooling rate of 1 K ·min-1; method III) for temperaturesbetween 158 and 173 K, in steps of 5 K, and from 173 to 197 K, in steps of 2 K. (b) Isotherms taken at 175 and 195 K where the solid lines arethe overall fit to data using a sum of HN individual functions as exemplified by the dashed and dotted lines.
14204 J. Phys. Chem. B, Vol. 113, No. 43, 2009 Viciosa et al.
γ-secondary processes. The dynamical behavior follows, ingeneral, the tendency observed in EGDMA counterparts,namely: (i) the Tg value, detected calorimetrically and estimatedfrom dielectric data, is the lowest obtained for the n-ethyleneglycol dimethacrylates previously studied (with n going from2 to 4), confirming that the glass transition temperature decreaseswith the number of ethylene glycol units, (ii) the temperaturedependence of the secondary �-relaxation shifts to lowerrelaxation times with the decrease of the ethylene glycol groupsize, and (iii) the γ-process temperature and frequency locationis independent of n. The γ-peak was assigned to dipolar motionswithin the ethylene glycol moiety, as mentioned in the Introduc-tion, being of very low intensity in EGDMA while comparingto the other members of the series, as expected since it onlycontains one ethylene glycol group.
The departure from Arrhenian behavior of the R-relaxationis much less pronounced in EGDMA compared with itscounterparts as confirmed by the lower fragility index, m. Bothm and the apparent activation energy at Tg (Table 1) decreasewith the decrease of glass transition temperature, which indicatesthat some correlation should exist between the different proper-ties. Indeed, Qin and McKenna53 proposed a roughly linearrelationship between dynamic fragility and the glass transitiontemperature and their apparent activation energy, Ea
app at Tg,with Tg
2 by analyzing data concerning a variety of glass-formersystems. For all ethylene glycol dimethacrylates studied by someof us, the predicted correlation obeys ETg
app (kJ ·mol-1) )0.018Tg
2(K) - 305 with a correlation factor of 0.98 where theTg values used were those estimated from dielectric data.
Mobility after Nonisothermal Cold-Crystallization. Duringnonisothermal cold-crystallization, the R-process goes progres-sively to extinction. The respective shape parameters associatedto the isotherms where it is still detected, although withdecreasing intensity, stay almost unchanged. After crystalliza-tion, the main R-process vanishes, and the secondary �- andγ-processes remain together with a new hindered process (R′).The �-relaxation becomes narrower and much better resolved.The narrowing is associated to a more restricted distribution ofrelaxation times probably caused by a greater homogeneity ofsurrounding media. Its linear temperature dependence followsthe behavior observed in the glassy state crossing the trace ofthe R-relaxation of the bulk amorphous fraction.
Mobility under and after Isothermal Cold-Crystallization.Upon isothermal cold-crystallization, the behavior is stronglytemperature dependent. At 197 K the R-relaxation rapidlydepletes and the same happens with the �-process. On the otherside, at 193 K, the R-peak extinguishes, whereas the �-relaxationremains although significantly reduced. The latter never becomesextinct even after further heating. At both crystallizationtemperatures, the evolution of the R-process occurs with no
significant changes either in position or in shape. At relativelyhigh crystallization states, a new relaxation, the R′-process,evolves.
Both �- and R′-processes were characterized in the subsequentmeasurements performed after the accomplishment of isothermalcrystallization at 193 K. The temperature dependence of theR′-process exhibits a slope nearly identical to that found forthe corresponding process observed after nonisothermal crystalliza-tion.
In regard to the �-relaxation, its detection after the vanishingof the main R-process allowed us to investigate its temperaturedependence over the entire temperature range. Its trace in therelaxation map obeys the extrapolation of the behavior observedin the glassy state and also confirms the temperature dependenceobserved previously in the nonisothermal cold-crystallizedsample.
Considering that high crystalline samples are being analyzed,the permanence of this �-process is a clear indication of itsintramolecular nature as suggested previously for the othermembers of the series.15
Mobility after Nonisothermal Crystallization from Melt.Although with a very low intensity the �-process is thedominating process in this sample, the R-relaxation is stillobserved with very small magnitude. Interestingly, no R′-processwas detected, and no further cold-crystallization was observedin the heating run.
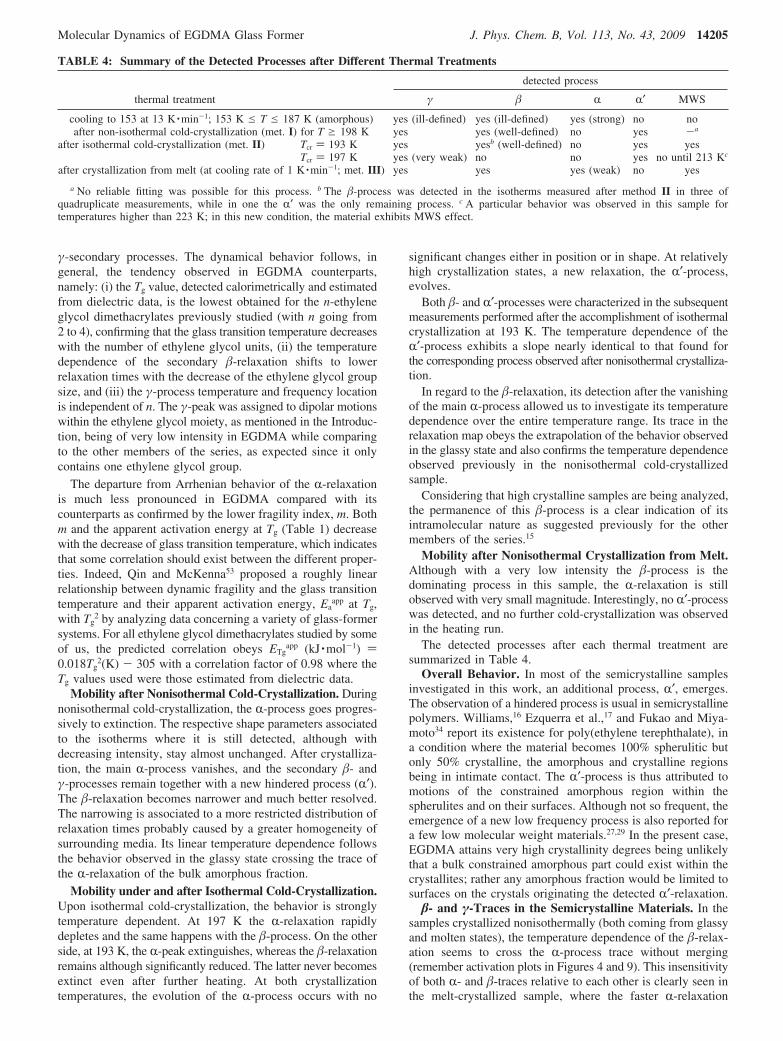
The detected processes after each thermal treatment aresummarized in Table 4.
Overall Behavior. In most of the semicrystalline samplesinvestigated in this work, an additional process, R′, emerges.The observation of a hindered process is usual in semicrystallinepolymers. Williams,16 Ezquerra et al.,17 and Fukao and Miya-moto34 report its existence for poly(ethylene terephthalate), ina condition where the material becomes 100% spherulitic butonly 50% crystalline, the amorphous and crystalline regionsbeing in intimate contact. The R′-process is thus attributed tomotions of the constrained amorphous region within thespherulites and on their surfaces. Although not so frequent, theemergence of a new low frequency process is also reported fora few low molecular weight materials.27,29 In the present case,EGDMA attains very high crystallinity degrees being unlikelythat a bulk constrained amorphous part could exist within thecrystallites; rather any amorphous fraction would be limited tosurfaces on the crystals originating the detected R′-relaxation.
�- and γ-Traces in the Semicrystalline Materials. In thesamples crystallized nonisothermally (both coming from glassyand molten states), the temperature dependence of the �-relax-ation seems to cross the R-process trace without merging(remember activation plots in Figures 4 and 9). This insensitivityof both R- and �-traces relative to each other is clearly seen inthe melt-crystallized sample, where the faster R-relaxation
TABLE 4: Summary of the Detected Processes after Different Thermal Treatments
detected process
thermal treatment γ � R R′ MWS
cooling to 153 at 13 K ·min-1; 153 K e T e 187 K (amorphous) yes (ill-defined) yes (ill-defined) yes (strong) no noafter non-isothermal cold-crystallization (met. I) for T g 198 K yes yes (well-defined) no yes -a
after isothermal cold-crystallization (met. II) Tcr ) 193 K yes yesb (well-defined) no yes yesTcr ) 197 K yes (very weak) no no yes no until 213 Kc
after crystallization from melt (at cooling rate of 1 K ·min-1; met. III) yes yes yes (weak) no yes
a No reliable fitting was possible for this process. b The �-process was detected in the isotherms measured after method II in three ofquadruplicate measurements, while in one the R′ was the only remaining process. c A particular behavior was observed in this sample fortemperatures higher than 223 K; in this new condition, the material exhibits MWS effect.
Molecular Dynamics of EGDMA Glass Former J. Phys. Chem. B, Vol. 113, No. 43, 2009 14205

crosses the slower �-process instead of merging into an R� ora process as found for a variety of materials (illustrated in Figure10). This peculiar effect where the R- and �-traces cross withoutinterfering with each other was also found by Lupascu et al. inatactic and syndiotactic polystyrene,54 which was taken as anindication of independent dynamic processes. So, it can beassumed that the R- and �-processes detected in EGDMA evolvedecoupled from each other.
As an alternative to this explanation, the observed behaviorcan also be rationalized conceiving that the remaining �-processis occurring in the semicrystalline material, in a different phaseother than the bulklike amorphous fraction where the originalR-relaxation takes place. This interpretation is not incompatiblewith the similarity observed for each conceivable �-processoccurring in either amorphous bulklike or semicrystallineenvironments, which would follow the same trace in theactivation plot since both relaxations can be originated by localdipolar fluctuations involving the same molecular unit.
In regard to the γ-trace detected after the sample being cold-crystallized at 193 K, it reveals a temperature dependence ofrelaxation times (Figure 9) that, in spite of some uncertainty,seems to agree with the linear behavior found in the glassy state.The insensitivity of the γ-relaxation time during conversion wasalready observed in other complex systems as partially polym-
erized mixtures55 and for the members of the EGDMA series(n ) 2, 3, and 4),15,56 where τγ detected in the unreactedmonomer remains unchanged upon polymerization.
Influence of Thermal History in the CrystallizationBehavior of EGDMA. The evolving of crystallization is usuallyinterpreted in terms of a nucleation/growth process, wherecrystallization requires the presence of a nucleus on which thecrystals will subsequently grow.57 For a variety of materials,the nucleation rate has a maximum above Tg, while themaximum growth rate is further displaced at higher temperaturessomewhere between Tg and Tm.2,58,59
To gain a better understanding of the factors that determinecrystallization of amorphous EGDMA and the possible locationof those nucleation/growth mechanisms, we compare the resultsobtained subsequently to the distinct thermal pathways.
Figure 11 presents at 100 Hz the dielectric response (inlogarithmic scale) after submitting EGDMA to the differentthermal treatments tested in the present work.
The solid line in Figure 11 corresponds to the behavior foundin the decreasing temperature run where crystallization wasavoided being the clear signature of the R-process. Uponsubsequent heating, cold-crystallization occurs slightly above183 K (filled circles) suppressing the R-process. An identicalbehavior was undergone by a different sample previously cold-
Figure 11. Isochronal dielectric loss at 100 Hz in logarithmic scale illustrating the dielectric behavior observed after different thermal treatments.The plots were displaced vertically to make the comparison easier. The magnitudes of the different processes should not be compared since distinctscales were used. Identification from top to bottom: solid line, cooling ramp from 298 to 153 K at 13 K ·min-1 (stage 1 of method I) which led tothe full amorphous solid; filled circles, subsequent heating (stage 2 of method I), where cold-crystallization occurred above ∼183 K; Tcr ) 197 K,Tcr ) 193 K, and Tcr ) 191 K, after isothermal cold-crystallization (method II) at the referred Tcr; met. III, after crystallization from melt. Theisochronal plots were constructed taking data acquired isothermally after each thermal treatment, except for the data represented by the solid line.The inset shows some isotherms where the �-process continuously disappears originating the drop in the Tcr ) 191 K trace (dashed circles), andits location is shown by the loss curve detected at 215 K in the specimen crystallized at 193 K (half-down circles). The vertical dashed lineindicates the melting that occurs at the same temperature (263 K) for all samples.
14206 J. Phys. Chem. B, Vol. 113, No. 43, 2009 Viciosa et al.

crystallized for 2 h at 191 K (detailed analysis not reported here)where the R-process remained (triangles down) but disappearedunder further heating. The R′- and �-relaxations seem to be theprocesses that persist after the nonisothermal crystallization ofthese two semicrystalline samples. Nevertheless, in the latter,an additional cold-crystallization occurred above 213 K asdetected by the drop in ε′′ (indicated by the circle in dashedline) extinguishing the �-process as shown in the isothermsincluded in the inset (the location of the �-process is undoubt-edly indicated by the isotherm at 215 K of the samplecrystallized at 193 K). This is the reason why data from a samplecrystallized at 191 K were included since it is the onlyexperiment where the �-process can be suppressed by supple-mentary crystallization.
In the sample melt-crystallized (up triangles) some contribu-tion of the R-relaxation is still present, but no further crystal-lization occurs. In this kind of crystallization, coming from themolten state, nucleation and growth are rather simultaneous.Therefore, the absence of further crystallization (cold) couldmean that in the melt-crystallized sample the mobility retainedwas not enough to promote further crystal grow in thesubsequent heating run.
The isothermal crystallization at 197 K is the experimentwhere in only a single path neither R- nor �-processes are left.It seems that the greatest crystallization degree was attainedfor this sample.
In spite of the different crystallinities achieved and prethermaltreatment, all the specimens melt at the same temperature, 263K. It is interesting to point out that also the melting endothermsdetected by DSC are independent of the thermal history (eitherafter isothermal melt- and cold-crystallizations or after noniso-thermal cold and melt-crystallizations): the respective endo-thermic peaks perfectly superpose (not shown). According tothe Gibbs-Thomson equation,60,61 this fact means that thecrystals formed are large enough to make insignificant theirsurface free energy when compared with volume free energy,since the former is responsible for the dependence of meltingtemperature on the crystal size. Thus, DSC heating scans giveno information about the dependence of crystal morphology withthermal history during crystallization. Nevertheless, a differencein the microstructure of the semicrystalline materials formedseems to be evident from dielectric results.
Conclusions
Ethylene glycol dimethacrylate is a low molecular weightglass former that can be obtained as a fully amorphous glass orin a nearly fully crystalline state depending on the thermaltreatment to which it is subjected.
Molecular mobility of the amorphous material in the glassystate is characterized by two secondary relaxations, γ and �,attributed to local motions, which can be related to thecorresponding relaxation processes in other n-EGDMA previ-ously characterized. The cooperative R-relaxation is character-ized by the common VFTH behavior with Tg, T0, and fragilityindex values in line with those of their counterparts.
The R-relaxation is completely suppressed only when crystal-lization is preceded by cooling to a temperature below Tg. Whenthe sample is melt-crystallized, the cooperative R-relaxationremains even strongly depleted.
On the other hand, the secondary �-relaxation when detectedafter crystallization becomes better resolved relative to theamorphous material. In spite of its significant depletion, it isobserved in a broader temperature interval including that inwhich the R-relaxation was located in the amorphous material.
The detection of �- and γ-processes after the vanishing of thecooperative R-relaxation means that its origin can be ascribedto molecular motions occurring in dimensions below the length-scale of cooperativity. Additionally, a low frequency R′-relaxation appears at advanced crystallization states, which canbe due to mobility in amorphous regions adjacent to the crystalsurfaces. The detection of this hindered process presents somesimilarity to what happens in semicrystalline polymers, but inthe case of low molecular weight molecules, there appearinteresting peculiarities that come from the differences in crystalmorphologyand the lackofconnectivity in thecrystal-amorphousinterfaces between the molecules that remain in the amorphousfraction and those in the crystalline phase.
Interestingly enough is the insensitivity to conversion of the�-process location (and apparently of γ), reinforcing the previousassignment of secondary relaxations in the n-EGDMA seriesto very localized motions. This leads to a decoupling of theirtemperatures dependencies relative to that of the R-processwhich takes place in the amorphous bulk-like regions.
Dielectric relaxation proved to be sensible to the remainingmobility in a highly crystalline media.
Acknowledgment. The authors deeply acknowledge thehelpful discussions with Prof. Graham Williams. Financialsupport to Fundacao para a Ciencia e Tecnologia (FCT,Portugal) is acknowledged through the project PTDC/CTM/64288/2006 and a postdoc grant SFRH/BPD/39691/2007 (M. T.Viciosa). J. L. Gomez Ribelles acknowledges the support ofthe Spanish Ministry of Science through project No. MAT2007-66759-C03-01 (including the FEDER financial support) andfunding for research in the field of Regenerative Medicinethrough the collaboration agreement from the Conselleria deSanidad (Generalitat Valenciana) and the Instituto de SaludCarlos III (Ministry of Science and Innovation).
References and Notes
(1) Carpentier, L.; Decressain, R.; Desprez, S.; Descamps, M. J. Phys.Chem. B 2006, 110, 457.
(2) Andronis, V.; Zografi, G. J. Non-Cryst. Solids 2000, 271, 236.(3) Vallet-Regı, M.; Granado, S.; Arcos, D.; Gordo, M.; Cabaoas,
M. V.; Ragel, C. V.; Salinas, A. J.; Doadrio, A. L.; San Roman, J. J. Biomed.Mater. Res. 1998, 39, 423.
(4) Walstra, P. Physical Chemistry of Food; Marcel Dekker Inc.: NewYork, 2003; chap. XVI.
(5) Bhugra, C.; Rambhatla, S.; Bakri, A.; Duddu, S. P.; Miller, D. P.;Pikal, M. J.; Lechuga-Ballesteros, D. J. Pharm. Sci. 2007, 96, 1258.
(6) Seefeldt, K.; Miller, J.; Alvarez-Nunez, F.; Rodrıguez-Hornedo, N.J. Pharm. Sci. 2007, 96, 1147.
(7) Hancock, B. C.; Shamblin, S. L.; Zografi, G. Pharm. Res. 1995,12, 799.
(8) Yoshioka, M.; Hancock, B. C.; Zografi, G. J. Pharm. Sci. 1995,84, 983.
(9) Dudognon, E.; Danede, F.; Descamps, M.; Correia, N. T. Pharm.Res. 2008, 25, 2853.
(10) Bland, M. H.; Peppas, N. A. Biomaterials 1996, 17, 1109.(11) Krishnan, V. K.; Manjusha, K.; Yamuna, V. J. Mater. Sci.-Mater.
Med. 1997, 8, 703.(12) Alvarez-Lorenzo, C.; Hiratani, H.; Gomez-Amoza, J. L.; Martınez-
Pacheco, R.; Souto, C.; Concheiro, A. J. Pharm. Sci. 2002, 91, 2182.(13) Chetoni, P.; Di Colo, G.; Grandi, M.; Morelli, M.; Saettone, M. F.;
Darougar, S. Eur. J. Pharm. Biopharm. 1998, 46, 125.(14) Viciosa, M. T.; Dionısio, M. J. Non-Cryst. Solids 2004, 341, 60.(15) Viciosa, M. T.; Bras, A. R.; Gomez Ribelles, J. L.; Dionısio, M.
Eur. Polym. J. 2008, 44, 155.(16) Williams, G. AdV. Polym. Sci. 1979, 33, 59.(17) Ezquerra, T. A.; Balta-Calleja, F. J.; Zachmann, H. G. Polymer
1994, 35, 2600.(18) Dionısio, M.; Viciosa, M. T.; Wang, Y.; Mano, J. F. Macromol.
Rapid Commun. 2005, 26, 1423.(19) Bras, A. R.; Viciosa, M. T.; Wang, Y.; Dionısio, M.; Mano, J. F.
Macromolecules 2006, 39, 6513.(20) Mijoviæ, J.; Sy, J. W. Macromolecules 2002, 35, 6370.
Molecular Dynamics of EGDMA Glass Former J. Phys. Chem. B, Vol. 113, No. 43, 2009 14207

(21) Fitz, B. D.; Andjelic, S. Polymer 2003, 44, 3031.(22) Kanchanasopa, M.; Runt, J. Macromolecules 2004, 37, 863.(23) Laredo, E.; Graimau, M.; Barriola, P.; Bello, A.; Muller, A. J.
Polymer 2005, 46, 6532.(24) Soccio, M.; Nogales, A.; Lotti, N.; Munari, A.; Ezquerra, T. A.
Polymer 2007, 48, 4742.(25) Sanz, A.; Nogales, A.; Ezquerra, T. A.; Lotti, N.; Munari, A.; Funari,
S. S. Polymer 2006, 47, 1281.(26) Massalska-Arodz, M.; Williams, G.; Smith, I. K.; Conolly, C.;
Aldridge, G. A.; Dabrowski, R. J. Chem. Soc., Faraday Trans. 1998, 94,387.
(27) Dobbertin, J.; Hannemann, J.; Schick, C.; Potter, M.; Dehne, H.J. Chem. Phys. 1998, 108, 9062.
(28) Massalska-Arodz, M.; Williams, G.; Thomas, D. K.; Jones, W. J.;Dabrowski, R. J. Phys. Chem. B 1998, 103, 4197.
(29) Minoguchi, A.; Nozaki, R. J. Non-Cryst. Solids 2002, 307-310,246.
(30) Hedoux, A.; Denicourt, T.; Guinet, Y.; Carpentier, L.; Descamps,M. Solid State Commun. 2002, 122, 373.
(31) Jimenez-Ruiz, M.; Ezquerra, T. A.; Sics, I.; Fernandez-Dıaz, M. T.Appl. Phys. A 2002, 74, S543.
(32) Rengarajan, G. T.; Beiner, M. Lett. Drug Des. DiscoVery 2006, 3,723.
(33) Alie, J.; Menegotto, J.; Cardon, P.; Duplaa, H.; Caron, A.;Lacabanne, C.; Bauer, M. J. Pharm. Sci. 2004, 93, 218.
(34) Fukao, K.; Miyamoto, Y. J. J. Non-Cryst. Solids 1997, 212, 208.Fukao, K.; Miyamoto, Y. J. J. Non-Cryst. Solids 1998, 235-237, 534.
(35) Alves, N. M.; Mano, J. F.; Balaguer, E.; Meseguer Duenas, J. M.;Gomez Ribelles, J. L. Polymer 2002, 43, 4111.
(36) Shafee, E. El. Eur. Polym. J. 2001, 37, 1677.(37) Wang, Y.; Gomez Ribelles, J. L.; Salmeron Sanchez, M.; Mano,
J. F. Macromolecules 2005, 38, 4712.(38) Viciosa, M. T.; Correia, N. T.; Salmeron Sanchez, M.; Carvalho,
A. L., Romao, M. J.; Gomez Ribelles, J. L.; Dionısio, M. J. Phys. Chem.B, DOI: 10.1021/jp903212g.
(39) Affouard, F., PriVate communication. The estimation of the dipolarmoment was accomplished by using Gaussian98 [Frisch, M. J. Gaussian98, Revision A.11.1; Gaussian, Inc.: Pittsburgh PA, 2001]. Base: B3LYP/6-31G*.
(40) Havriliak, S.; Negami, S. Polymer 1967, 8, 161. Havriliak, S.;Negami, S. J. Polym. Sci. C 1966, 16, 99.
(41) Schonhals, A.; Kremer, F. Analysis of Dielectric Spectra. InBroadband Dielectric Spectroscopy; Kremer, F., Schonhals, A., Eds.;Springer Verlag: Berlin, 2003; Chapter 3.
(42) Boersema, A.; van Turnhout, J.; Wubbenhorst, M. Macromolecules1998, 31, 7453.
(43) Schroter, K.; Unger, R.; Reissig, S.; Garwe, F.; Kahle, S.; Beiner,M.; Donth, E. Macromolecules 1998, 31, 8966.
(44) Frohlich, H. Theory of Dielectrics; Oxford Univ. Press, 1958.(45) Wunderlich, B. J. Chem. Phys. 1958, 29, 1395.(46) Diogo, H. P.; Moura Ramos, J. J. J. Chem. Educ. 2006, 83, 1389.(47) Vogel, H. Phys. Zeit. 1921, 22, 645.(48) Fulcher, G. S. J. Am. Ceram. Soc. 1925, 8, 339.(49) Tammann, G.; Hesse, W. Z. Anorg. Allg. Chem. 1926, 156, 245.(50) Richert, R.; Blumen, A. Eds. Disorder Effects on Relaxational
Processes; Springer: Berlin, 1994.(51) Bohmer, R.; Ngai, K. L.; Angell, C. A.; Plazek, D. J. J. Chem.
Phys. 1993, 99, 4201.(52) Angell, C. A. J. Non-Cryst. Solids 1991, 131-133, 13. Angell,
C. A. J. Res. Natl. Inst. Stand. Technol. 1997, 102, 171.(53) Qin, Q.; McKenna, G. B. J. Non-Cryst. Solids 2006, 352, 2977.(54) Lupa°cu, V.; Picken, S. J.; Wubbenhorst, M. Macromolecules 2006,
39, 5152.(55) Beiner, M.; Ngai, K. L. Macromolecules 2005, 38, 7033.(56) Viciosa, M. T.; Rodrigues, C. M.; Dionısio, M. J. Non-Cryst. Solids
2005, 351, 14. In this reference, the actual γ-process found in n-ethyleneglycol dimethacrylates was designated as � since only one secondaryrelaxation was detected.
(57) Shelby, J. E. Introduction to Glassy Science and Applications; RoyalSociety of Chemistry: Cambridge, United Kingdom, 2002.
(58) Rao, C. N. R.; Rao, K. J. Phase Transitions in Solids; McGraw-Hill: New York, 1978.
(59) Owen, A. E. Amorphous Solids and the Liquid State; Plenum: NewYork, 1985.
(60) Wunderlich, B. Macromolecular Physics; Academic Press: London,1980; Vol. 3.
(61) Zhou, H.; Wilkes, G. L. Polymer 1997, 38, 5735.
JP903208K
14208 J. Phys. Chem. B, Vol. 113, No. 43, 2009 Viciosa et al.