asbestosis in former Wittenoom asbestos workers - NCBI
10
British Journal of Industrial Medicine 1991;48:793-802 Prediction of mesothelioma, lung cancer, and asbestosis in former Wittenoom asbestos workers G Berry Abstract Projections have been made of the number of mesotheliomas, lung cancers, and cases of asbestosis that might occur over the period 1987 to 2020 in former workers at the Wittenoom crocidolite asbestos mine in Western Australia. Predictions were based on the observed mortality to the end of 1986 and modelling of the mesothelioma rate. Elimina- tion of crocidolite from the lungs was included in the model. Between the years 1987 and 2020 it is predicted that between 250 and 680 deaths will occur due to mesothelioma. This wide range is due to uncertainty on the functional form of the relation between mesothelioma rate and time, and insufficient data to estimate the elimination rate of crocidolite from the lungs. The most likely range is the lower half of this total range-that is, between 250 and 500. It is predicted that between 340 and 465 deaths will occur due to lung cancer. About 45% of these deaths would be attributable to exposure to asbestos. It is estimated that currently there are up to 200 cases of undiagnosed asbestosis. Of these about 50 will die of lung cancer or mesothelioma and are therefore also included in the figures above. Up to 60 former workers may develop the first signs of asbestosis in the future but any such cases are likely to progress to more serious disease at a much slower rate than the cases that have already been identified. The group of former workers employed in the production of crocidolite asbestos at Wittenoom between 1943 and 1966 has been studied by Hobbs et al over the past decade. Out of a workforce of over 6500 men and 400 women there had been 820 deaths in men by the end of 1980,2 including 32 deaths due to mesothelioma, 91 (standardised mortality ratio (SMR) between 1-6 and 2-6) due to cancer of the trachea, bronchus, and lung, and 34 due to pneumoconiosis. de Klerk et al 'extended the follow up to the end of 1986, by which time there had been 94 cases of mesothelioma, 141 cases of lung cancer, and 356 successful compensation claims for asbes- tosis. The data were used to predict future incidence of these three asbestos related diseases for the period 1987 to 2020. They predicted 2898 deaths in this period, 692 cases of mesothelioma, 183 cases of lung cancer, and 482 cases of asbestosis. In the present paper an independent set of predictions is reported and compared with those of de Klerk et al.3 The characteristics of the workforce have been reported.2 Briefly about 45 % of the men had worked at Wittenoom for less than three months and less than 3% had stayed for more than five years. Fibre concentrations in the mill were high but because of the short exposures most men (56%) accumulated less than 10 fibre-years/ml and less than 5% more than 100 fibre-years/ml. About 80% of men were known to have worked in the mine, or mill, or both and 62% started work after 1957, the year in which a new mill was opened. The women's exposure differed from that of the men since very few worked in the mine or mill and consequently about 90% had a cumulative exposure of less than 10 fibre-years/ml. Methods THE POPULATION Details of the population were supplied by the Perth investigators; the information consisted of sex, year of birth, year and age when they started work at Wittenoom, total days worked, workplace, and average intensity of exposure (fibres/ml) to asbestos. For those who had died the year of death was given and if a mesothelioma or lung cancer had been diagnosed the year of such diagnosis was supplied. For a person known to have emigrated the year of emigration was stated. This information was sup- plied for 6501 men and 410 women. This data set forms the basis of the predictions described. Cumulative exposure (fibres-year/ml) was calculated as the product of total days worked and average intensity of exposure divided by 365. As noted by Rogers4 the absolute values of fibre concentration are underestimates, but they serve as a means of ranking the different jobs within the Wittenoom population. Deaths had been recorded for 1176 men and 31 women, and 153 men and six women were recorded Department of Public Health, University of Sydney, New South Wales, 2006, Australia G Berry 793
-
Upload
khangminh22 -
Category
Documents
-
view
2 -
download
0
Transcript of asbestosis in former Wittenoom asbestos workers - NCBI

British Journal of Industrial Medicine 1991;48:793-802
Prediction of mesothelioma, lung cancer, andasbestosis in former Wittenoom asbestos workers
G Berry
AbstractProjections have been made of the number ofmesotheliomas, lung cancers, and cases ofasbestosis that might occur over the period1987 to 2020 in former workers at theWittenoom crocidolite asbestos mine inWestern Australia. Predictions were based onthe observed mortality to the end of 1986 andmodelling of the mesothelioma rate. Elimina-tion of crocidolite from the lungs was includedin the model. Between the years 1987 and 2020 itis predicted that between 250 and 680 deathswill occur due to mesothelioma. This widerange is due to uncertainty on the functionalform of the relation between mesotheliomarate and time, and insufficient data to estimatethe elimination rate of crocidolite from thelungs. The most likely range is the lower halfofthis total range-that is, between 250 and 500. Itis predicted that between 340 and 465 deathswill occur due to lung cancer. About 45% ofthese deaths would be attributable to exposureto asbestos. It is estimated that currently thereare up to 200 cases of undiagnosed asbestosis.Of these about 50 will die of lung cancer or
mesothelioma and are therefore also includedin the figures above. Up to 60 former workersmay develop the first signs of asbestosis in thefuture but any such cases are likely to progressto more serious disease at a much slower ratethan the cases that have alreadybeen identified.
The group of former workers employed in theproduction of crocidolite asbestos at Wittenoombetween 1943 and 1966 has been studied by Hobbs etal over the past decade. Out of a workforce of over6500 men and 400 women there had been 820 deathsin men by the end of 1980,2 including 32 deaths due tomesothelioma, 91 (standardised mortality ratio(SMR) between 1-6 and 2-6) due to cancer of thetrachea, bronchus, and lung, and 34 due topneumoconiosis. de Klerk et al 'extended the follow
up to the end of 1986, by which time there had been94 cases of mesothelioma, 141 cases of lung cancer,and 356 successful compensation claims for asbes-tosis. The data were used to predict future incidenceof these three asbestos related diseases for the period1987 to 2020. They predicted 2898 deaths in thisperiod, 692 cases of mesothelioma, 183 cases of lungcancer, and 482 cases of asbestosis. In the presentpaper an independent set of predictions is reportedand compared with those of de Klerk et al.3The characteristics of the workforce have been
reported.2 Briefly about 45% of the men had workedat Wittenoom for less than three months and less than3% had stayed for more than five years. Fibreconcentrations in the mill were high but because ofthe short exposures most men (56%) accumulatedless than 10 fibre-years/ml and less than 5% morethan 100 fibre-years/ml. About 80% of men wereknown to have worked in the mine, or mill, or bothand 62% started work after 1957, the year in which anew mill was opened. The women's exposure differedfrom that of the men since very few worked in themine or mill and consequently about 90% had acumulative exposure of less than 10 fibre-years/ml.
MethodsTHE POPULATIONDetails of the population were supplied by the Perthinvestigators; the information consisted of sex, yearof birth, year and age when they started work atWittenoom, total days worked, workplace, andaverage intensity of exposure (fibres/ml) to asbestos.For those who had died the year of death was givenand if a mesothelioma or lung cancer had beendiagnosed the year of such diagnosis was supplied.For a person known to have emigrated the year ofemigration was stated. This information was sup-plied for 6501 men and 410 women. This data setforms the basis of the predictions described.Cumulative exposure (fibres-year/ml) was calculatedas the product of total days worked and averageintensity of exposure divided by 365. As noted byRogers4 the absolute values offibre concentration are
underestimates, but they serve as a means of rankingthe different jobs within the Wittenoom population.Deaths had been recorded for 1176 men and 31
women, and 153 men and six women were recorded
Department of Public Health, University of Sydney,New South Wales, 2006, AustraliaG Berry
793

Berry
as having emigrated. This left 5172 men and 373women as the maximum numbers still alive on 1January 1987.A problem that occurs in the follow up of a group
such as this in Australia is the difficulty of obtainingpositive confirmation that a given subject is still aliveafter checks of death registries in all the States havefailed to identify that the subject has died. Con-firmation of vital status had been sought by thechecking of electoral rolls, telephone directories, andother sources,2 but the vital status was unconfirmedfor about a third of the men and almost half of thewomen on 31 December 1986.3 It is reasonable tosuppose that most of these subjects would be alive atthe end of 1986 as the death of any subject wouldincrease the probability of a confirmed vital status;this would be even more so for a subject dying ofmesothelioma or lung cancer since such subjectswould be included in state cancer registries. Never-theless, it is also reasonable to suppose that somedeaths would be missed in the search and internalevidence in the data indicates that this has occurred.One piece of such evidence is the excess ofmen who,if still alive, would have been aged 90 or more at theend of 1986; there were 24 such men, including eightaged over 95 and two over 100. Only 62 men in theentire group born in 1896 or earlier could havereached the age of 90, including 22 and eight whocould have reached the ages of 95 and 100 respec-tively. It should be noted that these apparently veryold survivors would not have invalidated any of themortality analyses published by the Perth group asthese analyses only included subjects up to the age of85. A second and more important piece ofevidence ofundetected deaths came to light in the analysis ofmortality reported below.
MORTALITY ANALYSISAn analysis of mortality was carried out for the mento establish the amount of excess mortality for allcauses of death, lung cancer, and mesothelioma, andthe factors ofthe working environment at Wittenoomthat influenced the mortality. In this analysis the first10 years after first employment at Wittenoom wereignored. Expected deaths for all causes and cancer ofthe lung were calculated using sex and calendarperiod specific death rates for Western Australia(these rates were the same as used by the Perthgroup), the subject-years method,56 and a specificcomputer program.7 Associations between excessmortality and features of exposure were analysedusing Poisson modelling of the results of the subject-years analysis.6 Mesothelioma mortality was ex-pressed as a rate per 100 000 person-years andanalysed by Poisson modelling.
MESOTHELIOMA AND DURATION OF FOLLOW UPThe relation between mesothelioma rate and time
since first exposure has been investigated in a numberof follow up studies similar to the Wittenoom study.It has generally been found that the mesotheliomarate increases according to time since first exposure (t)raised to a power-that is:
rate = c tkwhere the power k would be between 3 and 4, and theconstant c is dependent on exposure. This formula-tion does not include any lag period during whichmesotheliomas could not occur and lead to death. Analternative that includes such a lag period w is:
rate = c (t - w)kwhere the power k would be lower the greater the lagperiod.
PREDICTION METHODThe mortality ofthe population ofmen assumed aliveon 1 January 1987 was projected forward annually to31 December 2020. The assumptions in this projec-tion were:
(1) that the death rates for all causes of deathwould be the rates for Western Australia for1979 to 1982, except as modified to take accountof the excess deaths from lung cancer andmesothelioma in (2) and (3) below. An exponen-tial equation in age was fitted to the rates for allcauses.(2) That the death rates due to lung cancerwould be those for Western Australia multi-plied by a factor representing the excessassociated with exposure to crocidolite at Wit-tenoom. This factor, the SMR, depended oncumulative exposure to asbestos at Wittenoom.(3) That the mesothelioma death rate would bemodelled according to time since first exposure,and would also contain a factor dependent oncumulative exposure.
These death rates were applied to the assumedpopulation alive on 1 January of each year and thenumber of deaths expected during the year werecalculated (assuming that deaths would occur uni-formly throughout the year). This calculation gavethe number ofsurvivors at the end ofthe year and thiswas the starting population for the next year'scalculation.Three different models of mesothelioma rate were
fitted, for lag times of zero, five, and 10 years. Also,some modified models were used. In one of these thebackground death rates due to lung cancer wereassumed to decline at 2% per calendar year becauseof a decline in smoking. In another, increase inmesothelioma rate with time since exposure wasmoderated by a factor representing a decline in risk tocorrespond to elimination ofasbestos from the lungs.This model was:
rate = c e-'(t - w)k
794

Prediction of mesothelioma, lung cancer, and asbestosis informer Wittenoom asbestos workers
Table 1 Mortality analysis
Cause of death Observed Expected Ratio Rate per 10' my
All ages:All causes 983 1114-0 0-88Lung cancer 122 88-1 1 38Mesothelioma 84 - - 81
Ages up to 65:All causes 719 601 8 1.19Lung cancer 87 48-7 1-79Mesothelioma 72 - - 76
Ages of 65 and older:All causes 264 512 2 0-52Lung cancer 35 39 4 0 89Mesothelioma 12 - - 136
Results of mortality analysisIn 6258 men followed up for more than 10 years therehad been 983 recorded deaths, ofwhich 122 were dueto lung cancer and 84 to mesothelioma. Table 1presents the subject-years analysis in which thefollow up has been subdivided into ages up to 65 and65 and older. In spite of the excess mortality due tolung cancer overall, this analysis showed an apparentdeficit of deaths due to all causes and to lung cancer
but not to mesothelioma, at ages of 65 or older. Amore detailed tabulation showed that the apparentdeficit increases with increasing age beyond 65. Themost reasonable explanation is that undetecteddeaths occurred. The results of de Klerk et al ' (seetheir fig 4), in which the increase in death rate beyondage 65 was less than expected, support this inter-pretation. To compensate for this two things havebeen done. Firstly, in the analysis to determine theenvironmental factors influencing mortality onlymortality experience up to age 65 has been included.Secondly, the population alive on 1 January 1987,which was used for prediction, has been adjusted.
It should be noted that the excess mortality fromall causes up to age 65 (117 deaths) is almost equal tothe excess number of lung cancer deaths (38) and thenumber of mesotheliomas (72).As expected from the earlier work23 the excess
mortality from lung cancer and from mesotheliomaboth increased with increasing time worked at Wit-tenoom, and with increasing cumulative exposure.The excesses were also greater for those who hadworked in the mill and for those who were firstemployed before 1957. The excess rate oflung cancerwas relatively stable with increasing duration offollow up beyond 10 years, but the mesothelioma rateincreased rapidly with duration of follow up.The exposure factors above were associated. For
example, the group was divided into those firstemployed before 1957 and later because an
improvement in conditions was reported at that time.This improvement is reflected in the intensity ofexposure, and hence in the measure of cumulative
2000- Lag=08OLag=5
* Lag=100/1500- O Lag=5, elimination=6'8%/[* Lag= 5, elimination= 15%
1000AE0-~500-0
0
Years since first exposure
Figure 1 Fitted mesothelioma rates for lag periods of zero,5, and 10 years, andfor models with elimination ofcrocidolite from lungs.
exposure. Similarly, differences between the mineand mill will be incorporated into cumulativeexposure, which by definition is also associated withduration of exposure. The consequence of theseassociations was that the excess mortality could bemodelled using only cumulative exposure as ameasure ofthe working environment, and also takingaccount of duration of follow up for mesothelioma.
MESOTHELIOMA AND DURATION OF FOLLOW UPThe relation between mesothelioma death rate andtime since first exposure used was:
rate = c (t - w)kwith lag periods w of zero, five, and 10 yearsconsidered. The constant c was related to thecumulative exposure. It was found that the observedtime pattern ofmesothelioma deaths was fitted almostequally well by the three models with estimates ofthepower k of 3 52, 2-71, and 1 80 for lags of zero, five,and 10 years respectively.
If the only purpose of an analysis were to explainthe mortality already observed the model with zerolag period would be favoured on the grounds ofparsimony-that is, the model contains fewerparameters. When the purpose, however, is topredict future mortality involving extrapolation todurations of follow up not yet observed, the distinc-tion is critical. Although a range of values of lagperiod give similar mesothelioma rates within therange of the data these rates diverge appreciablythereafter. This is illustrated in fig 1, in which thefitted mesothelioma rate, averaged over exposure, isplotted against time since first exposure for lagperiods of zero, five, and 10 years. The agreementbetween these three models up to 35 years from firstexposure, which covers most of the observed followup, is clear. Between 30 and 35 years from firstexposure the mesothelioma rate is about 250 per100 000 person-years. The divergence thereafter is
795

Berry
Table 2 Age distribution of men surviving on 1 January1987
Age group Maximum survivors Assumed survivors
34-39 90 9040-44 597 59745-49 1105 110550-54 901 90155-59 976 97660-64 643 64365-69 356 32070-74 221 17775-79 133 9380-84 83 5085-89 43 2290-94 16 6>95 8 2
Total 5172 4982
striking and is twofold after 55 years, a duration offollow up that all former workers will reach by 2020.The rate reaches 1400, 1100, and 700 per 100 000person-years by 50 to 55 years since first exposure forthe models with lag zero, five, and 10 years respec-tively. Figure 1 also shows the fitted mesotheliomarates after fitting two models with elimination, rate =ce4t(t - w)k. For a lag of five years, the maximumlikelihood estimate of) was 0-068, corresponding toelimination of 6 8% per year, with k as 3-92. Withthis model the mesothelioma rate is relatively con-stant after 40 years since first exposure and reaches525 per 100 000 person-years by 50 to 55 years. Thisestimate of A was imprecise and a value of0- 15, with k= 5 4, fitted the data almost as well, giving a peak rate
between 40 and 45 years since first exposure of 265per 100 000 person-years followed by a decline to 210per 100 000 person-years by 50 to 55 years.
POPULATION OF MEN ALIVE ON 1 JANUARY 1987A maximum of 5172 men survived to 1 January1987, but evidence existed showing that some ofthese aged 65 or older not recorded as dead were infact dead, and that the proportion of undetecteddeaths increased with age. Accordingly thepopulation assumed alive on 1 January 1987 wasreduced by 10%, 20%, etc to 70% for those aged65 to 69, 70 to 74, etc to 95 or older respectively.This gave 4982 men (table 2).
WOMENOnly 410 women were in the group and there wereonly 31 recorded deaths. Two mesotheliomas andthree lung cancers have been diagnosed. Withthese small numbers a detailed mortality analysiswould not be informative.
Prediction resultsMESOTHELIOMA AND LUNG CANCERTable 3 gives details ofthe mortality models used andparameter values.The first prediction was that no excess lung cancer
mortality or mesotheliomas occurred. This serves asa baseline as it indicates the mortality that would havebeen expected if working at Wittenoom hadproduced no asbestos-related mortality. Table 4
Table 3 Mortality models usedfor prediction
Western Australia death rates from all causes (DRAC) (men):DRAC = exp (- 9759 + 0-09348 *age on January 1)
Western Australia death rates from lung cancer (DRLC) (men):DRLC = 28, 72, 310, 692, 1362, 1972, 3439, 4781, 6629, 5887, 4955 per million for age groups 35-39, 40-44, 45-49, 50-54, 55-59,60-64,65-69, 70-74, 75-79,80-84, > 85
SMR for lung cancer due to exposure at Wittenoom (SMRLC):SMRLC = 1-34 for cumulative exposure less than 10 fibre-years/ml
1-78 for cumulative exposure 10 to less than 50 fibre-years/ml1-80 for cumulative exposure 50 to less than 100 fibre-years/ml5-97 for cumulative exposure 100 or more fibre-years/ml1-78 for cumulative exposure unknown
Mesothelioma rate (DMS):DMS = exp [a + b + k *ln(t-lag)] where for(1) lag = 0
a =-18-48, k = 3 517b = 0, 0-9273, 1-150, 1-931, - 06655 for the five categories of cumulative exposure given above
(2) lag = 5 yearsa = -15 23,k = 2 707b = 0, 0-9256, 1-146, 1-932, - 06492 for the five categories of cumulative exposure given above
(3) lag= 10 yearsa =-11-94, k = 1-796b = 0, 0-9248, 1-142, 1 937, -0-6103 for the five categories of cumulative exposure given above
Total death rate (DTOT):DTOT = DRAC + (SMRLC-1) *DRLC + DMSProbability of dying in year = DTOT/(1 0 + 0-5 * DTOT)
796

Prediction of mesothelioma, lung cancer, and asbestosis informer Wittenoom asbestos workers
Table 4 Predicted mortality with no asbestos related excess
All causes Lung cancer
Years Peryear Cumulative Per year Cumulative
1987-90 82 327 7 281991-5 98 815 9 711996-2000 117 1399 10 1232001-5 134 2069 11 1802006-10 144 2787 11 2352011-5 140 3486 9 2812016-20 120 4088 7 315
Age distribution of deaths to 31 December 2020
Age All causes Lung cancer
<49 41 250-54 91 855-59 194 2160-64 363 3665-69 570 6170-74 779 7375-79 855 7180-84 670 3185-89 379 10>90 146 2
gives the details of this prediction. In summary therewould have been 4088 deaths in men by the year 2020and 315 (7 7%) of these deaths would have been dueto lung cancer. A corresponding approach for womengave 232 deaths, five with lung cancer, out of 356assumed survivors at the beginning of 1987.The next set of predictions were for the models
with excess lung cancer mortality and mesotheliomamortality discussed earlier, with allowance made forrisk varying with cumulative exposure, and formesothelioma lag periods of zero, five, and 10 years.
Table 5 summarises the results with more details intables 6 and 7. The numbers of deaths due to allcauses and due to lung cancer are only slightly affectedby the mesothelioma lag period; a total ofabout 4300deaths are expected to occur, which would leaveabout 700 survivors at the end of2020, and about 450(10-5%) of the deaths would be due to lung cancer.
The predicted number of deaths due to meso-
thelioma depends critically on the mesothelioma lagperiod, 654 (15 1%), 573 (13 3%), and 441 (10-4%)for lags of zero, five, and 10 years respectively. Thepredicted number ofdeaths due to mesothelioma alsodepends critically on the power k in the equation
Table 6 Predicted mortality due to all causes and lungcancerfor mesothelioma model with lag of 5 years
All causes Lung cancer
Years Per year Cumulative Per year Cumulative
1987-90 98 391 12 471991-5 115 966 14 1171996-2000 134 1635 16 1972001-5 146 2366 16 2772006-10 147 3103 15 3512011-5 134 3772 12 4102016-20 107 4304 8 449
Age distribution of deaths to 31 December 2020
Age All causes Lung cancer
K49 54 350-54 121 1255-59 255 3260-64 453 5565-69 674 9270-74 850 10575-79 853 9580-84 608 4085-89 319 1290 118 3
relating mesothelioma rate and time since exposure.The values ofk in table 3 are the maximum likelihoodestimates. For a lag period of zero, the 95% con-fidence limits for k were 2 66 and 4-42. Using thesevalues the number of mesotheliomas predicted by2020 ranged from 410 to 1007 (394 to 960 aged lessthan 85), whereas with k set as 3 0 the predictednumber was 499 (478 aged less than 85). Anotherpossibility considered was that elimination of asbes-tos from the lungs occurred and hence a reduction inthe parameter c with time since exposure. For a lag offive years, a rate ofelimination of6 8% per year, and k= 3-92, the number of predicted mesotheliomas was383 (tables 5 and 7) compared with 573 withoutelimination. For a rate of elimination of 15% per yearand k = 5 4, the number ofpredicted mesotheliomaswas 255.
Figure 2 shows the cumulative number of meso-theliomas for lag periods of zero, five, and 10 years,and for the models with elimination and a lag of fiveyears. Figure 3 shows the average numbers ofmesotheliomas per five year period. With a lag ofzerothe peak incidence is 24 per year between 2001 and2010; for a lag offive years the peak is 21 between 2001
Table 5 Predicted mortality by 2020for different models of mesothelioma rate
All ages Aged less than 85
Lag (y) All causes Lung cancer Mesothelioma All causes Lung cancer Mesothelioma
0 4332 444 654 3904 430 6245 4304 449 573 3867 434 54810 4261 459 441 3810 443 4255, 1=0-068 4239 462 383 3782 447 3725, A=0-15 4198 473 255 3728 456 250
797

Table 7 Predicted mortality for mesotheliomafor models with lag of zero, 5, and 10years, andfor models with elimination of dustfromlungs (lag 5 years, elimination rates 0-068 and 0 15)
No elimination Lag = five years with elimination
Lag = 0 Lag = five years Lag = IOyears A=0-068 A=0 15
Years Per year Cumulative Peryear Cumulative Peryear Cumulative Peryear Cumulative Per-year Cumulativ
1987-90 12 49 12 48 11 44 11 44 10 401991-5 17 132 16 125 13 i11 13 110 11 961996-2000 21 236 19 220 15 188 14 183 11 1502001-5 24 354 21 324 16 267 14 252 9 1942006-10 24 473 20 424 15 340 12 311 6 2252011-5 21 576 17 510 12 399 9 355 4 2452016-20 16 654 13 573 8 441 6 383 2 255
Age distribution of deaths to 31 December 2020
Lag = five years with elimination
Age Lag= 0 Lag =five years Lag= 10 years A=0-068 A=0-15
K49 12 12 12 13 1350-54 27 27 25 26 2455-59 56 53 46 46 3960-64 92 84 69 66 4965-69 124 109 84 75 4970-74 137 117 85 70 4075-79 113 94 67 51 2580-84 63 52 36 26 1185-89 24 20 14 9 4>90 6 5 3 2 1
and 2005, for a lag of 10 years the peak is 16 between2001 and 2005. For the model with an eliminationrate of 6-8% the peak of 14 occurs between 1996 and2000, and for an elimination rate of 15% the peak of11 per year is predicted to occur between 1991 and1995.Smoking rates in men have been declining in
recent years and it is reasonable to suppose that thiswill result in a decline in lung cancer rates in thefuture. Accordingly models were used for predictionin which the lung cancer rates at all ages in the generalpopulation declined at 2% per year; this is equivalentto a halving of the rates over 34 years. The asbestos
0z
am
EcJ
related mesothelioma rates and SMRs for excess lungcancer were taken as above. The predicted number oflung cancers was reduced to 336 (7-9%) with areduction of about 40 deaths overall and an increaseof about 10 deaths due to mesothelioma as a con-sequence ofthe increased numbers at risk in any year.
ASBESTOSISThe situation with asbestosis is different from thatwith mesothelioma and lung cancer. The diagnosis ofasbestosis depends not only on the onset of thiscondition but also on a person seeking medicalassessment. It is possible for a person to be undiag-
30
25-
20-
15-0z
Calender year-
Figure 2 Cumulative number ofpredicted mesotheliomas forlag periods of zero, 5, and IOyears, andfor models withelimination of crocidolite from lungs.
10
5-
1985 1990 1995 2000 2005 2010 2015Calender year
Figure 3 Predicted mesothelioma incidence peryearfor lagperiods of zero, 5, and IO years, andfor models withelimination of crocidolite from lungs.
Berry798

Prediction of mesothelioma, lung cancer, and asbestosis informer Wittenoom asbestos workers
nosed for several years after the disease has reached astage where it could be diagnosed. Also, whereas themortality ofpersons with asbestosis is higher becauseof the disease, persons with the disease could live formany years and eventually die ofsome other cause. Afurther complication is that the criteria for diagnosisare not invariant over time.There were 356 successful asbestosis claims to the
Pneumoconiosis Board by the end of 1986.3 Onehundred of these claims were successful between1981 and 1986, and the numbers in each of these sixyears were 12, 8, 6, 14, 41 and 19. The high numberin 1985 was thought to be due to "the need . .. toapply for compensation before a certain legislateddate," as well as the other factors mentioned earlier.Up to the end of 1986 41 deaths had occurred for
which the cause of death was recorded as asbestosis.Of the 356 who had made a successful claim to thePneumoconiosis Board, 167 had died by the end of1986; 37 (22%) ofthese deaths were due to asbestosisand, as these are included in the 41 above, onlyfour deaths were attributed to asbestosis in formerworkers not diagnosed in life. Also, out of the 356with asbestosis, 40 had been diagnosed with lungcancer and 10 with mesothelioma.The variation in delay between onset and diagnosis
of asbestosis makes it difficult to model the biologicalprocess of onset. Walker et al 8 approached thisproblem as follows: Firstly, based on publishedresults, they argued that in a group with asbestosisthere will be one death due to mesothelioma per yearper 200 persons. Not all persons with mesotheliomahave asbestosis, however, and they took a figure of28% as the proportion of those with mesotheliomawho have asbestosis. Applying this argument to theWittenoom men we have shown an average of 8-7deaths ofmesothelioma a year in 1981-6 (52 deaths insix years). About 2-5 (28% of 8-7) of these caseswould come from the group with asbestosis andtherefore this group would consist of 500 men. Thisis an estimate ofthe number ofmen with diagnosableasbestosis alive at the beginning of the 1980s. Thisapproach depends on the figure of 28%, which wasfrom a different situation and would not apply exactlyto the Wittenoom group.A second approach adopted by Walker et al8 gives
an independent estimate. It is based on a roughequality in the numbers of deaths due to meso-thelioma and asbestosis, on about 20% of deaths in agroup of asbestotic subjects being recorded as due toasbestosis, and the death rate of those with asbestosisbeing about three times the expected rate. Thisargument can be adapted to the Wittenoom group,substituting values from that group. By the end of1986, 84 deaths with mesothelioma and 41 withasbestosis had occurred. Because about 10 meso-thelioma deaths occur per year, one may expect aboutfive deaths a year due to asbestosis. As 22% (37/167
above) ofthe deaths in asbestotic subjects were due toasbestosis, then five deaths a year from asbestosiswould occur in a total of about 23 deaths out of agroup with asbestosis. Cookson et al 9 found that in agroup of 354 claimants to the Pneumoconiosis Boardfor asbestosis, the SMR for all cases of death was2-65. Because not all of the group had asbestosis(about 276 of the claims were successful) an SMR of3-0 for those with asbestosis seems reasonable. Thecurrent expected death rate in Wittenoom men isabout 0-017 per year and multiplying by three gives arate of about 0 05 in those with asbestosis at thebeginning of the 1980s. Thus to give 23 deaths a yearthere would have to be about 460 with asbestosis atthe beginning of the 1980s.The above numbers include those already diag-
nosed and still alive in 1980, about 300, so theyindicate between 160 and 200 cases of undiagnosedasbestosis.
DiscussionThe mortality analyses have been carried out usingthe age specific death rates for Western Australia as anindication of the mortality that would have beenexpected if the Wittenoom workers had experiencedthe same mortality as other people of the same sexand age in the state. This is the usual approach instudies of this type and is based on the availability ofstate death rates. One way that these rates could notbe completely appropriate arises from the healthyworker effect-that is, that men who applied for andwere accepted for employment at Wittenoom wouldexclude the chronically ill and so be expected to havea more favourable mortality than the state average.Although this would be the case at the start ofemployment the healthy worker effect declines overthe years as members of the group develop chronicillnesses. Although they may leave the workforce orchange jobs because of this they would remain in thestudy. Mortality was only considered 10 or moreyears after first employment at Wittenoom and theinfluence of the healthy worker effect is likely to besmall.
MESOTHELIOMAThe number of mesotheliomas expected by the year2020 has a range of 441 to 654 men considering onlymodels without elimination of crocidolite from thelungs. The second figure is an extreme result based onthe assumption that no lag time occurs for thedevelopment of a mesothelioma to the stage of death.This is so unrealistic that, even though such a modelfits the existing data, it should be disregarded forpredictive purposes. Allowing for a lag period of atleast five years reduces the upper limit to 573 meso-theliomas in men.The predictions make allowance for the duration
799
Berry
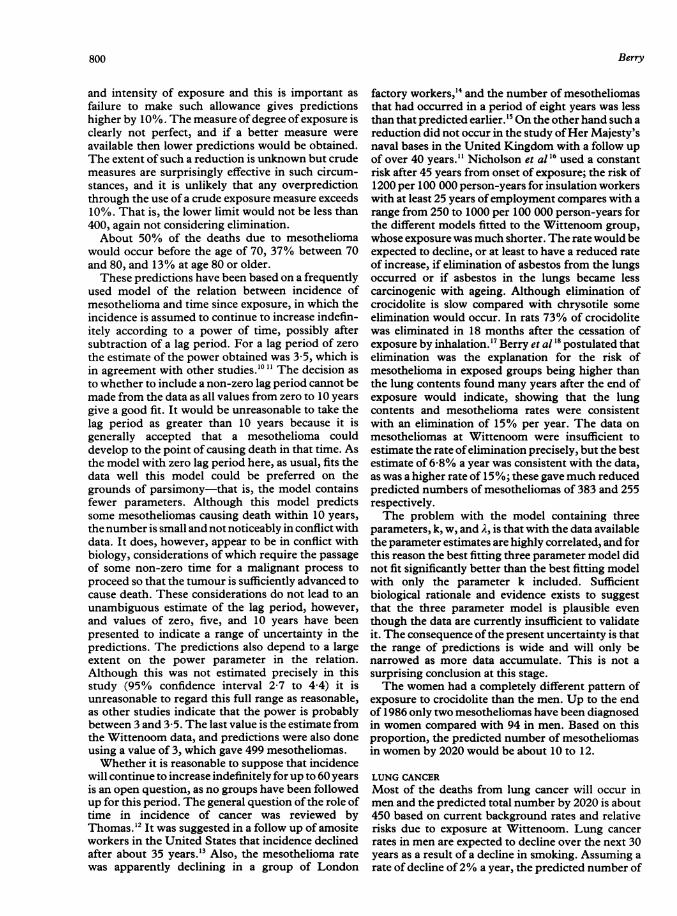
and intensity of exposure and this is important asfailure to make such allowance gives predictionshigher by 10%. The measure of degree ofexposure isclearly not perfect, and if a better measure wereavailable then lower predictions would be obtained.The extent of such a reduction is unknown but crudemeasures are surprisingly effective in such circum-stances, and it is unlikely that any overpredictionthrough the use of a crude exposure measure exceeds10%. That is, the lower limit would not be less than400, again not considering elimination.About 50% of the deaths due to mesothelioma
would occur before the age of 70, 37% between 70and 80, and 13% at age 80 or older.These predictions have been based on a frequently
used model of the relation between incidence ofmesothelioma and time since exposure, in which theincidence is assumed to continue to increase indefin-itely according to a power of time, possibly aftersubtraction of a lag period. For a lag period of zerothe estimate of the power obtained was 3-5, which isin agreement with other studies.''" The decision asto whether to include a non-zero lag period cannot bemade from the data as all values from zero to 10 yearsgive a good fit. It would be unreasonable to take thelag period as greater than 10 years because it isgenerally accepted that a mesothelioma coulddevelop to the point of causing death in that time. Asthe model with zero lag period here, as usual, fits thedata well this model could be preferred on thegrounds of parsimony-that is, the model containsfewer parameters. Although this model predictssome mesotheliomas causing death within 10 years,thenumber is small and not noticeably in conflict withdata. It does, however, appear to be in conflict withbiology, considerations of which require the passageof some non-zero time for a malignant process toproceed so that the tumour is sufficiently advanced tocause death. These considerations do not lead to anunambiguous estimate of the lag period, however,and values of zero, five, and 10 years have beenpresented to indicate a range of uncertainty in thepredictions. The predictions also depend to a largeextent on the power parameter in the relation.Although this was not estimated precisely in thisstudy (95% confidence interval 2-7 to 4 4) it isunreasonable to regard this full range as reasonable,as other studies indicate that the power is probablybetween 3 and 3-5. The last value is the estimate fromthe Wittenoom data, and predictions were also doneusing a value of 3, which gave 499 mesotheliomas.Whether it is reasonable to suppose that incidence
will continue to increase indefinitely for up to 60 yearsis an open question, as no groups have been followedup for this period. The general question ofthe role oftime in incidence of cancer was reviewed byThomas.'2 It was suggested in a follow up of amositeworkers in the United States that incidence declinedafter about 35 years.'3 Also, the mesothelioma ratewas apparently declining in a group of London
factory workers,'4 and the number of mesotheliomasthat had occurred in a period of eight years was lessthan that predicted earlier.'5 On the otherhand such areduction did not occur in the study ofHer Majesty'snaval bases in the United Kingdom with a follow upof over 40 years." Nicholson et al 6 used a constantrisk after 45 years from onset of exposure; the risk of1200 per 100 000 person-years for insulation workerswith at least 25 years ofemployment compares with arange from 250 to 1000 per 100 000 person-years forthe different models fitted to the Wittenoom group,whose exposure was much shorter. The rate would beexpected to decline, or at least to have a reduced rateof increase, if elimination of asbestos from the lungsoccurred or if asbestos in the lungs became lesscarcinogenic with ageing. Although elimination ofcrocidolite is slow compared with chrysotile someelimination would occur. In rats 73% of crocidolitewas eliminated in 18 months after the cessation ofexposure by inhalation.'7 Berry et al 8 postulated thatelimination was the explanation for the risk ofmesothelioma in exposed groups being higher thanthe lung contents found many years after the end ofexposure would indicate, showing that the lungcontents and mesothelioma rates were consistentwith an elimination of 15% per year. The data onmesotheliomas at Wittenoom were insufficient toestimate the rate ofelimination precisely, but the bestestimate of 6-8% a year was consistent with the data,as was a higher rate of 15%; these gave much reducedpredicted numbers of mesotheliomas of 383 and 255respectively.The problem with the model containing three
parameters, k, w, and A, is that with the data availablethe parameter estimates are highly correlated, and forthis reason the best fitting three parameter model didnot fit significantly better than the best fitting modelwith only the parameter k included. Sufficientbiological rationale and evidence exists to suggestthat the three parameter model is plausible eventhough the data are currently insufficient to validateit. The consequence ofthe present uncertainty is thatthe range of predictions is wide and will only benarrowed as more data accumulate. This is not asurprising conclusion at this stage.The women had a completely different pattern of
exposure to crocidolite than the men. Up to the endof 1986 only two mesotheliomas have been diagnosedin women compared with 94 in men. Based on thisproportion, the predicted number of mesotheliomasin women by 2020 would be about 10 to 12.
LUNG CANCERMost of the deaths from lung cancer will occur inmen and the predicted total number by 2020 is about450 based on current background rates and relativerisks due to exposure at Wittenoom. Lung cancerrates in men are expected to decline over the next 30years as a result of a decline in smoking. Assuming arate of decline of2% a year, the predicted number of
800

Prediction of mesothelioma, lung cancer, and asbestosis informer Wittenoom asbestos workers
lung cancers would be 336.Deaths due to lung cancer would have occurred
even if working at Wittenoom had produced noincrease in risk. The overall SMR for lung cancer was1-79 so that about 45% of deaths from lung cancerwould be attributable to exposure to asbestos-thatis, about 200 of the predicted 450. The actual excess,compared with the prediction with no asbestos effect(table 4), is 135 lung cancer deaths but this does nottake account ofthe fact that an increased rate not onlyresults in more cases but also some that would haveoccurred in any case, occur earlier. These figures arebased on the assumption that the Wittenoom workershad similar smoking habits to other men of the sameage.About 43% of the deaths due to lung cancer would
occur before age 70, 45% between 70 and 80, and12% at age 80 or older.
ASBESTOSISThe close agreement between the two approaches ofpredicting the number offormer workers with asbes-tosis not yet detected provides some reassurance thatthe predictions are reasonable. The agreement is,however, to some extent fortuitous. The firstapproach involved using factors calculated in dif-ferent circumstances, but the second approach wasself contained. This approach was based on thenumber of deaths caused by asbestosis being abouthalf the number due to mesothelioma. This was thesituation at the end of 1986 (41 asbestosis deaths, 84mesotheliomas) but at the end of 1980 the numberswere almost equal (34 asbestosis, 32 mesotheliomas).In the period 1981 to 1986 only seven deathsoccurred due to asbestosis compared with 52 meso-theliomas, and this indicates a decline in the numberwith, or at least the severity of, asbestosis. Thus thepredictions above may be too high, or the 160 to 200as yet undiagnosed may be less severe forms ofasbestosis.
Because four of the 41 deaths due to asbestosishave occurred in subjects not diagnosed in life, then alower limit to the number of undiagnosed cases is 35(10% of the 356 diagnosed cases). This estimatewould be too low because the fact that asbestosis hasbeen diagnosed in life increases the chance that it isrecorded as the cause ofdeath. A more prudent lowerlimit would perhaps be double this figure, 70, to give arange of between 70 and 200 cases.The above estimates are of the number of existing
but undiagnosed cases. The question arises as towhether there could be onset of new cases in formerworkers who, if medically examined now, would beassessed as not having asbestosis. A study of thenatural history of asbestosis in former workers atWittenoom'9 indicated that progression of asbestosiscontinues for many years after exposure has ceased.As the onset of asbestosis may be considered as a stepin a progression starting with sub-clinical stages ofthe disease, it is reasonable to suppose that onset
could also occur many years after exposure hasceased. It was also shown that the rate of progressionof radiological abnormality was less for those whotook longer to reach the first detectable stage.'9 Thusifany new cases of asbestosis are yet to occur 20 yearsafter exposure ceased, such cases would be expectedto progress slowly and thus would be less likely toreach a stage at which a claim could be sustained.Walker et al8 suggested that few new cases wouldoccur 10 years after cessation of exposure.A worst possible case is obtained from a figure in
the paper by Cookson et al 9 showing the time courseto radiological abnormality. From this figure, andtaking account of the time of employment of theWittenoom group, it can be calculated that by 1987 atleast 90% of the eventual yield of radiologicalabnormality would already have occurred. Althoughradiological abnormality is not sufficient to give adiagnosis of asbestosis, if it is assumed that 90% ofthe eventual number with asbestosis already have thedisease, another 60 could develop the first detectablesigns in the future. As discussed earlier these 60would progress slowly.
COMPARISON WITH THE FINDINGS OF DE KLERK et al 3In comparing the results reported here with those ofde Klerk et al3 one difference is that in my paper thepredictions are of deaths due to mesothelioma andlung cancer, whereas de Klerk et al3 predictedincidence of diagnosis. For these two types of malig-nancy, which usually prove fatal fairly rapidly, thedifferences between the two approaches would not belarge. A second difference is that de Klerk et al3truncated the predictions at age 85; in comparing thepredictions a similar restriction will be applied to theresults in this paper.The most striking difference between the two
predictions is in the total number of deaths, 2898 inmen and women predicted by de Klerk et al3compared with 3850 in men in this paper (therewould have been another 170 deaths in women). Thisdiscrepancy is probably due to undetected deaths. deKlerk et al 3 claimed that the effect of loss to follow upshould only be slight on the basis that only a few casesof asbestos related disease are likely to have beenmissed. Their claim also depends on an accurateassessment of the population at risk and the futuremortality from all causes. Ifsome have died of causesunrelated to exposure to asbestos unknown to theauthors then the number of survivors on 1 January1987, the starting date of their prediction, will not beas high as they have assumed. More importantly, thesurvival of the population in the future will have beenoverestimated, as de Klerk et al3 based their predic-tion on the observed mortalities and did not use Statefigures, and hence the number at risk of asbestosrelated disease will also have been overestimated.
de Klerk et al3 based their mesothelioma predic-tions on a relation of the same form as used in thispaper with lag zero and the power was estimated as
801

Berry
3 35. This gave 692 mesotheliomas compared with624 in this paper. The predictions are reasonablyclose although the predicted proportion of meso-theliomas to total deaths (692/2898 = 24%) by deKlerk et al' is higher. The confidence interval of deKlerk et al' (394 to 990) was also similar to that in thispaper for a lag of zero (394 to 960), although asdiscussed earlier this interval is too wide because itignores information from other studies. The modelused by de Klerk et al' corresponds to the modelgiving the highest predictions and alternative formswere not considered.
de Klerk et al' predicted only 183 cases of lungcancer in 2898 deaths, a proportion of only 6-3%,compared with 434 out of3867 (11 2%). The currentrates of death indicate that in Australia as a whole8-4% of deaths in men in 1986 were due to lungcancer.20 Thus it is surprising that in a group with anincreased risk due to exposure to asbestos only 6-3%would be predicted to die of this cause. The eventualproportion of lung cancers may well be less than thatindicated on current figures because ofdeclining ratesof smoking in men. The difference between the twosets of predictions may be due to undetected deaths,but could also be due to a decline in excess risk afterabout 20 years since exposure, which would be takenaccount of by the method of de Klerk et al'; Walker2'concluded that excess risk declined after an intervalsince exposure ceased.For asbestosis de Klerk et al' predicted 482 more
cases compared with a maximum of260 in this paper.The two approaches were different and prediction ofthe number of cases of asbestosis is complicated bythe delays that occur between onset and diagnosis, forreasons unrelated to the natural history of thedisease, which place any attempt to fit a time depen-dent model to the observed time series at the mercy ofnon-random perturbations. Many, probably most, ofthose who may make a successful claim in the futurealready have asbestosis in an undiagnosed form.Such cases are developing the disease slowly as themine has been closed for over 20 years and, as shownin an earlier paper on the Wittenoom group,"9 the rateof progression of such cases after initial detection isalso likely to be slow. Therefore, although consider-able doubts accrue on the final number ofcases, it maybe stated more confidently that future claimants willbe less disabled than those who have already made asuccessful claim. About 25% of those with asbestosiseventually die of the disease, another 25% of meso-thelioma or lung cancer, and about 50% of unrelatedcauses.
Despite the differences in the predictions betweenthose of de Klerk et al3 and those of this paper, andeven using the lowest predicted number of meso-theliomas in this paper, the major continuing toll ofthe Wittenoom crocidolite mine will be deaths due tomesothelioma.
permission to have access to the data and toDr N H de Klerk for providing a copy of the data incomputer readable form on disc. The Western Aus-tralian death rates and some extra data on asbestosiswere also kindly supplied to me by Dr de Klerk. Thepaper is based on a report prepared for AustralianOccupational Health Management Pty Limited, andI am grateful to Dr David Douglas for his supportand encouragement. I am also grateful to Mr NeilDonnelly who carried out the computing of themortality analysis.
1 Hobbs MST, Woodward SD, Murphy B, Musk AW, Elder JE.The incidence of pneumoconiosis, mesothelioma and otherrespiratory cancer in men engaged in mining and millingcrocidolite in Western Australia. In: Wagner JC, ed. Biologicaleffects of mineral fibres. Lyon: International Agency forResearch on Cancer, 1980:615-25. (IARC Scientific publ No30.)
2 Armstrong BK, de Klerk NH, Musk AW, Hobbs MST.Mortality in miners and millers of crocidolite in WesternAustralia. Br J Ind Med 1988;45:5-13.
3 de Klerk NH, Armstrong BK, Musk AW, Hobbs MST.Predictions of future cases of asbestos-related disease amongformer miners and millers of crocidolite in Western Australia.Med J Aust 1989;151:616-20.
4 Rogers A. Cancer mortality and exposure to crocidolite (letter).Br J Ind Med 1990;47:286-8.
5 Doll R. The causes of death among gas-workers with specialreference to cancer of the lung. Br J Ind Med 1952;9:180-5.
6 Berry G. The analysis of mortality by the subject-years method.Biometrics 1983;39: 173-84.
7 Coleman M, Douglas A, Hermon C, Peto J. Cohort studyanalysis with a FORTRAN computer program. Int JEpidemiol 1986;15:134-7.
8 Walker AM, Loughlin JE, Friedlander ER, Rothman KJ,Dreyer NA. Projections of asbestos-related disease 1980-2009. J Occup Med 1983;25:409-25.
9 Cookson WOC, Musk AW, Glancy JJ, de Klerk NH, Yin R,Mele R, et al. Compensation, radiographic changes, andsurvival in applicants for asbestosis compensation. Br J IndMed 1985;42:461-8.
10 Peto J, Seidman H, Selikoff IJ. Mesothelioma mortality inasbestos workers: implications for models of carcinogenesisand risk assessment. Br J Cancer 1982;45:124-35.
11 Sullivan KR, Lam TH, Rossiter CE. HM naval bases: mesothe-lioma and time since first employment. Ann Occup Hyg1988;32(suppl):491-6.
12 Thomas DC. Models for exposure-time-response relationshipswith applications to cancer epidemiology. Ann Rev PublicHealth 1988;9:451-82.
13 Seidman H, Selikoff IJ, Gelb SK. Mortality experience ofamosite asbestos factory workers: dose-response relationships5 to 40 years after onset ofshort-term work exposure. AmJ IndMed 1986;10:479-514.
14 Newhouse ML, Berry G, Wagner JC. Mortality of factoryworkers in east London 1933-80. Br J IndMed 1985;42:4-1 1.
15 Newhouse ML, Berry G. Predictions of mortality from meso-thelial tumours in asbestos factory workers. Br J Ind Med1976;33: 147-5 1.
16 Nicholson WJ, Perkel G, Selikoff IJ. Occupational exposure toasbestos: population at risk and projected mortality-1980-2030. Am J Ind Med 1982;3:259-31 1.
17 Wagner JC, Berry G, Skidmore JW, Timbrell V. The effects ofthe inhalation ofasbestos in rats. BrJ Cancer 1974;29:252-69.
18 Berry G, Rogers AJ, Pooley FD. Mesotheliomas-asbestosexposure and lung burden. In: Bignon J, Peto J, Saracci R, eds.Non-occupational exposure to mineral fibres. Lyon: Inter-national Agency for Research on Cancer, 1989:486-96. (IARCsci publ No 90.)
19 Cookson W, de Klerk NH, Musk AW, Glancy JJ, Armstrong B,Hobbs M. The natural history of asbestosis in formercrocidolite workers of Wittenoom gorge. Am Rev Respir Dis1986;133:994-8.
20 Australian Bureau of Statistics. Causes of death Australia 1986.Canberra: ABS, 1988.
21 Walker AM. Declining relative risks for lung cancer aftercessation of asbestos exposure. J Occup Med 1984;26:422-6.
I am grateful to Professor M S T Hobbs for his Accepted 8 May 1991
802