
Molecular Characterization of the Cytotoxic Mechanism of Multiwall Carbon Nanotubes and Nano-Onions...
17
Molecular Characterization of the Cytotoxic Mechanism of Multiwall Carbon Nanotubes and Nano-Onions on Human Skin Fibroblast Lianghao Ding, ²,‡ Jackie Stilwell, ²,‡ Tingting Zhang, ²,‡,§ Omeed Elboudwarej, ² Huijian Jiang, ², | John P. Selegue, ⊥ Patrick A. Cooke, #,¶ Joe W. Gray, ², + and Fanqing Frank Chen* ,², + Lawrence Berkeley National Laboratory, Berkeley, California 94720, Department of Chemistry, UniVersity of Kentucky, Lexington, Kentucky 40506-0055, Affymetrix Inc., 3380 Central Expressway, Santa Clara, California 95051, and Department of Laboratory Medicine and the ComprehensiVe Cancer Center, UniVersity of California, San Francisco, California 94143 Received September 1, 2005; Revised Manuscript Received October 18, 2005 ABSTRACT The increasing use of nanotechnology in consumer products and medical applications underlies the importance of understanding its potential toxic effects to people and the environment. Although both fullerene and carbon nanotubes have been demonstrated to accumulate to cytotoxic levels within organs of various animal models and cell types and carbon nanomaterials have been exploited for cancer therapies, the molecular and cellular mechanisms for cytotoxicity of this class of nanomaterial are not yet fully apparent. To address this question, we have performed whole genome expression array analysis and high content image analysis based phenotypic measurements on human skin fibroblast cell populations exposed to multiwall carbon nano-onions (MWCNOs) and multiwall carbon nanotubes (MWCNTs). Here we demonstrate that exposing cells to MWCNOs and MWCNTs at cytotoxic doses induces cell cycle arrest and increases apoptosis/necrosis. Expression array analysis indicates that multiple cellular pathways are perturbed after exposure to these nanomaterials at these doses, with material-specific toxigenomic profiles observed. Moreover, there are also distinct qualitative and quantitative differences in gene expression profiles, with each material at different dosage levels (6 and 0.6 μg/mL for MWCNO and 0.6 and 0.06 μg/mL for MWCNT). MWCNO and MWCNT exposure activates genes involved in cellular transport, metabolism, cell cycle regulation, and stress response. MWCNTs induce genes indicative of a strong immune and inflammatory response within skin fibroblasts, while MWCNO changes are concentrated in genes induced in response to external stimuli. Promoter analysis of the microarray results demonstrate that interferon and p38/ERK-MAPK cascades are critical pathway components in the induced signal transduction contributing to the more adverse effects observed upon exposure to MWCNTs as compared to MWCNOs. Introduction. The emerging field of nanotechnology is part of a new industrial revolution being applied to a diverse array of consumer products and medical applications, ranging from cosmetics to electronics and to drug delivery vehicles. With this revolution, methods to reduce the potential toxic effects of nanoparticles both in the environment and for medical applications should be addressed (for review see Colvin 1 and Science Highlights 2-4 ). Defining any potential toxicity will aid the nanotechnology industry to minimize the environment- al impact of nanomaterials, leading to reduced concern from the public and policymakers and a more successful industry. Carbon nanomaterials, 5-7 including carbon nanoparticles and nanotubes, have been one of the most extensively used nanoparticles, because of their unique and superior properties, including large surface areas, high electrical conductivity, and excellent strength. Multiwall carbon nanotubes (MWCNTs) and multiwall carbon nano-onions (MWCNOs), which will be the focus of this study, represent a relatively recently discovered allotrope of carbon derived from the more intensively studied fullerene (C 60 ). 8,9 Single-walled, 10 double- walled, 11 and multiwalled 12 carbon nanotubes, with their diverse chemical and physical properties, have led them to * To whom correspondence should be addressed at: Life Sciences Division, Lawrence Berkley National Laboratory, MS 977R0225A, 1 Cyclotron Rd., Berkeley, CA 94720. Phone: (510) 495-2444. Fax: (510) 486-5586. E-mail: [email protected]. ² Lawrence Berkeley National Laboratory, Berkeley. ‡ L.D., J.S, and T.Z. contributed equally to the work. § Current address: Roche Palo Alto LLC., 3431 Hillview Ave., Palo Alto, CA 94304. | Current address: A&Z Pharmaceutical Inc., 180 Oser Ave., Hauppauge, NY 11788. ⊥ Department of Chemistry, University of Kentucky. # Affymetrix Inc. ¶ Current address: Department of Cell Biology and Genetics UNT Health Science Center, Fort Worth, TX 76107. + Department of Laboratory Medicine and the Comprehensive Cancer Center, University of California, San Francisco. NANO LETTERS 2005 Vol. 5, No. 12 2448-2464 10.1021/nl051748o CCC: $30.25 © 2005 American Chemical Society Published on Web 10/29/2005
Transcript of Molecular Characterization of the Cytotoxic Mechanism of Multiwall Carbon Nanotubes and Nano-Onions...

Molecular Characterization of theCytotoxic Mechanism of MultiwallCarbon Nanotubes and Nano-Onions onHuman Skin FibroblastLianghao Ding, †,‡ Jackie Stilwell, †,‡ Tingting Zhang, †,‡,§ Omeed Elboudwarej, †
Huijian Jiang, †,| John P. Selegue, ⊥ Patrick A. Cooke, #,¶ Joe W. Gray, †,+ andFanqing Frank Chen* ,†,+
Lawrence Berkeley National Laboratory, Berkeley, California 94720,Department of Chemistry, UniVersity of Kentucky, Lexington, Kentucky 40506-0055,Affymetrix Inc., 3380 Central Expressway, Santa Clara, California 95051, andDepartment of Laboratory Medicine and the ComprehensiVe Cancer Center,UniVersity of California, San Francisco, California 94143
Received September 1, 2005; Revised Manuscript Received October 18, 2005
ABSTRACTThe increasing use of nanotechnology in consumer products and medical applications underlies the importance of understanding its potentialtoxic effects to people and the environment. Although both fullerene and carbon nanotubes have been demonstrated to accumulate to cytotoxiclevels within organs of various animal models and cell types and carbon nanomaterials have been exploited for cancer therapies, the molecularand cellular mechanisms for cytotoxicity of this class of nanomaterial are not yet fully apparent. To address this question, we have performedwhole genome expression array analysis and high content image analysis based phenotypic measurements on human skin fibroblast cellpopulations exposed to multiwall carbon nano-onions (MWCNOs) and multiwall carbon nanotubes (MWCNTs). Here we demonstrate that exposingcells to MWCNOs and MWCNTs at cytotoxic doses induces cell cycle arrest and increases apoptosis/necrosis. Expression array analysisindicates that multiple cellular pathways are perturbed after exposure to these nanomaterials at these doses, with material-specific toxigenomicprofiles observed. Moreover, there are also distinct qualitative and quantitative differences in gene expression profiles, with each material atdifferent dosage levels (6 and 0.6 µg/mL for MWCNO and 0.6 and 0.06 µg/mL for MWCNT). MWCNO and MWCNT exposure activates genesinvolved in cellular transport, metabolism, cell cycle regulation, and stress response. MWCNTs induce genes indicative of a strong immuneand inflammatory response within skin fibroblasts, while MWCNO changes are concentrated in genes induced in response to external stimuli.Promoter analysis of the microarray results demonstrate that interferon and p38/ERK-MAPK cascades are critical pathway components in theinduced signal transduction contributing to the more adverse effects observed upon exposure to MWCNTs as compared to MWCNOs.
Introduction. The emerging field of nanotechnology is partof a new industrial revolution being applied to a diverse arrayof consumer products and medical applications, ranging fromcosmetics to electronics and to drug delivery vehicles. Withthis revolution, methods to reduce the potential toxic effects
of nanoparticles both in the environment and for medicalapplications should be addressed (for review see Colvin1 andScience Highlights2-4). Defining any potential toxicity willaid the nanotechnology industry to minimize the environment-al impact of nanomaterials, leading to reduced concern fromthe public and policymakers and a more successful industry.
Carbon nanomaterials,5-7 including carbon nanoparticlesand nanotubes, have been one of the most extensively usednanoparticles, because of their unique and superior properties,including large surface areas, high electrical conductivity, andexcellent strength. Multiwall carbon nanotubes (MWCNTs)and multiwall carbon nano-onions (MWCNOs), which willbe the focus of this study, represent a relatively recentlydiscovered allotrope of carbon derived from the moreintensively studied fullerene (C60).8,9 Single-walled,10 double-walled,11 and multiwalled12 carbon nanotubes, with theirdiverse chemical and physical properties, have led them to
* To whom correspondence should be addressed at: Life SciencesDivision, Lawrence Berkley National Laboratory, MS 977R0225A, 1Cyclotron Rd., Berkeley, CA 94720. Phone: (510) 495-2444. Fax: (510)486-5586. E-mail: [email protected].
† Lawrence Berkeley National Laboratory, Berkeley.‡ L.D., J.S, and T.Z. contributed equally to the work.§ Current address: Roche Palo Alto LLC., 3431 Hillview Ave., Palo
Alto, CA 94304.| Current address: A&Z Pharmaceutical Inc., 180 Oser Ave., Hauppauge,
NY 11788.⊥ Department of Chemistry, University of Kentucky.# Affymetrix Inc.¶ Current address: Department of Cell Biology and Genetics UNT Health
Science Center, Fort Worth, TX 76107.+ Department of Laboratory Medicine and the Comprehensive Cancer
Center, University of California, San Francisco.
NANOLETTERS
2005Vol. 5, No. 122448-2464
10.1021/nl051748o CCC: $30.25 © 2005 American Chemical SocietyPublished on Web 10/29/2005
be used in applications ranging from nanowires, electroniccomponents, catalyst supports, electronic displays, to drugdelivery, and may even be used for hydrogen storage.9,10,13-16
Giant, nested fullerenes, generally called nano-onions (MWC-NOs),17,18 comprise the least studied class of carbon nano-particles. MWCNOs are usually produced by an underwatercarbon-arc discharge.19-21 Our arc-produced MWCNOs aretypically about 30 nm in diameter.22 Although the applica-tions of MWCNOs have lagged behind those of MWCNTs,they have been used as components of nanocomposites forapplications including solar cells, light-emitting devices,23,24
and fuel-cell electrodes.25
The increase in commercial interest of nanomaterials andtheir subsequent production en masse will lead to greaterpotential for exposure to individuals. Fortunately, aerosolrelease of the MWCNOs and MWCNTs during manufactur-ing is limited.26 However, because of the increase use, therisk associated with exposure and the molecular mechanismsof any cytotoxicity need to be well understood. Some of theprimary questions that should be addressed include thefollowing: (i) what are likely routes and location of exposure,(ii) what are the molecular mechanisms of toxicity inducedby exposure, (iii) does observed toxicity correlate most tosize, shape, or composition, (iv) is there any concentration-dependent toxicity, and (v) are byproducts of production ordecomposition toxic. The scientific community is beginningto address these concerns, but information is scant. To date,most toxicity studies have been performed on ultrafineparticles, which, interestingly, are more toxic than equivalentmicrometer-sized material.27 Other studies, however, havedemonstrated that toxicity is more highly correlated withparticle composition and surface chemistry rather than size.28
Recently, single-walled carbon nanotubes (SWCNTs) havebeen demonstrated to be an effective infrared photosensitizerfor cancer cells,29 and a C2B10 carborane cage-coatedSWCNT has been constructed as the delivery vehicle forboron neutron capture therapy for cancer.30 Fullerene hasbeen suggested to be a promising carcinotoxic chemical.28,31
Therefore, we speculate that multiwalled carbon nanomate-rials such as MWCNO and MWCNT will be more effectivecancer killing agents than the SWCNT and single-walledfullerene. It is even more important for us to decipher thecytotoxicity and molecular mechanism of the multiwalledcarbon nanomaterials.
Early studies have indicated that a repeated subchronictopical dose of fullerenes on mouse skin for up to 24 weeks,after initiation with a polycyclic aromatic hydrocarbon, doesnot result in either benign or malignant skin tumors, incontrast to development of benign skin tumors when aphorbol ester control is used for promotion.32 More recentstudies have begun to indicate some adverse effects fromcarbon nanomaterial exposure. For example, water-solublefullerenes demonstrate cytotoxicity as a function of surfacederivatization28 and C60 derivative molecules also demon-strate superoxide dismutase mimetic properties in Jurkatcells.33,34 In addition, fullerenes induce oxidative stress inthe brains of juvenile largemouth bass,35 possibly throughfree radical generation. Oberdo¨rster has demonstrated that
inhaled nanosized carbon particles accumulate in the nasalcavities, lungs, and brains of rats. The suggested route ofmigration of these nanomaterials into the brain was fromlung to blood to brain where they were speculated toaccumulate and cause inflammation, brain damage, or centralnervous system disorders.35,36 It has also been reported thatthere is an increased susceptibility to blood clotting in rabbitsinhaling carbon nanospheres.27 Validation of this toxicitycomes from studies in vitro, using nanosized diesel exhaustparticles (DEP). DEP, which includes carbon nanoparticles,selectively damages dopaminergic neurons through thephagocytic activation of microglial NADPH oxidase andconsequential oxidative insult.37
Lam and co-workers have demonstrated that inhaledMWCNTs are more toxic than carbon black and quartz, thusposing a serious occupational health hazard for people whoare chronically exposed.38 Monteiro-Riviere and colleaguesreport that at all examined time points, chemically unmodi-fied MWCNTs were present within cytoplasmic vacuoles ofexposed kerotinocytes HEK.39 In addition, MWCNT exposedHEK cells released interleukin-8, a pro-inflammatory cy-tokine. This release was postulated to result in the skinirritation associated with exposure. In a separate study,epidermal keratinocytes exposed to MWCNTs demonstratedfree radical generation, accumulation of peroxidative prod-ucts, and antioxidant depletion, all indicators of oxidativestress.40 Observations of exposed cells also indicated mor-phological changes and reduced cell viability.40 These dataindicate that dermal exposure to unrefined SWCNTs maylead to dermal toxicity due to accelerated oxidative stress inthe exposed skin.40 SWCNT exposures by intratrachealinstallation in rats also produced transient inflammatory andcell injury. When rat lungs were exposed to SWCNTs, aseries of multifocal granulomas were induced, both nonuni-form in distribution and in a non-dose-dependent fashion,indicative of a foreign tissue body reaction.41
Evidence thus far suggests that the key factors contributingto nanomaterial-related cytotoxicity are size/mass, shape,surface charge, and surface functionalization. The cytotox-icity with equal mass basis shows an order of: SWNTs>MWNT10 > C60.42 Investigations with 2 nm gold nanopar-ticles in different cell types, tested by MTT, hemolysis, andbacterial viability assays, showed that surface charge was akey factor in inducing toxicity. This indicates that cationicnanoparticles are moderately toxic and have an immediatetoxic effect at the blood/brain barrier, whereas anionicparticles are relatively nontoxic.43,44Different surface coatingsalso have been shown to change the cytotoxicity profiles ofquantum dots (CdSe nanocrystals) dramatically, and modi-fications may attenuate the toxicity.45
As the exact molecular mechanisms for the damagesinflicted are still not fully understood, the above-mentionedanalyses have demonstrated the urgency of a more thoroughmolecular characterization of nanomaterial toxicity. Expres-sion array analysis and phenotypic measurements of exposedcell populations may provide insight into the mechanismsresponsible for adverse events observed in these models. Forexample, a recent preliminary unpublished investigation
Nano Lett., Vol. 5, No. 12, 2005 2449

demonstrated gene expression changes associated with thetoxicity of nanoscale materials46 and, thus, the potentialbenefit for using microarray technology to perform highthroughput characterization of nanomaterial toxigenomics.
In this study, the goal was to assess if changes in geneexpression in cells exposed to carbon-based nanomaterialsshows a correlation to phenotypic observations. Reportedhere are two approaches to evaluate toxicity in nanomaterialexposed cells: (i) the measurement of phenotypic changesin large populations of cells by high content analysis and(ii) gene expression array analysis in exposed cells. Pheno-typically, cells exposed to high concentrations of nanoma-terials were observed to undergo apoptosis/necrosis with aconcomitant reduction in proliferation indicative of aninflammation response. We found that carbon nanomaterialsgenerated mRNA level changes in exposed skin fibroblasts,including changes in mRNA levels from genes involved inmetabolism, apoptosis, cell cycle, stress response, cellulartransport, and inflammatory response. Of interest was ourobservation that many of the genes that increased inexpression in nanomaterial-exposed cells are often associatedwith a type I interferon response, which is known to beactivated during viral infection and lead to antiviral andantiproliferative responses. Promoter analysis, derived fromgene expression data, indicates that the primary mechanismfor cell effects from MWCNO and MWCNT treatment isthrough the p38/ERK MAPK kinase and interferon responsepathways. Of interest is the observation that MWCNTsappear to induce a greater amount of stress upon the cellsthan MWCNOs, even though the dosage is 1/10 by weight/volume concentration. This may have far reaching ramifica-tions for the deployment of specific types of nanomaterialsin the future. Clearly this study underscores the importanceof the potential toxic side effects in this burgeoning field.
Materials and Methods.Details for materials and meth-ods can be found in the Supporting Information. The carbonMWCNOs used in this study were produced by using amodified direct-current electric-arc discharge method19 (Fig-ure 1). The multiwalled carbon nanotubes (MWCNTs) weresynthesized by using a chemical vapor deposition (CVD)method47 (Figure 1). Cellomics-based high content imageanalysis (HCA) has been used for phenotypical measurementof cell apoptosis, necrosis, cell numbers, proliferation, andcell cycle distribution. Apoptotic cells and necrotic cells weredetected using DNA dyes that only traverse membranes ofnecrotic or apoptotic cells.48 The DNA stain, YO-PRO-1 cantransverse the slightly permeable membranes of apoptoticcells while propidium iodide requires the greater membranepermeability of necrotic cells. An Affymetrix high-through-put analysis (HTA) automated GeneChip system was usedfor acquisition of the microarray data for the gene expressionprofiling. Target preparation, washing, and staining have beenperformed on an Affymetrix/Caliper robotic system, andscanning was performed on a CCD-based Affymetrix highthroughput (HT) scanner, which is a fully automated epif-lourescent imaging system. More details for the HTAprotocols can be found in the Supporting Information. Dataanalysis has been performed using GeneSpring, Bioconduc-
tor, GeneTraffic, Cluster 3.0, PAINT, GoMiner, and Path-wayAssist, with more details in Supporting Information.
Results.In Vitro Toxicity.Human skin fibroblasts (HSF42)(Figures 2and 3) and human embryonic lung fibroblasts(IMR-90) (Supporting Information Figure S1), both untrans-formed cells, were used to evaluate the cytotoxic andproliferative effects of carbon nanomaterials. Lung and skincells were selected because entry through the skin or respir-atory tract is the most likely route of exposure to nanoma-terials. Cells were added to 96-well plates (BD Biosciences),grown to approximately 70% confluency in a CO2 incubator,and then exposed to several concentrations of MWCNOs andMWCNTs (Figure 1). To determine the cytotoxic dose tobe used for this study, cells were treated with serial dilutionsof MWCNO and MWCNT (data not shown), and we chosedoses of 0.6 and 6 mg/L for MWCNO and doses of 0.06and 0.6 mg/L for MWCNT, so that the cells show ap-proximately 2-fold increase in apoptosis/necrosis from theuntreated baseline cells and a∼50% reduction in proliferation(measured by end point cell numbers) after a treatment of48 h at the low dose. The 2-fold increase of apoptosis/necrosis from the baseline is an artificially defined point, anapproach previously used.49 The high doses are chosen as10 times that of the low dose, so that pronounced geneexpression changes can be observed to mimic the acuteexposure to carbon nanomaterials. Cells were exposed for24 or 48 h and counted, and various measurements weremade to evaluate cytotoxicity and proliferation. The MWCNTsseem to be 10 times more toxic than the MWCNOs, whichis the reason that the amount of MWCNTs used in our studiesis only one-tenth that of the amount of MWCNOs used, atboth the low dose and high dose levels.
Cell counts were obtained by staining live cells withHoechst 33342 (Sigma), 48 h post-treatment, and then usinghigh content imaging in the KineticScan (KSR, Cellomics,Pittsburgh, PA) to visualize the cells. Hoechst will stain DNAin both live and dead cells; however the intensity of stainingis higher in apoptotic cells because of the condensedchromosomes. The image analysis software, Cell HealthProfiling (Cellomics), was then used with the imagesobtained with the KSR to identify and count cells. The barsin the graphs in Figure 2A and Supporting Information FigureS1 show cell numbers. This graph demonstrates that treat-ment with either the MWCNOs or MWCNTs reduces cellnumber in a dose-dependent fashion, with the higherconcentrations of MWCNTs creating the greatest effect(Figure 2). This reduction in cell number could result fromapoptosis/necrosis and/or reduced proliferation.
Apoptosis and Necrosis.Cytotoxicity was evaluated bystaining live cells for 30 min with YO-PRO 1 (Invitrogen,Molecular Probes), propidium iodide (PI, Sigma), andHoechst. Live cells are impermeable to YO-PRO 1 and PI,both of which are intercalating DNA dyes. Apoptotic cellsare permeable to YO-PRO 1, while PI only stains necroticcells.48 Stained culture plates were analyzed using the KSRand images were acquired at each appropriate fluorescencechannel for Hoechst, YO-PRO 1, and PI. The image analysissoftware establishes average and total intensity for each
2450 Nano Lett., Vol. 5, No. 12, 2005
nucleus in all channels. In the experiments pictured in Figure2, wells were exposed to either the indicated concentrationof nanomaterials or the same volume of ethanol solvent asa control, both kept at less than 1% of the total volume. Tenreplicates were done for each condition with intensities forboth YO-PRO 1 and PI averaged by well, to obtain the barsin Figure 2B. Studentt-tests indicated that all treatmentgroups demonstrated significant differences from the controlgroup, withp < 0.01.
The following observations were made: (1) Apoptosis andnecrosis were observed for both MWCNO and MWCNTtreated cells with MWCNTs having the most detrimentaleffect on both types of cells at the highest concentration(Figure 2). (2) MWCNO treatment to lung fibroblasts,however, demonstrated less of an effect as compared totreatment of skin fibroblasts (Figure 2 and SupportingInformation Figure S1). (3) Skin fibroblasts treated with thehigher concentration of MWCNOs demonstrated a cell count
less than half of that observed in the control, more closelyreflecting the results obtained with MWCNT treatment(Figure 2). (4) The average intensity of YO-PRO 1 andpropidium iodide staining in the cell types treated with bothMWCNOs and MWCNTs went up in a dose-dependentmanner (Figure 2) with one exception. The exception isaverage YO-PRO 1 staining in MWCNO-treated skinfibroblasts, and it remains similar at both concentrations. ThePI staining, however, gains intensity at the higher concentra-tion of MWCNOs, indicating a greater number of necroticcells. These observations indicate the induction of apoptosisand necrosis in nanomaterial-treated cells that is dose andmaterial dependent. It cannot be ruled out that some of thereduction in cell number was a result of reduced proliferation,so this was also tested.
Cell Proliferation. Proliferation was measured in skinfibroblasts by incorporating BrdU for 30 min, fixing cells,staining for BrdU with an antibody, and then counterstaining
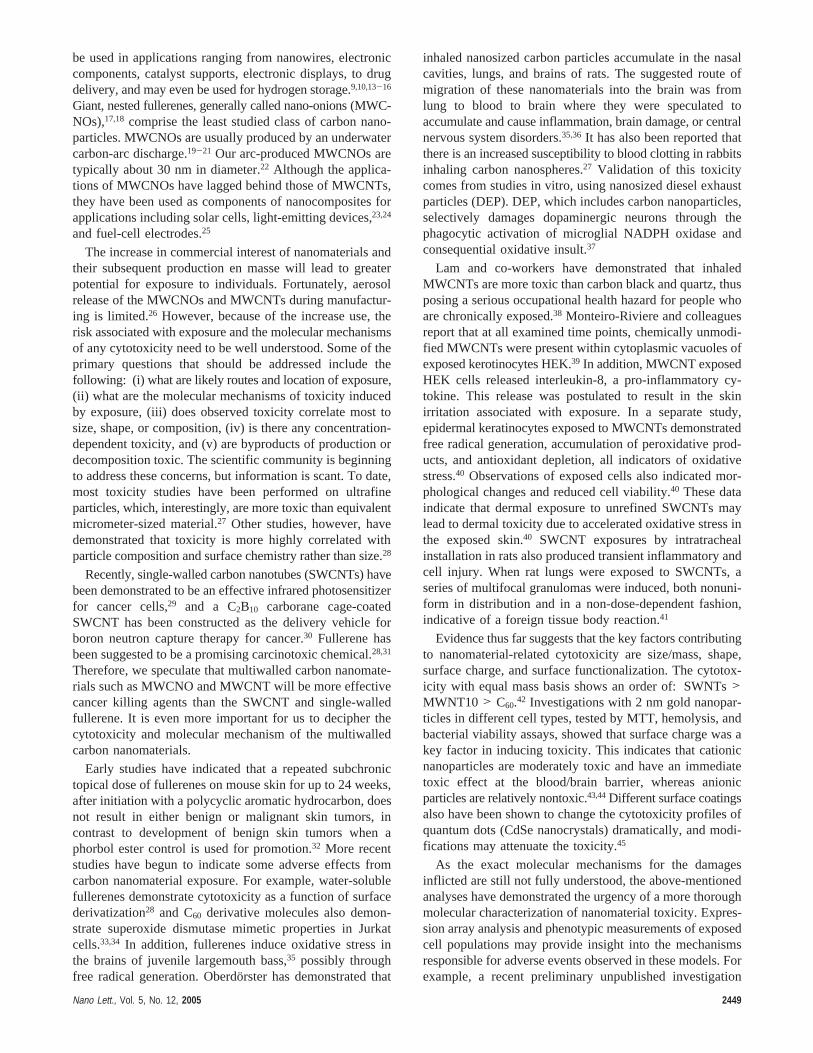
Figure 1. Scanning electron microscopy (SEM) images and high-resolution transmission electron microscopy (HRTEM) images of carbonnanomaterials used in this study. (A) SEM image of multiwalled carbon nanotubes (scale bar) 200 nm). (B) SEM image of carbonnano-onions (scale bar) 200 nm). (C) HRTEM images of multiwalled carbon nanotubes (MWCNTs) (scale bar) 5 nm). (D) HRTEMimages of multiwalled carbon nano-onions (MWCNO) (scale bar) 10 nm).
Nano Lett., Vol. 5, No. 12, 2005 2451

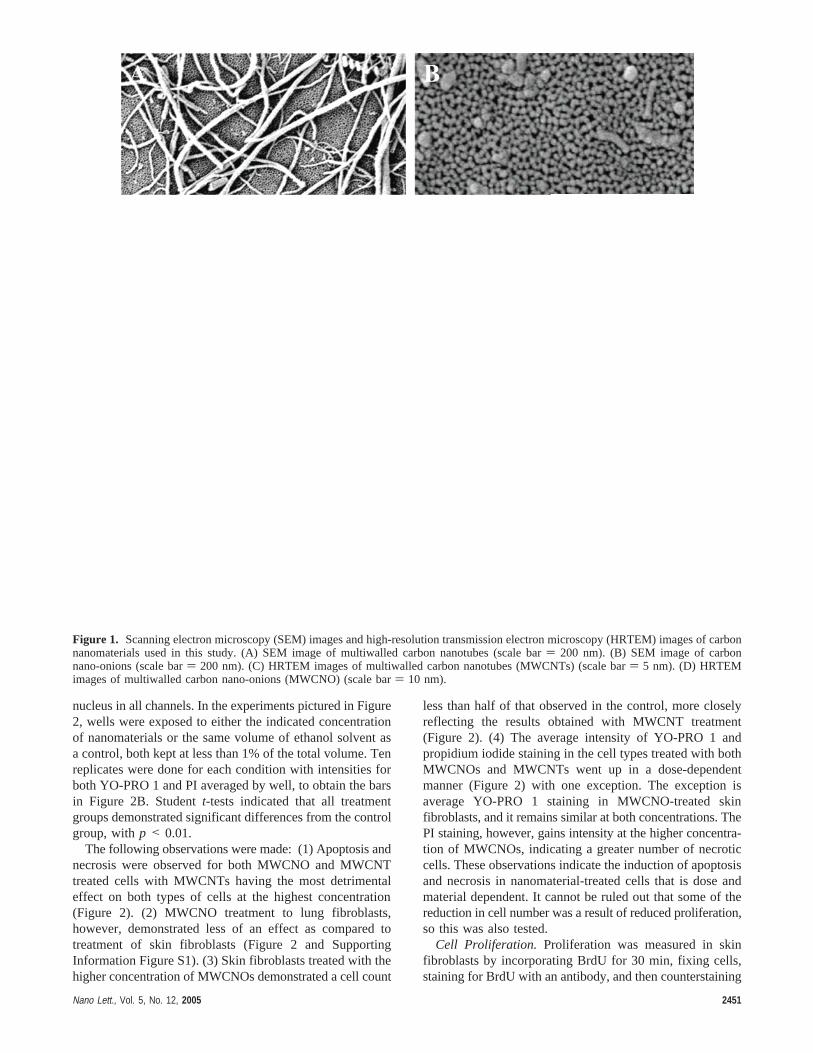
the DNA with PI.50 Figure 3A shows images from one field,generated by the KSR for image analysis, with PI stainingpictured in channel 1, BrdU antibody staining in channel 2,and the composite pictured in the middle. After images fromstained culture plates were obtained using the KSR, intensitymeasurements for both BrdU and DNA staining were madefor each identified cell to generate a scatter plot with theintensity of BrdU antibody staining on theY-axis and PI in-tensity on theX-axis. Analysis of these scatter plots allowedus to obtain percentages of cells in G0/G1, S, and G2/Mphases during cell cycle (Figure 3B). Data from these scatterplots are summarized in Figure 3C as a ratio of the percent-ages of cells in each phase of the cell cycle in treated cellsas compared to control cells. The ratio of treated to controlcells in G0/G1 is very close to 1.00, suggesting thatnanomaterial treatment does not induce a block in G1. Ratiosof cells in S-phase of treated to control were also similar,with a Studentt-test demonstrating borderline significance.The p-values for both nanomaterial treatments were bothslightly over 0.05. The largest difference in ratio, ap-proximately 1:1.2 for both treatments, was in G2/M (Figure3C), indicating a possible G2/M block and S phase delayduring cell cycle.
The results outlined above indicate that the reduction incell number is due to both apoptosis/necrosis and a possibleG2/M block. As measured by Studentt-test and percentagechange from control, apoptosis/necrosis appears to be a moresignificant mechanism for the reduced cell number afternanomaterial treatment. These results are consistent withother studies done with water-soluble fullerenes28,38,41,51andtoxicity studies using MWCNTs.40
Gene Expression.Treating human skin fibroblast withcarbon nanomaterials induced profound gene expression
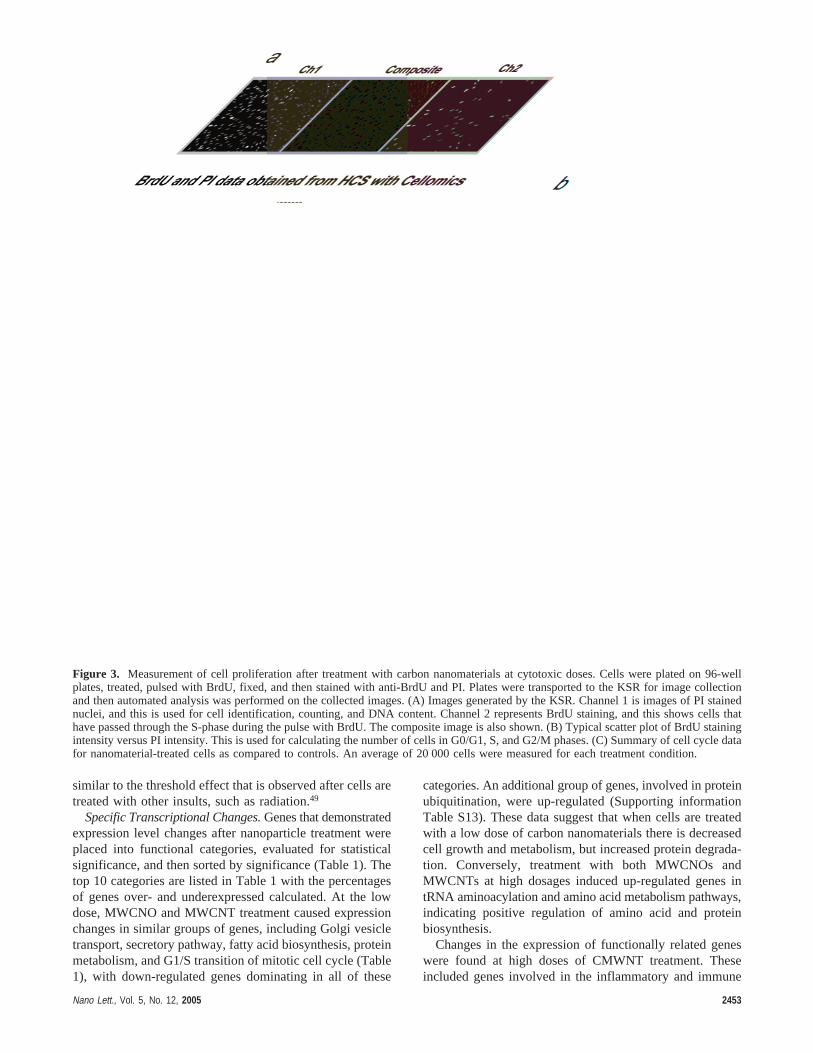
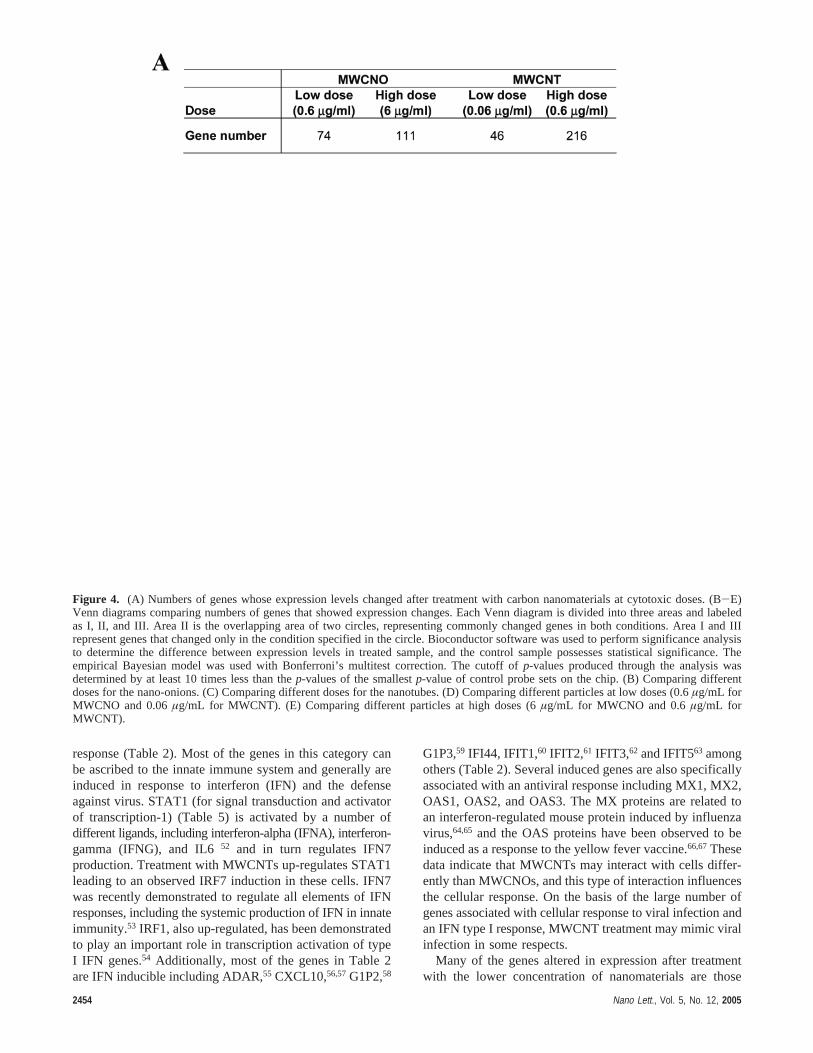
changes. Gene expression profiling was performed with thenew generation Affymetrix HTA GeneChip system. Figure4A lists numbers of genes whose expression levels changedafter treatment with different particles and doses. Wecompared gene expression changes using different doses ofthe same particle structure (Figure 4B,C). These data indicatethat, although higher doses induced a greater number of genesexpression changes than low doses, there are no global dose-dependent responses to both particles. This is demonstratedby the small portion of genes that were changed commonlyat both low and high doses (Figure 4B,C, SupportingInformation Tables S2 and S5). The data indicated thatdistinct pathways were activated in cells treated with lowdose or high dose nanomaterials. This is a phenomenonreported before for other cellular stress factors; we haveobserved similar qualitative differences between carefullychosen low and high doses of radiation.49
We also compared genes that demonstrate altered expres-sion after treatment with different types of carbon nanoma-terials (Figure 4D,E). The number of genes in the area ofintersection in the Venn diagram in parts D and E of Figure4 indicates a large percentage of genes show a commonexpression changes after treatment with both types ofparticles (Supporting Inormation Tables S8 and S11).However, unique genes were also induced in response toMWCNO or MWCNT and more genes demonstrated changesin levels of expression at the lower concentration ofMWCNOs than that with lower concentration MWCNTtreatment (Figure 4). Interestingly, it is the dosage of carbonnanomaterials that appears to have the greatest influence ongene expression changes in common between MWCNOs andMWCNTs, not the specific nanomaterial. This could be
Figure 2. Cell viability measurements after treatment with carbon nanomaterials at cytotoxic doses. Cells were plated on 96-well plates,treated for 48 h, and then stained with Hoechst (nucleus stain for cell number indicator), YO-PRO 1 (apoptosis indicator) and PI (necrosisindicator). Plates were transported to KineticScan (KSR, Cellomics, Pittsburgh, PA) for image collection, then automated analysis wasperformed on the collected images. (A) The number of skin fibroblast cells per well 48 h after mock treatment with ethanol or treatmentwith either MWCNOs (NO) or nanotubes (NT). The numbers of low doses (0.6µg/mL for MWCNO and 0.06µg/mL for MWCNT) andhigh doses (6µg/mL for MWCNO and 0.6µg/mL for MWCNT) represent the nanomaterial concentration used for treatment. Bars representthe mean of cell numbers from 10 imaged viewfields in 10 treated wells, and error bars represent a 95% confidence interval. Each nucleiimaged by the KSR was identified with the Cell Health Profiling software in the blue channel by Hoechst staining. (B) YO-PRO 1 isvisualized in the green channel and PI is visualized in the red channel, where measurement such as dye intensity and area can be madeusing the Cell Health Profiling algorithm. Average intensity of YO-PRO 1 intensity and PI intensity of mock treated and treated skinfibroblasts at 48 h. The YO-PRO 1 intensity is proportional to apoptosis and the PI intensity correlates to necrosis. Bars represent the meanof cell numbers from eight treated wells and the error bars represent a 95% confidence interval. Data for lung fibroblast treated under thesame condition are presented in Supporting Information Figure S1.
2452 Nano Lett., Vol. 5, No. 12, 2005
similar to the threshold effect that is observed after cells aretreated with other insults, such as radiation.49
Specific Transcriptional Changes.Genes that demonstratedexpression level changes after nanoparticle treatment wereplaced into functional categories, evaluated for statisticalsignificance, and then sorted by significance (Table 1). Thetop 10 categories are listed in Table 1 with the percentagesof genes over- and underexpressed calculated. At the lowdose, MWCNO and MWCNT treatment caused expressionchanges in similar groups of genes, including Golgi vesicletransport, secretory pathway, fatty acid biosynthesis, proteinmetabolism, and G1/S transition of mitotic cell cycle (Table1), with down-regulated genes dominating in all of these
categories. An additional group of genes, involved in proteinubiquitination, were up-regulated (Supporting informationTable S13). These data suggest that when cells are treatedwith a low dose of carbon nanomaterials there is decreasedcell growth and metabolism, but increased protein degrada-tion. Conversely, treatment with both MWCNOs andMWCNTs at high dosages induced up-regulated genes intRNA aminoacylation and amino acid metabolism pathways,indicating positive regulation of amino acid and proteinbiosynthesis.
Changes in the expression of functionally related geneswere found at high doses of CMWNT treatment. Theseincluded genes involved in the inflammatory and immune
Figure 3. Measurement of cell proliferation after treatment with carbon nanomaterials at cytotoxic doses. Cells were plated on 96-wellplates, treated, pulsed with BrdU, fixed, and then stained with anti-BrdU and PI. Plates were transported to the KSR for image collectionand then automated analysis was performed on the collected images. (A) Images generated by the KSR. Channel 1 is images of PI stainednuclei, and this is used for cell identification, counting, and DNA content. Channel 2 represents BrdU staining, and this shows cells thathave passed through the S-phase during the pulse with BrdU. The composite image is also shown. (B) Typical scatter plot of BrdU stainingintensity versus PI intensity. This is used for calculating the number of cells in G0/G1, S, and G2/M phases. (C) Summary of cell cycle datafor nanomaterial-treated cells as compared to controls. An average of 20 000 cells were measured for each treatment condition.
Nano Lett., Vol. 5, No. 12, 2005 2453
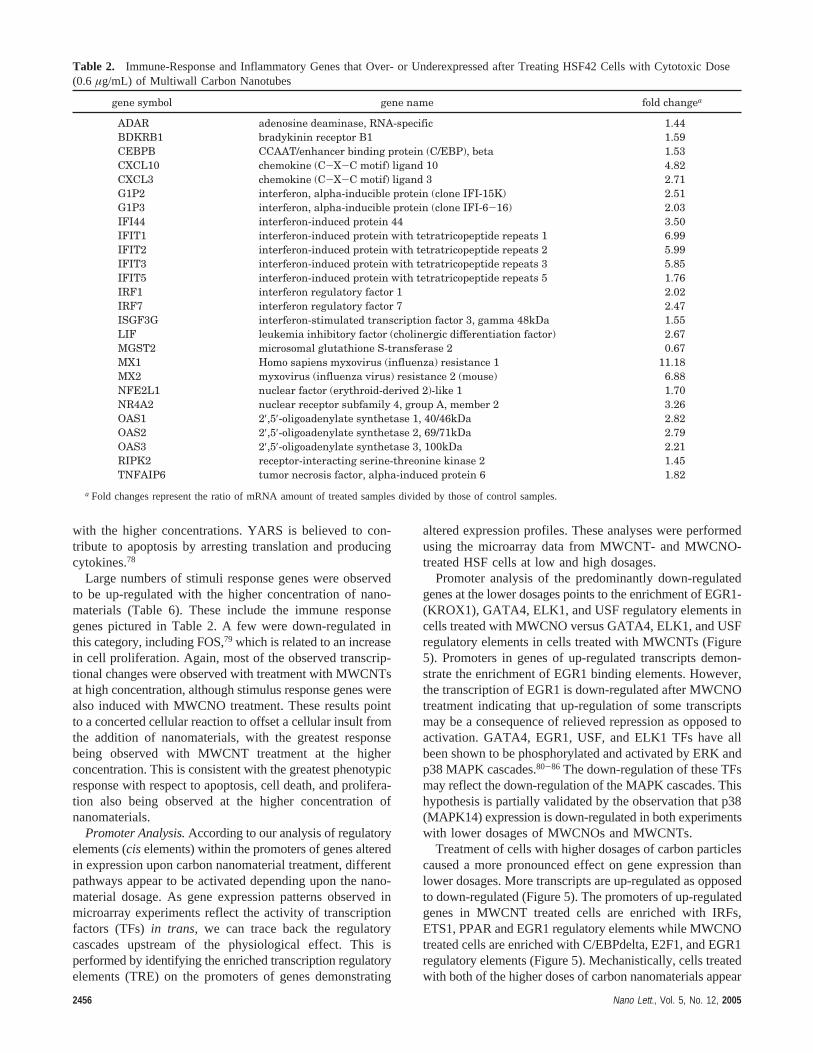
response (Table 2). Most of the genes in this category canbe ascribed to the innate immune system and generally areinduced in response to interferon (IFN) and the defenseagainst virus. STAT1 (for signal transduction and activatorof transcription-1) (Table 5) is activated by a number ofdifferent ligands, including interferon-alpha (IFNA), interferon-gamma (IFNG), and IL652 and in turn regulates IFN7production. Treatment with MWCNTs up-regulates STAT1leading to an observed IRF7 induction in these cells. IFN7was recently demonstrated to regulate all elements of IFNresponses, including the systemic production of IFN in innateimmunity.53 IRF1, also up-regulated, has been demonstratedto play an important role in transcription activation of typeI IFN genes.54 Additionally, most of the genes in Table 2are IFN inducible including ADAR,55 CXCL10,56,57G1P2,58
G1P3,59 IFI44, IFIT1,60 IFIT2,61 IFIT3,62 and IFIT563 amongothers (Table 2). Several induced genes are also specificallyassociated with an antiviral response including MX1, MX2,OAS1, OAS2, and OAS3. The MX proteins are related toan interferon-regulated mouse protein induced by influenzavirus,64,65 and the OAS proteins have been observed to beinduced as a response to the yellow fever vaccine.66,67Thesedata indicate that MWCNTs may interact with cells differ-ently than MWCNOs, and this type of interaction influencesthe cellular response. On the basis of the large number ofgenes associated with cellular response to viral infection andan IFN type I response, MWCNT treatment may mimic viralinfection in some respects.
Many of the genes altered in expression after treatmentwith the lower concentration of nanomaterials are those
Figure 4. (A) Numbers of genes whose expression levels changed after treatment with carbon nanomaterials at cytotoxic doses. (B-E)Venn diagrams comparing numbers of genes that showed expression changes. Each Venn diagram is divided into three areas and labeledas I, II, and III. Area II is the overlapping area of two circles, representing commonly changed genes in both conditions. Area I and IIIrepresent genes that changed only in the condition specified in the circle. Bioconductor software was used to perform significance analysisto determine the difference between expression levels in treated sample, and the control sample possesses statistical significance. Theempirical Bayesian model was used with Bonferroni’s multitest correction. The cutoff ofp-values produced through the analysis wasdetermined by at least 10 times less than thep-values of the smallestp-value of control probe sets on the chip. (B) Comparing differentdoses for the nano-onions. (C) Comparing different doses for the nanotubes. (D) Comparing different particles at low doses (0.6µg/mL forMWCNO and 0.06µg/mL for MWCNT). (E) Comparing different particles at high doses (6µg/mL for MWCNO and 0.6µg/mL forMWCNT).
2454 Nano Lett., Vol. 5, No. 12, 2005

involved in transport, membrane fusion, and secretion (Table3). These genes did not show discernible changes in expres-sion with higher concentrations of MWCNOs and MWCNTs.Many of the genes in this category, SNAP23, NAPG, NAPAand GBF1, are involved in the process of docking and fusionof vesicles to their target membranes.68-71 Most of the genesin this category are underexpressed indicating that the cellsmay be slowing secretion of proteins. Treatment of cells withthe lower concentrations of nanomaterials also has an impacton the expression of cell cycle genes (Table 4) and genes in-volved in ubiquitination (Supporting information Table S13).Again, many of these genes are down-regulated, indicat-ing a slowing of cell proliferation and protein degradation.
Table 5 lists genes involved in apoptosis that were inducedor repressed with nanomaterial treatment. A greater number
of genes involved in apoptosis were observed to be up-regulated with MWCNT treatment at the higher dose,possibly explaining the greater number of apoptotic and deadcells observed with high content screening (Figure 2). Ofinterest was the up-regulation of the cytokine and TNF familymember, TNFRSF10B (TRAILR2) in cells treated with thehighest concentration of MWCNTs, which is known toinduce apoptosis.72 Also, the RIPK273 gene contributes tothe induction of apoptosis and was observed to be up-regulated in these treated cells. At lower doses, many of thegenes related to apoptosis listed in Table 5 are down-regulated and are anti-apoptotic; examples include EGFR,74
MCL1,75 BCL2L1,76 and CRKL.77 Up-regulation of YARSwas observed with both nanomaterial treatments, especially
Table 1. Most Significantly Changed Gene Categories after Treating HSF42 Cells with Carbon Nanomaterials at Cytotoxic Dosesa
gene category p-value%
underexpressed%
overexpressed
carbon nano-onion Golgi vesicle transport 0.0000 8.51 2.130.6 µg/mL membrane fusion 0.0002 15.79 0.00
secretory pathway 0.0003 4.35 1.09protein ubiquitination 0.0139 0.68 2.05intracellular transport 0.0166 1.23 0.62cell growth and/or maintenance 0.0201 0.66 0.27fatty acid biosynthesis 0.0208 5.71 0.00protein metabolism 0.0323 0.71 0.29ubiquitin cycle 0.0342 0.70 1.06G1/S transition of mitotic cell cycle 0.0361 4.26 0.00
carbon nanotube Golgi vesicle transport 0.0007 4.26 2.130.06 µg/mL protein metabolism 0.0020 0.65 0.18
secretory pathway 0.0049 2.17 1.09fatty acid biosynthesis 0.0076 5.71 0.00G1/S transition of mitotic cell cycle 0.0135 4.26 0.00protein ubiquitination 0.0174 0.68 1.37mitotic cell cycle 0.0200 1.95 0.00ubiquitin cycle 0.0214 0.70 0.70cell homeostasis 0.0228 3.23 0.00protein prenylation 0.0262 14.29 0.00
carbon nano-onion L-serine metabolism 0.0000 0.00 40.006 µg/mL tRNA aminoacylation 0.0000 0.00 23.81
amine metabolism 0.0000 0.00 5.42amine transport 0.0000 0.00 12.20dicarboxylic acid transport 0.0020 0.00 25.00response to extracellular stimulus 0.0063 0.00 14.29heterocycle metabolism 0.0076 0.00 6.38porphyrin metabolism 0.0139 0.00 9.52TGF beta receptor signaling pathway 0.0139 4.76 4.76pigment metabolism 0.0194 0.00 8.00
carbon nanotube tRNA aminoacylation 0.0000 0.00 33.330.6 µg/mL L-serine metabolism 0.0000 0.00 50.00
amine metabolism 0.0000 0.00 6.90amine transport 0.0000 0.00 14.63response to stimulus 0.0000 0.16 2.86immune response 0.0000 0.18 4.50water-soluble vitamin biosynthesis 0.0024 0.00 40.00inflammatory response 0.0034 0.00 5.06heterocycle metabolism 0.0062 2.13 6.38dicarboxylic acid transport 0.0065 0.00 25.00
a The categories are generated by the GoMiner program (Materials and Methods, Supporting Information), usingp-values as the evaluation criteria ofstatistically significant changes. for each category. Thep-value was calculated by conducting a two-sided Fisher’s exact test, which reflects the statisticalsignificance for that category being enriched in changed genes. Thep-values were used to sort categories to identify those gene functional groups that haveresponded the most after treatments.
Nano Lett., Vol. 5, No. 12, 2005 2455
with the higher concentrations. YARS is believed to con-tribute to apoptosis by arresting translation and producingcytokines.78
Large numbers of stimuli response genes were observedto be up-regulated with the higher concentration of nano-materials (Table 6). These include the immune responsegenes pictured in Table 2. A few were down-regulated inthis category, including FOS,79 which is related to an increasein cell proliferation. Again, most of the observed transcrip-tional changes were observed with treatment with MWCNTsat high concentration, although stimulus response genes werealso induced with MWCNO treatment. These results pointto a concerted cellular reaction to offset a cellular insult fromthe addition of nanomaterials, with the greatest responsebeing observed with MWCNT treatment at the higherconcentration. This is consistent with the greatest phenotypicresponse with respect to apoptosis, cell death, and prolifera-tion also being observed at the higher concentration ofnanomaterials.
Promoter Analysis.According to our analysis of regulatoryelements (ciselements) within the promoters of genes alteredin expression upon carbon nanomaterial treatment, differentpathways appear to be activated depending upon the nano-material dosage. As gene expression patterns observed inmicroarray experiments reflect the activity of transcriptionfactors (TFs)in trans, we can trace back the regulatorycascades upstream of the physiological effect. This isperformed by identifying the enriched transcription regulatoryelements (TRE) on the promoters of genes demonstrating
altered expression profiles. These analyses were performedusing the microarray data from MWCNT- and MWCNO-treated HSF cells at low and high dosages.
Promoter analysis of the predominantly down-regulatedgenes at the lower dosages points to the enrichment of EGR1-(KROX1), GATA4, ELK1, and USF regulatory elements incells treated with MWCNO versus GATA4, ELK1, and USFregulatory elements in cells treated with MWCNTs (Figure5). Promoters in genes of up-regulated transcripts demon-strate the enrichment of EGR1 binding elements. However,the transcription of EGR1 is down-regulated after MWCNOtreatment indicating that up-regulation of some transcriptsmay be a consequence of relieved repression as opposed toactivation. GATA4, EGR1, USF, and ELK1 TFs have allbeen shown to be phosphorylated and activated by ERK andp38 MAPK cascades.80-86 The down-regulation of these TFsmay reflect the down-regulation of the MAPK cascades. Thishypothesis is partially validated by the observation that p38(MAPK14) expression is down-regulated in both experimentswith lower dosages of MWCNOs and MWCNTs.
Treatment of cells with higher dosages of carbon particlescaused a more pronounced effect on gene expression thanlower dosages. More transcripts are up-regulated as opposedto down-regulated (Figure 5). The promoters of up-regulatedgenes in MWCNT treated cells are enriched with IRFs,ETS1, PPAR and EGR1 regulatory elements while MWCNOtreated cells are enriched with C/EBPdelta, E2F1, and EGR1regulatory elements (Figure 5). Mechanistically, cells treatedwith both of the higher doses of carbon nanomaterials appear
Table 2. Immune-Response and Inflammatory Genes that Over- or Underexpressed after Treating HSF42 Cells with Cytotoxic Dose(0.6 µg/mL) of Multiwall Carbon Nanotubes
gene symbol gene name fold changea
ADAR adenosine deaminase, RNA-specific 1.44BDKRB1 bradykinin receptor B1 1.59CEBPB CCAAT/enhancer binding protein (C/EBP), beta 1.53CXCL10 chemokine (C-X-C motif) ligand 10 4.82CXCL3 chemokine (C-X-C motif) ligand 3 2.71G1P2 interferon, alpha-inducible protein (clone IFI-15K) 2.51G1P3 interferon, alpha-inducible protein (clone IFI-6-16) 2.03IFI44 interferon-induced protein 44 3.50IFIT1 interferon-induced protein with tetratricopeptide repeats 1 6.99IFIT2 interferon-induced protein with tetratricopeptide repeats 2 5.99IFIT3 interferon-induced protein with tetratricopeptide repeats 3 5.85IFIT5 interferon-induced protein with tetratricopeptide repeats 5 1.76IRF1 interferon regulatory factor 1 2.02IRF7 interferon regulatory factor 7 2.47ISGF3G interferon-stimulated transcription factor 3, gamma 48kDa 1.55LIF leukemia inhibitory factor (cholinergic differentiation factor) 2.67MGST2 microsomal glutathione S-transferase 2 0.67MX1 Homo sapiens myxovirus (influenza) resistance 1 11.18MX2 myxovirus (influenza virus) resistance 2 (mouse) 6.88NFE2L1 nuclear factor (erythroid-derived 2)-like 1 1.70NR4A2 nuclear receptor subfamily 4, group A, member 2 3.26OAS1 2′,5′-oligoadenylate synthetase 1, 40/46kDa 2.82OAS2 2′,5′-oligoadenylate synthetase 2, 69/71kDa 2.79OAS3 2′,5′-oligoadenylate synthetase 3, 100kDa 2.21RIPK2 receptor-interacting serine-threonine kinase 2 1.45TNFAIP6 tumor necrosis factor, alpha-induced protein 6 1.82
a Fold changes represent the ratio of mRNA amount of treated samples divided by those of control samples.
2456 Nano Lett., Vol. 5, No. 12, 2005

to trigger responses from the activated p38 and ERK MAPKcascades, based on transcription factor profiling. In fact,CCAAT enhancer binding protein delta (C/EBPdelta), en-riched in MWCNO-treated cells, is a target of p38 MAPK87
and is associated with growth arrest in epithelial cells.88
However, the expression pattern of higher dose MWCNTtreatment differs significantly from that of MWCNO treat-ment. For example, a robust IFN response is observed inMWCNT-treated cells, but not in MWCNO-treated cells. Thepresence of IRF elements contained within the promoters ofmany of the up-regulated genes may explain this response.In fact, IRF7 is one of the up-regulated genes observed (Table2) and is believed to be central to an IFN response53 alongwith STAT1 (Table 5), another up-regulated gene discussedabove, and one of the central signal transduction factorsneeded for an IFN response. Transcriptional regulatory
elements present in the down-regulated genes of cells treatedwith MWCNOs, such as GATA1, may also contribute tothe differences in gene transcription observed (Figure 5). FOSgene expression is also reduced, leading to a lowered activityof AP1 (FOS/JUN) transcription factors (Table 6). Thesedifferences may be responsible for the difference in themagnitude of response between these particles, observedphenotypically by high content analysis. Additional experi-ments monitoring the kinase activities should give us betterunderstanding the underlying mechanism.
Discussion.The results presented here show for the firsttime both a phenotypic response of cells to carbon nanoma-terials (apoptosis, necrosis, cell cycle perturbation, andantiproliferation) and a global gene expression response ata cellular level. Phenotypic effects were confirmed for twodifferent fibroblast cell types, human skin fibroblast (HSF,
Table 3. Genes Changed by Nano-Onion and Nanotube but Fall in the Category of “Transport” (Golgi Vesicle Transport, MembraneFusion, Secretory Pathway, Intracellular Transport)a
gene categorygene
symbol gene namefold change
of gene expression
Fold Change of Gene Expression for Onion, 0.6 µg/mLGolgi vesicle transport COPA coatomer protein complex, subunit alpha 0.57
SNAP23 synaptosomal-associated protein 0.30GBF1 golgi-specific brefeldin A resistance factor 1 2.45NAPG N-ethylmaleimide-sensitive factor attachment protein, gamma 0.48NAPA N-ethylmaleimide sensitive fusion protein attachment protein alpha 0.60
membrane fusion NAPA N-ethylmaleimide sensitive fusion protein attachment protein alpha 0.60NAPG N-ethylmaleimide-sensitive factor attachment protein, gamma 0.48SNAP23 synaptosomal-associated protein 0.30
secretory pathway NAPA N-ethylmaleimide sensitive fusion protein attachment protein alpha 0.60COPA coatomer protein complex, subunit alpha 0.57GBF1 golgi-specific brefeldin A resistance factor 1 2.45NAPG N-ethylmaleimide-sensitive factor attachment protein, gamma 0.48SCD stearoyl-CoA desaturase 0.19SNAP23 synaptosomal-associated protein 0.30
intracellular transport GBF1 golgi-specific brefeldin A resistance factor 1 2.45DST dystonin 0.40NAB2 NGFI-A binding protein 2 0.43SNAP23 synaptosomal-associated protein 0.30KDELR3 KDEL (Lys-Asp-Glu-Leu) endoplasmic reticulum protein retention
receptor 30.76
NAPG N-ethylmaleimide-sensitive factor attachment protein, gamma 0.48COPA coatomer protein complex, subunit alpha 0.57HNRPA1 heterogeneous nuclear ribonucleoprotein A 1 2.49NAPA N-ethylmaleimide sensitive fusion protein attachment protein alpha 0.60
nucleocytoplasmic NAB2 NGFI-A binding protein 2 0.43transport HNRPA1 heterogeneous nuclear ribonucleoprotein A 1 2.49
Fold Change of Gene Expression for Tube, 0.06 µg/mLGolgi vesicle transport COPA coatomer protein complex, subunit alpha 0.57
NAPA N-ethylmaleimide sensitive fusion protein attachment protein alpha 0.60GBF1 Golgi-specific brefeldin A resistance factor 1 2.45
membrane fusion NAPA N-ethylmaleimide sensitive fusion protein attachment protein alpha 0.60secretory pathway COPA coatomer protein complex, subunit alpha 0.57
NAPA N-ethylmaleimide sensitive fusion protein attachment protein alpha 0.60SCD stearoyl-CoA desaturase 0.19GBF1 Golgi-specific brefeldin A resistance factor 1 2.45
intracellular transport GBF1 Golgi-specific brefeldin A resistance factor 1 2.45NAPA N-ethylmaleimide sensitive fusion protein attachment protein alpha 0.60COPA coatomer protein complex, subunit alpha 0.57
a Fold change of gene expression is given for the low dose (0.6µg/mL for MWCNO and 0.06µg/mL for MWCNT). Fold changes represent the ratio ofMRNA amount of treated samples divided by those of control samples.
Nano Lett., Vol. 5, No. 12, 2005 2457

see figures and tables in text) and IMR-90 (SupportingInformation Figure S1). This information will be importantfor elucidating possible mechanisms responsible for thetoxicity observed after exposure to these particles. Importantto the validation of this experimental approach was todetermine if the microarray results were consistent with ourphenotypic observations of exposed cells by high contentanalysis (HCA). The phenotypic responses of apoptosis, celldeath, and proliferation changes were predicted by changesin expression levels of many of the genes we observed.
HCA of cells treated with MWCNOs and MWCNTsshowed significant changes in cell number that, upon furtherinvestigation, was shown to be due to apoptosis, cell death,and proliferation changes. Therefore nanomaterials do dem-onstrate toxicity, especially at higher concentrations. MWCNTsappear to be more toxic to cells than MWCNOs asdemonstrated by the greater number of cells undergoingapoptosis or necrosis after treatment, even at one-tenth theamount of the carbon nano-onions. This response, at leastwith the MWCNT treatment may be due to a type I INF
response, which has been shown to lead to apoptosis andcell death. This type of response also leads to changes incell proliferation, which were also observed. The phenotypicresponse is dose-dependent, even though the molecularmechanisms causing the phenotypic changes may be differentdepending on the dose or particle type. The magnitude ofthe response could be a reflection of differential pathwayactivation (Figure 6). One limitation of this study is that ithas been performed on cells and not on whole organisms. Aliving system may have several lines of defense to preventor minimize some of the toxic effects of exposure to smallparticles. However, because toxicity has been indicated fromthis analysis, workers that come in contact with largeamounts of nanomaterials should protect their skin and lungsfrom potential exposure.
Gene expression changes in human skin fibroblasts serveas readout for cellular responses to the stimulus of carbonnanomaterials. By applying significance analysis with veryconservative Bonferroni multitesting correction, we found aprofound number of genes with statistically significant
Table 4. Genes Changed by Nano-Onion and Carbon Nanotubes but Fall in the Category of Cell Cycle Regulatory Genes (G1/STransition of Mitotic Cell Cycle, Mitotic Cell Cycle, and Cell Growth of Maintenance)a
gene categorygene
symbol gene namefold change
of gene expression
Fold Change of Gene Expression for Nano-Onioncell proliferation EXTL3 exostoses (multiple)-like 3 0.44
FGFR1 fibroblast growth factor receptor 1 (fms-related tyrosine kinase 2,Pfeiffer syndrome)
1.72
NAB2 NGFI-A binding protein 2 (EGR1 binding protein 2) 0.43cell cycle DUSP1 dual specificity phosphatase 1 0.17
TRIM33 tripartite motif-containing 33 1.60HSF1 heat shock transcription factor 1 0.52BCAT1 branched chain aminotransferase 1, cytosolic 0.17
regulation of cell cycle SKP2 S-phase kinase-associated protein 2 (p45) 0.21MCL1 myeloid cell leukemia sequence 1 (BCL2-related) 0.19EGFR epidermal growth factor receptor (erythroblastic leukemia viral
(v-erb-b) oncogene homolog, avian)0.24
MAPK14 mitogen-activated protein kinase 14 0.25CRKL v-crk sarcoma virus CT10 oncogene homologue (avian)-like 0.20
cell cycle arrest MACF1 microtubule-actin cross-linking factor 1 1.81DST dystonin 0.40
cell differentiation PDLIM7 PDZ and LIM domain 7 (enigma) 0.60BSG basigin (OK blood group) 0.44NAPA N-ethylmaleimide sensitive fusion protein attachment protein alpha 0.60EGR1 early growth response 1 0.39
Fold Change of Gene Expression for Nanotubecell proliferation FGFR1 fibroblast growth factor receptor 1 (fms-related tyrosine kinase 2,
Pfeiffer syndrome)1.72
cell cycle DUSP1 dual specificity phosphatase 1 0.23BCAT1 branched chain aminotransferase 1, cytosolic 0.24CDK2 cyclin-dependent kinase 2 0.58
regulation of cell cycle SKP2 S-phase kinase-associated protein 2 (p45) 0.18MCL1 myeloid cell leukemia sequence 1 (BCL2-related) 0.18MAPK14 mitogen-activated protein kinase 14 0.30CRK v-crk sarcoma virus CT10 oncogene homologue (avian) 0.53SLC12A4 solute carrier family 12 (potassium/chloride transporters), member 4 0.23
cell differentiation PDLIM7 PDZ and LIM domain 7 (enigma) 0.62NAPA N-ethylmaleimide sensitive fusion protein attachment protein alpha 0.62
a Fold change of gene expression is given for the low dose (0.6µg/mL for MWCNO and 0.06µg/mL for MWCNT). Fold changes represent the ratio ofMRNA amount of treated samples divided by those of control samples.
2458 Nano Lett., Vol. 5, No. 12, 2005

expression level changes (Figure 4, Supporting InformationTable S1-S12). Treating cells with a high dose of carbonparticles caused more gene expression changes than the lowdose treatment (Figure 4). However, it would be misleadingto say that the responses were dose-dependent, at least forthe two doses in this study. As shown in parts B and C ofFigure 4, only a small portion of genes with alteredtranscription were found in common between the low andhigh dose profiles, when treating with same type of particle.This indicates that distinct gene expression profiles wereinduced at low and high dose treatment. In contrast, if wecompare two types of particles, they induced similar tran-scriptional changes in cells at the same high and low doses(Figure 4D,E). The unique genes flanking the overlappingarea in Figure 4D,E may indicate cellular responses uniqueto exposure with MWCNOs or MWCNTs (SupportingInformation Tables S7, S9, S10, and S12).
Gene ontology analysis gave further evidence supportingthe qualitative differences of cell responses to low and highdoses of carbon nanomaterials. The percentages of overex-pressed and underexpressed genes in the top 10 most changedgene categories are shown in Table 1. At low dose of bothof MWCNO and MWCNT, genes were down-regulated inmost of the categories. Many of these genes involve Golgivesicle transport, secretory pathway, fatty acid biosynthesis,
protein metabolism, and G1/S transition of mitotic cell cycle.The only up-regulated category was protein ubiquitination(Table 1, Supporting Information Table 13). Collectively,these data suggest a reduction of cell growth and metabolismbut an acceleration of protein degradation at the low dosage.Reduction of cell growth was consistent with our phenotypicdata. In contrast, a high dose of MWCNO and MWCNTresulted in the up-regulation of protein and amino acidmetabolism; with additional up-regulation of genes involvedin a type I IFN response (Table 1). The outcome is anincrease in apoptosis and reduction in cell growth. However,the distinct gene expression profiles induced at low and highdoses may indicate that different mechanisms are responsiblefor our phenotypic observations or that the response occursat a different rate and we are observing two “snapshots” ofa temporal progression of a single mechanism. This observa-tion agrees with the our earlier experience with geneexpression changes induced by radiation.49
Structure-specific cellular responses were also observedin this experiment. At high dose, only MWCNT causedoverexpression of a significant number of immune andinflammatory response genes (Table 1 and Table 2). Totally25 genes in this category were overexpressed and only onegene was underexpressed, indicating a robust response ofthis function group (Tables 1 and 2). Most of these genes
Table 5. Genes Changed by Nano-Onion and Carbon Nanotubes but Fall in the Category of Apoptosisa
gene symbol gene namefold change of
gene expression
Fold Change of Gene Expression for 0.6 µg/mL MWCNOEGFR epidermal growth factor receptor (erythroblastic leukemia viral (v-erb-b)
oncogene homolog, avian)0.17
MCL1 myeloid cell leukemia sequence 1 (BCL2-related) 0.19BCL2L1 BCL2-like 1 0.24PPM1F protein phosphatase 1F (PP2C domain containing) 1.63TGM2 transglutaminase 2 (C polypeptide, protein-glutamine-gamma-glutamyltransferase) 0.35FGFR1 fibroblast growth factor receptor 1 (fms-related tyrosine kinase 2, Pfeiffer syndrome) 1.72CRKL v-crk sarcoma virus CT10 oncogene homologue (avian)-like 0.20EXTL3 exostoses (multiple)-like 3 0.44MAPK14 mitogen-activated protein kinase 14 0.31MACF1 microtubule-actin cross-linking factor 1 1.81
Fold Change of Gene Expression for 0.06 µg/mL MWCNTTGM2 transglutaminase 2 (C polypeptide, protein-glutamine-γ-glutamyltransferase) 0.40MCL1 myeloid cell leukemia sequence 1 (BCL2-related) 0.18FGFR1 fibroblast growth factor receptor 1 (fms-related tyrosine kinase 2, Pfeiffer syndrome) 1.72CRK v-crk sarcoma virus CT10 oncogene homologue (avian) 0.48MAPK14 mitogen-activated protein kinase 14 0.30
Fold Change of Gene Expression for 6 µg/mL MWCNOYARS tyrosyl-tRNA synthetase 1.62
Fold Change of Gene Expression for 0.6 µg/mL MWCNTYARS tyrosyl-tRNA synthetase 1.75MX1 myxovirus (influenza virus) resistance 1, interferon-inducible protein p78 (mouse) 11.55BIRC3 baculoviral IAP repeat-containing 3 2.16RIPK2 receptor-interacting serine-threonine kinase 2 1.38STAT1 signal transducer and activator of transcription 1, 91kDa 2.22TNFAIP3 tumor necrosis factor, alpha-induced protein 3 1.95AHR aryl hydrocarbon receptor 1.68TNFRSF10B tumor necrosis factor receptor superfamily, member 10b 1.62
a Fold change of gene expression is given for the low dose (0.6µg/mL for MWCNO and 0.06µg/mL for MWCNT). Fold changes represent the ratio ofMRNA amount of treated samples divided by those of control samples.
Nano Lett., Vol. 5, No. 12, 2005 2459

are involved in innate immune response system and areinduced by interferon or interferon-related proteins. Manyof these genes are implicated in an interferon type I response,which is potently antiviral and antiproliferative. Some of thegenes that are typically induced by an interferon type Iresponse include Irf7, Isgf3g, Stat1 Adar, Cxcl10, Irf1,Isgf3g, IFIT1, and MX2, all found in Table 2. Interestinglythe dimension of carbon tubes is similar to that of a virus,and the cellular response may mimic the response observedwith viral infection. Certainly the induction of many of thesame genes during viral infection is observed. Our observa-tion fits a previous report that kerotinocytes (HEKs) exposedto chemically unmodified MWCNTs released interleukin-8,a pro-inflammatory cytokine, which was postulated to resultin the skin irritation associated with exposure.39
In addition to the IFN type I response genes, we alsoobserved up-regulation of intracellular aryl hydrocarbon
(AHR) in MWCNT-treated cells (Table 5). This gene istypically expressed in cells or animals exposed to polycyclicaromatic hydrocarbons and is believed to mediate theteratogenesis, immune suppression, epithelial disorders, andtumor production in exposed experimental animals.89 Tran-scription of Bax, driven by AHR, is part of an evolutionarilyconserved cell-death-signaling pathway response, responsiblefor ovarian failure induced by environmental toxins.90
Overexpression of this gene is consistent with the cell deathwe observed with the carbon nanomaterials. In addition, thecytokine and TNF family member TNFRSF10B (TRAILR2)is up-regulated in cells treated with the highest concentrationof nanotubes, and this protein induces apoptosis in a widevariety of cells.72 Additional apoptosis genes involved includeBCL2L2 and MCL1. Finally, RIPK2 and TNFAIP3, genesthat contribute to the induction of apoptosis, were alsoobserved to be up-regulated in these treated cells.
Table 6. Genes Changed by Nano-Onion and Carbon Nanotubes but Fall in the Category of External Stimuli Response Genesa
gene category gene symbol gene namefold change of
gene expression
Fold Change of Gene Expression for MWCNO 6 mg/Limmune response EGR1 early growth response 1 0.37
FOS v-fos FBJ murine osteosarcoma viral oncogene homolog 0.14stress response DDIT3 DNA-damage-inducible transcript 3 2.39
SLC3A2 solute carrier family 3 (activators of dibasic and neutral aminoacid transport), member 2
2.46
STC2 stanniocalcin 2 2.38VEGF vascular endothelial growth factor 2.18DDIT3 DNA-damage-inducible transcript 3 2.39FOS v-fos FBJ murine osteosarcoma viral oncogene homolog 0.14SQSTM1 sequestosome 1 2.00VEGF vascular endothelial growth factor 2.18
Fold Change of Gene Expression for MWCNT 0.6 mg/Limmune response CXCL10 chemokine (C-X-C motif) ligand 10 4.82
IFIT2 interferon-induced protein with tetratricopeptide repeats 2 5.99IFIT3 interferon-induced protein with tetratricopeptide repeats 3 5.85IRF1 interferon regulatory factor 1 2.02IRF7 interferon regulatory factor 7 2.47CXCL3 chemokine (C-X-C motif) ligand 3 2.71MX2 myxovirus (influenza virus) resistance 2 (mouse) 6.88NR4A2 nuclear receptor subfamily 4, group A, member 2 2.62PLSCR1 phospholipid scramblase 1 2.38
response to DNA damage DDIT3 DNA-damage-inducible transcript 3 2.70stimulus IRF7 interferon regulatory factor 7 2.47
stress response CXCL10 chemokine (C-X-C motif) ligand 10 4.82CXCL3 chemokine (C-X-C motif) ligand 3 2.71DDIT3 DNA-damage-inducible transcript 3 2.70IRF7 interferon regulatory factor 7 2.47MKNK2 MAP kinase interacting serine/threonine kinase 2 2.11MX2 myxovirus (influenza virus) resistance 2 (mouse) 6.88NR4A2 nuclear receptor subfamily 4, group A, member 2 2.62OAS1 2′,5′-oligoadenylate synthetase 1, 40/46 kDa 2.82OAS2 2′,5′-oligoadenylate synthetase 2, 69/71 kDa 2.79OAS3 2′,5′-oligoadenylate synthetase 3, 100 kDa 2.21PLSCR1 phospholipid scramblase 1 2.38SLC3A2 solute carrier family 3 (activators of dibasic and neutral amino
acid transport), member 22.58
STAT1 signal transducer and activator of transcription 1, 91 kDa 2.22VEGF vascular endothelial growth factor 2.24
a Fold change of gene expression is given for the low dose (0.6µg/mL for MWCNO and 0.06µg/mL for MWCNT). Fold changes represent the ratio ofMRNA amount of treated samples divided by those of control samples.
2460 Nano Lett., Vol. 5, No. 12, 2005

Data from Tables 4 and 5 indicate that FGFR1 and EGFRare involved in the response. We suspect that the cells areusing strategies similar to a viral response when exposed tonanomaterials. Viruses are very similar in size range to the
carbon nanomaterials used here, around 20 nm in diameter.FGFR, EGFR, and other RTK pathways have been impli-cated in viral response in numerous studies. An early stepin viral infection is the targeting of the virus to cell surface
Figure 5. Promoter analysis. The interaction matrix for the differentially expressed genes (horizontal) and transcription regulatory elements(vertical) in the up- and down-regulated gene sets at different dosage using different carbon nanoparticles. The PAINT software (SupportingInformation) then computesp-values to look for the overrepresented TREs in the set of promoters analyzed in reference to all the genes inthe PAINT database to generate filtered (p-value< 0.1) interaction matrixes. Individual elements of the matrix are colored by the significancep-values: over-representation in the matrix is colored in red. The brightest red represents lowp-value (most significantly over-represented).Enriched transcription regulatory elements for the nanoparticle dataset.
Nano Lett., Vol. 5, No. 12, 2005 2461

receptors. Many viral receptors have been identified, includ-ing signaling receptors such as EGFR, chemokine receptor,platelet-derived growth factor receptor, fibroblast growthfactor receptor, tumor necrosis factor receptor family, andvarious integrin receptors. Usually multiple receptors aretargeted by the virus for binding, signaling, and entry. Virusalso impinges upon the signal transduction pathway in thesense that their binding to the receptor perturbs the normalreceptor-coupled signal transduction pathways. Many recep-tors, e.g., EGFR, are potent stimulators of the mitogen-activated protein kinase (MAPK) signaling pathway. Chronicstimulation of EGFR and of multiple steps in the MAPKsignaling pathway is involved in multiple cellular processes,especially in the interaction between viruses and tyrosinekinase pathways.91 One interesting observation is the down-regulation of EGFR by>4-fold, which indicates that thenano-onion and nanotubes might serve as therapeutics forEGFR-overexpressing epithelial cancers, such as>20% ofthe breast cancer. This could be a very interesting use of thecytotoxicity of the carbon nanomaterials, which has beensuggested28 and demonstrated by other groups.29 In additionto regulation of EGFR and FGFR1 expression, the overex-pression of VEGF mRNA is also observed at both high doseexperiments. The secretion of VEGF could be the cellularwound healing response to the addition of nanoparticles. Inaddition to the ability to activate epithelial proliferation, itmay also be a last-resort cellular response to save theepithelial cells from apoptosis.92
Promoter analysis identified EGR1/Krox as one of theover-represented transcription regulatory elements on up-regulated genes in almost all experimental settings (Figure5). In addition, with high dosage of treatment, additionaltranscription factors (ETS1 and IRF for MWCNTs, E2F andC/EBP-delta for MWCNOs) might be involved (Figure 5).In general, the profiles of enriched TREs are dramaticallydifferent in the individual experiments. For the down-regulated genes from MWCNT treatment, there are enrich-ment of GATA4, USF, and ELK1 at low dosage and COMP1
(cooperates with myogenic proteins 1) at higher dosage. Forthe carbon onions treatment, the lower dosage is correlatedwith enrichment of GATA4, USF, elk1, and Egr1/Knox indown-regulated genes and high dosage with enrichment ofGATA1, HES1, PAX, and E2F1. The upstream eventsleading to the different expression patterns seem to be relatedto ERK and p38 MAPK activities and the induction ofinterferon signaling. These analyses suggest that the inductionof the p38/ERK pathway and the type I IFN response arethe upstream signaling events (see Figure 6 for the pathwayanalysis result illustration) responsible for changes in cellulartranscription due to MWCNO and MWCNT treatment ofcells. Indeed, the pathway responses shown here are similarto the response of human bronchial epithelial cells tocombustion-derived metals.93
In summary, combined with the result from functionalanalysis, this study clearly showed that at high dosage, carbonparticles can seriously impact the cellular functions inmaintenance, growth, and differentiation. Of these twonanomaterials, MWCNTs appear to induce more stress onthe cells than MWCNOs. Our data suggest that there is aqualitative difference in response to low dose and high dosetreatment of carbon particles in human skin fibroblasts.Carbon tubes at high dose induced innate immune responses,whereas carbon onions did not. This indicates that cellsrespond differently according to the structures of nanoma-terials. Our data also suggest that carbon atoms released fromnanomaterials may participate in cell metabolic pathways.It is evident from our studies that carbon nanomaterials havea toxic effect on lung and skin cells. As little as 15 000MWCNOs per cell and a few dozen MWCNTs per cellinduced cell death in this study. Therefore, as this potentiallyrevolutionary technology is further developed, specific heedmust be given to minimizing unwanted effects upon bothproducers and consumers. The regulation of p38/ERK andthe EGFR also opens the door that the carbon nano-onionsand potentially other carbon nanomaterials can be exploited
Figure 6. A comparison of activated signal transduction networks for higher dose responses to carbon tubes and carbon onions.PathwayBuilder software (Arkin Group, LBNL) is used to analyze and create pathways differentially activated with the treatment matrixbased on published literature.
2462 Nano Lett., Vol. 5, No. 12, 2005

as a nanomedicine platform for cancer therapy, especiallyepithelially derived cancers.
Acknowledgment. We thank Mr. Kevin Peet and Ms.Lonnette Robinson for excellent administrative support. Wethank Alistar McDonald for critical reading of the manuscriptand Professor Marc Shuman and Professor Song Li forsupport. F. Chen was supported by NIH Grant R1CA95393-01, DOD BCRP BC045345 Grant, DARPA, UCSF ProstateCancer SPORE award (NIH Grant P50 CA89520), by a DOELDRD grant to A. P. Alivisatos/J. W. Gray, and by NIHP50 Grant CA112970 to J. W. Gray. This work wasperformed under the auspices of the U.S. Departmentof Energy, at the University of California/LawrenceBerkeley National Laboratory, under Contract No. DE-AC03-76SF00098.
Supporting Information Available: Details of materialsand methods discussed, figures showing cell viability mea-surements and a scatter plot of normalized GeneChip data,and tables listing the top 20 genes in Figure 4. This materialis available free of charge via the Internet at http://pubs.acs.org.
References
(1) Colvin, V. L. The potential environmental impact of engineerednanomaterials.Nat. Biotechnol.2003, 21, 1166-1170.
(2) Service, R. F. American Chemical Society meeting. Nanomaterialsshow signs of toxicity.Science2003, 300, 243.
(3) Proffitt, F. Nanotechnology. Yellow light for nanotech.Science2004,305, 762.
(4) Service, R. F. Nanotoxicology. Nanotechnology grows up.Science2004, 304, 1732-1734.
(5) Curl, R. F.; R. E., S.; Kroto, H. W.; O’Brien, S.; Heath, J. R. Howthe news that we were not the first to conceive of soccer ball C60got to us.J. Mol. Graphics Modell.2001, 19, 185-186.
(6) Iijima, S. Helical microtubules of graphitic carbon.Nature1991, 354,56-58.
(7) Iijima, S.; Ichihashi, T. Single-shell carbon nanotubes of 1-nmdiameter.Nature1993, 363, 603-605.
(8) Fullerenes: Chemistry, Physics, and Technology; Kadish, K. M.,Ruoff, R. S., Eds.; Wiley-Interscience: New York, 2000.
(9) Dresselhaus, M. S.; Dresselhaus, G.; Eklund, P. C.Science ofFullerenes and Carbon Nanotubes; Academic Press: New York,1996.
(10) Ajayan, P. M. Nanotubes from Carbon.Chem. ReV. 1999, 99, 1787-1799.
(11) Sugai, T.; et al. New Synthesis of High-Quality Double-WalledCarbon Nanotubes by High-Temperature Pulsed Arc Discharge.NanoLett. 2003, 3, 769-773.
(12) Sinnott, S. B.; Andrews, R. Carbon Nanotubes: Synthesis, Propertiesand Applications.Crit. ReV. Solid State Mater. Sci.2001, 26, 145-249.
(13) Tan, S. J.; et al. Individual single-wall carbon nanotubes as quantumwires.Nature1997, 386, 474-477.
(14) Colbert, D. T.; Smalley, R. E. Fullerene nanobutes for molecularelectronics.Trends. Biotechnol.1999, 17, 46-50.
(15) White, C. T.; Todorov, T. N. Quantum electronics: Nanotubes goballistic. Nature2001, 411, 649-651.
(16) Calvert, P. InCarbon Nanotubes1997, 277-292.(17) Iijima, S. Direct observation of the tetrahedral bonding in graphitized
carbon black by high-resolution electronmicroscopy.J. Cryst. Growth1980, 50, 675-683.
(18) Ugarte, D. Onion-like graphitic particles.Carbon 1995, 33, 989-993.
(19) Sano, N.; Wang, H.; Chhowalla, M.; Alexandrou, I.; Amaratunga,G. A. J. Nanotechnology: Synthesis of carbon “onions” in water.Nature (London) 2001, 414, 506-507.
(20) Sano, N.; et al. Properties of carbon onions produced by an arcdischarge in water.J. Appl. Phys.2002, 92, 2783-2788.
(21) Lange, H.; et al. Nanocarbon production by arc discharge in water.Carbon2003, 41, 1617-1623.
(22) Chen, B.; Selegue, J. P.; Wijeratne, L.; Bom, D.; Meier, M. S.Characterization of carbon nano-onions by using flow field-flowfractionation.Proc. Carbon′02, Int. Conf. Carbon[ISBN 7-900362-03-7]; 2002, 22.27.75.
(23) Choi, M. S.; Kim, Y.-J.; Yi, J.-H.; Altman, I.; Pikhitsa, P. U.S. Pat.Appl. Publ. 10 pp. ((S. Korea). U.S.; 2004).
(24) Brabec, C.; Hirsch, A. PCT Int. Appl. 19 pp. ((Siemens Aktieng-esellschaft, Germany). WO; 2003).
(25) Kajiura, H.; Shiraishi, S.; Negishi, E.; Ata, M.; Yamada, A. Jpn.Kokai Tokkyo Koho 13 pp. ((Sony Corp.: Japan). Jp; 2001).
(26) Maynard, A. D.; et al. Exposure to carbon nanotube material: aerosolrelease during the handling of unrefined single-walled carbonnanotube material.J. Toxicol. EnViron. Health, Part A2004, 67, 87-107.
(27) Silva, V. M.; Corson, N.; Elder, A.; Oberdorster, G. The Rat EarVein Model For Investigating In Vivo Thrombogenicity Of UltrafineParticles (Ufp).Toxicol. Sci.2005.
(28) Sayes, C. M.; et al. The differential cytotoxicity of water-solublefullerenes.Nano Lett.2004, 4, 1881-1887.
(29) Shi Kam, N. W.; O’Connell, M.; Wisdom, J. A.; Dai, H. Carbonnanotubes as multifunctional biological transporters and near-infraredagents for selective cancer cell destruction.Proc. Natl. Acad. Sci.U.S.A.2005, 102, 11600-11605.
(30) Yinghuai, Z.; et al. Substituted carborane-appended water-solublesingle-wall carbon nanotubes: new approach to boron neutron capturetherapy drug delivery.J. Am. Chem. Soc.2005, 127, 9875-9880.
(31) Burlaka, A. P.; et al. Catalytic system of the reactive oxygen specieson the C60 fullerene basis.Exp. Oncol.2004, 26, 326-327.
(32) Nelson, M. A.; et al. Effects of acute and subchronic exposure oftopically applied fullerene extracts on the mouse skin.Toxicol. Ind.Health 1993, 9, 623-630.
(33) Ali, S. S.; et al. A biologically effective fullerene (C60) derivativewith superoxide dismutase mimetic properties.Free Radical. Biol.Med.2004, 37, 1191-1202.
(34) Rancan, F.; et al. Cytotoxicity and photocytotoxicity of a dendriticC(60) monoadduct and a malonic acid C(60) tris-adduct on Jurkatcells.J. Photochem. Photobiol., B2002, 67, 157-162.
(35) Oberdorster, E. Manufactured nanomaterials (fullerenes, C60) induceoxidative stress in the brain of juvenile largemouth bass.EnViron.Health Perspect.2004, 112, 1058-1062.
(36) Frampton, M. W.; et al. Effects of exposure to ultrafine carbonparticles in healthy subjects and subjects with asthma.Res. Rep.sHealth Eff. Inst.; 2004, discussion 49-63, 1-47.
(37) Block, M. L.; et al. Nanometer size diesel exhaust particles areselectively toxic to dopaminergic neurons: the role of microglia,phagocytosis, and NADPH oxidase.FASEB J.2004, 18, 1618-1620.
(38) Lam, C. W.; James, J. T.; McCluskey, R.; Hunter, R. L. Pulmonarytoxicity of single-wall carbon nanotubes in mice 7 and 90 days afterintratracheal instillation.Toxicol. Sci.2004, 77, 126-134.
(39) Monteiro-Riviere, N. A.; Nemanich, R. J.; Inman, A. O.; Wang, Y.Y.; Riviere, J. E. Multiwalled carbon nanotube interactions withhuman epidermal keratinocytes.Toxicol. Lett.2005, 155, 377-384.
(40) Shvedova, A. A.; et al. Exposure to carbon nanotube material:assessment of nanotube cytotoxicity using human keratinocyte cells.J. Toxicol. EnViron. Health, Part A 2003, 66, 1909-1926.
(41) Warheit, D. B.; et al. Comparative pulmonary toxicity assessmentof single-wall carbon nanotubes in rats.Toxicol. Sci.2004, 77, 117-125.
(42) Jia, G.; et al. Cytotoxicity of Carbon Nanomaterials: Single-WallNanotube, Multi-Wall Nanotube, and Fullerene.2005, 39, 1378-1383.
(43) Goodman, C. M.; McCusker, C. D.; Yilmaz, T.; Rotello, V. M.Toxicity of gold nanoparticles functionalized with cationic andanionic side chains.Bioconjugate Chem.2004, 15, 897-900.
(44) Lockman, P. R.; Koziara, J. M.; Mumper, R. J.; Allen, D. D.Nanoparticle surface charges alter blood-brain barrier integrity andpermeability.J. Drug Targeting2004, 12, 635-641.
(45) Kirchner, C.; et al. Cytotoxicity of colloidal CdSe and CdSe/ZnSnanoparticles.Nano Lett.2005, 5, 331-338.
(46) Cunningham, M. J.; Magnuson, S. R.; Falduto, M. T.; Balzano, L.;Resasco, D. E. Investigating the toxicity of nanoscale materials bygene expression profiling: A systems biology approach. AmericanChemical Society Annual Meeting Presentation, 2005.
(47) Andrews, R.; Jacques, D.; Qian, D.; Rantell, T. Multiwall carbonnanotubes: synthesis and application.Acc. Chem. Res.2002, 35,1008-1017.
Nano Lett., Vol. 5, No. 12, 2005 2463

(48) Wronski, R.; Golob, N.; Grygar, E.; Windisch, M. Two-color,fluorescence-based microplate assay for apoptosis detection.Bio-techniques2002, 32, 666-668.
(49) Ding, L. H.; et al. Gene expression profiles of normal humanfibroblasts after exposure to ionizing radiation: a comparative studyof low and high doses.Radiat. Res.2005, 164, 17-26.
(50) Dolbeare, F.; Gratzner, H.; Pallavicini, M. G.; Gray, J. W. Flowcytometric measurement of total DNA content and incorporatedbromodeoxyuridine.Proc. Natl. Acad. Sci. U.S.A.1983, 80, 5573-5577.
(51) Yang, X. L.; Fan, C. H.; Zhu, H. S. Photoinduced cytotoxicity ofmalonic acid [C(60)]fullerene derivatives and its mechanism.Toxicol.in Vitro 2002, 16, 41-46.
(52) Darnell, J. E., Jr.; Kerr, I. M.; Stark, G. R. Jak-STAT pathways andtranscriptional activation in response to IFNs and other extracellularsignaling proteins.Science1994, 264, 1415-1421.
(53) Honda, K.; et al. IRF-7 is the master regulator of type-I interferon-dependent immune responses.Nature2005, 434, 772-777.
(54) Harada, H.; et al. Absence of the type I IFN system in EC cells:transcriptional activator (IRF-1) and repressor (IRF-2) genes aredevelopmentally regulated.Cell 1990, 63, 303-312.
(55) Weier, H. U.; George, C. X.; Greulich, K. M.; Samuel, C. E. Theinterferon-inducible, double-stranded RNA-specific adenosine deami-nase gene (DSRAD) maps to human chromosome 1q21.1-21.2.Genomics1995, 30, 372-375.
(56) Luster, A. D.; Unkeless, J. C.; Ravetch, J. V. Gamma-interferontranscriptionally regulates an early-response gene containing homol-ogy to platelet proteins.Nature1985, 315, 672-676.
(57) Luster, A. D.; Jhanwar, S. C.; Chaganti, R. S.; Kersey, J. H.; Ravetch,J. V. Interferon-inducible gene maps to a chromosomal bandassociated with a (4; 11) translocation in acute leukemia cells.Proc.Natl. Acad. Sci. U.S.A.1987, 84, 2868-2871.
(58) Clauss, I. M.; et al. Chromosomal localization of two human genesinducible by interferons, double-stranded RNA, and viruses.Cyto-genet. Cell Genet.1990, 53, 166-168.
(59) Porter, A. C.; et al. Interferon response element of the human gene1988, 6-16. EMBO J.1988, 7, 85-92.
(60) Chebath, J.; Merlin, G.; Metz, R.; Benech, P.; Revel, M. Interferon-induced 56 000 Mr protein and its mRNA in human cells: molecularcloning and partial sequence of the cDNA.Nucleic. Acids Res.1983,11, 1213-1226.
(61) Lafage, M.; et al. The interferon- and virus-inducible IFI-56K andIFI-54K genes are located on human chromosome 10 at bands q23-q24.Genomics1992, 13, 458-460.
(62) Zhu, H.; Cong, J. P.; Shenk, T. Use of differential display analysisto assess the effect of human cytomegalovirus infection on theaccumulation of cellular RNAs: induction of interferon-responsiveRNAs. Proc. Natl. Acad. Sci. U.S.A.1997, 94, 13985-13990.
(63) Niikura, T.; Hirata, R.; Weil, S. C. A novel interferon-inducible geneexpressed during myeloid differentiation.Blood Cells Mol. Dis.1997,23, 337-349.
(64) Horisberger, M. A.; et al. cDNA cloning and assignment tochromosome 21 of IFI-78K gene, the human equivalent of murineMx gene.Somat Cell Mol. Genet1988, 14, 123-131.
(65) Melen, K.; et al. Human MxB protein, an interferon-alpha-inducibleGTPase, contains a nuclear targeting signal and is localized in theheterochromatin region beneath the nuclear envelope.J. Biol. Chem.1996, 271, 23478-23486.
(66) Bonnevie-Nielsen, V.; Larsen, M. L.; Frifelt, J. J.; Michelsen, B.;Lernmark, A. Association of IDDM and attenuated response of 2′,5′-oligoadenylate synthetase to yellow fever vaccine.Diabetes1989,38, 1636-1642.
(67) Bonnevie-Nielsen, V.; et al. Variation in antiviral 2′,5′-oligoadenylatesynthetase (2′5′AS) enzyme activity is controlled by a single-nucleotide polymorphism at a splice-acceptor site in the OAS1 gene.Am. J. Hum. Genet. 2005, 76, 623-633.
(68) Whiteheart, S. W.; et al. SNAP family of NSF attachment proteinsincludes a brain-specific isoform.Nature1993, 362, 353-355.
(69) Lemons, P. P.; Chen, D.; Bernstein, A. M.; Bennett, M. K.;Whiteheart, S. W. Regulated secretion in platelets: identification ofelements of the platelet exocytosis machinery.Blood1997, 90, 1490-1500.
(70) Ravichandran, V.; Chawla, A.; Roche, P. A. Identification of a novelsyntaxin- and synaptobrevin/VAMP-binding protein, SNAP-23,expressed in nonneuronal tissues.J. Biol. Chem.1996, 271, 13300-13303.
(71) Mansour, S. J.; Herbrick, J. A.; Scherer, S. W.; Melancon, P. HumanGBF1 is a ubiquitously expressed gene of the sec7 domain familymapping to 10q24.Genomics1998, 54, 323-327.
(72) Walczak, H.; et al. TRAIL-R2: a novel apoptosis-mediating receptorfor TRAIL. EMBO J. 1997, 16, 5386-5397.
(73) McCarthy, J. V.; Ni, J.; Dixit, V. M. RIP2 is a novel NF-kappaB-activating and cell death-inducing kinase.J. Biol. Chem.1998, 273,16968-16975.
(74) Sibilia, M.; et al. The EGF receptor provides an essential survivalsignal for SOS-dependent skin tumor development.Cell 2000, 102,211-220.
(75) Opferman, J. T.; et al. Development and maintenance of B and Tlymphocytes requires antiapoptotic MCL-1.Nature2003, 426, 671-676.
(76) Boise, L. H.; et al. bcl-x, a bcl-2-related gene that functions as adominant regulator of apoptotic cell death.Cell 1993, 74, 597-608.
(77) Senechal, K.; Halpern, J.; Sawyers, C. L. The CRKL adaptor proteintransforms fibroblasts and functions in transformation by the BCR-ABL oncogene.J. Biol. Chem.1996, 271, 23255-23261.
(78) Wakasugi, K.; Schimmel, P. Two distinct cytokines released from ahuman aminoacyl-tRNA synthetase.Science1999, 284, 147-151.
(79) Seshadri, T.; Campisi, J. Repression of c-fos transcription and analtered genetic program in senescent human fibroblasts.Science1990,247, 205-209.
(80) Chuang, C. F.; Ng, S. Y. Functional divergence of the MAP kinasepathway. ERK1 and ERK2 activate specific transcription factors.FEBS Lett.1994, 346, 229-234.
(81) Hipskind, R. A.; Baccarini, M.; Nordheim, A. Transient activationof RAF-1, MEK, and ERK2 coincides kinetically with ternarycomplex factor phosphorylation and immediate-early gene promoteractivity in vivo. Mol. Cell Biol. 1994, 14, 6219-6231.
(82) Hodge, C.; et al. Growth hormone stimulates phosphorylation andactivation of elk-1 and expression of c-fos, egr-1, and junB throughactivation of extracellular signal-regulated kinases 1 and 2.J. Biol.Chem.1998, 273, 31327-31336.
(83) Lim, C. P.; Jain, N.; Cao, X. Stress-induced immediate-early gene,egr-1, involves activation of p38/JNK1.Oncogene1998, 16, 2915-2926.
(84) Liang, Q.; et al. The transcription factor GATA4 is activated byextracellular signal-regulated kinase 1- and 2-mediated phosphory-lation of serine 105 in cardiomyocytes.Mol. Cell Biol. 2001, 21,7460-7469.
(85) Kerkela, R.; Pikkarainen, S.; Majalahti-Palviainen, T.; Tokola, H.;Ruskoaho, H. Distinct roles of mitogen-activated protein kinasepathways in GATA-4 transcription factor-mediated regulation ofB-type natriuretic peptide gene.J. Biol. Chem.2002, 277, 13752-13760.
(86) Galibert, M. D.; Carreira, S.; Goding, C. R. The Usf-1 transcriptionfactor is a novel target for the stress-responsive p38 kinase andmediates UV-induced Tyrosinase expression.EMBO J. 2001, 20,5022-5031.
(87) Baldassare, J. J.; Bi, Y.; Bellone, C. J. The role of p38 mitogen-activated protein kinase in IL-1 beta transcription.J. Immunol.1999,162, 5367-5373.
(88) O’Rourke, J.; Yuan, R.; DeWille, J. CCAAT/enhancer-bindingprotein-delta (C/EBP-delta) is induced in growth-arrested mousemammary epithelial cells.J. Biol. Chem.1997, 272, 6291-6296.
(89) Ohtake, F.; et al. Modulation of oestrogen receptor signaling byassociation with the activated dioxin receptor.Nature 2003, 423,545-550.
(90) Matikainen, T.; et al. Aromatic hydrocarbon receptor-driven Bax geneexpression is required for premature ovarian failure caused bybiohazardous environmental chemicals.Nat. Genet2001, 28, 355-360.
(91) Braun-Falco, M.; Eisenried, A.; Buning, H.; Ring, J. Recombinantadeno-associated virus type 2-mediated gene transfer into humankeratinocytes is influenced by both the ubiquitin/proteasome pathwayand epidermal growth factor receptor tyrosine kinase.Arch. Dermatol.Res. 2005, 296, 528-535.
(92) Alavi, A.; Hood, J. D.; Frausto, R.; Stupack, D. G.; Cheresh, D. A.Role of Raf in vascular protection from distinct apoptotic stimuli.Science2003, 301, 94-96.
(93) Wu, W.; et al. Activation of the EGF receptor signaling pathway inhuman airway epithelial cells exposed to metals.Am. J. Physiol.1999,277, L924-931.
NL051748O
2464 Nano Lett., Vol. 5, No. 12, 2005