Iron-Zinc Co-Doped Titania Nanocomposite: Photocatalytic ...

714
Modulation of defect-mediated energy transfer fromZnO nanoparticles for the photocatalytic
degradation of bilirubinTanujjal Bora1,2, Karthik K. Lakshman2, Soumik Sarkar3,
Abhinandan Makhal3, Samim Sardar3, Samir K. Pal3 and Joydeep Dutta*1,2
Full Research Paper Open Access
Address:1Center of Excellence in Nanotechnology, School of Engineering andTechnology, Asian Institute of Technology, P. O. Box 4, Klong Luang,Pathumthani – 12120, Thailand, 2Chair in Nanotechnology, WaterResearch Center, Sultan Qaboos University, P. O. Box 17, Al Khoud –123, Sultanate of Oman and 3Department of Chemical, Biological &Macromolecular Sciences, Unit for Nanoscience & Technology, S. N.Bose National Centre for Basic Sciences, J D Block, Sector III, SaltLake, Kolkata – 700 098, India
Email:Joydeep Dutta* - [email protected]
* Corresponding author
Keywords:bilirubin; Förster resonance energy transfer (FRET); neonataljaundice; oxygen vacancy; photocatalysis; phototherapy; zinc oxidenanoparticles
Beilstein J. Nanotechnol. 2013, 4, 714–725.doi:10.3762/bjnano.4.81
Received: 18 July 2013Accepted: 22 October 2013Published: 04 November 2013
Associate Editor: J. J. Schneider
© 2013 Bora et al; licensee Beilstein-Institut.License and terms: see end of document.
AbstractIn recent years, nanotechnology has gained significant interest for applications in the medical field. In this regard, a utilization of
the ZnO nanoparticles for the efficient degradation of bilirubin (BR) through photocatalysis was explored. BR is a water insoluble
byproduct of the heme catabolism that can cause jaundice when its excretion is impaired. The photocatalytic degradation of BR
activated by ZnO nanoparticles through a non-radiative energy transfer pathway can be influenced by the surface defect-states
(mainly the oxygen vacancies) of the catalyst nanoparticles. These were modulated by applying a simple annealing in an oxygen-
rich atmosphere. The mechanism of the energy transfer process between the ZnO nanoparticles and the BR molecules adsorbed at
the surface was studied by using steady-state and picosecond-resolved fluorescence spectroscopy. A correlation of photocatalytic
degradation and time-correlated single photon counting studies revealed that the defect-engineered ZnO nanoparticles that were
obtained through post-annealing treatments led to an efficient decomposition of BR molecules that was enabled by Förster reso-
nance energy transfer.
714
Beilstein J. Nanotechnol. 2013, 4, 714–725.
715
IntroductionBilirubin (BR) is a yellow-orange pigment which is a byproduct
of the normal heme catabolism in mammals. In the human
body, 250–400 mg BR is produced every day [1] and can exist
in the body both as a free molecule and as an albumin complex.
The unconjugated (Z,Z)-BR isomer is insoluble in water and is
converted in the liver into the water-soluble (Z,E)-BR isomer
with the assistance of glucuronic acid. Most of the BR is then
extracted in the bile while a small portion is excreted in the
urine [2]. Excess bilirubin in blood can lead to deposits on
tissues, which gives rise to neurotoxicity and hyperbiliru-
binemia and/or a yellowish pigmentation of the skin, a disease
commonly known as jaundice. According to the World Health
Organization, almost 30,000 people suffering from jaundice die
every year [3]. Jaundice is most commonly seen in newly born
babies (neonatal jaundice) and typically develops within a few
weeks after birth. There can be many sources for neonatal jaun-
dice, such as weak liver function, a high level of red blood cells,
and the deficiency of important enzymes in the body [4]. At
present, phototherapy, the treatment of various diseases with
light irradiation, is the most widely used treatment for neonatal
jaundice. In it, the unconjugated (Z,Z)-BR isomers are
converted to water-soluble (Z,E)-BR isomers by using a light
source. Additionally, upon absorption of light, the (Z,Z)-BR
isomers can also react with oxygen in the blood to form color-
less oxidation products, which are typically excreted in the
urine [2]. However, the photo-oxidation of (Z,Z)-BR is a slow
process and the isomerization of (Z,Z)-BR occurs much faster
than the photo-oxidation [5].
In recent years, the use of nanotechnology in medical science is
gaining a lot of attention across the world. Research that
focuses on the use of various nanostructured materials in
different areas, such as for drug delivery [6], cancer treatments
[7,8], etc. is underway. Out of the numerous nanostructured ma-
terials, zinc oxide (ZnO) is one of the most promising materials
for applications in the medical field, because of its biocompati-
bility, biodegradability and non-toxicity [9]. Moreover, ZnO
can degrade various organic compounds efficiently through
photocatalysis [10,11]. It has been reported that the native
defects in the ZnO lattice, mostly the oxygen vacancy sites, play
an important role in the photocatalytic activity of the nanostruc-
tures [11]. Oxygen vacancies have been reported as the cause of
the characteristic green luminescence of ZnO [12-14]. These
vacancies exist in three charged states: singly charged (VO+),
doubly charged (VO++) and neutral (VO
x). The presence of the
oxygen vacancies and other native defects in the ZnO lattice
reduces the direct e−/h+ recombination process and thus
increases the quantum yield of ZnO nanocrystalline photocata-
lysts. Furthermore, the defect-mediated emission of energy
from the ZnO nanostructures can also effectively degrade
various organic compounds in water through Förster resonance
energy transfer (FRET) [15]. Hence, for an efficient photocatal-
ysis system that is based on ZnO nanostructures, the control of
such defect sites is a crucial factor. One effective way to modu-
late the concentration of defects in the ZnO lattice is to anneal
the ZnO nanostructures in an oxygen-rich atmosphere. The
effect of annealing on the native defects of ZnO has been
studied extensively and it has been demonstrated that the crys-
tallinity of ZnO can be improved by annealing the samples at
higher temperatures, typically above 500 °C [16-20]. However,
some studies show that annealing at higher temperatures can
also introduce defects, such as oxygen interstitials in the ZnO
lattice [21,22].
In the present work, we have explored the potential use of ZnO
nanoparticles as a phototherapy agent to efficiently degrade BR
molecules by controlling the surface defect-states of the
nanoparticles through annealing in an oxygen-rich atmosphere.
In one of our recent studies, it was demonstrated that upon
surface adsorption of BR molecules on ZnO nanostructures, a
resonant defect-mediated energy transfer from the photo-excited
ZnO nanostructures to the BR molecules induces their
photodegradation [15]. It was also demonstrated that the system
can effectively degrade BR when it is bound to albumin.
Although literature related to the molecular transformation of
water-insoluble BR through photocatalysis is limited, a few
studies are available on the photocatalytic degradation of BR
adsorbed on nanostructured hydroxyapatite coatings [23] or
molecularly imprinted titania films [24]. The current study
focuses on the efficient utilization of the defect-mediated emis-
sion from the ZnO nanoparticles. The emission is modulated
through annealing of the nanoparticles, in order to improve the
overall efficiency of the FRET process and hence to expedite
the photocatalytic degradation of BR molecules. By using
steady state and picosecond-resolved fluorescence spec-
troscopy, we have explored the influence of the surface defect-
states (mainly the oxygen vacancies) of the various as-synthe-
sized and annealed ZnO nanoparticles on the photocatalytic de-
gradation process of BR.
Results and DiscussionFigure 1a shows the UV–vis optical absorption spectra of the
as-synthesized ZnO nanoparticles and the particles annealed in
air at different temperatures. The as-synthesized ZnO nanoparti-
cles show a sharp absorbance onset at about 340 nm, which
indicates an almost uniform size of the nanoparticles. However,
upon annealing at higher temperatures, a slight red-shift in the
absorption spectra of the nanoparticles was observed, which
indicates a marginal increase in the size of the ZnO nanoparti-
cles after annealing [25]. The changes in the crystallite size of

Beilstein J. Nanotechnol. 2013, 4, 714–725.
716
the nanoparticles after annealing were estimated from their
respective XRD patterns (Figure 1b) by using the Scherrer
equation and the results are shown in Table S1 (Supporting
Information File 1). The crystallite size of the as-synthesized
ZnO nanoparticles was found to be about 7.3 nm and margin-
ally increases to 7.8 nm upon annealing at 250 °C.
Figure 1: (a) UV–vis optical absorption and (b) X-ray diffraction patternof ZnO nanoparticles annealed at various temperatures in air for 1 h.The 60 °C sample indicates the non-annealed as-synthesized ZnOnanoparticles.
The changes in the sizes of ZnO nanoparticles were further veri-
fied by transmission electron microscopy (TEM) analysis.
Figure 2a shows the typical TEM image of the fairly monodis-
persed ZnO nanoparticles annealed at 250 °C. As shown in
Figure 2b, the lattice spacing of 0.26 nm indicates the (002)
plane of the wurtzite structure of ZnO nanoparticles. The poly-
crystalline nature of the nanoparticles is confirmed by the
corresponding selected area electron diffraction (SAED) pattern
(Figure 2c). The particle size distributions of all samples
obtained from the respective TEM micrographs are also shown
in Figure 2d–i. For the as-synthesized ZnO nanoparticles the
mean particle size was found to be 4.5 nm, while the nanoparti-
cles increased in size upon annealing at higher temperatures,
which corroborates well with our previous observations from
XRD analysis. The mean size for the ZnO nanoparticles
annealed at 250 °C was obtained to be 5.5 nm. The maximum
mean particle size of 5.9 nm was obtained in the case of the
nanoparticles annealed at 350 °C.
Figure 2: (a) Transmission electron micrograph, (b) high resolutionTEM image of a single ZnO nanoparticle and (c) SAED pattern of theZnO nanoparticles annealed at 250 °C. The particle size distribution ofthe (d) as-synthesized, (e) 150 °C, (f) 200 °C, (g) 250 °C, (h) 300 °Cand (i) 350 °C annealed ZnO nanoparticles are also shown.
Here, it should be noted that the size of the nanoparticles esti-
mated by using the Scherrer equation yielded larger crystallite
sizes than the size obtained from TEM images. This discrep-
ancy arises because of a line broadening in XRD patterns that
originate primarily from the inhomogeneous micro-strain of the
samples as well as effects from the measurement apparatus [26].
As a result, the size estimation from XRD peaks using the
Beilstein J. Nanotechnol. 2013, 4, 714–725.
717
Scherrer equation typically yields larger sizes than the actual
sample size that can be obtained from TEM more accurately.
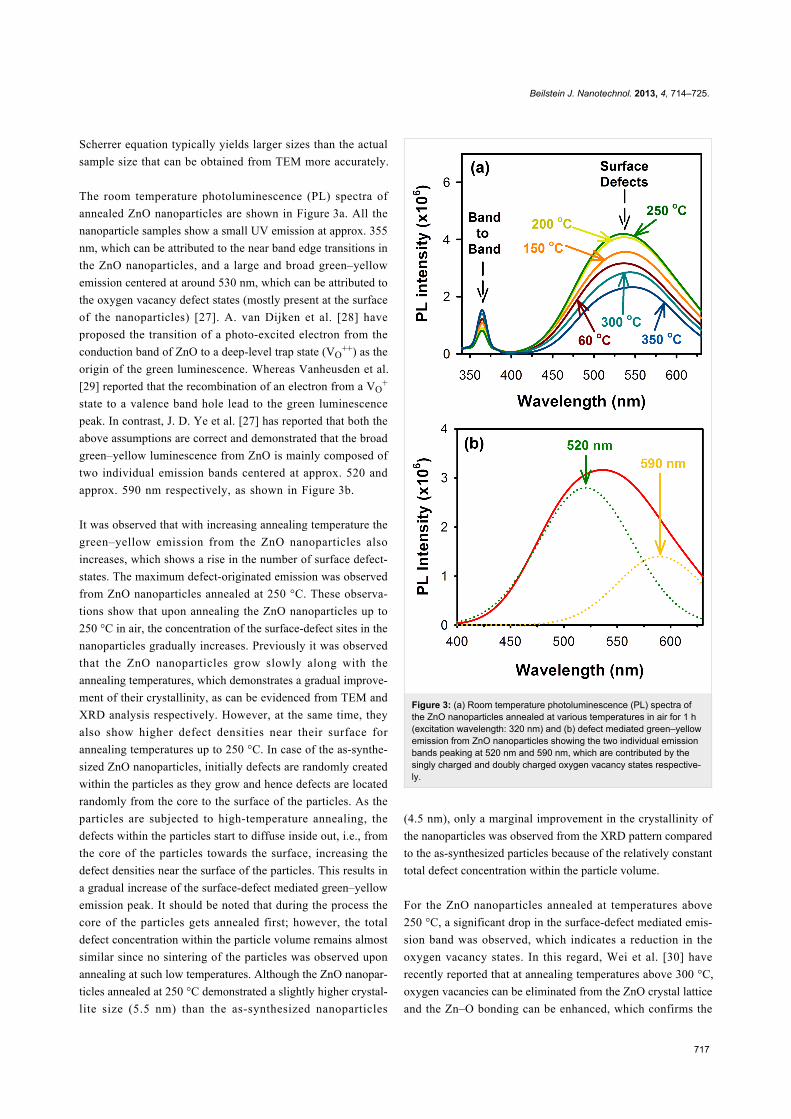
The room temperature photoluminescence (PL) spectra of
annealed ZnO nanoparticles are shown in Figure 3a. All the
nanoparticle samples show a small UV emission at approx. 355
nm, which can be attributed to the near band edge transitions in
the ZnO nanoparticles, and a large and broad green–yellow
emission centered at around 530 nm, which can be attributed to
the oxygen vacancy defect states (mostly present at the surface
of the nanoparticles) [27]. A. van Dijken et al. [28] have
proposed the transition of a photo-excited electron from the
conduction band of ZnO to a deep-level trap state (VO++) as the
origin of the green luminescence. Whereas Vanheusden et al.
[29] reported that the recombination of an electron from a VO+
state to a valence band hole lead to the green luminescence
peak. In contrast, J. D. Ye et al. [27] has reported that both the
above assumptions are correct and demonstrated that the broad
green–yellow luminescence from ZnO is mainly composed of
two individual emission bands centered at approx. 520 and
approx. 590 nm respectively, as shown in Figure 3b.
It was observed that with increasing annealing temperature the
green–yellow emission from the ZnO nanoparticles also
increases, which shows a rise in the number of surface defect-
states. The maximum defect-originated emission was observed
from ZnO nanoparticles annealed at 250 °C. These observa-
tions show that upon annealing the ZnO nanoparticles up to
250 °C in air, the concentration of the surface-defect sites in the
nanoparticles gradually increases. Previously it was observed
that the ZnO nanoparticles grow slowly along with the
annealing temperatures, which demonstrates a gradual improve-
ment of their crystallinity, as can be evidenced from TEM and
XRD analysis respectively. However, at the same time, they
also show higher defect densities near their surface for
annealing temperatures up to 250 °C. In case of the as-synthe-
sized ZnO nanoparticles, initially defects are randomly created
within the particles as they grow and hence defects are located
randomly from the core to the surface of the particles. As the
particles are subjected to high-temperature annealing, the
defects within the particles start to diffuse inside out, i.e., from
the core of the particles towards the surface, increasing the
defect densities near the surface of the particles. This results in
a gradual increase of the surface-defect mediated green–yellow
emission peak. It should be noted that during the process the
core of the particles gets annealed first; however, the total
defect concentration within the particle volume remains almost
similar since no sintering of the particles was observed upon
annealing at such low temperatures. Although the ZnO nanopar-
ticles annealed at 250 °C demonstrated a slightly higher crystal-
lite size (5.5 nm) than the as-synthesized nanoparticles
Figure 3: (a) Room temperature photoluminescence (PL) spectra ofthe ZnO nanoparticles annealed at various temperatures in air for 1 h(excitation wavelength: 320 nm) and (b) defect mediated green–yellowemission from ZnO nanoparticles showing the two individual emissionbands peaking at 520 nm and 590 nm, which are contributed by thesingly charged and doubly charged oxygen vacancy states respective-ly.
(4.5 nm), only a marginal improvement in the crystallinity of
the nanoparticles was observed from the XRD pattern compared
to the as-synthesized particles because of the relatively constant
total defect concentration within the particle volume.
For the ZnO nanoparticles annealed at temperatures above
250 °C, a significant drop in the surface-defect mediated emis-
sion band was observed, which indicates a reduction in the
oxygen vacancy states. In this regard, Wei et al. [30] have
recently reported that at annealing temperatures above 300 °C,
oxygen vacancies can be eliminated from the ZnO crystal lattice
and the Zn–O bonding can be enhanced, which confirms the
Beilstein J. Nanotechnol. 2013, 4, 714–725.
718
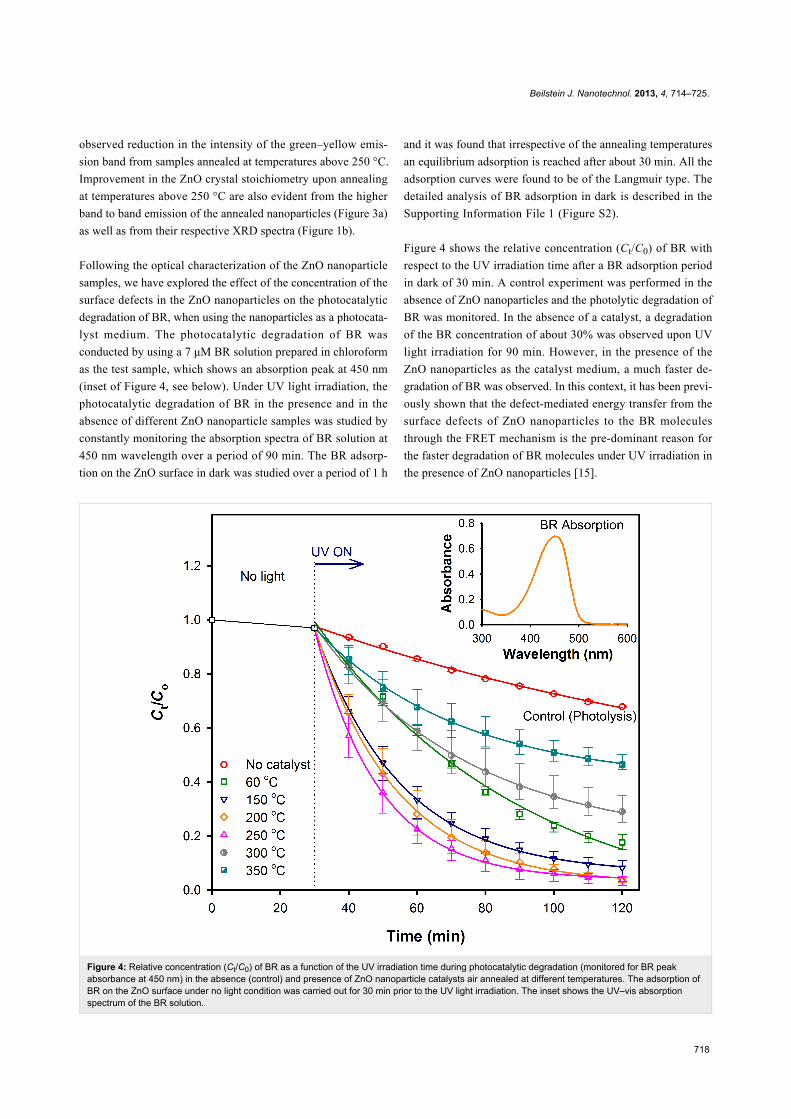
Figure 4: Relative concentration (Ct/C0) of BR as a function of the UV irradiation time during photocatalytic degradation (monitored for BR peakabsorbance at 450 nm) in the absence (control) and presence of ZnO nanoparticle catalysts air annealed at different temperatures. The adsorption ofBR on the ZnO surface under no light condition was carried out for 30 min prior to the UV light irradiation. The inset shows the UV–vis absorptionspectrum of the BR solution.
observed reduction in the intensity of the green–yellow emis-
sion band from samples annealed at temperatures above 250 °C.
Improvement in the ZnO crystal stoichiometry upon annealing
at temperatures above 250 °C are also evident from the higher
band to band emission of the annealed nanoparticles (Figure 3a)
as well as from their respective XRD spectra (Figure 1b).
Following the optical characterization of the ZnO nanoparticle
samples, we have explored the effect of the concentration of the
surface defects in the ZnO nanoparticles on the photocatalytic
degradation of BR, when using the nanoparticles as a photocata-
lyst medium. The photocatalytic degradation of BR was
conducted by using a 7 μM BR solution prepared in chloroform
as the test sample, which shows an absorption peak at 450 nm
(inset of Figure 4, see below). Under UV light irradiation, the
photocatalytic degradation of BR in the presence and in the
absence of different ZnO nanoparticle samples was studied by
constantly monitoring the absorption spectra of BR solution at
450 nm wavelength over a period of 90 min. The BR adsorp-
tion on the ZnO surface in dark was studied over a period of 1 h
and it was found that irrespective of the annealing temperatures
an equilibrium adsorption is reached after about 30 min. All the
adsorption curves were found to be of the Langmuir type. The
detailed analysis of BR adsorption in dark is described in the
Supporting Information File 1 (Figure S2).
Figure 4 shows the relative concentration (Ct/C0) of BR with
respect to the UV irradiation time after a BR adsorption period
in dark of 30 min. A control experiment was performed in the
absence of ZnO nanoparticles and the photolytic degradation of
BR was monitored. In the absence of a catalyst, a degradation
of the BR concentration of about 30% was observed upon UV
light irradiation for 90 min. However, in the presence of the
ZnO nanoparticles as the catalyst medium, a much faster de-
gradation of BR was observed. In this context, it has been previ-
ously shown that the defect-mediated energy transfer from the
surface defects of ZnO nanoparticles to the BR molecules
through the FRET mechanism is the pre-dominant reason for
the faster degradation of BR molecules under UV irradiation in
the presence of ZnO nanoparticles [15].

Beilstein J. Nanotechnol. 2013, 4, 714–725.
719
Upon inclusion of the as-synthesized ZnO nanoparticles
(hydrolyzed at ≈60 °C) in BR, almost 50% degradation was
observed to occur within 40 min of UV irradiation, leading to
an about 70% faster photocatalytic reduction of BR compared
to the degradation of BR in 40 minutes when no catalyst was
used. The reduction in the BR concentration increased further
when annealed ZnO nanoparticles (up to 250 °C) were used as
the photocatalysts because of their higher concentrations of
surface defects. The rates of the photocatalytic degradation of
BR were found to follow a first-order exponential equation with
a maximum photocatalytic activity for the ZnO nanoparticles
annealed at 250 °C. However, when the surface defects were
reduced by annealing the ZnO nanoparticles at temperatures
above 250 °C, a significant drop in the catalytic activity was
observed, which suggests the vital role of the surface defects in
the photocatalytic degradation of BR. It should be noted that the
FRET process between the ZnO nanoparticles and the BR mole-
cules does not interfere with the normal phototherapy process of
BR under UV irradiation. Hence, the photoproducts formed
after the photocatalysis of BR in the presence of ZnO nanoparti-
cles should mainly contain the structural (Z-lumirubin) and
configurational ((Z,E)-BR) isomers of water-insoluble BR,
which are the usual photoproducts of the BR phototherapy [2].
In addition, the presence of methylvinylmaleimide (MVM) as
an outcome of the photocatalytic degradation of BR in the pres-
ence of ZnO nanoparticles has also been evidenced in our
previous study [15].
In order to obtain further insights on the influence of the surface
defect concentration of the ZnO nanoparticle samples on the BR
photocatalytic degradation rate (R0), we conducted photocatal-
ysis experiments with different initial concentrations (C0) of
BR, while keeping the ZnO concentration constant. For these
experiments, we selected the as-synthesized ZnO nanoparticles,
the ZnO nanoparticles annealed at 250 °C, which had the
maximum number of surface defect-states and the ZnO
nanoparticles annealed at 350 °C, which have a minimum
number surface defect-states. The rate of the photocatalytic de-
gradation, R0, was then fitted by using the Langmuir–Hinshel-
wood (L–H) kinetic model, which typically explains the bimol-
ecular reaction of two species upon surface adsorption [31].
Upon fitting the rate constant (R0) vs the initial concentration of
BR (C0) curves using Equation 1 (see Experimental section), we
observe that the photocatalytic degradation of BR exactly
follows the phenomenon explained by the L–H model
(Figure 5). In case of the as-synthesized ZnO nanoparticles, the
value of the L–H rate constant (kL–H) was found to be 128.38
μmol·dm−3·s−1; which then improved to170.20 μmol·dm−3·s−1
for the 250 °C annealed ZnO nanoparticles. For the ZnO
nanoparticles with the minimum surface defect-states, the
Figure 5: Langmuir–Hinshelwood (L–H) plot showing theLangmuir–Hinshelwood rate constant (kL–H), Langmuir adsorptioncoefficient (K) and regression coefficients (R2) for the photocatalyticreactions conducted by using (a) the as-synthesized, (b) 250 °C and(c) 350 °C annealed ZnO nanoparticles as catalysts.
values of kL–H and K were found to decrease again to 152.80
μmol·dm−3·s−1 and 0.02 μmol−1·dm3, respectively.
The energy transfer process between the acceptor BR mole-
cules and the donor ZnO nanoparticles was then probed by
studying the FRET dynamics process through picosecond-
resolved fluorescence spectroscopy. For an efficient FRET
Beilstein J. Nanotechnol. 2013, 4, 714–725.
720
process it is important to have a significant spectral overlap
between the emission spectrum of the donor and the absorption
spectrum of the acceptor species. There are generally two mech-
anisms used to describe the transfer of excitations between a
donor and an acceptor species, namely Dexter and Förster
mechanisms. In both of these mechanisms, the energy transfer
rate is dependent on the distance between the donor and
acceptor as well as the spectral overlap of the emission from
donor and the absorption of acceptor molecules. However, the
basic difference between the two mechanisms is that in the
Dexter mechanism the donor and the acceptor exchange their
electron, whereas in the Förster mechanism energy (not elec-
trons) is exchanged between the donor and acceptor. Therefore,
the overlap of wavefunctions or molecular orbitals between the
donor and acceptor is very crucial in the case of the Dexter
mechanism so that the electrons can occupy the molecular
orbital of the other molecule. The energy transfer rate also
decays exponentially with the distance between the donor and
acceptor molecules, and the exchange normally occurs when the
distance is smaller than 1 nm. On the other hand, the energy
transfer of the Förster mechanism is highly influenced by the
Förster distance (R0) and the relative orientation of the tran-
sition dipoles of the donor and acceptor in space. Furthermore,
the energy exchange occurs within a minimal donor–acceptor
distance of 1–10 nm. Therefore here in this study, the consider-
ation of Dexter mechanism (orbital overlap) via an exchange
process associated with the transfer of single charge carriers can
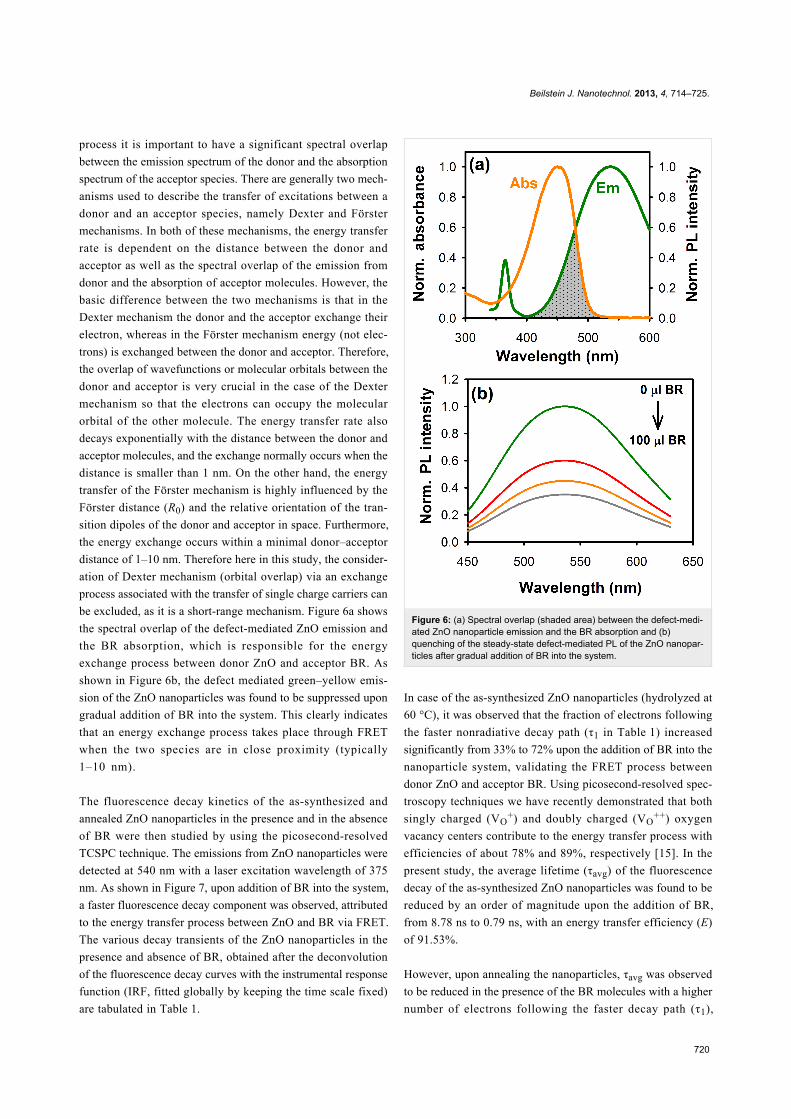
be excluded, as it is a short-range mechanism. Figure 6a shows
the spectral overlap of the defect-mediated ZnO emission and
the BR absorption, which is responsible for the energy
exchange process between donor ZnO and acceptor BR. As
shown in Figure 6b, the defect mediated green–yellow emis-
sion of the ZnO nanoparticles was found to be suppressed upon
gradual addition of BR into the system. This clearly indicates
that an energy exchange process takes place through FRET
when the two species are in close proximity (typically
1–10 nm).
The fluorescence decay kinetics of the as-synthesized and
annealed ZnO nanoparticles in the presence and in the absence
of BR were then studied by using the picosecond-resolved
TCSPC technique. The emissions from ZnO nanoparticles were
detected at 540 nm with a laser excitation wavelength of 375
nm. As shown in Figure 7, upon addition of BR into the system,
a faster fluorescence decay component was observed, attributed
to the energy transfer process between ZnO and BR via FRET.
The various decay transients of the ZnO nanoparticles in the
presence and absence of BR, obtained after the deconvolution
of the fluorescence decay curves with the instrumental response
function (IRF, fitted globally by keeping the time scale fixed)
are tabulated in Table 1.
Figure 6: (a) Spectral overlap (shaded area) between the defect-medi-ated ZnO nanoparticle emission and the BR absorption and (b)quenching of the steady-state defect-mediated PL of the ZnO nanopar-ticles after gradual addition of BR into the system.
In case of the as-synthesized ZnO nanoparticles (hydrolyzed at
60 °C), it was observed that the fraction of electrons following
the faster nonradiative decay path (τ1 in Table 1) increased
significantly from 33% to 72% upon the addition of BR into the
nanoparticle system, validating the FRET process between
donor ZnO and acceptor BR. Using picosecond-resolved spec-
troscopy techniques we have recently demonstrated that both
singly charged (VO+) and doubly charged (VO
++) oxygen
vacancy centers contribute to the energy transfer process with
efficiencies of about 78% and 89%, respectively [15]. In the
present study, the average lifetime (τavg) of the fluorescence
decay of the as-synthesized ZnO nanoparticles was found to be
reduced by an order of magnitude upon the addition of BR,
from 8.78 ns to 0.79 ns, with an energy transfer efficiency (E)
of 91.53%.
However, upon annealing the nanoparticles, τavg was observed
to be reduced in the presence of the BR molecules with a higher
number of electrons following the faster decay path (τ1),

Beilstein J. Nanotechnol. 2013, 4, 714–725.
721
Table 1: Picosecond-resolved fluorescence transients of the as-synthesized and annealed ZnO nanoparticles in the presence and in the absence ofBRa.
annealing temperature (°C) sample τ1 (ns) τ2 (ns) τ3 (ns) τavg (ns) E (%)
60 ZnO only 0.71 (33%) 4.69 (46%) 39.20 (21%) 8.78 —60 ZnO + BR 0.13 (72%) 1.60 (26%) 14.20 (2%) 0.79 91.53150 ZnO only 0.71 (50%) 4.69 (43%) 39.20 (7%) 5.11 —150 ZnO + BR 0.13 (81%) 1.60 (18%) 14.20 (1%) 0.53 88.63200 ZnO only 0.71 (47%) 4.69 (45%) 39.20 (8%) 5.58 —200 ZnO + BR 0.13 (78%) 1.60 (21%) 14.20 (1%) 0.58 86.20250 ZnO only 0.71 (42%) 4.69 (33%) 39.20 (25%) 11.64 —250 ZnO + BR 0.13 (85%) 1.60 (14%) 14.20 (1%) 0.48 93.79300 ZnO only 0.71 (41%) 4.69 (52%) 39.20 (7%) 5.47 —300 ZnO + BR 0.13 (78%) 1.60 (21%) 14.20 (1%) 1.85 88.18350 ZnO only 0.71 (28%) 4.69 (67%) 39.20 (5%) 5.30 —350 ZnO + BR 0.13 (75%) 1.60 (23%) 14.20 (2%) 0.75 87.25
aThe emissions from ZnO nanoparticles were detected at 540 nm with a laser excitation wavelength of 375 nm. Numbers in parentheses indicate therelative weighting.
Figure 7: The picosecond-resolved fluorescence transients of theas-synthesized and annealed ZnO nanoparticles in the presence andin the absence of BR. The fluorescence decay was monitored at 540nm with an excitation wavelength of 375 nm.
reaching a maximum of 85% in case of the nanoparticles
annealed at 250 °C, which have the maximum number of
surface defects. This suggests that in nanoparticles with a higher
amount of surface defect-states, more photo-excited electrons
lose their energy via a nonradiative path. This loss of energy via
the nonradiative path can be directly correlated to the FRET
process. The population of the trap-state electrons, indicated by
the number in parenthesis in the slower time component (τ3) of
the fluorescence decay curves, was also found to be highest
(25%) in the case of the ZnO nanoparticles annealed at 250 °C
with the highest concentration of surface defect-states. For the
various ZnO nanoparticles samples, the energy transfer effi-
ciency (E) during the FRET process was then calculated using
Equation 4 (see Experimental section). It was observed that the
energy transfer efficiency increases with an increasing number
of surface defect-states. For the ZnO nanoparticles annealed at
250 °C, which had the maximum number of surface defect-
states, the highest energy transfer efficiency of 93.79% was
observed, which is reduced gradually to 87.25% in the samples
annealed at 350 °C, because of the reduction in the surface
defects in the nanoparticles. It was observed earlier in the
steady-state photoluminescence study of the annealed ZnO
nanoparticles (Figure 3a), that the defect mediated
green–yellow luminescence from oxygen vacancies is
maximum for the nanoparticles annealed at 250 °C in air, which
corroborates the highest energy transfer efficiency observed
here. As a result, the ZnO nanoparticles annealed at 250 °C in
air demonstrated the highest photocatalytic degradation of BR
compared to the nanoparticles annealed at other temperatures.
Therefore, it is clear from our results that an efficient BR de-
Beilstein J. Nanotechnol. 2013, 4, 714–725.
722
gradation can be achieved through photocatalysis by using ZnO
nanoparticles as the catalyst.
ConclusionZnO nanoparticles with diameters of about 5–6 nm were
synthesized and used as catalyst for studying the photocatalytic
degradation of bilirubin. It has been demonstrated that the
number of surface defect-states (mainly the oxygen vacancies)
of the nanoparticles, which plays an important role in the photo-
catalytic degradation of the BR molecules, can be controlled
through an annealing process. From picosecond-resolved
TCSPC studies, it was observed that the energy related to the
defect-mediated photoluminescence from the ZnO nanoparti-
cles that peaks at about 530 nm resonantly transfers to the BR
molecules adsorbed at the surface via the Förster resonance
energy transfer (FRET) process: This leads to an efficient
photocatalytic degradation of the BR molecules. The energy
transfer efficiency of the FRET process between the annealed
ZnO nanoparticles and BR molecules was estimated, and for the
ZnO nanoparticles annealed at 250 °C a maximum energy
transfer efficiency of more than 93% was obtained, which can
be attributed to the highest concentration of surface defect-
states present in these nanoparticles. Under continuous UV ir-
radiation, the ZnO nanoparticles annealed at 250 °C showed the
maximum photocatalytic activity, which was almost 3.5 times
higher than that of the as-synthesized ZnO nanoparticles. In
summary, from the present study, it is clear that for the effi-
cient photocatalytic degradation of BR in blood, the defect-
states in the ZnO nanoparticle catalyst, which can be modu-
lated simply by annealing the nanoparticles, is crucial. Although
DNA damage due to the exposure to UV irradiation can be a
concern in case of the practical implementation of this type of
FRET-based phototherapeutic systems, we believe that such
harmful effects can be circumvented in the presence of the ZnO
nanoparticle layer due to their ability to filter UV light. In this
regard, a flow device for the removal of BR from blood, which
is based on a nanoparticle film, has already been proposed in
our previous study [15].
ExperimentalAll chemicals used in this study were of analytical grade and
used without further purification. For the synthesis of the ZnO
nanoparticles, zinc acetate dihydrate (Zn(CH3COO)2·2H2O,
Merck) and sodium hydroxide (NaOH, Merck) were used as the
starting materials. Bilirubin powder was purchased from Sigma-
Aldrich.
Synthesis of ZnO nanoparticlesZnO nanoparticles were synthesized in ethanol. In a typical syn-
thesis process, a 2 mM Zn(CH3COO)2·2H2O solution was
prepared in 40 mL ethanol by stirring the solution at 60 °C until
a clear solution was obtained. Separately, a 4 mM NaOH solu-
tion was prepared in 20 mL ethanol by stirring the solution at
60 °C until a clear solution was obtained. Both the solutions
were allowed to cool down to room temperature, then the
NaOH solution was slowly added to the zinc acetate solution
and mixed properly. The glass beaker was then covered tightly
with aluminum foil and placed in a pre-heated water bath at
60 °C for 2 hours to hydrolyze. After 2 h, the resultant trans-
parent ZnO nanoparticle colloidal solution was allowed to cool
down to room temperature and stored in a refrigerator for
further use.
Photocatalyst preparationFor the annealing of the ZnO nanoparticles, six glass substrates
(1.5 cm × 1.5 cm) were placed on a hot plate (60 °C) and
100 μL of the as-prepared ZnO nanoparticle colloidal solution
was dropped on each glass substrate. The glass substrates were
initially cleaned by successive sonication in soap water,
acetone, ethanol and DI water respectively for 15 min each.
Once the solvent on the glass substrates dried, another 100 μL
of the ZnO nanoparticle colloid was dropped again and the
process was repeated several times. A total of 10 mL ZnO
nanoparticle colloid was dropped on each glass substrate.
Finally, the ZnO nanoparticle coated glass substrates were
annealed at different temperatures up to 350 °C in air for 1 h.
The annealed ZnO nanoparticles were then redispersed in chlo-
roform by sonication for 1 h and stored in dark until further use.
Photocatalytic degradation of bilirubinA 100 μM bilirubin (BR) stock solution (20 mL) was prepared
in chloroform and stored at 4 °C in dark. For the photocatalytic
tests, the BR solution was diluted in chloroform to obtain a
concentration equal to 7 μM and used as the photocatalytic test
sample. The concentration of the bilirubin solution was deter-
mined from our previous study, in which it was demonstrated
that the photocatalysis of BR with ZnO nanoparticles as cata-
lyst medium is maximum in the BR concentration range from 7
to 16.5 μM [15]. 100 μL of the ZnO nanoparticles redispersed
in chloroform (0.5 μM) was then added to 2.9 mL of BR test
solution in a quartz cuvette and the photocatalysis was carried
out using a 12 W UV lamp. For the selective excitation of the
ZnO nanoparticles, we have used a 320 nm high pass filter to
block the light with wavelengths lower than 320 nm. During the
photocatalysis, the degradation of BR was constantly moni-
tored in terms of its optical absorptions recorded every two
minutes by using a UV–vis spectrophotometer (Mikropack
DH-2000 with USB4000 detector from Ocean Optics). BR
adsorption at the surface of ZnO nanoparticles was carried out
in the dark for 30 min prior to the UV light irradiation. The
photocatalytic test was then carried out for 90 min and repeated
thrice. BR degradation was determined by plotting the absorp-
Beilstein J. Nanotechnol. 2013, 4, 714–725.
723
tion peak of BR at 450 nm with respect to the UV irradiation
time.
Langmuir–Hinshelwood kinetics model for thephotocatalytic degradation of BRThe Langmuir–Hinshelwood (L–H) kinetics model was
employed in order to explore the photocatalytic degradation rate
at various initial concentrations of BR while keeping the
concentration of the ZnO nanoparticle catalyst fixed. Mathemat-
ically the L–H model can be defined as:
(1)
where R0 is the rate of photocatalytic degradation of BR, C0 is
the initial concentration of BR, kL–H is the Langmuir–Hinshel-
wood (L–H) rate constant, K is the Langmuir adsorption coeffi-
cient of BR molecules and t is the UV illumination time. The
values of kL–H and K can be derived by considering the two
boundary conditions of Equation 1. If the initial concentration
of BR (C0) is sufficiently low (i.e., KC0 << 1), then Equation 1
can be rewritten as:
(2)
where kapp is the apparent first-order rate constant. If C0 is
sufficiently high (i.e., KC0 >> 1), then Equation 1 can be
simplified to a zero-order equation of the form
(3)
For this study the initial concentration of BR in the photocat-
alytic system was varied from 0 to 52.80 μM and the values of
kL–H and K were determined by fitting the R0 vs C0 curves
using a hyperbolic function.
Characterization techniquesTransmission electron microscopy (TEM; model: JEOL JEM-
2010) was used for the morphological and crystallographic
characterization of the ZnO nanoparticles used in this study.
The TEM samples were prepared by applying a drop of the ZnO
nanoparticle samples dispersed in ethanol onto the carbon side
of carbon-coated copper grids and dried overnight in air. The
sizes of the nanoparticles were then determined by using the
ImageJ software. X-ray diffraction (XRD) of the various ZnO
nanoparticle samples were recorded by using a Rigaku Mini-
Flex 600 (Cu Kα radiation, λ =1.54 Å) XRD machine.
Steady state absorption and emission spectra of the nanoparti-
cles were measured with an Ocean Optics Mikropack DH-2000
spectrophotometer and Jobin Yvon Fluoromax-3 fluorometer,
respectively. All the photoluminescence transients were
measured by using the picosecond-resolved time-correlated
single photon counting (TCSPC) technique with a commer-
cially available picosecond diode laser-pumped fluorescence
spectrophotometer (LifeSpec-ps) from Edinburgh Instruments,
U.K. Picosecond excitation pulses from the picoquant diode
laser were used with an instrument response function (IRF) of
60 ps. A microchannel-plate photomultiplier tube (MCP-PMT,
Hammamatsu) was used to detect the photoluminescence from
the sample after dispersion through a monochromator. For all
transients, the polarizer on the emission side was adjusted to be
at 55° (the “magic angle”) with respect to the polarization axis
of the excitation beam.
Data analysisThe picosecond resolved decay curves were fitted by using a
nonlinear least square method to the function
which comprises the convolution of the IRF, E(t), with a sum of
exponentials
where Bi is the pre-exponential factor, τi are the characteristic
lifetimes and A represents a background. The relative concen-
tration in a multi-exponential decay was expressed as:
The average lifetime (amplitude-weighted) of a multi-exponen-
tial decay [32] is expressed as
In order to estimate the energy transfer efficiency (E) between
the ZnO donor nanoparticles and the BR acceptor molecules,
the relative fluorescence lifetime of the donor in the absence
(τD) and presence (τDA) of the acceptor were initially deter-
mined. The efficiency E was then calculated using the following
equation:
(4)

Beilstein J. Nanotechnol. 2013, 4, 714–725.
724
Supporting InformationSupporting Information File 1Experimental details
[http://www.beilstein-journals.org/bjnano/content/
supplementary/2190-4286-4-81-S1.pdf]
AcknowledgementsT. Bora would like to acknowledge the financial support from
the Sheikh Saqr Al Qasimi Graduate Research Fellowship and
the Centre of Excellence in Nanotechnology at the Asian Insti-
tute of Technology for partial funding. S. Sarkar and A. Makhal
would like to thank UGC and CSIR fellowships respectively for
financial support. S. K. Pal thanks DST (India) for financial
grant (No. DST/TM/SERI/2k11/103). K. Lakshman and J.
Dutta would like to thank the Research Council of Oman for
partial financial support for this work.
References1. London, I. M.; West, R.; Shemin, D.; Rittenberg, D. J. Biol. Chem.
1950, 184, 351–358.2. Maisels, M. J.; McDonagh, A. F. N. Engl. J. Med. 2008, 358, 920–928.
doi:10.1056/NEJMct07083763. Robertson, S. E.; Hull, B. P.; Tomori, O.; Bele, O.; LeDuc, J. W.;
Esteves, K. JAMA, J. Am. Med. Assoc. 1996, 276, 1157–1162.doi:10.1001/jama.1996.03540140045025
4. Vreman, H. J.; Wong, R. J.; Stevenson, D. K. Semin. Perinatol. 2004,28, 326–333. doi:10.1053/j.semperi.2004.09.003
5. Stocker, R.; Glazer, A. N.; Ames, B. N. Proc. Natl. Acad. Sci. U. S. A.1987, 84, 5918–5922. doi:10.1073/pnas.84.16.5918
6. Paciotti, G. F.; Myer, L.; Weinreich, D.; Goia, D.; Pavel, N.;McLaughlin, R. E.; Tamarkin, L. Drug Delivery 2004, 11, 169–183.doi:10.1080/10717540490433895
7. Wu, X.; Liu, H.; Liu, J.; Haley, K. N.; Treadway, J. A.; Larson, J. P.;Ge, N.; Peale, F.; Bruchez, M. P. Nat. Biotechnol. 2002, 21, 41–46.doi:10.1038/nbt764
8. Hirsch, L. R.; Stafford, R. J.; Bankson, J. A.; Sershen, S. R.; Rivera, B.;Rrice, R. E.; Hazle, J. D.; Halas, N. J.; West, J. L.Proc. Natl. Acad. Sci. U. S. A. 2011, 100, 13549–13554.doi:10.1073/pnas.2232479100
9. Zhou, J.; Xu, N. S.; Wang, Z. L. Adv. Mater. 2006, 18, 2432–2435.doi:10.1002/adma.200600200
10. Baruah, S.; Rafique, R. F.; Dutta, J. NANO 2008, 3, 399–407.doi:10.1142/S179329200800126X
11. Baruah, S.; Sinha, S. S.; Ghosh, B.; Pal, S. K.; Raychaudhuri, A. K.;Dutta, J. J. Appl. Phys. 2009, 105, 074308. doi:10.1063/1.3100221
12. Hofmann, D. M.; Pfisterer, D.; Sann, J.; Meyer, B. K.; Tena-Zaera, R.;Munoz-Sanjose, V.; Frank, T.; Pensl, G.Appl. Phys. A: Mater. Sci. Process. 2007, 88, 147–151.doi:10.1007/s00339-007-3956-2
13. Vanheusden, K.; Seager, C. H.; Warren, W. L.; Tallant, D. R.;Voigt, J. A. Appl. Phys. Lett. 1996, 68, 403–405. doi:10.1063/1.116699
14. Van Dijken, A.; Meulenkamp, E. A.; Vanmaekelbergh, D.; Meijerink, A.J. Phys. Chem. B 2000, 104, 1715–1723. doi:10.1021/jp993327z
15. Sarkar, S.; Makhal, A.; Baruah, S.; Mahmood, M. A.; Dutta, J.;Pal, S. K. J. Phys. Chem. C 2012, 116, 9608–9615.doi:10.1021/jp301316e
16. Chen, Z. Q.; Yamamoto, S.; Maekawa, M.; Kawasuso, A.; Yuan, X. L.;Sekiguchi, T. J. Appl. Phys. 2003, 94, 4807–4812.doi:10.1063/1.1609050
17. Xu, J.-P.; Shi, S.-B.; Li, L.; Zhang, X.-S.; Wang, Y.-X.; Chen, X.-M.Chin. Phys. Lett. 2010, 27, No. 047803.doi:10.1088/0256-307X/27/4/047803
18. Lin, B.; Fu, Z.; Jia, Y.; Liao, G. J. Electrochem. Soc. 2001, 148,G110–G113. doi:10.1149/1.1346616
19. Sanyal, D.; Roy, T. K.; Chakrabarti, M.; Dechoudhury, S.;Bhowmick, D.; Chakrabarti, A. J. Phys.: Condens. Matter 2008, 20,045217. doi:10.1088/0953-8984/20/04/045217
20. Zhang, Y.; Fa, W.; Yang, F.; Zheng, Z.; Zhang, P. Ionics 2010, 16,815–820. doi:10.1007/s11581-010-0468-4
21. Fan, H. B.; Yang, S. Y.; Zhang, P. F.; Wei, H. Y.; Liu, X. L.; Jiao, C. M.;Zhu, Q. S.; Chen, Y. H.; Wang, Z. G. Chin. Phys. Lett. 2007, 24,2108–2111. doi:10.1088/0256-307X/24/7/089
22. Mtangi, W.; Auret, F. D.; Diale, M.; Meyer, W. E.; Chawanda, A.;De Meyer, H.; Janse Van Rensburg, P. J.; Nel, J. M. J. Appl. Phys.2012, 111, 084503. doi:10.1063/1.3700186
23. Yang, Z.; Zhang, C. J. Mol. Catal. A: Chem. 2009, 302, 107–111.doi:10.1016/j.molcata.2008.12.001
24. Yang, Z.-p.; Yan, J.-l.; Zhang, C.-j.; Luo, S.-q. Colloids Surf., B 2011,87, 187–191. doi:10.1016/j.colsurfb.2011.05.022
25. Irimpan, L.; Ambika, D.; Kumar, V.; Nampoori, V. P. N.;Radhakrishnan, P. J. Appl. Phys. 2008, 104, 033118.doi:10.1063/1.2949400
26. Scardi, P.; Leoni, M.; Delhez, R. J. Appl. Crystallogr. 2004, 37,381–390. doi:10.1107/S0021889804004583
27. Ye, J. D.; Gu, S. L.; Qin, F.; Zhu, S. M.; Liu, S. M.; Zhou, X.; Liu, W.;Hu, L. Q.; Zhang, R.; Shi, Y.; Zheng, Y. D.Appl. Phys. A: Mater. Sci. Process. 2005, 81, 759–762.doi:10.1007/s00339-004-2996-0
28. Van Dijken, A.; Meulenkamp, E. A.; Vanmaekelbergh, D.; Meijerink, A.J. Lumin. 2000, 90, 123–128. doi:10.1016/S0022-2313(99)00599-2
29. Vanheusden, K.; Warren, W. L.; Seager, C. H.; Tallant, D. R.;Voigt, J. A.; Gnade, B. E. J. Appl. Phys. 1996, 79, 7983–7990.doi:10.1063/1.362349
30. Wei, S.; Lian, J.; Wu, H. Mater. Charact. 2010, 61, 1239–1244.doi:10.1016/j.matchar.2010.08.002
31. Sleiman, M.; Vildozo, D.; Ferronato, C.; Chovelon, J.-M.Appl. Catal., B: Environ. 2007, 77, 1–11.doi:10.1016/j.apcatb.2007.06.015
32. Lakowicz, J. R. Principles of Fluorescence Spectroscopy; SpringerScience+Business Media, LLC: New York, 1999.

Beilstein J. Nanotechnol. 2013, 4, 714–725.
725
License and TermsThis is an Open Access article under the terms of the
Creative Commons Attribution License
(http://creativecommons.org/licenses/by/2.0), which
permits unrestricted use, distribution, and reproduction in
any medium, provided the original work is properly cited.
The license is subject to the Beilstein Journal of
Nanotechnology terms and conditions:
(http://www.beilstein-journals.org/bjnano)
The definitive version of this article is the electronic one
which can be found at:
doi:10.3762/bjnano.4.81
Copyright © 2022 FDOKUMEN