Phase II Environmental Site Assessment Report - Maryland ...
Upload
khangminh22Category
view
1download
0
Modified Phase I and Phase II Environmental Site Assessment (ESA)
US97: J St. Intersection (Madras South Y) Sec. The Dalles-California Highway, M.P. 92.78 to M.P. 96.30
Madras, Jefferson County
Key#: 15409
August 1, 2012
Oregon Department of Transportation Region 4 Geo/Bridge/Env Unit 63034 O.B. Riley Rd.
Hazardous Materials Bend, Oregon 97702

This Page Intentionally Left Blank

Executive Summary
ODOT Region 4 HazMat (R4 HazMat) performed a modified Phase I and II Environmental Site Assessment (ESA) for Tax Lot 11.13.11DD Lot 6901 for the US97: J Street Intersection (Madras South Y) Sec project. The project site is located at 837 SW Hwy 97 and supports two structures, a commercial building and a shop building. This ESA has identified the following as potential risks to the project:
• Florescent lamps that may contain mercury vapor are located inside the commercial building and on the exterior of the shop building. The florescent lamp ballasts may contain polychlorinated biphenyls (PCBs). A neon sign that is located on the east side of the shop building may also contain PCBs.
• Old electrical panels and meters that may contain asbestos are located in the shop building.
• The paint on the exterior of the shop building is suspected to be lead-based paint. • Diesel- and residual-range organic hydrocarbon-contaminated soils are present
below the concrete floor of the shop building in an apparent former hydraulic lift pit. Contamination appears to extend from just below the concrete shop floor to 11 feet below ground surface. The estimated amount of contaminated soil is 10 tons.
Based on the findings of this ESA, R4 HazMat recommends the following:
• The ODOT Right-of-Way unit will address the florescent/HID lamps and ballasts, PCBs, asbestos, and lead-based paint issues as part of the building demolition contract.
• The landowner should have the contaminated soil removed from the former hydraulic lift pit prior to ODOT acquisition of the property.
• If the landowner decides to not remove the contaminated soil, ODOT should have the construction contractor remove the contaminated soils during construction. The appraised value of the property should be adjusted to cover the costs that ODOT will incur to remove the contaminated soils. The estimated cost for removal and disposal of the contaminated soils is $6,850.
• If the contaminated soil is removed during construction, special provisions will be required to address the excavation, handling, and disposal of the contaminated soil.
• Confirm the presence/absence of possible water well detected during the geophysical survey at the project site. If the presence of a water well is confirmed, the well should be abandoned in accordance with Oregon Water Resources Department regulations.
Modified Phase I and II Environmental Site Assessment i Tax Lot 11.13.11DD Lot 6901 US97: J Street Intersection (Madras South Y) Sec. Project Key #15409

This Page Intentionally Left Blank
Table of Contents
1 INTRODUCTION............................................................................................................................... 1 1.1 PROJECT SITE DESCRIPTION ......................................................................................................... 1 1.2 PHYSICAL SETTING ...................................................................................................................... 1
2 SITE INVESTIGATION.................................................................................................................... 2 2.1 PROJECT SITE OBSERVATIONS ..................................................................................................... 2 2.2 ADJACENT PROPERTIES................................................................................................................ 2 2.3 POTENTIAL SOURCES OF HAZARDOUS SUBSTANCES .................................................................... 3 2.4 INTERVIEWS ................................................................................................................................. 5
3 HISTORIC RECORDS...................................................................................................................... 5 3.1 PROJECT SITE OWNERSHIP ........................................................................................................... 5 3.2 ENVIRONMENTAL LIENS .............................................................................................................. 6 3.3 LOCAL GOVERNMENT RECORDS .................................................................................................. 6 3.4 OWNER / OPERATOR..................................................................................................................... 6 3.5 HISTORIC AERIAL PHOTOGRAPHS ................................................................................................ 7 3.6 SANBORN FIRE INSURANCE MAPS................................................................................................ 7 3.7 REVERSE DIRECTORIES ................................................................................................................ 8 3.8 HISTORIC SUMMARY.................................................................................................................... 8
4 ENVIRONMENTAL RECORDS...................................................................................................... 8 4.1 FEDERAL DATABASES .................................................................................................................. 9
4.1.1 National Priority List (NPL)................................................................................................... 9 4.1.2 Comprehensive Environmental Response, Compensation, and Liability Information System (CERCLIS) ............................................................................................................................................ 9 4.1.3 Resource Conservation and Recovery Act (RCRA) Generators ............................................. 9 4.1.4 RCRA Treatment Storage and Disposal Facilities (TSD)....................................................... 9 4.1.5 RCRA Corrective Action Sites (CORRACTS) ......................................................................... 9 4.1.6 National Response Center (NRC) ........................................................................................... 9
4.2 STATE DATABASES ...................................................................................................................... 9 4.2.1 Environmental Cleanup Site Information (ECSI) ................................................................... 9 4.2.2 Oregon State Fire Marshal (OSFM) Hazardous Materials Incidents .................................. 10 4.2.3 Solid Waste Landfills ............................................................................................................ 10 4.2.4 Leaking Underground Storage Tanks (LUSTs) .................................................................... 10 4.2.5 Underground Storage Tanks (USTs) .................................................................................... 12
5 ISA CHECKLIST ............................................................................................................................. 12
6 SUBSURFACE INVESTIGATIONS .............................................................................................. 12 6.1 GEOPHYSICS SURVEY................................................................................................................. 12 6.2 SOIL BORINGS ............................................................................................................................ 13 6.3 LABORATORY ANALYTICAL....................................................................................................... 13 6.4 RESULTS .................................................................................................................................... 13
6.4.1 Geology and Hydrogeology.................................................................................................. 13 6.4.2 Analytical Results ................................................................................................................. 14 6.4.3 DEQ Generic Risk-Based Concentrations (RBCs) ............................................................... 15
7 CONCLUSIONS ............................................................................................................................... 15
8 LIMITATIONS................................................................................................................................. 16
9 SIGNATURES OF ENVIRONMENTAL PROFESSIONALS..................................................... 17
Modified Phase I and II Environmental Site Assessment ii Tax Lot 11.13.11DD Lot 6901 US97: J Street Intersection (Madras South Y) Sec. Project Key #15409
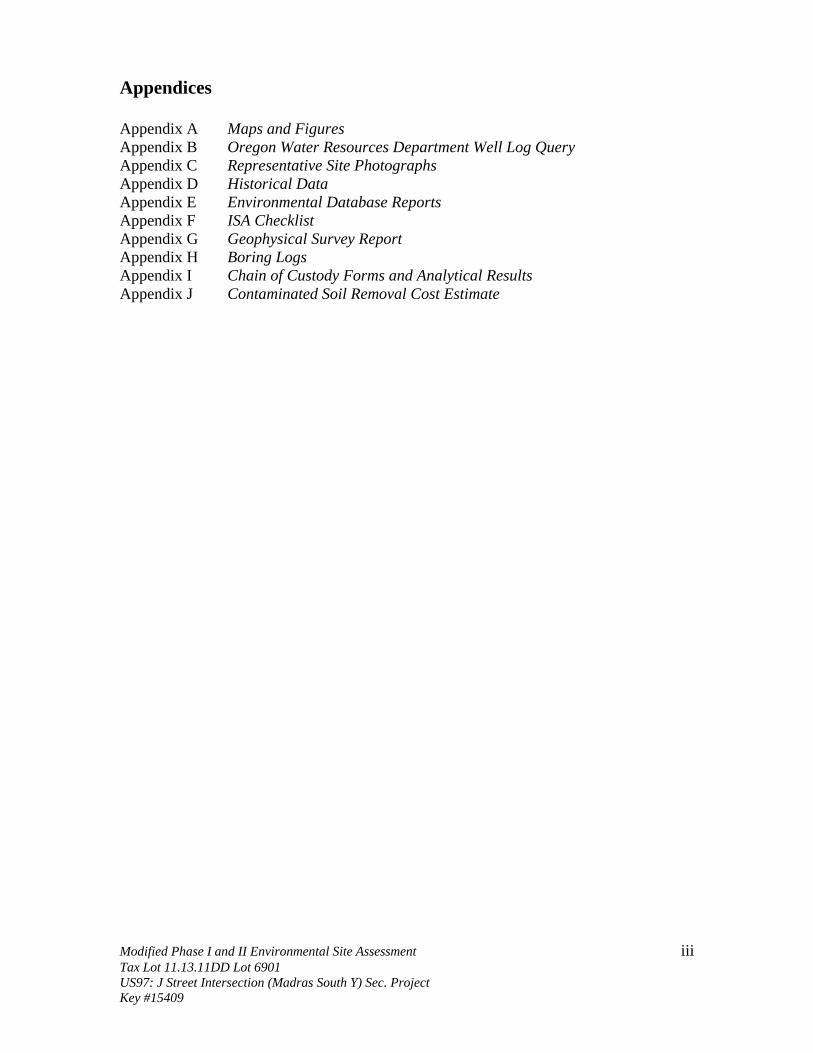
Appendices Appendix A Maps and Figures Appendix B Oregon Water Resources Department Well Log Query Appendix C Representative Site Photographs Appendix D Historical Data Appendix E Environmental Database Reports Appendix F ISA Checklist Appendix G Geophysical Survey Report Appendix H Boring Logs Appendix I Chain of Custody Forms and Analytical Results Appendix J Contaminated Soil Removal Cost Estimate
Modified Phase I and II Environmental Site Assessment iii Tax Lot 11.13.11DD Lot 6901 US97: J Street Intersection (Madras South Y) Sec. Project Key #15409

1 Introduction The Oregon Department of Transportation (ODOT) Region 4 HazMat unit (R4 HazMat) performed a modified Phase 1 and Phase II Environmental Site Assessment (ESA) for Tax Lot 11.13.11DD Lot 6901 for the following project:
US97: J Street Intersection (Madras South Y) Sec.
The Dalles-California Highway, M.P. 92.78 to M.P. 96.30 Madras, Jefferson County
Key #15409
This assessment is intended primarily as an approach to identifying potential sources of contamination that could impact the project site. Such impacts could affect worker safety, property value, and project costs. This assessment was performed according to generally accepted environmental procedures as outlined in the Hazardous Waste Guide for Project Development, by the American Association of State Highway and Transportation Officials (AASHTO) Special Committee on Environment, Archaeology and Historic Preservation and the American Society for Testing and Materials (ASTM) standard E 1527-00.
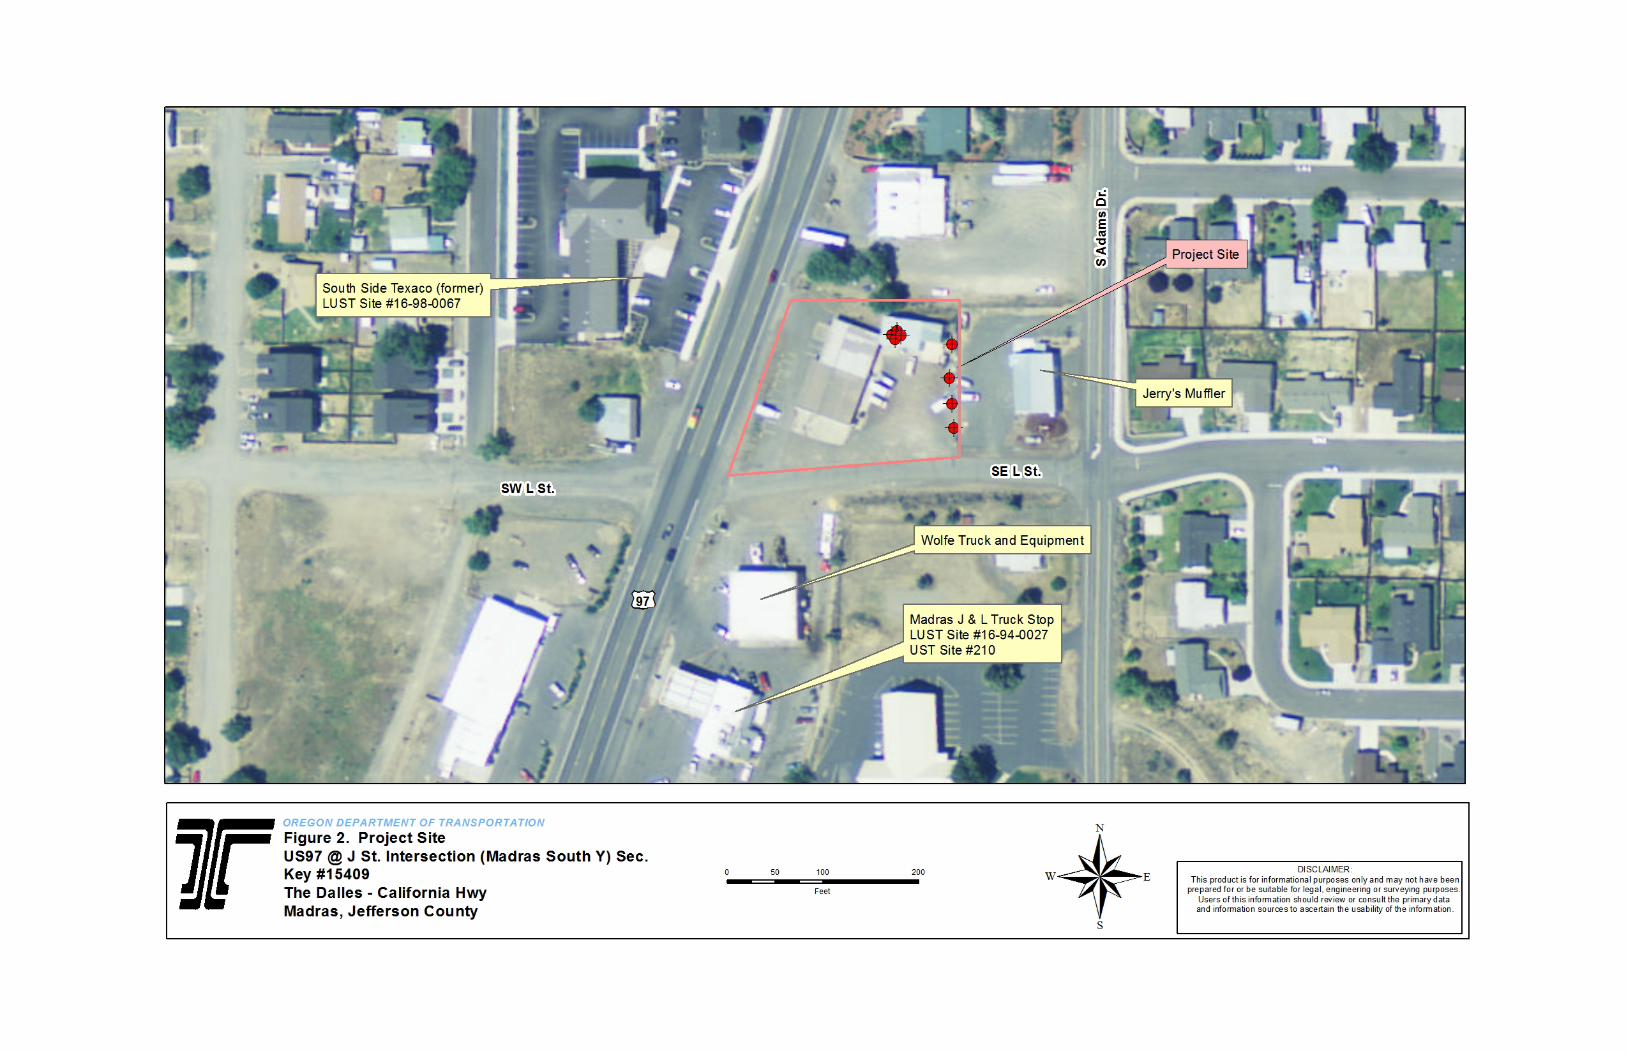
1.1 Project Site Description The project site is located at 837 SW Hwy 97 in Madras. The Assessor’s Map #11.13.11DD identifies the project site as Lot 6901. The project vicinity and site maps (Figures 1 and 2) and a copy of the Assessor’s Map are attached in Appendix A. Proposed activities at the project site include the following: • Purchase of Lot 6901 (project site) for new highway right-of-way (R/W). • Demolition of the two buildings located on the project site. • Construction of a new US97 (SW 5th St.) alignment through the project site. • Trench excavations along the new alignment to install storm sewer pipe and inlets.
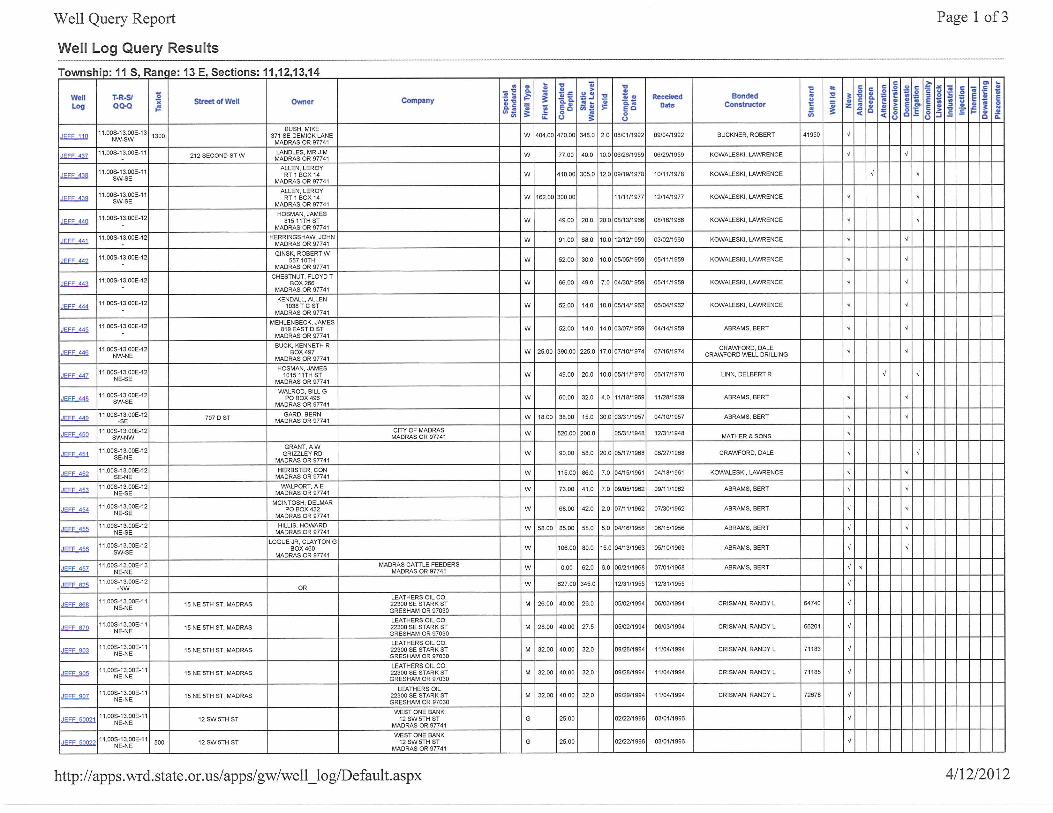
1.2 Physical Setting According to the Culver Quadrangle USGS Topographic Map, the project site is at an elevation of 2,320 feet above sea level and the land slopes gently down to the north-northwest. The closest surface water body to the project site is Willow Creek, an annual stream located one mile to the north. Based on the local topography and proximity of surface water bodies, groundwater at the project site likely flows to the north-northwest. However, local subsurface geologic and manmade features can affect groundwater flow; therefore, this groundwater flow interpretation is only an estimate based on surface observations R4 HazMat performed a query of Oregon Water Resources Department (OWRD) well logs in the Madras area to determine the depth of groundwater in the vicinity of the project site. A copy of the well log query is provided in Appendix B. Reported groundwater depths are typically 20 ft or more below ground surface (bgs). However, Modified Phase I and II Environmental Site Assessment 1 Tax Lot 11.13.11DD Lot 6901 US97: J Street Intersection (Madras South Y) Sec. Project Key #15409
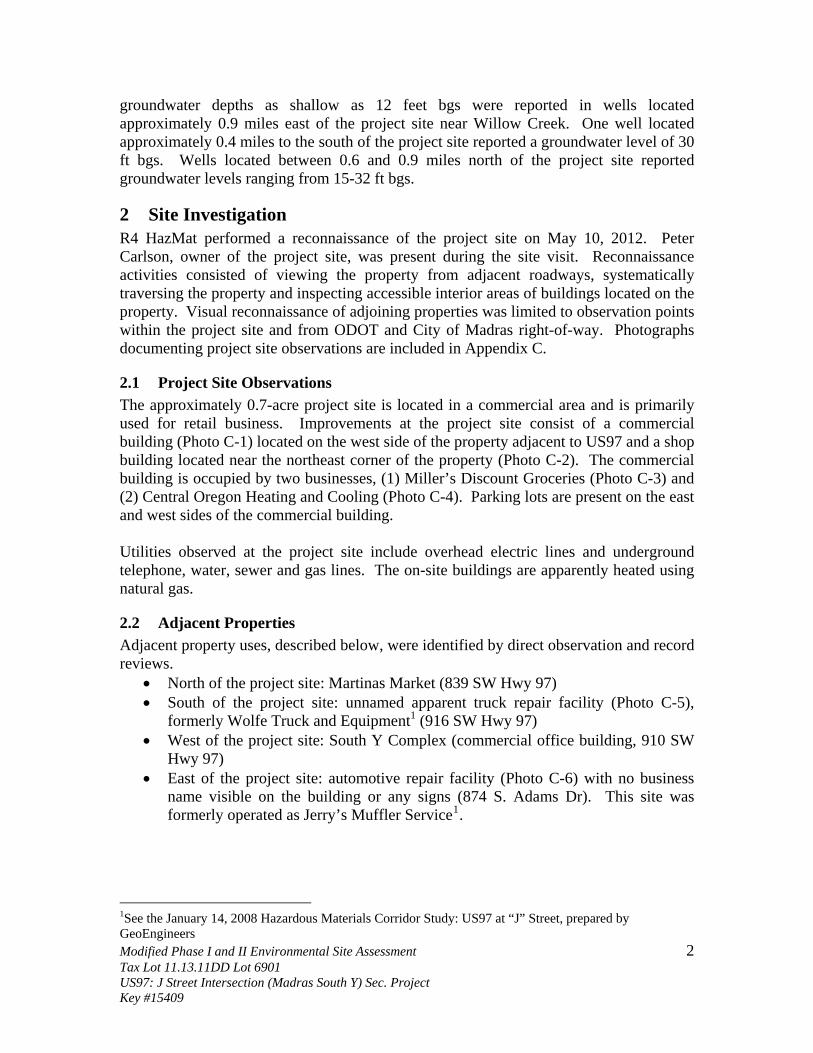
groundwater depths as shallow as 12 feet bgs were reported in wells located approximately 0.9 miles east of the project site near Willow Creek. One well located approximately 0.4 miles to the south of the project site reported a groundwater level of 30 ft bgs. Wells located between 0.6 and 0.9 miles north of the project site reported groundwater levels ranging from 15-32 ft bgs.
2 Site Investigation R4 HazMat performed a reconnaissance of the project site on May 10, 2012. Peter Carlson, owner of the project site, was present during the site visit. Reconnaissance activities consisted of viewing the property from adjacent roadways, systematically traversing the property and inspecting accessible interior areas of buildings located on the property. Visual reconnaissance of adjoining properties was limited to observation points within the project site and from ODOT and City of Madras right-of-way. Photographs documenting project site observations are included in Appendix C.
2.1 Project Site Observations The approximately 0.7-acre project site is located in a commercial area and is primarily used for retail business. Improvements at the project site consist of a commercial building (Photo C-1) located on the west side of the property adjacent to US97 and a shop building located near the northeast corner of the property (Photo C-2). The commercial building is occupied by two businesses, (1) Miller’s Discount Groceries (Photo C-3) and (2) Central Oregon Heating and Cooling (Photo C-4). Parking lots are present on the east and west sides of the commercial building. Utilities observed at the project site include overhead electric lines and underground telephone, water, sewer and gas lines. The on-site buildings are apparently heated using natural gas.
2.2 Adjacent Properties Adjacent property uses, described below, were identified by direct observation and record reviews.
• North of the project site: Martinas Market (839 SW Hwy 97) • South of the project site: unnamed apparent truck repair facility (Photo C-5),
formerly Wolfe Truck and Equipment1 (916 SW Hwy 97) • West of the project site: South Y Complex (commercial office building, 910 SW
Hwy 97) • East of the project site: automotive repair facility (Photo C-6) with no business
name visible on the building or any signs (874 S. Adams Dr). This site was formerly operated as Jerry’s Muffler Service1.
Modified Phase I and II Environmental Site Assessment 2
1See the January 14, 2008 Hazardous Materials Corridor Study: US97 at “J” Street, prepared by GeoEngineers
Tax Lot 11.13.11DD Lot 6901 US97: J Street Intersection (Madras South Y) Sec. Project Key #15409

2.3 Potential Sources of Hazardous Substances Table 1 summarizes potential sources of hazardous substances that were observed at and adjacent to the project site. Potential sources identified are discussed in detail below: Table 1. Potential sources of contamination that were identified during on-site reconnaissance.
Heating oil tanks None Observed
Aboveground Storage Tanks (ASTs) Yes USTs, fill and vent pipes, fuel dispensers Yes Other hazardous substance containers Yes Hazardous waste generation None Observed Oil water separators, dry wells or floor/storm drains None Observed Septic systems None Observed Stains or odors Yes Stressed vegetation Yes Solid waste Yes Suspect asbestos-containing materials Yes Suspect lead-based paint Yes Potential PCB-containing equipment Yes Florescent or high intensity discharge (HID) lamps Yes Treated timbers Yes Water wells or monitoring wells None Observed
Aboveground Storage Tanks An above-ground poly storage tank that apparently contained waste oil was observed on the former Jerry’s Muffler property located adjacent east of the project site (Photo C-7). The outside of the AST appeared to be stained with oil and a wood pallet under the AST also appeared to be oil-stained. Soil contamination beneath the AST is suspected based on the staining observed on the outside of the AST. This AST is not considered to pose a risk to the project because it is located 80 ft from the project site and the quantity of released oil appears to be small. Underground Storage Tanks, Pipes and Fuel Dispensers USTs were observed at the active Shell service station (Madras J and L Truck Stop) located 0.07 miles south of the project site (Photo C-8). This facility is discussed in Sections 4.2.4 and 4.2.5. Other Hazardous Substance Containers Hazardous substance containers designed for consumer end use were observed in the portion of the commercial building that is occupied by Central Oregon Heating and Cooling (Photos C-9 and C-10). Examples of hazardous substances observed included pipe thread sealant, vacuum pump oil, and coil cleaner. All of these substances were stored in their original containers on sturdy shelves. The storage area was clean and
Modified Phase I and II Environmental Site Assessment 3 Tax Lot 11.13.11DD Lot 6901 US97: J Street Intersection (Madras South Y) Sec. Project Key #15409

organized and no evidence of spills or leaks was observed. This site is not considered to pose a risk to the project. Septic Systems No septic systems were directly observed on the project site. However, Mr. Carlson indicated that a septic tank that was abandoned in place was present on the property (see Section 3.4). Stains or Odors Surface motor oil stains are suspected at the former Jerry’s Muffler facility where several vehicles are frequently parked along the west property line with the project site (Photo C-6). Due to wet soil conditions during the project site reconnaissance, oil stains were difficult to identify. Stressed Vegetation Stressed vegetation was observed at the former Jerry’s Muffler facility. Dead arborvitae trees were observed adjacent to the AST (Photo C-7) and along the east and west sides of this property. It is not known whether contaminants or lack of water caused the death of these trees. Solid Waste Solid waste was observed at the project site along the eastern property line (Photos C-11 to C-13). Most of this material was debris consisting of cardboard and plastic containers and other light materials that were apparently blown by wind into the property line fence. Miscellaneous automobile parts, tires, cardboard, and plastic materials were observed on the east side of the fence on the former Jerry’s Muffler property. Suspect Asbestos-Containing Materials Old electrical panels and meters were observed in the shop building that may contain asbestos (Photos C-14 to C-17). No other suspected asbestos-containing materials were observed. ODOT Region 4 Right of Way (R4 R/W) will have an asbestos survey performed on all structures prior to demolition of the buildings. Suspect Lead-Based Paint Peeling/damaged paint was observed on the exterior of the shop building (Photo C-18). Since this building was constructed prior to 1978, it is suspected that this paint contains lead. ODOT Region 4 Right-of-Way (R4 R/W) will have a lead-based paint survey conducted prior to demolition. Florescent or High Intensity Discharge Lamps Florescent lights were observed inside the shop building and in both businesses in the commercial building (Photos C-21 and C-22). One high intensity discharge (HID) lamp was observed on the outside of the shop building (Photo C-23) and another HID lamp was observed on the treated utility pole that is located near the northwest corner of the project site (Photo C-24).
Modified Phase I and II Environmental Site Assessment 4
Tax Lot 11.13.11DD Lot 6901 US97: J Street Intersection (Madras South Y) Sec. Project Key #15409

Florescent and HID lamps may contain mercury. R4 R/W will address the fluorescent and HID lamps associated with the buildings as part of the demolition contract. If the HID lamp on the treated utility pole requires removal or relocation, the owner of the HID lamp will need to be determined to address the removal or relocation. Potential PCB-Containing Equipment The florescent light ballasts that were observed in the commercial and shop buildings may contain polychlorinated biphenyls (PCBs). An apparent former hydraulic lift pit was observed in the west bay of the shop building (Photo C-19). The evidence for the hydraulic lift includes a square concrete patch measuring approximately three by three feet with a linear concrete patch measuring approximately six inches wide leading from the square patch to the west wall. Releases of hydraulic fluid that may contain PCBs were suspected to have occurred in the soils underneath the shop building (See Section 6.0). A neon sign that may have an internal transformer that contains PCBs was observed leaning up against the east side of the shop building (Photo C-20). Treated Timbers Creosote-treated timbers were observed at the former Jerry’s Muffler Service property located adjacent east of the project site (Photo C-25). These timbers were located adjacent to the property line and were apparently used as parking barriers. These timbers are not considered to pose a risk to the project because they are not located within the project site. Creosote-treated utility poles are present on and adjacent to the project site. If these poles require removal or relocation during construction, the utility company that is responsible for these poles will address the relocation or removal.
2.4 Interviews On July 16, 2012, R4 HazMat attempted to contact Gerald Barker and Wesley Hudson, former owners of the project site to learn more about past uses. A voice message was left for Gerald Barker and the phone number for Wesley Hudson was reported as “disconnected and no longer in service”. Mr. Barker had not returned the phone call as of the date of this report. The current owner of the project site, Peter Carlson, was present and interviewed during the site reconnaissance by R4 HazMat (see Section 3.4).
3 Historic Records
3.1 Project Site Ownership The ODOT Region 4 Right of Way unit obtained a chain of title for the project site from Amerititle. A summary of past ownership is presented in Table 2.
Modified Phase I and II Environmental Site Assessment 5 Tax Lot 11.13.11DD Lot 6901 US97: J Street Intersection (Madras South Y) Sec. Project Key #15409
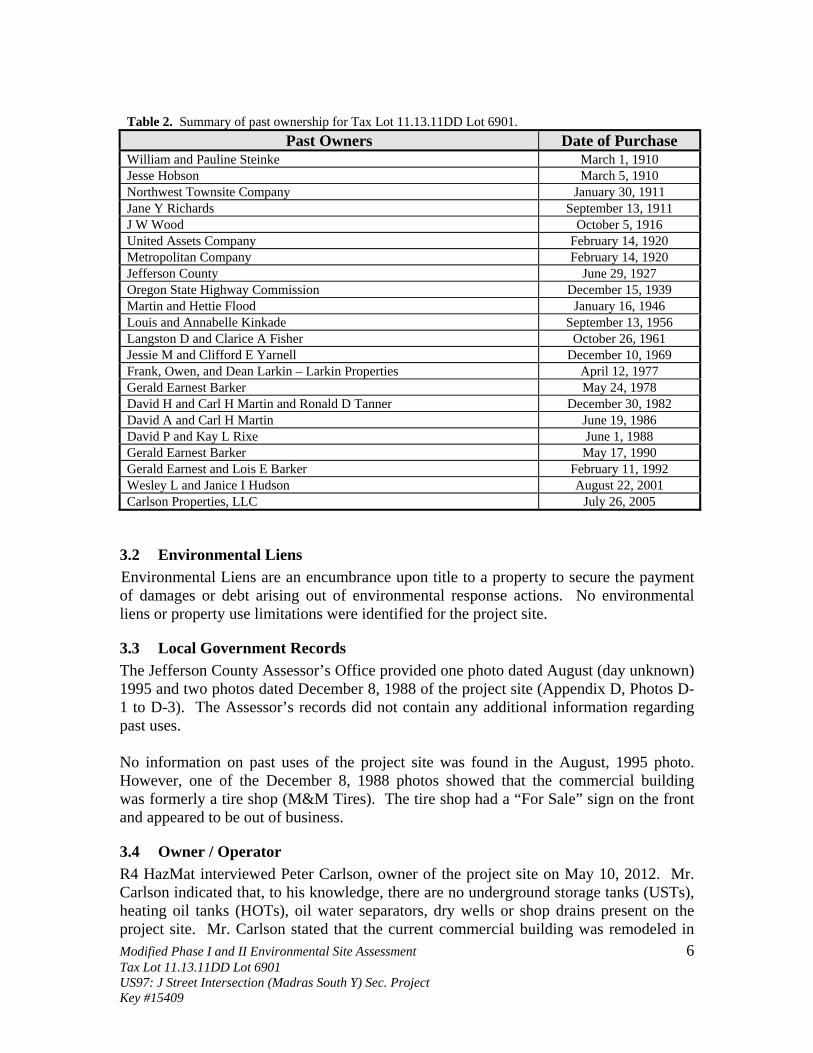
Table 2. Summary of past ownership for Tax Lot 11.13.11DD Lot 6901. Past Owners Date of Purchase
William and Pauline Steinke March 1, 1910 Jesse Hobson March 5, 1910 Northwest Townsite Company January 30, 1911 Jane Y Richards September 13, 1911 J W Wood October 5, 1916 United Assets Company February 14, 1920 Metropolitan Company February 14, 1920 Jefferson County June 29, 1927 Oregon State Highway Commission December 15, 1939 Martin and Hettie Flood January 16, 1946 Louis and Annabelle Kinkade September 13, 1956 Langston D and Clarice A Fisher October 26, 1961 Jessie M and Clifford E Yarnell December 10, 1969 Frank, Owen, and Dean Larkin – Larkin Properties April 12, 1977 Gerald Earnest Barker May 24, 1978 David H and Carl H Martin and Ronald D Tanner December 30, 1982 David A and Carl H Martin June 19, 1986 David P and Kay L Rixe June 1, 1988 Gerald Earnest Barker May 17, 1990 Gerald Earnest and Lois E Barker February 11, 1992 Wesley L and Janice I Hudson August 22, 2001 Carlson Properties, LLC July 26, 2005
3.2 Environmental Liens Environmental Liens are an encumbrance upon title to a property to secure the payment of damages or debt arising out of environmental response actions. No environmental liens or property use limitations were identified for the project site.
3.3 Local Government Records The Jefferson County Assessor’s Office provided one photo dated August (day unknown) 1995 and two photos dated December 8, 1988 of the project site (Appendix D, Photos D-1 to D-3). The Assessor’s records did not contain any additional information regarding past uses.
No information on past uses of the project site was found in the August, 1995 photo. However, one of the December 8, 1988 photos showed that the commercial building was formerly a tire shop (M&M Tires). The tire shop had a “For Sale” sign on the front and appeared to be out of business.
3.4 Owner / Operator R4 HazMat interviewed Peter Carlson, owner of the project site on May 10, 2012. Mr. Carlson indicated that, to his knowledge, there are no underground storage tanks (USTs), heating oil tanks (HOTs), oil water separators, dry wells or shop drains present on the project site. Mr. Carlson stated that the current commercial building was remodeled in Modified Phase I and II Environmental Site Assessment 6Tax Lot 11.13.11DD Lot 6901 US97: J Street Intersection (Madras South Y) Sec. Project Key #15409

the 1980s and that this building was a tire shop prior to remodeling. After the tire shop, the building was operated as Wes’ Floor Covering.
Mr. Carlson stated that an on-site septic tank was decommissioned in place and filled with inert materials in the middle 1990’s when the property was placed on the City of Madras sewer system.
3.5 Historic Aerial Photographs ODOT reviewed selected historic aerial photographs dated 1944, 1951, 1961, 1968, 1976, 1982, 1994, and 2005 that were obtained from the University of Oregon Map Library to clarify past land uses on the project site and adjacent properties. Land uses observed are described in Tables 2a and 2b and copies of the reviewed photographs are included in Appendix D.
Table 2a. Past land uses as determined by a review of historic aerial photographs from 1944 to 1968. Site # Address/Location 1944 1951 1961 1968
1 837 SW Hwy 97 (project site)
Vacant Vacant Commercial Building
Commercial and Shop Buildings
2 874 S Adams Dr. Vacant Vacant Vacant Vacant3 916 SW Hwy 97 Vacant Vacant Vacant Possible Truck
Repair 4 992 SW Hwy 97 Vacant Vacant Vacant Apparent
Service Station5 838 SW Hwy 97 Vacant Vacant Vacant Apparent
Service Station
Table 2b. Past land uses as determined by a review of historic aerial photographs from 1976 to 2005. Site # Address/Location 1976 1982 1994 2005
1 837 SW Hwy 97 (project site)
Commercial and Shop Buildings
Commercial and Shop Buildings
Commercial and Shop Buildings
Commercial and Shop Buildings
2 874 S Adams Dr. Vacant Vacant Apparent Automotive Repair
Apparent Automotive Repair
3 916 SW Hwy 97 Possible Truck Repair
Apparent Truck Repair
Apparent Truck Repair
Apparent Truck Repair
4 992 SW Hwy 97 Apparent Service Station
Service Station
Service Station Service Station
5 838 SW Hwy 97 Apparent Service Station
Apparent Service Station
Apparent Service Station
Apparent Service Station
3.6 Sanborn Fire Insurance Maps No Sanborn Fire Insurance Maps are available for the project site.
Modified Phase I and II Environmental Site Assessment 7Tax Lot 11.13.11DD Lot 6901 US97: J Street Intersection (Madras South Y) Sec. Project Key #15409
3.7 Reverse Directories R4 HazMat attempted to locate historical reverse directories at the Jefferson County Library on May 10, 2012 and found that no reverse directories are available.
3.8 Historic Summary Based on the reviewed historic records, the project site was first developed between 1951 and 1961. The commercial building was constructed between 1951 and 1961 and the shop building was added between 1961 and 1968. Modifications to the commercial building occurred between 1968 and 1976 and between 1976 and 1982. In 1988, the project site was operated as a tire shop. An apparent service station was constructed across US97 (west) from the project site between 1961 and 1968. This former service station is discussed in Section 4.2.4. A possible truck repair facility and apparent service station were constructed across SE L St. (south) from the project site between 1961 and 1968. The truck repair facility is discussed in Section 2.2 and the service station is discussed in Sections 4.2.4 and 4.2.5. An apparent automotive repair facility (former Jerry’s Muffler) was constructed adjacent east of the project site between 1982 and 1994. This facility is discussed in Sections 2.2 and 2.3.
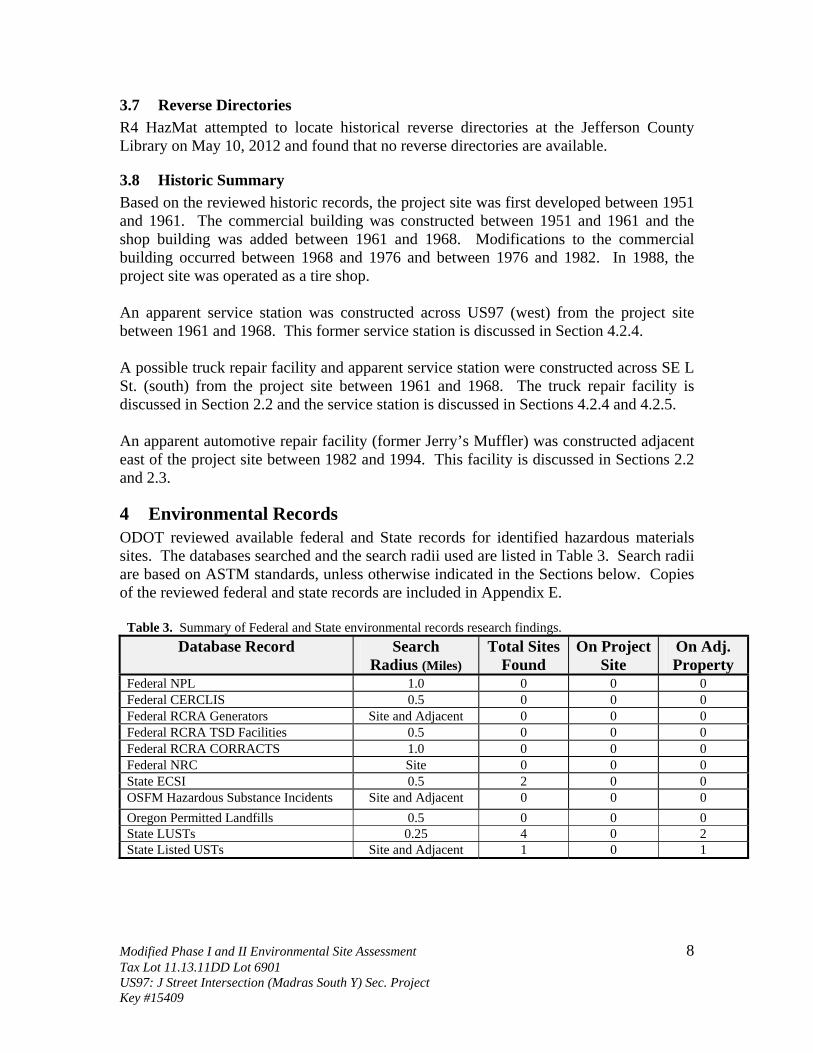
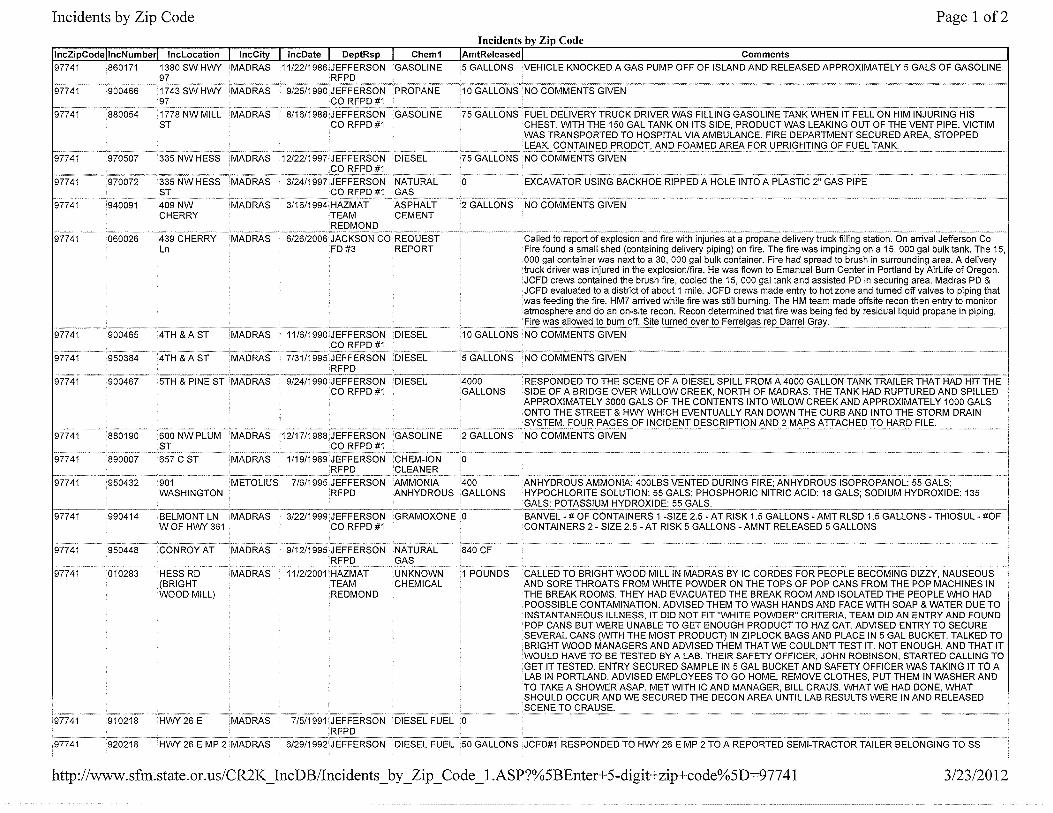
4 Environmental Records ODOT reviewed available federal and State records for identified hazardous materials sites. The databases searched and the search radii used are listed in Table 3. Search radii are based on ASTM standards, unless otherwise indicated in the Sections below. Copies of the reviewed federal and state records are included in Appendix E.
Table 3. Summary of Federal and State environmental records research findings. Database Record Search
Radius (Miles) Total Sites
Found On Project
Site On Adj. Property
Federal NPL 1.0 0 0 0 Federal CERCLIS 0.5 0 0 0 Federal RCRA Generators Site and Adjacent 0 0 0 Federal RCRA TSD Facilities 0.5 0 0 0 Federal RCRA CORRACTS 1.0 0 0 0 Federal NRC Site 0 0 0 State ECSI 0.5 2 0 0 OSFM Hazardous Substance Incidents Site and Adjacent 0 0 0 Oregon Permitted Landfills 0.5 0 0 0 State LUSTs 0.25 4 0 2 State Listed USTs Site and Adjacent 1 0 1
Modified Phase I and II Environmental Site Assessment 8 Tax Lot 11.13.11DD Lot 6901 US97: J Street Intersection (Madras South Y) Sec. Project Key #15409

4.1 Federal Databases
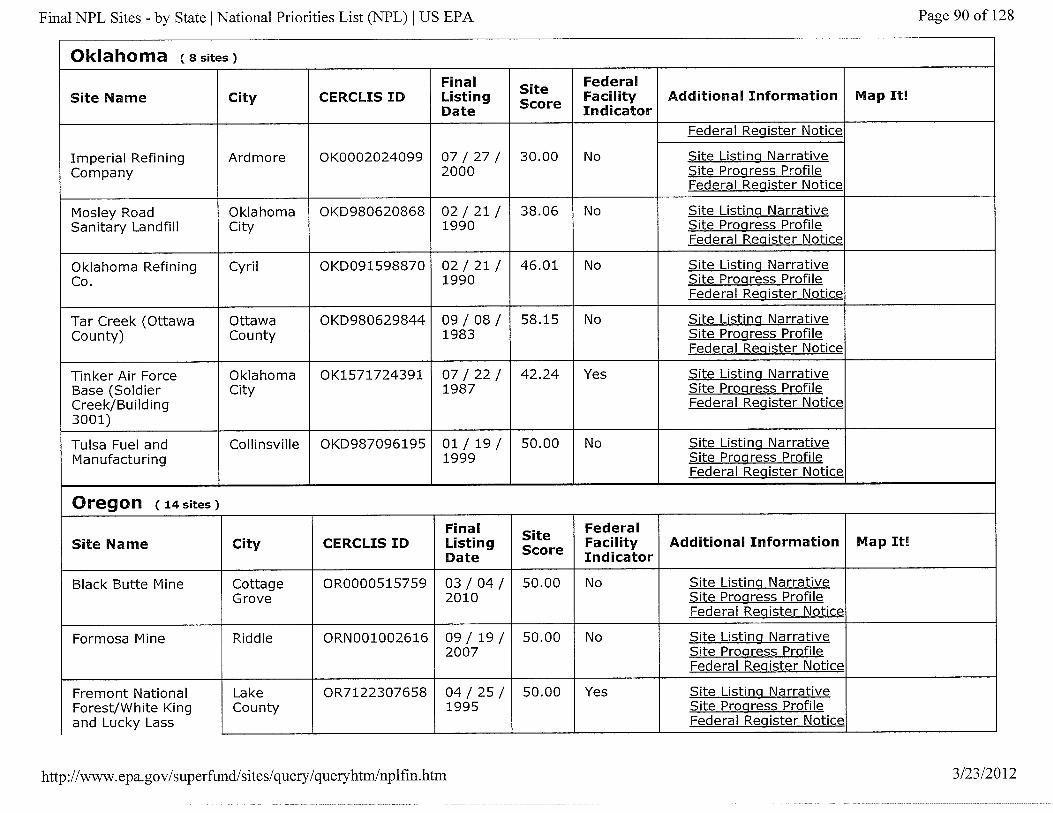
4.1.1 National Priority List (NPL) NPL sites (also known as Superfund sites) have been determined by the U. S. Environmental Protection Agency (EPA) to present long-term threats to public health and the environment. There are no NPL sites listed within one mile of the project site.
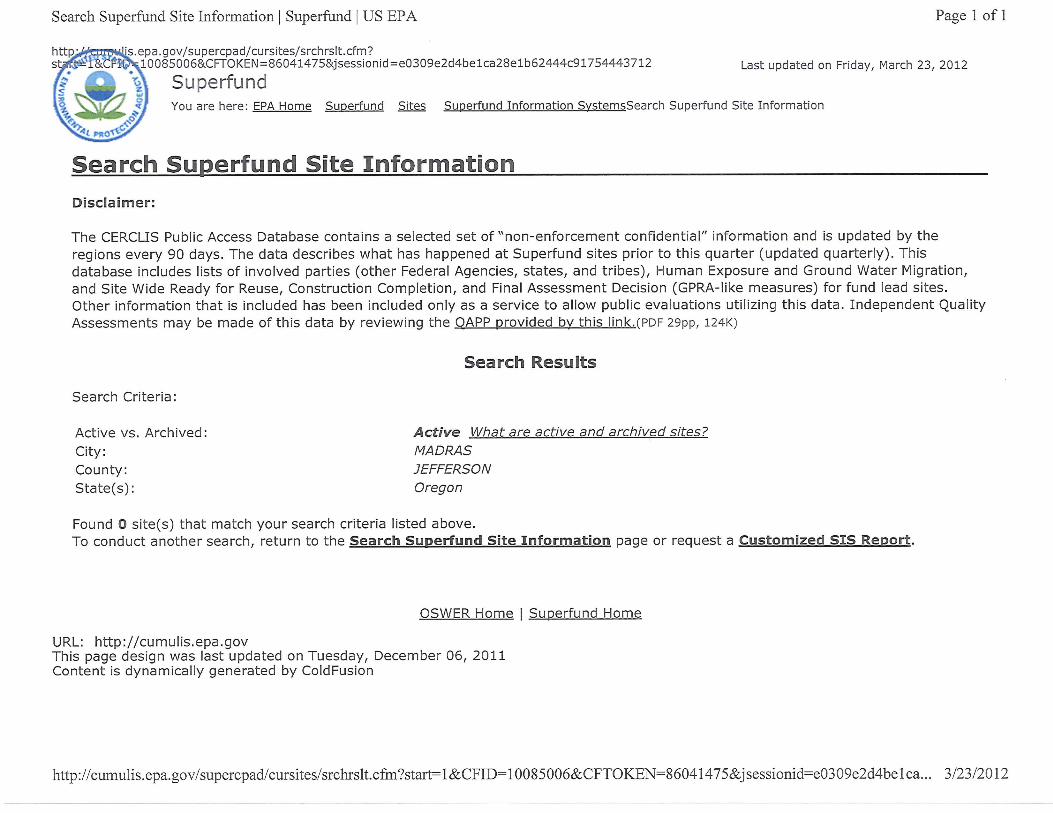
4.1.2 Comprehensive Environmental Response, Compensation, and Liability Information System (CERCLIS)
CERCLIS is the official repository for federally-listed sites not included in the NPL. There are no CERCLIS sites listed within 0.5 miles of the project site.
4.1.3 Resource Conservation and Recovery Act (RCRA) Generators RCRA generators are facilities that generate or store a defined amount of hazardous waste in any one calendar month and are subject to regulatory control. There are no RCRA generators listed within or adjacent to the project site.
4.1.4 RCRA Treatment Storage and Disposal Facilities (TSD) TSD facilities are RCRA permitted facilities that treat, store or dispose of hazardous waste and are not currently subject to Corrective Action under RCRA. No TSD facilities are listed within 0.5 miles of the project site.
4.1.5 RCRA Corrective Action Sites (CORRACTS) The RCRA CORRACTS list includes TSD facilities subject to corrective action under RCRA due to facility violations. There are no CORRACTS facilities listed within one mile of the project site.
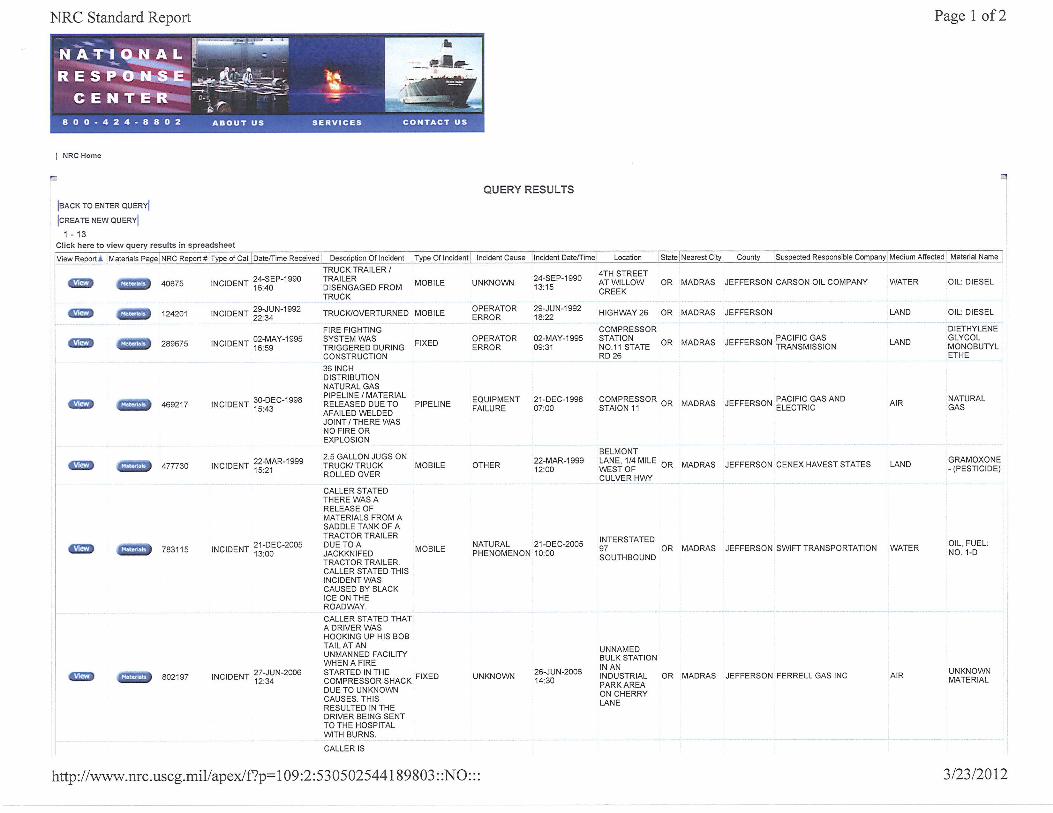
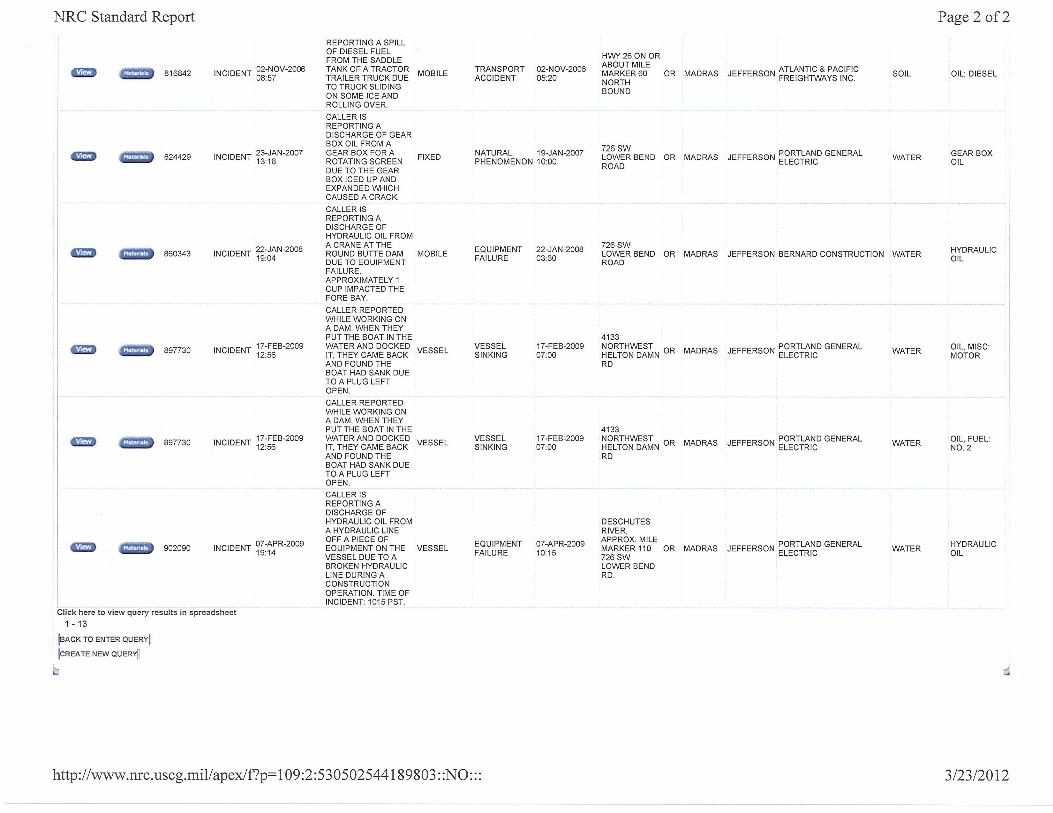
4.1.6 National Response Center (NRC) The NRC acts as a hazardous materials incident reporting center for the EPA and U.S. Coast Guard. No releases were found in the NRC database on or adjoining the project site.
4.2 State Databases
4.2.1 Environmental Cleanup Site Information (ECSI) The Oregon Department of Environmental Quality (DEQ) ECSI list includes sites on the Confirmed Release List (CRL) and the CRL Inventory. DEQ lists two ECSI sites within 0.5 miles of the project site as shown in Table 4.
Modified Phase I and II Environmental Site Assessment 9Tax Lot 11.13.11DD Lot 6901 US97: J Street Intersection (Madras South Y) Sec. Project Key #15409

Table 4. DEQ-listed ECSI sites within 0.5 miles of the project corridor.
Site Name and Location DEQ ID#
Distance (Miles)
Direction (N,S,W,E)
Regulatory Status
Madras Dry Cleaning and Laundry (former) 1036 SW Hwy 97
3171 0.16 SW Suspect Site Requiring Further Investigation
Les Schwab – Madras (former) 1412 SW Hwy 97
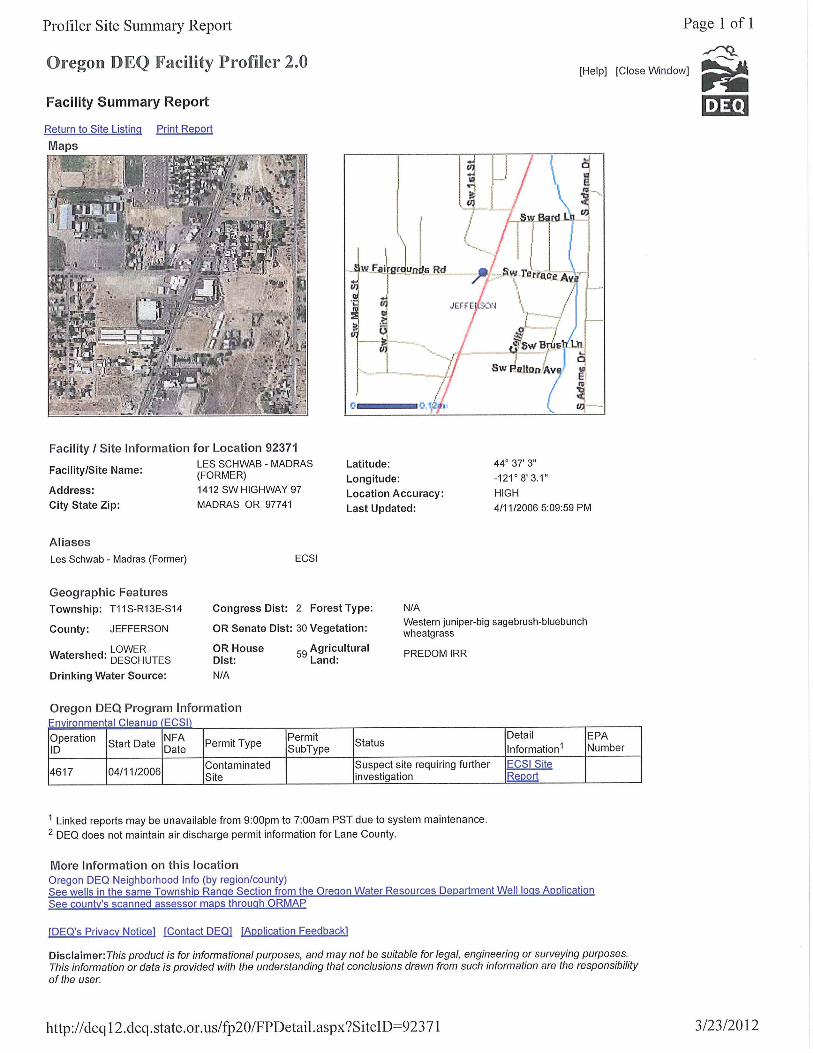
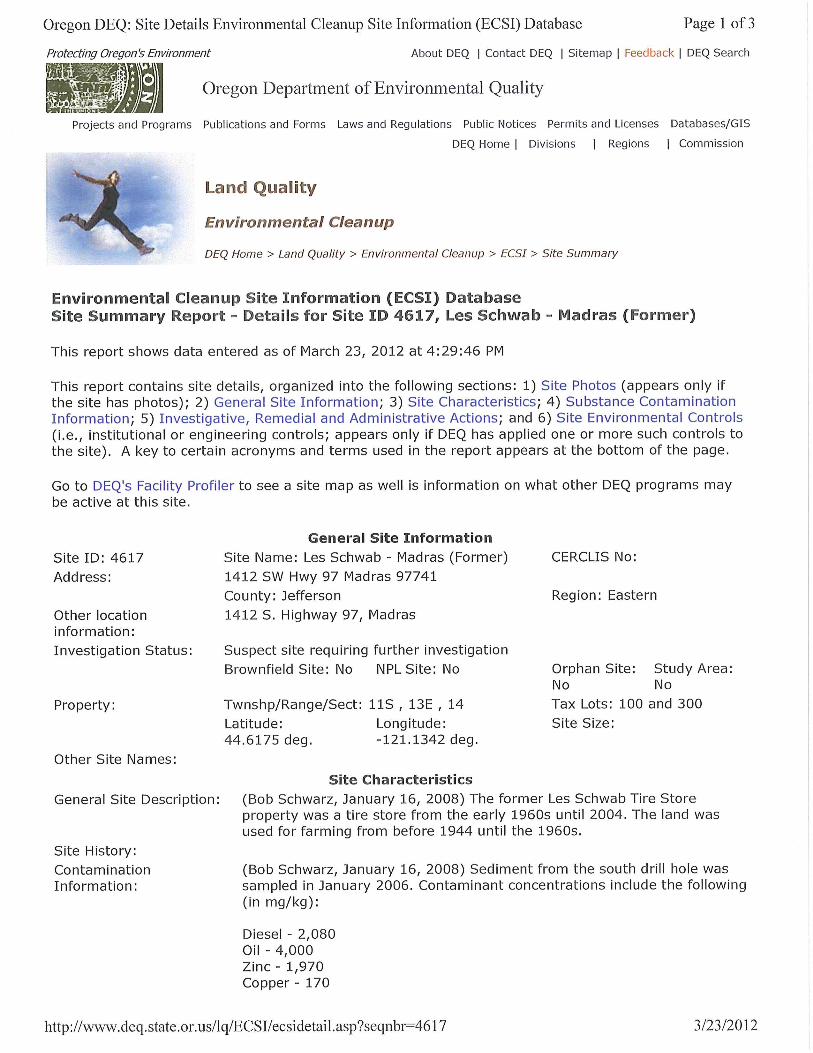
4617 0.4 SW Suspect Site Requiring Further Investigation
Madras Dry Cleaning and Laundry (former) According to the ECSI report, the Madras Dry Cleaning and Laundry facility was added to the ECSI database for tracking purposes as a former dry cleaner. This site may have a cleaning machine that uses perchloroethylene. No releases have been reported. This facility is unlikely to pose a risk to the project because it is located 0.16 miles (more than 800 ft) from the project site. Les Schwab – Madras (former) According to the ECSI report, the Les Schwab – Madras facility is contaminated with diesel, oil, zinc and copper. The contamination at this site is not considered to pose a risk to the project because it is located 0.4 miles from the project site.
4.2.2 Oregon State Fire Marshal (OSFM) Hazardous Materials Incidents There are no OSFM incidents listed within or adjacent to the project site.
4.2.3 Solid Waste Landfills There are no DEQ-permitted landfills listed within 0.5 miles of the project site.
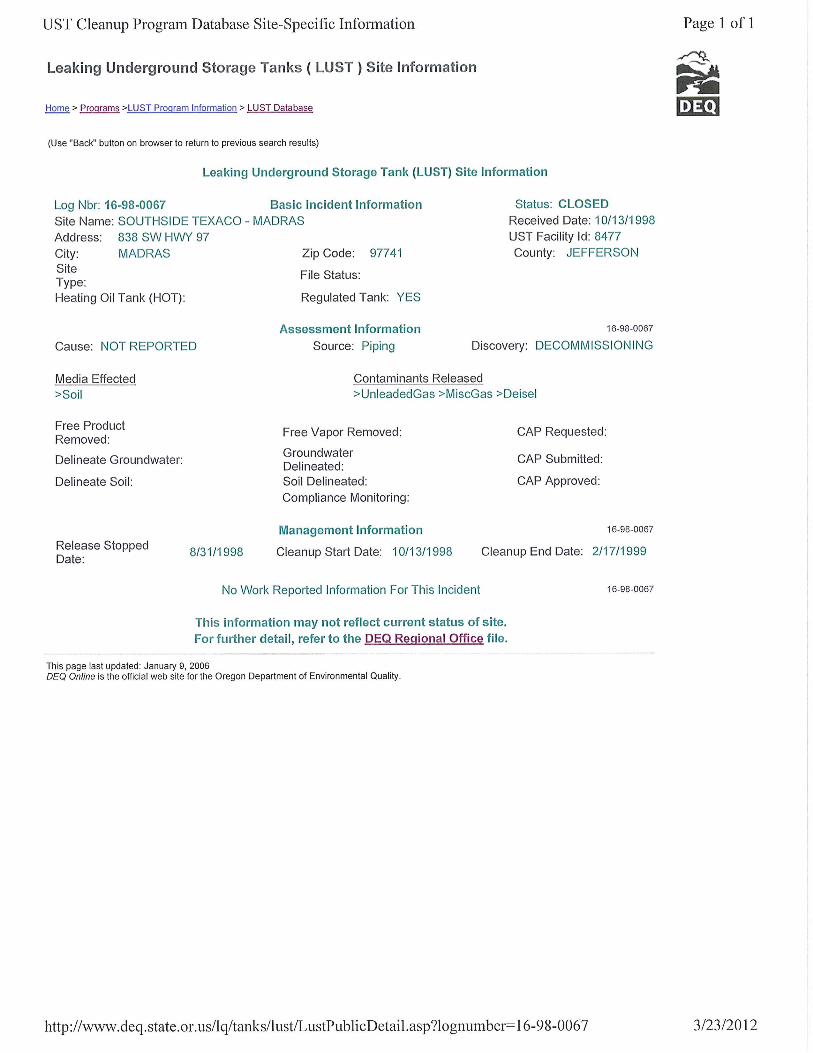
4.2.4 Leaking Underground Storage Tanks (LUSTs) DEQ maintains the list of LUST facilities, which includes known sites where leaks in buried tanks have been reported. DEQ lists four LUST sites within 0.25 miles of the project site as summarized in Table 5. Table 5. DEQ-listed LUST sites located within 0.25 miles of the project site.
Site Name and Location DEQ ID#
Distance (Miles)
Direction (N,S,W,E)
Regulatory Status
South Side Texaco 838 SW Hwy 97
16-98-0067
0.04 W Cleanup Completed
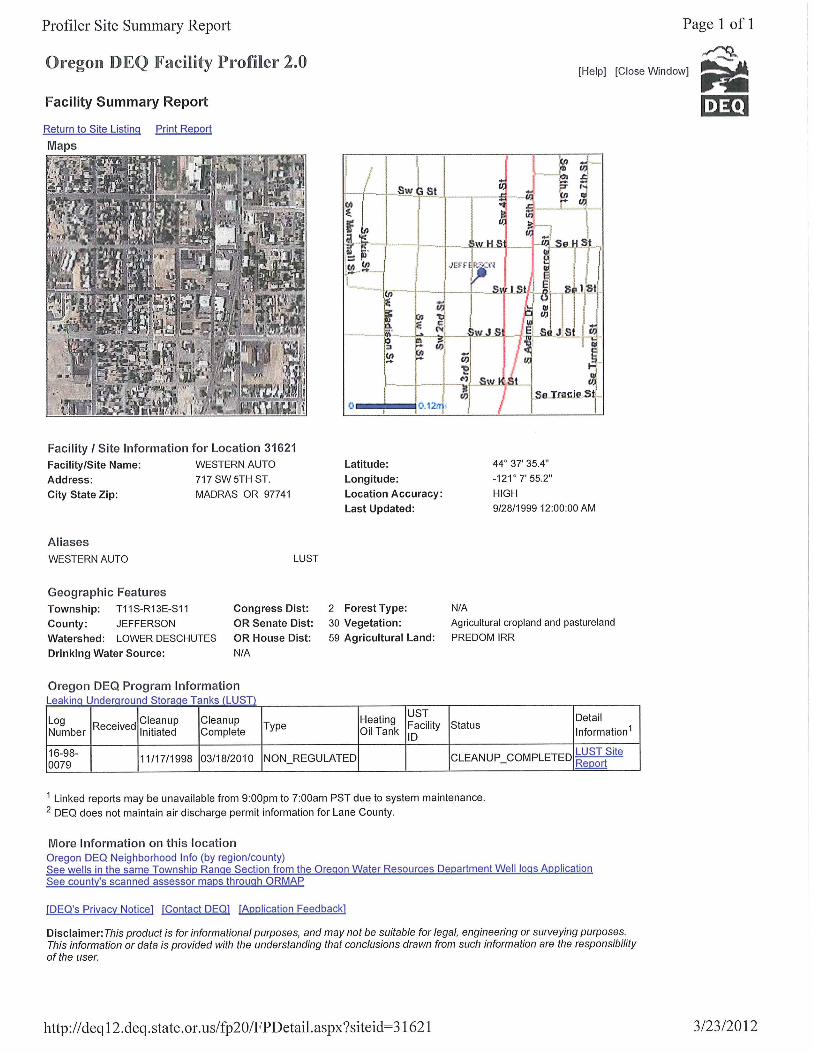
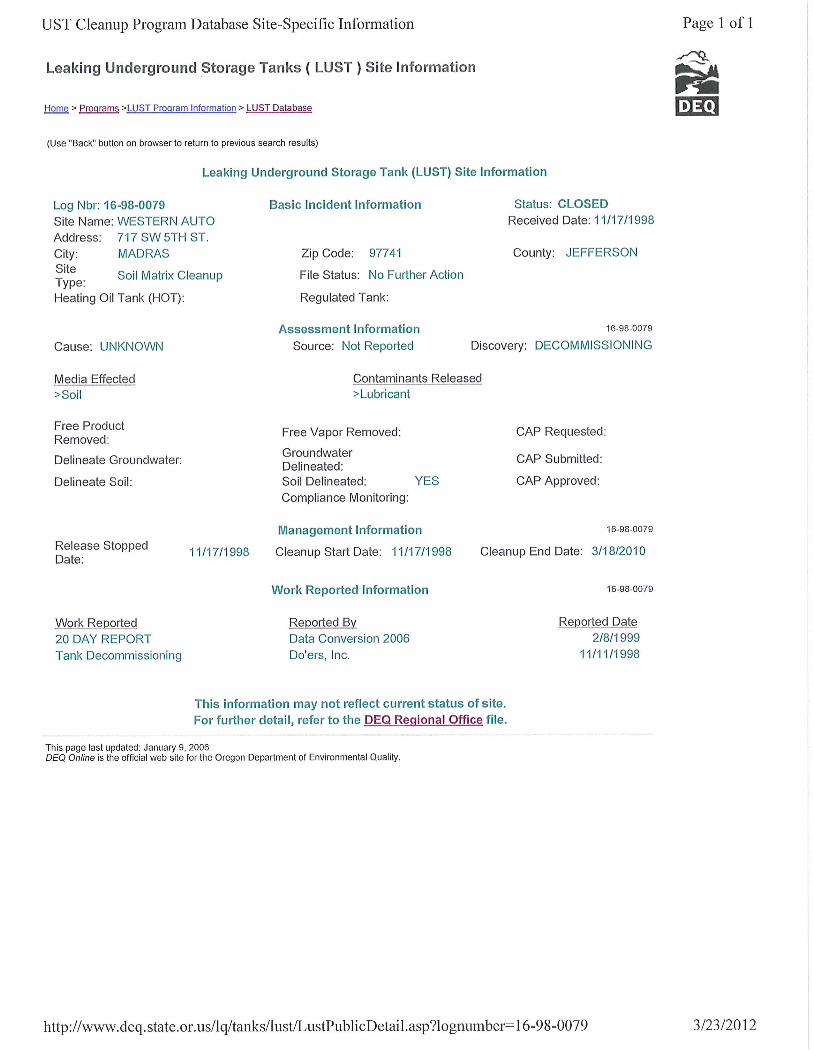
Western Auto 717 SW 5th St.
16-98-0079
0.21 N Cleanup Completed
Madras J & L Truck Stop 992 SW Hwy 97
16-94-0027
0.07 S Cleanup Completed
Bob’s Thrifty Gas 1099 SW Hwy 97
16-91-0071
0.17 S Cleanup Completed
Modified Phase I and II Environmental Site Assessment 10 Tax Lot 11.13.11DD Lot 6901 US97: J Street Intersection (Madras South Y) Sec. Project Key #15409
South Side Texaco According to the LUST report, gasoline and diesel contamination was discovered during UST decommissioning. Cleanup was initiated on October 13, 1998 and completed by February 17, 1999. The “Texaco” sign for this facility is visible in Photo D-3. According to the December 10, 1998 Site Closure report, 132.77 tons of contaminated soil was excavated and disposed of at Knott Landfill in Bend. Petroleum hydrocarbons were detected in two of the six soil confirmation samples that were collected from the UST excavation. Gasoline was detected in one soil sample at a concentration of 707 mg/kg and a combination of diesel and heavy oil was detected in another soil sample at a concentration of 405 mg/kg. The South Side Texaco facility is not considered to pose a risk to the project because it is located 0.04 miles (200 ft) cross-gradient from the project site. Western Auto According to the LUST report, lubricant contamination was discovered during UST decommissioning at the former Western Auto facility (Photo C-26). Cleanup was initiated on November 17, 1998 and was completed on March 18, 2010. According to the January 1, 1999 Site Closure Report, no observable contamination was present in the excavation after the USTs were removed. However, a laboratory analysis on one of the six analyzed confirmation soil samples detected heavy oil at 187 mg/kg. This concentration was below DEQ cleanup requirements so the UST excavation was backfilled. The Western Auto facility is not considered to pose a risk to the project because this facility is located 0.21 miles down-gradient of the project site. Madras J and L Truck Stop According to the LUST report, diesel contaminated soil was discovered during UST decommissioning at the Madras J and L Truck Stop (Photo C-8). Cleanup was initiated on June 23, 1994 and completed by May 11, 1995. According to the March 24, 1995 Underground Storage Tank Decommissioning Report prepared by Century West Engineering, diesel contamination as high as 570 mg/kg is present at a depth of two ft below ground surface adjacent to the US97 right-of-way. Residual petroleum contamination as high as 75 mg/kg is present in the former UST excavation located adjacent east of the restaurant/store. The Madras & L truck stop is not considered to pose a risk to the project because of the low concentrations of known residual contamination and because it is located approximately 350 feet from the project site.
Modified Phase I and II Environmental Site Assessment 11 Tax Lot 11.13.11DD Lot 6901 US97: J Street Intersection (Madras South Y) Sec. Project Key #15409

Bob’s Thrifty Gas According to the LUST report, gasoline-contaminated soil was discovered upon UST decommissioning. Cleanup was initiated on October 2, 1991 and completed by April 25, 1992. Any residual contamination that might be present is not considered to pose a risk to the project because this facility is located 0.17 miles (900 feet) from the project site.
4.2.5 Underground Storage Tanks (USTs) There is one DEQ-permitted UST facility located adjacent to the project site as shown in Table 6. DEQ-permitted USTs are required to have double-walled tanks, double-walled piping and leak detection systems. Therefore, the active USTs listed in Table 6 are considered to pose a low risk to the project.
Table 6. DEQ-registered UST facilities located adjacent to the project corridor.
Facility Name and Location DEQ ID#
Direction (N,S,W,E)
Tank Size, Content & Status
Madras J & L Truck Stop 992 SW Hwy 97 210 S
10,000 gallons, diesel 6,000 gallons, gasoline 12,000 gallons, gasoline 6,000 gallons, gasoline
5 ISA Checklist The AASHTO Initial Site Assessment Checklist is a record of the field inspection of present land uses, determining the potential for hazardous waste at a project site according to AASHTO guidelines. A copy of the ISA checklist for the project site is attached in Appendix F.
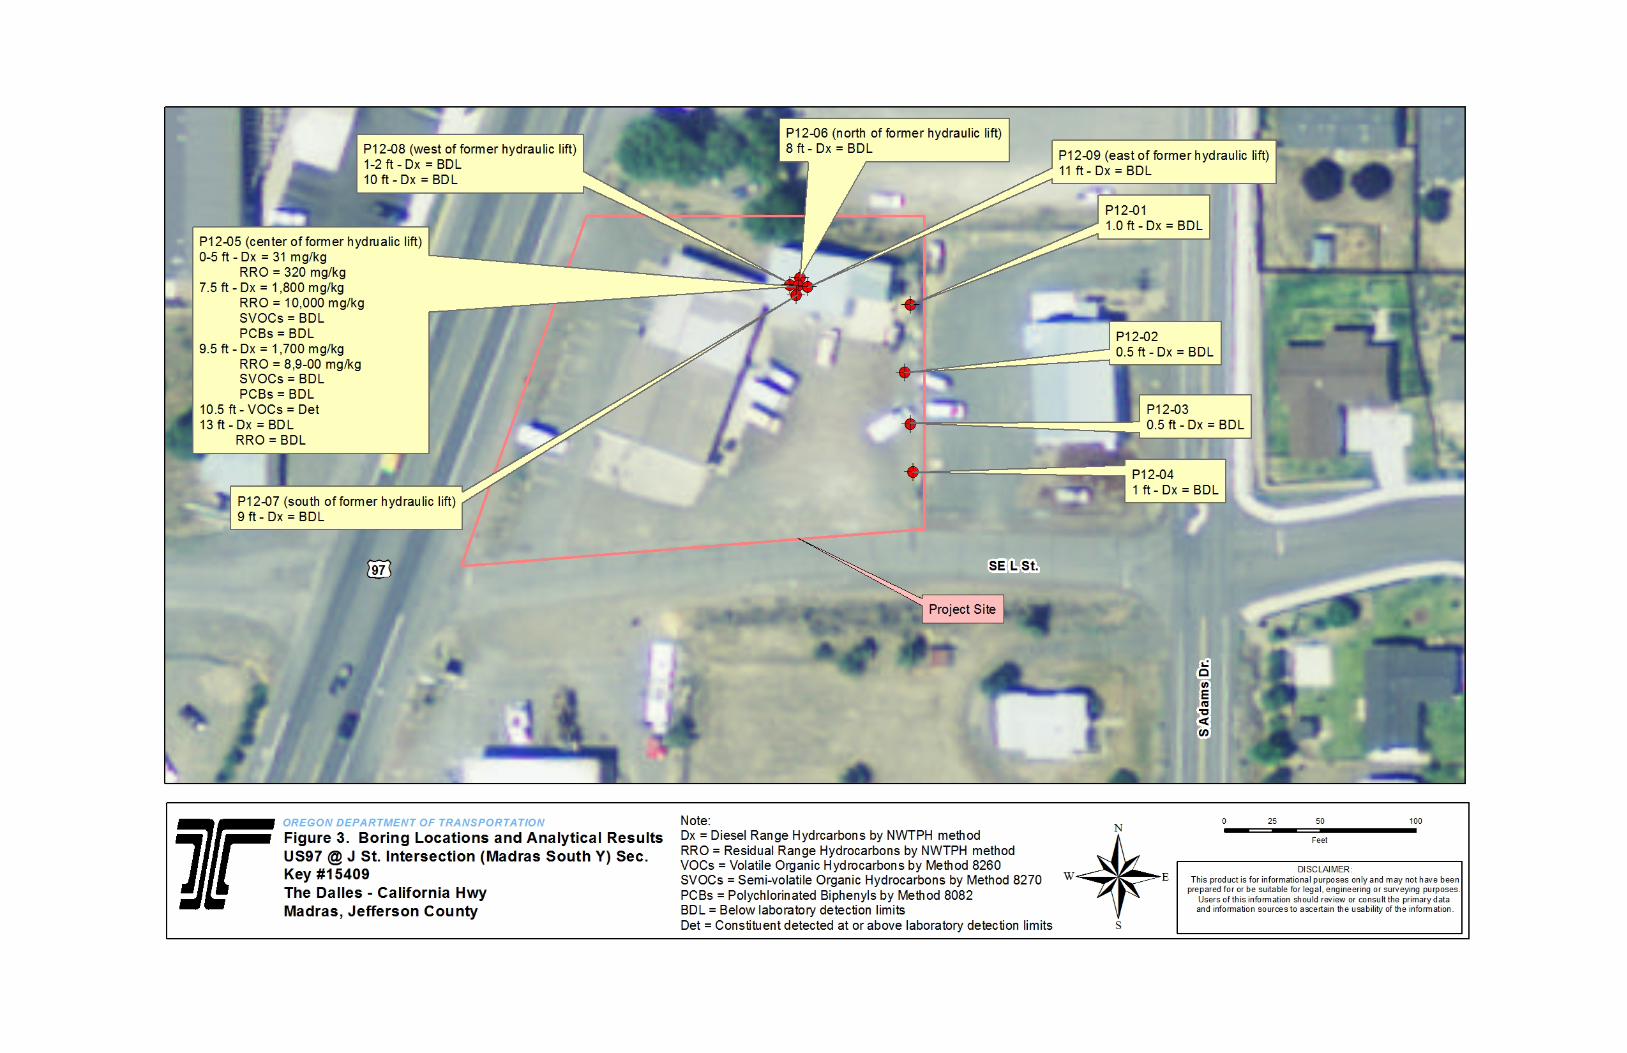
6 Subsurface Investigations Based on the Phase I activities described in Sections 1-5, R4 HazMat recommended Phase II subsurface sampling within the project site to determine the presence/absence of contamination at the following locations:
• Along the eastern property line where contamination that may have migrated off-site from the adjacent former Jerry’s Muffler Service facility.
• Below the apparent former hydraulic lift pit that is located in the project site shopbuilding where releases of hydraulic fluid may have occurred.
6.1 Geophysics Survey GeoPotential out of Brightwood, Oregon conducted a geophysical survey at the project site on June 15, 2012 using a magnetometer, ground-penetrating radar, and other instrumentation (Photos C-27 and C-28). The purpose of the survey was to clear proposed boreholes for utilities and to locate potential unknown underground features such as USTs. A copy of the geophysical survey report is provided in Appendix G.
Modified Phase I and II Environmental Site Assessment 12Tax Lot 11.13.11DD Lot 6901 US97: J Street Intersection (Madras South Y) Sec. Project Key #15409

No anomalies characteristic of USTs were found. The survey data suggests that the concrete pad located in front of the east shop garage door and the concrete floor in the shop are reinforced with rebar. A probable well was identified in the northeast corner of the project site.
6.2 Soil Borings BB&A Environmental out of Coburg, Oregon, advanced nine borings at the project site with a push probe sampling system on June 25, 2012 (Figure 3, Photos C-29 and C-30). Four borings were advanced along the east property line of the project site and five borings were advanced inside the shop building in and adjacent to the former hydraulic lift pit and service line. Soil samples were collected in five-foot long disposable plastic liners. R4 HazMat screened the soil samples for contamination by observing for staining, odor, and elevated photo-ionization detector (PID) readings. Soil samples were selected for lab analysis based on field screening and geologic indicators of where contamination may accumulate such as the soil/bedrock interface. R4 HazMat also logged the recovered soils using the Unified Soil Classification System (USCS). The selected soil samples were placed in laboratory-prepared containers, labeled, placed in a cooler with ice, and shipped under chain-of-custody protocol to Environmental Sciences Corporation (ESC) for laboratory analysis. Appendix H contains the boring logs, including geologic descriptions and screening results. Figure 3 shows the boring locations.
6.3 Laboratory Analytical On June 26, 2012, R4 HazMat submitted 16 soil samples from the push probe borings to ESC. All except two of the samples were analyzed for one or more of the following:
• Diesel Range Hydrocarbon Identification by NWTPH-Dx (Dx analysis includes residual-range organic hydrocarbons (RRO)).
• Volatile Organic Compounds (VOCs) by EPA Method 8260B • Semi-Volatile Organic Compounds (SVOCs) by EPA Method 8270 • Polychlorinated Biphenyls (PCBs) by EPA Method 8082
The two samples that were not analyzed were held by the laboratory pending the analytical results of the other samples. Based on the analytical results (Section 6.4.2), the held samples were not analyzed.
6.4 Results
6.4.1 Geology and Hydrogeology Based on samples recovered from the borings, the site geology is characterized by a silty sand soil overlying a moderately welded volcanic tuff. The soil thickness was found to be between 0.5 and two feet thick. The bottom of the welded tuff was not encountered in
Modified Phase I and II Environmental Site Assessment 13 Tax Lot 11.13.11DD Lot 6901 US97: J Street Intersection (Madras South Y) Sec. Project Key #15409
any of the borings so this unit extends to a depth of at least 13 ft bgs based on the depth of the deepest boring. The boring through the center of the apparent former hydraulic lift pit encountered fill (silty SAND with Gravel) to a depth of eight feet bgs.
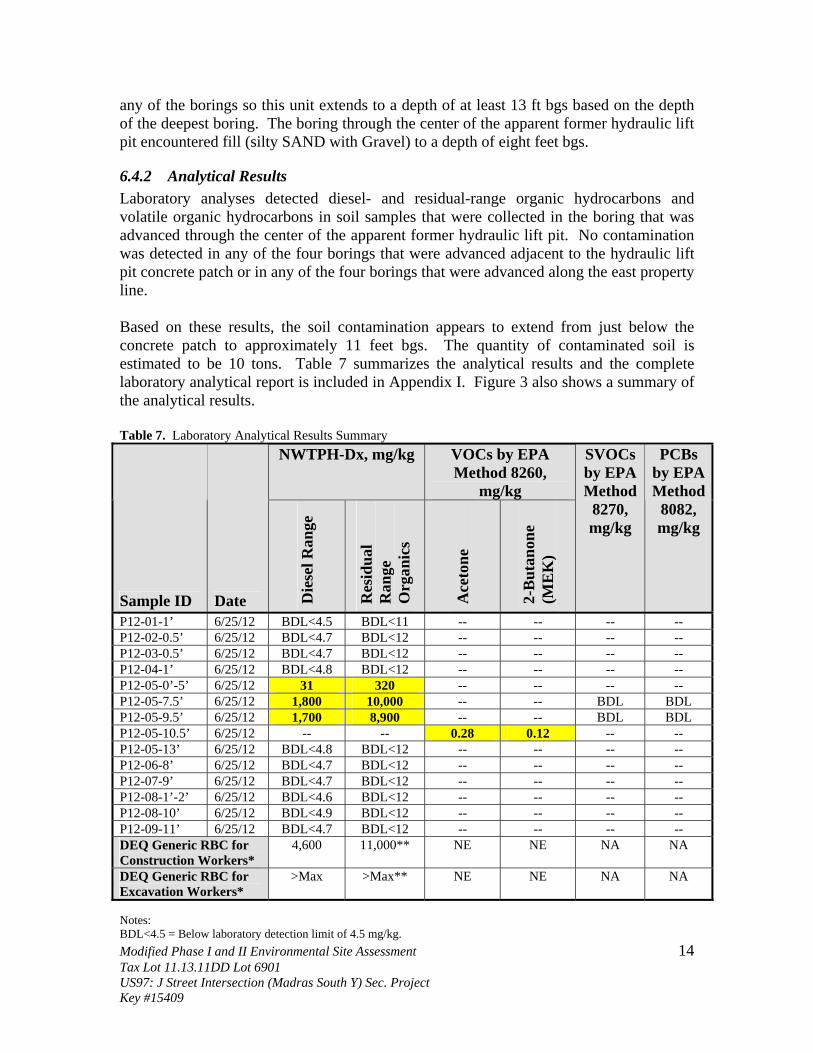
6.4.2 Analytical Results Laboratory analyses detected diesel- and residual-range organic hydrocarbons and volatile organic hydrocarbons in soil samples that were collected in the boring that was advanced through the center of the apparent former hydraulic lift pit. No contamination was detected in any of the four borings that were advanced adjacent to the hydraulic lift pit concrete patch or in any of the four borings that were advanced along the east property line. Based on these results, the soil contamination appears to extend from just below the concrete patch to approximately 11 feet bgs. The quantity of contaminated soil is estimated to be 10 tons. Table 7 summarizes the analytical results and the complete laboratory analytical report is included in Appendix I. Figure 3 also shows a summary of the analytical results. Table 7. Laboratory Analytical Results Summary
NWTPH-Dx, mg/kg VOCs by EPA Method 8260,
mg/kg
Sample ID Date Die
sel R
ange
Res
idua
l R
ange
O
rgan
ics
Ace
tone
2-B
utan
one
(ME
K)
SVOCs by EPA Method
8270, mg/kg
PCBs by EPA Method
8082, mg/kg
P12-01-1’ 6/25/12 BDL<4.5 BDL<11 -- -- -- -- P12-02-0.5’ 6/25/12 BDL<4.7 BDL<12 -- -- -- -- P12-03-0.5’ 6/25/12 BDL<4.7 BDL<12 -- -- -- -- P12-04-1’ 6/25/12 BDL<4.8 BDL<12 -- -- -- -- P12-05-0’-5’ 6/25/12 31 320 -- -- -- -- P12-05-7.5’ 6/25/12 1,800 10,000 -- -- BDL BDL P12-05-9.5’ 6/25/12 1,700 8,900 -- -- BDL BDL P12-05-10.5’ 6/25/12 -- -- 0.28 0.12 -- -- P12-05-13’ 6/25/12 BDL<4.8 BDL<12 -- -- -- -- P12-06-8’ 6/25/12 BDL<4.7 BDL<12 -- -- -- -- P12-07-9’ 6/25/12 BDL<4.7 BDL<12 -- -- -- -- P12-08-1’-2’ 6/25/12 BDL<4.6 BDL<12 -- -- -- -- P12-08-10’ 6/25/12 BDL<4.9 BDL<12 -- -- -- -- P12-09-11’ 6/25/12 BDL<4.7 BDL<12 -- -- -- -- DEQ Generic RBC for Construction Workers*
4,600 11,000** NE NE NA NA
DEQ Generic RBC for Excavation Workers*
>Max >Max** NE NE NA NA
Notes:
Modified Phase I and II Environmental Site Assessment 14 BDL<4.5 = Below laboratory detection limit of 4.5 mg/kg.
Tax Lot 11.13.11DD Lot 6901 US97: J Street Intersection (Madras South Y) Sec. Project Key #15409

-- = Sample not analyzed for that constituent. Yellow highlighted cells indicated detection of the constituent analyzed. Only VOC compounds that were detected at or above laboratory detection limits in one or more samples are listed in the table. *These RBCs are for soil ingestion, dermal contact and inhalation exposure pathways. **This RBC is for Generic Mineral/Insulating oil. This is the closest substance to residual range organics that has an established RBC. NE = DEQ RBC not established for that constituent. NA = DEQ RBC not applicable because these constituents were not detected at or above the laboratory detection limits in any analyzed sample. >Max = The constituent RBC for this pathway is calculated as greater than 1,000,000 mg/kg or 1,000,000 mg/L. Therefore, this substance is deemed not to pose risks in this scenario.
6.4.3 DEQ Generic Risk-Based Concentrations (RBCs) The proposed construction activities include the demolition and removal of the shop building and excavation of the underlying soils. Therefore, soil ingestion, dermal contact and inhalation are recognized exposure pathways and the receptors are construction and excavation workers. As shown in Table 7, none of the detected constituents exceeded any generic RBCs.
7 Conclusions ODOT Region 4 HazMat (R4 HazMat) performed a modified Phase I and II Environmental Site Assessment (ESA) for Tax Lot 11.13.11DD Lot 6901 for the US97: J Street Intersection (Madras South Y) Sec project. The project site is located at 837 SW Hwy 97 and supports two structures, a commercial building and a shop building. This ESA has identified the following as potential risks to the project:
• Florescent lamps that may contain mercury vapor are located inside the commercial building and on the exterior of the shop building. The florescent lamp ballasts may contain polychlorinated biphenyls (PCBs). A neon sign that is located on the east side of the shop building may also contain PCBs.
• Old electrical panels and meters that may contain asbestos are located in the shop building.
• The paint on the exterior of the shop building is suspected to be lead-based paint. • Diesel- and residual-range organic hydrocarbon-contaminated soils are present
below the concrete floor of the shop building in an apparent former hydraulic lift pit. Contamination appears to extend from just below the concrete shop floor to 11 feet below ground surface. The estimated amount of contaminated soil is 10 tons.
Based on the findings of this ESA, R4 HazMat recommends the following:
• The ODOT Right-of-Way unit will address the florescent/HID lamps and ballasts, PCBs, asbestos, and lead-based paint issues as part of the building demolition contract.
• The landowner should have the contaminated soil removed from the former hydraulic lift pit prior to ODOT acquisition of the property.
• If the landowner decides to not remove the contaminated soil, ODOT should have the construction contractor remove the contaminated soils during construction. The appraised value of the property should be adjusted to cover the costs that
Modified Phase I and II Environmental Site Assessment 15 Tax Lot 11.13.11DD Lot 6901 US97: J Street Intersection (Madras South Y) Sec. Project Key #15409

ODOT will incur to remove the contaminated soils. The estimated cost for removal and disposal of the contaminated soils is $6,850.
• If the contaminated soil is removed during construction, special provisions will be required to address the excavation, handling, and disposal of the contaminated soil.
• Confirm the presence/absence of possible water well detected during the geophysical survey at the project site. If the presence of a water well is confirmed, the well should be abandoned in accordance with Oregon Water Resources Department regulations.
8 Limitations This assessment was conducted according to AASHTO criteria and does not represent a standard American Society for Testing and Materials (ASTM) Phase I and II. It is for internal use only and may not be relied upon by any other entity without written permission from an authorized ODOT representative. This report is presented as current at the time of publication; it does not warranty against changes in land use or environmental conditions subsequent to its publication. Performance of this assessment is intended to reduce but not eliminate uncertainty regarding the existence of environmental conditions. The AASHTO practice is intended primarily as an approach to identifying potential sources of contamination that could impact a project. Based on the AASHTO guide, this assessment constitutes appropriate inquiry into current and past uses of properties within the project corridor and is consistent with good commercial or customary practice. However, no environmental assessment can wholly eliminate uncertainty regarding the potential for environmental conditions in connection with a project.
Modified Phase I and II Environmental Site Assessment 16 Tax Lot 11.13.11DD Lot 6901 US97: J Street Intersection (Madras South Y) Sec. Project Key #15409
9 Signatures of Environmental Professionals Report preparation conducted by Ryan Franklin, R.G. _____________________________________ ____________ Signature Date Technical review conducted by Curtis Ehlers, C.E.G. _____________________________________ ____________ Signature Date Corporate review conducted by Randall K. Davis, C.E.G. _____________________________________ ____________ Signature Date Oregon Registered Geologist Stamp
Modified Phase I and II Environmental Site Assessment 17 Tax Lot 11.13.11DD Lot 6901 US97: J Street Intersection (Madras South Y) Sec. Project Key #15409

This Page Intentionally Left Blank

Appendix A
Maps and Figures

This Page Intentionally Left Blank
I.R.
FD. 70 (70.06)
10' TO CO. 49-23 49-2649-25 49-29
FD. S
TONE
MON
.24
"X15
"X10
"
15
SEE SURVEY BY
DEJARNATT
#922069
35
SEE SURVEY
SEE SURVEY#2003-5519
SEE MAP 11 13 14AA
1314
I.R. I.R.I.R.
I.R.I.R.
I.R.I.R.
FD. 1/2"I.R. SEE M
AP 11
13 12
CC
SEE M
AP 11
13 11
DC
SEE MAP 11 13 11DD
SEE MAP 11 13 11DA
SEE SURVEY3-299
FD.
I.R.FD.
FIX TC/SUBD LINESINITIALPOINT
FD. 1" I. ROD
#200
1159
9SU
RVEY
P.O.T.
52+1
5.68
P.C.S.
52+6
6.2
P.T.
56+6
6.2
P.O.T.
61+0
2.25
(VAC
ATED
)
(VAC
ATED
)(V
ACAT
ED)
(VAC
ATED
)
(VACATED)
ORDER NO. 0-27-85
52-49
4
12345
6 7 8 9 10
1112
BY POVEY#146437
SEE BA #95-1
0
#9607
74
#2002-3590SEE SURVEY
51-48
7
ALLE
Y VAC
ATED
DV 38
289
VACATED
8300 8301
1700
1800
2100
2200
3000
3100
3200
3300
3400
2900
2800
2700
3600
3500
2500
2501
2600
3700
3800
3900
4000
4301
4602
81007700
8101 76008601
8600
850185008400
8201
8200
500
700
(VAC
ATED
)
VACATED
5500
5400
5401
6300
6100 6600
7000
6801
6901 6900
6800
6790
6700
71007200
7200
7300
8000 7900
78008001
20
25
800
900
901
11001200
1202
1300
1400
1501
1502
100
200
300
400
4100
4200
4300
4401
4500
4400
4600
5300
5200
5100 5000
4900
4800
4700
4601
5001
6000
5900
5800
5700
5600
7300
7400 7400
6002
6001
1900
1903
1902
1901
2400
2300 2000
89
11
12
14
15
16
10
13
5
14
15
16
1
2
3
4
5
6
1
67
1600
1500
1503
13
14
15
161
2
3
4
5
6
7
8
11
12
13
14
15
10
13
8
7
6
5
4
3
2
1
2
8
1
2
3
4
5
6
7
89
10
11
12
5
6
9
10
11
121211
10
9
8
7
9
10
11
12
13
14
15
6200
9
10
11
12
13
14
15
16
1
2
9
10
2
8
1415161718
1920212223
131211109
241
3
4
5
6
7
16
11
12
13
14
15
16
1
2
3
4
5
6
8
7
1
2
3
4
5
6
1
2
3
4
3
4
5
8
7
6
5
4
3
2
1
9
10
11
12
13
14
15
16 1
2
3
4
5
6
7
8
2
3
4
5
67
8
1
3
4
5
6
7
3
4
5
6
8
7
9
10
12
11
10
9
8
7 6
5
4
3
2
1
7
89
10
11
12
7
8
9
10
11
12
1
2
3
4
5
6
7
8
1616
115
14
1312
11
10
99
10
11
12
13
3
215
14
6
15
9
11
12
7
11
2
50
5050
5050
5050
5050
5050
100
45.25
50
100
5050
5050
5050
5050 50
5050
5050
5050
5050
5050
100100
5050
5050
5050
115 115
5050
5050
50
100100
5050
5050
5050
100
50
100 100
5050
5050
505050
5050
32.9
47.6
100
2525
5050
505050
5050
5050
50
100
50
50
50 50 50 50
5050
5050
5050
5050
50
100 100
100
50
155.6
7(15
5.58)
146.4
150
50
3.59
3.59
146.4
1
5050
5050
100100
1494
5050
5050
5050
50
100100
50
5050
35
5050
20140 140
50
140.091
.02N0
0°37
'15"E
N89°22'30"W129.90
32.4
50
100 100
5050
5050
50
50
8060
70 70
70 70 70 70140 140
140
2525
2525
25
3 322
25
100100
100
100
10°C
.R.
TS=1
209.6
50
50
125
5050
5050
50 50
100 100
5050
5050
5050
50
100100
5050
5050
5050
50
50
8060
2525
2525
2525
2525
2525
5050
5050
5050
50
115
115115
115 16
505050
5050
5050
5050
5050
5050
100
5050
5050
50
5050
5050
50
50
10 10S89°47'50"E1492.5709.94
2525
50
5050
5050
5050
50
115115
115 115
5050
5050
5050
5050
5050
5050
5050
5050
5050
5050
5050
140
20
140
140
14020140
140 140
100
100
5050
5050
5050
505050
50
5050
22
50
5050
5050
5050
50
107
107100 10070
N19°5
9'38"E
100
S12°
57'03
"W
205.1
2
(49.94) (49.94)
2525
2525
25
10 16115 115
40.7 10 35 35
35 35 35 35
35 35
31.5
1318
.13)
(N00
°12'39
"E
30
556.99
160
85.5
11'
40
57.52 57.52
50
1535
2030
STREET
S. W.
S. W.
HWY.
CALIF
ORNIA
THE D
ALLE
S
FOUR
TH
STRE
ET
STRE
ET
S. W.
4TH
STRE
ET
STREET
S.W. "J"
STREET"M"U.
S. NO
. 97
S. W.
S. W.
"K"
"L"
S. W.
S. W.
STRE
ET
STREETS.
W.MA
DISO
NST
REET
PARTITIONPLAT
1/16COR.
1/16 COR.
0.40 AC.
1.32 AC.
0.11 AC.
11
14
1/16COR.
S.W.
0.20 AC.
1.90 AC.
NORTHWEST
EASEMENT
1010
EASEMENT
1.81 AC.
1/16COR.
1994-11
TOWNSITE
CO'S
FIRST
ADDITION
TO
MADRAS
1991-155801
5803 5802
SOUT
HAD
AMS
DRIVE
COUN
TY R
D. N
O. 67
9
FIRST
SECO
ND
THIR
D
THIS MAP WAS PREPARED FORASSESSMENT PURPOSE ONLY
S.E.1/4 S.E.1/4 SEC.11 T.11S. R.13E. W.M.JEFFERSON COUNTY
1" = 100'CANCELLED: 600 6400 7500 9000 2601 6201 6202 6500 1000
11.13.11DD
11.13.11DD
0 100 200 300 400 Feet
Revised09/18/2009
Map Produced:01/26/2012

Appendix B
Oregon Water Resources Department Well Log Query

This Page Intentionally Left Blank

This Page Intentionally Left Blank

Appendix C
Representative Site Photographs

This Page Intentionally Left Blank
Photo C-1. View of the commercial building that is located on the west side of the project site. Photo taken facing northeast.
Photo C-2. View of the shop building located on the northeast portion of the project site. Photo taken facing north.
C-1

Photo C-3. View of the north half of the commercial building that is operated as Miller’s Discount Groceries. Photo taken facing east.
Photo C-4. View of the south half of the commercial building that is operated as Central Oregon Heating and Cooling. Photo taken facing east.
C-2
Photo C-5. View of the former Wolfe Truck and Equipment facility that is located adjacent south of the project site. Photo taken facing southwest.
Photo C-6. View of the former Jerry’s Muffler facility that is located adjacent east of the project site. Photo taken facing northeast.
C-3
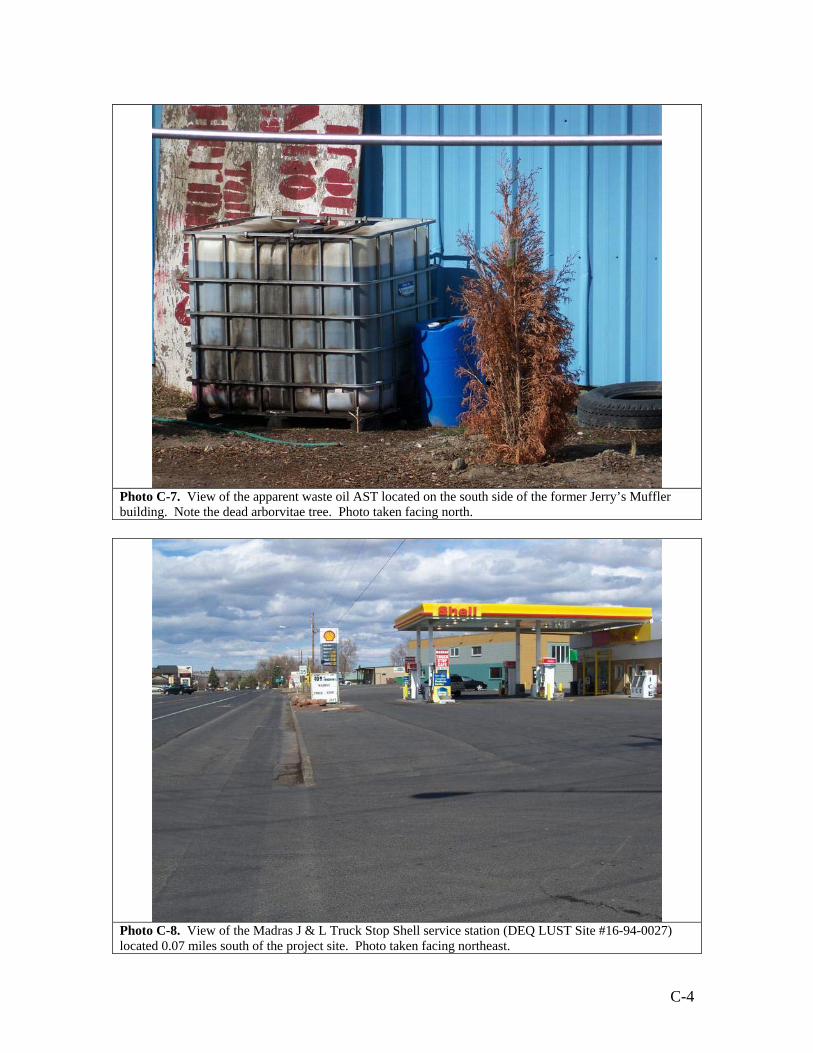
Photo C-7. View of the apparent waste oil AST located on the south side of the former Jerry’s Muffler building. Note the dead arborvitae tree. Photo taken facing north.
Photo C-8. View of the Madras J & L Truck Stop Shell service station (DEQ LUST Site #16-94-0027) located 0.07 miles south of the project site. Photo taken facing northeast.
C-4
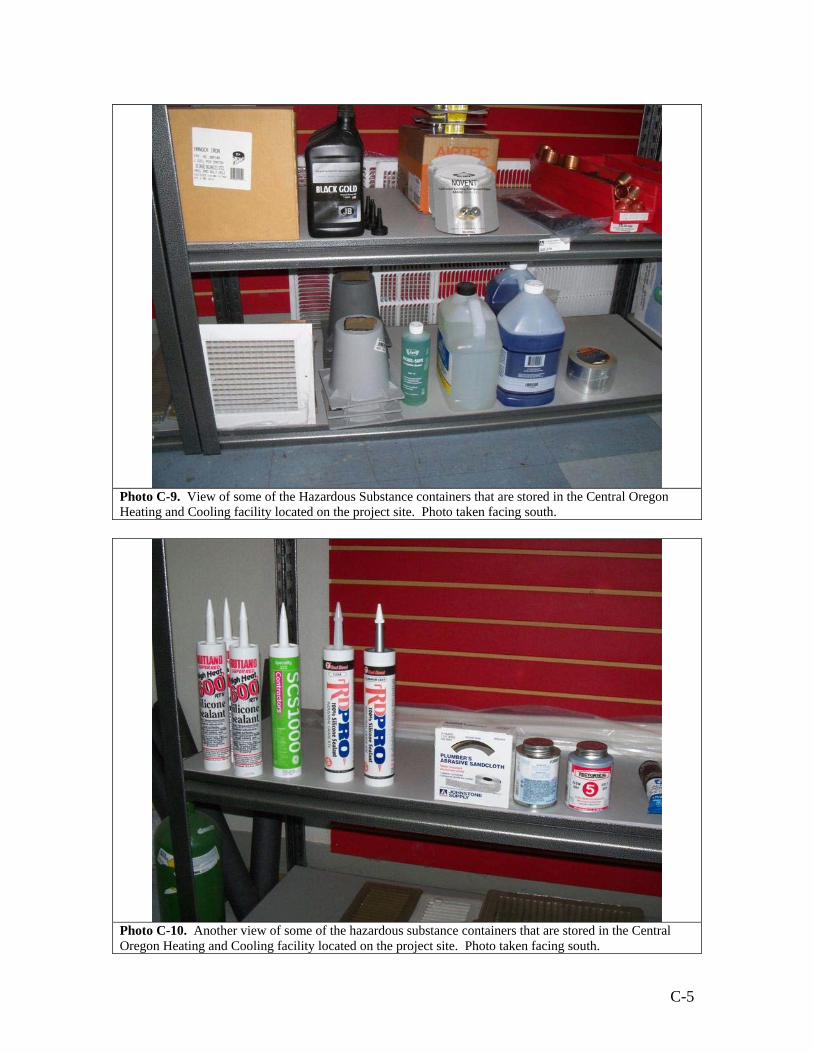
Photo C-9. View of some of the Hazardous Substance containers that are stored in the Central Oregon Heating and Cooling facility located on the project site. Photo taken facing south.
Photo C-10. Another view of some of the hazardous substance containers that are stored in the Central Oregon Heating and Cooling facility located on the project site. Photo taken facing south.
C-5
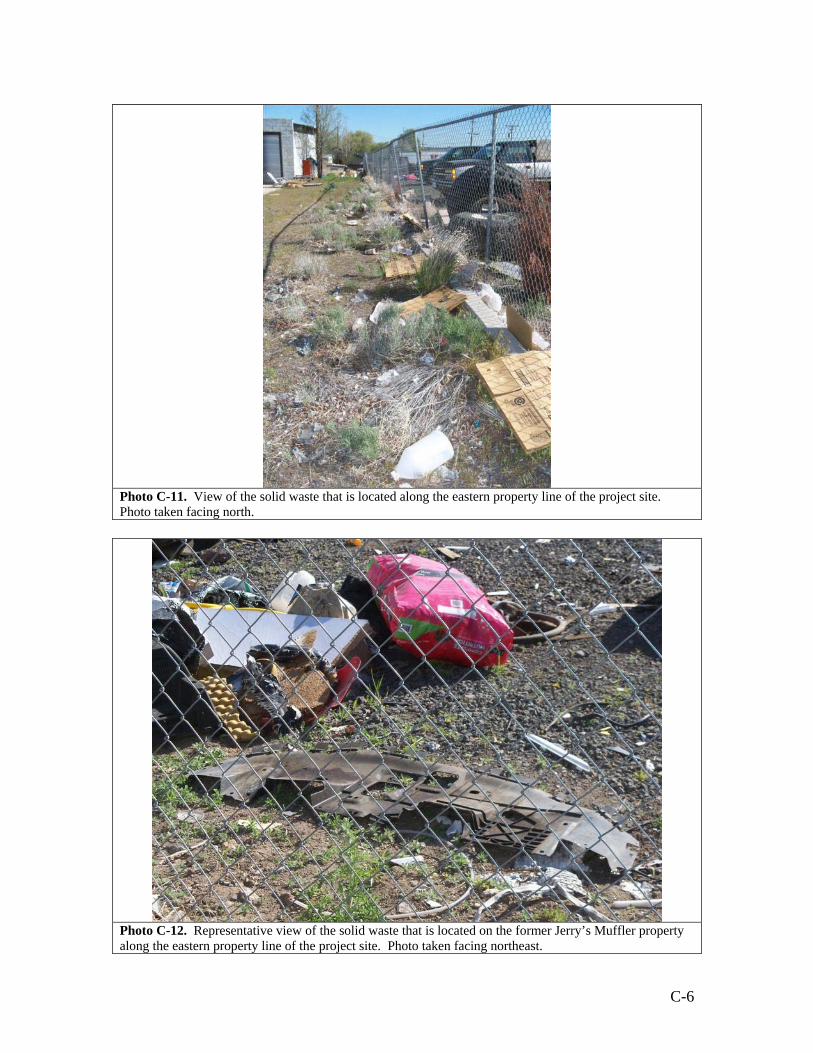
Photo C-11. View of the solid waste that is located along the eastern property line of the project site. Photo taken facing north.
Photo C-12. Representative view of the solid waste that is located on the former Jerry’s Muffler property along the eastern property line of the project site. Photo taken facing northeast.
C-6
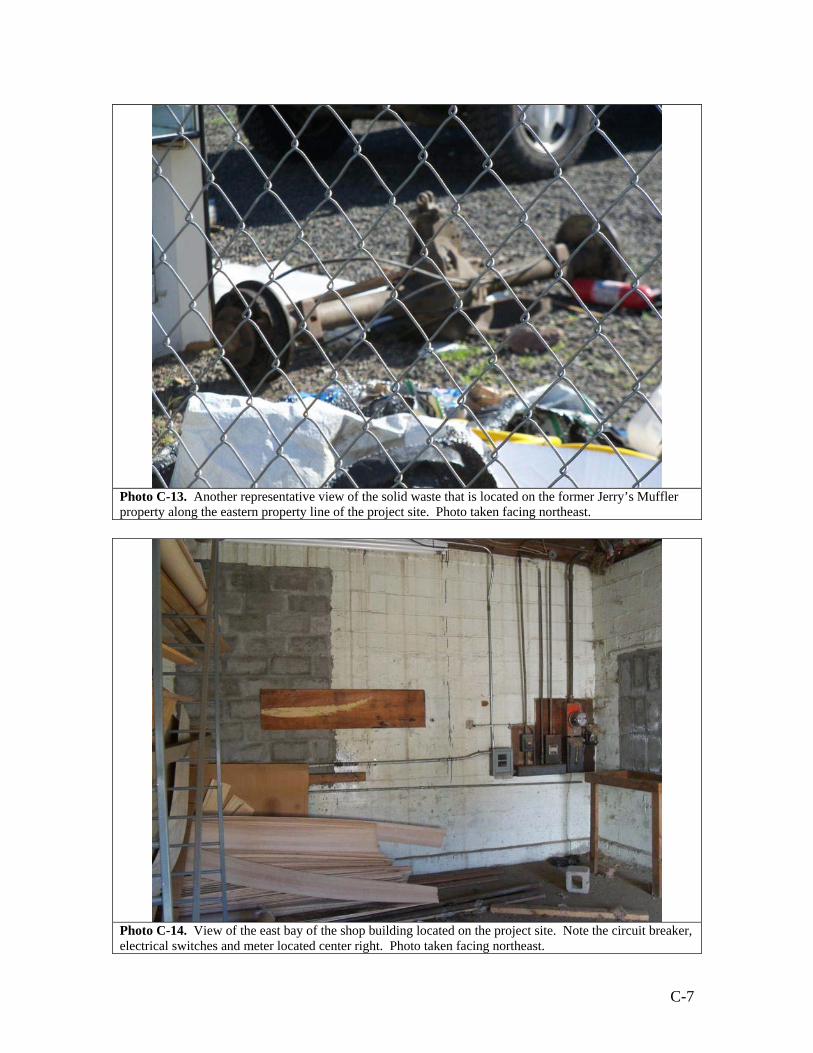
Photo C-13. Another representative view of the solid waste that is located on the former Jerry’s Muffler property along the eastern property line of the project site. Photo taken facing northeast.
Photo C-14. View of the east bay of the shop building located on the project site. Note the circuit breaker, electrical switches and meter located center right. Photo taken facing northeast.
C-7
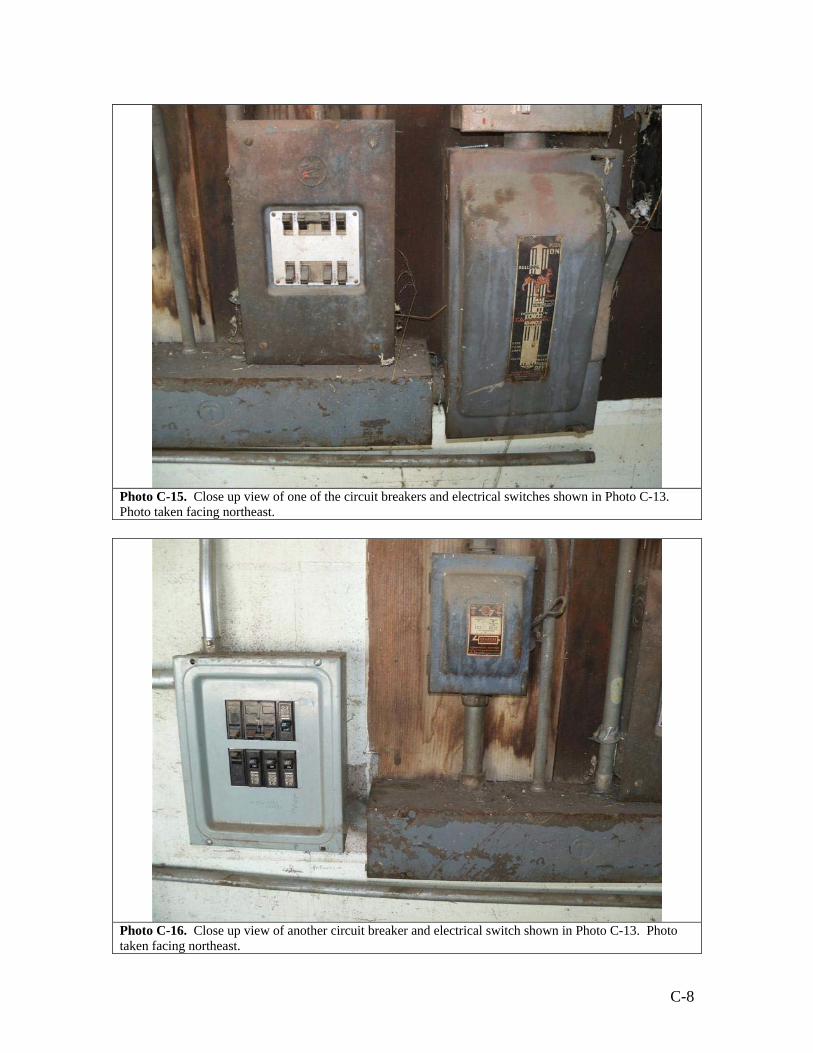
Photo C-15. Close up view of one of the circuit breakers and electrical switches shown in Photo C-13. Photo taken facing northeast.
Photo C-16. Close up view of another circuit breaker and electrical switch shown in Photo C-13. Photo taken facing northeast.
C-8

Photo C-17. Close up view the electrical meter and an electrical switch shown in Photo C-13. Photo taken facing northeast.
Photo C-18. Representative view of the suspected lead-based paint on the shop building located on the project site. Photo taken facing west.
C-9
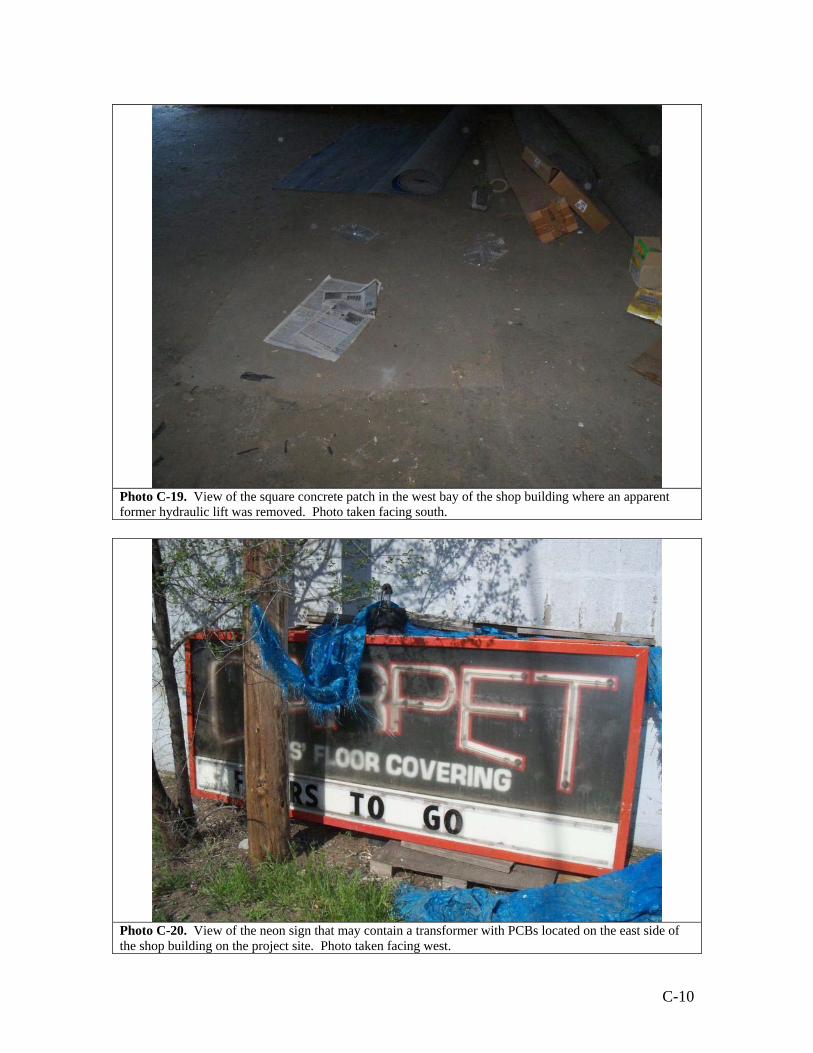
Photo C-19. View of the square concrete patch in the west bay of the shop building where an apparent former hydraulic lift was removed. Photo taken facing south.
Photo C-20. View of the neon sign that may contain a transformer with PCBs located on the east side of the shop building on the project site. Photo taken facing west.
C-10
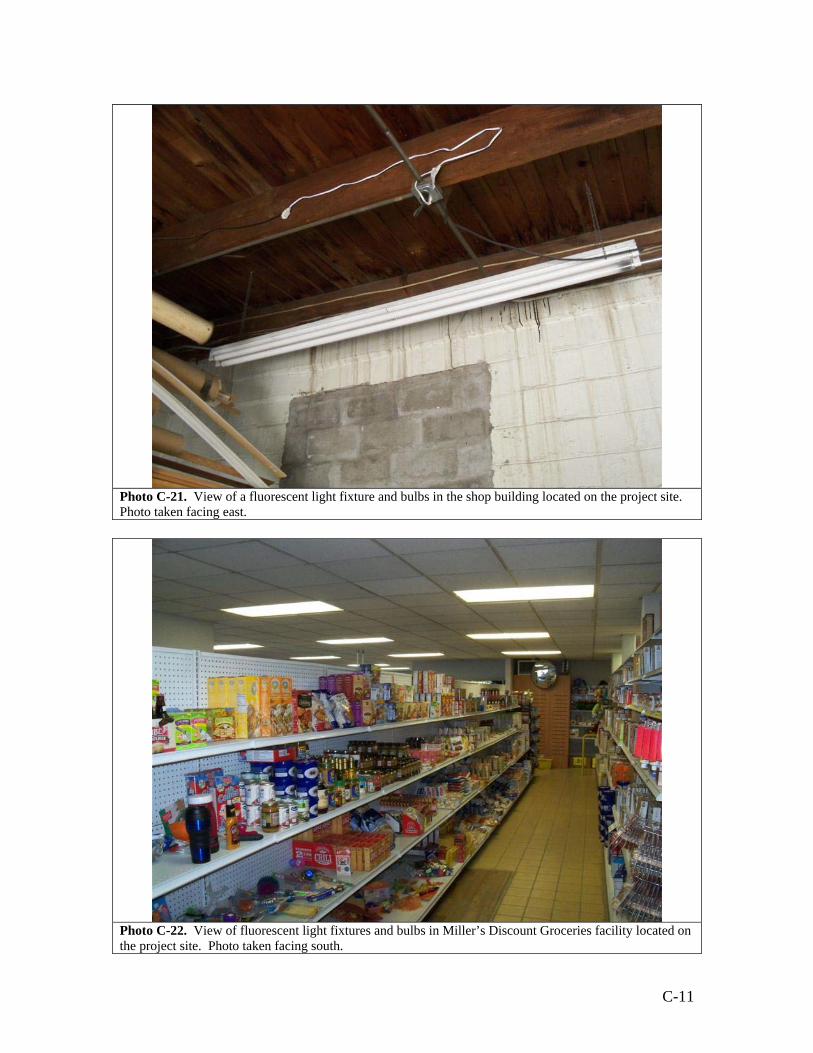
Photo C-21. View of a fluorescent light fixture and bulbs in the shop building located on the project site. Photo taken facing east.
Photo C-22. View of fluorescent light fixtures and bulbs in Miller’s Discount Groceries facility located on the project site. Photo taken facing south.
C-11
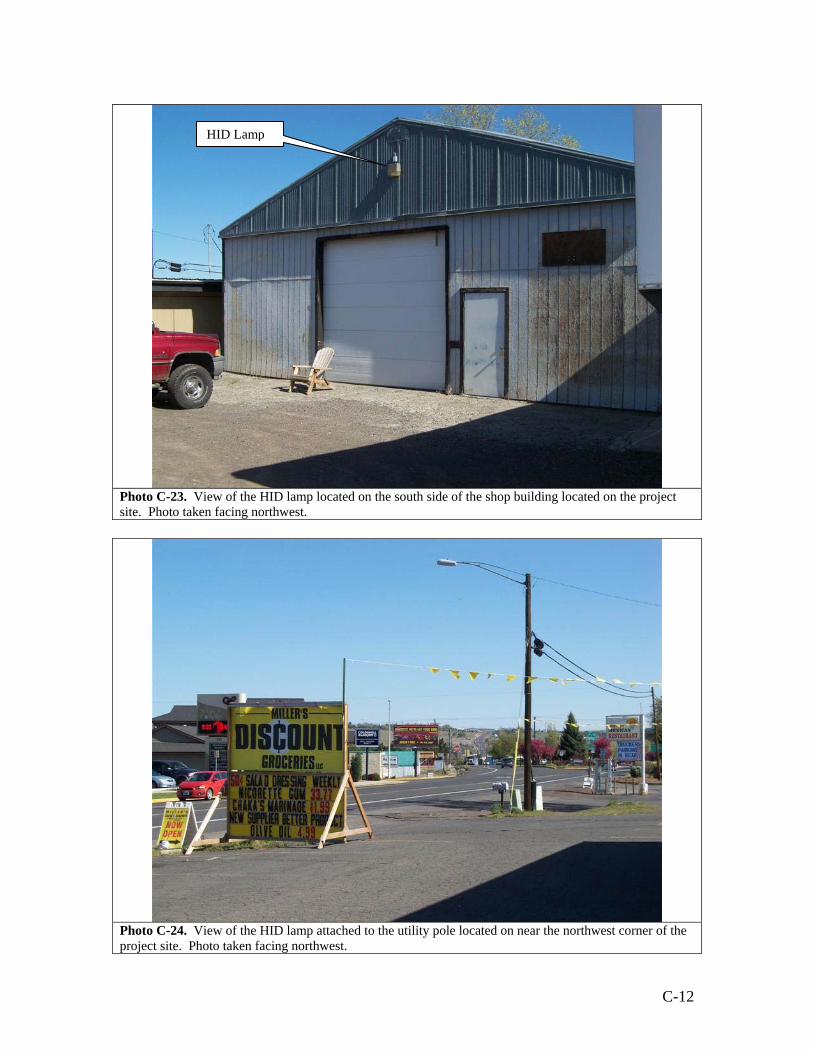
Photo C-23. View of the HID lamp located on the south side of the shop building located on the project site. Photo taken facing northwest.
Photo C-24. View of the HID lamp attached to the utility pole located on near the northwest corner of the project site. Photo taken facing northwest.
HID Lamp
C-12
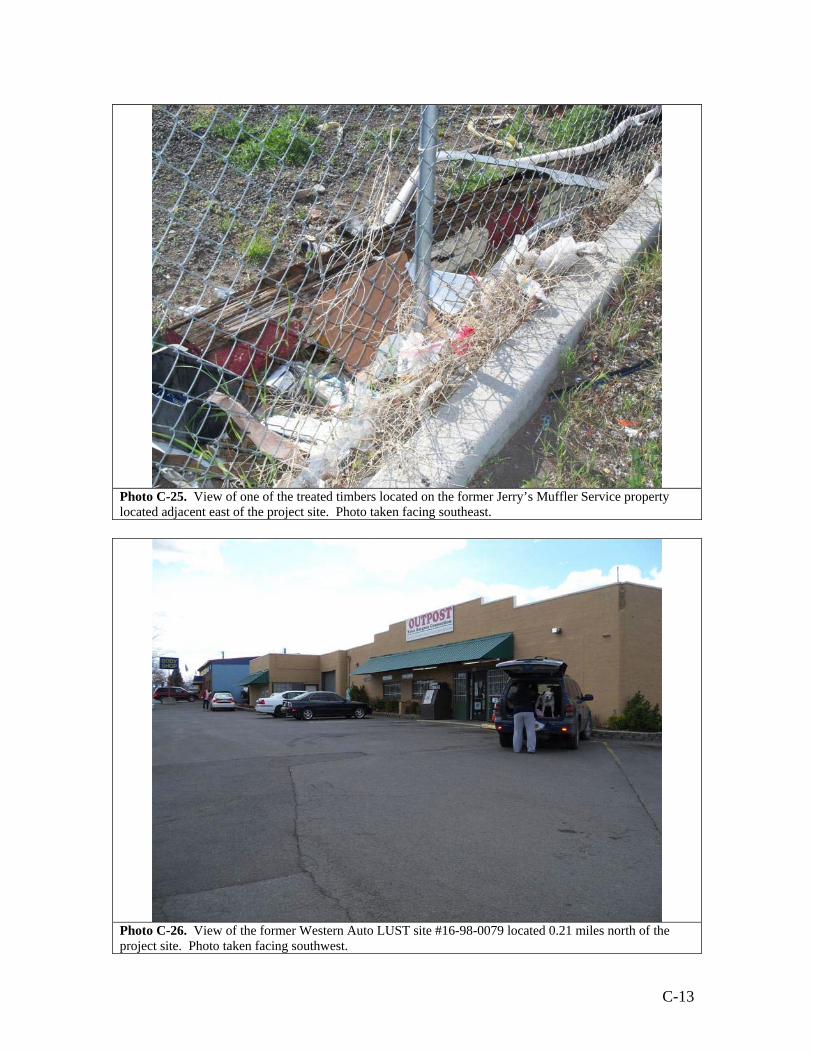
Photo C-25. View of one of the treated timbers located on the former Jerry’s Muffler Service property located adjacent east of the project site. Photo taken facing southeast.
Photo C-26. View of the former Western Auto LUST site #16-98-0079 located 0.21 miles north of the project site. Photo taken facing southwest.
C-13
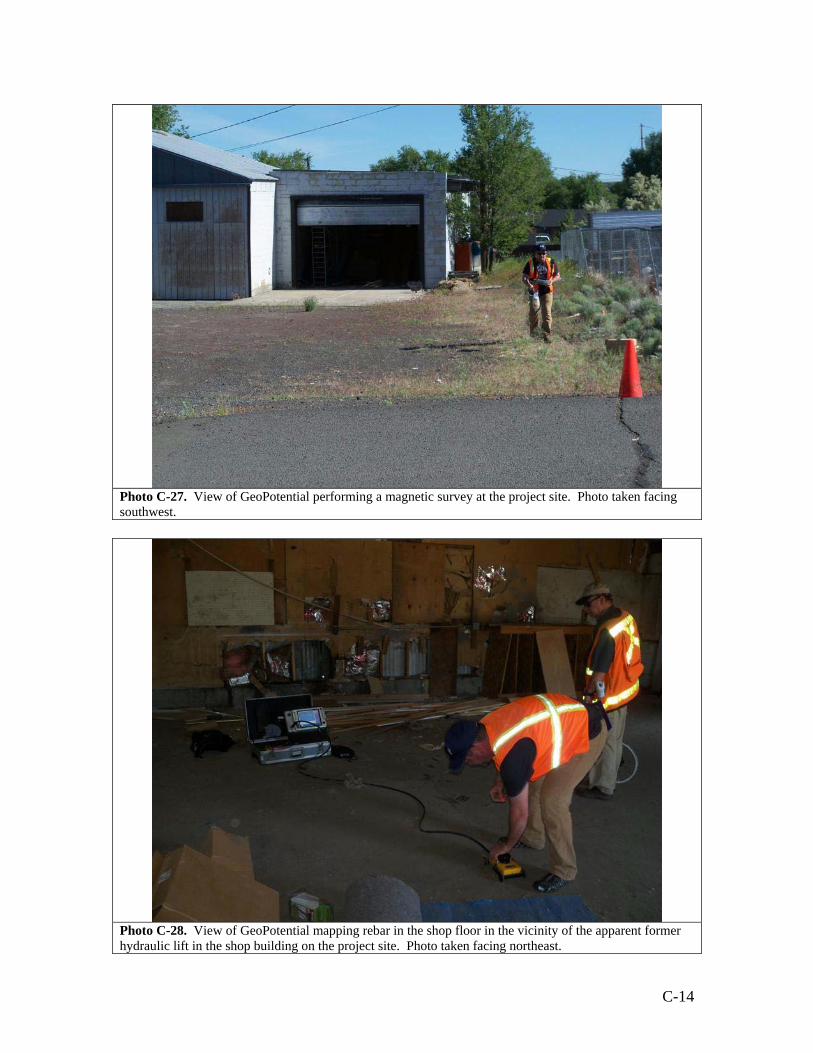
Photo C-27. View of GeoPotential performing a magnetic survey at the project site. Photo taken facing southwest.
Photo C-28. View of GeoPotential mapping rebar in the shop floor in the vicinity of the apparent former hydraulic lift in the shop building on the project site. Photo taken facing northeast.
C-14

Photo C-29. View of BB&A Environmental advancing a push probe boring along the eastern project site property boundary. Photo taken facing south.
Photo C-30. View of BB&A Environmental advancing a push probe boring in the vicinity of the apparent former hydraulic lift in the shop building on the project site. Photo taken facing southwest.
C-15

This Page Intentionally Left Blank

Appendix D
Historical Data

This Page Intentionally Left Blank
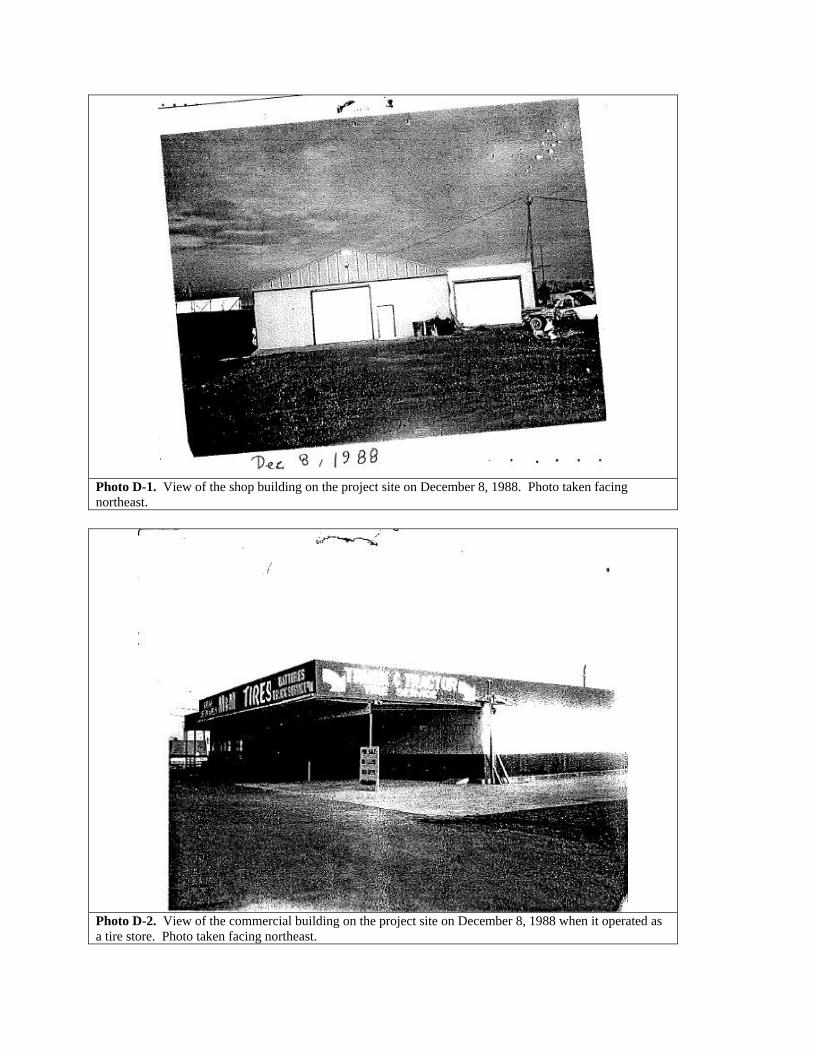
Photo D-1. View of the shop building on the project site on December 8, 1988. Photo taken facing northeast.
Photo D-2. View of the commercial building on the project site on December 8, 1988 when it operated as a tire store. Photo taken facing northeast.

Photo D-3. View of the project site in August 1995 showing the commercial building and shop building. Note the “Texaco” sign for the South Side Texaco service station (DEQ LUST Site #16-98-0067) in the center background. Photo taken facing north.
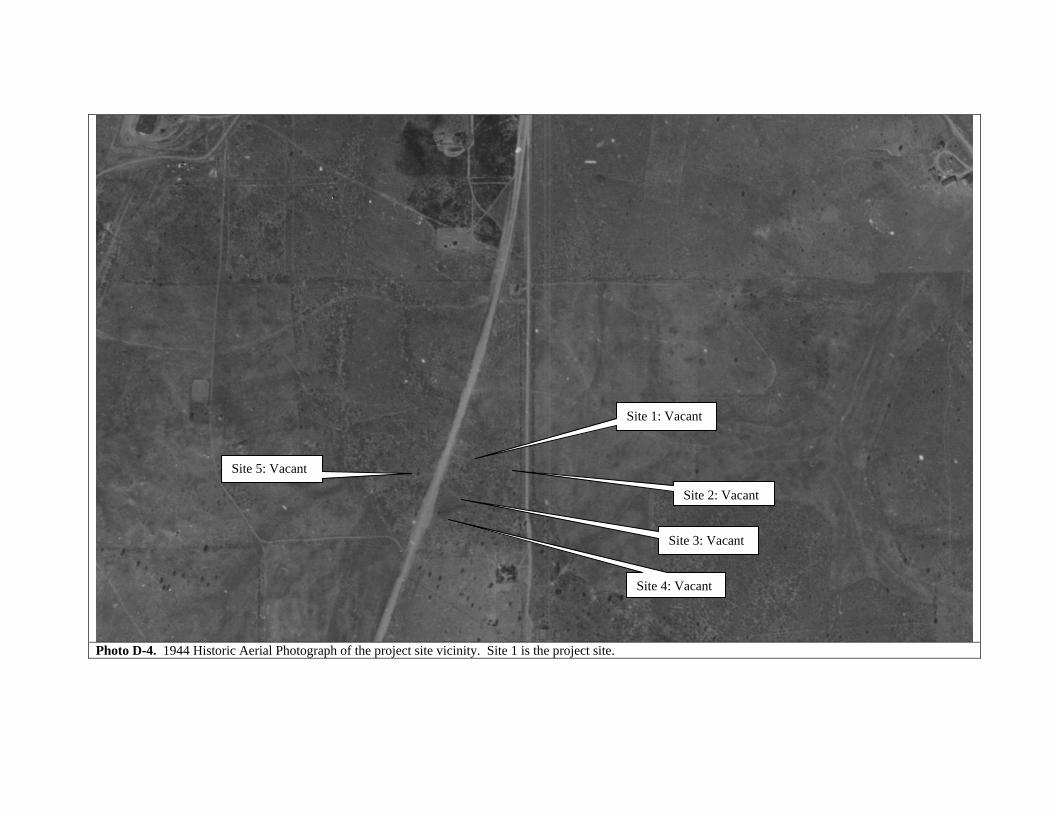
Photo D-4. 1944 Historic Aerial Photograph of the project site vicinity. Site 1 is the project site.
Site 1: Vacant
Site 5: Vacant
Site 2: Vacant
Site 3: Vacant
Site 4: Vacant
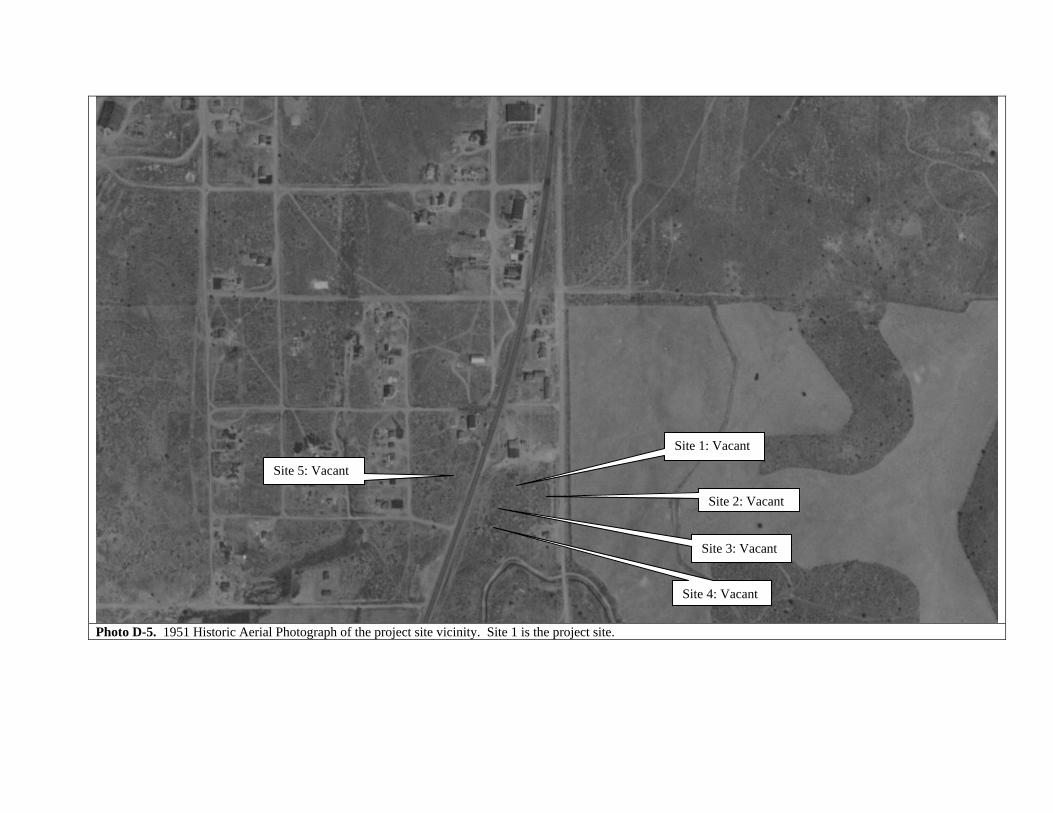
Photo D-5. 1951 Historic Aerial Photograph of the project site vicinity. Site 1 is the project site.
Site 2: Vacant
Site 3: Vacant
Site 4: Vacant
Site 1: Vacant
Site 5: Vacant
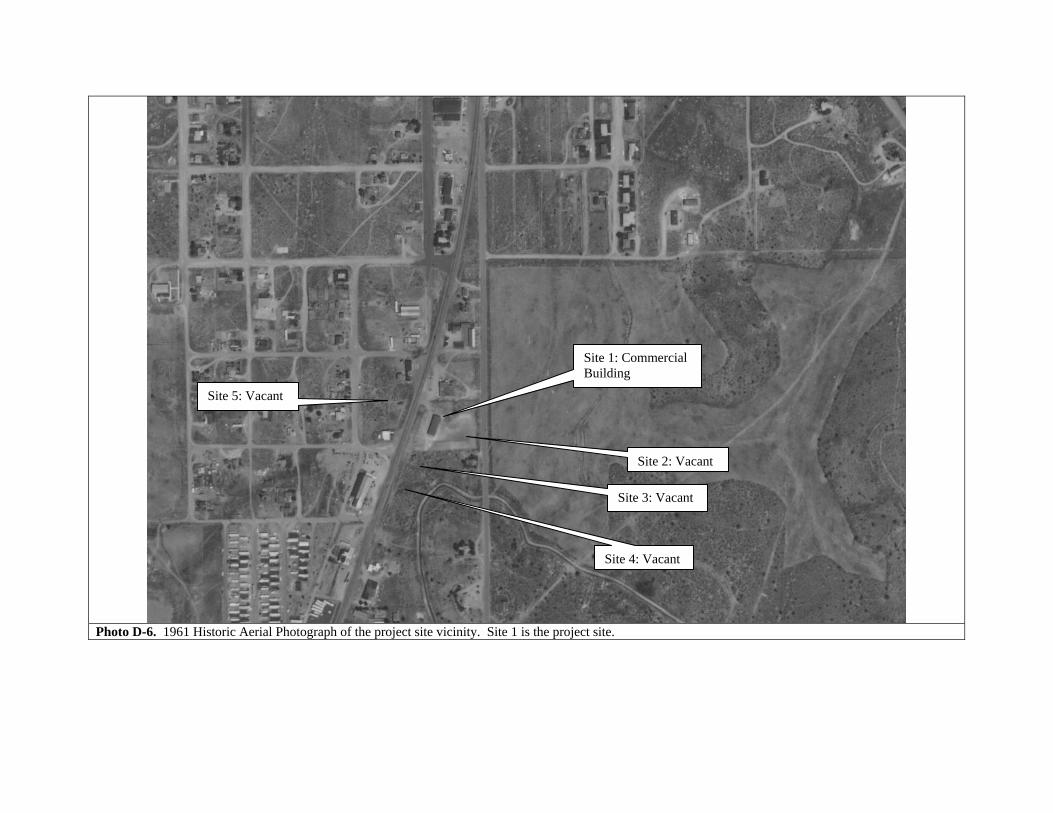
Photo D-6. 1961 Historic Aerial Photograph of the project site vicinity. Site 1 is the project site.
Site 1: Commercial Building
Site 5: Vacant
Site 2: Vacant
Site 3: Vacant
Site 4: Vacant

Photo D-7. 1968 Historic Aerial Photograph of the project site vicinity. Site 1 is the project site.
Site 1: Commercial and Shop Buildings
Site 5: Apparent Service Station
Site 3: Possible Truck Repair
Site 4: Apparent Service Station
Site 2: Vacant

Photo D-8. 1976 Historic Aerial Photograph of the project site vicinity. Site 1 is the project site.
Site 1: Commercial and Shop Buildings
Site 5: Apparent Service Station
Site 2: Vacant
Site 3: Possible Truck Repair
Site 4: Apparent Service Station
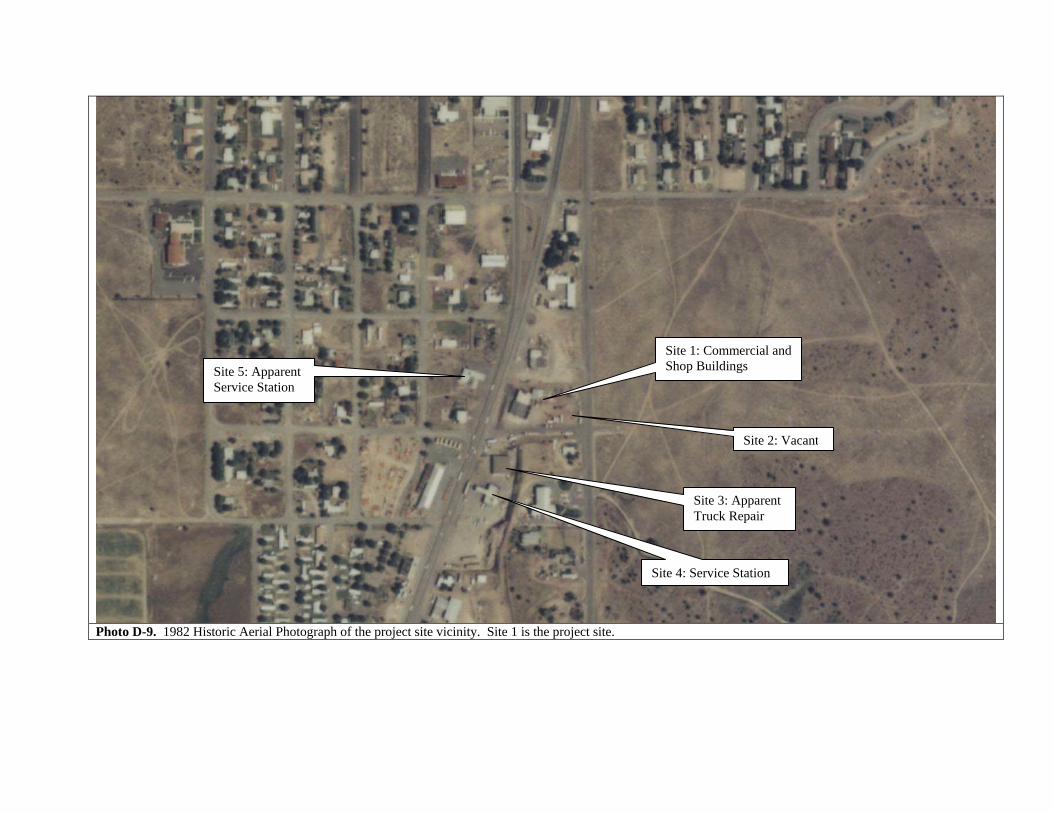
Photo D-9. 1982 Historic Aerial Photograph of the project site vicinity. Site 1 is the project site.
Site 1: Commercial and Shop Buildings Site 5: Apparent
Service Station
Site 2: Vacant
Site 3: Apparent Truck Repair
Site 4: Service Station
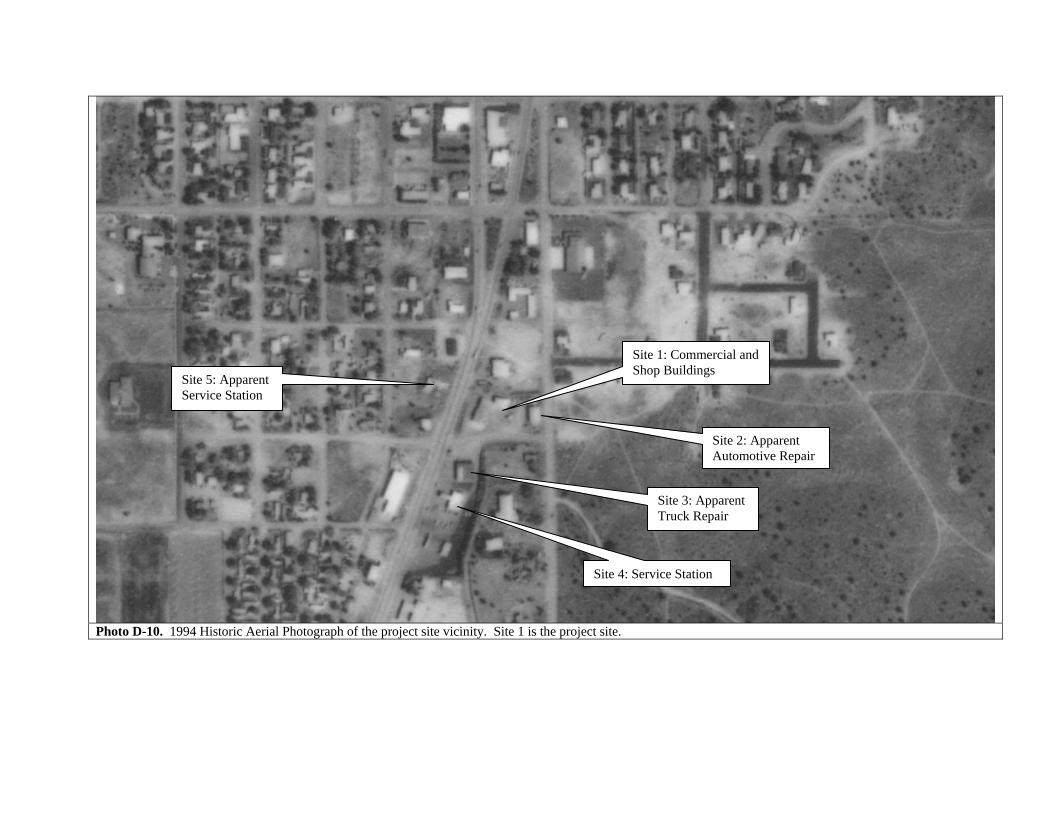
Photo D-10. 1994 Historic Aerial Photograph of the project site vicinity. Site 1 is the project site.
Site 3: Apparent Truck Repair
Site 4: Service Station
Site 2: Apparent Automotive Repair
Site 1: Commercial and Shop Buildings
Site 5: Apparent Service Station

Photo D-11. 2005 Historic Aerial Photograph of the project site vicinity. Site 1 is the project site.
Site 2: Automotive Repair
Site 1: Commercial and Shop Buildings
Site 5: Commercial Building
Site 3: Apparent Truck Repair
Site 4: Service Station

Appendix E
Environmental Database Reports

This Page Intentionally Left Blank

This Page Intentionally Left Blank

This Page Intentionally Left Blank


Appendix F
Initial Site Assessment (ISA) Checklist

This Page Intentionally Left Blank
INITIAL SITE ASSESSMENT (ISA) CHECKLIST
Project Information District: 10 County: Jefferson Route: US97 Milepost: 92.78 to
96.30 Description: Does the project have potential hazardous waste involvement? Not anticipated Screening Criteria 1. Project Features: New R/W? Yes Excavation? Yes Relocate Utilities? Yes 2. Land Use History and Development Setting (urban/rural; industrial, commercial, agricultural,
housing other –list) Current land uses: Commercial Previous land uses: Commercial Adjacent land uses: Residential and commercial 3. In-house record review: Yes 4. Any known hazardous waste sites in vicinity? No If yes, identify and explain. Optional Records County Assessor: Yes Fire Dept: Yes Sanborn Maps: Yes Other Take photos of sites or sketch Visual Inspection of Project Site and Adjoining Properties Storage Structures: Contamination: Potential asbestos
containing materials: Underground tanks: Yes Surface Staining: Possibly Buildings: Yes Aboveground tanks: Yes Oil sheen: No Sprayed-on fireproofing:
No Sumps: No Odors: No Pipe wrap: No Ponds: No Stress vegetation: Yes Floor tiles: N/A Transformers: Yes Other Siding: No Other Ceiling tiles: Possibly Acoustical plaster: No Sites: Sites: Sites: N/A Project site and adjoining properties.
Property adjacent east to project site has stressed vegetation
Shop building and possibly in the commercial building.
Comments: Conducted by: Ryan Franklin

This Page Intentionally Left Blank

Appendix G
Geophysical Survey Report

This Page Intentionally Left Blank
ENVIRONMENTAL & EXPLORATION GEOPHYSICS
22323 East Wild Fern Lane, Brightwood, Oregon 97011 PH (503) 622-0154 FAX (503) 622-0526 WEB http://www.geopotential.biz/ E-MAIL [email protected]
CLIENT
ODOT
355 Capitol St. N.E. Salem, OR 97301-3871
DATE OF SURVEY
June 15, 2012
SUMMARY REPORT
SUBSURFACE MAPPING SURVEY TO DETECT
UNDERGROUND FEATURES
US97 @ J Street Intersection The Dalles – California Highway
Madras, Jefferson County, Oregon
GeoPotential Project Number: 8903
CONTENTS
Summary ....................................................................................................................................................3 Introduction ................................................................................................................................................3 Survey Objectives .......................................................................................................................................3 Survey Site .................................................................................................................................................3 Survey Equipment ......................................................................................................................................3 Procedure ....................................................................................................................................................4 Results ........................................................................................................................................................5 Limitations..................................................................................................................................................5 FIGURES Figure 1. Location Maps .............................................................................................................................6 Figure 2. Magnetic Map .............................................................................................................................7 Figure 3. Interpretation Map ......................................................................................................................8 APPENDICES Appendix A – Magnetometer Surveys .......................................................................................................9 Appendix B – Ground Penetrating Radar Surveys .....................................................................................11

SUMMARY
A Subsurface Mapping Survey (SMS) was conducted over the exterior and interior of an abandoned garage along US97 (The Dalles – Columbia Highway) in Madras, Oregon for the purpose of detecting Underground Storage Tanks (USTs), utilities and perform Bore Hole Clearance Surveys (BHCS). Magnetic Surveys, Ground Penetrating Radar (GPR) Surveys and hand held magnetic and electromagnetic scanners were used for the project. No USTs were detected in any areas covered by the SMS. BHCS were conducted over 8 proposed bore hole locations. Detected utilities were mapped.
INTRODUCTION Ralph Soule and Tony Bartruff of GeoPotential conducted the Subsurface Mapping Survey. Ryan Franklin was ODOT’s on-site representative. Fieldwork was conducted on June 15, 2012. The report was completed and e-mailed to ODOT on June 18, 2012. Subsurface mapping surveys are geophysical surveys utilizing geophysical methods and data to detect and locate natural and manmade subsurface features. Magnetic Surveys are used to detect and map the locations of buried ferrous (iron-bearing) objects (see Appendix A). Ground Penetrating Radar (GPR) Surveys are used to map both natural and manmade subsurface features such as USTs, utilities, backfilled pits, etc. (see Appendix B.). Pipe and cable locators are used to map the locations of buried utilities and piping. Once subsurface ferrous objects are detected from a magnetic survey then hand held scanners and GPR surveys are used to map the locations, depths, sizes and shapes of the objects.
SURVEY OBJECTIVES The objectives of this subsurface mapping survey are:
1. Search for UST’s. 2. Map Utilities 3. Clear 8 proposed Bore Hole locations.
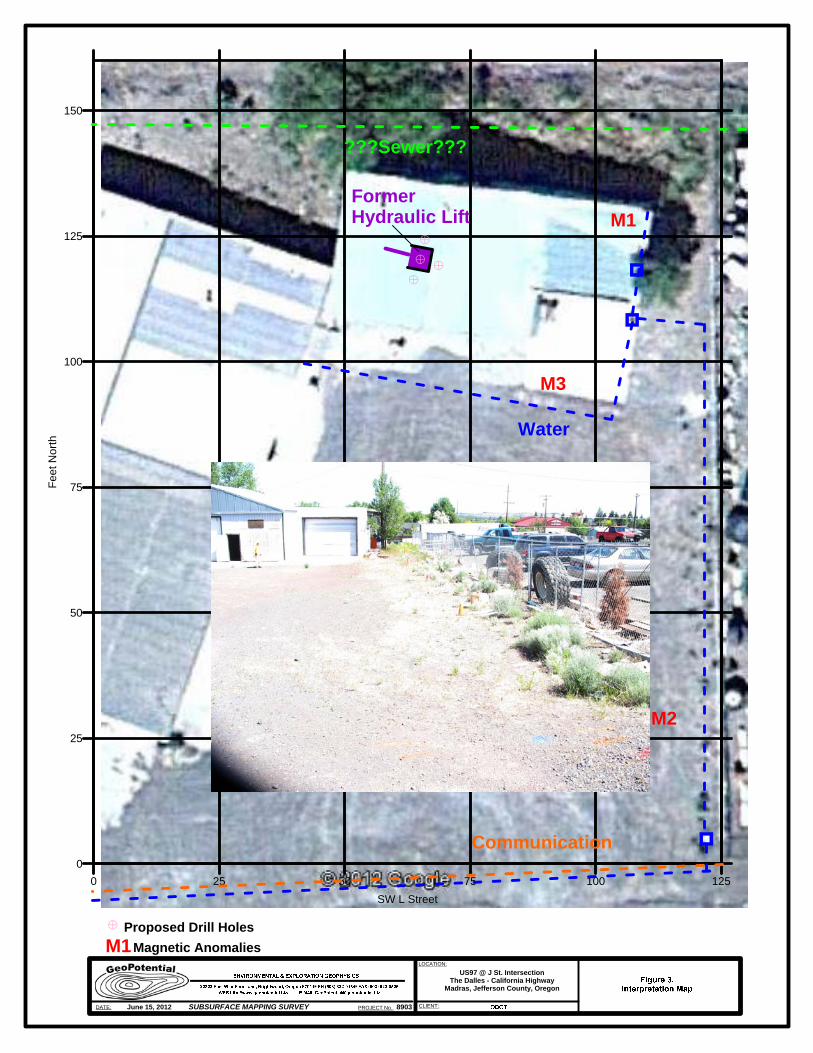
SURVEY SITE The survey Site is shown on Figures 1, 2 & 3. The Site consisted of and abandoned garage which contained a water valve and a concrete 4X4 foot patch in the reinforced concrete floor. A small patch extension led to a stubbed pipe against the West interior wall of the garage. These features suggested a former hydraulic lift which had been removed. The South exterior of the site consisted of a gravel covered parking lot and reinforced concrete apron on the garage. A water valve was located on the apron and in the Southeast corner of the property. The North side of the garage consisted of soil with grass and shrubs. A sewer manhole was located on the Northwest corner of the Eastern adjacent property. Locating marks on the manhole indicated a East-West sewer line may pass under North edge of the Site. There were no surface indications of USTs.

SURVEY EQUIPMENT The following geophysical instruments were used to conduct the survey:
GEOMETRICS 858G Cesium Vapor Magnetometer (Magnetic Survey). Mala RAMAC Ground Penetrating Radar System with a 500 MHz antenna (GPR Survey). MALA Concrete Imaging Radar with a 1.6 GHz Antenna (GPR Survey) Schonstedt GA52 Magnetic Gradiometer. Aqua-Tronics A6 Pipe & Cable locator. Heath Shurlock Pipe & Cable locator.
This equipment and the procedures used to meet the survey objectives of this project have been proven effective in detecting metallic objects and mapping non-metallic features such as disturbed soil from backfilled pits. Geophysical techniques are excellent at detecting changes in the subsurface caused by natural and manmade objects; however, they are poor at actually identifying subsurface features. Complementary methods may be used to assist in the interpretation; however, the only sure way of identifying a buried feature is by excavation. Brief descriptions of the magnetic method and the radar method are included in the Appendices.
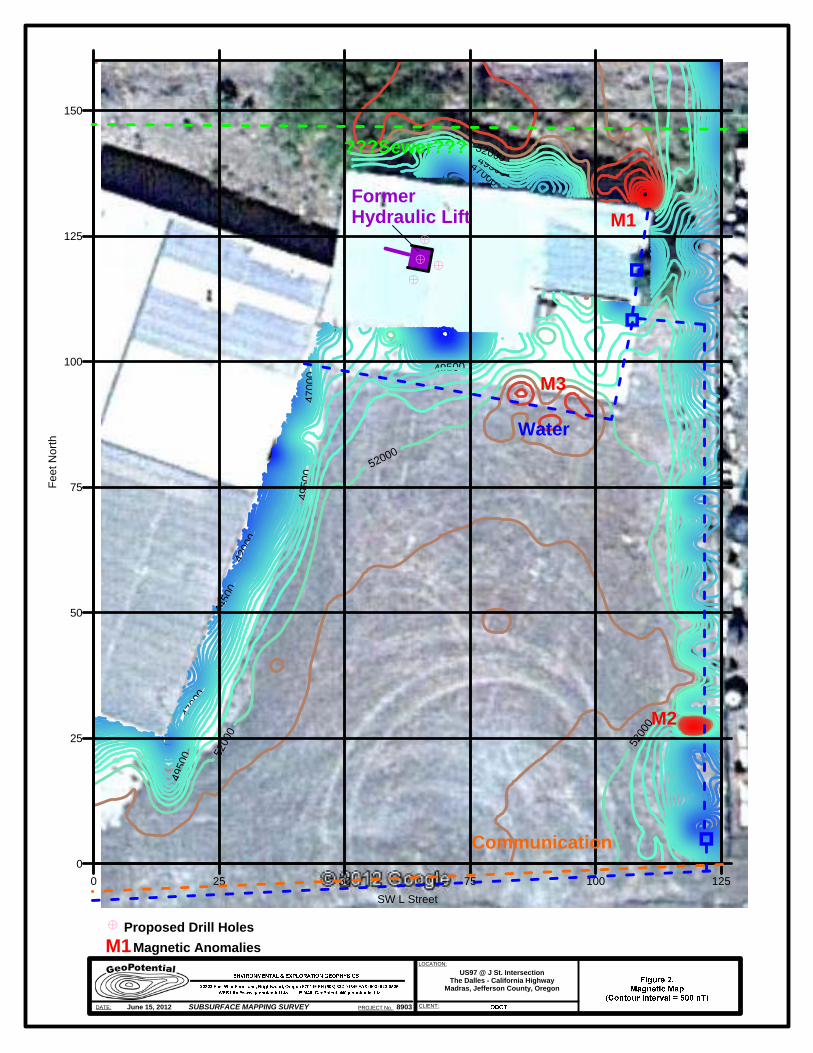
PROCEDURE Magnetic Survey The Magnetic Survey consisted of acquiring magnetic readings along traverses using a 5-foot spacing between traverses over the exterior portion of the Site. Magnetic data were downloaded to a computer, processed and contoured to produce Figure 2. Magnetic Map for the Site. The Magnetic Map is plotted at a Contour Interval of 500 nT a Contour Interval sufficient to detect USTS. In general buried ferriferous objects will produce stronger positive magnetic anomalies that are shown as red contours on the Magnetic Map. Surface ferriferous objects such as fences or buildings my produce negative magnetic anomalies that are shown as blue contours on the magnetic map. Significant positive Magnetic Anomalies are marked on the Maps as M1 (Magnetic Anomaly 1), M2 and M3. Ground Penetrating Radar Surveys Over AREAS that contained suspect USTs GPR Profiles were acquired using a 500 MHz antenna. The data were processed and interpreted as discussed below. A 2.3 GHz antenna was used to map reinforcement in the vicinity of the former hydraulic lift. Also GPR data were acquired over all proposed bore holes. Pipe and Cable Survey Hand held magnetic and electromagnetic scanners were used to help identify USTs and utilities and clear proposed bore holes.
RESULTS
Results were marked on the Site and are shown on the Figures 2 & 3. Significant Magnetic Anomalies are: M1 – this Magnetic Anomaly is interpreted as a buried vertical pipe which may be water well casing. The investigation of the water valve inside the garage indicated a water line extended to this feature. It is necessary to excavate to confirm the identity of this feature. M2 – is interpreted as ferric debris. M3- is interpreted as reinforcement in the concrete slab All other Magnetic Anomalies observed in AREA are interpreted to be caused by Surface features and minor ferric debris. Eight bore holes were cleared for drilling. No Underground Storage Tanks were detected on the Site.
LIMITATIONS Limitations of magnetometer and GPR surveys can be seen in the Appendices. Geophysical surveys consist of interpreting geophysical responses from subsurface features. Since a variety of subsurface features can produce identical geophysical responses, it is necessary to confirm the geophysical interpretation with intrusive investigations such as excavating or drilling. In addition, many subsurface features may produce no geophysical response.
Ralph Soule June 18, 2012 GeoPotential

SUBSURFACE MAPPING SURVEY
LOCATION:
CLIENT:PROJECT No.DATE: June 15, 2012 8903
US97 @ J St. IntersectionThe Dalles - California Highway
Madras, Jefferson County, Oregon
4200
0
4450
0
4700
0
4700
0
4700049
500
4950
0
49500
49500
5200
0
52000
5200
0
52000
0 25 50 75 100 125SW L Street
0
25
50
75
100
125
150
Feet
Nor
th
Water
???Sewer???
Communication
SUBSURFACE MAPPING SURVEY
LOCATION:
CLIENT:PROJECT No.DATE: June 15, 2012 8903
US97 @ J St. IntersectionThe Dalles - California Highway
Madras, Jefferson County, Oregon
Proposed Drill Holes
FormerHydraulic Lift M1
M2
M3
M1Magnetic Anomalies

ENVIRONMENTAL & EXPLORATION GEOPHYSICS
22323 East Wild Fern Lane, Brightwood, Oregon 97011 PH (503) 622-0154 FAX (503) 622-0526 WEB http://www.geopotential.biz/ E-MAIL [email protected]
APPENDIX A
MAGNETOMETER SURVEYS
The earth's magnetic field, measured in "nano Teslas" (nT), behaves like a bar magnet ( a dipolar field), with the strongest magnetic field located at the poles, and the weakest field located near the equator. In the continental United States, the average field intensity varies widely, however, the average value is about 50,000 nT. Also, like the magnetic field around the bar magnet, the earth's magnetic field is inclined. This inclination in the continental United States varies between 60 and 75 degrees, generally depending upon the latitude of the measuring location. The earth's magnetic field varies constantly and, during sunspot activity, quite dramatically. A magnetometer is an electronic device that measures the intensity of the earth's magnetic field. Naturally occurring geologic features and buried ferrous metal objects such as underground storage tanks, drums, ordnance, pipes and debris filled trenches produce both horizontal and vertical disturbances to the earth's local magnetic field. The objects causing these "anomalies" can be detected quickly and reliably using portable magnetometers. The intensity of an anomaly is a function of the size, depth of burial and magnetic susceptibility of the object. As a rule of thumb, single drums buried several feet below the surface produce anomalies of about 200 nT relative to the normal undisturbed background and can be detected at a horizontal distance of about 15 feet, while large caches of drums can produce anomalies of many thousands of nT and may be detectable 50 feet away. Magnetometers generally measure total intensity of the local magnetic field. A magnetic gradiometer is a variant of the magnetometer that measures both the horizontal and the vertical magnetic field at each survey point. It consists of two identical sensors located vertically on a staff and having a fixed separation. The intensity of the magnetic field caused by a buried metal object varies inversely with the distance between the object and the sensor. The relative intensities measured simultaneously at each sensor are used to determine the relative depth of burial of an object. Relative depth estimates of buried metal objects can be made using a single sensor. In general, for a given object, the deeper the object is buried, the lower the amplitude and the wider the anomaly. Shallowly buried objects produce higher amplitude anomalies with closely spaced contour lines. Magnetic surveys can only detect ferrous metal objects and cannot be used to identify the buried object. Estimates of the total mass of a buried object are difficult due to the physical properties of the object and other factors. Interference caused by observed surface metal objects limits the accuracy of the survey. The anomalies produced by fences, power lines, cars and buildings can easily mask the anomaly caused by an underground target. Magnetic surveys are cost effective. Using the standard "step and wait" magnetometer, data from approximately 1000 points can be obtained in one field day corresponding to between 1 acre and about 5 acres depending on site conditions and survey goals. More modern cesium magnetometers collect up to 10 readings per second continuously, thus the operator can proceed without stopping. Many modern magnetometers use an audible signal to call attention to anomalous data as it is obtained. At some sites metallic objects can be detected and marked in the field at the time of the survey.

The use of a second, automatically recording "base station" magnetometer is highly recommended due to temporal variations in the earth's magnetic field. These changes must be removed from the field data before an accurate interpretation can be made, particularly when searching for small-buried objects. Magnetic data are most commonly presented in two contour maps. The TOTAL MAGNETIC FIELD CONTOUR MAP shows the horizontal variation of the total intensity of the magnetic field and, therefore, the areal extent of anomalies. The GRADIOMETER CONTOUR MAPS show the horizontal variation of the vertical gradient of the magnetic field and indicate the relative depth of burial of the objects causing those anomalies. Color versions of these maps may be produced showing only the magnetic highs and lows.

ENVIRONMENTAL & EXPLORATION GEOPHYSICS
22323 East Wild Fern Lane, Brightwood, Oregon 97011 PH (503) 622-0154 FAX (503) 622-0526 WEB http://www.geopotential.biz/ E-MAIL [email protected]
APPENDIX B GROUND PENETRATING RADAR SURVEYS
Ground Penetrating Radar (GPR) can be a valuable tool to accurately locate both metallic and non-metallic UST's and utilities, buried drums and hazardous material at some sites. It may detect objects below reinforced concrete floors and slabs. GPR may delineate trenches and excavations and, under some conditions, it may be used to locate contaminant plumes. It has been used as an archaeological tool to look for buried artifacts. It may accurately profile fresh water lake bottoms either from a boat or from a frozen lake surface. GPR may be used to locate voids below roads and runways. GPR has numerous engineering applications. It can be used in non-destructive testing of engineering material, for example, locating rebar in concrete structures and determining the thickness of concrete and other structural material.
GPR uses short impulses of high frequency radio waves directed into the ground to acquire information about the subsurface. The energy radiated into the ground is reflected back to the antenna by features having different electrical properties to that of the surrounding material. The greater the contrast, the stronger the reflection. Typical reflectors include water table, bedrock, bedding, fractures, voids, contaminant plumes and man-made objects such as UST's and metal and plastic utilities. Materials having little electrical contrast like clay and concrete pipes may not produce strong reflections and may not be seen. Data are digitally recorded or downloaded to a laptop computer for filtering and processing.
The frequency of the radar signal used for a survey is a trade off. Low frequencies (250 MHz – 50 MHz) give better penetration but low resolution so that pipes and utilities may not be seen. Pipes and utilities may be seen using higher frequencies (500 MHz) but the depth of penetration may be limited to only a few feet especially in the wet, clayey soils found in many areas of the NW USA. The GPR frequency is dependent upon the antenna. Once an antenna is selected, nothing the operator can do can increase the depth of penetration.
Radar data is ambiguous. Many buried objects produce echoes that may be similar to the echo expected from the target object. Boulders and debris produce reflections that are similar to pipes and tanks. Subtle changes in the electrical properties along a traverse caused by changes in soil type, mineralogy, grain size, and moisture content all produce “noise” that can make interpretation difficult. Interpreting radargrams is an art as much as a science.
Under some conditions, although a UST itself may not be clearly visible in a GPR record, the excavation or trench in which the UST is buried is evident. Usually GPR data is used to compliment data from other “tools”. For example, a trench-like reflection but no clear UST reflection, combined with a “tank” shaped magnetic anomaly suggests the presence of a UST. Although the UST itself could not be seen using GPR, the radar showed a trench-like reflection. The magnetic data showed a large ferrous object. We would report a possible UST at that location.
GPR is often used in conjunction with magnetometer surveys. Magnetometer Surveys are very fast and large areas can be covered cost effectively. Magnetic anomalies are marked in the field, and then may be further investigated using radar.

GPR, like other geophysical tools, is excellent at detecting changes across a site, but it is poor at actually identifying the cause of the change. The only definite way to identify buried objects is through excavation.
ADVANTAGES - General
When GPR data is properly interpreted subsurface objects can usually be confidently identified. This often requires the GPR data be combined with other geophysical data, surface features and historical information.
GPR provides continuous records along traverses which, depending on the goal of the survey, may
be interpreted in the field.
At flat, open sites, for reconnaissance purposes, the antenna can be towed behind a vehicle at several mph.
Many GPR antennas are shielded and are unaffected by surface and overhead objects and power
lines.
GPR can be used in conjunction with magnetic or EM surveys to accurately locate buried objects.
ADVANTAGES – Site specific
With a low frequency antenna, in clean, dry, sandy soil, reflections from targets as deep as 100 feet are possible. Geologic features such as bedrock and cross bedding may be seen at some sites.
The resolution of data is very high particularly for high frequency antennas.
Shallow, man-made objects generally can be detected.
Fiberglass UST’s and plastic pipes can be detected using GPR.
LIMITATIONS - General
To acquire the highest quality data, proper coupling between the antenna and the ground surface is necessary. Poor data may be obtained at sites covered with debris, an uneven surface, tall grass and brush. Objects located at curbs are difficult to see.
Acquiring GPR data is slow. The antenna must be over the target. The signal from the antenna is cone-shaped. Reflections from objects to the side of the antenna may be seen, but their actual location relative to the antenna is not obvious.
Penetration of the GPR signal is "site specific" and its depth of penetration at a particular site cannot be predicted ahead of time. Near surface conductive material, such as salty or contaminated ground water and wet, clay-rich soil, may attenuate the radar signal, limiting the effective depth of the survey to several feet. Reinforced concrete also can attenuate the signal. Rebar may produce reflections that look like pipes.

GPR may not be cost-effective for some projects. For a detailed survey mapping underground storage tanks and utilities, it may be necessary to collect data in orthogonal directions at 5-foot line spacing.
LIMITATIONS – Interpretation
Interpretation can be difficult. Radar data are ambiguous. Subsurface objects can be detected but, in general, they cannot be identified. USTs and utilities have a characteristic reflection, however, large rocks and boulders have a similar reflection.
The reflection visible in a GPR record is very complex and may be caused by small changes in the electrical properties of the soil. The target in mind may not produce the reflection. Due to “noise”, the target may be missed. USTs and deep utilities may be missed if they are under debris and/or other pipes.
Other methods may be necessary to aid in the interpretation of the data (use a magnetometer to detect a large metallic mass, then GPR to determine if the object is tank-like, or a utility locator to determine if there are feed lines and fill pipes leading to the object).
Adequate contrast between the ground and the target is required to obtain reflections. UST’s may be missed if they are badly corroded. Utilities made of “earth” materials like clay and concrete may not be detected since their electrical properties are similar to the surrounding soil.
To determine the depth to an object without "ground truth", assumptions must be made regarding soil properties. Even with ground truth at several locations on the same site, changes in material across a site (therefore changes in signal velocity) can cause errors in depth measurements at other locations.

This Page Intentionally Left Blank
Appendix H
Boring Logs

This Page Intentionally Left Blank
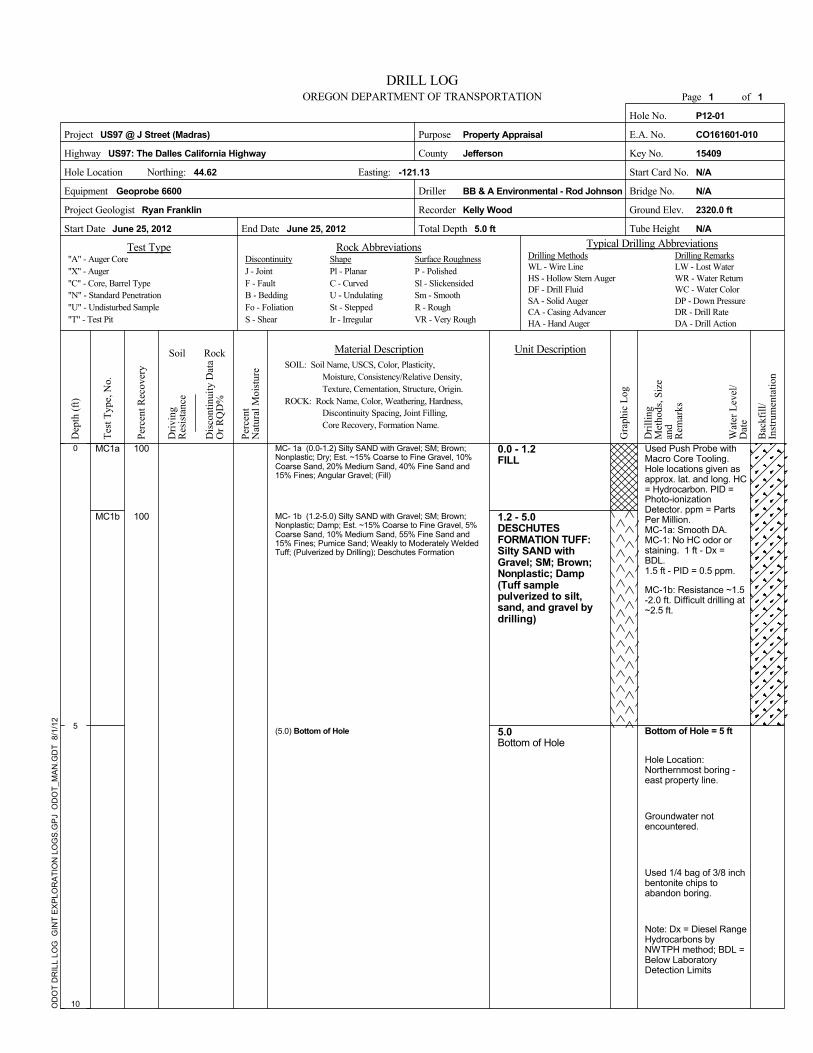
OREGON DEPARTMENT OF TRANSPORTATION
OD
OT
DR
ILL
LOG
GIN
T E
XP
LOR
ATI
ON
LO
GS
.GP
J O
DO
T_M
AN
.GD
T 8
/1/1
2
Test Type
US97: The Dalles California Highway
Geoprobe 6600
Start Date End Date
Purpose
County
Driller
June 25, 2012
DRILL LOG
June 25, 2012
Project
Highway
Hole Location
Equipment
Project Geologist
Typical Drilling AbbreviationsRock Abbreviations
P12-01
CO161601-010
15409
N/A
N/A
2320.0 ft
N/A
0.0 - 1.2FILL
5.0 ft
Groundwater notencountered.
1.2 - 5.0DESCHUTESFORMATION TUFF:Silty SAND withGravel; SM; Brown;Nonplastic; Damp(Tuff samplepulverized to silt,sand, and gravel bydrilling)
5.0Bottom of Hole
MC- 1a (0.0-1.2) Silty SAND with Gravel; SM; Brown;Nonplastic; Dry; Est. ~15% Coarse to Fine Gravel, 10%Coarse Sand, 20% Medium Sand, 40% Fine Sand and15% Fines; Angular Gravel; (Fill)
MC- 1b (1.2-5.0) Silty SAND with Gravel; SM; Brown;Nonplastic; Damp; Est. ~15% Coarse to Fine Gravel, 5%Coarse Sand, 10% Medium Sand, 55% Fine Sand and15% Fines; Pumice Sand; Weakly to Moderately WeldedTuff; (Pulverized by Drilling); Deschutes Formation
(5.0) Bottom of Hole
Used Push Probe withMacro Core Tooling.Hole locations given asapprox. lat. and long. HC= Hydrocarbon. PID =Photo-ionizationDetector. ppm = PartsPer Million.MC-1a: Smooth DA.MC-1: No HC odor orstaining. 1 ft - Dx =BDL.1.5 ft - PID = 0.5 ppm.
MC-1b: Resistance ~1.5-2.0 ft. Difficult drilling at~2.5 ft.
Hole Location:Northernmost boring -east property line.
44.62
Used 1/4 bag of 3/8 inchbentonite chips toabandon boring.
Note: Dx = Diesel RangeHydrocarbons byNWTPH method; BDL =Below LaboratoryDetection Limits
MC1a
MC1b
100
100
Bottom of Hole = 5 ft
Test
Typ
e, N
o.Hole No.
E.A. No.
Key No.
Start Card No.
Bridge No.
Ground Elev.
Tube Height
Dep
th (f
t)
10
0
Soil
Driv
ing
Res
ista
nce
Bac
kfill
/In
stru
men
tatio
n
Drilling RemarksLW - Lost WaterWR - Water ReturnWC - Water ColorDP - Down PressureDR - Drill RateDA - Drill Action
Perc
ent
Nat
ural
Moi
stur
e
Dis
cont
inui
ty D
ata
Or R
QD
%
5
Rock
Dril
ling
Met
hods
, Siz
ean
dR
emar
ks
Gra
phic
Log
Perc
ent R
ecov
ery
Unit Description
Wat
er L
evel
/D
ate
Property Appraisal
1
US97 @ J Street (Madras)
"A" - Auger Core"X" - Auger"C" - Core, Barrel Type"N" - Standard Penetration"U" - Undisturbed Sample"T" - Test Pit
BB & A Environmental - Rod Johnson
DiscontinuityJ - JointF - FaultB - BeddingFo - FoliationS - Shear
Jefferson
Ryan Franklin
-121.13
Total Depth
Recorder Kelly Wood
Surface RoughnessP - PolishedSl - SlickensidedSm - SmoothR - RoughVR - Very Rough
SOIL: Soil Name, USCS, Color, Plasticity,
ROCK: Rock Name, Color, Weathering, Hardness,
Moisture, Consistency/Relative Density,Texture, Cementation, Structure, Origin.
Material Description
ShapePl - PlanarC - CurvedU - UndulatingSt - SteppedIr - Irregular
Drilling MethodsWL - Wire LineHS - Hollow Stem AugerDF - Drill FluidSA - Solid AugerCA - Casing AdvancerHA - Hand Auger
1 ofPage
Easting:Northing:
Discontinuity Spacing, Joint Filling,Core Recovery, Formation Name.
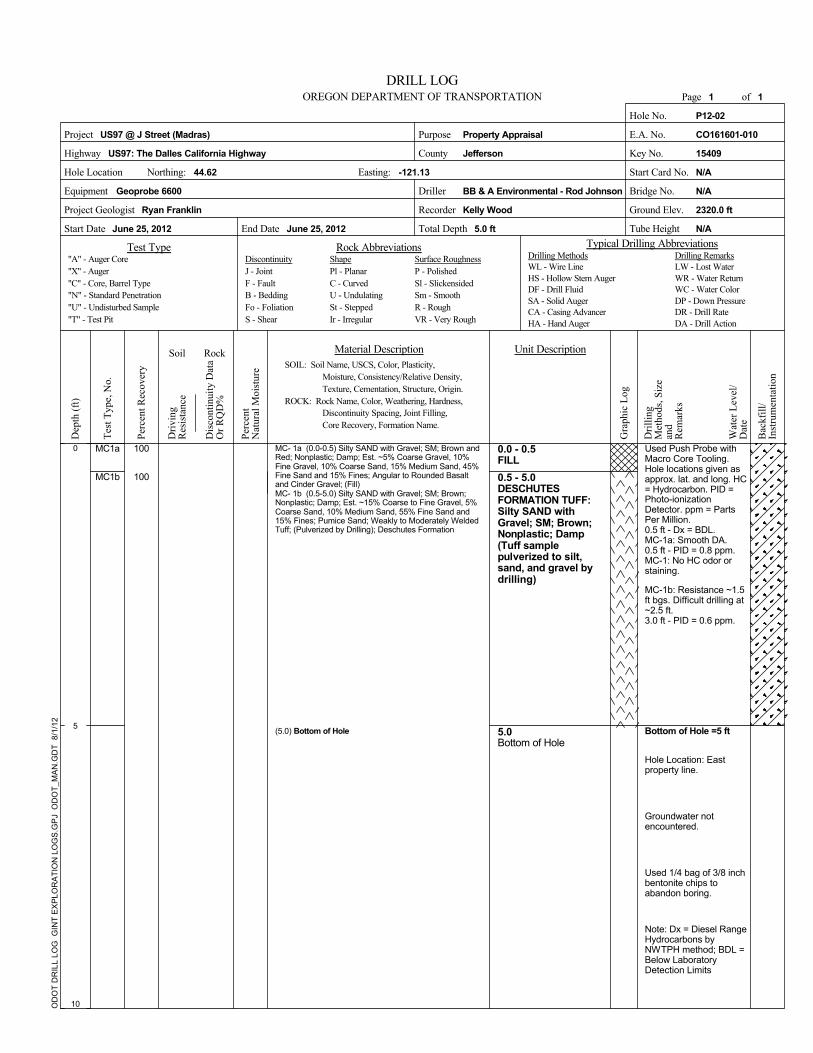
DRILL LOG
OD
OT
DR
ILL
LOG
GIN
T E
XP
LOR
ATI
ON
LO
GS
.GP
J O
DO
T_M
AN
.GD
T 8
/1/1
2
Test Type
US97: The Dalles California Highway
Geoprobe 6600
Start Date End Date
Purpose
County
Driller
June 25, 2012
Highway
Hole No.
E.A. No.
Key No.
Start Card No.
Bridge No.
Ground Elev.
Tube Height
0.0 - 0.5FILL
Rock Abbreviations Typical Drilling Abbreviations
Project Geologist
Hole Location
Project
OREGON DEPARTMENT OF TRANSPORTATION
Equipment
Bottom of Hole =5 ft
0.5 - 5.0DESCHUTESFORMATION TUFF:Silty SAND withGravel; SM; Brown;Nonplastic; Damp(Tuff samplepulverized to silt,sand, and gravel bydrilling)
5.0Bottom of Hole
MC- 1a (0.0-0.5) Silty SAND with Gravel; SM; Brown andRed; Nonplastic; Damp; Est. ~5% Coarse Gravel, 10%Fine Gravel, 10% Coarse Sand, 15% Medium Sand, 45%Fine Sand and 15% Fines; Angular to Rounded Basaltand Cinder Gravel; (Fill)MC- 1b (0.5-5.0) Silty SAND with Gravel; SM; Brown;Nonplastic; Damp; Est. ~15% Coarse to Fine Gravel, 5%Coarse Sand, 10% Medium Sand, 55% Fine Sand and15% Fines; Pumice Sand; Weakly to Moderately WeldedTuff; (Pulverized by Drilling); Deschutes Formation
(5.0) Bottom of Hole
Used Push Probe withMacro Core Tooling.Hole locations given asapprox. lat. and long. HC= Hydrocarbon. PID =Photo-ionizationDetector. ppm = PartsPer Million.0.5 ft - Dx = BDL.MC-1a: Smooth DA.0.5 ft - PID = 0.8 ppm.MC-1: No HC odor orstaining.
June 25, 2012
MC1b 100
100
MC-1b: Resistance ~1.5ft bgs. Difficult drilling at~2.5 ft.3.0 ft - PID = 0.6 ppm.
MC1a
Note: Dx = Diesel RangeHydrocarbons byNWTPH method; BDL =Below LaboratoryDetection Limits
Used 1/4 bag of 3/8 inchbentonite chips toabandon boring.
Groundwater notencountered.
Hole Location: Eastproperty line.
5.0 ft
Bac
kfill
/In
stru
men
tatio
n
P12-02
CO161601-010
15409
N/A
N/A
2320.0 ft
N/A
Unit Description
5
Test
Typ
e, N
o.
Dep
th (f
t)
10
0
44.62
Rock
Dril
ling
Met
hods
, Siz
ean
dR
emar
ks
Wat
er L
evel
/D
ate
Perc
ent R
ecov
ery
Perc
ent
Nat
ural
Moi
stur
e
Soil
Driv
ing
Res
ista
nce
Gra
phic
Log
SOIL: Soil Name, USCS, Color, Plasticity,
ShapePl - PlanarC - CurvedU - UndulatingSt - SteppedIr - Irregular
Drilling RemarksLW - Lost WaterWR - Water ReturnWC - Water ColorDP - Down PressureDR - Drill RateDA - Drill Action
Recorder
Total Depth
-121.13
Ryan Franklin
Jefferson
Property Appraisal
BB & A Environmental - Rod Johnson
Kelly Wood
US97 @ J Street (Madras)
Dis
cont
inui
ty D
ata
Or R
QD
%
of
ROCK: Rock Name, Color, Weathering, Hardness,
Moisture, Consistency/Relative Density,Texture, Cementation, Structure, Origin.
Material Description
Discontinuity Spacing, Joint Filling,Core Recovery, Formation Name.
Drilling MethodsWL - Wire LineHS - Hollow Stem AugerDF - Drill FluidSA - Solid AugerCA - Casing AdvancerHA - Hand Auger
1 1Page
Easting:Northing:
DiscontinuityJ - JointF - FaultB - BeddingFo - FoliationS - Shear
"A" - Auger Core"X" - Auger"C" - Core, Barrel Type"N" - Standard Penetration"U" - Undisturbed Sample"T" - Test Pit
Surface RoughnessP - PolishedSl - SlickensidedSm - SmoothR - RoughVR - Very Rough

DRILL LOG
Test Type
US97: The Dalles California Highway
Geoprobe 6600
Start Date End Date
Purpose
County
Driller
June 25, 2012
OD
OT
DR
ILL
LOG
GIN
T E
XP
LOR
ATI
ON
LO
GS
.GP
J O
DO
T_M
AN
.GD
T 8
/1/1
2
OREGON DEPARTMENT OF TRANSPORTATION
Project
Highway
Hole Location
Equipment
Project Geologist
Typical Drilling AbbreviationsRock Abbreviations
0.0 - 0.5FILL
Hole No.
E.A. No.
Key No.
Start Card No.
Bridge No.
Ground Elev.
Tube Height
Hole Location: Eastproperty line.
0.5 - 5.0DESCHUTESFORMATION TUFF:Silty SAND withGravel; SM; Brown;Nonplastic; Damp(Tuff samplepulverized to silt,sand, and gravel bydrilling)
5.0Bottom of Hole
MC- 1a (0.0-0.5) Silty SAND with Gravel; SM; DarkBrown and Red; Nonplastic; Moist; Est. ~15% Coarse toFine Gravel, 10% Coarse Sand, 15% Medium Sand, 45%Fine Sand and 15% Fines; Angular to Rounded Basaltand Cinder Gravel; (Fill)MC- 1b (0.5-5.0) Silty SAND with Gravel; SM; Brown;Nonplastic; Damp; Est. ~15% Coarse to Fine Gravel, 5%Coarse Sand, 10% Medium Sand, 55% Fine Sand and15% Fines; Pumice Sand; Weakly to Moderately WeldedTuff; (Pulverized by Drilling); Deschutes Formation
(5.0) Bottom of Hole
Used Push Probe withMacro Core Tooling.Hole locations given asapprox. lat. and long. HC= Hydrocarbon. PID =Photo-ionizationDetector. ppm = PartsPer Million.MC-1a: Smooth DA. 0.5ft - Dx = BDL.PID-0.4' = 0.2 ppm.MC-1: No HC odor orstaining.MC-1b: Slow DR 2.0-5.0ft.
June 25, 2012 5.0 ft
100
100
4.0 ft - PID = 0.3 ppm.
Bottom of Hole = 5 ft
MC1b
MC1a
Note: Dx = Diesel RangeHydrocarbons byNWTPH method; BDL =Below LaboratoryDetection Limits
Used 1/4 bag of 3/8 inchbentonite chips toabandon boring.
Groundwater notencountered.
P12-03
CO161601-010
15409
N/A
N/A
2320.0 ft
N/A
Test
Typ
e, N
o.
Dep
th (f
t)
10
0
Soil
Driv
ing
Res
ista
nce
Bac
kfill
/In
stru
men
tatio
n
Unit Description
Perc
ent
Nat
ural
Moi
stur
e
Dis
cont
inui
ty D
ata
Or R
QD
%
5
Rock
Dril
ling
Met
hods
, Siz
ean
dR
emar
ks
Gra
phic
Log
Perc
ent R
ecov
ery
Wat
er L
evel
/D
ate
Jefferson
US97 @ J Street (Madras)
Kelly Wood
ShapePl - PlanarC - CurvedU - UndulatingSt - SteppedIr - Irregular
Property Appraisal
"A" - Auger Core"X" - Auger"C" - Core, Barrel Type"N" - Standard Penetration"U" - Undisturbed Sample"T" - Test Pit
Ryan Franklin
-121.13
Total Depth
Recorder
Drilling RemarksLW - Lost WaterWR - Water ReturnWC - Water ColorDP - Down PressureDR - Drill RateDA - Drill Action
BB & A Environmental - Rod Johnson
Surface RoughnessP - PolishedSl - SlickensidedSm - SmoothR - RoughVR - Very Rough
SOIL: Soil Name, USCS, Color, Plasticity,
ROCK: Rock Name, Color, Weathering, Hardness,
Moisture, Consistency/Relative Density,Texture, Cementation, Structure, Origin.
Material Description
1
Drilling MethodsWL - Wire LineHS - Hollow Stem AugerDF - Drill FluidSA - Solid AugerCA - Casing AdvancerHA - Hand Auger
44.62
1 ofPage
Easting:Northing:
DiscontinuityJ - JointF - FaultB - BeddingFo - FoliationS - Shear
Discontinuity Spacing, Joint Filling,Core Recovery, Formation Name.

OREGON DEPARTMENT OF TRANSPORTATION
Test Type
US97: The Dalles California Highway
Geoprobe 6600
Start Date End Date
Purpose
County
Driller
June 25, 2012
OD
OT
DR
ILL
LOG
GIN
T E
XP
LOR
ATI
ON
LO
GS
.GP
J O
DO
T_M
AN
.GD
T 8
/1/1
2
DRILL LOG
Project
Highway
Hole Location
Equipment
Project Geologist
Typical Drilling AbbreviationsRock Abbreviations
P12-04
CO161601-010
15409
N/A
N/A
2320.0 ft
N/A
0.0 - 1.0FILL
5.0 ft
Groundwater notencountered.
1.0 - 5.0DESCHUTESFORMATION TUFF:Silty SAND withGravel; SM; Brown;Nonplastic; Damp(Tuff samplepulverized to silt,sand, and gravel bydrilling)
5.0Bottom of Hole
MC- 1a (0.0-1.0) Silty SAND with Gravel; SM; Brown andRed; Nonplastic; Damp; Est. ~15% Coarse to Fine Gravel,10% Coarse Sand, 15% Medium Sand, 45% Fine Sandand 15% Fines; Abundant Pumice and Cinder;Subrounded Gravel; (Fill)
MC- 1b (1.0-5.0) Silty SAND with Gravel; SM; Brown;Nonplastic; Damp; Est. ~15% Coarse to Fine Gravel, 5%Coarse Sand, 10% Medium Sand, 55% Fine Sand and15% Fines; Pumice Sand; Weakly to Moderately WeldedTuff; (Pulverized by Drilling); Deschutes Formation
(5.0) Bottom of Hole
Used Push Probe withMacro Core Tooling.Hole locations given asapprox. lat. and long. HC= Hydrocarbon. PID =Photo-ionizationDetector. ppm = PartsPer Million.MC-1a: Smooth DA.PID-0.7' = 0.1 ppm.MC-1: No HC Odor orStaining. 1 ft - Dx =BDL.MC-1b: Resistance at~2.0 ft. Slow DR 2.0-5.0ft.
5.0 ft - PID = 0.1 ppm.
44.62
90
Bottom of Hole = 5 ft
Hole Location:Southernmost boring -east property line.
MC1b
MC1a
Note: Dx = Diesel RangeHydrocarbons byNWTPH method; BDL =Below LaboratoryDetection Limits
Used 1/4 Bag of 3/8 inchBentonite Chips toAbandon Boring.
June 25, 2012
90
Test
Typ
e, N
o.Hole No.
E.A. No.
Key No.
Start Card No.
Bridge No.
Ground Elev.
Tube Height
Dep
th (f
t)
10
0
Soil
Driv
ing
Res
ista
nce
Bac
kfill
/In
stru
men
tatio
n
Drilling RemarksLW - Lost WaterWR - Water ReturnWC - Water ColorDP - Down PressureDR - Drill RateDA - Drill Action
Perc
ent
Nat
ural
Moi
stur
e
Dis
cont
inui
ty D
ata
Or R
QD
%
5
Rock
Dril
ling
Met
hods
, Siz
ean
dR
emar
ks
Gra
phic
Log
Perc
ent R
ecov
ery
Unit Description
Wat
er L
evel
/D
ate
Property Appraisal
1
US97 @ J Street (Madras)
"A" - Auger Core"X" - Auger"C" - Core, Barrel Type"N" - Standard Penetration"U" - Undisturbed Sample"T" - Test Pit
BB & A Environmental - Rod Johnson
DiscontinuityJ - JointF - FaultB - BeddingFo - FoliationS - Shear
Jefferson
Ryan Franklin
-121.13
Total Depth
Recorder Kelly Wood
Surface RoughnessP - PolishedSl - SlickensidedSm - SmoothR - RoughVR - Very Rough
SOIL: Soil Name, USCS, Color, Plasticity,
ROCK: Rock Name, Color, Weathering, Hardness,
Moisture, Consistency/Relative Density,Texture, Cementation, Structure, Origin.
Material Description
ShapePl - PlanarC - CurvedU - UndulatingSt - SteppedIr - Irregular
Drilling MethodsWL - Wire LineHS - Hollow Stem AugerDF - Drill FluidSA - Solid AugerCA - Casing AdvancerHA - Hand Auger
1 ofPage
Easting:Northing:
Discontinuity Spacing, Joint Filling,Core Recovery, Formation Name.
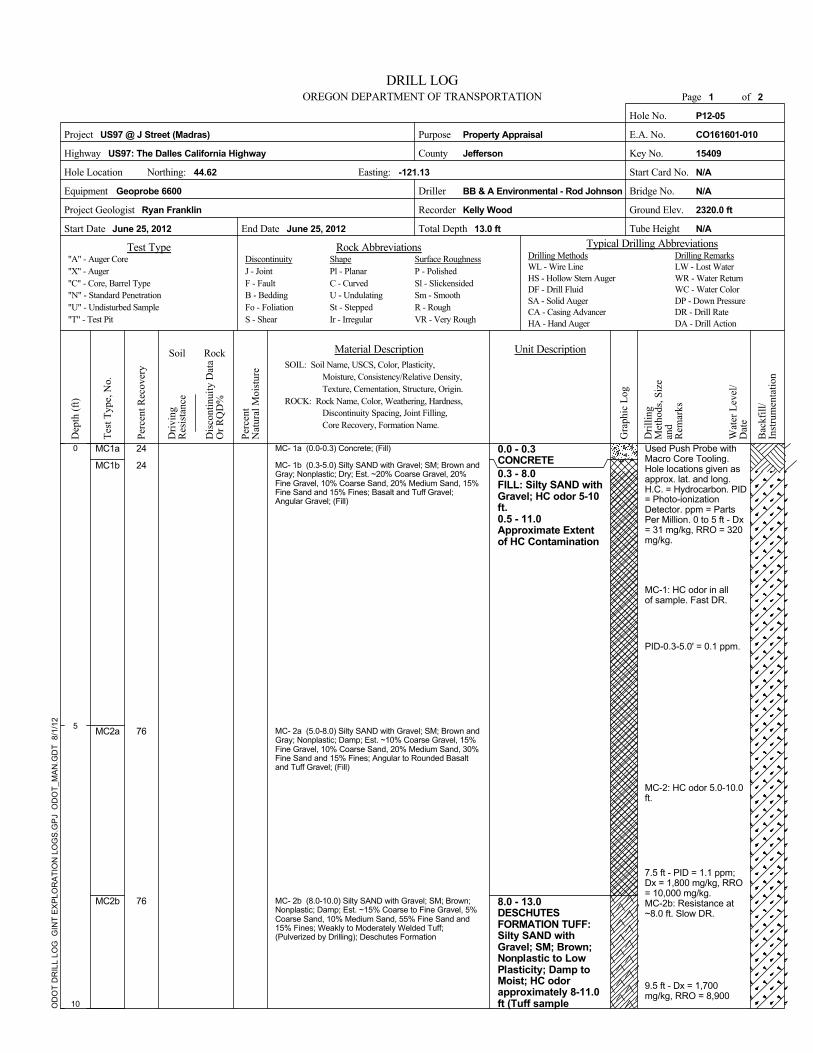
Purpose
End DateStart Date
Geoprobe 6600 Driller
Test Type
June 25, 2012 June 25, 2012
OD
OT
DR
ILL
LOG
GIN
T E
XP
LOR
ATI
ON
LO
GS
.GP
J O
DO
T_M
AN
.GD
T 8
/1/1
2
US97: The Dalles California Highway
Rock Abbreviations
0.0 - 0.3CONCRETE
Project Geologist
Equipment
Hole Location
County
Project
OREGON DEPARTMENT OF TRANSPORTATIONDRILL LOG
Highway
MC- 1b (0.3-5.0) Silty SAND with Gravel; SM; Brown andGray; Nonplastic; Dry; Est. ~20% Coarse Gravel, 20%Fine Gravel, 10% Coarse Sand, 20% Medium Sand, 15%Fine Sand and 15% Fines; Basalt and Tuff Gravel;Angular Gravel; (Fill)
MC-2: HC odor 5.0-10.0ft.
PID-0.3-5.0' = 0.1 ppm.
MC-1: HC odor in all of sample. Fast DR.
Used Push Probe withMacro Core Tooling.Hole locations given asapprox. lat. and long.H.C. = Hydrocarbon. PID= Photo-ionizationDetector. ppm = PartsPer Million. 0 to 5 ft - Dx= 31 mg/kg, RRO = 320mg/kg.
MC-2b: Resistance at~8.0 ft. Slow DR.
MC- 2a (5.0-8.0) Silty SAND with Gravel; SM; Brown andGray; Nonplastic; Damp; Est. ~10% Coarse Gravel, 15%Fine Gravel, 10% Coarse Sand, 20% Medium Sand, 30%Fine Sand and 15% Fines; Angular to Rounded Basaltand Tuff Gravel; (Fill)
9.5 ft - Dx = 1,700mg/kg, RRO = 8,900
MC- 1a (0.0-0.3) Concrete; (Fill)
8.0 - 13.0DESCHUTESFORMATION TUFF:Silty SAND withGravel; SM; Brown;Nonplastic to LowPlasticity; Damp toMoist; HC odorapproximately 8-11.0ft (Tuff sample
0.5 - 11.0Approximate Extentof HC Contamination
0.3 - 8.0FILL: Silty SAND withGravel; HC odor 5-10ft.
MC- 2b (8.0-10.0) Silty SAND with Gravel; SM; Brown;Nonplastic; Damp; Est. ~15% Coarse to Fine Gravel, 5%Coarse Sand, 10% Medium Sand, 55% Fine Sand and15% Fines; Weakly to Moderately Welded Tuff;(Pulverized by Drilling); Deschutes Formation
76
76
24
24
7.5 ft - PID = 1.1 ppm;Dx = 1,800 mg/kg, RRO= 10,000 mg/kg.
P12-05
CO161601-010
15409
N/A
N/A
2320.0 ft
N/A
MC2b
MC2a
MC1b
MC1a
Hole No.
E.A. No.
Key No.
Start Card No.
Bridge No.
Ground Elev.
Tube Height
0
Driv
ing
Res
ista
nce
Dep
th (f
t)
Bac
kfill
/In
stru
men
tatio
n
Test
Typ
e, N
o.
Unit Description
Typical Drilling Abbreviations
5
10
Rock
Dril
ling
Met
hods
, Siz
ean
dR
emar
ks
Wat
er L
evel
/D
ate
Perc
ent R
ecov
ery
Soil
ROCK: Rock Name, Color, Weathering, Hardness,
Gra
phic
Log
Perc
ent
Nat
ural
Moi
stur
e
-121.13
Dis
cont
inui
ty D
ata
Or R
QD
%
US97 @ J Street (Madras)
Kelly Wood
BB & A Environmental - Rod Johnson
Property Appraisal
Ryan Franklin
Total Depth
Recorder
Drilling RemarksLW - Lost WaterWR - Water ReturnWC - Water ColorDP - Down PressureDR - Drill RateDA - Drill Action
44.62
13.0 ft
Jefferson
Page
Moisture, Consistency/Relative Density,Texture, Cementation, Structure, Origin.
Material Description
Discontinuity Spacing, Joint Filling,Core Recovery, Formation Name.
Drilling MethodsWL - Wire LineHS - Hollow Stem AugerDF - Drill FluidSA - Solid AugerCA - Casing AdvancerHA - Hand Auger
Surface RoughnessP - PolishedSl - SlickensidedSm - SmoothR - RoughVR - Very Rough
of
SOIL: Soil Name, USCS, Color, Plasticity,
Easting:Northing:
DiscontinuityJ - JointF - FaultB - BeddingFo - FoliationS - Shear
"A" - Auger Core"X" - Auger"C" - Core, Barrel Type"N" - Standard Penetration"U" - Undisturbed Sample"T" - Test Pit
ShapePl - PlanarC - CurvedU - UndulatingSt - SteppedIr - Irregular
21
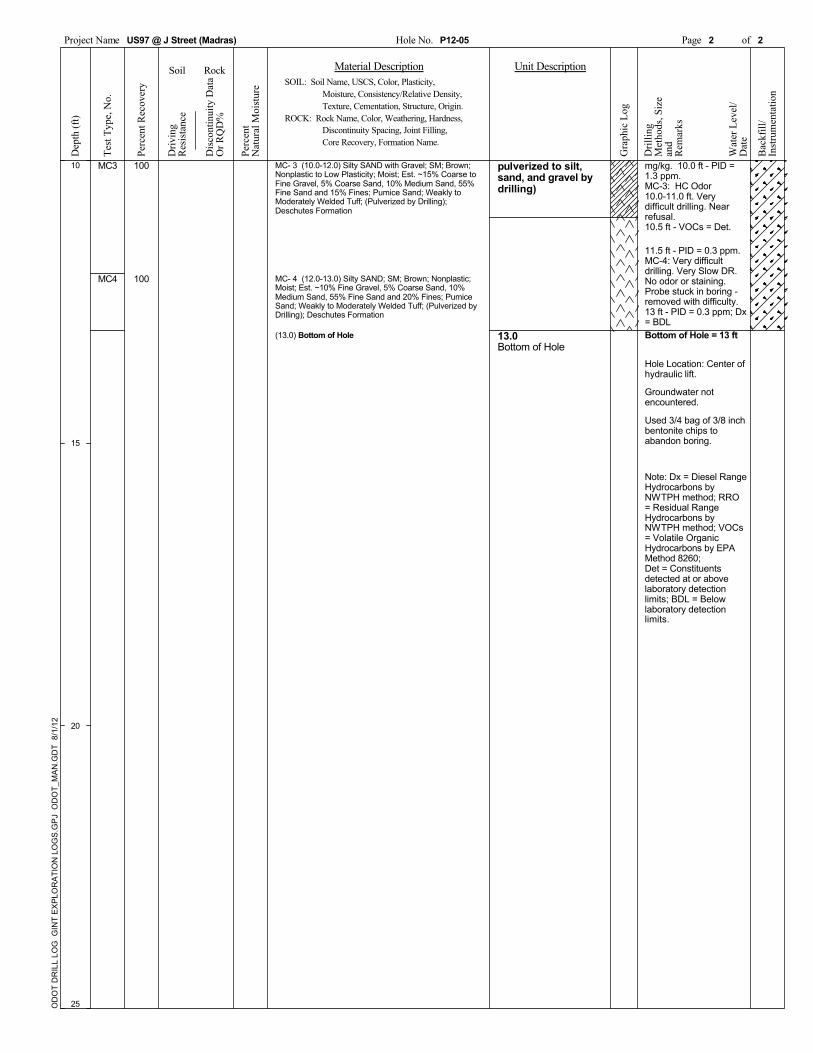
MC3
MC4
100
100
OD
OT
DR
ILL
LOG
GIN
T E
XP
LOR
ATI
ON
LO
GS
.GP
J O
DO
T_M
AN
.GD
T 8
/1/1
2
Used 3/4 bag of 3/8 inchbentonite chips toabandon boring.
Project Name US97 @ J Street (Madras) Hole No. P12-05
pulverized to silt,sand, and gravel bydrilling)
of
11.5 ft - PID = 0.3 ppm.
13.0Bottom of Hole
MC- 3 (10.0-12.0) Silty SAND with Gravel; SM; Brown;Nonplastic to Low Plasticity; Moist; Est. ~15% Coarse toFine Gravel, 5% Coarse Sand, 10% Medium Sand, 55%Fine Sand and 15% Fines; Pumice Sand; Weakly toModerately Welded Tuff; (Pulverized by Drilling);Deschutes Formation
MC- 4 (12.0-13.0) Silty SAND; SM; Brown; Nonplastic;Moist; Est. ~10% Fine Gravel, 5% Coarse Sand, 10%Medium Sand, 55% Fine Sand and 20% Fines; PumiceSand; Weakly to Moderately Welded Tuff; (Pulverized byDrilling); Deschutes Formation
(13.0) Bottom of Hole
mg/kg. 10.0 ft - PID =1.3 ppm.
Det = Constituentsdetected at or abovelaboratory detectionlimits; BDL = Belowlaboratory detectionlimits.
10.5 ft - VOCs = Det.
Note: Dx = Diesel RangeHydrocarbons byNWTPH method; RRO= Residual RangeHydrocarbons byNWTPH method; VOCs= Volatile OrganicHydrocarbons by EPAMethod 8260;
MC-4: Very difficultdrilling. Very Slow DR.No odor or staining.Probe stuck in boring -removed with difficulty.13 ft - PID = 0.3 ppm; Dx= BDLBottom of Hole = 13 ft
Hole Location: Center ofhydraulic lift.
Groundwater notencountered.
2
MC-3: HC Odor10.0-11.0 ft. Verydifficult drilling. Nearrefusal.
Page
Bac
kfill
/In
stru
men
tatio
n
Gra
phic
Log
Soil
Perc
ent
Nat
ural
Moi
stur
e
Perc
ent R
ecov
ery
Wat
er L
evel
/D
ate
Dril
ling
Met
hods
, Siz
ean
dR
emar
ks
Rock
15
20
Dis
cont
inui
ty D
ata
Or R
QD
%
Discontinuity Spacing, Joint Filling,Core Recovery, Formation Name.
ROCK: Rock Name, Color, Weathering, Hardness,
SOIL: Soil Name, USCS, Color, Plasticity,Unit Description
Driv
ing
Res
ista
nce
Material Description
Moisture, Consistency/Relative Density,Texture, Cementation, Structure, Origin.
Test
Typ
e, N
o.
Dep
th (f
t)
25
10
2

June 25, 2012
Test Type
US97: The Dalles California Highway
Geoprobe 6600
Start Date End Date
Purpose
County
OD
OT
DR
ILL
LOG
GIN
T E
XP
LOR
ATI
ON
LO
GS
.GP
J O
DO
T_M
AN
.GD
T 8
/1/1
2
Rock Abbreviations
0.0 - 0.5CONCRETE
Project Geologist
Equipment
Hole Location
Driller
Project
June 25, 2012
OREGON DEPARTMENT OF TRANSPORTATIONDRILL LOG
Highway
MC- 1b (0.5-1.5) Silty SAND with Gravel; SM; Brown andGray; Nonplastic; Dry; Est. ~20% Coarse Gravel, 20%Fine Gravel, 10% Coarse Sand, 20% Medium Sand, 15%Fine Sand and 15% Fines; Angular Basalt Gravel; (Fill)
MC-2: No HC odor orstaining. Slow DR. Nearrefusal. Roots insample.
4.8 ft - PID = 0.1 ppm.
MC-1: No HC odor orstaining. Fast DR.
Used Push Probe withMacro Core Tooling.Hole locations given asapprox. lat. and long. HC= Hydrocarbon. PID =Photo-ionizationDetector. ppm = PartsPer Million.
9.0 ft - PID = 2.2 ppm.
MC- 1c (1.5-5.0) Silty SAND with Gravel; SM; Brown andTan; Nonplastic; Dry; Est. ~10% Coarse Gravel, 10% FineGravel, 5% Coarse Sand, 15% Medium Sand, 45% FineSand and 15% Fines; Abundant Pumice Sand; Weakly toModerately Welded Tuff; (Pulverized by Drilling);Deschutes Formation
MC1a MC- 1a (0.0-0.5) Concrete
1.5 - 10.0DESCHUTESFORMATION TUFF:Silty SAND withGravel; Brown andTan; Nonplastic; Dryto Damp (Tuff samplepulverized to silt,sand, and gravel bydrilling)
0.5 - 1.5FILL: Silty SAND withGravel
MC- 2 (5.0-10.0) Silty SAND with Gravel; SM; Brown;Nonplastic; Damp; Est. ~15% Coarse to Fine Gravel, 5%Coarse Sand, 10% Medium Sand, 50% Fine Sand and20% Fines; Pumice Sand; Weakly to Moderately WeldedTuff; (Pulverized by Drilling); Deschutes Formation
P12-06
CO161601-010
15409
N/A
N/A
2320.0 ft
N/A
90
60
60
8 ft - Dx = BDL.
MC2
MC1c
MC1b
60
Test
Typ
e, N
o.
ROCK: Rock Name, Color, Weathering, Hardness,
0
10
Dep
th (f
t)
Soil Unit Description
Typical Drilling Abbreviations
5
Rock
Dril
ling
Met
hods
, Siz
ean
dR
emar
ks
Wat
er L
evel
/D
ate
Perc
ent R
ecov
ery
Perc
ent
Nat
ural
Moi
stur
e
Moisture, Consistency/Relative Density,Texture, Cementation, Structure, Origin.
Gra
phic
Log
Bac
kfill
/In
stru
men
tatio
n
Driv
ing
Res
ista
nce
-121.13
Hole No.
E.A. No.
Key No.
Start Card No.
Bridge No.
Ground Elev.
Tube Height
US97 @ J Street (Madras)
Kelly Wood
BB & A Environmental - Rod Johnson
Property Appraisal
Ryan Franklin
Total Depth
Recorder
Drilling RemarksLW - Lost WaterWR - Water ReturnWC - Water ColorDP - Down PressureDR - Drill RateDA - Drill Action
44.62
10.0 ft
Jefferson
Page
Dis
cont
inui
ty D
ata
Or R
QD
%
Material Description
Discontinuity Spacing, Joint Filling,Core Recovery, Formation Name.
Drilling MethodsWL - Wire LineHS - Hollow Stem AugerDF - Drill FluidSA - Solid AugerCA - Casing AdvancerHA - Hand Auger
Surface RoughnessP - PolishedSl - SlickensidedSm - SmoothR - RoughVR - Very Rough
of
SOIL: Soil Name, USCS, Color, Plasticity,
Easting:Northing:
DiscontinuityJ - JointF - FaultB - BeddingFo - FoliationS - Shear
"A" - Auger Core"X" - Auger"C" - Core, Barrel Type"N" - Standard Penetration"U" - Undisturbed Sample"T" - Test Pit
ShapePl - PlanarC - CurvedU - UndulatingSt - SteppedIr - Irregular
21

Page
Test
Typ
e, N
o.
Unit DescriptionSOIL: Soil Name, USCS, Color, Plasticity,
ROCK: Rock Name, Color, Weathering, Hardness,
Moisture, Consistency/Relative Density,Texture, Cementation, Structure, Origin.
Material Description
Discontinuity Spacing, Joint Filling,Core Recovery, Formation Name.
2
10.0Bottom of Hole
of
25
P12-06Hole No.US97 @ J Street (Madras)Project Name
Note: Dx = Diesel RangeHydrocarbons byNWTPH method; BDL =Below LaboratoryDetection Limits
Used 1/2 bag of 3/8 inchbentonite chips toabandon boring.
Groundwater notencountered.
Hole Location: Adjacentnorth of hydraulic lift.
Bottom of Hole = 10 ft(10.0) Bottom of Hole
2
Dis
cont
inui
ty D
ata
Or R
QD
%
15
20
Rock
Dril
ling
Met
hods
, Siz
ean
dR
emar
ks
Wat
er L
evel
/D
ate
Perc
ent R
ecov
ery
Perc
ent
Nat
ural
Moi
stur
e
Dep
th (f
t)
Gra
phic
Log
Bac
kfill
/In
stru
men
tatio
n
Driv
ing
Res
ista
nce
Soil
10
OD
OT
DR
ILL
LOG
GIN
T E
XP
LOR
ATI
ON
LO
GS
.GP
J O
DO
T_M
AN
.GD
T 8
/1/1
2

June 25, 2012
Test Type
US97: The Dalles California Highway
Geoprobe 6600
Start Date End Date
Purpose
County
OD
OT
DR
ILL
LOG
GIN
T E
XP
LOR
ATI
ON
LO
GS
.GP
J O
DO
T_M
AN
.GD
T 8
/1/1
2
Rock Abbreviations
0.0 - 0.5CONCRETE
Project Geologist
Equipment
Hole Location
Driller
Project
June 25, 2012
OREGON DEPARTMENT OF TRANSPORTATIONDRILL LOG
Highway
MC- 1b (0.5-1.5) Silty SAND with Gravel; SM; Brown andGray; Nonplastic; Dry; Est. ~20% Coarse Gravel, 20%Fine Gravel, 10% Coarse Sand, 20% Medium Sand, 15%Fine Sand and 15% Fines; Angular Basalt Gravel; (Fill)
MC-2: No HC odor orstaining. very difficultdrilling. Slow DR. Nearrefusal. Liner stuck incore rod.
4.0 - 5.0 ft - PID = 1.0ppm.
MC-1: No HC odor orstaining. Driller statesvery hard compactedmaterial beneathconcrete.
Used Push Probe withMacro Core Tooling.Hole locations given asapprox. lat. and long. HC= Hydrocarbon. PID =Photo-ionizationDetector. ppm = PartsPer Million.
9.5 ft - PID = 0.4 ppm.
MC- 1c (1.5-5.0) Silty SAND with Gravel; SM; Brown andTan; Nonplastic; Dry; Est. ~10% Coarse Gravel, 10% FineGravel, 5% Coarse Sand, 15% Medium Sand, 45% FineSand and 15% Fines; Abundant Pumice Sand; Weakly toModerately Welded Tuff; (Pulverized by Drilling);Deschutes Formation
MC1a MC- 1a (0.0-0.5) Concrete
1.5 - 10.0DESCHUTESFORMATION TUFF:Silty SAND withGravel; Brown andTan; Nonplastic; Dryto Damp (Tuff samplepulverized to silt,sand, and gravel bydrilling)
0.5 - 1.5FILL: Silty SAND withGravel
MC- 2 (5.0-10.0) Silty SAND with Gravel; SM; Brown;Nonplastic; Damp; Est. ~15% Coarse to Fine Gravel, 5%Coarse Sand, 10% Medium Sand, 50% Fine Sand and20% Fines; Pumice Sand; Weakly to Moderately WeldedTuff; (Pulverized by Drilling); Deschutes Formation
P12-07
CO161601-010
15409
N/A
N/A
2320.0 ft
N/A
90
60
60
9 ft - Dx = BDL
MC2
MC1c
MC1b
60
Test
Typ
e, N
o.
ROCK: Rock Name, Color, Weathering, Hardness,
0
10
Dep
th (f
t)
Soil Unit Description
Typical Drilling Abbreviations
5
Rock
Dril
ling
Met
hods
, Siz
ean
dR
emar
ks
Wat
er L
evel
/D
ate
Perc
ent R
ecov
ery
Perc
ent
Nat
ural
Moi
stur
e
Moisture, Consistency/Relative Density,Texture, Cementation, Structure, Origin.
Gra
phic
Log
Bac
kfill
/In
stru
men
tatio
n
Driv
ing
Res
ista
nce
-121.13
Hole No.
E.A. No.
Key No.
Start Card No.
Bridge No.
Ground Elev.
Tube Height
US97 @ J Street (Madras)
Kelly Wood
BB & A Environmental - Rod Johnson
Property Appraisal
Ryan Franklin
Total Depth
Recorder
Drilling RemarksLW - Lost WaterWR - Water ReturnWC - Water ColorDP - Down PressureDR - Drill RateDA - Drill Action
44.62
10.0 ft
Jefferson
Page
Dis
cont
inui
ty D
ata
Or R
QD
%
Material Description
Discontinuity Spacing, Joint Filling,Core Recovery, Formation Name.
Drilling MethodsWL - Wire LineHS - Hollow Stem AugerDF - Drill FluidSA - Solid AugerCA - Casing AdvancerHA - Hand Auger
Surface RoughnessP - PolishedSl - SlickensidedSm - SmoothR - RoughVR - Very Rough
of
SOIL: Soil Name, USCS, Color, Plasticity,
Easting:Northing:
DiscontinuityJ - JointF - FaultB - BeddingFo - FoliationS - Shear
"A" - Auger Core"X" - Auger"C" - Core, Barrel Type"N" - Standard Penetration"U" - Undisturbed Sample"T" - Test Pit
ShapePl - PlanarC - CurvedU - UndulatingSt - SteppedIr - Irregular
21

Page
Test
Typ
e, N
o.
Unit DescriptionSOIL: Soil Name, USCS, Color, Plasticity,
ROCK: Rock Name, Color, Weathering, Hardness,
Moisture, Consistency/Relative Density,Texture, Cementation, Structure, Origin.
Material Description
Discontinuity Spacing, Joint Filling,Core Recovery, Formation Name.
2
10.0Bottom of Hole
of
25
P12-07Hole No.US97 @ J Street (Madras)Project Name
Note: Dx = Diesel RangeHydrocarbons byNWTPH method; BDL =Below LaboratoryDetection Limits
Used 1/3 bag of 3/8 inchbentonite chips toabandon boring.
Groundwater notencountered.
Hole Location: Adjacentsouth of hydraulic lift.
Bottom of Hole = 10 ft(10.0) Bottom of Hole
2
Dis
cont
inui
ty D
ata
Or R
QD
%
15
20
Rock
Dril
ling
Met
hods
, Siz
ean
dR
emar
ks
Wat
er L
evel
/D
ate
Perc
ent R
ecov
ery
Perc
ent
Nat
ural
Moi
stur
e
Dep
th (f
t)
Gra
phic
Log
Bac
kfill
/In
stru
men
tatio
n
Driv
ing
Res
ista
nce
Soil
10
OD
OT
DR
ILL
LOG
GIN
T E
XP
LOR
ATI
ON
LO
GS
.GP
J O
DO
T_M
AN
.GD
T 8
/1/1
2
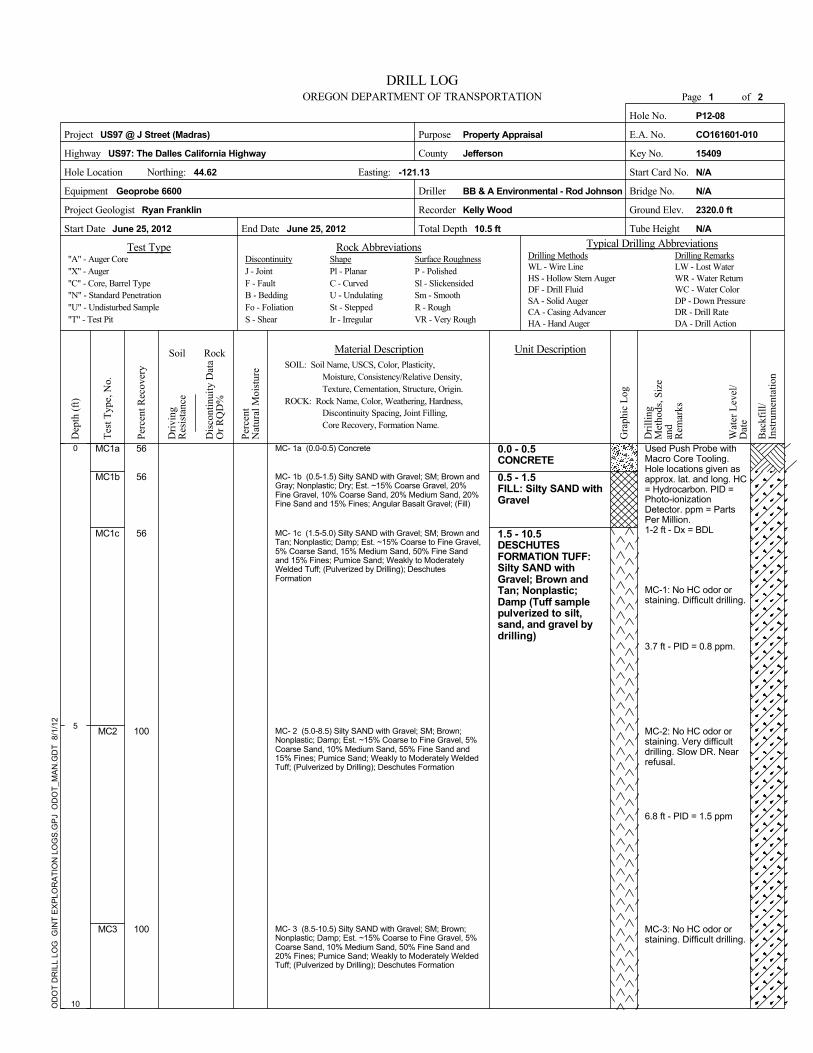
End DateStart Date
Geoprobe 6600
US97: The Dalles California Highway County
Driller
June 25, 2012
Rock AbbreviationsTest Type
0.0 - 0.5CONCRETE
Project Geologist
Equipment
Hole Location
Highway
Purpose
100
OREGON DEPARTMENT OF TRANSPORTATIONDRILL LOG
June 25, 2012
Project
MC- 1c (1.5-5.0) Silty SAND with Gravel; SM; Brown andTan; Nonplastic; Damp; Est. ~15% Coarse to Fine Gravel,5% Coarse Sand, 15% Medium Sand, 50% Fine Sandand 15% Fines; Pumice Sand; Weakly to ModeratelyWelded Tuff; (Pulverized by Drilling); DeschutesFormation
3.7 ft - PID = 0.8 ppm.
MC-1: No HC odor orstaining. Difficult drilling.
1-2 ft - Dx = BDL
Used Push Probe withMacro Core Tooling.Hole locations given asapprox. lat. and long. HC= Hydrocarbon. PID =Photo-ionizationDetector. ppm = PartsPer Million.
6.8 ft - PID = 1.5 ppm
MC- 2 (5.0-8.5) Silty SAND with Gravel; SM; Brown;Nonplastic; Damp; Est. ~15% Coarse to Fine Gravel, 5%Coarse Sand, 10% Medium Sand, 55% Fine Sand and15% Fines; Pumice Sand; Weakly to Moderately WeldedTuff; (Pulverized by Drilling); Deschutes Formation
MC-3: No HC odor orstaining. Difficult drilling.
MC- 1b (0.5-1.5) Silty SAND with Gravel; SM; Brown andGray; Nonplastic; Dry; Est. ~15% Coarse Gravel, 20%Fine Gravel, 10% Coarse Sand, 20% Medium Sand, 20%Fine Sand and 15% Fines; Angular Basalt Gravel; (Fill)
MC- 1a (0.0-0.5) Concrete
1.5 - 10.5DESCHUTESFORMATION TUFF:Silty SAND withGravel; Brown andTan; Nonplastic;Damp (Tuff samplepulverized to silt,sand, and gravel bydrilling)
0.5 - 1.5FILL: Silty SAND withGravel
MC- 3 (8.5-10.5) Silty SAND with Gravel; SM; Brown;Nonplastic; Damp; Est. ~15% Coarse to Fine Gravel, 5%Coarse Sand, 10% Medium Sand, 50% Fine Sand and20% Fines; Pumice Sand; Weakly to Moderately WeldedTuff; (Pulverized by Drilling); Deschutes Formation
100
56
56
56
MC-2: No HC odor orstaining. Very difficultdrilling. Slow DR. Nearrefusal.
P12-08
CO161601-010
15409
N/A
N/A
2320.0 ft
N/A
MC3
MC2
MC1c
MC1b
MC1a
Dep
th (f
t)
Driv
ing
Res
ista
nce
Soil
0
Typical Drilling Abbreviations
10
Test
Typ
e, N
o.
Unit DescriptionSOIL: Soil Name, USCS, Color, Plasticity,
Dis
cont
inui
ty D
ata
Or R
QD
%
5
Rock
Dril
ling
Met
hods
, Siz
ean
dR
emar
ks
Wat
er L
evel
/D
ate
Bac
kfill
/In
stru
men
tatio
n
Perc
ent
Nat
ural
Moi
stur
e
Gra
phic
Log
Moisture, Consistency/Relative Density,Texture, Cementation, Structure, Origin.
Perc
ent R
ecov
ery
US97 @ J Street (Madras)
Kelly Wood
BB & A Environmental - Rod Johnson
Property Appraisal
Jefferson
-121.13
Total Depth
Recorder
Drilling RemarksLW - Lost WaterWR - Water ReturnWC - Water ColorDP - Down PressureDR - Drill RateDA - Drill Action
44.62
10.5 ft
Hole No.
E.A. No.
Key No.
Start Card No.
Bridge No.
Ground Elev.
Tube Height
Ryan Franklin
Page
OD
OT
DR
ILL
LOG
GIN
T E
XP
LOR
ATI
ON
LO
GS
.GP
J O
DO
T_M
AN
.GD
T 8
/1/1
2
Material Description
Discontinuity Spacing, Joint Filling,Core Recovery, Formation Name.
Drilling MethodsWL - Wire LineHS - Hollow Stem AugerDF - Drill FluidSA - Solid AugerCA - Casing AdvancerHA - Hand Auger
Surface RoughnessP - PolishedSl - SlickensidedSm - SmoothR - RoughVR - Very Rough
of
ROCK: Rock Name, Color, Weathering, Hardness,
Easting:Northing:
DiscontinuityJ - JointF - FaultB - BeddingFo - FoliationS - Shear
"A" - Auger Core"X" - Auger"C" - Core, Barrel Type"N" - Standard Penetration"U" - Undisturbed Sample"T" - Test Pit
ShapePl - PlanarC - CurvedU - UndulatingSt - SteppedIr - Irregular
21

Project Name
10.5Bottom of Hole
SOIL: Soil Name, USCS, Color, Plasticity,
ROCK: Rock Name, Color, Weathering, Hardness,
Moisture, Consistency/Relative Density,Texture, Cementation, Structure, Origin.
Material Description
Discontinuity Spacing, Joint Filling,Core Recovery, Formation Name.
22 ofPageP12-08
Unit Description
US97 @ J Street (Madras)
Test
Typ
e, N
o.
Note: Dx = Diesel RangeHydrocarbons byNWTPH method; BDL =Below LaboratoryDetection Limits
Used 1/3 bag of 3/8 inchbentonite chips toabandon boring.
Groundwater notencountered.
Hole Location: Adjacentwest of hydraulic lift.
Bottom of Hole = 10.5 ft
10.0 ft - PID = 1.7 ppm;Dx = BDL
(10.5) Bottom of Hole
Hole No.
Dis
cont
inui
ty D
ata
Or R
QD
%
15
20
Rock
Dril
ling
Met
hods
, Siz
ean
dR
emar
ks
Wat
er L
evel
/D
ate
Perc
ent R
ecov
ery
Perc
ent
Nat
ural
Moi
stur
e
SoilD
epth
(ft)
25
10
OD
OT
DR
ILL
LOG
GIN
T E
XP
LOR
ATI
ON
LO
GS
.GP
J O
DO
T_M
AN
.GD
T 8
/1/1
2
Driv
ing
Res
ista
nce
Bac
kfill
/In
stru
men
tatio
n
Gra
phic
Log
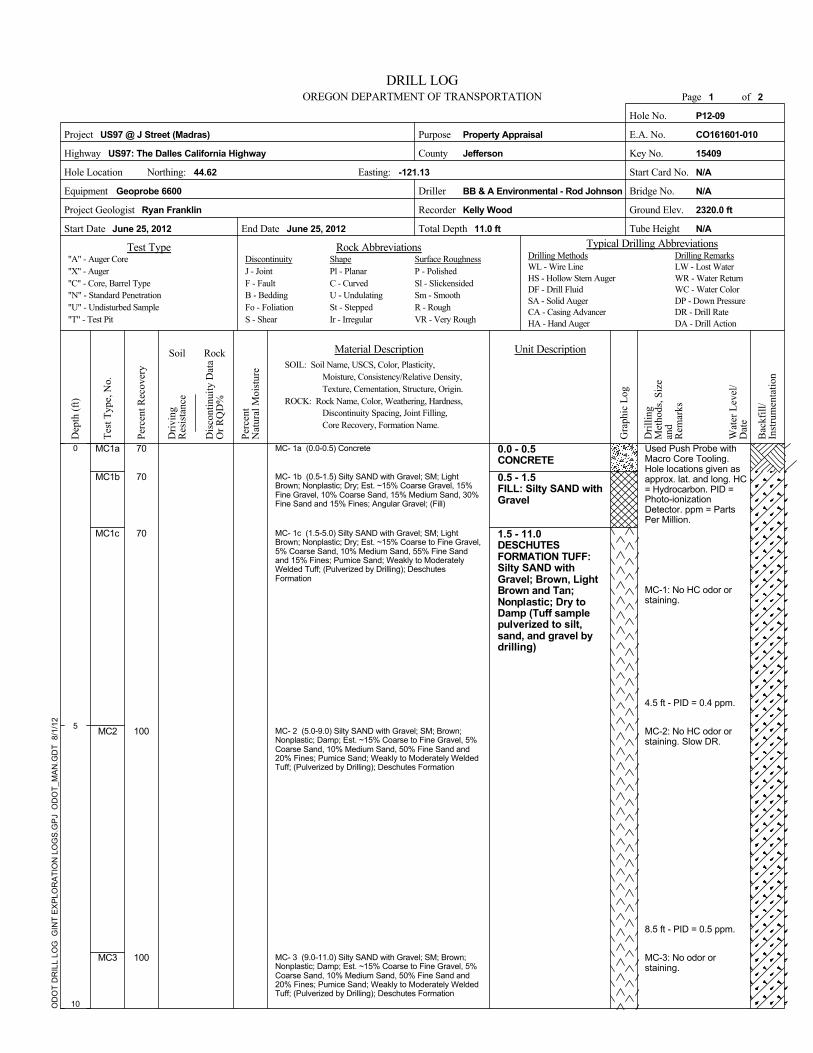
Purpose
End DateStart Date
Geoprobe 6600 Driller
Test Type
June 25, 2012 June 25, 2012
OD
OT
DR
ILL
LOG
GIN
T E
XP
LOR
ATI
ON
LO
GS
.GP
J O
DO
T_M
AN
.GD
T 8
/1/1
2
US97: The Dalles California Highway
Rock Abbreviations
0.0 - 0.5CONCRETE
Project Geologist
Equipment
Hole Location
County
Project
OREGON DEPARTMENT OF TRANSPORTATIONDRILL LOG
Highway
MC- 1c (1.5-5.0) Silty SAND with Gravel; SM; LightBrown; Nonplastic; Dry; Est. ~15% Coarse to Fine Gravel,5% Coarse Sand, 10% Medium Sand, 55% Fine Sandand 15% Fines; Pumice Sand; Weakly to ModeratelyWelded Tuff; (Pulverized by Drilling); DeschutesFormation
MC-2: No HC odor orstaining. Slow DR.
4.5 ft - PID = 0.4 ppm.
MC-1: No HC odor orstaining.
Used Push Probe withMacro Core Tooling.Hole locations given asapprox. lat. and long. HC= Hydrocarbon. PID =Photo-ionizationDetector. ppm = PartsPer Million.
MC-3: No odor orstaining.
MC- 2 (5.0-9.0) Silty SAND with Gravel; SM; Brown;Nonplastic; Damp; Est. ~15% Coarse to Fine Gravel, 5%Coarse Sand, 10% Medium Sand, 50% Fine Sand and20% Fines; Pumice Sand; Weakly to Moderately WeldedTuff; (Pulverized by Drilling); Deschutes Formation
MC1a
MC- 1b (0.5-1.5) Silty SAND with Gravel; SM; LightBrown; Nonplastic; Dry; Est. ~15% Coarse Gravel, 15%Fine Gravel, 10% Coarse Sand, 15% Medium Sand, 30%Fine Sand and 15% Fines; Angular Gravel; (Fill)
MC- 1a (0.0-0.5) Concrete
1.5 - 11.0DESCHUTESFORMATION TUFF:Silty SAND withGravel; Brown, LightBrown and Tan;Nonplastic; Dry toDamp (Tuff samplepulverized to silt,sand, and gravel bydrilling)
0.5 - 1.5FILL: Silty SAND withGravel
MC- 3 (9.0-11.0) Silty SAND with Gravel; SM; Brown;Nonplastic; Damp; Est. ~15% Coarse to Fine Gravel, 5%Coarse Sand, 10% Medium Sand, 50% Fine Sand and20% Fines; Pumice Sand; Weakly to Moderately WeldedTuff; (Pulverized by Drilling); Deschutes Formation
100
100
70
70
70
8.5 ft - PID = 0.5 ppm.
P12-09
CO161601-010
15409
N/A
N/A
2320.0 ft
N/A
MC3
MC2
MC1c
MC1b
Dep
th (f
t)
Driv
ing
Res
ista
nce
Soil
0
SOIL: Soil Name, USCS, Color, Plasticity,
10
Test
Typ
e, N
o.
Unit Description
Typical Drilling Abbreviations
Dis
cont
inui
ty D
ata
Or R
QD
%
5
Rock
Dril
ling
Met
hods
, Siz
ean
dR
emar
ks
Wat
er L
evel
/D
ate
Bac
kfill
/In
stru
men
tatio
n
Perc
ent
Nat
ural
Moi
stur
e
Gra
phic
Log
ROCK: Rock Name, Color, Weathering, Hardness,
Perc
ent R
ecov
ery
-121.13
US97 @ J Street (Madras)
Kelly Wood
BB & A Environmental - Rod Johnson
Property Appraisal
Ryan Franklin
2
Total Depth
Recorder
Drilling RemarksLW - Lost WaterWR - Water ReturnWC - Water ColorDP - Down PressureDR - Drill RateDA - Drill Action
44.62
11.0 ft
Jefferson
Page
Moisture, Consistency/Relative Density,Texture, Cementation, Structure, Origin.
Material Description
Discontinuity Spacing, Joint Filling,Core Recovery, Formation Name.
Drilling MethodsWL - Wire LineHS - Hollow Stem AugerDF - Drill FluidSA - Solid AugerCA - Casing AdvancerHA - Hand Auger
Surface RoughnessP - PolishedSl - SlickensidedSm - SmoothR - RoughVR - Very Rough
of
Hole No.
E.A. No.
Key No.
Start Card No.
Bridge No.
Ground Elev.
Tube Height
Easting:Northing:
DiscontinuityJ - JointF - FaultB - BeddingFo - FoliationS - Shear
"A" - Auger Core"X" - Auger"C" - Core, Barrel Type"N" - Standard Penetration"U" - Undisturbed Sample"T" - Test Pit
ShapePl - PlanarC - CurvedU - UndulatingSt - SteppedIr - Irregular
1
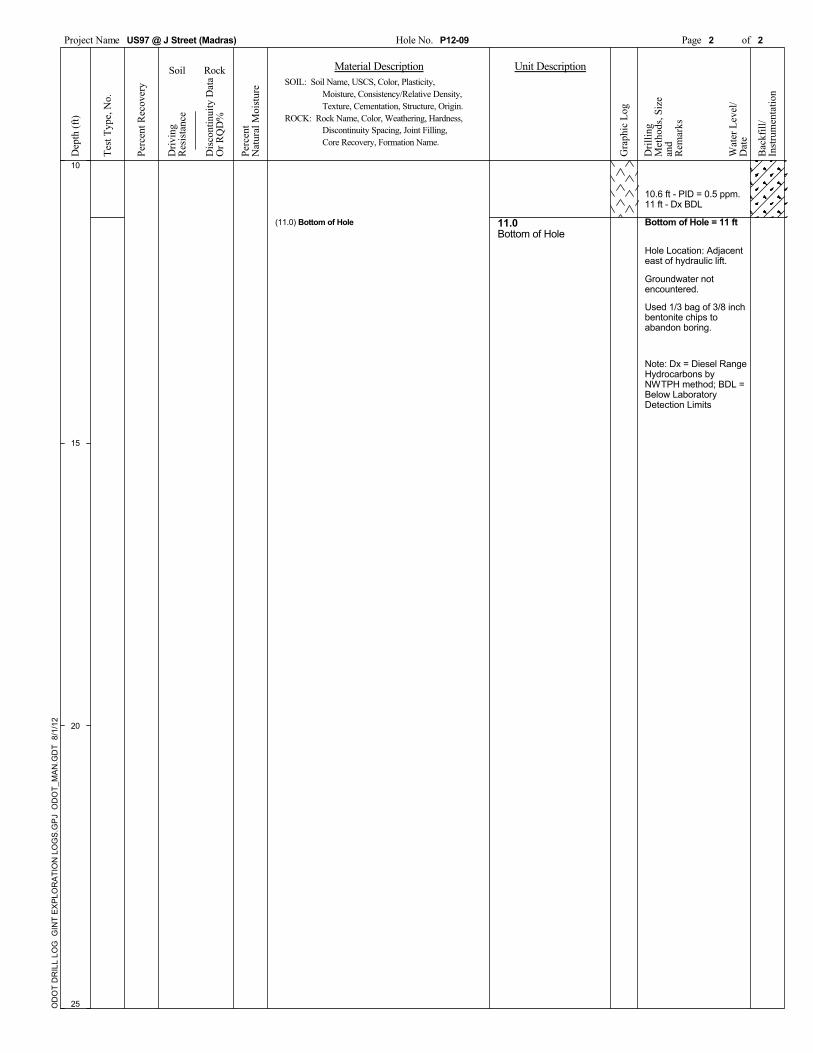
Project Name
11.0Bottom of Hole
SOIL: Soil Name, USCS, Color, Plasticity,
ROCK: Rock Name, Color, Weathering, Hardness,
Moisture, Consistency/Relative Density,Texture, Cementation, Structure, Origin.
Material Description
Discontinuity Spacing, Joint Filling,Core Recovery, Formation Name.
22 ofPageP12-09
Unit Description
US97 @ J Street (Madras)
Test
Typ
e, N
o.
Note: Dx = Diesel RangeHydrocarbons byNWTPH method; BDL =Below LaboratoryDetection Limits
Used 1/3 bag of 3/8 inchbentonite chips toabandon boring.
Groundwater notencountered.
Hole Location: Adjacenteast of hydraulic lift.
Bottom of Hole = 11 ft
10.6 ft - PID = 0.5 ppm.11 ft - Dx BDL
(11.0) Bottom of Hole
Hole No.
Dis
cont
inui
ty D
ata
Or R
QD
%
15
20
Rock
Dril
ling
Met
hods
, Siz
ean
dR
emar
ks
Wat
er L
evel
/D
ate
Perc
ent R
ecov
ery
Perc
ent
Nat
ural
Moi
stur
e
SoilD
epth
(ft)
25
10
OD
OT
DR
ILL
LOG
GIN
T E
XP
LOR
ATI
ON
LO
GS
.GP
J O
DO
T_M
AN
.GD
T 8
/1/1
2
Driv
ing
Res
ista
nce
Bac
kfill
/In
stru
men
tatio
n
Gra
phic
Log

Appendix I
Chain of Custody Forms and Analytical Results

This Page Intentionally Left Blank
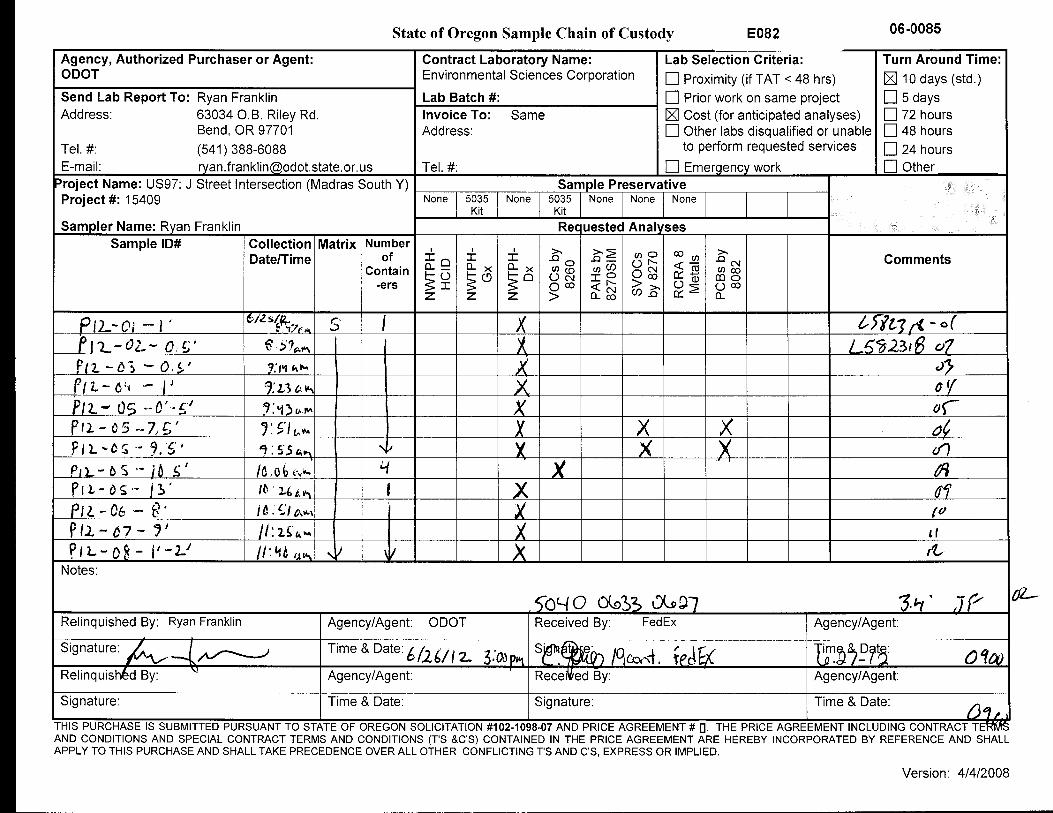
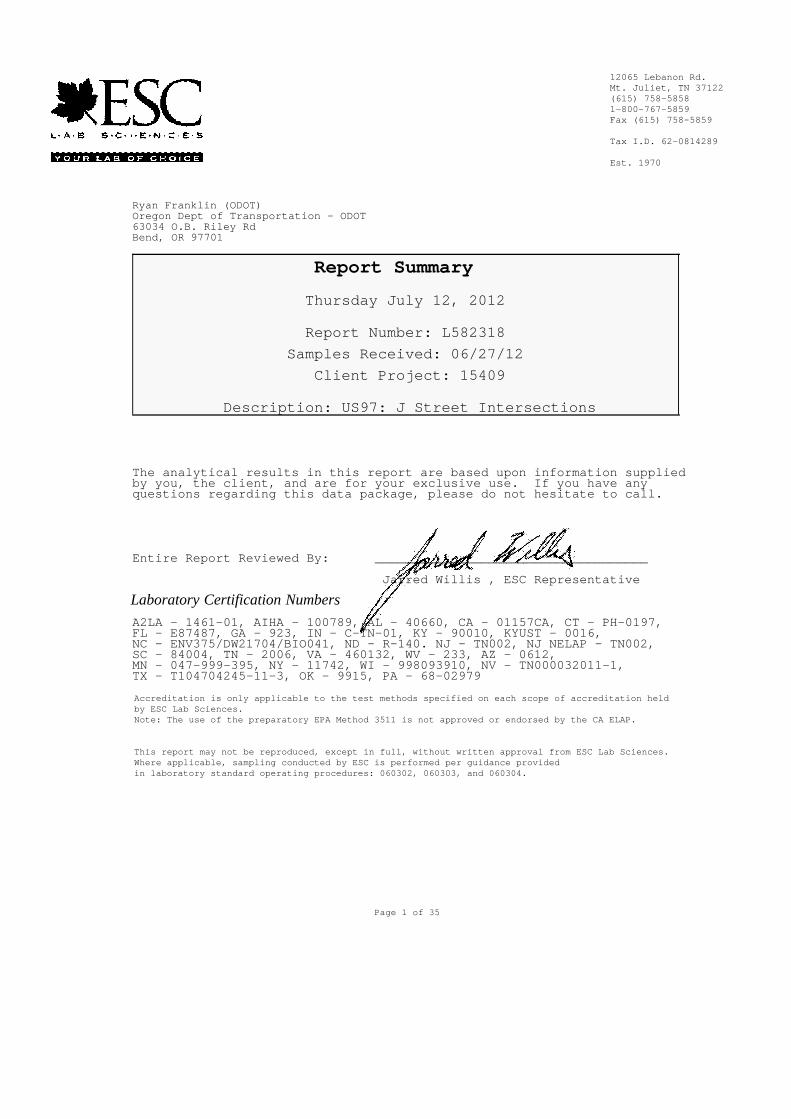
12065 Lebanon Rd.Mt. Juliet, TN 37122(615) 758-58581-800-767-5859Fax (615) 758-5859
Tax I.D. 62-0814289
Est. 1970
Ryan Franklin (ODOT)Oregon Dept of Transportation - ODOT63034 O.B. Riley RdBend, OR 97701
Report Summary
Thursday July 12, 2012
Report Number: L582318
Samples Received: 06/27/12
Client Project: 15409
Description: US97: J Street Intersections
The analytical results in this report are based upon information suppliedby you, the client, and are for your exclusive use. If you have anyquestions regarding this data package, please do not hesitate to call.
Entire Report Reviewed By: ____________________________________
Jarred Willis , ESC Representative
Laboratory Certification NumbersA2LA - 1461-01, AIHA - 100789, AL - 40660, CA - 01157CA, CT - PH-0197,FL - E87487, GA - 923, IN - C-TN-01, KY - 90010, KYUST - 0016,NC - ENV375/DW21704/BIO041, ND - R-140. NJ - TN002, NJ NELAP - TN002,SC - 84004, TN - 2006, VA - 460132, WV - 233, AZ - 0612,MN - 047-999-395, NY - 11742, WI - 998093910, NV - TN000032011-1,TX - T104704245-11-3, OK - 9915, PA - 68-02979
Accreditation is only applicable to the test methods specified on each scope of accreditation heldby ESC Lab Sciences.Note: The use of the preparatory EPA Method 3511 is not approved or endorsed by the CA ELAP.
This report may not be reproduced, except in full, without written approval from ESC Lab Sciences.Where applicable, sampling conducted by ESC is performed per guidance providedin laboratory standard operating procedures: 060302, 060303, and 060304.
Page 1 of 35

12065 Lebanon Rd.Mt. Juliet, TN 37122(615) 758-58581-800-767-5859Fax (615) 758-5859
Tax I.D. 62-0814289
Est. 1970
REPORT OF ANALYSIS Ryan Franklin (ODOT) July 12,2012 Oregon Dept of Transportation - ODO 63034 O.B. Riley Rd Bend, OR 97701
ESC Sample # : L582318-01 Date Received : June 27, 2012 Description : US97: J Street Intersections
Site ID : Sample ID : P12-01-1 FT
Project # : 15409 Collected By : Ryan Franklin Collection Date : 06/25/12 08:57
Parameter Dry Result Det. Limit Units Method Date Dil.
Total Solids 88.9 0.100 % 2540G 07/02/12 1
Diesel Range Organics (DRO) BDL 4.5 mg/kg NWTPHDX 07/05/12 1 Residual Range Organics (RRO) BDL 11. mg/kg NWTPHDX 07/05/12 1
Surrogate Recovery o-Terphenyl 78.3 % Rec. NWTPHDX 07/05/12 1
Results listed are dry weight basis. BDL - Below Detection Limit Det. Limit - Practical Quantitation Limit(PQL) Note: This report shall not be reproduced, except in full, without the written approval from ESC. The reported analytical results relate only to the sample submitted Reported: 07/12/12 19:24 Printed: 07/12/12 19:24
Page 2 of 35

12065 Lebanon Rd.Mt. Juliet, TN 37122(615) 758-58581-800-767-5859Fax (615) 758-5859
Tax I.D. 62-0814289
Est. 1970
REPORT OF ANALYSIS Ryan Franklin (ODOT) July 12,2012 Oregon Dept of Transportation - ODO 63034 O.B. Riley Rd Bend, OR 97701
ESC Sample # : L582318-02 Date Received : June 27, 2012 Description : US97: J Street Intersections
Site ID : Sample ID : P12-02-.5 FT
Project # : 15409 Collected By : Ryan Franklin Collection Date : 06/25/12 08:59
Parameter Dry Result Det. Limit Units Method Date Dil.
Total Solids 84.9 0.100 % 2540G 07/02/12 1
Diesel Range Organics (DRO) BDL 4.7 mg/kg NWTPHDX 07/05/12 1 Residual Range Organics (RRO) BDL 12. mg/kg NWTPHDX 07/05/12 1
Surrogate Recovery o-Terphenyl 78.0 % Rec. NWTPHDX 07/05/12 1
Results listed are dry weight basis. BDL - Below Detection Limit Det. Limit - Practical Quantitation Limit(PQL) Note: This report shall not be reproduced, except in full, without the written approval from ESC. The reported analytical results relate only to the sample submitted Reported: 07/12/12 19:24 Printed: 07/12/12 19:24
Page 3 of 35

12065 Lebanon Rd.Mt. Juliet, TN 37122(615) 758-58581-800-767-5859Fax (615) 758-5859
Tax I.D. 62-0814289
Est. 1970
REPORT OF ANALYSIS Ryan Franklin (ODOT) July 12,2012 Oregon Dept of Transportation - ODO 63034 O.B. Riley Rd Bend, OR 97701
ESC Sample # : L582318-03 Date Received : June 27, 2012 Description : US97: J Street Intersections
Site ID : Sample ID : P12-03-.5 FT
Project # : 15409 Collected By : Ryan Franklin Collection Date : 06/25/12 09:14
Parameter Dry Result Det. Limit Units Method Date Dil.
Total Solids 85.5 0.100 % 2540G 07/02/12 1
Diesel Range Organics (DRO) BDL 4.7 mg/kg NWTPHDX 07/05/12 1 Residual Range Organics (RRO) BDL 12. mg/kg NWTPHDX 07/05/12 1
Surrogate Recovery o-Terphenyl 72.0 % Rec. NWTPHDX 07/05/12 1
Results listed are dry weight basis. BDL - Below Detection Limit Det. Limit - Practical Quantitation Limit(PQL) Note: This report shall not be reproduced, except in full, without the written approval from ESC. The reported analytical results relate only to the sample submitted Reported: 07/12/12 19:24 Printed: 07/12/12 19:24
Page 4 of 35

12065 Lebanon Rd.Mt. Juliet, TN 37122(615) 758-58581-800-767-5859Fax (615) 758-5859
Tax I.D. 62-0814289
Est. 1970
REPORT OF ANALYSIS Ryan Franklin (ODOT) July 12,2012 Oregon Dept of Transportation - ODO 63034 O.B. Riley Rd Bend, OR 97701
ESC Sample # : L582318-04 Date Received : June 27, 2012 Description : US97: J Street Intersections
Site ID : Sample ID : P12-04-1 FT
Project # : 15409 Collected By : Ryan Franklin Collection Date : 06/25/12 09:23
Parameter Dry Result Det. Limit Units Method Date Dil.
Total Solids 84.1 0.100 % 2540G 07/02/12 1
Diesel Range Organics (DRO) BDL 4.8 mg/kg NWTPHDX 07/05/12 1 Residual Range Organics (RRO) BDL 12. mg/kg NWTPHDX 07/05/12 1
Surrogate Recovery o-Terphenyl 69.5 % Rec. NWTPHDX 07/05/12 1
Results listed are dry weight basis. BDL - Below Detection Limit Det. Limit - Practical Quantitation Limit(PQL) Note: This report shall not be reproduced, except in full, without the written approval from ESC. The reported analytical results relate only to the sample submitted Reported: 07/12/12 19:24 Printed: 07/12/12 19:24
Page 5 of 35

12065 Lebanon Rd.Mt. Juliet, TN 37122(615) 758-58581-800-767-5859Fax (615) 758-5859
Tax I.D. 62-0814289
Est. 1970
REPORT OF ANALYSIS Ryan Franklin (ODOT) July 12,2012 Oregon Dept of Transportation - ODO 63034 O.B. Riley Rd Bend, OR 97701
ESC Sample # : L582318-05 Date Received : June 27, 2012 Description : US97: J Street Intersections
Site ID : Sample ID : P12-05-0-5 FT
Project # : 15409 Collected By : Ryan Franklin Collection Date : 06/25/12 09:43
Parameter Dry Result Det. Limit Units Method Date Dil.
Total Solids 91.0 0.100 % 2540G 07/02/12 1
Diesel Range Organics (DRO) 31. 4.4 mg/kg NWTPHDX 07/05/12 1 Residual Range Organics (RRO) 320 55. mg/kg NWTPHDX 07/12/12 5
Surrogate Recovery o-Terphenyl 65.1 % Rec. NWTPHDX 07/05/12 1
Results listed are dry weight basis. BDL - Below Detection Limit Det. Limit - Practical Quantitation Limit(PQL) Note: This report shall not be reproduced, except in full, without the written approval from ESC. The reported analytical results relate only to the sample submitted Reported: 07/12/12 19:24 Printed: 07/12/12 19:24
Page 6 of 35

12065 Lebanon Rd.Mt. Juliet, TN 37122(615) 758-58581-800-767-5859Fax (615) 758-5859
Tax I.D. 62-0814289
Est. 1970
REPORT OF ANALYSIS Ryan Franklin (ODOT) July 12,2012 Oregon Dept of Transportation - ODO 63034 O.B. Riley Rd Bend, OR 97701
ESC Sample # : L582318-06 Date Received : June 27, 2012 Description : US97: J Street Intersections
Site ID : Sample ID : P12-05-7.5 FT
Project # : 15409 Collected By : Ryan Franklin Collection Date : 06/25/12 09:51
Parameter Dry Result Det. Limit Units Method Date Dil.
Total Solids 83.6 0.100 % 2540G 07/02/12 1
Diesel Range Organics (DRO) 1800 190 mg/kg NWTPHDX 07/12/12 40 Residual Range Organics (RRO) 10000 960 mg/kg NWTPHDX 07/12/12 80
Surrogate Recovery o-Terphenyl 0.00 % Rec. NWTPHDX 07/12/12 40
Polychlorinated Biphenyls PCB 1016 BDL 0.020 mg/kg 8082 07/02/12 1 PCB 1221 BDL 0.020 mg/kg 8082 07/02/12 1 PCB 1232 BDL 0.020 mg/kg 8082 07/02/12 1 PCB 1242 BDL 0.020 mg/kg 8082 07/02/12 1 PCB 1248 BDL 0.020 mg/kg 8082 07/02/12 1 PCB 1254 BDL 0.020 mg/kg 8082 07/02/12 1 PCB 1260 BDL 0.020 mg/kg 8082 07/02/12 1
PCBs Surrogates Decachlorobiphenyl 46.0 % Rec. 8082 07/02/12 1 Tetrachloro-m-xylene 53.5 % Rec. 8082 07/02/12 1
Base/Neutral Extractables Acenaphthene BDL 0.79 mg/kg 8270D 07/05/12 20 Acenaphthylene BDL 0.79 mg/kg 8270D 07/05/12 20 Anthracene BDL 0.79 mg/kg 8270D 07/05/12 20 Benzidine BDL 8.0 mg/kg 8270D 07/05/12 20 Benzo(a)anthracene BDL 0.79 mg/kg 8270D 07/05/12 20 Benzo(b)fluoranthene BDL 3.9 mg/kg 8270D 07/06/12 100 Benzo(k)fluoranthene BDL 3.9 mg/kg 8270D 07/06/12 100 Benzo(g,h,i)perylene BDL 3.9 mg/kg 8270D 07/06/12 100 Benzo(a)pyrene BDL 3.9 mg/kg 8270D 07/06/12 100 Bis(2-chlorethoxy)methane BDL 8.0 mg/kg 8270D 07/05/12 20 Bis(2-chloroethyl)ether BDL 8.0 mg/kg 8270D 07/05/12 20 Bis(2-chloroisopropyl)ether BDL 8.0 mg/kg 8270D 07/05/12 20 4-Bromophenyl-phenylether BDL 8.0 mg/kg 8270D 07/05/12 20 2-Chloronaphthalene BDL 0.79 mg/kg 8270D 07/05/12 20 4-Chlorophenyl-phenylether BDL 8.0 mg/kg 8270D 07/05/12 20 Chrysene BDL 0.79 mg/kg 8270D 07/05/12 20 Dibenz(a,h)anthracene BDL 3.9 mg/kg 8270D 07/06/12 100 3,3-Dichlorobenzidine BDL 8.0 mg/kg 8270D 07/05/12 20 2,4-Dinitrotoluene BDL 8.0 mg/kg 8270D 07/05/12 20 2,6-Dinitrotoluene BDL 8.0 mg/kg 8270D 07/05/12 20 Fluoranthene BDL 0.79 mg/kg 8270D 07/05/12 20 Fluorene BDL 0.79 mg/kg 8270D 07/05/12 20 Hexachlorobenzene BDL 8.0 mg/kg 8270D 07/05/12 20 Hexachloro-1,3-butadiene BDL 8.0 mg/kg 8270D 07/05/12 20
Results listed are dry weight basis. BDL - Below Detection Limit Det. Limit - Practical Quantitation Limit(PQL) Note: This report shall not be reproduced, except in full, without the written approval from ESC. The reported analytical results relate only to the sample submitted
Page 7 of 35
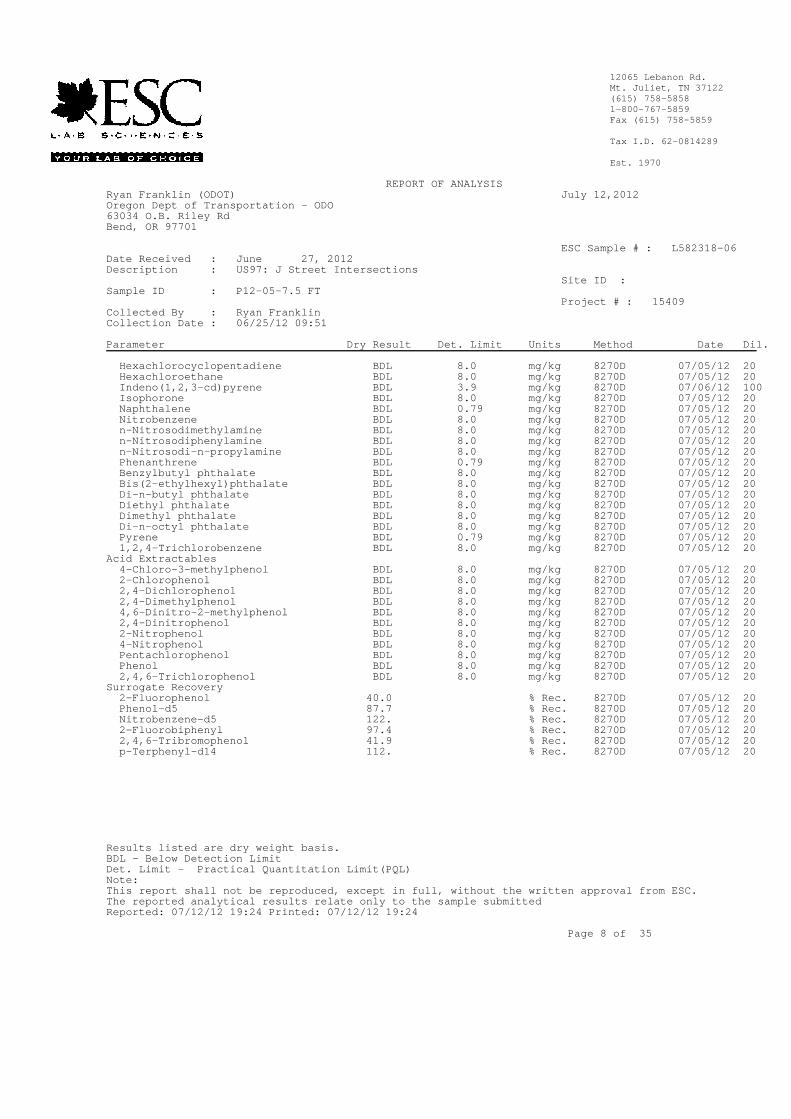
12065 Lebanon Rd.Mt. Juliet, TN 37122(615) 758-58581-800-767-5859Fax (615) 758-5859
Tax I.D. 62-0814289
Est. 1970
REPORT OF ANALYSIS Ryan Franklin (ODOT) July 12,2012 Oregon Dept of Transportation - ODO 63034 O.B. Riley Rd Bend, OR 97701
ESC Sample # : L582318-06 Date Received : June 27, 2012 Description : US97: J Street Intersections
Site ID : Sample ID : P12-05-7.5 FT
Project # : 15409 Collected By : Ryan Franklin Collection Date : 06/25/12 09:51
Parameter Dry Result Det. Limit Units Method Date Dil.
Hexachlorocyclopentadiene BDL 8.0 mg/kg 8270D 07/05/12 20 Hexachloroethane BDL 8.0 mg/kg 8270D 07/05/12 20 Indeno(1,2,3-cd)pyrene BDL 3.9 mg/kg 8270D 07/06/12 100 Isophorone BDL 8.0 mg/kg 8270D 07/05/12 20 Naphthalene BDL 0.79 mg/kg 8270D 07/05/12 20 Nitrobenzene BDL 8.0 mg/kg 8270D 07/05/12 20 n-Nitrosodimethylamine BDL 8.0 mg/kg 8270D 07/05/12 20 n-Nitrosodiphenylamine BDL 8.0 mg/kg 8270D 07/05/12 20 n-Nitrosodi-n-propylamine BDL 8.0 mg/kg 8270D 07/05/12 20 Phenanthrene BDL 0.79 mg/kg 8270D 07/05/12 20 Benzylbutyl phthalate BDL 8.0 mg/kg 8270D 07/05/12 20 Bis(2-ethylhexyl)phthalate BDL 8.0 mg/kg 8270D 07/05/12 20 Di-n-butyl phthalate BDL 8.0 mg/kg 8270D 07/05/12 20 Diethyl phthalate BDL 8.0 mg/kg 8270D 07/05/12 20 Dimethyl phthalate BDL 8.0 mg/kg 8270D 07/05/12 20 Di-n-octyl phthalate BDL 8.0 mg/kg 8270D 07/05/12 20 Pyrene BDL 0.79 mg/kg 8270D 07/05/12 20 1,2,4-Trichlorobenzene BDL 8.0 mg/kg 8270D 07/05/12 20
Acid Extractables 4-Chloro-3-methylphenol BDL 8.0 mg/kg 8270D 07/05/12 20 2-Chlorophenol BDL 8.0 mg/kg 8270D 07/05/12 20 2,4-Dichlorophenol BDL 8.0 mg/kg 8270D 07/05/12 20 2,4-Dimethylphenol BDL 8.0 mg/kg 8270D 07/05/12 20 4,6-Dinitro-2-methylphenol BDL 8.0 mg/kg 8270D 07/05/12 20 2,4-Dinitrophenol BDL 8.0 mg/kg 8270D 07/05/12 20 2-Nitrophenol BDL 8.0 mg/kg 8270D 07/05/12 20 4-Nitrophenol BDL 8.0 mg/kg 8270D 07/05/12 20 Pentachlorophenol BDL 8.0 mg/kg 8270D 07/05/12 20 Phenol BDL 8.0 mg/kg 8270D 07/05/12 20 2,4,6-Trichlorophenol BDL 8.0 mg/kg 8270D 07/05/12 20
Surrogate Recovery 2-Fluorophenol 40.0 % Rec. 8270D 07/05/12 20 Phenol-d5 87.7 % Rec. 8270D 07/05/12 20 Nitrobenzene-d5 122. % Rec. 8270D 07/05/12 20 2-Fluorobiphenyl 97.4 % Rec. 8270D 07/05/12 20 2,4,6-Tribromophenol 41.9 % Rec. 8270D 07/05/12 20 p-Terphenyl-d14 112. % Rec. 8270D 07/05/12 20
Results listed are dry weight basis. BDL - Below Detection Limit Det. Limit - Practical Quantitation Limit(PQL) Note: This report shall not be reproduced, except in full, without the written approval from ESC. The reported analytical results relate only to the sample submitted Reported: 07/12/12 19:24 Printed: 07/12/12 19:24
Page 8 of 35
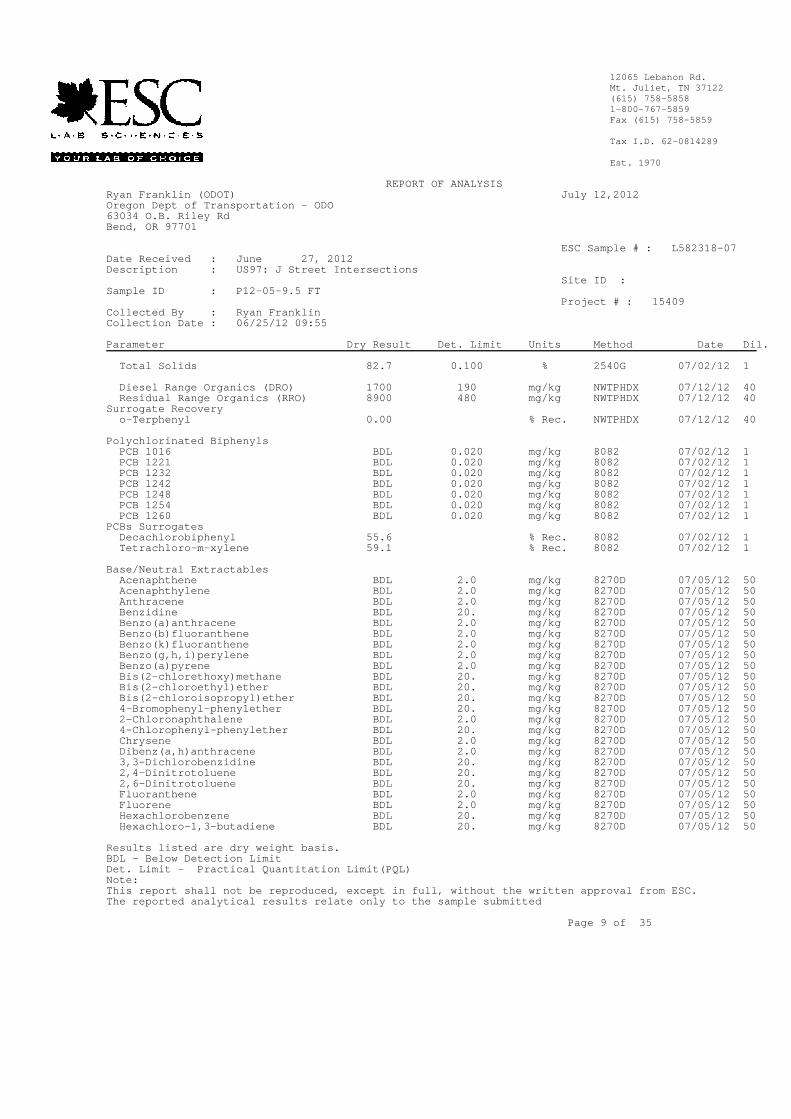
12065 Lebanon Rd.Mt. Juliet, TN 37122(615) 758-58581-800-767-5859Fax (615) 758-5859
Tax I.D. 62-0814289
Est. 1970
REPORT OF ANALYSIS Ryan Franklin (ODOT) July 12,2012 Oregon Dept of Transportation - ODO 63034 O.B. Riley Rd Bend, OR 97701
ESC Sample # : L582318-07 Date Received : June 27, 2012 Description : US97: J Street Intersections
Site ID : Sample ID : P12-05-9.5 FT
Project # : 15409 Collected By : Ryan Franklin Collection Date : 06/25/12 09:55
Parameter Dry Result Det. Limit Units Method Date Dil.
Total Solids 82.7 0.100 % 2540G 07/02/12 1
Diesel Range Organics (DRO) 1700 190 mg/kg NWTPHDX 07/12/12 40 Residual Range Organics (RRO) 8900 480 mg/kg NWTPHDX 07/12/12 40
Surrogate Recovery o-Terphenyl 0.00 % Rec. NWTPHDX 07/12/12 40
Polychlorinated Biphenyls PCB 1016 BDL 0.020 mg/kg 8082 07/02/12 1 PCB 1221 BDL 0.020 mg/kg 8082 07/02/12 1 PCB 1232 BDL 0.020 mg/kg 8082 07/02/12 1 PCB 1242 BDL 0.020 mg/kg 8082 07/02/12 1 PCB 1248 BDL 0.020 mg/kg 8082 07/02/12 1 PCB 1254 BDL 0.020 mg/kg 8082 07/02/12 1 PCB 1260 BDL 0.020 mg/kg 8082 07/02/12 1
PCBs Surrogates Decachlorobiphenyl 55.6 % Rec. 8082 07/02/12 1 Tetrachloro-m-xylene 59.1 % Rec. 8082 07/02/12 1
Base/Neutral Extractables Acenaphthene BDL 2.0 mg/kg 8270D 07/05/12 50 Acenaphthylene BDL 2.0 mg/kg 8270D 07/05/12 50 Anthracene BDL 2.0 mg/kg 8270D 07/05/12 50 Benzidine BDL 20. mg/kg 8270D 07/05/12 50 Benzo(a)anthracene BDL 2.0 mg/kg 8270D 07/05/12 50 Benzo(b)fluoranthene BDL 2.0 mg/kg 8270D 07/05/12 50 Benzo(k)fluoranthene BDL 2.0 mg/kg 8270D 07/05/12 50 Benzo(g,h,i)perylene BDL 2.0 mg/kg 8270D 07/05/12 50 Benzo(a)pyrene BDL 2.0 mg/kg 8270D 07/05/12 50 Bis(2-chlorethoxy)methane BDL 20. mg/kg 8270D 07/05/12 50 Bis(2-chloroethyl)ether BDL 20. mg/kg 8270D 07/05/12 50 Bis(2-chloroisopropyl)ether BDL 20. mg/kg 8270D 07/05/12 50 4-Bromophenyl-phenylether BDL 20. mg/kg 8270D 07/05/12 50 2-Chloronaphthalene BDL 2.0 mg/kg 8270D 07/05/12 50 4-Chlorophenyl-phenylether BDL 20. mg/kg 8270D 07/05/12 50 Chrysene BDL 2.0 mg/kg 8270D 07/05/12 50 Dibenz(a,h)anthracene BDL 2.0 mg/kg 8270D 07/05/12 50 3,3-Dichlorobenzidine BDL 20. mg/kg 8270D 07/05/12 50 2,4-Dinitrotoluene BDL 20. mg/kg 8270D 07/05/12 50 2,6-Dinitrotoluene BDL 20. mg/kg 8270D 07/05/12 50 Fluoranthene BDL 2.0 mg/kg 8270D 07/05/12 50 Fluorene BDL 2.0 mg/kg 8270D 07/05/12 50 Hexachlorobenzene BDL 20. mg/kg 8270D 07/05/12 50 Hexachloro-1,3-butadiene BDL 20. mg/kg 8270D 07/05/12 50
Results listed are dry weight basis. BDL - Below Detection Limit Det. Limit - Practical Quantitation Limit(PQL) Note: This report shall not be reproduced, except in full, without the written approval from ESC. The reported analytical results relate only to the sample submitted
Page 9 of 35

12065 Lebanon Rd.Mt. Juliet, TN 37122(615) 758-58581-800-767-5859Fax (615) 758-5859
Tax I.D. 62-0814289
Est. 1970
REPORT OF ANALYSIS Ryan Franklin (ODOT) July 12,2012 Oregon Dept of Transportation - ODO 63034 O.B. Riley Rd Bend, OR 97701
ESC Sample # : L582318-07 Date Received : June 27, 2012 Description : US97: J Street Intersections
Site ID : Sample ID : P12-05-9.5 FT
Project # : 15409 Collected By : Ryan Franklin Collection Date : 06/25/12 09:55
Parameter Dry Result Det. Limit Units Method Date Dil.
Hexachlorocyclopentadiene BDL 20. mg/kg 8270D 07/05/12 50 Hexachloroethane BDL 20. mg/kg 8270D 07/05/12 50 Indeno(1,2,3-cd)pyrene BDL 2.0 mg/kg 8270D 07/05/12 50 Isophorone BDL 20. mg/kg 8270D 07/05/12 50 Naphthalene BDL 2.0 mg/kg 8270D 07/05/12 50 Nitrobenzene BDL 20. mg/kg 8270D 07/05/12 50 n-Nitrosodimethylamine BDL 20. mg/kg 8270D 07/05/12 50 n-Nitrosodiphenylamine BDL 20. mg/kg 8270D 07/05/12 50 n-Nitrosodi-n-propylamine BDL 20. mg/kg 8270D 07/05/12 50 Phenanthrene BDL 2.0 mg/kg 8270D 07/05/12 50 Benzylbutyl phthalate BDL 20. mg/kg 8270D 07/05/12 50 Bis(2-ethylhexyl)phthalate BDL 20. mg/kg 8270D 07/05/12 50 Di-n-butyl phthalate BDL 20. mg/kg 8270D 07/05/12 50 Diethyl phthalate BDL 20. mg/kg 8270D 07/05/12 50 Dimethyl phthalate BDL 20. mg/kg 8270D 07/05/12 50 Di-n-octyl phthalate BDL 20. mg/kg 8270D 07/05/12 50 Pyrene BDL 2.0 mg/kg 8270D 07/05/12 50 1,2,4-Trichlorobenzene BDL 20. mg/kg 8270D 07/05/12 50
Acid Extractables 4-Chloro-3-methylphenol BDL 20. mg/kg 8270D 07/05/12 50 2-Chlorophenol BDL 20. mg/kg 8270D 07/05/12 50 2,4-Dichlorophenol BDL 20. mg/kg 8270D 07/05/12 50 2,4-Dimethylphenol BDL 20. mg/kg 8270D 07/05/12 50 4,6-Dinitro-2-methylphenol BDL 20. mg/kg 8270D 07/05/12 50 2,4-Dinitrophenol BDL 20. mg/kg 8270D 07/05/12 50 2-Nitrophenol BDL 20. mg/kg 8270D 07/05/12 50 4-Nitrophenol BDL 20. mg/kg 8270D 07/05/12 50 Pentachlorophenol BDL 20. mg/kg 8270D 07/05/12 50 Phenol BDL 20. mg/kg 8270D 07/05/12 50 2,4,6-Trichlorophenol BDL 20. mg/kg 8270D 07/05/12 50
Surrogate Recovery 2-Fluorophenol 0.00 % Rec. 8270D 07/05/12 50 Phenol-d5 0.00 % Rec. 8270D 07/05/12 50 Nitrobenzene-d5 140. % Rec. 8270D 07/05/12 50 2-Fluorobiphenyl 115. % Rec. 8270D 07/05/12 50 2,4,6-Tribromophenol 0.00 % Rec. 8270D 07/05/12 50 p-Terphenyl-d14 106. % Rec. 8270D 07/05/12 50
Results listed are dry weight basis. BDL - Below Detection Limit Det. Limit - Practical Quantitation Limit(PQL) Note: This report shall not be reproduced, except in full, without the written approval from ESC. The reported analytical results relate only to the sample submitted Reported: 07/12/12 19:24 Printed: 07/12/12 19:24
Page 10 of 35

12065 Lebanon Rd.Mt. Juliet, TN 37122(615) 758-58581-800-767-5859Fax (615) 758-5859
Tax I.D. 62-0814289
Est. 1970
REPORT OF ANALYSIS Ryan Franklin (ODOT) July 12,2012 Oregon Dept of Transportation - ODO 63034 O.B. Riley Rd Bend, OR 97701
ESC Sample # : L582318-08 Date Received : June 27, 2012 Description : US97: J Street Intersections
Site ID : Sample ID : P12-05-10.5 FT
Project # : 15409 Collected By : Ryan Franklin Collection Date : 06/25/12 10:06
Parameter Dry Result Det. Limit Units Method Date Dil.
Total Solids 87.6 0.100 % 2540G 07/02/12 1
Volatile Organics Acetone 0.28 0.057 mg/kg 8260B 06/28/12 1 Acrylonitrile BDL 0.011 mg/kg 8260B 06/28/12 1 Benzene BDL 0.0011 mg/kg 8260B 06/28/12 1 Bromobenzene BDL 0.0011 mg/kg 8260B 06/28/12 1 Bromodichloromethane BDL 0.0011 mg/kg 8260B 06/28/12 1 Bromoform BDL 0.0011 mg/kg 8260B 06/28/12 1 Bromomethane BDL 0.0057 mg/kg 8260B 06/28/12 1 n-Butylbenzene BDL 0.0011 mg/kg 8260B 06/28/12 1 sec-Butylbenzene BDL 0.0011 mg/kg 8260B 06/28/12 1 tert-Butylbenzene BDL 0.0011 mg/kg 8260B 06/28/12 1 Carbon tetrachloride BDL 0.0011 mg/kg 8260B 06/28/12 1 Chlorobenzene BDL 0.0011 mg/kg 8260B 06/28/12 1 Chlorodibromomethane BDL 0.0011 mg/kg 8260B 06/28/12 1 Chloroethane BDL 0.0057 mg/kg 8260B 06/28/12 1 2-Chloroethyl vinyl ether BDL 0.057 mg/kg 8260B 06/28/12 1 Chloroform BDL 0.0057 mg/kg 8260B 06/28/12 1 Chloromethane BDL 0.0028 mg/kg 8260B 06/28/12 1 2-Chlorotoluene BDL 0.0011 mg/kg 8260B 06/28/12 1 4-Chlorotoluene BDL 0.0011 mg/kg 8260B 06/28/12 1 1,2-Dibromo-3-Chloropropane BDL 0.0057 mg/kg 8260B 06/28/12 1 1,2-Dibromoethane BDL 0.0011 mg/kg 8260B 06/28/12 1 Dibromomethane BDL 0.0011 mg/kg 8260B 06/28/12 1 1,2-Dichlorobenzene BDL 0.0011 mg/kg 8260B 06/28/12 1 1,3-Dichlorobenzene BDL 0.0011 mg/kg 8260B 06/28/12 1 1,4-Dichlorobenzene BDL 0.0011 mg/kg 8260B 06/28/12 1 Dichlorodifluoromethane BDL 0.0057 mg/kg 8260B 06/28/12 1 1,1-Dichloroethane BDL 0.0011 mg/kg 8260B 06/28/12 1 1,2-Dichloroethane BDL 0.0011 mg/kg 8260B 06/28/12 1 1,1-Dichloroethene BDL 0.0011 mg/kg 8260B 06/28/12 1 cis-1,2-Dichloroethene BDL 0.0011 mg/kg 8260B 06/28/12 1 trans-1,2-Dichloroethene BDL 0.0011 mg/kg 8260B 06/28/12 1 1,2-Dichloropropane BDL 0.0011 mg/kg 8260B 06/28/12 1 1,1-Dichloropropene BDL 0.0011 mg/kg 8260B 06/28/12 1 1,3-Dichloropropane BDL 0.0011 mg/kg 8260B 06/28/12 1 cis-1,3-Dichloropropene BDL 0.0011 mg/kg 8260B 06/28/12 1 trans-1,3-Dichloropropene BDL 0.0011 mg/kg 8260B 06/28/12 1 2,2-Dichloropropane BDL 0.0011 mg/kg 8260B 06/28/12 1 Di-isopropyl ether BDL 0.0011 mg/kg 8260B 06/28/12 1 Ethylbenzene BDL 0.0011 mg/kg 8260B 06/28/12 1 Hexachloro-1,3-butadiene BDL 0.0011 mg/kg 8260B 06/28/12 1 Isopropylbenzene BDL 0.0011 mg/kg 8260B 06/28/12 1
Results listed are dry weight basis. BDL - Below Detection Limit Det. Limit - Practical Quantitation Limit(PQL) Note: This report shall not be reproduced, except in full, without the written approval from ESC. The reported analytical results relate only to the sample submitted
Page 11 of 35
12065 Lebanon Rd.Mt. Juliet, TN 37122(615) 758-58581-800-767-5859Fax (615) 758-5859
Tax I.D. 62-0814289
Est. 1970
REPORT OF ANALYSIS Ryan Franklin (ODOT) July 12,2012 Oregon Dept of Transportation - ODO 63034 O.B. Riley Rd Bend, OR 97701
ESC Sample # : L582318-08 Date Received : June 27, 2012 Description : US97: J Street Intersections
Site ID : Sample ID : P12-05-10.5 FT
Project # : 15409 Collected By : Ryan Franklin Collection Date : 06/25/12 10:06
Parameter Dry Result Det. Limit Units Method Date Dil.
p-Isopropyltoluene BDL 0.0011 mg/kg 8260B 06/28/12 1 2-Butanone (MEK) 0.12 0.011 mg/kg 8260B 06/28/12 1 Methylene Chloride BDL 0.0057 mg/kg 8260B 06/28/12 1 4-Methyl-2-pentanone (MIBK) BDL 0.011 mg/kg 8260B 06/28/12 1 Methyl tert-butyl ether BDL 0.0011 mg/kg 8260B 06/28/12 1 Naphthalene BDL 0.0057 mg/kg 8260B 06/28/12 1 n-Propylbenzene BDL 0.0011 mg/kg 8260B 06/28/12 1 Styrene BDL 0.0011 mg/kg 8260B 06/28/12 1 1,1,1,2-Tetrachloroethane BDL 0.0011 mg/kg 8260B 06/28/12 1 1,1,2,2-Tetrachloroethane BDL 0.0011 mg/kg 8260B 06/28/12 1 1,1,2-Trichlorotrifluoroethane BDL 0.0011 mg/kg 8260B 06/28/12 1 Tetrachloroethene BDL 0.0011 mg/kg 8260B 06/28/12 1 Toluene BDL 0.0057 mg/kg 8260B 06/28/12 1 1,2,3-Trichlorobenzene BDL 0.0011 mg/kg 8260B 06/28/12 1 1,2,4-Trichlorobenzene BDL 0.0011 mg/kg 8260B 06/28/12 1 1,1,1-Trichloroethane BDL 0.0011 mg/kg 8260B 06/28/12 1 1,1,2-Trichloroethane BDL 0.0011 mg/kg 8260B 06/28/12 1 Trichloroethene BDL 0.0011 mg/kg 8260B 06/28/12 1 Trichlorofluoromethane BDL 0.0057 mg/kg 8260B 06/28/12 1 1,2,3-Trichloropropane BDL 0.0028 mg/kg 8260B 06/28/12 1 1,2,4-Trimethylbenzene BDL 0.0011 mg/kg 8260B 06/28/12 1 1,2,3-Trimethylbenzene BDL 0.0011 mg/kg 8260B 06/28/12 1 1,3,5-Trimethylbenzene BDL 0.0011 mg/kg 8260B 06/28/12 1 Vinyl chloride BDL 0.0011 mg/kg 8260B 06/28/12 1 Xylenes, Total BDL 0.0034 mg/kg 8260B 06/28/12 1
Surrogate Recovery Toluene-d8 103. % Rec. 8260B 06/28/12 1 Dibromofluoromethane 111. % Rec. 8260B 06/28/12 1 a,a,a-Trifluorotoluene 96.9 % Rec. 8260B 06/28/12 1 4-Bromofluorobenzene 89.2 % Rec. 8260B 06/28/12 1
Results listed are dry weight basis. BDL - Below Detection Limit Det. Limit - Practical Quantitation Limit(PQL) Note: This report shall not be reproduced, except in full, without the written approval from ESC. The reported analytical results relate only to the sample submitted Reported: 07/12/12 19:24 Printed: 07/12/12 19:25
Page 12 of 35
12065 Lebanon Rd.Mt. Juliet, TN 37122(615) 758-58581-800-767-5859Fax (615) 758-5859
Tax I.D. 62-0814289
Est. 1970
REPORT OF ANALYSIS Ryan Franklin (ODOT) July 12,2012 Oregon Dept of Transportation - ODO 63034 O.B. Riley Rd Bend, OR 97701
ESC Sample # : L582318-09 Date Received : June 27, 2012 Description : US97: J Street Intersections
Site ID : Sample ID : P12-05-13 FT
Project # : 15409 Collected By : Ryan Franklin Collection Date : 06/25/12 10:26
Parameter Dry Result Det. Limit Units Method Date Dil.
Total Solids 83.6 0.100 % 2540G 07/02/12 1
Diesel Range Organics (DRO) BDL 4.8 mg/kg NWTPHDX 07/12/12 1 Residual Range Organics (RRO) BDL 12. mg/kg NWTPHDX 07/12/12 1
Surrogate Recovery o-Terphenyl 102. % Rec. NWTPHDX 07/12/12 1
Results listed are dry weight basis. BDL - Below Detection Limit Det. Limit - Practical Quantitation Limit(PQL) Note: This report shall not be reproduced, except in full, without the written approval from ESC. The reported analytical results relate only to the sample submitted Reported: 07/12/12 19:24 Printed: 07/12/12 19:25
Page 13 of 35

12065 Lebanon Rd.Mt. Juliet, TN 37122(615) 758-58581-800-767-5859Fax (615) 758-5859
Tax I.D. 62-0814289
Est. 1970
REPORT OF ANALYSIS Ryan Franklin (ODOT) July 12,2012 Oregon Dept of Transportation - ODO 63034 O.B. Riley Rd Bend, OR 97701
ESC Sample # : L582318-10 Date Received : June 27, 2012 Description : US97: J Street Intersections
Site ID : Sample ID : P12-06-8 FT
Project # : 15409 Collected By : Ryan Franklin Collection Date : 06/25/12 10:51
Parameter Dry Result Det. Limit Units Method Date Dil.
Total Solids 85.8 0.100 % 2540G 07/02/12 1
Diesel Range Organics (DRO) BDL 4.7 mg/kg NWTPHDX 07/12/12 1 Residual Range Organics (RRO) BDL 12. mg/kg NWTPHDX 07/12/12 1
Surrogate Recovery o-Terphenyl 91.9 % Rec. NWTPHDX 07/12/12 1
Results listed are dry weight basis. BDL - Below Detection Limit Det. Limit - Practical Quantitation Limit(PQL) Note: This report shall not be reproduced, except in full, without the written approval from ESC. The reported analytical results relate only to the sample submitted Reported: 07/12/12 19:24 Printed: 07/12/12 19:25
Page 14 of 35

12065 Lebanon Rd.Mt. Juliet, TN 37122(615) 758-58581-800-767-5859Fax (615) 758-5859
Tax I.D. 62-0814289
Est. 1970
REPORT OF ANALYSIS Ryan Franklin (ODOT) July 12,2012 Oregon Dept of Transportation - ODO 63034 O.B. Riley Rd Bend, OR 97701
ESC Sample # : L582318-11 Date Received : June 27, 2012 Description : US97: J Street Intersections
Site ID : Sample ID : P12-07-9 FT
Project # : 15409 Collected By : Ryan Franklin Collection Date : 06/25/12 11:25
Parameter Dry Result Det. Limit Units Method Date Dil.
Total Solids 84.3 0.100 % 2540G 07/03/12 1
Diesel Range Organics (DRO) BDL 4.7 mg/kg NWTPHDX 07/12/12 1 Residual Range Organics (RRO) BDL 12. mg/kg NWTPHDX 07/12/12 1
Surrogate Recovery o-Terphenyl 99.1 % Rec. NWTPHDX 07/12/12 1
Results listed are dry weight basis. BDL - Below Detection Limit Det. Limit - Practical Quantitation Limit(PQL) Note: This report shall not be reproduced, except in full, without the written approval from ESC. The reported analytical results relate only to the sample submitted Reported: 07/12/12 19:24 Printed: 07/12/12 19:25
Page 15 of 35

12065 Lebanon Rd.Mt. Juliet, TN 37122(615) 758-58581-800-767-5859Fax (615) 758-5859
Tax I.D. 62-0814289
Est. 1970
REPORT OF ANALYSIS Ryan Franklin (ODOT) July 12,2012 Oregon Dept of Transportation - ODO 63034 O.B. Riley Rd Bend, OR 97701
ESC Sample # : L582318-12 Date Received : June 27, 2012 Description : US97: J Street Intersections
Site ID : Sample ID : P12-08-1-2 FT
Project # : 15409 Collected By : Ryan Franklin Collection Date : 06/25/12 11:40
Parameter Dry Result Det. Limit Units Method Date Dil.
Total Solids 86.1 0.100 % 2540G 07/03/12 1
Diesel Range Organics (DRO) BDL 4.6 mg/kg NWTPHDX 07/12/12 1 Residual Range Organics (RRO) BDL 12. mg/kg NWTPHDX 07/12/12 1
Surrogate Recovery o-Terphenyl 105. % Rec. NWTPHDX 07/12/12 1
Results listed are dry weight basis. BDL - Below Detection Limit Det. Limit - Practical Quantitation Limit(PQL) Note: This report shall not be reproduced, except in full, without the written approval from ESC. The reported analytical results relate only to the sample submitted Reported: 07/12/12 19:24 Printed: 07/12/12 19:25
Page 16 of 35

12065 Lebanon Rd.Mt. Juliet, TN 37122(615) 758-58581-800-767-5859Fax (615) 758-5859
Tax I.D. 62-0814289
Est. 1970
REPORT OF ANALYSIS Ryan Franklin (ODOT) July 12,2012 Oregon Dept of Transportation - ODO 63034 O.B. Riley Rd Bend, OR 97701
ESC Sample # : L582318-13 Date Received : June 27, 2012 Description : US97: J Street Intersections
Site ID : Sample ID : P12-08-10 FT
Project # : 15409 Collected By : Ryan Franklin Collection Date : 06/25/12 11:57
Parameter Dry Result Det. Limit Units Method Date Dil.
Total Solids 81.4 0.100 % 2540G 07/03/12 1
Diesel Range Organics (DRO) BDL 4.9 mg/kg NWTPHDX 07/12/12 1 Residual Range Organics (RRO) BDL 12. mg/kg NWTPHDX 07/12/12 1
Surrogate Recovery o-Terphenyl 117. % Rec. NWTPHDX 07/12/12 1
Results listed are dry weight basis. BDL - Below Detection Limit Det. Limit - Practical Quantitation Limit(PQL) Note: This report shall not be reproduced, except in full, without the written approval from ESC. The reported analytical results relate only to the sample submitted Reported: 07/12/12 19:24 Printed: 07/12/12 19:25
Page 17 of 35

12065 Lebanon Rd.Mt. Juliet, TN 37122(615) 758-58581-800-767-5859Fax (615) 758-5859
Tax I.D. 62-0814289
Est. 1970
REPORT OF ANALYSIS Ryan Franklin (ODOT) July 12,2012 Oregon Dept of Transportation - ODO 63034 O.B. Riley Rd Bend, OR 97701
ESC Sample # : L582318-14 Date Received : June 27, 2012 Description : US97: J Street Intersections
Site ID : Sample ID : P12-09-11 FT
Project # : 15409 Collected By : Ryan Franklin Collection Date : 06/25/12 12:22
Parameter Dry Result Det. Limit Units Method Date Dil.
Total Solids 85.1 0.100 % 2540G 07/03/12 1
Diesel Range Organics (DRO) BDL 4.7 mg/kg NWTPHDX 07/12/12 1 Residual Range Organics (RRO) BDL 12. mg/kg NWTPHDX 07/12/12 1
Surrogate Recovery o-Terphenyl 118. % Rec. NWTPHDX 07/12/12 1
Results listed are dry weight basis. BDL - Below Detection Limit Det. Limit - Practical Quantitation Limit(PQL) Note: This report shall not be reproduced, except in full, without the written approval from ESC. The reported analytical results relate only to the sample submitted Reported: 07/12/12 19:24 Printed: 07/12/12 19:25
Page 18 of 35
Attachment AList of Analytes with QC Qualifiers
Sample Work Sample Run Number Group Type Analyte ID Qualifier ________________ ___________ _______ ________________________________________ __________ __________
L582318-06 WG600178 SAMP o-Terphenyl R2240913 J7 WG600176 SAMP Acenaphthene R2234913 O WG600176 SAMP Acenaphthylene R2234913 O WG600176 SAMP Anthracene R2234913 O WG600176 SAMP Benzidine R2234913 J4O WG600176 SAMP Benzo(a)anthracene R2234913 O WG600176 SAMP Benzo(b)fluoranthene R2234913 O WG600176 SAMP Benzo(k)fluoranthene R2234913 O WG600176 SAMP Benzo(g,h,i)perylene R2234913 O WG600176 SAMP Benzo(a)pyrene R2234913 O WG600176 SAMP Bis(2-chlorethoxy)methane R2234913 O WG600176 SAMP Bis(2-chloroethyl)ether R2234913 O WG600176 SAMP Bis(2-chloroisopropyl)ether R2234913 O WG600176 SAMP 4-Bromophenyl-phenylether R2234913 O WG600176 SAMP 2-Chloronaphthalene R2234913 O WG600176 SAMP 4-Chlorophenyl-phenylether R2234913 O WG600176 SAMP Chrysene R2234913 O WG600176 SAMP Dibenz(a,h)anthracene R2234913 O WG600176 SAMP 3,3-Dichlorobenzidine R2234913 O WG600176 SAMP 2,4-Dinitrotoluene R2234913 O WG600176 SAMP 2,6-Dinitrotoluene R2234913 O WG600176 SAMP Fluoranthene R2234913 O WG600176 SAMP Fluorene R2234913 O WG600176 SAMP Hexachlorobenzene R2234913 O WG600176 SAMP Hexachloro-1,3-butadiene R2234913 O WG600176 SAMP Hexachlorocyclopentadiene R2234913 O WG600176 SAMP Hexachloroethane R2234913 O WG600176 SAMP Indeno(1,2,3-cd)pyrene R2234913 O WG600176 SAMP Isophorone R2234913 O WG600176 SAMP Naphthalene R2234913 O WG600176 SAMP Nitrobenzene R2234913 O WG600176 SAMP n-Nitrosodimethylamine R2234913 O WG600176 SAMP n-Nitrosodiphenylamine R2234913 O WG600176 SAMP n-Nitrosodi-n-propylamine R2234913 O WG600176 SAMP Phenanthrene R2234913 O WG600176 SAMP Benzylbutyl phthalate R2234913 O WG600176 SAMP Bis(2-ethylhexyl)phthalate R2234913 O WG600176 SAMP Di-n-butyl phthalate R2234913 O WG600176 SAMP Diethyl phthalate R2234913 O WG600176 SAMP Dimethyl phthalate R2234913 O WG600176 SAMP Di-n-octyl phthalate R2234913 O WG600176 SAMP Pyrene R2234913 O WG600176 SAMP 1,2,4-Trichlorobenzene R2234913 O WG600176 SAMP 4-Chloro-3-methylphenol R2234913 O WG600176 SAMP 2-Chlorophenol R2234913 O WG600176 SAMP 2,4-Dichlorophenol R2234913 O WG600176 SAMP 2,4-Dimethylphenol R2234913 J4O WG600176 SAMP 4,6-Dinitro-2-methylphenol R2234913 O WG600176 SAMP 2,4-Dinitrophenol R2234913 J3J4O WG600176 SAMP 2-Nitrophenol R2234913 O WG600176 SAMP 4-Nitrophenol R2234913 O WG600176 SAMP Pentachlorophenol R2234913 O WG600176 SAMP Phenol R2234913 O WG600176 SAMP 2,4,6-Trichlorophenol R2234913 O WG600176 SAMP 2-Fluorophenol R2234913 J7 WG600176 SAMP Phenol-d5 R2234913 J7 WG600176 SAMP Nitrobenzene-d5 R2234913 J7 WG600176 SAMP 2-Fluorobiphenyl R2234913 J7 WG600176 SAMP 2,4,6-Tribromophenol R2234913 J7 WG600176 SAMP p-Terphenyl-d14 R2234913 J7
L582318-07 WG600178 SAMP o-Terphenyl R2240913 J7 WG600176 SAMP Acenaphthene R2234913 O WG600176 SAMP Acenaphthylene R2234913 O WG600176 SAMP Anthracene R2234913 O WG600176 SAMP Benzidine R2234913 J4O WG600176 SAMP Benzo(a)anthracene R2234913 O WG600176 SAMP Benzo(b)fluoranthene R2234913 O WG600176 SAMP Benzo(k)fluoranthene R2234913 O WG600176 SAMP Benzo(g,h,i)perylene R2234913 O
Page 19 of 35
Attachment AList of Analytes with QC Qualifiers
Sample Work Sample Run Number Group Type Analyte ID Qualifier ________________ ___________ _______ ________________________________________ __________ __________
WG600176 SAMP Benzo(a)pyrene R2234913 O WG600176 SAMP Bis(2-chlorethoxy)methane R2234913 O WG600176 SAMP Bis(2-chloroethyl)ether R2234913 O WG600176 SAMP Bis(2-chloroisopropyl)ether R2234913 O WG600176 SAMP 4-Bromophenyl-phenylether R2234913 O WG600176 SAMP 2-Chloronaphthalene R2234913 O WG600176 SAMP 4-Chlorophenyl-phenylether R2234913 O WG600176 SAMP Chrysene R2234913 O WG600176 SAMP Dibenz(a,h)anthracene R2234913 O WG600176 SAMP 3,3-Dichlorobenzidine R2234913 O WG600176 SAMP 2,4-Dinitrotoluene R2234913 O WG600176 SAMP 2,6-Dinitrotoluene R2234913 O WG600176 SAMP Fluoranthene R2234913 O WG600176 SAMP Fluorene R2234913 O WG600176 SAMP Hexachlorobenzene R2234913 O WG600176 SAMP Hexachloro-1,3-butadiene R2234913 O WG600176 SAMP Hexachlorocyclopentadiene R2234913 O WG600176 SAMP Hexachloroethane R2234913 O WG600176 SAMP Indeno(1,2,3-cd)pyrene R2234913 O WG600176 SAMP Isophorone R2234913 O WG600176 SAMP Naphthalene R2234913 O WG600176 SAMP Nitrobenzene R2234913 O WG600176 SAMP n-Nitrosodimethylamine R2234913 O WG600176 SAMP n-Nitrosodiphenylamine R2234913 O WG600176 SAMP n-Nitrosodi-n-propylamine R2234913 O WG600176 SAMP Phenanthrene R2234913 O WG600176 SAMP Benzylbutyl phthalate R2234913 O WG600176 SAMP Bis(2-ethylhexyl)phthalate R2234913 O WG600176 SAMP Di-n-butyl phthalate R2234913 O WG600176 SAMP Diethyl phthalate R2234913 O WG600176 SAMP Dimethyl phthalate R2234913 O WG600176 SAMP Di-n-octyl phthalate R2234913 O WG600176 SAMP Pyrene R2234913 O WG600176 SAMP 1,2,4-Trichlorobenzene R2234913 O WG600176 SAMP 4-Chloro-3-methylphenol R2234913 O WG600176 SAMP 2-Chlorophenol R2234913 O WG600176 SAMP 2,4-Dichlorophenol R2234913 O WG600176 SAMP 2,4-Dimethylphenol R2234913 J4O WG600176 SAMP 4,6-Dinitro-2-methylphenol R2234913 O WG600176 SAMP 2,4-Dinitrophenol R2234913 J3J4O WG600176 SAMP 2-Nitrophenol R2234913 O WG600176 SAMP 4-Nitrophenol R2234913 O WG600176 SAMP Pentachlorophenol R2234913 O WG600176 SAMP Phenol R2234913 O WG600176 SAMP 2,4,6-Trichlorophenol R2234913 O WG600176 SAMP 2-Fluorophenol R2234913 J7 WG600176 SAMP Phenol-d5 R2234913 J7 WG600176 SAMP Nitrobenzene-d5 R2234913 J7 WG600176 SAMP 2-Fluorobiphenyl R2234913 J7 WG600176 SAMP 2,4,6-Tribromophenol R2234913 J7 WG600176 SAMP p-Terphenyl-d14 R2234913 J7
Page 20 of 35

Attachment BExplanation of QC Qualifier Codes
Qualifier Meaning __________________ _______________________________________________________________________________
J3 The associated batch QC was outside the established quality control rangefor precision.
J4 The associated batch QC was outside the established quality control rangefor accuracy.
J7 Surrogate recovery cannot be used for control limit evaluation due todilution.
O (ESC) Sample diluted due to matrix interferences that impaired the abilityto make an accurate analytical determination. The detection limit iselevated in order to reflect the necessary dilution.
Qualifier Report Information
ESC utilizes sample and result qualifiers as set forth by the EPA Contract Laboratory Program andas required by most certifying bodies including NELAC. In addition to the EPA qualifiers adoptedby ESC, we have implemented ESC qualifiers to provide more information pertaining to our analyticalresults. Each qualifier is designated in the qualifier explanation as either EPA or ESC.Data qualifiers are intended to provide the ESC client with more detailed information concerningthe potential bias of reported data. Because of the wide range of constituents and variety ofmatrices incorporated by most EPA methods,it is common for some compounds to fall outside ofestablished ranges. These exceptions are evaluated and all reported data is valid and useable"unless qualified as 'R' (Rejected)."
DefinitionsAccuracy - The relationship of the observed value of a known sample to the
true value of a known sample. Represented by percent recovery andrelevant to samples such as: control samples, matrix spike recoveries,surrogate recoveries, etc.
Precision - The agreement between a set of samples or between duplicate samples.Relates to how close together the results are and is represented byRelative Percent Differrence.
Surrogate - Organic compounds that are similar in chemical composition, extraction,and chromotography to analytes of interest. The surrogates are used todetermine the probable response of the group of analytes that are chem-ically related to the surrogate compound. Surrogates are added to thesample and carried through all stages of preparation and analyses.
TIC - Tentatively Identified Compound: Compounds detected in samples that arenot target compounds, internal standards, system monitoring compounds,or surrogates.
Page 21 of 35
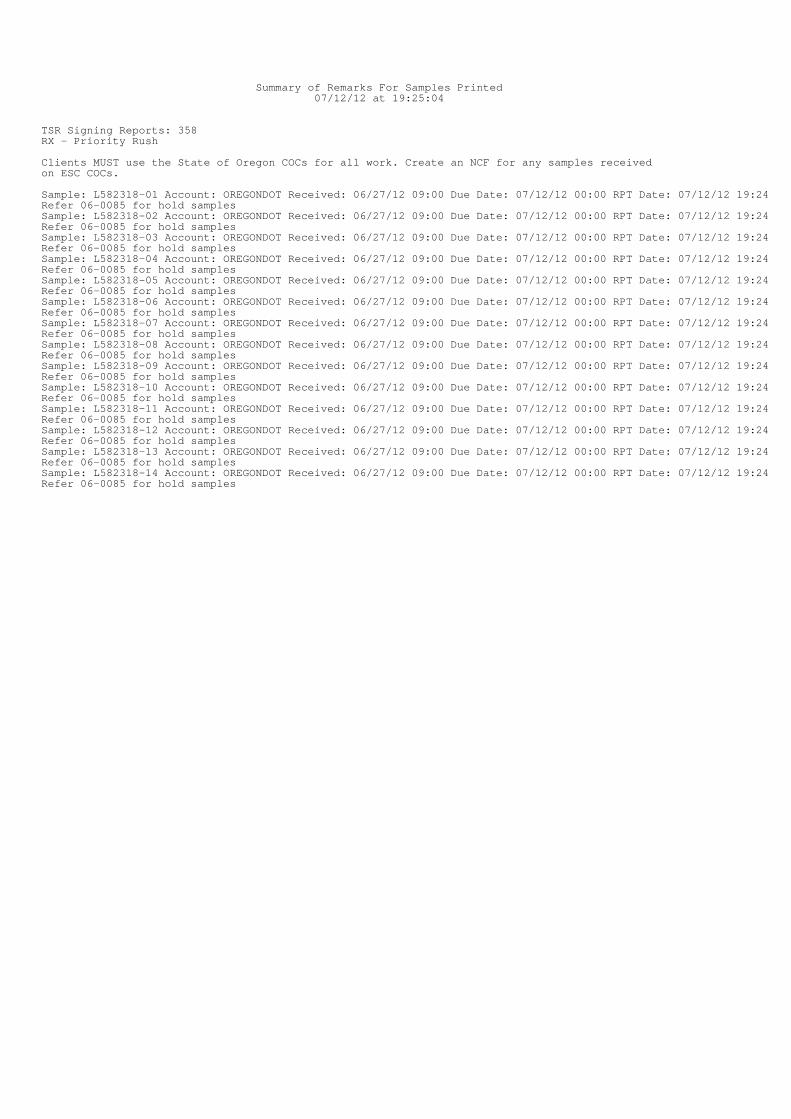
Summary of Remarks For Samples Printed07/12/12 at 19:25:04
TSR Signing Reports: 358RX - Priority Rush
Clients MUST use the State of Oregon COCs for all work. Create an NCF for any samples receivedon ESC COCs.
Sample: L582318-01 Account: OREGONDOT Received: 06/27/12 09:00 Due Date: 07/12/12 00:00 RPT Date: 07/12/12 19:24 Refer 06-0085 for hold samplesSample: L582318-02 Account: OREGONDOT Received: 06/27/12 09:00 Due Date: 07/12/12 00:00 RPT Date: 07/12/12 19:24 Refer 06-0085 for hold samplesSample: L582318-03 Account: OREGONDOT Received: 06/27/12 09:00 Due Date: 07/12/12 00:00 RPT Date: 07/12/12 19:24 Refer 06-0085 for hold samplesSample: L582318-04 Account: OREGONDOT Received: 06/27/12 09:00 Due Date: 07/12/12 00:00 RPT Date: 07/12/12 19:24 Refer 06-0085 for hold samplesSample: L582318-05 Account: OREGONDOT Received: 06/27/12 09:00 Due Date: 07/12/12 00:00 RPT Date: 07/12/12 19:24 Refer 06-0085 for hold samplesSample: L582318-06 Account: OREGONDOT Received: 06/27/12 09:00 Due Date: 07/12/12 00:00 RPT Date: 07/12/12 19:24 Refer 06-0085 for hold samplesSample: L582318-07 Account: OREGONDOT Received: 06/27/12 09:00 Due Date: 07/12/12 00:00 RPT Date: 07/12/12 19:24 Refer 06-0085 for hold samplesSample: L582318-08 Account: OREGONDOT Received: 06/27/12 09:00 Due Date: 07/12/12 00:00 RPT Date: 07/12/12 19:24 Refer 06-0085 for hold samplesSample: L582318-09 Account: OREGONDOT Received: 06/27/12 09:00 Due Date: 07/12/12 00:00 RPT Date: 07/12/12 19:24 Refer 06-0085 for hold samplesSample: L582318-10 Account: OREGONDOT Received: 06/27/12 09:00 Due Date: 07/12/12 00:00 RPT Date: 07/12/12 19:24 Refer 06-0085 for hold samplesSample: L582318-11 Account: OREGONDOT Received: 06/27/12 09:00 Due Date: 07/12/12 00:00 RPT Date: 07/12/12 19:24 Refer 06-0085 for hold samplesSample: L582318-12 Account: OREGONDOT Received: 06/27/12 09:00 Due Date: 07/12/12 00:00 RPT Date: 07/12/12 19:24 Refer 06-0085 for hold samplesSample: L582318-13 Account: OREGONDOT Received: 06/27/12 09:00 Due Date: 07/12/12 00:00 RPT Date: 07/12/12 19:24 Refer 06-0085 for hold samplesSample: L582318-14 Account: OREGONDOT Received: 06/27/12 09:00 Due Date: 07/12/12 00:00 RPT Date: 07/12/12 19:24 Refer 06-0085 for hold samples
12065 Lebanon Rd.Mt. Juliet, TN 37122(615) 758-58581-800-767-5859Fax (615) 758-5859
Tax I.D. 62-0814289
Est. 1970Oregon Dept of Transportation - ODOT Ryan Franklin (ODOT) 63034 O.B. Riley Rd Quality Assurance Report
Level IIBend, OR 97701 July 12, 2012
L582318
Laboratory BlankAnalyte Result Units % Rec Limit Batch Date Analyzed
1,1,1,2-Tetrachloroethane < .001 mg/kg WG600099 06/27/12 22:34 1,1,1-Trichloroethane < .001 mg/kg WG600099 06/27/12 22:34 1,1,2,2-Tetrachloroethane < .001 mg/kg WG600099 06/27/12 22:34 1,1,2-Trichloroethane < .001 mg/kg WG600099 06/27/12 22:34 1,1,2-Trichlorotrifluoroethane < .001 mg/kg WG600099 06/27/12 22:34 1,1-Dichloroethane < .001 mg/kg WG600099 06/27/12 22:34 1,1-Dichloroethene < .001 mg/kg WG600099 06/27/12 22:34 1,1-Dichloropropene < .001 mg/kg WG600099 06/27/12 22:34 1,2,3-Trichlorobenzene < .001 mg/kg WG600099 06/27/12 22:34 1,2,3-Trichloropropane < .0025 mg/kg WG600099 06/27/12 22:34 1,2,3-Trimethylbenzene < .001 mg/kg WG600099 06/27/12 22:34 1,2,4-Trichlorobenzene < .001 mg/kg WG600099 06/27/12 22:34 1,2,4-Trimethylbenzene < .001 mg/kg WG600099 06/27/12 22:34 1,2-Dibromo-3-Chloropropane < .005 mg/kg WG600099 06/27/12 22:34 1,2-Dibromoethane < .001 mg/kg WG600099 06/27/12 22:34 1,2-Dichlorobenzene < .001 mg/kg WG600099 06/27/12 22:34 1,2-Dichloroethane < .001 mg/kg WG600099 06/27/12 22:34 1,2-Dichloropropane < .001 mg/kg WG600099 06/27/12 22:34 1,3,5-Trimethylbenzene < .001 mg/kg WG600099 06/27/12 22:34 1,3-Dichlorobenzene < .001 mg/kg WG600099 06/27/12 22:34 1,3-Dichloropropane < .001 mg/kg WG600099 06/27/12 22:34 1,4-Dichlorobenzene < .001 mg/kg WG600099 06/27/12 22:34 2,2-Dichloropropane < .001 mg/kg WG600099 06/27/12 22:34 2-Butanone (MEK) < .01 mg/kg WG600099 06/27/12 22:34 2-Chloroethyl vinyl ether < .05 mg/kg WG600099 06/27/12 22:34 2-Chlorotoluene < .001 mg/kg WG600099 06/27/12 22:34 4-Chlorotoluene < .001 mg/kg WG600099 06/27/12 22:34 4-Methyl-2-pentanone (MIBK) < .01 mg/kg WG600099 06/27/12 22:34 Acetone < .05 mg/kg WG600099 06/27/12 22:34 Acrylonitrile < .01 mg/kg WG600099 06/27/12 22:34 Benzene < .001 mg/kg WG600099 06/27/12 22:34 Bromobenzene < .001 mg/kg WG600099 06/27/12 22:34 Bromodichloromethane < .001 mg/kg WG600099 06/27/12 22:34 Bromoform < .001 mg/kg WG600099 06/27/12 22:34 Bromomethane < .005 mg/kg WG600099 06/27/12 22:34 Carbon tetrachloride < .001 mg/kg WG600099 06/27/12 22:34 Chlorobenzene < .001 mg/kg WG600099 06/27/12 22:34 Chlorodibromomethane < .001 mg/kg WG600099 06/27/12 22:34 Chloroethane < .005 mg/kg WG600099 06/27/12 22:34 Chloroform < .005 mg/kg WG600099 06/27/12 22:34 Chloromethane < .0025 mg/kg WG600099 06/27/12 22:34 cis-1,2-Dichloroethene < .001 mg/kg WG600099 06/27/12 22:34 cis-1,3-Dichloropropene < .001 mg/kg WG600099 06/27/12 22:34 Di-isopropyl ether < .001 mg/kg WG600099 06/27/12 22:34 Dibromomethane < .001 mg/kg WG600099 06/27/12 22:34 Dichlorodifluoromethane < .005 mg/kg WG600099 06/27/12 22:34 Ethylbenzene < .001 mg/kg WG600099 06/27/12 22:34 Hexachloro-1,3-butadiene < .001 mg/kg WG600099 06/27/12 22:34 Isopropylbenzene < .001 mg/kg WG600099 06/27/12 22:34 Methyl tert-butyl ether < .001 mg/kg WG600099 06/27/12 22:34 Methylene Chloride < .005 mg/kg WG600099 06/27/12 22:34 n-Butylbenzene < .001 mg/kg WG600099 06/27/12 22:34 n-Propylbenzene < .001 mg/kg WG600099 06/27/12 22:34 Naphthalene < .005 mg/kg WG600099 06/27/12 22:34 p-Isopropyltoluene < .001 mg/kg WG600099 06/27/12 22:34 sec-Butylbenzene < .001 mg/kg WG600099 06/27/12 22:34 Styrene < .001 mg/kg WG600099 06/27/12 22:34 tert-Butylbenzene < .001 mg/kg WG600099 06/27/12 22:34 Tetrachloroethene < .001 mg/kg WG600099 06/27/12 22:34
* Performance of this Analyte is outside of established criteria.For additional information, please see Attachment A 'List of Analytes with QC Qualifiers.'
Page 22 of 35

12065 Lebanon Rd.Mt. Juliet, TN 37122(615) 758-58581-800-767-5859Fax (615) 758-5859
Tax I.D. 62-0814289
Est. 1970Oregon Dept of Transportation - ODOT Ryan Franklin (ODOT) 63034 O.B. Riley Rd Quality Assurance Report
Level IIBend, OR 97701 July 12, 2012
L582318
Laboratory BlankAnalyte Result Units % Rec Limit Batch Date Analyzed
Toluene < .005 mg/kg WG600099 06/27/12 22:34 trans-1,2-Dichloroethene < .001 mg/kg WG600099 06/27/12 22:34 trans-1,3-Dichloropropene < .001 mg/kg WG600099 06/27/12 22:34 Trichloroethene < .001 mg/kg WG600099 06/27/12 22:34 Trichlorofluoromethane < .005 mg/kg WG600099 06/27/12 22:34 Vinyl chloride < .001 mg/kg WG600099 06/27/12 22:34 Xylenes, Total < .003 mg/kg WG600099 06/27/12 22:34 4-Bromofluorobenzene % Rec. 98.54 67-133 WG600099 06/27/12 22:34 Dibromofluoromethane % Rec. 103.3 72-135 WG600099 06/27/12 22:34 Toluene-d8 % Rec. 103.3 90-113 WG600099 06/27/12 22:34 a,a,a-Trifluorotoluene % Rec. 101.7 89-115 WG600099 06/27/12 22:34
1,2,4-Trichlorobenzene < .333 mg/kg WG600176 06/30/12 07:17 2,4,6-Trichlorophenol < .333 mg/kg WG600176 06/30/12 07:17 2,4-Dichlorophenol < .333 mg/kg WG600176 06/30/12 07:17 2,4-Dimethylphenol < .333 mg/kg WG600176 06/30/12 07:17 2,4-Dinitrophenol < .333 mg/kg WG600176 06/30/12 07:17 2,4-Dinitrotoluene < .333 mg/kg WG600176 06/30/12 07:17 2,6-Dinitrotoluene < .333 mg/kg WG600176 06/30/12 07:17 2-Chloronaphthalene < .033 mg/kg WG600176 06/30/12 07:17 2-Chlorophenol < .333 mg/kg WG600176 06/30/12 07:17 2-Nitrophenol < .333 mg/kg WG600176 06/30/12 07:17 3,3-Dichlorobenzidine < .333 mg/kg WG600176 06/30/12 07:17 4,6-Dinitro-2-methylphenol < .333 mg/kg WG600176 06/30/12 07:17 4-Bromophenyl-phenylether < .333 mg/kg WG600176 06/30/12 07:17 4-Chloro-3-methylphenol < .333 mg/kg WG600176 06/30/12 07:17 4-Chlorophenyl-phenylether < .333 mg/kg WG600176 06/30/12 07:17 4-Nitrophenol < .333 mg/kg WG600176 06/30/12 07:17 Acenaphthene < .033 mg/kg WG600176 06/30/12 07:17 Acenaphthylene < .033 mg/kg WG600176 06/30/12 07:17 Anthracene < .033 mg/kg WG600176 06/30/12 07:17 Benzidine < .333 mg/kg WG600176 06/30/12 07:17 Benzo(a)anthracene < .033 mg/kg WG600176 06/30/12 07:17 Benzo(a)pyrene < .033 mg/kg WG600176 06/30/12 07:17 Benzo(b)fluoranthene < .033 mg/kg WG600176 06/30/12 07:17 Benzo(g,h,i)perylene < .033 mg/kg WG600176 06/30/12 07:17 Benzo(k)fluoranthene < .033 mg/kg WG600176 06/30/12 07:17 Benzylbutyl phthalate < .333 mg/kg WG600176 06/30/12 07:17 Bis(2-chlorethoxy)methane < .333 mg/kg WG600176 06/30/12 07:17 Bis(2-chloroethyl)ether < .333 mg/kg WG600176 06/30/12 07:17 Bis(2-chloroisopropyl)ether < .333 mg/kg WG600176 06/30/12 07:17 Bis(2-ethylhexyl)phthalate < .333 mg/kg WG600176 06/30/12 07:17 Chrysene < .033 mg/kg WG600176 06/30/12 07:17 Di-n-butyl phthalate < .333 mg/kg WG600176 06/30/12 07:17 Di-n-octyl phthalate < .333 mg/kg WG600176 06/30/12 07:17 Dibenz(a,h)anthracene < .033 mg/kg WG600176 06/30/12 07:17 Diethyl phthalate < .333 mg/kg WG600176 06/30/12 07:17 Dimethyl phthalate < .333 mg/kg WG600176 06/30/12 07:17 Fluoranthene < .033 mg/kg WG600176 06/30/12 07:17 Fluorene < .033 mg/kg WG600176 06/30/12 07:17 Hexachloro-1,3-butadiene < .333 mg/kg WG600176 06/30/12 07:17 Hexachlorobenzene < .333 mg/kg WG600176 06/30/12 07:17 Hexachlorocyclopentadiene < .333 mg/kg WG600176 06/30/12 07:17 Hexachloroethane < .333 mg/kg WG600176 06/30/12 07:17 Indeno(1,2,3-cd)pyrene < .033 mg/kg WG600176 06/30/12 07:17 Isophorone < .333 mg/kg WG600176 06/30/12 07:17 n-Nitrosodi-n-propylamine < .333 mg/kg WG600176 06/30/12 07:17 n-Nitrosodimethylamine < .333 mg/kg WG600176 06/30/12 07:17
* Performance of this Analyte is outside of established criteria.For additional information, please see Attachment A 'List of Analytes with QC Qualifiers.'
Page 23 of 35
12065 Lebanon Rd.Mt. Juliet, TN 37122(615) 758-58581-800-767-5859Fax (615) 758-5859
Tax I.D. 62-0814289
Est. 1970Oregon Dept of Transportation - ODOT Ryan Franklin (ODOT) 63034 O.B. Riley Rd Quality Assurance Report
Level IIBend, OR 97701 July 12, 2012
L582318
Laboratory BlankAnalyte Result Units % Rec Limit Batch Date Analyzed
n-Nitrosodiphenylamine < .333 mg/kg WG600176 06/30/12 07:17 Naphthalene < .033 mg/kg WG600176 06/30/12 07:17 Nitrobenzene < .333 mg/kg WG600176 06/30/12 07:17 Pentachlorophenol < .333 mg/kg WG600176 06/30/12 07:17 Phenanthrene < .033 mg/kg WG600176 06/30/12 07:17 Phenol < .333 mg/kg WG600176 06/30/12 07:17 Pyrene < .033 mg/kg WG600176 06/30/12 07:17 2,4,6-Tribromophenol % Rec. 75.63 16-136 WG600176 06/30/12 07:17 2-Fluorobiphenyl % Rec. 81.38 37-119 WG600176 06/30/12 07:17 2-Fluorophenol % Rec. 59.98 22-114 WG600176 06/30/12 07:17 Nitrobenzene-d5 % Rec. 61.43 20-114 WG600176 06/30/12 07:17 Phenol-d5 % Rec. 65.69 26-127 WG600176 06/30/12 07:17 p-Terphenyl-d14 % Rec. 106.6 15-174 WG600176 06/30/12 07:17
PCB 1016 < .017 mg/kg WG600177 07/02/12 10:30 PCB 1221 < .017 mg/kg WG600177 07/02/12 10:30 PCB 1232 < .017 mg/kg WG600177 07/02/12 10:30 PCB 1242 < .017 mg/kg WG600177 07/02/12 10:30 PCB 1248 < .017 mg/kg WG600177 07/02/12 10:30 PCB 1254 < .017 mg/kg WG600177 07/02/12 10:30 PCB 1260 < .017 mg/kg WG600177 07/02/12 10:30 Decachlorobiphenyl % Rec. 97.13 18.9-115.8 WG600177 07/02/12 10:30 Tetrachloro-m-xylene % Rec. 79.00 31.8-115.7 WG600177 07/02/12 10:30
Total Solids < .1 % WG600199 07/02/12 11:34
Total Solids < .1 % WG600201 07/03/12 07:31
Diesel Range Organics (DRO) < 4 ppm WG600178 07/05/12 03:15 Residual Range Organics (RRO) < 10 ppm WG600178 07/05/12 03:15 o-Terphenyl % Rec. 77.90 50-150 WG600178 07/05/12 03:15
DuplicateAnalyte Units Result Duplicate RPD Limit Ref Samp Batch
Total Solids % 85.0 85.9 0.692 5 L582318-10 WG600199
Total Solids % 92.0 91.8 0.261 5 L582343-06 WG600201
Laboratory Control SampleAnalyte Units Known Val Result % Rec Limit Batch
1,1,1,2-Tetrachloroethane mg/kg .025 0.0227 90.9 77-129 WG600099 1,1,1-Trichloroethane mg/kg .025 0.0248 99.0 70-127 WG600099 1,1,2,2-Tetrachloroethane mg/kg .025 0.0219 87.7 76-133 WG600099 1,1,2-Trichloroethane mg/kg .025 0.0218 87.2 79-123 WG600099 1,1,2-Trichlorotrifluoroethane mg/kg .025 0.0280 112. 52-145 WG600099 1,1-Dichloroethane mg/kg .025 0.0250 99.8 74-121 WG600099 1,1-Dichloroethene mg/kg .025 0.0258 103. 53-135 WG600099 1,1-Dichloropropene mg/kg .025 0.0254 102. 67-127 WG600099 1,2,3-Trichlorobenzene mg/kg .025 0.0211 84.4 74-131 WG600099 1,2,3-Trichloropropane mg/kg .025 0.0207 82.8 75-135 WG600099 1,2,3-Trimethylbenzene mg/kg .025 0.0241 96.5 76-128 WG600099 1,2,4-Trichlorobenzene mg/kg .025 0.0257 103. 72-130 WG600099
* Performance of this Analyte is outside of established criteria.For additional information, please see Attachment A 'List of Analytes with QC Qualifiers.'
Page 24 of 35
12065 Lebanon Rd.Mt. Juliet, TN 37122(615) 758-58581-800-767-5859Fax (615) 758-5859
Tax I.D. 62-0814289
Est. 1970Oregon Dept of Transportation - ODOT Ryan Franklin (ODOT) 63034 O.B. Riley Rd Quality Assurance Report
Level IIBend, OR 97701 July 12, 2012
L582318
Laboratory Control SampleAnalyte Units Known Val Result % Rec Limit Batch
1,2,4-Trimethylbenzene mg/kg .025 0.0249 99.7 75-131 WG600099 1,2-Dibromo-3-Chloropropane mg/kg .025 0.0176 70.5 55-142 WG600099 1,2-Dibromoethane mg/kg .025 0.0233 93.0 77-126 WG600099 1,2-Dichlorobenzene mg/kg .025 0.0242 97.0 80-123 WG600099 1,2-Dichloroethane mg/kg .025 0.0237 94.9 70-128 WG600099 1,2-Dichloropropane mg/kg .025 0.0249 99.6 74-125 WG600099 1,3,5-Trimethylbenzene mg/kg .025 0.0252 101. 77-129 WG600099 1,3-Dichlorobenzene mg/kg .025 0.0249 99.5 76-128 WG600099 1,3-Dichloropropane mg/kg .025 0.0231 92.3 77-118 WG600099 1,4-Dichlorobenzene mg/kg .025 0.0250 99.9 77-119 WG600099 2,2-Dichloropropane mg/kg .025 0.0252 101. 60-132 WG600099 2-Butanone (MEK) mg/kg .125 0.119 95.3 56-146 WG600099 2-Chloroethyl vinyl ether mg/kg .125 0.113 90.1 17-179 WG600099 2-Chlorotoluene mg/kg .025 0.0255 102. 76-125 WG600099 4-Chlorotoluene mg/kg .025 0.0254 101. 76-125 WG600099 4-Methyl-2-pentanone (MIBK) mg/kg .125 0.107 85.4 55-148 WG600099 Acetone mg/kg .125 0.131 105. 47-155 WG600099 Acrylonitrile mg/kg .125 0.101 80.6 50-155 WG600099 Benzene mg/kg .025 0.0244 97.5 72-120 WG600099 Bromobenzene mg/kg .025 0.0240 96.1 74-122 WG600099 Bromodichloromethane mg/kg .025 0.0206 82.3 74-128 WG600099 Bromoform mg/kg .025 0.0190 75.8 62-137 WG600099 Bromomethane mg/kg .025 0.0287 115. 38-180 WG600099 Carbon tetrachloride mg/kg .025 0.0218 87.3 62-130 WG600099 Chlorobenzene mg/kg .025 0.0251 101. 77-124 WG600099 Chlorodibromomethane mg/kg .025 0.0207 82.7 74-128 WG600099 Chloroethane mg/kg .025 0.0297 119. 46-173 WG600099 Chloroform mg/kg .025 0.0246 98.4 76-122 WG600099 Chloromethane mg/kg .025 0.0244 97.8 49-143 WG600099 cis-1,2-Dichloroethene mg/kg .025 0.0238 95.2 73-123 WG600099 cis-1,3-Dichloropropene mg/kg .025 0.0223 89.4 73-126 WG600099 Di-isopropyl ether mg/kg .025 0.0231 92.5 64-131 WG600099 Dibromomethane mg/kg .025 0.0232 92.8 75-127 WG600099 Dichlorodifluoromethane mg/kg .025 0.0258 103. 30-177 WG600099 Ethylbenzene mg/kg .025 0.0253 101. 76-126 WG600099 Hexachloro-1,3-butadiene mg/kg .025 0.0221 88.6 71-134 WG600099 Isopropylbenzene mg/kg .025 0.0267 107. 70-128 WG600099 Methyl tert-butyl ether mg/kg .025 0.0222 88.7 66-127 WG600099 Methylene Chloride mg/kg .025 0.0197 78.7 67-124 WG600099 n-Butylbenzene mg/kg .025 0.0279 112. 71-133 WG600099 n-Propylbenzene mg/kg .025 0.0265 106. 76-126 WG600099 Naphthalene mg/kg .025 0.0205 82.1 68-136 WG600099 p-Isopropyltoluene mg/kg .025 0.0258 103. 75-134 WG600099 sec-Butylbenzene mg/kg .025 0.0261 104. 75-132 WG600099 Styrene mg/kg .025 0.0243 97.1 68-148 WG600099 tert-Butylbenzene mg/kg .025 0.0260 104. 75-132 WG600099 Tetrachloroethene mg/kg .025 0.0253 101. 70-131 WG600099 Toluene mg/kg .025 0.0239 95.7 74-155 WG600099 trans-1,2-Dichloroethene mg/kg .025 0.0239 95.7 63-126 WG600099 trans-1,3-Dichloropropene mg/kg .025 0.0224 89.6 68-126 WG600099 Trichloroethene mg/kg .025 0.0228 91.3 75-121 WG600099 Trichlorofluoromethane mg/kg .025 0.0277 111. 48-170 WG600099 Vinyl chloride mg/kg .025 0.0259 104. 54-144 WG600099 Xylenes, Total mg/kg .075 0.0763 102. 76-126 WG600099 4-Bromofluorobenzene 101.6 67-133 WG600099 Dibromofluoromethane 103.0 72-135 WG600099 Toluene-d8 105.9 90-113 WG600099 a,a,a-Trifluorotoluene 99.21 89-115 WG600099
* Performance of this Analyte is outside of established criteria.For additional information, please see Attachment A 'List of Analytes with QC Qualifiers.'
Page 25 of 35
12065 Lebanon Rd.Mt. Juliet, TN 37122(615) 758-58581-800-767-5859Fax (615) 758-5859
Tax I.D. 62-0814289
Est. 1970Oregon Dept of Transportation - ODOT Ryan Franklin (ODOT) 63034 O.B. Riley Rd Quality Assurance Report
Level IIBend, OR 97701 July 12, 2012
L582318
Laboratory Control SampleAnalyte Units Known Val Result % Rec Limit Batch
1,2,4-Trichlorobenzene mg/kg .333 0.259 77.8 48-87 WG600176 2,4,6-Trichlorophenol mg/kg .333 0.264 79.3 50-98 WG600176 2,4-Dichlorophenol mg/kg .333 0.283 85.1 56-96 WG600176 2,4-Dimethylphenol mg/kg .333 0.322 96.7 52-101 WG600176 2,4-Dinitrophenol mg/kg .333 0.0498 15.0 10-109 WG600176 2,4-Dinitrotoluene mg/kg .333 0.295 88.6 54-103 WG600176 2,6-Dinitrotoluene mg/kg .333 0.289 86.7 53-99 WG600176 2-Chloronaphthalene mg/kg .333 0.273 81.9 55-96 WG600176 2-Chlorophenol mg/kg .333 0.263 79.0 52-88 WG600176 2-Nitrophenol mg/kg .333 0.281 84.4 55-106 WG600176 3,3-Dichlorobenzidine mg/kg .333 0.261 78.4 36-84 WG600176 4,6-Dinitro-2-methylphenol mg/kg .333 0.170 51.0 24-98 WG600176 4-Bromophenyl-phenylether mg/kg .333 0.284 85.2 58-111 WG600176 4-Chloro-3-methylphenol mg/kg .333 0.318 95.5 58-98 WG600176 4-Chlorophenyl-phenylether mg/kg .333 0.288 86.5 59-103 WG600176 4-Nitrophenol mg/kg .333 0.232 69.5 34-101 WG600176 Acenaphthene mg/kg .333 0.271 81.5 55-96 WG600176 Acenaphthylene mg/kg .333 0.294 88.4 61-107 WG600176 Anthracene mg/kg .333 0.315 94.7 58-105 WG600176 Benzidine mg/kg .333 0.0116 3.48* 10-21 WG600176 Benzo(a)anthracene mg/kg .333 0.293 88.0 56-103 WG600176 Benzo(a)pyrene mg/kg .333 0.295 88.6 57-103 WG600176 Benzo(b)fluoranthene mg/kg .333 0.290 87.0 52-106 WG600176 Benzo(g,h,i)perylene mg/kg .333 0.281 84.5 47-112 WG600176 Benzo(k)fluoranthene mg/kg .333 0.292 87.7 53-104 WG600176 Benzylbutyl phthalate mg/kg .333 0.331 99.4 61-118 WG600176 Bis(2-chlorethoxy)methane mg/kg .333 0.277 83.2 58-104 WG600176 Bis(2-chloroethyl)ether mg/kg .333 0.248 74.4 51-103 WG600176 Bis(2-chloroisopropyl)ether mg/kg .333 0.255 76.5 56-95 WG600176 Bis(2-ethylhexyl)phthalate mg/kg .333 0.335 101. 56-120 WG600176 Chrysene mg/kg .333 0.305 91.6 55-102 WG600176 Di-n-butyl phthalate mg/kg .333 0.337 101. 59-114 WG600176 Di-n-octyl phthalate mg/kg .333 0.326 97.9 51-119 WG600176 Dibenz(a,h)anthracene mg/kg .333 0.281 84.5 49-111 WG600176 Diethyl phthalate mg/kg .333 0.319 95.9 61-105 WG600176 Dimethyl phthalate mg/kg .333 0.306 91.8 60-106 WG600176 Fluoranthene mg/kg .333 0.314 94.1 59-108 WG600176 Fluorene mg/kg .333 0.294 88.4 59-100 WG600176 Hexachloro-1,3-butadiene mg/kg .333 0.279 83.8 53-106 WG600176 Hexachlorobenzene mg/kg .333 0.259 77.8 50-108 WG600176 Hexachlorocyclopentadiene mg/kg .333 0.220 66.2 36-117 WG600176 Hexachloroethane mg/kg .333 0.254 76.3 45-83 WG600176 Indeno(1,2,3-cd)pyrene mg/kg .333 0.285 85.4 50-110 WG600176 Isophorone mg/kg .333 0.234 70.2 51-99 WG600176 n-Nitrosodi-n-propylamine mg/kg .333 0.280 84.0 52-103 WG600176 n-Nitrosodimethylamine mg/kg .333 0.232 69.8 31-107 WG600176 n-Nitrosodiphenylamine mg/kg .333 0.298 89.5 57-121 WG600176 Naphthalene mg/kg .333 0.273 82.0 55-91 WG600176 Nitrobenzene mg/kg .333 0.272 81.6 47-92 WG600176 Pentachlorophenol mg/kg .333 0.163 49.1 10-89 WG600176 Phenanthrene mg/kg .333 0.296 88.9 55-103 WG600176 Phenol mg/kg .333 0.261 78.3 49-99 WG600176 Pyrene mg/kg .333 0.294 88.4 54-104 WG600176 2,4,6-Tribromophenol 78.22 16-136 WG600176 2-Fluorobiphenyl 84.03 37-119 WG600176 2-Fluorophenol 75.31 22-114 WG600176 Nitrobenzene-d5 80.33 20-114 WG600176 Phenol-d5 79.69 26-127 WG600176
* Performance of this Analyte is outside of established criteria.For additional information, please see Attachment A 'List of Analytes with QC Qualifiers.'
Page 26 of 35
12065 Lebanon Rd.Mt. Juliet, TN 37122(615) 758-58581-800-767-5859Fax (615) 758-5859
Tax I.D. 62-0814289
Est. 1970Oregon Dept of Transportation - ODOT Ryan Franklin (ODOT) 63034 O.B. Riley Rd Quality Assurance Report
Level IIBend, OR 97701 July 12, 2012
L582318
Laboratory Control SampleAnalyte Units Known Val Result % Rec Limit Batch
p-Terphenyl-d14 88.36 15-174 PCB 1016 mg/kg .167 0.155 93.1 64-120 WG600177 PCB 1260 mg/kg .167 0.166 99.4 72-130 WG600177 Decachlorobiphenyl 100.7 18.9-115.8 WG600177 Tetrachloro-m-xylene 88.18 31.8-115.7 WG600177
Total Solids % 50 50.0 99.9 85-115 WG600199
Total Solids % 50 50.0 99.9 85-115 WG600201
Diesel Range Organics (DRO) mg/kg 30 23.7 79.1 50-150 WG600178 Residual Range Organics (RRO) mg/kg 30 20.3 67.6 50-150 WG600178 o-Terphenyl 69.95 50-150 WG600178
Laboratory Control Sample DuplicateAnalyte Units Result Ref %Rec Limit RPD Limit Batch
1,1,1,2-Tetrachloroethane mg/kg 0.0220 0.0227 88.0 77-129 3.16 20 WG600099 1,1,1-Trichloroethane mg/kg 0.0251 0.0248 100. 70-127 1.53 20 WG600099 1,1,2,2-Tetrachloroethane mg/kg 0.0215 0.0219 86.0 76-133 1.73 20 WG600099 1,1,2-Trichloroethane mg/kg 0.0224 0.0218 89.0 79-123 2.55 20 WG600099 1,1,2-Trichlorotrifluoroethane mg/kg 0.0287 0.0280 115. 52-145 2.45 20 WG600099 1,1-Dichloroethane mg/kg 0.0250 0.0250 100. 74-121 0.230 20 WG600099 1,1-Dichloroethene mg/kg 0.0250 0.0258 100. 53-135 2.98 20 WG600099 1,1-Dichloropropene mg/kg 0.0258 0.0254 103. 67-127 1.38 20 WG600099 1,2,3-Trichlorobenzene mg/kg 0.0209 0.0211 83.0 74-131 1.09 20 WG600099 1,2,3-Trichloropropane mg/kg 0.0207 0.0207 83.0 75-135 0.160 20 WG600099 1,2,3-Trimethylbenzene mg/kg 0.0248 0.0241 99.0 76-128 2.77 20 WG600099 1,2,4-Trichlorobenzene mg/kg 0.0266 0.0257 106. 72-130 3.17 20 WG600099 1,2,4-Trimethylbenzene mg/kg 0.0258 0.0249 103. 75-131 3.44 20 WG600099 1,2-Dibromo-3-Chloropropane mg/kg 0.0170 0.0176 68.0 55-142 3.42 20 WG600099 1,2-Dibromoethane mg/kg 0.0239 0.0233 95.0 77-126 2.54 20 WG600099 1,2-Dichlorobenzene mg/kg 0.0244 0.0242 98.0 80-123 0.630 20 WG600099 1,2-Dichloroethane mg/kg 0.0235 0.0237 94.0 70-128 0.940 20 WG600099 1,2-Dichloropropane mg/kg 0.0244 0.0249 97.0 74-125 2.15 20 WG600099 1,3,5-Trimethylbenzene mg/kg 0.0260 0.0252 104. 77-129 3.09 20 WG600099 1,3-Dichlorobenzene mg/kg 0.0253 0.0249 101. 76-128 1.74 20 WG600099 1,3-Dichloropropane mg/kg 0.0218 0.0231 87.0 77-118 5.60 20 WG600099 1,4-Dichlorobenzene mg/kg 0.0256 0.0250 102. 77-119 2.64 20 WG600099 2,2-Dichloropropane mg/kg 0.0262 0.0252 105. 60-132 3.86 20 WG600099 2-Butanone (MEK) mg/kg 0.118 0.119 95.0 56-146 0.490 20 WG600099 2-Chloroethyl vinyl ether mg/kg 0.0952 0.113 76.0 17-179 16.8 22 WG600099 2-Chlorotoluene mg/kg 0.0259 0.0255 104. 76-125 1.77 20 WG600099 4-Chlorotoluene mg/kg 0.0257 0.0254 103. 76-125 1.27 20 WG600099 4-Methyl-2-pentanone (MIBK) mg/kg 0.103 0.107 82.0 55-148 3.54 20 WG600099 Acetone mg/kg 0.130 0.131 104. 47-155 0.680 22 WG600099 Acrylonitrile mg/kg 0.0980 0.101 78.0 50-155 2.70 20 WG600099 Benzene mg/kg 0.0250 0.0244 100. 72-120 2.32 20 WG600099 Bromobenzene mg/kg 0.0247 0.0240 99.0 74-122 2.65 20 WG600099 Bromodichloromethane mg/kg 0.0209 0.0206 84.0 74-128 1.72 20 WG600099 Bromoform mg/kg 0.0194 0.0190 77.0 62-137 2.15 20 WG600099 Bromomethane mg/kg 0.0290 0.0287 116. 38-180 0.930 20 WG600099 Carbon tetrachloride mg/kg 0.0224 0.0218 90.0 62-130 2.59 20 WG600099 Chlorobenzene mg/kg 0.0247 0.0251 99.0 77-124 1.69 20 WG600099 Chlorodibromomethane mg/kg 0.0213 0.0207 85.0 74-128 3.18 20 WG600099 Chloroethane mg/kg 0.0290 0.0297 116. 46-173 2.27 20 WG600099
* Performance of this Analyte is outside of established criteria.For additional information, please see Attachment A 'List of Analytes with QC Qualifiers.'
Page 27 of 35

12065 Lebanon Rd.Mt. Juliet, TN 37122(615) 758-58581-800-767-5859Fax (615) 758-5859
Tax I.D. 62-0814289
Est. 1970Oregon Dept of Transportation - ODOT Ryan Franklin (ODOT) 63034 O.B. Riley Rd Quality Assurance Report
Level IIBend, OR 97701 July 12, 2012
L582318
Laboratory Control Sample DuplicateAnalyte Units Result Ref %Rec Limit RPD Limit Batch
Chloroform mg/kg 0.0255 0.0246 102. 76-122 3.51 20 WG600099 Chloromethane mg/kg 0.0248 0.0244 99.0 49-143 1.47 20 WG600099 cis-1,2-Dichloroethene mg/kg 0.0240 0.0238 96.0 73-123 0.820 20 WG600099 cis-1,3-Dichloropropene mg/kg 0.0221 0.0223 88.0 73-126 1.16 20 WG600099 Di-isopropyl ether mg/kg 0.0232 0.0231 93.0 64-131 0.380 20 WG600099 Dibromomethane mg/kg 0.0227 0.0232 91.0 75-127 2.28 20 WG600099 Dichlorodifluoromethane mg/kg 0.0255 0.0258 102. 30-177 1.17 20 WG600099 Ethylbenzene mg/kg 0.0259 0.0253 104. 76-126 2.53 20 WG600099 Hexachloro-1,3-butadiene mg/kg 0.0233 0.0221 93.0 71-134 5.14 20 WG600099 Isopropylbenzene mg/kg 0.0273 0.0267 109. 70-128 2.53 20 WG600099 Methyl tert-butyl ether mg/kg 0.0216 0.0222 86.0 66-127 2.76 20 WG600099 Methylene Chloride mg/kg 0.0198 0.0197 79.0 67-124 0.590 20 WG600099 n-Butylbenzene mg/kg 0.0288 0.0279 115. 71-133 2.95 20 WG600099 n-Propylbenzene mg/kg 0.0268 0.0265 107. 76-126 0.980 20 WG600099 Naphthalene mg/kg 0.0205 0.0205 82.0 68-136 0.0600 20 WG600099 p-Isopropyltoluene mg/kg 0.0264 0.0258 106. 75-134 2.40 20 WG600099 sec-Butylbenzene mg/kg 0.0267 0.0261 107. 75-132 2.03 20 WG600099 Styrene mg/kg 0.0250 0.0243 100. 68-148 3.09 20 WG600099 tert-Butylbenzene mg/kg 0.0262 0.0260 105. 75-132 0.610 20 WG600099 Tetrachloroethene mg/kg 0.0254 0.0253 101. 70-131 0.380 20 WG600099 Toluene mg/kg 0.0241 0.0239 96.0 74-155 0.900 20 WG600099 trans-1,2-Dichloroethene mg/kg 0.0243 0.0239 97.0 63-126 1.57 20 WG600099 trans-1,3-Dichloropropene mg/kg 0.0224 0.0224 90.0 68-126 0.0100 20 WG600099 Trichloroethene mg/kg 0.0234 0.0228 94.0 75-121 2.71 20 WG600099 Trichlorofluoromethane mg/kg 0.0273 0.0277 109. 48-170 1.64 20 WG600099 Vinyl chloride mg/kg 0.0271 0.0259 108. 54-144 4.55 20 WG600099 Xylenes, Total mg/kg 0.0782 0.0763 104. 76-126 2.53 20 WG600099 4-Bromofluorobenzene 99.52 67-133 WG600099 Dibromofluoromethane 105.7 72-135 WG600099 Toluene-d8 104.9 90-113 WG600099 a,a,a-Trifluorotoluene 101.0 89-115 WG600099
1,2,4-Trichlorobenzene mg/kg 0.257 0.259 77.0 48-87 0.974 20 WG600176 2,4,6-Trichlorophenol mg/kg 0.266 0.264 80.0 50-98 0.889 20 WG600176 2,4-Dichlorophenol mg/kg 0.285 0.283 86.0 56-96 0.649 20 WG600176 2,4-Dimethylphenol mg/kg 0.343 0.322 103* 52-101 6.42 20 WG600176 2,4-Dinitrophenol mg/kg 0.0329 0.0498 10.0 10-109 40.9* 39 WG600176 2,4-Dinitrotoluene mg/kg 0.308 0.295 92.0 54-103 4.38 20 WG600176 2,6-Dinitrotoluene mg/kg 0.299 0.289 90.0 53-99 3.43 20 WG600176 2-Chloronaphthalene mg/kg 0.275 0.273 82.0 55-96 0.655 20 WG600176 2-Chlorophenol mg/kg 0.261 0.263 78.0 52-88 0.891 20 WG600176 2-Nitrophenol mg/kg 0.283 0.281 85.0 55-106 0.605 20 WG600176 3,3-Dichlorobenzidine mg/kg 0.272 0.261 82.0 36-84 4.03 20 WG600176 4,6-Dinitro-2-methylphenol mg/kg 0.179 0.170 54.0 24-98 5.08 32 WG600176 4-Bromophenyl-phenylether mg/kg 0.300 0.284 90.0 58-111 5.64 20 WG600176 4-Chloro-3-methylphenol mg/kg 0.323 0.318 97.0 58-98 1.75 20 WG600176 4-Chlorophenyl-phenylether mg/kg 0.294 0.288 88.0 59-103 1.99 20 WG600176 4-Nitrophenol mg/kg 0.235 0.232 71.0 34-101 1.66 26 WG600176 Acenaphthene mg/kg 0.278 0.271 84.0 55-96 2.57 20 WG600176 Acenaphthylene mg/kg 0.300 0.294 90.0 61-107 1.93 20 WG600176 Anthracene mg/kg 0.335 0.315 100. 58-105 5.92 20 WG600176 Benzidine mg/kg 0.0131 0.0116 4* 10-21 12.2 40 WG600176 Benzo(a)anthracene mg/kg 0.299 0.293 90.0 56-103 1.91 20 WG600176 Benzo(a)pyrene mg/kg 0.301 0.295 90.0 57-103 2.12 20 WG600176 Benzo(b)fluoranthene mg/kg 0.290 0.290 87.0 52-106 0.0245 20 WG600176 Benzo(g,h,i)perylene mg/kg 0.285 0.281 86.0 47-112 1.30 20 WG600176 Benzo(k)fluoranthene mg/kg 0.305 0.292 92.0 53-104 4.22 20 WG600176 Benzylbutyl phthalate mg/kg 0.328 0.331 98.0 61-118 0.926 20 WG600176
* Performance of this Analyte is outside of established criteria.For additional information, please see Attachment A 'List of Analytes with QC Qualifiers.'
Page 28 of 35
12065 Lebanon Rd.Mt. Juliet, TN 37122(615) 758-58581-800-767-5859Fax (615) 758-5859
Tax I.D. 62-0814289
Est. 1970Oregon Dept of Transportation - ODOT Ryan Franklin (ODOT) 63034 O.B. Riley Rd Quality Assurance Report
Level IIBend, OR 97701 July 12, 2012
L582318
Laboratory Control Sample DuplicateAnalyte Units Result Ref %Rec Limit RPD Limit Batch
Bis(2-chlorethoxy)methane mg/kg 0.271 0.277 81.0 58-104 2.09 20 WG600176 Bis(2-chloroethyl)ether mg/kg 0.234 0.248 70.0 51-103 5.71 20 WG600176 Bis(2-chloroisopropyl)ether mg/kg 0.249 0.255 75.0 56-95 2.37 20 WG600176 Bis(2-ethylhexyl)phthalate mg/kg 0.345 0.335 104. 56-120 3.10 20 WG600176 Chrysene mg/kg 0.310 0.305 93.0 55-102 1.63 20 WG600176 Di-n-butyl phthalate mg/kg 0.354 0.337 106. 59-114 4.76 20 WG600176 Di-n-octyl phthalate mg/kg 0.330 0.326 99.0 51-119 1.20 22 WG600176 Dibenz(a,h)anthracene mg/kg 0.291 0.281 87.0 49-111 3.48 20 WG600176 Diethyl phthalate mg/kg 0.321 0.319 96.0 61-105 0.407 20 WG600176 Dimethyl phthalate mg/kg 0.307 0.306 92.0 60-106 0.486 20 WG600176 Fluoranthene mg/kg 0.329 0.314 99.0 59-108 4.72 20 WG600176 Fluorene mg/kg 0.302 0.294 91.0 59-100 2.60 20 WG600176 Hexachloro-1,3-butadiene mg/kg 0.274 0.279 82.0 53-106 1.76 20 WG600176 Hexachlorobenzene mg/kg 0.267 0.259 80.0 50-108 3.02 20 WG600176 Hexachlorocyclopentadiene mg/kg 0.225 0.220 68.0 36-117 2.14 20 WG600176 Hexachloroethane mg/kg 0.247 0.254 74.0 45-83 2.91 20 WG600176 Indeno(1,2,3-cd)pyrene mg/kg 0.289 0.285 87.0 50-110 1.70 20 WG600176 Isophorone mg/kg 0.235 0.234 70.0 51-99 0.497 20 WG600176 n-Nitrosodi-n-propylamine mg/kg 0.279 0.280 84.0 52-103 0.199 20 WG600176 n-Nitrosodimethylamine mg/kg 0.226 0.232 68.0 31-107 2.95 23 WG600176 n-Nitrosodiphenylamine mg/kg 0.317 0.298 95.0 57-121 6.12 20 WG600176 Naphthalene mg/kg 0.274 0.273 82.0 55-91 0.350 20 WG600176 Nitrobenzene mg/kg 0.268 0.272 80.0 47-92 1.27 20 WG600176 Pentachlorophenol mg/kg 0.195 0.163 58.0 10-89 17.4 28 WG600176 Phenanthrene mg/kg 0.308 0.296 92.0 55-103 3.85 20 WG600176 Phenol mg/kg 0.265 0.261 80.0 49-99 1.65 20 WG600176 Pyrene mg/kg 0.301 0.294 90.0 54-104 2.32 20 WG600176 2,4,6-Tribromophenol 82.46 16-136 WG600176 2-Fluorobiphenyl 84.63 37-119 WG600176 2-Fluorophenol 73.68 22-114 WG600176 Nitrobenzene-d5 78.38 20-114 WG600176 Phenol-d5 78.76 26-127 WG600176 p-Terphenyl-d14 88.18 15-174 WG600176
PCB 1016 mg/kg 0.159 0.155 95.0 64-120 2.39 20 WG600177 PCB 1260 mg/kg 0.174 0.166 104. 72-130 4.84 20 WG600177 Decachlorobiphenyl 94.66 18.9-115.8 WG600177 Tetrachloro-m-xylene 83.24 31.8-115.7 WG600177
Diesel Range Organics (DRO) mg/kg 24.9 23.7 83.0 50-150 4.66 20 WG600178 Residual Range Organics (RRO) mg/kg 21.2 20.3 71.0 50-150 4.63 20 WG600178 o-Terphenyl 73.52 50-150 WG600178
Matrix SpikeAnalyte Units MS Res Ref Res TV % Rec Limit Ref Samp Batch
1,1,1,2-Tetrachloroethane mg/kg 0.0820 0 .025 65.6 49-135 L582303-01 WG600099 1,1,1-Trichloroethane mg/kg 0.0936 0 .025 74.8 43-142 L582303-01 WG600099 1,1,2,2-Tetrachloroethane mg/kg 0.0805 0 .025 64.4 42-147 L582303-01 WG600099 1,1,2-Trichloroethane mg/kg 0.0852 0 .025 68.2 51-134 L582303-01 WG600099 1,1,2-Trichlorotrifluoroethane mg/kg 0.104 0 .025 83.0 25-156 L582303-01 WG600099 1,1-Dichloroethane mg/kg 0.0911 0 .025 72.8 50-131 L582303-01 WG600099 1,1-Dichloroethene mg/kg 0.0969 0 .025 77.5 29-145 L582303-01 WG600099 1,1-Dichloropropene mg/kg 0.0934 0 .025 74.7 40-136 L582303-01 WG600099 1,2,3-Trichlorobenzene mg/kg 0.0737 0 .025 58.9 13-142 L582303-01 WG600099 1,2,3-Trichloropropane mg/kg 0.0844 0 .025 67.6 41-149 L582303-01 WG600099 1,2,3-Trimethylbenzene mg/kg 0.0883 0 .025 70.6 33-146 L582303-01 WG600099
* Performance of this Analyte is outside of established criteria.For additional information, please see Attachment A 'List of Analytes with QC Qualifiers.'
Page 29 of 35

12065 Lebanon Rd.Mt. Juliet, TN 37122(615) 758-58581-800-767-5859Fax (615) 758-5859
Tax I.D. 62-0814289
Est. 1970Oregon Dept of Transportation - ODOT Ryan Franklin (ODOT) 63034 O.B. Riley Rd Quality Assurance Report
Level IIBend, OR 97701 July 12, 2012
L582318
Matrix SpikeAnalyte Units MS Res Ref Res TV % Rec Limit Ref Samp Batch
1,2,4-Trichlorobenzene mg/kg 0.0936 0 .025 74.9 12-140 L582303-01 WG600099 1,2,4-Trimethylbenzene mg/kg 0.0919 0 .025 73.5 29-143 L582303-01 WG600099 1,2-Dibromo-3-Chloropropane mg/kg 0.0651 0 .025 52.1 29-151 L582303-01 WG600099 1,2-Dibromoethane mg/kg 0.0889 0 .025 71.1 48-133 L582303-01 WG600099 1,2-Dichlorobenzene mg/kg 0.0891 0 .025 71.2 37-136 L582303-01 WG600099 1,2-Dichloroethane mg/kg 0.0874 0 .025 70.0 49-131 L582303-01 WG600099 1,2-Dichloropropane mg/kg 0.0894 0 .025 71.6 50-132 L582303-01 WG600099 1,3,5-Trimethylbenzene mg/kg 0.0916 0 .025 73.3 29-144 L582303-01 WG600099 1,3-Dichlorobenzene mg/kg 0.0896 0 .025 71.7 26-140 L582303-01 WG600099 1,3-Dichloropropane mg/kg 0.0875 0 .025 70.0 50-126 L582303-01 WG600099 1,4-Dichlorobenzene mg/kg 0.0950 0 .025 76.0 34-132 L582303-01 WG600099 2,2-Dichloropropane mg/kg 0.0931 0 .025 74.5 35-148 L582303-01 WG600099 2-Butanone (MEK) mg/kg 0.497 0 .125 79.5 40-149 L582303-01 WG600099 2-Chloroethyl vinyl ether mg/kg 0.384 0 .125 61.5 10-173 L582303-01 WG600099 2-Chlorotoluene mg/kg 0.0921 0 .025 73.6 34-136 L582303-01 WG600099 4-Chlorotoluene mg/kg 0.0921 0 .025 73.7 31-137 L582303-01 WG600099 4-Methyl-2-pentanone (MIBK) mg/kg 0.415 0 .125 66.4 37-153 L582303-01 WG600099 Acetone mg/kg 0.540 0 .125 86.4 10-177 L582303-01 WG600099 Acrylonitrile mg/kg 0.408 0 .125 65.2 33-159 L582303-01 WG600099 Benzene mg/kg 0.0916 0 .025 73.3 44-131 L582303-01 WG600099 Bromobenzene mg/kg 0.0892 0 .025 71.4 36-132 L582303-01 WG600099 Bromodichloromethane mg/kg 0.0791 0 .025 63.3 48-134 L582303-01 WG600099 Bromoform mg/kg 0.0725 0 .025 58.0 34-141 L582303-01 WG600099 Bromomethane mg/kg 0.111 0 .025 89.1 19-173 L582303-01 WG600099 Carbon tetrachloride mg/kg 0.0834 0 .025 66.7 36-140 L582303-01 WG600099 Chlorobenzene mg/kg 0.0927 0 .025 74.2 42-133 L582303-01 WG600099 Chlorodibromomethane mg/kg 0.0786 0 .025 62.8 45-135 L582303-01 WG600099 Chloroethane mg/kg 0.116 0 .025 93.0 16-178 L582303-01 WG600099 Chloroform mg/kg 0.0915 0 .025 73.2 52-130 L582303-01 WG600099 Chloromethane mg/kg 0.0943 0 .025 75.4 28-147 L582303-01 WG600099 cis-1,2-Dichloroethene mg/kg 0.0915 0 .025 73.2 52-128 L582303-01 WG600099 cis-1,3-Dichloropropene mg/kg 0.0830 0 .025 66.4 46-131 L582303-01 WG600099 Di-isopropyl ether mg/kg 0.0857 0 .025 68.5 46-134 L582303-01 WG600099 Dibromomethane mg/kg 0.0859 0 .025 68.7 51-133 L582303-01 WG600099 Dichlorodifluoromethane mg/kg 0.0984 0 .025 78.8 12-179 L582303-01 WG600099 Ethylbenzene mg/kg 0.0943 0 .025 75.4 38-139 L582303-01 WG600099 Hexachloro-1,3-butadiene mg/kg 0.0747 0 .025 59.7 10-147 L582303-01 WG600099 Isopropylbenzene mg/kg 0.0976 0 .025 78.1 34-137 L582303-01 WG600099 Methyl tert-butyl ether mg/kg 0.0792 0 .025 63.4 45-134 L582303-01 WG600099 Methylene Chloride mg/kg 0.0680 0 .025 54.4 41-133 L582303-01 WG600099 n-Butylbenzene mg/kg 0.0991 0 .025 79.2 19-149 L582303-01 WG600099 n-Propylbenzene mg/kg 0.0955 0 .025 76.4 27-142 L582303-01 WG600099 Naphthalene mg/kg 0.0751 0 .025 60.1 19-146 L582303-01 WG600099 p-Isopropyltoluene mg/kg 0.0931 0 .025 74.5 21-150 L582303-01 WG600099 sec-Butylbenzene mg/kg 0.0924 0 .025 73.9 25-148 L582303-01 WG600099 Styrene mg/kg 0.0884 0 .025 70.7 30-156 L582303-01 WG600099 tert-Butylbenzene mg/kg 0.0911 0 .025 72.9 32-146 L582303-01 WG600099 Tetrachloroethene mg/kg 0.0941 0 .025 75.3 35-139 L582303-01 WG600099 Toluene mg/kg 0.0911 0 .025 72.9 43-127 L582303-01 WG600099 trans-1,2-Dichloroethene mg/kg 0.0901 0 .025 72.1 41-132 L582303-01 WG600099 trans-1,3-Dichloropropene mg/kg 0.0857 0 .025 68.5 43-129 L582303-01 WG600099 Trichloroethene mg/kg 0.0881 0 .025 70.5 42-136 L582303-01 WG600099 Trichlorofluoromethane mg/kg 0.103 0 .025 82.7 20-178 L582303-01 WG600099 Vinyl chloride mg/kg 0.105 0 .025 84.0 30-157 L582303-01 WG600099 Xylenes, Total mg/kg 0.278 0 .075 74.1 38-137 L582303-01 WG600099 4-Bromofluorobenzene 97.04 67-133 WG600099 Dibromofluoromethane 109.0 72-135 WG600099 Toluene-d8 102.9 90-113 WG600099 a,a,a-Trifluorotoluene 99.67 89-115 WG600099
* Performance of this Analyte is outside of established criteria.For additional information, please see Attachment A 'List of Analytes with QC Qualifiers.'
Page 30 of 35

12065 Lebanon Rd.Mt. Juliet, TN 37122(615) 758-58581-800-767-5859Fax (615) 758-5859
Tax I.D. 62-0814289
Est. 1970Oregon Dept of Transportation - ODOT Ryan Franklin (ODOT) 63034 O.B. Riley Rd Quality Assurance Report
Level IIBend, OR 97701 July 12, 2012
L582318
Matrix SpikeAnalyte Units MS Res Ref Res TV % Rec Limit Ref Samp Batch
1,2,4-Trichlorobenzene mg/kg 0.270 0 .333 81.2 27-118 L582315-01 WG600176 2,4,6-Trichlorophenol mg/kg 0.292 0 .333 87.7 18-140 L582315-01 WG600176 2,4-Dichlorophenol mg/kg 0.309 0 .333 92.8 30-134 L582315-01 WG600176 2,4-Dimethylphenol mg/kg 0.323 0 .333 97.0 13-147 L582315-01 WG600176 2,4-Dinitrophenol mg/kg 0.0380 0 .333 11.4 10-110 L582315-01 WG600176 2,4-Dinitrotoluene mg/kg 0.310 0 .333 93.0 12-146 L582315-01 WG600176 2,6-Dinitrotoluene mg/kg 0.308 0 .333 92.4 10-150 L582315-01 WG600176 2-Chloronaphthalene mg/kg 0.291 0 .333 87.4 31-127 L582315-01 WG600176 2-Chlorophenol mg/kg 0.272 0 .333 81.7 26-120 L582315-01 WG600176 2-Nitrophenol mg/kg 0.313 0 .333 93.9 10-156 L582315-01 WG600176 3,3-Dichlorobenzidine mg/kg 0.194 0 .333 58.1 10-127 L582315-01 WG600176 4,6-Dinitro-2-methylphenol mg/kg 0.165 0 .333 49.6 10-124 L582315-01 WG600176 4-Bromophenyl-phenylether mg/kg 0.263 0 .333 78.9 27-150 L582315-01 WG600176 4-Chloro-3-methylphenol mg/kg 0.326 0 .333 97.9 24-140 L582315-01 WG600176 4-Chlorophenyl-phenylether mg/kg 0.275 0 .333 82.7 27-142 L582315-01 WG600176 4-Nitrophenol mg/kg 0.242 0 .333 72.7 10-166 L582315-01 WG600176 Acenaphthene mg/kg 0.286 0 .333 85.9 30-132 L582315-01 WG600176 Acenaphthylene mg/kg 0.303 0 .333 91.1 31-144 L582315-01 WG600176 Anthracene mg/kg 0.309 0 .333 92.7 27-140 L582315-01 WG600176 Benzidine mg/kg 0 0 .333 0* 10-55 L582315-01 WG600176 Benzo(a)anthracene mg/kg 0.267 0 .333 80.1 22-139 L582315-01 WG600176 Benzo(a)pyrene mg/kg 0.258 0 .333 77.6 16-148 L582315-01 WG600176 Benzo(b)fluoranthene mg/kg 0.250 0 .333 75.0 13-152 L582315-01 WG600176 Benzo(g,h,i)perylene mg/kg 0.168 0 .333 50.6 10-137 L582315-01 WG600176 Benzo(k)fluoranthene mg/kg 0.253 0 .333 75.9 15-152 L582315-01 WG600176 Benzylbutyl phthalate mg/kg 0.281 0 .333 84.3 20-168 L582315-01 WG600176 Bis(2-chlorethoxy)methane mg/kg 0.292 0 .333 87.7 32-141 L582315-01 WG600176 Bis(2-chloroethyl)ether mg/kg 0.253 0 .333 75.9 25-139 L582315-01 WG600176 Bis(2-chloroisopropyl)ether mg/kg 0.266 0 .333 79.8 32-128 L582315-01 WG600176 Bis(2-ethylhexyl)phthalate mg/kg 0.257 0 .333 77.0 20-163 L582315-01 WG600176 Chrysene mg/kg 0.286 0 .333 85.9 20-139 L582315-01 WG600176 Di-n-butyl phthalate mg/kg 0.304 0 .333 91.3 24-149 L582315-01 WG600176 Di-n-octyl phthalate mg/kg 0.255 0 .333 76.5 14-164 L582315-01 WG600176 Dibenz(a,h)anthracene mg/kg 0.193 0 .333 58.0 10-137 L582315-01 WG600176 Diethyl phthalate mg/kg 0.336 0 .333 101. 28-142 L582315-01 WG600176 Dimethyl phthalate mg/kg 0.331 0 .333 99.4 31-142 L582315-01 WG600176 Fluoranthene mg/kg 0.320 0.0590 .333 78.2 24-145 L582315-01 WG600176 Fluorene mg/kg 0.299 0 .333 89.8 30-138 L582315-01 WG600176 Hexachloro-1,3-butadiene mg/kg 0.272 0 .333 81.7 29-136 L582315-01 WG600176 Hexachlorobenzene mg/kg 0.228 0 .333 68.5 26-136 L582315-01 WG600176 Hexachlorocyclopentadiene mg/kg 0.0994 0 .333 29.9 10-124 L582315-01 WG600176 Hexachloroethane mg/kg 0.280 0 .333 84.0 21-107 L582315-01 WG600176 Indeno(1,2,3-cd)pyrene mg/kg 0.190 0 .333 56.9 10-139 L582315-01 WG600176 Isophorone mg/kg 0.241 0 .333 72.3 26-134 L582315-01 WG600176 n-Nitrosodi-n-propylamine mg/kg 0.281 0 .333 84.3 24-141 L582315-01 WG600176 n-Nitrosodimethylamine mg/kg 0.249 0 .333 74.8 18-126 L582315-01 WG600176 n-Nitrosodiphenylamine mg/kg 0.313 0 .333 93.9 16-128 L582315-01 WG600176 Naphthalene mg/kg 0.422 0.0780 .333 103. 31-124 L582315-01 WG600176 Nitrobenzene mg/kg 0.293 0 .333 88.0 22-122 L582315-01 WG600176 Pentachlorophenol mg/kg 0.215 0 .333 64.6 10-124 L582315-01 WG600176 Phenanthrene mg/kg 0.345 0.0570 .333 86.6 25-139 L582315-01 WG600176 Phenol mg/kg 0.262 0 .333 78.7 22-129 L582315-01 WG600176 Pyrene mg/kg 0.292 0.0440 .333 74.6 23-145 L582315-01 WG600176 2,4,6-Tribromophenol 87.16 16-136 WG600176 2-Fluorobiphenyl 88.46 37-119 WG600176 2-Fluorophenol 78.22 22-114 WG600176 Nitrobenzene-d5 85.74 20-114 WG600176 Phenol-d5 79.55 26-127 WG600176 p-Terphenyl-d14 77.54 15-174 WG600176
* Performance of this Analyte is outside of established criteria.For additional information, please see Attachment A 'List of Analytes with QC Qualifiers.'
Page 31 of 35

12065 Lebanon Rd.Mt. Juliet, TN 37122(615) 758-58581-800-767-5859Fax (615) 758-5859
Tax I.D. 62-0814289
Est. 1970Oregon Dept of Transportation - ODOT Ryan Franklin (ODOT) 63034 O.B. Riley Rd Quality Assurance Report
Level IIBend, OR 97701 July 12, 2012
L582318
Matrix SpikeAnalyte Units MS Res Ref Res TV % Rec Limit Ref Samp Batch
Diesel Range Organics (DRO) mg/kg 28.5 0 30 94.9 50-150 L582318-10 WG600178 Residual Range Organics (RRO) mg/kg 29.2 0 30 97.2 50-150 L582318-10 WG600178 o-Terphenyl 103.8 50-150 WG600178
Matrix Spike DuplicateAnalyte Units MSD Ref %Rec Limit RPD Limit Ref Samp Batch
1,1,1,2-Tetrachloroethane mg/kg 0.104 0.0820 83.4 49-135 24.0* 23 L582303-01 WG600099 1,1,1-Trichloroethane mg/kg 0.119 0.0936 95.5 43-142 24.2* 24 L582303-01 WG600099 1,1,2,2-Tetrachloroethane mg/kg 0.106 0.0805 84.7 42-147 27.2* 25 L582303-01 WG600099 1,1,2-Trichloroethane mg/kg 0.111 0.0852 88.8 51-134 26.2* 21 L582303-01 WG600099 1,1,2-Trichlorotrifluoroethane mg/kg 0.130 0.104 104. 25-156 22.5 29 L582303-01 WG600099 1,1-Dichloroethane mg/kg 0.124 0.0911 99.0 50-131 30.4* 21 L582303-01 WG600099 1,1-Dichloroethene mg/kg 0.123 0.0969 98.0 29-145 23.4 28 L582303-01 WG600099 1,1-Dichloropropene mg/kg 0.123 0.0934 98.0 40-136 27.0* 24 L582303-01 WG600099 1,2,3-Trichlorobenzene mg/kg 0.0942 0.0737 75.4 13-142 24.5 33 L582303-01 WG600099 1,2,3-Trichloropropane mg/kg 0.111 0.0844 88.6 41-149 27.0 28 L582303-01 WG600099 1,2,3-Trimethylbenzene mg/kg 0.115 0.0883 91.8 33-146 26.0 27 L582303-01 WG600099 1,2,4-Trichlorobenzene mg/kg 0.114 0.0936 91.2 12-140 19.7 32 L582303-01 WG600099 1,2,4-Trimethylbenzene mg/kg 0.113 0.0919 90.3 29-143 20.5 30 L582303-01 WG600099 1,2-Dibromo-3-Chloropropane mg/kg 0.0955 0.0651 76.4 29-151 37.9* 31 L582303-01 WG600099 1,2-Dibromoethane mg/kg 0.113 0.0889 90.5 48-133 23.9* 22 L582303-01 WG600099 1,2-Dichlorobenzene mg/kg 0.118 0.0891 94.6 37-136 28.2* 25 L582303-01 WG600099 1,2-Dichloroethane mg/kg 0.121 0.0874 96.5 49-131 31.9* 20 L582303-01 WG600099 1,2-Dichloropropane mg/kg 0.119 0.0894 95.1 50-132 28.3* 21 L582303-01 WG600099 1,3,5-Trimethylbenzene mg/kg 0.113 0.0916 90.0 29-144 20.5 30 L582303-01 WG600099 1,3-Dichlorobenzene mg/kg 0.115 0.0896 92.2 26-140 25.0 28 L582303-01 WG600099 1,3-Dichloropropane mg/kg 0.113 0.0875 90.2 50-126 25.2* 22 L582303-01 WG600099 1,4-Dichlorobenzene mg/kg 0.119 0.0950 94.8 34-132 22.1 26 L582303-01 WG600099 2,2-Dichloropropane mg/kg 0.125 0.0931 99.9 35-148 29.1* 26 L582303-01 WG600099 2-Butanone (MEK) mg/kg 0.678 0.497 108. 40-149 30.7* 27 L582303-01 WG600099 2-Chloroethyl vinyl ether mg/kg 0.495 0.384 79.3 10-173 25.3 33 L582303-01 WG600099 2-Chlorotoluene mg/kg 0.116 0.0921 92.8 34-136 23.0 28 L582303-01 WG600099 4-Chlorotoluene mg/kg 0.113 0.0921 90.0 31-137 20.0 27 L582303-01 WG600099 4-Methyl-2-pentanone (MIBK) mg/kg 0.572 0.415 91.5 37-153 31.8* 27 L582303-01 WG600099 Acetone mg/kg 0.772 0.540 123. 10-177 35.3* 28 L582303-01 WG600099 Acrylonitrile mg/kg 0.557 0.408 89.1 33-159 31.0* 26 L582303-01 WG600099 Benzene mg/kg 0.122 0.0916 97.4 44-131 28.2* 21 L582303-01 WG600099 Bromobenzene mg/kg 0.115 0.0892 91.6 36-132 24.8 26 L582303-01 WG600099 Bromodichloromethane mg/kg 0.106 0.0791 84.5 48-134 28.7* 20 L582303-01 WG600099 Bromoform mg/kg 0.0965 0.0725 77.2 34-141 28.3* 24 L582303-01 WG600099 Bromomethane mg/kg 0.143 0.111 114. 19-173 24.9 25 L582303-01 WG600099 Carbon tetrachloride mg/kg 0.109 0.0834 87.2 36-140 26.6* 26 L582303-01 WG600099 Chlorobenzene mg/kg 0.115 0.0927 92.4 42-133 21.9 24 L582303-01 WG600099 Chlorodibromomethane mg/kg 0.103 0.0786 82.5 45-135 27.1* 23 L582303-01 WG600099 Chloroethane mg/kg 0.140 0.116 112. 16-178 18.7 25 L582303-01 WG600099 Chloroform mg/kg 0.122 0.0915 97.9 52-130 28.8* 21 L582303-01 WG600099 Chloromethane mg/kg 0.121 0.0943 96.5 28-147 24.5* 23 L582303-01 WG600099 cis-1,2-Dichloroethene mg/kg 0.122 0.0915 97.6 52-128 28.6* 21 L582303-01 WG600099 cis-1,3-Dichloropropene mg/kg 0.109 0.0830 87.4 46-131 27.4* 21 L582303-01 WG600099 Di-isopropyl ether mg/kg 0.119 0.0857 95.5 46-134 32.9* 20 L582303-01 WG600099 Dibromomethane mg/kg 0.117 0.0859 93.5 51-133 30.6* 21 L582303-01 WG600099 Dichlorodifluoromethane mg/kg 0.123 0.0984 98.3 12-179 22.1 27 L582303-01 WG600099 Ethylbenzene mg/kg 0.118 0.0943 94.3 38-139 22.3 27 L582303-01 WG600099 Hexachloro-1,3-butadiene mg/kg 0.0913 0.0747 73.0 10-147 20.0 37 L582303-01 WG600099 Isopropylbenzene mg/kg 0.119 0.0976 95.3 34-137 19.8 29 L582303-01 WG600099 Methyl tert-butyl ether mg/kg 0.111 0.0792 89.0 45-134 33.7* 22 L582303-01 WG600099 Methylene Chloride mg/kg 0.0964 0.0680 77.1 41-133 34.5* 28 L582303-01 WG600099 n-Butylbenzene mg/kg 0.123 0.0991 98.1 19-149 21.3 32 L582303-01 WG600099
* Performance of this Analyte is outside of established criteria.For additional information, please see Attachment A 'List of Analytes with QC Qualifiers.'
Page 32 of 35

12065 Lebanon Rd.Mt. Juliet, TN 37122(615) 758-58581-800-767-5859Fax (615) 758-5859
Tax I.D. 62-0814289
Est. 1970Oregon Dept of Transportation - ODOT Ryan Franklin (ODOT) 63034 O.B. Riley Rd Quality Assurance Report
Level IIBend, OR 97701 July 12, 2012
L582318
Matrix Spike DuplicateAnalyte Units MSD Ref %Rec Limit RPD Limit Ref Samp Batch
n-Propylbenzene mg/kg 0.117 0.0955 93.8 27-142 20.5 29 L582303-01 WG600099 Naphthalene mg/kg 0.0987 0.0751 79.0 19-146 27.2 30 L582303-01 WG600099 p-Isopropyltoluene mg/kg 0.113 0.0931 90.1 21-150 19.0 31 L582303-01 WG600099 sec-Butylbenzene mg/kg 0.112 0.0924 89.8 25-148 19.3 31 L582303-01 WG600099 Styrene mg/kg 0.114 0.0884 91.2 30-156 25.3 26 L582303-01 WG600099 tert-Butylbenzene mg/kg 0.111 0.0911 88.8 32-146 19.7 30 L582303-01 WG600099 Tetrachloroethene mg/kg 0.113 0.0941 90.2 35-139 18.0 27 L582303-01 WG600099 Toluene mg/kg 0.116 0.0911 93.0 43-127 24.2* 21 L582303-01 WG600099 trans-1,2-Dichloroethene mg/kg 0.118 0.0901 94.2 41-132 26.6* 23 L582303-01 WG600099 trans-1,3-Dichloropropene mg/kg 0.112 0.0857 89.7 43-129 26.8* 23 L582303-01 WG600099 Trichloroethene mg/kg 0.113 0.0881 90.0 42-136 24.3* 23 L582303-01 WG600099 Trichlorofluoromethane mg/kg 0.133 0.103 106. 20-178 25.2 30 L582303-01 WG600099 Vinyl chloride mg/kg 0.129 0.105 103. 30-157 20.3 24 L582303-01 WG600099 Xylenes, Total mg/kg 0.346 0.278 92.2 38-137 21.8 26 L582303-01 WG600099 4-Bromofluorobenzene 98.18 67-133 WG600099 Dibromofluoromethane 108.3 72-135 WG600099 Toluene-d8 104.5 90-113 WG600099 a,a,a-Trifluorotoluene 98.49 89-115 WG600099
1,2,4-Trichlorobenzene mg/kg 0.270 0.270 81.0 27-118 0.182 23 L582315-01 WG600176 2,4,6-Trichlorophenol mg/kg 0.290 0.292 87.0 18-140 0.725 26 L582315-01 WG600176 2,4-Dichlorophenol mg/kg 0.307 0.309 92.2 30-134 0.660 23 L582315-01 WG600176 2,4-Dimethylphenol mg/kg 0.344 0.323 103. 13-147 6.28 27 L582315-01 WG600176 2,4-Dinitrophenol mg/kg 0.0239 0.0380 7.18* 10-110 45.4* 40 L582315-01 WG600176 2,4-Dinitrotoluene mg/kg 0.328 0.310 98.4 12-146 5.66 25 L582315-01 WG600176 2,6-Dinitrotoluene mg/kg 0.321 0.308 96.3 10-150 4.24 23 L582315-01 WG600176 2-Chloronaphthalene mg/kg 0.295 0.291 88.5 31-127 1.21 23 L582315-01 WG600176 2-Chlorophenol mg/kg 0.281 0.272 84.4 26-120 3.22 21 L582315-01 WG600176 2-Nitrophenol mg/kg 0.315 0.313 94.5 10-156 0.710 24 L582315-01 WG600176 3,3-Dichlorobenzidine mg/kg 0.156 0.194 46.8 10-127 21.6 40 L582315-01 WG600176 4,6-Dinitro-2-methylphenol mg/kg 0.134 0.165 40.3 10-124 20.6 40 L582315-01 WG600176 4-Bromophenyl-phenylether mg/kg 0.272 0.263 81.6 27-150 3.36 20 L582315-01 WG600176 4-Chloro-3-methylphenol mg/kg 0.335 0.326 101. 24-140 2.75 22 L582315-01 WG600176 4-Chlorophenyl-phenylether mg/kg 0.298 0.275 89.4 27-142 7.73 21 L582315-01 WG600176 4-Nitrophenol mg/kg 0.232 0.242 69.6 10-166 4.33 35 L582315-01 WG600176 Acenaphthene mg/kg 0.297 0.286 89.2 30-132 3.68 21 L582315-01 WG600176 Acenaphthylene mg/kg 0.319 0.303 95.7 31-144 4.96 24 L582315-01 WG600176 Anthracene mg/kg 0.317 0.309 95.1 27-140 2.48 20 L582315-01 WG600176 Benzidine mg/kg 0 0 0* 10-55 0 36 L582315-01 WG600176 Benzo(a)anthracene mg/kg 0.275 0.267 82.6 22-139 3.14 22 L582315-01 WG600176 Benzo(a)pyrene mg/kg 0.268 0.258 80.4 16-148 3.55 21 L582315-01 WG600176 Benzo(b)fluoranthene mg/kg 0.267 0.250 80.1 13-152 6.59 24 L582315-01 WG600176 Benzo(g,h,i)perylene mg/kg 0.145 0.168 43.6 10-137 14.8 32 L582315-01 WG600176 Benzo(k)fluoranthene mg/kg 0.282 0.253 84.7 15-152 11.1 22 L582315-01 WG600176 Benzylbutyl phthalate mg/kg 0.291 0.281 87.5 20-168 3.73 23 L582315-01 WG600176 Bis(2-chlorethoxy)methane mg/kg 0.296 0.292 88.8 32-141 1.30 20 L582315-01 WG600176 Bis(2-chloroethyl)ether mg/kg 0.261 0.253 78.4 25-139 3.21 26 L582315-01 WG600176 Bis(2-chloroisopropyl)ether mg/kg 0.272 0.266 81.6 32-128 2.23 22 L582315-01 WG600176 Bis(2-ethylhexyl)phthalate mg/kg 0.271 0.257 81.3 20-163 5.43 24 L582315-01 WG600176 Chrysene mg/kg 0.292 0.286 87.6 20-139 1.99 23 L582315-01 WG600176 Di-n-butyl phthalate mg/kg 0.313 0.304 94.1 24-149 3.07 24 L582315-01 WG600176 Di-n-octyl phthalate mg/kg 0.264 0.255 79.4 14-164 3.68 24 L582315-01 WG600176 Dibenz(a,h)anthracene mg/kg 0.173 0.193 52.0 10-137 10.8 29 L582315-01 WG600176 Diethyl phthalate mg/kg 0.341 0.336 102. 28-142 1.42 23 L582315-01 WG600176 Dimethyl phthalate mg/kg 0.337 0.331 101. 31-142 1.85 22 L582315-01 WG600176 Fluoranthene mg/kg 0.309 0.320 75.0 24-145 3.46 29 L582315-01 WG600176 Fluorene mg/kg 0.307 0.299 92.2 30-138 2.69 22 L582315-01 WG600176 Hexachloro-1,3-butadiene mg/kg 0.279 0.272 83.8 29-136 2.60 22 L582315-01 WG600176
* Performance of this Analyte is outside of established criteria.For additional information, please see Attachment A 'List of Analytes with QC Qualifiers.'
Page 33 of 35
12065 Lebanon Rd.Mt. Juliet, TN 37122(615) 758-58581-800-767-5859Fax (615) 758-5859
Tax I.D. 62-0814289
Est. 1970Oregon Dept of Transportation - ODOT Ryan Franklin (ODOT) 63034 O.B. Riley Rd Quality Assurance Report
Level IIBend, OR 97701 July 12, 2012
L582318
Matrix Spike DuplicateAnalyte Units MSD Ref %Rec Limit RPD Limit Ref Samp Batch
Hexachlorobenzene mg/kg 0.241 0.228 72.3 26-136 5.49 20 L582315-01 WG600176 Hexachlorocyclopentadiene mg/kg 0.115 0.0994 34.4 10-124 14.2 33 L582315-01 WG600176 Hexachloroethane mg/kg 0.289 0.280 86.8 21-107 3.38 27 L582315-01 WG600176 Indeno(1,2,3-cd)pyrene mg/kg 0.169 0.190 50.7 10-139 11.6 32 L582315-01 WG600176 Isophorone mg/kg 0.249 0.241 74.6 26-134 3.23 20 L582315-01 WG600176 n-Nitrosodi-n-propylamine mg/kg 0.290 0.281 87.1 24-141 3.31 20 L582315-01 WG600176 n-Nitrosodimethylamine mg/kg 0.234 0.249 70.4 18-126 6.15 27 L582315-01 WG600176 n-Nitrosodiphenylamine mg/kg 0.321 0.313 96.5 16-128 2.65 25 L582315-01 WG600176 Naphthalene mg/kg 0.467 0.422 117. 31-124 10.2 25 L582315-01 WG600176 Nitrobenzene mg/kg 0.290 0.293 87.2 22-122 0.899 20 L582315-01 WG600176 Pentachlorophenol mg/kg 0.186 0.215 56.0 10-124 14.4 34 L582315-01 WG600176 Phenanthrene mg/kg 0.351 0.345 88.2 25-139 1.58 25 L582315-01 WG600176 Phenol mg/kg 0.267 0.262 80.3 22-129 1.97 25 L582315-01 WG600176 Pyrene mg/kg 0.284 0.292 72.1 23-145 2.92 30 L582315-01 WG600176 2,4,6-Tribromophenol 87.76 16-136 WG600176 2-Fluorobiphenyl 91.31 37-119 WG600176 2-Fluorophenol 76.97 22-114 WG600176 Nitrobenzene-d5 85.99 20-114 WG600176 Phenol-d5 79.59 26-127 WG600176 p-Terphenyl-d14 75.84 15-174 WG600176
Diesel Range Organics (DRO) mg/kg 27.5 28.5 91.6 50-150 3.60 20 L582318-10 WG600178 Residual Range Organics (RRO) mg/kg 28.1 29.2 93.5 50-150 3.89 20 L582318-10 WG600178 o-Terphenyl 96.32 50-150 WG600178
Batch number /Run number / Sample number cross reference
WG600099: R2231413: L582318-08WG600176: R2234913: L582318-06 07WG600177: R2235933: L582318-06 07WG600199: R2236217: L582318-01 02 03 04 05 06 07 08 09 10WG600201: R2238576: L582318-11 12 13 14WG600178: R2240913: L582318-01 02 03 04 05 06 07 09 10 11 12 13 14
* * Calculations are performed prior to rounding of reported values.* Performance of this Analyte is outside of established criteria.
For additional information, please see Attachment A 'List of Analytes with QC Qualifiers.'
Page 34 of 35

12065 Lebanon Rd.Mt. Juliet, TN 37122(615) 758-58581-800-767-5859Fax (615) 758-5859
Tax I.D. 62-0814289
Est. 1970Oregon Dept of Transportation - ODOT Ryan Franklin (ODOT) 63034 O.B. Riley Rd Quality Assurance Report
Level IIBend, OR 97701 July 12, 2012
L582318
The data package includes a summary of the analytic results of the qualitycontrol samples required by the SW-846 or CWA methods. The quality controlsamples include a method blank, a laboratory control sample, and the matrixspike/matrix spike duplicate analysis. If a target parameter is outsidethe method limits, every sample that is effected is flagged with theappropriate qualifier in Appendix B of the analytic report.
Method Blank - an aliquot of reagent water carried through theentire analytic process. The method blank results indicate ifany possible contamination exposure during the sample handling,digestion or extraction process, and analysis. Concentrations oftarget analytes above the reporting limit in the method blank arequalified with the "B" qualifier.
Laboratory Control Sample - is a sample of known concentrationthat is carried through the digestion/extraction and analysisprocess. The percent recovery, expressed as a percentage of thetheoretical concentration, has statistical control limitsindicating that the analytic process is "in control". If atarget analyte is outside the control limits for the laboratorycontrol sample or any other control sample, the parameter isflagged with a "J4" qualifier for all effected samples.
Matrix Spike and Matrix Spike Duplicate - is two aliquots of anenvironmental sample that is spiked with known concentrations oftarget analytes. The percent recovery of the target analytesalso has statistical control limits. If any recoveries that areoutside the method control limits, the sample that was selectedfor matrix spike/matrix spike duplicate analysis is flagged witheither a "J5" or a "J6". The relative percent difference (%RPD)between the matrix spike and the matrix spike duplicaterecoveries is all calculated. If the RPD is above the methodlimit, the effected samples are flagged with a "J3" qualifier.
Page 35 of 35
Appendix J
Contaminated Soil Removal Cost Estimate

This Page Intentionally Left Blank
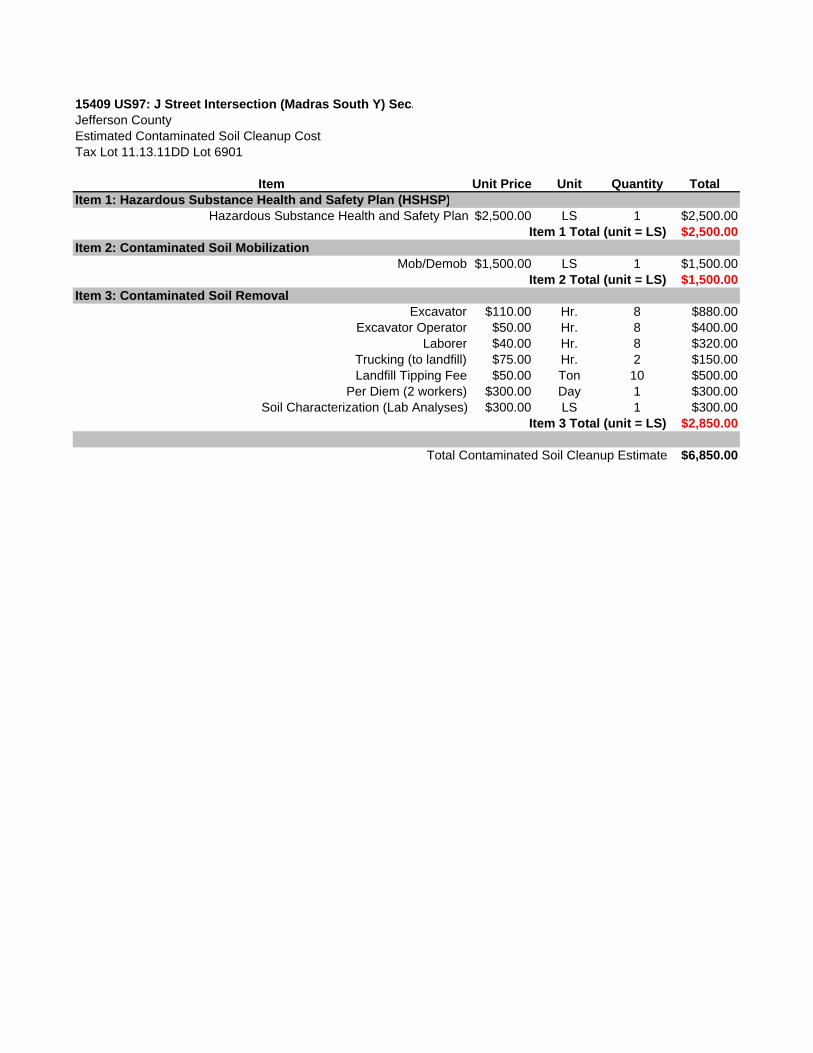
15409 US97: J Street Intersection (Madras South Y) Sec.Jefferson CountyEstimated Contaminated Soil Cleanup CostTax Lot 11.13.11DD Lot 6901
Item Unit Price Unit Quantity TotalItem 1: Hazardous Substance Health and Safety Plan (HSHSP)
Hazardous Substance Health and Safety Plan $2,500.00 LS 1 $2,500.00$2,500.00
Item 2: Contaminated Soil MobilizationMob/Demob $1,500.00 LS 1 $1,500.00
$1,500.00Item 3: Contaminated Soil Removal
Excavator $110.00 Hr. 8 $880.00Excavator Operator $50.00 Hr. 8 $400.00
Laborer $40.00 Hr. 8 $320.00Trucking (to landfill) $75.00 Hr. 2 $150.00Landfill Tipping Fee $50.00 Ton 10 $500.00
Per Diem (2 workers) $300.00 Day 1 $300.00Soil Characterization (Lab Analyses) $300.00 LS 1 $300.00
$2,850.00
$6,850.00
Item 1 Total (unit = LS)
Item 3 Total (unit = LS)
Total Contaminated Soil Cleanup Estimate
Item 2 Total (unit = LS)
Copyright © 2022 FDOKUMEN