FARMERS' PRACTICES AND COMMUNITY MANAGEMENT OF IRRIGATION: WHY DO THEY NOT MATCH IN FATNASSA OASIS?
Upload
khangminh22Category
view
0download
0
Modern Water Control and Management Practices in Irrigation: Impact on Performance http://www.itrc.org/reports/modernwatercontrol/modernwatercontrol.htm ITRC Report 98-001
Modern Water Control and Management Practices
in Irrigation: Impact on Performance
AGR IPTRID ITRC
Prepared for the World Bank Research Committee
Principal Authors Charles M. Burt, P.E., Ph.D.
Stuart W. Styles, P.E.
October 1998
Irrigation Training and Research Center - www.itrc.org Page 1 of 276

Page 2 of 276
Modern Water Control and Management Practices in Irrigation: Impact on Performance http://www.itrc.org/reports/modernwatercontrol/modernwatercontrol.htm ITRC Report 98-001
Table of Contents
Executive Summary ..................................................................................................ES-1
Chapter 1. Introduction ...............................................................................................1-1 Background......................................................................................................1-1 Research Objectives.........................................................................................1-2 Project Appraisals ............................................................................................1-3 Methodology....................................................................................................1-6
Develop internal process indicators and external indicators ...............1-6 Develop data collection forms .............................................................1-7 Contact local irrigation specialists and the projects ............................1-8 Project visits.........................................................................................1-8 Computation of indicators ...................................................................1-9 Written project summaries...................................................................1-9
Results............................................................................................................1-10
Chapter 2. Rapid Appraisal Process (RAP) ................................................................2-1
Chapter 3. Project Selection........................................................................................3-1
Chapter 4. Irrigation Project Characteristics ..............................................................4-1
Chapter 5. External Indicators ....................................................................................5-1 IWMI Indicators of Irrigated Agricultural Output...........................................5-1 Proposed Indicators of Agricultural Output.....................................................5-2 IWMI Indicators of Water Supply ...................................................................5-3 IWMI Financial Indicators...............................................................................5-7 New or Revised External Indicators ................................................................5-7 Graphs of Indicators.......................................................................................5-10
Chapter 6. Internal Process Indicators ........................................................................6-1 General.............................................................................................................6-1 Internal Indicators: Results ..............................................................................6-8
Chapter 7. Correlation Evaluation ..............................................................................7-1 Background......................................................................................................7-1 Percent of Area with an Active Water User Association.................................7-4 Size of the Water User Association .................................................................7-7 Time Needed for the Manager to Travel Down the Main Canal .....................7-8 Communications - How Often do Cross-Regulator Operators
Communicate with the Next Higher Level (Hr) ................................7-10 Cost of the Land Close to the Head of Canals ...............................................7-12 Actual Service to Individual Fields Based on Traditional
Irrigation Methods .............................................................................7-14 Table of Contents (cont)
Irrigation Training and Research Center - www.itrc.org
Page ii

Page 3 of 276
Modern Water Control and Management Practices in Irrigation: Impact on Performance http://www.itrc.org/reports/modernwatercontrol/modernwatercontrol.htm ITRC Report 98-001
Actual Service by Main Canals to Its Subcanals ...........................................7-19 Capacities.......................................................................................................7-21 Percentage of O&M Collected.......................................................................7-24 Number of Turnouts Per Operator .................................................................7-24 Summary ........................................................................................................7-27
Chapter 8. General Observations ................................................................................8-1 Developing the Proper Focus...........................................................................8-1 Irrigation Efficiency.........................................................................................8-2 Management.....................................................................................................8-6 Computers ......................................................................................................8-11 Cost Recovery................................................................................................8-14 Trends in Farm and Field Sizes .....................................................................8-15 Training..........................................................................................................8-16 Water User Associations and Farmer Cooperation........................................8-19 Farmer Expectations and Field Irrigation Performance.................................8-23 Hardware Practices ........................................................................................8-26
Gated vs. Ungated Systems................................................................8-26 Cheap Imitations ................................................................................8-27 Proper Turnout Designs .....................................................................8-27 Turnout Density .................................................................................8-31 Pipelines.............................................................................................8-31 Buffer (Regulating) Reservoirs..........................................................8-31 Long Crested Weirs ...........................................................................8-32
Canal Cross Section Designs .........................................................................8-33 Cattle Access..................................................................................................8-34 Mobility and Communications ......................................................................8-35
Chapter 9. Review of the Original Project Hypotheses ..............................................9-1
Chapter 10. Irrigation Project Improvement and Modernization .............................10-1 The Nature of Modernization ........................................................................10-1 Tradeoffs between Hardware and Organization ............................................10-2 Decentralization .............................................................................................10-3 Hardware vs. Software? .................................................................................10-3 Long Term Objectives ...................................................................................10-4 Real Projects vs. Research Projects ...............................................................10-4 Projects with High Rainfall and Abundant Water Supplies ..........................10-4 Personnel Continuity......................................................................................10-5 The Mexico Experience .................................................................................10-5
Table of Contents (cont)
Irrigation Training and Research Center - www.itrc.org
Page iii

Page 4 of 276
Modern Water Control and Management Practices in Irrigation: Impact on Performance http://www.itrc.org/reports/modernwatercontrol/modernwatercontrol.htm ITRC Report 98-001
Chapter 11. Lessons for Lending Agencies ..............................................................11-1 Focus of Lenders............................................................................................11-1 Finding the Technical Answers .....................................................................11-1 Sufficient Funding and Duration ...................................................................11-2 Recommended Strategy for Modernization Assistance.................................11-3
Chapter 12. Summary ...............................................................................................12-1 Background....................................................................................................12-1 Projects Evaluated..........................................................................................12-2 Procedure .......................................................................................................12-3 Evaluation of the Hypotheses ........................................................................12-4 Correlations....................................................................................................12-5 Improved Field (On-Farm) Water Management............................................12-6 Perceptions.....................................................................................................12-6 Training Needs...............................................................................................12-7 Hardware Improvements................................................................................12-8 Management Improvements...........................................................................12-8 Water User Associations................................................................................12-9 Impacts of Modernization on Performance..................................................12-10 Recommended Strategy for Modernization .................................................12-11 Conclusion ...................................................................................................12-12
Chapter 13. References .............................................................................................13-1
Irrigation Training and Research Center - www.itrc.org
Page iv

Page 5 of 276
Modern Water Control and Management Practices in Irrigation: Impact on Performance http://www.itrc.org/reports/modernwatercontrol/modernwatercontrol.htm ITRC Report 98-001
Tables
Table 1-1. Comparison of irrigation projects with a complex human body ...............1-4 Table 1-2. Project tasks...............................................................................................1-6
Table 3-1. Irrigation projects visited. ..........................................................................3-3
Table 4-1. Key project characteristics. .......................................................................4-2 Table 4-2. Aspects of modern control or management in the irrigation
projects visited, as perceived or advertised by the project personnel or some previous reviewers.................................................4-3
Table 4-3a. Examples of prominent positive and negative aspects of each project ..........................................................................................4-4
Table 4-3b. Examples of prominent positive and negative aspects of each project ..........................................................................................4-5
Table 4-3c. Examples of prominent positive and negative aspects of each project ..........................................................................................4-6
Table 4-3d. Examples of prominent positive and negative aspects of each project ..........................................................................................4-7
Table 5-1. External Indicator Values. .......................................................................5-11
Table 6-1. Indicator I-1 Information...........................................................................6-3 Table 6-2a. Internal Process Indicators, Sub-Indicators, and
Relative Weighting Values. .............................................................................6-4 Table 6-2b. Internal Process Indicators, Sub-Indicators, and
Relative Weighting Values. .............................................................................6-5 Table 6-2c. Internal Process Indicators, Sub-Indicators, and
Relative Weighting Values. .............................................................................6-6 Table 6-2d. Internal Process Indicators, Sub-Indicators, and
Relative Weighting Values. .............................................................................6-7 Table 6-2e. Internal Process Indicators, Sub-Indicators, and
Relative Weighting Values. .............................................................................6-8 Table 6-3. Data on Internal process indicator I-24 sub-indicator values..................6-32
Table 7-1. List of Variables with Best Correlations ...................................................7-3
Irrigation Training and Research Center - www.itrc.org
Page v

Page 6 of 276
Modern Water Control and Management Practices in Irrigation: Impact on Performance http://www.itrc.org/reports/modernwatercontrol/modernwatercontrol.htm ITRC Report 98-001
Figures
Figure 1-1. The "big picture" view of irrigation projects (a.k.a. [also known as] "black box" approach). ...................................1-3
Figure 1-2. Factors affecting output (results) and symptoms from irrigation projects. .......................................................................1-5
Figure 4-1. Irrigation project size, hectares of service area........................................4-8 Figure 4-2. Annual rainfall, mm. ................................................................................4-8 Figure 4-3. Annual reference Evapotranspiration (ETo), mm....................................4-9 Figure 4-4. Ratio of Annual Rainfall to Annual ETo. ................................................4-9 Figure 4-5. Percent of lined canals. ..........................................................................4-10 Figure 4-6. Peak flow rates delivered at the head of the main canal. .......................4-11 Figure 4-7. Annual volume of water delivered to fields, cubic meters/ha................4-11 Figure 4-8. Cropping intensity, based on the service area which is
equipped with a water delivery system. 5-year average values.........................................................................4-12
Figure 4-9. Main season rice yields (Tons/ha with hulls) ........................................4-12 Figure 4-10. Ratio of yields (Head of Canal to Tail of Canal)
during the dry season. ........................................................................4-13 Figure 4-11. Percent of project area with active WUA. ...........................................4-14 Figure 4-12. Number of fines levied by a typical WUA in one year........................4-14 Figure 4-13. Value of Land ($US/ha) .......................................................................4-15 Figure 4-14. Average farm management unit size (ha). ...........................................4-15 Figure 4-15. Monthly salaries ($US). .......................................................................4-16 Figure 4-16. Annual operation and maintenance (O&M)
expenditures, including salaries. $/ha ...............................................4-16 Figure 4-17. O&M expenditures expressed as $/million cubic
meters (mcm) of beneficial use..........................................................4-17 Figure 4-18. Water charges, $/ha..............................................................................4-18 Figure 4-19. Water charges. $/mcm delivered to the farm ......................................4-18 Figure 4-20. Percent of water charges collected.......................................................4-19 Figure 4-21. Number of project operated turnouts per operator...............................4-20 Figure 4-22. Hectares per operator. ..........................................................................4-21 Figure 4-23. Farmers per operator. ...........................................................................4-21 Figure 4-24. Percent of final water distribution done by farmers.............................4-22 Figure 4-25. Number of farmers which must cooperate on final distribution. .........4-22 Figure 4-26. Gross income per farm management unit ($)
(rough estimates)................................................................................4-23 Figure 4-27. Agricultural output per hectare, with value expressed
in labor days.......................................................................................4-24
Irrigation Training and Research Center - www.itrc.org
Page vi

Page 7 of 276
Modern Water Control and Management Practices in Irrigation: Impact on Performance http://www.itrc.org/reports/modernwatercontrol/modernwatercontrol.htm ITRC Report 98-001
Figures (cont)
Figure 5-1. IWMI1 external indicator. Output per cropped area ($US/ha). Local prices. .............................................................5-13
Figure 5-2. IWMI2 external indicator. Output per command area ($US/ha). Local prices. .............................................................5-13
Figure 5-3. IWMI3 external indicator. Output per unit irrigation supply ($/cu. m.) ................................................................5-14
Figure 5-4. IWMI4 external indicator. Output per water consumed ($/cu. m.)...........................................................................5-14
Figure 5-5. IWMI5 external indicator. Relative water supply (RWS) ....................5-15 Figure 5-6. ITRC6 external indicator. Annual RWSITRC .........................................5-15 Figure 5-7. ITRC4 external indicator. Dry Season RWSITRC ..................................5-16 Figure 5-8. ITRC5 external indicator. Wet Season RWSITRC..................................5-16 Figure 5-9. IWMI6 external indicator. Relative Irrigation Supply (RIS)................5-17 Figure 5-10. ITRC9 external indicator. Annual RISITRC .........................................5-17 Figure 5-11. ITRC7 external indicator. Dry Season RISITRC...................................5-18 Figure 5-12. ITRC8 external indicator. Wet Season RISITRC ..................................5-18 Figure 5-13. IWMI7 external indicator. Water Delivery Capacity (%)...................5-19 Figure 5-14. ITRC3 external indicator. Water Delivery Capacity (%) ...................5-19 Figure 5-15. Peak LPS/ha. ........................................................................................5-20 Figure 5-16. ITRC10 external indicator. Annual Project
Irrigation Efficiency (%)....................................................................5-21 Figure 5-17. IWMI9REV. Percentage of O&M Collected (%)..................................5-22 Figure 6-1. Indicator I-1. Actual water delivery service to individual fields.
Based on traditional field irrigation methods. .................................................6-9 Figure 6-2. Actual water delivery service to individual fields. Based on
traditional field irrigation methods. Sub-indicator values for Indicator I-1. ..................................................................................................6-10
Figure 6-3. Indicator I-2. Actual service to the average point of effective differentiation.................................................................................................6-12
Figure 6-4. Sub-indicator values of Internal process indicator I-2. Actual service to the point of effective differentiation. .........................................................6-12
Figure 6-5. Internal process indicator I-3. Actual service to the point of deliberate differentiation................................................................................6-13
Figure 6-6. Sub-indicator values of Internal process indicator I-3. Actual service to the point of deliberate differentiation. .......................................................6-14
Figure 6-7. Internal process indicator I-4. Actual service by the main canals to the submain canals. .........................................................................6-15
Figure 6-8. Sub-indicator values of Internal process indicator I-4. Actual service by the main canals to the submain canals..........................................6-15
Figure 6-9. Internal process indicator I-5 and Indicator I-1. Stated and actual service to individual fields. .................................................................6-16
Figure 6-10. Internal process indicator I-6 together with Indicator I-2. Stated and actual service to the average point of effective differentiation....6-16
Figure 6-11. Internal process indicator I-7 and Indicator I-3. Stated and actual service to the average point of deliberate differentiation....................6-17
Irrigation Training and Research Center - www.itrc.org
Page vii

Page 8 of 276
Modern Water Control and Management Practices in Irrigation: Impact on Performance http://www.itrc.org/reports/modernwatercontrol/modernwatercontrol.htm ITRC Report 98-001
Figures (cont)
Figure 6-12. Internal process indicator I-8 and Indicator I-4. Stated and actual service by main canals to subcanals. ...................................................6-17
Figure 6-13. Internal process indicator I-9. Lack of anarchy index. .......................6-18 Figure 6-14. Internal process indicator I-10. Cross Regulator
Hardware (Main Canal). Overall value.........................................................6-18 Figure 6-15. Internal process indicator I-10 sub-indicator values. Main
canal cross regulator hardware. .....................................................................6-19 Figure 6-16. Internal process indicator I-11. Main canal capacities........................6-19 Figure 6-17. Internal process indicator I-12. Main canal turnouts ..........................6-20 Figure 6-18. Internal process indicator I-13. Regulating reservoirs. .......................6-20 Figure 6-19. Internal process indicator I-14. Main canal communications. ............6-21 Figure 6-20. Internal process indicator I-14 sub-indicators. Main canal
communications. ............................................................................................6-22 Figure 6-21. Internal process indicator I-15. Main canal general conditions..........6-22 Figure 6-22. Internal process indicator I-15 sub-indicators. Main canal
general conditions. .........................................................................................6-23 Figure 6-23. Internal process indicator I-16. Main canal operation. .......................6-23 Figure 6-24. Internal process indicator I-16 sub-indicators. Main
canal operation. ..............................................................................................6-25 Figure 6-25. Internal process indicator I-17. Submain canal cross-regulators. .......6-26 Figure 6-26. Internal process indicator I-18. Submain canal capacities..................6-26 Figure 6-27. Internal process indicator I-19. Submain canal turnouts. ..................6-27 Figure 6-28. Internal process indicator I-19 sub-indicator values. Submain
canal turnouts. ................................................................................................6-27 Figure 6-29. Internal process indicator I-20. Submain canal communications. .....6-28 Figure 6-30. Internal process indicator I-20 sub-indicators. Submain
canal communications....................................................................................6-28 Figure 6-31. Internal process indicator I-21. Submain canal general conditions. ..6-29 Figure 6-32. Internal process indicator I-22. Submain canal operation. ................6-29 Figure 6-33. Internal process indicator I-23. Overall project budget index. ...........6-30 Figure 6-34. Internal process indicator I-23 sub-indicators. Overall project
budget index...................................................................................................6-30 Figure 6-35. Internal process indicator I-24. Employee index. ...............................6-31 Figure 6-36. Internal process indicator I-24 sub-indicators. Employee index. .......6-31 Figure 6-37. Internal process indicator I-25. Water User Associations. .................6-32 Figure 6-38. Internal process indicator I-25 sub-indicators. Water
User Associations. .........................................................................................6-33 Figure 6-39. Internal process indicator I-26. Ability to accommodate
pressurized field irrigation systems today. ....................................................6-33 Figure 6-40. Internal process indicator I-26 sub-indicators. Ability to
accommodate pressurized field irrigation systems today. .............................6-34
Irrigation Training and Research Center - www.itrc.org
Page viii

Page 9 of 276
Modern Water Control and Management Practices in Irrigation: Impact on Performance http://www.itrc.org/reports/modernwatercontrol/modernwatercontrol.htm ITRC Report 98-001
Figures (cont)
Figure 6-41. Internal process indicator I-27 sub-indicators. Present quality of management and hardware in terms of accommodating pressurized field irrigation systems tomorrow...............................................6-35
Figure 6-42. Internal process indicator I-28. Number of turnouts per operator. 6-36 Figure 6-43. Internal process indicators I-29, I-30, I-31.. 6-36
Figure 7-1. Scatter plot between [actual service to individual fields based on traditional irrigation methods (flexibility to fields)] and the [percent of area with an active water user association]. ......................7-4
Figure 7-2. Scatter plot between [actual service to average point of differentiation (number of fields downstream)] and the [percent of area with an active water user association]. ....................................7-5
Figure 7-3. Scatter plot between [water delivery capacity] and the [percent of area with an active water user association]. ......................7-6
Figure 7-4. Scatter plot between [ability of present service to individual fields to accommodate pressurized irrigation systems] and the [percent of area with an active water user association]. ......................7-6
Figure 7-5. Scatter plot between the [ability of present service to accommodate pressurized irrigation systems (flexibility to field)] and the [typical size of a WUA]. ......................................................................7-7
Figure 7-6. Scatter plot between the [actual service to average point of effective differentiation based on traditional on-farm methods (number of fields downstream)] and the [typical size of a WUA]. .....7-7
Figure 7-7. Scatter plot between the [stated service to fields (flexibility to field)] and the [time needed for the manager to travel down the longest canal]. ................................................................................7-9
Figure 7-8. Scatter plot between the [water charge] and the [time needed for the manager to travel down the longest canal]. .........................................7-9
Figure 7-9. Scatter plot between [operation of submain canal (how frequently does the headworks respond to realistic feedback from the canal operators)] and the [time need for the manager to travel down the longest canal]. ....................................................................7-10
Figure 7-10. Scatter plot between [communications - how often do cross- regulator operators communicate with the next higher level)] to the [sense of inequity of deliveries throughout the project]. .........7-11
Figure 7-11. Scatter plot between [communications - how often do cross- regulator operators communicate with the next higher level)] to the [operation of the main canal]. ..................................................7-12
Figure 7-12. Scatter plot between the [actual service at point of effective differentiation (number of fields downstream)] and the [cost of land close to the head of canals]. .......................................................7-13
Figure 7-13. Scatter plot between the [ability of present service to accommodate pressurized irrigation systems (flexibility to field)] and the [cost of the land close to head of canals]. ..................7-13
Irrigation Training and Research Center - www.itrc.org
Page ix

Page 10 of 276
Modern Water Control and Management Practices in Irrigation: Impact on Performance http://www.itrc.org/reports/modernwatercontrol/modernwatercontrol.htm ITRC Report 98-001
Figures (cont)
Figure 7-14. Scatter plot between the [water user associations (weighted overall)] and the [cost of the land close to head of canals]................7-14
Figure 7-15. Scatter plot between the [actual service to individual fields based on traditional irrigation methods (weighted overall)] and the [operation of the main canal (clarity and correctness of instructions to operator)]. ..............................................................7-15
Figure 7-16. Scatter plot between the [actual service to individual fields based on traditional irrigation methods (weighted overall)] and the [operation of the submain canal (clarity and correctness of instructions to operator)]. ..............................................................7-15
Figure 7-17. Scatter plot between the [actual service to individual fields based on traditional irrigation methods (weighted overall)] and the [actual service by main canals to its subcanals]. ...........................................7-16
Figure 7-18. Scatter plot between the [actual service to individual fields based on traditional irrigation methods (weighted overall)] and the [noticeable non-existence of unauthorized turnouts from canals above point of ownership change]. ....................................................7-17
Figure 7-19. Scatter plot between the [actual service to individual fields based on traditional irrigation methods (weighted overall)] and the [output per cropped area]. ..................................................................7-18
Figure 7-20. Scatter plot between the [actual service to individual fields based on traditional irrigation methods (weighted overall)] and the [number of farmers involved in the final stage]...........................7-19
Figure 7-21. Scatter plot between [cross-regulators of main canals] and the [actual service by main canals to its subcanals] ................................7-20
Figure 7-22. Scatter plot between [cross-regulators of submain canals] and the [actual service by main canals to its subcanals]...........................7-20
Figure 7-23. Scatter plot between [cross-regulators of main canal (probable ease of cross-regulator operation if system was required to provide better service to turnouts)] and the [actual service by main canals to its subcanals]..............................................................7-21
Figure 7-24. Scatter plot between [capacities of main canals (overall weighted)] and the [annual project irrigation efficiency (ITRC10)]. .........................................................................................7-22
Figure 7-25. Scatter plot between [capacities of main canals (capacity limitations of structures or canal cross sections further down in the canal)] and the [annual project irrigation efficiency (ITRC10)]. ........................................................................7-22
Figure 7-26. Scatter plot between [water delivery capacity] and the [percent of area with an active water user association]. ..................................7-23
Figure 7-27. Scatter plot between [Relative Irrigation Supply, RIS] and the [annual project-level irrigation efficiency (ITRC 10)] ................7-23
Irrigation Training and Research Center - www.itrc.org
Page x

Page 11 of 276
Modern Water Control and Management Practices in Irrigation: Impact on Performance http://www.itrc.org/reports/modernwatercontrol/modernwatercontrol.htm ITRC Report 98-001
Figures (cont)
Figure 7-28. Scatter plot between [percentage of O&M collected] and the [actual service to the individual fields based on traditional irrigation methods (equity)]. ..............................................................7-24
Figure 7-29. Scatter plot between [number of turnouts per operator] and the [percent of the area with an active water user association]. ........7-25
Figure 7-30. Scatter plot between [number of turnouts per operator] and the [water user associations (weighted overall)]................................7-25
Figure 7-31. Scatter plot between [number of turnouts per operator] and the [ability of present service to individual fields to accommodate pressurized irrigation systems]. .........................................................7-26
Figure 7-32. Scatter plot between [number of turnouts per operator] and the [ability of present service to individual fields to accommodate pressurized irrigation systems (flexibility to the field)]. ...................7-26
Figure 12-1. Map showing the general location of the projects.
Irrigation Training and Research Center - www.itrc.org
Page xi
12-2

Page 12 of 276
Modern Water Control and Management Practices in Irrigation: Impact on Performance http://www.itrc.org/reports/modernwatercontrol/modernwatercontrol.htm ITRC Report 98-001
Attachments
Report
A. Questionnaire B. Data Requested Prior to the Visit C. Data for all Projects D. Internal Indicators Description and Ranking Criteria E. Internal Indicator Values for all Projects
Project Summary Reports (under separate cover)
1. Lam Pao 2. Dez 3. Guilan 4. Seyhan 5. Majalgaon 6. Dantiwada 7. Bhakra 8. Muda 9. Kemubu 10. Beni Amir 11. Office du Niger 12. Rio Yaqui Alto 13. Coello 14. Saldana 15. Cupatizio 16. Rio Mayo
Irrigation Training and Research Center - www.itrc.org
Page xii

Page 13 of 276
Modern Water Control and Management Practices in Irrigation: Impact on Performance http://www.itrc.org/reports/modernwatercontrol/modernwatercontrol.htm ITRC Report 98-001
Team Members
Team Member Responsibility Background Charles Burt IPTRID Consultant, site visits
and senior author
Director of Cal Poly ITRC, Irrigation
Engineering and Management
Stuart Styles IPTRID Consultant, site visits
and junior author
Cal Poly ITRC Irrigation Project
Manager, MBA
Herve Plusquellec AGR Representative, initial visit
and editing
Irrigation Advisor - World Bank, retired
Chris Perry Program proposal World Bank Irrigation and Economics
Specialist, IWMI Staff
David Molden Site visit and partial review IWMI Staff
Daniel Renault Site visit and partial review IWMI Staff
Randall Purcell IPTRID Program Manager Executive Director of IPTRID,
Agricultural Economics
Francois Gadelle Two site visits Irrigation Engineer - IPTRID
All opinions and conclusions in this paper are those of the two authors (Charles Burt and Stuart Styles), and do not necessarily represent those of the individuals listed above, or their organizations.
Irrigation Training and Research Center - www.itrc.org
Page xiii

Modern Water Control and Management Practices in Irrigation: Impact on Performance http://www.itrc.org/reports/modernwatercontrol/modernwatercontrol.htm ITRC Report 98-001
Acknowledgements
The authors gratefully acknowledge the assistance of the staffs of the organizations that were visited as part of this project. In all cases, the staffs donated valuable time and information to the researchers. This project would not have been successful without the cooperation of the local agencies.
It should be emphasized that in all cases, the personnel of the host irrigation projects were very hospitable and invested their valuable time in assisting the research team members. The negative aspects mentioned in this report must not be construed as negative comments about the personal integrity of any of the project personnel. Rather, they are listed because we can often learn as much from recognized deficiencies as we can from success stories. If we can understand the reasons for the negative aspects, we can sometimes provide solutions.
Summary of Project Visits and Cooperating Governmental Organizations
Project Country Governmental Organization Lam Pao Thailand Royal Irrigation Department (RID) Dez Iran North of Khuzestan - Irrigation and Drainage Network
Company Guilan Iran Guilan Regional Water Authority Seyhan Turkey General Directorate of State Hydraulic Works (DSI) Majalgaon India Government of Maharashtra - Irrigation Department Dantiwada India Dantiwada Canal Company - Narmada Water Resources
Department Bhakra India Government of Haryana - Irrigation Department Muda Malaysia Muda Agricultural Development Authority (MADA) Kemubu Malaysia Kemubu Agricultural Development Authority (KADA) Beni Amir Morocco Regional Offices for Agricultural Development
(ORMVA) Office du Niger Mali Office du Niger (ODN) Rio Yaqui Alto Dominican Republic Instituto Nacional de Recursos Hidraulicos (INDRHI) Coello Colombia USOCOELLO water user organization Saldaña Colombia USOSALDANA water user organization Cupatitzio Mexico Comision Nacional del Agua (CNA). Irrigation District
No. 097 water user organization Rio Mayo Mexico Comision Nacional del Agua (CNA). Irrigation District
No. 308 water user organization
Irrigation Training and Research Center - www.itrc.org
Page xiv Page 14 of 276

Page 15 of 276
Executive Summary
This study was funded by the Research Committee of the World Bank and managed by the International Program for Technology Research in Irrigation and Drainage (IPTRID) and the Agricultural and Rural Development Department. The International Water Management Institute (IWMI) participated in developing the initial research proposal and several site visits. The principal authors were contractors of IPTRID, and are from the Irrigation Training and Research Center (ITRC) at California Polytechnic State University in San Luis Obispo, California.
The research built upon previous work presented in the World Bank Technical Paper No. 246 (Plusquellec et. al., 1994). That publication, Modern Water Control in Irrigation, provided a conceptual framework for the concepts, issues, and applications of irrigation modernization efforts. It lacked the detailed field baseline information and correlations that this report now provides.
Background. The world population is expanding rapidly, with corresponding increased pressures on the food supply and the environment. Competition for water is becoming critical, and environmental degradation related to water usage is serious. Nevertheless, most recent Staff Appraisal Reports of Bank financed irrigation projects almost never refer to the degree of water delivery service that is provided by irrigation projects. Reports focus on the external inputs and outputs and rarely discuss the internal workings of irrigation projects. Yet, we know that typical irrigation efficiencies are in the 25-35% range, most projects fail to collect fees from farmers sufficient to cover Operation and Maintenance costs, and there is a potential for higher crop yields. There is a clear and critical need to redirect some policies with irrigation project investments.
The basic questions addressed by this research were: 1. What levels of water delivery service are presently provided by irrigation projects
having some aspects of modernization? 2. What hardware and software features impact those levels of service? 3. Do modern water control and management practices in irrigation make a positive
difference in performance? [Note: The answer is a definite “yes”]. 4. What universal lessons can be learned and applied?
Procedure Investigators visited 16 irrigation projects in 10 developing countries, 15 of which have been partially modernized in some aspects of hardware and/or management. The projects were selected to represent a variety of climates, soils, design concepts, and water supply conditions. It was difficult to find a good selection of irrigation projects that had significant modernization components. The lack of any completely modernized irrigation projects highlighted the need for this study.
Executive Summary Page 1

Page 16 of 276
Three tools were utilized to systematically collect data and to characterize each irrigation project. The tools were: 1. A Rapid Appraisal Process (RAP). The use of a RAP is a relatively new concept and
this project developed a customized RAP. The RAP contrasts with traditional research techniques that collect data over a year of more. The RAP requires a well-trained evaluator, and in this project utilized a questionnaire with over 700 questions that were answered based on observations, interview results, and readily available data. The RAP required about a one-week visit of the project, and incorporated some background data provided in advance by the irrigation project staff. When combined with the next two tools, the RAP proved very successful. It is highly recommended as a technique to evaluate the operation and design of an irrigation project with the intent of providing recommendations for improvement.
2. External performance indicators. These indicators characterize the inputs and outputs of irrigation projects, including water, yield, and economics. Existing IWMI indicators were evaluated, and new indicators were developed to help standardize irrigation project performance. Important contributions of this research in this area were: a. Confidence intervals were provided for the various external performance indicator
values. Previously published reports do not adequately recognize the uncertainties, which always exist in data.
b. Recommendations were made for the improvement of various external performance indicators, thereby minimizing inconsistencies and errors.
c. It was concluded that external performance indicators are useful for comparing conditions before and after changes within a project. In general, they cannot be used to compare one project against another to determine whether an investment in one project is or was worthwhile.
3. Internal process indicators. Thirty-one primary indicators were developed and quantified for each irrigation project, as well as 3-4 sub-indicators for each primary indicator. These indicators characterize the internal workings and type of water delivery service provided by an irrigation project. They provide a new evaluation tool; when implemented worldwide they will serve as a valuable training and diagnostic tool for modifying the internal hardware and operation of irrigation projects.
Key indicators were graphed and discussed in the report. It was never anticipated that the data would lend itself to detailed statistical analysis because there was no ability to vary one factor while keeping all other factors constant. Nevertheless, some pairs of data with high (r>0.7) Pearson Correlation Coefficients provided some interesting discussions.
Findings. The report has dozens of important observations and conclusions that are important for engineers, managers, and lending agencies alike. It provides numerous details about proper and improper design and operation of physical features such turnouts, check structures, and canals. Similar details are provided about water user organizations,
Executive Summary Page 2

Page 17 of 276
employee motivation, establishing priorities, investment, etc. Only a few of the details will be listed here.
Positive Findings. A number of findings were very positive, including: 1. Hardware modernization can drastically improve the ease of system operation and the
degree of water delivery service provided, which influences whether a strong water user association can exist. Conversely, without some key design features (such as sufficient density of turnouts) to provide good water delivery service, it is unlikely that water user associations can be sustainable.
2. Anarchy was largely absent in the projects with modernization aspects. This contrasts with traditional irrigation projects.
3. Water user associations which were managed and operated in a business style, which had sufficient enabling legislation and law enforcement support, and which were physically capable (because of good physical infrastructure) of providing good water delivery service, were collecting close to 100% of their O&M fees. These were predominately located in Latin America.
4. Several projects have very motivated lower-level staff having good communications and mobility. These field staff spent the majority of the time in the field working on operations (as opposed to collecting statistical data or working in the office), and could resolve conflicts rapidly (within a few hours). Farmers in these projects were largely satisfied with the level of service provided.
5. Very large projects such as Dantiwada (India) can be operated reasonably well once the managers understand the concept of dividing a project into manageable layers where each hydraulic layer is responsible for providing a specified level of service to the downstream layer (e.g., a secondary canal services the tertiary canals).
6. It is possible to have relatively simple operation yet provide very flexible water delivery service to the farmer – if the hydraulic design is appropriate. An example is areas of Office du Niger, where farmers receive water almost “on demand”.
7. In 11 of the 16 projects, the stated (by project managers) levels of water delivery service throughout the project were similar to the actual levels of water delivery. In these 11 projects, the staff was typically eager to learn how to improve their operations and design.
8. In almost every project that was visited, there were a number of very simple operation or design changes which could be made that could have a significant beneficial impact on the level of water delivery service.
9. Most of the design and operation solutions to improving water delivery service, even those requiring substantial time and capital investment, are relatively simple in nature. This does not mean that institutional problems are simple to correct, but it does mean that a significant percentage of the constraints for successful irrigation projects can be removed with relatively simple solutions that are well within our grasp. Most people just are not aware of these solutions or how to select them and put them together for a total plan.
10. There is excellent and realistic potential for improvement of water management and crop yields.
Executive Summary Page 3

Page 18 of 276
Negative Findings. A number of findings were negative, including: 1. Very little modernization has been accomplished in irrigation projects. It was
challenging to find good examples of modernization to visit, and the selected projects typically only had a few components of modernization. None of the projects were completely modernized.
2. There is a very low level of awareness by project personnel and consultants about the details of designing irrigation systems so that they are easy to operate and so that they can provide good water delivery service. This means that most attempts at “modernization” are inappropriate and doomed to failure. It also means that we cannot expect newly funded irrigation projects to achieve great performance unless something is done to address this lack of knowledge.
3. Although farmers were generally satisfied with the level of water delivery service they receive, they are basing this opinion on prior experiences with extremely poor water delivery service and very simplistic needs of crude, traditional field irrigation methods. The present level of water delivery service in almost all of the projects is incapable of supporting modern field irrigation management and methods.
4. Project irrigation efficiencies are generally quite low (in the 20-30% range). 5. Many consultants and engineers are using computers incorrectly. In the process, they
are wasting limited time and financial resources, and are giving “modernization” a poor reputation.
6. The projects with the poorest water delivery service and the greatest mismatch between stated and actual service are those with upper management who think they are doing a great job. These managers also seem to lack a strong thirst for outside knowledge.
7. It is common for people to misunderstand modernization as consisting of simple actions such as lining canals, establishing water user organizations, and experimenting with computer programs, rather than as a whole new integrated thought/design/operation process which targets good water delivery service and good water management throughout a project. For example, water user organizations which do not receive a manageable water supply are likely to be ineffective.
Key Observations. Many observations do not qualify as either “negative” or “positive”. Some of the more important observations of this nature were: 1. Modernization cannot be done with only hardware or management changes.
Modernization needs were split between hardware, management, and a combination of the two. In this case, “management” includes institutional factors.
2. Overall, there is a lack of understanding of modernization strategies, even if there is a good understanding of individual modernization actions (e.g., how to install a specific type of gate).
3. The “devil is in the details.” Irrigation project design and management are very complex, and each project has different constraints. Designers and institutional reformers must have a very comprehensive understanding of options in order to make the proper choices for modernization. Irrigation project planning is much more complex than road or port planning, for example. Excellent and substantial training programs are needed immediately to develop a large cadre of experts who understand the details and how they fit into a total modernization program.
Executive Summary Page 4

Page 19 of 276
4. There is absolutely no point in discussing modern irrigation scheduling, soil moisture measurement devices, and water measurement with farmers who receive water on a rotation basis (such as the rigid warabundi schedule), or if the farmer does not have the ability to modify the duration of the water delivery. The reason is simple; the farmer has no control over the topics being discussed. In other words, unless the field water is available on a "demand" or true "arranged" schedule, these principles do not apply.
5. In order to have both a good field-level water delivery service (equity, flexibility, and reliability) and a high project level irrigation efficiency (i.e., minimal spills and good on-farm irrigation efficiency), a project must have been modernized in both operation and design. It is sometimes possible to obtain good field-level water delivery service or a high project-level irrigation efficiency without a complete and appropriate modernization program. For example, Beni Amir in Tadla, Morocco (which has some modernization components but has not undergone comprehensive modernization) has a high efficiency but suffers from inflexible water delivery service. Parts of Office du Niger in Mali provide water to farmers almost “on demand” because of modernization of certain parts of the project, yet the overall project has not been modernized with a recirculation system which would be required to have a high project irrigation efficiency.
Summary
1. The visited irrigation projects with even a partial modernization program and motivated personnel have almost eliminated anarchy and are often well on the way to being self-sufficient from an O&M standpoint.
2. There are very few true modernization programs in irrigation projects, and generally they only have a few modernization components.
3. Even the partially modernized irrigation projects that were visited are incapable of supporting modern field irrigation systems and management that are available today and which will certainly be needed in the 21st century.
4. There is an immediate need for a major and pragmatic training in the concepts and details of modernization.
5. Irrigation project modernization requires a long-term commitment to training, O&M expenditures, and fine-tuning.
6. Most policy and institutional reforms cannot be fully implemented without the right physical environment. Application of volumetric water charges and quotas, implementation of water rights and active water markets, and demand management are reform tools which require confidence from the users in the water delivery service, and proper water control to provide that service.
Executive Summary Page 5

Page 20 of 276
Chapter 1 - Introduction
Background Agricultural irrigation utilizes some 80 to 90 percent of diverted water in developing countries. The World Bank, other development banks, and numerous countries have invested in large irrigation projects. There have been conflicting opinions about the wisdom of investing further in new irrigation projects, primarily due to questions about the performance of existing projects. Those who believe that further investment in irrigation projects is needed, whether it is for new projects, rehabilitation, or modernization, often have differing perceptions of how the investment funds should be spent.
Describing and quantifying the performance of irrigation projects is a relatively new idea if one goes beyond simplistic indicators, such as the total tons of grain produced with and without irrigation. This report pays considerable attention to the topic of describing irrigation project performance. To introduce the topic, it is sufficient to say that one single indicator, or even a small handful of indicators, cannot adequately meet the needs of all groups interested in irrigation projects. A river environmental specialist may be primarily interested in maintaining river flows and in preventing the degradation of return flows. A sociologist may have a strong interest in the level of social anarchy (or lack of it). An economist may be interested in the economic return on the Bank investment, while an agronomist may focus on the yield per hectare, and so on.
This research project was commissioned to answer a very fundamental question: Do modern water control and management practices in irrigation make a positive difference? Throughout this report, the reader will discover that the answer is a definite "yes".
In addition to the fundamental question addressed by this research is: Is it important to make a positive difference? Again, the answer is a very basic and resounding "yes". Irrigation projects have a large impact on the world food supply, country economies, and the environment - all of which can be quite fragile. Developing countries are experiencing high rates of population, urban, and income growth which is putting tremendous pressure on available water supplies. At the same time, growing populations make it necessary to ensure that crop yields continue to rise. Some predictions indicate a rise in world population from 5 billion in 1998 to 8 billion in 2020. Therefore, developing countries must find ways to grow more food with the same or less water consumption. There are three principal ways to do this:
• Improve water use efficiency (yield/water consumed); • Reduce water quality degradation; and • Reduce return flows into saline sinks
All three options require better on-farm water management, which depends upon improved quality and reliability of water delivery service to the field. One could logically assume that new and/or rehabilitation irrigation projects are designed and funded with the goals of improved water delivery service in mind. Because irrigation
Chapter 1 - Introduction Page 1

Page 21 of 276
projects are resource (capital, water, etc.) intensive, a second logical assumption is that project design and operation manuals should clearly define the service goals and should have clear guidelines as to how various project features will help to achieve the goals. Neither assumption matches reality.
In a parallel study of the strategy of Bank financed irrigation projects, none of the reviewers have been able to find any information about the quality of service with or without new Bank financed irrigation projects in the Bank Staff Appraisal Reports (SARs). Very few irrigation projects even have a modernization component. One regional exception is in western Africa, where projects in the Office du Niger and three very small projects in Niger, Senegal, and Madagascar address modernization.
Furthermore, there is no baseline information (indexes of reliability, timeliness, and flexibility) regarding levels of service to farmers and the factors which affect that service. One would expect that establishing baseline information regarding levels of service, determining standards, and then determining how to meet them, would be crucial for improving the design, upgrading, and management of irrigation projects.
This research project was funded to fill a major gap in Bank work by addressing these and other points related to irrigation project performance. The World Bank's Department of Agriculture and Natural Resources, in collaboration with the International Program for Technology Research in Irrigation and Drainage (IPTRID/AGR) and the International Water Management Institute (IWMI) received funding for this study from the World Bank research committee. Charles Burt and Stuart Styles of the Irrigation Training and Research Center (ITRC) at California Polytechnic State University, San Luis Obispo (Cal Poly), were the primary investigators.
Research Objectives This project performed a rapid appraisal of 16 irrigation projects (described later) in 10 different developing countries. The stated objectives of the research were threefold:
1. Documentation of baseline data, including a. Physical and institutional constraints. These can impact the effectiveness of the
hardware and management used in the project. b. Hardware and management factors which influence the quality of water delivery
service and conveyance manageability. c. The level of water delivery service which is declared and provided at various
layers in the system. d. Results such as cropping intensity. e. Symptoms resulting from chaos and management problems. Chaos is defined in
this project as a difference between declared levels of service and delivered service levels. (Perry, 1995)
2. Observations and Correlations. Relationships between the five preceding documented categories were to be examined.
Chapter 1 - Introduction Page 2

Page 22 of 276
3. Findings. The research was to develop a systematic method of project appraisal which will provide transferable information about conveyance manageability and levels of service, as well as the factors affecting them.
This research builds upon previous work presented in the World Bank Technical Paper No. 246 (Plusquellec et al., 1994). That publication, Modern Water Control in Irrigation, provided a conceptual framework for the concepts, issues, and applications of irrigation modernization efforts. It lacked the detailed field baseline information and correlations which this report now provides.
Project Appraisals A key item addressed by this research is the development of appropriate procedures to evaluate irrigation projects before and after investment. Appraisals (evaluations) of irrigation projects often only look at the "big picture", as illustrated in Figure 1-1, without examining internal processes. The "In" may include dollars, water, labor, fertilizer, etc. The "Out" may include dollars, water, tons of rice, etc.
In Out
Figure 1-1. The "big picture" view of irrigation projects (also known as the "black box" approach).
Conceptually, the approach of Figure 1-1 is simple - does an irrigation project pay for itself, or doesn't it? But the use of Figure 1-1 to analyze and explain irrigation project performance should be considered the "black box" approach. It gives no information about the internal processes which affect the output, and provides no solid basis for determining what internal factors must be modified to improve output. Figure 1-1 is also inadequately simplistic to address environmental issues associated with irrigation projects, which can be strongly dependent on internal processes.
Irrigation projects are very complex, and might be compared to a human body as illustrated in Table 1-1. Numerous factors affect output.
Chapter 1 - Introduction Page 3

Page 23 of 276
Table 1-1. Comparison of irrigation projects with a complex human body. Human Body Irrigation Project Equivalents
Output Work or Movement Crop Yields, Financial Self-Sufficiency
External factors influencing output
Heredity Topography, Soils
Surrounding Environment, Background
Rainfall patterns, crop prices, national water rights policies
Internal factors influencing output
Training, conditioning, diet Physical infrastructure design, operation rules, management
Figure 1-2 shows some of the major inter-relationships which affect outputs from irrigation projects. "Results" are easy to confuse with "causes" and "symptoms"; indeed, in some cases the relationships can be switched. It may be thought that strong water user associations (WUAs) will eliminate most, if not all, of the myriad of problems in irrigation projects. However, Figure 1-2 shows strong WUAs as a result, not as a cause. Figure 1-2 shows that numerous factors will impact project outputs, and the strength of a WUA is dependent on both institutional and water delivery service factors.
A classic scenario for the existence of a weak WUA is one in which the irrigation project authorities expect the WUA to collect water fees, distribute water, and maintain a water distribution network - yet the WUA has little or no say in how the fees are spent, and the water arrives at the WUA area in an undependable manner (i.e., poor water delivery service). In this scenario, the weak WUA is a symptom, not a cause, of poor water delivery service.
A secondary objective of this project was to develop a rapid appraisal process which would examine the factors in Figure 1-2. This rapid appraisal process is described in more detail in the methodology section below, and in subsequent chapters.
Chapter 1 - Introduction Page 4

Page 24 of 276
RESULTS • Cropping Intensity
• Average Crop Yields (Ton/Ha)
• Yield/Unit of Water Consumed
• Downstream Environmental Impacts
SYMPTOMS • % Collection of Water Fees
• Viability of Water User Associations
• Condition of Structures and Canals
• Water Theft
SERVICE • Actual Level and Quality of Service Delivered
- To Fields
- From One Level of Canal to Another
FACTORS INFLUENCING SERVICE QUALITY
Hardware Design Management
• Turnout Design • Instructions for Operating Check
• Check Structure Design Structures
• Flow Rate Measurement • Frequency of Communication
• Communications System • Maintenance Schedules
• Remote Monitoring • Understanding of the Service Concept
• Availability of Spill Sites • Frequency of Making Flow Changes
• Flow Rate Control Structures • Quality and Types of Training Programs
• Regulating Reservoir Sites • Monitoring and Evaluation by
• Density of Turnouts Successive Levels of Management
• Existence of Performance Objectives
CONSTRAINTS
Physical Constraints Institutional Constraints • Dependability of Water Supply • Adequacy of Budget
• Adequacy of Water Supply • Size of Water User Association
• Availability of Groundwater • Existence of and Type of Law
• Climate Enforcement
• Silt Load in the Water • Purpose and Organizational Structure
• Geometric Pattern of Fields of WUA
• Size of Fields • Destination of Budget
• Quality of Seed Varieties • Method of Collecting and Assessing
• Field Conditions Water Fees
- Land Leveling • Ownership of Water and Facilities
- Appropriate Irrigation Method • Ability to Fire Inept Employees
for the Soil Type • Staffing Policies, Salaries
• Availability of Farm Credit
• Crop prices
Figure 1-2. Factors affecting output (results) and symptoms from irrigation projects.
Internal process indicators and external performance indicators were developed for the 16 irrigation projects which were evaluated. The development of the internal process indicators and some external performance indicators was based on standards of the principal authors. They have extensive experience in irrigation modernization programs a key factor to understand when examining the standards. To illustrate this point, one might consider 3 different perspectives of irrigation performance:
Chapter 1 - Introduction Page 5

Page 25 of 276
• The traditional farmer with a traditional (and typically inefficient) method of field irrigation.
• The traditional engineer and economist, who look at present inputs and outputs.
• Persons with a vision of how irrigation systems will need to perform when there are 3 billion more people on this earth by the year 2020, resulting in increased competition for water from the urban and environmental sectors.
The traditional farmer with no knowledge of advanced irrigation methods, nor knowledge of the pressures on the total water supply, will have a completely different perception of "satisfactory service" than the visionary. The traditional project operation engineer may be so immersed in the daily struggles of administration and avoiding major spills that he may consider anything that works with a minimum of personal (to himself) hassle to be "satisfactory".
Methodology The steps for gathering data and the initial data organization are shown in Table 1-2. At first glance, the methodology described in Table 1-2 is typical of any similar research project. However, there are significant differences between this methodology and the ones used in prior international irrigation project research.
Table 1-2. Project tasks. Task Comments
Develop initial draft of internal process indicators and external indicators Develop data collection forms About 600 questions were developed. Beta tests
were conducted in Mexicali, Mexico and Lam Pao, Thailand.
Selection of projects Contact local irrigation specialists and the projects Where possible, local irrigation experts were
involved in organizing preliminary data prior to the visit, and assisted in arranging the visit.
Project visits Compute indicators The computation of external indicators was very
time consuming. Write up project descriptions
A fundamental feature of this research is that it relied upon a Rapid Appraisal Process (RAP) which only required a 3-5 day visit to any single irrigation project. The data and results contained within this report demonstrate that a RAP, if developed and conducted properly, is a valuable diagnostic tool. A more detailed description of the RAP is found in the next chapter.
Develop internal process indicators and external indicators. The details of this step are covered in Chapter 6. The computation of internal process indicators requires
Chapter 1 - Introduction Page 6

Page 26 of 276
information listed in the "Constraints", "Factors Influencing Service Quality", "Service", and "Symptoms" sections of Figure 1-2. External indicators require some of the information contained under "Physical Constraints" (water supply, climate) and "Results".
Develop data collection forms. The questionnaire can be found in Attachment A. It contains approximately 600 questions, and was designed to collect information in the following categories:
1. Typical baseline data, such as: a. Total area served b. Budgets c. Climate d. Crop areas and yields e. Water supply f. Number and size of water user associations g. Total length of canals and pipelines h. Field sizes This type of information is standard data collected in irrigation project evaluations, with perhaps some extra attention paid to certain details in this research project.
2. Non-typical data, such as: a. Various institutional constraints
* Methods of collecting and assessing water fees * Existence and type of law enforcement (as related to water conflicts) * Strength of WUAs * Wages of operators as compared to typical laborers * Organizational charts of management, employee, and farmer responsibilities
b. The physical infrastructure for moving and controlling water flow rates and depths * Designs of turnouts and check structures * Number and locations of spill sites * Canal capacities * Flow rate measurement and control structures * Communication system * Density of turnouts
c. The operation of physical infrastructure * Frequency of communications * Promptness of repairs * Instructions for operating check structures * Frequency of checking and adjusting flows and water levels * Number of farmers who must cooperate in the final distribution of water * Water travel time through the system
d. Service of water delivery at all levels throughout the system, including * Service to the main canal from the reservoir or river
- Reliability. Does it come when guaranteed and at the proper flow rate?
Chapter 1 - Introduction Page 7

Page 27 of 276
- Consistency. Does the assigned flow rate stay constant for the period of time it is supposed to remain constant?
- Flexibility. Is the flow the right frequency, rate, and duration? - Accuracy. Are the flow rates and/or volumes known?
* Main canal service to secondary canals * Secondary canals service to tertiary canals * Service to the point where control is turned over to farmers * Service to individual fields
Contact local irrigation specialists and the projects. Some typical baseline data requires several weeks to organize. In some cases, good typical baseline data is simply not available, no matter how much time is spent looking for it. A Rapid Appraisal Process (RAP) is most efficient if the typical baseline data is organized prior to the visit. The gathering of typical data requires cooperative project staff and government agencies. It also requires an individual who is both knowledgeable in irrigation and skilled in obtaining information from the project and agencies. The gathering of typical data organization does not require unusual skills for the synthesis or analysis of the data. A request list of typical data was prepared (see Attachment B) and sent to each project prior to the site visits - allowing for sufficient time to collect the typical data.
Whenever possible, a local irrigation expert was included in the research process at this initial step. The local expert participation was intended to increase local awareness and capacity. In some cases, the local irrigation expert worked with the irrigation project staff to collect typical baseline data prior to the RAP. In other cases, the local irrigation expert only participated in the RAP. For example, in the Rio Mayo project in Mexico, the irrigation project staff was able to organize all of the data, but an irrigation specialist from the Mexico Institute of Water Technology (IMTA) in Cuernavaca participated in the RAP itself.
Project visits. A typical visit took the following form: 1. One of the ITRC authors would arrive at the project on Day 1. In some cases, he was
accompanied by a local irrigation expert and/or a representative of IWMI. In other instances, he would arrive alone.
2. A half-day was spent at the project offices examining the typical baseline data which had been collected in advance by the project authorities or local irrigation expert. At this time, gaps in the data were noted and project authorities requested their staff to provide specific information. The gaps were generally due to a misunderstanding of details in the request for information which had been sent to the irrigation project prior to the visit of the ITRC author.
3. A half-day was spent at the project offices becoming more familiar with the general project layout and in interviews with various staff members to answer other parts of the questionnaire.
Chapter 1 - Introduction Page 8

Page 28 of 276
4. Two - three days were spent traveling down the canal system. The goal was to drive from the water source, down the complete length of the main canal. Information was obtained about the release of water into the main canal. During the trip down the main canal, the design and operation of each structure along the length of the main canal was noted. Operators and supervisors on this level were interviewed. Every attempt was made to talk to individual operators and supervisors, rather than receive answers from the project office personnel (who generally accompanied the authors on this trip). This was not always easy; in projects with the lowest performance, the office personnel tended to try to answer all questions. However, the field staff typically had different answers. In many projects the gate and turnout operators had field books in which they recorded such items as cross regulator position, water levels, or flow rates. These books were an excellent source of information and often illustrated differences between the stated service and the actual service.
Once the main canal design and operation was understood, the focus shifted toward the secondary canals. The process of the main canal was repeated. Structure designs, operation procedures, and controllability issues were addressed for each structure along a single secondary canal. Several secondary canals were visited. Following this, the same procedure was followed on the next "layer" or level of canals. Eventually, the path led to the point at which the operation was handed over to farmers, and finally down to individual farms.
5. A half-day to one day was spent talking with farmers and water user associations. Short conversations with individual farmers occurred throughout the travels along the various layers of the water distribution network. Again, every attempt was made to have spontaneous conversations with farmers, as opposed to conversations with farmers who had been selected by the project authorities. Farmers from the head and tail sections of the network were sought out.
If water user associations (WUAs) existed, short meetings with several WUAs were typically organized. These meetings served to answer questions about water rates, budgets, and responsibilities of the WUAs. The meetings also served as forums to ask questions about the quality of water delivery service to the fields.
Computation of indicators. This will be discussed in more detail in the chapter dealing with indicators. The Internal Process Indicators were computed rapidly. The External Indicators required the most amount of time to compute - typically 3-4 days/project.
Written project summaries. In the original scope of work it was not envisioned that a report would be written for each individual project. However, the authors found that by writing the individual project summaries, many ideas could be organized. The 16 project summaries can be found in a separate report titled “Project Summary Reports”.
Chapter 1 - Introduction Page 9

Page 29 of 276
Results The contributions (results) of this research are:
1. A Rapid Appraisal Process (RAP). This was developed and proven to provide a uniform and comprehensive field data in irrigation projects for developing countries.
2. A set of Internal Process Indicators. The indicators and corresponding rating scales were developed to evaluate the internal workings of irrigation projects. The indicators also assess the ease with which existing irrigation projects will be able to provide the levels of water delivery service needed by the field irrigation technologies 30 years from now.
3. External performance indicators, both established by IWMI and ITRC, and newly developed ones.
4. Correlations between data and indicators, and between various types of field data.
5. The introduction of the use of confidence intervals in describing irrigation project data and indicators.
6. Discussion of various observations
7. Lessons learned, which can be applied to other projects.
8. Recommendations for the Bank and other agencies which invest in new irrigation projects and irrigation project modernization.
Chapter 1 - Introduction Page 10

Page 30 of 276
Chapter 2 - Rapid Appraisal Process (RAP)
This research project used a Rapid Appraisal Process (RAP) - a technique which has rarely been used in the diagnosis of international irrigation projects. The following points explain the rationale behind using the RAP for this particular research project:
1. Traditional applied and basic research projects tend to examine portions of a project, whether they be the development of water user associations (WUAs) or the fluctuation of flow rates in a single canal lateral. Those research projects typically require the collection of substantial field data over extended periods of time. Most IWMI projects have been of this nature, and they provide valuable detailed information about parts of a process.
The time and budgetary requirements of such standard research procedures are significant -Kloezen and Garcés-Restrepo (1998) state that "three engineers worked full-time for more than a year to collect primary data and make measurements to apply process indicators at the level of selected canals and fields" for just one project. Furthermore, they state that "In addition, the work in Salvatierra was supported by an M.Sc. student...In addition, much time was spent on visiting the selected field and taking several flow measurements per field, per irrigation... Five more months were spent on entering, cleaning, and processing data."
The budget for this research project, which included 16 different irrigation projects in 10 countries, was clearly insufficient for the level of effort described by IWMI's Kloezen and Garcés-Restrepo. But a small budget does not, by itself, provide a logical justification for a RAP. The RAP must also give credible results. This point is addressed in the next items.
2. There are many types of research projects. This particular research project falls under the "diagnostic research" category, which by its nature is often (not always) fairly quick and is recommendation-oriented. For over 15 years, Cal Poly ITRC has promoted the use of the RAP for diagnosing certain aspects of farm irrigation performance (Burt et al., 1995). ITRC has developed rapid evaluation procedures which require 1-2 person days of time to perform an evaluation and provide results and recommendations. ITRC farm irrigation evaluation techniques have been widely adopted by consultants, government agencies, and farmers. The use of these specific RAPs has provided a quick diagnosis which helps farmers while also building a database of farm irrigation performance throughout California. The RAPs address a carefully targeted set of irrigation parameters; others can only be addressed with more long term, traditional irrigation research techniques.
An essential ingredient of the successful application of these RAPs is adequate training of the evaluators. Even though the ITRC farm irrigation data collection procedures have been standardized and are quite simple, experience has shown that successful RAP programs require (i) evaluators with prior training in irrigation, (ii) specific training in the RAP techniques, and (iii) follow-up support and critique when the evaluators begin their field work.
Chapter 2 - Rapid Appraisal Process Page 1

Page 31 of 276
3. Following up on point 2, the two principal authors personally conducted all of the site visits. The principal authors have both been intensively involved in the farm irrigation RAPs (described in point 2) and irrigation project RAPs (described later). This research project would have been unsuccessful if the questionnaire had merely been mailed to local irrigation experts to fill out. Evaluators must understand the logic behind all the questions, and must learn how to go beyond the obvious when obtaining data. To ensure similar answers to the questionnaires and computations of the various indicators in this research study, the two principal authors jointly evaluated the Lam Pao irrigation project in Thailand before separating and subsequently visiting the other irrigation projects with only one author/project.
4. Typical baseline data, as described earlier, is either available or it is not. Individual irrigation projects have differences in the ease of access to typical baseline data on the command area, weather, water supply, etc. In some projects the data can be gathered in a day; in others it may take weeks. Usually the delays in data organization are due to simply finding the time to pull the data out of files and organizing it.
The authors found that in most instances, the local expert or irrigation project authorities were able to organize about 70% (rough estimate) of the information in advance. Another 20% of the information was easily available once the authors arrived on site. The last 10% of the information may not have been available, but it was generally not crucial for the purposes of this research project. Whenever possible, the authors cross-examined (politely) the project authorities and the data to detect discrepancies and to understand why such discrepancies existed.
A key point is this: If the data does not already exist, spending an additional 3 months on the site will not create the data. Therefore, the RAP appeared to assign the appropriate amount of time to the collection of baseline data.
5. Using a RAP for diagnosing irrigation projects is not new. Plusquellec (1996) has promoted the idea for several years based upon his experiences. ITRC has used RAP techniques for several years while working with irrigation projects throughout the western U.S. (Burt et al., 1996). In some cases, ITRC has used the RAP process for determining baseline data and statistical purposes, but in most cases ITRC is hired to make a system diagnosis for modernization. In those cases, the RAP process is informal - no specific data form is used.
Many of the water delivery control and service problems seen in developing countries can also be found in U.S. irrigation districts. The differences between U.S. and developing country projects are significant enough that a different set of questionnaires and performance indicators is warranted for irrigation projects in developing countries. ITRC's experience with dozens of U.S. irrigation districts (plus experience with irrigation projects in developing countries), gave the authors a high degree of confidence in the RAP for this project. The informal RAP process used by the authors in the U.S. was relatively easy to adapt into a suitable data collection format for this research project.
Chapter 2 - Rapid Appraisal Process Page 2

Page 32 of 276
6. A quick, focused examination of irrigation projects can sometimes give more accurate and pragmatic big picture results than what one would obtain using traditional research techniques. While describing ITRC farm irrigation evaluation techniques, point #2 notes that "The RAPs address a carefully targeted set of irrigation parameters; others can only be addressed with more long term, traditional irrigation research techniques."
Prior to ITRC RAPs, farm irrigation evaluations were lengthy and expensive, and often examined a few items so thoroughly that the big picture was overlooked. The computed values of farm irrigation performance indicators (distribution uniformity, application efficiency) were typically incorrect because some of the essential items which should have been included in the computations were left out (Burt et al., 1997). RAPs do require a very focused data collection effort to ensure that unnecessary data will not be collected, and that the minimum of pertinent data will be gathered to produce a reasonably accurate result.
The question of what is "reasonably accurate" can be debated. Confidence intervals (described later in more detail) should be assigned to most data - reflecting the reality that we always have uncertainties in our data and computation techniques. In irrigation matters, one is typically concerned about 5-10% accuracy, not 0.5-1% accuracy ranges (Clemmens and Burt, 1997). The problems are typically so gross and clear that it is unnecessary to strive for extreme accuracy when one wants to diagnose an irrigation project. Furthermore, (i) projects typically have such unique sets of characteristics that the results from a very detailed study of just a few items on one project may have limited transferability to other projects, and (ii) even with very sophisticated and detailed research, it is difficult to achieve better than about 5-10% accuracy on some key values such as crop evapotranspiration of irrigation water.
7. For this particular research project, most of the non-typical data was easy to collect and organize. When one travels down and through a canal network, talking to operators and farmers, many aspects of engineering and operation become very apparent. This research project was designed to utilize this simple information rather than requiring time-intensive and equipment-intensive studies of other variables.
Economic data are major components for computations of some of the IWMI Indicators. The experience of this research project showed that a RAP is not suitable for the collection of some economic data. Data such as the overall cost of a project in today's dollars, per capita income, and the size of typical farm management units were not readily available in most projects. Therefore, the economic indicators in this report are typically the weakest. Nevertheless, there are generally some general trends which appear even in these uncertain indicators.
If properly designed and executed with qualified personnel, the RAP can quickly provide valuable insight into many aspects of irrigation project design and operations. In this research project, the RAP successfully allowed the authors to discern the major differences between the various projects, to characterize the projects, and to develop a long list of "lessons learned". The authors expect that the RAP will become a widely used diagnostic tool in the future.
Chapter 2 - Rapid Appraisal Process Page 3

Page 33 of 276
Chapter 3 - Project Selection
This research project was designed to examine the impact of modern water control and management on performance. The term "modern water control and management" can cover numerous aspects of management, operation, and hardware - as well as thought processes that are radically different from those usually used by designers and managers (Plusquellec et al., 1994).
"Modern water control and management practices" do not necessarily imply that there has been a deliberate "modernization" process. Some older irrigation projects contain "modern" features which are only now being implemented in "modernization" efforts on other projects. Because there are so many possible aspects of modern hardware, modern management, and modernization, and because each irrigation project has a unique set of constraints, the combinations of "modern" components of individual irrigation projects tend to be unique. No attempt was made in the project selection to find projects with a specific combination of modern components. The Dez (Iran) project was selected in part because it had an older design "typical" of the US Bureau of Reclamation which might be considered "modern" when compared against some other developing country projects - even though Dez had no "modernization" program in place. As such, it was felt that Dez would be valuable for comparison against Guilan and other projects. The one aspect of operation that was unique at Dez was the large farmers using regulating reservoirs. The Bhakra project in India was recommended by Indian authorities as the best northern India project, but virtually no modern hardware or practices were evident during the visit.
During the selection process very little detailed information was readily available for many of the individual irrigation projects. There was no attempt during the selection process to only select projects which were known to be very successful. Instead, the over-riding criterion was that an aspect of modernization had been attempted. Because so little was known about the internal operations of most of the selected irrigation projects, the authors were very curious to learn whether or not these irrigation projects suffered from the chaos and anarchy that has been documented in so many traditional irrigation projects. As can be seen by reading the individual project descriptions, some of the modernization efforts were very successful, while others were less so. Interestingly, there was very little chaos or anarchy in most of the projects that were visited - which appears to present a breath of fresh air in the review of irrigation projects.
One of the original criteria was that the projects have no groundwater use. It was thought that these criteria would make projects more comparable. Two of the projects did have informal or formal conjunctive use of surface and groundwater supplies - indicating the difficulties of finding simple baseline data on existing projects.
Typical baseline data was necessary to compute various IWMI indicators, such as Relative Irrigation Supply (RIS) and Relative Water Supply (RWS) - as described in a later chapter. One of the selection criteria was that there was a good probability that the typical baseline data (water supply by month, estimates of crop evapotranspiration, areas of various crops, etc.) necessary to compute these indicators was available. If that information was not available, it would have taken
Chapter 3 - Project Selection Page 1

Page 34 of 276
months or years to develop a data collection effort to obtain it - an effort which was clearly beyond this project's resources.
In the proposal stage, there was a question of whether or not 16 projects were enough to provide any meaningful conclusions. The wide range of results indicates that 16 irrigation projects were ample for this level of study. The projects have provided large variations in typical baseline data and of internal process indicators and external indicators. Of the 16 projects selected, one (Bhakra in India) had no significant modernization aspects, and 2 (Lam Pao in Thailand and Cupatitzio in Mexico) would not be categorized as "good" examples of modernization projects. All other projects had their pluses or minuses, but the overall impression by the principal authors, after making the visits, was one of optimism.
The proposal for this research project did not include a rigid statistical analysis of all of the data, although certain statistical correlations were developed. Many types of statistical analysis need a control and numerous trials of a single variable, with all other variables remaining constant. This was clearly impossible for this type of research project - and for most types of irrigation project analysis. Rather than look for 16 irrigation projects which were all similar except for one or two modernization components, this research project selected 16 irrigation projects with a wide range of climate, topography, institutional, and engineering conditions. Projects were deliberately selected in Latin America, Africa, the Middle East, India, and Southeast Asia to provide a wide spectrum of conditions. It was hoped that some lessons learned would be applicable over the whole range of conditions, and that other lessons could be clearly distinguished as being applicable to a specific subset of those conditions.
Final project selection was sometimes done by the host country. For example, the Ministry of Agriculture in Morocco recommended the Beni Amir portion of the Tadla project, although Beni Amir is not a "typical" project in Morocco. The Department of Irrigation in 3 states of India selected the 3 Indian projects.
In two projects, Office du Niger (Mali) and Majalgaon (India), only the areas with modernization were examined. The remaining areas of these two projects were in very poor, traditional condition. Some data regarding overall main canal operation from the total projects in these two cases was included in the reports.
Chapter 3 - Project Selection Page 2

Page 35 of 276
Table 3-1. Irrigation projects visited. Project Name Country Closest Major City
with (Region or State)
Influences on Project Selection
Lam Pao Thailand Kalasin (Khon Kaen)
World Bank project plus extensive EuroConsult modernization involvement. Thai Royal Irrig. Dept. selection.
Dez Iran Dezful (Khuzestan) World Bank project w/ U.S. consultants. Large scale agribusiness component.
Guilan Iran Rasht (Guilan) Prior Rapid Appraisal by World Bank. French design.
Seyhan Turkey Adana World Bank project. WUA transfer. Majalgaon India Parli (Aurangabad) Widely promoted as having recent French
canal modernization technology. Dantiwada India Deesa (Ahmedabad,
Gujarat) Chosen by India World Bank office, primarily because of new rotation water schedule.
Bhakra India Chandigahr (Haryana)
Chosen by India World Bank office as the best north India project to visit
Muda Malaysia Alor Setar Prior IWMI evaluation, World Bank project.
Kemubu Malaysia Kota Bharu World Bank project. Downstream control on main canals.
Beni Amir, Tadla Morocco Beni Mellal Chosen by Min. of Agric. of Morocco; some aspects of modernization with USAID support. Original French design.
Office du Niger Mali Segou World Bank, French, Dutch, and other investment in modernization.
Rio Yaqui Alto Dominican Republic Santiago Little known. Begemann gates and WUA development with USAID support.
Coello Colombia Espinal (Tolima) Prior IWMI, World Bank report. Old U.S. technology.
Saldaña Colombia Saldaña (Tolima) Prior IWMI, World Bank report. Old U.S. technology
Cupatitzio Mexico Apatzingan (Michoacan)
One of first modernized projects in Mexico. Heavy French design.
Rio Mayo Mexico Navojoa (Sonora) Little known. Self-started modernization.
Chapter 3 - Project Selection Page 3

Page 36 of 276
Chapter 4 - Irrigation Project Characteristics
Detailed descriptions of project characteristics can be found in two other locations within this report. Attachment C contains the data for the questionnaire that was filled out during each visit. Volume II of this report contains written summaries of each project.
Tables within this Chapter give the reader a quick summary of some key characteristics of each project. Table 4-1 lists typical baseline data such as the size of the project and crops. Next, is information about the main canals, followed by the submain canals (meaning those canals downstream of the main canal), and finally some data about distribution to the individual farmers. Such tables always suffer from brevity; for example, it would be rare that only one type of cross regulator or flow control device would be used in all canals downstream of the main canal.
Likewise, information about the number of farmers who must cooperate with the final distribution of water is insufficient. In the Beni Amir (Morocco), for example, 10 farmers must cooperate in the final distribution of water, but the cooperation is carefully orchestrated by the irrigation authority with a system of checks and balances. In Lam Pao (Thailand) the project authorities are not seriously involved with inter-farmer distribution of water; such cooperation between farmers is left up to small individual groups of farmers.
Perceptions of "modern" hardware and practices in any one project varied depending upon who one talked to. Conversations in the capital city sometimes led one to expect much more than one saw in the field. Likewise, the advantages of some computer programs tended to be highly touted in the office, but their actual impact on operations was sometimes negative, given the other better options for management and control which could have been pursued with the same level of energy and investment. Even more interesting was the finding that some projects had important features which had a profound positive influence on water delivery service, but the project authorities did not always recognize the importance of those features. An example was the very broad quaternary canals in Mali, which are discussed later in this report. Table 4-2 lists the perceived "modern" aspects of the various programs, from the viewpoint of irrigation project authorities, funding agencies, or published reports.
Chapter 4 - Project Description Page 1

Page 37 of 276
service area h"ear" ero intensil
net farm size hafield size hansolidalion on what %
rented land
49333'.42.20.4
oo
98500
'"5650
30o
235 OJOLoU0.3
oo
103 1350.95.63 ..
oo
11283030603
oo
=
l
"0.5
oo
683000L93.20.5
oo
9< 0002.02.0'.0
WOo
20430
"0'05
oo
28000U3005
=o~3g--~f
56 000U33
75o
~§'il=~: _~
3574U2.52.5
ow
25711
"100012.0
o85
100.050
o80
9878078295
o,
97047U
100.012.0
o
""in canals (10 high;
unit,
2n300
22500
,4200
W9700
38300
5 4125lX1 10000
38200
,8000
W6000
24500
2, 900
SUs/dOl
mfall
nce official
6RiceRice
Reservoir2.5
'595U360.16
N
7
3 1153
WheatSu '" Cane
Reservoir33
1 670
2""0.39
y
365
2163
"Rice
"'"Reservoir
Lom
U900.15
N
7500W
MaizeCotton
Reservoir'.9
, 285
'"0.33
N
2So, hum
CottonReservoirand wells
0920557740.22
y
365
764,Wheat
MustardReservoirand wells
0.9, 8936040.45
y
2 9002
RiceCotton
Reservoirand wells
0.2, 550
5450.45
y
30
2500
"RiceRice
Reservoir'.3
, 42023000.14
N
2 000
"RiceRice
River, 9
, 4002700
N
24163
WheatS. beetsReselY1Jirand wells
06U263760.30
N
"002
RiceVe
River23
2628238025
N
30
, '00,PastureTobacco
ReservoirU
19459840.15
N
600008
RiceSo. hum
River, ,1676, 306
0.18
N
75
17950]W
RicePasture
River26
153214420.18
N
365
22006
So, humLemon
Reservoir
"228067'026
N
3
400004
WheatCorn
Reservoirand wells
0.823""3230.26
N
5als,
of Main Canal
rincipaltype of crosse ulator in Main Canal
ManualSluice
ManualRadial
no
""Hyd. AMIL,
LeWManualSluice
AutomaticRadial
ManualSluice
ManualSluice
U6o
ManualOvershot
105.6o
H,oW8
lAVIS'
42@
H d LeW
288o
ManualSluice
ManualSluice
14 69o 3
Radial Radial Radial plusIus LCW with LCW LCW
ManualSluice
3 5ondition of cross reg~I~~~t~ in
X~
3
y
2
N N
2
N y
2
y
3
y
2
y N
2
N
2
N y N N N
3
N
rement (notntrance to
CANALSeHO Rated Gate
BaffleDistributor
ParshallFlume Rated Gate Flume Flume
RatedOvershot
"'"
BaffleDist and
CHO Baffle DistBaffleDist
currentmeter
RatedSec. ,
Parshall Baffle oist Flume
h of SUBMAINro·ect kmSUBMAJN Canals
e of cross re ulatorRMER
452 560 640
95 90 ""Long
CrestedManual 90% Radial, WeirSluice 10% mixed LC'Nl
255095
ManualSluice
on90
Lew
675'00
Pro portDivider, afew Weirs
2ODO
""1530 408
40 0ManualRadial
Comb in andWeir ate Sluice
24099
Lew
75o
91 22695 6
Begeman Sluicen ate
93 39o '00
LCWwithSluice Underflow
ate ates
11948
inal distribution to farmer
I~ater distribution schedule to
I~fonaldistribution of
age number offarmerslved at lowest level
unlined;fIeld-fIeld~5'
Contino ,rotationfRfI/401
Farmer
200
unlined; lined
'''"'''''ContinuouslUnknownRotation
'''"'''''Farmer
10.0
unlined,field-field150150,Contin.,knownrotation1Rl/40
Farmer
20.0
pipeline,lined
110i90,
Arran edWUAorFarmer
2.8
lined
KnownRotation
Farmer
15.0
unlined
KnownRotation
Farmer
5.0
unlined,lined I"'lRI2
KnownRotation
Farmer
""0
field-fIeld,lined
ffiflJ40lContino .
'"~rotation05fl5
Farmer
200
fieldfIeld
Contin
Farmer
200
unlined
Variablerotation
Farmer
10.0
unlined unlined unlinedKnown
Rotation,Arranged
Arran ed Arran ed I7fl/si::nWUAor
Farmer Farmer Farmer
7.0 2.8 1.1
unlinedKnown
Rotation,Arranged
""'''"WUA
25
unlined
Arran ed
Farmer
37
unlined,lined
~"
Arran ed
WUA
3.0
Table 4-1. Key project characteristics.
Chapter 4 - Project Description Page 2

Page 38 of 276
Table 4-2. Aspects of modern control or management in the irrigation projects visited, as perceived or advertised by the project personnel or some previous reviewers. Project Country Perceived aspects of modern control or management Lam Pao Thailand WUA development, WASAM (computerized canal delivery schedule), canal lining. Dez Iran Robust structures, little modernization. Gated structures throughout. Guilan Iran Automated upstream control on main and submain canals. Strong collection of water
fees. Seyhan Turkey Transfer of project O&M to WUA. Arranged demand. Strong collection of water
fees. Majalgaon India Dynamic regulation of main canal. Long crested weirs on submains. Baffle
distributors down to outlet level. WUA development. Dantiwada India New method of water delivery rotation. Concrete lining to 8 ha level. Large training
component for all levels of employees. WUA development. Bhakra India WUA development and water delivery rotation efforts. Muda Malaysia Overshot gates on main canal (manual); weirs on submain system. Selective remote
monitoring. Computer program for main canal discharges. WUA of special "miniestate" design.
Kemubu Malaysia Automated downstream control on main canals. Automatic upstream control on submains. Baffle distributors on outlets. WUA of special "mini-estate" design.
Beni Amir, Tadla
Morocco Beginning efforts on remote monitoring and computerizing record keeping. Strict discipline with a modified rotation delivery schedule to farmers. Computation of crop water requirements. Water fees. Old (and in need of repair/replacement) automatic flow and water level control equipment on main and submain canals.
Office du Niger
Mali Downstream control on main canal and some submains; baffle distributors; unique WUA. Very flexible deliveries. New plans for maintenance.
Rio Yaqui Alto
Dominican Republic
WUA management of water deliveries downstream of main canal. Begemann gates on canals below main canal.
Coello Colombia Complete operation by WUA. Arranged deliveries. Quick resolution of conflicts. Water fee collection. High density of turnouts. High mobility of operators.
Saldaña Colombia Complete operation by WUA. Arranged deliveries. Quick resolution of conflicts. Water fee collection. Long crested weirs. High density of turnouts. High mobility of operators.
Cupatitzio Mexico Recent modernization with canal lining, baffle distributors, long crested weirs, hydraulic gates. Computerized control of main canal envisioned.
Rio Mayo Mexico Project is operated by consortium of WUA groups. WUAs operate their own areas. Water fee collection. High mobility and excellent communications. High density of turnouts.
The perceptions of the research team were sometimes quite different from the perceptions listed in Table 4-2. Table 4-3 lists some of the most prominent positive and negative aspects of each project from the viewpoint of the research team.
It should be emphasized that in all cases, the personnel of the host irrigation projects were very hospitable and invested their valuable time in assisting the research team members. The comments of negative aspects must not be construed as negative comments about the personal integrity of any of the project personnel. Rather, they are listed because we can often learn as much from recognized deficiencies as we can from success stories. If we can understand the reasons for the negative aspects, we can sometimes provide solutions.
Chapter 4 - Project Description Page 3

Page 39 of 276
Table 4-3a. Examples of prominent positive and negative aspects of each project. Project Example Positive aspects Example Negative aspects
Lam Pao, - Extensive concrete lining - Use of WASAM program for computing main Thailand - Work is progressing on WUA development
- Some records are organized in computerized databases - There is an interest in matching canal deliveries to in-field irrigation requirements - Good access to main canals and secondary canals
canal cross regulator positions and offtake flow rates does not match realities in the field, and has flawed logic and application - Field operators have very little ability to influence the service into their zones - There is little real-time feedback of meaningful data in the field - Flow measurement and control is poor - No charges for water - Canals shut down at important times of the year - Field-to-field irrigation required
Dez, Iran - Robust concrete lining and structures - Farmers utilization of on-farm reservoirs - Moving towards volumetric deliveries - Area recovering well since the Iran/Iraq war - Minor changes required to make drastic improvements in irrigation efficiency and operations - Large agri-business operations working well in conjunction with small farmer operations - Excellent local research station available for local variety research
- Abandoned the original intent of supplying water on arranged demand basis - Good construction, wrong hydraulic structures - Need to change the method of on-farm water delivery where farmers have individual tertiary canals - Need project level reservoirs - Need remote monitoring - Poor irrigation efficiency - High degree of vandalism at the gates
Guilan, Iran - Excellent use of long crested weir and AMIL cross regulators designs on main and submain canals - Farmers benefit from premium for the local variety of rice - Excellent recovery of O&M expenditures - Use of the local "mirab" instead of WUAs to resolve water disputes - Good cooperation between water users - Independent authority operates and maintains the project separate from the headquarters in Tehran - Good communications between levels of the project
- The project needs more concrete lining/ canaletti down to the field/outlet level - Problem with old steel structures corroding - Problem with small baffle distributors becoming clogged - Field to field irrigation required
Seyhan, - WUAs have been transferred for the entire - Reliance on field siphons and temporary Turkey project
- O&M recovery has improved dramatically after the WUA transfer - Service has improved with the change to the new WUAs - Deliveries are flexible in duration and timing - Outlets available to each farm management unit - Water delivery provided on arranged demand basis
checks for volumetric measurement - WUA transfer required more employees for the delivery of water - No regulating reservoirs, but needed - Wrong use of the side weirs on cross regulators - Inadequate monitoring of the drainage water quality used for recycling - Lack of heavy equipment for the WUA maintenance activities - Some capacity constraints on the submain canal system during peak periods
Chapter 4 - Project Description Page 4

Page 40 of 276
Table 4-3b. Examples of prominent positive and negative aspects of each project (cont.) Project Example Positive aspects Example Negative aspects
Majalgaon, - Dynamic regulation being adopted for the main - Project planning was overly optimistic India canal
- Adopting long crested weirs for the modernized area - Modernization planning moving away from the un-gated outlets and Full Supply Level (FSL) concept of canal delivery - Good use of SCADA for the main canal - Concrete lining down to the water course level - Groundwater available - Beginning to get WUAs operating and functional - Desire to move towards volumetric water delivery to WUAs
regarding the water supply and the area actually benefiting from modernization; results in an extremely high cost per serviced ha. - Large organizational structure - Competition for the water supply from cities - Control system required excellent electric supply, but it is unpredictable and inadequate (presently being fixed by installing generators). - Impacted by rotating management staff - Training requirements for the dynamic regulation are large - Extensive data collection, little data synthesizing
Dantiwada, - Training of the management, engineers, - Lack of necessary regulating reservoir storage India operators, and farmers of the project was a key
aspect of the modernization - Changed water scheduling to rotation water supply from traditional methods - Concrete lining to the 8ha unit level has improved conveyance efficiency and reduced farmer conflicts - Use of long crested weirs and short weirs on the submain canals to replace the proportional dividers - Groundwater available - Excellent access and use of local agricultural university
- Dependence on the gate rating tables to resolve flow rate discrepancies between divisions - Large siltation problems due to flows entering the canal - Only one WUA formed, not much incentives for farmers to form additional WUAs
Bhakra, - Large number of farmers are provided water by - Many farmers unhappy with the water service India this project
- Groundwater is available for internal recirculation. - WUAs being formed with the main incentive being concrete lining of the tertiary canal system
provided by this project - Inadequate water supply for entire project - Inequity in deliveries; farmers closer to the canals receive larger volumes of water - Use of the un-gated outlets and no cross regulators below the main canal level - Large organizational structure - Lots of anarchy, water stealing - Staff has important "policing" role rather than water "tending" role - Problem with water logging and salinity build up of the shallow groundwater - No charges for the water - Poor utilization of the local agricultural university - Problems with cattle creating large maintenance headache by damaging the canal lining and banks
Chapter 4 - Project Description Page 5

Page 41 of 276
Table 4-3c. Examples of prominent positive and negative aspects of each project (cont.) Project Example Positive aspects Example Negative aspects
Muda, - Good hydraulic structures on the main canal - Problem with farmers coordinating planting Malaysia and the secondary canal for cross regulators
- Good use of closed loop feedback for monitoring water levels remotely - Capability to modify the daily releases of water from reservoir - Creation of "mini-estates" which function similar to WUA - Recycling of water is done extensively at the lower end of the project
schedules and cultural practices - Low cost recovery - Field to field irrigation required on major portion of system
Kemubu, - Downstream control on the main canal - Problem with farmers coordinating planting Malaysia - Baffle distributors for outlets from main and
submain canals - Good use of long crested weirs in submain canals - Planning on moving towards remote monitoring of the main canal - Creation of "mini-estates" which function similar to WUA
schedules and cultural practices - Large organization for the O&M - No charges for water - Field to field irrigation required
Beni Amir, - Project is beginning to utilize remote - Plans for expansion do not recognize the Tadla, monitoring at key points already high project irrigation efficiency and Morocco - Field land leveling program is in first tentative
steps - High level of discipline and organization with water ordering process and water deliveries - Extensive use of long crested weirs in secondary canals, some good hydraulic automatic check structures in main canal - Beginning to computerize water ordering records
lack of additional water - Over-emphasis on a canal simulation computer program for answers - Replacement equipment does not correct flaws which caused serious corrosion deterioration on original equipment throughout the project. - No intermediate storage, and very small capacities in canals - Some modernization efforts are not conducive to modern on-farm irrigation techniques - Remote monitoring equipment does not use standard communication protocols - No water user associations - Low density of turnouts
Office du - Unique WUA which participates in decisions - Lessons which could be learned from this Niger, Mali on maintenance expenses
- Water is available at the field level almost on demand - Very wide canal design is forgiving of low maintenance and allows high flexibility - Manual downstream control on one canal almost unique in the world - Good access to almost all canals - Each field has its own offtake (turnout)
project have not been applied to new projects - Low project irrigation efficiency due to no recirculation of surface drainage water - Extremely slow information feedback to main canal operation. - Unreliable communications system at essential links. - Problems at all levels with finding and retaining motivated and qualified local technical specialists - Very heavy reliance on foreign aid and technical assistance programs for almost all aspects of modernization and construction - Little evidence of local brainstorming and subsequent implementation of actions for the future.
Chapter 4 - Project Description Page 6

Page 42 of 276
Table 4-3d. Examples of prominent positive and negative aspects of each project (cont.) Project Example Positive aspects Example Negative aspects
Rio Yaqui - Flexible deliveries to farmers (although - Most cross regulators in secondary canals do not Alto, poorly controlled) function properly Dominican - Active participation of WUA in the - Very poor operation rules for the main canal Republic delivery of water below the main canal
- High density of turnouts - High rate of water fee collections - Collection and reuse of spill in some areas of the project
offtakes and cross regulators - Poor control structures in the main canal - Unrealistic expectations of what computer programs might do to assist future operations - No flow measurement to deliveries
Coello, - Very motivated operators and supervisors - Poor water measurement and control structures Colombia of the WUA
- WUA operate the complete project - Flexible deliveries - High density of turnouts - Considerable recirculation of surface runoff - Strong WUA in most aspects
- Rice is grown on unsuitable hilly and sandy land, with very poor land grading - resulting in very poor on-farm irrigation efficiencies
Saldaña, - Motivated operators - Main canal flows remain constant throughout the Colombia - Very high density of turnouts
- Operational and statistical data are collected by separate offices - WUA is similar to Coello - it is operated in many ways as a business organization.
year rather than adjusting to crop needs - Very low irrigation efficiency - Brainstorming and investment decisions are not targeted toward largest cost item - sand removal - Alleged corruption with construction contracts controlled by the Colombian government
Cupatitzio, - Extensive concrete lining - An inordinate amount of time is spent filling out Mexico - Very high density of turnouts
- Long crested weirs in submain canals data forms rather than on operations - Poor turnout (baffle distributor) design and installation. This is a major problem - Inappropriate local designs of automatic gates - Very low level of understanding of water control and efficiency by the local WUA, with resultant management and operation problems throughout the project - All electrical automation schemes are dysfunctional
Rio Mayo, - Extremely motivated operation staff - The control hardware in the system is not Mexico - Very high mobility of field staff
- Excellent communications of stationary and mobile staff - Good maintenance of canals - Excellent use of computers to process water orders and records - Eagerness of the staff to learn more and properly implement correct technologies - The main system is operated by a professional organization hired by the WUAs; WUAs operate the local distribution systems
compatible with very flexible, efficient water delivery service. Needs include better designs of cross regulators, improved flow measurement and control devices, and regulating reservoirs. The staff understands these needs and is making adjustments as rapidly as possible. - Some trials with baffle distributor turnouts have proven unsuccessful - Some of the WUAs (all are relatively new) have management problems.
Chapter 4 - Project Description Page 7

..
Page 43 of 276
An
nu
al R
ain
fall
(mm
) H
ecta
res
of
Ser
vice
Are
a (h
a)
2,000
1 ,500
1 ,000
500
0
Lam
Pao
, Tha
iland
La
m P
ao, T
haila
nd
The following graphs help to illustrate some of the irrigation project characteristics, and serve to highlight some of the differences in size, climate, and economics.
ch1250,000
Bhakra (630,000)
200 ,000
150 ,000
100 ,000
50 ,000
0
Figure 4-1. Irrigation project size, hectares of service area
ch73,000
2 ,500
Figure 4-2. Annual rainfall, mm.
Chapter 4 - Project Description Page 8
Dez
, Ira
n D
ez, I
ran
Gui
lan,
Iran
G
uila
n, Ir
an
Sey
han,
Tur
key
Sey
han,
Tur
key
Maj
alga
on, I
ndia
M
ajal
gaon
, Ind
ia
Dan
tiwad
a, In
dia
Dan
tiwad
a, In
dia
Bha
kra,
Indi
a B
hakr
a, In
dia
Mud
a, M
alay
sia
Mud
a, M
alay
sia
Kem
ubu,
Mal
aysi
a K
emub
u, M
alay
sia
Ben
i Am
ir, M
oroc
co
Offi
ce d
u N
iger
, Mal
i
Rio
Yaq
ui A
lto, D
R
Coe
llo, C
olom
bia
Sal
daña
, Col
ombi
a
Cup
atitz
io, M
exic
o
Ben
i Am
ir, M
oroc
co
Offi
ce d
u N
iger
, Mal
i
Rio
Yaq
ui A
lto, D
R
Coe
llo, C
olom
bia
Sal
daña
, Col
ombi
a
Cup
atitz
io, M
exic
o
Rio
May
o, M
exic
o R
io M
ayo,
Mex
ico

. .
Page 44 of 276
(An
nu
al R
ain
fall)
/(A
nn
ual
ET
o)
Ref
eren
ce E
vap
otr
ansp
irat
ion
(E
To
) in
mm
1 . 5
1 . 0
0 . 5
0 . 0
Figure 4-4. Ratio of Annual Rainfall to Annual ETo.
If the ratio of Annual Rainfall/Annual ETo is close to 1.0, and the rainfall is evenly distributed throughout the year, an excellent pasture crop could be grown throughout the year without any
Chapter 4 - Project Description Page 9
Lam
Pao
, Tha
iland
Dez
, Ira
n
Gui
lan,
Iran
Sey
han,
Tur
key
Maj
alga
on, I
ndia
Dan
tiwad
a, In
dia
Bha
kra,
Indi
a
Mud
a, M
alay
sia
Kem
ubu,
Mal
aysi
a
Ben
i Am
ir, M
oroc
co
Offi
ce d
u N
iger
, Mal
i
Rio
Yaq
ui A
lto, D
R
Coe
llo, C
olom
bia
Sal
daña
, Col
ombi
a
Cup
atitz
io, M
exic
o
Figure 4-3. Annual reference Evapotranspiration (ETo), mm
Reference evapotranspiration (ETo) is the evapotranspiration of a reference grass crop which is healthy and well watered. The value is computed from the Penman-Monteith equation from daily or hourly weather data. On any particular day, rice evapotranspiration (including both evaporation and transpiration) is about 10% higher than ETo.
c h 1 4 02 . 5
2 . 0
Lam
Pao
, Tha
iland
Dez
, Ira
n
Gui
lan,
Iran
Sey
han,
Tur
key
Maj
alga
on, I
ndia
Dan
tiwad
a, In
dia
Bha
kra,
Indi
a
Mud
a, M
alay
sia
Kem
ubu,
Mal
aysi
a
Ben
i Am
ir, M
oroc
co
Offi
ce d
u N
iger
, Mal
i
Rio
Yaq
ui A
lto, D
R
Coe
llo, C
olom
bia
Sal
daña
, Col
ombi
a
Cup
atitz
io, M
exic
o
c h 93 , 0 0 0
2 , 5 0 0
2 , 0 0 0
1 , 5 0 0
1 , 0 0 0
5 0 0
0
Rio
May
o, M
exic
o R
io M
ayo,
Mex
ico
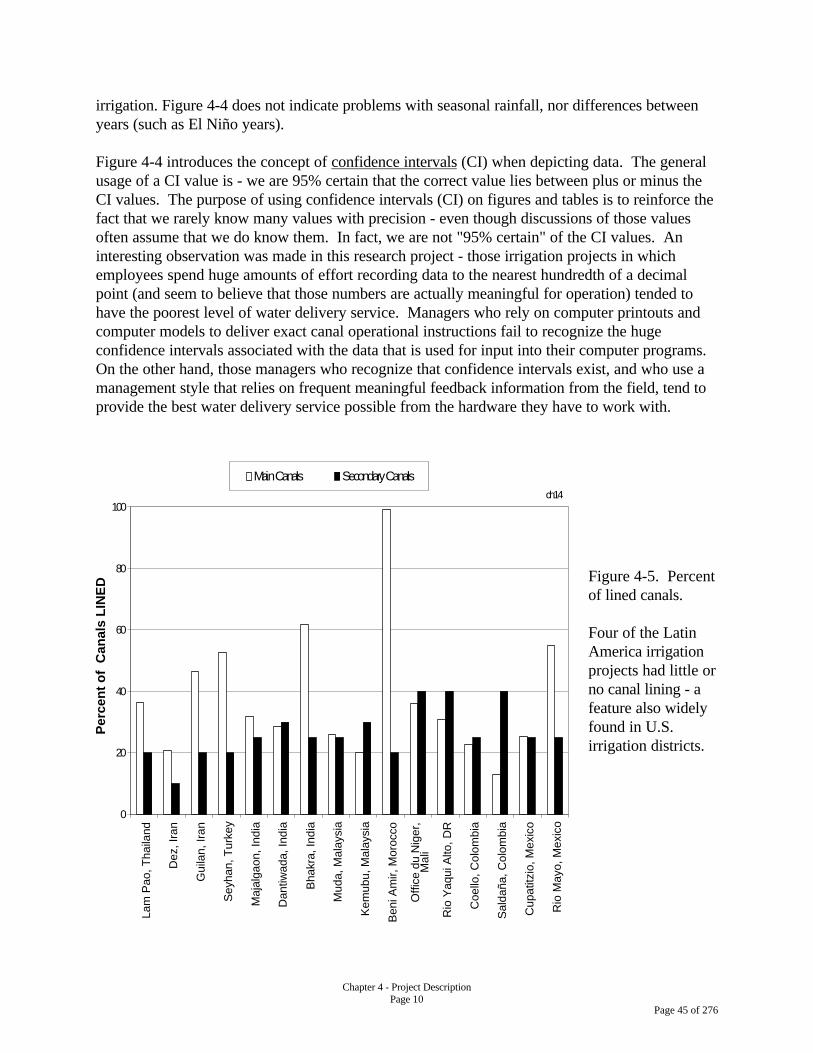
.
Page 45 of 276
irrigation. Figure 4-4 does not indicate problems with seasonal rainfall, nor differences between years (such as El Niño years).
Figure 4-4 introduces the concept of confidence intervals (CI) when depicting data. The general usage of a CI value is - we are 95% certain that the correct value lies between plus or minus the CI values. The purpose of using confidence intervals (CI) on figures and tables is to reinforce the fact that we rarely know many values with precision - even though discussions of those values often assume that we do know them. In fact, we are not "95% certain" of the CI values. An interesting observation was made in this research project - those irrigation projects in which employees spend huge amounts of effort recording data to the nearest hundredth of a decimal point (and seem to believe that those numbers are actually meaningful for operation) tended to have the poorest level of water delivery service. Managers who rely on computer printouts and computer models to deliver exact canal operational instructions fail to recognize the huge confidence intervals associated with the data that is used for input into their computer programs. On the other hand, those managers who recognize that confidence intervals exist, and who use a management style that relies on frequent meaningful feedback information from the field, tend to provide the best water delivery service possible from the hardware they have to work with.
Main Canals Secondary Canals ch14
100
80
Per
cen
t o
f C
anal
s L
INE
D Figure 4-5. Percent of lined canals.
Four of the Latin America irrigation projects had little or no canal lining - a feature also widely found in U.S. irrigation districts.
60
40
20
0
Lam
Pao
, Tha
iland
Dez
, Ira
n
Gui
lan,
Iran
Sey
han,
Tur
key
Maj
alga
on, I
ndia
Dan
tiwad
a, In
dia
Bha
kra,
Indi
a
Mud
a, M
alay
sia
Kem
ubu,
Mal
aysi
a
Ben
i Am
ir, M
oroc
co
Offi
ce d
u N
iger
,M
ali
Rio
Yaq
ui A
lto, D
R
Coe
llo, C
olom
bia
Sal
daña
, Col
ombi
a
Cup
atitz
io, M
exic
o
Rio
May
o, M
exic
o
Chapter 4 - Project Description Page 10

. .
Page 46 of 276
Irri
gat
ion
Su
pp
ly t
o F
ield
s (c
ub
ic m
/ha)
30,000
25,000
20,000
15,000
10,000
5,000
0
Pea
k S
ou
rce
(Ava
ilab
le)
Can
al C
apac
ity
(lp
s/h
a)
Figure 4-7. Annual volume of water delivered to fields, cubic meters/ha.
Chapter 4 - Project Description Page 11
Figure 4-6. Peak flow rates delivered at the head of the main canal.
ch14740,000
Rio
Yaq
ui A
lto, D
R
Rio
Yaq
ui A
lto, D
R
35,000
Coe
llo, C
olom
bia
Coe
llo, C
olom
bia
Sal
daña
, Col
ombi
a S
alda
ña, C
olom
bia
Cup
atitz
io, M
exic
oC
upat
itzio
, Mex
ico
0.0
0.5
1.0
1.5
2.0
2.5
3.0
3.5
4.0
4.5 ch142
Lam
Pao
, Tha
iland
Lam
Pao
, Tha
iland
Dez
, Ira
n D
ez, I
ran
Gui
lan,
Iran
G
uila
n, Ir
an
Sey
han,
Tur
key
Sey
han,
Tur
key
Maj
alga
on, I
ndia
M
ajal
gaon
, Ind
ia
Dan
tiwad
a, In
dia
Dan
tiwad
a, In
dia
Bha
kra,
Indi
a B
hakr
a, In
dia
Mud
a, M
alay
sia
Mud
a, M
alay
sia
Kem
ubu,
Mal
aysi
a K
emub
u, M
alay
sia
Ben
i Am
ir, M
oroc
co
Ben
i Am
ir, M
oroc
co
Offi
ce d
u N
iger
, Mal
i O
ffice
du
Nig
er, M
ali
Rio
May
o, M
exic
o R
io M
ayo,
Mex
ico

..
Page 47 of 276
c h 1 3 5
Figure 4-8. Cropping intensity, based on the service area which is equipped with a water delivery system. 5-year average values.
Cropping intensities can be computed several ways: - "Typical" values, that is, years of "typical" rainfall. - Based upon the total potentially irrigable area in a project. - Based upon the area which presently has irrigation service (such as Fig. 5-8)
c h 1 7 7
6
N o t a N o t a N o t a N o t a N o t a N o t a N o t a N o t a m a j o r m a j o r m a j o r m a j o r m a j o r m a j o r m a j o r m a j o r c r o p c r o p c r o p c r o p c r o p c r o p c r o p c r o p
0
Figure 4-9. Main season rice yields (Tons/ha with hulls)
Chapter 4 - Project Description Page 12
0 . 0
0 . 5
1 . 0
1 . 5
2 . 0
2 . 5 C
rop
pin
g In
ten
sity
- a
nn
ual
(5
yr. a
vg.)
Mai
n S
easo
n R
ice
Yie
lds
(T/h
a w
/ hu
ll)
5
4
3
2
1
Lam
Pao
, Tha
iland
Lam
Pao
, Tha
iland
Dez
, Ira
nD
ez, I
ran
Gui
lan,
Iran
Gui
lan,
Iran
Sey
han,
Tur
key
Sey
han,
Tur
key
Maj
alga
on, I
ndia
Maj
alga
on, I
ndia
Dan
tiwad
a, In
dia
Bha
kra,
Indi
a
Dan
tiwad
a, In
dia
Bha
kra,
Indi
a
Mud
a, M
alay
sia
Mud
a, M
alay
sia
Kem
ubu,
Mal
aysi
aK
emub
u, M
alay
sia
Ben
i Am
ir, M
oroc
coB
eni A
mir,
Mor
occo
Offi
ce d
u N
iger
, Mal
iO
ffice
du
Nig
er, M
ali
Rio
Yaq
ui A
lto, D
RR
io Y
aqui
Alto
, DR
Coe
llo, C
olom
bia
Coe
llo, C
olom
bia
Sal
daña
, Col
ombi
aS
alda
ña, C
olom
bia
Cup
atitz
io, M
exic
o
Rio
May
o, M
exic
o
Cup
atitz
io, M
exic
o
Rio
May
o, M
exic
o

.
.
Page 48 of 276
Although a comparison of rice yields between the projects is interesting, it does not provide good information about the effects of various irrigation management schemes. Rice yields also depend upon the rice variety, the local climate, soil type, fertilizer practices, and general agronomic practices such as insect and disease control. To determine the impact of water management on rice yields, one must keep all other variables constant and only vary the quality of water management - something which this study (and other studies which compare performances from groups of irrigation projects) was not designed to do.
c h 6
0 . 0
0 . 2
0 . 4
0 . 6
0 . 8
1 . 0
1 . 2
1 . 4
1 . 6
1 . 8
2 . 0
Rat
io o
f Y
ield
s (H
ead
of
Can
al t
o
Tai
l of
Can
al)
Dry
Sea
son
Lam
Pao
, Tha
iland
Dez
, Ira
n
Gui
lan,
Iran
Sey
han,
Tur
key
Maj
alga
on, I
ndia
Dan
tiwad
a, In
dia
Bha
kra,
Indi
a
Mud
a, M
alay
sia
Kem
ubu,
Mal
aysi
a
Ben
i Am
ir, M
oroc
co
Offi
ce d
u N
iger
, Mal
i
Rio
Yaq
ui A
lto, D
R
Coe
llo, C
olom
bia
Sal
daña
, Col
ombi
a
Cup
atitz
io, M
exic
o
Rio
May
o, M
exic
o
Figure 4-10. Ratio of yields (Head of Canal to Tail of Canal) during the dry season.
For the most part, yields were similar at the head of canals as compared to the tail ends of canals. There are some notable exceptions with Bhakra and Lam Pao being the most obvious. Later discussions will show that the level of water delivery service to tailender fields in those projects is poor. In Beni Amir, periodic problems with canalette corrosion and subsequent canalette breakage interrupt service at the tail ends of laterals frequently enough that yields decline. In all cases, the data was based on limited interviews with farmers rather than actual field measurements of yield. However, in most projects, farmers tended to be quite confident in their estimates. In the Latin American projects, farmers often had fields at both the head and tail ends of canals. Therefore, if they said there was "no difference," there was probably no difference. If the ratio of yield in Lam Pao was stated as 1.3/1, perhaps the actual value was 1.4/1, but there was a detectable difference in yields according to farmers.
Chapter 4 - Project Description Page 13

..
Page 49 of 276
Nu
mb
er o
f F
ines
Lev
ied
by
WU
A in
On
e Y
ear
Per
cen
t o
f A
rea
wit
h A
ctiv
e W
UA
1 6
1 2
8
4
0
Lam
Pao
, Tha
iland
Dez
, Ira
n
Gui
lan,
Iran
Sey
han,
Tur
key
Maj
alga
on, I
ndia
Dan
tiwad
a, In
dia
Bha
kra,
Indi
a
Mud
a, M
alay
sia
Kem
ubu,
Mal
aysi
a
Ben
i Am
ir, M
oroc
co
Offi
ce d
u N
iger
, Mal
i
0 0 0 0 0 0 0 0 0 0
Lam
Pao
, Tha
iland
Dez
, Ira
n
Gui
lan,
Iran
Sey
han,
Tur
key
Maj
alga
on, I
ndia
Dan
tiwad
a, In
dia
Bha
kra,
Indi
a
Mud
a, M
alay
sia
Kem
ubu,
Mal
aysi
a
Ben
i Am
ir, M
oroc
co
Offi
ce d
u N
iger
, Mal
i
Rio
Yaq
ui A
lto, D
R
Coe
llo, C
olom
bia
Sal
daña
, Col
ombi
a
Cup
atitz
io, M
exic
o
Rio
May
o, M
exic
o
Rio
Yaq
ui A
lto, D
R
Coe
llo, C
olom
bia
Sal
daña
, Col
ombi
a
Cup
atitz
io, M
exic
o
Rio
May
o, M
exic
o
c h 1 11 0 0 %
8 0 %
6 0 %
4 0 %
2 0 %
0 % 0 %
0 %
Figure 4-11. Percent of project area with active WUA.
There are stark contrasts between the various countries in terms of active water user association involvement, with Asian countries typically having very few active WUAs. WUAs or farmer organizations were not counted if they existed solely on the books and did not participate in any decisions.
c h 1 2 2 0
Figure 4-12. Number of fines levied by a typical WUA in one year.
Discussions of the number of fines seemed to indicate that giving fines was not a sign of weakness or anarchy. Rather, it was a sign of the strength and independence of the WUA.
Chapter 4 - Project Description Page 14

.
Page 50 of 276
Val
ue
of
Lan
d (
$/h
a 19
96 U
S)
Ave
rag
e F
arm
Man
agem
ent
Un
it S
ize
(ha) 1 0 0
8 0
6 0
4 0
2 0
0
Lam
Pao
, Tha
iland
Dez
, Ira
n
Gui
lan,
Iran
Sey
han,
Tur
key
Maj
alga
on, I
ndia
Dan
tiwad
a, In
dia
Bha
kra,
Indi
a
Mud
a, M
alay
sia
Kem
ubu,
Mal
aysi
a
Ben
i Am
ir, M
oroc
co
Offi
ce d
u N
iger
, Mal
i
Rio
Yaq
ui A
lto, D
R
Coe
llo, C
olom
bia
Sal
daña
, Col
ombi
a
Cup
atitz
io, M
exic
o
Lam
Pao
, Tha
iland
Dez
, Ira
n
Gui
lan,
Iran
Sey
han,
Tur
key
C l o s e t o C a n a l s
$ 1 6 , 0 0 0 A w a y f r o m C a n a l s
$ 1 2 , 0 0 0 N o t e : a t O D N - n o l a n d i s a v a i l a b l e f o r s a l e s
$ 8 , 0 0 0
$ 4 , 0 0 0
$ 0 M
ajal
gaon
, Ind
ia
Dan
tiwad
a, In
dia
Bha
kra,
Indi
a
Mud
a, M
alay
sia
Kem
ubu,
Mal
aysi
a
Ben
i Am
ir, M
oroc
co
Offi
ce d
u N
iger
, Mal
i
Rio
Yaq
ui A
lto, D
R
Coe
llo, C
olom
bia
Sal
daña
, Col
ombi
a
c h 3$ 2 0 , 0 0 0
Figure 4-13. Value of Land ($US/ha)
Land is very expensive in many projects; much more expensive than the irrigation system which delivers water. Interestingly enough, there did not appear to be a good correlation between land prices and the level of water delivery service. However, it is interesting to note that a project such as Lam Pao has very expensive land, yet the farmers do not pay for water, the rice yields are relatively low, and the water delivery service is relatively poor.
c h 2 1 2 0
Figure 4-14. Average farm management unit size (ha).
Chapter 4 - Project Description Page 15
Cup
atitz
io, M
exic
o
Rio
May
o, M
exic
o R
io M
ayo,
Mex
ico

. .
Page 51 of 276
Mo
nth
ly S
alar
ies
(bas
ed o
n 1
996
US
$)O
&M
Exp
end
itu
res
(in
c. s
alar
ies)
- $/
ha
Precise data on the average farm management unit size was not available, but the contrast is nevertheless remarkable. In Coello, Saldaña, and Rio Mayo, a large percentage of the farmland was rented to larger farm management units. Those three projects also ran their WUAs as business operations in many ways.
c h 8$ 2 , 5 0 0
S e n i o r A d m i n i s t r a t o r
P r o f e s s i o n a l E n g i n e e r
C a n a l O p e r a t o r
L a b o r e r
Figure 4-15. Monthly salaries ($US).
It is interesting to note the differences between the salaries of common agricultural laborers and the canal operators. In Rio Mayo (Mexico) the canal operators were expected to take initiative and receive training; in Cupatitzio (Mexico) the WUA directors thought that canal operators did not need to do any special thinking or have any special training. Those operators spent most of their time filling out simple data forms in the office.
c h 1 3 7 $ 4 0 0
$ 3 5 0
Figure 4-16. Annual operation and maintenance (O&M) expenditures, including salaries. $/ha
Chapter 4 - Project Description Page 16
$ 3 0 0
$ 2 5 0
$ 2 0 0
$ 1 5 0
$ 1 0 0
$ 5 0
$ 0
$ 2 , 0 0 0
$ 1 , 5 0 0
$ 1 , 0 0 0
$ 5 0 0
$ 0
Lam
Pao
, Tha
iland
Dez
, Ira
n
Gui
lan,
Iran
Sey
han,
Tur
key
Maj
alga
on, I
ndia
Dan
tiwad
a, In
dia
Bha
kra,
Indi
a
Mud
a, M
alay
sia
Kem
ubu,
Mal
aysi
a
Ben
i Am
ir, M
oroc
co
Offi
ce d
u N
iger
,
Mal
i
Rio
Yaq
ui A
lto, D
R
Coe
llo, C
olom
bia
Sal
daña
, Col
ombi
a
Cup
atitz
io, M
exic
o
Lam
Pao
, Tha
iland
Dez
, Ira
n
Gui
lan,
Iran
Sey
han,
Tur
key
Maj
alga
on, I
ndia
Dan
tiwad
a, In
dia
Bha
kra,
Indi
a
Mud
a, M
alay
sia
Kem
ubu,
Mal
aysi
a
Ben
i Am
ir, M
oroc
co
Offi
ce d
u N
iger
, Mal
i
Rio
Yaq
ui A
lto, D
R
Coe
llo, C
olom
bia
Sal
daña
, Col
ombi
a
Cup
atitz
io, M
exic
o
Rio
May
o, M
exic
oR
io M
ayo,
Mex
ico

.
Page 52 of 276
It was difficult to determine precise values for O&M expenditures because project costs were often divided into many categories. Furthermore, in some projects, "rehabilitation" funds were really O&M funds, and those funds were kept in separate budgets from the "regular" irrigation project budgets. This was especially common when the rehabilitation funds came from foreign donors or loans. The figures do include estimated in-kind contributions by farmers in those cases where they are partially responsible for weed control and desilting.
A figure such as Figure 4-16 is interesting because it gives a sense of magnitude of the O&M expenditures. However, it is not a stand-alone figure. Some projects were quite new and needed very little O&M, while others had just been rehabilitated. Still others were in the midst of rehabilitation (depending upon one's viewpoint, deferred maintenance could be considered as O&M or at least as the equivalent), while some irrigation projects needed to expand O&M expenditures to maintain equipment in good repair. These factors are complicated by constraints such as the amount of silt in the water. Saldaña and Dantiwada had large silt loads in the water, thereby requiring large annual expenses. Office du Niger had a perfect environment for the growth of aquatic weeds and also had unlined canals, thus requiring higher expenditures for weed control than needed in other projects. Kemubu has a high O&M expenditure due to the high pumping costs.
ch138
$0
$5,000
$10,000
$15,000
$20,000
$25,000
$30,000
$35,000
$40,000
O&
M E
xpen
dit
ure
s -
$/m
cm o
f b
enef
icia
l use
Lam
Pao
, Tha
iland
Dez
, Ira
n
Gui
lan,
Iran
Sey
han,
Tur
key
Maj
alga
on, I
ndia
Dan
tiwad
a, In
dia
Bha
kra,
Indi
a
Mud
a, M
alay
sia
Kem
ubu,
Mal
aysi
a
Ben
i Am
ir, M
oroc
co
Offi
ce d
u N
iger
, Mal
i
Rio
Yaq
ui A
lto, D
R
Coe
llo, C
olom
bia
Sal
daña
, Col
ombi
a
Cup
atitz
io, M
exic
o
Rio
May
o, M
exic
o
Figure 4-17. O&M expenditures expressed as $/million cubic meters (mcm) of beneficial use.
Figure 4-17 introduces the concept of "beneficial use", which is discussed in much more detail in the chapter on indicators (Chapter 5). Beneficial use in this case refers to irrigation water which is ultimately consumed as crop evapotranspiration within the project boundaries. When compared to Figure 4-16, one can see some contrasts which are due to the total amount of irrigation water available to the project, or the project irrigation efficiency.
Chapter 4 - Project Description Page 17

.
.
Page 53 of 276
Wat
er c
har
ge
- $/
mcm
del
iver
ed t
o t
he
farm
W
ater
ch
arg
e -
$/h
a
0
2 0
4 0
6 0
8 0
1 0 0
1 2 0
1 4 0
1 6 0 c h 1 4 3
Figure 4-18. Water charges, $/ha
Water charges include all fees that farmers must pay for service, regardless of how they are computed. The water charges show a wide difference among the various projects. Office du Niger (ODN) is somewhat remarkable because the farmers have such small land holdings and are so poor.
c h 1 4 4 3 0 , 0 0 0
Figure 4-19. Water charges. $/mcm delivered to the farm.
The values in Figure 4-19 were computed from the total reported water charges, divided by the estimated total volume of water delivered to all farms. In general, the total volumes of water diverted into the projects, plus internal recirculation, were reasonably well known. However, the farm deliveries required an estimate of the conveyance efficiency. None of the projects could produce convincing data that substantiated a low confidence internal on their estimate of conveyance losses.
Chapter 4 - Project Description Page 18
2 5 , 0 0 0
2 0 , 0 0 0
1 5 , 0 0 0
1 0 , 0 0 0
5 , 0 0 0
0
Lam
Pao
, Tha
iland
Lam
Pao
, Tha
iland
Dez
, Ira
n
Gui
lan,
Iran
Sey
han,
Tur
key
Maj
alga
on, I
ndia
Dan
tiwad
a, In
dia
Bha
kra,
Indi
a
Mud
a, M
alay
sia
Kem
ubu,
Mal
aysi
a
Ben
i Am
ir, M
oroc
co
Offi
ce d
u N
iger
, Mal
i
Rio
Yaq
ui A
lto, D
R
Coe
llo, C
olom
bia
Sal
daña
, Col
ombi
a
Cup
atitz
io, M
exic
o
Dez
, Ira
n
Gui
lan,
Iran
Sey
han,
Tur
key
Maj
alga
on, I
ndia
Dan
tiwad
a, In
dia
Bha
kra,
Indi
a
Mud
a, M
alay
sia
Kem
ubu,
Mal
aysi
a
Ben
i Am
ir, M
oroc
co
Offi
ce d
u N
iger
, Mal
i
Rio
Yaq
ui A
lto, D
R
Coe
llo, C
olom
bia
Sal
daña
, Col
ombi
a
Cup
atitz
io, M
exic
o
Rio
May
o, M
exic
o R
io M
ayo,
Mex
ico

.
Page 54 of 276
Several of the irrigation projects claimed to have a "volumetric" water charge. However, none of them had a volumetric water charge in the sense of such charges in the western U.S. In the western U.S., individual farmers are typically charged for the volume of water that is actually delivered to their individual ownership units. Such charges require flow measurement to individual ownership units, as well as an accounting for the volumes of water delivered. No such accounting or measurement was found in any of the irrigation projects visited in this study. The "volumetric" charges of the various irrigation projects that had them were really charges based on the total amount of money the authorities wanted to collect, divided by an estimate of the total volume of water delivered to all the farms. Then each farm was assumed to receive the same volume of water, although in some cases different crops were assumed to receive different volumes.
ch10
0%
20%
40%
60%
80%
100%
Per
cen
t o
f W
ater
Ch
arg
es C
olle
cted
0%0%
Lam
Pao
, Tha
iland
Dez
, Ira
n
Gui
lan,
Iran
Sey
han,
Tur
key
Maj
alga
on, I
ndia
Dan
tiwad
a, In
dia
Bha
kra,
Indi
a
Mud
a, M
alay
sia
Kem
ubu,
Mal
aysi
a
Ben
i Am
ir, M
oroc
co
Offi
ce d
u N
iger
, Mal
i
Rio
Yaq
ui A
lto, D
R
Coe
llo, C
olom
bia
Sal
daña
, Col
ombi
a
Cup
atitz
io, M
exic
o
Rio
May
o, M
exic
oFigure 4-20. Percent of water charges collected.
It is one thing to establish a water charge. It is an entirely different matter to collect those fees. Four projects evidently have "perfect" fee collection records: Dez, Beni Amir, Coello, and Saldaña. In those projects, the water fees are not always collected when due, but within a grace period there is 100% collection. Dantiwada (India) appears to be a remarkable success case in Asia, until one examines Figure 4-18, which shows that the water charge is negligible when compared to Beni Amir and Saldaña.
Chapter 4 - Project Description Page 19

.
.
Page 55 of 276
ch146
0
20
40
60
80
100
120
Nu
mb
er o
f T
urn
ou
ts p
er
(op
erat
or/
gat
e o
per
ato
r/ s
up
ervi
sor)
Lam
Pao
, Tha
iland
Dez
, Ira
n
Gui
lan,
Iran
Sey
han,
Tur
key
Maj
alga
on, I
ndia
Dan
tiwad
a, In
dia
Bha
kra,
Indi
a
Mud
a, M
alay
sia
Kem
ubu,
Mal
aysi
a
Ben
i Am
ir, M
oroc
co
Offi
ce d
u N
iger
, Mal
i
Rio
Yaq
ui A
lto, D
R
Coe
llo, C
olom
bia
Sal
daña
, Col
ombi
a
Cup
atitz
io, M
exic
o
Rio
May
o, M
exic
o
Figure 4-21. Number of project operated turnouts per operator.
Figure 4-21 is presented to illustrate the tremendous difference in employee efficiency which was found in the study. "Operators" include all personnel working on the actual movement of water throughout an irrigation project, such as gate tenders, "ditchriders", and their supervisors. It does not include the office staff or maintenance personnel. Later in this report, this indicator will be shown to correlate to several service-related factors. At this point, it might be sufficient to note that arguments are often heard that Asian projects are so large they are difficult to manage. That may be true, but it is also very apparent from Figure 4-21 that the inherent way that those projects are managed is very different from Seyhan (Turkey), Coello (Columbia), or Rio Mayo (Mexico). Bhakra (India), an Asian project with large inequities in water delivery and serious problems, has about 15 times as many operators to control the same number of turnouts (offtakes) as Rio Mayo.
Figure 4-21 cuts across arguments about the size of farm holdings and the number of farmers. It deals strictly with the responsibilities and efficiency of operators, who must deliver water to a certain number of outlets (offtakes, turnouts) within their area of responsibility. There may be 1 or 100 farmers downstream of a turnout; that is not an issue since the "turnout" defines the end of the responsibility of the operator. Interestingly, one of the first things done by many Mexican irrigation projects after the project operations were transferred to the WUAs was to fire the majority of employees, and only retain the efficient ones. Rio Mayo is one such project.
Chapter 4 - Project Description Page 20

. .
Page 56 of 276
Far
mer
s/O
per
ato
r H
ecta
res/
Op
erat
or
3 0 0
2 0 0
1 0 0
0
Lam
Pao
, Tha
iland
Lam
Pao
, Tha
iland
Dez
, Ira
n
Gui
lan,
Iran
Dez
, Ira
n
Gui
lan,
Iran
Sey
han,
Tur
key
Sey
han,
Tur
key
Maj
alga
on, I
ndia
Maj
alga
on, I
ndia
Dan
tiwad
a, In
dia
Dan
tiwad
a, In
dia
Bha
kra,
Indi
aB
hakr
a, In
dia
Mud
a, M
alay
sia
Mud
a, M
alay
sia
Kem
ubu,
Mal
aysi
aK
emub
u, M
alay
sia
Ben
i Am
ir, M
oroc
coB
eni A
mir,
Mor
occo
Offi
ce d
u N
iger
, Mal
iO
ffice
du
Nig
er, M
ali
Rio
Yaq
ui A
lto, D
RR
io Y
aqui
Alto
, DR
Coe
llo, C
olom
bia
Coe
llo, C
olom
bia
Sal
daña
, Col
ombi
aS
alda
ña, C
olom
bia
Cup
atitz
io, M
exic
o C
upat
itzio
, Mex
ico
0
500
1,000
1,500
2,000
2,500
3,000
3,500 ch130
Figure 4-22. Hectares per operator.
The hectares per operator is interesting, but not very meaningful because it does not indicate anything about the real responsibilities of the operator. The previous figure (Figure 4-21) is the key graph to examine.
c h 1 3 16 0 0
5 0 0
4 0 0
Figure 4-23. Farmers per operator.
Chapter 4 - Project Description Page 21
Rio
May
o, M
exic
o R
io M
ayo,
Mex
ico

.. .
Page 57 of 276
1 0 0
Nu
mb
er o
f F
arm
ers
wh
ich
Mu
st
Per
cen
t o
f F
inal
Dis
trib
uti
on
Do
ne
by
FA
RM
ER
S
Co
op
erat
e o
n F
inal
Dis
trib
uti
on
8 0
6 0
4 0
2 0
0
3 0
2 0
1 0
0
Lam
Pao
, Tha
iland
Dez
, Ira
n
Gui
lan,
Iran
Sey
han,
Tur
key
Maj
alga
on, I
ndia
Dan
tiwad
a, In
dia
Bha
kra,
Indi
a
Mud
a, M
alay
sia
Kem
ubu,
Mal
aysi
a
Ben
i Am
ir, M
oroc
co
Offi
ce d
u N
iger
, Mal
i
Rio
Yaq
ui A
lto, D
R
Coe
llo, C
olom
bia
Sal
daña
, Col
ombi
a
Cup
atitz
io, M
exic
o
Rio
May
o, M
exic
o
The farmers per operator (Figure 4-23) does not indicate how hard an operator must work, or even how much responsibility an operator has. A single turnout (the responsibility of the operator) may supply one or 100 farmers. This graph is interesting, but should not be used for project comparison purposes.
c h 1 5
Figure 4-24. Percent of final water distribution done by farmers.
"Distribution done by farmers" does not refer to "distribution done by WUA". If 100% of the final water distribution is done by farmers, this means that 2 or more farmers must cooperate downstream of the turnout in 100% of the project area. The 20% value for Rio Yaqui Alto indicates that about 20% of the project area requires inter-farmer cooperation.
c h 1 65 0
4 0
Figure 4-25. Number of farmers which must cooperate on final distribution.
Chapter 4 - Project Description Page 22

.
.
Page 58 of 276
In cases where farmers must cooperate on the final distribution of water, Figure 4-25 provides the number of farmers who must work together downstream of a turnout. This cooperation may be voluntary, it may precisely follow a project-approved rotation, or it may ignore a project-approved rotation. In any case, the farmer cooperation occurs downstream of the point that the project authorities relinquish physical control of the water. Bhakra is the one exception, especially because it does not have functional WUAs.
c h 4
S a l d a n a $ 1 8 0 , 0 0 0 $ 6 0 , 0 0 0
$ 5 0 , 0 0 0
Gro
ss In
com
e p
er F
arm
Man
agem
ent
Un
it (
$/fa
rm u
nit
)
$ 4 0 , 0 0 0
$ 3 0 , 0 0 0
$ 2 0 , 0 0 0
$ 1 0 , 0 0 0
$ 0
Lam
Pao
, Tha
iland
Dez
, Ira
n
Gui
lan,
Iran
Sey
han,
Tur
key
Maj
alga
on, I
ndia
Dan
tiwad
a, In
dia
Bha
kra,
Indi
a
Mud
a, M
alay
sia
Kem
ubu,
Mal
aysi
a
Ben
i Am
ir, M
oroc
co
Offi
ce d
u N
iger
, Mal
i
Rio
Yaq
ui A
lto, D
R
Coe
llo, C
olom
bia
Sal
daña
, Col
ombi
a
Cup
atitz
io, M
exic
o
Rio
May
o, M
exic
o
Figure 4-26. Gross income per farm management unit ($) (rough estimates)
There is considerable uncertainty in the values of Figure 4-26. Even in Lam Pao, where there was an abundance of farm income studies available, the various studies provided conflicting conclusions. Nevertheless, this figure does show that there are striking differences among the projects. Even if the estimate of Dantiwada has a 100% error, the gross income is obviously different from that in Seyhan.
Figure 4-27 displays project output from another perspective. The value of the agricultural output of crops was converted into an equivalent labor day value. For example, if a typical day wage was $5, and the output was $100, the equivalent labor day value was 20. In Lam Pao, Thailand, the agricultural output is very low compared to the local wages. The consequence is a low cropping intensity during the dry season because of the difficulty finding laborers; family members often work on construction jobs in the cities and receive better wages than can be obtained on the farm.
Chapter 4 - Project Description Page 23

.
Page 59 of 276
Ou
tpu
t p
er c
rop
ped
are
a (l
abo
r d
ays/
ha)
0
2 0 0
4 0 0
6 0 0
8 0 0
1 , 0 0 0
1 , 2 0 0
1 , 4 0 0 c h 1 4 8
Lam
Pao
, Tha
iland
Dez
, Ira
n
Gui
lan,
Iran
Sey
han,
Tur
key
Maj
alga
on, I
ndia
Dan
tiwad
a, In
dia
Bha
kra,
Indi
a
Mud
a, M
alay
sia
Kem
ubu,
Mal
aysi
a
Ben
i Am
ir, M
oroc
co
Offi
ce d
u N
iger
, Mal
i
Rio
Yaq
ui A
lto, D
R
Coe
llo, C
olom
bia
Sal
daña
, Col
ombi
a
Cup
atitz
io, M
exic
o
Rio
May
o, M
exic
o
Figure 4-27. Agricultural output per hectare, with value expressed in labor days.
Chapter 4 - Project Description Page 24

Page 60 of 276
Chapter 5 - External Indicators
Over the past two decades there has been considerable interest in the development of indicators which could describe different internal processes and outputs of irrigation systems. Jurriens and Bottral (1984) were early advocates of improved techniques to assess irrigation projects. Small and Svendsen (1990) described a framework for assessing irrigation performance, but did not provide specific examples of performance indicators which might be used.
Murray-Rust and Snellen (1993) described the framework of using performance indicators, and noted two approaches to the use of performance indicators in the field of irrigation:
1. Attempts to develop indicators which allow the performance of one system to be compared to similar systems elsewhere.
2. The use of indicators to compare actual results with what was planned.
A major contribution of their work was a comparison of performance found in several different countries and irrigation projects. They presented detailed and enlightening field data which showed large discrepancies between assumed water delivery service and actual water delivery service, primarily in systems of Sri Lanka, Indonesia, India, and Pakistan. Those projects did not have significant modernization components.
More recently, ICID (1995) defined several irrigation system performance indicators for international projects. Burt et al., (1997) described the detailed process needed to effectively evaluate Irrigation Efficiency and Irrigation Sagacity. IWMI investigators have recently focused on improving irrigation project performance indicators. In this report, the term "IWMI Indicators" will refer to those defined by Molden et al., (1998), who provided a summary of recent IWMI indicator work. Molden et al., (1998) also provide values for 9 IWMI indicators for 27 different irrigation projects.
This chapter will first provide definitions and discussions of the IWMI indicators, followed by a more detailed discussion of the new indicators developed for this project. The new indicators were developed to reduce the difficulties of application of some IWMI indicators, and to clarify ambiguity with some indicator definitions. There was also a need for indicators of additional topics.
IWMI Indicators of Irrigated Agricultural Output. Indicators are still not widely used, and their development is still in the evolutionary phase. IWMI continues to modify the details of computing its own indicators. IWMI provides four "external" indicators of agricultural output. These are:
ProductionIWMI 1. Output per cropped area ( $ ) =ha Irrigated cropped area (A cropped )
Chapter 5 – External Indicators Page 1
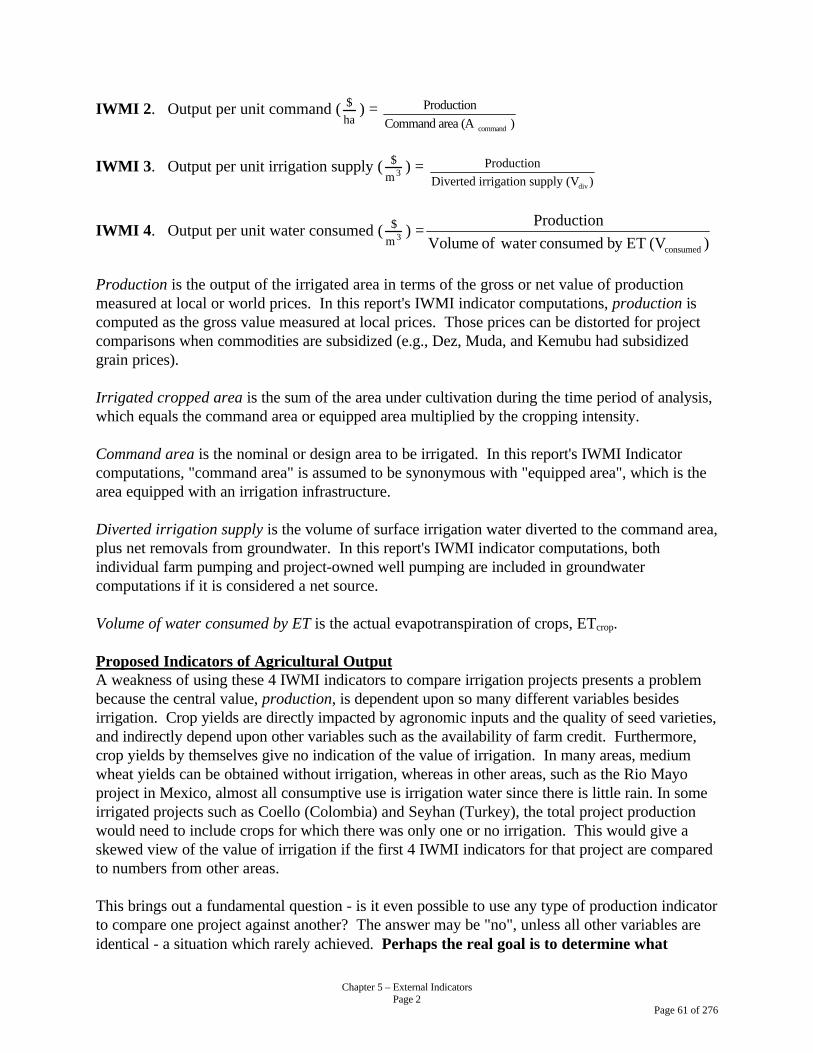
Page 61 of 276
ProductionIWMI 2. Output per unit command ( $ ) =ha Command area (A command )
ProductionIWMI 3. Output per unit irrigation supply ( $3 ) =
m Diverted irrigation supply (Vdiv )
ProductionIWMI 4. Output per unit water consumed ( $
3 ) = m Volume of water consumed by ET (V consumed )
Production is the output of the irrigated area in terms of the gross or net value of production measured at local or world prices. In this report's IWMI indicator computations, production is computed as the gross value measured at local prices. Those prices can be distorted for project comparisons when commodities are subsidized (e.g., Dez, Muda, and Kemubu had subsidized grain prices).
Irrigated cropped area is the sum of the area under cultivation during the time period of analysis, which equals the command area or equipped area multiplied by the cropping intensity.
Command area is the nominal or design area to be irrigated. In this report's IWMI Indicator computations, "command area" is assumed to be synonymous with "equipped area", which is the area equipped with an irrigation infrastructure.
Diverted irrigation supply is the volume of surface irrigation water diverted to the command area, plus net removals from groundwater. In this report's IWMI indicator computations, both individual farm pumping and project-owned well pumping are included in groundwater computations if it is considered a net source.
Volume of water consumed by ET is the actual evapotranspiration of crops, ETcrop.
Proposed Indicators of Agricultural Output A weakness of using these 4 IWMI indicators to compare irrigation projects presents a problem because the central value, production, is dependent upon so many different variables besides irrigation. Crop yields are directly impacted by agronomic inputs and the quality of seed varieties, and indirectly depend upon other variables such as the availability of farm credit. Furthermore, crop yields by themselves give no indication of the value of irrigation. In many areas, medium wheat yields can be obtained without irrigation, whereas in other areas, such as the Rio Mayo project in Mexico, almost all consumptive use is irrigation water since there is little rain. In some irrigated projects such as Coello (Colombia) and Seyhan (Turkey), the total project production would need to include crops for which there was only one or no irrigation. This would give a skewed view of the value of irrigation if the first 4 IWMI indicators for that project are compared to numbers from other areas.
This brings out a fundamental question - is it even possible to use any type of production indicator to compare one project against another? The answer may be "no", unless all other variables are identical - a situation which rarely achieved. Perhaps the real goal is to determine what
Chapter 5 – External Indicators Page 2

Page 62 of 276
opportunities still exist in each project for improved production. If that is the goal, it might be best to use the following indicators.
ProductionITRC 1. Achieved Production Indicator = Production without irrigation
This type of indicator would clearly indicate the production benefit that has been achieved in an individual project. When translated into various economic terms, it would help define an impact of investment (crop yield). It would not be valid to compare ITRC 1 indicators of various projects against each other for the same reasons noted earlier in the discussion of IWMI 1-4 indicators. A desert environment would be expected to have a much larger Achieved Production Indicator than one in the humid tropics, so comparing them to each other would be fairly meaningless. The values needed to compute this indicator would be relatively simple to obtain. Some irrigation project personnel often quote similar indicators to show what has happened "post independence" or "post-irrigation project" as compared to prior conditions.
ITRC 1 would indicate how far a project has come. Another important aspect is the remaining potential for improvement. Therefore, ITRC 2 is suggested:
ITRC 2. Potential Production Improvement Indicator = Potential Production
Production
ITRC 2 might define "Potential Production" in terms of the existing cropping pattern, or might recognize the potential for increased double cropping and different types of crops with improved irrigation water service. Some standardization would need to be developed for the definition. In any case, it would provide a valuable indicator as to how much investment might be appropriate, independent from political, military, health, etc. goals which must also be considered in evaluating irrigation project results.
These two proposed indicators have not been computed in this project, because they were not proposed until the analysis portion of the project was reached. However, the data for ITRC 1 should be relatively simple to obtain, and the data for ITRC 2 can be estimated from the abundance of crop research work which has been conducted around the world.
IWMI Indicators of Water Supply Molden et al., (1998) define five additional indicators for comparative purposes. The first three are meant to characterize the individual irrigation system with respect to water supply.
IWMI 5. Relative water supply (RWS) = Total water supply
Crop demand
Irrigation supplyIWMI 6. Relative irrigation supply (RIS) = Irrigation demand
Total water supply = Surface diversions plus net groundwater draft plus rainfall (but does not include any recirculating internal project drainage water).
Chapter 5 – External Indicators Page 3

Page 63 of 276
Crop demand = Potential crop ET, or the ET under well-watered conditions. When rice is considered, deep percolation and seepage losses are added to crop demand.
Irrigation supply = Only the surface diversions and net groundwater draft for irrigation (i.e., this does not include rainfall and does not include any recirculating internal project drainage water).
Irrigation demand = The crop ET less effective rainfall.
The following can be noted regarding IWMI 5 and 6: 1. In most arid-region projects, there is an additional net water requirement for the removal of
salts on a project-level basis. RIS and RWS do not include these. 2. The definition of "total water supply" is almost guaranteed to give double counting of rainfall
in most tropical climates, because the groundwater is actually resupplied by rainfall. 3. Although Molden et al., (1998) state that RIS is the inverse of Irrigation Efficiency, such is not
the case if Irrigation Efficiency is computed by the rigorous standards set forth by the ASCE task committee in Burt et al., (1997), and defined below:
ASCE 1. volume of irrigation water beneficially used
Irrigation Efficiency (IE) = x 100% vol. irrig. water applied - D storage of irrig. water
The primary components of beneficial use are crop ET and necessary salt leaching. The development of ASCE 1 recognized that Irrigation Efficiency (IE) could only be determined if one knows the timings of irrigation events and rainfalls. The use of annual totals may miss the fact that water is available when it cannot be beneficially used. RIS does not account for the timing of irrigation and rainfall events; it just accounts for the total volumes in a year or season.
4. The present IWMI definition of "crop demand" includes deep percolation and seepage loss water for rice, in addition to crop ET. There are two difficulties when including those values.
First, there is a question of the validity of including deep percolation and seepage losses as a "crop demand". The ASCE task committee document (Burt et al., 1997) is consistent with U.S. performance measurements in not including these water destinations as beneficial uses on the field nor on the project level. The ASCE document recognizes that such water destinations may be unavoidable, but "unavoidable" is not the same as "beneficial".
Second, inclusion of those values can cause serious problems with double counting of water. On one hand, RWS is proposed as an indicator for project-level performance. On the other hand, "deep percolation and seepage losses" are typically field-level values. One cannot mathematically mix field-level and project-level values in such a manner.
This point is illustrated in the following example.
Chapter 5 – External Indicators Page 4

Page 64 of 276
Example Calculations for RWS
* Assume 12 units of water are applied to an area having 3 parcels. * 6 units of water are initially applied to each of 2 parcels (total = 12 units). * Of the 6 units of water on each parcel,
- 3 units are used at crop ET, and - 3 are destined as deep percolation or seepage losses.
* The third parcel receives drainage water that originated in the first 2 parcels - a total of 6 units. The RWS for this example is:
Crop demand = ET + deep percolation + seepage = 3 parcels x (3 units ET + 3 units DP/seepage) = 18 units
Total water supply = 12 units
12 unitsRWS = = .67, indicating insufficient water
18 units
If the "Crop demand" does not include (deep perc. + seepage) on the farm-level, but does include the amount of (deep perc. + seepage) which leaves the 3-dimensional project boundaries, then RWS can be computed as:
Crop demand = ET + deep percolation + seepage = (3 parcels x 3 units of ET) + (3 units of DP/seepage) = 12 units
Total water supply = 12 units
12 unitsRWSmodified = = 1.0
12 units This would be a more correct accounting of the conditions, because in this example there was sufficient water for all three fields. The 3 units of deep percolation and seepage that left the final field was NOT counted because it left a field, but because it left the boundaries of the area of study - the area of 3 fields.
Some accounting procedures double count the deep percolation from the first two fields as part of the project supply, and come up with:
Crop demand = ET + deep percolation + seepage = (3 parcels x 3 units ET ) + (3 units DP/seepage from proj.) = 12 units
Total water supply = 12 units into area + 6 units recovery = 18 units
18 unitsRWSmodified = = 1.5
12 units
The points of this illustration are that: (i) all performance indicators must be consistent in using values from an identical 3-dimensional boundary, whether it is field-level or project level. One cannot mix field-level values with project-level values. (ii) field-level irrigation indicator values cannot be used to represent project-level performance (iii) the computation procedures for any indicator must be clearly defined.
Chapter 5 – External Indicators Page 5

Page 65 of 276
5. A similar double counting error can occur with groundwater. Both RWS and RIS include "net groundwater draft". The problem with double counting rainfall was pointed out earlier. It is also common for evaluators to add irrigation surface supplies and groundwater pumping to estimate the total project supply - a serious mathematical error in most cases. Such an error leads to gross over-estimations of how much land can be farmed, as may be the case in Beni Amir, Morocco. Often the groundwater is recharged by the surface water inefficiencies. Again, one must establish 3-dimensional boundaries to a project. A surface supply may be reused two or even three times within a project via groundwater pumping or recirculation of surface drainage waters. Regardless of the amount of recirculation, in the final count, only a certain amount of irrigation water came into the project boundaries. That incoming water is what must be counted in project-level indicators as the supply to the project.
One reason to move toward indicators such as RWS and RIS is the confusion which frequently arises in understanding "Irrigation Efficiency" estimates. Some people have an aversion to using any indicator with the term "efficiency" because of the value judgments which are attached to an "efficiency" term. The discussion above shows that the same misunderstandings and miscalculations can arise with any indicator, such as RWS and RIS. There is no shortcut to standardization of the proper definitions and techniques of computations. Education is necessary to properly implement and explain all standardized techniques.
Water delivery capacity (%) = Canal capacity to deliver water at system headIWMI 7. x 100 Peak consumptive demand
Capacity to deliver water at the system head = The present discharge capacity of the canal at the system head.
Peak consumptive demand = The peak crop irrigation requirements for a monthly period expressed as a flow rate at the head of the irrigation system. In this report, this does not include seepage and deep percolation losses for rice.
There may be some confusion in the terminology of IWMI 7 as the definition reads. "Peak consumptive demand" includes the ET of rainfall by crops - and therefore does not give an indication of irrigation requirements. The wording of the definition of "peak consumptive demand" by IWMI clarifies this point, but any confusion can be avoided by making a slight modification to the terminology. A suggested terminology change is "Peak irrigation water consumptive demand".
Canal capacity to deliver water at system headITRC 3. Water delivery capacity (%) = x 100
Peak irrigation water consumptive demand
Chapter 5 – External Indicators Page 6

Page 66 of 276
IWMI Financial Indicators Two financial indicators are also provided:
Gross return on investment (%) = Standardized gross value of productionIWMI 8. x 100 Cost of irrigation infrastructure
IWMI 9. Financial self-sufficiency = Revenue from irrigation
Total O & M expenditure
In this research project, the values for IWMI 8 were not obtained. The Rapid Appraisal Process did not provide sufficient time to accurately determine the cost of the irrigation infrastructure. Many projects had been constructed over decades of time, and accurate records of total costs of construction were lacking. In some projects, there was also confusion between construction, rehabilitation, and modernization costs.
IWMI 9 is sometimes called the "Collection Rate", which is somewhat ambiguous. A name change is recommended for IWMI 9. "Financial self-sufficiency" should also include the ability to improve the infrastructure, as needed and to repay original construction costs. Therefore, it is recommended that this indicator be called "Percentage of O&M Collected". There remains, of course, the question of whether the actual O&M expenditures are due to deferred maintenance which is occurring at the moment, or whether the O&M expenditures are too small at the moment - thereby requiring large expenditures at a later date. That determination was beyond the scope of this research.
Revenue from irrigationIWMI 9REV. Percentage of O&M Collected = x 100 Total O & M expenditure
New or Revised External Indicators Three new indicators were proposed in the previous section:
ProductionITRC 1. Achieved Production Indicator = Production without irrigation
ITRC 2. Potential Production Improvement Indicator = Potential Production
Production
The following are modifications of the IWMI (Molden et al., 1998) indicators. The major improvements are in the elimination of double counting of water. The component descriptions are found after the proposed indicators are presented.
ITRC 3. Canal capacity to deliver water at system headWater delivery capacityITRC (%) = x 100
Peak irrigation water consumptive demand
ITRC 4:
Chapter 5 – External Indicators Page 7

Page 67 of 276
Total water supplyDry season relative water supply (Dry Season RWSITRC) = Crop demand
Chapter 5 – External Indicators Page 8

Page 68 of 276
ITRC 5: Total water supplyWet season rel. water supply (Wet Season RWSITRC) =
Crop demand
ITRC 6: Total water supplyAnnual relative water supply (Annual RWSITRC) =
Crop demand
ITRC 7: Irrigation supplyDry season rel. irrig. supply (Dry Season RISITRC) =
Irrigation demand
ITRC 8: Irrigation supplyWet season rel. irrig. supply (Wet Season RISITRC) =
Irrigation demand
ITRC 9: Irrigation supplyAnnual relative irrigation supply (Annual RISITRC) =
Irrigation demand
Total water supply = Surface diversions (including uncontrolled flows entering the project boundaries) plus rainfall plus net groundwater pumping (groundwater which did not originate from surface irrigation supplies or from rainfall which fell within the project boundaries). The water supply pertains to the period of time stated, such as "dry season", "wet season", or "annual".
Crop demand = Potential crop ET, or the ET under well-watered conditions. Deep percolation and seepage losses are not included in crop demand. The crop demand is only for the designated time ("dry season", "wet season", or "annual").
Irrigation supply = The surface diversions and other surface inflows, plus net groundwater draft (which does not include groundwater recharged by surface diversions and inflows which are already counted, but does include any groundwater which was recharged by rainfall or external sources). This does not double count internal drainage recycling. The value is only for the designated time ("dry season", "wet season", or "annual").
Irrigation demand = The crop ET less effective rainfall. The value is only for the designated time ("dry season", "wet season", or "annual").
The use of "dry season" and "wet season" indicators arises because the two may have completely different values, and the differences may be masked when only examining a single annual value. For example, a wet season indicator may look very low (poor), but may in reality have no negative impact if there is good drainage and very high, uniform rainfall. In such a case, it may be most important to examine the dry season indicators.
Chapter 5 – External Indicators Page 9

Page 69 of 276
Proposed ITRC 10: volume of irrigation water beneficially used
Annual Project Irrigation Efficiency, IE = x 100% vol. irrig. water applied - D storage of irrig. water
The two components of beneficial use in the computations for this research project are crop ET and necessary salt leaching. In most of the projects, the salt leaching requirement was 0.0, since rainfall accomplished the leaching for the whole year. The change in storage value was assumed to be 0.0 in all cases.
Irrigation Efficiency gives a much more in-depth description of water destinations than RIS or RWS, which only look at total volumes of water which are available or needed. RIS and RWS do not consider the timing of the water availability, nor the corresponding crop/soil needs. Irrigation efficiency, if properly computed according to ASCE guidelines (Burt et al., 1997), considers the amounts, timing, and usage of the water, not just the amounts of water. RIS and RWS have value in that they provide a snapshot view of the magnitude of water available, but they miss the details of irrigation management which IE includes. For example, irrigation water may be applied when the crop does not need it, in excessive amounts (resulting in excess deep percolation for field irrigation), or with a high percentage of unrecoverable surface losses - factors which are accounted for in the computation of IE.
Graphs of Indicators The production, water supply, and financial indicators are all considered "external indicators" in this report. The external indicator values are presented in Table 5-1. Subsequent figures display the values graphically.
Chapter 5 – External Indicators Page 10

Page 70 of 276
" ~ !f a
'" " 1: '"~~ " ~ ~ ~,~ ~ ~ ~it ~ '" 'I ! :r ~ -i 0 ~ I• ~ ~ "
a
~ 2 ~ ~ "," ~ ~ [ [ ~ ~§ • ~ ~• • • ~
0 • g g~ • ~ •
---- -- --.---112 Eli
"
------- --.---1.9 1.9-- ------->---
"
------- --.---
CD "10 40------- --.---
345 l:E-- ------->---
" "------- --.---4.1 2.0
" "------- --.---
"-- ------->---
" "------- --.---3.1 2.0
" "------- --.---4.2 1.9-- ------->---
" "------- --.---
"-- ------->---
" "------- --.---3.9 1.9-- ------->---
" "------- --.---
" ""40 25
"
"--~j29-- 4() 3.6 --~-15-6
,po
,po
,po
-- 4oi~!-- 4() 23 - -- -25P-~
00
" "" "" n
" "" "" n
" "" '""
"
"
,<C
"
'""
,<C
" "" "" "" 50
" 6'
" 6"
" on
"
1,245
Table 5-1. External Indicator values.
Chapter 5 – External Indicators Page 11

Page 71 of 276

. .
Page 72 of 276
IWM
I2. O
utp
ut
per
un
it c
om
man
d (
$/h
a)
IWM
I1. O
utp
ut
per
cro
pp
ed a
rea
($/h
a)
6 , 0 0 0
5 , 0 0 0
4 , 0 0 0
3 , 0 0 0
2 , 0 0 0
1 , 0 0 0
0
Lam
Pao
, Tha
iland
Dez
, Ira
n
Gui
lan,
Iran
Sey
han,
Tur
key
Maj
alga
on, I
ndia
Dan
tiwad
a, In
dia
Bha
kra,
Indi
a
Mud
a, M
alay
sia
Kem
ubu,
Mal
aysi
a
Ben
i Am
ir, M
oroc
co
Offi
ce d
u N
iger
, Mal
i
Rio
Yaq
ui A
lto, D
R
Coe
llo, C
olom
bia
Sal
daña
, Col
ombi
a
Cup
atitz
io, M
exic
o
Figure 5-1. IWMI 1 external indicator. Output per cropped area ($US/ha). Local prices.
7 , 0 0 0 c h 1 1 1
6 , 0 0 0
5 , 0 0 0
4 , 0 0 0
3 , 0 0 0
2 , 0 0 0
1 , 0 0 0
0
Lam
Pao
, Tha
iland
Dez
, Ira
n
Gui
lan,
Iran
Sey
han,
Tur
key
Maj
alga
on, I
ndia
Dan
tiwad
a, In
dia
Bha
kra,
Indi
a
Mud
a, M
alay
sia
Kem
ubu,
Mal
aysi
a
Ben
i Am
ir, M
oroc
co
Offi
ce d
u N
iger
, Mal
i
Rio
Yaq
ui A
lto, D
R
Coe
llo, C
olom
bia
Sal
daña
, Col
ombi
a
Cup
atitz
io, M
exic
o
The following pages display the various IWMI external indicators, along with the comparable and recommended ITRC external indicators.
c h 1 1 0 7 , 0 0 0
Figure 5-2. IWMI 2 external indicator. Output per command area ($US/ha). Local prices.
Both Figures 5-1 and 5-2 provide similar data. However, one could not say that Rio Yaqui Alto (Dominican Republic) is a more successful project than Guilan (Iran) because of this graph. The graph largely reflects the current prices of the crops grown in a project. The high output values for Rio Yaqui Alto simply reflect a current high price for tobacco. For some irrigation projects
Chapter 5 – External Indicators Page 13
Rio
May
o, M
exic
o R
io M
ayo,
Mex
ico

.
.
Page 73 of 276
IWM
I4.
Ou
tpu
t p
er w
ater
co
nsu
med
($/
cu. m
.)
IWM
I3.
Ou
tpu
t p
er u
nit
irri
g. s
up
ply
($/
cu. m
.) 0 . 8 0
0 . 7 0
0 . 6 0
0 . 5 0
0 . 4 0
0 . 3 0
0 . 2 0
0 . 1 0
0 . 0 0
Figure 5-3. IWMI 3 external indicator. Output per unit irrigation supply ($/cu. m.)
0 .90 c h 1 1 3
0 .80
0 .70
0 .60
0 .50
0 .40
0 .30
0 .20
0 .10
0 .00
Lam
Pao
, Tha
iland
Dez
, Ira
n
Gui
lan,
Iran
Sey
han,
Tur
key
Maj
alga
on, I
ndia
Dan
tiwad
a, In
dia
Bha
kra,
Indi
a
Mud
a, M
alay
sia
Kem
ubu,
Mal
aysi
a
Ben
i Am
ir, M
oroc
co
Offi
ce d
u N
iger
, Mal
i
Rio
Yaq
ui A
lto, D
R
Coe
llo, C
olom
bia
Sal
daña
, Col
ombi
a
Lam
Pao
, Tha
iland
Dez
, Ira
n
Gui
lan,
Iran
Sey
han,
Tur
key
Maj
alga
on, I
ndia
Dan
tiwad
a, In
dia
Bha
kra,
Indi
a
Mud
a, M
alay
sia
Kem
ubu,
Mal
aysi
a
Ben
i Am
ir, M
oroc
co
Offi
ce d
u N
iger
, Mal
i
Rio
Yaq
ui A
lto, D
R
Coe
llo, C
olom
bia
Sal
daña
, Col
ombi
a
Cup
atitz
io, M
exic
oC
upat
itzio
, Mex
ico
the objective is to grow grain crops - which will never have the same high price per hectare as tobacco.
c h 1 1 2 0 . 9 0
Figure 5-4. IWMI 4 external indicator. Output per water consumed ($/cu. m.)
Some economists are interested in the output contrasted to the input. In Figures 5-3 and 5-4, water is considered an input, and the sales price of the crop is considered the output. On a basin-wide basis, IWMI4 may be most important because it reflects the actual consumption of water within the irrigation project. However, if the project is next to an ocean and there is no opportunity for recycling of the diverted water supply, IWMI 3 is more pertinent.
Chapter 5 – External Indicators Page 14
Rio
May
o, M
exic
o R
io M
ayo,
Mex
ico

. .
Page 74 of 276
ITR
C6.
An
nu
al R
WS
(IT
RC
) IW
MI5
. R
elat
ive
wat
er s
up
ply
(R
WS
)
5
4
3
2
1
0
Figure 5-5. IWMI 5 external indicator. Relative water supply (RWS)
c h 1 2 1 8
7
6
Rio
Yaq
ui A
lto, D
R
Rio
Yaq
ui A
lto, D
R
Coe
llo, C
olom
bia
Coe
llo, C
olom
bia
Sal
daña
, Col
ombi
a S
alda
ña, C
olom
bia
Cup
atitz
io, M
exic
o C
upat
itzio
, Mex
ico
Lam
Pao
, Tha
iland
Lam
Pao
, Tha
iland
Dez
, Ira
n D
ez, I
ran
Gui
lan,
Iran
G
uila
n, Ir
an
Sey
han,
Tur
key
Sey
han,
Tur
key
Maj
alga
on, I
ndia
M
ajal
gaon
, Ind
ia
Dan
tiwad
a, In
dia
Dan
tiwad
a, In
dia
Bha
kra,
Indi
a B
hakr
a, In
dia
Mud
a, M
alay
sia
Mud
a, M
alay
sia
Kem
ubu,
Mal
aysi
a K
emub
u, M
alay
sia
Ben
i Am
ir, M
oroc
co
Ben
i Am
ir, M
oroc
co
Offi
ce d
u N
iger
, Mal
i O
ffice
du
Nig
er, M
ali
0
1
2
3
4
5
6
7
8 c h 1 1 4
Figure 5-6. ITRC6 external indicator. Annual RWSITRC
Figures 5-5 and 5-6 both show Relative Water Supply values. Figure 5-5 uses the IWMI computation technique, whereas Figure 5-6 uses the ITRC recommended computation that does not include deep percolation for rice as a "crop demand". The differences in the two RWS values are substantial in the rice projects (Saldaña, Coello, Muda, Kemubu, Lam Pao).
Chapter 5 – External Indicators Page 15
Rio
May
o, M
exic
o R
io M
ayo,
Mex
ico

. .
Page 75 of 276
ITR
C5.
Wet
Sea
son
RW
S(I
TR
C)
ITR
C4.
Dry
Sea
son
RW
S(I
TR
C)
1 4
1 2
1 0
8
6
4
2
0
Lam
Pao
, Tha
iland
Figure 5-7. ITRC 4 external indicator. Dry Season RWSITRC
1 6
1 8 c h 1 2 0
Lam
Pao
, Tha
iland
0
2
4
6
8
1 0
1 2
1 4
1 6
1 8 c h 1 1 9
Figure 5-8. ITRC 5 external indicator. Wet Season RWSITRC
Figures 5-7 and 5-8 promote the usage of seasonal RWS values, in addition to annual RWS values. The seasonal values provide additional insight to the temporal usage of total water supplies. A "zero" value indicates that (i) no crops are grown in a season, or (ii) the crops are all permanent crops, so the values are consolidated into one season.
Chapter 5 – External Indicators Page 16
Dez
, Ira
n D
ez, I
ran
Gui
lan,
Iran
G
uila
n, Ir
an
Sey
han,
Tur
key
Sey
han,
Tur
key
Maj
alga
on, I
ndia
M
ajal
gaon
, Ind
ia
Dan
tiwad
a, In
dia
Dan
tiwad
a, In
dia
Bha
kra,
Indi
a B
hakr
a, In
dia
Mud
a, M
alay
sia
Mud
a, M
alay
sia
Kem
ubu,
Mal
aysi
a K
emub
u, M
alay
sia
Ben
i Am
ir, M
oroc
co
Ben
i Am
ir, M
oroc
co
Offi
ce d
u N
iger
, Mal
i
Rio
Yaq
ui A
lto, D
R
Coe
llo, C
olom
bia
Sal
daña
, Col
ombi
a
Cup
atitz
io, M
exic
o
Offi
ce d
u N
iger
, Mal
i
Rio
Yaq
ui A
lto, D
R
Coe
llo, C
olom
bia
Sal
daña
, Col
ombi
a
Cup
atitz
io, M
exic
o
Rio
May
o, M
exic
o R
io M
ayo,
Mex
ico

. .
Page 76 of 276
ITR
C9.
An
nu
al R
IS(I
TR
C)
IWM
I6.
Rel
ativ
e ir
rig
. su
pp
ly (
RIS
)
Figure 5-9. IWMI 6 external indicator. Relative Irrigation Supply (RIS)
ch12412
10
Coe
llo, C
olom
bia
Coe
llo, C
olom
bia
Sal
daña
, Col
ombi
aS
alda
ña, C
olom
bia
Cup
atitz
io, M
exic
oC
upat
itzio
, Mex
ico
Lam
Pao
, Tha
iland
8
6
4
2
0
Lam
Pao
, Tha
iland
Dez
, Ira
n
Dez
, Ira
nG
uila
n, Ir
an
Gui
lan,
Iran
S
eyha
n, T
urke
y
Sey
han,
Tur
key
Maj
alga
on, I
ndia
Maj
alga
on, I
ndia
D
antiw
ada,
Indi
a
Dan
tiwad
a, In
dia
Bha
kra,
Indi
a
Bha
kra,
Indi
a
Mud
a, M
alay
sia
Mud
a, M
alay
sia
Kem
ubu,
Mal
aysi
a
Kem
ubu,
Mal
aysi
a
Ben
i Am
ir, M
oroc
co
Ben
i Am
ir, M
oroc
co
Offi
ce d
u N
iger
, Mal
i
Offi
ce d
u N
iger
, Mal
i
Rio
Yaq
ui A
lto, D
RR
io Y
aqui
Alto
, DR
0
2
4
6
8
1 0
1 2 c h 1 1 5
Figure 5-10. ITRC 9 external indicator. Annual RISITRC
Figures 5-9 and 5-10 provide RIS values which only account for the irrigation water supply, as opposed to the total water supply of RWS. As with RWS, the ITRC values of Figure 5-10 do not include rice deep percolation as a "crop demand" for the reasons explained earlier in this chapter.
Chapter 5 – External Indicators Page 17
Rio
May
o, M
exic
o R
io M
ayo,
Mex
ico

..
Page 77 of 276
ITR
C8.
Wet
Sea
son
RIS
(IT
RC
) IT
RC
7. D
ry S
easo
n R
IS(I
TR
C)
1 2
1 0
8
6
4
2
0
0
2
4
6
8
10
12
14
16
18 ch122
Figure 5-11. ITRC 7 external indicator. Dry Season RISITRC
c h 1 2 3 1 6
1 4
Figure 5-12. ITRC 8 external indicator. Wet Season RISITRC
Chapter 5 – External Indicators Page 18
Lam
Pao
, Tha
iland
Dez
, Ira
n
Lam
Pao
, Tha
iland
Dez
, Ira
n
Gui
lan,
Iran
G
uila
n, Ir
an
Sey
han,
Tur
key
Sey
han,
Tur
key
Maj
alga
on, I
ndia
M
ajal
gaon
, Ind
ia
Dan
tiwad
a, In
dia
Dan
tiwad
a, In
dia
Bha
kra,
Indi
a B
hakr
a, In
dia
Mud
a, M
alay
sia
Mud
a, M
alay
sia
Kem
ubu,
Mal
aysi
a K
emub
u, M
alay
sia
Ben
i Am
ir, M
oroc
co
Ben
i Am
ir, M
oroc
co
Offi
ce d
u N
iger
, Mal
i
Rio
Yaq
ui A
lto, D
R
Coe
llo, C
olom
bia
Sal
daña
, Col
ombi
a
Cup
atitz
io, M
exic
o
Offi
ce d
u N
iger
, Mal
i
Rio
Yaq
ui A
lto, D
R
Coe
llo, C
olom
bia
Sal
daña
, Col
ombi
a
Cup
atitz
io, M
exic
o
Rio
May
o, M
exic
o R
io M
ayo,
Mex
ico

. .
Page 78 of 276
ITR
C3.
Wat
er d
eliv
ery
cap
acit
y (%
) IW
MI7
. W
ater
del
iver
y ca
pac
ity
(%)
Figure 5-13. IWMI 7 external indicator. Water Delivery Capacity (%)
c h 1 1 8 5 0 0
4 5 0
Rio
Yaq
ui A
lto, D
R
Rio
Yaq
ui A
lto, D
R
Coe
llo, C
olom
bia
Coe
llo, C
olom
bia
Sal
daña
, Col
ombi
a S
alda
ña, C
olom
bia
Cup
atitz
io, M
exic
o C
upat
itzio
, Mex
ico
4 0 0
3 5 0
3 0 0
2 5 0
2 0 0
1 5 0
1 0 0
5 0
0
Lam
Pao
, Tha
iland
La
m P
ao, T
haila
nd
Dez
, Ira
n D
ez, I
ran
Gui
lan,
Iran
G
uila
n, Ir
an
Sey
han,
Tur
key
Sey
han,
Tur
key
Maj
alga
on, I
ndia
M
ajal
gaon
, Ind
ia
Dan
tiwad
a, In
dia
Dan
tiwad
a, In
dia
Bha
kra,
Indi
a B
hakr
a, In
dia
Mud
a, M
alay
sia
Mud
a, M
alay
sia
Kem
ubu,
Mal
aysi
a K
emub
u, M
alay
sia
Ben
i Am
ir, M
oroc
co
Ben
i Am
ir, M
oroc
co
Offi
ce d
u N
iger
, Mal
i O
ffice
du
Nig
er, M
ali
0
5 0
100
150
200
250
300
350
400
450
500 ch116
Figure 5-14. ITRC 3 external indicator. Water Delivery Capacity (%)
The importance of clear definitions of terms is brought out when one compares Figures 5-13 and 5-14. Both provide information about the adequacy of the peak inflow rates to irrigation projects. For most projects, ITRC 3 and IWMI 7 provide similar values. However, there are major differences between the two indicators for Beni Amir, Rio Yaqui Alto, and Cupatitzio. IWMI 7 compares the peak inflow rates to the crop water requirement, whereas ITRC 3 compares the
Chapter 5 – External Indicators Page 19
Rio
May
o, M
exic
o R
io M
ayo,
Mex
ico

Page 79 of 276
inflow rates to the irrigation water requirement (ET of irrigation water) - a major difference in rainy conditions. If there is substantial rainfall, the ET of irrigation water is much lower than the total ET.
0 . 0
0 . 5
1 . 0
1 . 5
2 . 0
2 . 5
3 . 0
3 . 5
Pea
k L
PS
/ha
1 0 0 % c r o p p i n g i n tens i t y se rv i ce a r e a
A c t u a l c r o p p i n g in tens i t y
c h 1 4 2 a
Lam
Pao
, Tha
iland
Dez
, Ira
n
Gui
lan,
Iran
Sey
han,
Tur
key
Maj
alga
on, I
ndia
Dan
tiwad
a, In
dia
Bha
kra,
Indi
a
Mud
a, M
alay
sia
Kem
ubu,
Mal
aysi
a
Ben
i Am
ir, M
oroc
co
Offi
ce d
u N
iger
, Mal
i
Rio
Yaq
ui A
lto, D
R
Coe
llo, C
olom
bia
Sal
daña
, Col
ombi
a
Cup
atitz
io, M
exic
o
Rio
May
o, M
exic
o
Figure 5-15. Peak LPS/ha.
Figure 5-15 is not listed as an ITRC or IWMI external indicator, but it is commonly used to indicate the adequacy of the design or the adequacy of the water supply. The peak (maximum) flow rate into the project only includes surface water sources which enter the boundaries of the project. It does not include internal drainage/spill recirculation nor groundwater pumping.
Figure 5-15 shows 2 ways of computing the source flow rate - based on 100% cropping intensity or on actual cropping intensity. The hectare base is the actual service area, rather than a theoretical command area - which would give another 2 graphs. There are some striking differences, demonstrating that how the data is presented will give very different impressions about the availability of water in a project. Figure 5-15, when combined with Figure 5-14, gives a good idea of the adequacy of the water supply on a theoretical basis. Neither figure directly indicate the project efficiency or sagacity (degree to which water is used wisely).
Chapter 5 – External Indicators Page 20

.
Page 80 of 276
c h 1 2 5
0
1 0
2 0
3 0
4 0
5 0
6 0
7 0
8 0
9 0
1 0 0
ITR
C10
. An
nu
al P
roje
ct Ir
rig
atio
n E
ffic
ien
cy
Lam
Pao
, Tha
iland
Dez
, Ira
n
Gui
lan,
Iran
Sey
han,
Tur
key
Maj
alga
on, I
ndia
Dan
tiwad
a, In
dia
Bha
kra,
Indi
a
Mud
a, M
alay
sia
Kem
ubu,
Mal
aysi
a
Ben
i Am
ir, M
oroc
co
Offi
ce d
u N
iger
, Mal
i
Rio
Yaq
ui A
lto, D
R
Coe
llo, C
olom
bia
Sal
daña
, Col
ombi
a
Cup
atitz
io, M
exic
o
Rio
May
o, M
exic
o
Figure 5-16. ITRC10 external indicator. Annual Project Irrigation Efficiency (%)
Irrigation Efficiency, if properly computed, provides valuable insight into several aspects of irrigation project performance. The most immediate insight which can be seen from Figure 5-16 is that almost all of the irrigation water supply is presently being beneficially used in Beni Amir (Morocco). This is extremely important because, evidently, there are some plans to increase the irrigated acreage with the same water supply which is obviously an error if the irrigation efficiency value is correct. If irrigation efficiency is properly understood and defined, it helps to avoid double counting of water and unwarranted expansion of acreage.
The next point from Figure 5-16 is that Dez, Dantiwada, Muda, Kemubu, Rio Yaqui, Coello, and Cupatitzio may all have the same annual project irrigation efficiency of 20%. The confidence intervals for all of these projects overlap the 20% value.
The third point from Figure 5-16 is that there are tremendous differences in performance between various projects, and that there is great room for improvement in some cases. Figure 5-16 does not show where inefficiencies occur, such as spills, unrecovered seepage, on-farm surface spills not recovered within the project, or on-farm deep percolation not recovered within the project. However, in all cases, better control and flexibility of the water delivery system is essential for reducing such inefficiencies.
Chapter 5 – External Indicators Page 21

.
Page 81 of 276
c h 1 1 7
0
2 0
4 0
6 0
8 0
1 0 0
1 2 0
1 4 0
1 6 0
1 8 0
2 0 0 IW
MI9
RE
V.
Per
cen
tag
e o
f O
&M
Co
llect
ed (
%)
Lam
Pao
, Tha
iland
Dez
, Ira
n
Gui
lan,
Iran
Sey
han,
Tur
key
Maj
alga
on, I
ndia
Dan
tiwad
a, In
dia
Bha
kra,
Indi
a
Mud
a, M
alay
sia
Kem
ubu,
Mal
aysi
a
Ben
i Am
ir, M
oroc
co
Offi
ce d
u N
iger
, Mal
i
Rio
Yaq
ui A
lto, D
R
Coe
llo, C
olom
bia
Sal
daña
, Col
ombi
a
Cup
atitz
io, M
exic
o
Rio
May
o, M
exic
o
Figure 5-17. IWMI9REV. Percentage of O&M Collected (%).
Figure 5-17 presents a recommended revision to IWMI9 in name only - suggesting "percentage of O&M collected" as opposed to "self sufficiency". Guilan is notable because the fees from farmers exceed that needed to cover O&M. Such a recovery rate may be desirable to pay back the initial cost of the project, modernization, etc. Lam Pao, Dantiwada, Bhakra, Muda, Kemubu, Rio Yaqui Alto, and Cupatitzio are remarkable for their low recovery of O&M costs. Those projects with higher than 50% recovery tend to have active farmer involvement or dependable and somewhat timely water deliveries to farms.
Chapter 5 – External Indicators Page 22

Page 82 of 276
Chapter 6 - Internal Process Indicators
General The previously described external indicators (Chapter 5) give an idea of the relative magnitudes of some major inputs and outputs of irrigation projects. An indicator such as "Irrigation Efficiency" assigns a specific value to the percentage of the irrigation water beneficially used within the project. None of the Chapter 5 external indicators provide specific information on instream or downstream impacts - they all deal with actions directly associated with the irrigation project itself.
It is clear that no single indicator is satisfactory for all descriptive purposes. It is also clear that there are uncertainties about the exact values of each indicator; hence, the recommended use of confidence intervals.
Within certain limits, external indicators can sometimes give an indication of inter-relationships between hydrologic levels (e.g., farm, irrigation project, hydrologic basin). This is accomplished by computing the values of the external indicators for each hydrologic level - something that is sometimes done with Irrigation Efficiency. Some external indicators, such as ITRC1 and ITRC2, focus on agricultural production and they can give good indications of how production has been impacted by the irrigation project, as well as what potential improvement remains to be achieved. However, none of the external indicators provide insight regarding the workings of the internal mechanisms (e.g., management, social, hardware) within an irrigation project.
Irrigation project investors have two basic questions which need answers:
Question #1. Is it possible to reap benefits by investing in an irrigation project rehabilitation or modernization?
Question #2. What specific actions must be taken so those benefits will actually be realized?
There are uncertainties as to how well the first question has been answered in the past. This is one reason why the external indicators ITRC 1 and ITRC 2 are proposed in Chapter 5. Certainly in many cases various government, technical, and investment groups have expected significant benefits achieved through irrigation investment. But the early part of this report indicates that theoretical benefits have not always been achieved (as now done in some projects financed by lending agencies).
This research project was funded, in part, to better answer the second question. This research assumes that it is insufficient to simply look at the inputs and outputs of an irrigation project. It is absolutely necessary to understand the internal mechanisms of irrigation projects, and to provide selective enhancement of those internal mechanisms, if irrigation project performance is to be improved. These "details" of internal mechanisms are so important that the investment must be based on specific actions to improve them, rather than deciding on the framework for detail improvement only after the investment is approved.
Chapter 6 - Internal Process Indicators Page 1

Page 83 of 276
As stated earlier in this report, there has been significant work by various groups (Murray-Rust and Snellen, 1993; ICID, 1995) to develop internal indicators. Various researchers, including those at IWMI, have conducted detailed multi-year field studies to quantify the internal indicators in some projects. What has been missing, however, is a procedure which is both rapid and comprehensive enough to give good indications of the critical weak internal links in an irrigation system.
This research project has developed a new framework for assessing the internal processes of irrigation projects. It incorporates two major features:
1. A Rapid Appraisal Process (RAP) 2. A comprehensive set of internal indicators, which when examined as a whole, indicate how
and where irrigation investments should be targeted.
The new internal indices provide ratings to hardware, management, and service throughout the whole system, an approach which has not been used in the past. The complete picture enables one to visualize where changes are needed, and what impact the changes would have at various levels. The new internal indicators, when combined with the RAP, provide an operational or modernization checklist.
The RAP of this research project was designed to obtain data for both the internal indicators and the external indicators. The researchers learned that external indicators require considerably more data and effort to compute than do the internal indicators.
Attachment D contains a listing of each internal indicator, the sub-indicators for that internal indicator, and the criteria for ranking each sub-indicator. Table 6-1 shows a small portion of Attachment D - the information for Indicator I-1. Indicator I-1 rates " Actual service to individual fields ", and has 4 sub-indicators:
I-1A. Measurement of volumes to the field I-1B. Flexibility to the field I-1C. Reliability to the field I-1D. Apparent equity.
Each of the Sub-Indicators (e.g., No. I-1A) has a maximum potential value of 4.0 (best), and a minimum possible value of 0.0 (worst). The Ranking Criteria in Table 6-1 and Attachment D explain how the values of 0-4 are to be assigned.
The value for each Indicator (e.g., No. I-1) is determined by:
1. Applying a relative weighting factor (Wt.) to each sub-indicator value. The weighting factors are only relative to each other within the indicator group; one group may have a maximum value of 4, whereas another group may have a maximum value of 2. The only factor of importance is the relative values of the sub-indicators within a group.
2. Summing the weighted sub-indicator values. 3. Adjusting the final value based on a possible scale of 0-10 (10 indicating the most positive
conditions).
Chapter 6 - Internal Process Indicators Page 2

Page 84 of 276
Table 6-1. Indicator I-1 Information. No. Indicator Sub-Indicator Ranking Criteria Wt I-1 Actual service to
individual fields I-1A Measurement of
volumes to field 4 - Excellent measurement and control devices, properly operated and recorded. 3 - Reasonable meas. & control devices, avg. operation. 2 - Meas. of volumes and flows - useful but poor. 1 - Meas. of flows, reasonably well. 0 - No measurement of volumes or flows.
1
I-1B Flexibility to field
4 - Unlimited freq., rate, duration, but arranged by farmer within a few days. 3 - Fixed freq., rate, or duration, but arranged. 2 - Dictated rotation, but matches approx. crop need. 1 - Rotation, but uncertain. 0 - No rules.
2
I-1C Reliability to field (incl. weeks avail. vs. week needed)
4 - Water always arrives with freq., rate, and duration promised. Volume is known. 3 - A few days delay occasionally, but v. reliable in rate and duration. Volume is known. 2 - Volume is unknown at field, but water arrives when about as needed and in the right
amounts. 1 - Volume is unknown at field. Deliveries are fairly unreliable < 50% of the time. 0 - Unreliable freq., rate, duration, more than 50% of the time; volume is unknown.
4 I-1D Apparent equity 4 - It appears that fields throughout the project and within tertiary units all receive the
same type of water. 3 - Areas of the project receive the same amounts, but within an area it is somewhat
inequitable. 2 - Areas of the project receive somewhat different amounts (unintentionally), but within
an area it is equitable. 1 - It appears to be somewhat inequitable both between areas and within areas. 0 - Appears to be quite inequitable (differences more than 100%) throughout project.
4
Table 6-2 provides a listing of all of the internal process indicators which were developed for the Rapid Appraisal Process. As mentioned earlier, the ranking criteria for each sub-indicator can be found in Attachment D.
Chapter 6 - Internal Process Indicators Page 3

Page 85 of 276
Table 6-2a. Internal Process Indicators, Sub-Indicators, and Relative Weighting Values. No. Indicator Sub-Indicator Wt.
WATER DELIVERY SERVICE I -1 Actual service to individual fields based on traditional
irrigation methods I -1A Measurement of volumes to field 1 I -B Flexibility to field 2
I -1C Reliability to field (incl. weeks avail. vs. week needed) 4 I -1D Apparent equity 4 I- 2 Actual Service to avg. point of EFFECTIVE Differentiation
I -2A # of fields downstream (less is better) 1 I -2B Measurement of volumes to point 4 I -2C Flexibility 4 I -2D Reliability 4 I -2E Apparent equity 4 I -3 Actual Service to avg. point of DELIBERATE Q
Differentiation I -3A # of fields downstream (less is better) 1 I -3B Measurement of volumes to point 4 I -3C Flexibility 4 I -3D Reliability 4 I -3E Apparent equity 4 I -4 Actual Service by Main Canals to Subcanals (Submains)
I -4A Flexibility 1 I -4B Reliability 1 I -4C Equity 1 I -4D Control of flows to submains as stated 1.5 I- 5 Stated Service to Individual Fields
I -5A Measurement of volumes to field 1 I -5B Flexibility to field 2 I -5C Reliability to field (incl. weeks avail. vs. week needed) 4 I -5D Apparent equity 4 I- 6 Stated Service to avg. point of EFFECTIVE Differentiation.
I -6A # of fields downstream (less is better) 1 I -6B Measurement of volumes to point 4 I -6C Flexibility 4 I -6D Reliability 4 I -6E Equity 4 I- 7 Stated service to avg. point of DELIBERATE Q
differentiation. I -7A # of fields downstream (less is better) 1 I -7B Measurement of volumes to point 4
I -7C Flexibility 4 I -7D Reliability 4 I -7E Equity 4 I- 8 Stated Service by Main Canals to Subcanals (Submains)
I -8A Flexibility 1 I -8B Reliability 1 I -8C Equity 1 I -8D Control of flows to submains as stated 1.5 I- 9 Lack of Anarchy Index - (Evidence of No Anarchy in Canal
System u/s of Ownership Change) I -9A Degree to which deliveries are not taken out of turn above
point of ownership change 2
I -9B Noticeable non-existence of unauthorized turnouts from canals above point of ownership change
1
I -9C Lack of vandalism of structures above the point of ownership change, to obtain flow
1
Chapter 6 - Internal Process Indicators Page 4

Page 86 of 276
Table 6-2b. Internal Process Indicators, Sub-Indicators, and Relative Weighting Values. No. Indicator Sub-Indicator Wt.
MAIN CANAL CHARACTERISTICS I- 10 Cross-Regulator Hardware (Main Canal)
I -10A Ease of cross-regulator operation under current target operation. (This doesn't mean that current targets are being met - just that it would be easy or difficult to meet them)
1
I -10B Probable ease of cross-regulator operation if system was to be required to provide better service to turnouts (this is related to the suitability of the device, also)
2
I -10C Level of maintenance 1 I -10D Fluctuation (max daily ±%) of target value in the canal itself
(NOT the DELIVERY target value) (e.g., water level in the canal rather than outlet Q)
3
I -10E Travel time of flow rate change through length of this canal level
2
I -11 Capacities (Main Canal) I -11A Headworks and first canal section capacity vs. peak actual
(crop ET-rain) at time of maximum demand, under current operation (i.e., gross compared to net)
1.3
I -11B Headworks and first canal section capacity vs. peak potential (crop ET - rain) with 100% cropping intensity at that time
2.7
I -11C Capacity (limitations) of structures or canal cross section further down in the canal
2
I -11D Availability of effective spill points 1 I- 12 Turnouts (from Main Canals)
I -12A Ease of turnout operation under current target operation mode/frequency.
1
I -12B Ease of turnout operation if system provides better service to turnouts from this canal (this is related to the suitability of the device, also)
2
I -12C Level of maintenance 1 I -12D Capacity (limitations) 1 I- 13 Regulating Reservoirs
I -13A Suitability of number and location(s) 2 I -13B Effectiveness of operation 2 I -13C Suitability of capacities 1 I -13D Maintenance 1 I- 14 Communications (Main Canal)
I -14A Actual frequency of communication of operators along this canal with upper level
1
I -14B Actual frequency of communication of operators or supervisors along this canal (or indirectly by upper level that then transmits orders down to them) with personnel at lower level
1
I -14C Dependability of voice communications (by phone or radio) 3 I -14D Frequency of physical visits by supervisors to field operators 2 I -14E Existence and frequency of remote monitoring (auto. or
manual) at key spill points, including the end 3
Chapter 6 - Internal Process Indicators Page 5

Page 87 of 276
Table 6-2c. Internal Process Indicators, Sub-Indicators, and Relative Weighting Values. No. Indicator Sub-Indicator Wt. I -15 General Conditions (Main Canal)
I -15A Availability of roads along canal 2 I -15B General level of maintenance 1 I -15C General level of undesired seepage (if deliberate
conjunctive use is practiced, some seepage may be desired) 1
I -15D Availability of proper equipment and staff to adequately maintain this canal
2
I -15E Time to travel from maintenance yard to most distant point (for major equipment maintenance crew)
1
I -16 Operation (Main Canal) I -16A How frequently does the headworks respond to realistic real
time feedback from the canal operators/observers? 2
I -16B Existence and effectiveness of water ordering/delivery procedures to match actual demands. This is different than previous question, which dealt with mis-match of orders, wedge storage var. and wave travel time problems
1
I -16C Clarity and correctness of instructions to operators 1 I -16D Frequency of checking total length of canal 1
SUBMAIN CANAL CHARACTERISTICS I- 17 Cross-Regulators (Submain Canals)
I -17A Ease of cross-regulator operation under current target operation. (This doesn't mean that current targets are being met - just that it would be easy or difficult to meet them)
1
I -17B Probable ease of cross-regulator operation if system was to be required to provide better service to turnouts (this is related to the suitability of the device, also)
2
I -17C Level of maintenance 1 I -17D Fluctuation (max daily ±%) of target value in the canal itself
(NOT the DELIVERY target value) 3
I -17E Travel time of flow rate change through this canal level 2 I -18 Capacities (Submain Canals)
I -18A Headworks and first canal section capacity vs. peak actual (crop ET-rain) at time of maximum demand, under current operation (i.e., gross compared to net)
1.3
I -18B Headworks and first canal section capacity vs. peak potential (crop ET - rain) with 100% cropping intensity at that time
2.7
I -18C Capacity (limitations?) of structures or canal cross section further down in the canal
2
I -18D Availability of effective spill points 1 I- 19 Turnouts (from Submain Canals)
I -19A Ease of turnout operation under current target operation mode/frequency
1
I -10B Ease of turnout operation if system provides better service to turnouts from this canal (this is related to the suitability of the device, also)
2
I -19C Level of maintenance 1 I -19D Capacity (limitations) 1 I- 20 Communications (Submain Canals)
I -20A Actual frequency of communication of operators along this canal with upper level
1
I -20B Actual frequency of communication of operators or supervisors along this canal (or indirectly by upper level that then transmits orders down to them) with personnel at lower level
1
I -20C Dependability of voice comm. (by phone or radio) 3 I -20D Frequency of physical visits by supervisors to field operators
of this level 2
I -20E Existence and frequency of remote monitoring (auto. or manual) at key spill points, including the end
3
Chapter 6 - Internal Process Indicators Page 6
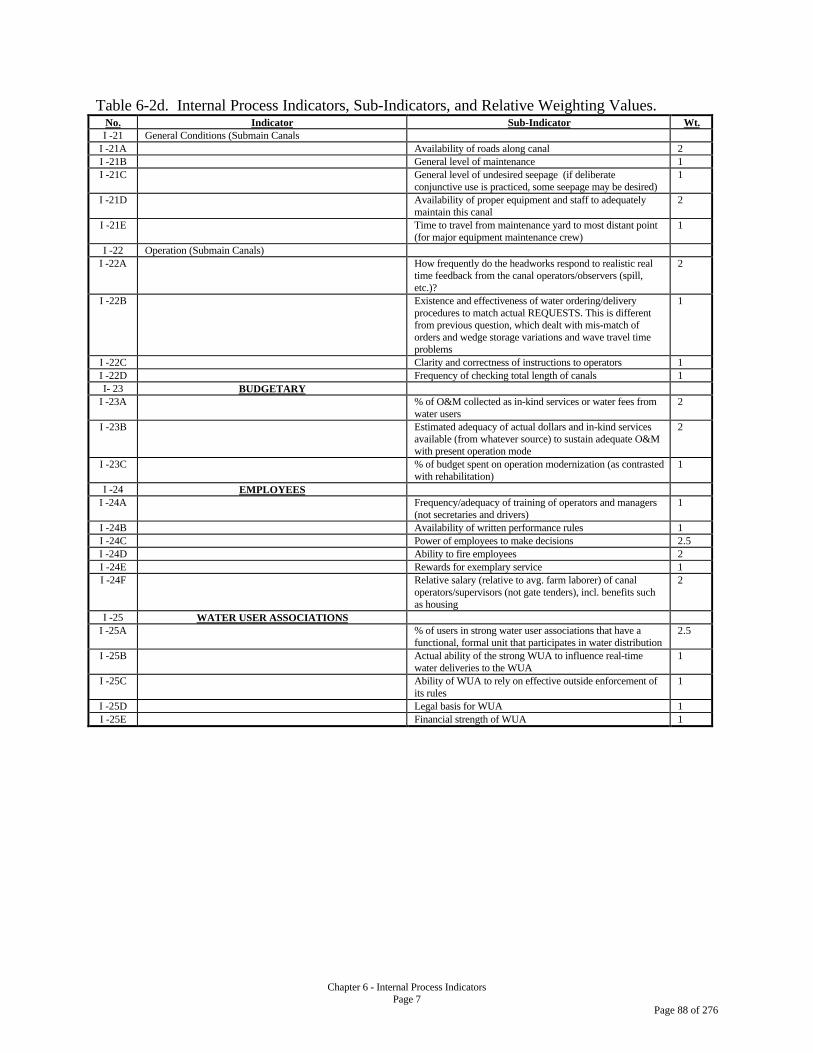
Page 88 of 276
Table 6-2d. Internal Process Indicators, Sub-Indicators, and Relative Weighting Values. No. Indicator Sub-Indicator Wt. I -21 General Conditions (Submain Canals
I -21A Availability of roads along canal 2 I -21B General level of maintenance 1 I -21C General level of undesired seepage (if deliberate
conjunctive use is practiced, some seepage may be desired) 1
I -21D Availability of proper equipment and staff to adequately maintain this canal
2
I -21E Time to travel from maintenance yard to most distant point (for major equipment maintenance crew)
1
I -22 Operation (Submain Canals) I -22A How frequently do the headworks respond to realistic real
time feedback from the canal operators/observers (spill, etc.)?
2
I -22B Existence and effectiveness of water ordering/delivery procedures to match actual REQUESTS. This is different from previous question, which dealt with mis-match of orders and wedge storage variations and wave travel time problems
1
I -22C Clarity and correctness of instructions to operators 1 I -22D Frequency of checking total length of canals 1 I- 23 BUDGETARY
I -23A % of O&M collected as in-kind services or water fees from water users
2
I -23B Estimated adequacy of actual dollars and in-kind services available (from whatever source) to sustain adequate O&M with present operation mode
2
I -23C % of budget spent on operation modernization (as contrasted with rehabilitation)
1
I -24 EMPLOYEES I -24A Frequency/adequacy of training of operators and managers
(not secretaries and drivers) 1
I -24B Availability of written performance rules 1 I -24C Power of employees to make decisions 2.5 I -24D Ability to fire employees 2 I -24E Rewards for exemplary service 1 I -24F Relative salary (relative to avg. farm laborer) of canal
operators/supervisors (not gate tenders), incl. benefits such as housing
2
I -25 WATER USER ASSOCIATIONS I -25A % of users in strong water user associations that have a
functional, formal unit that participates in water distribution 2.5
I -25B Actual ability of the strong WUA to influence real-time water deliveries to the WUA
1
I -25C Ability of WUA to rely on effective outside enforcement of its rules
1
I -25D Legal basis for WUA 1 I -25E Financial strength of WUA 1
Chapter 6 - Internal Process Indicators Page 7

Page 89 of 276
Table 6-2e. Internal Process Indicators, Sub-Indicators, and Relative Weighting Values. PRESSURIZED SYSTEMS TODAY
I- 26 Ability of present service to individual fields, to accommodate pressurized irrig. systems
I -26A Measurement and control of volumes to field 1 I -26B Flexibility to field 1 I -26C Reliability to field 1
PRESSURIZED SYSTEMS TOMORROW I-27 If they wanted to change to a more flexible system which
would accommodate widespread conversion to pressurized methods with a reasonable project efficiency, what would be required?
I -27A Management 1 I -27B Hardware 1
OTHER I -28 Number of Turnouts per (operator, gate oper., supervisor) 1 I -29 What level of sophistication is there in receiving and using
feedback information? It does not need to be automatic. 1
I -30 To what extent are computers being used for billing/record management?
1
I -31 To what extent are computers used for canal control? 1
No single internal process indicator is sufficient by itself to describe a project. But when the internal indicators are taken as a whole and combined with some of the external indicators, a clear image emerges about the design, operation, and management of an irrigation project. Furthermore, these indicators provide the basis for a rational program of rehabilitation and modernization which will enhance the operation, management, and outputs of an irrigation project. The internal process indicators of Table 6-2 must be assessed by qualified people who have a good understanding of irrigation project design, operation, and modernization.
Internal Indicators: Results The following figures are based on Table 6-2. Typically, two figures are presented for each indicator. The first figure is the composite internal process indicator with a maximum value of 10.0 (Figure 6-1). The next figure describes the sub-indicators. The maximum value on this graph is 4.0 (Figure 6-2).
Chapter 6 - Internal Process Indicators Page 8

.
Page 90 of 276
Ch202 A
ctu
al s
ervi
ce t
o in
div
idu
al f
ield
s, b
ased
on
trad
itio
nal
on
-far
m ir
rig
atio
n m
eth
od
s (o
vera
ll in
dex
)10
9
8
7
6
5
4
3
2
1
0
Lam
Pao
, Tha
iland
Dez
, Ira
n
Gui
lan,
Iran
Sey
han,
Tur
key
Maj
alga
on, I
ndia
Dan
tiwad
a, In
dia
Bha
kra,
Indi
a
Mud
a, M
alay
sia
Kem
ubu,
Mal
aysi
a
Ben
i Am
ir, M
oroc
co
Offi
ce d
u N
iger
, Mal
i
Rio
Yaq
ui A
lto, D
R
Coe
llo, C
olom
bia
Sal
daña
, Col
ombi
a
Cup
atitz
io, M
exic
o
Rio
May
o, M
exic
o
Figure 6-1. Indicator I-1. Actual water delivery service to individual fields, based on traditional field irrigation methods.
The legends for many of the figures in this chapter will follow the convention seen in Figure 6-2 below, defined as:
"A" Lightly shaded columns "B" Dark columns, completely filled in "C" Columns with occasional horizontal hash marks "D" Columns with no fill-in "E" Columns with cross-hatching and dots
Column "A" will always be on the far left hand side of a group. The lack of a column with a particular shading indicates a value of zero for that sub-indicator. For example, Figure 6-2 has no column "A" for Lam Pao, Dez, Guilan, Majalgaon, Dantiwada, Bhakra, Kemubu, Office du Niger, or Rio Yaqui Alto. In all those projects the measurement of volumes of water delivered to individual fields is so poor or lacking that they merited a "0.0" score for that sub-indicator.
Chapter 6 - Internal Process Indicators Page 9

.
Page 91 of 276
C h 2 0 1
Act
ual
ser
vice
to
ind
ivid
ual
fie
lds,
bas
ed o
n
trad
itio
nal
on
-far
m ir
rig
atio
n m
eth
od
s
4
3
2
1
0
A - M e a s u r e m e n t o f v o l u m e s t o f i e l d
B - F l e x i b i l i t y t o f i e l d
C - R e l i a b i l i t y t o f i e l d
D - A p p a r e n t E q u i t y
Lam
Pao
, Tha
iland
Dez
, Ira
n
Gui
lan,
Iran
Sey
han,
Tur
key
Maj
alga
on, I
ndia
Dan
tiwad
a, In
dia
Bha
kra,
Indi
a
Mud
a, M
alay
sia
Kem
ubu,
Mal
aysi
a
Ben
i Am
ir, M
oroc
co
Offi
ce d
u N
iger
, Mal
i
Rio
Yaq
ui A
lto, D
R
Coe
llo, C
olom
bia
Sal
daña
, Col
ombi
a
Cup
atitz
io, M
exic
o
Rio
May
o, M
exic
o
Figure 6-2. Actual water delivery service to individual fields. Based on traditional field irrigation methods. Sub-indicator values for Indicator I-1.
Most field (on-farm) irrigation methods in these irrigation projects are relatively simple, and the farmers and irrigation project staff have low expectations of the level of water delivery service needed. This will be contrasted later with the level of water delivery service needed for pressurized field irrigation systems. As explained earlier, Tables 6-1 and 6-2 indicate the relative weighting given to each sub-indicator of Indicator I-1. Reliability and equity are both given 4 times the relative importance given to measurement of volumes to the fields when computing the final value for Indicator I-1. This indicates the very high importance of those factors in avoiding anarchy by users. Therefore, Guilan and Office du Niger (as examples) received relatively high overall ratings even though water deliveries to individual fields are not measured volumetrically. The ranking and weighting criteria found in Table 6-2 are quite important for developing standardized internal indicators. The authors offer these ranking criteria as a first version of such a procedure, recognizing that this is a new concept and it will be improved with time.
Figure 6-1 shows that the majority of the projects visited have relatively similar overall service ratings, although there are major differences in the components of service. The level of service to individual fields definitely has room for immediate improvement, but by the same token, it is not devastatingly poor in most cases. For the most part, irrigation projects which have been recipients of "modernization" aspects perform better in this important aspect than those which have not received modernization. Bhakra (India) is an example of a project in Asia without modernization and its rating for Indicator I-1 is very low. Lam Pao, Dez, and Bhakra are outstanding in their relatively low levels of water delivery service. Lam Pao, Dez, and Bhakra also had noticeable farmer dissatisfaction with the water service. The "level of service" does not include a measure of the adequacy of water in volume. For example, Lam Pao and Bhakra have very different Relative Water Supplies (Annual RWSITRC =2.2 for Lam Pao vs. 1.2 for Bhakra).
Chapter 6 - Internal Process Indicators Page 10

Page 92 of 276
Rather, Indicator I-1 is a measure of the reliability, flexibility, equity, and measurement of the existing supply (whatever it is) to individual fields.
Figure 6-2 shows that 2 projects (Office du Niger and Rio Yaqui Alto) have outstanding flexibility in water delivery service to individual fields. Both projects have two important design/operation characteristics (seen later in this report) - they have a very high density of turnouts, and they allow spill of canal water. The high amounts of tailender canal spill from the lateral canals was not a deliberate design feature, but it could have been. In both projects, the spill reduces the overall project irrigation efficiency because both projects, (especially Office du Niger,) lack a systematic design for recapturing the spill within the project. In both projects such a design feature (spill recovery) could have been incorporated, which would have provided both a high irrigation efficiency and flexible delivery to the fields.
Rio Mayo has little spill in its distribution system, and does not have the topography, physical layout, and soils which would allow any spill to be easily recaptured and reused. Therefore, it requires a completely different engineering and operations strategy to provide the high degree of flexibility - the operators know the flow rates throughout the project reasonably well, have excellent communications and mobility, and work quickly and quite efficiently to provide flexibility.
The RAP examined the level of service provided at each level in the hydraulic system. These levels are:
1. To the field (as seen in Figures 6-1 and 6-2).
2. To the point of effective differentiation. This is the furthest downstream point in the irrigation distribution network with a realistic flow control and measurement structure. "Realistic" means that if the flow is supposed to be split into 2 equal components, it is indeed possible to do so relatively well. Likewise, if there is a specified flow rate downstream of that point, the point is one of "effective differentiation" and it is realistically possible to control and measure that flow.
3. To the point of deliberate differentiation. This is the furthest downstream point in the irrigation distribution network at which the flow is deliberately split or controlled. The fact that the flow is divided at a point does not mean that the split is effective or equitable. The point of "effective" differentiation may be the same as the point of "deliberate" differentiation, or it may be further upstream. For example, a small channel may supply several fields simultaneously, but there is no effective means of equitably dividing the flow between the various fields.
4. To the submains (laterals), from the mainlines.
Furthermore, there may be a difference between the "actual" service to a level and the "stated" service. In the project office, a person may hear one story (the "stated" service story), but then see a completely different level of "actual" service in the field.
Chapter 6 - Internal Process Indicators Page 11

.
.
Page 93 of 276
Figure 6-4. Sub-indicator values of Internal process indicator I-2. Actual service to the point of effective differentiation.
Chapter 6 - Internal Process Indicators Page 12
Lam
Pao
, Tha
iland
C h 2 0 3
0
1
2
3
4
Act
ual
Ser
vice
to
avg
. po
int
of
Eff
ecti
ve D
iffe
ren
tiat
ion
bas
ed o
n
Tra
dit
ion
al O
n-F
arm
Met
ho
ds
A - N u m b e r o f f i e l d s d o w n s t r e a m
B - M e a s u r e m e n t o f v o l u m e s
C - F l e x i b i l i t y
D - R e l i a b i l i t y
E - A p p a r e n t E q u i t y
0
1
2
3
4
5
6
7
8
9
10A
ctu
al S
ervi
ce t
o a
vg. p
oin
t o
f E
ffec
tive
Dif
fere
nti
atio
n
bas
ed o
n T
rad
itio
nal
On
-Far
m M
eth
od
s (o
vera
ll in
dex
)
Lam
Pao
, Tha
iland
Dez
, Ira
n
Dez
, Ira
n
Gui
lan,
Iran
Gui
lan,
Iran
Sey
han,
Tur
key
Maj
alga
on, I
ndia
Dan
tiwad
a, In
dia
Sey
han,
Tur
key
Maj
alga
on, I
ndia
Bha
kra,
Indi
a
Dan
tiwad
a, In
dia
Mud
a, M
alay
sia
Bha
kra,
Indi
aK
emub
u, M
alay
sia
Ben
i Am
ir, M
oroc
coM
uda,
Mal
aysi
a
Offi
ce d
u N
iger
, Mal
i K
emub
u, M
alay
sia
Rio
Yaq
ui A
lto, D
R
Ben
i Am
ir, M
oroc
coC
oello
, Col
ombi
a
Offi
ce d
u N
iger
, Mal
iS
alda
ña, C
olom
bia
Cup
atitz
io, M
exic
o R
io Y
aqui
Alto
, DR
Rio
May
o, M
exic
o C
oello
, Col
ombi
a
Sal
daña
, Col
ombi
a
Cup
atitz
io, M
exic
o
Rio
May
o, M
exic
o
Figure 6-3. Indicator I-2. Actual service to the average point of effective differentiation.
Figure 6-3 displays Indicator I-2, which rates the water delivery service to a point which is typically upstream of the field level in the irrigation projects visited. Several fields were typically downstream of the final control point. In the western United States, the average point of effective differentiation is typically a single field.
Ch204

.
Page 94 of 276
The sub-indicators or components of Indicator of I-2 are found in Figure 6-4. It can be seen from Figure 6-4 that all of the Asian Projects visited (Lam Pao, Majalgaon, Dantiwada, Bhakra, Muda, and Kemubu) received a "zero" score for the number of fields downstream of this point indicating that there is a low density of turnouts.
C h 2 0 6
Act
ual
Ser
vice
to
avg
. po
int
of
DE
LIB
ER
AT
E Q
dif
fere
nti
atio
n
bas
ed o
n t
rad
itio
nal
irri
g. m
eth
od
s (o
vera
ll in
dex
)
1 0
9
8
7
6
5
4
3
2
1
0
Lam
Pao
, Tha
iland
Dez
, Ira
n
Gui
lan,
Iran
Sey
han,
Tur
key
Maj
alga
on, I
ndia
Dan
tiwad
a, In
dia
Bha
kra,
Indi
a
Mud
a, M
alay
sia
Kem
ubu,
Mal
aysi
a
Ben
i Am
ir, M
oroc
co
Offi
ce d
u N
iger
, Mal
i
Rio
Yaq
ui A
lto, D
R
Coe
llo, C
olom
bia
Sal
daña
, Col
ombi
a
Cup
atitz
io, M
exic
o
Rio
May
o, M
exic
o
Figure 6-5. Internal process indicator I-3. Actual service to the point of deliberate differentiation.
Internal process indicator I-3 (Figure 6-5) shows the actual service to the point of deliberate differentiation. These scores are lower than those for Indicator I-2 (effective differentiation) for Lam Pao, Guilan, Majalgaon, Dantiwada, Muda, Kemubu, and Cupatitzio. The lower scores indicate that the irrigation project loses control of the water at the lower ends (toward the field) of the hydraulic system, and that flows are poorly split and re-regulated downstream of more effective upstream control points.
Chapter 6 - Internal Process Indicators Page 13

.
Page 95 of 276
C h 2 0 5
0
1
2
3
4A
ctu
al S
ervi
ce t
o a
vg. p
oin
t o
f D
elib
erat
e D
iffe
ren
tiat
ion
bas
ed
on
Tra
dit
ion
al O
n-F
arm
Met
ho
ds
A - N u m b e r o f f i e l d s d o w n s t r e a m
B - M e a s u r e m e n t o f v o l u m e s
C - F lex ib i l i t y
D - Re l iab i l i t y
E - A p p a r e n t E q u i t y
Lam
Pao
, Tha
iland
Dez
, Ira
n
Gui
lan,
Iran
Sey
han,
Tur
key
Maj
alga
on, I
ndia
Dan
tiwad
a, In
dia
Bha
kra,
Indi
a
Mud
a, M
alay
sia
Kem
ubu,
Mal
aysi
a
Ben
i Am
ir, M
oroc
co
Offi
ce d
u N
iger
, Mal
i
Rio
Yaq
ui A
lto, D
R
Coe
llo, C
olom
bia
Sal
daña
, Col
ombi
a
Cup
atitz
io, M
exic
o
Rio
May
o, M
exic
o
Figure 6-6. Sub-indicator values of Internal process indicator I-3. Actual service to the point of deliberate differentiation.
A hypothesis of this research was that the quality of water delivery service to the fields would depend upon the quality of water delivery service of the main canals to the submains, and the quality of service provided by the submains to the points of differentiation. Figure 6-7, when compared to Figure 6-1, shows that Lam Pao, Seyhan, Muda, Beni Amir, Office du Niger, Coello, Saldaña, and Rio Mayo have equally high or low service to the field as what is provided by the main canal to the submain. In other words, the overall quality of service did not appreciably change. On the other hand, the quality of service for Dez and Bhakra deteriorated with distance down the water network. Nevertheless, the Dez and Bhakra conditions are still consistent with the hypothesis - which suggests that good conditions cannot exist downstream unless good conditions exist upstream.
However, Guilan, Majalgaon, Dantiwada, Kemubu, Rio Yaqui Alto, and Cupatitzio all went the opposite direction. The water delivery service was considerably better at the field level than what was provided by the main canal. The estimated irrigation efficiencies for these projects were 46, 32, 29, 20, 31, and 25 percent, respectively (average = 30%). Also, the level of water delivery service delivered by the main canal was typically quite low (average = 4.0) and the actual service to individual fields (average score = 5.3) also has considerable room for improvement. These three factors indicate that if there is plenty of water available, the upper levels of a canal system may be operated less-than-satisfactorily without further degrading the service downstream. However, the data show that the final product (downstream service = 5.3 out of 10.0) is still not superb and the irrigation efficiencies are quite low. A conclusion is that just because the service further downstream did not degrade, the quality of service was still poor, and therefore, this is not a desirable model to follow.
Chapter 6 - Internal Process Indicators Page 14

. .
Page 96 of 276
4
Act
ual
Ser
vice
by
mai
n c
anal
s to
its
sub
can
als
Act
ual
Ser
vice
by
mai
n c
anal
s to
3
2
1
0
its
sub
can
als
(ove
rall
ind
ex)
Lam
Pao
, Tha
iland
0
1
2
3
4
5
6
7
8
9
1 0 C h 2 0 8
Figure 6-7. Internal process indicator I-4. Actual service by the main canals to the submain canals.
C h 2 0 7
Figure 6-8. Sub-indicator values of Internal process indicator I-4. Actual service by the main canals to the submain canals.
Chapter 6 - Internal Process Indicators Page 15
Dez
, Ira
n
Gui
lan,
Iran
Sey
han,
Tur
key
Maj
alga
on, I
ndia
Dan
tiwad
a, In
dia
Bha
kra,
Indi
a
Mud
a, M
alay
sia
Kem
ubu,
Mal
aysi
a
Ben
i Am
ir, M
oroc
co
Offi
ce d
u N
iger
, Mal
i
Rio
Yaq
ui A
lto, D
R
Coe
llo, C
olom
bia
Sal
daña
, Col
ombi
a
Cup
atitz
io, M
exic
o
Rio
May
o, M
exic
o
A -F lex ib i l i t y
B - Re l i ab i l i t y
C - A p p a r e n t E q u i t y
D - Con t ro l o f f l ows t o s u b m a i n s
Lam
Pao
, Tha
iland
Dez
, Ira
n
Gui
lan,
Iran
Sey
han,
Tur
key
Maj
alga
on, I
ndia
Dan
tiwad
a, In
dia
Bha
kra,
Indi
a
Mud
a, M
alay
sia
Kem
ubu,
Mal
aysi
a
Ben
i Am
ir, M
oroc
co
Offi
ce d
u N
iger
, Mal
i
Rio
Yaq
ui A
lto, D
R
Coe
llo, C
olom
bia
Sal
daña
, Col
ombi
a
Cup
atitz
io, M
exic
o
Rio
May
o, M
exic
o

. .
Page 97 of 276
C h 2 1 0 1 0
A c t u a l S t a t e d
Figure 6-9. Internal process indicator I-5 and Indicator I-1. Stated and actual service to individual fields.
Figure 6-9 shows Indicator I-5, as well as the values for the earlier Indicator I-1 - both of which are for the service to individual fields. Three (Lam Pao, Dez, Rio Yaqui Alto) of the four projects with the lowest water delivery service ratings have highly over-inflated stated opinions of the service they offer. The fourth project with a very low field service rating (Bhakra) has a moderately over-inflated opinion of its service.
C h 2 1 2
Figure 6-10. Internal process indicator I-6 together with Indicator I-2. Stated and actual service to the average point of effective differentiation.
Figure 6-10 is similar to Figure 6-9, but refers to the average point of effective differentiation. Again, it can be seen that Lam Pao and Bhakra projects have greatly inflated views of the level of
Chapter 6 - Internal Process Indicators Page 16
Ser
vice
to
avg
. po
int
of
Eff
ecti
ve D
iffe
ren
tiat
ion
Ser
vice
to
ind
ivid
ual
fie
lds,
bas
ed o
n
bas
ed o
n T
rad
itio
nal
On
-Far
m M
eth
od
s (o
vera
ll in
dex
)tr
adit
ion
al o
n-f
arm
irri
gat
ion
met
ho
ds
(ove
rall
ind
ex)
1 0
9
8
7
6
5
4
3
2
1
0
9
8
7
6
5
4
3
2
1
0
Lam
Pao
, Tha
iland
Dez
, Ira
n
Gui
lan,
Iran
Sey
han,
Tur
key
Maj
alga
on, I
ndia
Dan
tiwad
a, In
dia
Bha
kra,
Indi
a
Mud
a, M
alay
sia
Kem
ubu,
Mal
aysi
a
Ben
i Am
ir, M
oroc
co
Offi
ce d
u N
iger
, Mal
i
Rio
Yaq
ui A
lto, D
R
Coe
llo, C
olom
bia
Sal
daña
, Col
ombi
a
Cup
atitz
io, M
exic
o
Rio
May
o, M
exic
o
A c t u a l S t a t e d
Lam
Pao
, Tha
iland
Dez
, Ira
n
Gui
lan,
Iran
Sey
han,
Tur
key
Maj
alga
on, I
ndia
Dan
tiwad
a, In
dia
Bha
kra,
Indi
a
Mud
a, M
alay
sia
Kem
ubu,
Mal
aysi
a
Ben
i Am
ir, M
oroc
co
Offi
ce d
u N
iger
, Mal
i
Rio
Yaq
ui A
lto, D
R
Coe
llo, C
olom
bia
Sal
daña
, Col
ombi
a
Cup
atitz
io, M
exic
o
Rio
May
o, M
exic
o

.
.
Page 98 of 276
Ser
vice
by
mai
n c
anal
s to
Ser
vice
to
avg
. po
int
of
DE
LIB
ER
AT
E Q
dif
fere
nti
atio
n b
ased
its
sub
can
als
(ove
rall
ind
ex)
on
tra
dit
ion
al ir
rig
. met
ho
ds
(ove
rall
ind
ex)
Lam
Pao
, Tha
iland
Dez
, Ira
n
Lam
Pao
, Tha
iland
Dez
, Ira
n
Gui
lan,
Iran
Gui
lan,
Iran
Sey
han,
Tur
key
Sey
han,
Tur
key
9
8
7
6
5
4
3
2
1
0
A c t u a l S t a t e d
Maj
alga
on, I
ndia
Maj
alga
on, I
ndia
Dan
tiwad
a, In
dia
Dan
tiwad
a, In
dia
Bha
kra,
Indi
aB
hakr
a, In
dia
Mud
a, M
alay
sia
Mud
a, M
alay
sia
Kem
ubu,
Mal
aysi
aK
emub
u, M
alay
sia
Ben
i Am
ir, M
oroc
coB
eni A
mir,
Mor
occo
Offi
ce d
u N
iger
, Mal
iO
ffice
du
Nig
er, M
ali
Rio
Yaq
ui A
lto, D
RR
io Y
aqui
Alto
, DR
Coe
llo, C
olom
bia
Coe
llo, C
olom
bia
Sal
daña
, Col
ombi
aS
alda
ña, C
olom
bia
Cup
atitz
io, M
exic
oC
upat
itzio
, Mex
ico
Rio
May
o, M
exic
o R
io M
ayo,
Mex
ico
Figure 6-12. Internal process indicator I-8 and Indicator I-4. Stated and actual service by main canals to subcanals.
Figure 6-12 again shows a large inconsistency between stated and actual service by the main canals on Bhakra, Rio Yaqui Alto, and Lam Pao projects. These projects provide low levels of
Chapter 6 - Internal Process Indicators Page 17
9
8
7
6
5
4
3
2
1
0
A c t u a l S t a t e d
Figure 6-11. Internal process indicator I-7 and Indicator I-3. Stated and actual service to the average point of deliberate differentiation.
C h 2 1 61 0
service which they provide (as contrasted to actual service). Dez and Rio Yaqui Alto, the two other projects with the lowest service to the field, also have somewhat inflated viewpoints. Interestingly, Rio Mayo, Cupatitzio, Kemubu, Muda, Dantiwada, Majalgaon, and Guilan have better-than-stated service - indicating that field operators may be taking matters into their own hands and providing better service than official policy dictates.
C h 2 1 41 0

. .
Page 99 of 276
service to the individual fields, but the inconsistency is also shared by many of the other projects, including Office du Niger, Saldaña, and Coello. The projects which stand out positively in the previous figures (stated vs. actual service) are Guilan, Dantiwada, Muda, and Rio Mayo. It appears that the supervisors and senior engineers have realistic understandings of (and recognition of) the benefits and shortcomings of their project operations.
Figure 6-13. Internal process indicator I-9. Lack of anarchy index.
Indicator I-9 rates the lack of noticeable anarchy observed in the projects. A score of 10 indicates that all water is taken when authorized and at authorized turnouts. The predominate factor for "anarchy" generally results from taking water out of turn rather than vandalism of structures or the existence of unauthorized turnouts. Dez had noticeable unauthorized turnouts and vandalism which also contributed to its lower-than-average score. The topic of anarchy will be discussed in more detail in later chapters.
C h 2 2 0
0
1
2
3
4
5
6
7
8
9
1 0
Mai
n C
anal
Cro
ss-R
egu
lato
r H
ard
war
e (o
vera
ll in
dex
)
Lam
Pao
, Tha
iland
Dez
, Ira
n
Gui
lan,
Iran
Sey
han,
Tur
key
Maj
alga
on, I
ndia
Dan
tiwad
a, In
dia
Bha
kra,
Indi
a
Mud
a, M
alay
sia
Kem
ubu,
Mal
aysi
a
Ben
i Am
ir, M
oroc
co
Offi
ce d
u N
iger
, Mal
i
Rio
Yaq
ui A
lto, D
R
Coe
llo, C
olom
bia
Sal
daña
, Col
ombi
a
Cup
atitz
io, M
exic
o
Rio
May
o, M
exic
o
0
1
2
3
4
5
6
7
8
9
1 0
Evi
den
ce o
f L
ack
of
An
arch
y in
Can
al S
yste
m
u/s
of
ow
ner
ship
ch
ang
e (o
vera
ll in
dex
)
C h 2 1 8
Lam
Pao
, Tha
iland
Dez
, Ira
n
Gui
lan,
Iran
Sey
han,
Tur
key
Maj
alga
on, I
ndia
Dan
tiwad
a, In
dia
Bha
kra,
Indi
a
Mud
a, M
alay
sia
Kem
ubu,
Mal
aysi
a
Ben
i Am
ir, M
oroc
co
Offi
ce d
u N
iger
, Mal
i
Rio
Yaq
ui A
lto, D
R
Coe
llo, C
olom
bia
Sal
daña
, Col
ombi
a
Cup
atitz
io, M
exic
o
Rio
May
o, M
exic
o
Figure 6-14. Internal process indicator I-10. Cross Regulator Hardware (Main Canal). Overall value.
Chapter 6 - Internal Process Indicators Page 18

. .
Page 100 of 276
Figure 6-14 is the first graph which clearly demonstrates a need for improved engineering designs and operation - in this case, within the main canal system itself. Figure 6-15 separates out the rating between ease of operation, level of maintenance, fluctuations of target levels, and wave travel time. A few of the projects have high ratings, but there are also a significant number of very poor ratings. Rio Mayo is an example of a main canal system with poor hardware but well trained, mobile, and motivated staff who are getting the most they can out of their hardware. However, for Rio Mayo to improve its performance beyond the current level of service, the canal hardware must first be improved.
C h 2 1 94
A - E a s e o f c r o s s - r e g u l a t o r o p e r a t i o n u n d e r c u r r e n t t a r g e t o p e r a t i o n
0
Figure 6-15. Internal process indicator I-10 sub-indicator values. Main canal cross regulator hardware.
C h 2 2 2
Cro
ss-R
egu
lato
r H
ard
war
e (M
ain
Can
al)
3
2
1
Lam
Pao
, Tha
iland
Dez
, Ira
n
Gui
lan,
Iran
Sey
han,
Tur
key
Maj
alga
on, I
ndia
Dan
tiwad
a, In
dia
Bha
kra,
Indi
a
Mud
a, M
alay
sia
Kem
ubu,
Mal
aysi
a
Ben
i Am
ir, M
oroc
co
Offi
ce d
u N
iger
, Mal
i
Rio
Yaq
ui A
lto, D
R
Coe
llo, C
olom
bia
Sal
daña
, Col
ombi
a
Cup
atitz
io, M
exic
o
Rio
May
o, M
exic
o
B - P r o b a b l e e a s e o f c r o s s -r e g u l a t o r o p e r a t i o n i f s y s t e m w a s t o b e r e q u i r e d t o p r o v i d e b e t t e r s e r v i c e t o t u r n o u t s
C - L e v e l o f m a i n t e n a n c e
D - F l u c t u a t i o n ( m a x d a i l y ± % ) o f t a r g e t v a l u e i n t h e c a n a l i t s e l f
E - T r a v e l t i m e o f f l o w r a t e c h a n g e t h r o u g h l e n g t h o f t h i s c a n a l l e v e l
Figure 6-16. Internal process indicator I-11. Main canal capacities.
Chapter 6 - Internal Process Indicators Page 19
Lam
Pao
, Tha
iland
Dez
, Ira
n
Gui
lan,
Iran
Sey
han,
Tur
key
Maj
alga
on, I
ndia
Dan
tiwad
a, In
dia
Bha
kra,
Indi
a
Mud
a, M
alay
sia
Kem
ubu,
Mal
aysi
a
Ben
i Am
ir, M
oroc
co
Offi
ce d
u N
iger
, Mal
i
Rio
Yaq
ui A
lto, D
R
Coe
llo, C
olom
bia
Sal
daña
, Col
ombi
a
Cup
atitz
io, M
exic
o
Rio
May
o, M
exic
o
0
1
2
3
4
5
6
7
8
9
1 0
Mai
n C
anal
Cap
acit
ies
(ove
rall
ind
ex)

. .
Page 101 of 276
Internal process indicator I-11 combines some of the elements of the IWMI7 and ITRC3 external indicators (Water Delivery Capacity, %). It shows that 5 of the 16 projects have no restrictions, even at 100% cropping intensity. Other projects have moderate to severe canal capacity problems. It is interesting to note that there is little correlation between the canal capacities and the level of service provided by the irrigation projects. In other words, the fact that a project has small canal capacities is not related to how well the limited supply is delivered.
Figure 6-17. Internal process indicator I-12. Main canal turnouts.
Another important design and operation point is the turnouts from the main canal. Turnout designs vary widely in their ease of operation, and in how well operators can control and measure flow rates. Bhakra (the sole project without any modernization aspects) has a noticeably poor design and operation.
C h 2 2 6
Lam
Pao
, Tha
iland
Dez
, Ira
n
Gui
lan,
Iran
Sey
han,
Tur
key
Maj
alga
on, I
ndia
Dan
tiwad
a, In
dia
Bha
kra,
Indi
a
Mud
a, M
alay
sia
Kem
ubu,
Mal
aysi
a
Ben
i Am
ir, M
oroc
co
Offi
ce d
u N
iger
, Mal
i
Rio
Yaq
ui A
lto, D
R
Coe
llo, C
olom
bia
Sal
daña
, Col
ombi
a
Cup
atitz
io, M
exic
o
Rio
May
o, M
exic
o
0
1
2
3
4
5
6
7
8
9
1 0
Reg
ula
tin
g R
eser
voir
s (o
vera
ll in
dex
)
Lam
Pao
, Tha
iland
Dez
, Ira
n
Gui
lan,
Iran
Sey
han,
Tur
key
Maj
alga
on, I
ndia
Dan
tiwad
a, In
dia
Bha
kra,
Indi
a
Mud
a, M
alay
sia
Kem
ubu,
Mal
aysi
a
Ben
i Am
ir, M
oroc
co
Offi
ce d
u N
iger
, Mal
i
Rio
Yaq
ui A
lto, D
R
Coe
llo, C
olom
bia
Sal
daña
, Col
ombi
a
Cup
atitz
io, M
exic
o
Rio
May
o, M
exic
o
0
1
2
3
4
5
6
7
8
9
1 0
Mai
n C
anal
Tu
rno
uts
(o
vera
ll in
dex
)
C h 2 2 4
Figure 6-18. Internal process indicator I-13. Regulating reservoirs.
Chapter 6 - Internal Process Indicators Page 20

.
Page 102 of 276
Regulating reservoirs can provide tremendous benefits in terms of easy and efficient operation. All canal systems have difficulties with wave travel time and unsteady flows and spills. Regulating reservoirs can provide operators with a re-starting point in addition to consolidating surface spill and buffering main canal flows. They are a major component of many modernization schemes. Figure 6-18 shows that very few regulating reservoirs are used to date, and those which exist tend to have low ratings in terms of design and management. The exception is Guilan, which utilizes a network of regulation reservoirs at the lower end of its distribution system.
1 0 C h 2 2 8
Mai
n C
anal
Co
mm
un
icat
ion
s (o
vera
ll in
dex
) 9
8
7
6
5
4
3
2
1
0
Lam
Pao
, Tha
iland
Dez
, Ira
n
Gui
lan,
Iran
Sey
han,
Tur
key
Maj
alga
on, I
ndia
Dan
tiwad
a, In
dia
Bha
kra,
Indi
a
Mud
a, M
alay
sia
Kem
ubu,
Mal
aysi
a
Ben
i Am
ir, M
oroc
co
Offi
ce d
u N
iger
, Mal
i
Rio
Yaq
ui A
lto, D
R
Coe
llo, C
olom
bia
Sal
daña
, Col
ombi
a
Cup
atitz
io, M
exic
o
Rio
May
o, M
exic
o
Figure 6-19. Internal process indicator I-14. Main canal communications.
A major consideration in canal management is communications between operators and monitoring of water levels and flows at key control or spill points. One of the first steps in good modernization programs is the purchase of two-way radios for operators. Modern irrigation projects make extensive use of remote "monitoring" at key points, even if there is no remote "control" at those locations. Figure 6-19 shows that all of the projects have room for improvement, and that the majority of projects have considerable modernization potential in this regard. Figure 6-20 shows that remote real-time monitoring (either manual or automatic) only exists in Lam Pao, Guilan, Seyhan, Majalgaon, Dantiwada, Muda, Kemubu, and Beni Amir, and the real-time monitoring is only extensive in Muda, Kemubu and Majalgaon. As a side note, the most active component of irrigation district modernization in California at the moment is in the field of Supervisory Control and Data Acquisition (SCADA). Dozens of California irrigation districts are voluntarily installing remote monitoring and control points (at their own cost) as they attempt to improve their water delivery service while facing a decreasing water supply.
Chapter 6 - Internal Process Indicators Page 21

. .
Page 103 of 276
0
Lam
Pao
, Tha
iland
Figure 6-20. Internal process indicator I-14 sub-indicators. Main canal communications.
C h 2 3 0
Figure 6-21. Internal process indicator I-15. Main canal general conditions.
Figures 6-21 and 6-22 show the state of general conditions along the main canals. Although there are major differences in the sub-indicators, the overall Indicator I-15 values are quite similar. Furthermore, the conditions appeared to be reasonably good - although not perfect. This indicates that although individual projects may need better main canal maintenance or canal access, this is generally not the key aspect of the main canals which affects the level of water delivery service.
Chapter 6 - Internal Process Indicators Page 22
0
1
2
3
4
5
6
7
8
9
1 0
Mai
n C
anal
Gen
eral
Co
nd
itio
ns
(ove
rall
ind
ex)
Co
mm
un
icat
ion
s (M
ain
Can
al)
Lam
Pao
, Tha
iland
C h 2 2 74
3
2
1
Dez
, Ira
n
Dez
, Ira
n
Gui
lan,
Iran
Gui
lan,
Iran
Sey
han,
Tur
key
Maj
alga
on, I
ndia
Dan
tiwad
a, In
dia
Sey
han,
Tur
key
Maj
alga
on, I
ndia
Bha
kra,
Indi
a
Dan
tiwad
a, In
dia
Mud
a, M
alay
sia
Bha
kra,
Indi
aK
emub
u, M
alay
sia
Ben
i Am
ir, M
oroc
co
Offi
ce d
u N
iger
, Mal
i
Mud
a, M
alay
sia
Kem
ubu,
Mal
aysi
a
Rio
Yaq
ui A
lto, D
R
Ben
i Am
ir, M
oroc
co
Coe
llo, C
olom
bia
Offi
ce d
u N
iger
, Mal
iS
alda
ña, C
olom
bia
Cup
atitz
io, M
exic
oR
io Y
aqui
Alto
, DR
Rio
May
o, M
exic
oC
oello
, Col
ombi
a
Sal
daña
, Col
ombi
a
Cup
atitz
io, M
exic
o
Rio
May
o, M
exic
o
A - A c t u a l f r e q u e n c y o f c o m m u n i c a t i o n w i t h u p p e r l e v e l
B - A c t u a l f r e q u e n c y o f c o m m u n i c a t i o n w i t h l o w e r l e v e l
C - D e p e n d a b i l i t y o f v o i c e c o m m u n i c a t i o n s
D - F r e q u e n c y o f phys i ca l v i s i t s by supe rv i so rs t o f i e l d ope ra to r s
E - R e m o t e m o n i t o r i n g ( a u t o . o r m a n u a l ) a t k e y sp i l l po in ts , i nc l . end

. .
Page 104 of 276
Figure 6-22. Internal process indicator I-15 sub-indicators. Main canal general conditions.
C h 2 3 2 1 0
9
Figure 6-23. Internal process indicator I-16. Main canal operation.
Figures 6-23 and 6-24 primarily indicate how well the people in charge of the main canal, the reservoirs, or the diversion dams understand basic concepts of irrigation. While there are numerous challenges in irrigation projects which are difficult to understand and solve, there is really no justification for not receiving excellent scores on Indicator I-16. Indicator I-16 deals with basic responsibilities - checking the canal, giving clear and correct instructions to operators, and matching main canal water flows to actual (not hypothetically calculated) water needs. In some projects, the people who are in charge of the main reservoir discharges are almost
Mai
n C
anal
Op
erat
ion
(o
vera
ll in
dex
) G
ener
al C
on
dit
ion
s (M
ain
Can
al)
8
7
6
5
4
3
2
1
0
Lam
Pao
, Tha
iland
La
m P
ao, T
haila
nd
Dez
, Ira
n
Dez
, Ira
n
Gui
lan,
Iran
Gui
lan,
Iran
Sey
han,
Tur
key
Sey
han,
Tur
key
Maj
alga
on, I
ndia
Dan
tiwad
a, In
dia
Maj
alga
on, I
ndia
Dan
tiwad
a, In
dia
Bha
kra,
Indi
a
Bha
kra,
Indi
a
Mud
a, M
alay
sia
Kem
ubu,
Mal
aysi
a
Ben
i Am
ir, M
oroc
co
Mud
a, M
alay
sia
Offi
ce d
u N
iger
, Mal
i
Kem
ubu,
Mal
aysi
a
Ben
i Am
ir, M
oroc
co
Rio
Yaq
ui A
lto, D
R
Coe
llo, C
olom
bia
Offi
ce d
u N
iger
, Mal
i
Sal
daña
, Col
ombi
a
Cup
atitz
io, M
exic
o
Rio
Yaq
ui A
lto, D
R
Rio
May
o, M
exic
o
Coe
llo, C
olom
bia
Sal
daña
, Col
ombi
a
Cup
atitz
io, M
exic
o
Rio
May
o, M
exic
o
C h 2 2 9 4
3
2
1
0
A - Ava i l ab i l i t y o f r oads a l o n g c a n a l
B - G e n e r a l l e v e l o f m a i n t e n a n c e
C - G e n e r a l l e v e l o f u n d e s i r e d s e e p a g e
D - Ava i l ab i l i t y o f p rope r e q u i p m e n t a n d s t a f f t o a d e q u a t e l y m a i n t a i n t h i s c a n a l
E - T i m e t o t r a v e l f r o m m a i n t e n c e y a r d t o m o s t d i s tan t po in t
Chapter 6 - Internal Process Indicators Page 23

Page 105 of 276
completely disconnected from the people who have responsibility for everything else within the irrigation project, thus yielding low scores for this indicator. In some projects the flows remain constant throughout the whole year regardless of the cropped acreage, rainfall, and ET rates. In other projects the flows match complicated hypothetical computations with little or no meaningful feedback from the field. Poor main system management puts a tremendous strain on managers and operators lower in the system who are attempting to do a reasonable job of water management.
The preceding figures show that there are major improvements needed in both main system management and hardware.
Chapter 6 - Internal Process Indicators Page 24

.
Page 106 of 276
Op
erat
ion
(M
ain
Can
al)
Ch231 4
3
2
1
0
A - Frequency of headworks response to realistic real time feedback from canal operators/observers
B - Existence and effectiveness of water ordering/delivery procedures to match actual demands
C - Clarity and correctness of instructions to operators
D - Frequency of checking total length of canal
Lam
Pao
, Tha
iland
Dez
, Ira
n
Gui
lan,
Iran
Sey
han,
Tur
key
Maj
alga
on, I
ndia
Dan
tiwad
a, In
dia
Bha
kra,
Indi
a
Mud
a, M
alay
sia
Kem
ubu,
Mal
aysi
a
Ben
i Am
ir, M
oroc
co
Offi
ce d
u N
iger
, Mal
i
Rio
Yaq
ui A
lto, D
R
Coe
llo, C
olom
bia
Sal
daña
, Col
ombi
a
Cup
atitz
io, M
exic
o
Rio
May
o, M
exic
o
Figure 6-24. Internal process indicator I-16 sub-indicators. Main canal operation.
Chapter 6 - Internal Process Indicators Page 25

. .
Page 107 of 276
C h 2 3 4
Figure 6-25. Internal process indicator I-17. Submain canal cross-regulators.
Figure 6-25 displays the first in a series of internal process indicators which are identical to the earlier main canal indicators. There are some notable differences between the two levels. A few projects have somewhat better submain cross-regulator ratings than for the main canal (Dez and Seyhan). On the other hand, Bhakra, Muda, Office du Niger, Coello, Saldaña, Cupatitzio, and Rio Yaqui Alto have considerable lower ratings at the submain levels. Rio Yaqui Alto has Begemann gates (a type of flat plate hydraulic automatic gate for upstream control) throughout its submain network, and almost none of them work correctly or at all. Those that function only do so in a manual mode.
C h 2 3 6
Figure 6-26. Internal process indicator I-18. Submain canal capacities. Submain canal capacities (Figure 6-26) approximately correspond to the main canal capacities seen in Figure 6-16. Notable exceptions are Rio Mayo (larger submain capacities) and Lam Pao (smaller submain capacities). Indicator I-18 shows that overall,
Chapter 6 - Internal Process Indicators Page 26
0
1
2
3
4
5
6
7
8
9
1 0S
ub
mai
n C
anal
Cro
ss-R
egu
lato
r H
ard
war
e (o
vera
ll in
dex
)
Lam
Pao
, Tha
iland
Dez
, Ira
n
Gui
lan,
Iran
Sey
han,
Tur
key
Maj
alga
on, I
ndia
Dan
tiwad
a, In
dia
Bha
kra,
Indi
a
Mud
a, M
alay
sia
Kem
ubu,
Mal
aysi
a
Ben
i Am
ir, M
oroc
co
Offi
ce d
u N
iger
, Mal
i
Rio
Yaq
ui A
lto, D
R
Coe
llo, C
olom
bia
Sal
daña
, Col
ombi
a
Cup
atitz
io, M
exic
o
Rio
May
o, M
exic
o
0
1
2
3
4
5
6
7
8
9
1 0
Su
bm
ain
Can
al C
apac
itie
s (o
vera
ll in
dex
)
Lam
Pao
, Tha
iland
Dez
, Ira
n
Gui
lan,
Iran
Sey
han,
Tur
key
Maj
alga
on, I
ndia
Dan
tiwad
a, In
dia
Bha
kra,
Indi
a
Mud
a, M
alay
sia
Kem
ubu,
Mal
aysi
a
Ben
i Am
ir, M
oroc
co
Offi
ce d
u N
iger
, Mal
i
Rio
Yaq
ui A
lto, D
R
Coe
llo, C
olom
bia
Sal
daña
, Col
ombi
a
Cup
atitz
io, M
exic
o
Rio
May
o, M
exic
o

..
Page 108 of 276
4
submains are undersized - a major design flaw if one desires to provide water with high flexibility.
C h 2 3 8
Figure 6-27. Internal process indicator I-19. Submain canal turnouts.
Indicator I-19 (Figure 6-27) shows that while a few projects rated fairly high (Dez, Guilan, Majalgaon), in general there is insufficient design and maintenance attention given to submain canal turnouts - making canal operation inefficient and inflexible canal operation. In many cases the turnouts were supposed to work quite well, but did not in the field because of design or installation problems. Figure 6-28 provides further insight. Cupatitzio's modular distributors, although theoretically excellent, were installed incorrectly and had poor maintenance. In only 3 of the 16 projects were the turnouts sized large enough.
C h 2 3 7
A - E a s e o f t u r n o u t o p e r a t i o n u n d e r c u r r e n t t a r g e t o p e r a t i o n m o d e / f r e q u e n c y
Tu
rno
uts
(fr
om
Su
bm
ain
Can
als)
3
2
1
0
Lam
Pao
, Tha
iland
Dez
, Ira
n
Lam
Pao
, Tha
iland
0
1
2
3
4
5
6
7
8
9
1 0
Su
bm
ain
Can
al T
urn
ou
ts (
ove
rall
ind
ex)
Dez
, Ira
nG
uila
n, Ir
an
Sey
han,
Tur
key
Gui
lan,
Iran
Maj
alga
on, I
ndia
S
eyha
n, T
urke
y
Dan
tiwad
a, In
dia
Bha
kra,
Indi
a M
ajal
gaon
, Ind
ia
Mud
a, M
alay
sia
Kem
ubu,
Mal
aysi
a
Dan
tiwad
a, In
dia
Bha
kra,
Indi
a
Ben
i Am
ir, M
oroc
co
Offi
ce d
u N
iger
, Mal
i
Mud
a, M
alay
sia
Kem
ubu,
Mal
aysi
aR
io Y
aqui
Alto
, DR
Coe
llo, C
olom
bia
Ben
i Am
ir, M
oroc
co
Sal
daña
, Col
ombi
a O
ffice
du
Nig
er, M
ali
Cup
atitz
io, M
exic
o
Rio
May
o, M
exic
o
Rio
Yaq
ui A
lto, D
R
B - E a s e o f t u r n o u t o p e r a t i o n i f s y s t e m p r o v i d e s b e t t e r s e r v i c e t o t u r n o u t s f r o m t h i s c a n a l
C - L e v e l o f m a i n t e n a n c e
D - C a p a c i t y
Coe
llo, C
olom
bia
Sal
daña
, Col
ombi
a
Cup
atitz
io, M
exic
o
Rio
May
o, M
exic
o
Figure 6-28. Internal process indicator I-19 sub-indicator values. Submain canal turnouts.
Chapter 6 - Internal Process Indicators Page 27

. .
Page 109 of 276
4
Figure 6-28 shows that the level of maintenance of the turnouts from the submain canals was sub-optimum on all of the projects.
C h 2 4 0
Figure 6-29. Internal process indicator I-20. Submain canal communications.
Figure 6-29 shows Indicator I-20, which rates submain canal communications. The scores are considerably lower than for the main canal system (Indicator I-14, Figure 6-19). Figure 6-30 shows that on many of the projects, there is very little communication with either the upper level or the lower level of the canal (i.e., with the people receiving the submain canals deliveries).
C h 2 3 9
A - A c t u a l f r e q u e n c y o f c o m m u n i c a t i o n o f o p e r a t o r s a l o n g t h i s c a n a l w i t h u p p e r l e v e l
Figure 6-30. Internal process indicator I-20 sub-indicators. Submain canal communications.
Chapter 6 - Internal Process Indicators Page 28
Co
mm
un
icat
ion
s (S
ub
mai
n C
anal
)
3
2
1
0
Lam
Pao
, Tha
iland
Lam
Pao
, Tha
iland
0
1
2
3
4
5
6
7
8
9
1 0
Su
bm
ain
Can
al C
om
mu
nic
atio
ns
(ove
rall
ind
ex)
Dez
, Ira
n
Dez
, Ira
nG
uila
n, Ir
an
Sey
han,
Tur
key
Maj
alga
on, I
ndia
Gui
lan,
Iran
Sey
han,
Tur
key
Dan
tiwad
a, In
dia
Maj
alga
on, I
ndia
Bha
kra,
Indi
a
Mud
a, M
alay
sia
Dan
tiwad
a, In
dia
Kem
ubu,
Mal
aysi
aB
hakr
a, In
dia
Ben
i Am
ir, M
oroc
co
Mud
a, M
alay
sia
Offi
ce d
u N
iger
, Mal
i
Rio
Yaq
ui A
lto, D
RK
emub
u, M
alay
sia
Coe
llo, C
olom
bia
Ben
i Am
ir, M
oroc
co
Sal
daña
, Col
ombi
a
Offi
ce d
u N
iger
,
Mal
i
Cup
atitz
io, M
exic
o
Rio
May
o, M
exic
o
B - A c t u a l f r e q u e n c y o f c o m m u n i c a t i o n o f o p e r a t o r s o r s u p e r v i s o r s a l o n g t h i s c a n a l w i t h p e r s o n n e l a t l o w e r l e v e l
C - D e p e n d a b i l i t y o f v o i c e c o m m u n i c a t i o n s ( b y p h o n e o r r a d i o )
D - F r e q u e n c y o f p h y s i c a l v i s i t s b y s u p e r v i s o r s t o f i e l d o p e r a t o r s
E - R e m o t e m o n i t o r i n g ( a u t o . o r m a n u a l ) a t k e y s p i l l p o i n t s , i n c l . e n d
Rio
Yaq
ui A
lto, D
R
Coe
llo, C
olom
bia
Sal
daña
, Col
ombi
a
Cup
atitz
io, M
exic
o
Rio
May
o, M
exic
o

. .
Page 110 of 276
C h 2 4 2
Figure 6-31. Internal process indicator I-21. Submain canal general conditions.
Indicator I-21, when contrasted to its corresponding Indicator I-15 (Figure 6-21) shows somewhat degraded conditions as one moves downstream from the main canal. The average indicator value for the main canals was 7.1, as compared to 6.2 for the submains.
C h 2 4 4 1 0
9
Figure 6-32. Internal process indicator I-22. Submain canal operation.
Indicator I-22 is rather surprising when contrasted to Indicator I-16 (Figure 6-23) for main canal operation. It shows that in almost all cases, the operators of the submain canals do a better job of operating than those who control the releases into the main canals.
Su
bm
ain
Can
al O
per
atio
n (
ove
rall
ind
ex)
Su
bm
ain
Can
al G
ener
al C
on
dit
ion
s (o
vera
ll in
dex
)
8
7
6
5
4
3
2
1
0
1 0
9
8
7
6
5
4
3
2
1
0
Lam
Pao
, Tha
iland
Lam
Pao
, Tha
iland
Dez
, Ira
nD
ez, I
ran
Gui
lan,
Iran
G
uila
n, Ir
an
Sey
han,
Tur
key
Sey
han,
Tur
key
Maj
alga
on, I
ndia
M
ajal
gaon
, Ind
ia
Dan
tiwad
a, In
dia
Dan
tiwad
a, In
dia
Bha
kra,
Indi
aB
hakr
a, In
dia
Mud
a, M
alay
sia
Mud
a, M
alay
sia
Kem
ubu,
Mal
aysi
a K
emub
u, M
alay
sia
Ben
i Am
ir, M
oroc
co
Ben
i Am
ir, M
oroc
co
Offi
ce d
u N
iger
, Mal
iO
ffice
du
Nig
er, M
ali
Rio
Yaq
ui A
lto, D
RR
io Y
aqui
Alto
, DR
Coe
llo, C
olom
bia
Coe
llo, C
olom
bia
Sal
daña
, Col
ombi
aS
alda
ña, C
olom
bia
Cup
atitz
io, M
exic
oC
upat
itzio
, Mex
ico
Rio
May
o, M
exic
o R
io M
ayo,
Mex
ico
Chapter 6 - Internal Process Indicators Page 29

. .
Page 111 of 276
C h 2 4 6
2
1
0
Figure 6-33. Internal process indicator I-23. Overall project budget index.
Internal process indicator I-23 was developed to look beyond the simple collection of fees for O&M. As seen in Figure 6-34, it includes an estimate of the adequacy of O&M to sustain the present mode of operation (which may be insufficient), and also takes a glimpse at the investment in modernization. Some projects are in the middle of modernization efforts such as Office du Niger, Dantiwada, and Majalgaon, while others such as Coello and Saldaña were constructed with "modern" aspects years ago and have little or no modernization budget.
Ch245 4
A - % of O&M collected as in-kind services or water fees from water users
3
Bu
dg
etar
y
Lam
Pao
, Tha
iland
La
m P
ao, T
haila
nd
Dez
, Ira
n
Dez
, Ira
n
Gui
lan,
Iran
Sey
han,
Tur
key
Maj
alga
on, I
ndia
Gui
lan,
Iran
Sey
han,
Tur
key
Dan
tiwad
a, In
dia
Maj
alga
on, I
ndia
Bha
kra,
Indi
a
Dan
tiwad
a, In
dia
Mud
a, M
alay
sia
Kem
ubu,
Mal
aysi
a
Ben
i Am
ir, M
oroc
co
Bha
kra,
Indi
a
Mud
a, M
alay
sia
Offi
ce d
u N
iger
, Mal
i K
emub
u, M
alay
sia
Rio
Yaq
ui A
lto, D
R
Ben
i Am
ir, M
oroc
coC
oello
, Col
ombi
a
Sal
daña
, Col
ombi
a O
ffice
du
Nig
er, M
ali
Cup
atitz
io, M
exic
o
Rio
May
o, M
exic
o
Rio
Yaq
ui A
lto, D
R
Coe
llo, C
olom
bia
Sal
daña
, Col
ombi
a
Cup
atitz
io, M
exic
o
Rio
May
o, M
exic
o
0
1
2
3
4
5
6
7
8
9
1 0
Bu
dg
etar
y (o
vera
ll in
dex
)
B - Estimated adequacy of actual dollars and in-kind services available to sustain adequate O&M with present operation mode
C - % of budget spent on operation modernization (as contrasted with rehabilitation)
Figure 6-34. Internal process indicator I-23 sub-indicators. Overall project budget index.
Chapter 6 - Internal Process Indicators Page 30

..
Page 112 of 276
Em
plo
yees
2
1
0
Figure 6-35. Internal process indicator I-24. Employee index.
The quality of the workforce is important in any project, and Internal process indicator incorporates factors which may influence the motivation levels of employees - such as the ability of management to fire employees, relative salaries, and incentive programs. Figure 6-35 provides the overall employee index, while Figure 6-36 and Table 6-3 provide specific details.
Ch2474
A - Frequency/adequacy of training of operators and managers
B - Availability of written
3 performance rules
C - Power of employees to make decisions
D - Ability to fire employees
E - Rewards for exemplary service
F - Salary (relative to farm laborer) of canal operators/supervisors
Lam
Pao
, Tha
iland
Dez
, Ira
n
Gui
lan,
Iran
Sey
han,
Tur
key
Maj
alga
on, I
ndia
Dan
tiwad
a, In
dia
Bha
kra,
Indi
a
Mud
a, M
alay
sia
Kem
ubu,
Mal
aysi
a
Ben
i Am
ir, M
oroc
co
Offi
ce d
u N
iger
, Mal
i
Rio
Yaq
ui A
lto, D
R
Coe
llo, C
olom
bia
Sal
daña
, Col
ombi
a
Cup
atitz
io, M
exic
o
Rio
May
o, M
exic
o
0
1
2
3
4
5
6
7
8
9
10
Em
plo
yees
(o
vera
ll in
dex
)
Ch248
Figure 6-36. Internal process indicator I-24 sub-indicators. Employee index.
Chapter 6 - Internal Process Indicators Page 31
Lam
Pao
, Tha
iland
Dez
, Ira
n
Gui
lan,
Iran
Sey
han,
Tur
key
Maj
alga
on, I
ndia
Dan
tiwad
a, In
dia
Bha
kra,
Indi
a
Mud
a, M
alay
sia
Kem
ubu,
Mal
aysi
a
Ben
i Am
ir, M
oroc
co
Offi
ce d
u N
iger
, Mal
i
Rio
Yaq
ui A
lto, D
R
Coe
llo, C
olom
bia
Sal
daña
, Col
ombi
a
Cup
atitz
io, M
exic
o
Rio
May
o, M
exic
o

.
Page 113 of 276
Table 6-3. Data on Internal process indicator I-24 sub-indicator values
Item Avg. Value (0 = minimum;
4 = maximum) Coefficient of Variation Frequency/adequacy of training of operators and managers .57 .41 Availability of written performance rules .34 .85 Power of employees to make decisions 1.67 .43 Ability to fire employees .94 .85 Rewards for exemplary service .35 .83 Salary (relative to farm laborers) of canal operators/supervisors 1.18 .52
Table 6-3 and Figure 6-36 show that there are major differences between projects, but overall, the projects received low ratings in regard to their employee management. The Latin American projects appeared to give their employees the greatest latitude in making decisions, perhaps because they were operated by functional water user associations that operated much like businesses. Salaries for operators were only slightly higher than those for typical agricultural day laborers, indicating that in many projects there is a low value and possibly low expectations, placed on the work of operators -. It is very evident that the average level of training, rewards, and clear employee evaluation procedures is extremely low for the operators.
C h 2 5 0
0
1
2
3
4
5
6
7
8
9
1 0
Wat
er U
ser
Ass
oci
atio
ns
(ove
rall
ind
ex)
Lam
Pao
, Tha
iland
Dez
, Ira
n
Gui
lan,
Iran
Sey
han,
Tur
key
Maj
alga
on, I
ndia
Dan
tiwad
a, In
dia
Bha
kra,
Indi
a
Mud
a, M
alay
sia
Kem
ubu,
Mal
aysi
a
Ben
i Am
ir, M
oroc
co
Offi
ce d
u N
iger
, Mal
i
Rio
Yaq
ui A
lto, D
R
Coe
llo, C
olom
bia
Sal
daña
, Col
ombi
a
Cup
atitz
io, M
exic
o
Rio
May
o, M
exic
o
Figure 6-37. Internal process indicator I-25. Water User Associations.
Figures 6-37 and 6-38 provide some insight regarding the extent and strength of water user associations in the irrigation projects. The first obvious point is that 4 of the projects had no functional water user associations. The next point is that all of the Latin American irrigation projects not only had water user associations - those associations also received relatively high ratings. The third point is that all of the Asian projects had some type of water user association, but basically they were ineffective (with the exception of Seyhan). Office du Niger is a special case, and will be discussed later. The water users have a
Chapter 6 - Internal Process Indicators Page 32

..
Page 114 of 276
unique institutional arrangement in which they participate in decisions related to the expenditure of maintenance funds.
C h 2 4 9
A - % o f u s e r s i n s t r o n g W U A s t h a t h a v e a f u n c t i o n a l , f o r m a l u n i t t h a t p a r t i c i p a t e s i n w a t e r d i s t r i bu t i on
B - A c t u a l a b i l i t y o f t h e s t r o n g W U A t o i n f l u e n c e r e a l - t i m e w a t e r d e l i v e r i e s t o t he W U A
C - Ab i l i t y o f W U A t o r e l y o n e f f e c t i v e o u t s i d e e n f o r c e m e n t o f i t s r u l e s
D - L e g a l b a s i s f o r W U A
E - F i n a n c i a l s t r e n g t h o f W U A
Figure 6-38. Internal process indicator I-25 sub-indicators. Water User Associations.
C h 2 5 2
Figure 6-39. Internal process indicator I-26. Ability to accommodate pressurized field irrigation systems today.
0
1
2
3
4
5
6
7
8
9
1 0
Ab
ility
of
pre
sen
t se
rvic
e to
ind
ivid
ual
fie
lds,
to
acc
om
mo
dat
e
pre
ssu
rize
d ir
rig
. sys
tem
s (o
vera
ll in
dex
)
Lam
Pao
, Tha
iland
Sey
han,
Tur
key
Maj
alga
on, I
ndia
Dan
tiwad
a, In
dia
Mud
a, M
alay
sia
Kem
ubu,
Mal
aysi
a
Ben
i Am
ir, M
oroc
co
Rio
Yaq
ui A
lto, D
R
0
1
2
3
4
Wat
er U
ser
Ass
oci
atio
ns
Lam
Pao
, Tha
iland
Dez
, Ira
n
Dez
, Ira
n
Gui
lan,
Iran
Sey
han,
Tur
key
Maj
alga
on, I
ndia
Dan
tiwad
a, In
dia
Bha
kra,
Indi
a
Mud
a, M
alay
sia
Gui
lan,
Iran
Kem
ubu,
Mal
aysi
a
Ben
i Am
ir, M
oroc
co
Offi
ce d
u N
iger
, Mal
i
Bha
kra,
Indi
a
Offi
ce d
u N
iger
,
Mal
i
Rio
Yaq
ui A
lto, D
R
Coe
llo, C
olom
bia
Sal
daña
, Col
ombi
a
Cup
atitz
io, M
exic
o
Rio
May
o, M
exic
o
Coe
llo, C
olom
bia
Sal
daña
, Col
ombi
a
Cup
atitz
io, M
exic
o
Rio
May
o, M
exic
o
Chapter 6 - Internal Process Indicators Page 33

Page 115 of 276
C h 2 5 1
0
1
2
3
4
Ab
ility
of
pre
sen
t se
rvic
e to
ind
ivid
ual
fie
lds,
to
acc
om
mo
dat
e
pre
ssu
rize
d ir
rig
. sys
tem
s
A - M e a s u r e m e n t a n d c o n t r o l o f v o l u m e s t o f i e l d
B - F l ex i b i l i t y t o f i e l d
C - Re l i ab i l i t y t o f i e l d
.
Lam
Pao
, Tha
iland
Dez
, Ira
n
Gui
lan,
Iran
Sey
han,
Tur
key
Maj
alga
on, I
ndia
Dan
tiwad
a, In
dia
Bha
kra,
Indi
a
Mud
a, M
alay
sia
Kem
ubu,
Mal
aysi
a
Ben
i Am
ir, M
oroc
co
Offi
ce d
u N
iger
, Mal
i
Rio
Yaq
ui A
lto, D
R
Coe
llo, C
olom
bia
Sal
daña
, Col
ombi
a
Cup
atitz
io, M
exic
o
Rio
May
o, M
exic
o
Figure 6-40. Internal process indicator I-26 sub-indicators. Ability to accommodate pressurized field irrigation systems today.
Indicator I-26 (Figures 6-39 and 6-40) highlights a major reason for examining internal processes. It provides for the evaluation of the need to upgrade field irrigation systems. With rice irrigation there will not be a sudden (if ever) shift toward pressurized (sprinkler and drip) irrigation systems. However, most rice irrigation projects have significant potential for crop diversification during the dry season and sometimes even during the wet season. Surface irrigation of upland crops, under the correct conditions, can be efficient and inexpensive. Surface irrigation performance can be quite low if soils are non-uniform; the field slopes are undulating or greater than .05m/m; and if the fields are small, thereby limiting the implementation of modern land grading techniques (Burt, 1995).
Pressurized irrigation systems have problems related to power costs, but those concerns are often negated if one considers the total energy inputs (land grading, fertilizer, etc.) into farming against the potential higher yields that are obtainable in some cases with pressurized irrigation methods. There are certainly theoretical arguments against the adoption of pressurized methods (including the true problems of maintenance with drip/micro systems). Nevertheless, the area of land irrigated with those methods is growing rapidly because of the over-riding advantages of pressurized irrigation in many conditions.
The lesson to be learned from Figures 6-39 and 6-40 is that the water delivery system engineering and management of most of the irrigation projects are not close to being able to support modern field irrigation techniques. This is a major factor to consider, given the potential future discrepancy between population and agricultural production, as well as the need to make better first-time use of irrigation water. Figure 6-40 shows that the Latin American irrigation projects are generally the most advanced in their ability to provide the necessary water delivery service to the field and to accommodate pressurized irrigation
Chapter 6 - Internal Process Indicators Page 34

.
Page 116 of 276
methods. In addition, Seyhan and Office du Niger are outstanding projects in other areas of the world in this regard.
0
1
2
3
4
Pre
sen
t q
ual
ity
of
man
agem
ent
and
har
dw
are
to
acco
mm
od
ate
pre
ssu
rize
d ir
rig
atio
n
A - M a n a g e m e n t
B - H a r d w a r e
C h 2 5 3
Lam
Pao
, Tha
iland
Dez
, Ira
n
Gui
lan,
Iran
Sey
han,
Tur
key
Maj
alga
on, I
ndia
Dan
tiwad
a, In
dia
Bha
kra,
Indi
a
Mud
a, M
alay
sia
Kem
ubu,
Mal
aysi
a
Ben
i Am
ir, M
oroc
co
Offi
ce d
u N
iger
, Mal
i
Rio
Yaq
ui A
lto, D
R
Coe
llo, C
olom
bia
Sal
daña
, Col
ombi
a
Cup
atitz
io, M
exic
o
Rio
May
o, M
exic
o
Figure 6-41. Internal process indicator I-27 sub-indicators. Present quality of management and hardware in terms of accommodating pressurized field irrigation systems tomorrow.
Figure 6-41 shows the present quality of management and hardware in terms of accommodating pressurized field irrigation systems tomorrow. A high rating such as the 3.5 Management/Operation rating for Rio Mayo indicates that the present management procedures are quite good for this objective. The Hardware rating of 2.5 for Rio Mayo indicates that there is still considerable room for improvement on the Hardware aspect. However, the Hardware rating of 2.5 for Rio Mayo is high enough to indicate that the Hardware changes would be relatively easy to accomplish (compared to lower scores). The emphasis on modernization for this project would be Hardware, with some attention given to the Management. Lam Pao and Bhakra have very low scores, indicating that both Hardware and Management need tremendous improvement if those projects are to move into the field irrigation methods of the 21st century. In both cases, investment in only one aspect would not achieve the desired effect.
An interesting case is Beni Amir (Morocco). It receives very low ratings, although it often scored quite high on previous indicators such as Irrigation Efficiency. The hardware and management/operation of Beni Amir was designed for outdated field irrigation methods. Beni Amir has very low capacities in its distribution system and the hardware and management are designed to only supply one field at a time in the lower level of the canal distribution system on a rotation basis. This is clearly not conducive to modern field irrigation methods, which need flexible deliveries and long, frequent irrigations at variable flow rates. The current improvements in management/operation are intended to provide better service to those outdated field irrigation methods, but are only geared to modifying
Chapter 6 - Internal Process Indicators Page 35

.
.
Page 117 of 276
2
1
0
c o m p u t e r s b e i n g u s e d f o r b i l l i n g / r e c o r d m a n a g e m e n t ? ( I - 3 0 )
C - T o w h a t e x t e n t a r e c o m p u t e r s u s e d f o r c a n a l c o n t r o l ? ( I - 3 1 )
Oth
er
Lam
Pao
, Tha
iland
Dez
, Ira
n
Gui
lan,
Iran
Sey
han,
Tur
key
Maj
alga
on, I
ndia
Dan
tiwad
a, In
dia
Bha
kra,
Indi
a
Mud
a, M
alay
sia
Kem
ubu,
Mal
aysi
a
Ben
i Am
ir, M
oroc
co
Offi
ce d
u N
iger
, Mal
i
Rio
Yaq
ui A
lto, D
R
Coe
llo, C
olom
bia
Sal
daña
, Col
ombi
a
Cup
atitz
io, M
exic
o
Rio
May
o, M
exic
o
Nu
mb
er o
f T
urn
ou
ts p
er
(op
erat
or,
gat
e o
per
ato
r, s
up
ervi
sor)
9 0
8 0
7 0
6 0
5 0
4 0
3 0
2 0
1 0
0
(not replacing) a rigid operation that it is incompatible with pressurized field irrigation methods. It will require major restructuring of the thinking and key hardware components if Beni Amir is to be upgraded for the 21st century.
C h 2 5 5
Figure 6-42. Internal process indicator I-28. Number of turnouts per operator.
Indicator I-28 rates the various irrigation projects according to the number of turnouts per operator. This Internal process indicator is unique in that the scale is not on a 0-4 scale, but rather reflects the actual number of turnouts per operator. It is also unique in that a small number is better than a large number. It is obvious that there are major differences between irrigation projects, indicating major differences in communication, management skills, and efficiency of employees.
C h 2 5 44
A - W h a t l e v e l o f s o p h i s t i c a t i o n i s t h e r e i s r e c e i v i n g a n d u s i n g f e e d b a c k i n f o r m a t i o n . I t d o e s n o t n e e d t o b e a u t o m a t i c . ( I - 2 9 )
3
B - T o w h a t e x t e n t a r e
Figure 6-43. Internal process indicators I-29, I-30, and I-31.
Chapter 6 - Internal Process Indicators Page 36

Page 118 of 276
The three Internal process indicators shown in Figure 6-43 show interesting aspects of management in the irrigation projects. The conclusions are:
1. Overall, there is very little good utilization of information feedback for the management of irrigation projects. That is, there is little real-time information on actual (as opposed to supposed) flow rates, water levels, spills, etc. Where there is information available, it is often utilized properly.
2. A few projects use computers for billing and record management. Only Rio Mayo received a "perfect" score of 4.0. Dez, Seyhan, and Beni Amir are the only other projects which have made significant efforts in this regard.
3. Computers are rarely used for actual canal control. Majalgaon is an exception, and in that case computers are only used in a portion of the project.
Chapter 6 - Internal Process Indicators Page 37

Page 119 of 276
Chapter 7 - Correlation Evaluation
Background This project quantified numerous factors and indicators, but it did not actually implement any changes. There was no ability to vary one factor while keeping all other factors constant - a key requirement for many traditional statistical approaches. The research proposal acknowledged that a statistical analysis would not be valid for most of the data because of this factor, and because of the relatively small number of projects.
The previous chapters include graphs that illustrate many of relationships that were observed. Attachment C contains the values of 745 data items for each irrigation project, plus the average and coefficient of variation values. In addition, a Pearson Correlation test was run to search for meaningful data correlations. This section of the chapter describes the procedure. The remainder of the chapter presents the most pertinent results in graphical form, along with discussions of those results. The Pearson Correlation test procedure was as follows:
1. A database was developed with three types of variables: - Data Variables - ITRC and IWMI External Indicators - ITRC Internal Indicators
2. Mean values and the coefficient of variation (defined as the standard deviation divided by the mean) of the values were obtained. As a quality control measure, they were examined to determine if data points were reasonable or if there was some misinterpretation of the project responses.
3. A Pearson Correlation Matrix was created with the database by comparing each of the variable types to each other. This translated into a high volume of correlations to evaluate. A total of about 380 variables were put into a matrix and generated over 72,000 data pairs. A Pearson Correlation test is used to determine if there is a linear relationship between two variables. However, it does not prove cause or effect relationships.
4. Pairs of data with high Pearson Correlation Coefficients (r>0.7) were identified and grouped. In other words, the "r" values of the Pearson Correlation Matrix were used indirectly - as a means of identifying interesting relationships. This reduced the evaluation to about 6,000 data pairs.
5. Further groupings were made to identify data pairs that had variables that were similar in nature. For example, there were two questions that asked about the cost of the land. One question referenced the cost of land near the head of the canal; another question asked about the cost near the end of canals. The correlation evaluation determined that both variables are highly correlated with each other and they were in turn correlated with same indicators. In this case, one of the data pairs was eliminated. This procedure reduced the number of data pairs to 250.
Chapter 7 - Correlation Evaluation Page 1

Page 120 of 276
6. Data pairs that had high correlation values but clearly (through common sense) were not related to each other were eliminated from consideration. Data pairs that were based on similar calculations or were simply sub-indicators correlated to the indicator were eliminated. This filtering stage reduced the analysis to about 100 data pairs.
7. Some data pairs were expected to show a good correlation or at least interesting results but did not show up in the surviving 100 data pairs. These pairs were identified, and were added to the 100 data pairs, making a total of about 120 data pairs.
8. The data pairs were evaluated using visual inspection of scatter diagrams. Scatter diagrams were developed to examine the groupings of the projects. Additional data pairs were eliminated by inspecting the scatter plots. Some of the data had one extreme value that caused a skewing of the data. Further consolidation resulted in about 40 data pairs.
9. Table 7-1 lists the variables that had a relatively large number of high correlation values. The most interesting of the corresponding scatter diagrams were selected, and are presented in this chapter along with some discussion.
10. The results indicate that there are not strong correlations between the data variables and the external indicators. However, there was high correlation between the data variables and various internal indicators. This may indicate that the internal indicators are better suited to judge the performance of an irrigation project rather than the external indicators. For example, the external indicators can be distorted by a project that receives a high subsidy or is growing a high value crop such as tobacco. The project can be a poorly designed, mismanaged, and dysfunctional project but the external indicators might not indicate that serious changes need to be made. A feature of the internal indicators is that they provide the managers key information on what is precisely required to improve the operations of the project.
11. A finding of the correlation plots was that there was a definite trend of some of the projects being grouped together. The good projects tended to stay in a definite, tight pattern in most of the plots. Conversely, those projects that had lower ratings tended to stay in a pattern.
Chapter 7 - Correlation Evaluation Page 2

Page 121 of 276
Table 7-1. List of Variables with Best Correlations Variable Type Variable Name Data Variable Percent of area with an active water user association Data Variable Size of water user association Data Variable Time needed for the manager to travel down the main canal Data Variable Communications. How often do cross-regulator operators communicate with the next
higher level (hr) Data Variable Cost of land close to head of canals ($/ha) Data Variable Water charge ($/ha) ITRC Internal Indicator (I-1) Actual service to individual fields based on traditional irrigation methods (overall
weighted) ITRC Internal Indicator (I-1B) Actual service to individual fields based on traditional irrigation methods
(flexibility to field) ITRC Internal Indicator (I-2A) Actual service to average point of effective differentiation (number of fields
downstream) ITRC Internal Indicator (I-4) Actual service by main canals to subcanals (overall weighted) ITRC Internal Indicator (I-4C) Actual service by main canals to subcanals (equity) ITRC Internal Indicator (I-5B) Stated service to individual fields (flexibility to field) ITRC Internal Indicator (I-10) Cross-regulator hardware of main canal (overall weighted) ITRC Internal Indicator (I-10B) Cross-regulator hardware of main canal (probable ease of cross-regulator
operation if system was required to provide better service to turnouts) ITRC Internal Indicator (I-11) Capacities of main canal (overall weighted) ITRC Internal Indicator (I-11C) Capacities of main canal (capacity limitations of structures or canal cross section
further down in the canal) ITRC Internal Indicator (I-16) Operation of main canal (overall weighted) ITRC Internal Indicator (I-17) Cross-regulator hardware of submain canal (overall weighted) ITRC Internal Indicator (I-18) Capacities of submain canal (overall weighted) ITRC Internal Indicator (I-20) Communication of submain canal (overall weighted) ITRC Internal Indicator (I-22A) Operation of submain canal (how frequently does the headworks respond to
realistic feedback from the canal operators) ITRC Internal Indicator (I-22C) Operation of submain canal (clarity and correctness of instructions to operators) ITRC Internal Indicator (I-25) Water user associations (overall weighted) ITRC Internal Indicator (I-25B) Water user associations (actual ability of the strong WUA to influence real-time
water deliveries to the WUA) ITRC Internal Indicator (I-25E) Water user associations (financial strength of WUA) ITRC Internal Indicator (I-26) Ability of present service to individual fields to accommodate pressurized
irrigation systems (overall weighted) ITRC Internal Indicator (I-26B) Ability of present service to individual fields to accommodate pressurized
irrigation systems (flexibility to field) ITRC Internal Indicator (I-28) Number of turnouts per operator IWMI/ITRC Ext.Ind. IWMI6. Relative irrigation supply (RIS) IWMI/ITRC Ext.Ind. ITRC3. Water delivery capacity (%) IWMI/ITRC Ext. Ind. ITRC10. Annual project-level irrigation efficiency (%)
The following discussion focuses data which showed some visual trends, and which also have some logical "cause" and "effect" relationships.
Chapter 7 - Correlation Evaluation Page 3

.
Page 122 of 276
Percent of Area with an Active Water User Association It is difficult to know whether the "percent area with an active WUA" variable is best described as a cause or as an effect variable. That is, in some cases it appears that the presence of a WUA will cause certain things to happen - while in other cases it appears that certain other factors will cause a WUA to prosper.
The following figures indicate that there are certain characteristics that must be in place for active water user associations (WUAs) to exist.
ch92
Per
cen
t o
f A
rea
wit
h A
ctiv
e W
UA
100%
90%
80%
70%
60%
50%
40%
30%
20%
10%
0%
Muda
Dantiwada
Cupatitzio
Gui lan
Rio Mayo
Beni Amir
Lam Pao
Coel lo
Kemubu
Bhakra
Saldana Rio Yaqui Al to
Majalgaon
Dez
Off ice du Niger
Seyhan
0.0 0.5 1.0 1.5 2.0 2.5 3.0 3.5
( I-1B) Actual service to individual f ields based on traditional irrigation methods (flexibility to fields)
Figure 7-1. Scatter plot between [actual service to individual fields based on traditional irrigation methods (flexibility to fields)] and the [percent of area with an active water user association].
Figure 7-1 shows that there are distinct groupings of projects in regard to the existence of active WUAs. The projects with a high level of flexibility to the individual fields (Saldaña, Cupatitzio, Seyhan, Coello, Rio Mayo, Rio Yaqui Alto, and Office du Niger) have the highest values for the percent of area with water user associations. Those projects with low water delivery service ratings seem to have a problem with getting the water user associations started.
Chapter 7 - Correlation Evaluation Page 4
4.0

.
Page 123 of 276
ch92a P
erce
nt
of
Are
a w
ith
Act
ive
WU
A1 0 0 %
9 0 %
8 0 %
7 0 %
6 0 %
5 0 %
4 0 %
3 0 %
2 0 %
1 0 %
0 %
M u d a
Dant iwada
Cupat i tz io
Gu i lan
R io Mayo
Ben i Am i r L a m P a o
Coe l lo
K e m u b u
Bhakra
Sa ldanaRio Yaqu i A l to
Ma ja lgaonD e z
Of f i ce du N iger
Seyhan
0 .0 0 .5 1 .0 1 .5 2 .0 2 .5 3 .0 3 .5
( I -2A) Actual Service to average point of effect ive di f ferent iat ion (number o f f ie lds downstream)
Figure 7-2. Scatter plot between [actual service to average point of differentiation (number of fields downstream)] and the [percent of area with an active water user association].
Figure 7-2 shows a strong grouping of irrigation projects in the lower left-hand corner. Strong WUAs did not exist in any of the Asian projects. It is interesting because incentives had been made available to Indian farmers to encourage them to form WUAs. In Bhakra farmers were promised that the watercourses would be lined if they formed WUAs. In both Majalgaon and Dantiwada farmers were told that if they formed WUAs they would be provided volumetric deliveries and their water charges would be cut by 50%. Indian farmers probably recognize that discussions of volumetric deliveries are meaningless if the water delivery service is very poor. Figure 7-2 shows that in the Asian projects there tend to be a large number of fields downstream of the final point of effective control - meaning that promises to individual farmers cannot be kept because it is almost impossible to treat farmers equitably in such cases.
The projects with a high percentage of active WUAs seem to have several things in common that contribute to the success of implementing a WUA. These systems have a high degree of flexibility in the water delivery service to the individual fields. A good example is the Seyhan irrigation project in Turkey. This project provides good flexibility in the water service to the farmers and there is a strong movement towards the creation of active WUAs.
Another contributing factor to the successful implementation of the WUA is the capacity of the system. Figure 7-3 is a scatter diagram showing the relationship between the water deliver capacity (ITRC 3) and the percent of area with an active WUA. This would indicate that it is necessary to meet a minimum capacity to deliver water to the project in order to encourage the formation of WUAs. Figure 7-3 shows this relationship.
Chapter 7 - Correlation Evaluation Page 5
4.0

. .
Page 124 of 276
c h 9 2 d1 0 0 %
Per
cen
t o
f A
rea
wit
h A
ctiv
e W
UA
9 0 %
8 0 %
7 0 %
6 0 %
5 0 %
4 0 %
3 0 %
2 0 %
1 0 %
0 %
M u d a
D a n t i w a d a
C u p a t i t z i o
G u i l a n
R i o M a y o
B e n i A m i r
L a m P a o
C o e l l o
K e m u b u
B h a k r a
S a l d a n aR i o Y a q u i A l t o
M a j a l g a o n
D e z
O f f i c e d u N i g e r
S e y h a n
0 5 0 1 0 0 1 5 0 2 0 0 2 5 0 3 0 0 3 5 0
I T R C 3 . W a t e r d e l i v e r y c a p a c i t y ( % )
4 0 0
Figure 7-3. Scatter plot between [water delivery capacity] and the [percent of area with an active water user association].
The last figure in this first sequence represents the relationship between the area with an active WUA and the ITRC internal indicator (I-26), which is a measure of the ability of present service to individual fields to accommodate pressurized irrigation systems. This figure shows that there is a link between the creation of effective WUAs and the future transition to pressurized irrigation methods.
S e y h a n c h 9 2 c 1 0 0 %
Per
cen
t o
f A
rea
wit
h A
ctiv
e W
UA
9 0 %
8 0 %
7 0 %
6 0 %
5 0 %
4 0 %
3 0 %
2 0 %
1 0 %
0 %
M u d a
D a n t i w a d a
Cupa t i t z i o
G u i l a n
R i o M a y o
B e n i A m i r
L a m P a o
C o e l l o
K e m u b u
B h a k r a
S a l d a n a R i o Y a q u i A l t o
M a j a l g a o n D e z
O f f i c e d u N i g e r
0 1 2 3 4 5 6 7 8 9
( I - 26 ) Ab i l i t y o f p resent serv ice to ind iv idua l f i e lds to accomm o d a t e p r e s s u r i z e d i r r iga t ion sys tems (overa l l we igh ted )
Figure 7-4. Scatter plot between [ability of present service to individual fields to accommodate pressurized irrigation systems] and the [percent of area with an active water user association].
Chapter 7 - Correlation Evaluation Page 6
1 0

. .
Page 125 of 276
Size of the Water User Association The following graphs illustrate a trend of increased flexibility and service that is associated with an increase in the size of the water user association.
c h 8 43 0 , 0 0 0
Typ
ical
Siz
e o
f a
WU
A, h
a
2 5 , 0 0 0
2 0 , 0 0 0
1 5 , 0 0 0
1 0 , 0 0 0
5 , 0 0 0
0
M u d a
D a n t i w a d a
C u p a t i t z i oG u i l a n R i o M a y o
B e n i A m i r
L a m P a o
C o e l l o
K e m u b u
B h a k r a
S a l d a n a
R i o Y a q u i A l t o M a j a l g a o n
D e z
O f f i c e d u N i g e r
S e y h a n
0 . 0 0 . 5 1 . 0 1 . 5 2 . 0 2 . 5 3 . 0 3 . 5 4 . 0
( I - 2 6 B ) A b i l i t y o f p r e s e n t s e r v i c e t o i n d i v i d u a l f i e l d s t o a c c o m m o d a t e p r e s s u r i z e d i r r i g . S y s t e m s ( f l e x i b i l i t y t o f i e l d )
Figure 7-5. Scatter plot between the [ability of present service to accommodate pressurized irrigation systems (flexibility to field)] and the [typical size of a WUA].
ch84a 30,000
Typ
ical
Siz
e o
f a
WU
A, h
a
25,000
20,000
15,000
10,000
5,000
0
Muda
Dantiwada
Gui lan Beni Amir
Lam Pao
Kemubu
Bhakra
Majalgaon
Dez Rio Yaqui Al to
Cupatitzio
Rio Mayo
Saldana
Coel lo
Off ice du Niger
Seyhan
0.0 0.5 1.0 1.5 2.0 2.5 3.0 3.5 4.0
( I-2A) Actual Service to avg. point of Effective Differentiation (number of fields downstream)
Figure 7-6. Scatter plot between the [actual service to average point of effective differentiation based on traditional on-farm methods (number of fields downstream)] and the [typical size of a WUA].
Chapter 7 - Correlation Evaluation Page 7

Page 126 of 276
It is difficult to draw many conclusions from Figures 7-5 and 7-6. However, these figures are interesting because they show that there is not a negative effect due to an increasing size of WUA. In Mexico, it has been noted that WUAs need some minimum size in order to be able to hire qualified managers and staff. This is an important point, as one sometimes hears that WUAs should be small. The difference in perception is probably related to what a person thinks a WUA should do. In Latin America the WUAs operate almost as businesses, and they hire staff to do the actual water distribution. Discussions of village level WUAs (i.e., small WUAs) tend to assume that with the formation of a WUA, farmers will begin to cooperate voluntarily in the distribution of water. In this research, the only successful WUA of this nature was Office du Niger, and in that case voluntary cooperation works well because of the design of the final watercourses. The final watercourses are really miniature reservoirs and there is no hurry to adjust the flows into the watercourses when farmers take water. In other words, Office du Niger farmers do not really need to cooperate to any great extent, because they can individually control the flows into their individual fields without significantly impacting their neighbors. The proper engineering design has minimized the need for close inter-personal cooperation.
Time Needed for the Manager to Travel Down the Main Canal The "time needed for the manager to travel down the main canal" variable is one indication of the level of communication that occurs on a project. There is a significant amount of contrast between the projects with respect to the ability to readily move through the project. Some projects have an excellent paved road system that parallels the canals. On other projects, the canal roads are the only roads available to the farmers and the project personnel, and those roads are in poor condition.
Figure 7-7 demonstrates there is a negative relationship between the time needed for the manager to travel down the longest canal and the ITRC internal sub-indicator (I-5B) which is the stated service to fields - flexibility to field. The indicator shows that on those projects where the manager has difficulty getting down the canals, the stated water delivery service to fields is the lowest. The one exception is the Office du Niger project where the stated service to the fields is very high (perfect 4.0), even though the main canal is not accessible at many points. Office du Niger is not a "typical" design, however, in that its main conveyance canal is operated with considerably less flexibility than the lower canal reaches. Office du Niger has relatively small operational units, and during the dry season the travel was reasonably easy on a motorbike within the units that were visited.
Chapter 7 - Correlation Evaluation Page 8

.
.
Page 127 of 276
c h 8 0 b
0 . 0
1 . 0
2 . 0
3 . 0
4 . 0
5 . 0
6 . 0
7 . 0 T
ime
nee
ded
fo
r m
gr.
to
tra
vel d
ow
n t
he
lon
ges
t ca
nal
, hrs
M u d a
D a n t i w a d a
Cupa t i t z i o
G u i l a n
R i o M a y o B e n i A m i r
L a m P a o
C o e l l o
K e m u b u
B h a k r a
S a l d a n a
R i o Y a q u i A l t o
M a j a l g a o n
D e z
O f f i c e d u N i g e r . No ab i l i t y t o t r a v e l d o w n cana l .
S e y h a n
0 . 0 0 . 5 1 . 0 1 . 5 2 . 0 2 . 5 3 . 0 3 . 5 4 . 0
( I - 5B) S ta ted serv ice to f i e lds ( f l ex ib i l i t y to f i e ld )
Figure 7-7. Scatter plot between the [stated service to fields (flexibility to field)] and the [time needed for the manager to travel down the longest canal].
An interesting negative correlation is found between the water charge and the time needed for the manager to travel down the longest canal. It appears that those systems with the worst access have the least expensive water (Figure 7-8).
c h 8 0 a 7 . 0
Tim
e n
eed
ed f
or
mg
r. t
o t
rave
l do
wn
the
lon
ges
t ca
nal
, hrs
6 . 0
5 . 0
4 . 0
3 . 0
2 . 0
1 . 0
0 . 0 0 2 0 4 0 6 0 8 0 1 0 0 1 2 0 1 4 0 1 6 0
W a t e r c h a r g e - $ / h a ( a v g / y r p e r p h y s i c a l h a i r r i g a t e d )
M u d a
D a n t i w a d a
Cupa t i t z i o
G u i l a n
R i o M a y o
B e n i A m i r
L a m P a o
C o e l l o
K e m u b u
B h a k r a
S a l d a n a
R i o Y a q u i A l t o
M a j a l g a o n
D e z
O f f i c e d u N i g e r . N o a b i l i t y t o t r a v e l d o w n c a n a l .
S e y h a n
Figure 7-8. Scatter plot between the [water charge] and the [time needed for the manager to travel down the longest canal].
Chapter 7 - Correlation Evaluation Page 9

.
Page 128 of 276
Those projects that have a poor transportation network seem to have a lower level of service in general. Figure 7-9 shows the relation between the time needed for the manager to travel down the longest canal and the ITRC internal indicator I-22A (how frequently does the headworks of the submain canal respond to realistic feedback from the canal operators).
ch80
Tim
e n
eed
ed f
or
mg
r. t
o t
rave
l do
wn
th
e
lon
ges
t ca
nal
, hrs
.
7.0
6.0
5.0
4.0
3.0
2.0
1.0
0.0
0.0 0.5 1.0 1.5 2.0 2.5 3.0 3.5 4.0
Muda
Dantiwada
Cupatitzio
Gui lan
Rio MayoBeni Amir
Lam Pao
Coel lo
Kemubu
Bhakra
Saldana
Rio Yaqui Al to
Majalgaon
Dez
Off ice du Niger. No abil ity.
Seyhan
( I -22A) Operation of submain canal (how frequently does the headworks respond to realistic feedback from the canal operators
Figure 7-9. Scatter plot between [operation of submain canal (how frequently does the headworks respond to realistic feedback from the canal operators)] and the [time need for the manager to travel down the longest canal].
Figure 7-9 shows that in general, if the main canal is easily accessible, then the headworks to the submain canals are operated quite well.
Communications - How Often do Cross-Regulator Operators Communicate with the Next Higher Level (Hr) This is another communication variable that is related to the type of service provided. Figure 710 shows that most projects communicate on 3, 12, 24 or 48 hour time increments. Those projects with the highest increments (48 hours) appeared to have the biggest problem with inequity in the project. A special note is needed here regarding Office du Niger. That project is somewhat of a mix. It has areas which have been modernized (those which receive excellent flexibility at the field level) and other areas outside of the modernized zones. In those unmodernized zones there is a strong sense of inequity, which shows up on Figure 7-10.
Chapter 7 - Correlation Evaluation Page 10

. .
Page 129 of 276
ch76 S
ense
of
Ineq
uit
y o
f D
eliv
erie
s T
hro
ug
ho
ut
Pro
ject
(10
= H
ug
e In
equ
ity)
10
9
8
7
6
5
4
3
2
1
0
Muda
Dantiwada
Guilan
CoelloKemubu
Majalgaon
Seyhan Rio Mayo
Saldana
Rio Yaqui Alto
Dez
Cupatitzio
Beni Amir
Lam Pao
Bhakra
Office du Niger
0 10 20 30 40 50
Communications. How often do Submain Canal Cross Regulator Operators Communicate with the next Higher Level (hr)
60
Figure 7-10. Scatter plot between [communications - how often do cross-regulator operators communicate with the next higher level)] and the [sense of inequity of deliveries throughout the project].
Figure 7-11 shows that the frequency of communication is also related to the ITRC internal indicator I-16 (the operation of the main canal- weighted overall). This should not be surprising, since, in general, a canal can only be operated properly if the canal is easily visited and there are frequent updates for the operators. There are a few points to note: Both Lam Pao and Rio Yaqui Alto have frequent communications, but the main canal is operated poorly. In these two projects, even though some information is frequently updated, the information which is passed back to the headquarters is fairly meaningless and the operators of the canal are given poor or incorrect instructions. The frequent communications are not really used to answer operational questions nor to answer spur-of-the-moment questions by operators so that they can respond to changing conditions. In general, the communications are solely used to pass numbers back and forth for archival purposes or for incorrect field instructions.
Chapter 7 - Correlation Evaluation Page 11

..
Page 130 of 276
(I-1
6) O
per
atio
n o
f m
ain
can
al (
ove
rall
wei
gh
ted
) ch76b
10
9
8
7
0 10 20 30 40 50
Communications. How often do Submain Canal Cross Regulator Operators Communicate with the next Higher Level (hr)
Muda
Dantiwada
Cupatitzio
Guilan Beni AmirDez
Rio Mayo
Lam Pao
Coello
Kemubu
Bhakra
Saldana
Rio Yaqui Alto
Majalgaon
Office du Niger
Seyhan
6
5
4
3
2
1
0
Figure 7-11. Scatter plot between [communications - how often do cross-regulator operators communicate with the next higher level)] and the [operation of the main canal].
Cost of the Land Close to the Head of Canals The "cost of land close to the head of canals" is an interesting indicator that is correlated with several other factors. Those projects with the least amount of flexibility and experiencing poor service are the ones with the most expensive land costs. For example, the land acquisition costs on the Bhakra project in India are a major restriction for the expansion of the water delivery system.
The projects with a high cost of land generally do not have many land sales. These projects are characterized as having land that is transferred by inheritance. Most of these projects also are characterized as having small land holdings due to the inheritance and land splitting that has occurred over time. Figures 7-12 and 7-13 generally show that there is a decrease in the service of water delivery as the cost of land is increased.
Chapter 7 - Correlation Evaluation Page 12
60

. .
Page 131 of 276
c h 7 0 2 0 , 0 0 0
Co
st o
f L
and
Clo
se t
o H
ead
of
Can
als
($/h
a)
1 8 , 0 0 0
1 6 , 0 0 0
1 4 , 0 0 0
1 2 , 0 0 0
1 0 , 0 0 0
8 , 0 0 0
6 , 0 0 0
4 , 0 0 0
2 , 0 0 0
0
M u d a
D a n t i w a d a
Cupa t i t z i o
G u i l a n
R i o M a y o
B e n i A m i r
L a m P a o
C o e l l o
K e m u b u
B h a k r a
S a l d a n a
R i o Y a q u i A l t o
M a j a l g a o n
D e z
O f f i c e d u N i g e r - n o l a n d f o r s a l e
S e y h a n
0 . 0 0 . 5 1 . 0 1 . 5 2 . 0 2 . 5 3 . 0 3 . 5 4 . 0
A c t u a l S e r v ic e t o a v g . p o i n t o f E f f e c t i v e D i f f e r e n t i a t i o n
( N u m b e r o f F i e l d s D o w n s t r e a m )
Figure 7-12. Scatter plot between the [actual service at point of effective differentiation (number of fields downstream)] and the [cost of land close to the head of canals].
c h 7 0 a
0
2 , 0 0 0
4 , 0 0 0
6 , 0 0 0
8 , 0 0 0
1 0 , 0 0 0
1 2 , 0 0 0
1 4 , 0 0 0
1 6 , 0 0 0
1 8 , 0 0 0
2 0 , 0 0 0
Co
st o
f L
and
Clo
se t
o H
ead
of
Can
als
($/h
a)
M u d a
D a n t i w a d a
C u p a t i t z i o
G u i l a n
R i o M a y o
B e n i A m i r
L a m P a o
C o e l l o
K e m u b u
B h a k r a
S a l d a n a
R i o Y a q u i A l t o
M a j a l g a o n
D e z
O f f i c e d u N i g e r n o l a n d f o r s a l e
S e y h a n
0 . 0 0 . 5 1 . 0 1 . 5 2 . 0 2 . 5 3 . 0 3 . 5 4 . 0
A b i l i t y o f P r e s e n t S e r v i c e t o A c c o m o d a t e P r e s s u r i z e d I r r i g a t i o n S y s t e m s ( F l e x i b i l i t y t o F i e l d )
Figure 7-13. Scatter plot between the [ability of present service to accommodate pressurized irrigation systems (flexibility to field)] and the [cost of the land close to head of canals].
The previous figures bring up some intriguing questions. Why is the water service typically so low in areas with the most expensive land? And since it will be shown later that the yields also tend to be low in those same areas, wouldn't it be worthwhile to invest more in irrigation infrastructure and improved irrigation project operation to increase the yields? In these areas, the
Chapter 7 - Correlation Evaluation Page 13

.
Page 132 of 276
value of the land in terms of production per hectare is low, yet the purchase price is high. Therefore, the incremental cost of improved irrigation should have dramatic economic impacts.
Figure 7-14 shows an another relationship with the cost of the lands and the WUAs. The projects with the best ratings for the WUAs are the projects with the lowest land costs. Again, there is a definite grouping of the Latin American projects (along with the Seyhan project), that have excellent ratings for WUAs and lower land costs.
ch70b 20,000
18,000
Muda
Dantiwada
Cupatitzio
Guilan Lam Pao
Majalgaon
Rio Mayo
Beni Amir
Coello
Kemubu
Bhakra
Saldana
Rio Yaqui Alto
Dez
Office du Niger -no land for sale
Seyhan
0 1 2 3 4 5 6 7 8 9
(I-25) Water user associations weighted overall.
16,000
14,000
12,000
10,000
8,000
6,000
4,000
2,000
0
Figure 7-14. Scatter plot between the [water user associations (weighted overall)] and the [cost of the land close to head of canals].
Actual Service to Individual Fields Based on Traditional Irrigation Methods While this ITRC internal indicator (I-1) did not show big differences in the overall service ratings, there were several graphs that appear to show correlations between this variable and several of the internal process indicators.
Figures 7-15 and 7-16 support one of the original hypothesis statements regarding the clarity and correctness of instructions for the operators.
- Reliable service at field turnouts will only be found if levels of service are clearly defined and understood by operators and management at all layers within the system.
Chapter 7 - Correlation Evaluation Page 14
Co
st o
f L
and
Clo
se t
o H
ead
of
Can
als
($/h
a)
10

. .
Page 133 of 276
These two graphs show that this hypothesis appears to be true. The general trend is that there needs to be clarity and correctness in the instructions in order for projects to have good service at the turnouts to the individual fields.
0 . 0
0 . 5
1 . 0
1 . 5
2 . 0
2 . 5
3 . 0
3 . 5
4 . 0
0 1 2 3 4 5 6 7 8 9 1 0
( I - 1 ) A c t u a l s e r v i c e t o i n d i v i d u a l f i e l d s b a s e d o n t r a d i t i o n a l i r r i g a t i o n m e t h o d s ( o v e r a l l w e i g h t e d )
(I-1
6c)
Op
erat
ion
of
mai
n c
anal
(cl
arit
y an
d
corr
ectn
ess
of
inst
ruct
ion
s to
op
erat
ors
M u d a
D a n t i w a d a
G u i l a n
R i o M a y o
B e n i A m i r
L a m P a o C o e l l o
K e m u b u
B h a k r a
S a l d a n a
R i o Y a q u i A l t o
M a j a l g a o n
D e z
O f f i c e d u N i g e r S e y h a n
C u p a t i t z i o
c h 1 0 3
Figure 7-15. Scatter plot between the [actual service to individual fields based on traditional irrigation methods (weighted overall)] and the [operation of the main canal (clarity and correctness of instructions to operator)].
c h 1 0 3 a 4 . 0
(I-2
2c)
Op
erat
ion
of
sub
mai
n c
anal
(cl
arit
y an
d
corr
ectn
ess
of
inst
ruct
ion
s to
op
erat
ors
3 . 5
3 . 0
2 . 5
2 . 0
1 . 5
1 . 0
0 . 5
0 . 0
M u d a
D a n t i w a d a
G u i l a n
R i o M a y o
B e n i A m i r
L a m P a o
C o e l l oK e m u b u
B h a k r a
S a l d a n a
R i o Y a q u i A l t o
M a j a l g a o n
D e z
O f f i c e d u N i g e r
S e y h a n
Cupa t i t z i o
0 1 2 3 4 5 6 7 8 9 1 0
( I - 1 ) A c t u a l s e r v i c e t o i n d i v i d u a l f i e l d s b a s e d o n t r a d i t i o n a l i r r i g a t i o n m e t h o d s ( o v e r a l l w e i g h t e d )
Figure 7-16. Scatter plot between the [actual service to individual fields based on traditional irrigation methods (weighted overall)] and the [operation of the submain canal (clarity and correctness of instructions to operator)].
Chapter 7 - Correlation Evaluation Page 15

Page 134 of 276
Figure 7-17 shows evidence of one of the strongest relationships between a service variable and the instructions provided to operators. This graph points to Lam Pao, Dez, Bhakra and Rio Yaqui Alta as the projects that have both low service ratings to the individual fields and low ratings for the service between canal levels in the system. One of the hypothesis statements for this research was that certain institutional frameworks needed to be in place in order for a project to provide a high level of water delivery service.
- Certain institutional frameworks are always present in projects that provide a high level of water delivery service to individual fields.
It appears that good service from the main canals to the submain canals is a key indicator for providing good service to the field level. This was true on several of the projects that rated high in both categories, such as Rio Mayo and Seyhan.
c h 1 0 3 b
(I-4
) A
ctu
al s
ervi
ce b
y m
ain
can
als
to it
s su
bca
nal
s.
1 0
9
8
7
6
5
4
3
2
1
0
0 1 2 3 4 5 6 7 8 9
L a m P a o
B h a k r a
D e z
M u d a
G u i l a n
S a l d a n a
R i o Y a q u i A l t o
M a j a l g a o n
D a n t i w a d a
C o e l l o R i o M a y o
B e n i A m i r
K e m u b u
O f f i c e d u N i g e r
S e y h a n
Cupa t i t z i o
1 0
( I -1 ) Actua l serv ice to ind iv idua l f ie lds based on t rad i t iona l i r r igat ion m e t h o d s (overa l l we ighted)
Figure 7-17. Scatter plot between the [actual service to individual fields based on traditional irrigation methods (weighted overall)] and the [actual service by main canals to its subcanals].
In the research proposal, those projects with unreliable service to the individual fields were predicted to have some degree of chaos.
- Failure to provide a promised and clearly defined level of service to farmer fields will be associated with problems as water stealing, destruction of structures, lack of farmer discipline, and failure to pay for water.
Chapter 7 - Correlation Evaluation Page 16

. .
Page 135 of 276
Figure 7-18 addresses the occurrence of anarchy. Bhakra and Dez were the only projects evaluated where there were significant levels of anarchy observed. The farmers were not damaging structures beyond repair, but there were documented problems with water stealing and vandalism in both projects.
ch103d
0
10
20
30
40
50
60
70
80
90
100
(I-9
a) E
vid
ence
of
lack
of
anar
chy
in c
anal
syst
em u
pst
ream
of
ow
ner
ship
ch
ang
e
Muda Dantiwada
Gui lan Rio Mayo
Beni Amir Lam Pao
Coel lo
Kemubu
Bhakra
Saldana
Rio Yaqui Al to
Majalgaon
Dez
Off ice du Niger
Seyhan
Cupatitzio
0 1 2 3 4 5 6 7 8 9
(I-1) Actual service to individual fields based on traditional irrigation methods (overall weighted)
Figure 7-18. Scatter plot between the [actual service to individual fields based on traditional irrigation methods (weighted overall)] and the [noticeable non-existence of unauthorized turnouts from canals above point of ownership change].
Perhaps the most significant point to be learned from Figure 7-18 is that all of the projects, with the exception of Bhakra, have some aspects of modernization. While none of the projects received perfect scores, in general there was minimal anarchy in these systems. This is in sharp contrast to previous studies that have noted extreme chaos and anarchy in traditional irrigation projects. Instead, this research project shows relatively optimistic results.
Figure 7-19 shows that there is a limited relationship between the level of service provided to the individual fields and the output of the project. The IWMI production based external indicators (IWMI1, IWMI2, IWMI3, and IWMI4) did not show good correlations with any of the other variables based on the Pearson Correlation coefficient. This may be partly due to the problems with collecting meaningful economic data using the rapid appraisal process (RAP). However, the poor correlation seemed more closely related to other factors such as the prices of commodities and the types of crops which could be grown in each project. For example, Rio Yaqui Alto had a high percentage of the area cultivated with tobacco which is a very high value crop.
Chapter 7 - Correlation Evaluation Page 17
10

. .
Page 136 of 276
IWM
I1. O
utp
ut
per
cro
pp
ed a
rea
($/h
a)
ch103e 5,000
4,500
4,000
3,500
3,000
2,500
2,000
1,500
1,000
500
0 0 1 2 3 4 5 6 7 8 9 10
Muda
Dantiwada
Guilan
Rio Mayo
Beni Amir
Lam Pao Coello
Kemubu
Bhakra
Saldana
Rio Yaqui Alto
Majalgaon
Dez
Office du Niger
Seyhan
Cupatitzio
(I-1) Actual service to individual fields based on traditional irrigation methods (overall weighted)
Figure 7-19. Scatter plot between the [actual service to individual fields based on traditional irrigation methods (weighted overall)] and the [output per cropped area].
Figure 7-20 shows there is a fairly good relationship between the number of farmers involved in the final stage of the water delivery and the level of service provided to the field. There appears to be a significant linkage between service and trying to get a high number of farmers to cooperate. It is important to note that "modern" irrigation projects do not rely on inter-farmer cooperation.
The critical need identified by the farmers in the Bhakra project was funding for additional concrete lining of the watercourses to the field level. They sincerely believed that the concrete lining would solve the biggest problem they have -- water stealing. The problem is that the concrete lining would not address the basic problem of the high number of farmers who must cooperate. The perception of water theft may be decreased, but the service to the farmers would still be much poorer when compared to the other projects.
Chapter 7 - Correlation Evaluation Page 18

. .
Page 137 of 276
Nu
mb
er o
f fa
rmer
s in
volv
ed in
fin
al s
tag
e ch103f
50
45
40
35
30
25
20
15
10
5
0
0 1 2 3 4 5 6 7 8 9
Muda
Dantiwada
Gui lan
Rio Mayo
Beni Amir
Lam Pao
Coel lo
Kemubu
Bhakra
Saldana
Rio Yaqui Al to
Majalgaon
Dez Off ice du Niger
Seyhan
Cupatitzio
( I-1) Actual service to individual fields based on traditional irrigation methods (overall weighted)
Figure 7-20. Scatter plot between the [actual service to individual fields based on traditional irrigation methods (weighted overall)] and the [number of farmers involved in the final stage].
Actual Service by Main Canals to Its Subcanals The next set of graphs show the correlation between the ITRC internal indicator I-17 and several other internal process indicators. These graphs show that there is a strong relationship between the service provided and the operations of the cross regulators.
Some of the projects are consistently on the low end of the graphs (Lam Pao, Dez, Rio Yaqui Alto and Bhakra). These projects have also been on the low end of the indicators on several of the previous correlation categories.
The Kemubu project consistently scores well in this section because the downstream control and automated gates on the main canal are coupled with the long crested weirs on the submain canals. Majalgaon also has excellent ratings based on the dynamic regulation concept for the main canals and the long crested weirs on the submain canals.
Chapter 7 - Correlation Evaluation Page 19
10

. .
Page 138 of 276
ch97 10
9
Rio Mayo
Lam Pao
Rio Yaqui Alto
Dez
Muda
Dantiwada
Cupatitzio
Guilan
Coello
Bhakra
Saldana
Office du NigerSeyhan
Beni Amir
Kemubu
Majalgaon
(I-4
) A
ctu
al S
ervi
ce b
y m
ain
can
als
to it
s su
bca
nal
s
8
7
6
5
4
3
2
1
0
0 1 2 3 4 5 6 7 8 9 10
(I-10) Cross-Regulators of main canals (overall weighted)
Figure 7-21. Scatter plot between [cross-regulators of main canals] and the [actual service by main canals to its subcanals].
ch97a 10
9
(I-4
) A
ctu
al S
ervi
ce b
y m
ain
can
als
to it
s su
bca
nal
s
8
7
6
5
4
3
2
1
0
Bhakra
Rio Yaqui Al to
Muda
Cupatitzio
Rio Mayo
Lam Pao
Dantiwada
Beni Amir
Coel lo
Saldana
Majalgaon
Dez
Off ice du Niger
Seyhan Gui lan
Kemubu
0 1 2 3 4 5 6 7 8 9
( I -17) Cross-Regulators of submain canals (overal l weighted)
Figure 7-22. Scatter plot between [cross-regulators of submain canals] and the [actual service by main canals to its subcanals].
Chapter 7 - Correlation Evaluation Page 20
10

.
Page 139 of 276
ch97b (I
-4)
Act
ual
Ser
vice
by
mai
n c
anal
sto
its
sub
can
als
10
9
8
7
6
5
4
3
2
1
0
Rio Mayo
Lam Pao
Rio Yaqui Alto
Dez
Dantiwada
Coello
Bhakra
Saldana
Office du Niger
Seyhan
Muda Cupatitzio
Guilan
Beni Amir
Kemubu
Majalgaon
0.0 0.5 1.0 1.5 2.0 2.5 3.0 3.5 4.0
(I-10B) Cross-regulators of main canal (probable ease of cross-regulator operation if system was to be required to provide better service to turnouts)
Figure 7-23. Scatter plot between [cross-regulators of main canal (probable ease of cross-regulator operation if system was required to provide better service to turnouts)] and the [actual service by main canals to its subcanals].
Capacities The capacity of the project delivery system is negatively correlated to the project efficiency of the project. There are several capacity variables that can be used for the evaluation. The following graphs use a combination of the ITRC internal process indicators and the IWMI/ITRC external indicators to illustrate the correlations.
The projects with the highest efficiency are the ones with the smallest capacities. An erroneous conclusion might be that it best to design projects with a restriction in the flow rate capacities in order to force the projects to have better irrigation efficiency. At first glance, this appears to be the logical conclusion. However, project efficiency is only one measure of the performance of the system. Too much emphasis on the project efficiency can lead to incorrect design criteria. The two projects with the highest efficiency, Beni Amir and Bhakra, are not the best projects in other areas, such as economic performance or the lack of anarchy. Nor are they highly rated in their ability to support farmers who want to switch to modern pressurized field irrigation methods.
Chapter 7 - Correlation Evaluation Page 21

. .
Page 140 of 276
ch106 100
ITR
C10
. A
nn
ual
Pro
ject
-Lev
el Ir
rig
. Eff
icie
ncy
, % 90
80
70
60
50
40
30
20
10
0
0 1 2 3 4 5 6 7 8 9 10
(I-11) Capacities of main canals (overall weighted)
MudaDantiwada Cupatitzio
Guilan
Rio Mayo
Beni Amir
Lam Pao
Coello Kemubu
Bhakra
Saldana
Rio Yaqui Alto
Majalgaon
Dez
Office du Niger
Seyhan
Figure 7-24. Scatter plot between [capacities of main canals (overall weighted)] and the [annual project-level irrigation efficiency (ITRC 10)].
c h 1 0 6 b
0
1 0
2 0
3 0
4 0
5 0
6 0
7 0
8 0
9 0
1 0 0
ITR
C10
. A
nn
ual
Pro
ject
-Lev
el Ir
rig
. Eff
icie
ncy
, %
M u d a D a n t i w a d a
Cupa t i t z i o
G u i l a n
R i o M a y o
B e n i A m i r
L a m P a o
C o e l l o K e m u b u
B h a k r a
S a l d a n a
R i o Y a q u i A l t o
M a j a l g a o n
D e z
O f f i c e d u N i g e r
S e y h a n
0 . 0 0 . 5 1 . 0 1 . 5 2 . 0 2 . 5 3 . 0 3 . 5 4 . 0
( I - 1 1 C ) C a p a c i t i e s o f m a i n c a n a l s ( c a p a c i t y l i m i t a t i o n s o f s t r u c t u r e s o r c a n a l c r o s s s e c t i o n f u r t h e r d o w n i n t h e c a n a l )
Figure 7-25. Scatter plot between [capacities of main canals (capacity limitations of structures or canal cross sections further down in the canal)] and the [annual project-level irrigation efficiency (ITRC 10)].
Chapter 7 - Correlation Evaluation Page 22

..
Page 141 of 276
Figure 7-26 shows that there is strong a relationship between the water delivery capacity and the ITRC internal indicator I-25 (water user associations). This may be an important point - if there is a large flow rate capacity, it is easier to form and sustain a water user organization.
c h 1 0 7 a
0
1
2
3
4
5
6
7
8
9
1 0
(I-2
5) W
ater
Use
r A
sso
ciat
ion
s -
ove
rall
wei
gh
ted
M u d a
D a n t i w a d a
C u p a t i t z i o
G u i l a n
R i o M a y o
B e n i A m i r
L a m P a o
C o e l l o
K e m u b u
B h a k r a
S a l d a n a
R i o Y a q u i A l t o
M a j a l g a o n
D e zO f f i c e d u N i g e r
S e y h a n
0 5 0 1 0 0 1 5 0 2 0 0 2 5 0 3 0 0 3 5 0
I T R C 3 . W a t e r d e l i v e r y c a p a c i t y ( % )
Figure 7-26. Scatter plot between [water delivery capacity] and the [percent of area with an active water user association].
4 0 0
Figure 7-27 shows that the IWMI external indicator IWMI 7 (Relative Irrigation Supply) is not equivalent to the inverse of the annual project irrigation efficiency. The idea that these variables were related had been proposed in Molden et al., (1998).
c h 1 0 6 e 1 0 0
0 1 2 3 4 5 6
I W M I 6 . R e l a t i v e i r r i g a t i o n s u p p l y ( R I S )
M u d a D a n t i w a d a
C u p a t i t z i o
G u i l a n
R i o M a y o
B e n i A m i r
L a m P a o
C o e l l o
K e m u b u
B h a k r a
S a l d a n a
R i o Y a q u i A l t o M a j a l g a o n
D e z
O f f i c e d u N i g e r
S e y h a n
ITR
C10
. A
nn
ual
Pro
ject
-Lev
el Ir
rig
. Eff
icie
ncy
, %
9 0
8 0
7 0
6 0
5 0
4 0
3 0
2 0
1 0
0
Figure 7-27. Scatter plot between [Relative Irrigation Supply, RIS] and the [annual project-level irrigation efficiency (ITRC 10)].
Chapter 7 - Correlation Evaluation Page 23

.
Page 142 of 276
Percentage of O&M Collected The "percentage of O&M collected" is an ITRC external indicator (ITRC9rev). This variable did not correlate well with many other variables.
Figure 7-28 shows a relationship between the percent O&M collected and the service indicator to the individual fields based on equity (I-1D). This relationship indicates that there is a link between the service and the capability of the project to collect irrigation fees. Some projects do not have immediate plans to collect irrigation water fees (Lam Pao and Kemubu) and it has been proposed in the northern India project (Bhakra) that the water is also provided for free to the farmers.
ch108a 4.0
3.5
3.0
2.5
2.0
1.5
1.0
0.5
0.0
0 20 40 60 80 100 120 140 160 180
IWMI9rev. Percentage of O&M collected.
Muda Dantiwada
Cupatitzio
GuilanSaldana
Rio Mayo
Beni Amir
Lam Pao Bhakra Dez
Coello
Kemubu
Rio Yaqui Alto
Majalgaon
Office du Niger
Seyhan
(I-1
D)
Act
ual
ser
vice
to
ind
ivid
ual
fie
lds
bas
ed o
n t
rad
itio
nal
on
-far
m ir
rig
atio
nm
eth
od
s (E
qu
ity)
Figure 7-28. Scatter plot between [percentage of O&M collected] and the [actual service to the individual fields based on traditional irrigation methods (equity)].
Number of Turnouts Per Operator The "number of turnouts per operator" variable is a key cause variable that correlated with numerous other indicators. The following graphs illustrate a trend of increased performance and service that is linked to an increase in the number of turnouts per operator - an extremely important point that is linked to both design and management.
Chapter 7 - Correlation Evaluation Page 24
200

. .
Page 143 of 276
ch73c 1 0 0 %
Per
cen
t o
f A
rea
wit
h A
ctiv
e W
UA
9 0 %
8 0 %
7 0 %
6 0 %
5 0 %
4 0 %
3 0 %
2 0 %
1 0 %
0 %
0 1 0 2 0 3 0 4 0 5 0 6 0 7 0 8 0 9 0
( I -28) Number of Turnouts per Operator
M u d a
Dant iwada
Cupat i tz io
Gu i lan
R io Mayo
Ben i Am i r L a m P a o
Coe l lo
K e m u b u
Bhakra
Sa ldanaRio Yaqu i A l to
Ma ja lgaon
D e z
Of f i ce du N iger
Seyhan
Figure 7-29. Scatter plot between [number of turnouts per operator] and the [percent of the area with an active water user association].
ch73d
0
1
2
3
4
5
6
7
8
9
10
0 10 20 30 40 50 60 70 80 90
(I-28) Number of Turnouts per Operator
(I-2
5) W
ater
use
r as
soci
atio
ns
(wei
gh
ted
ove
rall)
Muda Dantiwada
Cupatitzio
Gui lan
Rio Mayo
Beni Amir
Lam Pao
Coel lo
Kemubu
Bhakra
Saldana
Rio Yaqui Al to
Majalgaon
Dez Off ice du Niger
Seyhan
Figure 7-30. Scatter plot between [number of turnouts per operator] and the [water user associations (weighted overall)].
Chapter 7 - Correlation Evaluation Page 25

. .
Page 144 of 276
ch73 10
9
(I-2
6) A
bili
ty o
f p
rese
nt
serv
ice
to in
div
idu
al
fiel
ds
to a
cco
mm
od
ate
pre
ssu
rize
d ir
rig
.
Sys
tem
s (o
vera
ll w
eig
hte
d)
8
7
6
5
4
3
2
1
0
Muda
Dantiwada
Cupatitzio
Gui lan
Beni Amir
Lam Pao
Majalgaon
Kemubu
Bhakra
Dez
Saldana
Rio Yaqui Al to
Off ice du Niger
Seyhan
Rio Mayo
Coel lo
0 10 20 30 40 50 60 70 80 90
( I -28) Number of Turnouts per Operator
Figure 7-31. Scatter plot between [number of turnouts per operator] and the [ability of present service to individual fields to accommodate pressurized irrigation systems].
ch73a 4.0
3.5
Muda
Dantiwada
Cupatitzio
Gui lanKemubu
Rio Mayo
Beni Amir
Lam Pao
Rio Yaqui Al to
MajalgaonDez
Coel lo
Bhakra
Saldana
Off ice du Niger
Seyhan
(I-2
6B)
Ab
ility
of
pre
sen
t se
rvic
e to
ind
ivid
ual
fiel
ds,
to
acc
om
mo
dat
e p
ress
uri
zed
irri
g.
Sys
tem
s (f
lexi
bili
ty t
o t
he
fiel
d)
3.0
2.5
2.0
1.5
1.0
0.5
0.0 0 10 20 30 40 50 60 70 80 90
( I -28) Number of Turnouts per Operator
Figure 7-32. Scatter plot between [number of turnouts per operator] and the [ability of present service to individual fields to accommodate pressurized irrigation systems (flexibility to the field)].
Chapter 7 - Correlation Evaluation Page 26

Page 145 of 276
It is clear that having additional personnel does not mean there will be a more flexible operation. When WUAs were formed in Mexico, one of the first actions was to fire a large percentage of the previous government employees and then provide the remaining operators with the means of operating efficiently. The systems with a large number of turnouts per operator seem to have several things in common. These systems tend to have operators that understand the concept of "service". The systems have staff that are mobile and spends a high percentage of time in the field working on operations rather than at the office filling out paperwork (or in the field just collecting statistical data).
The activity of the water user association also appears to be linked to the number of turnouts per operator. Projects that are overloaded with operators appear to have poor success with successful water user association formation.
Summary
There are several variables that seemed to have a strong correlation when compared to other variables collected in this research. The following are the key variables that were evaluated in this section:
• Percent of Area with an Active Water User Association • Size of the Water User Association • Time Needed for the Manager to Travel Down the Main Canal • Communications - How Often do Cross-Regulator Operators Communicate with the
Next Higher Level (Hr) • Cost of the Land Close to the Head of Canals • Actual Service to Individual Fields Based on Traditional Irrigation Methods5 • Actual Service by Main Canals to Its Subcanals • Capacities • Percentage of O&M Collected • Number of Turnouts Per Operator
Plots were constructed to evaluate the relationships to see if there were any trends in the data. Due to the nature of this study, the evaluation consisted of finding strong visual relationships.
The following summarize some of the key findings of the graphs:
1. The projects with a high level of flexibility to the individual fields have the highest values for the percent of area with water user associations. Those projects with low water delivery service ratings seem to have a problem with getting the water user associations started.
2. The projects with a high percentage of active WUAs seem to have several things in common that contribute to the success of implementing a WUA. These systems have a high degree of flexibility in the water delivery service to the individual fields.
3. There is a link between the creation of effective WUAs and the future transition to pressurized irrigation methods.
Chapter 7 - Correlation Evaluation Page 27

Page 146 of 276
4. Those projects where the manager has difficulty getting down the canals, the stated water delivery service to fields is the lowest.
5. Those systems with the worst access have the least expensive water.
6. Those projects that have a poor transportation network seem to have a lower level of service.
7. If the main canal is easily accessible, then the headworks to the submain canals are operated quite well.
8. Those projects with the least amount of flexibility and experiencing poor service are the ones with the most expensive land costs.
9. The projects with the best ratings for the WUAs are the projects with the lowest land costs.
10. The general trend is that there needs to be clarity and correctness in the instructions in order for projects to have good service at the turnouts to the individual fields.
11. Good service from the main canals to the submain canals is a key indicator for providing good service to the field level.
12. Some of the projects are consistently on the low end of the graphs (Lam Pao, Dez, Rio Yaqui Alto and Bhakra).
13. In general there was minimal anarchy in the evaluated systems. This is in sharp contrast to previous studies that have noted extreme chaos and anarchy in traditional irrigation projects. Instead, this research project shows relatively optimistic results.
14. There is a limited relationship between the level of service provided to the individual fields and the output of the project. None of the IWMI production based external indicators showed good correlations with any of the other variables based on the Pearson Correlation coefficient. This may be partly due to the problems with collecting meaningful economic data with the rapid appraisal process (RAP).
15. The projects with the highest efficiency are the ones with the smallest capacities. An erroneous conclusion might be that it best to design projects with a restriction in the flow rate capacities in order to force the projects to have better irrigation efficiency. At first glance, this appears to be the logical conclusion. However, project efficiency is only one measure of the performance of the system. Too much emphasis on the project efficiency can lead to incorrect design criteria.
16. There may be a relationship between a large flow rate capacity and the ease to form and sustain a water user organization.
Chapter 7 - Correlation Evaluation Page 28

Page 147 of 276
17. A trend of increased performance and service that is linked to an increase in the number of turnouts per operator - an extremely important point that is linked to both design and management.
18. The systems with a large number of turnouts per operator seem to have several things in common. These systems tend to have operators that understand the concept of "service". The systems seem to have staff that is mobile and spends a high percentage of time in the field working on operations rather than at the office filling out paperwork (or in the field just collecting statistical data).
Chapter 7 - Correlation Evaluation Page 29
Page 148 of 276
Chapter 8 - General Observations
The previous chapters presented concepts numerically, based on the project data and the various external and internal process indicators which have been developed. The supporting data was developed with the RAP (Rapid Appraisal Process) which was a result of this research project. The RAP also provided an opportunity to observe, hear feedback, and contemplate many related factors.
This chapter generally departs from the numerical depiction of concepts and instead contains general observations which were made during and after the project visits. It will focus on factors that can be improved. The reader should consider these observations while keeping in mind that there were numerous examples of good management and design found in most of the projects that were visited. Of course, in some cases the project authorities were putting serious effort into programs which would have been more effective if they were refocused, or discarded in favor of other programs. One person might interpret this observation to be negative. Another person might interpret it as positive - that the project authorities were seriously trying to improve conditions.
Developing the Proper Focus Some of the irrigation projects had management staff which were able to properly focus on the big, important issues. In other projects, the management and engineers tended to concentrate energy and resources on factors which were not really very important in terms of overall project operation.
A feature of modern design and operation is often the minimization of the collection of large amounts of data which are used for statistics. Interestingly, modern projects tend to increase the availability of information needed for operation. It was apparent from this research project that there is tremendous confusion between these two types of data.
Some irrigation projects waste tremendous amounts of employee time by measuring meaningless data (e.g., water levels at the head of lateral canals in non-rated canal sections), where the time would be much better spent in controlling water levels and flows. Examples of this can be found in Lam Pao, Cupatitzio, and Rio Yaqui Alto. In Cupatitzio, the canal operators spend the vast majority of their time inside the office filling out data forms. The opposite is found in Coello, where the canal operators come to the office twice daily (on their motorbikes), but only for about an hour each time, to collect water orders from the farmers. The rest of the time the canal operators and the supervisors are outdoors, actively working on water deliveries.
In Lam Pao, the operators diligently maintain records, even though the records clearly show that water levels and flows are not maintained as desired. The procedures are such that the operators just continue to record numbers and never take steps to question whether the results are wrong and what can be done to remedy problems.
Chapter 8 - General Observations Page 1

Page 149 of 276
A key distinction between the two types of operation (Coello versus Lam Pao) is that in Coello operators have the freedom to make decisions, and the expectation is that operators are responsible for providing service to downstream users. Coello has apparently made the distinction between the two types of data. Operators only work with operational data; statistical data is collected, recorded, and manipulated by other personnel.
When dealing with the operation of a canal system, one must focus on results rather than on process. For example, the Lam Pao management emphasizes "process" and requires operators to diligently record the gate positions and water levels, when the desired "result" is a water level. Field operators are not allowed to take personal initiative to achieve the desired result. Instead, they must follow a process. This is typical of some top-down management styles.
Some of the data, which is collected for statistical rather than operational purposes, can be meaningless because of its nature. An example is detailed canal seepage measurements and computations which are based on a water balance of inflows minus outflows. In Rio Mayo, serious efforts were made to compute seepage losses, but the computations were flawed because the error in outflow (offtake or turnout) flow measurement was greater than the magnitude of the seepage.
Two projects in particular did not appear to focus enough on the solution of major budget expenditures. In Beni Amir, the major maintenance and annual expense item was the repair of canalettes which were broken or had early deterioration of the concrete. The deterioration appeared to be caused by corrosion of the upper reinforcing steel wires. However, a visit to the canalette factory showed that no new concrete mixes or reinforcing wire materials were being studied or used to remedy the corrosion problem.
Similarly, in Saldaña silt removal uses 46% of the district's annual income. This single major problem, resulting from an extremely high silt load in the water, dominates the management and design of the whole system. In order to have a reliable, flexible, low annual cost delivery system, that problem must first be addressed and solved. Solutions appear to be available, but are not being implemented.
Irrigation Efficiency Project-level irrigation efficiency is addressed with the external indicator ITRC10, shown in Figure 5-16. Individual annual project irrigation efficiencies are also shown in Table 51. The values range from a low of 13% (Saldaña), to a high of 99% (Beni Amir), with all values having confidence intervals in the 20 - 40% range. It should be noted that in this report, project irrigation efficiency is not the same as conveyance efficiency. It is the percentage of available irrigation water which is used beneficially throughout the whole project. One might ask if project-level irrigation efficiency is important at all. The answer is definitely "yes", with a few of the reasons as folloows:
Chapter 8 - General Observations Page 2

Page 150 of 276
1. Many projects had large amounts of diverted water (such as Saldaña), yet the low efficiencies caused restrictions in the planted area. This means that part of the irrigation infrastructure investment was under-utilized, since at any one moment the infrastructure was conveying water to areas that were not planted nor ready for irrigation.
2. Crop yields are definitely tied to field water management, and field water management is related to the quality of water service provided. Crop yields had potential for improvement in all cases, with little or no increase in total evapotranspiration (ET).
3. Improved operation and the resulting improved efficiency can reduce waterlogging and drainage problems, as done in Rio Yaqui Alto (Dominican Republic), once the water user organizations were established and canal lining was improved.
4. In several of the projects, irrigation inefficiencies did not benefit downstream users. The return flows from these projects (Rio Mayo, Dez, Muda, Kemubu) flows directly into salt-water bodies.
5. Higher irrigation efficiencies in many projects would enable them to maintain higher in-stream flows immediately downstream of the reservoirs or diversion dams, thus resulting in a better river environment.
It was clear that project authorities and consultants, in general, do not understand how to properly develop project-level water balances nor how to compute on-farm and project-level irrigation efficiencies. This lack of understanding shows up in several ways:
1. Expensive drainage programs might be halted or reduced if more attention was paid to source control of the drainage water.
2. In some cases, canal lining, for the purposes of improving water supplies, does not improve supplies at all since the projects have extensive groundwater pumping. This is not to say that there are not other benefits to canal lining, such as reduced maintenance costs and less water theft.
3. Project authorities may think more water is available than really exists. This was apparently the case in Beni Amir, where there were plans to expand the irrigated area even though the project efficiency was close to 100% (due to groundwater pumping of deep percolation water).
4. Project authorities may think that the only way to make more water available to farmers is to divert more water - even though they may be presently diverting 2 or 3 times what is needed for net use. This was perhaps the most common error in thinking in the projects visited.
Chapter 8 - General Observations Page 3

Page 151 of 276
5. Investment may be spent in the wrong place. For example, in the Dez project it appeared that canal seepage and spill was minimal as compared to field irrigation water losses. A knee-jerk reaction might be to implement major programs for field (on-farm) irrigation improvements to improve efficiencies. This would be inappropriate because the water is lost from the fields as a result of being supplied to the fields by the canal system when it is not needed. It should be no surprise that it is then "wasted" on-farm. Water is supplied 24 hours a day, even though there are no night irrigations, and water is only used a few days per week, although it is delivered 7 days per week. The solution in this case would require changes at both levels - field and canal system.
There appeared to be three major conceptual errors regarding irrigation efficiencies:
1. In general, recirculated groundwater was double counted as a water source or not considered at all in the computations.
2. Field seepage losses (with rice) were counted as "beneficial" for project-level computations. There are two problems here. First, field-level measurements do not generally give any indication of project-level efficiencies, because field losses may be recirculated within the project. Second, seepage losses may be unavoidable, but they are not "beneficial" in the definition of field-level irrigation efficiency.
3. Reported values of project-level irrigation efficiencies were really only estimates of conveyance efficiencies.
Several points continued to re-appear in the 16 projects regarding annual project-level irrigation efficiencies. These were:
1. Projects with good subsurface drainage will typically have lower efficiencies than those with high water tables. The reason is simple - high water tables enhance intentional or unintentional reuse of deep percolation.
2. Low project efficiencies were typically associated with:
a. Very infrequent changes in the main canal flow rates, and
b. A lack of real-time, frequent monitoring of the conditions within the canal network and at spill points at all levels within the network.
These problems are relatively easy to fix, and require a relatively inexpensive combination of hardware and management changes.
3. In most projects, if there are not large surface drainage flows or high water tables, project authorities appear to believe that they have high efficiencies. In areas with
Chapter 8 - General Observations Page 4

Page 152 of 276
excellent soil permeability and good subsurface drainage, these projects may have poor efficiencies and not be aware of it.
4. While some projects have recirculation of surface drainage water (such as Coello and Muda), other projects have tremendous unused potential for improving project-level efficiency through simple surface water recirculation projects. Probably the most pronounced benefit would occur in Office du Niger, where the soils are relatively impermeable and the topography is very flat. In such conditions, almost all of the inefficiencies show up in surface drain canals, and this water can easily be repumped. While low lift pump stations for recirculation have been standard items in many places throughout the world for decades (such as Seyhan, Muda, numerous projects in California and Holland), unfamiliarity with pumps and recirculation systems obviously makes many engineers and project managers discard this option immediately. Instead, they tend to opt for very expensive options. Recirculation systems, if designed and implemented properly, can be extremely simple to operate, drastically improve project efficiencies, and can often be implemented for a small fraction of the cost of other options. Of course there are maintenance issues, but these problems are greatly exaggerated. Any mechanical system (including the millions of motorbikes found in less developed areas of the world) requires periodic maintenance, as well as the availability of spare parts inventories.
There was a significant amount of recirculation on Seyhan (pumps), Muda (pumps), Kemubu (pumps), Coello (gravity). There was a minor amount in Bhakra (wet season pumps for drainage water removal - not for operational purposes). See other previous paragraphs in this section.
In short, most of the projects have relatively simple and inexpensive options (both hardware and operational) which can be immediately implemented to make substantial improvements in project-level efficiencies. This should not be surprising, since the average project-level efficiency was estimated at 38% (unweighted average). But while those options are desirable, they are insufficient to meet the future requirements of optimum water management (and resulting high yields and better environments). Once the easy steps are taken, there must be systematic changes in attitude including an adoption of the service concept, intensive pragmatic training, modifications to the canal and pipeline hardware designs, and improvements in operation procedures in order to achieve potential performance levels. These will take much more time and investment to accomplish.
A few other items regarding efficiencies stood out in the study. These include: 1. Land leveling is very important for field-level irrigation efficiency and for obtaining
high crop yields if surface irrigation methods are used. Farmers are often convinced that it is the single most important water management item (keeping in mind that they currently have enough water). Furthermore, if the land leveling is poor, then the fields must be very fragmented in order to have small level areas - resulting in long and inefficient distributary canals. Another effect of the fragmented field sizes is that a large percentage of land is out of production because it is used as bunds.
Chapter 8 - General Observations Page 5

Page 153 of 276
Ideally, land leveling with proper equipment should be done prior to allowing the farmers onto the fields in new projects. Farmers in the Niono area of Office du Niger stated that with all other things being equal, the difference in yield due to land grading is about 1.5 - 2.0 tons/ha. Therefore, it increases the yield from 4 tons/ha to 6 tons/ha. This is up to a 50% increase in yield - something which cannot be ignored. The farmers themselves in Office du Niger have no animal or machine equipment to assist with leveling - it is all done by hand unless there is a special government program to assist farmers.
2. Complex management schemes to measure water and distribute it equitably are limited in potential to day-only irrigation schemes due to lag time in secondary and tertiary canals. Instead, one must keep the canals full and then have a program to minimize flows in the evening, and then for recovering the drainage water. This also requires storage in reservoirs or in canals. This is very applicable in flat topographies.
3. If a project implements a policy of planting by sector (area) in order to minimize canal losses, this can be bad for the larger farmers. Larger farmers do not typically have enough equipment to plant all of their acreage at the same time. They continuously move their equipment around the farm, and are able to do this by planting small areas on different dates. This factor is a consideration because of the apparent trend in many countries towards more rental properties and larger farm management units.
Management Many discussions have been held over the years regarding the relative importance of improved management (operation) versus hardware design in irrigation projects. This research project developed an internal process indicator I-27 (Figure 6-41), and shows that both factors are important. In some projects, the major roadblock to improved water delivery service is management; in others it is hardware. But in all projects, both hardware and management need improvement. In many cases, the management is limited by the type of canal design.
Some management issues are closely tied to culture and government policies - influences which are difficult to change quickly at the irrigation project level. But the investigators of this research project were left with an almost overwhelming feeling that many very simple management/operation changes could be immediately implemented and have significant beneficial impacts on performance. The topic of the next section of this chapter, training, provides some insight into how project personnel might be motivated or become aware of these simple changes.
The notes below highlight some of the major management-related observations from this research project:
Chapter 8 - General Observations Page 6

Page 154 of 276
1. In several projects, the flow rates at the source were only changed occasionally during the year. However, these project typically had an employee visit the source to make measurement and do simple maintenance. It would be easy to make flow changes at a dam once per day if a person already visits the dam daily. It would also be easy for the lateral (submain canal) operators to make daily changes if they knew how to properly operate their cross regulators.
2. Simple things such as reservoir operation rules and maintenance schedules may be modified with ease. In Lam Pao, there may be some benefits to re-examining the reservoir discharge rules, thereby giving a longer growing season. Official centralized policies regarding reservoir management may not provide the maximum benefit in this case.
Another limitation for the Lam Pao project comes from the two maintenance periods used. The first maintenance period occurs between early November to December 25. This time period coincides with the end of the wet season. The second maintenance period occurs in April, in preparation for the start of the wet season. The timing of the November/December maintenance period affects the timing for planting vegetables. For optimal yields, the vegetables need to planted earlier than December. There are some practical problems which may delay some maintenance decisions, including scheduling of vacations for Royal Irrigation Department personnel, and the beginning of the fiscal year in October. However, a major recommendation to the RID would be to modify the maintenance period so that the water is available as much as possible to the farmers in November and December. This could be accomplished by selective shutdowns of specific reaches of canal, rather than shutdown of the complete system. A benefit to reduced down time would be the reduction of the wet/dry cycle that may be accelerating the deterioration of the concrete panels.
3. You get what you pay and train for. In Rio Yaqui Alto, for example, the main canal gate tenders receive very low salaries and have virtually no training. They take measurements and move things occasionally, but they do not have any concept of what their job should really entail. Employees (tecnicos) of the water user associations operate the canals downstream of the main canal. Those employees earn about 4 times as much as the main canal gate tenders, have a college education, and they take a lot of initiative on their own. Since these professional employees have been in place, it appears that bribery has almost disappeared. In short, canal operators who are paid minimum wage and have no training, cannot be expected to operate a system properly.
Cupatitzio is another similar example. The directors of the water user association believe that a canal operator only needs a half-day or so of training to do his job effectively. This low opinion of the job results in hiring canal operators at very low wages and not providing incentives or training. The net effect is that the canal operators have little motivation and are not very aware of what is happening throughout their canal distribution system.
Chapter 8 - General Observations Page 7

Page 155 of 276
4. An area of interest was the difference between stated and actual service in the field. Figures 7-9 through 7-12 show that there were often differences. It is obviously a management issue if the office staff and administrators are unaware of the field conditions, or if they refuse to acknowledge the actual field conditions. Solutions cannot be developed unless the problems are acknowledged and understood. Bhakra and Lam Pao, two projects with the worst performances, had consistently large discrepancies between stated and actual service. Rio Yaqui Alto also had a huge discrepancy in stated versus actual service by the main canals. Managers in Guilan, Seyhan, Dantiwada, Muda, Kemubu, Coello, Saldaña, and Rio Mayo had a good sense of what the actual levels of service were throughout their canal systems. In Beni Amir and Office du Niger, the managers were somewhat in-between in their understanding.
5. Coello, Rio Mayo, Saldaña, Seyhan, and Dantiwada are operated by professional staff with an apparent sense of duty and adherence to the "service concept". The field operators are highly mobile, as are their supervisors. The field operators handle most problems with farmers, but the farmers know that they have access to the supervisors, and problems are generally solved within hours rather than weeks. These irrigation projects have developed procedures in which the canal operators spend the vast majority of their time operating the canals and turnouts and taking water orders, rather than filling out statistical forms. They work in a "responsive" mode rather than in a "pre-programmed, inflexible" mode.
6. A key factor appears to be whether or not the operators of canals operate multiple structures, and make their own decisions on how and when to operate the structures. If operators are judged by results rather than by process, the service is better. This requires training operators and providing clear instructions as to what results are expected. The upper management must understand the concept of service, and what types of service are desirable and possible with their irrigation project. Once that is known, clear and proper guidelines can be developed for operators.
In some of the projects with the poorest level of service to the farmers (e.g., Lam Pao), the main canal operators are given very clear, written guidelines of exactly what is expected of them. There is also a procedure to check whether or not those guidelines have been followed. The problem is that the guidelines refer to process rather than desirable results.
Interestingly, in those systems with the most dynamic canal operators, one does not see written guidelines for either process or results. Instead, those systems have relied on key managers to verbally pass down concepts of service, or procedures have been demonstrated to new employees in the field but are not in writing. As a result, these operators have a "sense" of service, but they do not have clear, written guidelines by which they can be evaluated.
What is needed is something in-between. That is, employees need to know what is expected of them, and there should be clear performance guidelines. However, those
Chapter 8 - General Observations Page 8

Page 156 of 276
guidelines must focus on results, such as the expected degree of control of water levels and the allowable fluctuation of flow rate, rather than on statistical forms.
Not one of the projects had a meaningful periodic review for the canal operators. In some projects, the employees knew that they were officially reviewed, but they never saw the results of the review themselves, nor did they have formal interviews and reviews from their superiors.
The issue of operating rules was particularly evident in the Kemubu project. Its staff is responsible for 5 constructed irrigation schemes. They are also involved with the expansion into the Kemasin Project, which consists of about 20,000 additional hectares and will be operational by the year 2000). The projects managed by the staff have been constructed in at least 7 stages with various design strategies. The project authorities have attempted to standardize rules and procedures despite the wide differences in hardware out in the field. The conclusion is that there is a limit to how much procedures can be standardized for any single project. Training must be available which focuses on the results that should be obtained from different equipment and management approaches, with information included about the appropriate procedures for each type of equipment.
7. The common approach to irrigation scheduling in Asia is inherently different from the approach used in other areas of the world. In Asia, a theoretical rotation schedule of deliveries to fields downstream of a turnout is often determined by the project staff. This schedule is then permanently posted on large signs for each irrigation block, so that farmers know when the water should be available. If the water actually arrived as promised, these signs might be meaningful, but in general it appears that these published schedules are different from actual schedules.
In some projects as Lam Pao, Dantiwada, Majalgaon, and Kemubu, the signs are posted once and never modified. In the Kemubu project the signs are updated every season and include information on various agronomic activities as well as water availability. In Kemubu, everyone understood that schedule signs are primarily used as guidelines for everyone's planning purposes rather than as a rigid schedule.
8. There has been an abundance of discussions and reports about the best irrigation scheduling technique to use in India. Some observations from this research project are:
a. Shejpali, Warabundi, and RWS, are schemes which concentrate on trying to achieve equity in water distribution and, in some cases, matching water deliveries to the crop requirements.
b. All the methods are incompatible with modern field irrigation techniques. By concentrating on these scheduling methods rather than examining other options for water distribution, Indian farmers will be locked into substandard field irrigation techniques for many generations.
Chapter 8 - General Observations Page 9

Page 157 of 276
c. Discussions of the merits of Shejpali vs. Warabundi vs. RWS, can leave one with a sense of hopelessness - that it might be impossible to ever establish equity and support more modern field irrigation systems in India. For example, the equity of the warabundi delivery system in Bhakra is poor. One of the engineers (in one division) on the Bhakra project reported 126 cases of water stealing in one rotation. There are 12 divisions (about 680,000 irrigated ha) and including wet and dry season they have about 24 rotations which roughly extrapolates to about 20,000 cases of reported water stealing for the whole project in a year. Although water is readily available at the upper portion of the systems and near the canals, there is tremendous conflict in the lower portions of the system.
This research project enables us to stand back and analyze the situation not just from within the project, but also comparatively against other projects facing similar conditions (very small fields, uneducated farmers, low income, scarce water). In this regard, Figure 6-42 (Internal Process Indicator I-28, number of turnouts/operator) and Figure 4-25 (number of farmers who must cooperate on final distribution) are very enlightening if Bhakra represents a "typical" Indian project for which these scheduling issues are a major concern.
Figure 6-42 clearly shows that the management is very inefficient in Bhakra. Bhakra operators (including all persons operating structures of any kind in the field) are only responsible for about 3-4 turnouts each. This can be compared to Seyhan which has about 60 turnouts/operator and Coello which has about 80 turnouts/operator. This means that in Coello, it is much easier to have flexible management because a manager only needs to talk with about 5% as many employees (for the same responsibility) as in Bhakra. Furthermore, because one operator in Coello is responsible for so many more structures, there is less inter-operator communication necessary to make everything function well.
The “number of farmers who must cooperate on the final distribution of water” is defined as the number of farmers located downstream of the final point of actual project employee control. That is, there is a point in every system beyond which the employees are not, on a regular basis, personally responsible for the physical actions required for distribution of water to the farmers. Farmers must personally take action downstream of this point in order for the water to be shared and/or divided. Figure 4-25 shows that the number of farmers who must cooperate on the final distribution of water in Bhakra (even if there are supposedly rules in place) is about 50, compared to about 5 in Dantiwada (which is also in India). It is the opinion of the authors of this research project that the arguments of Shejpali vs. Warabundi vs. Rotational Water Supply vs. similar scheduling techniques will never be settled as long as so many farmers must cooperate.
Chapter 8 - General Observations Page 10

Page 158 of 276
"Modern" irrigation projects do not rely on inter-farmer cooperation. They have professional staff who distribute the water to individual fields, or to manageable numbers of individual fields. If one of the objectives is to support modern field irrigation methods, it is a requirement that individual fields be treated individually. Table 4-1 clearly shows that Bhakra is not so unique that it requires special rules. Many of the other projects also have small fields.
For a water scarce project, perhaps the only way to obtain equitable water delivery of water, is to modify the thinking of all of the participants in the process. Large-scale changes in the water distribution methodology from Shejpali to Warabundi to RWS was possible for the Dantiwada project in India due to education and training done by WALMI. Along with the education, was a realization that equitable water delivery was tied to having good control of water levels throughout the project. The good control on this project was obtained by modifying the operation of the cross regulators and the installation of long-crested weirs on the project.
9. The management of the canal system for the Dez project was unique. The original design for the Dez project was for a canal capacity of 4 lps/ha. This was the design used at the tertiary and secondary level. The larger main canals were then sized for 2 lps assuming that they would not be in use all of the time. The current operation of the canal system is to deliver the water throughout the entire system at a target of about 2 lps/ha, regardless of where the water is to be delivered in the system. This has created many problems with the delivery of water to the farmers - a problem that could be remedied by a change in operational strategy.
Computers There were several examples of excellent computer use, although these were in the minority. The site visits did provide clear evidence of the following:
• Many people are looking to computers as "the answer" to water control. • Those people are looking in the wrong direction.
Computers can be used in many ways in irrigation projects. Such as:
1. Water ordering software. For a system providing flexible water deliveries and reasonably good hydraulic control (of water levels and flows) in the field as well as a mobile field staff, a computerized water order program can be helpful. Rio Mayo has such a system. The operation is rather advanced and is service oriented. A water ordering and tracking program has been useful. Only a few of the other projects were advanced to the point where they could actually receive meaningful water orders from farmers.
In Morocco, the personnel on the Beni Amir project were developing a software program to keep track of water orders from the farmers. This will improve their
Chapter 8 - General Observations Page 11

Page 159 of 276
present operation. However, the Beni Amir hardware limitations prevent the project authorities from providing a very good degree of water delivery service to the fields. Therefore, the software program is not expected to significantly enhance the flexibility of water delivery nor change the basic mode of operation. Rather, it will have the potential to eliminate copying orders by hand numerous times.
2. Unsteady flow computer models are used to analyze the operation of main canal for modernization. This is generally an unwise allocation of resources - in other words, a waste of time. The people who run the unsteady models must understand possible options in order to conduct meaningful simulations. Generally, one can determine the best possible canal control options through a simple RAP if one understands hydraulics and the control of unsteady flows. If one does not understand those principles, the computer model will not automatically provide the correct answers. Unsteady flow computer models are best used to fine tune automatic gate control algorithms after the big answers and strategies have already been identified.
Beni Amir (Morocco) is a project using unsteady flow computer models. The stated purpose of using such a model (which requires considerable engineering resources inside the office as well as extensive surveying and foreign consultants) was to determine how flow rate changes would move through the canal. This information on how a flow rate change moves through a canal can be easily determined by making a flow rate change and then measuring flows and water levels as the change moves through the canal. That field work can be done in days rather than requiring man-years of investment in computer simulation.
3. Unsteady flow simulation models can be used to predict cross regulator gate movements for real-time operation. However, this too is a very unwise allocation of resources - a statement which flies directly in the face of numerous research projects which have been conducted on irrigation systems. The best (worst) example of this was the use of the WASAM program in Lam Pao, Thailand. A computer model (developed over many years by numerous consultants, with numerous engineers spending large amounts of effort to learn the logic and to make field calibrations) was used to predict gate openings on the main canal on a daily, even hourly, basis. The field operators are provided with the required gate settings and they diligently adjust the gates. The objective is to maintain constant water levels in the canal - an objective which is not even remotely achieved. Much better control would be achieved if the gates were never calibrated and no computer program was used. Instead, the field operators just need very simple instructions - maintain the upstream water levels within a certain range. The field operators can determine on their own how much to move the gates to achieve this. As an example, this very simple procedure was observed being used very successfully in Dantiwada, India - a project with similar main canal cross regulator designs. An even more extreme (and good) example of cross regulator operator instructions was found in portions of Office du Niger - where some canals were operated manually under downstream control.
Chapter 8 - General Observations Page 12

Page 160 of 276
Some features of WASAM have good potential, including the prediction of crop water requirements based on field and weather information. The complex and erroneous canal hydraulics (cross regulator movement) portion of WASAM could easily be discarded in favor of the simple options noted above.
4. Computers can be used in remote monitoring operations. This is a wise usage of computers because a properly designed monitoring system is designed properly (including the locations of sensors, software, and hardware), it can provide valuable real-time operational information to the operators.
The Muda project in Malaysia had a good use of a computer program for monitoring the irrigation water deliveries. Muda has limited water supplies from the reservoir diversions, and must rely heavily on other sources of water, such as uncontrolled inflows and rainfall. In order to minimize the deliveries from the reservoir system, the Muda project evaluates data from 70 weather stations and also evaluates uncontrolled flows from 2 tributary rivers. This information is helpful because the water from the reservoir has 67 km of travel distance down a meandering river before the reaching the main canal headworks. The water can take up to 72 hours in travel time to reach the lower part of the delivery system. The monitoring system is used to monitor the volumes and discharges required for the system and not to dictate the deliveries to the divisions.
The authorities at the Beni Amir project are embarking on a remote monitoring program which has the potential to assist in operations. Its focus is different than Muda's. The Beni Amir approach is a more traditional (and very useful) system to monitor canal spills and flows at strategic locations.
5. Computers can be used to directly control canal cross regulators automatically. There are numerous feedback logic systems which can be used, some are simple, while others are very complicated and risky. The main canal of Cupatitzio was supposed to have a semi-complicated, risky logic in place, but during the site visit it was discovered that it was never implemented. Cupatitzio also had a recently abandoned automatic structure in a large submain; the control logic was evidently quite complicated.
The Bival algorithm for downstream control was supposed to be functional in Office du Niger. However, close questioning of the conveyance canal operators revealed that the canal was actually being operated manually, and the original Bival algorithm results were always "adjusted" in some unforeseen manner.1 Interestingly enough, this project has been reported in various reports as having a successful Bival implementation. There was obviously a gap in communication and training since the original implementation/research done several years ago. It should be noted that in this case
1During the visit to the project, a new engineer was in the process to taking over the responsibility for the Bival algorithm. He did not have a good idea of what it was or what it was supposed to do, and it did not appear that he would receive training.
Chapter 8 - General Observations Page 13

Page 161 of 276
the Bival algorithm was not automatically computed. In a more typical situation it, would be computed with computers.
The only project with an actively functioning computer control on part of it was Majalgaon. The control logic was just implemented in 1997 and tested a single time prior to the site visit. The focus of the automation was using the concept of "dynamic regulation". This concept requires the centralized computer control of all of the main canal cross regulators. The training requirements for so a sophisticated project are significant. This could lead to future problems due to the frequent rotation of engineers in India.
Overall, it appears that in Majalgaon, there was tremendous investment in automation based on an over-estimation of the area supplied by irrigation water. Because the Majalgaon computerized portion is so greatly over-designed, it cannot serve as a good example of automation with computers.
In the western United States, Australia, and Canada, simple computer controls for local, distributed control of canal gates are becoming quite popular. This control is typically provided just at key points that need automation within the system - as opposed to having a complete automated system at all structures. This type of modernization strategy was not seen in the 16 projects.
6. Computers can be used for information dissemination. The Kemubu project uses the INTERNET. The project has posted basic information on the facilities and the yields, and has its own web site located at http://kada.moa.my. These information sources are not targeted for the customers (the farmers) but rather for the general public.
Cost Recovery The two Colombian projects (Saldaña and Coello) have many management features in common with western U.S. irrigation projects. They are also relatively mature - having been established in the 1950's. They have strong water user associations and board members who understand business operations. Many of the farmers (those who farm large areas of land as rental property) understand that water charges must be high enough to pay for required services. Also, the money which is collected stays within the water user association, rather than being sent to the country government and then returned to the WUA.
In no case were the water users paying back the cost of the infrastructure investment. Figure 5-17 shows external indicator IWMI9rev (% of O&M collected), and it can be seen that only 2 projects (Saldaña and Guilan) had more income than the total O&M expenditures, with Coello being close to 100% recovery. Lam Pao, Dantiwada, Muda, and Kemubu water users were paying zero or close to zero percent of the O&M costs, and Rio Yaqui and Cupatitzio were only in the 25-30% recovery range.
Chapter 8 - General Observations Page 14

Page 162 of 276
Only in the Mexican projects is there a policy of paying back a portion of the infrastructure investment on new projects, and farmers who were interviewed said that this new policy may put new infrastructure investment out of reach economically. The 50/50 (or so) cost sharing policy in Mexico has not yet been implemented, and may be phased in within the next 10-12 years. Time will tell how successful the 50% cost sharing requirement policy will be in Mexico.
One might ask how this compares to irrigation projects in the United States. In the U.S., modernization has only recently occurred on most projects. The change began gradually, and was generally in response to external pressures (maintaining in-stream flows for fish, negative effects on drainage water on fish or fowl, lack of water for urban areas, groundwater overdraft, etc.). Although many California irrigation districts are beginning modernization efforts through self-funding, the majority of irrigation districts still depend on technical assistance, low interest loans, and grants from government sources when they embark on modernization programs. In other words, investment in major infrastructure improvement is not always totally self-supporting in the U.S., but is still ahead of what was seen in these 16 projects. In regards to the O&M costs, the days of subsidized O&M costs have totally disappeared in most U.S. irrigation projects.
Thus, it appears unrealistic to expect farmers in these countries to be willing to pay for the full cost of modernization at this time. The percentage of modernization costs borne by the farmers remains undetermined. It has been demonstrated that it is possible to have effective recovery of O&M costs in some of the projects. However, the big question is:
What conditions must exist in order for farmers to be willing to pay O&M costs?
This question is addressed in subsequent comments in this chapter.
Trends in Farm and Field Sizes In some irrigation projects, land becomes more and more subdivided as parents pass land to children. Eventually, the fields and farms are too small to be farmed economically. At that point, it appears that a gradual shift develops in farm management organizations.
A shift of small parcel management from the owner to a renter was particularly noticeable in the Latin American projects. In extreme cases, such as Saldaña and Coello, almost all land is rented even though there are numerous landowners. In effect, the farm management units become fairly large, although there are many landowners and many small fields.
In summary, the characterization of an irrigation project based on the number of landowners can be deceiving, since only a few large farmers may actually cultivate the majority of the area.
Chapter 8 - General Observations Page 15

Page 163 of 276
Training The previous sections included comments on the need for improved training. Every single project visited had serious training needs which, if met properly, could result in rapid and effective improvements in performance. Interestingly, projects with the best service at various levels tended to have staff with the highest interest in training and new knowledge. Conversely, projects exhibiting poor performance tended to have a low interest in training and a high opinion of their own capabilities.
Sophisticated computerized techniques do not present the greatest training need for design and operation. Rather, there are major gaps in pragmatic understanding about fundamental issues of irrigation water control. These gaps in knowledge and understanding were very evident at all levels - from senior engineers to junior engineers. It is common for project engineers to be relatively well educated (often with B.Sc. and M.Sc. degrees). Furthermore, the project engineers at first glance appear to understand many concepts and formulas. However, they are lacking the ability to synthesize this information. It is necessary to put all the pieces together properly - and there are a lot of pieces to put together in order to come up with a simple, overall control and operation strategy.
This means that training cannot simply be a textbook exercise or a list of facts. Trainers must focus on pragmatic aspects, such as how to apply various hydraulic principles. Trainers must also understand service-oriented irrigation project design and management, rather than simple hydraulics. Examples of fundamental concepts that were not generally understood by engineers are:
1. The difference between a "rated canal section" and a "critical flow measurement device" and a "canal section which cannot be rated".
2. The importance of water level control in canals and the impact on maintaining a constant turnout flow.
3. Differences between orifices and weirs, in terms of their proper positioning and usage for water level vs. flow rate control.
4. How to design good open channel flow measurement devices.
5. How main canal operation impacts lateral canal operation, and so on down to the farm level.
6. Project irrigation efficiency and field irrigation efficiency measurement.
Chapter 8 - General Observations Page 16

Page 164 of 276
7. How to break down the control of an irrigation project into manageable layers or units, rather than understanding all of the details of the massive entity.
8. What the "service concept" consists of.
9. How to redesign or modify existing canal structures so that they can provide better water service.
The training needs are not only for engineers. They also exist for managers and operators, and key members of water user organizations. There were two special examples of training efforts which are worth noting:
1. The first was in Mexico. The training needs are so great that some projects, such as Cupatitzio, have not yet been significantly impacted by the program. However, other projects such as Rio Mayo have enjoyed benefits. When the government of Mexico decided to transfer operations from the federal organization to water user associations, it embarked on a detailed education effort which included consultants, water user associations, and university personnel. It is intriguing that university professors were included in the training "needs" category - the result will be a better educated junior cadre of graduating engineers and managers from the universities.
2. The second example of improved training efforts was in Dantiwada, India. The Dantiwada project has benefited from an extensive amount of training from the state WALMI organization. WALMI has instituted some significant changes to the system, as follows:
a. Water levels in the main canal are maintained constant by the local Chowkidars (gate operators). They are trained to achieve results - so they move the gates based on the water levels. The operators seem to keep a tight water level tolerance with minimal gate movements.
b. RWS (Rotational Water Supply) is being used on the system. It is a modified form of the traditional Warabundi systems seen in the north of India. They are not using the traditional Shejpali rotations.
c. Concrete lining of channels has occurred down to the 8 ha chak level. This is tremendously different from the systems with traditional Warabundi.
d. Training has included farmers, ditchtenders, and engineers.
Training is not a one-time event. It must be repeated frequently at multiple levels and with progressively more complex material, without forgetting to return to the basics for new employees. For example, in Lam Pao there may have been good training at one time in the proper usage of CHOs. (Another possibility is that the training was poor). However,
Chapter 8 - General Observations Page 17

Page 165 of 276
it is obvious that either the hardware deteriorated or the training was forgotten (if it was ever given), because the CHOs are not operated properly.
Training can be made more difficult if the trainees do not remain in a project long enough. For example, the implementation of the Majalgaon project has been complex. The new system has required extensive training and commitment by the operators. However, one of the requirements of state Irrigation Departments throughout India is to have the senior personnel rotate after three or four years. This rotation requirement should be relaxed for a modernization project, such as Majalgaon, because the techniques and concepts that have been put into place at Majalgaon were complicated and difficult to implement. Successful water projects in the U.S. and Europe often have senior personnel who have been in the same project for several decades.
Modern canal design concepts must be accompanied by good technical training. Examples of this need are:
1. In Coello, some radial gates are equipped with long crested side weirs, but instead of maintaining a constant water level over the weirs and then varying the turnout opening, the operators vary the main canal water level and keep the turnout opening constant - an action which causes unintended variations in turnout flow rate. The operators are unfamiliar with the proper operation concepts. This practice was also observed in Seyhan on the secondary canals.
2. Even a simple design such as a combination cross regulation structure (long crested weir plus center radial gate) can be designed or installed incorrectly. In the case of Saldaña, some of these combination structures were designed and installed backwards (in 1955), and therefore, the silt cannot be flushed out. As a result, silt accumulates upstream of the structure and the structure loses much of its theoretical effectiveness.
3. A new additional siphon is being constructed (1997) in Saldaña at a cost of about $US 660,000, although the need could be eliminated with a simple improvement in the inlet conditions of the siphon for about $US 30,000.
4. In Cupatitzio, the long crested weir walls (for canal cross regulators) were at the same elevation as the lateral spill weir walls. This is an indication that some simple concepts were missing in design and/or installation. Also in Cupatitzio, about 70% of the distributor modules were dysfunctional - largely because of improper design or installation.
5. The use of side weirs on the Seyhan project was done similar to Coello and Lam Pao. The water levels in the secondary canals were maintained below the top of the weirs. The weirs were being "saved" for emergency flows only. This caused unnecessary flow rate fluctuations from the secondary canal outlets.
Chapter 8 - General Observations Page 18

Page 166 of 276
6. New canal structures are being installed on the Bhakra system. Rather than upgrade the new structures with improved hydraulic designs, the structures are the same as the previous structures. When discussing the need for improved water level control at the local level using better structures, the local managers and engineers were receptive to the ideas. However, the design decisions are made back at the headquarters and the ideas were not well received at the higher levels.
7. Perhaps the most distressing evidence of the need for training and proper information synthesis was seen in the Office du Niger. In that case, a small pilot project was being constructed, and the designers had overlooked or forgotten numerous important design lessons that were evident in other areas of Office du Niger. As a result, it appears that the investment in this new area will fail. In contrast, the Niono area of Office du Niger functions remarkably well at the field level because of specific design features which were unintentionally or inadvertently applied there. The details are discussed in the section on hardware.
Water User Associations and Farmer Cooperation. Water User Associations (WUAs) have received much attention in the last two decades. In many cases, discussions appear to assume that if a WUA is formed, many irrigation project problems will disappear. It was obvious that simple formation is insufficient - the WUA must also survive and flourish in order to be effective. There appear to be several key ingredients found in the strongest WUAs, which must be supported by the legislative, executive, and judicial branches of the government. These ingredients are:
• Financial management. • Autonomy. • Capacity (including both training of technical and managerial skills, and a
functional physical infrastructure) • Reliable water supplies.
Water User Associations, if functional and empowered with authority and water, can be very effective in satisfying farmer concerns. Blame can no longer be assigned to individuals at a distance; the WUA is physically very close to the farms and the staff are accessible. Furthermore, WUA staff are hired by the board of directors, and must be sensitive to the farmer needs. This is contrast to government employees (especially upper management) who may have rapid turnover and do not tend to appreciate the needs of farmers.
This research project found five general types of WUAs:
1. Functional organizations in Latin American countries (such as Mexico, Dominican Republic, and Colombia) and the Seyhan project in Turkey. The active WUAs collect fees, hire professional staff, and operate the water distribution system within their areas. One of the first things the new WUAs in Mexico did when organized this past decade, was fire the majority of former government employees in an effort to reduce
Chapter 8 - General Observations Page 19

Page 167 of 276
unnecessary overhead. In general, these WUAs have elected boards which are empowered to make and implement significant economic and policy decisions. They are also approaching self-sufficiency in terms of O&M costs.
It should be noted that all of the WUAs in the Latin American projects were not superb. Cupatitzio is an example of one WUA which appears to have problems, and some of the small WUAs in Rio Mayo had difficulties. There were also squabbling problems in Saldaña, where about half of the board members were small farmers and half were large farmers. In Saldaña the large farmers tended to make more businesslike decisions.
Rio Mayo provides proof that it is possible to form strong WUAs and have them effectively collect fees and provide operation within a 10-year period.
2. The Comites Paritaires of Office du Niger in Mali. This was unique among the projects. There was no expectation by the project officials that the farmers could effectively manage a WUA of the Latin American type. The Comites Paritaires were given a 50% voting right in how O&M funds (collected from the water users) were to be spent. However, they did not participate in the operation or management of the system. This may be a good intermediate or even final step for WUA organizations where there are many small farmers with little skills in organization or budgets.
3. Small, generally non-functional WUAs. These were found in Morocco (in a project next to Beni Amir), Lam Pao, Majalgaon, Bhakra, and Dantiwada. It appears that these WUAs might be classified as "sociological WUAs" as opposed to "business WUAs" as found in Latin America, the U.S., Australia, and Canada. These small sociological WUAs are asked to (a) clean the canals, (b) cooperate on water delivery, and (c) collect fees which to be transferred to the government. These WUAs tend to have many responsibilities but very little power, cannot influence the quality of water delivery service which they receive, and have little or no enforcement capabilities. It is not surprising that they are generally non-functional for there is little apparent incentive for individual farmers to step forward and take the leadership roles in such organizations.
Perhaps one benefit of these WUAs is that at least they can provide a unified voice for requests and complaints to the project authorities. In that sense, they potentially provide more political clout than individual farmers do.
4. In Malaysia, the farmers are joining together to create "mini-estates". The problem is that sons and daughters are leaving the farms for work in the cities and hired labor is very expensive (also in Lam Pao and Guilan). This process has already occurred in Malaysia. The creation of "mini-estates" are in the early stages of formation. The differences are readily seen in field observations. Mini-estates are operated as a unit with 20-40 hectares being farmed uniformly. Those blocks not being irrigated by mini-estates have a traditional appearance with the fields at various stages of development.
Chapter 8 - General Observations Page 20

Page 168 of 276
The mini-estates allow the growers within a block to coordinate the planting, transplanting, harvesting, etc. This reduces the conflicting water demands (there is no incentive for the upslope farmers to steal the irrigation water since they are all part of the same economic unit), and has greatly impacted yields within the project. Some farmers reported yield increases from 3 T/ha to 5 T/ha, that were simply attributed to the creation of the mini-estate.
5. Umbrella associations which distribute water to smaller water user associations. Rio Mayo has this structure, in which an umbrella association has a board consisting of people from each of the member associations. The umbrella association is responsible for operation and maintenance between the dam which is federally owned and operated, and the individual water user associations.
There are some definite regional differences in the situation of projects before WUAs are formed. In Mexico, the water distribution was already fairly equitable before the WUAs were formed. The issue was maintenance and operation (O&M). Evidently, Turkey has had a similar history. In both cases the governments recognized that they were unable to meet the O&M obligations, so they facilitated the development of business-type WUAs which could take over the operation of large areas. In Mexico and Turkey, the transfer of management to WUAs has been accompanied by very intensive planning and training.
The Asian projects appear to be quite different. In those projects, equity can be a major issue, as well as the O&M. The equity problems are clearly not only management issues (see the discussions about hardware, density of turnouts, etc.), and therefore, they will not disappear if a WUA is formed.
There is also a question for which the authors of this report do not have an answer:
Is it possible to have effective and sustainable business-type WUAs?
This would require a board elected through reasonably democratic procedures. Is it possible if there is no effective means of rapid legal enforcement of democratic rule violations? The authors of this report can, however, point out factors such as turnout density which are clearly important issues, regardless of the country and culture.
Even for the business-type WUAs, there is a question of where the central government's responsibility should begin and end. In general, the central governments provided assistance for O&M, often in the form of large equipment. The central governments also tended to retain control over the dams, and kept ownership of the water. In many cases the government also retains ownership of the structures within the project. The structure ownership can create problems because often the structures need quick and simple modifications to function better but the government requires long and complicated approval processes for any modifications. Farmers do not always want to improve infrastructure that is owned by the government.
Chapter 8 - General Observations Page 21

Page 169 of 276
A significant design/hardware issue (already mentioned above) which is related to the sustainability of WUAs is the density of turnouts which can receive individual and flexible deliveries. It is clear that large numbers of farmers cannot be expected to voluntarily cooperate in water distribution on most projects. It may work on old village-level irrigation schemes, but not in other irrigation projects. The business-type WUAs have democratic voting procedures, but when it comes to the delivery of the water, these successful WUAs depend on paid staff. The staff may not even be allowed to have relatives or land in their areas of responsibility. In the Rio Yaqui Alto WUA, a volunteer is supposed to coordinate water deliveries within his small zone of farmers, but in reality these volunteers only perform well for about the first half of their term and then they lose motivation, and the professional staff needs to take responsibility.
Office du Niger is a project offering a high degree of flexibility to small ownership units, even though there are no effective WUAs involved, and the government employees do not distribute water to individual fields. The large reservoir-type lateral canals provide sufficient storage so farmers do not really need to coordinate their activities; the water is essentially available on demand and requires no precise actions by either the farmers or the government employees.
In Majalgaon, canalettes (half-pipe sections) were used to line the watercourses down to the field level, and the farmers liked this feature. The farmers were able to see the water and exactly where it was going, and there were apparently few disputes about water theft by upstream users. Again, the design of the system and the high density of turnouts reduces the difficulty of personal interactions.
In Beni Amir, farmers must cooperate, but the cooperation consists of not taking water out of turn. The schedule of water deliveries is updated weekly based on water orders (from 2 weeks prior). The project authorities have developed a complex procedure for providing the farmers with very simple information about when they will receive water. Everyone knows when they and their neighbors will receive water, and the project delivers water fairly reliably. The ordering schedule and reliable water supplies provide equity and certainty in the water supply at most times.
Kemubu and Muda projects have extensive field-to-field irrigation. However, this is not a problem if the farming unit (not the field) is large. It is the size of the management unit which is important when examining turnout density, not the size of the fields.
Effective law enforcement is essential to back up water user association regulations. In the Rio Yaqui Alto case, the local police force is ineffective, but the Junta is able to call upon federal army troops to make arrests and to jail people. In Cupatitzio, there is a special "water police" hired by the overall irrigation project authority. Law enforcement is less of an issue if the farmers believe that inequities or errors will be corrected immediately. In Coello, for example, the WUA employees have reasonable communications and excellent mobility, and farmers can reach them easily. Furthermore,
Chapter 8 - General Observations Page 22

Page 170 of 276
the WUA employees have the power to make decisions and take corrective actions. If the farmers are not satisfied with those actions which are taken within a few hours, they feel free to go to the main WUA office and complain to the manager, who is obligated to respond. This quick and effective action discourages water theft and vandalism, and also reduces antagonistic feelings that could develop among frustrated farmers. In Guilan, the authority is the local "mirab" who acts as a village wise man to settle disputes. The system has been in place for centuries and is quite effective in enforce water the WUAs activities.
Farmer Expectations and Field Irrigation Performance In most of the projects, the expectations of the farmers appeared to be reasonably well met. However, Lam Pao, Dez and Bhakra were notable cases in which farmers appeared to have a moderate to high level of dissatisfaction with the service received. As noted below, once farmer expectations are met, we must ask (i) if those expectations coincide with what is needed to move irrigation into the 21st century, and (ii) if not, what additional changes are needed.
Many irrigation projects have domestic or internationally funded programs to improve field (on-farm) irrigation performance. Improvement programs have existed in highly developed irrigation areas such as California, and also in less developed areas like those examined in this study. Many of these programs have failed, while others have achieved success. Some observations are as follows:
1. There is absolutely no point in discussing irrigation scheduling, soil moisture measurement devices, and water measurement with farmers who receive water on a rotation basis (such as the rigid warabundi schedule), or if the farmer does not have the ability to modify the duration of the water delivery. The reason is simple - the farmer has no control over the topics being discussed. In other words, unless the field water is available on a "demand" or true "arranged" schedule, these principles do not apply. Seyhan, Office du Niger, Rio Yaqui Alto, Cupatitzio, and Rio Mayo provided water to the field levels (intentionally or by default) on this flexible basis.
2. Point number 1 indicates that if we are to achieve high performance field irrigation, the water delivery service must be improved - even if the farmers cannot articulate how it should be improved.
3. If we want to move from very inefficient irrigation to rather inefficient irrigation, we should only look at what the farmer understands today, and the on-farm irrigation practices of today. However, if we hope to improve irrigation projects with an eye to the future, we need to look beyond what the farmers understand today. Their understandings are limited to what they have experienced to date. They are typically unaware of many options which will be unavailable in the future.
4. During the project visits, a sense was developed of what farmers want today, despite the authors’ realization that this is insufficient for meeting future needs.
Chapter 8 - General Observations Page 23

Page 171 of 276
a. Farmers understand the need for good land leveling. This is typically the first answer given by a farmer in terms of important things - assuming that they are already receiving water in a "reasonable" manner and also assuming that they are aware of good land grading practices. What the farmers, project authorities, and consultants are typically unaware of, is the option to use properly designed (and the stress in on properly designed, which is apparently rarely the case) sprinklers on land which is difficult, impossible, or tremendously expensive to land level.
b. These farmers typically have very simple and crude field irrigation systems at the present time (the authors emphasize the need to upgrade these system in the future). Therefore, their expectations are simple. The largest water delivery service concern of farmers appears to be that they receive water soon after they ask for it. In other words, dependability and flexibility, in terms of frequency (timing), are key factors. Farmers are less aware of the importance of an optimum flow rate or duration, although they are aware that extremes or fluctuations cause them problems. As an example, the typical rating scale of flexibility that ITRC uses in California would be completely inappropriate for these projects, as all of the scores would be so low as to be meaningless. The internal indicators used in this study accounted for the fact that the typical deliveries in these 16 projects are not nearly as sophisticated as those found in systems which service advanced farm (field) irrigation systems in California and Israel.
c. In no project were farmers truly billed for the volume of water used, so they are largely unaware of the importance of flow and volume measurements. “Volumetric billing” was a misnomer in the projects that used the term; billing was not based on individually measured volumes of water which were delivered to each field.
d. Farmers and project personnel do not typically understand concepts of irrigation efficiency, nor do they understand that if efficiencies are improved, their net water availability will be improved. Rather, they believe the answer to "shortages" is to receive more water - without understanding field irrigation concepts of timing, over-irrigation and distribution uniformity.
e. Farmers seem to understand the general concepts of drainage problems and salinity, even if they do not understand the technical details of the causes and solutions.
While many aid programs have concentrated on procedures which will ensure high on-farm irrigation efficiency, when farmers have primitive on-farm irrigation systems, it has been pointed out that they do not easily understand the importance of on-farm irrigation efficiency. Their judgement of the irrigation system performance, and their lack of
Chapter 8 - General Observations Page 24

Page 172 of 276
vandalism, seems more related to receiving enough water when they want or expect it. Reliability is a key issue at this point. They do not understand that if they improve on-farm irrigation efficiency, they will have more water available. It's just not in their experience, and with the current level of water delivery service to the fields. Improvement of on-farm irrigation efficiency is largely outside of their control.
Perhaps there is an evolutionary process in these projects which will match what has happened in California and other more advanced irrigated areas. First, relatively crude irrigation systems were installed and the emphasis was on simply acquiring water and spreading it throughout a region as "irrigation". Then laws were developed to facilitate water rights security and the development of water user associations. At the same time, reservoirs and conveyance systems were improved to provide a more reliable annual supply. At this point, the emphasis was still on acquiring and holding onto water.
As the awareness of good on-farm management grew, the water suppliers made some simple changes in reservoir management. To provide more flexibility, canal operators compensated for some canal design deficiencies by having plenty of water available and spilling water that was not used. Eventually, a broader understanding of improved water management and water balances was gained. In the last few decades, external forces began to apply pressure on project authorities to improve performances. Farmers became more sophisticated and intensified their search for ways to economize and improve yields. At this stage, a gradual (not sudden and complete) modernization process resulted in incremental improvements in water delivery service to farms. A parallel process of fine-tuning on-farm irrigation techniques also began as the required level of water delivery service became available. The most rapid advances in on-farm irrigation technology have occurred in irrigation projects which allow a great amount of flexibility in terms of frequency, rate, and duration and in areas where farmers could obtain excellent water flexibility with their own private wells (often to supplement surface supplies). There are almost no modern on-farm irrigation technologies in areas that only have rotation schedules (without groundwater) or unreliable surface irrigation supplies.
Several factors can combine to make water control, flexibility, and flow rate measurement very important to farmers:
1. If farmers are given a certain volume of water per year as an allocation, they want a system which provides sufficient flexibility so they can use the water only when they need it. This has two flexibility aspects to it:
a. The timing throughout the year must be flexible so that they can match crop water requirements and other agronomic practices.
b. The timing on an hourly and daily basis must be very flexible so that they can use just the amount of water they need on every irrigation and have an irrigation supply that is manageable for a high efficiency. For example, a manageable supply is one that provides constant flow rate once adjusted,
Chapter 8 - General Observations Page 25

Page 173 of 276
adjustable flow rate, the correct flow rate to match their soils and field size, and ability to receive water when it is needed (frequency) and shut off when they have completed the irrigation (duration) event.
2. If farmers are allocated a specific volume of water per year, they are very interested in flow and volumetric measurement. They do not want to be overcharged, and they also want to receive every drop of water to which they are entitled.
3. Volumetric allocations are typically accompanied by volumetric water charges. Again, flow measurement, flexibility, and reliability are key items if farmers are to be convinced that the charges are fair.
4. For the case of volumetric allocations and billing (true volumetric allocation and billing was not seen in any of the projects visited) with an arranged irrigation schedule (seen in several of the projects), reliability and equity cannot even be issues of concern - if water does not arrive with an extremely high reliability and equity, such a program will not work well.
Hardware Practices "Hardware" can encompass many things. On one hand, it may include the capability of the irrigation project to provide timely repair to hardware in the field. On the other hand, "hardware" may cover the capability to provide good maintenance to the canals and structures. In Mexico's conversion process which included the transfer of irrigation project operation and maintenance to irrigation districts, a first emphasis of the government was to provide the new irrigation districts with good and suitable maintenance equipment as well as good physical access (roads) to the canals and structures. Mexico made a serious commitment to determining what type of maintenance equipment was needed, and found that typical construction equipment was unsuitable for efficient maintenance work.
This research project was limited in scope and did not examine the maintenance procedures in detail. It did examine the suitability of the water control systems, both from operational and design standpoints. This section focuses on the hardware used to control water levels and flows throughout the system as a means of providing the desired level of service to the ultimate user - the farmer.
Gated vs. Ungated Systems. The only ungated system in the group of 16 was Bhakra, which was plagued by a miserable hydraulic performance, a bloated field workforce, poor communications, and unhappy farmers. This system certainly did not produce any positive arguments in favor of ungated systems. However, numerous gated systems performed well, including Dantiwada (also in India).
Various negative comments seen in the literature about the poor controllability of gated systems probably come from observations of systems such as Lam Pao, which was
Chapter 8 - General Observations Page 26

Page 174 of 276
operated incorrectly and did not use suitable hardware features. For example, in Lam Pao a medium cross regulator gate position change requires a person three hours to accomplish manually - an extraordinarily large amount of time. Furthermore, the Lam Pao cross regulators were all underflow (orifice) and did not incorporate any weir action thereby creating relatively large water level changes if the flow rates changed slightly. Terms like "automation" and "gated" may not really mean very much by themselves because so many irrigation projects have “automation” and “gated cross regulators and turnouts” yet they were never designed as a comprehensive system to provide simple, reliable, and flexible water delivery service. One can only arrive at conclusions after examining the specific “gated” design details – and the authors completely agree that most “gated” designs have been inappropriately designed. In other words, the words “automation” and “gated systems” are not synonymous with “modernization”.
Cheap Imitations. Even simple automation techniques or hardware such as the Begemann hydraulic gate must be extremely well designed, installed and adjusted (if required) in order to work properly. In the case of Rio Yaqui Alto, almost none of the Begemann gates were functioning properly. It appears that the gates were not properly designed and field ballasted. Perhaps they were never properly tested in a laboratory before being used in this project. Similarly, it seems that copies of simple hydraulic gates of the Neytrec type (Amil, Avis, etc.) have typically failed. This was seen in Cupatitzio and Office du Niger.
Proper Turnout Designs. Turnouts (offtakes) control the flow of water from a supply canal. Large turnouts are used to supply submain and lateral canals, and smaller turnouts are used for fields or group supplies. Turnout hardware has 4 possible functions:
• Flow rate measurement • On/off capability • Flow rate adjustment • Ability to maintain a fairly constant flow rate even though upstream or
downstream water levels may change with time.
The conclusions from this research study are that regardless of the turnout design, improper training (and subsequent improper design and installation and operation) can give poor results. One of the challenges for a designer is to choose a turnout design which is robust enough to perform satisfactorily even if various errors are made.
All of the gated project turnouts (except Bhakra and the main canal turnouts at Muda) used a form of underflow (orifice) design for flow rate control. This is a positive sign; orifice designs inherently maintain more constant flow rates than overflow (weir) designs.
There were 4 basic turnout designs seen in the projects. They are described below.
a. Simple gates which could be jacked or screwed into position (metergates). These gates are typical of those used in the U.S. irrigation districts. They can provide functions (b, c, and d) well. They are very insensitive to errors in the
Chapter 8 - General Observations Page 27

Page 175 of 276
elevation of their placement, or to errors in the elevation of spills on canal cross regulators. Their ability to provide accurate flow rate measurement (function a) depends on their design. In most cases, the flow rate measurement with these devices was poor. Project authorities have the following options for building good flow measurement into these designs:
i. Install these gates in a concrete turnout structure with standardized dimensions and inlet conditions. Develop standard calibration curves/tables which provide the flow rate as a function of the gate opening, in addition to the upstream and downstream water levels. This is a very popular feature in many U.S. irrigation districts, but its use was not seen other than one case in Rio Mayo. The primary difficulty with this type of flow measurement is if the downstream condition varies with time between submerged and unsubmerged. Different calibration tables and curves must be developed for those two conditions, and sometimes operators have a difficult time knowing which condition is applicable at any one moment.
ii. Install a Replogle flume downstream of the gates. This type of flume is very simple to construct, and very accurate even at high degrees of submergence. One advantage of using flumes is that because it is a critical flow device. The flow rate stabilizes almost immediately after the turnout is adjusted - as opposed to requiring time for the downstream canal water level to stabilize. Disadvantages include the possibility of poor maintenance, the lack of sufficient head in some sites, and the lack of enough room to install the device.
b. CHO gate (Constant Head Orifice) gates. These are a variation of the metergate. However, they are rarely used properly - mainly because their simple operation is rarely explained properly. In Lam Pao, for example, the main canal had many CHO turnouts which were in disrepair and the operators did not know how to correctly operate those which were in good condition. These gates should really be operated exactly as a simple "metergate" which was described previously. The only difference is that the CHO installation has a second gate downstream of the "metergate". The sole purpose of the second gate is to keep the downstream side of the "metergate" submerged. That is, if the "metergate" is operating in an unsubmerged condition, the second gate is slowly closed until the "metergate" is submerged. The advantage of this type of 2-gate design is that only one calibration chart (rather than 2) is needed. In short, these are hydraulically sound gates if there is good initial, consistent, and simple training…….and if the supply canal water levels do not fluctuate wildly. If the supply canal water levels have very severe water level fluctuations, the CHO may switch from submerged to unsubmerged with time. For some reason, that training has been neglected or the trainers do not understand how to operate the gates in a simple fashion. This is not surprising, as most descriptions of CHO operation are needlessly complex.
Chapter 8 - General Observations Page 28

Page 176 of 276
c. "Semi-modules". This is a fancy name used in Office du Niger for a simple vertical plate. People raise it or close it to let water into a turnout. If it were used to modulate the flow, it would function as an orifice. In general, the bottom sill of these semi-modules is above the downstream water surface so when the plate is completely up, the device functions as a weir, but is not really functional for flow measurement. It is a very poor control device when compared to available options.
d. Baffle distributor modules. The authors were surprised by their consistent observations with this device. The potential advantages of baffle distributor modules are well advertised and include:
i. The flow rate is easily known by observing how many modules are open.
ii. They are somewhat pressure compensating - that is, their flow rate changes are less sensitive than orifices or weirs to a change in upstream water level.
iii. They are very easy to understand. One opens the desired combination of modules to obtain the flow desired.
iv. They take no special training to operate correctly. Uneducated operators can operate them easily. A particular module is either fully open or fully closed.
What the authors saw was considerably poorer performance than one would expect when reading the 4 advantages listed above. Baffle distributor modules were used in Cupatitzio, Beni Amir, Guilan, Kemubu, parts of Office du Niger, and in a few places in Rio Mayo. In not one of these projects were the baffle distributor modules working as advertised, although they were working reasonably well in Office du Niger and Kemubu. In Cupatitzio it was estimated that 70% of the units were working improperly - a staggering problem for a new project.
First, it must be understood that baffle distributor modules are not intended for modern on-farm irrigation methods. Modern on-farm irrigation methods often have varying flow rate requirements; that is, the required flow rate onto a field will vary by the hour as the number of sprinklers operating varies, or as a drip filter backflushes. Even if the flow rate requirement is constant, that requirement rarely match the incremental flow rates offered by various combinations of baffle distributor modules. Traditional surface irrigation methods can function well with incremental flows such as 20 l/s or 10 l/s. A sprinkler system may require a flow of 5.6 l/s, for example, which is not one of the available flow rates. As a result, when modern on-farm irrigation methods are used the baffle distributor modules are operated with one baffle partially throttled (closed) to obtain the desired flow rate. If an operator is capable of doing that successfully (as seen in Cupatitzio, Rio Mayo,
Chapter 8 - General Observations Page 29

Page 177 of 276
Office du Niger, and Guilan), the operator is certainly able to operate a "metergate" successfully, and "metergates" are less expensive and easier to install.
Second, the authors do not believe that operators are incapable of operating metergates correctly. That is, the assumption that the operators are incapable of reading tables and making simple measurements is incorrect. Operators with minimal education, but with simple training and initiative were seen operating moveable gates quite well in many projects. An extreme example is the low-level operators of canal gates in Office du Niger who were successfully providing manual downstream control. In Lam Pao, the operators of the submains often had B.Sc. degrees. They simply lacked proper instructions.
The use of baffle distributor modules requires very good installation and the proper physical circumstances. If a whole series of conditions are not met, these units do not perform properly. One can blame the designer or the installer for failures, but in the end, a sensitive device is more difficult to work with successfully than a hydraulically robust device. There were repeated problems observed with placing the baffle distributor modules at improper elevations (in relation to the cross regulators) and with backwater effects, due to insufficient drops across them. There was also incorrect positioning of the devices on the canal banks or within the concrete walls (insufficient set-back) - as a result there was swirling water rather than a straight streamlined entrance approach and/or some of the entrance area was blocked off by concrete. Surface systems in many projects have large amounts of trash in the water, which plugs many of the smaller modules.
All of these problems have nothing to do with the quality of construction or materials of the devices themselves, which brought additional problems to this project. It was noted, for example, that the locally manufactured distributor modules in Cupatitzio did not have uniform dimensions. The units were simply poor copies.
In Beni Amir, a study was made regarding the accuracy of the baffle distributors. The results must be interpreted with the understanding that many of the units had corrosion problems due to improper maintenance and replacement. Nevertheless, reports from the project and project consultants repeatedly state that the flow measurement is within 510%. The results of a study of 53 baffle distributor modules (Chemonics 1994) gave the following results:
Study of 53 baffle distributor modules (Chemonics 1994)
Average ratio of (actual/rated) flow: 1.18 Std. deviation of the ratio: .37 Coefficient of variation: .32 Maximum ratio: 2.98 Minimum ratio: .49
Chapter 8 - General Observations Page 30

Page 178 of 276
The reason for such a detailed discussion of the baffle distributor modules is that many designers apparently believe that the potential benefits are equivalent to the actual benefits. This is the same problem that has occurred with drip/micro irrigation; salesmen typically talk about potential performance and do not acknowledge actual lower performances that exist if the design and maintenance and operation are not correct. As with any other device, there are benefits and detriments associated with the selection of these baffle distributor modules. These units are particularly sensitive to proper downstream conditions and proper installation.
Turnout Density. Figure 4-25 and Table 4-1 show the number of farmers who must cooperate on final distribution. Values range from a low of 1.5 (Coello and Saldaña), to a high of 50 (Bhakra). Office du Niger provides individual adjustable turnouts to each field, but the farmers must cooperate slightly in the operation of the large watercourse. It has been mentioned that voluntary cooperation is very difficult to achieve when there are more than a few farmers involved or if the cooperation is complex.
When farmers expand their areas of dry footed crops (i.e., non-rice crops) in traditional rice systems, the turnout density is often inadequate (as seen in Guilan, Lam Pao, Muda, Kemubu, and Dez).
In Cupatitzio, the very high density of turnouts (approximately 1 turnout for every 4 fields) made the field deliveries relatively simple. This high density was the key factor that avoided very poor service to the fields, even though the rest of the operation was very poor.
In Beni Amir, discipline is excellent among farmers even though there is insufficient water and people have low (but not destitute) incomes. There is an effective administrative procedure to enforce violations with punishment, and there is a sense of equity by the farmers. Although farmers must cooperate, there are sufficient turnouts to facilitate this cooperation, and schedules are closely followed.
Pipelines. Pipelines were not used to any significant extent in any of the 16 projects (only a small portion of the Seyhan project). However, there is considerable potential for pipelines in many projects, especially as a means of efficiently providing a high density of turnouts. This will be especially important if more flexible irrigation service is provided. Currently many small earth-lined channels may not have huge conveyance losses if they are only wet occasionally. If water is available with more flexibility, the percentage of wetted time will increase unless those channels are lined or replaced with pipes. In Morocco, for example, pipelines could greatly improve the performance in the quaternary canals, and also reduce the maintenance costs. If pipelines are used, they must be supplied for flexibility and not simply for conveyance, or much of the potential for future modernization will be lost.
Buffer (Regulating) Reservoirs. Only a few projects had buffer reservoirs within their canal distribution systems. Buffer reservoirs have been used extensively in more
Chapter 8 - General Observations Page 31

Page 179 of 276
developed and modern projects because of their distinct operational and efficiency advantages.
In Dez, large farms adapted to the adverse water delivery conditions by constructing on-farm reservoirs. One of the farms had set up 18 large reservoirs for the operation on a 12,000 ha operation. The "turnout" was actually a 33 cms Parshall flume. These reservoirs were being used for 3 purposes:
• As a buffer for the flow rate fluctuations • As a storage for night time flows • To provide additional flow rate for daytime delivery
In Guilan, regulating reservoirs are also used within the system. Lam Pao had a regulating reservoir, but it did not appear to be actually used for operation.
In Seyhan, there is also a major problem with daytime-only irrigation. Buffer reservoirs could be easily installed in this project because it appeared that land was available and there was also enough land slope that a gravity in/out control system to reservoirs might be possible (thereby eliminating the need for pumps). Similarly, Beni Amir has the potential to use regulating reservoirs (with the necessary interlinking and monitoring system) to provide simple and effective improvements in flexibility.
Long Crested Weirs. Long crested weirs were used to enhance upstream control in the main or submain canals in Guilan, Majalgaon, Dantiwada, Kemubu, Beni Amir, Cupatitzio, Coello, and Saldaña. Unfortunately, operators did not always understand that they function best with a significant flow rate over them (as opposed to running the water through the often-accompanying radial gate). Also, although they were found in parts of the systems, they were rarely used throughout the systems. In some systems, such as Cupatitzio, the weir walls were installed too high to be used effectively. Many of the personnel from other projects were interested in the use of these devices. In some of the systems, some rather simple structural modifications can provide at least some weir action in the cross regulators. More extensive modifications would not be difficult in any of the projects. In Dantiwada and Rio Mayo, a few demonstrations of long crested weirs have proven to be very popular. Farmers and operators unanimously agreed that these structures were much better than the traditional approach of no cross regulators, or the undershot regulators found in Majalgaon, Dantiwada, and Kemubu.
The best long crested weir design was one in which a center radial or sluice gate was installed to sluice out the silt, thereby avoiding siltation behind the long crested weirs. Weir walls were provided on both sides of this center gate. In these installations, the center gate is properly operated by maintaining a desired water level of 20 cm or so above the weir crests. This combination design allows for easy adjustment of the water level about once per day for a very flexible operation via the center gate with the weir walls controlling the water levels reasonably well throughout the day.
Chapter 8 - General Observations Page 32

Page 180 of 276
Canal Cross Section Designs Some key observations were made during the project visits. These include:
1. In order to obtain the earth necessary to build up canal banks, it should be obtained from within the canal rather than from outside the canal. The results of this are (i) wider canals (more storage), (ii) better road access, and (iii) no swamps for mosquitoes and bilharzia next to the canals.
2. Most canals are designed for conveyance capacity (with rules such as 1/2 or 1 or 2 or 3 or 4 LPS/ha). This type of design criteria is generally incompatible with the concepts of flexible water delivery service, in which flows will constantly change. Once canals are designed for flexible operation as opposed to conveyance, the canal cross sections will increased in size.
3. There are, of course, arguments in favor of using more narrow canals. Some examples are:
a. Wide canals occupy more land area, and therefore, waste cropland. The responses are: (i) If overall yields can be increased, then a little more land out of production is not a net loss (ii) Often the spoil pits (due to improper excavation) give equal or greater land loss.
b. Wide canals have more water loss. A proper response must examine each of the possible losses which can occur. There are only 3 types of water loss: (i) spillage (ii) evaporation (iii) seepage. Each is addressed below.
i) Spillage can be eliminated or reduced to perhaps 1-2 % on a moderately-managed downstream control system. This is considerably less than what will occur on a narrow upstream controlled system that does not experience water shortages for the tail end farmers.
ii) Evaporation will be greater if there is a greater water surface area exposed to the air. However, the magnitude of evaporation should be put into context. If 5% of the total wetted land area is canal water surfaces, then perhaps 8% of the evaporation which occurs within the area will be from canal water surface. Canal water surfaces have about the same evaporation rate as rice fields, but the canals will be filled with water longer than the rice fields receive water. Therefore, the 5% area is weighted as being equivalent to perhaps 8% of the evaporation. In any case, perhaps the evaporation on a wide canal may increase by 3-4% over the evaporation on a narrow canal (which is built without wetted side spoil areas). This very small increase in evaporation must then be weighed against the benefits of easy farmer operation, better water controllability, less spills, etc. The selection of a wider canal is obvious regardless of the potential for larger evaporation, if in fact larger evaporation even occurs.
Chapter 8 - General Observations Page 33

Page 181 of 276
iii) Seepage is determined by the area covered with water, the depth of water over that area, and the transmissivity (or hydraulic conductivity) of the soil. Typically, the bottoms of canals on all but very sandy soils have low seepage rates because sediment tends to seal the bottoms of canals. A wide canal has about the same amount of side area as a narrow canal - the area through which most seepage often occurs. Accurate seepage studies can be conducted if there are serious questions about this, but this is often an academic issue, especially if the spoil pit land adjacent to the canals is un-compacted, but full of water.
c. Wide canals have more siltation. This is true, but only when compared to canals which are operated on a very inflexible, rotation schedule. Once canals are managed for variable flows, siltation will generally occur in most canals anyway and there must be suitable procedures for concentrating the siltation in convenient locations, as well as for removing that silt.
4. Office du Niger (ODN) has some very special conditions in which very wide canals were the "saving grace" of the modernized areas, especially in the most downstream submains and watercourses which supplied the farmers' field. Three reasons for this are:
a. The soils in Office du Niger are very unstable. If standard steeply sloped canal banks were used, they would slough off and partially fill a narrow canal cross section.
b. Weed growth is very active and Office du Niger cannot afford to have very frequent weed maintenance of the canals. In those canals which had been designed for "proper hydraulic sections", the water did not even reach the ends of the canals because of weed growth. In the very wide sections, the velocities were so low that there was only minor friction in the canals.
d. The very wide canal sections provided tremendous buffer capacity, which was essential for the simple operation of the canals. One farmer could take out water for a field yet no adjustment was necessary at the head of the canal for several hours because of the quantity of water in storage. This gave the farmers plenty of time to react to any changes.
The Gezira project in Sudan (800,000 ha) has the same feature of large canals without automatic control as ODN. Those large canals are very simple to operate; a design with smaller cross sections would almost certainly fail with the available expertise in operation and maintenance.
Cattle Access
Chapter 8 - General Observations Page 34

Page 182 of 276
Extensive cattle damage to the canal banks was evident in Bhakra. "Ghatts" were required near every village. Ghatts are concrete structures that allow for the cattle to get in and out of the canals without damaging the canal banks. In areas where the ghatt had been damaged, the canal damage and erosion was extensive. Rio Yaqui Alto provided special cattle access points periodically along its canals.
Mobility and Communications Previous sections of this report have stressed the importance of good communications and mobility of operators. In some projects such as Lam Pao, Office du Niger, and Majalgaon, good all-weather roads did not exist until the irrigation project installed them. The road density is not important for efficient operation of the canals, but the roads also affect the ability of farmers to transport their supplies and harvests to and from markets. It appeared clear that the investment in roads is expensive, but necessary for irrigation projects if they are to provide flexible water deliveries.
In some projects, portable radio communication systems were used very effectively. The operators and farmers in Coello both noted that problems and conflicts have been minimized ever since better communications have been used. Now, if there is an unauthorized use of water, a canal break, or other problem in Coello, that problem is solved within a few hours rather than having drawn-out discussions and an eventual settlement of the problem. The existence of the road network along all the canals, in addition to good vehicles (motorcycles for the canal operators; pickups for their foremen) and radios for the foremen, all contribute to rapid observation and solution of problems in Coello. The canal operators had radios for awhile, but they were of poor quality; they have ordered new portable radios.
In Coello, Rio Mayo, Saldaña, and other projects, the foremen are very effective because they can quickly travel throughout their zone and check up on problems. They have good locks on the turnouts and an effective procedure for dealing with problems.
The Dantiwada project staff utilize an ancient telephone system that is being upgraded to a radio-based system. However, the modernization and improved operation of the main canal have demonstrated that well trained individuals who can and do communicate are able effectively monitor and operate the canal system. Gate operators are now told to maintain water levels and communicate with the upstream and downstream cross regulators.
The Dez project staff uses a system of three people for the ditchtender operation, which is very inefficient compared to many of the other projects. One man was the ditchtender and was responsible for the opening and closing of the gates. A second man was the driver. He would also help with opening structures and cleaning debris in front of gates. The third man was the "key" man. He was responsible for all of the locks in the sub-area and had numerous keys. The three were provided with a jeep for canal patrol.
Chapter 8 - General Observations Page 35

Page 183 of 276
Different projects approached the issue of canal operator vehicles differently. While some projects supplied the vehicles and fuel, others paid the operators a fixed monthly amount with which the operators were supposed to pay all expenses. The logic of paying the operators to own their vehicles was that better care would be taken of the vehicles. The negative side of that logic is that the operators are reluctant to travel very much with their own vehicles - thereby restricting their mobility.
Chapter 8 - General Observations Page 36

Page 184 of 276
Chapter 9 - Review of the Original Project Hypotheses
The proposal for this research project presented 11 hypotheses. The findings related to each hypothesis are summarized here.
Hypothesis 1. Reliable service at field turnouts will only be found if levels of service are clearly defined and understood by operators and management at all layers within the system.
This statement was not always true. The most obvious examples of contradiction can be found in Seyhan, Cupatitzio, Saldaña, Coello, Rio Yaqui Alto, and Office du Niger. Certain physical, design, and management factors allowed reasonably good service (for present day crude field irrigation standards) at the field turnouts. The major factor was an abundant water supply. Because water was almost always available in the submain canals, it was relatively easy to provide water when it was needed. The second factor was the relatively high density of turnouts at the field level. The operators of the main canal in Rio Yaqui Alto, clearly did not understand the concept of service, whereas the "tecnicos" who distributed water to farm turnouts had a clear sense of service. In the Office du Niger, the long conveyance canal was operated with questionable control logic and fairly constant flow rates, but the extremely wide canals which serviced the field turnouts provided tremendous flexibility at the field level. Cupatitzio, Saldaña, and Coello had low project efficiencies because of high spillage in canals and poor on-farm efficiency, but the farmers were relatively content.
This hypothesis is true if the project is to supply a high degree of flexibility at the field turnouts, plus operate at a high project irrigation efficiency. Rio Mayo came closest to this type of mentality, where operators at all levels were working together to provide a good level of service even though they had serious hardware limitations.
Hypothesis 2. Certain institutional frameworks are always present in projects that provide a high level of water delivery service to individual fields.
This hypothesis is true. At the very least, a program of reasonable maintenance must be in place or else the tailenders will not receive water. Furthermore, turnouts must be in relatively decent condition or else there will be no ability to allocate water supplies, even somewhat equitably.
A key word in this hypothesis is "high" level of water delivery service. As with Hypothesis 1, it can be noted that with conditions of limited water supplies, the institutional frameworks must be stronger than if there is a very abundant water supply. Those institutional frameworks are quite complex, and must provide pragmatic training and instruction, excellent designs, proper installation of equipment, and reasonable maintenance. The institutional frameworks must also provide an operation strategy which is efficient and service-oriented. Finally, certain social and political frameworks must be in place to collect the funds necessary to pay for these services and resolve conflicts.
Chapter 9 - Review of the Original Project Hypotheses Page 1

Page 185 of 276
Hypothesis 3. Inappropriate hardware or inappropriate instructions for using appropriate hardware will be found in the majority of the projects.
This hypothesis was definitely true in every project visited. The only difference was in the extent to which inappropriate hardware and instructions were found. An example is the use of weirs on canal cross regulators. Most projects did not utilize this simple design concept for the maintenance of water levels in the canals. Those projects that did have the weirs in place did not allow the water level to be maintained above the weir. Another example is the use of CHOs. A majority of the projects used these structures which can be effectively utilized given the correct mix of appropriate hardware on the canal. However, it was nearly impossible to find operators who knew how to correctly operate the gate.
Hypothesis 4. Inappropriate hardware will be accompanied by chaos (inability to provide the prescribed level of service) unless there are extremely strong institutional frameworks.
This hypothesis was not written very well. In most cases, the actual level of service at the field, point of differentiation, and main/submain connections were fairly close to the stated level of service - indicating that what was promised was often realistic, even if less than desirable. The hypothesis should have addressed the inability to provide a high level of service, rather than the "prescribed level of service", because a good manager will adjust the promised level of service depending on the hardware limitations in the project.
There were serious discrepancies in Lam Pao, Dez, Bhakra, Beni Amir, and Rio Yaqui Alto - all of which had major hardware problems. Beni Amir has a strong institutional framework which prevented more serious problems from developing. But the most pertinent factor for this hypothesis is that the managers of these projects were simply not as aware of the field conditions as they should have been.
Hypothesis 5. Failure to provide a promised and clearly defined level of service to farmer fields will be associated with problems as water stealing, destruction of structures, lack of farmer discipline, and failure to pay for water.
This hypothesis is true and might be better restated to revolve around the issue of uncertainty. In only two projects was there a high level of uncertainty - in Lam Pao and Bhakra. In Lam Pao, farmers do not pay for water, and are not extremely interested in cooperating to provide canal maintenance. In Bhakra, there is a large amount of vandalism and water stealing. Farmers in other projects, essentially from the same educational and income levels, were more enthusiastic and cooperative.
Hypothesis 6. The level of service to the field in the majority of projects will be insufficient to allow for modern irrigation scheduling and modern on-farm irrigation management.
Chapter 9 - Review of the Original Project Hypotheses Page 2

Page 186 of 276
This is definitely true. Figure 7-40 (Internal Process Indicator I-26) shows that only one of the projects (the modernized areas of Office du Niger having large canals supplying the field turnouts) could easily adapt to modern techniques. Figure 7-41 clearly shows the gap between present and needed hardware and management capabilities.
Hypothesis 7. Declared levels of service in some projects will be impossible to achieve; they will not match hydrologic or physical constraints.
Most of the project authorities were fairly realistic regarding the annual water supplies available to farmers. Perhaps the most impossible conditions were in Bhakra and Lam Pao, where computations made in the office were supposed to ensure excellent service to the fields. The signs which were posted in the fields, declaring the type of service meant to be provided, were clearly incorrect. In both projects, and in the other projects to varying degrees, the physical design of the system would need some fundamental changes in order to be able to provide the desired level of service (which would still be insufficient for modern field irrigation).
Hypothesis 8. Operational office staff will often have an incorrect perception of how water is delivered by operational field staff.
This hypothesis was true in most projects, but was definitely not the case in Seyhan, Dantiwada, Coello, Saldaña, or Rio Mayo
Hypothesis 9. One or two simple errors or gaps in institutional framework or hydraulic design will be sufficient to drastically offset the actual level of service provided from the declared level of service.
This is definitely true. One example is the new area of Office du Niger, which uses small canal cross sections. The poor instructions and use of WASAM for determining main canal gate positions in Lam Pao is another example. The lack of regulating reservoirs and the small canal capacities in Beni Amir are key points for that project. As mentioned in previous sections, it is almost impossible to achieve decent water delivery service to fields if a large number of farmers must cooperate, as in Bhakra.
Nevertheless, it would be an oversimplification to assume that the correction of just one or two errors would turn a project around. Figure 2-2 shows that numerous factors impact the level of service which is available in an irrigation project. Perhaps good training and the development of a sense of service by project authorities are the most important factors - good design and operation will flow from that base.
Hypothesis 10. Functional Water User Associations will only exist if the actual level of service matches the declared level of service at the point of ownership transfer between project authorities and the WUA.
Chapter 9 - Review of the Original Project Hypotheses Page 3

Page 187 of 276
This is true, with some qualifications. In projects with an abundance of water, some deviations from the prescribed level of service are barely felt by the Water User Association, as the WUA can pass those problems (in the form of excess flow) right through its zone of operations.
Perhaps this question should have been reworded to include something about the level of service to the fields themselves. The level of service provided to the beginning of the WUA is important, but rather useless to a farmer who could still not receive water with a good degree of service at his individual field. And, since the farmers must be enthusiastic in order to form a WUA, this is a key point. The most noticeable factor which must accompany a reliable supply to the WUA is a high density of manageable turnouts (requiring very little or no inter-farmer cooperation) within the WUA itself.
Hypothesis 11. The concept of treating water deliveries as a service to users will be new in many projects.
Although this statement is true (the concept is new), the concept already exists in most of the projects visited. Even in Lam Pao, which has received numerous negative comments in this report, it appeared that the project authorities were genuinely interested in providing good service throughout the project. Because this is a new concept, some of the details of service (reliability; equity; flexibility in frequency, rate, and duration) and details of the service concept implementation (each layer must provide service to the next lower level) are not understood. Project authorities (and the consultants) definitely need help on understanding the details of how to provide better service.
Chapter 9 - Review of the Original Project Hypotheses Page 4

Page 188 of 276
Chapter 10 - Irrigation Project Improvement and Modernization
This research project examined 16 projects, 15 of which have some modernization components. Bhakra was the exception. The authors were left with a sense of strong optimism for the future of irrigation projects in general, and specifically for the success of future irrigation modernization programs. In the 15 projects, they observed the beginning of an evolution which is already several steps ahead in the western U.S. That evolution is a gradual and incremental but nonetheless dramatic move towards increased awareness and performance in irrigation projects over the last 10-15 years.
Figure 1-2 shows the complexity of irrigation projects. One cannot change the whole picture instantaneously or even in a decade, but this research project did discern key steps which must be taken for eventual success. This chapter discusses the concept of modernization and makes some specific points about the projects which were visited.
The Nature of Modernization Modernization requires the adoption of a new thought process. The modernization process first defines what the true objectives are. These objectives should always be related to the improvement of some aspect of irrigation project performance. The modernization process then defines the specific course of action needed to fulfill those objectives. It continues with subsequent implementation of those targeted actions. "Installation of modern equipment" or "promotion of water user associations" by themselves are actions which may or may not be appropriately targeted, and therefore may or may not be part of a modernization process. This means that it is entirely possible to work on the development of water user associations, but if the purposes are incorrectly defined or the support network (hardware and software) is not available, WUA association promotion cannot be considered part of a "modernization" process.
In other words, modernization is not a shopping list of actions. Actions such as the development of water user associations or installation of automation are only means to an end, not the end itself. The actions must fit into a good overall strategy - something which appeared to be missing in almost all of the projects which were visited. Modernization might be comparable to developing a shopping list of objectives, for which we subsequently define various actions which may help accomplish those objectives. Typically modernization includes changes to both hardware and software (management/operation).
There can be many objectives or anticipated results of modernization programs. These include:
• Improved yields. • Financial sustainability of a project, including collection of water fees. • Elimination of anarchy among employees and water users. • Improved irrigation efficiency. • Reduction of environmental degradation.
Chapter 10 - Irrigation Project Improvement and Modernization Page 1

Page 189 of 276
• Reduced operation or maintenance costs. • It was clear that the recovery of O&M costs can be a realistic goal. Indeed, it
has been accomplished in several of the irrigation projects visited.
Only in Rio Mayo was the operational staff able to articulate a strategy which blended the concepts of simultaneously improving the irrigation efficiency and providing better service. In other projects, both objectives were sometimes discussed, but the links and interrelationships between the two did not seem very clear when selecting alternatives especially at the level of the operational staff.
The tremendous diversity of conditions found within the 16 irrigation projects of this study shows that there is no single formula for success for all projects. This is why the thought process and proper training/education of available options are so critical. An example of overdependence on a "device" to achieve modernization is the use of the baffle distributor modules as turnouts throughout Cupatitzio. Key elements of process understanding and training were under-emphasized and as a result, the "devices" did not perform up to expectations - in fact they represent a wasted investment.
Furthermore, because there are so many differences in soils, weather, fertility, etc., it is unrealistic to expect all irrigation projects to achieve similar levels of performance when measured as economic output, irrigation efficiency, or other external indicators. Rather, when planning for modernization, one must examine projects one at a time and determine what is required to achieve incremental improvements in each project.
Tradeoffs between Hardware and Organization The need for both management and hardware improvements was identified in every project visited. However, it is important to recognize that some modern hardware options can make the operation/management much easier - thereby reducing the need for high discipline and cooperation. The project visits indicated that this beneficial tradeoff often occurred, but the project authorities were unaware of its significance and did not usually even recognize that the tradeoff existed. Some examples are given:
1. A high density of farm turnouts, with good service to those turnouts, almost eliminates the need for inter-farmer cooperation.
2. The use of regulating reservoirs plus remote monitoring (either manual or automatic) can eliminate the need for very tight flow control in the majority of a canal system.
3. The use of surface drainage water recirculation facilities enables the project authorities to not worry about spills, thereby allowing excess water to be available at almost all times, with very simple operational rules, while still achieving a high project irrigation efficiency. This is a potential improvement for Office du Niger.
4. Low capacity systems with no flexibility built into them require a very high discipline and complicated water tracking system, as was seen in Beni Amir.
Chapter 10 - Irrigation Project Improvement and Modernization Page 2

Page 190 of 276
5. The use of simple and effective water level control devices reduces the need for frequent employee supervision and adjustments of canal cross regulators and turnouts. If the control devices are designed properly, the main effort of the employees is to simply check for problems and provide maintenance, rather than needing a constant presence at the structures. For example, some automatic gates and long crested weirs can fit this category of "efficient" cross regulator devices.
Decentralization Another key point of modernization which is frequently overlooked is that successful projects include a healthy dose of decentralization. This decentralization may take several forms. For example, the gate movement instructions for the main canal in Lam Pao were centralized - gate operators had no ability to deviate from the gate movements which they were instructed to make. In contrast, operators in Rio Mayo, Seyhan, and other projects received centralized service objectives, but the operators were empowered to achieve those service objectives in the field.
Likewise, typical successful water user associations (other than the type found in Office du Niger, which has no operational or fee collection responsibilities) will only function if they are empowered.
Empowerment, whether it be of employees or of WUAs, requires several conditions - all of which must be present:
• Ability to make decisions on their own. • Proper training so informed and proper decisions can be made. • The necessary hardware and software tools must be available to achieve their
objectives reasonably well. In the case of a WUA, this also means that the water supply to the WUA must be delivered with good reliable and flexible service.
Because modernization involves decentralization, it requires a huge shift in thinking in some organizations and societies. In several of the projects, it was obvious that the thinking and management style was "down". In contrast, the adoption of a service attitude requires a shift to "up" thinking. "Up" thinking does not must mean that one is concerned about the users (in all projects, this concern was professed to be held). It also means that there is an effective and rapid process for responding (real time) to the user needs.
Hardware vs. Software? This title is simply meant to emphasize the point that both hardware and software improvements are needed in all of the projects visited. It is never a choice of just one or the other if a good water delivery service is desired.
Rio Mayo (Mexico) is an example of very motivated and well-trained staff who are squeezing almost everything they can get out of an old water delivery system that needs hardware modification. They have identified key hardware elements that need modification or modernization. In Rio Mayo, they have excellent communications, and
Chapter 10 - Irrigation Project Improvement and Modernization Page 3

Page 191 of 276
appropriate use of computers. The main constraint is hardware. Nevertheless, they still need better training and some improved operational procedures.
Long Term Objectives Several of the projects have advanced quite well for traditional on-farm surface irrigation. There is little or no anarchy and deliveries are fairly reliable. However, the problem is that the designers have boxed themselves into a corner when it comes to a shift to modernized on-farm irrigation techniques. The hardware and management styles which they have finely tuned are incompatible with modern on-farm irrigation.
The project authorities (Beni Amir, Majalgaon, and others) do not seem to be aware of this long-term problem. Understandably, they are very pleased that they do not have anarchy and that their systems are workable. They even have possibilities of O&M payback. A problem is that their investments are locking in, from a physical structure standpoint, a maximum potential level of service that will preclude an easy conversion to modern on-farm irrigation techniques.
In all these projects, one can identify both management and hardware changes that can be made to improve performance for the goals they have set. However, if they really want to be ready for the next century, there needs to be a completely new vision of service, which will result in a dramatic shift for both management and hardware improvements. A modernization program only truly exists if it has an eye to the future.
Real Projects vs. Research Projects Lam Pao in Thailand and Beni Amir appear to be an examples of how experts have spent many valuable funds developing or adjusting very sophisticated computer programs which could be replaced with some simple hardware/operational changes or field tests. Are these efforts totally wasted? The answer is no - there are always some benefits that one can derive. However, whether or not there are "some" benefits is not really the issue. Instead, the issue is that other investments would result in a higher level of benefits.
In talking with various project authorities in other projects as well, it appears that the irrigation projects are frequently treated as research projects in the sense that modernization dollars can easily be spent in theoretical rather than practical solutions while being sold to the funding agencies as practical solutions. This is a difficult and sensitive topic to approach - especially when it comes from another research project. Although research is necessary and important, researchers should be encouraged to emphasize research which is more pragmatic, applied, and diagnostic in nature.
Projects with High Rainfall and Abundant Water Supplies The combination of high rainfall and abundant water supplies at low prices may provide special difficulties. Cupatitzio (Mexico) and Rio Yaqui Alto (Dominican Republic) have these characteristics, and in both projects many of the personnel and farmers seemed to lack enthusiasm and vision in regards to irrigation.
Chapter 10 - Irrigation Project Improvement and Modernization Page 4

Page 192 of 276
In both of these projects there were serious hardware and operational procedure problems - but those problems could be remedied for a fraction of the overall project costs. The authors suspect that these hardware and operational procedure problems have contributed to the lack of enthusiasm. If an irrigation project with marginal benefit is also very difficult to operate/manage, it would seem likely that people would not be tremendously excited about working in it.
Personnel Continuity All of the impressive projects either had certain good hardware aspects that were independent from the staff for any given day (e.g., the wide canals in Office du Niger) or, more typically, an enthusiastic and stable staff. If a project cannot permanently attract and retain high quality technical personnel, it appears that modernization programs will not have good success. Modernization is a long-term process. Although short-term personnel can provide valuable insight into needed changes, these projects always need qualified, stable, and long-term personnel to implement and fine tune those changes.
The Mexico Experience The recent Mexican experience has been held up by many as a good example of institutional and policy reforms; although this report has not focused on such essential reforms. The observations below may be of some value:
1. To date, the Mexican experience has primarily been one of transferring the operation and maintenance and fee collection responsibilities from the federal government to water user associations. There has been little work to date on the improvement of the water delivery control structures within the individual irrigation projects.
2. Prior to the transfer of responsibilities, the irrigation projects of Mexico already had many features which would be considered "modern" in other areas of the world. These include:
a. Relatively high density of turnouts.
b. Many years of agricultural extension efforts related to water usage and good field irrigation practices.
c. Many relatively good irrigation structures, including undershot (orifice) turnout designs and radial gates or weirs rather than sluice gates in the main canals.
d. Relatively good equipment and operator access throughout the projects.
e. Professionally trained irrigation staff (although the staff was bloated in numbers and has since been deflated).
Chapter 10 - Irrigation Project Improvement and Modernization Page 5

Page 193 of 276
f. Relatively good discipline in many (although not all and there are still problems with this in some areas) projects, including a tradition of paying for water.
3. The government of Mexico embarked on a very serious, intensive, and long-range program of transfer to Water User Associations. This did not consist of a few meetings with a few individuals, but rather consisted of hundred of meetings with the stakeholders.
4. Mexican water law was changed to enable WUAs to have fiscal responsibility and empowerment. For example, the new WUAs could collect fees and keep them within the WUA, and the new WUAs were not obliged to recruit former government employees.
5. Mexican water law was changed to provide a good model organizational structure for WUA organizations.
6. The government of Mexico had a clear idea of the actual conditions in the field, and addressed the problems in a straightforward manner rather than skirting the issues.
7. The Mexican government embarked on a serious (and continuing) training program for operators, engineers, farmers, and university faculty.
8. Because the basic physical infrastructure was already designed to provide reasonably reliable service (keeping in mind that initially most farmers do not understand the need for good flexibility), and because operators had a sense of providing good service in most projects, the initial focus was on fiscal sustainability. The Mexican government identified 3 areas which needed immediate improvement (due to long-term deferred maintenance) before the transfer could be effective:
• Cleaning of drains • Cleaning of canals • Road maintenance
Therefore, in addition to the emphasis on organization needs, the Mexican government focused on providing the correct equipment and funding to upgrade these 3 items before transferring responsibilities to the WUAs.
9. Evidently in many of the Mexico projects (including Rio Mayo), the new WUAs are quickly beginning to focus on ways to improve their water delivery service. At this point in time (keeping in mind that they have workable although inefficient structures in place at the time of transfer) they are beginning to look for ways to improve their water control hardware and software.
10. Even with all of the excellent preparation work in Mexico, there is no guarantee of rapid success in all projects. Cupatitzio had numerous problems which could have been avoided with a better combination of training, design, and installation. But even with Cupatitzio a significant fraction of the investment can be recovered if a good training program is implemented and if the structures are modified. The concrete
Chapter 10 - Irrigation Project Improvement and Modernization Page 6

Page 194 of 276
lining, a major part of the investment, appears to be in good condition. In addition, there is a good density of turnouts - a major factor.
11. Mexico's ownership transfer program is only about a decade old, and overall, one must conclude that amazing things were accomplished in that short time. The challenge is for other countries to improve on the Mexican experience.
Chapter 10 - Irrigation Project Improvement and Modernization Page 7

Page 195 of 276
Chapter 11 - Lessons for Lending Agencies
Focus of Lenders The proper understanding and implementation of technical details are extremely important if an irrigation project is to function efficiently, provide good service to farmers, and be financially viable. In all of the 16 projects, the authors saw both simple and complex needs for improvement in both the operational and hardware arenas.
However, in important meetings such as the World Bank Water Week, discussions of "project improvement" do not address modernization of physical infrastructure, training, and day-to-day operational procedures for irrigation projects. Items which are typically discussed at these meetings are also important, and but focus on different topics such as:
• Watershed protection • Institutional Reforms • Basin Management • Intersector coordination • International treaties • Water Rights and Water Markets
The technical details of moving water throughout a project must be adequately addressed in front of the wider audience, also. If, for example, just one technical detail is incorrect (e.g. the turnout density is so small that it will be impossible to provide equitable, reliable, and flexible water delivery service), the project will never be able to provide the service necessary for modern on-farm irrigation. Likewise, the chance of developing viable water user organizations and collecting O&M fees with such a system will probably be nonexistent. As a result, the whole range of economic assumptions which are made during the initial loan assessment procedures can be meaningless.
Finding the Technical Answers This report has shown that irrigation projects are complex. There are still uncertainties about some organizational issues related to irrigation project water users and laws. However, we do know much more about proper hydraulic designs, water delivery strategies, and water delivery operation policies than is being applied at the moment in these projects. This body of knowledge is valid regardless of religion, social conditions, economics, climate, etc. We need to ask why this body of knowledge is not being universally considered nor properly applied.
The answers and solutions are fundamentally simple. First, there is insufficient attention by all parties to the importance of the technical details. This must be changed. Irrigation project proposals must clearly defined at the onset:
• The desired service which will be provided at all levels within the system. This requirement needs more than a few sentences in a report. Performance-based design requires that substantial thought and resources be dedicated to this matter.
Chapter 11 - Lessons for Lending Agencies Page 1

Page 196 of 276
• The operational procedures which will be used to provide this desired level of service.
• The hardware and irrigation project game plan which is needed to implement the proper operation.
Second, there is an insufficient pool of qualified technical experts available who can make proper design and modernization decisions, as well as implement those decisions. Pragmatic training of water professionals on an extensive scale is needed immediately. Extremely diverse qualifications is needed for irrigation project specialists. They must understand hydraulics, the sense of service, organizational behavior, the control of unsteady flow, construction materials, on-farm irrigation, and a host of other topics and how they inter-relate.
Sufficient Funding and Duration The costs of irrigation improvement projects will vary tremendously depending upon their location, as well as on their physical and operational conditions. It appears that many modernization projects are under-funded with respect to their expectations.
Experience in many countries, including the U.S., has shown that irrigation project improvement is a long term and costly procedure. The long-term aspect requires sufficient, stable, well-trained, and motivated people on site - not just for a year or two. If loans are made to complete just part of a project, it is doubtful that the rest of the project will ever be completed because governments and governmental priorities change with time.
If one looks at the Mexican experience, one must realize that there was more than 37 years of water assistance to Mexico. The "Mexico miracle" didn't happen overnight and is only partially successful to date in some of the projects. There is still substantial work on modernization to accomplish. Expectations of having a much more flexible delivery system, better water ordering procedure, active water user associations, etc., in place after a 4-5 year loan program are typically unrealistic. Each item takes time. The system must be diagnosed properly, the improvements must be designed carefully, perceptions and habits must be modified, the changes must be implemented, and then those implementations must be de-bugged and modified.
The good news is that in the majority of irrigation projects visited for this research, significant incremental improvements have been made. The trend is definitely in a positive direction, and people are slowly becoming more aware of various operation and hardware options. This is really just a first step, however.
Some projects, such as Office du Niger (ODN) in Mali, inherently have high costs per hectare when compared to other projects. This is because before an irrigation project can be successful, complete organizational, technical, and physical aspects must be built up. There is almost no physical infrastructure such as roads and drainage in the area, and the nature of the soils and distance from suitable construction materials means that construction costs are tremendously high. Towns must also have facilities which are
Chapter 11 - Lessons for Lending Agencies Page 2

Page 197 of 276
suitable for employees to live in. The list goes on. In other countries and areas, many of these infrastructure requirements are already available.
Recommended Strategy for Modernization Assistance In addition to the previous points, the following are recommended:
1. The vision for all modernization must be on the water delivery service which is needed 20-50 years from now.
2. In the past irrigation engineers concentrated on construction and the structural aspects of irrigation systems. They ignored the social aspects, and rightfully there has been increased emphasis on water user associations and institutional reforms. But the engineers also neglected to design the structural aspects so that they could be operated easily to provide good water delivery service. Therefore, modernization programs must include substantial funds for modifications and additions to the physical infrastructures of the projects, as well as for institutional reforms.
3. Direct government contributions to O&M activities can realistically be reduced...IF the projects are first improved to the point where reasonable water delivery service can be provided. This research project showed that this will require a combination of operational and hardware modifications in all projects, with a different emphasis in each. The proper modifications, in turn, require excellent training of consultants, engineers, managers, etc.
4. Water user associations of some form (quasi-public or private sector) provide distinct advantages if they are properly empowered. Efforts to form viable WUAs before steps 1 and 3 are accomplished will probably be unfruitful. These water user associations provide distinct advantages in that they:
• Remove political cronies and "dead wood" staff. In Mexico, for example, the transfer to WUAs resulted in a 44% reduction of total staff, but an increase of about 2,200 new professionals in the irrigation projects.
• Are "results" oriented.
WUAs do require legislative, judicial, and executive support to be financially self-sufficient.
Chapter 11 - Lessons for Lending Agencies Page 3

Page 198 of 276
Chapter 12. Summary
Background Irrigation projects have a large impact on the world food supply, country economies, and the environment - all of which can be quite fragile. Developing countries are experiencing high rates of population, urban, and income growth that is putting tremendous pressure on available water supplies. At the same time, growing populations make it necessary to ensure that crop yields continue to rise. Some predictions indicate a rise in world population from 5.6 billion in 1998 to 8 billion in 2020 – almost all in the less developed countries. Because of transportation problems and the lack of foreign currency, these countries must expand crop production. Production must occur with the same or less water consumption. There are three principal ways to do this:
• Improve water use efficiency (yield/water consumed); • Reduce water quality degradation; and • Reduce return flows into saline sinks
All three options require better on-farm water management, which depends upon improved quality and reliability of water delivery service to the field. One could logically assume that new and/or rehabilitation irrigation projects are designed and funded with the goals of improved water delivery service in mind. Because irrigation projects are resource (capital, water, etc.) intensive, a second logical assumption is that project design and operation manuals should clearly define the service goals and should have clear guidelines as to how various project features will help to achieve the goals. Both assumptions are incompatible with reality.
This research project was designed to answer several questions: One was: What is the extent of modernization in some of the best projects which can be located? The answer was: It is just beginning.
A second question was: Do modern water control and management practices in irrigation make a positive difference in performance?
The evaluated irrigation projects have many examples of improved operation and performance due to management and hardware modernization. This research project did not find any "complete" modernization programs; rather, various components of modernization were found in different irrigation schemes.
This research builds upon previous work presented in the World Bank Technical Paper No. 246 (Plusquellec et al., 1994). That publication, Modern Water Control in Irrigation, provided a conceptual framework for the concepts, issues, and applications of irrigation modernization efforts. It lacked the detailed field baseline information and correlations which this report now provides.
Chapter 12 - Summary Page 1

Page 199 of 276
•
)
•
,
SouthAmerica
Asia
Projects Evaluated The 16 irrigation projects evaluated for this research project were spread over 4 continents and 10 countries. These projects were selected as some of the best performing projects in developing countries. Nine of the evaluated projects were in Asia (Lam Pao, Guilan, Dez, Seyhan, Majalgaon, Dantiwada, Bhakra, Muda and Kemubu). Two projects were in Africa (Beni Amir and Office du Niger). Five of the projects were in Latin America (Cupatitzio, Rio Mayo, Coello, Rio Yaqui Alto del Norte, and Saldaña).
This research project did not include a rigid statistical analysis of all of the data, although certain statistical correlations between data and indicators, and between various types of field data were completed. Many types of statistical analysis need a control and numerous trials of a single variable, with all other variables remaining constant. This was clearly impossible for this type of research project - and for most types of irrigation project analysis. Rather than look for 16 irrigation projects which were all similar except for one or two modernization components, this research project selected 16 irrigation projects with a wide range of climate, topography, institutional, and engineering conditions. Projects were deliberately selected in Latin America, Africa, the Middle East, India, and Southeast Asia to provide a wide spectrum of conditions. It was hoped that some lessons learned would be applicable over the whole range of conditions, and that other lessons could be clearly distinguished as being applicable to a specific subset of those conditions.
The site visits in the Latin American and African projects were completed by the senior author, as well as a preliminary beta-test visit to Mexicali Valley (Mexico) during the development of the Rapid Appraisal Process. The junior author evaluated the Asian projects. Both authors evaluated the Lam Pao project to verify similarities in their assessments and conclusions. Local irrigation specialists generally accompanied the authors. IWMI, IPTRID, and AGR Staff participated in some field visits.
Seyhan Majalgaon
Kemubu
Muda
Coello
Rio Mayo
Saldana
Guilan
Dez
Dantiwada
Lam
BhakraCupatitzio
Beni Amir
Rio Yaqui Alto
Office du Niger
Figure 12-1. Map showing the general location of the projects.
Chapter 12 - Summary Page 2

Page 200 of 276
Procedure The procedures used in this research included the following: 1. Rapid Appraisal Process (RAP). This process was developed and proven to provide
uniform and comprehensive field data in irrigation projects for developing countries. The RAP allows a qualified evaluator to collect sufficient information to later evaluate the performance of an irrigation project, and to also make recommendations for improvements. Field time required is approximately 3-5 person-days for the evaluator, but also requires the cooperation of the local project staff and organization of general project statistics prior to the site visit. A key point is this: If the data does not already exist, spending an additional 3 months on the site will not create the data. Therefore, the RAP appeared to assign the appropriate amount of time to the collection of baseline data. An essential ingredient of the successful application of these RAPs is adequate training and qualifications of the evaluators.
2. Internal process indicators. This is a new concept for international projects, although the Irrigation Training and Research Center (ITRC) has used them for several years in the U.S. Indicators and corresponding rating scales were developed especially for international projects, to evaluate the internal workings of irrigation projects - that is, how is water controlled and delivered throughout a project. Special indicators were developed to assess the ease with which existing irrigation projects will be able to provide the levels of water delivery service needed by the modern field irrigation technologies in the year 2030.
3. External performance indicators. External performance indicators pertain to factors such as project irrigation efficiency, yields, finance and water consumed. This project quantified various IWMI external performance indicators for each irrigation project. In addition, several new ITRC external performance indicators were recommended, as well as modifications to some IWMI indicators. Modifications reflect current approaches to irrigation project evaluation. Economic data are major components for computations of some of the IWMI indicators. The experience of this research project showed that a RAP is not suitable for the collection of some economic data. Data such as the overall cost of a project in today's dollars, per capita income, and the size of typical farm management units were not readily available in most projects. Therefore, the economic indicators in this report are typically the weakest. Nevertheless, there are generally some general trends that appear even in these uncertain indicators.
4. The introduction of the use of confidence intervals (CI) in describing irrigation project data and indicators. The purpose of using confidence intervals (CI) on figures and tables is to reinforce the fact that we rarely know many values with precision even though discussions of those values often assume that we do know them. In fact, we are not "95% certain" of the CI values themselves.
5. Discussion of various observations and lessons learned from the projects. For example, in no case were the water users paying back the cost of the infrastructure investment, whereas in several projects there was an excellent collection rate of water
Chapter 12 - Summary Page 3

Page 201 of 276
charges that was sufficient to cover O&M costs. Such observations were discussed in great detail in Chapter 8.
6. Recommendations for the Bank and other agencies that invest in new irrigation projects and irrigation project modernization. These are discussed later in this summary.
Evaluation of the Hypotheses The proposal for this research project presented 11 hypotheses. Most of the original hypotheses proposed for this research were found to be true. Several of the hypothesis statements were not always true, but were true in most cases. Chapter 9 contains the review of those hypotheses. The following hypotheses were true in all cases:
- Certain institutional frameworks are always present in projects that provide a high level of water delivery service to individual fields (#2)
- Inappropriate hardware or inappropriate instructions for using appropriate hardware will be found in the majority of the projects (#3)
- Failure to provide a promised and clearly defined level of service to farmer fields will be associated with problems as water stealing, destruction of structures, lack of farmer discipline, and failure to pay for water (#5)
- The level of service to the field in the majority of projects will be insufficient to allow for modern irrigation scheduling and modern on-farm irrigation management (#6)
- Declared levels of service in some projects will be impossible to achieve; they will not match hydrologic or physical constraints (#7)
- One or two simple errors or gaps in institutional framework or hydraulic design will be sufficient to drastically offset the actual level of service provided from the declared level of service (#9)
- Function Water User Associations will only exist if the actual level of service matches the declared level of service at the point of ownership transfer between project authorities and the WUA (#10)
- The concept of treating water deliveries as a service to users will be new in many projects (#11)
The following hypothesis were true in some cases, and not true in other cases: - Reliable service at field turnouts will only be found if levels of service are
clearly defined and understood by operators and management at all layers within the system (#1)
- Operational office staff will often have an incorrect perception of how water is delivered by operational field staff (#8) [While this was true in several projects, it was not as widespread problem in these projects as the authors had imagined]
Hypothesis #4 dealt with chaos and was not well written, so it falls in neither category.
Chapter 12 - Summary Page 4

Page 202 of 276
Correlations Many factors were inter-related and appear to have cause-and-effect relationships. Some of the more interesting observations were:
1. The projects with the highest efficiency are the ones with the smallest capacities. An erroneous conclusion might be that it best to design projects with a restriction in the flow rate capacities in order to force the projects to have better irrigation efficiency. At first glance, this appears to be the logical conclusion. However, project efficiency is only one measure of the performance of the system. Too much emphasis on the project efficiency can lead to incorrect design criteria.
2. Good water delivery service is linked to an increase in the number of turnouts per operator - an extremely important point that is linked to both design and management. The systems with a large number of turnouts per operator tend to have operators that understand the concept of "service". These systems also have staff that is mobile and spends a high percentage of time in the field working on operations rather than at the office (or field) filling out paperwork or collecting statistics.
3. The projects with a high percentage of active water user associations (WUAs) have a high degree of flexibility in the water delivery service to the individual fields.
4. Water delivery systems which are closest to being able to service pressurized irrigation methods also have the strongest WUAs.
5. Those projects where the manager has difficulty traveling down the canals (i.e., projects which have poor access) also have: - the lowest stated water delivery service to fields - the least expensive water - poor operation of the headworks to the submain canals.
6. Those projects with the least amount of flexibility and which provide the poorest water delivery service are the ones with the most expensive land costs.
7. The projects with the strongest WUAs are the projects with the lowest land costs.
8. Instructions to operators must be clear and correct in order for projects to have good service at the turnouts to the individual fields.
9. Good service from the main canals to the submain canals is a key indicator for providing good service to the field level.
10. Some of the projects received consistently low rankings in most internal performance indicators [Lam Pao (Thailand), Dez (Iran), Rio Yaqui Alto del Norte (Dominican Republic) and Bhakra (India)]. These projects had no little or no modernization, or the “modernization” had been inappropriately applied. Poor instructions for operation staff were commonplace.
Chapter 12 - Summary Page 5

Page 203 of 276
In general there was minimal anarchy in the evaluated systems. This is in sharp contrast to previous studies that have noted extreme chaos and anarchy in traditional irrigation projects. Instead, this research project shows relatively optimistic results.
Improved Field (On-Farm) Water Management Improved utilization of project irrigation water typically requires better field water management, which depends upon improved quality and reliability of water delivery service to the field. Discussions on improved water management techniques such as irrigation scheduling, soil moisture measurement devices, and water measurement are meaningless if farmers do not have the ability to modify the timing and duration of the water delivery. The reason is simple - the farmer has no control over the topics being discussed. Seyhan, Office du Niger, Rio Yaqui Alto, Cupatitzio, and Rio Mayo provided water to fields (intentionally or by default) with sufficient flexibility that some of the improved field irrigation scheduling techniques could be discussed. Those techniques were not applicable on the other projects. Unfortunately, the high flexibility in some of these 5 cases was accompanied by a low project irrigation efficiency.
In evaluating the water delivery service that is provided to farmer fields, this research project applies more stringent criteria than local farmers or irrigation project personnel will apply. For example, the traditional farmer has no knowledge of advanced field irrigation methods and may decide that just having a reliable (although inflexible) supply of water is completely "satisfactory". The traditional project operation engineer may be so immersed in the daily struggles of administration and avoiding major spills that he considers anything that works with a minimum of personal (to himself) hassle to be "satisfactory". This research project applied two different rating scales to water delivery service when examining internal performance. The lower scale was based on improved yet still fairly "traditional" irrigation practices; the higher scale was based on the needs for "modern" field irrigation practices.
Perceptions Conversations in the capital city sometimes led one to expect much more than one saw in the field. As an example, the advantages of some computer programs tended to be promoted highly in the office, but their actual impact on operations was sometimes negative, given the better available options for management and control which could have been pursued with the same level of energy and investment. Even more interesting was the finding that some projects had important features in their projects which had a profound positive influence on water delivery service, but the project authorities did not always recognize the importance of those features.
Not surprisingly, perceptions of what constituted "modern" hardware and practices in any one project varied depending upon who one talked to. In several notable cases, tremendous effort was being put into developing complex operational procedures to overcome (or just deal with) problems that could be solved with hardware improvements.
Chapter 12 - Summary Page 6

Page 204 of 276
Some projects had significant discrepancies between what was actually happening in the field and what was stated in the office. These projects typically had the poorest water delivery service at all layers within the water distribution system.
Training Needs There are major gaps in pragmatic understanding about fundamental issues of irrigation water control (design and operation). These gaps in knowledge and understanding were very evident at all levels - from consultants to senior engineers to junior engineers. The biggest training needs identified by this research are not concerned with sophisticated computerized techniques. The lack of knowledge of the fundamental issues of water control, and how to combine the details into a functional design for good service, was simply missing in most cases. Fortunately, many of the project staff recognized the training needs and were eager to participate in meaningful training programs. Examples of fundamental concepts that were not generally understood by engineers are:
• The importance of water level control in canals and the impact on maintaining a constant turnout flow.
• The hydraulic interaction between structures. • Differences between orifices and weirs, in terms of their proper positioning
and usage for water level vs. flow rate control. • How to design good and appropriate open channel flow measurement devices. • How main canal operation impacts lateral canal operation, and so on down to
the farm level. • How to modify existing canal structures to provide better water service. • Project irrigation efficiency and field irrigation efficiency measurement. • How to convert control of an irrigation project into manageable layers or
units, rather than needing to understand all of the details of the massive entity. • What the "service concept" consists of.
The first items are classical operational and hardware problems. The last items require a more complete understanding of what irrigation projects are all about. The concept of breaking down the control of an irrigation project into manageable layers or units, for example, does not seem to exist in management situations that emphasize the top-down or centralized approach to management.
A real challenge will be to develop training programs which will help engineers and managers synthesize ideas and concepts. This is a challenge for irrigation projects throughout the world, not just in less-developed countries. Engineers and managers are often familiar individual concepts, and can recite numerous details of a particular idea or design. The weakness lies in their inability to put all of the pieces together into a manageable design or operation.
Chapter 12 - Summary Page 7

Page 205 of 276
Hardware Improvements The need for both management and hardware improvements was identified in every project visited. It was also evident that some modern hardware options can make the operation/management much easier - thereby reducing the need for high discipline and cooperation. Some examples of simple (yet inadequately adopted) modern hardware options are given:
• A high density of farm turnouts, with good service to those turnouts, almost eliminates the need for inter-farmer cooperation.
• The use of regulating reservoirs plus remote monitoring (either manual or automatic) can eliminate the need for very tight flow control in the majority of a canal system (note that the need for good water level control still remains).
• The use of surface drainage water recirculation facilities enables the project authorities to not worry about spills, thereby allowing excess water to be available at almost all times with very simple operational rules while still achieving a high project irrigation efficiency. This is a potential improvement for Office du Niger, as an example.
• High capacity systems with built-in flexibility will reduce the need for very high discipline and a complicated water tracking system. The opposite was seen in Beni Amir, which has a low capacity system with no flexibility built into it. The Beni Amir system requires a very high discipline and complicated water tracking system just to provide a mediocre water delivery service (the water delivery service is inadequate by the standards of modern field irrigation).
• The use of simple and effective water level control devices reduces the need for frequent employee supervision and adjustments of canal cross regulators and turnouts. If the control devices are designed properly, the main effort of the employees is to simple check for problems and provide maintenance, rather than needing a constant presence at the structures. For example, some automatic gates and long crested weirs can fit this category of "efficient" cross regulator devices.
Management Improvements Some of the irrigation projects had management staff who were able to properly focus on the big, important issues. In other projects, the management and engineers tended to concentrate energy and resources on interesting factors that were not really very important in terms of overall project operation.
One example is data collection and management. A feature of modern design and operation is often the minimization of the collection of large amounts of data that are used for statistics. On the other hand, modern projects tend to increase the availability of information needed for operation. It was apparent from this research project that there is tremendous confusion between these two types of data (statistics vs. operation). Many projects were justifying intensive statistical data collection on the basis of improved operation potential. When dealing with the operation of a canal system, one must focus on results rather than on process.
Chapter 12 - Summary Page 8

Page 206 of 276
Some management issues are closely tied to culture and government policies - influences that are difficult to change quickly at the irrigation project level. But the investigators of this research project were left with an almost overwhelming feeling that many, very simple management/operation changes could be immediately implemented and have significant beneficial impacts on performance. Some examples are given:
• In several projects the flow rates at the source were only changed occasionally during the year. It would be easy to make flow changes at a dam once/day if a person already visits the dam once/day.
• Simple things such as reservoir operation rules and maintenance schedules may be modified with ease. Official centralized policies regarding reservoir management may not provide the maximum benefit.
• You get what you pay and train for. In Rio Yaqui Alto del Norte, for example, the main canal gate tenders receive very low salaries and have virtually no training. In short, canal operators who are paid minimum wages and have no training cannot be expected to operate a system properly.
• An area of interest was the difference between stated and actual service in the field. It is obviously a management issue if the office staff and administrators are unaware of the field conditions, or if they refuse to acknowledge the actual field conditions.
• Coello, Rio Mayo, Saldaña, Seyhan, and Dantiwada are operated by professional staff with an apparent sense of duty and adherence to the "service concept". The field operators are highly mobile, as are their supervisors. Most farmer conflicts/concerns are handled by the field operators, but the farmers know that they have access to the supervisors and problems are generally solved within hours rather than weeks. These irrigation projects have developed procedures in which the canal operators spend the vast majority of their time operating the canals and turnouts and taking water orders, rather than filling out statistical forms. They work in a "responsive" mode rather than in a "pre-programmed, inflexible" mode.
• Projects in which a canal operator has good mobility and is responsible for the operation of structures had the highest motivation levels and the best water delivery service. Those operators were typically empowered to make their own decisions on how and when to operate the structures.
• For a water scarce project, perhaps the only way to obtain equitable water delivery of water is to modify the thinking of all of the participants in the process. Large-scale changes in the water distribution methodology from Shejpali to Warabundi to RWS was possible for the Dantiwada project in India due to education and training done by WALMI.
Water User Associations Water User Associations (WUAs) have received much attention in the last two decades. In many cases, discussions appear to assume that if a WUA is formed, many irrigation project problems will disappear. It was obvious that simple formation is insufficient. There appear to be several key ingredients common to the strong WUAs. The legislative,
Chapter 12 - Summary Page 9

Page 207 of 276
executive, and judicial branches of the government supported these ingredients. These ingredients are:
• Financial management by the WUA. • Autonomy. • Capacity (including both training of technical and managerial skills, and a
functional and suitable physical infrastructure). • Reliable water supplies.
Water User Associations, if functional and empowered with authority and water, can be very effective in satisfying farmer concerns. Blame can no longer be assigned to individuals at a distance; the WUA is physically very close to the farms and the staff are accessible. Furthermore, WUA staff are hired by the board of directors, and must be sensitive to the farmer needs. This is contrast to government employees (especially upper management) who may have rapid turnover and do not tend to appreciate the needs of farmers.
Empowerment, whether it be of employees or of WUAs, requires several conditions - all of which must be present:
• Ability to make decisions on their own. • Proper training, so that informed and proper decisions can be made. • The necessary hardware and software tools must be available to achieve their
objectives reasonably well. In the case of a WUA, this also means that the water supply to the WUA must be delivered with good service (reliability and flexibility)
Impacts of Modernization on Performance The “bottom line” of this report will depend upon who is reading it. A person interested in water user associations will have a different focus than an economist who examines outputs versus inputs. The authors make the following points about impacts on performance: 1. There is a poor statistical relationship between the levels of water delivery service
provided to the individual fields and the output of the projects. None of the IWMI production-based external indicators showed good correlation with any of the other variables, based on the Pearson Correlation coefficient. Does this mean that modernization will not positively impact the outputs? – Absolutely not. Each of the projects had a different starting point, and had a different combination of water availability, soil fertility, type of crops, climate, available credit, institutional infrastructure, etc.
External indicators can be useful to characterize the status of various projects. They are not useful for statistical comparison of one project against another to determine the effectiveness of modernization or investment. They can be useful to determine the before-vs.-after impact of a program. This particular research project did not collect and compare before-vs.-after data, although the authors repeatedly heard testimonies about the positive impacts of various modernization components.
Chapter 12 - Summary Page 10

Page 208 of 276
2. The internal process indicators showed that modernization provides positive impact on numerous important factors such as: - Recovery of O&M costs
(7 of the projects had greater than 75% collection rate – compared to about 0% in typical Asia irrigation projects)
- Sustainability of water user associations (6 of the projects had strong water user associations – mostly in Latin America).
- Ease of irrigation system operation (Although many projects had a few components, most are struggling with poorly designed structures and systems)
- Morale and efficiency of project staff (Some of the projects had 40-80 turnouts per operator, vs. less than 5 for the two projects with no or inappropriate modernization)
- Level of water delivery service to the field (Typical scores were 5-7 out of 10, versus about 2.5 for the projects with no or inappropriate modernization)
- Anarchy in a project (11 of the 16 projects received scores of 9 or greater on a 10 point possible score)
3. Modernization programs should be viewed as programs which develop the essential infrastructure which is necessary to support - Institutions such as water user associations - Efficient and productive field irrigation systems and management - The ability to manage the water diversions and deliveries and spills in a manner
which will optimize the available water supply and minimize negative impacts upon the environment.
4. Because modernization programs are targeted toward improvements of the infrastructure (personnel, hardware, software, and institutions), the items listed in (2) and (3) typically do not have immediate impacts on crop yield, although a few specific actions such as land grading can have immediate impact. It is clear, however, that without this essential infrastructure we will not move away from the 25-35% project irrigation efficiencies, the low crop yields, the inability to collect fees to support O&M, and the anarchy. Modernization is not the total answer to irrigation project performance improvement; there are also institutional reforms necessary, for example). But modernization is clearly a major and essential part of the total answer.
Recommended Strategy for Modernization First, there is insufficient attention by all parties to the importance of the technical details of how water moves and is controlled throughout a project, both from an operational and a hardware standpoint (these are linked). This must be changed. Irrigation project proposals, at the onset, must clearly define:
• The desired service that will be provided at all levels within the system. This requirement needs more than a few sentences in a report. Performance-based
Chapter 12 - Summary Page 11

Page 209 of 276
design requires that substantial thought and resources be dedicated to this matter.
• The operational procedures which will be used to provide this desired level of service.
• The hardware and irrigation project game plan (strategy) that is needed to implement the proper operation.
Second, there is an insufficient pool of qualified technical experts available who can make proper design and modernization decisions (especially on the strategy and synthesis levels), as well as implement those decisions. Pragmatic training of water professionals on an extensive scale is needed immediately.
Third, it appears that many modernization projects are under-funded with respect to the expectations. Experience in many countries, including the U.S., has shown that irrigation project improvement is both a long term and a capital-intensive procedure.
Fourth, there is a need for a new vision for projects: • The vision for all modernization must be on the water delivery service that is
needed 20-50 years from now. • Direct government contributions to O&M activities can realistically be
reduced...IF the projects are first brought up to the point where reasonable water delivery service can be provided. This research project showed that this will require a combination of operational and hardware modifications in all projects, with a different emphasis in each. The proper modifications, in turn, require excellent training of consultants, engineers, managers, etc.
• Water user associations of some form (quasi-public or private sector) provide distinct advantages if they are properly empowered.
Conclusion This research project examined 16 projects, 15 of which have some modernization components (Bhakra was the exception). The authors were left with a sense of strong optimism for the future of irrigation projects in general, and for the success of future irrigation modernization programs specifically. In the 15 projects, they observed the beginning of an important evolution of modernization.
Chapter 12 - Summary Page 12

Page 210 of 276
Chapter 13. References
Burt, C. M., and H. W. Wolter. 1992. Guidelines for Modernization of Irrigation Systems in Mexico. IPTRID/The World Bank.
Burt, C. M. 1995. The Surface Irrigation Manual - A Comprehensive Guide to Design and Operation of Surface Irrigation Systems. Waterman Industries. Exeter, CA. ISBN 0-9639016. 373 p.
Burt, C. M., R. E. Walker, and S. W. Styles. rev. 1995. Irrigation System Evaluation Manual - A comprehensive, documented software package for evaluation of agricultural irrigation systems. Irrigation Training and Research Center (ITRC). Cal Poly, San Luis Obispo, CA.
Burt, C. M., K. O'Connor, S. W. Styles, M. Lehmkuhl, C. Tienken, and R. E. Walker. 1996. Status and Needs Assessment: Survey of Irrigation Districts. Irrigation Training and Research Center (ITRC). Cal Poly, San Luis Obispo, CA.
Burt, C. M., A. J. Clemmens, T. S. Strelkoff, K. H. Solomon, R. D. Bliesner, L. A. Hardy, T. A. Howell, and D. E. Eisenhauer. 1997. Irrigation Performance Measures - Efficiency and Uniformity. Journal of Irrigation and Drainage Engineering. ASCE 123(6):423-442.
Chemonics. 1994. Report No. 12. Flow measurement instrumentation for the Tadla Irrigation Project. Edward Rawson, Chief of Party. John Replogle, preparer of the report. Appendix C.
Clemmens, A. J., and C. M. Burt. 1997. Accuracy of Irrigation Efficiency Estimates. 1997. Journal of Irrigation and Drainage Engineering. ASCE 123(6): 443-543 .
ICID. 1995. Currently Used Performance Indicators. Research Program on Irrigation Performance. Contact: M. G. Bos, Wageningen, The Netherlands.
Jurriens, R., A. F. Bottrall, et al. 1984. Evaluation of Irrigation Design - A Debate. Network Paper 9b. Overseas Development Inst. (ODI). London.
Kloezen, W. H. and C. Garcés-Restrepo. 1998. Assessing Irrigation Performance with Comparative Indicators: The Case of Alto Rio Lerma Irrigation District, Mexico. IWMI Research Report 22.
Molden, D., R. Sakthivadivel, C. J. Perry, C. de Fraiture, and W. H. Kloezen. 1998. Indicators for Comparing Performance of Irrigated Agricultural Systems. IWMI Research Report 20.
Murray-Rust, D. H. and W. B. Snellen. 1993. Irrigation System Performance Assessment and Diagnosis. IIMI.
Chapter 13 - References Page 1

Page 211 of 276
Perry, C. J. 1995. Determinants of Function and Dysfunction in Irrigation Performance, and Implications for Performance Improvement. International Journal of Water Resources Development 11(1).
Plusquellec, H., C. M. Burt, and H. W. Wolter. 1994. Modern Water Control in Irrigation. Concepts, Issues, and Applications. World Bank Technical Paper Number 246. Irrigation and Drainage Series.
Plusquellec, H. 1996. Guilan, A Successful Irrigation Project in Iran. Irrigation and Drainage Systems 10:95-107. Kluwer Academic Publ., The Netherlands.
Chapter 13 - References Page 2

Page 212 of 276
Impact on Performance - Questionnaire Project:_____________________________ Date: _______________________________
R5 Crop intensity R6
R7 Avg. actual "typical year" equipped service area, ha R8
R9
R10 Avg. actual last 5 yrs wet season crop intensity R11 "Typical year" wet season crop intensity R12
R13 Avg. actual last 5 yrs dry season crop intensity R14 "Typical year" dry season crop intensity R15 Avg. actual last 5 yrs crop intensity R16 "Typical year" avg. crop intensity, % R17
R18
R19 General Project Conditions R20 Average net farm size (ha) R21 Number of water users R22 Typical field size, ha R23 Soil type R24 Average soil fertility R25 Average % soil organic matter R26 Avg. Water EC, dS/m R27 Avg. Water SAR R28 Avg. Water Adj. Rna R29 Land consolidation on what % of area (or geometric fields) R30 Canal water supplies what % of drinking water? R31 Ownership of land, % of total R32 owned and operated by farmers R33 farmed by tenants on private ground R34 owned by government or cooperative R35 percent rented land R36 Silt level in canals (10=high; 1=low) R37 Source of silt R38
R39 % of land with sprinklers R40 % of land with drip R41 % of land with surface irrigation R42
R43 Farm Economics R44 Cost of land close to head of canals, $/ha R45 Cost of Tailender land, $/ha R46 Average ANNUAL Farm economics (Typical, ave. intensity) R47 Gross income per farm unit, 1996 US $/year R48 Farm labor cost ($/day - 1997 costs) R49
R50
Attachment A - Questionnaire Page 1

Page 213 of 276
Impact on Performance - Questionnaire Project:_____________________________ Date: _______________________________
R51 Drainage R52 Water table depth R53 % area w/ depth <1m R54 % area w/ 2m>depth>1m R55 % area w/ depth > 2 m R56 % of fields with individual tiles or open drains R57 Km. of main drainage canals R58 Km of secondary drainage canals R59 General condition of project drains R60
R61
R62 Crops R63 Major crop R64 Ha of major crop, avg. R65 % of service area for major crop R66 Typical yield, mT/ha R67 Farm-gate selling price ($/mT) R68 Second major crop R69 Ha of second crop, avg. R70 % of service area for 2nd major crop R71 Typical yield, mT/ha R72 Farm-gate selling price ($/mT) R73 Third major crop R74 Ha of third major crop, avg. R75 % of service area for 3rd major crop R76 Typical yield, mT/ha R77 Farm-gate selling price ($/mT) R78 Typical "extra" production R79 Est. total sales of the "extra" production in the project, $ R80
R81 What is the ratio of yield (head/tail) during wet season? R82 What is the ratio of yield (head/tail) during dry season? R83
R84
R85 Water Supply R86 Water source R87 Live Storage Capacity of Reservoir, million cu. m R88 Actual Max. Storage Capacity Used from Reservoir R89 Avg Vol. Discharged into canals in last 5 years (mcm) R90 Avg. Vol. Discharged into canals in last 5 yrs (mm) R91 Min. Volume Released into canals in last 5 years (mcm) R92 Times/year majority of system is shut down R93 Typical total annual duration of shutdown, days R94
R95 Annual rainfall, mm R96 Peak actual flow rate from source, cu meters/sec.
Attachment A - Questionnaire Page 2

Page 214 of 276
Impact on Performance - Questionnaire Project:_____________________________ Date: _______________________________
R97 Has conveyance efficiency been effectively measured? R98 If Yes, what is % annual spill R99 If Yes, what is % annual seepage R100 What is the measured conveyance efficiency, % R101 What conveyance efficiency is used in these calculations, % R102 Has proj. farm irrig. effic. been effectively measured? R103 If Yes, what is % annual non-ben. deep perc. R104 If Yes, what is % annual non-benef. evap R105 If Yes, what is % annual tailwater. R106
R107
R108 Water Usage R109 Annual avg. ETo, mm R110 Coefficient of variation (C.V.) of annual rainfall (yr-yr) R111 Avg. annual ETc, incl. evap prior to planting (mcm, not mm) R112 Peak monthly ETo, mm (avg. year) R113 Peak monthly ETo, equivalent cms R114 Month of peak monthly ETo value
R115 Peak monthly net farm need (ETc - Eff Rain + SMD), equivalent CMS R116 Month of peak farm need R117
R118
R119 Project Budget R120 Annual Budget (avg. last 5 years) - excl. WUA R121 Salaries, $ R122 Improvement of structures, (excl. salaries), $ R123 Maintenance, Other Operation (excl. salaries), $ R124 Farmer extension (excl. salaries), $ R125
R126 Source of Budget (avg. last 5 years), % R127 Country Govt. R128 Foreign R129 WUA or Farmer fees R130
R131 Employees R132 Total number of permanent employees R133 Professional employees R134 Canal, gate operators, supervisors R135 Other non-professional employees (maint., sect., etc.) R136 Avg. years of professional personnel on the project R137
R138 Salaries R139 Professional, senior admin, $/mo R140 House also provided? R141 Professional, engineer $/mo
Attachment A - Questionnaire Page 3

Page 215 of 276
Impact on Performance - Questionnaire Project:_____________________________ Date: _______________________________
R142 House also provided? R143 Non-prof. - canal operators, $/mo R144 House also provided? R145 Non-prof - laborers, $/mo R146 House also provided? R147 Project Costs R148 Total Construction cost, excluding diversion and dam R149 Year for $US above R150 1996 US$ R151
R152 Water Charges R153 How are water charges collected? R154 None collected, and none are assessed R155 None collected, although policy says charges are to be collected R156 They are collected R157 What % of water charges are recovered/collected? R158 From what group are water charges collected? R159 From individual users by the government R160 From individual users by a WUA, and then to govt. R161 Other R162 Basic of charge and amount R163 If by ha, $/ha/yr R164 If by crop, max $/crop/yr (not season) R165 If by crop, max $/crop/yr (not season) R166 If per irrigation, $/irrigation R167 If volumetric, $/cubic meter R168 Is there a special charge for private well usage? (Y/N) R169 If so, what is charge ($) R170 per (unit) R171 If so, what % of these charges are collected? R172 Estimated total water charges collected on the project, $/yr R173 Destination of water charges R174 % that stay with the WUA R175 % that stay in the central project office R176 % that go to the state or central govt. R177 In-kind services provided by water users above point of ownership R178 Labor R179 Crop R180 Construction materials R181 Other R182 Frequency of in-kind services (month) R183 What % of farmers participate in these R184
R185
R186 Ownership R187 Main canals
Attachment A - Questionnaire Page 4

Page 216 of 276
Impact on Performance - Questionnaire Project:_____________________________ Date: _______________________________
R188 Secondary canals R189 3rd Level R190 Distributaries to individual fields R191 Water R192
R193
R194 WUAs R195 % of project area on which formed R196 % of project area remaining on books R197 % of these with activities and improvements R198 % of total area with active WUA R199 Typical size, ha R200 Typical age, years R201 Ave. number of users R202 Functions of the WUA R203 Distribution of water in their area R204 Maintenance of canals R205 Construction of facilities in their area R206 Collection of water fees R207 Collection of other fees R208 Farmer cooperative - agronomic purposes R209 Technical advice to farmers R210 Who makes final distribution of water? R211 How many employees does an avg. WUA have? R212 avg # of farmers who must cooperate at lowest level R213 Typical annual budget of WUA, $ R214 Source of budget R215 % from government R216 % from water users R217 % from other R218 % of farmers in active WUAs that pay fees R219 Are there written rules? R220 Who enforces the rules if a farmer resists? R221 # of fines levied by typical active WUA in past year R222 Governing Board of WUA R223 Elected by all farmers (1 vote/farmer) R224 Elected by all farmers (wt. by farm size) R225 Appointed R226 Is a govt. employee on the Board? R227
R228
R229 Project Operation R230 Annual Operation Policies R231 Does the project make an annual estimate of total deliveries? R232 Is there a fixed adv. official schedule of deliveries for the year? R233 If yes, how well is it followed in the field (1=Xlnt, 10=horr)
Attachment A - Questionnaire Page 5

Page 217 of 276
Impact on Performance - Questionnaire Project:_____________________________ Date: _______________________________
R234 Does the project tell farmers what crops to plant? R235 If yes, how well is it followed (1=Xlnt, 10=horr.) R236 Does the project limit the planted acreage of various crops? R237 If yes, how well is it followed (1=Xlnt, 10=horr.) R238 Daily Operation Policies R239 How often are main supply discharges re-calculated, days? R240 How are main supply discharge changes computed? R241 Sums of farmer orders R242 Observation of general conditions R243 Std pre-determined schedule with slight modifications R244 Std pre-determined schedule with no modifications R245 What INSTRUCTIONS for field persons does the office give? R246 Main dam discharge flows R247 Predicted by computer program? R248 How well is this followed in the field (1=Xlnt, 10=horr)? R249 Cross regulator positions R250 Predicted by computer program? R251 How well is this followed in the field (1=Xlnt, 10=horr)? R252 Water levels in the canals R253 Predicted by computer program? R254 How well is this followed in the field (1=Xlnt, 10=horr)? R255 Flow rates at all offtakes? R256 Predicted by computer program? R257 How well is this followed in the field (1=Xlnt, 10=horr)? R258
R259 Main Canal R260 Control of Flows Into Main Canals R261 Type of flow control device R262 Type of flow measurement device R263 Probably accuracy of Q control/meas., +/-% R264
R265 Main Canal Characteristics R266 Total length of Main Canals, km R267 Length of longest main canal, km R268 Condition of canal lining (10=horrible;1=Xlnt) R269 Approximate canal invert slope R270 Do uncontrolled drain flows enter the canal? R271 % of cross section filled with silt R272 Total # of spill points for a typical canal R273 Water travel time (hours) from start to first deliveries R274 Water travel time for a change to reach end of canal (hrs) R275 Has seepage been measured well? R276 Have spills been measured well? R277 # of Regulating reservoirs in system R278 How effectively are they used for reg.? (10=horr; 1=Xlnt) R279 # of wells feeding into the canal
Attachment A - Questionnaire Page 6

Page 218 of 276
Impact on Performance - Questionnaire Project:_____________________________ Date: _______________________________
R280 How effectively are they used for reg.? (10=horr; 1=Xlnt) R281
R282 Lining type R283 Masonry, % R284 Concrete, % R285 Unlined, % R286 Rating of various items (10=horrible; 1=excellent) R287 Integrity of canal banks R288 Integrity of canal lining R289 General maintenance of structures R290 Seepage control R291 Weed control R292 Algae/moss control R293 Lack of canal breakage by customers R294
R295 Main Canal Cross-regulators R296 Condition of cross-regulators(10=horr.;1=Xlnt) R297 Type of cross regulator R298 Do operators live at each X-regulator site? R299 Can the ones that exist operate as needed? (10=horr; 1=Xlnt) R300 Are they operated as theor. intended?(10=horr; 1=Xlnt) R301 Number of cross regulators/km R302 Are there large overflows at cross regulator sides? R303 Unintended max. controlled w.s. variation in avg. gate in a day,m R304 In months w/ water, what is the max days of no gate change? R305 How long (max) does it take an operator to reach a regulator, hrs? R306 How frequently (hrs) will an operator move a gate if reqd/instr? R307 How frequently are gates typically operated? (days) R308 Officially, can gate oper make gate adj. w/o upper approval? R309 In reality, do gate oper. make adj. w/o upper approval? R310 If they do operate in reality, how well do they(10=H; 1=Xlt) R311 Hours necessary to make a significant setting change on the gate R312
R313 Main Canal X-Regulator Personnel R314 For whom do the operators work? R315 Typical education level of operator (yrs of school) R316 What is the option for firing an operator? R317 Incentives for exemplary work?(10=none/1=high) R318 Incentives for average work?(10=none/1=high) R319 Operators encouraged to think on their own?(10=No; 1-Definitely) R320 Is there a formal performance review process annually? R321 If so, is it written down & understood by employees? R322 # of persons fired in last 10 yrs for incompetence R323
R324 Main Canal Communications/Transportation R325 How often do operators communicate with next higher level? (hr)
Attachment A - Questionnaire Page 7

Page 219 of 276
Impact on Performance - Questionnaire Project:_____________________________ Date: _______________________________
R326 How is communication done? R327 What is the transportation of mobile personnel? R328 How many automatic remote monitoring sites are there?
R329
How often do X-reg. operators/bosses meet with rep. of d/s level? (days)
R330 How often does representative of u/s level visit? (days) R331 # of sides of canal with a road for trucks R332 # of sides of canal with a road suitable for motorcycles R333 What % of water season is the canal accessible by trucks? R334 Time needed for mgr. to travel down the longest canal, hrs
R335 Hours needed to reach the office of this stretch from office of supplier R336
R337 Main Canal Off-Takes R338 % of offtake flows taken from unofficial offtakes R339 Typical significant offtake flow rate, cms R340 Number of significant offtakes/km R341 Typ. chng. in w.s. elevation across off-take, m R342 Can they physically operate as needed? (10=horr; 1=Xlnt) R343 Are they phys. operated as theor. intended?(10=horr; 1=Xlnt) R344 How well can offtakes be supplied at low Q? (10=horr/1=Xlnt) R345 Who operate the offtakes? (1=this level;2=lower;3=both) R346 How frequently is the offtake checked? (hours) R347 Officially,how frequently should offtakes be adjusted (days) R348 Officially,can offtake oper. make Q adj. w/o upper approval? R349 In reality, do offtake oper. make Q adj. w/o upper approval? R350
R351 Scheduling of Flows From Main Canal Offtakes R352 What % of the time is the flow OFFICIALLY scheduled as follows: R353 Proportional flow R354 Rotation R355 Schedule computed by higher level - no lower level input R356 Schedule computed by higher level - some lower level input R357 Schedule by operator based on judgement of supply and d/s needs R358 Schedule actively matches real-time lower level requests R359 What % of the time is the flow ACTUALLY scheduled as follows: R360 Proportional flow R361 Rotation R362 Schedule computed by higher level - no lower level input R363 Schedule computed by higher level - some lower level input R364 Schedule by operator based on judgement of supply and d/s needs R365 Schedule actively matches real-time lower level requests R366
R367 Control of Flows From Main Canal Offtakes R368 Official type of flow control device R369 Common name
Attachment A - Questionnaire Page 8

Page 220 of 276
Impact on Performance - Questionnaire Project:_____________________________ Date: _______________________________
R370 Official type of flow measurement device R371 Common name? R372 Actual flow control/measurement R373 Probably accuracy of Q control/meas., +/-% R374
R375
R376 2nd Level Canals R377 2nd Level Canal Characteristics R378 Total length of 2nd Level Canals in project, km R379 Length of avg. 2nd level canal, km R380 Condition of canal lining (10=horrible;1=Xlnt) R381 Approximate canal invert slope R382 Do uncontrolled drain flows enter the canal? R383 % of cross section filled with silt R384 Total # of spill points for a typical canal R385 Water travel time (hours) from start to first deliveries R386 Water travel time for a change to reach end of canal (hrs) R387 Has seepage been measured well? R388 Have spills been measured well? R389 # of Regulating reservoirs in system R390 How effectively are they used for reg.? (10=horr; 1=Xlnt) R391 # of wells feeding into the canal R392 How effectively are they used for reg.? (10=horr; 1=Xlnt) R393
R394 Lining type R395 Masonry, % R396 Concrete, % R397 Unlined, % R398 Rating of various items (10=horrible; 1=excellent) R399 Integrity of canal banks R400 Integrity of canal lining R401 General maintenance of structures R402 Seepage control R403 Weed control R404 Algae/moss control R405 Lack of canal breakage by customers R406
R407 2nd Level Canal Cross-regulators R408 Condition of cross-regulators(10=horr.;1=Xlnt) R409 Type of cross regulator R410 Do operators live at each X-regulator site? R411 Can the ones that exist operate as needed? (10=horr; 1=Xlnt) R412 Are they operated as theor. intended?(10=horr; 1=Xlnt) R413 Number of cross regulators/km R414 Are there large overflows at cross regulator sides? R415 Unintended max. controlled w.s. variation in avg. gate in a day,m
Attachment A - Questionnaire Page 9

Page 221 of 276
Impact on Performance - Questionnaire Project:_____________________________ Date: _______________________________
R416 In months w/ water, what is the max days of no gate change? R417 How long (max) does it take an operator to reach a regulator, hrs? R418 How frequently (hrs) will an operator move a gate if reqd/instr? R419 How frequently are gates typically operated? (days) R420 Officially, can gate oper make gate adj. w/o upper approval? R421 In reality, do gate oper. make adj. w/o upper approval? R422 If they do operate in reality, how well do they(10=H; 1=Xlt) R423 Hours necessary to make a significant setting change on the gate R424
R425 2nd Level X-Regulator Personnel R426 For whom do the operators work? R427 Typical education level of operator (yrs of school) R428 What is the option for firing an operator? R429 Incentives for exemplary work?(10=none/1=high) R430 Incentives for average work?(10=none/1=high) R431 Operators encouraged to think on their own(10=No; 1-Definitely) R432 Is there a formal performance review process annually? R433 If so, is it written down & understood by employees? R434 # of persons fired in last 10 yrs for incompetence R435
R436 2nd Level Communications/Transportation
R437
How often do X-reg. operators communicate with next higher level? (hr)
R438 How is communication done? R439 What is the transportation of mobile personnel? R440 How many automatic remote monitoring sites are there?
R441
How often do X-reg. operators/bosses meet with rep. of d/s level? (days)
R442 How often does representative of u/s level visit? (days) R443 # of sides of canal with a road for trucks R444 # of sides of canal with a road suitable for motorcycles R445 What % of water season is the canal accessible by trucks? R446 Time needed for mgr. to travel down the longest canal, hrs
R447 Hours needed to reach the office of this stretch from office of supplier R448
R449 2nd Level Canal Off-Takes R450 % of offtake flows taken from unofficial offtakes R451 Typical significant offtake flow rate, cms R452 Number of significant offtakes/km R453 Typ. chng. in w.s. elevation across off-take, m R454 Can they physically operate as needed? (10=horr; 1=Xlnt) R455 Are they phys. operated as theor. intended?(10=horr; 1=Xlnt) R456 How well can offtakes be supplied at low Q? (10=horr/1=Xlnt) R457 Who operate the offtakes? (1=this level;2=lower;3=both) R458 How frequently is the offtake checked? (hours)
Attachment A - Questionnaire Page 10

Page 222 of 276
Impact on Performance - Questionnaire Project:_____________________________ Date: _______________________________
R459 Officially,how frequently should offtakes be adjusted (days) R460 Officially,can offtake oper. make Q adj. w/o upper approval? R461 In reality, do offtake oper. make Q adj. w/o upper approval? R462
R463 Scheduling of Flows From 2nd Level Canal Offtakes R464 What % of the time is the flow OFFICIALLY scheduled as follows: R465 Proportional flow R466 Rotation R467 Schedule computed by higher level - no lower level input R468 Schedule computed by higher level - some lower level input R469 Schedule by operator based on judgement of supply and d/s needs R470 Schedule actively matches real-time lower level requests R471 What % of the time is the flow ACTUALLY scheduled as follows: R472 Proportional flow R473 Rotation R474 Schedule computed by higher level - no lower level input R475 Schedule computed by higher level - some lower level input R476 Schedule by operator based on judgement of supply and d/s needs R477 Schedule actively matches real-time lower level requests R478
R479 Control of Flows From 2nd Level Canal Offtakes R480 Official type of flow control device R481 Common name R482 Official type of flow measurement device R483 Common name? R484 Actual flow control/measurement R485 Do the operators have an estimate of the flow rate thru offtake? R486 Probably accuracy of Q control/meas., +/-% R487
R488
R489 3rd Level Canals R490 3rd Level Canal Characteristics R491 Total length of all 3rd Level Canals, km R492 Length of avg. 3rd level canal, km R493 Condition of canal lining (10=horrible;1=Xlnt) R494 Approximate canal invert slope R495 Do uncontrolled drain flows enter the canal? R496 % of cross section filled with silt R497 Total # of spill points for a typical canal R498 Water travel time (hours) from start to first deliveries R499 Has seepage been measured well? R500 Have spills been measured well? R501 # of Regulating reservoirs in system R502 How effectively are they used for reg.? (10=horr; 1=Xlnt) R503 # of wells feeding into the canal R504 How effectively are they used for reg.? (10=horr; 1=Xlnt)
Attachment A - Questionnaire Page 11

Page 223 of 276
Impact on Performance - Questionnaire Project:_____________________________ Date: _______________________________
R505
R506 Lining type R507 Masonry, % R508 Concrete, % R509 Unlined, % R510 Rating of various items (10=horrible; 1=excellent) R511 Integrity of canal banks R512 Integrity of canal lining R513 General maintenance of structures R514 Seepage control R515 Weed control R516 Algae/moss control R517 Lack of canal breakage by customers R518
R519 3rd Level Canal Cross-regulators R520 Condition of cross-regulators(10=horr.;1=Xlnt) R521 Type of cross regulator R522 Do operators live at each X-regulator site? R523 Can the ones that exist operate as needed? (10=horr; 1=Xlnt) R524 Are they operated as theor. intended?(10=horr; 1=Xlnt) R525 Number of cross regulators/km R526 Are there large overflows at cross regulator sides? R527 Unintended max. controlled w.s. variation in avg. gate in a day,m R528 In months w/ water, what is the max days of no gate change? R529 How long does it take an operator to reach a regulator, hrs? R530 How frequently (hrs) will an operator move a gate if reqd/instr? R531 How frequently are gates typically operated? (days) R532 Officially, can gate oper make gate adj. w/o upper approval? R533 In reality, do gate oper. make adj. w/o upper approval? R534 If they do operate in reality, how well do they(10=H; 1=Xlt) R535 Hours necessary to make a significant setting change on the gate R536
R537 3rd Level X-Regulator Personnel R538 For whom do the operators work? R539 Typical education level of operator (yrs of school) R540 What is the option for firing an operator? R541 Incentives for exemplary work?(10=none/1=high) R542 Incentives for average work?(10=none/1=high) R543 Operators encouraged to think on their own(10=No; 1-Definitely) R544 Is there a formal performance review process annually? R545 If so, is it written down & understood by employees? R546 # of persons fired in last 10 yrs for incompetence R547
R548 3rd Level Canal Communications/Transportation R549 How often do operators communicate with next higher level? (hr) R550 How is communication done?
Attachment A - Questionnaire Page 12

Page 224 of 276
Impact on Performance - Questionnaire Project:_____________________________ Date: _______________________________
R551 What is the transportation of mobile personnel? R552 How many automatic remote monitoring sites are there?
R553
How often do X-reg. operators/bosses meet with rep. of d/s level? (days)
R554 How often does representative of u/s level visit? (days) R555 # of sides of canal with a road for trucks R556 # of sides of canal with a road suitable for motorcycles R557 What % of water season is the canal accessible by trucks? R558 Time needed for mgr. to travel down the longest canal, hrs
R559 Hours needed to reach the office of this stretch from office of supplier R560
R561 3rd Level Canal Off-Takes R562 % of offtake flows taken from unofficial offtakes R563 Typical significant offtake flow rate, cms R564 Number of significant offtakes/km R565 Typ. chng. in w.s. elevation across off-take, m R566 Can they physically operate as needed? (10=horr; 1=Xlnt) R567 Are they phys. operated as theor. intended?(10=horr; 1=Xlnt) R568 How well can offtakes be supplied at low Q? (10=horr/1=Xlnt) R569 Who operate the offtakes? (1=this level;2=lower;3=both) R570 How frequently is the offtake checked? (hours) R571 Officially,how frequently should offtakes be adjusted (days) R572 Officially,can offtake oper. make Q adj. w/o upper approval? R573 In reality, do offtake oper. make Q adj. w/o upper approval? R574
R575 Scheduling of Flows From 3rd Level Canal Offtakes R576 What % of the time is the flow OFFICIALLY scheduled as follows: R577 Proportional flow R578 Rotation R579 Schedule computed by higher level - no lower level input R580 Schedule computed by higher level - some lower level input R581 Schedule by operator based on judgement of supply and d/s needs R582 Schedule actively matches real-time lower level requests R583 What % of the time is the flow ACTUALLY scheduled as follows: R584 Proportional flow R585 Rotation R586 Schedule computed by higher level - no lower level input R587 Schedule computed by higher level - some lower level input R588 Schedule by operator based on judgement of supply and d/s needs R589 Schedule actively matches real-time lower level requests R590
R591 Control of Flows From 3rd Level Canal Offtakes R592 Official type of flow control device R593 Common name R594 Official type of flow measurement device
Attachment A - Questionnaire Page 13

Page 225 of 276
Impact on Performance - Questionnaire Project:_____________________________ Date: _______________________________
R595 Common name? R596 Actual flow control/measurement R597 Probably accuracy of Q control/meas., +/-% R598
R599
R600 Water Distribution to Individual Ownership units (e.g., field or farm) R601 What % of the distribution is done by R602 Employee of the project R603 Employee of the WUA R604 Volunteer of the WUA R605 No one - inter-farmer cooperation R606 If inter-farmer, # of farmers which must cooperate on final stage R607 What % of the distribution is done through R608 Small unlined distributary canals R609 Larger unlined canals R610 Field-through-field conveyance R611 Pipelines R612 Lined canals R613 General condition of final conveyance (10=horrible; 1=Xlnt) R614 Ability to measure flow rate to indiv field/farm (10=horr, 1=Xlnt) R615 Ability to measure volume to indiv. field/farm (10=horr, 1=Xlnt) R616
R617 FLEXIBILITY to final field/farm
R618 Are there written arrang/policies for FREQUENCY of water delivery? R619 How closely are they followed? (10=horr., 1=Xlnt) R620 Are actual practices better than official policies?(10-No;1-Yes) R621 Are there written arrang/policies for RATE of water delivery? R622 How closely are they followed? (10=horr., 1=Xlnt) R623 Are actual practices better than official policies?(10-No;1-Yes)
R624 Are there written arrang/policies for DURATION of water delivery? R625 How closely are they followed? (10=horr., 1=Xlnt) R626 Are actual practices better than official policies?(10-No;1-Yes) R627 What % of the time/farmers actually receive water as:? R628 Continuous flow - no adjustments R629 Continuous flow - some adjustments R630 Fixed rotation - well defined schedule that is followed R631 Fixed rotation - well defined schedule that is often not followed R632 Rotation - variable but known schedule R633 Rotation - variable and unknown schedule R634 Arranged R635 Advance days notice required if arranged R636
R637 EQUITY
Attachment A - Questionnaire Page 14

Page 226 of 276
Impact on Performance - Questionnaire Project:_____________________________ Date: _______________________________
R638 Is there an effective legal mechanism for indiv. farmers to get equity? R639
R640
R641 Point of Management Chng (where govt. in fact turns control over to users) R642 Physical desc. R643 Hectares d/s of that point (typical) R644 # of water users d/s of that point (typical) R645 # of fields downstream of that point (typical) R646
R647
R648 Pt of Differentiation (1)-Last pt Q can be EFFECTIVELY differed w/ time R649 Physical desc. R650 Hectares d/s of that point (typical) R651 # of water users d/s of that point (typical) R652 # of fields downstream of that point (typical) R653 Comment R654
R655
R656 Pt of Differentiation (2)-Last pt Q can be DELIBERATELY differed w/ time R657 Physical desc. R658 Hectares d/s of that point (typical) R659 # of water users d/s of that point (typical) R660 # of fields downstream of that point (typical) R661 Comment R662
R663
R664 Perceptions by Visiting Team R665 Sense of conflict between users (10=huge; 1=none) R666 Sense of conflict between users and govt (10=huge; 1=none)
R667 Sense of inequity of deliveries throughout project (10=huge;1=none)
R668 Ability to convert to modern on/farm irrig. systems (10=none; 1=easy) R669
R670
R671 VARIOUS RATIOS R672 **CI (confidence interval) is percent of reported value
R673 Hectares/Operator R674 CI, +/-% R675 Farmers/Operator R676 CI, +/-% R677 Hectares/Km dist. system R678 CI, +/-% R679 Cropping Intensity - wet season (5 yr. avg.) R680 CI, +/-%
Attachment A - Questionnaire Page 15

Page 227 of 276
Impact on Performance - Questionnaire Project:_____________________________ Date: _______________________________
R681 Cropping intensity - dry season (5 yr. avg.) R682 CI, +/-% R683 Cropping intensity - annual (5 yr. avg.) R684 CI, +/-% R685 Cropping intensity - annual (typical) R686 CI, +/-% R687 O&M Expenditures (inc. salaries)- $/ha R688 CI, +/-% R689 O&M Expenditures - $/mcm of beneficial use R690 CI, +/-% R691 Ratio of Rainfall/ETo - ***Dry season R692 CI, +/-% R693 Ratio of Rainfall/ETo - annual R694 CI, +/-% R695 Peak LPS/ha - (Gross max project LPS)/(actual service area) R696 CI, +/-%
R697 Peak LPS/ha - (Gross max project LPS)/(100% intensity service area) R698 CI, +/-%
R699
Water charge - $/ha (avg/yr per physical ha irrigated - assume 100% collected)
R700 CI, +/-%
R701 Water charge - $/mcm delivered to the farm - assume 100% collected) R702 CI, +/-% R703 Reservoir water storage/ service area (mm-ha/ha) R704 CI, +/-% R705 Number of Turnouts per (operator/ gate operator/ supervisor) R706 CI, +/-% R707 Irrigation Supply to Fields (cubic m/ha) R708 CI, +/-% R709 Output per cropped area (labor days/ha) R710 CI, +/-% R711 Output per unit command (labor days/ha) R712 CI, +/-%
VARIOUS COMPUTED VALUES Annual, mcm
Avg Vol. Discharged into canals
Wet Season, mcm Estimate of net groundwater Other Surface supplies Total Irrigation Water Supplied at the Head of Project (includes uncontrolled surface flows, surface diversions and net GW) Total Gross Rain
Attachment A - Questionnaire Page 16

Page 228 of 276
Impact on Performance - Questionnaire Project:_____________________________ Date: _______________________________
Effective Rain Leaching Requirement ETc (total) ETc of Irrigation Water
Dry Season, mcm Estimate of net groundwater Other Surface supplies Total Irrigation Water Supplied at the Head of Project (includes uncontrolled surface flows, surface diversions and net GW) Total Gross Rain Effective Rain Leaching Requirement ETc (total) ETc of Irrigation Water
EXTRAS Percent Main Canals Lined Percent Secondary Canals Lined Rice - Deep Percolation and Seepage Losses (annual) in mcm Number of farmers involved in the final stage of delivery Rice Yields (Main Season) mT/ha
IWMI and ITRC Indicators Total output, $
CI, +/-% IWMI1. Output per cropped area ($/ha)
CI, +/-% IWMI2. Output per unit command ($/ha)
CI, +/-% IWMI3. Output per unit irrig. supply ($/cu. m.)
CI, +/-% IWMI4. Output per water consumed ($/cu. m.)
CI, +/-% IWMI5. Relative water supply (RWS)
CI, +/-% IWMI6. Relative irrig. supply (RIS)
CI, +/-% IWMI7. Water delivery capacity (%)
CI, +/-% IWMI8. Gross return on investment (%)
CI, +/-, %
Attachment A - Questionnaire Page 17

Page 229 of 276
Impact on Performance - Questionnaire Project:_____________________________ Date: _______________________________
IWMI9REV. Percentage of O&M Collected (%)
CI, +/-% ITRC3. Water delivery capacity (%)
CI, +/-%
ITRC4. Dry Season RWSITRC
CI, +/-%
ITRC5. Wet Season RWSITRC
CI, +/-%
ITRC6. Annual RWSITRC
CI, +/-%
ITRC7. Dry Season RISITRC
CI, +/-%
ITRC8. Wet Season RISITRC
CI, +/-%
ITRC9. Annual RISITRC
CI, +/-% ITRC10. Annual Project Irrig. Efficiency
CI, +/-, %
Attachment A - Questionnaire Page 18

Page 230 of 276
Data Requested Prior to Visit
Project Overview
The Research Committee of the World Bank has authorized a research project through the International Program for Technology Research in Irrigation and Drainage (IPTRID) which will examine the performance of approximately 15 irrigation projects throughout the world. IIMI is also participating in this project. The outcomes of the project will be (i) a classification of projects with a common set of internal and external performance indicators, and (ii) an analysis of the common factors which affect the performance. The World Bank will use this information as guidance in determining what types of modernization projects to fund in the future.
The research project will examine some traditional information regarding commodity prices, yields, volumes of water available, field sizes, etc. Such information is necessary to compute various performance indicator values which have been proposed by IIMI, IPTRID, and others.
Of special importance, however, will be an analysis of the functionality and operation procedures of the canals, cross-regulators, and other water delivery control structures. In addition, the level of water delivery service provided by the main canal, the secondary canal, tertiary canals, etc. will be examined.
Planned Visit. During the visit to your project, a "rapid appraisal process" will be used. We hope to:
1. Visit the office to collect available data, and to learn about the project in general (.5 day)
2. Travel the complete length of the main canal, stopping at major structures to interview operators regarding their instructions, activity, data, etc. (1 day)
3. Travel the complete length of several secondary canals (.5 day). Again, stops will be made at major structures to interview operators.
4. Travel the complete length of several tertiary canals, etc. (.5 day) Again, stops will be made at major structures to interview operators.
5. Meet with 2-3 water user associations, or groups individual farmers (2-3 hours each) to determine what level of service they receive, and what factors influence their irrigation decisions (1 day).
In summary, it is hoped that the complete visit can be accomplished within a 3-4 day period of time. We would prefer to spend the majority of time in the field talking with actual operators and farmers, with only a minimum of time spent at the office. We have no interest in the dam design, but we are interested in the scheduling of water releases from the dam.
Attachment B – Data Requested Prior to Visit Page 1

Page 231 of 276
The following is a list of background information which we hope can provide us when we arrive. We understand that all projects will not have all of the information on the list, and we appreciate your help with organizing as much as this information as possible in advance of our visit.
Background Information Needed 1. Project maps, showing
a. Locations of canals down to the tertiary level, if possible. b. Locations of drains, including main and secondary.
2. Information on • Original design command area • Original design service area • Actual service area for the past 5 years • Total lengths of main, secondary, and tertiary canals • Total lengths of main and secondary drains • Total live storage and dead storage in the reservoir
3. Tables showing design and actual capacities of various canal sections, and downstream service area.
An example for a main canal may look like this:
Location Design capacity Actual capacity Ha. downstream 0.00-5.25 km 37.2 cms 35.3 cms 30,000 5.25-8.43 35.0 34.8 29,500 .....
4. Headworks operation (usable available storage and discharges) by day, for the last year (1996/97).
Headworks operation, by month, for the previous 4 years (93, 94, 95, 96)
An example of the daily table is:
Date Usable storage, million cu. m Discharge to canals, cms Jan 1, 1996 400.5 40.2 Jan 2, 1996 400.4 38.4 ...
5. Volumes of water delivered to the project for each month of the last 5 years Volumes of water, million cubic meters
Month Delivered to heads of canals Delivered from Dam Sept. 1993 --- --October 1993 --- --November 1993 --- --December 1993 --- --
Attachment B – Data Requested Prior to Visit Page 2

Page 232 of 276
6. Crop acreage and production figures for the past 5 years, for each section or subdistrict (not to exceed 20 such subsections) within the project. If information is not available by subsection/sector, a summary table for each year, for the whole project, is acceptable.
For each, year an example table for one subsection, for 1 year, is: Total yield Farm gate price Total value
Crop Total Hect. (metric tons) ($/ton) ($) Wet season rice 56,000 186,000 250. 46,500,000 Dry season rice 25,000 100,000 280. 28,000,000 Crop #3 Crop #4 etc.....
7. Operation and Maintenance (O&M) Budgets for the past 5 years. Two budgets are needed: a. For government expenses, and b. For Water User Association expenses (if applicable)
8. Other Budgets for the past 5 years. These may include special budgets for modernization or rehabilitation which are not included with the regular O&M budget from item (7) above. Two sets of this information are needed: a. For government expenses, and b. For Water User Association expenses (if applicable)
9. Description of staffing - Categories - Numbers of persons in each category - Salaries in each category
Two sets of this information are needed: a. For government expenses, and b. For Water User Association expenses (if applicable)
10. Data for a typical Farm Budget (production costs and incomes) This should include the value of crops which are produced for consumption by the
farmer.
11. List (and map, if available) of Water User Organizations, plus any information about their strength and activities.
Name No. of Users Age Hectares
12. List of private wells, and their capacities and volumes pumped/yr.
13. List of government wells for irrigation and their capacities and volumes pumped/yr.
Attachment B – Data Requested Prior to Visit Page 3

Page 233 of 276
14. Average salinity of the water into and out of the project,
Month EC in PPMin ECout(drains) PPMout Adj. RNa supply (in) Date .43 320 2.6 1432 4.2
15. General water requirements over the past 5 years. ETo is defined as "grass reference ET", from FAO bulletin #24. If some other reference ET or E value is known, it can be used instead.
Month ETo (mm) Jan 93 126 Feb 93 134
Total rainfall (mm) 32 65
.....
16. Plant and harvest dates of each of the major crops Crop Plant date Harvest date
17. Consumptive use of each crop (Evapotranspiration), mm/year or mm/harvest if there are two or more harvests.
18. Cropping intensity values for the past 5 years (both wet season and dry season)
19. Information on water user groups, including: a. strength, b. activities, c. sizes, d. copies of their regulations
20. Total cost of the project, excluding the costs of the storage dam and/or diversion dam, in $ of 1997.
Attachment B – Data Requested Prior to Visit Page 4

Page 234 of 276
CV
Questionnaire Data
Rio
Mayo
,M
exico
Cu
patitzio
,M
exico
Sald
aña,
Co
lom
bia
Co
ello,
Co
lom
bia
Rio
Yaq
ui
Alto
, DR
Office d
uN
iger, M
ali
Ben
i Am
ir,M
oro
cco
Kem
ub
u,
Malaysia
Mu
da,
Malaysia
Bh
akra, Ind
ia
Dan
tiwad
a,In
dia
Majalg
aon
,In
dia
Seyh
an,
Tu
rkey
Gu
ilan, Iran
Dez, Iran
Lam
Pao
,T
hailan
d
Averag
e
R4 R5 Crop intensity R6
R7 Avg. actual "typical year" equipped service area, ha 49,338 98,500 235,000 103,135 11,283 36,600 683,000 97,000 20,430 28,000 56,000 3,574 25,711 14,000 9,878 97,047 98,031 1.70
R8 R9
R10 Avg. actual last 5 yrs wet season crop intensity 0.84 0.60 n/a n/a 0.14 0.00 0.90 0.98 0.82 0.89 1.00 unknown 0.75 0.80 0.90 0.72 0.45
R11 "Typical year" wet season crop intensity 0.99 0.60 n/a n/a 0.14 0.00 0.90 0.98 0.82 0.89 1.00 1.00 0.75 0.80 0.34 0.90 0.72 0.46
R12
R13 Avg. actual last 5 yrs dry season crop intensity 0.32 0.40 1.00 0.84 0.16 0.74 0.97 1.00 0.64 0.52 0.22 unknown 0.68 0.80 0.24 0.61 0.49
R14 "Typical year" dry season crop intensity 0.40 0.40 1.00 0.89 0.16 1.11 0.97 1.00 0.64 0.52 0.22 0.57 0.68 0.80 0.55 0.24 0.63 0.48
R15 Avg. actual last 5 yrs crop intensity 1.16 1.00 1.00 0.84 0.30 0.74 1.87 1.98 1.46 1.25 1.22 unknown 1.40 1.60 1.14 1.21 0.37
R16 "Typical year" avg. crop intensity, % 1.39 1.00 1.00 0.89 0.30 1.11 1.87 1.98 1.46 1.25 1.22 1.15 1.40 1.60 0.72 1.14 1.22 0.34
R17 R18 R19 General Project Conditions R20 Average net farm size (ha) 2.2 5.6 1.2 5.6 0.6 1.4 3.2 2.0 0.7 3 3 2.5 100 100 8.15 100 21.2 1.85 R21 Number of water users 22,426 17,576 204,348 21,313 22,500 33,000 400,000 63,000 30,000 8500 20000 2015 1441 1308 1212 11717 53,772 1.94 R22 Typical field size, ha 0.35 5.00 0.30 3.40 0.30 0.50 0.50 1.0 0.5 0.5 3 2.5 12 5 9.5 12 3.5 1.18
R23 Soil type Sandy loam Light to Heavy Sandy Cl. to
Silts Light to Heavy Light to Heavy Sandy loam Light to Heavy Heavy Heavy Loam
40% clay; 10%sand;
50% loam. All with heavy clay subsoil Loam
23%clay, 74% loam; 3% sand Sandy clay loam
loam, clay loam Loam
R24 Average soil fertility low Low to Medium medium-high Medium
Low to Medium
Low to Medium Low good good avg. medium High low-medium good medium Medium
R25 Average % soil organic matter 4.0 10.0 unknown unknown 7.0 0.61 R26 Avg. Water EC, dS/m 0.1 0.4 1.2 0.4 0.5 2 0.1 0.32 0.3 0.4 0.25 0.41 0.5 1.02 R27 Avg. Water SAR 0.6 1.0 unknown 0.6 1.23 0.9 0.36 R28 Avg. Water Adj. Rna 0.5 unknown unknown 0.5
R29 Land consolidation on what % of area (or geometric fields) 0.0 30.0 0.0 100.0 0.0 0.0 0.0 100.0 0.0 100 75 0 0 0 0 0 25.3 1.65
R30 Canal water supplies what % of drinking water? 0.0 0.0 5.0 0.0 0.5 0.0 0.1 0.0 0.0 0 10 10 85 5 0 10 7.9 2.67
R31 Ownership of land, % of total R32 owned and operated by farmers 95.0 40.0 90.0 75.0 95.0 90.0 80.0 50.0 80.0 95 92 90 100 100 99 50 82.6 0.23
R33 farmed by tenants on private
ground 5.0 10.0 10.0 25.0 5.0 10.0 20.0 50.0 20.0 10 1 50 18.0 0.92
R34 owned by government or
cooperative 0.0 50.0 0.0 0.0 0.0 0.0 0.0 0.0 0.0 5 8 0 0 0 4.5 2.96 R35 percent rented land 0.0 0.0 0.0 0.0 0.0 0.0 0.0 0.0 0.0 10 0 10 85 80 1 50 14.8 1.98
R36 Silt level in canals (10=high; 1=low) 3.0 2.0 9.0 2.0 1.0 10.0 3.0 5.0 4.0 6 1 3 7 10 2 2 4.4 0.71
R37 Source of silt drains into
canals from water
source drains into
canals from water
source from water
source Banks from water
source from water
source from water
source river Niger river;
banks river river
diversion river
side inflows, canal bank sloughing
when passing through cuts
River, sides, inflow
R38 R39 % of land with sprinklers 0.0 0.5 0.0 10.0 0.0 0.0 2.0 0.0 0.0 0 0 1 0 0 0.5 0.5 1 2.74 R40 % of land with drip 0.0 0.0 0.0 5.0 0.0 0.0 0.0 0.0 0.0 0 0 0 0 0 0.5 0.5 0 3.32 R41 % of land with surface irrigation 100.0 99.0 100.0 85.0 100.0 100.0 98.0 100.0 100.0 100 100 99 100 100 99 99 99 0.04 R42 R43 Farm Economics
R44 Cost of land close to head of canals, $/ha 17,500 13,333 17,000 2,500 4,166 9,700 8,333 12,500 10,000 12000
n/a - no land available 8200 8000 6000 4490 1920 9,043 0.53
R45 Cost of Tailender land, $/ha 12,500 10,667 10,000 2,500 2,778 8,700 5,555 8,750 7,000 10000 n/a 8200 7000 6000 4490 1920 7,071 0.45
Average ANNUAL Farm economics R46 (Typical, ave. intensity)
R47 Gross income per farm unit, 1996
US $/year 1,490 3,115 2,163 7,500 700 764 2,900 2,500 2,000 2416 1400 1100 60000 179500 2200 40000 19,359 2.37
R48 Farm labor cost ($/day - 1997 costs) $6.00 $3.33 $15.00 $10.00 $1.50 $1.00 $2.00 $15.00 $15.00 3 2 6.5 8 10 6.4 4 6.8 0.73
Attachment C - Data for all Projects Page 1

Page 235 of 276
CV
Questionnaire Data
Rio
Mayo
,M
exico
Cu
patitzio
,M
exico
Sald
aña,
Co
lom
bia
Co
ello,
Co
lom
bia
Rio
Yaq
ui
Alto
, DR
Office d
uN
iger, M
ali
Ben
i Am
ir,M
oro
cco
Kem
ub
u,
Malaysia
Mu
da,
Malaysia
Bh
akra, Ind
ia
Dan
tiwad
a,In
dia
Majalg
aon
,In
dia
Seyh
an,
Tu
rkey
Gu
ilan, Iran
Dez, Iran
Lam
Pao
,T
hailan
d
Averag
e
R4 R49 R50 R51 Drainage R52 Water table depth R53 % area w/ depth <1m 100 0 100 20 0 0 0 100 100 100 10 15 25 5 6 38.7 1.17 R54 % area w/ 2m>depth>1m 0 5 0 20 0 50 10 0 0 20 40 30 25 10 50 17.3 1.05 R55 % area w/ depth > 2 m 0 95 0 60 100 50 90 0 0 80 50 35 50 85 44 49.3 0.74
R56 % of fields with individual tiles or open drains 0 15 0 80 0 0 0 0 0 100 100 5 0.5 5 5 1 19.5 1.91
R57 Km. of main drainage canals 174 200 1,200 340 80 0 160 240 124 100 50 25 0 0 0 220 182.1 1.59 R58 Km of secondary drainage canals 74 450 0 1,630 250 0 50 1,400 295 500 2800 35 0 0 12 606 506.4 1.56
OK on main;
R59 General condition of project drains Poor Good Good Good average N/A okay fair fair good
poor on tertiary &
secondary. 5 yr maint. on
2ndary; none on 3rd. avg. n/a n/a poor medium
R60 R61 R62 Crops
R63 Major crop Wet Season
Rice Wheat Rice Maize Rabi-
Sorghum Wheat Kharif- Rice Wet Season-
Rice Wet Season-
Rice wheat Rice Pasture rice Rice Grain
sorghum Wheat R64 Ha of major crop, avg. 49,359 58,000 240,000 45,755 1,600 10,243 445,000 95,100.0 16,676.0 12000 52400 1027 15600 21940 5146 49155 69,938 1.65 R65 % of service area for major crop 99 60 100 44 40 23 35 50 53 42.85714286 93.57142857 29 61 100 45 51 57.9 0.45
unknown; not
R66 Typical yield, mT/ha 3.10 1.80 4.17 8.80 1.10 3.70 3.00 3.8 4.2 4.6 5.3 harvested 6.5 6.3 4.5 4.9 4.4 0.43
R67 Farm-gate selling price ($/mT) 150 130 460 200 195 139 155 300.0 300.0 308.6956522 230 not
harvested 300 285 96 192 229.4 0.42
R68 Second major crop Dry Season
Rice Sugar Cane n/a Cotton Kharif-Cotton Mustard Kharif-Cotton Dry Season-
Rice Dry Season-
Rice Sugar beets Vegetables Tobacco Sorghum Pasture Lemon Corn R69 Ha of second crop, avg. 16,780 8,000 n/a 27,336 1,440 19,135 95,000 96,700 14,883 5000 6000 904 16000 200 767 23252 22,093 1.41
R70 % of service area for 2nd major crop 34 8 n/a 27 36 42 7 50 47 17.85714286 10.71428571 25 63 1.215509906 8 24 26.7 0.69
R71 Typical yield, mT/ha 2.6 80 n/a 4 0.90 1.70 0.30 4.5 4.2 48.9 unknown 2.2 3.5 unknown 11 5 13.0 1.84 R72 Farm-gate selling price ($/mT) 150.0 400.0 n/a 640.0 550.0 305.0 400.0 300.0 300.0 43.8 unknown 3930.0 200.0 unknown 196.0 154.0 582.2 1.8
R73 Third major crop Peanut Vegetables n/a Citrus Sugarcane Bajara Rabi-Wheat 0.0 0.0 Cotton Sugar cane corn Cotton misc. "secano"
crops Mango Vegetables
R74 Ha of third major crop, avg. 1,435 15,000 n/a 10,763 300 11,631 605,000 0.0 0.0 5000 5000 312 7462 unclear, but
small 343 6000 47,732 3.36
R75 % of service area for 3rd major crop 3.0 27.0 n/a 10.0 8.0 26.0 47.0 0.0 0.0 17.9 8.9 9.0 30.0 n/a 3.5 6.2 14.0 1.0 R76 Typical yield, mT/ha 1.6 15 n/a 38 76.00 2.30 4.00 0.0 0.0 2.8 unknown 2 2.15 n/a 6.5 16.4 12.8 1.69 R77 Farm-gate selling price ($/mT) 292.0 130.0 n/a 350.8 20.0 110.0 135.0 0.0 0.0 783.2 unknown 236.0 860.0 n/a 286.0 143.0 257.4 1.1
Fish Farms/Toba see crop cost
R78 Typical "extra" production fish ponds crops fish ponds Other Crops Other crops Other Crops n/a 0.0 cco sheet almost none minimal n/a n/a 0 0
R79 Est. total sales of the "extra" production in the project, $ 0 7000000 unknown 48000000 120000 6000000 10000000 0 10000000 28986800 almost none n/a n/a n/a 0 0 10009709 1.52
R80 0 0 0 0 0.00 0.00 0.00 0.0 0.0
R81 What is the ratio of yield (head/tail) during wet season? 1.0 n/a n/a n/a 1.0 1.0 1.0 1.0 1.0 1.1 1 1 1 1 1 1 1.0 0.03
R82 What is the ratio of yield (head/tail) during dry season? 1.3 1.2 1.0 1.0 1.0 1.0 2.0 1.1 1.0 1.2 1 1 1 1 1 1 1.1 0.23
R83 R84 R85 Water Supply
diversion dam Run of the and 4000 river
R86 Water source Reservoir Reservoir Reservoir Reservoir Reservoir Reservoir Reservoir Reservoir River private wells Niger river Reservoir diversion River Reservoir Res. & Wells
R87 Live Storage Capacity of Reservoir, million cu. m 1,442.0 3,395.0 1,800.0 600.0 334.0 398.2 7,191.0 1,209.0 n/a n/a n/a 31.0 n/a n/a 450.0 1,330.0 1,653 1.25
R88 Actual Max. Storage Capacity Used from Reservoir 1,016.0 3,315.0 1,800.0 649.0 250.0 437.0 n/d 1,100.0 n/a n/a n/a 27.0 n/a n/a 300.0 820.0 971 1.00
R89 Avg Vol. Discharged into canals in last 5 years (mcm) 755.0 3,166.0 2,056.0 1,161.0 54.9 432.0 4,104.0 978.0 338.0 211.3 2,653.2 115.0 438.0 817.1 180.0 920.0 1,149 1.05
Attachment C - Data for all Projects Page 2

Page 236 of 276
CV
Questionnaire Data
Rio
Mayo
,M
exico
Cu
patitzio
,M
exico
Sald
aña,
Co
lom
bia
Co
ello,
Co
lom
bia
Rio
Yaq
ui
Alto
, DR
Office d
uN
iger, M
ali
Ben
i Am
ir,M
oro
cco
Kem
ub
u,
Malaysia
Mu
da,
Malaysia
Bh
akra, Ind
ia
Dan
tiwad
a,In
dia
Majalg
aon
,In
dia
Seyh
an,
Tu
rkey
Gu
ilan, Iran
Dez, Iran
Lam
Pao
,T
hailan
d
Averag
e
R4
R90 Avg. Vol. Discharged into canals in last 5 yrs (mm) 1,530.3 3,176.9 874.9 1,127.6 966.1 1,053.0 679.8 1,008.2 1,654.4 754.8 4,737.9 3,217.7 1,700.0 5,836.2 1,822.2 951.9 1,943 0.78
R91 Min. Volume Released into canals in last 5 years (mcm) 518.0 3,114.2 1,757.0 1,020.0 84.5 59.0 n/d 577.0 n/a 177.0 2,387.9 103.5 388.0 795.5 73.0 783.0 845.5 1.12
R92 Times/year majority of system is shut down 2.0 0.0 1.0 1.0 10.0 1.0 1.0 2.0 2.0 1.0 0.5 0.0 4.0 1.0 1.0 0.0 1.7 1.41
R93 Typical total annual duration of shutdown, days 90.0 n/a 180.0 100.0 15.0 180.0 15.0 10.0 20.0 60.0 5.0 0.0 6.0 3.0 10.0 0.0 46.3 1.36
R94 R95 Annual rainfall, mm 1,336.0 250.0 1,290.0 721.0 774.0 604.0 545.0 2,300.0 2,700.0 376.0 238.2 984.0 1,306.0 1,442.4 671.0 323.0 991.3 0.72
R96 Peak actual flow rate from source, cu meters/sec. 48.6 194.0 238.0 175.0 10.0 35.4 147.0 120.0 31.0 14.0 128.0 4.8 21.6 29.0 11.5 66.0 79.6 0.95
R97 Has conveyance efficiency been effectively measured? N N N N N N N N N N N N
Sort of seepage on
the main canal; also
some discharges to the river Sort of N N
R98 If Yes, what is % annual spill n/a n/a n/a n/a n/a n/a n/a n/a n/a n/a n/a n/a n/a ? 4.0 4.0 R99 If Yes, what is % annual seepage n/a n/a n/a n/a n/a n/a n/a n/a n/a n/a n/a n/a n/a ?
R100 What is the measured conveyance
efficiency, % n/a n/a n/a n/a n/a n/a n/a n/a n/a n/a n/a unknown 69.0 45.3 65.0 59.8 0.21
R101 What conveyance efficiency is used
in these calculations, % 65.0 90.0 65.0 85.0 85.0 85.0 0.8 0.8 0.7 80.0 60.0 65.0 69.0 45.3 70.0 65.0 58.2 0.53
R102 Has proj. farm irrig. effic. been effectively measured? N N N N N N N N N N Parts of it N N N N N
R103 If Yes, what is % annual non-ben.
deep perc. n/a n/a 30.0 n/a n/a n/a n/a n/a n/a n/a 3.0 n/a n/a 16.5 1.16
R104 If Yes, what is % annual non-benef.
evap n/a n/a 10.0 n/a n/a n/a n/a n/a n/a n/a unknown n/a n/a 10.0 R105 If Yes, what is % annual tailwater. n/a n/a unknown n/a n/a n/a n/a n/a n/a n/a unknown 10.0 n/a 10.0 R106 R107 R108 Water Usage R109 Annual avg. ETo, mm 1,695.0 1,670.0 771.0 1,285.0 2,055.0 1,893.0 1,550.0 1,420.0 1,400.0 1,326.0 2,628.0 1,945.0 1,675.5 1,532.0 2,280.0 2,350.0 1,717 0.27
R110 Coefficient of variation (C.V.) of annual rainfall (yr-yr) 0.2 0.4 0.2 0.3 0.2 0.4 0.5 0.1 n/a 0.3 0.3 0.2 0.2 0.2 0.3 0.3 0.3 0.41
R111 Avg. annual ETc, incl. evap prior to planting (mcm, not mm) 662.0 768.0 1,771.9 766.3 64.0 286.0 5,041.0 1,530.0 213.0 0.0 1,087.7 52.4 180.8 158.6 52.5 590.0 826.5 1.51
R112 Peak monthly ETo, mm (avg. year) 175.0 243.0 198.0 177.0 281.0 259.0 163.0 136.0 134.0 198.4 295.0 197.0 192.1 158.0 310.0 253.6 210.6 0.27
R113 Peak monthly ETo, equivalent cms 33.3 95.8 179.5 70.4 13.5 36.6 472.0 83.0 22.1 20.7 385.5 2.6 18.4 9.7 10.3 48.7 93.9 1.48 R114 Month of peak monthly ETo value April July July July May May August Mar May July March July Sept. July May 95.0 95.0
R115 Peak monthly net farm need (ETc -Eff Rain + SMD), equivalent CMS 33.0 95.8 134.2 68.8 13.5 35.0 471.7 82.7 22.1 12.0 360.7 1.7 14.7 9.3 3.3 48.7 87.9 1.54
R116 Month of peak farm need June July July July May Mar August Mar Apr July May March December July May March-April R117 R118 R119 Project Budget
R120 Annual Budget (avg. last 5 years) excl. WUA
R121 Salaries, $ 1,576,330 2,666,667 996,000 3,164,800 59,000 713,000 6,200,000 5,700,000 2,100,000 2,348,000 64,135 944,000 215,824 1,100,000 1,989,125 0.97
R122 Improvement of structures, (excl.
salaries), $ 991,200 18,000 662,000 250,000 5,000 619,500 1,000,000 2,000,000 800,000 945,000 17,000,000 0 24,000 150,000 5,436,000 1,079,000 1,936,231 2.18
R123 Maintenance, Other Operation
(excl. salaries), $ 1,339,000 1,066,667 77,000 4,508,000 42,500 164,800 3,000,000 2,000,000 3,100,000 2,052,000 5,146,000 105,000 2,500,000 1,181,000 196,768 2,146,000 1,789,046 0.89
R124 Farmer extension (excl. salaries), $ 9,000 0 0 0 0 0 0 2,000,000 300,000 100,000 0 50,000 0 10,000 50,000 167,933 3.05 R125
R126 Source of Budget (avg. last 5 years), %
R127 Country Govt. 95 10 0 0 100 95 99 82 100 19 3 100 6 18 97 20 52.7 0.86 R128 Foreign 5 0 0 0 0 0 0 0 0 28 77 0 0 0 29 9.3 2.28 R129 WUA or Farmer fees 0 90 100 100 1 5 1 18 0 53 20 0 94 82 3 51 38.6 1.08 R130 R131 Employees
R132 Total number of permanent
employees 389 669 332 289 200 550 4900 1400 660 344 372 30 108 92 52 101 655.5 1.80 R133 Professional employees 20 30 25 38 10 7 100 900 25 30 52 5 5 5 15 12 79.9 2.75
Attachment C - Data for all Projects Page 3

Page 237 of 276
CV
Questionnaire Data
Rio
Mayo
,M
exico
Cu
patitzio
,M
exico
Sald
aña,
Co
lom
bia
Co
ello,
Co
lom
bia
Rio
Yaq
ui
Alto
, DR
Office d
uN
iger, M
ali
Ben
i Am
ir,M
oro
cco
Kem
ub
u,
Malaysia
Mu
da,
Malaysia
Bh
akra, Ind
ia
Dan
tiwad
a,In
dia
Majalg
aon
,In
dia
Seyh
an,
Tu
rkey
Gu
ilan, Iran
Dez, Iran
Lam
Pao
,T
hailan
d
Averag
e
R4 R134 Canal, gate operators, supervisors 230 170 380 491 100 295 1400 400 100 105 54 6 11 16 13 37 238.0 1.46
R135 Other non-professional employees
(maint., sect., etc.) 139 597 103 200 45 248 3400 100 535 75 274 19 92 71 24 52 373.4 2.21
R136 Avg. years of professional
personnel on the project 7 10 10 7 4 5 3 15 8 12 15 8 20 4 20 15 10.2 0.54 R137 R138 Salaries R139 Professional, senior admin, $/mo 1,200 1,000 1,400 1,500 150 450 350 1,850 1,850 1,500 690 1,100 2,400 2,200 1,025 1,410 1,254.7 0.51 R140 House also provided? Y Y Y Y Y N Y Y N Y N N N N N N R141 Professional, engineer $/mo 400 500 466 600 100 280 275 860 1,000 800 207 500 1,570 976 769 900 637.7 0.59 R142 House also provided? Y Y N Y Y N Y Y N Y Y N N N N N R143 Non-prof. - canal operators, $/mo 280 389 267 310 35 150 130 300 300 250 95 100 410 297 256 615 261.5 0.55 R144 House also provided? Y Y N N N Y N Y N Y N Y N N N N R145 Non-prof - laborers, $/mo 160 133 100 100 25 130 95 170 150 250 45 100 230 220 256 210 148.4 0.47 R146 House also provided? N Y N N N Y N Y N N N N N N N N R147 Project Costs
R148 Total Construction cost, excluding
diversion and dam 80781360 269708911 9100000 2134375000 291000000 23387000 33000000 25640000 191400000 339821363 2.01 R149 Year for $US above 1987 1996 1970 1996 1996 1973 1977 1996 1996 R150 1996 US$ 136035810 269708911 246605000 206270000 27000000 2134375000 291000000 82639576 150000000 85000000 106988817 25640000 191400000 304051009 1.83 R151 R152 Water Charges R153 How are water charges collected?
R154 None collected, and none are
assessed Y N N N N N N N Y
R155 None collected, although policy
says charges are to be collected N N N N N N N N N R156 They are collected N Y Y Y Y Y Y Y N Y Y Y Y Y Y Y
R157 What % of water charges are recovered/collected? 0% 100% 85% 95% 50% 90% 50% 50% 0% 100% 92% 75% 100% 100% 90% 95% 0.7 0.46 From what group are water charges
R158 collected?
R159 From individual users by the
government n/a Y Y n/a Y 1.0 Y Y n/a Y Y
R160 From individual users by a WUA,
and then to govt. n/a 0.0 n/a n/a 0.0 >1% 0.0 0.0 n/a Y Y Y Y R161 Other n/a 0.0 n/a Y 0.0 0.0 0.0 0.0 n/a Y R162 Basic of charge and amount R163 If by ha, $/ha/yr n/a 25.0 19.0 19.0 n/a 0.0 n/a 11.0 n/a 77.8 34.0 19.0 130.0 37.2 1.10
R164 If by crop, max $/crop/yr (not
season) n/a n/a n/a 45.0 15.0 3.0 2.5 n/a n/a 23.0 78.0 136.0 43.2 1.13
R165 If by crop, max $/crop/yr (not
season) n/a n/a n/a 90.0 58.0 23.0 3.0 n/a n/a 46.0 44.0 0.76 R166 If per irrigation, $/irrigation n/a n/a n/a n/a n/a 0.0 n/a n/a n/a 0.0 R167 If volumetric, $/cubic meter n/a 0.0 n/a n/a n/a 0.0 n/a n/a n/a 0.0 3.9 0.0 0.8 2.22
R168 Is there a special charge for private well usage? (Y/N) n/a N Y N Y N Y N n/a N
No - there are none n/a N N/a n/a N
R169 If so, what is charge ($) n/a - 6.0 ? 1/2 of Crop
Charge 0.0 1/2 of Crop
Charge n/a n/a n/a n/a 3.0 1.41 R170 per (unit) n/a - ha ha - 0.0 - n/a n/a n/a n/a 0.0
R171 If so, what % of these charges are
collected? n/a - 80-90 ? 50.0 0.0 50.0 n/a n/a n/a n/a 33.3 0.87
R172 Estimated total water charges collected on the project, $/yr 0 3333333 3000000 4508000 69500 94000 3000000 1000000 0 2870000 4117000 71900 1942000 2100000 63750 3361538 1845689 1
R173 Destination of water charges R174 % that stay with the WUA 0 0 0 100 0 0 0 0 0 100 100 100 70 50 37 1.25
R175 % that stay in the central project
office 0 100 95 0 100 100 100 100 0 100 100 0 0 0 30 40 54 0.89
R176 % that go to the state or central
govt. 0 0 5 0 0 0 0 0 0 0 0 0 0 10 1 2.70 In-kind services provided by water
R177 users above point of ownership
R178 Labor Y N N N N N N N N Y Y Y N N
farmers clean the sides of canals and
canal itself in front of their
property N R179 Crop N N N N N N N N N N N N N N N N
Attachment C - Data for all Projects Page 4

Page 238 of 276
CV
Questionnaire Data
Rio
Mayo
,M
exico
Cu
patitzio
,M
exico
Sald
aña,
Co
lom
bia
Co
ello,
Co
lom
bia
Rio
Yaq
ui
Alto
, DR
Office d
uN
iger, M
ali
Ben
i Am
ir,M
oro
cco
Kem
ub
u,
Malaysia
Mu
da,
Malaysia
Bh
akra, Ind
ia
Dan
tiwad
a,In
dia
Majalg
aon
,In
dia
Seyh
an,
Tu
rkey
Gu
ilan, Iran
Dez, Iran
Lam
Pao
,T
hailan
d
Averag
e
R4 R180 Construction materials N N N N N N N N N N N Y N N N N R181 Other N N N N N N N N N N N N N N N N
R182 Frequency of in-kind services
(month) 6.0 n/a n/a n/a n/a n/a n/a n/a n/a daily 12 6 N N 12 n/a 9.0 0.38
R183 What % of farmers participate in
these 60.0 n/a n/a n/a n/a n/a n/a n/a n/a 100 80 80 n/a n/a 50 n/a 74.0 0.26 R184 R185 R186 Ownership
Country Guilan (Office du INAT
R187 Main canals Fed. Govt. Company Authority DSI Irr. Dept. WRD Irr. Dept. MADA KADA Govt Niger) Federal federal INAT (federal) Fed. govt Fed Country
Guilan (Office du INAT R188 Secondary canals Fed. Govt. Company Authority DSI Irr. Dept. WRD Irr. Dept. MADA KADA Govt Niger) Federal federal INAT (federal) Fed govt Fed
Country Guilan (Office du INAT
R189 3rd Level n/a n/a Authority n/a n/a n/a Irr. Dept. MADA n/a Govt Niger) Federal federal INAT (federal) Fed govt Fed Country
MADA/ (Office du R190 Distributaries to individual fields Farmers Company Farmers Farmers Irr. Dept. Farmers Irr. Dept. Farmers Farmers Govt Niger) Farmer farmer INAT (federal) farmers Farmers
Country (Office du INAT
R191 Water Fed. Govt. Company Fed. Govt. DSI Irr. Dept. WRD Irr. Dept. MADA KADA Govt Niger) Federal federal Federal Fed Govt. Fed R192 R193 R194 WUAs R195 % of project area on which formed 43.0% 0.0% 60.0% 100.0% 1.0% 0.5% 1.0% 20.0% 15.0% 0.0% 75.0% 100.0% 100.0% 100.0% 100.0% 100.0% 0.5 0.88
R196 % of project area remaining on books 43.0% n/a 0.0% 100.0% - 0.0% - 20.0% 15.0% 100.0% 0.0% 0.0% 100.0% 0.0% 0.0% 100.0% 0.4 1.24
R197 % of these with activities and improvements 28.0% n/a 60.0% 100.0% 1.0% 0.0% 1.0% 20.0% 15.0% n/a 100.0% 100.0% 100.0% 0.0% 100.0% 100.0% 0.5 0.89
R198 % of total area with active WUA 12.0% n/a 60.0% 100.0% 1.0% 0.5% 1.0% 20.0% 15.0% n/a 75.0% 100.0% 100.0% 100.0% 100.0% 100.0% 0.6 0.80 R199 Typical size, ha 660.0 n/a 50.0 7,100.0 300.0 182.0 200.0 40.0 20.0 n/a 10000 3574 25700 14000 9878 6060 5,554.6 1.34 R200 Typical age, years 3.0 n/a old 3.0 3.0 1.0 5.0 5.0 1.0 n/a 10 10 20 21 4 7 7.2 0.92 R201 Ave. number of users 300.0 n/a 43.5 1,184.0 50.0 143.0 50.0 20.0 20.0 n/a 3300 2015 1411 400 1212 732 777.2 1.24 R202 Functions of the WUA R203 Distribution of water in their area Y n/a Y Y Y Y N N N n/a Y Y Y Y Y R204 Maintenance of canals Y n/a Y Y Y Y Y Y Y n/a Y Y Y Y Y Y
R205 Construction of facilities in their
area N n/a N N N N N N N n/a Y some Y N Y R206 Collection of water fees N n/a N Y Y Y N N N n/a Y Y Y Y Y
R207 Collection of other fees Y n/a N Y N N N N N n/a Y-for land grading N N Y
R208 Farmer cooperative - agronomic
purposes Y n/a N N N N N Y Y n/a Y Y N N N R209 Technical advice to farmers N n/a N N Y N N N N n/a Y Some N Y
R210 Who makes final distribution of water? Farmer Farmer Farmer Farmer Farmer Farmer Farmer Farmer Farmer n/a farmers farmers
WUA/farmer - depending
on the turnout location WUA farmers WUA
R211 How many employees does an avg. WUA have? 0 n/a 1 25 1 1 0 0 0 n/a 0 13 108 92 19 7 19.1 1.85
R212 avg # of farmers who must cooperate at lowest level 20 10 20 10 15 5 50 20 20 n/a 7 10 1.4 1.5 4 4 13.2 0.93
R213 Typical annual budget of WUA, $ 1,500 n/a 1,000 250,000 2,000 ? 100 n/a 0 n/a 0 202,700 2,470,000 2,100,000 75,000 105,000 433,942 2.01 R214 Source of budget R215 % from government 80.0 - 0.0 10.0 50.0 50.0 50.0 n/a n/a n/a n/a 65.0 6.0 15.0 0.0 32.6 0.9 R216 % from water users 20.0 - 100.0 90.0 50.0 50.0 50.0 n/a n/a n/a n/a 35.0 100.0 100.0 85.0 100.0 70.9 0.4 R217 % from other 0.0 - 0.0 0.0 0.0 0.0 0.0 n/a n/a n/a n/a 0.0 0.0 0.0 0.0
R218 % of farmers in active WUAs that pay fees 70.0 - 100.0 100.0 50.0 100.0 50.0 100.0 100.0 n/a 97.0 75.0 100.0 100.0 90.0 95.0 87.6 0.2
R219 Are there written rules? Y - N 0.0 N Y N N N n/a Y Y Y Y N Y 0.0
Attachment C - Data for all Projects Page 5

Page 239 of 276
CV
Questionnaire Data
Rio
Mayo
,M
exico
Cu
patitzio
,M
exico
Sald
aña,
Co
lom
bia
Co
ello,
Co
lom
bia
Rio
Yaq
ui
Alto
, DR
Office d
uN
iger, M
ali
Ben
i Am
ir,M
oro
cco
Kem
ub
u,
Malaysia
Mu
da,
Malaysia
Bh
akra, Ind
ia
Dan
tiwad
a,In
dia
Majalg
aon
,In
dia
Seyh
an,
Tu
rkey
Gu
ilan, Iran
Dez, Iran
Lam
Pao
,T
hailan
d
Averag
e
R4
R220 Who enforces the rules if a farmer resists? Police - Police/Judges WUA Police Police Irr. Dept. MADA KADA n/a
Office du Niger & police Army
First, district.
Then, police Police and WUA
first, operator. Then,
president of WUA, finally, CNA water
police WUA; water
police
R221 # of fines levied by typical active WUA in past year 0 - 0 1 0 0 0 0 0 n/a n/a 5 18 18 10 10 4.8 1.46
R222 Governing Board of WUA
R223 Elected by all farmers (1
vote/farmer) Y - n/a Y - 0.0 - N N n/a Y Y Y Y Y 0.0
R224 Elected by all farmers (wt. by farm
size) N - n/a N - 0.0 - N N n/a Y 0.0 R225 Appointed N - n/a Y Y Y Y Y Y n/a R226 Is a govt. employee on the Board? N - n/a N N N N N N n/a Y N N N N N R227 R228 R229 Project Operation R230 Annual Operation Policies
R231 Does the project make an annual estimate of total deliveries? Y Y Y Y Y Y Y N N Y Y N Y Y Y Y
R232 Is there a fixed adv. official schedule of deliveries for the year? N Y N N Y N Y N N N N N N N N N
R233 If yes, how well is it followed in the
field (1=Xlnt, 10=horr) n/a 3 n/a n/a 2 n/a 6 n/a n/a n/a n/a n/a n/a n/a n/a n/a 3.7 0.57
R234 Does the project tell farmers what crops to plant? N N N N N N N N Y N N N N N N N
R235 If yes, how well is it followed
(1=Xlnt, 10=horr.) n/a n/a n/a n/a n/a n/a n/a n/a 1 n/a 1.0
R236 Does the project limit the planted acreage of various crops? N N N N N N N N N N N Y Y Y N N
R237 If yes, how well is it followed
(1=Xlnt, 10=horr.) n/a n/a n/a n/a n/a n/a n/a n/a n/a n/a 2 1 1.5 1.5 0.33 R238 Daily Operation Policies
R239 How often are main supply discharges re-calculated, days? 7 365 7 30 365 1 30 1 1 1 30 120 75 365 3 5 87.9 1.61 How are main supply discharge
R240 changes computed?
R241 Sums of farmer orders N Y N N Y 0 N N N Y
XX Depends on
river flow and area planted Y Y
R242 Observation of general conditions Y N N N N 0 N Y Y Y Y
R243 Std pre-determined schedule with
slight modifications N N Y Y N Y N N N
R244 Std pre-determined schedule with
no modifications N N N N N 0 Y N N Y What INSTRUCTIONS for field
R245 persons does the office give? R246 Main dam discharge flows Y Y Y Y Y Y Y Y Y Y Y Y Y Y Y Y R247 Predicted by computer program? Y N N N N N N Y N N N N N N N N
R248 How well is this followed in the field
(1=Xlnt, 10=horr)? 1 n/a 3 n/a n/a 2 n/a 3 2 1 1 4 1 1 1 1 1.8 0.60 R249 Cross regulator positions Y N N N N N N N N N Y N N N N N R250 Predicted by computer program? N N N N N N N N N N N N n/a n/a n/a
R251 How well is this followed in the field
(1=Xlnt, 10=horr)? 2 n/a n/a n/a n/a n/a n/a n/a n/a n/a 1 N/A n/a n/a n/a 1.5 0.47 R252 Water levels in the canals N Y N N Y Y N N N N N N N N N N R253 Predicted by computer program? N N N N N N N N N N N N/A n/a n/a n/a
R254 How well is this followed in the field
(1=Xlnt, 10=horr)? n/a n/a n/a n/a n/a 2 n/a n/a n/a n/a n/a N/A n/a n/a n/a 1.5 R255 Flow rates at all offtakes? Y Y N N N Y N Y N Y N N Y Y Y Y R256 Predicted by computer program? Y N N N N N N Y N N N N N N N N
R257 How well is this followed in the field
(1=Xlnt, 10=horr)? 8 n/a n/a n/a n/a 3 n/a 3 n/a 2 n/a N/A 2 2 3 2 3.1 0.65 R258 R259 Main Canal R260 Control of Flows Into Main Canals
Attachment C - Data for all Projects Page 6

Page 240 of 276
CV
Questionnaire Data
Rio
Mayo
,M
exico
Cu
patitzio
,M
exico
Sald
aña,
Co
lom
bia
Co
ello,
Co
lom
bia
Rio
Yaq
ui
Alto
, DR
Office d
uN
iger, M
ali
Ben
i Am
ir,M
oro
cco
Kem
ub
u,
Malaysia
Mu
da,
Malaysia
Bh
akra, Ind
ia
Dan
tiwad
a,In
dia
Majalg
aon
,In
dia
Seyh
an,
Tu
rkey
Gu
ilan, Iran
Dez, Iran
Lam
Pao
,T
hailan
d
Averag
e
R4
R261 Type of flow control device Sluice Gate
Radial Gates and long
diversion weir Large Baffle Distributors Sluice Gates Radial Gates
Radial Gates Sluice Gates
Over-shot gates Pumps Sluice gate Sluice gate
SLUICE GATE
Water level over weir
control water level in diversion
canal Radial gates Orifice Sluice gate
R262 Type of flow measurement device CG Rated Gate Baffle
Distributors Rated Section Rated Gate Rating table Rated Section Weir Rating Curve Rated gate Rated gate
Rated section
Current meter
2x/week Parshall flume
Orifice gate, but never has
been calibrated.
Daily current metering
R263 Probably accuracy of Q control/meas., +/-% 10.0 20.0 10.0 10.0 15.0 20.0 25.0 10.0 20.0 10 30 15 15 20 10 10 15.6 0.40
R264 R265 Main Canal Characteristics R266 Total length of Main Canals, km 159.0 190.0 132.0 483.0 39.0 77.0 165.0 98.0 105.6 42 288 33 14 69 55 245 137.2 0.88 R267 Length of longest main canal, km 91.7 48.0 71.0 51.0 50.0 46.0 165.0 39.0 25.0 42 130 33 16 19 55 86 60.5 0.67
R268 Condition of canal lining (10=horrible;1=Xlnt) 3.0 2.0 2.0 3.0 3.0 5.0 5.0 n/a n/a 2 n/a 2 n/a n/a 2 2 2.8 0.41
R269 Approximate canal invert slope 0.0002 0.0002 0.0005 0.0004 0.0002 0.0005 0.0002 0.0001 0.0001 0.0002 0.0000 unknown mild/steep 0.0050 0.0030 0.0010 0.0003 0.0 1.74
R270 Do uncontrolled drain flows enter the canal? Y N Y N N Y Y Y Y N N minor Y N Y Y
R271 % of cross section filled with silt 5.0 5.0 10.0 2.0 >5% 20.0 10.0 10.0 10.0 10 20 10 15 20 3 5 10.3 0.58
R272 Total # of spill points for a typical canal 5.0 3.0 5.0 1.0 1.0 0.0 0.0 1.0 1.0 2 1 5 5 2 10 8 3.1 0.94
R273 Water travel time (hours) from start to first deliveries 0.2 0.5 1.0 1.0 1.0 0.3 24.0 0.2 0.3 5 120 0.5 5 4 6 8 11.1 2.68
R274 Water travel time for a change to reach end of canal (hrs) ? 4.0 12.0 10.0 18.0 2.0 48.0 12.0 10.0 10 230 4 12 30 18 28 29.9 1.90
R275 Has seepage been measured well? N N N N N N N N N N N N 16%
estimated N N N R276 Have spills been measured well? N N N N N N N N N N N N reasonable N N
R277 # of Regulating reservoirs in system 2.0 20.0 10.0 0.0 1.0 0.0 0.0 0.0 0.0 0 N 0 0 0 0 0 2.2 2.53
R278 How effectively are they used for
reg.? (10=horr; 1=Xlnt) 8.0 8.0 5.0 n/a 10.0 n/a n/a n/a n/a n/a n/a n/a n/a n/a n/a 7.8 0.27 R279 # of wells feeding into the canal 0.0 0.0 0.0 0.0 0.0 0.0 0.0 0.0 0.0 0 0 0 0 0 0 80 5.0 4.00
R280 How effectively are they used for
reg.? (10=horr; 1=Xlnt) n/a n/a n/a n/a n/a n/a n/a n/a n/a n/a n/a n/a n/a n/a 4 4.0 R281 R282 Lining type R283 Masonry, % 15 0 0 0 0 100 100 0 0 0 0 19.5 2.05 R284 Concrete, % 80 90 60 100 100 0 0 0 0 100 100 0 3 100 24 50.5 0.92 R285 Unlined, % 5 10 40 0 0 0 0 100 100 100 100 97 76 48.3 0.97
Rating of various items R286 (10=horrible; 1=excellent) R287 Integrity of canal banks 2 1 2 3 1 6 8 3 4 2 10 2 2 3 2 3 3.4 0.75 R288 Integrity of canal lining 4 2 2 3 3 5 4 n/a n/a 2 n/a 2 n/a n/a 2 1 2.7 0.44
R289 General maintenance of structures 3 2 4 2 2 2 5 2 4 2 2 5 2 4 3 3 2.9 0.38 R290 Seepage control 3 2 3 2 2 6 3 4 6 2 10 2 5 3 2 3 3.6 0.60 R291 Weed control 3 2 2 3 3 5 3 4 7 2 5 4 2 3 6 4 3.6 0.41 R292 Algae/moss control 7 3 4 3 3 5 3 4 7 2 5 8 2 3 1 3 3.9 0.50
R293 Lack of canal breakage by
customers 1 1 2 2 1 2 2 1 3 1 1 5 2 1 1 1 1.7 0.64 R294 R295 Main Canal Cross-regulators
R296 Condition of crossregulators(10=horr.;1=Xlnt) 3.0 2.0 3.0 2.0 1.0 2.0 3.0 2.0 3.0 2 2 7 3 5 4 3 2.9 0.49
R297 Type of cross regulator Sluice Gates
Dynamic Regulation Radial Gates
Combination of LCWs and AMIL gates
Sluice Gate w/ small side
weirs that were not used Radial Gate Sluice gates Sluice Gates
Manual Overshot AVIS
4 AMIL, 2 LCW w/ sliuice
Sluice gate at Point A;
composite over/underflow
on Point B Sluice
radial plus long side
walls Radial with LCW
Most are combination
LCW and Radial. At lower end, there are 3 AMIL which don't work,
Sluice & Radial; sluice
sometimes have
flashboards on side
R298 Do operators live at each X-regulator site? Y N N N Y Y Y Y N N N Y N N N N
R299 Can the ones that exist operate as needed? (10=horr; 1=Xlnt) 1.0 4.0 1.0 2.0 1.0 1.5 4.0 2.0 2.0 1 1 4 2 5 4 2 2.3 0.59
Attachment C - Data for all Projects Page 7

Page 241 of 276
CV
Questionnaire Data
Rio
Mayo
,M
exico
Cu
patitzio
,M
exico
Sald
aña,
Co
lom
bia
Co
ello,
Co
lom
bia
Rio
Yaq
ui
Alto
, DR
Office d
uN
iger, M
ali
Ben
i Am
ir,M
oro
cco
Kem
ub
u,
Malaysia
Mu
da,
Malaysia
Bh
akra, Ind
ia
Dan
tiwad
a,In
dia
Majalg
aon
,In
dia
Seyh
an,
Tu
rkey
Gu
ilan, Iran
Dez, Iran
Lam
Pao
,T
hailan
d
Averag
e
R4
R300 Are they operated as theor. intended?(10=horr; 1=Xlnt) 10.0 2.0 2.0 2.0 1.0 2.0 3.0 4.0 1.0 1 5 9 8 5 5 3 3.9 0.73
R301 Number of cross regulators/km 0.4 0.5 0.2 0.1 0.1 2.3 0.1 0.3 0.2 0.14 0.017 0.2 0.25 0.5 0.25 0.5 0.4 1.43
R302 Are there large overflows at cross regulator sides? N N Y N N N N N N Y N N Y Y Y sometimes
R303 Unintended max. controlled w.s. variation in avg. gate in a day,m 0.40 0.20 0.10 0.15 0.05 0.15 0.30 0.20 0.10 0.10 0.05 0.50 0.10 0.20 0.15 0.10 0.18 0.70
R304 In months w/ water, what is the max days of no gate change? 30.0 5.0 30.0 10.0 1.0 1.0 90.0 1.0 n/a 1 30 7 75 120 6 7 27.6 1.36
R305 How long (max) does it take an operator to reach a regulator, hrs? 0.1 3.0 0.5 0.1 0.1 0.1 0.1 0.1 0.5 1 0 0 0.5 0.5 1.5 1 0.6 1.38
R306 How frequently (hrs) will an operator move a gate if reqd/instr? 24.0 12.0 n/a 24.0 n/a 1.0 0.5 1.0 n/a 1 Daily 24 24 24 24 12 14.3 0.76
R307 How frequently are gates typically operated? (days) 2.0 1.0 n/a 1.0 1.0 0.3 15.0 0.5 0.5 1 15 5 30 3 3 2.5 5.4 1.55
R308 Officially, can gate oper make gate adj. w/o upper approval? N Y n/a N n/a Y Y Y n/a Y N Y Y Y Y Y
R309 In reality, do gate oper. make adj. w/o upper approval? N Y n/a ? n/a Y Y Y n/a Y N Y Y Y Y Y
R310 If they do operate in reality, how well do they(10=H; 1=Xlt) na/ 3.0 n/a 3.0 1.0 2.0 3.0 3.0 n/a 1 n/a 10 5 3 8 3 3.8 0.72 Hours necessary to make a significant setting change on the
R311 gate 3.0 0.5 n/a 1.0 1.0 0.5 1.0 0.5 n/a 0.1 0.5 0.3 1 0.5 0.5 0.2 0.8 0.94 R312 R313 Main Canal X-Regulator Personnel
Office du Guilan Niger Federal
R314 For whom do the operators work? Fed. Govt. Company Authority WUA Irr. Dept. WRD Irr. Dept. MADA KADA n/a - all auto. Government Govt. WUA WUA Fed. govt Association
R315 Typical education level of operator (yrs of school) 12.0 12.0 12.0 12.0 12.0 12.0 8.0 9.0 6.0 n/a - all auto. 12 10 11 11 14 16 11.3 0.21
R316 What is the option for firing an operator? AI
Almost Impossible AI P Possible
Almost Impossible Possible Possible Possible n/a - all auto. Very difficult Easy
Must show just cause
Need to prove, and go through
paperwork
Can only transfer to another position
simple - just do it
R317 Incentives for exemplary work?(10=none/1=high) 10.0 2.0 10.0 5.0 7.0 6.0 9.0 10.0 10.0 n/a - all auto. 10 10 10 10 9 10 8.5 0.29
R318 Incentives for average work?(10=none/1=high) 5.0 10.0 10.0 10.0 10.0 6.0 10.0 10.0 10.0 n/a - all auto. 10 10 10 10 10 10 9.4 0.17
R319 Operators encouraged to think on their own?(10=No; 1-Definitely) 10.0 3.0 4.0 5.0 5.0 2.5 8.0 2.0 6.0 n/a - all auto. 10 7 1 3 4 2 4.8 0.59
R320 Is there a formal performance review process annually? N Y N Y N Y N N N n/a - all auto. N N N N Y N
R321 If so, is it written down & understood by employees? n/a N n/a Y N N N n/a n/a n/a - all auto. n/a N n/a n/a N n/a
R322 # of persons fired in last 10 yrs for incompetence 0.0 0.0 0.0 ? 5.0 0.0 50.0 0.0 0.0 n/a - all auto. 0 5 2 2 0 0 4.6 2.89
R323 Main Canal
R324 Communications/Transportation How often do operators communicate with next higher
R325 level? (hr) 8.0 24.0 8.0 24.0 4.0 3.0 48.0 24.0 8.0 24 48 48 8 12 24 3 19.9 0.81
R326 How is communication done? P,R Personal P,R,M P Radio Old phone
system Telephone Radio Telephone Personal Phone or letter phone,
personal Radio and personal Per., port radio
phone, personal
radio and personal visit
R327 What is the transportation of mobile personnel? Motorcycle Jeep w/ Driver
Own Motorcycle
Own Motorcycle Jeep
Motorcycle and Jeep
Jeeps/ motorcycles Motorcycles Motorcycles Truck Motorcycle
Pickup, motorcycle
Pickup, motorcycle Pickup pickup, car pickup
R328 How many automatic remote monitoring sites are there? 0.0 0.0 0.0 0.0 10.0 0.0 0.0 10.0 4.0 4 0 0 0 0 0 0 1.8 2.00 How often do X-reg. operators/bosses meet with rep. of
R329 d/s level? (days) 1.0 2.0 1.0 3.0 1.0 0.5 1.0 1.0 1.0 1 never 2 1 1 1 0.3 1.2 0.56
R330 How often does representative of u/s level visit? (days) 1.0 2.0 1.0 3.0 1.0 2.0 2.0 1.0 3.0 1 3.5 5 1 1 30 1 3.7 1.95
R331 # of sides of canal with a road for trucks 1.0 2.0 1.0 2.0 1.0 1.0 1.0 1.0 2.0 2 0 1.5 1.5 1.5 1 1.5 1.3 0.41
R332 # of sides of canal with a road suitable for motorcycles 1.0 2.0 1.0 2.0 2.0 1.0 2.0 2.0 2.0 2 0 1.7 1.5 1.5 1 1.5 1.5 0.38
R333 What % of water season is the canal accessible by trucks? 100.0 100.0 100.0 100.0 90.0 70.0 80.0 80.0 90.0 95 0 100 100 100 100 100 87.8 0.29
Attachment C - Data for all Projects Page 8

Page 242 of 276
CV
Questionnaire Data
Rio
Mayo
,M
exico
Cu
patitzio
,M
exico
Sald
aña,
Co
lom
bia
Co
ello,
Co
lom
bia
Rio
Yaq
ui
Alto
, DR
Office d
uN
iger, M
ali
Ben
i Am
ir,M
oro
cco
Kem
ub
u,
Malaysia
Mu
da,
Malaysia
Bh
akra, Ind
ia
Dan
tiwad
a,In
dia
Majalg
aon
,In
dia
Seyh
an,
Tu
rkey
Gu
ilan, Iran
Dez, Iran
Lam
Pao
,T
hailan
d
Averag
e
R4
R334 Time needed for mgr. to travel down the longest canal, hrs 6.0 3.0 4.0 3.0 1.0 4.0 5.0 3.0 2.5 2
n/a - can't travel 2 1 0.5 2 2.5 2.8 0.55
R335 Hours needed to reach the office of this stretch from office of supplier 1.0 3.0 0.5 1.0 2.0 2.0 2.0 1.0 1.0 0.5 3 0.5 0.5 0.5 1.5 0.2 1.3 0.71
R336 R337 Main Canal Off-Takes
R338 % of offtake flows taken from unofficial offtakes 1.0 0.0 0.0 0.0 0.0 0.0 0.0 0.0 0.0 0 0 10 0 0 5 0 1.0 2.71
R339 Typical significant offtake flow rate, cms 1.2 15.0 5.6 6.0 9.0 3.0 10.0 10.0 5.0 1 30 0.8 5 1 8 1 7.0 1.06
R340 Number of significant offtakes/km 0.3 0.4 0.2 0.1 0.1 2.0 0.3 0.3 0.2 0.25 0.017 0.2 0.25 1 0.15 0.5 0.4 1.24
R341 Typ. chng. in w.s. elevation across off-take, m 0.5 1.5 2.0 3.0 1.0 0.2 0.2 0.2 0.5 0.25 0.5 0.5 0.4 0.3 0.5 0.15 0.7 1.08
R342 Can they physically operate as needed? (10=horr; 1=Xlnt) 8.0 2.0 2.0 2.0 4.0 3.0 3.0 6.0 3.0 5 Y 2 4 2 5 3 3.6 0.49
R343 Are they phys. operated as theor. intended?(10=horr; 1=Xlnt) 10.0 3.0 2.0 2.0 2.0 4.0 2.0 6.0 3.0 5 4 2 10 2 6 4 4.2 0.64
R344 How well can offtakes be supplied at low Q? (10=horr/1=Xlnt) 3.0 1.0 3.0 2.0 2.0 9.0 9.0 2.0 2.0 1 5 1 1 1 1 2 2.8 0.94
R345 Who operate the offtakes? (1=this level;2=lower;3=both) 1.0 2.0 1.0 2.0 1.0 0.0 2.0 1.0 1.0 1 2 2 3 1 1 1 1.4 0.52
R346 How frequently is the offtake checked? (hours) 24.0 3.0 8.0 4.0 1.0 3.0 3.0 1.0 4.0 8 24 8 24 24 24 24 11.7 0.86
R347 Officially,how frequently should offtakes be adjusted (days) 7.0 1.0 1.0 1.0 1.0 n/a 8.0 1.0 0.3 0.5 1 2 variable 3 3 2 2.3 1.04
R348 Officially,can offtake oper. make Q adj. w/o upper approval? N Y Y N Y n/a N Y Y N Y Y N Y Y Y
R349 In reality, do offtake oper. make Q adj. w/o upper approval? Y Y Y Y Y n/a N Y Y N Y Y N Y Y Y
R350 Scheduling of Flows From Main
R351 Canal Offtakes
What % of the time is the flow R352 OFFICIALLY scheduled as follows: R353 Proportional flow 0 0 0 0 0 0 0 0 0 0.0 R354 Rotation 0 0 0 0 100 0 100 100 100 50 45.0 1.10
R355 Schedule computed by higher level
no lower level input 0 100 0 0 0 0 0 0 0 11.1 3.00
R356 Schedule computed by higher level
some lower level input 100 0 100 100 0 0 0 0 0 33.3 1.50
R357 Schedule by operator based on
judgement of supply and d/s needs 0 0 0 0 0 100 0 0 0 11.1 3.00
R358 Schedule actively matches real-time
lower level requests 0 0 0 0 0 0 0 0 0 100 100 100 100 50 100 100 40.6 1.21 What % of the time is the flow
R359 ACTUALLY scheduled as follows: R360 Proportional flow 0 0 0 0 0 0 0 0 0 0.0 R361 Rotation 0 0 0 0 100 0 100 25 0 10 50 25.9 1.54
R362 Schedule computed by higher level
no lower level input 0 100 0 0 0 0 0 0 0 11.1 3.00
R363 Schedule computed by higher level
some lower level input 40 0 40 0 0 0 0 0 0 8.9 1.98
R364 Schedule by operator based on
judgement of supply and d/s needs 60 0 60 100 0 100 0 75 100 90 100 100 65.4 0.64
R365 Schedule actively matches real-time
lower level requests 0 0 0 0 0 0 0 0 0 100 50 100 100 26.9 1.63 R366
Control of Flows From Main Canal R367 Offtakes
R368 Official type of flow control device M, U, NE Gate Baffle
Distributor M,U,NE Gate Proportional
Divider Gate Overshot Gate Combo - BF
and CHO Dist. Modules D/S control
gate Round
canal gate Undershot
gate Canal gate
(orifice) Dist. Mod. Sluice; some
pumps
R369 Common name CHO Radial Gate Baffle
Distributor Sluice Radial Gate Proportional
Divider Sluice Gate Overshot Gate Baffle Dist and CHO Dist. Modules
AVIO or manual sluice Canal Gate Radial gate Canal gate Dist. Mod. Sluice
Attachment C - Data for all Projects Page 9

variable - some
Page 243 of 276
CV
Questionnaire Data
Rio
Mayo
,M
exico
Cu
patitzio
,M
exico
Sald
aña,
Co
lom
bia
Co
ello,
Co
lom
bia
Rio
Yaq
ui
Alto
, DR
Office d
uN
iger, M
ali
Ben
i Am
ir,M
oro
cco
Kem
ub
u,
Malaysia
Mu
da,
Malaysia
Bh
akra, Ind
ia
Dan
tiwad
a,In
dia
Majalg
aon
,In
dia
Seyh
an,
Tu
rkey
Gu
ilan, Iran
Dez, Iran
Lam
Pao
,T
hailan
d
Averag
e
R4
R370 Official type of flow measurement device GO,DH Rated
Baffle Distributor Flume Rated
Rated device Flume
Rated Overshot Gate
Baffle Dist and CHO Dist. Module none none
current meter
Rated section (70%) and
parshall flume (30%) Dist. Mod.
Replogle flume or current
meter (50/50)
R371 Common name? CHO Rated Gate Baffle
Distributor Parshall Flume Rated Gate Rated device Flume
Rated Overshot Gate
Baffle Dist and CHO Dist. Module n/a none
current meter
Rated Sec. & Parshall Dist. Mod. same
R372 Actual flow control/measurement Approx. Fair Good Fair Fair Poor Fair fair to poor fair Dist. Module none No rating
exists; none Unique same Dist. Mod. same
R373 Probably accuracy of Q control/meas., +/-% 20.0 20.0 5.0 10.0 15.0 20.0 20.0 25.0 0.2 15 N/A 50 30 35 25 20 20.7 0.58
R374 R375 R376 2nd Level Canals R377 2nd Level Canal Characteristics
R378 Total length of 2nd Level Canals in project, km 452.0 560.0 200.0 2,550.0 273.0 675.0 535.0 70.0 408.0 240 75 91 225.7 93 39 1194 480.0 1.31
R379 Length of avg. 2nd level canal, km 4.0 10.0 10.0 10.0 10.0 5.0 5.0 10.0 4.0 15 15 2 5 3 20 10 8.6 0.58
R380 Condition of canal lining (10=horrible;1=Xlnt) 4.0 2.0 3.0 2.0 2.0 4.0 5.0 n/a n/a 3 3 3 n/a n/a 2 2 2.9 0.34
very flat and others relatively
R381 Approximate canal invert slope 0.0000 0.0002 0.0010 0.0010 0.0002 0.0002 0.0002 0.0002 0.0002 0.0004 0.0005 steep 0.0050 steep 0.0005 fairly flat 0.0007 1.81
R382 Do uncontrolled drain flows enter the canal? Y N Y N N Y Y N N N N N Y N Y N
R383 % of cross section filled with silt 5.0 5.0 5.0 2.0 5.0 20.0 5.0 10.0 5.0 5 15 5 10 30 0 15 8.9 0.87
R384 Total # of spill points for a typical canal 1.0 1.0 1.0 2.0 2.0 0.0 0.0 1.0 0.0 5 0 1 1 1 2 0 1.1 1.12
R385 Water travel time (hours) from start to first deliveries 0.1 0.2 0.1 0.2 0.1 0.3 0.3 0.5 0.1 0.25 0.15 0.1 0.1 0.3 0.05 0.1 0.2 0.64
R386 Water travel time for a change to reach end of canal (hrs) 24.0 3.0 4.0 4.0 4.0 4.0 8.0 12.0 1.0 5 5 1 8 12 5 3 6.4 0.89
R387 Has seepage been measured well? N N N N N N N N N N N N N N N N R388 Have spills been measured well? N N N N N N N N N N N N N N N N
R389 # of Regulating reservoirs in system 0.0 0.0 ? 0.0 0.0 0.0 0.0 0.0 0.0 0 0 0 0 0 0 0 0.0
R390 How effectively are they used for reg.? (10=horr; 1=Xlnt) n/a n/a 3.0 n/a n/a n/a n/a n/a n/a n/a n/a n/a n/a n/a n/a n/a 3.0
R391 # of wells feeding into the canal 0.0 0.0 0.0 0.0 0.0 0.0 0.0 0.0 0.0 0 0 0 0 0 0 1 0.1 4.00
R392 How effectively are they used for reg.? (10=horr; 1=Xlnt) n/a n/a n/a n/a n/a n/a n/a n/a n/a n/a n/a n/a n/a n/a n/a 8 8.0
R393 R394 Lining type R395 Masonry, % 15 0 0 0 0 100 90 0 0 2 0 18.8 2.02 R396 Concrete, % 80 90 50 95 90 0 0 40 0 97 95 6 100 8 53.6 0.80 R397 Unlined, % 5 10 50 5 10 0 10 60 100 1 100 5 94 100 92 42.8 1.01
Rating of various items R398 (10=horrible; 1=excellent) R399 Integrity of canal banks 2 2 1 2 4 6 8 3 6 1 5 3 2 4 2 5 3.5 0.58 R400 Integrity of canal lining 4 2 2 2 3 5 4 n/a n/a 3 n/a 2 n/a n/a 2 1 2.7 0.44
R401 General maintenance of structures 3 4 2 2 3 2 5 2 5 3 3 8 3 4 6 5 3.8 0.45 R402 Seepage control 3 3 1 2 4 6 3 4 6 3 2 2 5 3 2 5 3.4 0.44 R403 Weed control 3 3 4 3 4 5 3 4 8 2 3 3 3 4 5 6 3.9 0.38 R404 Algae/moss control 7 3 2 3 4 5 3 4 8 1 4 10 3 3 1 3 4.0 0.61
R405 Lack of canal breakage by
customers 1 2 1 2 2 2 2 1 4 1 1 3 2 1 3 2 1.9 0.47 R406 R407 2nd Level Canal Cross-regulators
R408 Condition of crossregulators(10=horr.;1=Xlnt) 4.0 3.0 4.0 2.0 2.0 2.0 3.0 2.0 2.0 2 3 9 3 5 3 5 3.4 0.54
R409 Type of cross regulator Sluice Gates 90% Radial/
10% mix AMIL
Sluice Gates w/ small side
weirs LCW
Proport.. Dividers/
LCWs Sluice Gates Sluice Gates LCW long crested
weir various Begemann
95% sluice; 5% simple bamboo
flashboards Sluice gate
LCW with Underflow
gates sluice
R410 Do operators live at each X-regulator site? N N N N N N Y Y N N Y N N N N N
Attachment C - Data for all Projects Page 10

Page 244 of 276
CV
Questionnaire Data
Rio
Mayo
,M
exico
Cu
patitzio
,M
exico
Sald
aña,
Co
lom
bia
Co
ello,
Co
lom
bia
Rio
Yaq
ui
Alto
, DR
Office d
uN
iger, M
ali
Ben
i Am
ir,M
oro
cco
Kem
ub
u,
Malaysia
Mu
da,
Malaysia
Bh
akra, Ind
ia
Dan
tiwad
a,In
dia
Majalg
aon
,In
dia
Seyh
an,
Tu
rkey
Gu
ilan, Iran
Dez, Iran
Lam
Pao
,T
hailan
d
Averag
e
R4
R411 Can the ones that exist operate as needed? (10=horr; 1=Xlnt) 3.0 4.0 2.0 3.0 2.0 2.0 4.0 4.0 1.0 1 3 8 2 5 2 2 3.0 0.58
R412 Are they operated as theor. intended?(10=horr; 1=Xlnt) 5.0 5.0 1.0 8.0 2.0 2.0 3.0 4.0 2.0 1 3 10 2 5 8 2 3.9 0.69
R413 Number of cross regulators/km 0.5 0.8 0.6 0.5 0.3 2.0 0.1 0.3 0.5 0.3 0.25 2.1 3 1.3 0.5 1 0.9 0.93
R414 Are there large overflows at cross regulator sides? N N Y N Y Y N N Y Y N N N N Y N
R415 Unintended max. controlled w.s. variation in avg. gate in a day,m 0.1 0.2 0.1 0.2 0.1 0.2 0.3 0.2 0.0 0.1 0.15 0.25 0.15 0.2 0.25 0.1 0.2 0.45
R416 In months w/ water, what is the max days of no gate change? 30.0 15.0 180.0 10.0 n/a n/a 90.0 10.0 n/a n/a 10 365 6 10 7 7 61.7 1.76
R417 How long (max) does it take an operator to reach a regulator, hrs? 1.0 1.0 1.0 0.2 1.0 0.5 0.1 0.1 1.0 n/a 0 1.5 1 1 1.5 1 0.8 0.62
R418 How frequently (hrs) will an operator move a gate if reqd/instr? 168.0 24.0 n/a 2.0 n/a n/a 0.5 3.0 n/a n/a 1 48 24 24 24 12 30.0 1.60
R419 How frequently are gates typically operated? (days) 30.0 3.0 n/a 0.5 n/a n/a 15.0 1.0 n/a n/a 0.3 40 4 3 3 3 9.3 1.44
R420 Officially, can gate oper make gate adj. w/o upper approval? Y Y n/a Y n/a n/a Y Y n/a n/a Y Y Y Y Y Y
R421 In reality, do gate oper. make adj. w/o upper approval? Y Y n/a Y n/a n/a Y Y n/a n/a Y Y Y Y Y Y
R422 If they do operate in reality, how well do they(10=H; 1=Xlt) 8.0 6.0 n/a 3.0 n/a n/a 3.0 2.0 n/a n/a 2 10 5 3 8 3 4.8 0.58 Hours necessary to make a significant setting change on the
R423 gate 0.2 0.3 n/a 0.3 n/a n/a 1.0 0.1 n/a n/a 0.1 0.1 0.1 0.25 0.2 0.15 0.2 1.09 R424 R425 2nd Level X-Regulator Personnel
R426 For whom do the operators work? FG Company Guilan
Authority WUA Irr. Dept. WRD Irr. Dept. MADA KADA Project ODN WUA USOCOELL
O WUA WUA WUA
R427 Typical education level of operator (yrs of school) 16 9 12 12 8 10 8 9 6 6 9 16 11 11 11 16 10.63 0.30
Easy. Each new board
R428 What is the option for firing an operator? AI
Almost Impossible AI P Possible
Almost Impossible Possible Potential Potential
Can't fire, but can
downgrade Difficult Easy Relatively
simple Need proof, paperwork
puts its own operators in
place. Trying to change
that. simple - no
union
R429 Incentives for exemplary work?(10=none/1=high) 10.0 3.0 10.0 5.0 5.0 6.0 9.0 10.0 10.0 8 10 10 6 10 10 10 8.3 0.29
R430 Incentives for average work?(10=none/1=high) 5.0 10.0 10.0 10.0 10.0 6.0 10.0 10.0 10.0 7 10 10 8 10 10 10 9.1 0.18
R431 Operators encouraged to think on their own(10=No; 1-Definitely) 6.0 2.0 1.0 3.0 7.0 2.5 8.0 2.0 4.0 10 1 1 1 3 5 1 3.6 0.79
R432 Is there a formal performance review process annually? N Y N Y N Y N N N Y N N N N N N
Employee If so, is it written down & only gets a
R433 understood by employees? n/a Y n/a Y N N N n/a n/a verbal answer n/a n/a n/a n/a N n/a
R434 # of persons fired in last 10 yrs for incompetence 0.0 0.0 0.0 ? 2.0 0.0 50.0 0.0 0.0 0 0 5 2 2 0 3 4.3 2.99
R435 2nd Level
R436 Communications/Transportation How often do X-reg. operators communicate with next higher
R437 level? (hr) 24.0 12.0 8.0 3.0 4.0 3.0 48.0 3.0 3.0 24 48 12 2 12 24 12 15.1 0.99
R438 How is communication done? Personal Personal Personal Personal Phone Personal Telephone Personal Personal personal Motorcycle Personal Radio Per., port radio Personal radio, personal
visit
R439 What is the transportation of mobile personnel? Motorcycle Jeep w/ Driver
Own Motorcycle
Own Motorcycle
Jeep and Bike Motorcycle
Jeeps/ motorcycles Motorcycle Motorcycle motorcycle Motorcycle Motorbike
Motorcycles for
canaleros; pickups for supervisors Pickup auto pickup
R440 How many automatic remote monitoring sites are there? 0.0 0.0 0.0 0.0 0.0 0.0 0.0 0.0 0.0 0 0 0 0 0 0 0 0.0 How often do X-reg. operators/bosses meet with rep. of
R441 d/s level? (days) 1.0 1.0 n/a n/a 1.0 0.5 1.0 1.0 1.0 1 2 1 0.5 1 1 0.5 1.0 0.38
Attachment C - Data for all Projects Page 11

Page 245 of 276
CV
Questionnaire Data
Rio
Mayo
,M
exico
Cu
patitzio
,M
exico
Sald
aña,
Co
lom
bia
Co
ello,
Co
lom
bia
Rio
Yaq
ui
Alto
, DR
Office d
uN
iger, M
ali
Ben
i Am
ir,M
oro
cco
Kem
ub
u,
Malaysia
Mu
da,
Malaysia
Bh
akra, Ind
ia
Dan
tiwad
a,In
dia
Majalg
aon
,In
dia
Seyh
an,
Tu
rkey
Gu
ilan, Iran
Dez, Iran
Lam
Pao
,T
hailan
d
Averag
e
R4
R442 How often does representative of u/s level visit? (days) 2.5 1.0 1.0 1.0 2.0 5.0 2.0 3.0 5.0 200 2 0.5 0.5 1 1 1 14.3 3.47
R443 # of sides of canal with a road for trucks 0.8 1.0 1.0 1.0 1.0 1.0 1.0 1.0 1.0 1 2 1 0.9 1 1 1 1.0 0.25
R444 # of sides of canal with a road suitable for motorcycles 0.9 1.0 1.0 1.0 1.0 1.0 2.0 2.0 2.0 2 2 1 1 1 1 1 1.3 0.37
R445 What % of water season is the canal accessible by trucks? 0.7 100.0 0.5 75.0 50.0 0.5 0.8 75.0 75.0 95 100 95 100 100 100 95 66.4 0.63
R446 Time needed for mgr. to travel down the longest canal, hrs 2.0 2.0 2.0 2.0 3.0 1.0 8.0 3.0 0.5 1 1 0.3 1 0.25 1.5 0.7 1.8 1.02
R447 Hours needed to reach the office of this stretch from office of supplier 0.5 1.0 1.0 2.0 1.0 2.0 2.0 1.0 0.5 1 0.5 0.5 0.5 0.5 1.5 0.4 1.0 0.59
R448 R449 2nd Level Canal Off-Takes
R450 % of offtake flows taken from unofficial offtakes 5.0 0.0 0.0 0.0 0.0 0.0 0.0 0.0 0.0 1 0 7 1 5 5 5 1.8 1.41
R451 Typical significant offtake flow rate, cms 0.0 0.8 1.0 1.0 0.5 1.5 10.0 0.2 0.1 0.25 0.8 0.04 0.1 0.15 0.12 0.1 1.0 2.33
R452 Number of significant offtakes/km 1.4 0.8 0.6 0.5 0.5 2.0 0.3 3.0 4.0 0.25 1 2.1 3 4.5 1 2 1.7 0.79
R453 Typ. chng. in w.s. elevation across off-take, m 0.3 0.5 1.0 0.5 0.3 0.1 0.2 0.1 0.1 0.25 0.5 0.2 0.3 0.2 0.2 0.2 0.3 0.80
R454 Can they physically operate as needed? (10=horr; 1=Xlnt) 6.0 4.0 2.0 3.0 2.0 3.0 3.0 5.0 2.0 5 3 2 3 4 7 3 3.6 0.42
R455 Are they phys. operated as theor. intended?(10=horr; 1=Xlnt) 10.0 6.0 2.0 3.0 2.0 4.0 2.0 5.0 5.0 3 3 2 3 4 5 7 4.1 0.53
R456 How well can offtakes be supplied at low Q? (10=horr/1=Xlnt) 3.0 7.0 2.0 4.0 10.0 9.0 9.0 7.0 5.0 1 2 4 2 3 1 5 4.6 0.64
R457 Who operate the offtakes? (1=this level;2=lower;3=both) 2.0 1.0 3.0 1.0 1.0 0.0 2.0 3.0 1.0 1 1 1 1 1 1 1 1.3 0.60
R458 How frequently is the offtake checked? (hours) 24.0 12.0 4.0 12.0 12.0 4.0 24.0 12.0 12.0 12 12 90 80 24 48 24 25.4 1.01
R459 Officially,how frequently should offtakes be adjusted (days) 4.0 1.0 1.0 1.0 1.0 n/a 3.0 1.0 1.0 0.5 1 1 6 4 3 3 2.1 0.78
R460 Officially,can offtake oper. make Q adj. w/o upper approval? N Y Y Y Y n/a N Y Y N Y Y Y Y Y Y
R461 In reality, do offtake oper. make Q adj. w/o upper approval? Y Y Y Y Y n/a N Y Y N Y Y Y Y Y Y
R462
R463 Scheduling of Flows From 2nd Level Canal Offtakes
R464 What % of the time is the flow OFFICIALLY scheduled as follows:
R465 Proportional flow 0 0 0 0 0 0 0 0 0 0 0.0 R466 Rotation 30 100 30 0 100 100 100 100 100 0 20 50 60.8 0.71
R467 Schedule computed by higher level
no lower level input 0 0 0 0 0 0 0 0 0 0 0.0
R468 Schedule computed by higher level
some lower level input 70 0 70 0 0 0 0 0 0 0 14.0 2.11
R469 Schedule by operator based on
judgement of supply and d/s needs 0 0 0 100 0 0 0 0 0 100 10 0 17.5 2.21
R470 Schedule actively matches real-time
lower level requests 0 0 0 0 0 0 0 0 0 90 100 80 50 100 100 34.7 1.31
R471 What % of the time is the flow ACTUALLY scheduled as follows:
R472 Proportional flow 0 0 0 0 0 0 0 0 0 0 0.0 R473 Rotation 30 0 30 0 100 100 100 25 0 20 20 50 39.6 0.99
R474 Schedule computed by higher level
no lower level input 0 0 0 0 0 0 0 0 0 0 0.0
R475 Schedule computed by higher level
some lower level input 0 0 0 0 0 0 0 0 0 0 0.0
R476 Schedule by operator based on
judgement of supply and d/s needs 70 25 70 25 0 0 0 75 100 80 10 10 0 35.8 1.04
R477 Schedule actively matches real-time
lower level requests 0 75 0 75 0 0 0 0 0 90 90 80 50 100 100 44.0 1.00 R478
R479 Control of Flows From 2nd Level Canal Offtakes
Attachment C - Data for all Projects Page 12

Page 246 of 276
CV
Questionnaire Data
Rio
Mayo
,M
exico
Cu
patitzio
,M
exico
Sald
aña,
Co
lom
bia
Co
ello,
Co
lom
bia
Rio
Yaq
ui
Alto
, DR
Office d
uN
iger, M
ali
Ben
i Am
ir,M
oro
cco
Kem
ub
u,
Malaysia
Mu
da,
Malaysia
Bh
akra, Ind
ia
Dan
tiwad
a,In
dia
Majalg
aon
,In
dia
Seyh
an,
Tu
rkey
Gu
ilan, Iran
Dez, Iran
Lam
Pao
,T
hailan
d
Averag
e
R4
Un-gated Sluice Gate Baffle Baffle Outlet and some Distributor Distrib. module Distributor
R480 Official type of flow control device Sluice Gate Sluice gate Distributor CHO Distributor (APM) proport. Gates CHOs Sluice gate Module or sluice Slide gate Orifice Orifice Module sluice gate
R481 Common name CHO Sluice gate Baffle
Distributor CHO Baffle
Distributor APM Sluice Gate CHOs Sluice gate Distributor
Module Distrib. module
or sluice slide gate Manual
slide gate Canal gates Distributor
Module sluice gate
R482 Official type of flow measurement device CHO
Parshall Flume
Baffle Distributor Flume
Baffle Distributor Flume Flume CHOs Flume
Distributor Module
Distrib. module or sluice
Calibrated slide gate
varies - 3 kinds Rated section
Distributor Module
mostly current meter in d/s section; also some port.
prop. meters; floats
R483 Common name? CHO Parshall Flume
Baffle Distributor Parshall Flume
Baffle Distributor Flume Flume CHOs Flume
Distributor Module
Distrib. module or sluice None
37% rect. concrete section
("rated");13 % Balloffett & cutthroat; 50% none Rated section
Distributor Module same
R484 Actual flow control/measurement poor good fair fair - good good good/not
used Fair fair good Distributor
Module Distrib. module
or sluice
Guess based on slide gate position see above Rated section
Distributor Module
sluice gate + current meter
R485 Do the operators have an estimate of the flow rate thru offtake? PN Y Y Y Y Y Y Y Y Y Depends Y Y Y Y Y
R486 Probably accuracy of Q control/meas., +/-% 40.0 10.0 10.0 10.0 10.0 20.0 20.0 20.0 10.0 20 30 50 25 30 30 35 23.1 0.52
R487 R488 R489 3rd Level Canals R490 3rd Level Canal Characteristics
R491 Total length of all 3rd Level Canals, km 440.0 2,000.0 1,530.0 850 644 78 923.7 0.77
R492 Length of avg. 3rd level canal, km 2.0 5.0 5.0 0.8 1 2.5 2.7 0.69
R493 Condition of canal lining (10=horrible;1=Xlnt) 2.0 4.0 2.0 5 n/a 2 3.0 0.47
R494 Approximate canal invert slope 0.001 or more 0.0 0.0 0.0004 0.0005 0.001 0.0 0.71
R495 Do uncontrolled drain flows enter the canal? Y N N N N N
R496 % of cross section filled with silt 5.0 5.0 5.0 5 20 0 6.7 1.02
R497 Total # of spill points for a typical canal 1.0 0.0 1.0 1 1 0 0.7 0.77
R498 Water travel time (hours) from start to first deliveries 0.1 0.3 0.1 0.5 1 0.5 0.4 0.84
R499 Has seepage been measured well? N N N N N N R500 Have spills been measured well? N N N N N N
R501 # of Regulating reservoirs in system ? 0.0 0.0 0 0 0 0.0
R502 How effectively are they used for reg.? (10=horr; 1=Xlnt) 3.0 n/a n/a n/a n/a n/a 3.0
R503 # of wells feeding into the canal 0.0 0.0 0.0 0 0 0 0.0
R504 How effectively are they used for reg.? (10=horr; 1=Xlnt) n/a n/a n/a n/a n/a n/a
R505 R506 Lining type R507 Masonry, % 0.0 50.0 0.0 16.7 1.73 R508 Concrete, % 50.0 0.0 0.4 100 100 50.1 1.00 R509 Unlined, % 50.0 50.0 0.6 100 50.2 0.81
Rating of various items R510 (10=horrible; 1=excellent) R511 Integrity of canal banks 1.0 5.0 3.0 n/a 5 2 3.2 0.56 R512 Integrity of canal lining 2.0 4.0 3.0 5 n/a 2 3.2 0.41
R513 General maintenance of structures 2.0 5.0 2.0 5 4 6 4.0 0.42 R514 Seepage control 1.0 3.0 2.0 2 2 2 2.0 0.32 R515 Weed control 4.0 3.0 2.0 1 4 5 3.2 0.46 R516 Algae/moss control 2.0 3.0 2.0 1 4 1 2.2 0.54
Attachment C - Data for all Projects Page 13

Page 247 of 276
CV
Questionnaire Data
Rio
Mayo
,M
exico
Cu
patitzio
,M
exico
Sald
aña,
Co
lom
bia
Co
ello,
Co
lom
bia
Rio
Yaq
ui
Alto
, DR
Office d
uN
iger, M
ali
Ben
i Am
ir,M
oro
cco
Kem
ub
u,
Malaysia
Mu
da,
Malaysia
Bh
akra, Ind
ia
Dan
tiwad
a,In
dia
Majalg
aon
,In
dia
Seyh
an,
Tu
rkey
Gu
ilan, Iran
Dez, Iran
Lam
Pao
,T
hailan
d
Averag
e
R4
R517 Lack of canal breakage by
customers 1.0 2.0 3.0 1 1 3 1.8 0.54 R518 R519 3rd Level Canal Cross-regulators
R520 Condition of crossregulators(10=horr.;1=Xlnt) 2.0 n/a 2.0 10 4 3 4.2 0.80
Duck billed Combin. weir and Z-long
R521 Type of cross regulator LCW n/a Weir/gate none others crested weir
R522 Do operators live at each X-regulator site? N n/a N n/a N N
R523 Can the ones that exist operate as needed? (10=horr; 1=Xlnt) 2.0 n/a 2.0 n/a 3 10 4.3 0.91
R524 Are they operated as theor. intended?(10=horr; 1=Xlnt) 1.0 n/a 2.0 n/a 3 10 4.0 1.02
R525 Number of cross regulators/km 0.6 n/a 0.1 n/a 2 2.3 1.3 0.84
R526 Are there large overflows at cross regulator sides? Y n/a Y n/a Sometimes Y
R527 Unintended max. controlled w.s. variation in avg. gate in a day,m 0.1 n/a 0.1 n/a 0.25 0.05 0.1 0.84
R528 In months w/ water, what is the max days of no gate change? 180.0 n/a 1.0 n/a 30 0 52.8 1.63
R529 How long does it take an operator to reach a regulator, hrs? 1.0 n/a 1.0 n/a 0.5 0.4 0.7 0.44
R530 How frequently (hrs) will an operator move a gate if reqd/instr? n/a n/a 3.0 n/a 12 1 5.3 1.10
R531 How frequently are gates typically operated? (days) n/a n/a 1.0 n/a 10 1 4.0 1.30
R532 Officially, can gate oper make gate adj. w/o upper approval? n/a n/a Y n/a Y Y
R533 In reality, do gate oper. make adj. w/o upper approval? n/a n/a Y n/a Y Y
R534 If they do operate in reality, how well do they(10=H; 1=Xlt) n/a n/a 2.0 n/a Y Y 2.0 Hours necessary to make a significant setting change on the
R535 gate n/a n/a 0.1 n/a 0.1 0 0.1 1.00 R536 R537 3rd Level X-Regulator Personnel
R538 For whom do the operators work? Guilan
Authority n/a MADA none ODN WUA
R539 Typical education level of operator (yrs of school) 12.0 n/a 9.0 n/a 8 11 10.0 0.18
Easy. Each new board
R540 What is the option for firing an operator? AI n/a Potential n/a Difficult
puts its own operators in
place. Trying to change
that.
R541 Incentives for exemplary work?(10=none/1=high) 10.0 n/a 10.0 n/a 10 10 10.0 0.00
R542 Incentives for average work?(10=none/1=high) 10.0 n/a 10.0 n/a 10 10 10.0 0.00
R543 Operators encouraged to think on their own(10=No; 1-Definitely) 1.0 n/a 2.0 n/a 4 5 3.0 0.61
R544 Is there a formal performance review process annually? N n/a N n/a N N
R545 If so, is it written down & understood by employees? n/a n/a n/a n/a n/a N
R546 # of persons fired in last 10 yrs for incompetence 0.0 n/a 0.0 n/a 0 0 0.0
R547 3rd Level Canal
R548 Communications/Transportation How often do operators communicate with next higher
R549 level? (hr) 8.0 n/a 3.0 168 24 24 45.4 1.52
R550 How is communication done? P,R,M n/a Personal personal Motorcycle personal,
phone
Attachment C - Data for all Projects Page 14

Page 248 of 276
CV
Questionnaire Data
Rio
Mayo
,M
exico
Cu
patitzio
,M
exico
Sald
aña,
Co
lom
bia
Co
ello,
Co
lom
bia
Rio
Yaq
ui
Alto
, DR
Office d
uN
iger, M
ali
Ben
i Am
ir,M
oro
cco
Kem
ub
u,
Malaysia
Mu
da,
Malaysia
Bh
akra, Ind
ia
Dan
tiwad
a,In
dia
Majalg
aon
,In
dia
Seyh
an,
Tu
rkey
Gu
ilan, Iran
Dez, Iran
Lam
Pao
,T
hailan
d
Averag
e
R4
R551 What is the transportation of mobile personnel?
Own Motorcycle motorcycle motorcycle n/a Motorcycle auto
R552 How many automatic remote monitoring sites are there? 0.0 0.0 0.0 0 0 0 0.0
R553
How often do X-reg. operators/bosses meet with rep. of d/s level? (days) n/a n/a 1.0 n/a 1 1 1.0 0.00
R554 How often does representative of u/s level visit? (days) 1.0 n/a 3.0 n/a 14 15 8.3 0.88
R555 # of sides of canal with a road for trucks 1.0 1.0 1.0 n/a 1 1 1.0 0.00
R556 # of sides of canal with a road suitable for motorcycles 1.0 1.0 2.0 n/a 1.5 1 1.3 0.34
R557 What % of water season is the canal accessible by trucks? 0.5 50.0 75.0 n/a 75 100 60.1 0.63
R558 Time needed for mgr. to travel down the longest canal, hrs 2.0 1.0 1.0 n/a 0.25 0.3 0.9 0.78
R559 Hours needed to reach the office of this stretch from office of supplier 1.0 2.0 1.0 n/a 1 1.5 1.3 0.34
R560 R561 3rd Level Canal Off-Takes
R562 % of offtake flows taken from unofficial offtakes 5.0 0.0 0.0 5 0 7 2.8 1.13
R563 Typical significant offtake flow rate, cms 0.0 1.0 0.2 0.03 0.2 0.12 0.3 1.43
R564 Number of significant offtakes/km 0.6 0.5 3.0 9 4 1.7 3.1 1.01
R565 Typ. chng. in w.s. elevation across off-take, m 1.0 0.1 0.1 0.3 0.15 0.2 0.3 1.18
R566 Can they physically operate as needed? (10=horr; 1=Xlnt) 2.0 3.0 5.0 5 4 7 4.3 0.40
R567 Are they phys. operated as theor. intended?(10=horr; 1=Xlnt) 2.0 2.0 5.0 10 4 5 4.7 0.63
R568 How well can offtakes be supplied at low Q? (10=horr/1=Xlnt) 2.0 10.0 7.0 1 7 1 4.7 0.82
R569 Who operate the offtakes? (1=this level;2=lower;3=both) 3.0 1.0 3.0 2 3 1 2.2 0.45
R570 How frequently is the offtake checked? (hours) 4.0 3.0 3.0 n/a 12 48 14.0 1.38
R571 Officially,how frequently should offtakes be adjusted (days) n/a n/a 0.3 n/a 1 3 1.4 0.98
R572 Officially,can offtake oper. make Q adj. w/o upper approval? Y n/a Y N Y Y
R573 In reality, do offtake oper. make Q adj. w/o upper approval? Y n/a Y N Y Y
R574 Scheduling of Flows From 3rd Level
R575 Canal Offtakes
R576 What % of the time is the flow OFFICIALLY scheduled as follows: 0.0 0.0 0.0 0.0
R577 Proportional flow 0.0 0.0 0.0 0.0 R578 Rotation 30.0 100.0 100.0 76.7 0.53
R579 Schedule computed by higher level
no lower level input 0.0 0.0 0.0 0.0
R580 Schedule computed by higher level
some lower level input 70.0 0.0 0.0 100 42.5 1.19
R581 Schedule by operator based on
judgement of supply and d/s needs 0.0 0.0 0.0 10 2.5 2.00
R582 Schedule actively matches real-time
lower level requests 0.0 0.0 0.0 90 100 38.0 1.37
R583 What % of the time is the flow ACTUALLY scheduled as follows: 0.0 0.0 0.0 0.0
R584 Proportional flow 0.0 0.0 0.0 0.0 R585 Rotation 30.0 100.0 25.0 51.7 0.81
R586 Schedule computed by higher level
no lower level input 0.0 0.0 0.0 0.0
R587 Schedule computed by higher level
some lower level input 0.0 0.0 0.0 100 25.0 2.00
Attachment C - Data for all Projects Page 15

Page 249 of 276
CV
Questionnaire Data
Rio
Mayo
,M
exico
Cu
patitzio
,M
exico
Sald
aña,
Co
lom
bia
Co
ello,
Co
lom
bia
Rio
Yaq
ui
Alto
, DR
Office d
uN
iger, M
ali
Ben
i Am
ir,M
oro
cco
Kem
ub
u,
Malaysia
Mu
da,
Malaysia
Bh
akra, Ind
ia
Dan
tiwad
a,In
dia
Majalg
aon
,In
dia
Seyh
an,
Tu
rkey
Gu
ilan, Iran
Dez, Iran
Lam
Pao
,T
hailan
d
Averag
e
R4
R588 Schedule by operator based on
judgement of supply and d/s needs 70.0 0.0 75.0 10 38.8 1.01
R589 Schedule actively matches real-time
lower level requests 0.0 0.0 0.0 90 100 38.0 1.37 R590
Control of Flows From 3rd Level R591 Canal Offtakes
Baffle Un-gated CHOs and Module and Distributor R592 Official type of flow control device Distributor Outlet (APM) Field TOs none Semi-module Module
Baffle CHOs and Module and Distributor R593 Common name Distributor APM FTO n/a Semi-module Module
Official type of flow measurement Baffle Module and Distributor R594 device Distributor APM CHOs n/a Semi-module Module
R595 Common name? Baffle
Distributor APM CHOs n/a Module and Semi-module
Distributor Module
R596 Actual flow control/measurement fair poor fair on CHOs n/a
With module OK; just on/off
with semi-module
Distributor Module
R597 Probably accuracy of Q control/meas., +/-% 10.0 0.4 0.2 n/a 30 30 14.1 1.06
R598 R599 R600 Water Distribution to Individual Ownership units (e.g., field or farm)
What % of the distribution is done R601 by R602 Employee of the project 0 0 0 5 0 0 0 0 0 0.6 3.00 R603 Employee of the WUA 0 0 0 75 1 0 0 0 0 40 70 50 10 18.9 1.53 R604 Volunteer of the WUA 0 0 0 0 0 0 0 0 0 40 4.0 3.16 R605 No one - inter-farmer cooperation 100 100 100 20 99 100 100 100 100 100 100 20 30 50 90 100 81.8 0.39
R606 If inter-farmer, # of farmers which
must cooperate on final stage 20 10 20 10 15 5 50 20 20 10 7 10 1.4 4 4 3 13.1 0.90 What % of the distribution is done
R607 through R608 Small unlined distributary canals 65 50 50 0 0 100 98 0 0 100 100 100 100 100 99 64.1 0.68 R609 Larger unlined canals 0 0 0 0 0 0 0 0 0 100 0 9.1 3.32 R610 Field-through-field conveyance 30 0 50 0 0 0 0 60 100 0 24.0 1.47 R611 Pipelines 0 0 0 10 0 0 0 0 0 0 1.0 3.16 R612 Lined canals 5 50 0 90 100 0 2 40 0 0 1 26.2 1.46
R613 General condition of final conveyance (10=horrible; 1=Xlnt) 6 9 5 9 4 5 3 5 7 5 4 8 4 6 8 5 5.8 0.32
R614 Ability to measure flow rate to indiv field/farm (10=horr, 1=Xlnt) 10 9 10 5 10 8 10 8 10 4 10 8 5 6 7 5 7.8 0.28
R615 Ability to measure volume to indiv. field/farm (10=horr, 1=Xlnt) 10 10 10 6 10 10 10 10 10 5 10 10 6 7 7 6 8.6 0.23
R616 R617 FLEXIBILITY to final field/farm
R618 Are there written arrang/policies for FREQUENCY of water delivery? Y Y N Y Y Y Y Y N Y Y Y N N N N
R619 How closely are they followed?
(10=horr., 1=Xlnt) 7 8 n/a 3 7 2 5 3 n/a 2 10 3 n/a n/a n/a 5.0 0.57
R620 Are actual practices better than official policies?(10-No;1-Yes) 3 8 n/a 2 10 1 8 2 n/a 10 1 10 n/a 1 3 4.9 0.79
R621 Are there written arrang/policies for RATE of water delivery? N Y Y Y Y Y Y Y Y Y N N Y Y N N
R622 How closely are they followed?
(10=horr., 1=Xlnt) n/a 7 2 3 7 1 5 4 7 2 n/a 2 5 n/a 4.1 0.55
R623 Are actual practices better than official policies?(10-No;1-Yes) n/a 5 2 3 10 5 10 3 2 10 n/a 1 5 4 5.0 0.66
R624 Are there written arrang/policies for DURATION of water delivery? Y Y N N Y Y Y Y N Y Y N Y Y N N
R625 How closely are they followed?
(10=horr., 1=Xlnt) 7 5 n/a n/a 5 5 2 3 n/a 2 10 5 3 n/a 4.7 0.52
R626 Are actual practices better than official policies?(10-No;1-Yes) 3 7 n/a n/a 5 1 2 2 n/a 10 1 1 10 4 4.2 0.82
What % of the time/farmers actually R627 receive water as:? R628 Continuous flow - no adjustments 0 0 0 0 0 0 0 0 0 0 0.0
Attachment C - Data for all Projects Page 16
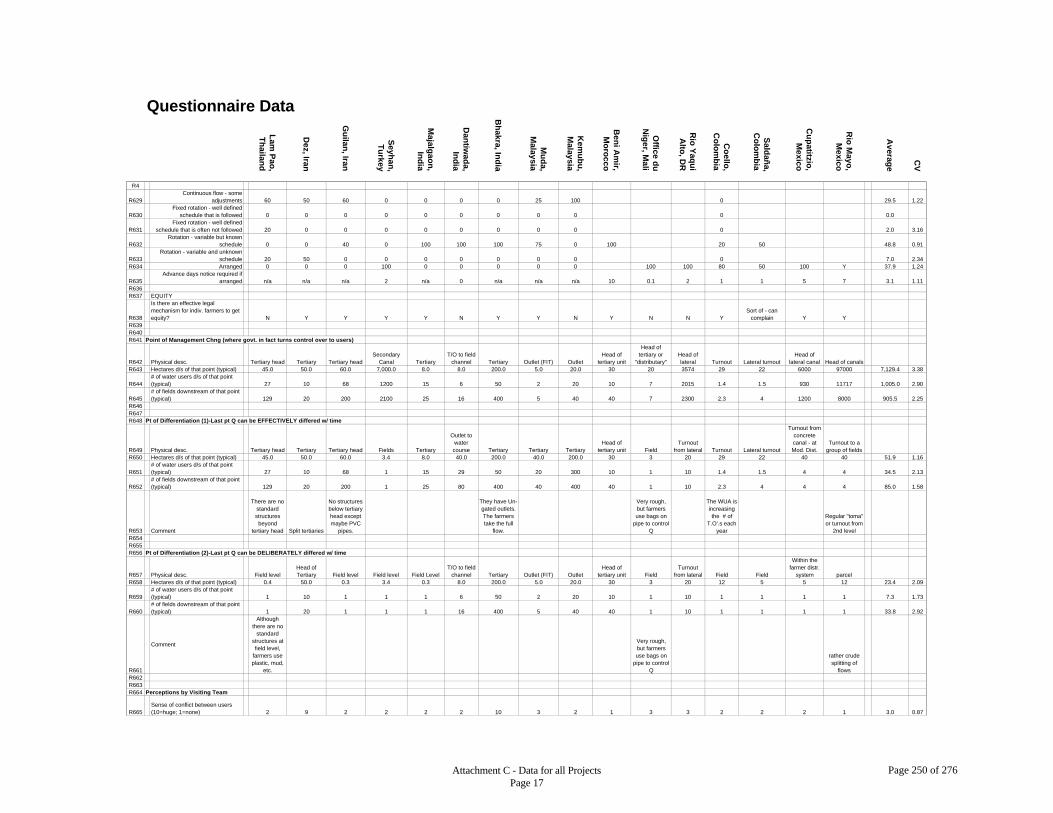
Page 250 of 276
CV
Questionnaire Data
Rio
Mayo
,M
exico
Cu
patitzio
,M
exico
Sald
aña,
Co
lom
bia
Co
ello,
Co
lom
bia
Rio
Yaq
ui
Alto
, DR
Office d
uN
iger, M
ali
Ben
i Am
ir,M
oro
cco
Kem
ub
u,
Malaysia
Mu
da,
Malaysia
Bh
akra, Ind
ia
Dan
tiwad
a,In
dia
Majalg
aon
,In
dia
Seyh
an,
Tu
rkey
Gu
ilan, Iran
Dez, Iran
Lam
Pao
,T
hailan
d
Averag
e
R4
R629 Continuous flow - some
adjustments 60 50 60 0 0 0 0 25 100 0 29.5 1.22
R630 Fixed rotation - well defined
schedule that is followed 0 0 0 0 0 0 0 0 0 0 0.0
R631 Fixed rotation - well defined
schedule that is often not followed 20 0 0 0 0 0 0 0 0 0 2.0 3.16
R632 Rotation - variable but known
schedule 0 0 40 0 100 100 100 75 0 100 20 50 48.8 0.91
R633 Rotation - variable and unknown
schedule 20 50 0 0 0 0 0 0 0 0 7.0 2.34 R634 Arranged 0 0 0 100 0 0 0 0 0 100 100 80 50 100 Y 37.9 1.24
R635 Advance days notice required if
arranged n/a n/a n/a 2 n/a 0 n/a n/a n/a 10 0.1 2 1 1 5 7 3.1 1.11 R636 R637 EQUITY
Is there an effective legal mechanism for indiv. farmers to get Sort of - can
R638 equity? N Y Y Y Y N Y Y N Y N N Y complain Y Y R639 R640 R641 Point of Management Chng (where govt. in fact turns control over to users)
Head of Secondary T/O to field Head of tertiary or Head of Head of
R642 Physical desc. Tertiary head Tertiary Tertiary head Canal Tertiary channel Tertiary Outlet (FIT) Outlet tertiary unit "distributary" lateral Turnout Lateral turnout lateral canal Head of canals R643 Hectares d/s of that point (typical) 45.0 50.0 60.0 7,000.0 8.0 8.0 200.0 5.0 20.0 30 20 3574 29 22 6000 97000 7,129.4 3.38
R644 # of water users d/s of that point (typical) 27 10 68 1200 15 6 50 2 20 10 7 2015 1.4 1.5 930 11717 1,005.0 2.90
R645 # of fields downstream of that point (typical) 129 20 200 2100 25 16 400 5 40 40 7 2300 2.3 4 1200 8000 905.5 2.25
R646 R647 R648 Pt of Differentiation (1)-Last pt Q can be EFFECTIVELY differed w/ time
R649 Physical desc. Tertiary head Tertiary Tertiary head Fields Tertiary
Outlet to water course Tertiary Tertiary Tertiary
Head of tertiary unit Field
Turnout from lateral Turnout Lateral turnout
Turnout from concrete canal - at Mod. Dist.
Turnout to a group of fields
R650 Hectares d/s of that point (typical) 45.0 50.0 60.0 3.4 8.0 40.0 200.0 40.0 200.0 30 3 20 29 22 40 40 51.9 1.16
R651 # of water users d/s of that point (typical) 27 10 68 1 15 29 50 20 300 10 1 10 1.4 1.5 4 4 34.5 2.13
R652 # of fields downstream of that point (typical) 129 20 200 1 25 80 400 40 400 40 1 10 2.3 4 4 4 85.0 1.58
R653 Comment
There are no standard structures beyond
tertiary head Split tertiaries
No structures below tertiary head except maybe PVC
pipes.
They have Ungated outlets. The farmers take the full
flow.
Very rough, but farmers use bags on
pipe to control Q
The WUA is increasing the # of
T.O'.s each year
Regular "toma" or turnout from
2nd level R654 R655 R656 Pt of Differentiation (2)-Last pt Q can be DELIBERATELY differed w/ time
Within the Head of T/O to field Head of Turnout farmer distr.
R657 Physical desc. Field level Tertiary Field level Field level Field Level channel Tertiary Outlet (FIT) Outlet tertiary unit Field from lateral Field Field system parcel R658 Hectares d/s of that point (typical) 0.4 50.0 0.3 3.4 0.3 8.0 200.0 5.0 20.0 30 3 20 12 5 5 12 23.4 2.09
R659 # of water users d/s of that point (typical) 1 10 1 1 1 6 50 2 20 10 1 10 1 1 1 1 7.3 1.73
R660 # of fields downstream of that point (typical) 1 20 1 1 1 16 400 5 40 40 1 10 1 1 1 1 33.8 2.92
R661
Comment
Although there are no
standard structures at field level,
farmers use plastic, mud,
etc.
Very rough, but farmers use bags on
pipe to control Q
rather crude splitting of
flows R662 R663 R664 Perceptions by Visiting Team
R665 Sense of conflict between users (10=huge; 1=none) 2 9 2 2 2 2 10 3 2 1 3 3 2 2 2 1 3.0 0.87
Attachment C - Data for all Projects Page 17

Page 251 of 276
CV
Questionnaire Data
Rio
Mayo
,M
exico
Cu
patitzio
,M
exico
Sald
aña,
Co
lom
bia
Co
ello,
Co
lom
bia
Rio
Yaq
ui
Alto
, DR
Office d
uN
iger, M
ali
Ben
i Am
ir,M
oro
cco
Kem
ub
u,
Malaysia
Mu
da,
Malaysia
Bh
akra, Ind
ia
Dan
tiwad
a,In
dia
Majalg
aon
,In
dia
Seyh
an,
Tu
rkey
Gu
ilan, Iran
Dez, Iran
Lam
Pao
,T
hailan
d
Averag
e
R4
R666 Sense of conflict between users and govt (10=huge; 1=none) 3 5 2 2 3 2 8 2 4 2 2 3 3 5 3 2 3.2 0.52
R667
Sense of inequity of deliveries throughout project (10=huge;1=none) 5 5 2 3 2 3 9 3 2 3 7 4 2 3 3 2 3.6 0.55
R668 Ability to convert to modern on/farm irrig. systems (10=none; 1=easy) 8 4 5 2 7 10 7 8 8 7 1 1 4 5 8 4 5.6 0.49
R669 R670 R671 VARIOUS RATIOS
R672 **CI (confidence interval) is
percent of reported value
R673 Hectares/Operator 215 579 618 210 113 124 488 243 204 267 981 893 2,751 778 1,976 1,128 723.0 1.01 R674 CI, +/-% 3 10 5 10 25 10 25 25 30 10 10 10 5 10 20 5 13.3 0.65
R675 Farmers/Operator 97.5 103.4 537.8 43.4 225.0 111.9 285.7 157.5 300.0 81.0 384.6 500.0 275.1 72.7 242.4 136.2 222.1 0.68 R676 CI, +/-% 5 10 5 10 25 15 25 25 30 10 15 10 20 10 20 5 15.0 0.54 R677 Hectares/Km dist. system 80.7 131.3 166.4 34.0 36.2 48.7 145.3 30.3 39.8 99.3 50.6 28.9 107.3 86.4 72.1 67.4 76.5 0.57 R678 CI, +/-% 3 10 5 5 15 10 15 20 25 5 10 5 5 5 5 5 9.3 0.69
R679 Cropping Intensity - wet season (5 yr. avg.) 0.8 n/a n/a n/a 0.0 0.0 0.9 1.0 0.8 0.9 1.0 1.0 0.8 0.8 0.3 0.9 0.7 0.50
R680 CI, +/-% 7 n/a n/a n/a 10 5 10 5 15 10 5 30 10 10 15 5 10.5 0.65
R681 Cropping intensity - dry season (5 yr. avg.) 0.3 0.4 1.0 0.8 0.2 0.7 1.0 1.0 0.6 0.5 0.2 0.6 0.7 0.8 0.6 0.2 0.6 0.46
R682 CI, +/-% 7 15 10 10 10 15 10 5 15 10 20 30 10 10 15 10 12.6 0.47
R683 Cropping intensity - annual (5 yr. avg.) 1.2 1.0 1.0 0.8 0.3 0.7 1.9 2.0 1.5 1.3 1.2 1.2 1.4 1.6 0.7 1.1 1.2 0.37
R684 CI, +/-% 7 15 10 10 10 15 10 5 15 15 15 30 15 10 20 7 13.1 0.46
R685 Cropping intensity - annual (typical) 1.4 1.0 1.0 0.9 0.3 1.1 1.9 2.0 1.5 1.3 1.2 1.2 1.4 1.6 0.7 1.1 1.2 0.34 R686 CI, +/-% 10 10 10 10 10 10 10 5 15 15 20 30 15 10 25 10 13.4 0.48
R687 O&M Expenditures (inc. salaries)$/ha 52.7 32.7 6.5 70.7 9.4 37.0 14.9 100.0 293.7 109.9 100.9 67.4 97.2 151.8 14.2 50.8 75.6 0.95
R688 CI, +/-% 15 15 25 10 25 15 30 25 25 20 35 15 5 5 10 10 17.8 0.50
R689 O&M Expenditures - $/mcm of beneficial use 3,928 4,190 867 9,513 1,664 5,235 2,023 6,340 28,169 14,715 5,508 6,770 24,038 22,693 4,150 9,729 9,345.9 0.91
R690 CI, +/-% 15 10 15 10 10 25 30 25 25 20 35 25 30 20 15 20.7 0.39
R691 Ratio of Rainfall/ETo - ***Dry season 1.3 0.1 0.7 0.2 0.1 0.0 0.1 1.8 1.4 0.6 0.2 0.5 1.0 0.9 n/a 0.6 0.91
R692 CI, +/-% 20 15 15 25 10 10 10 10 15 15 25 10 20 20 15 15.7 0.34
R693 Ratio of Rainfall/ETo - annual 0.8 0.1 1.2 0.6 0.1 1.2 0.4 1.6 1.9 0.3 0.2 0.5 0.8 0.9 0.3 0.1 0.7 0.81 R694 CI, +/-% 20 15 10 25 25 10 10 10 15 15 25 10 20 20 20 10 16.3 0.36
R695 Peak LPS/ha - (Gross max project LPS)/(actual service area) 2.46 3.28 1.01 1.91 0.89 0.87 0.24 1.26 1.85 0.56 2.29 1.34 1.12 2.59 2.12 0.76 1.5 0.55
R696 CI, +/-% 20 20 20 20 15 20 15 20 20 15 25 30 20 25 25 20 20.6 0.20
R697 Peak LPS/ha - (Gross max project LPS)/(100% intensity service area) 0.99 1.97 1.01 1.70 0.89 0.97 0.22 1.24 1.52 0.50 0.37 1.34 0.84 2.07 1.16 0.68 1.1 0.49
R698 CI, +/-% 20 20 20 20 15 20 15 20 20 15 25 30 20 25 25 20 20.6 0.20
R699
Water charge - $/ha (avg/yr per physical ha irrigated - assume 100% collected) 0.00 33.84 15.02 51.77 41.06 2.85 8.78 20.62 0.00 102.50 77.79 26.82 75.53 136.00 9.96 36.46 39.9 0.99
R700 CI, +/-% 0 10 30 10 10 30 10 10 0 20 30 25 10 10 40 15 16.3 0.72
R701 Water charge - $/mcm delivered to the farm - assume 100% collected) 0 1,239 2,297 3,885 1,101 239 1,682 4,107 0 21,219 3,429 1,282 8,549 9,081 757 5,618 4,030.3 1.34
R702 CI, +/-% 0 10 30 10 10 30 10 10 0 20 30 25 10 10 40 15 16.3 0.72
R703 Reservoir water storage/ service area (mm-ha/ha) 2,059 3,365 766 629 2,216 1,194 1,053 1,134 755 3,037 845
R704 CI, +/-% 35 25 30 25 25 30 50 20 30 10 15 30 20 10 25 20 25.0 0.39
R705 Number of Turnouts per (operator/ gate operator/ supervisor) 5 12 10 62 14 16 5 6 5 10 42 30 81 39 19 66 26.3 0.94
R706 CI, +/-% 5 10 5 10 25 15 25 25 30 10 15 10 20 10 20 5 15.0 0.54
R707 Irrigation Supply to Fields (cubic m/ha) 9,183 27,321 6,539 10,525 3,356 13,279 9,764 9,928 11,836 8,824 28,427 20,915 12,369 26,429 9,477 7,398 13,473.1 0.58 R708 CI, +/-% 35 25 30 25 25 30 50 20 30 25 20 28.6 0.29
R709 Output per cropped area (labor days/ha) 81.2 952.7 130.6 312.2 321.4 488.4 217.3 83.1 111.2 805.9 733.6 814.3 204.2 281.4 178.2 243.0 372.4 0.78
R710 CI, +/-% 25 20 20 20 20 15 20 15 20 30 30 30 25 15 22 15 21.4 0.25
Attachment C - Data for all Projects Page 18

Page 252 of 276
CV
Questionnaire Data
Rio
Mayo
,M
exico
Cu
patitzio
,M
exico
Sald
aña,
Co
lom
bia
Co
ello,
Co
lom
bia
Rio
Yaq
ui
Alto
, DR
Office d
uN
iger, M
ali
Ben
i Am
ir,M
oro
cco
Kem
ub
u,
Malaysia
Mu
da,
Malaysia
Bh
akra, Ind
ia
Dan
tiwad
a,In
dia
Majalg
aon
,In
dia
Seyh
an,
Tu
rkey
Gu
ilan, Iran
Dez, Iran
Lam
Pao
,T
hailan
d
Averag
e
R4
R711 Output per unit command (labor days/ha) 112.9 952.7 130.6 277.4 96.4 542.1 406.3 164.2 162.4 805.9 117.4 814.3 204.2 239.4 27.8 219.9 329.6 0.88
R712 CI, +/-% 25 20 20 20 20 15 20 15 20 30 30 30 25 15 22 15 21.4 0.25
VARIOUS COMPUTED VALUES Annual, mcm
Avg Vol. Discharged into canals 755 3166 2056 1161 55 432 4104 1081 338 211 2653 115 438 817 180 920 1,155.2 1.05
Wet Season, mcm Estimate of net groundwater 0.0 0.0 0.0 0.0 0.0 0.0 2916.0 0.0 0.0 0.0 0.0 0.0 0.0 0.0 0.0 0.0 182.3 4.00 Other Surface supplies 0.0 0.0 0.0 0.0 0.0 0.0 0.0 106.0 13.0 0.0 0.0 0.0 0.0 0.0 0.0 0.0 7.4 3.56
Total Irrigation Water Supplied at the Head of Project (includes uncontrolled surface flows, surface diversions and net GW) 390.0 989.0 0.0 0.0 5.1 0.0 4860.0 663.0 139.0 107.6 2049.1 115.0 219.5 391.4 31.7 0.0 622.5 2.01
Total Gross Rain 498.8 134.0 1750.8 554.9 10.3 361.0 0.0 1346.4 336.2 93.2 272.8 35.2 109.4 68.3 30.4 0.0 Effective Rain 360.7 24.0 0.0 0.0 6.2 0.0 0.0 610.1 84.5 35.9 133.4 16.8 43.7 34.1 18.2 0.0 85.5 1.95 Leaching Requirement 0.0 24.1 0.0 0.0 0.0 0.0 0.0 0.0 0.0 0.0 0.0 0.0 0.0 0.0 0.0 0.0 1.5 4.00
ETc (total) 403.6 456.9 0.0 0.0 10.1 0.0 4779.0 807.0 106.4 134.3 945.8 52.4 98.2 75.7 27.7 0.0 493.6 2.39 ETc of Irrigation Water 115.9 457.0 0.0 0.0 3.6 0.0 3005.0 213.4 27.7 98.4 812.4 35.6 54.4 41.6 9.5 0.0 304.7 2.47
Dry Season, mcm Estimate of net groundwater 0.0 0.0 0.0 0.0 0.0 216.0 3240.0 0.0 0.0 0.0 0.0 0.0 0.0 0.0 0.0 0.0 216.0 3.74 Other Surface supplies 0.0 0.0 308.0 0.0 0.0 0.0 0.0 110.0 21.0 0.0 0.0 0.0 0.0 0.0 0.0 0.0 27.4 2.91
Total Irrigation Water Supplied at the Head of Project (includes uncontrolled surface flows, surface diversions and net GW) 307.0 2177.0 2364.0 1161.0 49.0 648.0 5400.0 635.0 233.0 103.7 604.2 0.0 241.4 425.7 102.1 920.0 960.7 1.44 Total Gross Rain 59.2 74.9 1276.1 188.7 4.1 0.0 0.0 777.0 101.1 7.6 1.2 0.0 82.4 61.6 0.7 283.0 182.3 1.92 Effective Rain 38.4 0.0 1001.1 90.8 0.5 0.0 0.0 417.1 41.4 1.0 0.0 0.0 32.9 30.8 0.3 113.2 110.5 2.35 Leaching Requirement 0.0 8.5 0.0 0.0 0.0 0.0 0.0 0.0 0.0 0.0 0.0 0.0 0.0 0.0 0.0 0.0 0.5 4.00
ETc (total) 165.4 161.5 1771.9 579.0 27.5 375.0 3510.0 538.0 81.4 112.0 141.9 0.0 82.7 94.9 24.8 590.0 516.0 1.76 ETc of Irrigation Water 137.5 170.0 1098.0 610.0 13.7 186.0 3322.0 122.2 47.5 111.0 141.9 0.0 49.7 64.1 24.5 506.3 412.8 2.01
58.0 0.0 0.0 0.0 0.8 0.0 0.0 -1.0 0.0 0.0 0.0 0.0 -22.9 0.0 46.3 0.0
EXTRAS Percent Main Canals Lined 95 90 60 100 100 100 100 0 0 100 0 100 0 3 100 24 60.8 0.76 Percent Secondary Canals Lined 95 90 50 95 90 100 90 40 0 99 0 95 6 0 100 8 59.9 0.72 Rice - Deep Percolation and Seepage Losses (annual) in mcm 170 0 705 0 0 0 888 873 138 0 55 0 72 100 0 0 187.6 1.71
Number of farmers involved in the final stage of delivery 20.0 10.0 20.0 2.8 15.0 5.0 50.0 20.0 20.0 10.0 7.0 2.8 1.1 2.5 3.7 3.0
Rice Yields (Main Season) mT/ha 3.10 4.17 3.00 4.50 4.20 5.30 6.50 6.30 4.6 0.28
Attachment C - Data for all Projects Page 19

Page 253 of 276
Attachment D Internal Indicators Description and Ranking Criteria
Indicator Sub-Indicator
Ranking Criteria Wt.
I-1 Actual service to individual fields
I-1A Measuremen t of volumes to field
4 - Excellent measurement and control devices, properly operated and recorded.
3 - Reasonable meas. & control devices, avg. operation. 2 - Meas. of volumes and flows - useful but poor. 1 - Meas. of flows, reasonably well. 0 - No measurement of volumes or flows.
1
I-1B Flexibility to field
4 - Unlimited freq., rate, duration, but arranged by farmer within a few days.
3 - Fixed freq., rate, or duration, but arranged. 2 - Dictated rotation, but matches approx. crop need. 1 - Rotation, but uncertain. 0 - No rules.
2
I-1C Reliability to field (incl. weeks avail. vs. week needed)
4 - Water always arrives with freq., rate, and dur. promised. Volume is known.
3 - A few days delay occasionally, but v. reliable in rate and duration. Volume is known.
2 - Volume is unknown at field, but water arrives when about as needed and in the right amounts.
1 - Volume is unknown at field, and deliveries are fairly unreliable, but less than 50% of the time.
0 - Unreliable freq., rate, duration, more than 50% of the time, and volume is unknown.
4
I-1D Apparent equity
4 - It appears that fields throughout the project and within tertiary units all receive the same type of water.
3 - Areas of the project receive the same amounts, but within an area it is somewhat inequitable.
2 - Areas of the project receive somewhat different amounts (unintentionally), but within an area it is equitable.
1 - It appears to be somewhat inequitable both between areas and within areas.
0 - Appears to be quite inequitable (differences more than 100%) throughout the project.
4
Attachment D - Internal Indicator Description and Ranking Criteria Page 1

Page 254 of 276
I-2 Actual Service to avg. point of EFFECTIVE Differentiation
This is the last point w/ a realistic flow control (and)
measurement structure. For example, at the start of a
tertiary canal where farmers take over.
I-2A # of fields 4 - 1 field 1 downstrea 3 - less than 3 m (less is 2 - less than 6 better) 2 - less than 10
1 - 10 or greater
I-2B Measureme nt of volumes to point
4 - Excellent measurement and control devices, properly operated and recorded.
3 - Reasonable meas. & control devices, avg. operation.
2 - Meas. of volumes and flows - useful but poor.
1 - Meas. of flows, reasonably well. 0 - No measurement of volumes or flows.
4
I-2C Flexibility 4 - Unlimited freq., rate, duration, but arranged by users within a few days.
3 - Fixed freq., rate, or duration, but arranged. 2 - Dictated rotation, but matches approx. crop
need. 1 - Rotation, but uncertain. 0 - No rules.
4
I-2D Reliability 4 - Water always arrives with freq., rate, and dur. promised. Volume is known.
3 - A few days delay occasionally, but v. reliable in rate and duration. Volume is known.
2 - Volume is unknown at field, but water arrives when about as needed and in the right amounts.
1 - Volume is unknown at field, and deliveries are fairly unreliable, but less than 50% of the time.
0 - Unreliable freq., rate, duration, more than 50% of the time, and volume is unknown.
4
I-2E Apparent equity
4 - It appears that points throughout the project and within tertiary units all receive the same type of water.
3 - Areas of the project receive the same amounts, but within an area it is somewhat inequitable.
2 - Areas of the project receive somewhat different amounts (unintentionally), but within an area it is equitable.
1 - It appears to be somewhat inequitable both between areas and within areas.
0 - Appears to be quite inequitable (differences more than 100%) throughout the project.
4
Attachment D - Internal Indicator Description and Ranking Criteria Page 2

Page 255 of 276
I-3 Actual Service to avg. point of DELIBERATE Q
Differentiation This is the last point w/ a
deliberate flow control (and) measurement structure.
I-3A # of fields 4 - 1 field 1 downstream 3 - less than 3 (less is 2 - less than 6 better) 1 - less than 10
0 - 10 or greater I-3B Measuremen
t of volumes to point
4 - Excellent measurement and control devices, properly operated and recorded.
3 - Reasonable meas. & control devices, avg. operation
2 - Meas. of volumes and flows - useful but poor 1 - Meas. of flows, reasonably well 0 - No measurement of volumes or flows
4
I-3C Flexibility 4 - Unlimited freq., rate, duration, but arranged by users within a few days.
3 - Fixed freq., rate, or duration, but arranged. 2 - Dictated rotation, but matches approx. crop
need. 1 - Rotation, but uncertain. 0 - No rules.
4
I-3D Reliability 4 - Water always arrives with freq., rate, and dur. Promised. Volume is known.
3 - A few days delay occasionally, but v. reliable in rate and duration. Volume is known.
2 - Volume is unknown at field, but water arrives when about as needed and in the right amounts.
1 - Volume is unknown at field, and deliveries are fairly unreliable, but less than 50% of the time.
0 - Unreliable freq., rate, duration, more than 50% of the time, and volume is unknown.
4
I-3E Apparent equity
4 - It appears that points throughout the project and within tertiary units all receive the same type of water.
3 - Areas of the project receive the same amounts, but within an area it is somewhat inequitable.
2 - Areas of the project receive somewhat different amounts (unintentionally), but within an area it is equitable.
1 - It appears to be somewhat inequitable both between areas and within areas.
0 - Appears to be quite inequitable (differences more than 100%) throughout the project.
4
Attachment D - Internal Indicator Description and Ranking Criteria Page 3

Page 256 of 276
I-4 Actual Service by Main Canals to its Subcanals (Submains)
I-4A Flexibility 4 - Wide range of freq., rate, duration, but arranged by downstream canal several times daily based on actual need.
3 - Wide range of freq., rate, duration, but arranged by downstream canal once/day based on actual need.
2 - Schedules adjusted weekly by d/s operators. 1 - Delivery schedule dictated by main canal
operators. Changes at least weekly. 0 - Delivery schedule is unknown by d/s operators,
or changes are less frequent than weekly.
1
I-4B Reliability 4 - Submain operators know the flows, and receive the flows within a few hours of the targeted time. No shortages during the year.
3 - Submain operators know the flows, but may have to wait as long as a day to get the flows they need. Only a few shortages throughout the year.
2 - The flows arrive plus or minus 2 days, but are correct. Perhaps 4 weeks of some shortage throughout the year.
1 - The flows arrive plus or minus 4 days, and are incorrect. Perhaps 7 weeks of some shortage throughout the year.
0 - Unreliable freq., rate, duration, more than 50% of the time, and volume is unknown.
1
I-4C Equity 4 - It appears that points along the canal get the same level of good service.
3 - 5% of canal area receives significantly poorer service than the average.
2 - 15% of canal area receives significantly poorer service than the average.
1 - 25% of canal area receives significantly poorer service than the average.
0 - worse than 25% , or may not even be any pattern.
1
I-4D Control of flows to submains as stated
4 - Flows are known and controlled within 5%. 3 - Flows known and controlled are within 10%. 2 - Flows are not known but are controlled within
10%. 1 - Flows are controlled within 20%. 0 - Flows have more variation than 20%.
1.5
I-5 Stated Service to Individual Fields
I-5A Measurement of volumes to field
Same criteria as ACTUAL 1
I-5B Flexibility to field
Same criteria as ACTUAL 2
I-5C Reliability to field (incl. weeks avail. vs. week needed)
Same criteria as ACTUAL 4
I-5D Equity Same criteria as ACTUAL 4
Attachment D - Internal Indicator Description and Ranking Criteria Page 4

Page 257 of 276
I-6 Stated Service to avg. point of EFFECTIVE Differentiation.
I-6A # of fields downstream (less is better)
Same criteria as ACTUAL 1
I-6B Measuremen t of volumes to point
Same criteria as ACTUAL 4
I-6C Flexibility Same criteria as ACTUAL 4 I-6D Reliability Same criteria as ACTUAL 4 I-6E Equity Same criteria as ACTUAL 4 I-7 Stated service to avg. point of
DELIBERATE Q differentiation.
I-7A # of fields downstream (less is better)
Same criteria as ACTUAL 1
I-7B Measuremen t of volumes to point
Same criteria as ACTUAL 4
I-7C Flexibility Same criteria as ACTUAL 4 I-7D Reliability Same criteria as ACTUAL 4 I-7E Equity Same criteria as ACTUAL 4 I-8 Stated Service by Main Canals
to its Subcanals (Submains) I-8A Flexibility Same criteria as ACTUAL 1 I-8B Reliability Same criteria as ACTUAL 1 I-8C Equity Same criteria as ACTUAL 1 I-8D Control of
flows to submains as stated
Same criteria as ACTUAL 1
I-9 Chaos Index (Evidence of No
Anarchy in Canal System u/s of
Ownership Change) I-9A Degree to which
deliveries are not taken out of turn above point of ownership change.
This does not include physical breakage or vandalism; it only refers to unauthorized withdrawal from regular turnouts. Expressed as a % of the time and locations, or as a % of total water delivered. If 10% of the area has a problem 10% of the time, this is a 1% problem (10% of 10%).
2
I-9B Noticeable non-existence of unauthorized turnouts from canals above point of ownership change
Refers to diversions at unauthorized points. Estimate the percentage of total water delivered which falls under this category.
1
I-9C Lack of vandalism of structures above the point of ownership change, to obtain flow.
Estimate the percentage of pertinent structures which have been vandalized to obtain this.
1
Attachment D - Internal Indicator Description and Ranking Criteria Page 5

Page 258 of 276
I-10 Cross-Regulator Hardware (main
canal) I-10A Ease of cross-
regulator operation under current target operation. (This doesn't mean that current targets are being met - just that it would be easy or difficult to meet them)
4 - Very easy to operate. Hardware moves easily and quickly, or hardware has automatic features which work well. Water levels or flows could be controlled easily if desired. Current targets can be met with less than 2 manual changes per day.
3 - Easy and quick to physically operate, but requires many manual interventions per structure per day to meet target.
2 - Cumbersome to operate, but physically possible. Requires more than 5 manual changes per structure per day to meet target, but is difficult or dangerous.
1 - Cumbersome to operate, is difficult or dangerous, and in some cases it is almost physically impossible to meet objectives.
0 - Communications and hardware are very inadequate to meet the requirements. Almost impossible to operate as intended.
1
I-10B Probable ease of cross-regulator operation if system was to be required to provide better service to turnouts (this is related to the suitability of the device, also)
4 - Very easy to operate. Hardware moves easily and quickly, or hardware has automatic features which work well. Water levels or flows could be controlled easily. Targets could be met with less than 2 manual changes per day.
3 - Easy and quick to physically operate, but requires many manual interventions per structure per day to meet target.
2 - Cumbersome to operate, but physically possible. Would require more than 5 manual changes per structure per day to meet target, and would be difficult or dangerous. A person would probably need to be at the gate full time, 24 hours/day
1 - Cumbersome to operate, would be difficult or dangerous, and in some cases would be almost physically impossible to meet objectives.
0 - Communications and hardware are very inadequate to meet the requirements. Almost impossible to operate as desired.
2
I-10C Level of maintenance
4 - Excellent preventative maintenance. Broken items are typically fixed within a few days, except in very unusual circumstances.
3 - Decent preventative maintenance. Broken items are fixed within 2 weeks. Reasonable equipment available for maintenance operations.
2 - Routine maintenance only on critical items. Broken items noticeable throughout project, but not serious.
1 - Even routine maintenance is lacking in many cases. Many broken items noticeable, sometimes on serious items.
0 - Large scale damage due to deferred maintenance. Little or no maintenance equipment in working order.
1
I-10D Fluctuation (max 4- F < 3% 3 daily ±%) of target 3 - 6% > F >=3% value in the canal 2 - 12% > F >=6% itself (NOT the 1 - 18% > F >=12% DELIVERY target value) (e.g., water level in the canal rather than outlet Q)
0 - F >=18%
I-10E Travel time of flow 4 - T < 6 hrs 2 rate change 3 - 6 hrs<=T<12 hours through length of 2 - 12 hrs<=T<24 hrs this canal level 1 - 24 hrs<=T<2 days
0 - 2 days<=T
Attachment D - Internal Indicator Description and Ranking Criteria Page 6

Page 259 of 276
I-11 Capacities (Main Canal)
I-11A Headworks and first canal section capacity vs. peak actual (crop ET-rain) at time of maximum demand, under current operation (i.e., gross compared to net)
4 - C >=2.0 3 - 2.0 >C >=1.6 2 - 1.6>C>=1.3 1 - 1.3>C>=1.0 0 - C < 1.0
1.3
I-11B Headworks and first canal section capacity vs. peak potential (crop ET - rain) with 100% cropping intensity at that time
4 - C >=2.0 3 - 2.0 >C >=1.6 2 - 1.6>C>=1.3 1 - 1.3>C>=1.0 0 - C < 1.0
2.7
I-11C Capacity (limitations) of structures or canal cross section further down in the canal.
4 - No problems passing maximum desired flow rates.
2 - Minor problems. 0 - Serious problems - several structures are
underdesigned.
2
I-11D Availability of effective spill points
4 - Adequate safe spill points. 2 - Moderate number of safe spill, less than needed
but enough to avoid serious damage. 0 - Almost no adequate safe spill points.
1
Attachment D - Internal Indicator Description and Ranking Criteria Page 7

Page 260 of 276
I-12 Turnouts (from main
canals) I-12A Ease of turnout
operation under current target operation mode/frequency .
4 - Very easy to operate. Hardware moves easily and quickly, or hardware has automatic features which work well. Water split or flows could be controlled easily if desired. Current targets can be met accurately with less than 2 manual changes per day.
3 - Easy and quick to physically operate, flow rate or target measurement devices are reasonable but not excellent.
2 - Cumbersome to operate, but physically possible. Flow rate devices or target measurement devices are poor. Many do not appear to be calibrated well.
1 - Cumbersome to operate, is difficult or dangerous, and in some cases it is almost physically impossible to meet objectives. Flow rates or target cannot be measured, but are simply estimated.
0 - Communications and hardware are very inadequate to meet the requirements. Almost impossible to operate as intended.
1
I-12B Ease of turnout operation if system provides better service to turnouts from this canal (this is related to the suitability of the device, also)
4 - Very easy to operate. Hardware moves easily and quickly, or hardware has automatic features which work well. Water split or flows could be controlled easily if desired. Current targets could be met accurately with less than 2 manual changes per day.
3 - Easy and quick to physically operate, flow rate or target measurement devices are reasonable but not excellent.
2 - Cumbersome to operate, but physically possible. Flow rate devices or target measurement devices are poor. Many do not appear to be calibrated well.
1 - Cumbersome to operate, is difficult or dangerous, and in some cases it would be almost physically impossible to meet objectives. Flow rates or target cannot be measured, but would be simply estimated.
0 - Communications and hardware are very inadequate to meet the requirements. Almost impossible to operate as would be intended.
2
I-12C Level of maintenance
4 - Excellent preventative maintenance. Broken items are typically fixed within a few days, except in very unusual circumstances.
3 - Decent preventative maintenance. Broken items are fixed within 2 weeks. Reasonable equipment available for maintenance operations.
2 - Routine maintenance only on critical items. Broken items noticeable throughout project, but not serious.
1 - Even routine maintenance is lacking in many cases. Many broken items noticeable, sometimes on serious items.
0 - Large scale damage due to deferred maintenance. Little or no maintenance equipment in working order.
1
I-12D Capacity (limitations)
4 - No problems passing maximum desired flow rates. 2 - Minor problems. 0 - Serious problems - several structures are underdesigned.
1
Attachment D - Internal Indicator Description and Ranking Criteria Page 8

Page 261 of 276
I-13 Regulating Reservoirs
I-13A Suitability of number and location(s)
4 - Properly located and sufficient quantity. 2 - Some utilization of reg. reservoirs. 0 - None.
2
I-13B Effectiveness of operation 4 - Excellent 2 - Mediocre 0 - Poor
2
I-13C Suitability of capacities 4 - Excellent 2 - Mediocre 0 - Poor
1
I-13D Maintenance 4 - Excellent 2 - Mediocre 0 - Poor
1
I-14 Communications (Main Canal)
I-14A Actual frequency of communication of operators along this canal with upper level
4 - F> 6 times/day 3 - 6/day>= F > 3/day 2 - 3/day>=F > 1/day 1 - F = 1/day 0 - F < once/week
1
I-14B Actual frequency of communication of operators or supervisors along this canal (or indirectly by upper level that then transmits orders down to them) with personnel at lower level
4 - F> 3 times/day 3 - 3/day >=F >1/day 2 - 1/day >= F >once/2 days 1 - 2 days>= F >1/week 0 - F < 1/week
1
I-14C Dependability of voice communications (by phone or radio)
4 - Excellent. Lines work all the time. 3 - V. good. Lines work at least 95% of the
time. 2 - Poor at their site. Unreliable. However,
there is a good line within 30 minutes of travel.
1 - No direct line available to operators, but they are within 0.5 hour of travel to some line.
0 - No direct line available to operators. They must travel to a point to make a call. Even there, the lines are often down.
3
I-14D Frequency of physical visits by supervisors to field operators.
4 - Daily 2 - Weekly 0 - Monthly or less
2
I-14E Existence and frequency of remote monitoring (auto. or manual) at key spill points, including the end.
4 - Excellent. At all key points. At least every 2 hours feedback is given.
3 - Excellent coverage. However, data is recorded continuously on site and feedback is only once/day.
2 - Reasonable coverage. Data is recorded hourly and stored on site. Feedback is once/week or so.
1 - Only a few sites covered. Feedback weekly.
0 - Monthly feedback or less of a few sites.
3
Attachment D - Internal Indicator Description and Ranking Criteria Page 9

Page 262 of 276
I-15 General Conditions
(main canal)
I-15A Availability of roads along canal
4 - Very good access for automobiles on at least one side in all but extreme weather. Equipment access on second side.
3 - Good access for automobiles on at least one side in all but extreme weather. Limited access in some areas on second side.
2 - Rough but accessible road on one side. No road on second side.
1 - All of canal can be easily traversed on one side with a motorcycle, but maintenance equipment access is very limited.
0 - No apparent maintained access on either side for major stretches.
2
I-15B General level of maintenance
4 - Excellent 3 - Good. Things are not falling apart, but it does not look very
neat. 2 - Maintenance is not good enough to prevent some decrease
in performance in gates or canal. 1 - Maintenance is poor enough that decreased performance in
gates or canal is noticeable. 0 - Almost no maintenance. Major items and sections are in
disrepair.
1
I-15C General level of undesired seepage (if deliberate conjunctive use is practiced, some seepage may be desired)
4 - Very little seepage (less than 4%). 3 - 4-8% of what enters this canal. 2 - 9-15% along this canal. 1 - 16-25% along this canal. 0 - Extremely high levels of undesired seepage. Provides major
constraints to delivery capability.
1
I-15D Availability of proper equipment and staff to adequately maintain this canal
4 - Excellent equipment or organization of people. 3 - Equipment and number of people is reasonable to do the job
if organized properly. 2 - Most equipment works, and staff is large enough to get to
critical items in a week or so. Other items often wait a year or more for maintenance.
1 - Minimal equipment and staff. Critical equipment works, but much does not. Staff is poorly trained or motivated or insufficient in size.
0 - Almost no working equipment or mobilization of people.
2
I-15E Time to travel 4 - Less than 1 hour 1 from 3 - 1 hr<=T<2 hr maintenance 2 - 2 hr <=T < 3 hr yard to most 1 - 3 hr <=T < 4 hr distant point (for major equipment maintenance crew)
0 - T >=4 hr
Attachment D - Internal Indicator Description and Ranking Criteria Page 10

Page 263 of 276
I-16 Operatio n (main canal)
I-16A How frequently does the headworks respond to realistic real time feedback from the canal operators/observers?
4 - Excellent. If there is an excess or deficit (spill or deficit at tail ends), the headworks responds within 12 hours.
2.7 - Headworks responds to real-time feedback observations within 1 day.
1.3 - Headworks responds within 3 days. 0 - Headworks responds in greater than 3 days.
2
I-16B Existence and effectiveness of water ordering/delivery procedures to match actual demands. This is different than previous question, which dealt with mis-match of orders and wedge storage variations and wave travel time problems.
4 - Excellent. Information passes from lower level to this level in a timely and reliable manner, and the system then responds.
2.7 - Good. Reliable procedure. Updated at least once/2 days and system responds.
1.3 - Updated at least weekly with meaningful data. Changes are actually made.
0 - Perhaps updated weekly, but not with very meaningful data or procedures. Corresponding changes may not be actually made.
1
I-16C Clarity and correctness of instructions to operators.
4 - Instructions are very clear and very correct 2.7 - Instructions are clear, but are lacking in
enough detail. 1.3 - Instructions are unclear but generally correct.
0 - Instructions are incorrect, whether they are clear or not.
1
I-16D Frequency of checking total length 4 - Once/day 1 of canal. 2.7 - Once/2 days
1.3- Once/week 0 - Once/month or less often
Attachment D - Internal Indicator Description and Ranking Criteria Page 11

Page 264 of 276
SUBMAIN INDICATORS Subindicator
Ranking Criteria
I-17 Cross-Regulators (Submain canals)
I-17A Ease of cross-regulator operation under current target operation. (This doesn't mean that current targets are being met - just that it would be easy or difficult to meet them)
Same as Main 1
I-17B Probable ease of cross-regulator operation if system was to be required to provide better service to turnouts (this is related to the suitability of the device, also)
Same as Main 2
I-17C Level of maintenance Same as Main 1 I-17D Fluctuation (max daily ±%) of target value in the canal
itself (NOT the DELIVERY target value) Same as Main 3
I-17E Travel time of flow rate change through length of this canal level
Same as Main 2
I-18 Capacities (Submain canals)
I-18A Headworks and first canal section capacity vs. peak actual (crop ET-rain) at time of maximum demand, under current operation (i.e., gross compared to net)
Same as Main 1.3
I-18B Headworks and first canal section capacity vs. peak potential (crop ET - rain) with 100% cropping intensity at that time
Same as Main 2.7
I-18C Capacity (limitations?) of structures or canal cross section further down in the canal.
Same as Main 2
I-18D Availability of effective spill points Same as Main 1 I-19 Turnouts (from
Submain Canals) I-19A Ease of turnout operation under current target operation
mode/frequency. Same as Main 1
I-19B Ease of turnout operation if system provides better service to turnouts from this canal (this is related to the suitability of the device, also)
Same as Main 2
I-19C Level of maintenance Same as Main 1 I-19D Capacity (limitations) Same as Main 1 I-20 Communications
(Submain Canals) I-20A Actual frequency of communication of operators along this
canal with upper level Same as Main 1
I-20B Actual frequency of communication of operators or supervisors along this canal (or indirectly by upper level that then transmits orders down to them) with personnel at lower level
Same as Main 1
I-20C Dependability of voice communications (by phone or radio) Same as Main 3 I-20D Frequency of physical visits by supervisors to field
operators of this level. Same as Main 2
I-20E Existence and frequency of remote monitoring (auto. or manual) at key spill points, including the end.
Same as Main 3
I-21 General Conditions - Submain Canals
I-21A Availability of roads along canal Same as Main 2 I-21B General level of maintenance Same as Main 1 I-21C General level of undesired seepage (if deliberate
conjunctive use is practiced, some seepage may be desired) Same as Main 1
I-21D Availability of proper equipment and staff to adequately maintain this canal
Same as Main 2
I-21E Time to travel from maintenance yard to most distant point (for major equipment maintenance crew)
Same as Main 1
Attachment D - Internal Indicator Description and Ranking Criteria Page 12

Page 265 of 276
I-22 Operation (Submain Canals)
I-22A How frequently do the headworks respond to realistic real time feedback from the canal operators/observers (spill, etc.)?
Same as Main 2
I-22B Existence and effectiveness of water ordering/delivery procedures to match actual REQUESTS. This is different than previous question, which dealt with mis-match of orders and wedge storage variations and wave travel time problems.
Same as Main 1
I-22C Clarity and correctness of instructions to operators. Same as Main 1 I-22D Frequency of checking total length of canals. Same as Main 1
I-23 Budgetary I-23A % of O&M collected as in-kind services
or water fees from water users 4 - P >=90% 3 - 90%>P>=75% 2 - 75%>P>=60% 1 - 60%>P>=40% 0 - P< 40%
2
I-23B Estimated adequacy of actual dollars and in-kind services available (from whatever source) to sustain adequate O&M with present operation mode.
4 - P >=90% 3 - 90%>P>=75% 2 - 75%>P>=60% 1 - 60%>P>=40% 0 - P< 40%
2
I-23C % of budget spent on operation modernization (as contrasted with rehabilitation)
4 - P >20% 3 - 20>=P>15 2 - 15>=P>10 1 - 10>=P>5 0 - P<=5
1
Attachment D - Internal Indicator Description and Ranking Criteria Page 13

Page 266 of 276
I-24 Employees I- Frequency This must include all levels of employees, and integrates the total need. 1
24A and adequacy of training of operators and managers (not secretaries and drivers).
Persons living adjacent to a main canal may need only minimal training. Mobile operators may need much more. 4 - Adequate training at all levels. Employees are very aware of the
capabilities of themselves and their equipment and their need to provide service. Employees are hired with good backgrounds or are trained at employment and afterwards.
3 - Managers appear to have excellent training, both at entrance and later, but some important knowledge has not been passed down to the operators.
2 - Training exists at all levels "as needed", but evidently training does not go deep enough, because employees at all seem to be missing some important ideas. Many employees have never had adequate training at all levels, including pre-employment.
1 - Only minimal training. Inattention to necessary qualifications upon hiring. 0 - Virtually no training before or after hiring.
I- Availability 4 - Each employee has a written job description which spells out his job and 1 24B of written
performance rules
specifically how he will be evaluated. Evaluations are annual. 3 - There is a general written job description in the office. There is an annual
evaluation but it not rigorous. 2 - There is an evaluation, but no detailed job description or description of
evaluation procedures. 1 - There is a written description, but no meaningful evaluation procedure. 0 - There is no written job description, and no formal evaluation procedure.
I- Power of 4 - Employees are officially encouraged to think and act on their own, and they 2.5 24C employees to
make decisions
do it. 3 - Employees are not officially encouraged to think and act on their own, but
they do it anyway. 2 - Employees are encouraged to think and act on their own, but they do not
seem to take much initiative. 1 - Employees are not supposed to do any significant tasks without prior
authorization. However, if they do take the initiative they are not punished. 0 - Employees are not supposed to do any significant tasks without prior
authorization. If they do something without authorization they think they will be reprimanded.
I- Ability to 4 - Easy to do. No unions or long process. Employees are very aware of this 2 24D fire
employees and know of it happening when needed.
3 - Can do if well documented. Long process. Employees are very aware of this and know of it happening when needed.
2 - Occasionally happens due to laziness or serious problem. Not common, and employees don't seem to be concerned.
1 - Only occasionally happens if there is a very serious problem, but not due to laziness.
0 - Virtually never happens. System is plagued with many people who should be fired but aren't.
I- Rewards for 4 - Well designed program which follows a structured process, frequently. 1 24E exemplary
service Promotions, plus extra benefits for people who are at the top of their grade.
3 - No program, but people who do a good job frequently get promoted. Promotion is based on merit.
2 - Promotion is based on time in service, but extra benefits are given for exemplary service. More than just a piece of paper
1 - Seldom, but occasionally there are some awards which have little/no cash. Mainly paper.
0 - Nothing exists. I- Relative 4 - R>=3 Salary (relative to avg. farm laborer) of 2
24F salary 3 - 3>R>=2 canal operators/supervisors (not gate 2 - 2>R>=1 tenders), incl. benefits such as housing. 1 - 1>R>=.75 0 - R<.75
Attachment D - Internal Indicator Description and Ranking Criteria Page 14

Page 267 of 276
I-25 WUA I-25A % of users in
strong water user associations that have a functional, formal unit that participates in water distribution.
This does not include water users who are officially in some type of tertiary unit or WUA, but who in reality do not have a function organization with rules, and that is recognized legally. 4 - P >=90% 3 - 90%>P>=75% 2 - 75%>P>=60% 1 - 60%>P>=40% 0 - P< 40%
2.5
I-25B Actual ability of the strong WUA to influence real-time water deliveries to the WUA.
This only pertains to the strong WUAs. If there are no strong WUA, the answer is 1. 4 - Within the capacity of the supply canal, daily changes can be made per
their desire. 3 - Weekly changes can be made per their desire – any flow, duration, or
frequency that is physically possible. 2 - Weekly changes can be made per their desire, but they are quite limited
(less than what would be possible). 1 - No realistic say, except for occasional changes, perhaps if they call for
a formal meeting and express their desire several times per year or so. 0 - No one listens to them.
1
I-25C Ability of WUA to rely on effective outside enforcement of its rules.
4 - No problem. Just call up local authorities. They come and actually prosecute.
3 - The local authorities will come and are effective, but the WUA must have tried almost everything possible before calling them. It must be a serious or recurring problem.
2 - Authorities will come, but their ability to actually prosecute is minimal. It's mostly up to the WUA.
1 - Some enabling laws have been made by government, but it is up to the WUA to enforce them. No help with enforcement from outside WUA.
0 - No help from outside, either with laws or enforcement. Everything is internal, including authorization.
1
I-25D Legal basis for WUA
4 - Recognized by law. Has legal powers to tax, hold $$, fire, own structures and water. Law is real and enabling legislation is held up in courts.
3 - WUA is recognized by law. Good judicial backup. However, powers are limited. Govt. still holds most of the power that should belong to WUA.
2 - WUA is recognized by law. Many rules are laid out in enabling legislation. Supposedly has power. However, there is no judicial or legislative system to support it.
1 - Although the government as WUA on the books, in reality there are few if any true powers related to water. WUA is mainly there to do the bidding of the government.
0 - WUAs aren't even on the state or federal government books.
1
I-25E Financial strength of WUA
4 - Completely and sufficiently self-sustaining. Has power to tax, charge for water, obtain loans. 3 - Completely and sufficiently financed, but largely due to government support. 2 - Underfinanced, but not badly. Conditions are poor but are maintained and replaced well enough to be functional. No improvements made. 1 - Inadequate, but enough funds to replace and maintain key structures. Insufficient funds to do much of the basic maintenance needed. 0 - Woefully inadequate. Only enough funds or in-kind services to do absolutely essential tasks. Insufficient to maintain and replace essential equipment.
1
Attachment D - Internal Indicator Description and Ranking Criteria Page 15

Page 268 of 276
I -26 Ability of present service to individual fields, to
accommodate pressurized irrig. systems
I-26A Measurement and control of volumes to field
4 - Excellent volumetric metering and control. 3.5 - Ability to measure flow reasonably well,
but not volume. Flow is well controlled. 2.5 - Can't measure flow, but can control flow
well. 0 - Can't control the flow, even though it can
be measured.
1
I-26B Flexibility to field
4 - Arranged delivery, with frequency, rate, and duration promised. Can vary all.
3 - Same as 4, but can't vary duration. 2 - 2 variables fixed, but arranged. 0 - Rotation.
1
I-26C Reliability to field
4 - Water always arrives as promised, incl. volume.
3 - A few days delay occasionally, but still very reliable in rate and duration.
0 - More than a few days delay.
1
I-27 If they wanted to change to a more flexible system which
would accommodate widespread conversion to
pressurized methods with a reasonable project
efficiency, what would be required?
I-27A Management 4 - No changes in water ordering, staff training, mobility 3.5 - Improved training, only. The basic
procedures/conditions are just fine, they just aren't being implemented to their full
extent. 3- Minor changes in water ordering, mobility, training,
incentive programs, etc. 2 -Major changes in 1 of the above. 1 - Major changes to 2 of the above. 0 - Need to completely revamp or convert almost
everything.
1
I-27B Hardware 4 - No changes needed. 3.5 - Only repair of some existing structures so that they are workable again. 3 - Improved communications, repair of some existing structures, and a few key new structures (less than $300/ha), OR...Very little change to existing, or repairs, but new structures for water recirculation. 2- Larger capital expenditures - $301 - $ 600/ha 1- Larger capital expenditures - $ 601 $1500/ha 0 - Almost complete reworking of system (> $1500/ha)
1
Attachment D - Internal Indicator Description and Ranking Criteria Page 16

Page 269 of 276
Indicator Sub-I Ranking Criteria Wt. I-28 Number of Turnouts per
(operator, gate oper., supervisor)
n/a 4 - 50+ 3 - 30 - 49 2 - 20 - 29 1 - 10 - 19 0 - <9
1
I-29 What level of sophistication is there is receiving and using feedback information. It does not need to be automatic.
n/a 4 - Continuous feedback and continuous use of information to change inflows, with all key points monitored. Or, no feedback is necessary, such as with closed pipe systems. 3 - Several times a day feedback and rapid use (within a few hours) of information, at major points (but not all). 2 - Once/day feedback from key points, appropriate use of information that day. 1 - Weekly feedback and appropriate use, or once/day feedback and poor usage of information. 0 - No feedback, or else there is a lot of feedback but no usage.
1
I-30 To what extent are computers being used for
billing/record management?
n/a 4 - Used for almost all billing and records. Frequently updated, effective. 3 - Used for about half of billing and recordkeeping activities, frequently updated and effective. 2 - Just getting started on either billing or recordkeeping of turnout deliveries. 1 - Use computers effectively for some data management on the project (such as flows down canals, gate positions, dam releases, etc.), but not for billing. 0 - No usage of computers for these purposes.
1
I-31 To what extent are computers used for canal control?
n/a 4 - Very effectively, Real time control of all key structures with meaningful results. 3 - A few key structures are automated with computer controls. Close loop. 2 - Computers are effectively used to predict water flows, gate positions, daily diversions, or other things. Open loop. Output is well followed and meaningful. 1 - Computers are used to predict key control factors, but they are quite ineffective or erroneous. 0 - No computers really used.
1
Attachment D - Internal Indicator Description and Ranking Criteria Page 17

Page 270 of 276
1 2 3 4 5 6 7 8 9 10 11 12 13 14 15 16 1 2 3 4 5 6 7 8 9 10 11 12 13 14 15 16 Basic StatisticsInternal Indicators
Lam
Pao
, Th
ailand
Dez, Iran
Gu
ilan, Iran
Seyh
an, T
urkey
Majalg
aon
, Ind
ia
Dan
tiwad
a, Ind
ia
Bh
akra, Ind
ia
Mu
da, M
alaysia
Kem
ub
u, M
alaysia
Ben
i Am
ir, Mo
rocco
Office d
u N
iger, M
ali
Rio
Yaq
ui A
lto, D
R
Co
ello, C
olo
mb
ia
Sald
aña, C
olo
mb
ia
Cu
patitzio
, Mexico
Rio
Mayo
, Mexico
Average CV
INDEX Sub-Index Potential
Value Relative
Wt
Potential Relative
Value
Category Weighting Factor on
Level I Values
Weighting Factor on
Level II values
Values of Indicators Weighted Values of Indicators
Actual SERVICE INDEX
Actual service to
I -1 individual fields, based on traditional on-farm
Overall (**Weighted)
10 44 0.23 0.43 2.50 2.27 5.45 7.05 5.00 5.91 2.27 6.36 5.91 7.39 6.36 4.09 6.09 5.91 6.02 7.61 5.39 0.32
irrigation methods
I -1A Measurement of volumes to field 4 1 4 0.23 0.0 0.0 0.0 3.0 0.0 0.0 0.0 2.0 0.0 2.5 0.0 0.0 0.8 1.0 0.5 2.5 0.00 0.00 0.00 0.68 0.00 0.00 0.00 0.45 0.00 0.57 0.00 0.00 0.18 0.23 0.11 0.57 0.17 1.42
I -B Flexibility to field 4 2 8 0.45 1.5 1.0 2.0 3.0 1.0 2.0 1.0 2.0 2.0 3.0 4.0 4.0 3.0 2.5 3.0 3.5 0.68 0.45 0.91 1.36 0.45 0.91 0.45 0.91 0.91 1.36 1.82 1.82 1.36 1.14 1.36 1.59 1.09 0.42
I -1C Reliability to field (incl. weeks avail. vs.
week needed) 4 4 16 0.91 1.0 1.0 2.0 3.0 1.0 2.5 1.0 2.5 2.5 4.0 3.0 1.5 2.0 2.0 2.0 2.5 0.91 0.91 1.82 2.73 0.91 2.27 0.91 2.27 2.27 3.64 2.73 1.36 1.82 1.82 1.82 2.27 1.90 0.41
I -1D Apparent equity 4 4 16 0.91 1.0 1.0 3.0 2.5 4.0 3.0 1.0 3.0 3.0 2.0 2.0 1.0 3.0 3.0 3.0 3.5 0.91 0.91 2.73 2.27 3.64 2.73 0.91 2.73 2.73 1.82 1.82 0.91 2.73 2.73 2.73 3.18 2.22 0.40
Actual Service to avg.
I- 2 point of Effective Differentiation based on Traditional On-Farm
Overall (**Weighted)
10 68 0.15 0.21 2.65 4.41 6.47 7.35 4.41 6.18 3.24 5.29 5.88 6.76 5.88 3.09 5.62 5.96 6.18 7.47 5.43 0.27
Methods
I -2A # of fields downstream (less is better) 4 1 4 0.15 0.0 0.0 0.0 4.0 0.0 0.0 0.0 0.0 0.0 0.0 4.0 1.0 3.0 2.5 2.0 2.0 0.00 0.00 0.00 0.59 0.00 0.00 0.00 0.00 0.00 0.00 0.59 0.15 0.44 0.37 0.29 0.29 0.17 1.32
I -2B Measurement of volumes to point 4 4 16 0.59 0.5 2.5 3.0 3.0 2.0 3.0 2.5 0.5 2.5 2.5 0.0 0.0 0.8 2.0 1.0 2.7 0.29 1.47 1.76 1.76 1.18 1.76 1.47 0.29 1.47 1.47 0.00 0.00 0.47 1.18 0.59 1.59 1.05 0.63 I -2C Flexibility 4 4 16 0.59 2.0 2.0 2.0 3.0 1.0 2.0 1.0 2.0 2.5 3.0 4.0 3.0 3.0 2.5 3.0 3.5 1.18 1.18 1.18 1.76 0.59 1.18 0.59 1.18 1.47 1.76 2.35 1.76 1.76 1.47 1.76 2.06 1.45 0.33 I -2D Reliability 4 4 16 0.59 1.0 1.5 3.0 3.0 1.0 2.5 1.0 2.5 2.0 4.0 3.0 1.0 2.0 2.0 2.0 2.5 0.59 0.88 1.76 1.76 0.59 1.47 0.59 1.47 1.18 2.35 1.76 0.59 1.18 1.18 1.18 1.47 1.25 0.42 I -2E Apparent equity 4 4 16 0.59 1.0 1.5 3.0 2.5 3.5 3.0 1.0 4.0 3.0 2.0 2.0 1.0 3.0 3.0 4.0 3.5 0.59 0.88 1.76 1.47 2.06 1.76 0.59 2.35 1.76 1.18 1.18 0.59 1.76 1.76 2.35 2.06 1.51 0.40
Actual Service to avg.
I -3 point of DELIBERATE Q Differentiation based on
Overall (**Weighted)
10 68 0.15 0.07 2.21 4.41 4.56 7.35 3.24 3.38 3.24 6.03 5.00 6.76 5.88 3.09 5.62 5.96 5.59 7.65 5.00 0.33
traditional irrig. methods
I -3A # of fields downstream (less is better) 4 1 4 0.15 3.0 0.0 3.0 4.0 0.0 1.0 0.0 3.0 0.0 0.0 4.0 1.0 3.0 2.5 4.0 4.0 0.44 0.00 0.44 0.59 0.00 0.15 0.00 0.44 0.00 0.00 0.59 0.15 0.44 0.37 0.59 0.59 0.30 0.83
I -3B Measurement of volumes to point 4 4 16 0.59 0.0 2.5 0.0 3.0 0.0 0.0 2.5 1.5 1.0 2.5 0.0 0.0 0.8 2.0 0.5 2.5 0.00 1.47 0.00 1.76 0.00 0.00 1.47 0.88 0.59 1.47 0.00 0.00 0.47 1.18 0.29 1.47 0.69 0.98 I -3C Flexibility 4 4 16 0.59 1.5 2.0 2.0 3.0 1.0 2.0 1.0 2.5 2.5 3.0 4.0 3.0 3.0 2.5 3.0 3.5 0.88 1.18 1.18 1.76 0.59 1.18 0.59 1.47 1.47 1.76 2.35 1.76 1.76 1.47 1.76 2.06 1.45 0.34 I -3D Reliability 4 4 16 0.59 1.0 1.5 2.0 3.0 1.0 1.5 1.0 2.5 2.0 4.0 3.0 1.0 2.0 2.0 2.0 2.5 0.59 0.88 1.18 1.76 0.59 0.88 0.59 1.47 1.18 2.35 1.76 0.59 1.18 1.18 1.18 1.47 1.18 0.43 I -3E Apparent equity 4 4 16 0.59 0.5 1.5 3.0 2.5 3.5 2.0 1.0 3.0 3.0 2.0 2.0 1.0 3.0 3.0 3.0 3.5 0.29 0.88 1.76 1.47 2.06 1.18 0.59 1.76 1.76 1.18 1.18 0.59 1.76 1.76 1.76 2.06 1.38 0.40
I -4 Actual Service by main canals to its subcanals
Overall 10 18 0.56 0.29 3.33 2.36 7.50 7.11 7.50 8.28 4.44 6.39 8.75 6.25 6.67 2.78 6.39 5.28 6.11 7.08 6.01 0.32
I -4A Flexibility 4 1 4 0.56 1.5 1.5 3.0 2.0 1.0 3.2 1.0 2.5 4.0 1.0 4.0 2.0 2.0 2.0 2.0 3.0 0.83 0.83 1.67 1.11 0.56 1.78 0.56 1.39 2.22 0.56 2.22 1.11 1.11 1.11 1.11 1.67 1.24 0.44 I -4B Reliability 4 1 4 0.56 1.0 1.0 3.0 3.0 3.0 3.5 3.0 2.0 3.5 4.0 3.0 2.0 2.5 3.0 3.0 3.0 0.56 0.56 1.67 1.67 1.67 1.94 1.67 1.11 1.94 2.22 1.67 1.11 1.39 1.67 1.67 1.67 1.51 0.31 I -4C Equity 4 1 4 0.56 2.0 1.0 3.0 3.0 3.5 4.0 1.0 2.5 3.0 4.0 2.0 1.0 4.0 3.0 3.0 3.0 1.11 0.56 1.67 1.67 1.94 2.22 0.56 1.39 1.67 2.22 1.11 0.56 2.22 1.67 1.67 1.67 1.49 0.38
I -4D Control of flows to submains as stated 4 1.5 6 0.83 1.0 0.5 3.0 3.2 4.0 2.8 2.0 3.0 3.5 1.5 2.0 0.0 2.0 1.0 2.0 2.5 0.83 0.42 2.50 2.67 3.33 2.33 1.67 2.50 2.92 1.25 1.67 0.00 1.67 0.83 1.67 2.08 1.77 0.53
Stated SERVICE INDEX
I- 5 STATED service to fields.
Overall 10 44 0.23 0.43 5.91 5.45 5.68 7.61 5.68 5.91 3.64 5.91 6.59 9.55 7.27 7.05 6.59 7.50 7.05 7.61 6.56 0.20
I -5A Measurement of volumes to field 4 1 4 0.23 2.0 3.0 1.0 3.5 1.0 0.0 0.0 0.0 1.0 4.0 0.0 1.0 3.0 3.0 1.0 2.5 0.45 0.68 0.23 0.80 0.23 0.00 0.00 0.00 0.23 0.91 0.00 0.23 0.68 0.68 0.23 0.57 0.37 0.84 I -5B Flexibility to field 4 2 8 0.45 2.0 2.5 2.0 3.0 2.0 2.0 1.0 2.0 2.0 3.0 4.0 3.0 3.0 3.0 3.0 3.5 0.91 1.14 0.91 1.36 0.91 0.91 0.45 0.91 0.91 1.36 1.82 1.36 1.36 1.36 1.36 1.59 1.16 0.29
I -5C Reliability to field (incl. weeks avail. vs.
week needed) 4 4 16 0.91 2.0 2.0 2.0 3.0 1.0 2.5 1.5 2.5 3.0 4.0 2.0 2.0 2.0 3.0 2.0 2.5 1.82 1.82 1.82 2.73 0.91 2.27 1.36 2.27 2.73 3.64 1.82 1.82 1.82 2.73 1.82 2.27 2.10 0.30
I -5D Equity 4 4 16 0.91 3.0 2.0 3.0 3.0 4.0 3.0 2.0 3.0 3.0 4.0 4.0 4.0 3.0 3.0 4.0 3.5 2.73 1.82 2.73 2.73 3.64 2.73 1.82 2.73 2.73 3.64 3.64 3.64 2.73 2.73 3.64 3.18 2.93 0.20
STATED service to avg. I- 6 point of EFFECTIVE Overall 10 1 64 0.16 0.21 6.88 5.31 5.00 8.44 4.38 4.69 5.63 5.63 4.38 9.38 6.25 3.75 6.88 7.19 7.50 6.69 6.12 0.26
differentiation.
I -6A # of fields downstream (less is better) 4 4 16 0.63 0.0 0.0 0.0 4.0 0.0 0.0 0.0 0.5 0.0 4.0 0.0 1.0 3.0 2.5 2.0 2.0 0.00 0.00 0.00 2.50 0.00 0.00 0.00 0.31 0.00 2.50 0.00 0.63 1.88 1.56 1.25 1.25 0.74 1.27
I -6B Measurement of volumes to point 4 4 16 0.63 4.0 4.0 3.0 3.5 3.0 3.0 3.0 2.0 2.5 3.0 4.0 1.0 3.0 3.0 4.0 2.7 2.50 2.50 1.88 2.19 1.88 1.88 1.88 1.25 1.56 1.88 2.50 0.63 1.88 1.88 2.50 1.69 1.90 0.26 I -6C Flexibility 4 4 16 0.63 3.0 2.5 2.0 3.0 2.0 2.0 2.0 2.5 2.5 4.0 2.0 2.0 3.0 3.0 3.0 3.5 1.88 1.56 1.25 1.88 1.25 1.25 1.25 1.56 1.56 2.50 1.25 1.25 1.88 1.88 1.88 2.19 1.64 0.24 I -6D Reliability 4 4 16 0.63 4.0 2.0 3.0 3.0 2.0 2.5 4.0 4.0 2.0 4.0 4.0 2.0 2.0 3.0 3.0 2.5 2.50 1.25 1.88 1.88 1.25 1.56 2.50 2.50 1.25 2.50 2.50 1.25 1.25 1.88 1.88 1.56 1.84 0.28
Equity 3.0 2.0 3.0 2.5 4.0 3.0 4.0 3.0 3.0 4.0 3.0 2.0 3.0 3.0 4.0 3.5
STATED service to point I- 7 of deliberate Q Overall 10 52 0.19 0.07 6.73 6.54 3.65 8.08 3.08 2.88 6.92 4.62 4.23 9.23 7.69 4.04 6.73 7.40 5.38 7.31 5.91 0.33
differentiation.
I -7A # of fields downstream (less is better) 4 1 4 0.19 3.0 0.0 3.0 4.0 0.0 1.0 0.0 2.0 0.0 4.0 0.0 1.0 3.0 2.5 4.0 4.0 0.58 0.00 0.58 0.77 0.00 0.19 0.00 0.38 0.00 0.77 0.00 0.19 0.58 0.48 0.77 0.77 0.38 0.84
I -7B Measurement of volumes to point 4 4 16 0.77 2.0 4.0 0.0 3.5 1.0 0.0 3.0 0.5 1.0 3.0 4.0 1.0 3.0 3.0 1.0 2.5 1.54 3.08 0.00 2.69 0.77 0.00 2.31 0.38 0.77 2.31 3.08 0.77 2.31 2.31 0.77 1.92 1.56 0.68 I -7C Flexibility 4 4 16 0.77 2.0 2.5 2.0 3.0 2.0 2.0 2.0 2.5 2.5 4.0 2.0 2.0 3.0 3.0 3.0 3.5 1.54 1.92 1.54 2.31 1.54 1.54 1.54 1.92 1.92 3.08 1.54 1.54 2.31 2.31 2.31 2.69 1.97 0.25 I -7D Reliability 4 4 16 0.77 4.0 2.0 2.0 3.0 1.0 1.5 4.0 2.5 2.0 4.0 4.0 2.0 2.0 3.0 2.0 2.5 3.08 1.54 1.54 2.31 0.77 1.15 3.08 1.92 1.54 3.08 3.08 1.54 1.54 2.31 1.54 1.92 2.00 0.37
Equity 3.0 2.0 3.0 2.5 4.0 3.0 4.0 3.0 3.0 4.0 3.0 2.0 3.0 3.0 4.0 3.5
I- 8 Stated Service by main canals
Overall 10 18 0.56 0.29 7.22 6.11 8.33 8.33 7.22 7.50 6.39 6.39 10.00 8.33 10.00 7.50 7.22 7.78 8.89 7.08 7.77 0.15
I -8A Flexibility 4 1 4 0.56 2.0 3.0 3.0 3.0 1.0 2.0 1.0 2.5 4.0 1.0 4.0 2.0 2.0 2.5 2.0 3.0 1.11 1.67 1.67 1.67 0.56 1.11 0.56 1.39 2.22 0.56 2.22 1.11 1.11 1.39 1.11 1.67 1.32 0.40
Attachment E - Internal Indicator Values for all Projects Page 1

Page 271 of 276
1 2 3 4 5 6 7 8 9 10 11 12 13 14 15 16 1 2 3 4 5 6 7 8 9 10 11 12 13 14 15 16 Basic StatisticsInternal Indicators
Lam
Pao
, Th
ailand
Dez, Iran
Gu
ilan, Iran
Seyh
an, T
urkey
Majalg
aon
, Ind
ia
Dan
tiwad
a, Ind
ia
Bh
akra, Ind
ia
Mu
da, M
alaysia
Kem
ub
u, M
alaysia
Ben
i Am
ir, Mo
rocco
Office d
u N
iger, M
ali
Rio
Yaq
ui A
lto, D
R
Co
ello, C
olo
mb
ia
Sald
aña, C
olo
mb
ia
Cu
patitzio
, Mexico
Rio
Mayo
, Mexico
Lam
Pao
, Th
ailand
Dez, Iran
Gu
ilan, Iran
Seyh
an, T
urkey
Majalg
aon
, Ind
ia
Dan
tiwad
a, Ind
ia
Bh
akra, Ind
ia
Mu
da, M
alaysia
Kem
ub
u, M
alaysia
Ben
i Am
ir, Mo
rocco
Office d
u N
iger, M
ali
Rio
Yaq
ui A
lto, D
R
Co
ello, C
olo
mb
ia
Sald
aña, C
olo
mb
ia
Cu
patitzio
, Mexico
Rio
Mayo
, Mexico
Average CV
INDEX Sub-Index Potential
Value Relative
Wt
Potential Relative
Value
Category Weighting Factor on
Level I Values
Weighting Factor on
Level II values
Values of Indicators Weighted Values of Indicators
I -8B Reliability 4 1 4 0.56 1.0 2.0 3.0 3.0 3.0 3.0 3.0 2.0 4.0 4.0 4.0 4.0 2.5 3.0 4.0 3.0 0.56 1.11 1.67 1.67 1.67 1.67 1.67 1.11 2.22 2.22 2.22 2.22 1.39 1.67 2.22 1.67 1.68 0.29 I -8C Equity 4 1 4 0.56 4.0 3.0 3.0 3.0 3.0 4.0 3.0 2.5 4.0 4.0 4.0 3.0 4.0 4.0 4.0 3.0 2.22 1.67 1.67 1.67 1.67 2.22 1.67 1.39 2.22 2.22 2.22 1.67 2.22 2.22 2.22 1.67 1.93 0.16
I -8D Control of flows to customers as stated 4 1.5 6 0.83 4.0 2.0 4.0 4.0 4.0 3.0 3.0 3.0 4.0 4.0 4.0 3.0 3.0 3.0 4.0 2.5 3.33 1.67 3.33 3.33 3.33 2.50 2.50 2.50 3.33 3.33 3.33 2.50 2.50 2.50 3.33 2.08 2.84 0.19
Weighted Sum of Actual Service Indices
2.75 2.91 6.19 7.15 5.46 6.46 3.17 6.12 6.65 6.88 6.31 3.43 6.04 5.74 6.05 7.43 5.55 0.28
Weighted Sum of Stated Service Indices
6.55 5.69 6.17 8.03 5.67 5.90 5.08 5.90 6.95 9.14 7.88 6.27 6.84 7.51 7.56 7.24 6.77 0.16
Weighted Ratio of Service Indices (A/S)
0.42 0.51 1.00 0.89 0.96 1.09 0.62 1.04 0.96 0.75 0.80 0.55 0.88 0.76 0.80 1.03 0.82 0.25
Individual Field (A/S) 0.42 0.42 0.96 0.93 0.88 1.00 0.63 1.08 0.90 0.77 0.88 0.58 0.92 0.79 0.85 1.00 0.81 0.25 Effective Differentiation (A/S)
0.39 0.83 1.29 0.87 1.01 1.32 0.58 0.94 1.34 0.72 0.94 0.82 0.82 0.83 0.82 1.12 0.92 0.28
Deliberate Differentiation (A/S)
0.33 0.67 1.25 0.91 1.05 1.17 0.47 1.31 1.18 0.73 0.76 0.76 0.83 0.80 1.04 1.05 0.90 0.31
Main Canal (A/S) 0.46 0.39 0.90 0.85 1.04 1.10 0.70 1.00 0.88 0.75 0.67 0.37 0.88 0.68 0.69 1.00 0.77 0.29
Evidence of Lack of I- 9 Anarchy in Canal System Overall 10 400 0.03 9.13 8.00 9.50 9.90 9.63 9.75 7.75 8.75 9.00 9.90 9.13 8.88 9.73 9.70 9.38 9.80 9.24 0.07
u/s of ownership change
I -9A Degree to which deliveries are not taken
out of turn above point of ownership change.
100 2 200 0.05 85.0 75.0 95.0 98.0 95.0 95.0 60.0 80.0 90.0 99.0 85.0 85.0 98.0 97.0 95.0 97.0 4.25 3.75 4.75 4.90 4.75 4.75 3.00 4.00 4.50 4.95 4.25 4.25 4.90 4.85 4.75 4.85 4.47 0.12
Noticeable non-existence of I -9B unauthorized turnouts from canals above 100 1 100 0.03 95.0 85.0 90.0 100.0 100.0 100.0 95.0 100.0 90.0 99.0 100.0 90.0 100.0 97.0 90.0 99.0 2.38 2.13 2.25 2.50 2.50 2.50 2.38 2.50 2.25 2.48 2.50 2.25 2.50 2.43 2.25 2.48 2.39 0.05
point of ownership change
Lack of vandalism of structures above I -9C the point of ownership change, to obtain 100 1 100 0.03 100.0 85.0 100.0 100.0 95.0 100.0 95.0 90.0 90.0 99.0 95.0 95.0 93.0 97.0 95.0 99.0 2.50 2.13 2.50 2.50 2.38 2.50 2.38 2.25 2.25 2.48 2.38 2.38 2.33 2.43 2.38 2.48 2.39 0.05
flow.
CANAL INDICES - Main Canal INDEX
I- 10 Cross-Regulator Hardware (Main Canal)
Overall (**Weighted)
10 36 0.28 0.15 3.47 3.89 8.33 5.97 8.75 8.06 5.69 8.33 9.03 9.17 7.08 3.61 7.78 7.92 7.36 4.86 6.83 0.29
I -10A
Ease of cross-regulator operation under current target operation. (This doesn't
mean that current targets are being met just that it would be easy or difficult to
meet them)
4 1 4 0.28 2.0 1.0 4.0 2.5 4.0 2.8 2.5 4.0 4.0 4.0 3.0 3.0 4.0 4.0 3.5 3.0 0.56 0.28 1.11 0.69 1.11 0.78 0.69 1.11 1.11 1.11 0.83 0.83 1.11 1.11 0.97 0.83 0.89 0.28
I -10B
Probable ease of cross-regulator operation if system was to be required
to provide better service to turnouts (this is related to the suitability of the device,
also)
4 2 8 0.56 1.0 1.0 4.0 3.0 4.0 2.8 2.5 4.0 4.0 4.0 3.0 1.0 3.0 3.0 3.5 2.0 0.56 0.56 2.22 1.67 2.22 1.56 1.39 2.22 2.22 2.22 1.67 0.56 1.67 1.67 1.94 1.11 1.59 0.39
I -10C Level of maintenance 4 1 4 0.28 2.5 3.0 3.0 3.0 3.5 3.6 3.0 3.0 2.5 3.0 2.5 2.0 3.0 3.5 2.0 3.5 0.69 0.83 0.83 0.83 0.97 1.00 0.83 0.83 0.69 0.83 0.69 0.56 0.83 0.97 0.56 0.97 0.81 0.17
I -10D (NOT the DELIVERY target value) - e.g., water level in canal rather than TO Q
4 3 12 0.83 2.0 2.0 3.0 2.0 4.0 3.0 2.0 3.0 4.0 4.0 2.0 0.0 3.0 3.0 3.0 1.0 1.67 1.67 2.50 1.67 3.33 2.50 1.67 2.50 3.33 3.33 1.67 0.00 2.50 2.50 2.50 0.83 2.14 0.43
I -10E Travel time of flow rate change through
length of this canal level. 4 2 8 0.56 0.0 1.0 3.0 2.0 2.0 4.0 2.0 3.0 3.0 3.0 4.0 3.0 3.0 3.0 2.5 2.0 0.00 0.56 1.67 1.11 1.11 2.22 1.11 1.67 1.67 1.67 2.22 1.67 1.67 1.67 1.39 1.11 1.41 0.40
I -11 Capacities (Main Canal) Overall (**Weighted)
10 28 0.36 0.15 6.43 10.00 7.14 10.00 9.29 2.86 0.00 7.14 10.00 1.07 5.71 10.00 7.61 10.00 7.20 2.48 6.68 0.51
I -11A
Headworks and first canal section capacity vs. peak actual (crop ET-rain)
at time of maximum demand, under current operation (ie, gross compared to
net)
4 1.3 5.2 0.46 2.0 4.0 3.0 4.0 4.0 1.0 0.0 2.0 4.0 0.0 3.0 4.0 4.0 4.0 4.0 1.5 0.93 1.86 1.39 1.86 1.86 0.46 0.00 0.93 1.86 0.00 1.39 1.86 1.86 1.86 1.86 0.70 1.29 0.54
Headworks and first canal section
I -11B capacity vs. peak potential (crop ET rain) with 100% cropping intensity at
4 2.7 10.8 0.96 2.0 4.0 3.0 4.0 4.0 1.0 0.0 2.0 4.0 0.0 3.0 4.0 3.0 4.0 1.1 1.0 1.93 3.86 2.89 3.86 3.86 0.96 0.00 1.93 3.86 0.00 2.89 3.86 2.89 3.86 1.06 0.96 2.42 0.60
that time
Attachment E - Internal Indicator Values for all Projects Page 2

Page 272 of 276
1 2 3 4 5 6 7 8 9 10 11 12 13 14 15 16 1 2 3 4 5 6 7 8 9 10 11 12 13 14 15 16 Basic StatisticsInternal Indicators
Lam
Pao
, Th
ailand
Dez, Iran
Gu
ilan, Iran
Seyh
an, T
urkey
Majalg
aon
, Ind
ia
Dan
tiwad
a, Ind
ia
Bh
akra, Ind
ia
Mu
da, M
alaysia
Kem
ub
u, M
alaysia
Ben
i Am
ir, Mo
rocco
Office d
u N
iger, M
ali
Rio
Yaq
ui A
lto, D
R
Co
ello, C
olo
mb
ia
Sald
aña, C
olo
mb
ia
Cu
patitzio
, Mexico
Rio
Mayo
, Mexico
Lam
Pao
, Th
ailand
Dez, Iran
Gu
ilan, Iran
Seyh
an, T
urkey
Majalg
aon
, Ind
ia
Dan
tiwad
a, Ind
ia
Bh
akra, Ind
ia
Mu
da, M
alaysia
Kem
ub
u, M
alaysia
Ben
i Am
ir, Mo
rocco
Office d
u N
iger, M
ali
Rio
Yaq
ui A
lto, D
R
Co
ello, C
olo
mb
ia
Sald
aña, C
olo
mb
ia
Cu
patitzio
, Mexico
Rio
Mayo
, Mexico
Average CV
INDEX Sub-Index Potential
Value Relative
Wt
Potential Relative
Value
Category Weighting Factor on
Level I Values
Weighting Factor on
Level II values
Values of Indicators Weighted Values of Indicators
I -11C Capacity (limitations?) of structures or canal cross section further down in the
canal. 4 2 8 0.71 4.0 4.0 2.0 4.0 4.0 2.0 0.0 4.0 4.0 0.0 0.0 4.0 2.0 4.0 4.0 1.0 2.86 2.86 1.43 2.86 2.86 1.43 0.00 2.86 2.86 0.00 0.00 2.86 1.43 2.86 2.86 0.71 1.92 0.62
I -11D Availability of effective spill points 4 1 4 0.36 2.0 4.0 4.0 4.0 2.0 0.0 0.0 4.0 4.0 3.0 4.0 4.0 4.0 4.0 4.0 0.3 0.71 1.43 1.43 1.43 0.71 0.00 0.00 1.43 1.43 1.07 1.43 1.43 1.43 1.43 1.43 0.11 1.06 0.53
I- 12 Turnouts (from Main Canals)
Overall (**Weighted)
10 20 0.50 0.15 5.75 7.75 9.25 8.75 9.50 7.00 3.00 8.00 8.50 4.75 6.00 4.50 4.50 7.00 5.50 6.25 6.63 0.29
I -12A Ease of turnout operation under current
target operation mode/frequency. 4 1 4 0.50 2.0 2.5 4.0 3.5 4.0 3.0 1.0 3.0 3.5 2.5 2.5 1.0 2.0 2.0 2.0 2.5 1.00 1.25 2.00 1.75 2.00 1.50 0.50 1.50 1.75 1.25 1.25 0.50 1.00 1.00 1.00 1.25 1.28 0.36
Ease of turnout operation if system
I -12B provides better service to turnouts from
this canal (this is related to the 4 2 8 1.00 2.0 3.0 4.0 4.0 4.0 3.0 1.0 3.0 3.5 2.0 3.0 1.0 1.0 2.0 2.0 2.0 2.00 3.00 4.00 4.00 4.00 3.00 1.00 3.00 3.50 2.00 3.00 1.00 1.00 2.00 2.00 2.00 2.53 0.42
suitability of the device, also)
I -12C Level of maintenance 4 1 4 0.50 1.5 3.0 2.5 3.0 3.0 3.0 3.0 3.0 2.5 1.0 2.5 2.0 3.0 4.0 1.0 2.0 0.75 1.50 1.25 1.50 1.50 1.50 1.50 1.50 1.25 0.50 1.25 1.00 1.50 2.00 0.50 1.00 1.25 0.33
I -12D Capacity (limitations?) 4 1 4 0.50 4.0 4.0 4.0 3.0 4.0 2.0 0.0 4.0 4.0 2.0 1.0 4.0 2.0 4.0 4.0 4.0 2.00 2.00 2.00 1.50 2.00 1.00 0.00 2.00 2.00 1.00 0.50 2.00 1.00 2.00 2.00 2.00 1.56 0.42
I- 13 Regulating Reservoirs Overall (**Weighted)
10 24 0.42 0.05 1.67 4.17 9.17 0.00 2.92 0.00 0.00 0.00 0.00 0.00 0.00 0.00 0.00 0.00 0.00 0.00 1.12 2.22
I -13A Suitability of number and location(s) 4 2 8 0.83 2.0 3.0 4.0 0.0 2.0 0.0 0.0 0.0 0.0 0.0 0.0 0.0 0.0 0.0 0.0 0.0 1.67 2.50 3.33 0.00 1.67 0.00 0.00 0.00 0.00 0.00 0.00 0.00 0.00 0.00 0.00 0.00 0.57 1.89
I -13B Effectiveness of operation 4 2 8 0.83 0.0 2.0 4.0 0.0 0.0 0.0 0.0 0.0 0.0 0.0 0.0 0.0 0.0 0.0 0.0 0.0 0.00 1.67 3.33 0.00 0.00 0.00 0.00 0.00 0.00 0.00 0.00 0.00 0.00 0.00 0.00 0.00 0.31 2.90
I -13C Suitability of capacities 4 1 4 0.42 0.0 0.0 4.0 0.0 1.0 0.0 0.0 0.0 0.0 0.0 0.0 0.0 0.0 0.0 0.0 0.0 0.00 0.00 1.67 0.00 0.42 0.00 0.00 0.00 0.00 0.00 0.00 0.00 0.00 0.00 0.00 0.00 0.13 3.25
I -13D Maintenance 4 1 4 0.42 0.0 0.0 2.0 0.0 2.0 0.0 0.0 0.0 0.0 0.0 0.0 0.0 0.0 0.0 0.0 0.0 0.00 0.00 0.83 0.00 0.83 0.00 0.00 0.00 0.00 0.00 0.00 0.00 0.00 0.00 0.00 0.00 0.10 2.73
I- 14 Communications (Main Canal)
Overall (**Weighted)
10 40 0.25 0.15 6.50 2.25 6.75 6.00 8.25 7.90 3.88 8.25 7.00 4.38 2.00 2.75 5.25 7.00 2.75 6.25 5.45 0.40
I -14A Actual frequency of communication of operators along this canal with upper
level 4 1 4 0.25 2.0 1.0 2.0 2.0 4.0 2.0 2.0 3.0 3.0 1.0 1.0 0.5 2.0 4.0 4.0 1.0 0.50 0.25 0.50 0.50 1.00 0.50 0.50 0.75 0.75 0.25 0.25 0.13 0.50 1.00 1.00 0.25 0.54 0.53
I -14B
Actual frequency of communication of operators or supervisors along this canal
(or indirectly by upper level that then transmits orders down to them) with
personnel at lower level
4 1 4 0.25 1.0 1.0 2.0 3.0 3.0 3.0 2.0 2.0 3.0 3.0 1.0 1.5 3.0 4.0 2.0 4.0 0.25 0.25 0.50 0.75 0.75 0.75 0.50 0.50 0.75 0.75 0.25 0.38 0.75 1.00 0.50 1.00 0.60 0.41
I -14C Dependability of voice communications
(by phone or radio) 4 3 12 0.75 4.0 1.0 3.0 3.5 4.0 2.7 2.5 4.0 3.0 1.0 0.0 1.0 4.0 4.0 1.0 4.0 3.00 0.75 2.25 2.63 3.00 2.03 1.88 3.00 2.25 0.75 0.00 0.75 3.00 3.00 0.75 3.00 2.00 0.53
I -14D Frequency of physical visits by
supervisors to field operators. 4 2 8 0.50 4.0 2.0 4.0 2.0 4.0 4.0 2.0 2.0 2.0 3.0 3.0 3.0 2.0 4.0 1.0 4.0 2.00 1.00 2.00 1.00 2.00 2.00 1.00 1.00 1.00 1.50 1.50 1.50 1.00 2.00 0.50 2.00 1.44 0.36
I -14E Existence and frequency of remote
monitoring (auto. or manual) at key spill points, incld. end.
4 3 12 0.75 1.0 0.0 2.0 1.5 2.0 3.5 0.0 4.0 3.0 1.5 0.0 0.0 0.0 0.0 0.0 0.0 0.75 0.00 1.50 1.13 1.50 2.63 0.00 3.00 2.25 1.13 0.00 0.00 0.00 0.00 0.00 0.00 0.87 1.21
I -15 General Conditions (Main Canal)
Overall (**Weighted)
10 28 0.36 0.15 6.43 8.21 6.07 7.32 7.14 6.61 6.61 8.57 6.61 7.50 8.39 6.25 7.50 7.14 6.07 6.96 7.09 0.11
I -15A Availability of roads along canal 4 2 8 0.71 3.0 3.5 2.5 4.0 4.0 3.0 3.0 4.0 3.5 3.0 4.0 3.0 3.0 4.0 3.0 3.0 2.14 2.50 1.79 2.86 2.86 2.14 2.14 2.86 2.50 2.14 2.86 2.14 2.14 2.86 2.14 2.14 2.39 0.15
I -15B General level of maintenance 4 1 4 0.36 2.0 3.0 3.0 3.0 3.0 3.5 3.0 3.0 2.5 3.0 2.5 2.5 3.0 3.0 1.0 3.5 0.71 1.07 1.07 1.07 1.07 1.25 1.07 1.07 0.89 1.07 0.89 0.89 1.07 1.07 0.36 1.25 0.99 0.22
I -15C General level of undesired seepage (if
deliberate conjunctive use is practiced, some seepage may be desired)
4 1 4 0.36 3.0 3.0 3.0 2.5 3.0 2.0 2.0 3.0 2.0 4.0 4.0 4.0 2.0 1.0 4.0 2.0 1.07 1.07 1.07 0.89 1.07 0.71 0.71 1.07 0.71 1.43 1.43 1.43 0.71 0.36 1.43 0.71 0.99 0.33
I -15D Availability of proper equipment and staff
to adequately maintain this canal 4 2 8 0.71 2.0 4.0 2.0 2.5 3.0 2.5 3.0 3.5 2.0 2.5 3.0 1.0 3.0 2.0 2.0 2.5 1.43 2.86 1.43 1.79 2.14 1.79 2.14 2.50 1.43 1.79 2.14 0.71 2.14 1.43 1.43 1.79 1.81 0.28
I -15E Time to travel from maintence yard to
most distant point (for major equipment maintenance crew)
4 1 4 0.36 3.0 2.0 2.0 2.0 0.0 2.0 1.5 3.0 3.0 3.0 3.0 3.0 4.0 4.0 2.0 3.0 1.07 0.71 0.71 0.71 0.00 0.71 0.54 1.07 1.07 1.07 1.07 1.07 1.43 1.43 0.71 1.07 0.90 0.39
Attachment E - Internal Indicator Values for all Projects Page 3

Page 273 of 276
1 2 3 4 5 6 7 8 9 10 11 12 13 14 15 16 1 2 3 4 5 6 7 8 9 10 11 12 13 14 15 16 Basic StatisticsInternal Indicators
Lam
Pao
, Th
ailand
Dez, Iran
Gu
ilan, Iran
Seyh
an, T
urkey
Majalg
aon
, Ind
ia
Dan
tiwad
a, Ind
ia
Bh
akra, Ind
ia
Mu
da, M
alaysia
Kem
ub
u, M
alaysia
Ben
i Am
ir, Mo
rocco
Office d
u N
iger, M
ali
Rio
Yaq
ui A
lto, D
R
Co
ello, C
olo
mb
ia
Sald
aña, C
olo
mb
ia
Cu
patitzio
, Mexico
Rio
Mayo
, Mexico
Lam
Pao
, Th
ailand
Dez, Iran
Gu
ilan, Iran
Seyh
an, T
urkey
Majalg
aon
, Ind
ia
Dan
tiwad
a, Ind
ia
Bh
akra, Ind
ia
Mu
da, M
alaysia
Kem
ub
u, M
alaysia
Ben
i Am
ir, Mo
rocco
Office d
u N
iger, M
ali
Rio
Yaq
ui A
lto, D
R
Co
ello, C
olo
mb
ia
Sald
aña, C
olo
mb
ia
Cu
patitzio
, Mexico
Rio
Mayo
, Mexico
Average CV
INDEX Sub-Index Potential
Value Relative
Wt
Potential Relative
Value
Category Weighting Factor on
Level I Values
Weighting Factor on
Level II values
Values of Indicators Weighted Values of Indicators
I -16 Operation (Main Canal) Overall (**Weighted)
10 20 0.50 0.20 2.00 5.70 6.65 5.15 8.15 7.75 2.00 8.35 7.05 6.00 1.30 0.35 2.65 4.00 4.65 5.65 4.84 0.53
I -16A How frequently does the headworks
respond to realistic real time feedback from the canal operators/observers?
4 2 8 1.00 0.0 2.7 1.3 2.0 3.5 3.0 0.0 3.5 2.7 2.7 0.0 0.0 0.0 0.0 1.3 1.3 0.00 2.70 1.30 2.00 3.50 3.00 0.00 3.50 2.70 2.70 0.00 0.00 0.00 0.00 1.30 1.30 1.50 0.92
I -16B
Existence and effectiveness of water ordering/delivery procedures to match
actual demands. This is different than previous question, which dealt with mis
match of orders and wedge storage variations and wave travel time
problems.
4 1 4 0.50 0.0 0.7 2.7 2.0 1.3 2.0 0.0 4.0 2.0 1.3 0.0 0.0 1.3 0.0 1.3 2.0 0.00 0.35 1.35 1.00 0.65 1.00 0.00 2.00 1.00 0.65 0.00 0.00 0.65 0.00 0.65 1.00 0.64 0.90
I -16C Clarity and correctness of instructions
to operators. 4 1 4 0.50 0.0 1.3 4.0 1.3 4.0 3.5 1.3 3.0 2.7 4.0 1.3 0.0 0.0 4.0 2.7 2.7 0.00 0.65 2.00 0.65 2.00 1.75 0.65 1.50 1.35 2.00 0.65 0.00 0.00 2.00 1.35 1.35 1.12 0.67
I -16D Frequency of checking total length of
canal. 4 1 4 0.50 4.0 4.0 4.0 3.0 4.0 4.0 2.7 2.7 4.0 1.3 1.3 0.7 4.0 4.0 2.7 4.0 2.00 2.00 2.00 1.50 2.00 2.00 1.35 1.35 2.00 0.65 0.65 0.35 2.00 2.00 1.35 2.00 1.58 0.37
Overall Main Canal 4.77 6.16 7.42 6.74 8.22 6.41 3.28 7.71 7.58 5.23 4.64 4.14 5.43 6.66 5.26 5.15 5.92 0.24
CANAL INDICES -Submain Canals INDEX
I- 17 Cross-Regulators (Submain canals)
Overall (**Weighted)
10 36 0.28 0.15 3.47 5.00 8.33 7.08 8.89 8.47 1.11 5.28 9.72 7.22 5.28 2.22 5.56 6.39 5.42 4.86 5.89 0.40
I -17A
Ease of cross-regulator operation under current target operation. (this doesn't
mean that current targets are being met just that it would be easy or difficult to
meet them)
4 1 4 0.28 1.0 2.0 4.0 2.5 4.0 4.0 0.0 2.0 4.0 4.0 3.0 0.0 3.0 3.0 3.0 2.5 0.28 0.56 1.11 0.69 1.11 1.11 0.00 0.56 1.11 1.11 0.83 0.00 0.83 0.83 0.83 0.69 0.73 0.51
I -17B
Probable ease of cross-regulator operation if system was to be required
to provide better service to turnouts (this is related to the suitability of the device,
also)
4 2 8 0.56 0.0 1.0 4.0 3.0 4.0 4.0 0.0 2.0 4.0 4.0 3.0 0.0 2.5 2.0 3.0 2.5 0.00 0.56 2.22 1.67 2.22 2.22 0.00 1.11 2.22 2.22 1.67 0.00 1.39 1.11 1.67 1.39 1.35 0.61
I 17C
Level of maintenance 4 1 4 0.28 1.5 3.0 3.0 3.0 3.0 3.5 0.0 3.0 3.0 3.0 2.0 0.0 3.0 2.0 2.5 2.0 0.42 0.83 0.83 0.83 0.83 0.97 0.00 0.83 0.83 0.83 0.56 0.00 0.83 0.56 0.69 0.56 0.65 0.45
I -17D (NOT the DELIVERY target value) - e.g., water level in canal rather than TO Q
4 3 12 0.83 2.0 2.0 3.0 2.0 3.0 3.0 0.0 2.0 4.0 1.0 0.0 0.0 1.0 2.0 0.0 0.0 1.67 1.67 2.50 1.67 2.50 2.50 0.00 1.67 3.33 0.83 0.00 0.00 0.83 1.67 0.00 0.00 1.30 0.84
I -17E Travel time of flow rate change through
length of this canal level. 4 2 8 0.56 2.0 2.5 3.0 4.0 4.0 3.0 2.0 2.0 4.0 4.0 4.0 4.0 3.0 4.0 4.0 4.0 1.11 1.39 1.67 2.22 2.22 1.67 1.11 1.11 2.22 2.22 2.22 2.22 1.67 2.22 2.22 2.22 1.86 0.25
I -18 Capacities (Submain canals)
Overall (**Weighted)
10 28 0.36 0.15 4.29 9.64 7.14 8.14 10.00 3.57 0.00 7.14 8.57 1.07 6.43 9.29 7.86 10.00 5.95 5.71 6.55 0.46
I -18A
Headworks and first canal section capacity vs. peak actual (crop ET-rain)
at time of maximum demand, under current operation (ie, gross compared to
net)
4 1.3 5.2 0.46 2.0 4.0 3.0 4.0 4.0 1.0 0.0 2.0 4.0 0.0 2.5 4.0 3.0 4.0 1.5 3.0 0.93 1.86 1.39 1.86 1.86 0.46 0.00 0.93 1.86 0.00 1.16 1.86 1.39 1.86 0.70 1.39 1.22 0.54
Headworks and first canal section
I -18B capacity vs. peak potential (crop ET rain) with 100% cropping intensity at
4 2.7 10.8 0.96 2.0 4.0 3.0 4.0 4.0 1.0 0.0 2.0 4.0 0.0 2.5 4.0 3.0 4.0 1.0 3.0 1.93 3.86 2.89 3.86 3.86 0.96 0.00 1.93 3.86 0.00 2.41 3.86 2.89 3.86 0.96 2.89 2.50 0.56
that time
I -18C Capacity (limitations?) of structures or canal cross section further down in the
canal. 4 2 8 0.71 2.0 4.0 2.0 1.4 4.0 3.0 0.0 4.0 4.0 0.0 2.0 4.0 4.0 4.0 4.0 2.0 1.43 2.86 1.43 1.00 2.86 2.14 0.00 2.86 2.86 0.00 1.43 2.86 2.86 2.86 2.86 1.43 1.98 0.52
I -18D Availability of effective spill points 4 1 4 0.36 0.0 3.0 4.0 4.0 4.0 0.0 0.0 4.0 0.0 3.0 4.0 2.0 2.0 4.0 4.0 0.0 0.00 1.07 1.43 1.43 1.43 0.00 0.00 1.43 0.00 1.07 1.43 0.71 0.71 1.43 1.43 0.00 0.85 0.75
Turnouts (from Submain canals)
I- 19 Overall
(**Weighted) 10 20 0.50 0.15 2.25 5.50 5.25 6.00 5.75 5.75 3.75 5.75 5.00 5.75 6.00 5.50 3.75 5.50 5.00 4.15 5.04 0.21
I -19A Ease of turnout operation under current
target operation mode/frequency. 4 1 4 0.50 1.0 2.0 2.5 2.0 2.5 2.0 1.5 2.5 2.0 2.5 3.0 2.0 1.5 2.0 2.0 1.5 0.50 1.00 1.25 1.00 1.25 1.00 0.75 1.25 1.00 1.25 1.50 1.00 0.75 1.00 1.00 0.75 1.02 0.25
Attachment E - Internal Indicator Values for all Projects Page 4

Page 274 of 276
1 2 3 4 5 6 7 8 9 10 11 12 13 14 15 16 1 2 3 4 5 6 7 8 9 10 11 12 13 14 15 16 Basic StatisticsInternal Indicators
Lam
Pao
, Th
ailand
Dez, Iran
Gu
ilan, Iran
Seyh
an, T
urkey
Majalg
aon
, Ind
ia
Dan
tiwad
a, Ind
ia
Bh
akra, Ind
ia
Mu
da, M
alaysia
Kem
ub
u, M
alaysia
Ben
i Am
ir, Mo
rocco
Office d
u N
iger, M
ali
Rio
Yaq
ui A
lto, D
R
Co
ello, C
olo
mb
ia
Sald
aña, C
olo
mb
ia
Cu
patitzio
, Mexico
Rio
Mayo
, Mexico
Lam
Pao
, Th
ailand
Dez, Iran
Gu
ilan, Iran
Seyh
an, T
urkey
Majalg
aon
, Ind
ia
Dan
tiwad
a, Ind
ia
Bh
akra, Ind
ia
Mu
da, M
alaysia
Kem
ub
u, M
alaysia
Ben
i Am
ir, Mo
rocco
Office d
u N
iger, M
ali
Rio
Yaq
ui A
lto, D
R
Co
ello, C
olo
mb
ia
Sald
aña, C
olo
mb
ia
Cu
patitzio
, Mexico
Rio
Mayo
, Mexico
Average CV
INDEX Sub-Index Potential
Value Relative
Wt
Potential Relative
Value
Category Weighting Factor on
Level I Values
Weighting Factor on
Level II values
Values of Indicators Weighted Values of Indicators
Ease of turnout operation if system
I -10B provides better service to turnouts from
this canal (this is related to the 4 2 8 1.00 1.0 2.0 2.0 2.5 2.0 2.0 1.5 2.0 2.0 2.5 2.5 1.0 1.5 1.5 1.5 1.5 1.00 2.00 2.00 2.50 2.00 2.00 1.50 2.00 2.00 2.50 2.50 1.00 1.50 1.50 1.50 1.50 1.81 0.26
suitability of the device, also)
I -19C Level of maintenance 4 1 4 0.50 1.5 2.0 2.0 3.0 3.0 3.5 3.0 3.0 1.0 2.0 2.0 3.0 1.0 2.0 1.0 1.8 0.75 1.00 1.00 1.50 1.50 1.75 1.50 1.50 0.50 1.00 1.00 1.50 0.50 1.00 0.50 0.90 1.09 0.38
I -19D Capacity (limitations?) 4 1 4 0.50 0.0 3.0 2.0 2.0 2.0 2.0 0.0 2.0 3.0 2.0 2.0 4.0 2.0 4.0 4.0 2.0 0.00 1.50 1.00 1.00 1.00 1.00 0.00 1.00 1.50 1.00 1.00 2.00 1.00 2.00 2.00 1.00 1.13 0.53
I- 20 Communications (submain canals)
Overall (**Weighted)
10 40 0.25 0.15 4.50 2.50 6.25 5.88 5.25 5.13 0.00 5.88 3.50 2.25 1.25 4.25 5.25 5.88 1.50 6.75 4.13 0.50
I -20A Actual frequency of communication of operators along this canal with upper
level 4 1 4 0.25 2.0 1.0 3.0 2.0 2.0 2.0 0.0 3.0 2.0 1.0 1.0 2.0 2.0 2.0 1.0 4.0 0.50 0.25 0.75 0.50 0.50 0.50 0.00 0.75 0.50 0.25 0.25 0.50 0.50 0.50 0.25 1.00 0.47 0.51
I -20B
Actual frequency of communication of operators or supervisors along this canal
(or indirectly by upper level that then transmits orders down to them) with
personnel at lower level
4 1 4 0.25 2.0 2.0 3.0 3.0 2.0 4.0 0.0 3.0 2.0 1.0 2.0 3.0 3.0 3.0 2.0 3.0 0.50 0.50 0.75 0.75 0.50 1.00 0.00 0.75 0.50 0.25 0.50 0.75 0.75 0.75 0.50 0.75 0.59 0.40
I -20C Dependability of voice communications
(by phone or radio) 4 3 12 0.75 4.0 1.0 3.0 3.5 3.0 1.0 0.0 2.5 2.0 1.0 0.0 2.0 4.0 3.5 1.0 4.0 3.00 0.75 2.25 2.63 2.25 0.75 0.00 1.88 1.50 0.75 0.00 1.50 3.00 2.63 0.75 3.00 1.66 0.64
I -20D Frequency of physical visits by
supervisors to field operators. 4 2 8 0.50 1.0 2.0 2.0 4.0 4.0 2.0 0.0 2.0 2.0 2.0 1.0 3.0 2.0 4.0 0.0 4.0 0.50 1.00 1.00 2.00 2.00 1.00 0.00 1.00 1.00 1.00 0.50 1.50 1.00 2.00 0.00 2.00 1.09 0.61
I -20E Existence and frequency of remote
monitoring (auto. or manual) at key spill points, incld. end.
4 3 12 0.75 0.0 0.0 2.0 0.0 0.0 2.5 0.0 2.0 0.0 0.0 0.0 0.0 0.0 0.0 0.0 0.0 0.00 0.00 1.50 0.00 0.00 1.88 0.00 1.50 0.00 0.00 0.00 0.00 0.00 0.00 0.00 0.00 0.30 2.17
I -21 Submain Canals Maintenance
Overall (**Weighted)
10 28 0.36 0.20 5.36 6.79 6.43 7.14 5.36 5.36 5.54 7.14 6.07 5.71 6.96 5.71 7.68 5.89 5.71 5.89 6.17 0.12
I -21A Availability of roads along canal 4 2 8 0.71 2.0 3.0 3.0 3.0 2.5 2.0 2.5 3.0 3.0 3.0 2.5 2.0 3.0 2.5 3.0 2.0 1.43 2.14 2.14 2.14 1.79 1.43 1.79 2.14 2.14 2.14 1.79 1.43 2.14 1.79 2.14 1.43 1.88 0.16
I -21B General level of maintenance 4 1 4 0.36 2.0 3.0 3.0 2.5 3.0 3.0 2.5 3.0 2.0 1.0 2.0 1.0 3.0 2.0 1.0 2.0 0.71 1.07 1.07 0.89 1.07 1.07 0.89 1.07 0.71 0.36 0.71 0.36 1.07 0.71 0.36 0.71 0.80 0.33
I -21C General level of undesired seepage (if
deliberate conjunctive use is practiced, some seepage may be desired)
4 1 4 0.36 3.0 2.0 3.0 2.5 3.0 2.0 2.0 3.0 2.0 4.0 4.0 4.0 3.0 1.5 4.0 2.0 1.07 0.71 1.07 0.89 1.07 0.71 0.71 1.07 0.71 1.43 1.43 1.43 1.07 0.54 1.43 0.71 1.00 0.30
I -21D Availability of proper equipment and staff
to adequately maintain this canal 4 2 8 0.71 1.5 3.0 2.0 3.0 2.0 2.5 2.0 2.5 2.0 1.0 3.0 2.0 3.0 2.0 1.0 2.5 1.07 2.14 1.43 2.14 1.43 1.79 1.43 1.79 1.43 0.71 2.14 1.43 2.14 1.43 0.71 1.79 1.56 0.30
I -21E Time to travel from maintence yard to
most distant point (for major equipment maintenance crew)
4 1 4 0.36 3.0 2.0 2.0 3.0 0.0 1.0 2.0 3.0 3.0 3.0 2.5 3.0 3.5 4.0 3.0 3.5 1.07 0.71 0.71 1.07 0.00 0.36 0.71 1.07 1.07 1.07 0.89 1.07 1.25 1.43 1.07 1.25 0.93 0.39
I -22 Operation (submain canals)
Overall (**Weighted)
10 20 0.50 0.20 3.70 5.70 10.00 8.35 7.65 7.70 3.30 7.70 7.40 5.95 6.65 5.35 7.35 8.70 4.30 7.30 6.69 0.28
I -22A How frequently does the headworks
respond to realistic real time feedback from the canal operators/observers?
4 2 8 1.00 0.7 2.7 4.0 2.7 4.0 2.7 1.3 2.7 2.7 1.3 4.0 2.7 2.0 4.0 1.3 3.3 0.70 2.70 4.00 2.70 4.00 2.70 1.30 2.70 2.70 1.30 4.00 2.70 2.00 4.00 1.30 3.30 2.63 0.41
I -22B
Existence and effectiveness of water ordering/delivery procedures to match
actual demands. This is different than previous question, which dealt with mis
match of orders and wedge storage variations and wave travel time
problems.
4 1 4 0.50 0.7 0.7 4.0 4.0 1.3 2.7 0.0 2.7 2.7 1.3 2.0 1.3 4.0 2.7 1.3 2.0 0.35 0.35 2.00 2.00 0.65 1.35 0.00 1.35 1.35 0.65 1.00 0.65 2.00 1.35 0.65 1.00 1.04 0.60
I -22C Clarity and correctness of instructions
to operators. 4 1 4 0.50 1.3 1.3 4.0 3.3 2.0 3.3 1.3 3.3 2.7 4.0 0.0 1.3 2.7 2.7 0.7 2.0 0.65 0.65 2.00 1.65 1.00 1.65 0.65 1.65 1.35 2.00 0.00 0.65 1.35 1.35 0.35 1.00 1.12 0.53
I -22D Frequency of checking total length of
canal. 4 1 4 0.50 4.0 4.0 4.0 4.0 4.0 4.0 2.7 4.0 4.0 4.0 3.3 2.7 4.0 4.0 4.0 4.0 2.00 2.00 2.00 2.00 2.00 2.00 1.35 2.00 2.00 2.00 1.65 1.35 2.00 2.00 2.00 2.00 1.90 0.12
Overall Submain Canals 3.99 5.89 7.33 7.16 7.08 6.05 2.50 6.58 6.71 4.78 5.57 5.40 6.37 7.08 4.68 5.86 5.81 0.23
OPERATIONS PROJECT ADMINISTRATION INDEX
I- 23 Budgetary Overall (Weighted) 10 20 0.50 0.35 2.25 7.50 8.50 8.50 4.00 5.00 2.50 1.00 2.00 5.00 5.50 5.00 8.00 7.50 2.50 7.50 5.14 0.50
Attachment E - Internal Indicator Values for all Projects Page 5

Page 275 of 276
1 2 3 4 5 6 7 8 9 10 11 12 13 14 15 16 1 2 3 4 5 6 7 8 9 10 11 12 13 14 15 16 Basic StatisticsInternal Indicators
Lam
Pao
, Th
ailand
Dez, Iran
Gu
ilan, Iran
Seyh
an, T
urkey
Majalg
aon
, Ind
ia
Dan
tiwad
a, Ind
ia
Bh
akra, Ind
ia
Mu
da, M
alaysia
Kem
ub
u, M
alaysia
Ben
i Am
ir, Mo
rocco
Office d
u N
iger, M
ali
Rio
Yaq
ui A
lto, D
R
Co
ello, C
olo
mb
ia
Sald
aña, C
olo
mb
ia
Cu
patitzio
, Mexico
Rio
Mayo
, Mexico
Lam
Pao
, Th
ailand
Dez, Iran
Gu
ilan, Iran
Seyh
an, T
urkey
Majalg
aon
, Ind
ia
Dan
tiwad
a, Ind
ia
Bh
akra, Ind
ia
Mu
da, M
alaysia
Kem
ub
u, M
alaysia
Ben
i Am
ir, Mo
rocco
Office d
u N
iger, M
ali
Rio
Yaq
ui A
lto, D
R
Co
ello, C
olo
mb
ia
Sald
aña, C
olo
mb
ia
Cu
patitzio
, Mexico
Rio
Mayo
, Mexico
Average CV
INDEX Sub-Index Potential
Value Relative
Wt
Potential Relative
Value
Category Weighting Factor on
Level I Values
Weighting Factor on
Level II values
Values of Indicators Weighted Values of Indicators
I -23A % of O&M collected as in-kind services
or water fees from water users 4 2 8 1.00 0.2 4.0 4.0 4.0 0.0 0.0 0.0 0.0 0.0 1.0 0.5 3.0 4.0 4.0 1.0 4.0 0.20 4.00 4.00 4.00 0.00 0.00 0.00 0.00 0.00 1.00 0.50 3.00 4.00 4.00 1.00 4.00 1.86 1.00
Estimated adequacy of actual dollars
I -23B and in-kind services available (from
whatever source) to sustain adequate 4 2 8 1.00 2.0 3.5 3.0 4.0 2.0 3.0 2.5 0.0 2.0 3.0 3.0 2.0 4.0 3.0 1.0 3.0 2.00 3.50 3.00 4.00 2.00 3.00 2.50 0.00 2.00 3.00 3.00 2.00 4.00 3.00 1.00 3.00 2.56 0.41
O&M with present operation mode
I -23C % of budget spent on operation
modernization (as contrasted with rehabilitation)
4 1 4 0.50 0.1 0.0 3.0 1.0 4.0 4.0 0.0 2.0 0.0 2.0 4.0 0.0 0.0 1.0 1.0 1.0 0.05 0.00 1.50 0.50 2.00 2.00 0.00 1.00 0.00 1.00 2.00 0.00 0.00 0.50 0.50 0.50 0.72 1.07
I -24 Operation Employees Overall (Weighted) 10 38 0.26 0.20 3.75 5.72 4.87 5.86 3.03 6.58 3.29 4.67 2.89 6.38 4.08 5.00 6.05 5.79 3.95 8.82 5.05 0.31
I -24A Frequency/adequacy of training of
operators and managers (not secretaries and drivers)
4 1 4 0.26 2.0 2.0 3.0 3.0 2.0 4.0 1.0 3.0 2.0 2.5 1.0 1.0 2.0 1.0 2.0 3.0 0.53 0.53 0.79 0.79 0.53 1.05 0.26 0.79 0.53 0.66 0.26 0.26 0.53 0.26 0.53 0.79 0.57 0.41
I -24B Availability of written performance rules 4 1 4 0.26 1.0 2.5 3.0 3.0 1.0 2.0 1.0 1.0 0.0 3.0 0.0 0.0 1.0 1.0 1.0 0.0 0.26 0.66 0.79 0.79 0.26 0.53 0.26 0.26 0.00 0.79 0.00 0.00 0.26 0.26 0.26 0.00 0.34 0.85
I -24C Power of employees to make decisions 4 2.5 10 0.66 0.5 2.5 3.0 2.5 1.0 3.0 1.0 3.5 2.0 2.5 3.0 2.0 4.0 4.0 2.0 4.0 0.33 1.64 1.97 1.64 0.66 1.97 0.66 2.30 1.32 1.64 1.97 1.32 2.63 2.63 1.32 2.63 1.67 0.43
I -24D Ability to fire employees 4 2 8 0.53 1.0 0.5 1.0 1.5 0.0 2.0 1.0 1.0 0.5 1.0 2.0 5.0 3.0 3.0 1.0 5.0 0.53 0.26 0.53 0.79 0.00 1.05 0.53 0.53 0.26 0.53 1.05 2.63 1.58 1.58 0.53 2.63 0.94 0.85
I -24E Rewards for exemplary service 4 1 4 0.26 2.0 2.0 3.0 3.0 2.0 1.5 0.0 1.0 1.0 2.5 0.0 0.0 0.0 0.0 1.0 2.5 0.53 0.53 0.79 0.79 0.53 0.39 0.00 0.26 0.26 0.66 0.00 0.00 0.00 0.00 0.26 0.66 0.35 0.83
I -24F Relative salary (relative to farm laborer)
of canal operators/supervisors (not gate tenders), incl. benefits
4 2 8 0.53 3.0 4.0 0.0 2.0 2.0 3.0 3.0 1.0 1.0 4.0 1.5 1.5 2.0 2.0 2.0 4.0 1.58 2.11 0.00 1.05 1.05 1.58 1.58 0.53 0.53 2.11 0.79 0.79 1.05 1.05 1.05 2.11 1.18 0.52
I -25 Water User Associations Overall (**Weighted)
10 26 0.38 0.15 3.06 0.00 0.00 8.38 2.88 1.92 3.27 2.31 2.31 0.00 0.00 8.46 9.23 9.04 9.04 9.23 4.32 0.89
% of users in strong water user
I -25A associations that have a functional, formal unit that participates in water
4 2.5 10 0.96 1.1 0.0 0.0 4.0 0.0 0.0 0.0 0.0 0.0 0.0 0.0 4.0 4.0 4.0 4.0 4.0 1.06 0.00 0.00 3.85 0.00 0.00 0.00 0.00 0.00 0.00 0.00 3.85 3.85 3.85 3.85 3.85 1.51 1.25
distribution.
I -25B Actual ability of the strong WUA to
influence real-time water deliveries to the WUA.
4 1 4 0.38 2.0 0.0 0.0 3.0 1.0 1.0 1.0 1.0 1.0 0.0 0.0 4.0 4.0 4.0 3.5 3.5 0.77 0.00 0.00 1.15 0.38 0.38 0.38 0.38 0.38 0.00 0.00 1.54 1.54 1.54 1.35 1.35 0.70 0.88
I -25C Ability of WUA to rely on effective
outside enforcement of its rules. 4 1 4 0.38 2.0 0.0 0.0 2.0 3.0 2.0 4.0 3.0 3.0 0.0 0.0 3.5 3.0 3.0 3.0 3.0 0.77 0.00 0.00 0.77 1.15 0.77 1.54 1.15 1.15 0.00 0.00 1.35 1.15 1.15 1.15 1.15 0.83 0.64
I -25D Legal basis for WUA 4 1 4 0.38 1.0 0.0 0.0 3.0 3.0 2.0 3.0 1.0 1.0 0.0 0.0 3.5 3.5 3.5 3.5 3.5 0.38 0.00 0.00 1.15 1.15 0.77 1.15 0.38 0.38 0.00 0.00 1.35 1.35 1.35 1.35 1.35 0.76 0.76
I -25E Financial strength of WUA's 4 1 4 0.38 0.2 0.0 0.0 3.8 0.5 0.0 0.5 1.0 1.0 0.0 0.0 1.0 3.5 3.0 3.5 4.0 0.08 0.00 0.00 1.46 0.19 0.00 0.19 0.38 0.38 0.00 0.00 0.38 1.35 1.15 1.35 1.54 0.53 1.15
System Operations Overall (**Weighted)
10 12 0.83 0.30 4.58 5.17 8.33 8.33 7.08 8.33 4.17 8.75 10.00 8.17 4.17 2.08 6.25 5.83 6.25 7.92 6.59 0.33
Effectiveness of timing the monthly release of the available water supply to
water needs which are physically 4 1 4 0.83 1.5 3.0 3.0 3.5 1.5 3.5 0.0 3.5 4.0 4.0 2.5 0.5 2.5 3.0 4.0 4.0 1.25 2.50 2.50 2.92 1.25 2.92 0.00 2.92 3.33 3.33 2.08 0.42 2.08 2.50 3.33 3.33 2.29 0.46
possible to meet.
Effectiveness of main system operation (scheduling of deliveries and operation of
gates), compared to what is possible with same or only minor modifications to
hardware and personnel
4 1 4 0.83 1.0 0.2 4.0 3.0 4.0 3.5 3.0 3.5 4.0 1.8 0.5 0.0 1.0 1.0 0.5 1.5 0.83 0.17 3.33 2.50 3.33 2.92 2.50 2.92 3.33 1.50 0.42 0.00 0.83 0.83 0.42 1.25 1.69 0.74
Similarity between actual overall operation of structures and official
policy. 4 1 4 0.83 3.0 3.0 3.0 3.5 3.0 3.0 2.0 3.5 4.0 4.0 2.0 2.0 4.0 3.0 3.0 4.0 2.50 2.50 2.50 2.92 2.50 2.50 1.67 2.92 3.33 3.33 1.67 1.67 3.33 2.50 2.50 3.33 2.60 0.22
Overall Project Operation Index
3.37 5.32 6.45 7.90 4.56 5.85 3.27 4.26 4.63 5.48 3.99 4.64 7.27 6.89 4.90 8.15 5.43 0.28
SERVICE INDEX
Ability of present service
I- 26 to individual fields, to accommodate pressurized irrig.
Overall (**Weighted)
10 12 0.83 1.67 3.75 4.17 7.08 2.08 2.08 1.67 4.17 4.17 5.00 7.50 6.67 7.50 5.00 5.42 7.08 4.69 0.45
systems.
Attachment E - Internal Indicator Values for all Projects Page 6

Page 276 of 276
1 2 3 4 5 6 7 8 9 10 11 12 13 14 15 16 1 2 3 4 5 6 7 8 9 10 11 12 13 14 15 16 Basic StatisticsInternal Indicators
Lam
Pao
, Th
ailand
Dez, Iran
Gu
ilan, Iran
Seyh
an, T
urkey
Majalg
aon
, Ind
ia
Dan
tiwad
a, Ind
ia
Bh
akra, Ind
ia
Mu
da, M
alaysia
Kem
ub
u, M
alaysia
Ben
i Am
ir, Mo
rocco
Office d
u N
iger, M
ali
Rio
Yaq
ui A
lto, D
R
Co
ello, C
olo
mb
ia
Sald
aña, C
olo
mb
ia
Cu
patitzio
, Mexico
Rio
Mayo
, Mexico
Lam
Pao
, Th
ailand
Dez, Iran
Gu
ilan, Iran
Seyh
an, T
urkey
Majalg
aon
, Ind
ia
Dan
tiwad
a, Ind
ia
Bh
akra, Ind
ia
Mu
da, M
alaysia
Kem
ub
u, M
alaysia
Ben
i Am
ir, Mo
rocco
Office d
u N
iger, M
ali
Rio
Yaq
ui A
lto, D
R
Co
ello, C
olo
mb
ia
Sald
aña, C
olo
mb
ia
Cu
patitzio
, Mexico
Rio
Mayo
, Mexico
Average CV
INDEX Sub-Index Potential
Value Relative
Wt
Potential Relative
Value
Category Weighting Factor on
Level I Values
Weighting Factor on
Level II values
Values of Indicators Weighted Values of Indicators
I -26A Measurement of volumes to field 4 1 4 0.83 2.0 2.0 2.0 2.5 2.5 2.5 2.0 2.5 2.5 3.5 2.0 2.0 2.5 2.0 2.5 3.0 1.67 1.67 1.67 2.08 2.08 2.08 1.67 2.08 2.08 2.92 1.67 1.67 2.08 1.67 2.08 2.50 1.98 0.18
I -26B Flexibility to field 4 1 4 0.83 0.0 0.0 0.0 3.0 0.0 0.0 0.0 0.0 0.0 0.0 4.0 3.0 3.0 2.0 2.0 2.5 0.00 0.00 0.00 2.50 0.00 0.00 0.00 0.00 0.00 0.00 3.33 2.50 2.50 1.67 1.67 2.08 1.02 1.23
I -26C Reliability 4 1 4 0.83 0.0 2.5 3.0 3.0 0.0 0.0 0.0 2.5 2.5 2.5 3.0 3.0 3.5 2.0 2.0 3.0 0.00 2.08 2.50 2.50 0.00 0.00 0.00 2.08 2.08 2.08 2.50 2.50 2.92 1.67 1.67 2.50 1.69 0.63
I-27
Present quality of management and hardware to accommodate pressurized irrigation.
1.00
I -27A Management 4 1 4 1.00 0.0 0.5 2.5 2.5 1.0 3.0 0.0 3.0 2.0 1.0 2.5 1.0 3.5 2.0 0.5 3.5 0.00 0.50 2.50 2.50 1.00 3.00 0.00 3.00 2.00 1.00 2.50 1.00 3.50 2.00 0.50 3.50 1.78 0.68
I -27B Hardware 4 1 4 1.00 1.0 2.5 2.0 3.0 2.0 2.5 1.0 2.5 2.0 1.0 3.0 2.0 3.0 1.0 2.0 2.5 1.00 2.20 2.50 2.20 2.00 2.50 1.00 2.50 2.00 1.00 3.00 2.00 3.00 1.00 2.00 2.50 2.03 0.34
What is the key factor in improving (H=Hardware,
M=Management, B M M B M H B M B H B B H B M H B M M B M H B M B H B B H B M H
B=Both)?
Number of I -28 Turnouts/(operator, gate 4 1 4 1.00 0.0 1.0 1.0 4.0 1.0 1.0 0.0 0.0 0.0 1.0 3.0 3.0 4.0 3.0 1.0 4.0 0.00 1.00 1.00 4.00 1.00 1.00 0.00 0.00 0.00 1.00 3.00 3.00 4.00 3.00 1.00 4.00 1.69 0.91
oper., supervisor)
I -29 NEW - Feedback Information
4 1 4 1.00 1.0 1.0 2.0 2.0 3.0 3.0 1.0 3.0 2.0 1.0 1.0 1.0 1.5 1.5 0.0 2.5 1.00 1.00 2.00 2.00 3.00 3.00 1.00 3.00 2.00 1.00 1.00 1.00 1.50 1.50 0.00 2.50 1.66 0.54
Computers for I -30 billing/record 4 1 4 1.00 1.0 2.0 1.0 3.0 0.0 0.0 0.0 1.0 1.0 2.0 0.0 1.0 1.0 0.0 0.0 4.0 1.00 2.00 1.00 3.00 0.00 0.00 0.00 1.00 1.00 2.00 0.00 1.00 1.00 0.00 0.00 4.00 1.06 1.11
management
I -31 Computers for Canal Control
4 1 4 1.00 1.0 0.0 0.0 0.0 3.0 0.0 1.0 3.0 1.0 1.0 0.0 0.0 0.0 0.0 0.0 0.5 1.00 0.00 0.00 0.00 3.00 0.00 1.00 3.00 1.00 1.00 0.00 0.00 0.00 0.00 0.00 0.50 0.66 1.54
Attachment E - Internal Indicator Values for all Projects Page 7
Copyright © 2022 FDOKUMEN