FARMERS' PRACTICES AND COMMUNITY MANAGEMENT OF IRRIGATION: WHY DO THEY NOT MATCH IN FATNASSA OASIS?
13
FARMERS’ PRACTICES AND COMMUNITY MANAGEMENT OF IRRIGATION: WHY DO THEY NOT MATCH IN FATNASSA OASIS? † WAFA GHAZOUANI 1,2 , SERGE MARLET 1,2 * , INSAF MEKKI 2 , LARRY W. HARRINGTON 3 AND ALAIN VIDAL 3 1 Centre de Coopération Internationale en Recherche Agronomique pour le Développement (CIRAD), UMR G‐EAU, Montpellier, France 2 Institut National de Recherche en Génie Rural, Eaux et Forêts (INRGREF), Ariana, Tunisia 3 CGIAR Challenge Program on Water and Food, Colombo, Sri Lanka ABSTRACT Community‐managed irrigation systems are commonly faced with problems of low system‐level performance. A comprehensive survey was undertaken to assess and quantify the causes of the low irrigation performance in a community‐managed oasis in southern Tunisia. At the irrigation system level, results showed that irrigation intervals were double those that had been expected (19–21 days). The main cause was inappropriate farmers’ practices at field level where the irrigation duration was almost twice the expected 10 h ha ‐1 . The extension of date palm plantation and technical dysfunctions played a less important role as they were counterbalanced by cancellation of irrigation in some plots. At the field scale, excessively long irrigation duration resulted from the joint effects of small fields, poor maintenance of field‐level water delivery systems, uncontrolled night irrigation events and low farmer commitment. This situation emphasizes the question of efficiency and sustainability of irrigation systems when farmers subvert collective rules. Further, the situation raises the question of equity among farmers which hinders their support for the water users’ association and the strict application of water allocation rules. These findings should help identify an appropriate approach and lead to positive changes in the management of community irrigation systems. Copyright © 2011 John Wiley & Sons, Ltd. key words: collective rules; community management; farmers’ practices; irrigation; oasis; Tunisia Received 1 December 2009; Revised 8 December 2010; Accepted 9 December 2010 RÉSUMÉ Les systèmes irrigués collectifs sont communément confrontés à de faibles performances de l’irrigation à l’échelle de l’aménagement. Une étude détaillée a été réalisée dans un périmètre oasien du sud tunisien pour évaluer les performances de la gestion de l’irrigation à l’échelle de l’oasis et de la parcelle. Les données ont été collectées auprès de l’association des usagers de l’eau et sur la base d’une vaste campagne d’enquêtes et d’observations afin de quantifier les causes des faibles performances de l’irrigation. A l’échelle de l’oasis, les résultats montrent que la durée du tour d’eau excède le double de celle prévue par les règles collectives (19 à 21 jours). La principale cause est la durée excessive des irrigations qui atteint presque le double de la règle de 10 h ha ‐1 , due à des pratiques individuelles inappropriées à l’échelle de la parcelle. L’influence modérée de l’extension des superficies irriguées et des dysfonctionnements techniques du réseau est par ailleurs compensée par l’absence ou l’annulation occasionnelle de l’irrigation dans certaines parcelles. A l’échelle de la parcelle, les durées excessives des irrigations sont le résultat d’un effet conjugué des parcelles de petite taille, du mauvais entretien du système d’irrigation, des irrigations nocturnes sans surveillance et de la faible implication du propriétaire. Cette situation met l’accent sur l’efficience et la durabilité des systèmes irrigués quand les agriculteurs ne respectent pas les règles collectives et, dans le cas de systèmes oasiens, étendent les plantations de palmiers. De plus, la situation souligne le manque d’équité qui restreint le soutien apporté par les agriculteurs à l’association des usagers et la stricte application des règles de gestion. Ces résultats devraient permettre d’identifier une approche appropriée et conduire à des changements positifs dans la gestion des systèmes irrigués collectifs. Copyright © 2011 John Wiley & Sons, Ltd. mots clés: règles collectives; gestion collective; pratiques des agriculteurs; irrigation; oasis; Tunisie *Correspondence to: S. Marlet, Centre de Coopération Internationale en Recherche Agronomique pour le Développement (CIRAD), UMR G‐EAU, Montpellier, France. Tel: +33 467166483; Fax: +33 467166440, E‐mail: [email protected] † Pratiques individuelles des agriculteurs et gestion collective de l’irrigation: Pourquoi ne s’accordent‐elles pas dans l’oasis de Fatnassa? IRRIGATION AND DRAINAGE Irrig. and Drain. (2011) Published online in Wiley Online Library (wileyonlinelibrary.com) DOI: 10.1002/ird.626 Copyright © 2011 John Wiley & Sons, Ltd.
Transcript of FARMERS' PRACTICES AND COMMUNITY MANAGEMENT OF IRRIGATION: WHY DO THEY NOT MATCH IN FATNASSA OASIS?
IRRIGATION AND DRAINAGE
Irrig. and Drain. (2011)
Published online in Wiley Online Library (wileyonlinelibrary.com) DOI: 10.1002/ird.626
FARMERS’ PRACTICES AND COMMUNITY MANAGEMENT OF IRRIGATION: WHYDO THEY NOT MATCH IN FATNASSA OASIS?†
WAFA GHAZOUANI1,2, SERGE MARLET1,2*, INSAF MEKKI2, LARRY W. HARRINGTON3 AND ALAIN VIDAL3
1Centre de Coopération Internationale en Recherche Agronomique pour le Développement (CIRAD), UMR G‐EAU, Montpellier, France2Institut National de Recherche en Génie Rural, Eaux et Forêts (INRGREF), Ariana, Tunisia
3CGIAR Challenge Program on Water and Food, Colombo, Sri Lanka
ABSTRACT
Community‐managed irrigation systems are commonly faced with problems of low system‐level performance. A comprehensivesurvey was undertaken to assess and quantify the causes of the low irrigation performance in a community‐managed oasis insouthern Tunisia. At the irrigation system level, results showed that irrigation intervals were double those that had been expected(19–21 days). The main cause was inappropriate farmers’ practices at field level where the irrigation duration was almost twice theexpected 10 h ha‐1. The extension of date palm plantation and technical dysfunctions played a less important role as they werecounterbalanced by cancellation of irrigation in some plots. At the field scale, excessively long irrigation duration resulted from thejoint effects of small fields, poor maintenance of field‐level water delivery systems, uncontrolled night irrigation events and lowfarmer commitment. This situation emphasizes the question of efficiency and sustainability of irrigation systems when farmerssubvert collective rules. Further, the situation raises the question of equity among farmers which hinders their support for the waterusers’ association and the strict application of water allocation rules. These findings should help identify an appropriate approachand lead to positive changes in the management of community irrigation systems. Copyright © 2011 John Wiley & Sons, Ltd.
key words: collective rules; community management; farmers’ practices; irrigation; oasis; Tunisia
Received 1 December 2009; Revised 8 December 2010; Accepted 9 December 2010
RÉSUMÉ
Les systèmes irrigués collectifs sont communément confrontés à de faibles performances de l’irrigation à l’échelle de l’aménagement.Une étude détaillée a été réalisée dans un périmètre oasien du sud tunisien pour évaluer les performances de la gestion de l’irrigation àl’échelle de l’oasis et de la parcelle. Les données ont été collectées auprès de l’association des usagers de l’eau et sur la base d’unevaste campagne d’enquêtes et d’observations afin de quantifier les causes des faibles performances de l’irrigation. A l’échellede l’oasis, les résultats montrent que la durée du tour d’eau excède le double de celle prévue par les règles collectives (19 à 21 jours).La principale cause est la durée excessive des irrigations qui atteint presque le double de la règle de 10 h ha‐1, due à des pratiquesindividuelles inappropriées à l’échelle de la parcelle. L’influence modérée de l’extension des superficies irriguées et desdysfonctionnements techniques du réseau est par ailleurs compensée par l’absence ou l’annulation occasionnelle de l’irrigation danscertaines parcelles. A l’échelle de la parcelle, les durées excessives des irrigations sont le résultat d’un effet conjugué des parcelles depetite taille, du mauvais entretien du système d’irrigation, des irrigations nocturnes sans surveillance et de la faible implication dupropriétaire. Cette situation met l’accent sur l’efficience et la durabilité des systèmes irrigués quand les agriculteurs ne respectent pasles règles collectives et, dans le cas de systèmes oasiens, étendent les plantations de palmiers. De plus, la situation souligne le manqued’équité qui restreint le soutien apporté par les agriculteurs à l’association des usagers et la stricte application des règles de gestion.Ces résultats devraient permettre d’identifier une approche appropriée et conduire à des changements positifs dans la gestion dessystèmes irrigués collectifs. Copyright © 2011 John Wiley & Sons, Ltd.
mots clés: règles collectives; gestion collective; pratiques des agriculteurs; irrigation; oasis; Tunisie
*Correspondence to: S. Marlet, Centre de Coopération Internationale en Recherche Agronomique pour le Développement (CIRAD), UMR G‐EAU,Montpellier, France. Tel: +33 467166483; Fax: +33 467166440, E‐mail: [email protected]†Pratiques individuelles des agriculteurs et gestion collective de l’irrigation: Pourquoi ne s’accordent‐elles pas dans l’oasis de Fatnassa?
Copyright © 2011 John Wiley & Sons, Ltd.
W. GHAZOUANI ET AL.
INTRODUCTION
Privately managed irrigation schemes have proven theirability to achieve high performance in arid and semi‐aridregions. In contrast, community‐managed irrigation systemsin similar regions often fail to achieve expected levels ofperformance (Penning de Vries et al., 2005; Marlet et al.,2006). “In a community‐managed irrigation system, users arein control of and realize such different tasks as waterdistribution, infrastructure maintenance, conflict resolutionand establishment of norms to regulate and oversee irrigationrelated activity” (Beccar et al., 2002). In such systems, waterusers are mutually dependent and lose individual control(Bromley, 1991). When irrigation water is allocated anddelivered in rotation to different users, scheduling constraintsand inappropriate crop irrigation practices can reduceirrigated land productivity (Tyagi et al., 2005).
A number of agronomic, hydraulic and economic issuesare associated with reduced performance of community‐managed irrigation systems. Many of these issues arise froma mismatch between individual farmers’ practices andcollective water allocation rules (Faysse, 2005; Ghazouaniet al., 2009). Even in old community‐managed irrigationsystems of ingenious design and good performance, stateinterventions or rapid technical, economic or social transfor-mation can reinforce individual water management strategiesthat undermine overall system‐level performance.
“Irrigation assessment” is commonly defined as theassessment of irrigation performance, at either irrigationsystem or farm level, using one or several parameters asperformance indicators (Abernethy, 1989). Irrigation assess-ment at the system level often focuses on performanceindicators related to water delivery and distributionefficiency, water balance and water productivity (Sarmaand Rao, 1997; Isidoro et al., 2004; Phengphaengsy andOkudaira 2008). It is sometimes extended to includeindicators of adequacy, equity, reliability, flexibility,productivity and sustainability (Gorantiwar and Smout,2005). Other approaches, including benchmarking, employcomparative indicators. These can be used to establishwhether one irrigation system is more or less efficient thananother and can evaluate the gap between current andachievable performance (e.g. Kloezen and Garcés‐Restrepo,1998; Malano and Burton, 2001). Still other approachesfeature holistic performance assessment for multiplepurposes: to improve system operation, assess progresstowards strategic goals, diagnose constraints, better under-stand the determinants of performance, track the spatial andtemporal variability of system performance, and compareperformance across systems (Burton et al., 2000). Farm‐level irrigation performance is often assessed by indicatorsof application efficiency, distribution uniformity and othertechnical aspects (e.g. Horst et al., 2005; Juana et al., 2007;
Copyright © 2011 John Wiley & Sons, Ltd.
Pereira et al., 2007). Farm‐level assessment is sometimesextended to include socio‐economic, environmental andorganizational issues (e.g. Clemmens et al., 2000; Bekeleand Tilahun, 2006; Norman et al., 2008).
A few studies have assessed irrigation performance at thelevel of water user groups or communities (e.g. Vidal et al.,2004; Vandersypen et al., 2009). Findings emphasize theimportance of fairness for sustainable irrigation management(Tanaka and Sato, 2005); ways in which rules for waterdistribution influence irrigation performance (Brewer et al.,1997); the effects of farmers’ practices on water use efficiency(Watson and Drysdale, 2005); and ways in which traditionalrotational irrigation delivery systems influence farm‐levelirrigation performance (Zardari and Cordery, 2010).
Past assessments of community‐managed irrigation sys-tems have rarely examined the links between farm‐level andsystem‐level performance, or the root causes of lowperformance in community‐managed systems. The presentstudy sought to narrow this gap by examining the relationshipbetween farm‐level irrigation practices and the overallperformance of community‐managed irrigation systems. Itevaluates, for one case study, how farmers’ practices affectrotational irrigation delivery and, in return, how rotationalirrigation delivery influences farmers’ practices. The studytakes account of the extent to which respect for collectivewater allocation rules influences farmers’ decision‐makingon water use.
The rotational irrigation delivery system in the case studyarea was monitored for one year. Actual outcomes werecompared with expected outcomes. Using a previous studyof farmers’ perceptions of existing constraints (Ghazouaniet al., 2009), causal factors driving low performance wereidentified and analysed. The results of the study provideinsights for farmers and extensions services on how toidentify and implement appropriate solutions and messagesfor participatory action planning.
MATERIALS AND METHODS
Case study
Until recent decades, oases in southern Tunisia typically usedan ingenious management arrangement, said to have beendeveloped in the thirteenth century by the scientist Ibn Chabat.Water rights were fixed in terms of units of time, as measuredby a clepsydra (water clock, that is, a clock that measures timeby the escape of water), locally named a gadous. A waterinspection agent, or goddas, had the duty to ensure that waterrights were respected (Bédoucha, 1987). Groundwater wasexploited by collecting the discharge of natural springs. Fromthe 1950s onwards, however, the flow fromnatural springs andartesian wells diminished as groundwater was extracteddirectly through wells, for the development of new oases.
Irrig. and Drain. (2011)
DOI: 10.1002/ird
FARMERS’ PRACTICES AND COMMUNITY MANAGEMENT OF IRRIGATION
This resulted in a continuous lowering of the groundwatertable. From 1970 on, Tunisian policies have supported thelarge‐scale utilization of fossil groundwater resources fromthe Complex Terminal (CT) aquifer and the underlyingContinental Intercalaire (CI) aquifer. This has formed partof the Tunisian management plan for southern waterresources (PDES). This increasing availability of waterresources helped to prevent water shortages but alsofavoured the extension of irrigated areas that increasedfivefold from 1963 to 2007. The aim of the recent APIOSproject (Amélioration des Périmètres Irrigués dans les Oasisdu Sud) was to enhance water productivity through watersaving, and to improve irrigation and drainage networks.
Fatnassa oasis is one of the oldest oases affected by thesechanges. Investments were made in this oasis to increaseirrigation capacity, to increase distribution efficiency byreplacing earthen canals (seguias) with concrete canals, andto increase application efficiency through the adoption ofwater‐saving methods. As a result of these investments, itwas expected that the irrigation interval (time betweenirrigations) of 60 days in 1994 would be substantiallyshortened. Following these improvements, the prescribedirrigation duration (time allowed for each irrigation event)was decreased from 14 to 10 h ha‐1. The irrigated area wassimultaneously affected by two opposite processes. Somefields were abandoned in the ancient sector of Fatnassa oasis
Figure 1. Plots and irrigation network in
Copyright © 2011 John Wiley & Sons, Ltd.
due to a combination of soil degradation, ageing of datepalm trees, inheritance conflicts and land fragmentation. Butat the edge of Fatnassa oasis, farmers continuouslyexpanded date palm plantations which increased from130 ha in 1956 to 214 ha in 2005. The farming system isonly composed of date palm trees (Phoenix dactylifera) and,in a few places, fodder crops. The long irrigation intervalcaused the disappearance of the fruit trees and legume cropswell known in the traditional oasian cropping system.
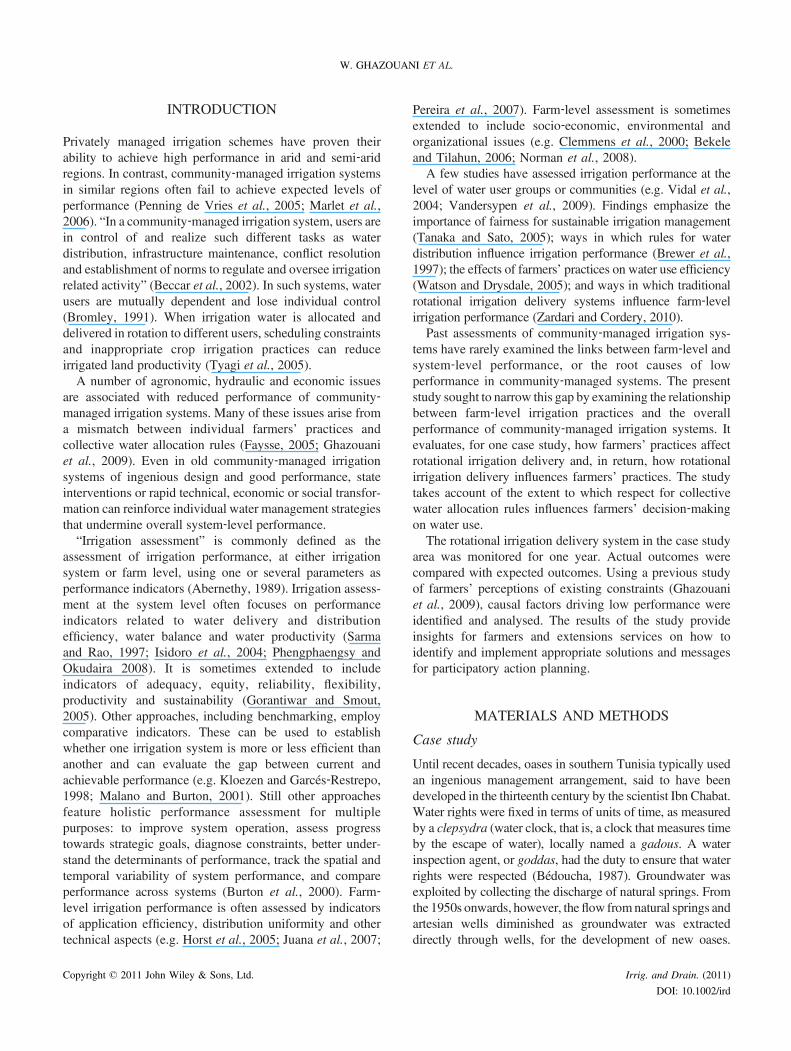
Irrigation water is currently supplied by two wells(Tawargha and Fatnassa II) pumping from the CT aquifer,delivering 42 and 50 l s‐1 respectively, and one geothermalartesian well (CI14) tapping into the CI aquifer, delivering80 l s‐1. Water from the three wells is mixed in a watertower, and then split into two, with half going to thenorthern and half to the southern part of Fatnassa oasis.The present study was carried out in the northern part of theoasis covering 112.5 ha officially included in irrigationmanagement. Water is conveyed to the fields through anetwork of three distribution pipes corresponding to threesectors, together with hydrants and small concrete canals(Figure 1). Irrigation is managed by the local Water Users’Association (GDA). However, the GDA does not enforcethe collective rule for prescribed irrigation duration, nordoes it prevent irrigation of new plantations outside theformer limits of the oasis.
the northern part of Fatnassa oasis
Irrig. and Drain. (2011)
DOI: 10.1002/ird

W. GHAZOUANI ET AL.
Flows from the two CT wells are interrupted for 4 h (from7 to 11 p.m.) every day in summer and all night in winter.During these shutdowns, only CI14 continues to supply theoasis with hot irrigation water that is free of charge. Everyday, the last farmer who irrigates just before the shutdownhas access to this free hot water. In summer, a rotation isorganized sequentially within the fields for each of the threesectors. Field‐level distribution systems have been built byfarmers to convey water to different irrigation basinsthrough earthen seguias or, in a few plots, by subsidizedPVC pipes that have replaced seguias. Building, levellingand maintaining irrigation basins is generally undertakenevery 3–5 years after ploughing and supplying sand. Basedon potential water discharge, the official area of each sectorand the collective rule for irrigation duration of 10 h ha‐1, anirrigation interval of 19–21 days, were established for waterdelivery. Despite the modernization of the irrigationscheme, however, community management of irrigationhas failed to meet expectations and unexpectedly longirrigation intervals have persisted.
Data and analyses
Drawing on farmers’ perceptions, Ghazouani et al. (2009)established a set of cause and effect relationships to explainwhy irrigation intervals remain excessively long. At theirrigation system level, the time between irrigations wasfound to be affected by irrigation duration of irrigated plots,area expansion for date palm plantations and technicaldysfunctions of the irrigation network. At the field level,irrigation duration was found to be affected by farmers’practices (especially long night irrigation events); poormaintenance of the irrigation system; inadequate farmerinvolvement; and environmental conditions such as watertable depth, salinity and soil permeability. The length of theirrigation interval was found to impact on irrigationduration. Farmers tended to increase irrigation duration tocompensate for lengthy irrigation intervals. In order tocompare farmers’ perceptions about irrigation performancewith actual measurements of performance, a set of variableswas selected and indicators were defined and measuredduring the agricultural year 2006–2007.
The date and duration of 2836 irrigation events on 419plots were taken from farm‐level data. The data wererecorded by a water inspection agent employed by theWater Users’ Association for calculation of the irrigationwater fees. They were frequently collected and checkedbefore exploitation. For each plot, irrigation intervals werecalculated as the number of days between two successiveirrigation events. The actual irrigated area of each plot wasupdated from a former land registration data set (CentreNational d’Etudes Agricoles (CNEA), 1984). The durationof irrigation events was adjusted to correspond to actual
Copyright © 2011 John Wiley & Sons, Ltd.
irrigated area and expressed in h ha‐1. It should be noted thatsuccessive irrigation events over a period of 2 or 3 dayswere counted as one event and the irrigation duration ofthese events was summed. These irrigation events weredefined as “night irrigation events”. A ratio between “nightirrigation events” and total irrigation events was calculatedfor each plot. Some irrigation events were also cancelledand some plots were temporarily abandoned. Based onirrigated area, a ratio between cancelled irrigation eventsand allowed irrigation events (estimated from the prescribedirrigation interval) was calculated for each sector and eachseason. Two‐way analyses of variance were performed tocalculate the least‐square means of irrigation intervals andirrigation duration for two seasons (winter and summer) andfor three irrigation sectors.
At the field level, irrigation water distribution systemswere characterized with respect to conveyance infrastructure(earthen seguias or PVC pipes); maintenance quality (landlevelling, construction of irrigation basins, weeding); the sizeof irrigation basins; and the date of the last sand supply. Asurvey of landowners was conducted to characterize farmers’personal involvement in irrigation operations based on theidentification of their main activities (agriculture or not),residence (local or elsewhere), and their function as decisionmakers and/or irrigation practitioners. And finally, a networkof 165 observation wells (grid cells of 100 × 100m) was usedto characterize the depth and the salinity of the shallowgroundwater table as of February and March 2008. The datawere interpolated by kriging using ArcGis 9 software(Johnston et al., 2001). The average groundwater table depthand salinity were calculated for each field.
In the first step, one‐way analysis of variance wasperformed to calculate the least‐square means of irrigationduration in relation to a number of factors, including: classesof actual field size, “night irrigation events” ratio, type ofirrigation system, level of farmer involvement, groundwatertable depth and salinity, number of irrigation events and dateof the last supply of sand. When analysis of variance found afactor to be statistically significant, that factor was retained forfurther analysis. When means were not significantly different,some factors were combined. In the second step, a GeneralLinear Model of irrigation duration was performed, includingsignificant factors and their second‐ and third‐order interac-tions. Datawere analysed usingMinitab software (version 15).
RESULTS
Irrigation intervals
Figure 2 shows irrigation intervals for all irrigation events asa function of time for each of the three sectors for theagricultural year 2006–2007. The lower boundary line showsthe irrigation interval trend over time. Points located above
Irrig. and Drain. (2011)
DOI: 10.1002/ird

Figure 2. Evolution of irrigation intervals during the agricultural year 2006–2007 in the three irrigated sectors of Fatnassa oasis
FARMERS’ PRACTICES AND COMMUNITY MANAGEMENT OF IRRIGATION
Copyright © 2011 John Wiley & Sons, Ltd. Irrig. and Drain. (2011)
DOI: 10.1002/ird

W. GHAZOUANI ET AL.
the trend line represent cancelled irrigation events. The firstirrigation represents a specific event after harvesting whenirrigation was stopped while the land was ploughed, sand andmanure applied, and irrigation basins levelled and built. Atthis stage and in the following winter season, the rotationalirrigation delivery system was not regular and depended oneach farmer’s demand and on maintenance of the collectiveirrigation network. In the winter season, a maximum of 3.30,3.45 and 3.47 rotations took place in sectors 3, 1 and 2,respectively. Table I shows that (i) irrigation was interruptedfor only 18 days in sector 2 in contrast to 49 days in sector 3,and 56 days in sector 1, and (ii) 46, 12 and 22% of theirrigated area were cancelled in sectors 1, 2 and 3,respectively. Due to its larger irrigated area, sector 2 waspreferentially supplied and the rotational irrigation deliverysystem was implemented earlier.
In the summer season (May–October), irrigation becamemore regular and a rotation was observed within each sector.There were only 3.75 rotations in sector 2 compared with4.64 rotations in sector 1 and 4.74 in sector 3. Even whenwater requirements were high, farmers cancelled at least oneirrigation event corresponding to 5, 3 and 6% of the totalirrigated area in sectors 1, 2 and 3, respectively. Rotationintervals began high and gradually decreased from 60 to45 days in sector 2, and from 70 to 30 days in sectors 1 and 3.The initial higher intervals in sectors 1 and 3 were due towinter breaks in the water supply in April andMay (Figure 2).Over the summer peak season (May–September), technicalproblems led to breaks in irrigation of 13, 12 and 24 days insectors 1, 2 and 3, respectively.
Analysis of variance showed significant differences inirrigation intervals between sectors, seasons (first irrigationevent, winter and summer), and their interactions (Table I).Generally, the first irrigation event occurred earlier in sector2 (72 days) than in sectors 1 and 3 (92 and 89 days,respectively). Sector 1 had a shorter irrigation interval thansectors 3 and 2, in both winter and summer seasons. Insector 2, the interval was significantly longer than in sectors
Table I. Mean indicators of irrigation performance in Fatnassa oasis (2n= 419 irrigated plots)
Sector Expected and actualirrigation interval (days)
Expected and actualirrigation duration (h ha‐1)
Rules Summer Winter Rule Summer Winter
Sector 1 20 44 36 10 20.2 18.9(+120%) (+80%) (+102%) (+89%)
Sector 2 21 52 43 10 17.5 17.7(+148%) (+105%) (+75%) (+77%)
Sector 3 19 45 41 10 16.6 19.2(+137%) (+116%) (+66%) (+92%)
Copyright © 2011 John Wiley & Sons, Ltd.
1 and 3 during the summer season when it exceeded 120%of the expected rotation. All pairwise comparison procedureswithin each sector showed significant differences betweenthe seasons except in sector 3.
Influence of irrigated area
At the time of data collection, date palm plantations covered137.44 ha compared with the 112.46 ha of officiallyirrigated area used to establish a rotation of 19–21 daysbased on the irrigation duration of 10 h ha‐1. On the otherhand, actual irrigated area was only 123.42 ha because 81fields were abandoned. Irrigated area increased by 33% insector 2 and by 6% in sector 3, but decreased by 12% insector 1 where the ancient oasis is located, and village ofFatnassa and sand dunes hindered the extension ofplantations (Table I).
Influence of irrigation duration
For the 2836 irrigation events, analysis of variance ofirrigation duration showed significant differences betweensectors, but no significant differences between seasons.Mean irrigation duration was 19.6, 17.6 and 17.9 h ha‐1 insectors 1, 2 and 3, respectively. Sector 1 had the longestsummer irrigation duration (20.2 h ha‐1) compared with 17.5and 16.6 h ha‐1 in sectors 2 and 3, respectively (Table I).
A comparison was made between “measured irrigationduration” and “prescribed irrigation duration”. Figure 3shows that only 7.1% of the 196 fields in sector 1, 12.1% ofthe 124 fields in sector 2 and 21.2% of the 99 fields in sector 3complied with the current rule of 10 h ha‐1. In contrast, 75.5%of fields in sector 1, 65.3% in sector 2 and 60.6% in sector 3actually exceeded the former rule of 14 h ha‐1.
Root causes of the high irrigation durations
The first round of one‐way analysis of variance (Table II)showed significant differences in irrigation duration with
836 irrigation events during the agricultural year 2006–2007 for
Official and actualirrigated area (ha)
Cancelled irrigationevents ratio (ha ha‐1)
Irrigationbreak (days)
Official Actual Summer Winter Summer Winter
37.5 33.1 0.05 0.46 13 56(−12%)
39.1 52.1 0.03 0.12 12 18(+33%)
35.9 38.25 0.06 0.22 24 49(+6%)
Irrig. and Drain. (2011)
DOI: 10.1002/ird

Figure 3. Histogram of irrigation duration with respect to the current rule of 10 h ha‐1 and the former rule of 14 h ha‐1 (n= 419, 2006–2007)
FARMERS’ PRACTICES AND COMMUNITY MANAGEMENT OF IRRIGATION
respect to field size, the night irrigation event ratio, theirrigation system, the level of farmer involvement, and thedepth of the groundwater table, but no significantdifferences in irrigation duration with respect to ground-water salinity, the date of the last supply of sand and thenumber of irrigation events. Non‐significant variables wererejected and the significant indicators were included in theGeneral Linear Model (GLM), the results of which arepresented in Table III.
Influence of field size and night irrigation events ratio
Irrigated field size ranged from 0.01 to 2.65 ha. Typicallyfields were small: 29.1% of irrigated fields comprised less than0.1 ha, 62.8% less than 0.25 ha, and only 4.1%weremore than1 ha in size. The mean area for an irrigated field in the oasiswas 0.29 ha. Smaller field size was associated with longerirrigation duration. Mean irrigation duration decreasedsignificantly from 20.5 h ha‐1 (below 0.25 ha) to 17.4 (from0.25 to 0.5 ha), and to 12.7 h ha‐1 (above 0.5 ha) (Figure 4).
During the agricultural year 2006–2007, 46.3% of theplots were irrigated at night at least once and 19.8% werecharacterized by a night irrigation events ratio of more than0.3. The presence of night irrigation events was associatedwith longer irrigation duration. Mean irrigation durationincreased significantly from 14.4 h ha‐1 with no nightirrigation events, to 17.9 h ha‐1 with occasional nightirrigation events (ratio <0.3), and to 18.4 h ha‐1 with frequentnight irrigation events (ratio ≥0.3) (Figure 4).
The interaction between field size and the night irrigationevents ratio was also significant (Table III). Larger fieldswere more likely to have frequent night irrigation events. Forthe largest irrigated fields (more than 0.5 ha), mean irrigationduration varied from 9.1 h ha‐1 with no night irrigation
Copyright © 2011 John Wiley & Sons, Ltd.
events, to 13.5 h ha‐1 with occasional night irrigation events,reaching 15.6 h ha‐1 with frequent night irrigation events.Fully 68% of the largest plots had frequent night irrigationevents. Occasional night irrigation events also led to asignificant increase in irrigation duration for the smallestplots from 18.9 to 23.7 h ha‐1. However, night irrigationevents were found in only 30% of the smallest plots. In theabsence of night irrigation events, irrigation duration wasalso related to plot size, decreasing from 18.9 to 15.2, and to9.1 h ha‐1 for small, medium and large fields, respectively.When night irrigation events occurred, the size of the fieldappeared to have less effect, except for occasional nightirrigation events in the smallest fields, when irrigationduration was significantly higher.
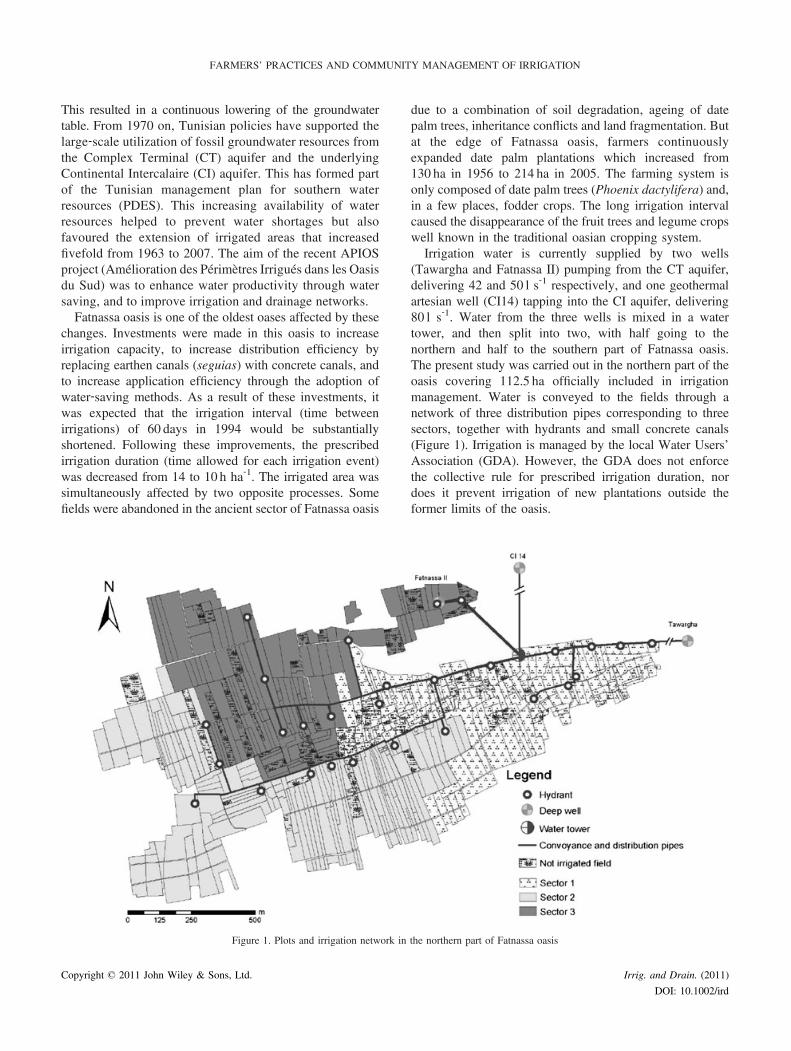
Influence of field size and farmer involvement
Two types of farmer involvement were also distinguishedaccording to land tenure and who was actually responsiblefor irrigation. “High involvement” was defined as the ownerbeing present and he or his family being responsible forirrigating. “Poor involvement” was defined as a workerbeing entrusted with irrigation or the owner havingdelegated farm management. Mean irrigation duration wassignificantly lower (15.8 h ha‐1) with “high involvement”,found on 55.1% of irrigated plots, than with “poorinvolvement” (18 h ha‐1), found on 44.9% of irrigated plots.
The differences in irrigation duration between “highinvolvement” and “poor involvement” farmers wereparticularly large for the smallest fields (<0.25 ha) but werenot significant for larger fields (>0.25 ha). In other words,irrigation duration was sensitive to field size when the farmerwas poorly involved. It decreased from 23.4 (<0.25 ha) to17.9 (from 0.25 to 0.5 ha), and to 12.8 h ha‐1 (>0.5 ha). In
Irrig. and Drain. (2011)
DOI: 10.1002/ird

Table II. Mean irrigation duration (h ha‐1) for different sources ofvariation at the field level. One‐way analyses of variance using theKruskal–Wallis method and pairwise multiple comparisons usingDunn’s method (n= 419, 2006–2007)
Sources of variation n Irrigationduration
(h ha‐1)
Actual field size (***)‐ SA< 0.1 ha 122 19.6a
‐ 0.1 ≤SA<0.25 ha 141 17.9ab
‐ 0.25 ≤SA< 0.50 ha 89 16bc
‐ 0.50 ≤SA< 1 ha 50 13.6cd
‐ SA ≥1 ha 17 9.8e
Night irrigation events (*)‐ no event (R = 0) 225 17.2ab
‐ occasional events (0 <R< 0.3) 111 17.4a
‐ frequent events (R≥ 0.3) 83 15.5b
Irrigation system (***)‐ traditional small basins andgood maintenance
7 11.3b
‐ traditional large basins andgood maintenance
176 13.4b
‐ improved system with PVC pipes 32 13.4b
‐ traditional and weak maintenance 204 20.2a
Farmer’s involvement (*): manager/irrigation operator
‐ owner/owner 148 16.7‐ owner/family member 83 16.7‐ owner/agricultural worker 30 18.2‐ else/family member 107 19.4‐ else/agricultural worker 51 19.1
Groundwater table depth (*)‐ shallow (0.55–0.75m) 180 16.1b
‐ medium (0.75–1m) 147 17.2ab
‐ deep (1–1.31m) 92 18a
Water table salinity (NS)‐ CE< 8 dS m‐1 34 16.8‐ 8 ≤CE<12 dS m‐1 284 17.4‐ 12 ≤CE< 16 dS m‐1 80 15.9‐ CE ≥16 dS m‐1 21 15.8
Number of irrigation events (NS)‐ low (2 to 4 times) 38 18‐ medium (5 to 6 times) 114 16.9‐ high (7 to 10 times) 267 17.1
Last sand supply (NS)‐ before 2006 258 17.2‐ 2006 43 17.2‐ 2007 73 16.7‐ 2006 or 2007 45 16.8
*Significant at pv< 0.05.***Significant at pv< 0.001.NS non‐significant.a,b,c,…Data followed by the same letter do not differ at pv.< 0.05.
W. GHAZOUANI ET AL.
contrast, mean irrigation duration did not differ significantlywith respect to field size when the farmers were highlyinvolved (Figure 5).
Copyright © 2011 John Wiley & Sons, Ltd.
Influence of irrigation system, farmer involvement andnight irrigation events
At the field level, two types of irrigation systems weredistinguished according to the way water was distributed andthe quality of maintenance. Mean irrigation duration wassignificantly higher in “damaged irrigation systems” withtraditional earthen seguias and poormaintenance of irrigationbasins (19.8 h ha‐1), compared to “improved irrigationsystems”, with distribution through PVC pipes or good basinmaintenance (14 h ha‐1). Damaged irrigation systems wereobserved in 48.7% of the irrigated fields.
The interaction between irrigation system and farmerinvolvement was highly significant (Table III, Figure 6a).Mean irrigation duration increased from 13.8 h ha‐1 with animproved irrigation system to 22.2 h ha‐1 with a damagedirrigation system when farmers were poorly involved. Thiscorresponding increase in irrigation duration was only from14.2 to 17.3 h ha‐1 when the farmers were highly involved. Inother words, mean irrigation duration only increased from17.3 to 22.2 h ha‐1 due to low farmer involvement in the caseof a damaged irrigation system.
The interaction between irrigation system, farmer involve-ment and the night irrigation events ratio was also significant(Table III, Figure 6b,c). Mean irrigation duration increasedfrom 18.6 to 22.0, and to 26.1 h ha‐1 with an increase in thenight irrigation events ratio when both the irrigation systemwas damaged and the farmers poorly involved. In contrast,the increase in the night irrigation events ratio did not affectirrigation duration in the case of an improved irrigationsystem, or when the farmers were highly involved.
DISCUSSION
While the previous study by Ghazouani et al. (2009) usedfarmers’ perceptions to analyse the causes of excessivelylong irrigation intervals in Fatnassa oasis, the presentstudy allowed a quantitative analysis of these causes. Themain cause of long irrigation intervals was found to be aconsiderable increase in irrigation duration which at the fieldlevel was almost double the prescribed duration. The in-fluence of the extension of date palm plantations and thebreaks in irrigation were found to be less important and werelargely compensated by the number of abandoned plots orthe cancellation of some irrigation events. Environmentalconstraints (salinity and waterlogging) did not affectirrigation practices. The increase in irrigation duration wastraced to a complex combination of causes related tofarmers’ practices.
This study revealed a specific problem related to smallirrigated plot size. Irrigation duration was significantly higherin smaller fields than in larger ones. However, plot size wasfound to play only a determining role when farmers were
Irrig. and Drain. (2011)
DOI: 10.1002/ird

Figure 4. Mean irrigation duration according to field size and the frequency of night irrigation events (n= 419, 2006–2007)
Table III. Variance analysis of irrigation duration (h ha‐1) at the field level: General Linear Model (r²= 0.41, n= 419, 2006–2007)
Indicators andmodalities
Actual field size (AFS) (ha): [0.01–0.25]; [0.25–0.5]; [0.5–2.65]Night irrigation events ratio (NIR): R= 0; 0 <R < 0.3; R ≥0.3Irrigation system (IS): improved and good maintenance; weak maintenanceFarmer’s involvement (FI): high involvement; poor involvement
Source of variance DF Sum of squares Mean square F pvModel 32 11 930.02 372.81 8.22 <0.001***
Main effectsAFS 2 1 026.84 513.42 11.32 <0.001***NIR 2 387.02 193.51 4.27 0.015*IS 1 1 848.22 1 848.22 40.76 <0.001***FI 1 225.78 225.78 4.98 0.026*
InteractionsAFS×NIR 4 514.34 128.58 2.84 0.024*AFS× IS 2 32.95 16.48 0.36 0.696AFS× FI 2 340.02 170.01 3.75 0.024*NIR× IS 2 187.99 93.99 2.07 0.127NIR× FI 2 64.47 32.24 0.71 0.492IS × FI 1 442.60 442.60 9.76 0.002**AFS×NIR× IS 3 70.52 23.52 0.52 0.670AFS× IS × FI 2 148.38 74.19 1.64 0.196NIR× IS × FI 2 295.08 147.54 3.25 0.04*AFS×NIR× FI 3 175.22 58.41 1.29 0.278AFS×NIR× IS × FI 3 166.19 55.40 1.22 0.302
Residual 386 17 502.03 45.34Total 418 29 432.05
*Significant at pv< 0.05.**Significant at pv< 0.01.***Significant at pv< 0.001.
FARMERS’ PRACTICES AND COMMUNITY MANAGEMENT OF IRRIGATION
poorly committed, i.e. when landowners entrusted unskilledworkers with irrigation or delegated farm management. Somelandowners live in other regions or in foreign countries and are
Copyright © 2011 John Wiley & Sons, Ltd.
termed absentee farmers. Even when they live in the village,they often depend on non‐agricultural income and cannot be aspersonally and intensively committed to plot‐level irrigation
Irrig. and Drain. (2011)
DOI: 10.1002/ird
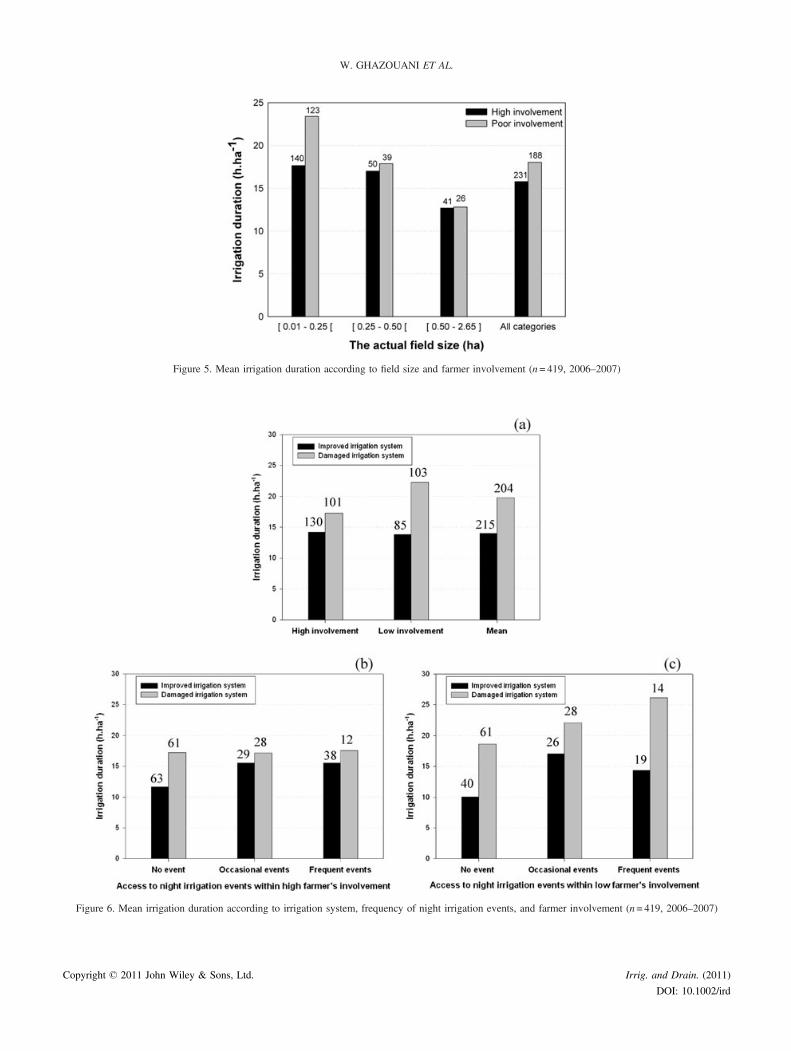
Figure 5. Mean irrigation duration according to field size and farmer involvement (n= 419, 2006–2007)
Figure 6. Mean irrigation duration according to irrigation system, frequency of night irrigation events, and farmer involvement (n= 419, 2006–2007)
W. GHAZOUANI ET AL.
Copyright © 2011 John Wiley & Sons, Ltd. Irrig. and Drain. (2011)
DOI: 10.1002/ird

FARMERS’ PRACTICES AND COMMUNITY MANAGEMENT OF IRRIGATION
management. Such impacts of land division on the perfor-mance of a community‐managed irrigation scheme have beenobserved in studies conducted in similar situations in Spain(Faci et al., 2000; Neira et al., 2005) and in New Mexico(Skaggs and Samani, 2005).
The type of irrigation system was also a major cause ofvariability of irrigation duration. The improvement ofirrigation distribution by means of PVC pipes or goodmaintenance of traditional earthen seguias led to asignificant decrease in irrigation duration. But, as for fieldsize, this effect was strongest when farmers were poorlycommitted. Improvement of the irrigation system can thus beanalysed as a modernization process that reduces the burdenof farm‐level irrigation management. Maintenance of theirrigation system proved to be important but can only beachieved through expensive ploughing and the supplying ofsand to rebuild the plot‐level water distribution system. PVCpipes are subsidized but sand supplies are not. Small‐scalefarmers with low incomes cannot pay the additional costs ofirrigation maintenance. In the case of improved irrigationsystems, the gap in irrigation duration between poorly andhighly committed farmers was insignificant. Absenteefarmers are often described as poorly committed farmers,but some are prosperous and have improved their irrigationsystem resulting in excellent performance.
The use of night irrigation events led to an increase inirrigation duration. But this effect was mainly felt when thefield was large, or when the farmers were poorly committedand their irrigation system was damaged. This issue can beexplained in two ways. In the case of farmers’ poorcommitment and a damaged irrigation system, the increasein irrigation duration seems to be the expression ofuncontrolled night irrigation events, especially in smallfields. Many farmers are not present during the nightirrigation events and only go to check irrigation on thefollowing morning. Most of these farmers have severalprofessional activities. In the case of large fields, it couldalso be an intentional tactic to lengthen irrigation and toobtain free hot water during the pumping break, or toirrigate an unofficial extension of the plantation. The impactof night irrigation events should be discussed with thefarmers who need to be made aware of the flexible supplyrepresented by night irrigation (Ghumman et al., 2009).
The efficiency and sustainability of the overall irrigationsystem are being undermined because farmers disregard therules imposed for community‐managed irrigation. This is allthe more surprising because the farmers’ practices them-selves were responsible for the long irrigation duration andconsequently the long irrigation rotation intervals. Farmerswere aware of the problem but have not yet found anappropriate solution. On the other hand, the farmers havetaken advantage of former public policies to invest in newfacilities for irrigation water supply. They still believe that it
Copyright © 2011 John Wiley & Sons, Ltd.
is possible to create new deep wells in spite of the hugeresulting depletion and salinization of the CT aquifer.Farmers need to be made aware of the fact that the currentoverexploitation of the fossil groundwater resource and soilsalinization will increase with expansion of the date palmplantation (Marlet et al., 2009).
The situation also raises questions of equity and of farmers’support for the Water Users’ Association. Only a few pow-erful farmers have extended their plantation, therebyobtaining increased water rights. Despite a recent decreethat defined the final boundary of the oasis, a disparitybetween small and large owners persists. In Fatnassa oasis,there is a remarkable relationship between the extension ofthe date palm plantation and farmers’ attitudes. If rules are notrespected by powerful farmers, other farmers are discouragedfrom respecting the collective rules of community‐managedirrigation. This behaviour is in agreement with that observedby Brewer et al. (1997), Plusquellec (2002) and Zardari andCordery (2010) concerning the relationship between inequityand efficiency. The question now is how to escape from thisvicious circle. Although oases are often cited as examples ofrespecting ancient water rights (e.g. Bédoucha, 1987),collective rules must be updated to achieve efficientcommunity management in Fatnassa oasis. The processshould be supported by participatory approaches includingthe farmers, and appropriate state interventions, including afinal definition of the oasis boundary to rebuild confidence.
Finally, questions of sustainability must be raised. InFatnassa, some powerful farmers, discouraged by uncertainwater delivery and the inefficiency of the communitymanagement of irrigation, have installed individual deepwells. In the Nefzawa, the expansion of “illicit” deep wellsdating from the 1970s is well known (Kassah, 1996).Proliferation of private deep wells has been linked togroundwater depletion as well as to the degradation ofgroundwater quality (Zammouri et al., 2007). Around theworld, especially in large‐scale irrigated schemes in SaudiArabia, Libya, Bangladesh, China, India and Pakistan, manyfarmers increasingly rely on groundwater for irrigation(Plusquellec, 2002). Although such groundwater exploitationmay temporarily raise food production and farm incomes, itmay worsen water scarcity in the long term. A main challengenow is to find pathways to sustainability of the growinggroundwater economy (Kuper et al., 2009).
CONCLUSION
The approach used in this study enabled us to assess andclassify the root causes of long irrigation intervals in acommunity‐managed irrigation scheme in an oasis insouthern Tunisia. Long intervals between irrigations werefound to be associated with farmers’ practices and circum-stances at the field level, including poor farmer commitment
Irrig. and Drain. (2011)
DOI: 10.1002/ird
W. GHAZOUANI ET AL.
to irrigation management linked with small farms andexcessive land division; lack of improvement of field‐levelwater distribution systems thanks to the expensive supply ofsand; and the specific case of uncontrolled night irrigationevents. Above all, the study raised the question of inequityrelated to unauthorized extension of the date palm plantation,farmers’ support for the Water Users’ Association, and theacceptance of collective rules. These findings can informdialogue and policy change aimed at fostering positivechanges in themanagement of community irrigation systems.It could particularly address the effectiveness of technical ormanagerial solutions and participatory approaches to improveland and water management.
ACKNOWLEDGEMENTS
The authors would like to sincerely thank all the farmers inFatnassa oasis for giving us free access to their fields andare indebted to them for patiently responding to ourquestions. We gratefully acknowledge the kind cooperationof the GDA of Fatnassa and the CRDA of Kebili (Tunisia).This research was supported by a PhD grant and fundingfrom the French Ministry of European and Foreign Affairswithin the SIRMA project that addresses water saving inirrigated agriculture in the Maghreb (North‐west Africa).
REFERENCES
Abernethy CL. 1989. Performance criteria for irrigation systems. InProceedings on International Conference on Irrigation Theory andPractice, Rydzewski JR, Ward K (eds), University of Southampton, UK,12–15 September 1989.
Beccar L, Boelens R, Hoogendam P. 2002. Water rights and collectiveaction in community irrigation. In Water Rights and Empowerment,Boelens R, Hoogendam P (eds). Koninklijke Van Gorcumpp: Assen, theNetherlands; 1–21.
Bédoucha G. 1987. L’Eau, l’amie du puissant. Une communauté oasienneau Sud tunisien. Edition des archives contemporaines: Paris; 427 pp.
Bekele Z, Tilahun K. 2006. On‐farm performance evaluation of improvedtraditional small‐scale irrigation practices: a case study from Dire Dawaarea, Ethiopia. Irrigation and Drainage Systems 20: 83–98.
Brewer JD, Sakthivadivel R, Raju KV. 1997. Water Distribution Rules andWater Distribution Performance: a Case Study in the TambraparaniIrrigation System. Research Report 12. IIMI: Colombo, Sri Lanka; 43 pp.
Bromley DW. 1991. Environment and Economy: Property Rights andPublic Policy. Blackwell: Oxford and Cambridge.
Burton M, Molden D, Skutsch J. 2000. Benchmarking irrigation anddrainage system performance. Position paper, FAO, Rome, Italy;28 pp.
Clemmens AJ, Dedrick AR, Clyma W, Ware RE. 2000. On‐farm systemperformance in the Maricopa‐Stanfield Irrigation and Drainage Districtarea. Irrigation and Drainage Systems 14: 93–120.
Centre National d’Etudes Agricoles (CNEA). 1984. Projet de rénovationet de création d’oasis dans la Nefzaoua. Oasis de Fatnassa 1, Fatnassa2, Bechri et Zaouiet el Anez. Ministère de l’Agriculture, des RessourcesHydrauliques et de la pêche: Tunis, Tunisia; 45 pp.
Copyright © 2011 John Wiley & Sons, Ltd.
Faci JM, Bensaci A, Slatni A, Playán E. 2000. A case study forirrigation modernisation I. Characterisation of the district andanalysis of water delivery records. Agricultural Water Management42: 313–334.
Faysse N. 2005. Coping with the strategy of the commons: game structureand design of rules. Journal of Economic Surveys 19(2): 239–261.
Ghazouani W, Marlet S, Mekki I, Vidal A. 2009. Farmers’ perceptions andengineering approach in the modernization of a community‐managedirrigation scheme. A case study from an oasis of the Nefzawa (South ofTunisia). Irrigation and Drainage 58: S285–S296.
Ghumman AR, Khan Z, Turral H. 2009. Study of feasibility of night‐closure of irrigation canals for water saving. Agricultural WaterManagement 96: 457–464.
Gorantiwar SD, Smout IK. 2005. Performance assessment of irrigationwater management of heterogeneous irrigation schemes: 1. A frameworkfor evaluation. Irrigation and Drainage Systems 19: 1–36.
Horst MG, Shamutalov SS, Pereira LS, Gonçalves JM. 2005. Fieldassessment of the water saving potential with furrow irrigation inFergana, Aral Sea basin. Agricultural Water Management 77: 210–231.
Isidoro D, Quílez D, Aragüés R. 2004. Water balance and irrigationperformance analysis: La Violada irrigation district (Spain) as a casestudy. Agricultural Water Management 64: 123–142.
Johnston K, ver Hoef JM, Krivoruchko K, Lucas N. 2001. Using ArcGISGeostatistical Analyst. Environmental Systems Research Institute:Redlands, Calif.
Juana L, Rodriguez‐Sinobas L, Sànchez R, Losada A. 2007. Evaluation ofdrip irrigation: selection of emitters and hydraulic characterization oftrapezoidal units. Agricultural Water Management 90: 13–26.
Kassah A. 1996. Les oasis tunisiennes: aménagement hydro‐agricoleet développement en zone aride. Faculté des lettres et sciences humainesde Tunis, 13th series, Géographie; 346 pp.
Kloezen WH, Garcés‐Restrepo C. 1998. Assessing Irrigation Perfor-mance with Comparative Indicators: the Case of the Alto Rio LermaIrrigation District, Mexico. Research Report 22. IWMI: Colombo, SriLanka; 35 pp.
Kuper M, Bouarfa S, Errahj M, Faysse N, Hammani A, Hartani T, Marlet S,Zairi A, Bahri A, Debbarh A, Garin P, Jamin JY, Vincent B. 2009. A cropneeds more than a drop: towards a new praxis in irrigation management inNorth Africa. Irrigation and Drainage 58: S231–S239.
Malano H, Burton M. 2001. Guidelines for Benchmarking Performancein the Irrigation and Drainage Sector. IPTRID Secretariat, FAO,Rome, Italy.
Marlet S, Hammami A, Hartani T, Kuper M, Zairi A. 2006. Enjeux etcontraintes liés à la modernisation de l’agriculture irriguée dans les paysdu Maghreb. AgroLine 54: 21–30.
Marlet S, Bouksila F, Bahri A. 2009. Water and salt balance at irrigationscheme scale: a comprehensive approach for salinity assessment in aSaharan oasis. Agricultural Water Management 96: 1311–1322.
Neira XX, Álvarez CJ, Cuesta TS, Cancela JJ. 2005. Evaluation ofwater‐use in traditional irrigation: an application to the Lemos Valleyirrigation district, northwest of Spain. Agricultural Water Management75: 137–151.
Norman WR, McCann I, Al‐Ghafri A. 2008. On‐farm labour allocation andirrigation water use: case studies among smallholder systems in aridregions. Irrigation and Drainage Systems 22: 79–92.
Penning de Vries FWT, Sally H, Inocencio A. 2005. Opportunitiesfor private sector participation in agricultural water developmentand management. Working paper 100. IWMI: Colombo, Sri Lanka;50 pp.
Pereira LS, Goncalves JM, Dong B, Mao Z, Fang SX. 2007. Assessingbasin irrigation and scheduling strategies for saving irrigation water andcontrolling salinity in the upper Yellow River Basin, China. AgriculturalWater Management 93: 109–122.
Irrig. and Drain. (2011)
DOI: 10.1002/ird

FARMERS’ PRACTICES AND COMMUNITY MANAGEMENT OF IRRIGATION
Phengphaengsy F, Okudaira H. 2008. Assessment of irrigation efficienciesand water productivity in paddy fields in the lower Mekong River Basin.Paddy and Water Environment 6: 105–114.
Plusquellec H. 2002. Is the daunting challenge of irrigation achievable?Irrigation and Drainage 51: 185–198.
Sarma PBS, Rao VV. 1997. Evaluation of an irrigation watermanagement scheme – a case study. Agricultural Water Management32: 181–195.
Skaggs RK, Samani Z. 2005. Farm size, irrigation practices and on‐farmirrigation efficiency. Irrigation and Drainage 54: 43–57.
Tanaka Y, Sato Y. 2005. Farmers managed irrigation districts in Japan:assessing how fairness may contribute to sustainability. AgriculturalWater Management 77: 196–209.
Tyagi NK, Agrawal A, Sakthivadivel R, Ambast SK. 2005. Watermanagement decisions on small farms under scarce canal watersupply: a case study from NW India. Agricultural Water Management77: 180–195.
Copyright © 2011 John Wiley & Sons, Ltd.
Vandersypen K, Verbist B, Keita ACT, Raes D, Jamin J‐Y. 2009. Linkingperformance and collective action – the case of theOffice duNiger IrrigationScheme in Mali. Water Resources Management 23 (1): 153–168.
Vidal A, Rigourd C, Nepveu de Villemarceau A. 2004. Identificationet diffusion de bonnes pratiques sur les périmètres irrigués en Afriquede l’Ouest. Rapport final du projet IPTRID GCP/RAF/355/FRA.IPTRID, FAO, Rome, Italy; 46 pp.
Watson DJ, Drysdale G. 2005. Irrigation practices on north‐east Victoriandairy farms: a survey. Australian Journal of Experimental Agriculture 45:1539–1549.
Zammouri M, Siegfried T, El‐Fahem T, Kriâa S, Kinzelbach W. 2007.Salinization of groundwater in the Nefzawa oases region, Tunisia: resultsof a regional‐scale hydrogeologic approach. Hydrogeology Journal 15:1357–1375.
Zardari NH, Cordery I. 2010. Estimating the effectiveness of a rotationalirrigation delivery system: a case study from Pakistan. Irrigation andDrainage 59: 277–290.
Irrig. and Drain. (2011)
DOI: 10.1002/ird