Modern organic carbon burial fluxes, recent sedimentation rates, and particle mixing rates from the...
21
Deep-Sea Research II 49 (2002) 4645–4665 Modern organic carbon burial fluxes, recent sedimentation rates, and particle mixing rates from the upper continental slope near Cape Hatteras, North Carolina (USA) Marc J. Alperin a, *, Ismail B. Suayah b,1 , Larry K. Benninger b , Christopher S. Martens a a Department of Marine Sciences, University of North Carolina, 17-7, Chapel Hill, NC 27599-3300, USA b Department of Geological Sciences, University of North Carolina, Chapel Hill, NC 27599-3315, USA Accepted 12 February 2002 Abstract The prominent band of organic-rich surface sediment (2–3% organic carbon) that straddles the upper continental slope near Cape Hatteras suggests that this region may be an important depocenter for phytodetritus exported from the highly productive shelf waters of the Mid-Atlantic Bight (MAB). To understand better the role of modern (post-1955) carbon burial in continental slope sediments, we quantified rates of recent (defined as o10 2 -yr timescale) sediment accumulation, particle mixing, and organic carbon burial for 12 cores from 10 upper slope stations (212–1004 m) in the proximity of Cape Hatteras. Recent sedimentation and mixing rates were evaluated using diagenetic models calibrated by coupling two modern particle tracers with distinct input functions: excess 210 Pb and fallout Pu. These two radionuclides provide independent information that can be used to deconvolve the effects of sediment accumulation and mixing. Recent sedimentation rates range from 10 to 425 cm kyr 1 (mean=106 cm kyr 1 ) and biodiffusion coefficients for the deep mixing layer (9–21 cm) range from 0.3 to 5.2 cm 2 yr 1 (mean=1.3 cm 2 yr 1 ). Total carbon burial for this region based on recent sedimentation rates (1.1 mol C m 2 yr 1 ) is considerably higher than that reported for the more northern sections of the MAB. Although the narrowing shelf and convergence of southward flowing shelf waters and the north-flowing Gulf Stream promote carbon export and deposition off Cape Hatteras, we estimate that modern carbon burial in upper slope sediments in this region accounts for much less than 1% of the shelf production. r 2002 Elsevier Science Ltd. All rights reserved. 1. Introduction The concept that slope sediments are a signifi- cant sink for fossil fuel-derived carbon can be traced back to the food-web models for continen- tal shelves first published by Walsh et al. (1981). These models suggested that much of the shelf phytodetritus is exported offshore to be deposited and buried on the continental slope. Subsequent work, however, has shown that primary produc- tion and heterotrophic oxidation on the shelf are more tightly coupled than previously thought (Rowe et al., 1986; Falkowski et al., 1988). Current estimates of the fraction of annual shelf *Corresponding author. Tel.: +1-919-962-5184; fax: +1- 919-962-1254. E-mail address: [email protected] (M.J. Alperin). 1 Current address: TIBCO Extensibility, Inc., 200 W. Franklin St., Suite 250, Chapel Hill, NC 27516, USA 0967-0645/02/$ - see front matter r 2002 Elsevier Science Ltd. All rights reserved. PII:S0967-0645(02)00133-9
Transcript of Modern organic carbon burial fluxes, recent sedimentation rates, and particle mixing rates from the...
Deep-Sea Research II 49 (2002) 4645–4665
Modern organic carbon burial fluxes, recent sedimentationrates, and particle mixing rates from the upper continental
slope near Cape Hatteras, North Carolina (USA)
Marc J. Alperina,*, Ismail B. Suayahb,1, Larry K. Benningerb,Christopher S. Martensa
aDepartment of Marine Sciences, University of North Carolina, 17-7, Chapel Hill, NC 27599-3300, USAbDepartment of Geological Sciences, University of North Carolina, Chapel Hill, NC 27599-3315, USA
Accepted 12 February 2002
Abstract
The prominent band of organic-rich surface sediment (2–3% organic carbon) that straddles the upper continental
slope near Cape Hatteras suggests that this region may be an important depocenter for phytodetritus exported from the
highly productive shelf waters of the Mid-Atlantic Bight (MAB). To understand better the role of modern (post-1955)
carbon burial in continental slope sediments, we quantified rates of recent (defined as o102-yr timescale) sediment
accumulation, particle mixing, and organic carbon burial for 12 cores from 10 upper slope stations (212–1004m) in the
proximity of Cape Hatteras. Recent sedimentation and mixing rates were evaluated using diagenetic models calibrated
by coupling two modern particle tracers with distinct input functions: excess 210Pb and fallout Pu. These two
radionuclides provide independent information that can be used to deconvolve the effects of sediment accumulation
and mixing. Recent sedimentation rates range from 10 to 425 cmkyr�1 (mean=106 cmkyr�1) and biodiffusion
coefficients for the deep mixing layer (9–21 cm) range from 0.3 to 5.2 cm2 yr�1 (mean=1.3 cm2 yr�1). Total carbon
burial for this region based on recent sedimentation rates (1.1mol Cm�2 yr�1) is considerably higher than that reported
for the more northern sections of the MAB. Although the narrowing shelf and convergence of southward flowing shelf
waters and the north-flowing Gulf Stream promote carbon export and deposition off Cape Hatteras, we estimate that
modern carbon burial in upper slope sediments in this region accounts for much less than 1% of the shelf production.
r 2002 Elsevier Science Ltd. All rights reserved.
1. Introduction
The concept that slope sediments are a signifi-cant sink for fossil fuel-derived carbon can be
traced back to the food-web models for continen-tal shelves first published by Walsh et al. (1981).These models suggested that much of the shelfphytodetritus is exported offshore to be depositedand buried on the continental slope. Subsequentwork, however, has shown that primary produc-tion and heterotrophic oxidation on the shelfare more tightly coupled than previously thought(Rowe et al., 1986; Falkowski et al., 1988).Current estimates of the fraction of annual shelf
*Corresponding author. Tel.: +1-919-962-5184; fax: +1-
919-962-1254.
E-mail address: [email protected] (M.J. Alperin).1Current address: TIBCO Extensibility, Inc., 200 W.
Franklin St., Suite 250, Chapel Hill, NC 27516, USA
0967-0645/02/$ - see front matter r 2002 Elsevier Science Ltd. All rights reserved.
PII: S 0 9 6 7 - 0 6 4 5 ( 0 2 ) 0 0 1 3 3 - 9
production that is transported offshore range from1% to 6% (Falkowski et al., 1994). Although earlyestimates of carbon export from continentalshelves were probably too high, the current upperlimit of 6% still allows a significant amount ofshelf carbon (0.3 Pg yr�1)2 to escape in situoxidation and possibly end up buried in slopesediments.
If export of shelf carbon is significant, it isunlikely that this material is deposited evenlyover the continental slope. Rather, we expectcarbon deposition and burial to be focusedat specific ‘‘depocenter’’ sites where the geomor-phology and prevailing ocean currents promotecross-shelf transport and sedimentation. One suchsite is the upper continental slope near Cape
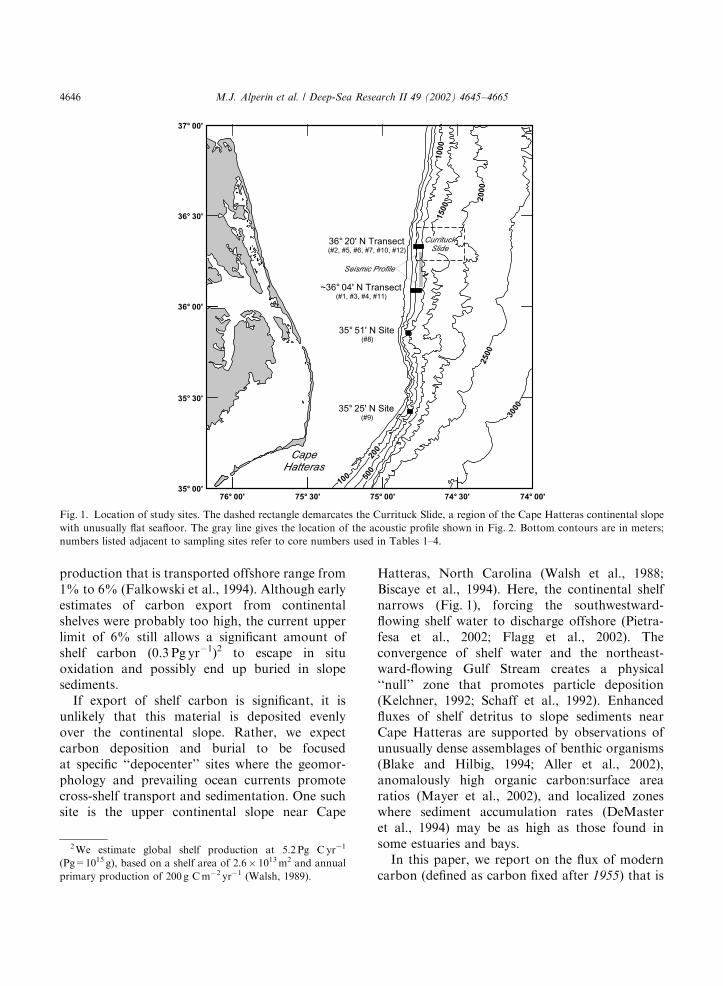
Hatteras, North Carolina (Walsh et al., 1988;Biscaye et al., 1994). Here, the continental shelfnarrows (Fig. 1), forcing the southwestward-flowing shelf water to discharge offshore (Pietra-fesa et al., 2002; Flagg et al., 2002). Theconvergence of shelf water and the northeast-ward-flowing Gulf Stream creates a physical‘‘null’’ zone that promotes particle deposition(Kelchner, 1992; Schaff et al., 1992). Enhancedfluxes of shelf detritus to slope sediments nearCape Hatteras are supported by observations ofunusually dense assemblages of benthic organisms(Blake and Hilbig, 1994; Aller et al., 2002),anomalously high organic carbon:surface arearatios (Mayer et al., 2002), and localized zoneswhere sediment accumulation rates (DeMasteret al., 1994) may be as high as those found insome estuaries and bays.
In this paper, we report on the flux of moderncarbon (defined as carbon fixed after 1955) that is
Fig. 1. Location of study sites. The dashed rectangle demarcates the Currituck Slide, a region of the Cape Hatteras continental slope
with unusually flat seafloor. The gray line gives the location of the acoustic profile shown in Fig. 2. Bottom contours are in meters;
numbers listed adjacent to sampling sites refer to core numbers used in Tables 1–4.
2We estimate global shelf production at 5.2 Pg C yr�1
(Pg=1015 g), based on a shelf area of 2.6� 1013m2 and annual
primary production of 200 g Cm�2 yr�1 (Walsh, 1989).
M.J. Alperin et al. / Deep-Sea Research II 49 (2002) 4645–46654646
incorporated into continental slope sediments nearCape Hatteras. By focusing on a region whereshelf export and slope deposition are expected tobe maximal, we can place a firmer upper limit onthe quantity of fossil fuel-derived carbon that isstored on the continental slope.
2. Approach
Three pieces of information are required tocalculate the burial flux of modern carbon incontinental slope sediments: (1) the organic carboncontent of sediments accumulating below a definedburial horizon; (2) the fraction of buried organiccarbon that is derived from modern planktonproduction; and (3) the recent sedimentation rate.The organic carbon content of buried sediment isreadily measured (see below) and the contributionof modern carbon in slope sediments near CapeHatteras has been constrained by 14C dating(DeMaster et al., 2002). The bulk of this paper isconcerned with quantifying recent sediment accu-mulation rates.
Recent sedimentation rates can be inferred fromdepth distributions of particle tracers with life-times of o100 yr. For these tracers, much of theinventory will be contained in the upper fewdecimeters of the sediment column. On the CapeHatteras continental slope, the upper 30 cm ofsediment is heavily reworked (bioturbated) by theactivities of infaunal organisms (Diaz et al., 1994).Bioturbation mixes geochronometric tracers intothe sediment, making it impossible to uniquelydetermine the sedimentation rate from a singletracer (Anderson et al., 1988). Our approach is tocouple two modern, particle-reactive radiotracersthat have distinct sediment input histories. Excess210Pb (210Pbxs) is a natural product of the 238Udecay series with a half-life (t1=2) of 22 yr; atmo-spheric deposition is considered to be nearly steadystate when averaged over several years (Applebyand Oldfield, 1992). 239Pu (t1=2 ¼ 24; 110 yr) and240Pu (t1=2 ¼ 6563 yr) were released during above-ground testing of nuclear weapons; widespreadfallout began in the early 1950s, peaked in 1963,and then declined abruptly. Coupling these twotracers allows us to deconvolve the impact of
bioturbation and sedimentation on tracer distribu-tions and thereby constrain the rate of eachprocess (Nie et al., 2001).
3. Study site
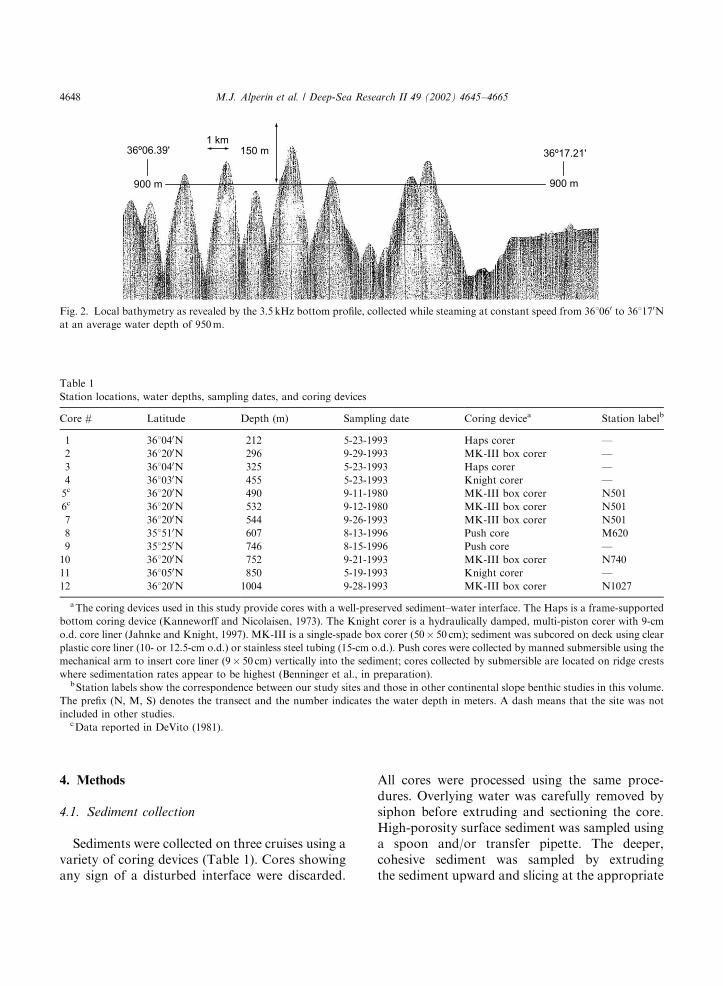
The continental slope near Cape Hatterasis noted for its rugged, complex topography(Tucholke, 1987). Most of the seafloor is heavilydissected by a network of downward slopingchannels that range in size from small gullies tolarge, deeply incised canyons (Mellor and Paull,1994). An example of the local bathymetry isillustrated by the 3.5-kHz bottom profile collectedwhile steaming from 361060 to 361170N at anaverage water depth of 950m (Fig. 2). The recordshows steep hills and valleys, with local reliefexceeding 150m over a horizontal distance of aboutB1km. At the northern end of the record, we seethe beginning of the Currituck Slide, a stretch ofrelatively flat and featureless seafloor that extendsfrom 361150 to 361270N beginning at a water depthof approximately 500m and continuing offshore formore than 20km (Bunn and McGregor, 1980;Fig. 1). The smooth seafloor in this locale is theresult of two Pleistocene submarine landslides thattransported up to 650m of upper slope sediment tothe lower slope and rise (Prior et al., 1986).
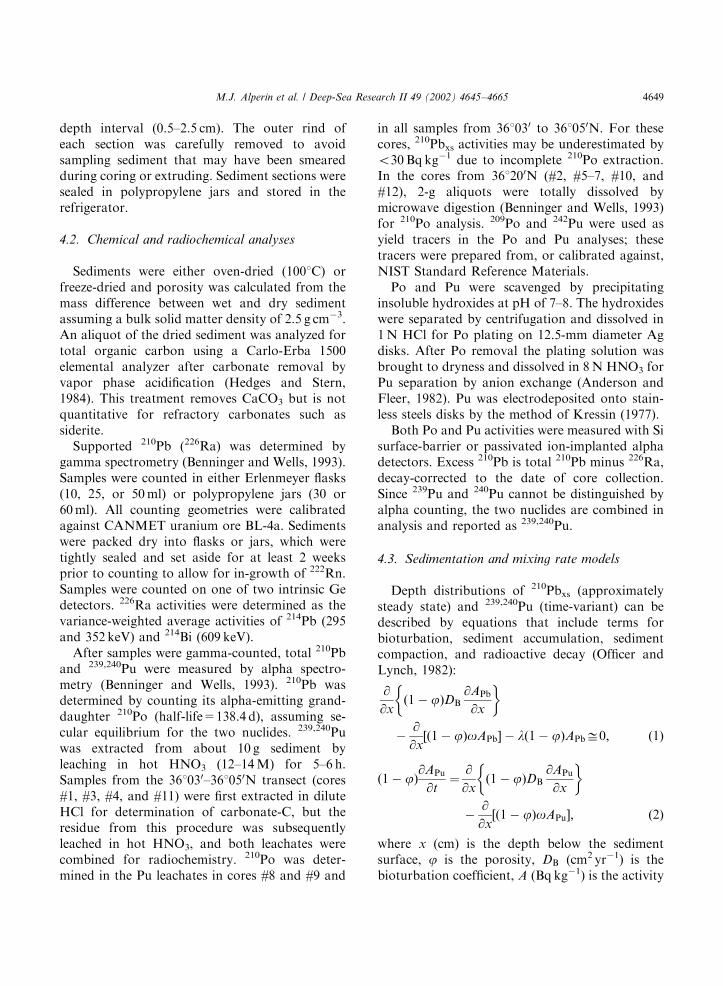
Sediment cores were collected at 10 stations onthe upper continental slope near Cape Hatteras(Fig. 1, Table 1). Eight of the cores were collectedfrom two cross-slope transects: 361200N (#2, #7,#10, and #12) and B361040N (#1, #3, #4, and#11). The three deeper stations on the 361200Ntransect (#7, #10, and #12) are located on theCurrituck Slide. Cores collected at 351510N (#8)and 351250N (#9) provide an along-slope transectfor evaluating north–south gradients in sedimentaccumulation and carbon burial rates. In additionto the 10 cores analyzed in this study, we includepublished 210Pbxs and 239,240Pu profiles for twocores (#5 and #6) collected at 361200N (DeVito,1981). These cores sampled the Currituck Slidewithin a few hundred meters of our core #7.Station labels for sites that are common with otherbenthic studies reported in this volume are given inTable 1.
M.J. Alperin et al. / Deep-Sea Research II 49 (2002) 4645–4665 4647
4. Methods
4.1. Sediment collection
Sediments were collected on three cruises using avariety of coring devices (Table 1). Cores showingany sign of a disturbed interface were discarded.
All cores were processed using the same proce-dures. Overlying water was carefully removed bysiphon before extruding and sectioning the core.High-porosity surface sediment was sampled usinga spoon and/or transfer pipette. The deeper,cohesive sediment was sampled by extrudingthe sediment upward and slicing at the appropriate
Table 1
Station locations, water depths, sampling dates, and coring devices
Core # Latitude Depth (m) Sampling date Coring devicea Station labelb
1 361040N 212 5-23-1993 Haps corer —
2 361200N 296 9-29-1993 MK-III box corer —
3 361040N 325 5-23-1993 Haps corer —
4 361030N 455 5-23-1993 Knight corer —
5c 361200N 490 9-11-1980 MK-III box corer N501
6c 361200N 532 9-12-1980 MK-III box corer N501
7 361200N 544 9-26-1993 MK-III box corer N501
8 351510N 607 8-13-1996 Push core M620
9 351250N 746 8-15-1996 Push core —
10 361200N 752 9-21-1993 MK-III box corer N740
11 361050N 850 5-19-1993 Knight corer —
12 361200N 1004 9-28-1993 MK-III box corer N1027
aThe coring devices used in this study provide cores with a well-preserved sediment–water interface. The Haps is a frame-supported
bottom coring device (Kanneworff and Nicolaisen, 1973). The Knight corer is a hydraulically damped, multi-piston corer with 9-cm
o.d. core liner (Jahnke and Knight, 1997). MK-III is a single-spade box corer (50� 50 cm); sediment was subcored on deck using clear
plastic core liner (10- or 12.5-cm o.d.) or stainless steel tubing (15-cm o.d.). Push cores were collected by manned submersible using the
mechanical arm to insert core liner (9� 50 cm) vertically into the sediment; cores collected by submersible are located on ridge crests
where sedimentation rates appear to be highest (Benninger et al., in preparation).bStation labels show the correspondence between our study sites and those in other continental slope benthic studies in this volume.
The prefix (N, M, S) denotes the transect and the number indicates the water depth in meters. A dash means that the site was not
included in other studies.cData reported in DeVito (1981).
Fig. 2. Local bathymetry as revealed by the 3.5 kHz bottom profile, collected while steaming at constant speed from 361060 to 361170N
at an average water depth of 950m.
M.J. Alperin et al. / Deep-Sea Research II 49 (2002) 4645–46654648
depth interval (0.5–2.5 cm). The outer rind ofeach section was carefully removed to avoidsampling sediment that may have been smearedduring coring or extruding. Sediment sections weresealed in polypropylene jars and stored in therefrigerator.
4.2. Chemical and radiochemical analyses
Sediments were either oven-dried (1001C) orfreeze-dried and porosity was calculated from themass difference between wet and dry sedimentassuming a bulk solid matter density of 2.5 g cm�3.An aliquot of the dried sediment was analyzed fortotal organic carbon using a Carlo-Erba 1500elemental analyzer after carbonate removal byvapor phase acidification (Hedges and Stern,1984). This treatment removes CaCO3 but is notquantitative for refractory carbonates such assiderite.
Supported 210Pb (226Ra) was determined bygamma spectrometry (Benninger and Wells, 1993).Samples were counted in either Erlenmeyer flasks(10, 25, or 50ml) or polypropylene jars (30 or60ml). All counting geometries were calibratedagainst CANMET uranium ore BL-4a. Sedimentswere packed dry into flasks or jars, which weretightly sealed and set aside for at least 2 weeksprior to counting to allow for in-growth of 222Rn.Samples were counted on one of two intrinsic Gedetectors. 226Ra activities were determined as thevariance-weighted average activities of 214Pb (295and 352 keV) and 214Bi (609 keV).
After samples were gamma-counted, total 210Pband 239,240Pu were measured by alpha spectro-metry (Benninger and Wells, 1993). 210Pb wasdetermined by counting its alpha-emitting grand-daughter 210Po (half-life=138.4 d), assuming se-cular equilibrium for the two nuclides. 239,240Puwas extracted from about 10 g sediment byleaching in hot HNO3 (12–14M) for 5–6 h.Samples from the 361030–361050N transect (cores#1, #3, #4, and #11) were first extracted in diluteHCl for determination of carbonate-C, but theresidue from this procedure was subsequentlyleached in hot HNO3, and both leachates werecombined for radiochemistry. 210Po was deter-mined in the Pu leachates in cores #8 and #9 and
in all samples from 361030 to 361050N. For thesecores, 210Pbxs activities may be underestimated byo30Bq kg�1 due to incomplete 210Po extraction.In the cores from 361200N (#2, #5–7, #10, and#12), 2-g aliquots were totally dissolved bymicrowave digestion (Benninger and Wells, 1993)for 210Po analysis. 209Po and 242Pu were used asyield tracers in the Po and Pu analyses; thesetracers were prepared from, or calibrated against,NIST Standard Reference Materials.
Po and Pu were scavenged by precipitatinginsoluble hydroxides at pH of 7–8. The hydroxideswere separated by centrifugation and dissolved in1N HCl for Po plating on 12.5-mm diameter Agdisks. After Po removal the plating solution wasbrought to dryness and dissolved in 8N HNO3 forPu separation by anion exchange (Anderson andFleer, 1982). Pu was electrodeposited onto stain-less steels disks by the method of Kressin (1977).
Both Po and Pu activities were measured with Sisurface-barrier or passivated ion-implanted alphadetectors. Excess 210Pb is total 210Pb minus 226Ra,decay-corrected to the date of core collection.Since 239Pu and 240Pu cannot be distinguished byalpha counting, the two nuclides are combined inanalysis and reported as 239,240Pu.
4.3. Sedimentation and mixing rate models
Depth distributions of 210Pbxs (approximatelysteady state) and 239,240Pu (time-variant) can bedescribed by equations that include terms forbioturbation, sediment accumulation, sedimentcompaction, and radioactive decay (Officer andLynch, 1982):
@
@xð1� jÞDB
@APb
@x
� �
�@
@x½ð1� jÞoAPb� � lð1� jÞAPbD0; ð1Þ
ð1� jÞ@APu
@t¼
@
@xð1� jÞDB
@APu
@x
� �
�@
@xð1� jÞoAPu½ �; ð2Þ
where x (cm) is the depth below the sedimentsurface, j is the porosity, DB (cm2 yr�1) is thebioturbation coefficient, A (Bq kg�1) is the activity
M.J. Alperin et al. / Deep-Sea Research II 49 (2002) 4645–4665 4649
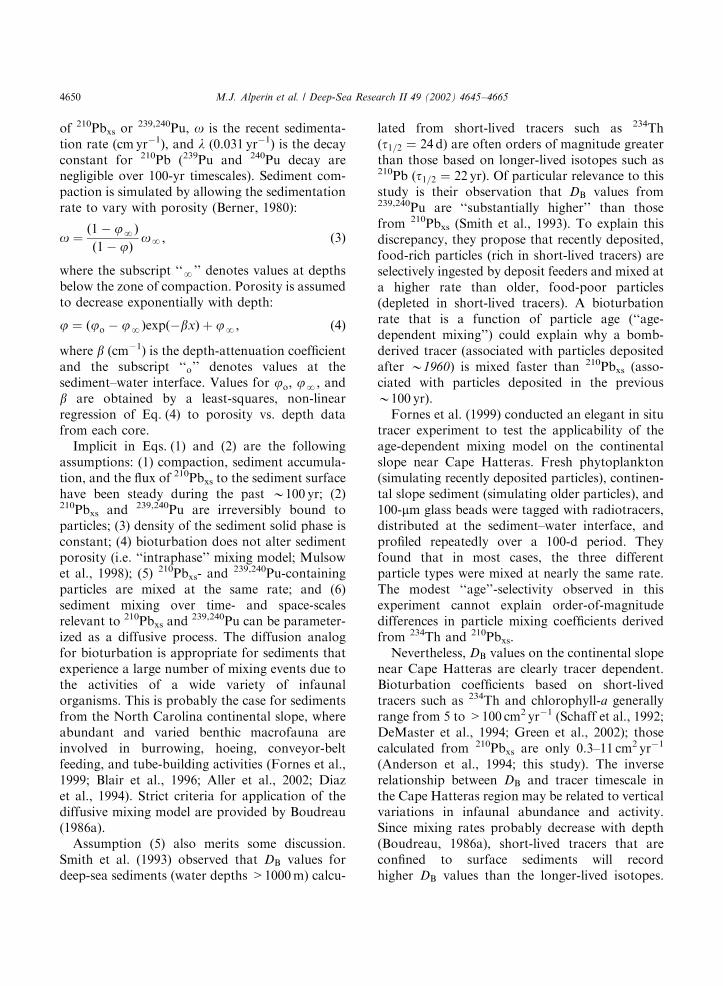
of 210Pbxs or239,240Pu, o is the recent sedimenta-
tion rate (cm yr�1), and l (0.031 yr�1) is the decayconstant for 210Pb (239Pu and 240Pu decay arenegligible over 100-yr timescales). Sediment com-paction is simulated by allowing the sedimentationrate to vary with porosity (Berner, 1980):
o ¼ð1� j
NÞ
ð1� jÞoN; ð3Þ
where the subscript ‘‘N’’ denotes values at depthsbelow the zone of compaction. Porosity is assumedto decrease exponentially with depth:
j ¼ ðjo � jNÞexpð�bxÞ þ j
N; ð4Þ
where b (cm�1) is the depth-attenuation coefficientand the subscript ‘‘o’’ denotes values at thesediment–water interface. Values for jo; jN
; andb are obtained by a least-squares, non-linearregression of Eq. (4) to porosity vs. depth datafrom each core.
Implicit in Eqs. (1) and (2) are the followingassumptions: (1) compaction, sediment accumula-tion, and the flux of 210Pbxs to the sediment surfacehave been steady during the past B100 yr; (2)210Pbxs and 239,240Pu are irreversibly bound toparticles; (3) density of the sediment solid phase isconstant; (4) bioturbation does not alter sedimentporosity (i.e. ‘‘intraphase’’ mixing model; Mulsowet al., 1998); (5) 210Pbxs- and
239,240Pu-containingparticles are mixed at the same rate; and (6)sediment mixing over time- and space-scalesrelevant to 210Pbxs and
239,240Pu can be parameter-ized as a diffusive process. The diffusion analogfor bioturbation is appropriate for sediments thatexperience a large number of mixing events due tothe activities of a wide variety of infaunalorganisms. This is probably the case for sedimentsfrom the North Carolina continental slope, whereabundant and varied benthic macrofauna areinvolved in burrowing, hoeing, conveyor-beltfeeding, and tube-building activities (Fornes et al.,1999; Blair et al., 1996; Aller et al., 2002; Diazet al., 1994). Strict criteria for application of thediffusive mixing model are provided by Boudreau(1986a).
Assumption (5) also merits some discussion.Smith et al. (1993) observed that DB values fordeep-sea sediments (water depths >1000m) calcu-
lated from short-lived tracers such as 234Th(t1=2 ¼ 24 d) are often orders of magnitude greaterthan those based on longer-lived isotopes such as210Pb (t1=2 ¼ 22 yr). Of particular relevance to thisstudy is their observation that DB values from239,240Pu are ‘‘substantially higher’’ than thosefrom 210Pbxs (Smith et al., 1993). To explain thisdiscrepancy, they propose that recently deposited,food-rich particles (rich in short-lived tracers) areselectively ingested by deposit feeders and mixed ata higher rate than older, food-poor particles(depleted in short-lived tracers). A bioturbationrate that is a function of particle age (‘‘age-dependent mixing’’) could explain why a bomb-derived tracer (associated with particles depositedafter B1960) is mixed faster than 210Pbxs (asso-ciated with particles deposited in the previousB100 yr).
Fornes et al. (1999) conducted an elegant in situtracer experiment to test the applicability of theage-dependent mixing model on the continentalslope near Cape Hatteras. Fresh phytoplankton(simulating recently deposited particles), continen-tal slope sediment (simulating older particles), and100-mm glass beads were tagged with radiotracers,distributed at the sediment–water interface, andprofiled repeatedly over a 100-d period. Theyfound that in most cases, the three differentparticle types were mixed at nearly the same rate.The modest ‘‘age’’-selectivity observed in thisexperiment cannot explain order-of-magnitudedifferences in particle mixing coefficients derivedfrom 234Th and 210Pbxs.
Nevertheless, DB values on the continental slopenear Cape Hatteras are clearly tracer dependent.Bioturbation coefficients based on short-livedtracers such as 234Th and chlorophyll-a generallyrange from 5 to >100 cm2 yr�1 (Schaff et al., 1992;DeMaster et al., 1994; Green et al., 2002); thosecalculated from 210Pbxs are only 0.3–11 cm2 yr�1
(Anderson et al., 1994; this study). The inverserelationship between DB and tracer timescale inthe Cape Hatteras region may be related to verticalvariations in infaunal abundance and activity.Since mixing rates probably decrease with depth(Boudreau, 1986a), short-lived tracers that areconfined to surface sediments will recordhigher DB values than the longer-lived isotopes.
M.J. Alperin et al. / Deep-Sea Research II 49 (2002) 4645–46654650
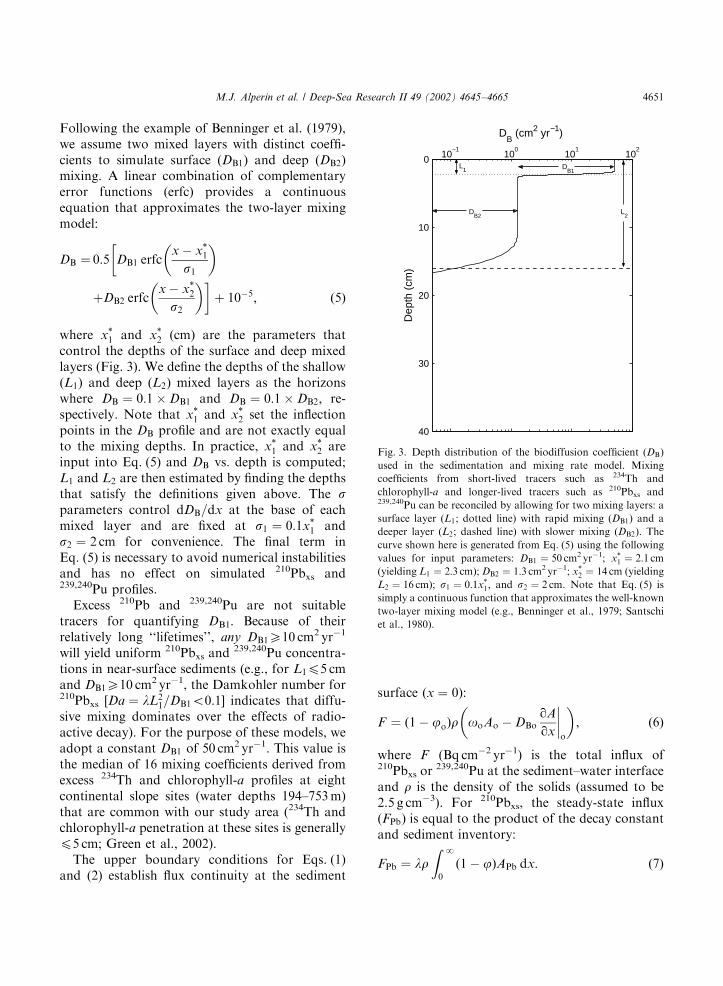
Following the example of Benninger et al. (1979),we assume two mixed layers with distinct coeffi-cients to simulate surface (DB1) and deep (DB2)mixing. A linear combination of complementaryerror functions (erfc) provides a continuousequation that approximates the two-layer mixingmodel:
DB ¼ 0:5 DB1 erfcx � x
1
s1
� ��
þDB2 erfcx � x
2
s2
� ��þ 10�5; ð5Þ
where x1 and x
2 (cm) are the parameters thatcontrol the depths of the surface and deep mixedlayers (Fig. 3). We define the depths of the shallow(L1) and deep (L2) mixed layers as the horizonswhere DB ¼ 0:1� DB1 and DB ¼ 0:1� DB2; re-spectively. Note that x
1 and x2 set the inflection
points in the DB profile and are not exactly equalto the mixing depths. In practice, x
1 and x2 are
input into Eq. (5) and DB vs. depth is computed;L1 and L2 are then estimated by finding the depthsthat satisfy the definitions given above. The sparameters control dDB=dx at the base of eachmixed layer and are fixed at s1 ¼ 0:1x
1 ands2 ¼ 2 cm for convenience. The final term inEq. (5) is necessary to avoid numerical instabilitiesand has no effect on simulated 210Pbxs and239,240Pu profiles.
Excess 210Pb and 239,240Pu are not suitabletracers for quantifying DB1. Because of theirrelatively long ‘‘lifetimes’’, any DB1X10 cm2 yr�1
will yield uniform 210Pbxs and239,240Pu concentra-
tions in near-surface sediments (e.g., for L1p5 cmand DB1X10 cm2 yr�1, the Damkohler number for210Pbxs [Da ¼ lL2
1=DB1o0:1] indicates that diffu-sive mixing dominates over the effects of radio-active decay). For the purpose of these models, weadopt a constant DB1 of 50 cm2 yr�1. This value isthe median of 16 mixing coefficients derived fromexcess 234Th and chlorophyll-a profiles at eightcontinental slope sites (water depths 194–753m)that are common with our study area (234Th andchlorophyll-a penetration at these sites is generallyp5 cm; Green et al., 2002).
The upper boundary conditions for Eqs. (1)and (2) establish flux continuity at the sediment
surface (x ¼ 0):
F ¼ ð1� joÞr ooAo � DBoqA
qx
����o
� �; ð6Þ
where F (Bq cm�2 yr�1) is the total influx of210Pbxs or
239,240Pu at the sediment–water interfaceand r is the density of the solids (assumed to be2.5 g cm�3). For 210Pbxs, the steady-state influx(FPb) is equal to the product of the decay constantand sediment inventory:
FPb ¼ lrZ
N
0
ð1� jÞAPb dx: ð7Þ
10−1
100
101
102
0
10
20
30
40
Dep
th (
cm)
DB (cm2 yr−1)
DB1
DB2
L1
L2
Fig. 3. Depth distribution of the biodiffusion coefficient (DB)
used in the sedimentation and mixing rate model. Mixing
coefficients from short-lived tracers such as 234Th and
chlorophyll-a and longer-lived tracers such as 210Pbxs and239,240Pu can be reconciled by allowing for two mixing layers: a
surface layer (L1; dotted line) with rapid mixing (DB1) and a
deeper layer (L2; dashed line) with slower mixing (DB2). The
curve shown here is generated from Eq. (5) using the following
values for input parameters: DB1 ¼ 50 cm2 yr�1; x1 ¼ 2:1 cm
(yielding L1 ¼ 2:3 cm); DB2 ¼ 1:3 cm2 yr�1; x2 ¼ 14 cm (yielding
L2 ¼ 16 cm); s1 ¼ 0:1x1; and s2 ¼ 2 cm. Note that Eq. (5) is
simply a continuous function that approximates the well-known
two-layer mixing model (e.g., Benninger et al., 1979; Santschi
et al., 1980).
M.J. Alperin et al. / Deep-Sea Research II 49 (2002) 4645–4665 4651
For 239,240Pu, the time-dependent influx (FPu) isassumed to be proportional to 90Sr falloutmeasured at New York city (HASL, 1977; Larsen,1985). The time-integral of the 239,240Pu influx isequal to the sediment inventory:
Z tc
1950
FPu dt ¼ rZ
N
0
ð1� jÞAPu dx; ð8Þ
where 1950 is a year that precedes widespreadrelease of fallout nuclides and tc is the date wheneach sediment core was collected. Although aninput function based on 90Sr fallout has been usedin previous studies to simulate 239,240Pu depositionin continental shelf and slope sediments (e.g.,Santschi et al., 1980; Anderson et al., 1988), thisfunction ignores the finite scavenging and settlingrate for 239,240Pu in seawater (Livingston andBowen, 1979). Sensitivity of the chronology todelayed 239,240Pu deposition is investigated below(see Model sensitivity).
The lower boundary conditions are APb ¼0 and APu ¼ 0 at a depth where we can safelyassume negligible tracer activities (generally100 cm for 210Pbxs and 40 cm for 239,240Pu). The239,240Pu simulations begin on January 1, 1950 andsolutions are obtained at tc; the model is initializedby setting APu ¼ 0 at all depths.
Eq. (1) is solved using a variable order, variablestep-size finite difference method (Pereyra, 1978).Eq. (2) is solved using the method of lines withcubic Hermite polynomials (Sewell, 1982). In allcases, numerical solutions conserve mass to betterthan 70.4%. ‘‘Goodness-of-fit’’ coefficients (R2)for modeled profiles are calculated as
R2 ¼ 1�P
½Ai � #Ai�2P½Ai � %Ai�2
; ð9Þ
where Ai and #Ai are measured and model-derived210Pbxs or
239,240Pu activities, respectively, at eachsampled depth, and %A is the mean of all measuredtracer activities.
The models contain four adjustable inputparameters: sedimentation rate below the zone ofcompaction ðoNÞ; bioturbation coefficient for thedeep mixed layer (DB2), and two mixing depthparameters (x
1 and x2). These four parameters are
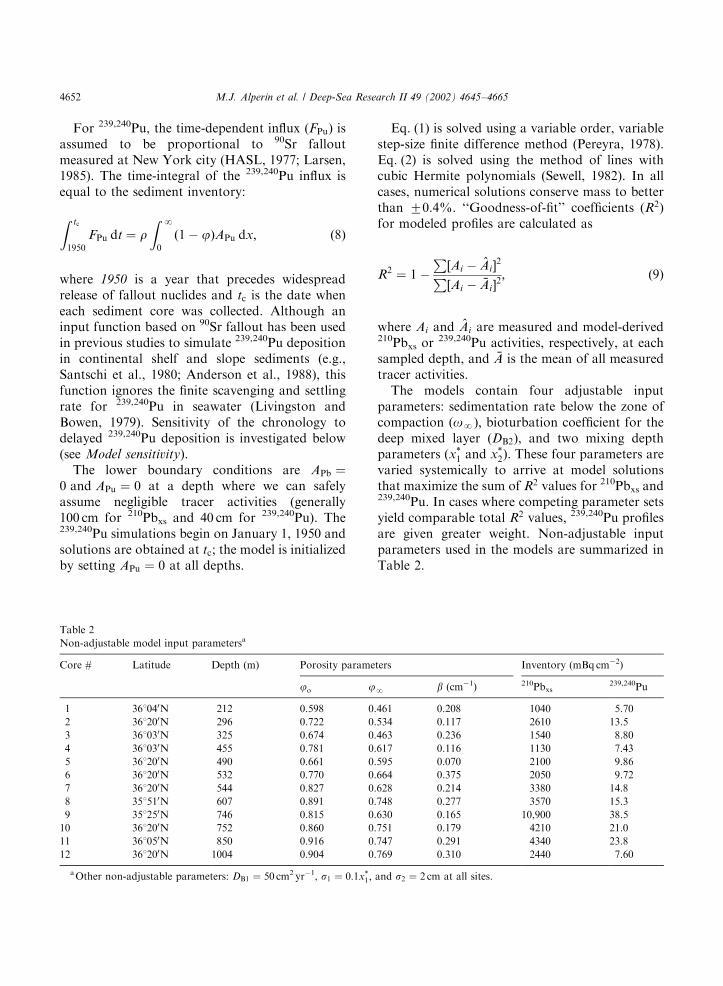
varied systemically to arrive at model solutionsthat maximize the sum of R2 values for 210Pbxs and239,240Pu. In cases where competing parameter setsyield comparable total R2 values, 239,240Pu profilesare given greater weight. Non-adjustable inputparameters used in the models are summarized inTable 2.
Table 2
Non-adjustable model input parametersa
Core # Latitude Depth (m) Porosity parameters Inventory (mBq cm�2)
jo jN
b (cm�1) 210Pbxs239,240Pu
1 361040N 212 0.598 0.461 0.208 1040 5.70
2 361200N 296 0.722 0.534 0.117 2610 13.5
3 361030N 325 0.674 0.463 0.236 1540 8.80
4 361030N 455 0.781 0.617 0.116 1130 7.43
5 361200N 490 0.661 0.595 0.070 2100 9.86
6 361200N 532 0.770 0.664 0.375 2050 9.72
7 361200N 544 0.827 0.628 0.214 3380 14.8
8 351510N 607 0.891 0.748 0.277 3570 15.3
9 351250N 746 0.815 0.630 0.165 10,900 38.5
10 361200N 752 0.860 0.751 0.179 4210 21.0
11 361050N 850 0.916 0.747 0.291 4340 23.8
12 361200N 1004 0.904 0.769 0.310 2440 7.60
aOther non-adjustable parameters: DB1 ¼ 50 cm2 yr�1, s1 ¼ 0:1x1; and s2 ¼ 2 cm at all sites.
M.J. Alperin et al. / Deep-Sea Research II 49 (2002) 4645–46654652
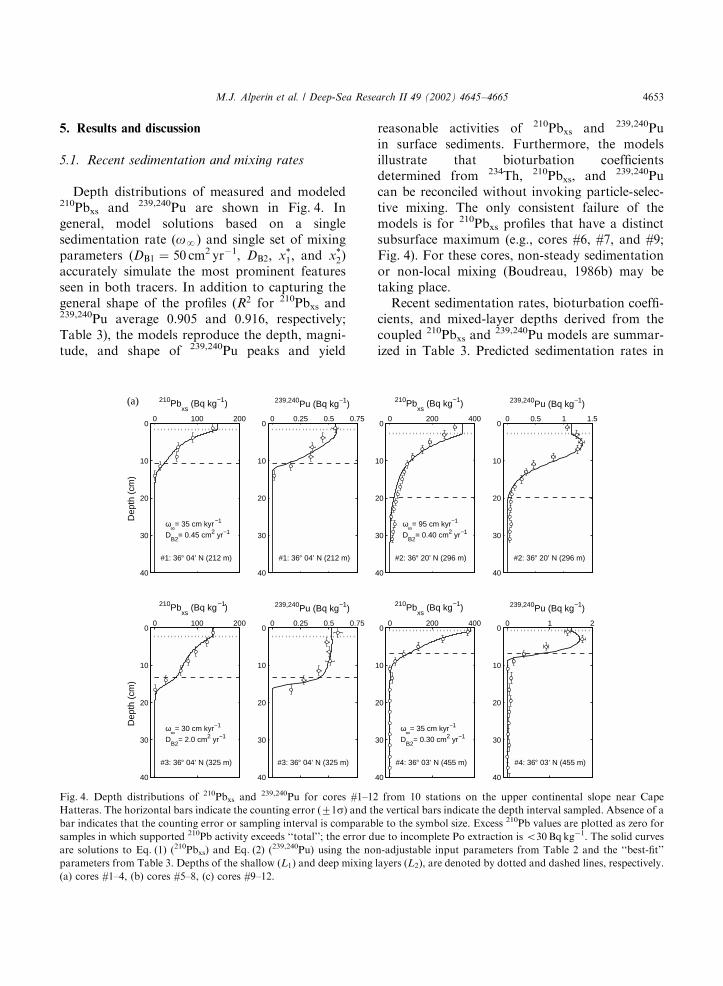
5. Results and discussion
5.1. Recent sedimentation and mixing rates
Depth distributions of measured and modeled210Pbxs and 239,240Pu are shown in Fig. 4. Ingeneral, model solutions based on a singlesedimentation rate (oN) and single set of mixingparameters (DB1 ¼ 50 cm2 yr�1, DB2; x
1; and x2)
accurately simulate the most prominent featuresseen in both tracers. In addition to capturing thegeneral shape of the profiles (R2 for 210Pbxs and239,240Pu average 0.905 and 0.916, respectively;Table 3), the models reproduce the depth, magni-tude, and shape of 239,240Pu peaks and yield
reasonable activities of 210Pbxs and 239,240Puin surface sediments. Furthermore, the modelsillustrate that bioturbation coefficientsdetermined from 234Th, 210Pbxs, and 239,240Pucan be reconciled without invoking particle-selec-tive mixing. The only consistent failure of themodels is for 210Pbxs profiles that have a distinctsubsurface maximum (e.g., cores #6, #7, and #9;Fig. 4). For these cores, non-steady sedimentationor non-local mixing (Boudreau, 1986b) may betaking place.
Recent sedimentation rates, bioturbation coeffi-cients, and mixed-layer depths derived from thecoupled 210Pbxs and
239,240Pu models are summar-ized in Table 3. Predicted sedimentation rates in
0 100 2000
10
20
30
40
Dep
th (
cm)
210Pbxs
(Bq kg−1)
#1: 36° 04’ N (212 m)
ω∞= 35 cm kyr −1
−1DB2
= 0.45 cm2 yr
0 0.25 0.5 0.750
10
20
30
40
239,240Pu (Bq kg −1)
#1: 36° 04’ N (212 m)
0 200 4000
10
20
30
40
210Pbxs
(Bq kg −1)
#2: 36° 20’ N (296 m)
ω∞= 95 cm kyr
DB2
= 0.40 cm2 yr
0 0.5 1 1.50
10
20
30
40
239,240Pu (Bq kg −1)
#2: 36° 20’ N (296 m)
0 100 2000
10
20
30
40
Dep
th (
cm)
210Pbxs
(Bq kg −1)
#3: 36° 04’ N (325 m)
ω∞= 30 cm kyr
DB2
= 2.0 cm2 yr
0 0.25 0.5 0.750
10
20
30
40
239,240Pu (Bq kg −1)
#3: 36° 04’ N (325 m)
0 200 4000
10
20
30
40
210Pbxs
(Bq kg −1)
#4: 36° 03’ N (455 m)
ω∞= 35 cm kyr
DB2
= 0.30 cm2 yr
0 1 20
10
20
30
40
239,240Pu (Bq kg −1)
#4: 36° 03’ N (455 m)
−1
−1
−1
−1−1
−1
(a)
Fig. 4. Depth distributions of 210Pbxs and 239,240Pu for cores #1–12 from 10 stations on the upper continental slope near Cape
Hatteras. The horizontal bars indicate the counting error (71s) and the vertical bars indicate the depth interval sampled. Absence of a
bar indicates that the counting error or sampling interval is comparable to the symbol size. Excess 210Pb values are plotted as zero for
samples in which supported 210Pb activity exceeds ‘‘total’’; the error due to incomplete Po extraction is o30Bqkg�1. The solid curves
are solutions to Eq. (1) (210Pbxs) and Eq. (2) (239,240Pu) using the non-adjustable input parameters from Table 2 and the ‘‘best-fit’’
parameters from Table 3. Depths of the shallow (L1) and deep mixing layers (L2), are denoted by dotted and dashed lines, respectively.
(a) cores #1–4, (b) cores #5–8, (c) cores #9–12.
M.J. Alperin et al. / Deep-Sea Research II 49 (2002) 4645–4665 4653
our study area range from 10 to 425 cmkyr�1
(average oN ¼ 106 cmkyr�1). The high oN
(425 cmkyr�1) at the southernmost site (351250N;core #9) is an obvious outlier. DeMaster et al.(1994) also report unusually rapid sedimentdeposition on the continental slope just north ofCape Hatteras. At their site (351230N, 850m), the14C age of sedimentary organic carbon is essen-tially constant between 25 and 200 cm, implyingaccumulation rates in excess of 500 cmkyr�1.
Bioturbation coefficients for the deep-mixinglayer (DB2) range from 0.3 to 5.2 cm2 yr�1 (averageDB2 ¼ 1:3 cm2 yr�1). As with the sediment accu-mulation rate, the mixing coefficient for thesouthernmost site (5.2 cm2 yr�1) is much greaterthan for any other core. In general, bioturbationcoefficients in our study area appear to becontrolled by factors other than the sedimentaccumulation rate and water-column depth: if weexclude the site with the anomalously high
sedimentation rate and mixing coefficient (core#9), DB2 is not correlated with oN (r2 ¼ 0:01) orwater depth (r2 ¼ 0:08).
The depth of the rapidly mixed surface layer(L1) ranges from 0.8 to 4.5 cm (averageL1 ¼ 2:3 cm). This value is in reasonable agree-ment with 234Th and chlorophyll-a penetrationdepths (generally p5 cm; Green et al., 2002). Therapid drop in DB at the base of the surface mixedlayer (Fig. 3) is consistent with the observationthat the upper 2 cm of sediment contain thegreatest number of benthic organisms (Schaffet al., 1992; Schaff and Levin, 1994).
The depth of the deep mixed layer (L2) rangesfrom 9 to 27 cm (average L2 ¼ 16 cm). Note thatthe deep mixed layer defines the zone where210Pbxs- and
239,240Pu-containing particles undergodiffusive mixing, not the full extent of the zonesubject to biological sediment transport. Since themodels neglect non-local processes, no attempt is
0 150 3000
10
20
30
40
Dep
th (
cm)
210Pbxs
(Bq kg−1)
#5: 36° 20’ N (490 m)
ω∞= 110 cm/kyrD
B2= 0.65 cm2/yr
0 0.5 1 1.50
10
20
30
40
239,240Pu (Bq kg )
#5: 36° 20’ N (490 m)
0 200 4000
10
20
30
40
210Pbxs
(Bq kg )
#6: 36° 20’ N (532 m)
ω∞= 100 cm/kyrD
B2= 0.60 cm2/yr
0 1 20
10
20
30
40
239,240Pu (Bq kg )
#6: 36° 20’ N (532 m)
0 250 5000
10
20
30
40
Dep
th (
cm)
210Pbxs
(Bq kg )
#7: 36° 20’ N (544 m)
ω∞= 125 cm/kyrD
B2= 1.2 cm2/yr
0 1 20
10
20
30
40
239,240Pu (Bq kg )
#7: 36° 20’ N (544 m)
0 400 8000
10
20
30
40
210Pbxs
(Bq kg )
#8: 35° 51’ N (607 m)
ω∞= 130 cm/kyrD
B2= 0.40 cm2/yr
0 1 20
10
20
30
40
239,240Pu (Bq kg )
#8: 35° 51’ N (607 m)
−1 −1 −1
−1−1−1−1
−1
−1
−1
−1
−1
−1
−1
−1
(b)
Fig. 4 (continued).
M.J. Alperin et al. / Deep-Sea Research II 49 (2002) 4645–46654654
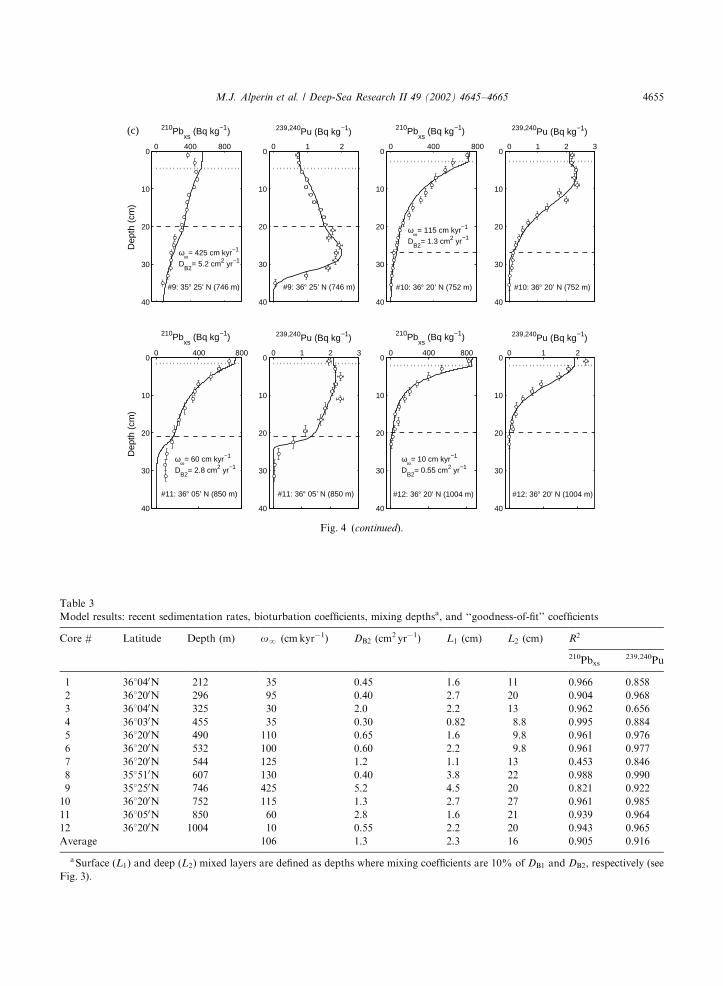
Table 3
Model results: recent sedimentation rates, bioturbation coefficients, mixing depthsa, and ‘‘goodness-of-fit’’ coefficients
Core # Latitude Depth (m) oN (cmkyr�1) DB2 (cm2 yr�1) L1 (cm) L2 (cm) R2
210Pbxs239,240Pu
1 361040N 212 35 0.45 1.6 11 0.966 0.858
2 361200N 296 95 0.40 2.7 20 0.904 0.968
3 361040N 325 30 2.0 2.2 13 0.962 0.656
4 361030N 455 35 0.30 0.82 8.8 0.995 0.884
5 361200N 490 110 0.65 1.6 9.8 0.961 0.976
6 361200N 532 100 0.60 2.2 9.8 0.961 0.977
7 361200N 544 125 1.2 1.1 13 0.453 0.846
8 351510N 607 130 0.40 3.8 22 0.988 0.990
9 351250N 746 425 5.2 4.5 20 0.821 0.922
10 361200N 752 115 1.3 2.7 27 0.961 0.985
11 361050N 850 60 2.8 1.6 21 0.939 0.964
12 361200N 1004 10 0.55 2.2 20 0.943 0.965
Average 106 1.3 2.3 16 0.905 0.916
aSurface (L1) and deep (L2) mixed layers are defined as depths where mixing coefficients are 10% of DB1 and DB2; respectively (see
Fig. 3).
0 400 8000
10
20
30
40
Dep
th (
cm)
210Pbxs
(Bq kg−1)
#9: 35° 25’ N (746 m)
ω∞= 425 cm kyr
DB2
= 5.2 cm2 yr
0 1 20
10
20
30
40
239,240Pu (Bq kg )
#9: 36° 25’ N (746 m)
0 400 8000
10
20
30
40
210Pbxs
(Bq kg )
#10: 36° 20’ N (752 m)
ω∞= 115 cm kyr
DB2
= 1.3 cm2 yr
0 1 2 30
10
20
30
40
239,240Pu (Bq kg )
#10: 36° 20’ N (752 m)
0 400 8000
10
20
30
40
Dep
th (
cm)
210Pbxs
(Bq kg )
#11: 36° 05’ N (850 m)
ω∞= 60 cm kyr
DB2
= 2.8 cm2 yr
0 1 2 30
10
20
30
40
239,240Pu (Bq kg )
#11: 36° 05’ N (850 m)
0 400 8000
10
20
30
40
210Pbxs
(Bq kg )
#12: 36° 20’ N (1004 m)
ω∞= 10 cm kyr
DB2
= 0.55 cm2 yr
0 1 20
10
20
30
40
239,240Pu (Bq kg )
#12: 36° 20’ N (1004 m)
−1 −1 −1
−1−1−1−1
−1
−1
−1
−1
−1
−1
−1
−1
(c)
Fig. 4 (continued).
M.J. Alperin et al. / Deep-Sea Research II 49 (2002) 4645–4665 4655
made to account for discontinuities in 210Pbxs and239,240Pu profiles that are visible in some coresbelow the base of the deep mixing layer (e.g., cores#5 and #7). Bioirrigation appears to continue todepths >1m (Thomas et al., 2002), but we haveno 210Pbxs or 239,240Pu data below 40 cm todetermine whether surficial particles are intro-duced to the base of the deep irrigation layer(>1m) via non-local processes.
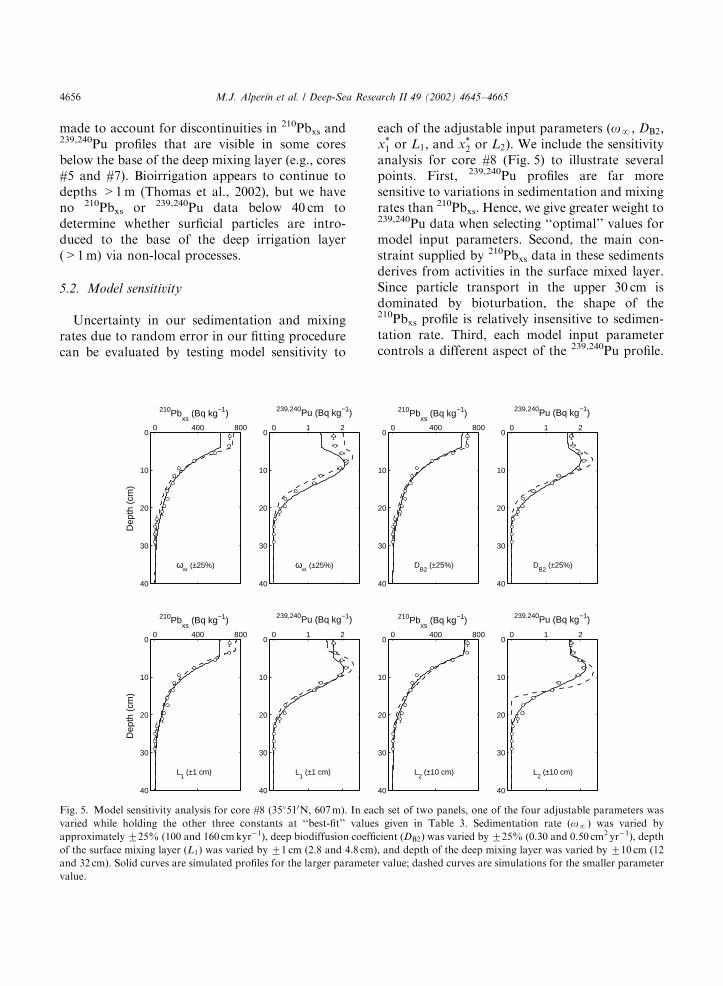
5.2. Model sensitivity
Uncertainty in our sedimentation and mixingrates due to random error in our fitting procedurecan be evaluated by testing model sensitivity to
each of the adjustable input parameters (oN; DB2;x1 or L1; and x
2 or L2). We include the sensitivityanalysis for core #8 (Fig. 5) to illustrate severalpoints. First, 239,240Pu profiles are far moresensitive to variations in sedimentation and mixingrates than 210Pbxs. Hence, we give greater weight to239,240Pu data when selecting ‘‘optimal’’ values formodel input parameters. Second, the main con-straint supplied by 210Pbxs data in these sedimentsderives from activities in the surface mixed layer.Since particle transport in the upper 30 cm isdominated by bioturbation, the shape of the210Pbxs profile is relatively insensitive to sedimen-tation rate. Third, each model input parametercontrols a different aspect of the 239,240Pu profile.
0 400 8000
10
20
30
40
Dep
th (
cm)
210Pbxs
(Bq kg )
ω∞ (±25%)
0 1 20
10
20
30
40
239,240Pu (Bq kg )
ω∞ (±25%)
0 400 8000
10
20
30
40
210Pbxs
(Bq kg )
DB2
(±25%)
0 1 20
10
20
30
40
239,240Pu (Bq kg )
DB2
(±25%)
0 400 8000
10
20
30
40
Dep
th (
cm)
210Pbxs
(Bq kg )
L1
(±1 cm)
0 1 20
10
20
30
40
239,240Pu (Bq kg )
L1
(±1 cm)
0 400 8000
10
20
30
40
210Pbxs
(Bq kg )
L2
(±10 cm)
0 1 20
10
20
30
40
239,240Pu (Bq kg )
L2
(±10 cm)
−1 −1 −1 −1
−1 −1 −1 −1
Fig. 5. Model sensitivity analysis for core #8 (351510N, 607m). In each set of two panels, one of the four adjustable parameters was
varied while holding the other three constants at ‘‘best-fit’’ values given in Table 3. Sedimentation rate (oN) was varied by
approximately 725% (100 and 160 cmkyr�1), deep biodiffusion coefficient (DB2) was varied by725% (0.30 and 0.50 cm2 yr�1), depth
of the surface mixing layer (L1) was varied by 71 cm (2.8 and 4.8 cm), and depth of the deep mixing layer was varied by 710 cm (12
and 32 cm). Solid curves are simulated profiles for the larger parameter value; dashed curves are simulations for the smaller parameter
value.
M.J. Alperin et al. / Deep-Sea Research II 49 (2002) 4645–46654656
For example, variations in oN shift the depthof the 239,240Pu peak, variations in DB2 impactactivities at the peak, and variations in x
2 (L2)affect the 239,240Pu penetration depth. Thus,each set of model parameters yields a unique239,240Pu profile. Fourth, uncertainty in model-derived oN associated with the curve-fittingprocedure is on the order of 725% for sites withsedimentation rates B102 cmkyr�1 (e.g., cores #2,#5–8, and #10; Table 3). For sites with lowersedimentation rates (e.g., cores #1, #3, #4, #9, #11,and #12), uncertainty in oN is estimated at740%:‘‘Goodness-of-fit’’ coefficients decrease substan-tially for oN values outside the uncertaintyinterval.
In the case of 239,240Pu, the time-dependentinput function presents an additional source ofuncertainty. The input function is predicatedon the assumption that the flux of 239,240Pu tothe sediment at any given time is directly propor-tional to 90Sr fallout from the atmosphere.However, this assumption oversimplifies the239,240Pu deposition pattern in continental slopesediments. While a significant fraction of the239,240Pu fallout in shallow shelf waters (o100m)was transferred to sediments on very short(1–3 yr) timescales (Livingston and Bowen, 1979;Santschi et al., 1980), 239,240Pu in the openocean (>5000m) can persist in the water columnfor centuries (Livingston and Anderson, 1983;Buesseler et al., 1985). At intermediate depthscharacteristic of the continental slope, there isevidence that sediments contain both rapidlyand slowly scavenged 239,240Pu. Varved sedimentsfrom Santa Barbara basin (500m) have finite239,240Pu in the sediment interval correspondingto the years 1950–1954 (Koide et al., 1975),suggesting little or no delay between fallout anddeposition. Rapid scavenging and deposition arealso supported by a core collected in 1974 (11 yrafter the fallout peak) from the North Atlanticcontinental slope (2080m) that exhibits a well-defined subsurface 239,240Pu peak at 6 cm (Living-ston and Bowen, 1979). In contrast, sediment trapstudies in regions with water-column depths of900–2000m suggest residence times for 239,240Pu inseawater of 10–30 yr (Wong et al., 1992; Fowleret al., 2000).
Thus, 239,240Pu deposition in continental slopesediments is better described by an input functionin which sedimentary 239,240Pu is derived from twosources: ‘‘pulse-like’’ deposition of a rapidlyscavenged fraction and ‘‘continuous’’ or time-averaged (Robbins et al., 2001) deposition of aless particle-reactive fraction. Eq. (8) describingthe time-integral of the 239,240Pu influx becomes(Nie et al., 2001)
Z tc
1950
ff þ ð1� f Þexp½�ðt � 1950Þ=t�gFPu dt
¼ rZ
N
0
ð1� jÞAPu dx; ð10Þ
where f is the fraction of the 239,240Pu inventorythat is deposited in direct proportion to 90Srfallout, t is the water-column residence time forthe slowly scavenged fraction, and FPu mimics the90Sr fallout pattern. We assume that t ¼ 20 yr,based on literature values reported for slopedepths (Wong et al., 1992; Fowler et al., 2000).Lacking a priori evidence for partitioning thesediment inventory into rapidly and slowly sca-venged fractions, we assume that the contributionfrom slowly scavenged 239,240Pu is equal to theportion of the sediment inventory that exceedsdirect atmospheric deposition (8.9mBq cm�2; Ben-ninger and Wells, 1993). Hence, f is calculated bydividing 8.9mBq cm�2 by the sediment inventory(e.g., for core #8, 58% of the inventory[15.3mBq cm�2; Table 2] is assumed to be derivedfrom ‘‘pulse-like’’ delivery of fallout 239,240Pu).
Time-averaging the input function results inrelatively constant (gradually decreasing) 239,240Pudeposition after the mid-1970s (Fig. 6, left panel).This ‘‘continuous’’ delivery of the slowly sca-venged 239,240Pu has the greatest impact on theportion of the profile that lies above the peak(Fig. 6, right panel). The influx of slowly sca-venged 239,240Pu tends to elevate activities insurface sediments and displace the peak toshallower depths. However, model-derivedsediment accumulation rates in bioturbated sedi-ments are relatively insensitive to the smoothingimposed by time-averaging the tracer influx. Forcore #8, allowing for ‘‘continuous’’ deposition ofslowly scavenged 239,240Pu changes the ‘‘best-fit’’
M.J. Alperin et al. / Deep-Sea Research II 49 (2002) 4645–4665 4657
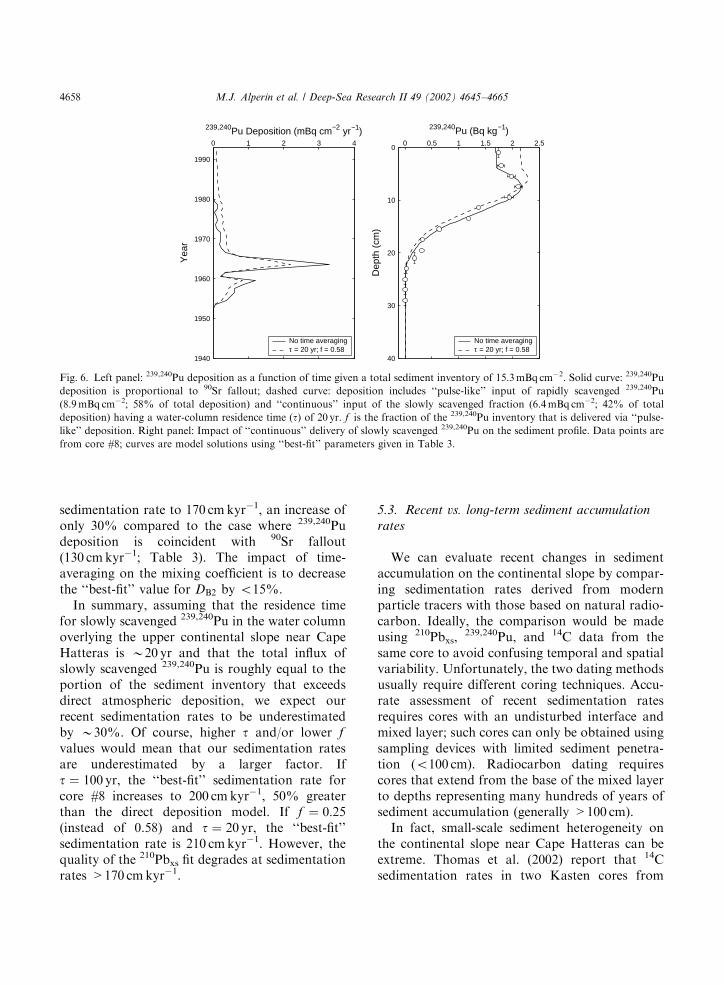
sedimentation rate to 170 cmkyr�1, an increase ofonly 30% compared to the case where 239,240Pudeposition is coincident with 90Sr fallout(130 cmkyr�1; Table 3). The impact of time-averaging on the mixing coefficient is to decreasethe ‘‘best-fit’’ value for DB2 by o15%.
In summary, assuming that the residence timefor slowly scavenged 239,240Pu in the water columnoverlying the upper continental slope near CapeHatteras is B20 yr and that the total influx ofslowly scavenged 239,240Pu is roughly equal to theportion of the sediment inventory that exceedsdirect atmospheric deposition, we expect ourrecent sedimentation rates to be underestimatedby B30%. Of course, higher t and/or lower f
values would mean that our sedimentation ratesare underestimated by a larger factor. Ift ¼ 100 yr, the ‘‘best-fit’’ sedimentation rate forcore #8 increases to 200 cmkyr�1, 50% greaterthan the direct deposition model. If f ¼ 0:25(instead of 0.58) and t ¼ 20 yr, the ‘‘best-fit’’sedimentation rate is 210 cmkyr�1. However, thequality of the 210Pbxs fit degrades at sedimentationrates >170 cmkyr�1.
5.3. Recent vs. long-term sediment accumulation
rates
We can evaluate recent changes in sedimentaccumulation on the continental slope by compar-ing sedimentation rates derived from modernparticle tracers with those based on natural radio-carbon. Ideally, the comparison would be madeusing 210Pbxs,
239,240Pu, and 14C data from thesame core to avoid confusing temporal and spatialvariability. Unfortunately, the two dating methodsusually require different coring techniques. Accu-rate assessment of recent sedimentation ratesrequires cores with an undisturbed interface andmixed layer; such cores can only be obtained usingsampling devices with limited sediment penetra-tion (o100 cm). Radiocarbon dating requirescores that extend from the base of the mixed layerto depths representing many hundreds of years ofsediment accumulation (generally >100 cm).
In fact, small-scale sediment heterogeneity onthe continental slope near Cape Hatteras can beextreme. Thomas et al. (2002) report that 14Csedimentation rates in two Kasten cores from
0 1 2 3 4
1940
1950
1960
1970
1980
1990
Yea
r
239,240Pu Deposition (mBq cm−2 yr )
No time averagingτ = 20 yr; f = 0.58
0 0.5 1 1.5 2 2.50
10
20
30
40
Dep
th (
cm)
239,240Pu (Bq kg )
No time averagingτ = 20 yr; f = 0.58
−1−1
Fig. 6. Left panel: 239,240Pu deposition as a function of time given a total sediment inventory of 15.3mBq cm�2. Solid curve: 239,240Pu
deposition is proportional to 90Sr fallout; dashed curve: deposition includes ‘‘pulse-like’’ input of rapidly scavenged 239,240Pu
(8.9mBq cm�2; 58% of total deposition) and ‘‘continuous’’ input of the slowly scavenged fraction (6.4mBq cm�2; 42% of total
deposition) having a water-column residence time (t) of 20 yr. f is the fraction of the 239,240Pu inventory that is delivered via ‘‘pulse-
like’’ deposition. Right panel: Impact of ‘‘continuous’’ delivery of slowly scavenged 239,240Pu on the sediment profile. Data points are
from core #8; curves are model solutions using ‘‘best-fit’’ parameters given in Table 3.
M.J. Alperin et al. / Deep-Sea Research II 49 (2002) 4645–46654658
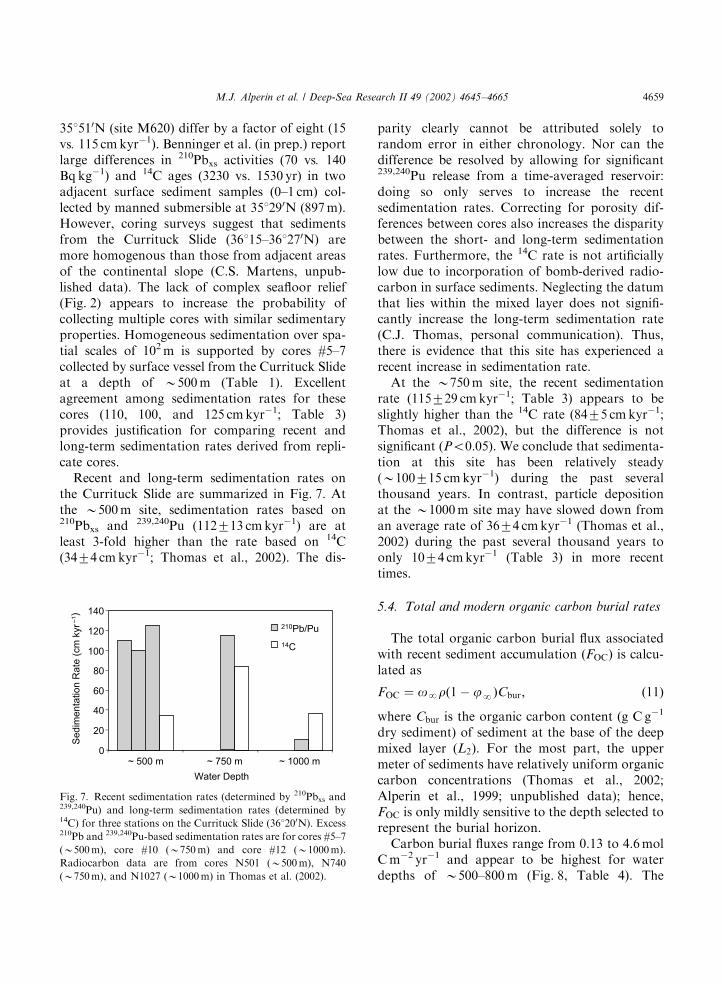
351510N (site M620) differ by a factor of eight (15vs. 115 cmkyr�1). Benninger et al. (in prep.) reportlarge differences in 210Pbxs activities (70 vs. 140Bq kg�1) and 14C ages (3230 vs. 1530 yr) in twoadjacent surface sediment samples (0–1 cm) col-lected by manned submersible at 351290N (897m).However, coring surveys suggest that sedimentsfrom the Currituck Slide (36115–361270N) aremore homogenous than those from adjacent areasof the continental slope (C.S. Martens, unpub-lished data). The lack of complex seafloor relief(Fig. 2) appears to increase the probability ofcollecting multiple cores with similar sedimentaryproperties. Homogeneous sedimentation over spa-tial scales of 102m is supported by cores #5–7collected by surface vessel from the Currituck Slideat a depth of B500m (Table 1). Excellentagreement among sedimentation rates for thesecores (110, 100, and 125 cmkyr�1; Table 3)provides justification for comparing recent andlong-term sedimentation rates derived from repli-cate cores.
Recent and long-term sedimentation rates onthe Currituck Slide are summarized in Fig. 7. Atthe B500m site, sedimentation rates based on210Pbxs and 239,240Pu (112713 cmkyr�1) are atleast 3-fold higher than the rate based on 14C(3474 cmkyr�1; Thomas et al., 2002). The dis-
parity clearly cannot be attributed solely torandom error in either chronology. Nor can thedifference be resolved by allowing for significant239,240Pu release from a time-averaged reservoir:doing so only serves to increase the recentsedimentation rates. Correcting for porosity dif-ferences between cores also increases the disparitybetween the short- and long-term sedimentationrates. Furthermore, the 14C rate is not artificiallylow due to incorporation of bomb-derived radio-carbon in surface sediments. Neglecting the datumthat lies within the mixed layer does not signifi-cantly increase the long-term sedimentation rate(C.J. Thomas, personal communication). Thus,there is evidence that this site has experienced arecent increase in sedimentation rate.
At the B750m site, the recent sedimentationrate (115729 cmkyr�1; Table 3) appears to beslightly higher than the 14C rate (8475 cmkyr�1;Thomas et al., 2002), but the difference is notsignificant (Po0:05). We conclude that sedimenta-tion at this site has been relatively steady(B100715 cmkyr�1) during the past severalthousand years. In contrast, particle depositionat the B1000m site may have slowed down froman average rate of 3674 cmkyr�1 (Thomas et al.,2002) during the past several thousand years toonly 1074 cmkyr�1 (Table 3) in more recenttimes.
5.4. Total and modern organic carbon burial rates
The total organic carbon burial flux associatedwith recent sediment accumulation (FOC) is calcu-lated as
FOC ¼ oNrð1� jNÞCbur; ð11Þ
where Cbur is the organic carbon content (g C g�1
dry sediment) of sediment at the base of the deepmixed layer (L2). For the most part, the uppermeter of sediments have relatively uniform organiccarbon concentrations (Thomas et al., 2002;Alperin et al., 1999; unpublished data); hence,FOC is only mildly sensitive to the depth selected torepresent the burial horizon.
Carbon burial fluxes range from 0.13 to 4.6molCm�2 yr�1 and appear to be highest for waterdepths of B500–800m (Fig. 8, Table 4). The
Fig. 7. Recent sedimentation rates (determined by 210Pbxs and239,240Pu) and long-term sedimentation rates (determined by14C) for three stations on the Currituck Slide (361200N). Excess210Pb and 239,240Pu-based sedimentation rates are for cores #5–7
(B500m), core #10 (B750m) and core #12 (B1000m).
Radiocarbon data are from cores N501 (B500m), N740
(B750m), and N1027 (B1000m) in Thomas et al. (2002).
M.J. Alperin et al. / Deep-Sea Research II 49 (2002) 4645–4665 4659
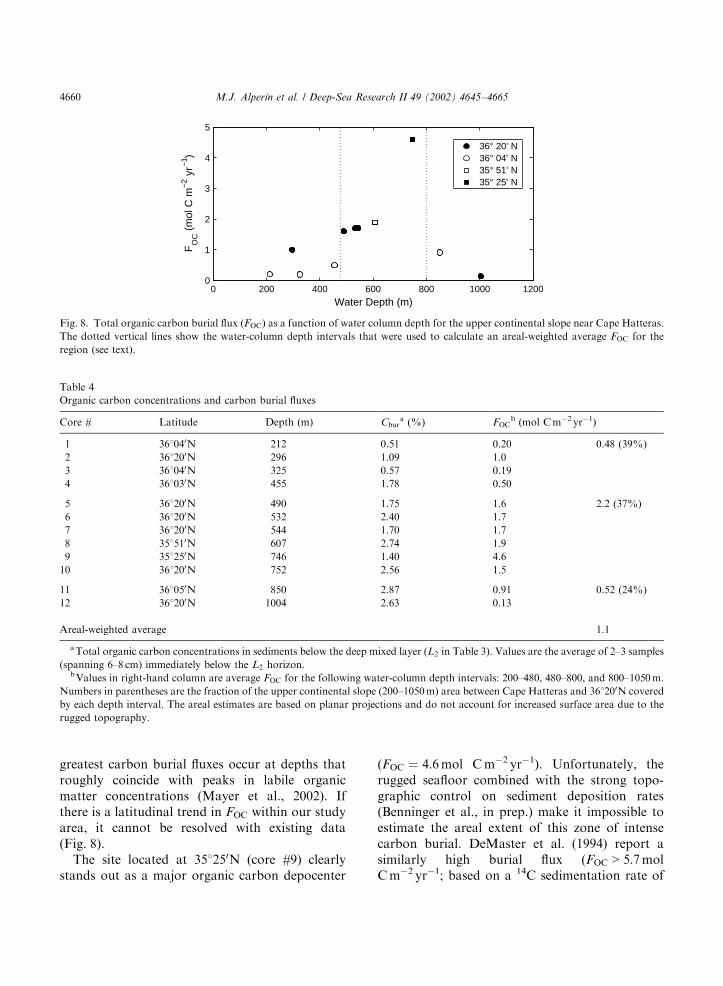
greatest carbon burial fluxes occur at depths thatroughly coincide with peaks in labile organicmatter concentrations (Mayer et al., 2002). Ifthere is a latitudinal trend in FOC within our studyarea, it cannot be resolved with existing data(Fig. 8).
The site located at 351250N (core #9) clearlystands out as a major organic carbon depocenter
(FOC ¼ 4:6mol Cm�2 yr�1). Unfortunately, therugged seafloor combined with the strong topo-graphic control on sediment deposition rates(Benninger et al., in prep.) make it impossible toestimate the areal extent of this zone of intensecarbon burial. DeMaster et al. (1994) report asimilarly high burial flux (FOC > 5:7molCm�2 yr�1; based on a 14C sedimentation rate of
0 200 400 600 800 1000 12000
1
2
3
4
5
FO
C (
mol
C m
−2 y
r −1)
Water Depth (m)
36° 20' N36° 04' N35° 51' N35° 25' N
Fig. 8. Total organic carbon burial flux (FOC) as a function of water column depth for the upper continental slope near Cape Hatteras.
The dotted vertical lines show the water-column depth intervals that were used to calculate an areal-weighted average FOC for the
region (see text).
Table 4
Organic carbon concentrations and carbon burial fluxes
Core # Latitude Depth (m) Cbura (%) FOC
b (mol Cm�2 yr�1)
1 361040N 212 0.51 0.20 0.48 (39%)
2 361200N 296 1.09 1.0
3 361040N 325 0.57 0.19
4 361030N 455 1.78 0.50
5 361200N 490 1.75 1.6 2.2 (37%)
6 361200N 532 2.40 1.7
7 361200N 544 1.70 1.7
8 351510N 607 2.74 1.9
9 351250N 746 1.40 4.6
10 361200N 752 2.56 1.5
11 361050N 850 2.87 0.91 0.52 (24%)
12 361200N 1004 2.63 0.13
Areal-weighted average 1.1
aTotal organic carbon concentrations in sediments below the deep mixed layer (L2 in Table 3). Values are the average of 2–3 samples
(spanning 6–8 cm) immediately below the L2 horizon.bValues in right-hand column are average FOC for the following water-column depth intervals: 200–480, 480–800, and 800–1050m.
Numbers in parentheses are the fraction of the upper continental slope (200–1050m) area between Cape Hatteras and 361200N covered
by each depth interval. The areal estimates are based on planar projections and do not account for increased surface area due to the
rugged topography.
M.J. Alperin et al. / Deep-Sea Research II 49 (2002) 4645–46654660
>500 cmkyr�1) for sediments collected about2 km south of core #9, suggesting that there maybe multiple ‘‘super’’-depocenter sites in this locale.
Walsh et al. (1985) suggested that ‘‘anthropo-genic nitrogen loading would allow an input of0.48 Pg C yr�1 to slope depocenters, as a nonsteady-state response to increased nutrient avail-ability since the industrial revolution’’. If slopesediments near Cape Hatteras receive a propor-tionate share of the enhanced carbon flux, organiccarbon deposition would increase by 1.2molCm�2 yr�1 (based on total area of slopedepocenters of 3.25� 1013m2; Walsh, 1989). Wecan test for enhanced carbon burial since theindustrial revolution by comparing burial fluxesbased on recent (o102-yr timescale) and long-term(>103-yr timescale) sedimentation rates.
The average carbon burial flux based on recentsedimentation rates for the upper continentalslope (200–1050m) between Cape Hatteras and361200N is 1.1mol Cm�2 yr�1 (Table 4). This isthe areal-weighted average of FOC values binnedaccording to water depth (200–480, 480–800,and 800–1050m; Table 4). If we apply the sameslope-area normalization to burial fluxes fromour study area derived from 14C chronology(Thomas et al., 2002; their Table 4), we calculatean average burial flux of 1.0mol Cm�2 yr�1. Theexcellent agreement between recent and long-termfluxes provides additional evidence (Peng andBroecker, 1984; Anderson et al., 1988) thatcarbon storage in upper slope sediments has notincreased markedly as a result of anthropogenicnutrient loading to the coastal zone. Althoughburial fluxes at specific sites may be variable, the
magnitude of the carbon sink for the entire regionhas been relatively stable over millennial time-scales.
The Ocean Margins Program was premised onthe idea that offshore transport of shelf-derivedphytodetritus increases from north to souththrough the Mid-Atlantic Bight (MAB), leadingto maximum organic carbon burial in upper slopesediments near Cape Hatteras (Walsh et al., 1988;Biscaye et al., 1994). The premise appears to bewell-founded. Organic carbon burial fluxes in theMAB rise steadily to the south (Table 5), increas-ing substantially over a distance ofB500 km (41 oflatitude). Furthermore, the upper continentalslope just north of Cape Hatteras harbors anunknown number of ‘‘super’’-depocenter sites(FOCB5mol Cm�2 yr�1) where localized burialfluxes rival those found in near-shore, organic-richsediments (Reeburgh, 1983). Such sites have notbeen detected in the more northern regions of theMAB.
The burial flux of modern carbon is simplyFOC � fmod; where fmod is the fraction of buriedorganic matter that contains fossil fuel-derivedcarbon. DeMaster et al. (2002) estimate that fmod
for our study area averages p0:3; based on 14Cmass balance of the sedimentary organic carbonpool. Thus, we calculate an average burial flux ofmodern carbon on the upper continental slopenear Cape Hatteras of o0.3mol Cm�2 yr�1 (o4 gCm�2 yr�1).
We can use this flux to constrain the fraction ofMAB shelf production that is exported offshoreand buried in upper continental slope sediments.Assuming an annual shelf production in this
Table 5
Organic carbon burial fluxes in slope sediments from the MAB
Region Depth (m) No. cores Carbon burial flux (mol Cm�2 yr�1) Study/references
391050–401280N 80–2700 18 0.092–0.18 SEEP-I
Anderson et al. (1988)
361520–371450N 60–2000 20 0.18–0.73 SEEP-II
Anderson et al. (1994)
351230–361200N Ocean Margins Program
212–1007 12 0.13–4.6 This study
295–1200 12 0.02–1.7 Thomas et al. (2002)
850 1 >5.7 DeMaster et al. (1994)
M.J. Alperin et al. / Deep-Sea Research II 49 (2002) 4645–4665 4661
region of 300 g Cm�2 yr�1 (Verity et al., 2002;Lohrenz et al., 2002; Redalje et al., 2002) and ashelf width that is twice that of the slope (Fig. 1),we calculate a shelf-production:slope-burialratio of o0.7% (o4 g Cm�2 yr�1� 0.5/300 gCm�2 yr�1). Since we have ignored particle focus-ing due to southward flowing shelf waters as wellas primary production at slope depths, this ratiomust be viewed as a gross upper limit. Never-theless, the calculation serves to illustrate that evenin a region where the prevailing currents andgeomorphology promote export and burial of shelfdetritus, an extremely small fraction of the shelfproduction is ultimately stored in upper continen-tal slope depocenters.
If we apply the upper-limit shelf-production:-slope-burial ratio to the global shelf primaryproduction (5.2 Pg C yr�1), we calculate an annualstorage of fossil fuel-derived carbon on thecontinental slope of o0.03 Pg C yr�1. This quan-tity is negligible relative to anthropogenic CO2
emissions (>6 Pg Cyr�1; Houghton, 1997), and isconsistent with other studies (e.g., Peng andBroecker, 1984; Berner, 1992; Biscaye et al.,1994) that have argued that upper continentalslope sediments are not a significant sink for fossilfuel-derived carbon.
6. Conclusions
1. The burial flux of modern (post-1955) carbon inupper continental slope sediments near CapeHatteras is o0.3mol Cm�2 yr�1. Although thisestimate is a gross upper limit, it accounts foro0.7% of the shelf production in the region.Assuming that conditions along the CapeHatteras upper slope are optimal for exportand deposition of shelf phytodetritus, moderncarbon sequestration by continental slope sedi-ments is o0.03 Pg Cyr�1.
2. Total organic carbon burial in upper slopesediments increases from north to south in theMid-Atlantic Bight. The region just north ofCape Hatteras may harbor a number of‘‘super’’-depocenter sites with organic carbonburial fluxes that rival those in near-shore,organic-rich environments.
3. Comparison of recent (o102-yr timescale) andlong-term (>103-yr timescale) sediment chron-ologies suggests that sedimentation at selectedsites on the continental slope near CapeHatteras has varied over millennial timescales.However, if we consider the entire slope regionbetween Cape Hatteras and 361200N, burialrates of organic carbon based on recent andlong-term sedimentation rates are remarkablysimilar.
4. The combination of 210Pbxs and239,240Pu data
with appropriate numerical models can be usedto quantify recent sedimentation rates in heavilybioturbated, continental slope sediments. Bio-turbation coefficients based on short-livedtracers (e.g. 234Th and chlorophyll-a) can bereconciled with those from 210Pbxs and
239,240Puwithout invoking particle-selective mixing, pro-vided that one allows for rapid bioturbation ina shallow surface layer.
Acknowledgements
We thank the crews of the R/V Cape Hatteras,R/V Edwin Link and DWS Johnson Sea-Link II,and the R/V Gyre for their assistance at sea. Wealso gratefully acknowledge the help of KristaWalter with core handling, Sonia Guarda withgamma-counting, and Howard Mendlovitz withmeasuring organic carbon concentrations. Thepaper greatly benefited from thoughtful reviewsby Bob Aller, Bill Fornes, and Peter Santschi. Thiswork was funded by the US Department of Energygrants #DE-FG05-92ER61413 (LKB) and #DE-FG05-95ER62073 (CSM and MJA).
References
Aller, J.Y., Aller, R.C., Green, M.A., 2002. Benthic faunal
assemblages and carbon supply along the continental shelf/
shelf break-slope off Cape Hatteras, North Carolina. Deep-
Sea Research II 49 (20), 4599–4626.
Alperin, M.J., Martens, C.S., Albert, D.B., Suayah, I.B.,
Benninger, L.K., Blair, N.E., Jahnke, R.A., 1999. Benthic
fluxes and porewater concentration profiles of dissolved
organic carbon in sediments from the North Carolina
M.J. Alperin et al. / Deep-Sea Research II 49 (2002) 4645–46654662
continental slope. Geochimica et Cosmochimica Acta 63,
427–448.
Anderson, R.F., Fleer, A.P., 1982. Determination of natural
actinides and plutonium in marine particulate material.
Analytical Chemistry 54, 1142–1147.
Anderson, R.F., Bopp, R.F., Buesseler, K.O., Biscaye, P.E.,
1988. Mixing of particles and organic constituents in
sediments from the continental shelf and slope off Cape
Cod: SEEP—I results. Continental Shelf Research 8,
925–946.
Anderson, R.F., Rowe, G.T., Kemp, P.F., Trumbore, S.,
Biscaye, P.E., 1994. Carbon budget for the mid-slope
depocenter of the Middle Atlantic Bight. Deep-Sea Re-
search II 41, 669–703.
Appleby, P.G., Oldfield, F., 1992. Application of lead-210 to
sedimentation studies. In: Ivanovich, M., Harmon, R.S.
(Eds.), Uranium-Series Disequilibrium: Applications to
Earth, Marine, and Environmental Sciences. Clarendon
Press, Oxford, pp. 731–778.
Benninger, L.K., Wells, J.T., 1993. Sources of sediment to the
Neuse River estuary, North Carolina. Marine Chemistry 43,
137–156.
Benninger, L.K., Aller, R.C., Cochran, J.K., Turekian, K.K.,
1979. Effects of biological sediment mixing on the 210Pb
chronology and trace metal distribution in a Long Island
Sound sediment core. Earth and Planetary Science Letters
43, 241–259.
Benninger, L.K., Meyer, S.L., Suayah, I.B. Sea-floor
topography controls modern sediment deposition on the
continental slope, Cape Hatteras, North Carolina, in
preparation.
Berner, R.A., 1980. Early Diagenesis. Princeton University
Press, Princeton, N.J.
Berner, R.A., 1992. Comments on the role of marine sediment
burial as a repository for anthropogenic CO2. Global
Biogeochemical Cycles 6, 1–2.
Biscaye, P.E., Flagg, C.N., Falkowski, P.G., 1994. The shelf
edge exchange processes experiment, SEEP—II: an intro-
duction to hypotheses, results, and conclusions. Deep-Sea
Research 41, 231–252.
Blair, N.E., Levin, L.A., DeMaster, D.J., 1996. The short-term
fate of fresh algal carbon in continental slope sediment.
Limnology and Oceanography 41, 1208–1219.
Blake, J.A., Hilbig, B., 1994. Dense infaunal assemblages on the
continental slope off Cape Hatteras, North Carolina. Deep-
Sea Research II 41, 875–899.
Boudreau, B.P., 1986a. Mathematics of tracer mixing in
sediments: I. Spatially dependent, diffusive mixing. Amer-
ican Journal of Science 286, 161–198.
Boudreau, B.P., 1986b. Mathematics of tracer mixing in
sediments: II. Non-local mixing and biological
conveyor-belt phenomena. American Journal of Science
286, 199–238.
Buesseler, K.O., Livingston, H.D., Sholkovitz, E.R., 1985.239,240Pu and excess 210Pb inventories along the shelf and
slope of the northeast USA. Earth and Planetary Science
Letters 76, 10–22.
Bunn, A.R., McGregor, B.A., 1980. Morphology of the North
Carolina continental slope, western North Atlantic, shaped
by deltaic sedimentation and slumping. Marine Geology 37,
253–266.
DeMaster, D.J., Pope, R.H., Levin, L.A., Blair, N.E., 1994.
Biological mixing intensity and rates of organic carbon
accumulation in North Carolina slope sediments. Deep-Sea
Research II 41, 735–753.
DeMaster, D.J., Thomas, C.J., Blair, N.E., Fornes, W.L., Plaia,
G., Levin, L.A., 2002. Deposition of bomb 14C in
continental slope sediments of the Mid-Atlantic Bight:
Assessing organic matter sources and burial rates. Deep-Sea
Research II 49 (20), 4667–4685.
DeVito, C.M., 1981. Radionuclides as tracers of sediment
transport processes in North Carolina continental slope
sediments. M.S. Thesis, University of North Carolina,
Chapel Hill, NC, USA.
Diaz, R.J., Cutter, G.R., Rhoads, D.C., 1994. The importance
of bioturbation to continental slope sediment structure and
benthic processes off Cape Hatteras, North Carolina. Deep-
Sea Research II 41, 719–734.
Falkowski, P.G., Biscaye, P.E., Sancetta, C., 1994. The lateral
flux of biogenic particles from the eastern North American
continental margin to the North Atlantic Ocean. Deep-Sea
Research 41, 583–601.
Falkowski, P.G., Flagg, C.N., Rowe, G.T., Smith, S.L.,
Whitledge, T.E., Wirick, C.D., 1988. The fate of a spring
phytoplankton bloom: Export or oxidation? Continental
Shelf Research 8, 457–484.
Flagg, C.L., Pietrafesa, L.J., Weatherly, G., 2002. Springtime
hydrography of the southern Middle Atlantic Bight and the
onset of seasonal stratification. Deep-Sea Research II 49
(20), 4297–4329.
Fornes, W.L., DeMaster, D.J., Levin, L.A., Blair, N.E., 1999.
Bioturbation and particle transport in Carolina slope
sediments: a radiochemical approach. Journal of Marine
Research 57, 335–355.
Fowler, S.W., Noshkin, V.E., La Rosa, J., Gastaud, J., 2000.
Temporal variations in plutonium and americium inven-
tories and their relation to vertical transport in the northeast
Mediterranean Sea. Limnology and Oceanography 45,
446–458.
Green, M.A., Aller, R.C., Cochran, J.K., Lee, C., Aller, J.Y.,
2002. Bioturbation in shelf/slope sediments off Cape
Hatteras, North Carolina: The use of 234Th, Chl-a, and
Br� to evaluate rates of particle and solute transport. Deep-
Sea Research II 49 (20), 4627–4644.
HASL, 1977. Final tabulation of monthly 90Sr fallout
data: 1954–1976. Health and Safety Laboratory
Environmental Quarterly, Report No. HASL-329.
Energy Research and Development Administration,
New York.
Hedges, J.I., Stern, J.H., 1984. Carbon and nitrogen determina-
tions of carbonate-containing solids. Limnology and
Oceanography 29, 657–663.
Houghton, J., 1997. Global Warming: The Complete Briefing.
Cambridge University Press, Cambridge.
M.J. Alperin et al. / Deep-Sea Research II 49 (2002) 4645–4665 4663
Jahnke, R.A., Knight, L.H., 1997. A gravity-driven, hydrauli-
cally damped multiple piston corer for sampling fine-
grained sediments. Deep-Sea Research I 44, 713–718.
Kanneworff, E., Nicolaisen, W., 1973. The ‘‘HAPS’’, a frame-
supported bottom corer. Ophelia 10, 119–129.
Kelchner, C., 1992. Organic-rich depositional regimes, North
Carolina continental slope: evaluating source sites and
sediment transport pathways. M.S. Thesis, North Carolina
State Univeristy, Raleigh, NC, USA.
Koide, M., Griffin, J.J., Goldberg, E.D., 1975. Records of
plutonium fallout in marine and terrestrial samples. Journal
of Geophysical Research 80, 4153–4162.
Kressin, I.K., 1977. Electrodeposition of plutonium and
americium for high resolution alpha spectrometry. Analy-
tical Chemistry 49, 842–845.
Larsen, R.J., 1985. Worldwide deposition of 90Sr through 1983.
US Department of Energy Report EML–444.
Livingston, H.D., Anderson, R.F., 1983. Large particle
transport of plutonium and other fallout radionuclides to
the deep ocean. Nature 303, 228–231.
Livingston, H.D., Bowen, V.T., 1979. Pu and 137Cs in coastal
sediments. Earth and Planetary Science Letters 43, 29–45.
Lohrenz, S.E., Redalje, D.G., Verity, P.G., Flagg, C.,
Matulewski, K.V., 2002. Primary production on the
continental shelf off Cape Hatteras, NC. Deep-Sea Re-
search II 49 (20), 4479–4509.
Mayer, L., Benninger, L., Bock, M., DeMaster, D., Roberts,
Q., Martens, C., 2002. Mineral associations and nutritional
quality of organic matter in shelf and upper slope sediments
off Cape Hatteras, USA: A case study of unusually high
loadings. Deep-Sea Research II 49 (20), 4587–4597.
Mellor, C.A., Paull, C.K., 1994. Sea beam bathymetry of the
Manteo 467 Lease Block off Cape Hatteras, North
Carolina. Deep-Sea Research II 41, 711–718.
Mulsow, S., Boudreau, B.P., Smith, J.N., 1998. Bioturbation
and porosity gradients. Limnology and Oceanography 43,
1–9.
Nie, Y., Suayah, I.B., Benninger, L.K., Alperin, M.J., 2001.
Modeling detailed sedimentary 210Pb and fallout 239,240Pu
profiles to allow episodic events: An application in
chesapeake bay. Limnology and Oceanography 46,
1425–1437.
Officer, C.B., Lynch, D.R., 1982. Interpretation procedures for
the determination of sediment parameters from time-
dependent flux inputs. Earth and Planetary Science Letters
61, 55–62.
Peng, T.-H., Broecker, W.S., 1984. Ocean life cycles and the
atmospheric CO2 content. Journal of Geophysical Research
89, 8170–8180.
Pereyra, V., 1978. PASVA3: an adaptive finite-difference
FORTRAN program for first order nonlinear boundary
value problems. Lecture Notes in Computer Science 76,
67–88.
Pietrafesa, L.J., Xie, L., Weatherly, G., Flagg, C., Morrison,
J.M., 2002. Offshore flux of water masses during the passage
of storms in the southern Mid-Atlantic Bight. Deep-Sea
Research II 49 (20), 4331–4354.
Prior, D.B., Doyle, E.H., Neurauter, T., 1986. The Currituck
Slide, Mid-Atlantic continental slope—revisted. Marine
Geology 73, 25–45.
Redalje, D.G., Lohrenz, S.E., Verity, P.G., Flagg, C.N., 2002.
Phytoplankton dynamics within a discrete water mass off
Cape Hatteras, North Carolina: The Lagrangian experi-
ment. Deep-Sea Research II 49 (20), 4511–4531.
Reeburgh, W.S., 1983. Rates of biogeochemical processes in
anoxic sediments. Annual Reviews of Earth and Planetary
Science 11, 269–298.
Robbins, J.A., Holmes, C., Halley, R., Bothner, M., Shinn, E.,
Graney, J., Keeler, G., tenBrink, M., Orlandi, K.A.,
Rudnick, D., 2001. Time-averaged fluxes of lead and fallout
radionuclides to sediments in Florida Bay. Journal of
Geophysical Research 105, 28805–28821.
Rowe, G.T., Smith, S.L., Falkowski, P.G., Whitledge, T.E.,
Theroux, R., Phoel, W., Ducklow, H., 1986. Do continental
shelves export organic matter? Nature 324, 559–561.
Santschi, P.H., Li, Y.-H., Bell, J.J., Trier, R.M., Kawtaluk, K.,
1980. Pu in coastal marine environments. Earth and
Planetary Science Letters 51, 248–265.
Schaff, T.R., Levin, L.A., 1994. Spatial heterogeneity of
benthos associated with biogenic structures on the North
Carolina continental slope. Deep-Sea Research II 41,
901–918.
Schaff, T., Levin, L., Blair, N., DeMaster, D., Pope, R.,
Boehme, S., 1992. Spatial heterogeneity of benthos on the
Carolina continental slope: large (100 km)-scale variation.
Marine Ecology Progress Series 88, 143–160.
Sewell, G., 1982. IMSL software for differential equations
in one space variable. IMSL Technical Report Series
No. 8202.
Smith, C.R., Pope, R.H., DeMaster, D.J., MaGaard, L., 1993.
Age-dependent mixing of deep-sea sediments. Geochimica
et Cosmochimica Acta 57, 1473–1488.
Thomas, C.J., Blair, N.E., Alperin, M.J., DeMaster, D.J.,
Jahnke, R.E., Martens, C.S., Mayer, L., 2002. Organic
carbon deposition on the North Carolina continental slope
off Cape Hatteras (USA). Deep-Sea Reserch II 49 (20),
4687–4709.
Tucholke, B.E., 1987. Submarine geology. In: Milliman, J.D.,
Wright, W.R. (Eds.), The Marine Environment of the US
Atlantic Continental Slope and Rise. Jones and Bartlett
Publishers Inc, Woods Hole, MA, pp. 56–113.
Verity, P.G., Redalje, D.G., Lohrenz, S.E., Paffenh .ofer, G.-A.,
2002. Coupling between primary production and pelagic
consumption in temperate ocean margin pelagic ecosystems.
Deep-Sea Reaseach II 49 (20), 4553–4569.
Walsh, J.J., 1989. How much shelf production reaches the deep
sea? In: Berger, W.H., Smetacek, V.S., Wefer, G. (Eds.),
Productivity of the Ocean: Present and Past. Wiley, Dahlem
Konferenzen, pp. 175–191.
Walsh, J.J., Rowe, G.T., Iverson, R.L., McRoy, C.P., 1981.
Biological export of shelf carbon is a sink of the global CO2
cycle. Nature 291, 196–201.
Walsh, J.J., Premuzic, E.T., Gaffney, J.S., Rowe, G.T.,
Harbottle, G., Stoenner, R.W., Balsam, W.L., Betzer,
M.J. Alperin et al. / Deep-Sea Research II 49 (2002) 4645–46654664

P.R., Macko, S.A., 1985. Organic storage of CO2 on the
continental slope off the Mid-Atlantic Bight, the south-
eastern Bering Sea, and the Peru coast. Deep-Sea Research
32, 853–883.
Walsh, J.J., Biscaye, P.E., Csanady, G.T., 1988. The 1983–1984
shelf edge exchange processes (SEEP)—I experiment:
hypotheses and highlights. Continental Shelf Research 8,
435–456.
Wong, K.M., Jokela, T.A., Eagle, R.J., Brunk, J.L., Noshkin,
V.E., 1992. Radionuclide concentrations, fluxes, and re-
sidence times at Santa Monica and San Pedro basins.
Progress in Oceanography 30, 353–391.
M.J. Alperin et al. / Deep-Sea Research II 49 (2002) 4645–4665 4665