Contrasting sedimentation rates in Lake Illawarra and St Georges Basin, two large barrier estuaries...
17
ORIGINAL PAPER Contrasting sedimentation rates in Lake Illawarra and St Georges Basin, two large barrier estuaries on the southeast coast of Australia Craig R. Sloss • Brian G. Jones • Brendan P. Brooke • Henk Heijnis • Colin V. Murray-Wallace Received: 16 April 2009 / Accepted: 4 February 2011 / Published online: 15 February 2011 Ó Springer Science+Business Media B.V. 2011 Abstract Sedimentation rates over the last 100 years within two lagoons on the southeast coast of Australia, Lake Illawarra and St Georges Basin, have been quantified to determine the effects of catchment land use change and native vegetation clearance on infill rates, and spatial variations in the rate at which the estuaries have filled. Both catchments have similar lake and catchment area but have experience different degrees of modification due to land clearing for agriculture practices, urbanisation and industri- alisation. Results indicate that in the heavily modified catchment of Lake Illawarra sedimentation rates close to fluvial deltas can be in excess of 16 mm/ year, and between 2 and 4 mm/year in the adjacent central basin. This is approximately an order of magnitude greater than the pre-European rates. In contrast, at St Georges Basin, where the catchment has experienced much less modification, sedimenta- tion rates in the central basin appear to have remained close to those prior to European settlement. However, sedimentation rates in the urbanized margin of St Georges Basin are relatively high (up to 4.4 mm/ year). This rapid modern sedimentation in the margin of the estuarine embayments has been detected in several other estuaries in the region. However the degree of sedimentation within the bay-head deltas, and more significantly in the central basin appears proportional to the degree clearance of native vege- tation (forest) in the catchment, urban expansion and development of heavy industry in the respective catchment areas. Keywords Lagoonal infilling Delta progradation Geochronology Amino acid racemisation Lead-210 Cesium-137 Landuse changes Introduction Estuaries are environmentally, economically and recreationally very valuable coastal environments (Costanza et al. 1997; Robinson 2001). Accordingly, it is essential for their sustainable management to understand how these systems respond to changing land use patterns and environmental conditions. C. R. Sloss (&) The Discipline of Biogeoscience, Queensland University of Technology, GPO Box 2434, Brisbane, QLD 4001, Australia e-mail: [email protected] B. G. Jones C. V. Murray-Wallace School of Earth and Environmental Sciences, University of Wollongong, Wollongong, NSW 2522, Australia B. P. Brooke Geoscience Australia, GPO Box 1666, Canberra, ACT 2601, Australia H. Heijnis Australian Nuclear Science and Technology Organisation, Menai, NSW, Australia 123 J Paleolimnol (2011) 46:561–577 DOI 10.1007/s10933-011-9507-z
Transcript of Contrasting sedimentation rates in Lake Illawarra and St Georges Basin, two large barrier estuaries...
ORIGINAL PAPER
Contrasting sedimentation rates in Lake Illawarra and StGeorges Basin, two large barrier estuaries on the southeastcoast of Australia
Craig R. Sloss • Brian G. Jones •
Brendan P. Brooke • Henk Heijnis •
Colin V. Murray-Wallace
Received: 16 April 2009 / Accepted: 4 February 2011 / Published online: 15 February 2011
� Springer Science+Business Media B.V. 2011
Abstract Sedimentation rates over the last 100
years within two lagoons on the southeast coast of
Australia, Lake Illawarra and St Georges Basin, have
been quantified to determine the effects of catchment
land use change and native vegetation clearance on
infill rates, and spatial variations in the rate at which
the estuaries have filled. Both catchments have
similar lake and catchment area but have experience
different degrees of modification due to land clearing
for agriculture practices, urbanisation and industri-
alisation. Results indicate that in the heavily modified
catchment of Lake Illawarra sedimentation rates
close to fluvial deltas can be in excess of 16 mm/
year, and between 2 and 4 mm/year in the adjacent
central basin. This is approximately an order of
magnitude greater than the pre-European rates. In
contrast, at St Georges Basin, where the catchment
has experienced much less modification, sedimenta-
tion rates in the central basin appear to have remained
close to those prior to European settlement. However,
sedimentation rates in the urbanized margin of St
Georges Basin are relatively high (up to 4.4 mm/
year). This rapid modern sedimentation in the margin
of the estuarine embayments has been detected in
several other estuaries in the region. However the
degree of sedimentation within the bay-head deltas,
and more significantly in the central basin appears
proportional to the degree clearance of native vege-
tation (forest) in the catchment, urban expansion and
development of heavy industry in the respective
catchment areas.
Keywords Lagoonal infilling � Delta progradation �Geochronology � Amino acid racemisation �Lead-210 � Cesium-137 � Landuse changes
Introduction
Estuaries are environmentally, economically and
recreationally very valuable coastal environments
(Costanza et al. 1997; Robinson 2001). Accordingly,
it is essential for their sustainable management to
understand how these systems respond to changing
land use patterns and environmental conditions.
C. R. Sloss (&)
The Discipline of Biogeoscience, Queensland University
of Technology, GPO Box 2434, Brisbane, QLD 4001,
Australia
e-mail: [email protected]
B. G. Jones � C. V. Murray-Wallace
School of Earth and Environmental Sciences, University
of Wollongong, Wollongong, NSW 2522, Australia
B. P. Brooke
Geoscience Australia, GPO Box 1666, Canberra,
ACT 2601, Australia
H. Heijnis
Australian Nuclear Science and Technology Organisation,
Menai, NSW, Australia
123
J Paleolimnol (2011) 46:561–577
DOI 10.1007/s10933-011-9507-z
Changes to these systems can be via natural processes
(e.g. sea-level fluctuations, inlet channel infilling and
migration, and natural sedimentation) or induced by
human modification such as increased sediment,
nutrient and contaminant loads associated with agri-
cultural practices, urbanisation and industrial devel-
opment (Brooke 2003). In this study, sedimentation
rates pre- and post-European settlement (i.e. \200
years) within the Lake Illawarra and St Georges
Basin barrier estuaries on the southeast coast of
Australia has been determined from sediment cores
using a combination of 210Pb and 137Cs profiles, plus
radiocarbon and aspartic acid racemisation-derived
ages on fossil molluscs within the sediment.
European settlement on the Illawarra region coast
commenced in the early 1800s. Since that time the
region has undergone rapid and extensive clearing for
agricultural, industrial and urban development, to the
point that the many coastal catchments are now
significantly modified landscapes (Chenhall et al.
1995, 1994, 2001, 2004; Hagan and Wells 1997;
Sloss et al. 2004a, b). Such land use modification has
altered the geomorphological characteristics and
sedimentation trends within the coastal catchments;
this is particularly evident in estuarine environments
which act as a sediment sink between the catchment
and the coast. These changes have often led to rapid
siltation and choking of navigation routes; increased
nutrient loads leading to proliferation of algal
blooms; and increased turbidity and loss of a range
of estuarine flora and fauna (Chenhall et al. 1995,
2004; Taylor et al. 2004). However, studies that
quantify sedimentation rates in estuarine environ-
ments on the southeast coast of Australia are lacking.
This study utilises a multi-proxy geochronological
investigation that quantifies sedimentation rates
following European settlement in both heavily and
moderately modified catchments.
Study sites
Lake Illawarra
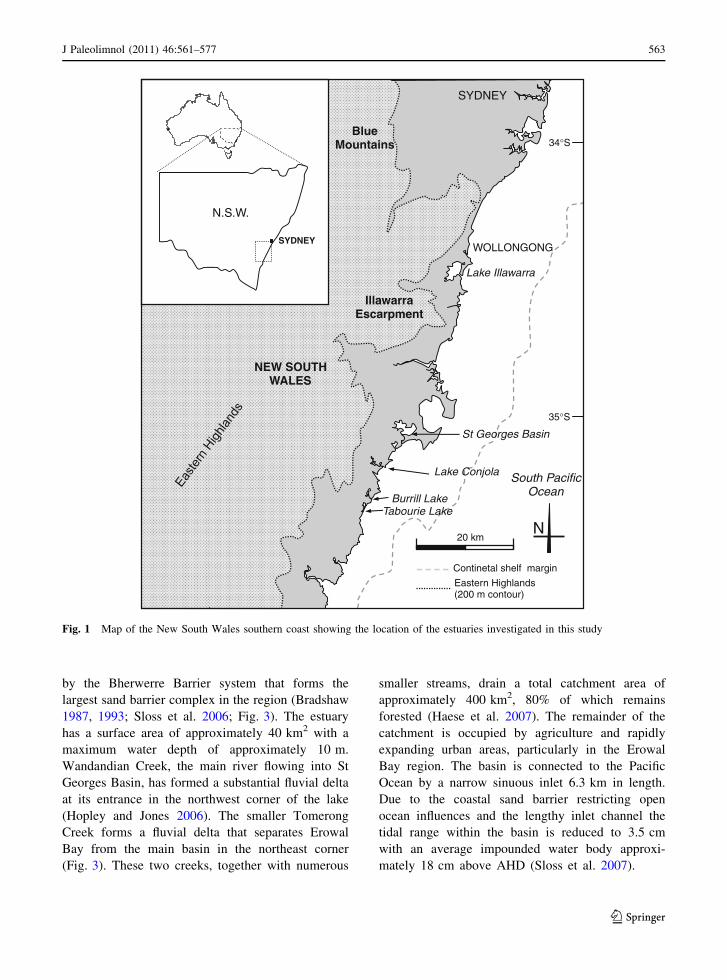
Lake Illawarra, located approximately 80 km south
of Sydney (Fig. 1), fills a shallow (\30 m) incised
valley system scoured into the upper Permian Shoal-
haven Group by river action during previous low-
stands of sea-level (Roy and Peat 1975; Sloss et al.
2005, 2006). The estuarine lake is impounded by
Windang Peninsula, a coastal barrier, and is con-
nected to the ocean by a 1.4 km long inlet channel.
The back-barrier estuarine lake covers an area of
approximately 36 km2 and has a maximum water
depth of 3.2 m. Due to the coastal barrier and narrow
inlet channel, the average impounded water level is
approximately 0.24 m above Australian Height
Datum (AHD; equivalent to present mean sea level;
Umitsu et al. 2001; Sloss et al. 2007). The estuary is
elongate in a general northeast–southwest direction
with two river mouths along its western margin,
Mullet Creek in the northwest and Macquarie Rivulet
in the southwest.
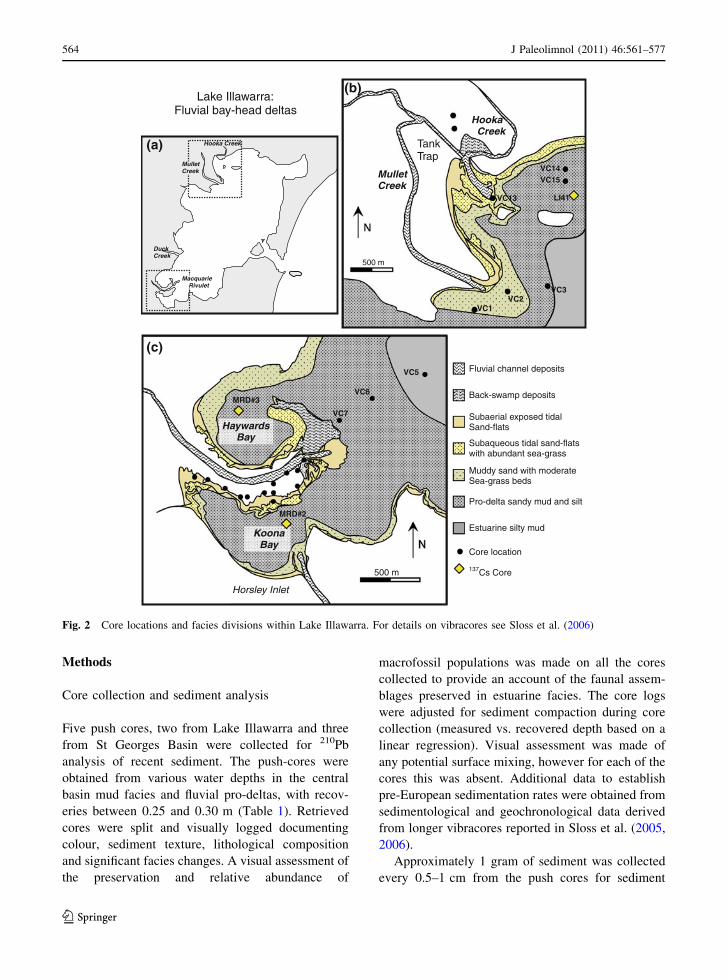
Mullet Creek has a single fluvial channel and lobate
subaqueous fluvial delta up to 1 km wide that extends
0.6 km east-southeast from the mouth of the creek into
the Lake Illawarra (Fig. 2). As sediment load associ-
ated with stream discharge enters the estuarine water
body, the sandy sediments are reworked and moved
alongshore by internally generated wind and wave
currents, producing a characteristic wave-dominated
delta morphology. The fine-grained fraction that
remains in suspension is transported into the deeper
portions of the central receiving basin (Jones et al.
1976; Sloss et al. 2004a, b, 2005).
Macquarie Rivulet enters the lagoon in the south-
west in a relatively sheltered embayment with lower
wind and wave energy. Macquarie Rivulet has a
higher discharge than Mullet Creek and, as a result,
its delta is dominated by river flow. This has
produced a delta with bifurcating channels, and
distributary mouth bars (Sloss et al. 2005; Hopley
et al. 2007) and thin, lobate sub-deltas that have
created a classic birdsfoot delta morphology that
extends 1.3 km into the lagoon (Fig. 2). Together
Mullet Creek and Macquarie Rivulet, along with
numerous smaller streams, drain a combined catch-
ment area of approximately 332 km2.
St Georges Basin
St Georges Basin is a large bi-lobate wave-domi-
nated barrier estuary located 190 km south of
Sydney (Fig. 1). The estuary has infilled a broad
and shallow incised valley scoured into the ante-
cedent Pleistocene landsurface and mid Permian
sandstone and siltstone during periods of lower sea
level (Sloss et al. 2006). The estuary is impounded
562 J Paleolimnol (2011) 46:561–577
123
by the Bherwerre Barrier system that forms the
largest sand barrier complex in the region (Bradshaw
1987, 1993; Sloss et al. 2006; Fig. 3). The estuary
has a surface area of approximately 40 km2 with a
maximum water depth of approximately 10 m.
Wandandian Creek, the main river flowing into St
Georges Basin, has formed a substantial fluvial delta
at its entrance in the northwest corner of the lake
(Hopley and Jones 2006). The smaller Tomerong
Creek forms a fluvial delta that separates Erowal
Bay from the main basin in the northeast corner
(Fig. 3). These two creeks, together with numerous
smaller streams, drain a total catchment area of
approximately 400 km2, 80% of which remains
forested (Haese et al. 2007). The remainder of the
catchment is occupied by agriculture and rapidly
expanding urban areas, particularly in the Erowal
Bay region. The basin is connected to the Pacific
Ocean by a narrow sinuous inlet 6.3 km in length.
Due to the coastal sand barrier restricting open
ocean influences and the lengthy inlet channel the
tidal range within the basin is reduced to 3.5 cm
with an average impounded water body approxi-
mately 18 cm above AHD (Sloss et al. 2007).
South Pacific Ocean
NEW SOUTH WALES
SYDNEY
SYDNEY
35°S
34°S Blue
Mountains
Illawarra Escarpment
Continetal shelf margin
Eastern Highlands (200 m contour)
N.S.W.
WOLLONGONG
Lake Illawarra
St Georges Basin
Lake Conjola
N 20 km
Burrill Lake Tabourie Lake
Fig. 1 Map of the New South Wales southern coast showing the location of the estuaries investigated in this study
J Paleolimnol (2011) 46:561–577 563
123
Methods
Core collection and sediment analysis
Five push cores, two from Lake Illawarra and three
from St Georges Basin were collected for 210Pb
analysis of recent sediment. The push-cores were
obtained from various water depths in the central
basin mud facies and fluvial pro-deltas, with recov-
eries between 0.25 and 0.30 m (Table 1). Retrieved
cores were split and visually logged documenting
colour, sediment texture, lithological composition
and significant facies changes. A visual assessment of
the preservation and relative abundance of
macrofossil populations was made on all the cores
collected to provide an account of the faunal assem-
blages preserved in estuarine facies. The core logs
were adjusted for sediment compaction during core
collection (measured vs. recovered depth based on a
linear regression). Visual assessment was made of
any potential surface mixing, however for each of the
cores this was absent. Additional data to establish
pre-European sedimentation rates were obtained from
sedimentological and geochronological data derived
from longer vibracores reported in Sloss et al. (2005,
2006).
Approximately 1 gram of sediment was collected
every 0.5–1 cm from the push cores for sediment
VC38
LkPb2 VC4
LkPb1
Fluvial channel deposits
Back-swamp deposits
Subaerial exposed tidal Sand-flats
Subaqueous tidal sand-flats with abundant sea-grass
Muddy sand with moderate Sea-grass beds
Pro-delta sandy mud and silt
Estuarine silty mud
Core location
137Cs Core 500 m
Haywards Bay
Koona Bay
VC5
VC6
VC7
VC8
Mullet Creek
500 m
Hooka Creek
Tank Trap
Duck Creek
Hooka Creek
Mullet Creek
Macquarie Rivulet
Lake Illawarra: Fluvial bay-head deltas
VC14 VC15
VC13
VC3 VC2
VC1
MRD#3
MRD#2
LI41
(a)
(b)
(c)
Horsley Inlet
Fig. 2 Core locations and facies divisions within Lake Illawarra. For details on vibracores see Sloss et al. (2006)
564 J Paleolimnol (2011) 46:561–577
123
analysis and 210Pb dating. Sediment collected for
particle size analysis was disaggregated in water by
immersion in an ultrasonic bath. Sodium hexameta-
phosphate was added to prevent flocculation of the
fine-grained detritus. Samples were analysed using a
Malvern Mastersizer 2000 laser particle size analyser
to establish the sediment characteristics (\2 mm).
Lead-210 dating
Sediment samples were taken at 0.5 cm intervals,
dried at 50�C for 24 h then crushed into a fine powder
using a mortar and pestle. The crushed samples were
chemically processed using the standard methods
employed by the Environment Division Laboratories
at the Australian Nuclear Science and Technology
Organisation (ANSTO), Sydney (Haworth et al.
1999).
Sediment accumulation rates and sample age esti-
mates based on the measured 210Pb activities were
calculated using the Constant Initial Concentration
(CIC) model (Krishnaswamy et al. 1971; Haworth et al.
1999). The CIC model assumes that at each stage of
sediment accumulation the initial concentration of
unsupported 210Pb is constant regardless of bulk
sediment accumulation (Krishnaswamy et al. 1971;
Fluvial channel deposits
Subaerial exposed tidal Sand-flats
Subaqueous tidal sand-flats with abundant sea-grass
Bhewerre Barrier
5 km
Worrowin Waterway
Tomerong Creek
Erowal Bay
6113
6112
6111
285 286
EbPb2
EbPb1
StPb1
Muddy sand with moderate sea-grass beds
Estuarine silty mud
Vibracore location
210Pb Core location
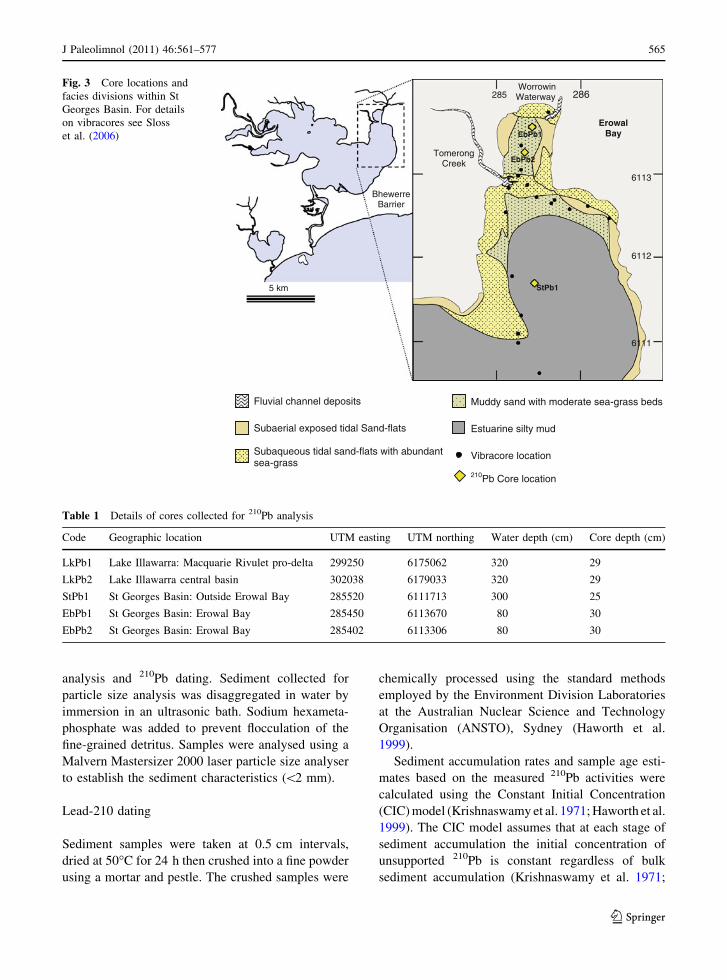
Fig. 3 Core locations and
facies divisions within St
Georges Basin. For details
on vibracores see Sloss
et al. (2006)
Table 1 Details of cores collected for 210Pb analysis
Code Geographic location UTM easting UTM northing Water depth (cm) Core depth (cm)
LkPb1 Lake Illawarra: Macquarie Rivulet pro-delta 299250 6175062 320 29
LkPb2 Lake Illawarra central basin 302038 6179033 320 29
StPb1 St Georges Basin: Outside Erowal Bay 285520 6111713 300 25
EbPb1 St Georges Basin: Erowal Bay 285450 6113670 80 30
EbPb2 St Georges Basin: Erowal Bay 285402 6113306 80 30
J Paleolimnol (2011) 46:561–577 565
123
Haworth et al. 1999). No independent markers were
available to assess the performance of the CIC model
(sensu Smith 2001). However, the linear nature of the210Pb profiles render this the most suitable model.
Since 210Pb decays logarithmically with time from its
initial activity, with a decay constant of 0.03114 per
year, the sediment age at any depth is given by:
tz ¼ ð1=kÞlogeðA0=AÞ;
where tz is the age at depth z; k is the 210Pb decay
constant; A0 is the initial unsupported 210Pb activity
per unit mass; and A is the unsupported 210Pb activity
per unit mass at depth z (Haworth et al. 1999).
The 210Po and excess 210Pb data from alpha
spectrometric counting of the sediment samples for
each core are presented in Table 2 and Fig. 4. Also,
Table 2 Geochemical data for cores analysed for 210Pb
Core Depth
(cm)
ANSTO
laboratory code
Activity of
Po-210 (Bq/kg)
Activity of
Ra-226 (Bq/kg)
Activity of excess210Pb (Bq/kg)
LkPb1 0–0.5 G380 48.8 ± 1.1 8.7 ± 0.6 40.1 ± 1.2
1–1.5 G381 58.7 ± 1.4 6.5 ± 0.4 52.1 ± 1.4
2–2.5 G382 48.0 ± 1.2 9.2 ± 0.6 38.8 ± 1.3
4.5–5 G383 53.4 ± 1.3 7.3 ± 0.5 46.1 ± 1.4
5.5–6 G384 24.3 ± 1.1 8.7 ± 0.7 15.6 ± 1.3
12–12.5 G385 52.2 ± 2.0 6.4 ± 0.5 45.7 ± 2.1
16–16.5 G386 17.8 ± 0.9 8.1 ± 0.6 9.7 ± 1.1
LkPb2 0–0.5 G174 54.8 ± 1.7 6.5 ± 0.4 48.3 ± 1.7
3.5–4 G175 46.3 ± 1.5 4.6 ± 0.4 41.7 ± 1.5
5–5.5 G176 44.0 ± 1.5 6.4 ± 0.4 37.6 ± 1.5
6.5–7 G177 43.0 ± 1.4 7.1 ± 0.5 35.9 ± 1.5
9–9.5 G393 40.3 ± 1.6 7.8 ± 0.7 32.5 ± 1.8
11.5–12 G178 35.6 ± 1.0 5.5 ± 0.4 30.2 ± 1.1
22–22.5 G394 15.9 ± 0.7 8.0 ± 0.8 7.9 ± 1.5
27–27.5 G179 12.5 ± 0.5 5.5 ± 0.4 7.0 ± 0.6
StPb1 0–1 G167 54.3 ± 2.1 3.0 ± 0.2 51.3 ± 2.1
2.5–3 G168 37.6 ± 1.0 1.9 ± 0.2 35.6 ± 1.0
5–5.5 G169 29.2 ± 1.2 2.5 ± 0.2 26.7 ± 1.2
8–8.5 G170 18.6 ± 0.6 2.4 ± 0.2 16.2 ± 0.7
12–12.5 G171 12.6 ± 0.5 8.1 ± 0.5 4.5 ± 0.7
20–20.5 G173 9.0 ± 0.4 4.2 ± 0.3 4.8 ± 0.5
EbPb1 0.75 ± 0.25 D313 94.6 ± 3.1 3.0 ± 0.3 91.6 ± 3.1
4.75 ± 0.25 D314 106.8 ± 3.3 3.7 ± 0.3 103.1 ± 3.3
9.75 ± 0.25 D315 84.3 ± 3.4 2.2 ± 0.2 82.1 ± 3.4
19.5 ± 0.5 D316 38.3 ± 2.1 2.1 ± 0.1 36.3 ± 2.1
29.5 ± 0.5 D317 20.6 ± 0.8 1.9 ± 0.1 18.7 ± 0.8
EbPb2 5.25 ± 0.25 D895 63.7 ± 1.7 2.5 ± 0.2 61.2 ± 1.7
9.75 ± 0.25 D896 41.9 ± 1.8 2.4 ± 0.2 39.5 ± 1.769
15.5 ± 0.5 D897 10.3 ± 0.3 2.3 ± 0.2 8.0 ± 0.4
20.5 ± 0.5 D898 3.7 ± 0.2 1.4 ± 0.1 2.3 ± 0.2
30.5 ± 0.5 D899 5.2 ± 0.2 2.8 ± 0.2 2.5 ± 0.3
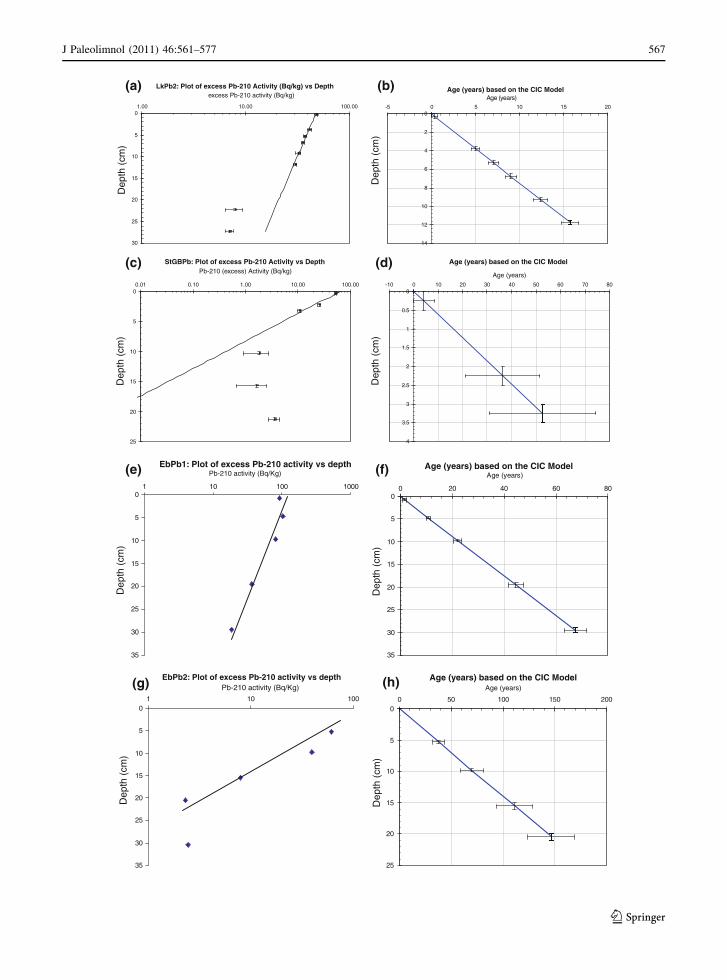
Fig. 4 Plot of the geochemical data showing excess 210Pb
activity plotted against core depth and age depth plot of the
normalised 210Pb against core depth using the CIC mode
respectively for: LkPb2 (a, b), StGBPb (c, d), EbPb1 (e, f), and
EbPb2 (g, h)
c
566 J Paleolimnol (2011) 46:561–577
123
LkPb2: Plot of excess Pb-210 Activity (Bq/kg) vs Depth
0
5
10
15
20
25
30
00.00100.0100.1
Dep
th (
cm)
excess Pb-210 activity (Bq/kg)Age (years) based on the CIC Model
0
2
4
6
8
10
12
14
-5 0 5 10 15 20
Dep
th (
cm)
Age (years)
(a)
(c)
(b)
StGBPb: Plot of excess Pb-210 Activity vs Depth
0
5
10
15
20
25
0.01 0.10 1.00 10.00 100.00
Pb-210 (excess) Activity (Bq/kg)
Dep
th (
cm)
Age (years) based on the CIC Model
0
0.5
1
1.5
2
2.5
3
3.5
4
-10 0 10 20 30 40 50 60 70 80
Age (years)
Dep
th (
cm)
(d)
(e) (f)
0
5
10
15
20
25
30
35
1 10 100 1000
Pb-210 activity (Bq/Kg)
Dep
th (
cm)
EbPb1: Plot of excess Pb-210 activity vs depth Age (years) based on the CIC Model
0
5
10
15
20
25
30
35
0 20 40 60 80
Age (years)
Dep
th (
cm)
EbPb2: Plot of excess Pb-210 activity vs depth
0
5
10
15
20
25
30
35
001011
Pb-210 activity (Bq/Kg)
Dep
th (
cm)
Age (years) based on the CIC Model
0
5
10
15
20
25
0 50 100 150 200
Age (years)
Dep
th (
cm)
(g) (h)
J Paleolimnol (2011) 46:561–577 567
123
226Ra data, which gives an indication of sediment
source, are presented in Table 2. The excess 210Pb
activities have been normalised using the measured
\62.5 lm grain size fraction of each 210Pb sample
(Haworth et al. 1999). Age-depth profiles were
calculated for each of the cores (Fig. 4).
Cesium-137
In the southern hemisphere the first detectable appear-
ance of this anthropogenic radionuclide is identified in
sediment profiles from 1955 (Leslie and Hancock
2008). Its distribution in sedimentary cores can exhibit
two maxima at ca 1958 and 1963 (Livens and Rimmer
1988; Walling and He 1992, 1997; Leslie and Hancock
2008). Samples were chemically processed using the
methods employed by the Environment Division
Laboratories at ANSTO (Haworth et al. 1999).
Amino acid racemisation
Amino acid racemisation is a biochemical dating
technique that is based on the chemical changes that
occur in proteins within carbonate shell following the
death of the organisms. Some of these chemical
changes are time-dependent and can provide the basis
for a chronological control based on the ratio of
levorotatory enantiomers that rotate plane-polarised
light to the left (exclusively utilized during life) and
dextrorotatory enantiomers (rotating plane-polarised
light to the right). This ratio (the D/L ratio) is
determined by the rate of racemisation of L enantio-
mers to the corresponding D enantiomers upon death
of an organism (Miller and Hare 1980; Miller and
Brigham-Grette 1989; Wehmiller and Miller 2000).
Aspartic acid, one of the fastest racemising amino
acids, is utilized to derive numeric ages over time
scales of decades to centuries (Goodfriend 1991,
1992; Goodfriend and Stanley 1996). This is an
interval of time that is difficult to date by more
established methods. 210Pb, for example, is applicable
only for the past 150 years and 14C dating of marine
shells may not uniquely define ages within the past
500 years when conventional radiocarbon ages are
expressed in sidereal years (i.e. the possibility of
multiple potential ages for one radiocarbon measure-
ment). Sloss et al. (2004b) highlighted the potential
for the aspartic acid dating method to ‘‘fill the gap’’
between radiocarbon and 210Pb dating.
In this study, the extent of aspartic acid racemi-
sation in the fossil molluscs Anadara trapezia,
Notospisula trigonella and Batillaria australis that
are commonly preserved in estuarine successions in
southeastern Australia have been used to establish
sedimentation rates for pre- and post-European
settlement (Sloss et al. 2005; Table 3). Sample
preparation and analytical techniques undertaken for
this study follow the procedures outlined in Murray-
Wallace and Kimber (1987), Murray-Wallace (1993)
and Sloss et al. (2004b, 2006). Average aspartic acid
D/L ratios for each sample analysed were based on at
least three replicate injections on a Hewlett-Packard
model 5890A series II Gas Chromatograph at the
Amino Acid Dating Laboratory, University of
Wollongong, Australia. Additional aspartic acid rac-
emisation derived ages have been determined by
re-calculating previously published results from Sloss
et al. (2005) using more precise calibration curves
(Sloss et al. 2006).
Radiocarbon age determinations
In this study five specimens of B. australis were dated
to provide a framework in which to assess the aspartic
acid racemisation rate in the epifauna gastropod (time
series experiment; Figs. 6, 7). AMS radiocarbon ages
were obtained from the Australian Nuclear Science and
Technology Organisation (ANSTO), Sydney, NSW.
The total radiocarbon dataset and their sources are
summarised in Table 5. Radiocarbon ages were cali-
brated to sidereal years using the radiocarbon calibra-
tion program CALIBTM REV5.0.1 (Stuiver and
Reimer 1993; Stuiver et al. 1998a, b). Calibration for
fossil molluscs used the marine model calibration
curve (Marine04) with a Dr value of 11 ± 85 year to
correct for the marine reservoir effect and convert ages
into sidereal years (expressed as cal year BP; Gillespie
1977; Gillespie and Polach 1979; Stuiver et al. 1998a,
b; Table 6).
Dating results
Lead-210
210Pb age-depth profiles were calculated for four of
the short cores (LkPb2, StGBPb1, EbPb1 and EbPb2;
Fig. 4). Each of these cores exhibited relatively
568 J Paleolimnol (2011) 46:561–577
123
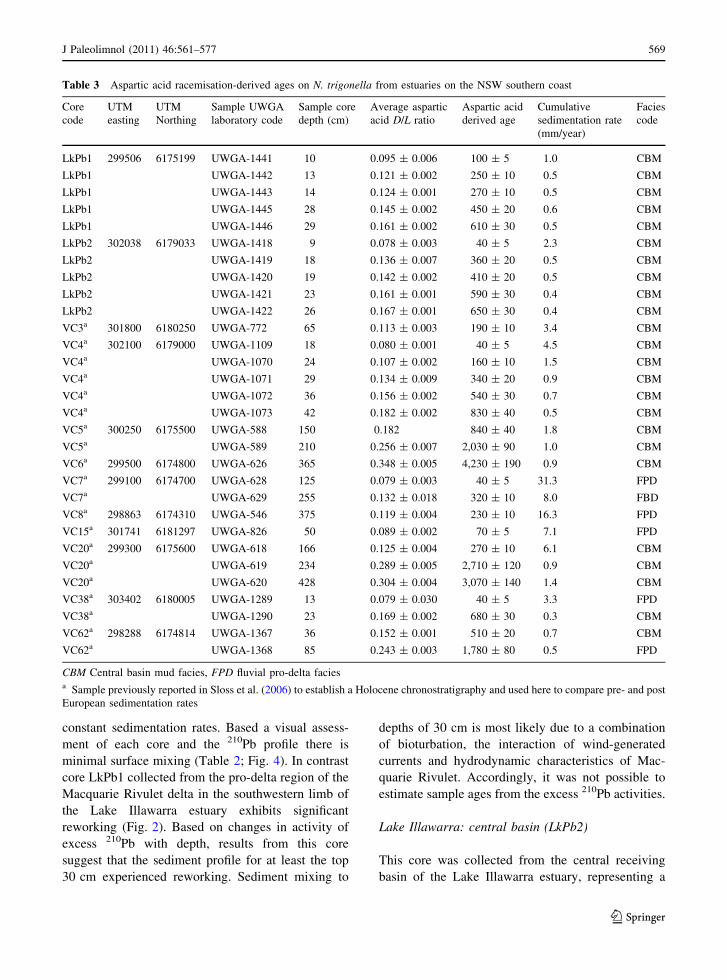
constant sedimentation rates. Based a visual assess-
ment of each core and the 210Pb profile there is
minimal surface mixing (Table 2; Fig. 4). In contrast
core LkPb1 collected from the pro-delta region of the
Macquarie Rivulet delta in the southwestern limb of
the Lake Illawarra estuary exhibits significant
reworking (Fig. 2). Based on changes in activity of
excess 210Pb with depth, results from this core
suggest that the sediment profile for at least the top
30 cm experienced reworking. Sediment mixing to
depths of 30 cm is most likely due to a combination
of bioturbation, the interaction of wind-generated
currents and hydrodynamic characteristics of Mac-
quarie Rivulet. Accordingly, it was not possible to
estimate sample ages from the excess 210Pb activities.
Lake Illawarra: central basin (LkPb2)
This core was collected from the central receiving
basin of the Lake Illawarra estuary, representing a
Table 3 Aspartic acid racemisation-derived ages on N. trigonella from estuaries on the NSW southern coast
Core
code
UTM
easting
UTM
Northing
Sample UWGA
laboratory code
Sample core
depth (cm)
Average aspartic
acid D/L ratio
Aspartic acid
derived age
Cumulative
sedimentation rate
(mm/year)
Facies
code
LkPb1 299506 6175199 UWGA-1441 10 0.095 ± 0.006 100 ± 5 1.0 CBM
LkPb1 UWGA-1442 13 0.121 ± 0.002 250 ± 10 0.5 CBM
LkPb1 UWGA-1443 14 0.124 ± 0.001 270 ± 10 0.5 CBM
LkPb1 UWGA-1445 28 0.145 ± 0.002 450 ± 20 0.6 CBM
LkPb1 UWGA-1446 29 0.161 ± 0.002 610 ± 30 0.5 CBM
LkPb2 302038 6179033 UWGA-1418 9 0.078 ± 0.003 40 ± 5 2.3 CBM
LkPb2 UWGA-1419 18 0.136 ± 0.007 360 ± 20 0.5 CBM
LkPb2 UWGA-1420 19 0.142 ± 0.002 410 ± 20 0.5 CBM
LkPb2 UWGA-1421 23 0.161 ± 0.001 590 ± 30 0.4 CBM
LkPb2 UWGA-1422 26 0.167 ± 0.001 650 ± 30 0.4 CBM
VC3a 301800 6180250 UWGA-772 65 0.113 ± 0.003 190 ± 10 3.4 CBM
VC4a 302100 6179000 UWGA-1109 18 0.080 ± 0.001 40 ± 5 4.5 CBM
VC4a UWGA-1070 24 0.107 ± 0.002 160 ± 10 1.5 CBM
VC4a UWGA-1071 29 0.134 ± 0.009 340 ± 20 0.9 CBM
VC4a UWGA-1072 36 0.156 ± 0.002 540 ± 30 0.7 CBM
VC4a UWGA-1073 42 0.182 ± 0.002 830 ± 40 0.5 CBM
VC5a 300250 6175500 UWGA-588 150 0.182 840 ± 40 1.8 CBM
VC5a UWGA-589 210 0.256 ± 0.007 2,030 ± 90 1.0 CBM
VC6a 299500 6174800 UWGA-626 365 0.348 ± 0.005 4,230 ± 190 0.9 CBM
VC7a 299100 6174700 UWGA-628 125 0.079 ± 0.003 40 ± 5 31.3 FPD
VC7a UWGA-629 255 0.132 ± 0.018 320 ± 10 8.0 FBD
VC8a 298863 6174310 UWGA-546 375 0.119 ± 0.004 230 ± 10 16.3 FPD
VC15a 301741 6181297 UWGA-826 50 0.089 ± 0.002 70 ± 5 7.1 FPD
VC20a 299300 6175600 UWGA-618 166 0.125 ± 0.004 270 ± 10 6.1 CBM
VC20a UWGA-619 234 0.289 ± 0.005 2,710 ± 120 0.9 CBM
VC20a UWGA-620 428 0.304 ± 0.004 3,070 ± 140 1.4 CBM
VC38a 303402 6180005 UWGA-1289 13 0.079 ± 0.030 40 ± 5 3.3 FPD
VC38a UWGA-1290 23 0.169 ± 0.002 680 ± 30 0.3 CBM
VC62a 298288 6174814 UWGA-1367 36 0.152 ± 0.001 510 ± 20 0.7 CBM
VC62a UWGA-1368 85 0.243 ± 0.003 1,780 ± 80 0.5 FPD
CBM Central basin mud facies, FPD fluvial pro-delta faciesa Sample previously reported in Sloss et al. (2006) to establish a Holocene chronostratigraphy and used here to compare pre- and post
European sedimentation rates
J Paleolimnol (2011) 46:561–577 569
123
low-energy depositional environment dominated by
the settling of fine-grained detritus from suspension
(Fig. 2). The relatively constant activity of 226Ra
down the core indicates one source of sediment (fine-
grained silty mud; Table 2). The data indicates that a
linear decrease in activity is present in the top 12 cm
of the core before reaching background levels for the
detection of excess 210Pb (Fig. 4a, b). The age/depth
profile indicates a relatively constant sedimentation
rate of 7.5 ± 0.5 mm/year for the top 12 cm of the
core which was deposited over the last 16 years
(Fig. 4a, b).
St Georges Basin: central basin (StGBPb)
A 25 cm core was collected from the central receiv-
ing basin of the St Georges Basin (Fig. 3) in a water
depth of 3 m in the vicinity of Sanctuary Point. This
region of the estuary represents a low-energy depo-
sitional environment dominated by the settling of
fine-grained detritus from suspension (Fig. 4c, d).
The age/depth profile indicates a relatively constant
sedimentation rate of 0.6 ± 0.3 mm/year for the top
8 cm which was deposited over the last 52 years
(Fig. 4c, d).
St Georges Basin: Erowal Bay (EbPb1)
A 30 cm core was collected from the bay in a water
depth of 80 cm (Fig. 3). The core was collected from
the pro-delta associated with the Worrowin Water-
way, an area within Erowal Bay that has a potential
for faster rates of sediment accumulation due to
adjacent extensive urban development (Fig. 3). The
plot of excess 210Pb indicates that sediments at a
depth of 30 cm in the core have not attained
background level, with excess 210Pb activity extend-
ing to a depth of 29.5 cm and displaying a linear
decrease in activity (Table 2; Fig. 4). The age/depth
profile indicates a relatively constant sedimentation
rate of 4.4 ± 0.9 mm/year for the top 30 cm depos-
ited over the last 65 years (Fig. 4e, f).
St Georges Basin: Erowal Bay (EbPb2)
A second 30 cm core was collected from Erowal Bay
in a water depth of 80 cm (Fig. 3). This core was
collected from the central basin of Erowal Bay away
from the pro-delta associated with Toomarong Creek
and the Worrowin Waterway (Fig. 3). The data for
samples above 20.5 cm represent a linear decrease in
excess 210Pb activity. The age/depth profile indicates
a relatively constant sedimentation rate of
1.4 ± 0.8 mm/year for the top 20.5 cm of the core
which was deposited over the last ca 147 years
(Fig. 4g, h).
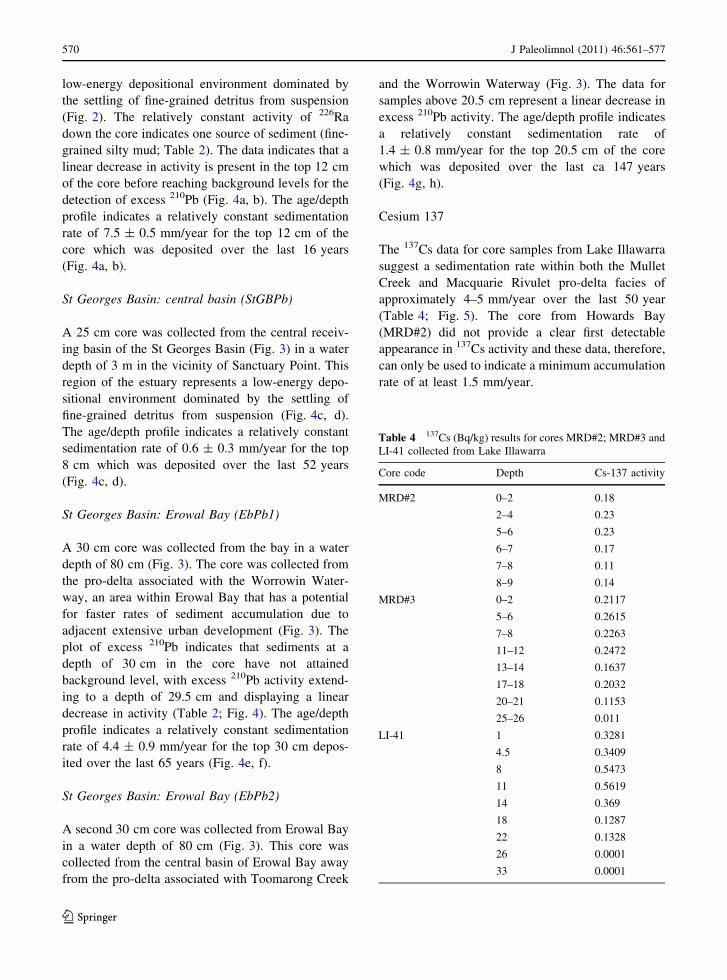
Cesium 137
The 137Cs data for core samples from Lake Illawarra
suggest a sedimentation rate within both the Mullet
Creek and Macquarie Rivulet pro-delta facies of
approximately 4–5 mm/year over the last 50 year
(Table 4; Fig. 5). The core from Howards Bay
(MRD#2) did not provide a clear first detectable
appearance in 137Cs activity and these data, therefore,
can only be used to indicate a minimum accumulation
rate of at least 1.5 mm/year.
Table 4 137Cs (Bq/kg) results for cores MRD#2; MRD#3 and
LI-41 collected from Lake Illawarra
Core code Depth Cs-137 activity
MRD#2 0–2 0.18
2–4 0.23
5–6 0.23
6–7 0.17
7–8 0.11
8–9 0.14
MRD#3 0–2 0.2117
5–6 0.2615
7–8 0.2263
11–12 0.2472
13–14 0.1637
17–18 0.2032
20–21 0.1153
25–26 0.011
LI-41 1 0.3281
4.5 0.3409
8 0.5473
11 0.5619
14 0.369
18 0.1287
22 0.1328
26 0.0001
33 0.0001
570 J Paleolimnol (2011) 46:561–577
123
Amino acid racemisation
Aspartic acid racemisation derived ages for sediment
cores from Lake Illawarra presented in this study
(Table 3) have been supplemented by aspartic acid
data previously reported in Sloss et al. (2004a, b).
However, in this study sample ages have been
calculated from the new and previously reported data
using more accurate calibration curves presented by
Sloss et al. (2006). The aspartic acid ages presented
in this study are for the uppermost, relatively recent
sedimentary succession preserved in the central basin
and fluvial pro-delta depositional environments. Ages
range from 40 cal year BP to mid Holocene
(Table 3). The Holocene geomorphological evolution
of the estuary is examined in detail in Sloss et al.
(2006), while in this study the data are used to
compare pre- and post-European sedimentation rates.
The results also include the first application of the
amino acid racemisation reaction observed in the
gastropod B. australis as a geochonological control
(Table 5).
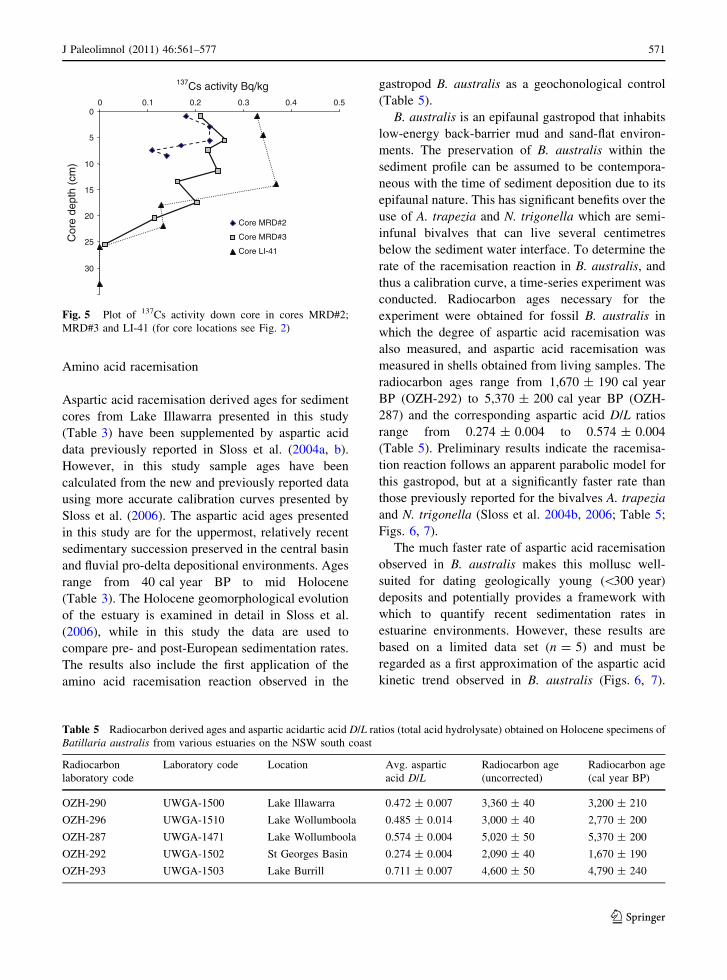
B. australis is an epifaunal gastropod that inhabits
low-energy back-barrier mud and sand-flat environ-
ments. The preservation of B. australis within the
sediment profile can be assumed to be contempora-
neous with the time of sediment deposition due to its
epifaunal nature. This has significant benefits over the
use of A. trapezia and N. trigonella which are semi-
infunal bivalves that can live several centimetres
below the sediment water interface. To determine the
rate of the racemisation reaction in B. australis, and
thus a calibration curve, a time-series experiment was
conducted. Radiocarbon ages necessary for the
experiment were obtained for fossil B. australis in
which the degree of aspartic acid racemisation was
also measured, and aspartic acid racemisation was
measured in shells obtained from living samples. The
radiocarbon ages range from 1,670 ± 190 cal year
BP (OZH-292) to 5,370 ± 200 cal year BP (OZH-
287) and the corresponding aspartic acid D/L ratios
range from 0.274 ± 0.004 to 0.574 ± 0.004
(Table 5). Preliminary results indicate the racemisa-
tion reaction follows an apparent parabolic model for
this gastropod, but at a significantly faster rate than
those previously reported for the bivalves A. trapezia
and N. trigonella (Sloss et al. 2004b, 2006; Table 5;
Figs. 6, 7).
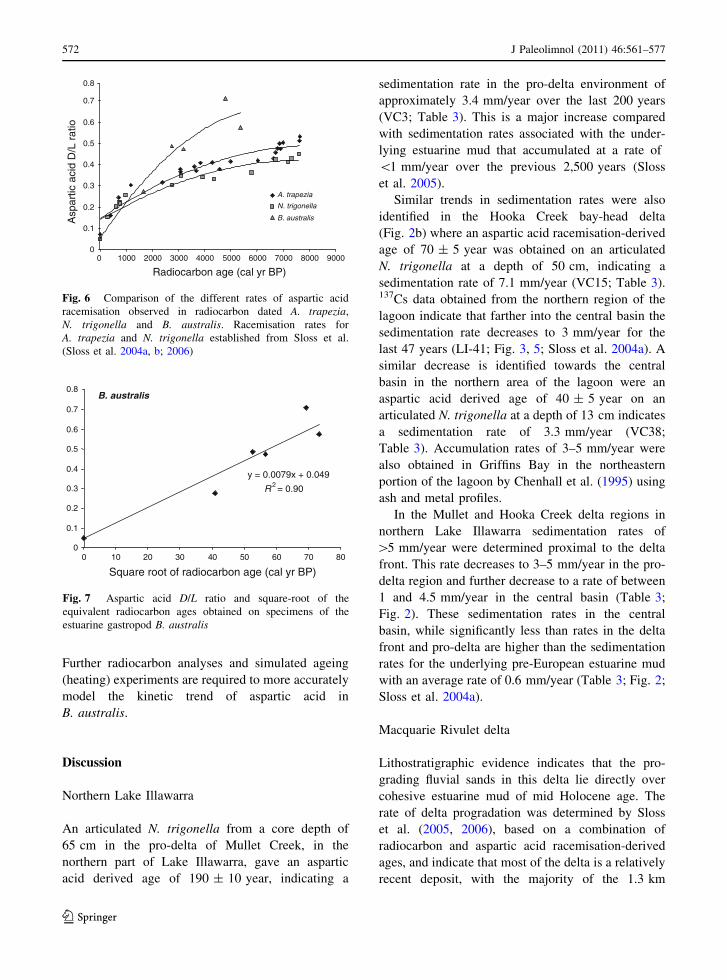
The much faster rate of aspartic acid racemisation
observed in B. australis makes this mollusc well-
suited for dating geologically young (\300 year)
deposits and potentially provides a framework with
which to quantify recent sedimentation rates in
estuarine environments. However, these results are
based on a limited data set (n = 5) and must be
regarded as a first approximation of the aspartic acid
kinetic trend observed in B. australis (Figs. 6, 7).
0
5
10
15
20
25
30
0 0.1 0.2 0.3 0.4 0.5
Core MRD#2
Core MRD#3
Core LI-41
137Cs activity Bq/kg C
ore
dept
h (c
m)
Fig. 5 Plot of 137Cs activity down core in cores MRD#2;
MRD#3 and LI-41 (for core locations see Fig. 2)
Table 5 Radiocarbon derived ages and aspartic acidartic acid D/L ratios (total acid hydrolysate) obtained on Holocene specimens of
Batillaria australis from various estuaries on the NSW south coast
Radiocarbon
laboratory code
Laboratory code Location Avg. aspartic
acid D/LRadiocarbon age
(uncorrected)
Radiocarbon age
(cal year BP)
OZH-290 UWGA-1500 Lake Illawarra 0.472 ± 0.007 3,360 ± 40 3,200 ± 210
OZH-296 UWGA-1510 Lake Wollumboola 0.485 ± 0.014 3,000 ± 40 2,770 ± 200
OZH-287 UWGA-1471 Lake Wollumboola 0.574 ± 0.004 5,020 ± 50 5,370 ± 200
OZH-292 UWGA-1502 St Georges Basin 0.274 ± 0.004 2,090 ± 40 1,670 ± 190
OZH-293 UWGA-1503 Lake Burrill 0.711 ± 0.007 4,600 ± 50 4,790 ± 240
J Paleolimnol (2011) 46:561–577 571
123
Further radiocarbon analyses and simulated ageing
(heating) experiments are required to more accurately
model the kinetic trend of aspartic acid in
B. australis.
Discussion
Northern Lake Illawarra
An articulated N. trigonella from a core depth of
65 cm in the pro-delta of Mullet Creek, in the
northern part of Lake Illawarra, gave an aspartic
acid derived age of 190 ± 10 year, indicating a
sedimentation rate in the pro-delta environment of
approximately 3.4 mm/year over the last 200 years
(VC3; Table 3). This is a major increase compared
with sedimentation rates associated with the under-
lying estuarine mud that accumulated at a rate of
\1 mm/year over the previous 2,500 years (Sloss
et al. 2005).
Similar trends in sedimentation rates were also
identified in the Hooka Creek bay-head delta
(Fig. 2b) where an aspartic acid racemisation-derived
age of 70 ± 5 year was obtained on an articulated
N. trigonella at a depth of 50 cm, indicating a
sedimentation rate of 7.1 mm/year (VC15; Table 3).137Cs data obtained from the northern region of the
lagoon indicate that farther into the central basin the
sedimentation rate decreases to 3 mm/year for the
last 47 years (LI-41; Fig. 3, 5; Sloss et al. 2004a). A
similar decrease is identified towards the central
basin in the northern area of the lagoon were an
aspartic acid derived age of 40 ± 5 year on an
articulated N. trigonella at a depth of 13 cm indicates
a sedimentation rate of 3.3 mm/year (VC38;
Table 3). Accumulation rates of 3–5 mm/year were
also obtained in Griffins Bay in the northeastern
portion of the lagoon by Chenhall et al. (1995) using
ash and metal profiles.
In the Mullet and Hooka Creek delta regions in
northern Lake Illawarra sedimentation rates of
[5 mm/year were determined proximal to the delta
front. This rate decreases to 3–5 mm/year in the pro-
delta region and further decrease to a rate of between
1 and 4.5 mm/year in the central basin (Table 3;
Fig. 2). These sedimentation rates in the central
basin, while significantly less than rates in the delta
front and pro-delta are higher than the sedimentation
rates for the underlying pre-European estuarine mud
with an average rate of 0.6 mm/year (Table 3; Fig. 2;
Sloss et al. 2004a).
Macquarie Rivulet delta
Lithostratigraphic evidence indicates that the pro-
grading fluvial sands in this delta lie directly over
cohesive estuarine mud of mid Holocene age. The
rate of delta progradation was determined by Sloss
et al. (2005, 2006), based on a combination of
radiocarbon and aspartic acid racemisation-derived
ages, and indicate that most of the delta is a relatively
recent deposit, with the majority of the 1.3 km
0.8
Radiocarbon age (cal yr BP)
0
0.1
0.2
0.3
0.4
0.5
0.6
0.7
2000 3000 4000 5000 6000 7000 8000 9000
Asp
artic
aci
d D
/L r
atio
A. trapezia
N. trigonella
B. australis
0 1000
Fig. 6 Comparison of the different rates of aspartic acid
racemisation observed in radiocarbon dated A. trapezia,
N. trigonella and B. australis. Racemisation rates for
A. trapezia and N. trigonella established from Sloss et al.
(Sloss et al. 2004a, b; 2006)
B. australis0.8
y = 0.0079x + 0.049
R 2 = 0.90
0
0.1
0.2
0.3
0.4
0.5
0.6
0.7
0 10 20 30 40 50 60 70 80
Square root of radiocarbon age (cal yr BP)
Fig. 7 Aspartic acid D/L ratio and square-root of the
equivalent radiocarbon ages obtained on specimens of the
estuarine gastropod B. australis
572 J Paleolimnol (2011) 46:561–577
123
extension into the lagoon occurring over the last
300 years (Fig. 2c). Recent delta progradation is also
supported by aspartic racemisation derived ages of
320 ± 10 year (VC7) and 230 ± 10 year (VC8) for
in situ specimens of articulated N. trigonella col-
lected from the pro-delta mud facies that sits
immediately beneath the fluvial bay-head delta
(Table 3).
Modern sedimentation rates proximal to the Mac-
quarie Rivulet pro-delta were also determined using a
combination of aspartic acid racemisation derived
ages and a 137Cs profile. Aspartic acid data for
N. trigonella indicate that post-European settlement
sedimentation rates close to the delta front can be as
high as 31.3–16.3 mm/year (VC7 and VC8; Table 3).
Previously reported 137Cs data for the active delta
margin deposits support these very high estimates and
gave an accumulation rate of at least 16 mm/year
(Chenhall et al. 1995). The 137Cs profile (MRD#3;
Figs. 2, 5; Table 4) obtained from Koona Bay, just
south of the active distributary, indicates a sedimen-
tation rate of approximately 4–5 mm/year. However,
the 137Cs profile in Haywards Bay (MRD#2; Figs. 2,
5), to the north of the main Macquarie Rivulet delta,
is incomplete and provides only an estimate of the
minimum modern sedimentation rate ([1.5 mm/year;
Figs. 2, 5). Sedimentation rates at the active pro-delta
front and farther into the central basin have also been
determined using aspartic acid racemisation derived
ages from in situ N. trigonella. These rates range
from 3.2 mm/year (VC7) in the pro-delta front to
1.8 mm/year in the central basin (VC5; Table 3).
The Lake Illawarra central mud basin facies
This facies is composed of very fine-grained grey/
black estuarine silty clay (avg. size = 0.005 mm),
with a high concentration of organic detritus charac-
teristic of anoxic environments. The silty mud
comprises fine-grained terrigenous detritus supplied
from the freshwater streams entering the estuary. The
fine-grained detritus would have rapidly flocculated
in the brackish to fully saline environment within the
estuaries (as it does at present) and not been flushed
from the system by circulating tidal currents.
N. trigonella dominate these strata and occur as a
life assemblage of dense shell beds, with abundant
articulated shells that indicate in situ preservation.
The relatively uninterrupted sediment supply and
minimal surface mixing makes the central basin mud
facies an ideal site to measure recent sedimentation.
The age/depth plot based on the excess 210Pb
profile indicates a higher sedimentation rate for the
top 12 cm of core LkPb2 (Fig. 4). This rate was
calculated to be 7.5 mm/year and indicates that the
top 12 cm was deposited over the last ca 16 years.
This rate of sedimentation is higher than the rate
established by amino acid racemisation dating on
N. trigonella from the central basin (between 2.0 and
4.5 mm/year; VC4, LkPb1; LkPb2; VC38; Table 3).
However, age determinations on fossil shells of this
bivalve represent a less precise age due to the semi-
infaunal habitat of the species. Sedimentation rates
may also be higher than indicated, as sediment that
the molluscs are preserved in may be older than the
fossil. However, as the molluscs used in this study are
epifaunal, this age discrepancy between sediment and
in situ fossils is regarded as minor. Despite a possible
underestimated sedimentation rate, the aspartic acid
determined sedimentation rates indicate a significant
increase in sedimentation within Lake Illawarra
compared to the underlying Holocene central basin
mud facies which accumulated at an average rate of
ca. 0.4 mm/year (Sloss et al. 2004a; Table 3).
St Georges Basin central basin mud facies
The 25 cm core collected from the central lagoon of
St Georges Basin (StGBPb1; Fig. 3; Table 2) pro-
vided excess 210Pb data for only the top 8 cm. The
age/depth profile indicates a relatively constant
sedimentation rate of 0.62 ± 0.25 mm/year over
approximately the last 52 years. A similar sedimen-
tation rate 0.5 mm/year is indicated by the aspartic
acid racemisation-derived age for B. australis at a
depth of 5 cm in the central basin (110 ± 5 year;
SGB4-H; Fig. 3; Table 6). This rate is the same as the
pre-European sedimentation rate based on aspartic
acid data (Table 6) and excess 210Pb data (Fig. 4);
and is similar to rates measured in the mid to late
Holocene estuarine muds in Lake Illawarra (0.4 mm/
year; Table 3). These data show that sedimentation in
this part of St Georges Basin has been relatively
constant over the last 500 years and probably since
the mid Holocene.
J Paleolimnol (2011) 46:561–577 573
123
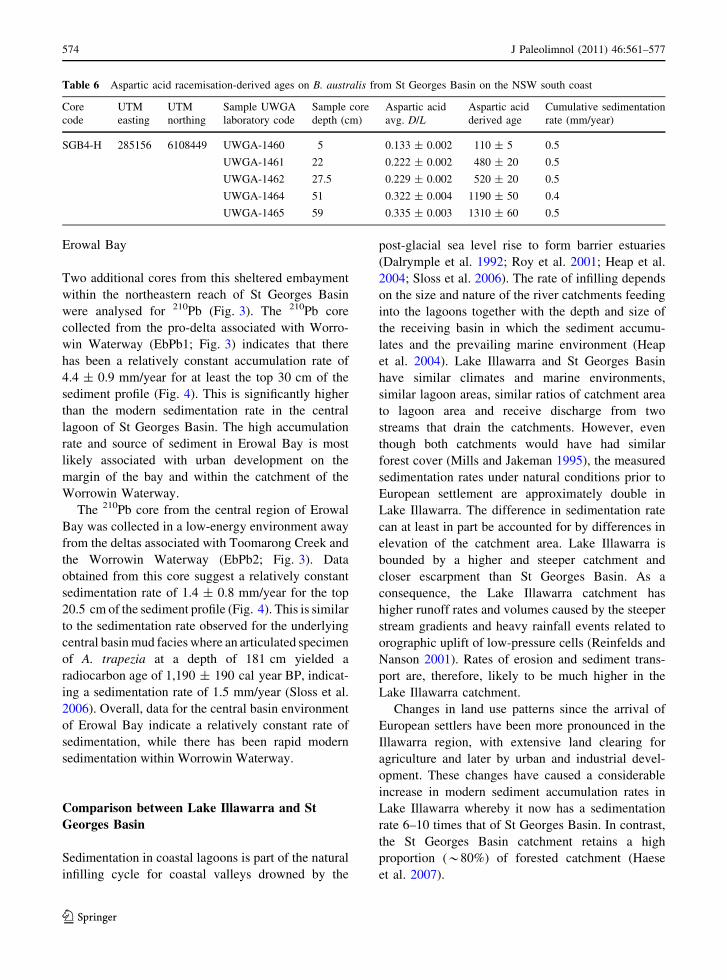
Erowal Bay
Two additional cores from this sheltered embayment
within the northeastern reach of St Georges Basin
were analysed for 210Pb (Fig. 3). The 210Pb core
collected from the pro-delta associated with Worro-
win Waterway (EbPb1; Fig. 3) indicates that there
has been a relatively constant accumulation rate of
4.4 ± 0.9 mm/year for at least the top 30 cm of the
sediment profile (Fig. 4). This is significantly higher
than the modern sedimentation rate in the central
lagoon of St Georges Basin. The high accumulation
rate and source of sediment in Erowal Bay is most
likely associated with urban development on the
margin of the bay and within the catchment of the
Worrowin Waterway.
The 210Pb core from the central region of Erowal
Bay was collected in a low-energy environment away
from the deltas associated with Toomarong Creek and
the Worrowin Waterway (EbPb2; Fig. 3). Data
obtained from this core suggest a relatively constant
sedimentation rate of 1.4 ± 0.8 mm/year for the top
20.5 cm of the sediment profile (Fig. 4). This is similar
to the sedimentation rate observed for the underlying
central basin mud facies where an articulated specimen
of A. trapezia at a depth of 181 cm yielded a
radiocarbon age of 1,190 ± 190 cal year BP, indicat-
ing a sedimentation rate of 1.5 mm/year (Sloss et al.
2006). Overall, data for the central basin environment
of Erowal Bay indicate a relatively constant rate of
sedimentation, while there has been rapid modern
sedimentation within Worrowin Waterway.
Comparison between Lake Illawarra and St
Georges Basin
Sedimentation in coastal lagoons is part of the natural
infilling cycle for coastal valleys drowned by the
post-glacial sea level rise to form barrier estuaries
(Dalrymple et al. 1992; Roy et al. 2001; Heap et al.
2004; Sloss et al. 2006). The rate of infilling depends
on the size and nature of the river catchments feeding
into the lagoons together with the depth and size of
the receiving basin in which the sediment accumu-
lates and the prevailing marine environment (Heap
et al. 2004). Lake Illawarra and St Georges Basin
have similar climates and marine environments,
similar lagoon areas, similar ratios of catchment area
to lagoon area and receive discharge from two
streams that drain the catchments. However, even
though both catchments would have had similar
forest cover (Mills and Jakeman 1995), the measured
sedimentation rates under natural conditions prior to
European settlement are approximately double in
Lake Illawarra. The difference in sedimentation rate
can at least in part be accounted for by differences in
elevation of the catchment area. Lake Illawarra is
bounded by a higher and steeper catchment and
closer escarpment than St Georges Basin. As a
consequence, the Lake Illawarra catchment has
higher runoff rates and volumes caused by the steeper
stream gradients and heavy rainfall events related to
orographic uplift of low-pressure cells (Reinfelds and
Nanson 2001). Rates of erosion and sediment trans-
port are, therefore, likely to be much higher in the
Lake Illawarra catchment.
Changes in land use patterns since the arrival of
European settlers have been more pronounced in the
Illawarra region, with extensive land clearing for
agriculture and later by urban and industrial devel-
opment. These changes have caused a considerable
increase in modern sediment accumulation rates in
Lake Illawarra whereby it now has a sedimentation
rate 6–10 times that of St Georges Basin. In contrast,
the St Georges Basin catchment retains a high
proportion (*80%) of forested catchment (Haese
et al. 2007).
Table 6 Aspartic acid racemisation-derived ages on B. australis from St Georges Basin on the NSW south coast
Core
code
UTM
easting
UTM
northing
Sample UWGA
laboratory code
Sample core
depth (cm)
Aspartic acid
avg. D/LAspartic acid
derived age
Cumulative sedimentation
rate (mm/year)
SGB4-H 285156 6108449 UWGA-1460 5 0.133 ± 0.002 110 ± 5 0.5
UWGA-1461 22 0.222 ± 0.002 480 ± 20 0.5
UWGA-1462 27.5 0.229 ± 0.002 520 ± 20 0.5
UWGA-1464 51 0.322 ± 0.004 1190 ± 50 0.4
UWGA-1465 59 0.335 ± 0.003 1310 ± 60 0.5
574 J Paleolimnol (2011) 46:561–577
123
The sedimentation rates determined for Lake
Illawarra and St Georges Basin in this study
complement data from previous studies in these and
other similar estuarine systems of the southeastern
coast of Australia. For example, sedimentation rates
for the pre-European central mud basin in Lake
Illawarra based on radiocarbon ages were determined
to be \1 mm/year, whereas post-European sedimen-
tation rates around the margins of the lagoon are
generally[5 mm/year (Chenhall et al. 2001). Using a
larger data base, Jones and Chenhall (2001) reported
pre-European sedimentation rates for the mud basin
ranging from 1.2 to 2 mm/year. The addition of
anthropogenic detritus into Lake Illawarra can also be
used to determine recent sedimentation rates when
the date of first released of the pollutant is known.
Trace metals from smelting and manufacturing and
fly ash from coal-burning power stations are cases in
point. In Lake Illawarra increases in trace element
abundance, especially in the northern and central
parts of the lagoon, show sedimentation rates of
3–5 mm/year over the past 70–90 years (Payne et al.
1997; Chenhall et al. 2001). Likewise fly ash
concentrations in the western and southwestern
portions of the lagoon indicate accumulation rates
of 11 to [16 mm/year associated with the extension
of Macquarie Rivulet delta as a result of increased
agriculture and urbanisation (Payne et al. 1997;
Chenhall et al. 1995, 2001).
Sediment has accumulated in the prodelta deposi-
tional environment near Wandandian Creek delta in
the western reach of St Georges Basin at a rate of
0.5 mm/year over the past 1,000 years with only a
minor increase to 0.6 mm/year (210Pb) over the past
20 years (Hopley and Jones 2006). The relatively low
accumulation rates probably reflect the influence of
extensive forest cover in the catchment and the
relatively large surface area of the basin over which
sedimentation may occur. Sedimentation rates
increase to about 3 mm/year closer to the active
delta front.
The results from this study indicate that the
uppermost portions of most sediment cores in all
these coastal lagoons show an increased rate of
sedimentation that is partly related to lower compac-
tion of the upper part of the sediment column and
partly a result of increased sediment runoff from the
catchments caused by recent land use changes.
Sedimentation can also vary spatially, especially
where there is a significant fluvial input to the
estuary. For example, sedimentation rates closer to
fluvial deltas in Lake Illawarra range between 5.1 and
[16 mm/year, while sedimentation rates within the
central basin are up to 7 mm/year. However, sedi-
ments deposited in the central basin comprise thixo-
tropic estuarine mud and have not undergone
significant compaction and dewatering over the last
two to three decades. This means that the apparent
recent sedimentation rates in all the central basins of
coastal lagoons are significantly higher than the long-
term average. However, taking into account likely
differential sediment compaction can provide a more
realistic comparison between the modern and pre-
European periods. Assuming a compaction rate of
5–25% (based on compaction rates (see Sloss et al.
2005, 2006) in the pre-European to late Holocene
sediment provides conservative modern sedimenta-
tion rates in these lagoons that range between 2 and
4.5 mm/year for the central basin estuarine muds
(Sloss 2005). This is still a significant increase in
sedimentation compared to the rates measured in the
pre-European deposits (0.4–0.8 mm/year) that are
less than 200 years old in this region.
In contrast, sedimentation rates in the central basin
of St Georges Basin appear to have remained very
similar to the pre-European rate. This may be in part
due to the largely intact native vegetation of the
catchment. However, in the Erowal Bay reach of St
Georges Basin sedimentation rates are up to 4.4 mm/
year compared to 0.5 mm in the pre-European period
(Table 3; Sloss et al. 2004a, b, 2006). This sedimen-
tation rate is similar to modern rates measured in
Lake Illawarra and is attributed to recent expansion
of the urban fringe of the northern bay.
Conclusions
The impacts of modern changes in catchment land use
on estuary sedimentation can be obtained from sedi-
ment cores dated using a range of methods. In this study
these data provide a chronostratigraphic framework for
modern estuary sedimentary deposits in southeastern
Australia that enable important comparisons to be
made of sedimentation rates over the last 100 years
with rates that occurred prior to European settlement.
Results indicate that in Lake Illawarra, which has a
heavily modified catchment, sedimentation rates close
J Paleolimnol (2011) 46:561–577 575
123
to fluvial deltas can be in excess of 16 mm/year, and
between 2 and 4 mm/year in the adjacent central basin,
approximately an order of magnitude greater than the
pre-European rates. Accordingly, results from this
study show that for this estuary, clearance of native
vegetation (forest) in the catchment, urban expansion
and development of heavy industry are factors linked
to accelerated sedimentation and more rapid fluvial
delta progradation.
In contrast, at St Georges Basin, where the
catchment retains approximately 80% of the native
forest cover, sedimentation rates in the central basin
appear to have remained close to those prior to
European settlement. However, sedimentation rates
in the urbanized margin of St Georges Basin are
relatively high (up to 4.4 mm/year). This rapid
modern sedimentation in the margin of the bay has
been detected in several other estuaries in the region,
including in central basins and bay-head deltas, and
appears proportional to the degree of land-use change
in the respective catchment areas.
Acknowledgments Financial and field work support for this
project was provided by the School of Earth and
Environmental Sciences and GeoQuest at the University of
Wollongong, an ARC Linkage Grant (LP0347365) in
conjunction with Shoalhaven City Council, an Australian
Institute of Nuclear Science and Engineering postgraduate
award and research award (02/069P). The 210Pb and 137Cs
analyses were conducted at the ANSTO Lucas Heights
Environmental Laboratory with the assistance of Jennifer
Harrison and Atun Zawadzki. The amino acid racemisation
measurements were undertaken in the University of
Wollongong AAR laboratory. This paper is a contribution to
IGCP Project 588 ‘‘Preparing for Coastal Change’’ and INQUA
working group on ‘‘Coastal and Marine Processes’’.
References
Bradshaw BE (1987) St Georges Basin—morphology and late
quaternary deposits. BSc Honours thesis, University of
Sydney, Sydney (unpublished)
Bradshaw BE (1993) Late quaternary evolution of the St
Georges Basin barrier—estuary system. In: Thomas MC
(ed) Catchments and coasts in eastern Australia. Depart-
ment of Geography, University of Sydney, Research
Monograph 5, Sydney, pp 60–71
Brooke B (2003) The role of sedimentological information in
estuary management. Proceedings of coast to coast
2002—‘‘source to sea’’, Tweed Heads, pp 31–34
Chenhall BE, Batley GE, Yassini I, Depers AM, Jones BG
(1994) Ash distribution and metal contents of Lake
Illawarra bottom sediments. Aust J Mar Freshw Res
45:977–992
Chenhall BE, Yassini I, Depers AM, Caitcheon G, Jones BG,
Batley GE, Ohmsen GS (1995) Anthropogenic marker
evidence for accelerated sedimentation in Lake Illawarra,
New South Wales, Australia. Environ Geol 26:124–135
Chenhall BE, Jones BG, Depers AM (2001) Trace-metal pol-
lution and sedimentation in coastal lagoons: an example
from Lake Illawarra, New South Wales, Australia. In:
Gostin VA (ed) Gondwana to greenhouse: Australian
environmental geoscience. Geological society of Austra-
lian special publication 21, pp 227–233
Chenhall BE, Jones BG, Sloss CR, O’Donnell M, Payne M,
Murrie M, Garnett D, Waldron H (2004) Trace metals in
sediments from Lake Illawarra, New South Wales, Aus-
tralia. Wetlands (Australia) 21:198–208
Costanza R, d’Arge R, de Groot R, Farber S, Grasso M,
Hannon B, Limburg K, Naeem S, O’Neill R, Paruelo J,
Raskin R, Sutton P, Van den Belt M (1997) The value of
the world’s ecosystem services and natural capital. Nature
387:253–260
Dalrymple RW, Zaitlin BA, Boyd R (1992) Estuarine facies
models; conceptual basis and stratigraphic implications.
J Sediment Petrol 62:1130–1146
Gillespie R (1977) Sydney university natural radiocarbon
measurements IV. Radiocarbon 19:101–110
Gillespie R, Polach HA (1979) The suitability of marine shells
for radiocarbon dating of Australian prehistory. In: Berger
R, Suess H (eds) Proceedings of the 9th international
conference on radiocarbon. University of California Press,
Los Angeles, pp 404–421
Goodfriend GA (1991) Patterns of racemization and epimer-
ization of amino acids in land snail shells over the course
of the Holocene. Geoch Cosmoch Acta 55:293–302
Goodfriend GA (1992) Rapid racemization of aspartic acid in
mollusc shells and potential for dating over recent cen-
turies. Nature 357:399–401
Goodfriend GA, Stanley DJ (1996) Reworking and disconti-
nuities in Holocene sedimentation in the Nile delta: doc-
umentation from amino acid racemization and stable
isotopes in mollusk shell. Mar Geol 129:271–283
Haese RR, Murray EJ, Smith CS, Smith J, Clementson L,
Heggie DT (2007) Diatoms control nutrient cycles in a
temperate, wave-dominated estuary (southeast Australia).
Limnol Oceanogr 52:2686–2700
Hagan J, Wells A (1997) A history of Wollongong. University
of Wollongong Press, Wollongong, pp 23–71
Haworth RJ, Gale SJ, Short SA, Heijnis H (1999) Land use and
lake sedimentation on the New England tablelands of
New South Wales, Australia. Aust Geogr 30:51–73
Heap AD, Bryce S, Ryan DA (2004) Facies evolution of
Holocene estuaries and deltas: a large-sample statistical
study from Australia. Sediment Geol 168:1–17
Hopley CA, Jones BG (2006) Holocene stratigraphic and
morphological evolution of the Wandandian Creek delta,
St Georges Basin, New South Wales. Aust J Earth Sci
53:991–1000
Hopley CA, Jones BG, Puotinen M (2007) Assessing the recent
(1834–2002) morphological evolution of a rapidly pro-
grading delta within a GIS framework: Macquarie Rivulet
576 J Paleolimnol (2011) 46:561–577
123
delta, Lake Illawarra, New South Wales. Aust J Earth Sci
54:1047–1056
Jones BG, Chenhall BE (2001) Lagoonal and estuarine sedi-
mentation during the past 200 years. In: Heijnis H, Harle
K (eds) Archives of human impact of the last 200 years.
Australian Institute for Nuclear Science and Engineering
Workshop, Lucas Heights, pp 42–46
Jones BG, Eliot IG, Depers AM (1976) Sedimentation in Lake
Illawarra. In: Lake Illawarra environmental assessment
project, Wollongong City Council, pp 20–40, 147–148
Krishnaswamy S, Lal D, Martin JM, Meybeck M (1971)
Geochronology of lake sediments. Earth Planet Sci Lett
11:407–414
Leslie C, Hancock GJ (2008) Estimating the date correspond-
ing to the horizon of the first detection of 137Cs and
239 ? 240Pu in sediment cores. J Environ Radioact
99:483–490
Livens FR, Rimmer DL (1988) Pysico-chemical controls on
artificial radionuclides in soil. Soil Use Manag 4:63–69
Miller GH, Brigham-Grette J (1989) Amino acid geochronol-
ogy: resolution and precision in carbonate fossils. Quat Int
1:111–128
Miller GH, Hare PE (1980) Amino acid geochronology:
integrity of the carbonate matrix and potential of mol-
luscan fossils. In: Hare PE, Hoeing TC, King K (eds)
Biochemistry of amino acids: selected papers. Wiley, New
York, pp 415–451
Mills K, Jakeman J (1995) Rainforests of the Illawarra District.
Coachwood Publishing, Jamberoo
Murray-Wallace CV (1993) A review of the application of the
amino acid racemisation reaction to archaeological dating.
Artefact 16:19–26
Murray-Wallace CV, Kimber RWL (1987) Evaluation of the
amino acid racemization reaction in studies of quaternary
marine sediments in South Australia. Aust J Earth Sci
34:279–292
Payne M, Chenhall BE, Murrie M, Jones BG (1997) Spatial
variation of sediment-bound zinc, lead, copper and
rubidium in Lake Illawarra, a coastal lagoon in eastern
Australia. J Coast Res 13:1181–1191
Reinfelds I, Nanson GC (2001) Torrents of terror: magnitude,
frequency and impact of major storms and floods, Illa-
warra, New South Wales. Aust Geogr Stud 39:335–352
Robinson J (2001) The economic value of Australia’s estuar-
ies—a scoping study, OzCoasts. http://www.ozcoasts.org.
au/pdf/CRC/economic_value_estuaries.pdf
Roy PS, Peat C (1975) Bathymetry and bottom sediments of
Lake Illawarra. Geol Surv NSW Rec 17:65–79
Roy PS, Williams RJ, Jones AR, Yassini I, Gibbs PJ, Coates B,
West RJ, Scanes PR, Hudson JP, Nichol S (2001) Struc-
ture and function of south-east Australian estuaries. Estuar
Coast Shelf Sci 53:351–384
Sloss CR (2005) Holocene sea-level change and the aminos-
tratigraphy of wave-dominated barrier estuaries on the
southeast coast of Australia. Unpublished PhD thesis,
University of Wollongong. http://ro.uow.edu.au/theses/
447/
Sloss CR, Jones BG, Murray-Wallace CV, Chenhall BE
(2004a) Recent sedimentation and geomorphological
changes, Lake Illawarra, NSW, Australia. Wetlands
(Aust) 21:73–83
Sloss CR, Murray-Wallace CV, Jones BG, Wallin T (2004b)
Aspartic acid racemisation dating of mid-Holocene to
recent estuarine sedimentation in New South Wales,
Australia: a pilot study. Mar Geol 212:45–59
Sloss CR, Jones BG, Murray-Wallace CV, McClennen CE
(2005) Holocene sea level fluctuations and the sedimen-
tary evolution of a barrier estuary: Lake Illawarra, New
South Wales, Australia. J Coast Res 21:943–959
Sloss CR, Murray-Wallace CV, Jones BG (2006) Aminostra-
tigraphy of two Holocene wave-dominated barrier estu-
aries in southeastern Australia. J Coastal Res 22:113–136
Sloss CR, Murray-Wallace CV, Jones BG (2007) Holecene
sea-level change on the southeast coast of Australia: a
review. Holocene 17:1001–1016
Smith JN (2001) Why should we believe 210Pb sediment
geochronologies? J Environ Radioact 55:121–123
Stuiver M, Reimer PJ (1993) Extended 14C data base and
revised CALIB 3.0 14C calibration program. Radiocarbon
35:215–230
Stuiver M, Reimer PJ, Braziunas TF (1998a) High-precision
radiocarbon age calibration for terrestrial and marine
samples. Radiocarbon 40:1127–1151
Stuiver M, Reimer PJ, Bard E, Beck JW, Burr GS, Hughen KA,
Kromer B, McCormac FG, Plicht J, Spurk M (1998b)
INTCAL98 Radiocarbon age calibration, 24,000–0 cal
BP. Radiocarbon 40:1127–1151
Umitsu M, Buman M, Kawase K, Woodroffe CD (2001)
Holocene palaeoecology and formation of the Shoalhaven
River deltaic-estuarine plains, southeast Australia. Holo-
cene 11:407–418
Walling DE, He Q (1992) Interpretation of caesium-137 pro-
files in lacustrine and other sediments: the role of catch-
ment-derived inputs. Hydrobiologia 235/236:219–230
Walling DE, He Q (1997) Use of fallout 137Cs in investiga-
tions of overbank sediment deposits on river floodplains.
Cantena 29:263–282
Wehmiller JF, Miller G (2000) Aminostratigraphic dating
methods in Quaternary geology. In: Moller JS, Sowere
JM, Lettis WR (eds) Quaternary geochronology: methods
and applications. American Geophysical Union, Wash-
ington, DC, pp 187–222
J Paleolimnol (2011) 46:561–577 577
123