Modelling wildebeest population dynamics: implications of predation and harvesting in a closed...
11
Journal of Applied Ecology 2005 42, 431– 441 © 2005 British Ecological Society Blackwell Publishing, Ltd. Modelling wildebeest population dynamics: implications of predation and harvesting in a closed system CRAIG J. TAMBLING and JOHAN T. DU TOIT Mammal Research Institute, Department of Zoology and Entomology, University of Pretoria, Pretoria 0002, South Africa Summary 1. Predation upon ungulates is generally considered to have a stronger regulatory effect on sedentary than migratory populations, with migratory populations maintaining higher densities. The blue wildebeest Connochaetus taurinus is a migratory species that has suffered a general decline in numbers and distribution across its species range. Wildebeest suffer from a fragmented distribution together with isolation of populations in closed reserves, preventing migratory movements and potentially allowing predators to benefit from a ‘captive’ prey resource. 2. In Pilanesberg National Park, South Africa, the declining blue wildebeest population (from 1074 in 1995 to 594 in 2001) is sedentary because the park (50 000 ha) is completely enclosed by fencing. This population was used to model the potential effects of predation and harvesting. The Pilanesberg population was then compared with other wildebeest populations in southern Africa. 3. The model outputs demonstrated that increased levels of predation by lions Panthera leo on a ‘captive’ population of prey such as wildebeest, in combination with regular harvesting by park managers, can drive the population towards extinction. At lower levels of predation some other factor needs to act in combination with predation to drive the population into a decline. 4. During our study the lion biomass density in Pilanesberg was almost three times greater than that predicted by regression models of the stable relationship between lion and prey biomass densities across African savannas. Furthermore, the ratio of lion numbers to prey numbers was substantially higher than in most other African reserves. 5. Synthesis and applications. In African savannas, artificial closed systems provide advantages to large predators. If wildlife-cropping schemes are implemented in such systems without careful monitoring and regulation of large predators, then ungulate populations can decline more rapidly than managers expect. Key-words: Connochaetus taurinus, lion density, lion predation, migratory and sedentary ungulates, prey density, wildlife cropping Journal of Applied Ecology (2005) 42, 431– 441 doi: 10.1111/j.1365-2664.2005.01039.x Introduction Historically, many grassland regions of the world sup- ported vast herds of migratory ungulates. Although most migratory ungulate populations have become reduced in abundance and range, mainly because of overhunting, they still often occur in much higher densities than can be attained by conspecific sedentary populations (Fryxell & Sinclair 1988). The reasons are unclear but Fryxell, Greever & Sinclair (1988) proposed that migratory populations benefit from (i) escaping year-round pre- dation by migrating out of the territories of large resident predators and (ii) responding to seasonal and spatial heterogeneity in food quality. Populations of both sedentary and migratory wilde- beest Connochaetus taurinus still persist in various parts of the African savanna biome, although both population types have suffered declines in various parts of the spe- cies’ range. The resident wildebeest population of the Correspondence: Craig J. Tambling, Mammal Research Institute, Department of Zoology and Entomology, University of Pretoria, Pretoria 0002, South Africa (e-mail [email protected]).
Transcript of Modelling wildebeest population dynamics: implications of predation and harvesting in a closed...
Journal of Applied Ecology
2005
42
, 431–441
© 2005 British Ecological Society
Blackwell Publishing, Ltd.
Modelling wildebeest population dynamics: implications of predation and harvesting in a closed system
CRAIG J. TAMBLING and JOHAN T. DU TOIT
Mammal Research Institute, Department of Zoology and Entomology, University of Pretoria, Pretoria 0002, South Africa
Summary
1.
Predation upon ungulates is generally considered to have a stronger regulatory effecton sedentary than migratory populations, with migratory populations maintaininghigher densities. The blue wildebeest
Connochaetus taurinus
is a migratory species thathas suffered a general decline in numbers and distribution across its species range.Wildebeest suffer from a fragmented distribution together with isolation of populationsin closed reserves, preventing migratory movements and potentially allowing predatorsto benefit from a ‘captive’ prey resource.
2.
In Pilanesberg National Park, South Africa, the declining blue wildebeest population(from 1074 in 1995 to 594 in 2001) is sedentary because the park (50 000 ha) is completelyenclosed by fencing. This population was used to model the potential effects of predationand harvesting. The Pilanesberg population was then compared with other wildebeestpopulations in southern Africa.
3.
The model outputs demonstrated that increased levels of predation by lions
Pantheraleo
on a ‘captive’ population of prey such as wildebeest, in combination with regularharvesting by park managers, can drive the population towards extinction. At lower levelsof predation some other factor needs to act in combination with predation to drive thepopulation into a decline.
4.
During our study the lion biomass density in Pilanesberg was almost three timesgreater than that predicted by regression models of the stable relationship between lionand prey biomass densities across African savannas. Furthermore, the ratio of lionnumbers to prey numbers was substantially higher than in most other African reserves.
5.
Synthesis and applications.
In African savannas, artificial closed systems provideadvantages to large predators. If wildlife-cropping schemes are implemented in suchsystems without careful monitoring and regulation of large predators, then ungulatepopulations can decline more rapidly than managers expect.
Key-words
:
Connochaetus taurinus
, lion density, lion predation, migratory and sedentaryungulates, prey density, wildlife cropping
Journal of Applied Ecology
(2005)
42
, 431–441doi: 10.1111/j.1365-2664.2005.01039.x
Introduction
Historically, many grassland regions of the world sup-ported vast herds of migratory ungulates. Although mostmigratory ungulate populations have become reducedin abundance and range, mainly because of overhunting,they still often occur in much higher densities than can
be attained by conspecific sedentary populations (Fryxell& Sinclair 1988). The reasons are unclear but Fryxell,Greever & Sinclair (1988) proposed that migratorypopulations benefit from (i) escaping year-round pre-dation by migrating out of the territories of large residentpredators and (ii) responding to seasonal and spatialheterogeneity in food quality.
Populations of both sedentary and migratory wilde-beest
Connochaetus taurinus
still persist in various partsof the African savanna biome, although both populationtypes have suffered declines in various parts of the spe-cies’ range. The resident wildebeest population of the
Correspondence: Craig J. Tambling, Mammal ResearchInstitute, Department of Zoology and Entomology, Universityof Pretoria, Pretoria 0002, South Africa (e-mail [email protected]).
432
C. J. Tambling & J. T. du Toit
© 2005 British Ecological Society,
Journal of Applied Ecology
,
42
, 431–441
Masai Mara ecosystem declined by 81% from 119 000in 1977 to 22 000 in 1997 (Ottichilo, de Leeuw & Prins2001). The migratory population in Botswana declinedby 90% in the early 1980s because of veterinary fences,hunting and competition with livestock (Spinage 1992).In the Kruger National Park, the western boundarysubpopulation suffered an 87% decline between 1965and 1979 as a result of a veterinary fence restrictingthem to half their original range (Whyte 1985; Whyte &Joubert 1988). The Etosha wildebeest population declinedfrom 25 000 to 2500 between 1954 and 1978 because of ananthrax epidemic and elevated predation rates arisingfrom the abundance of weak animals (Berry 1981a,b).
The wildebeest population in Pilanesberg NationalPark in South Africa declined by 47% between 1997and 2001. There are a number of possible explanationsfor the decline. First, an increase in predator numbersassociated with wildebeest harvesting could have causedthe decline (Starfield, Smuts & Shiell 1976). Secondly,the decline may have been related to nutritional factorsdependent on intra-annual rainfall patterns, such asdry season rainfall (Mduma, Sinclair & Hilborn 1999).Thirdly, wildebeest numbers are negatively correlatedwith annual rainfall in Kruger (Smuts 1978; Whyte 1985;Mills, Biggs & Whyte 1995) and so the Pilanesberg declinemay have been a lagged response to rainfall patterns,such as wet–dry cycles.
Many protected areas in Africa are under increasingpressure to supply meat to local human communities,both through traditional subsistence hunting (Pascual& Hilborn 1995) and quota harvesting (Pascual, Kareiva& Hilborn 1997). In addition many small reserves, andeven some large ones, actively manage their large mammalcommunities to achieve a mix of charismatic speciesthat appeal to the tourist market. However, the inter-actions between management interventions and naturalecosystem processes (many of which are stochastic) needto be evaluated whenever an adequate set of monitor-ing data becomes available, and models allow this to bedone relatively quickly (Starfield, Smuts & Shiell 1976).Models are often best utilized when follow-up studiescan be undertaken to help answer questions that ariseas a result of model development.
Even within protected areas managers need to beaware that wildebeest populations can undergo rapiddeclines through natural processes and/or anthropogenicsources. There is a need to understand how sedentarywildebeest populations respond to harvesting andnatural predation, because protected areas are increas-ingly becoming closed systems as a result of fencing and/or habitat loss outside. In this study we investigated therecent decline of the Pilanesberg wildebeest populationby modelling the effects (in isolation and in combination)of natural predation and harvesting by management.We compared the Pilanesberg data with that from othersouthern African wildebeest populations, and used thePilanesberg case study to gain further insights into theeffects of predation and harvesting on sedentary wilde-beest populations.
Methods
Pilanesberg National Park (25
°
8
′
S
−
25
°
22
′
S, 26
°
57
′
E
−
27
°
13
′
E) is a 50 000-ha circular reserve situated in theremains of an extinct volcano (Slotow & van Dyk 2001)in the North-west Province, South Africa. The moistsavanna vegetation consists of
Acacia
spp. (mainly
Acaciamellifera
and
Acacia tortilis
), broad-leaf bushveld (notably
Combretum
spp.) and pediment grasslands (Brockett2002). Pilanesberg has an average rainfall of 624 mmyear
−
1
, mostly falling in the summer months. The dryperiod between April and September contributes
c.
11% of the annual rainfall. The monthly rainfall figuresused in our study were obtained from six recordingstations. For each year (1984–2001) the rainfall in that andthe previous 2 years was averaged over the six stationsto derive a 3-year running mean. If the rainfall data for1 month were missing from a station, the entire year forthat station was removed from the analysis.
Wildebeest introductions took place in 1978 and 1979.In 1983 the park management reduced the populationby 67% to allow a natural population increase to takeplace. Since 1982 an annual aerial count has beenconducted during August and September for all largemammal populations in Pilanesberg (Brockett 2002).Harvesting of various ungulate populations takes placefrom October, after the completion of aerial counting.Annual population estimates (
n
) and numbers of wilde-beest harvested each year were obtained from Pilanesbergpark records and the population trend was plotted from1984 to 2002. The observed rate of population change wasdetermined for an increasing phase (1984–95) and adecreasing phase (1995–2002). The observed rate of popu-lation change was estimated from the slope of a regressionof log
n
against time (
t
) in years (Caughley & Birch 1971).During September 2002, before the onset of the
spring rains, all wildebeest encountered when drivingsystematically on all accessible roads in Pilanesbergwere scanned through binoculars (8 40) or a spottingscope (20
×
). Each individual was aged and sexed only ifit could be observed clearly enough to obtain a definiteclassification. Departure from parity in the sex ratio ofadults was tested for using a chi-squared test. Age–sexclassification was based on Attwell (1980), Skinner &Smithers (1990) and Estes (1991).
Three social groupings were identified: territorialmales, breeding herds and bachelor herds. Territorialmales are single individuals maintaining a territory.Breeding herds consist of a territorial male, breedingfemales and associated calves and yearlings. Bachelorherds consist of non-territorial males. During the fieldobservations the body condition of territorial andbachelor herd males was scored visually as good, mediumor poor (Riney 1960).
433
Wildebeest population dynamics
© 2005 British Ecological Society,
Journal of Applied Ecology
,
42
, 431–441
Lions
Panthera leo
are the dominant large predators inPilanesberg, having been reintroduced in 1993. The ageand sex of each individual lion was extracted from liongenealogy records maintained by the Pilanesberg man-agement. All births, introductions, deaths and removalsof lions were recorded, enabling all individuals alive atthe end of each year to be counted, and the age and sexstructure of the population to be determined for eachyear. Regression analysis was undertaken to determineif variation in observed lion numbers (total, total adultsand adult females) could explain the variation in observedwildebeest numbers between 1995 and 2001.
A population model based on that of Starfield, Smuts& Shiell (1976) was developed to determine whichfactors could be driving the decline in the Pilanesbergwildebeest population. The model simulates the popu-lation size and structure near the end of the calving sea-son. Pilanesberg has had a harvesting programme formost ungulates since the park’s inception in 1979. Weassumed that wildebeest of all age classes and bothsexes are harvested (cropped) in equal proportions.The cropping rate (
c
t
) was calculated as the proportionof animals removed from the wildebeest populationfollowing the aerial census.
Predation was included in the model for all yearsafter 1993 and all wildebeest mortality from predatorswas assumed to be from lions. For simplicity we assumedthat lions take equal proportions of all age and sex classes(Mills & Shenk 1992). The proportion of wildebeestkilled at a time
t
+ 1 is expressed as:
p
t
+
1
=
(
γ
×
l
t
)/
w
t
eqn 1
where
γ
is the number of wildebeest taken per adult lionper year, and
l
t
and
w
t
are the number of adult lion andwildebeest in the reserve at time
t
, respectively.The model tracks changes in four age classes at time
t
: juveniles (
j
t
), yearlings (
y
t
), 2-year-olds (
d
t
) andadults (
a
t
). The numbers of each age class at time
t
+ 1is then calculated to determine the total population at
t
+ 1.The number of calves in year
t
+ 1 is a result of repro-duction of both adult females and 2-year-old femalesand can be expressed by:
j
t
+
1
=
(
a
t
b
a
)
+
(
d
t
b
t
) eqn 2
where
b
a
is the reproductive rate of adults and
b
t
is thereproductive rate of 2-year-olds.
The number of yearlings at
t
+ 1 is dependent on thecalf survival rate from the previous year. The number ofyearlings can be calculated by:
y
t
+
1
=
(
j
t
β
j
)
×
(1
−
c
t
) eqn 3
before the introduction of lions and
y
t
+
1
=
(
j
t
β
j
)
×
(1
−
(
p
t
+
c
t
)) eqn 4
after the introduction of lions, where
β
j
is the calf sur-vival rate and
c
t
is the proportion of calves cropped.The 2-year-olds that survive from the yearling group
minus the proportion lost to both cropping and preda-tion determine the 2-year-old population size at
t
+ 1:
d
t
+
1
=
(
y
t
β
y
)
×
(1
−
c
t
) eqn 5
before the introduction of lions and
d
t
+
1
=
(
y
t
β
y
)
×
(1
−
(
p
t
+
c
t
)) eqn 6
after the introduction of lions, where
β
y
is the survivalrate of the yearlings. Mortality that is not the result ofpredation includes death from fence electrocution,fighting and poaching.
The adults at time
t
+ 1 are those surviving adultsand 2-year-olds after accidental deaths have occurredminus the proportions lost to cropping and lions:
a
t
+
1
= ((atβa) × (1 − ct)) + ((dtβt) × (1 − ct)) eqn 7
before the introduction of lions and
at+1 = ((atβa) × (1 − ( pt + ct))) + ((dtβt) × (1 − ( pt + ct)))eqn 8
after the introduction of lions. Survival of adults and 2-year-olds independent of predation by lions is given byβa and βt, respectively.
Wildebeest population data were limited for Pilanes-berg and predation on wildebeest was not specificallymonitored in the park. Nevertheless, accurate lionnumbers were obtained from genealogical records,which are well maintained in Pilanesberg. We assumedthat each adult Pilanesberg lion kills two to four wilde-beest per year, as in the Kruger ecosystem (Starfield,Smuts & Shiell 1976; Peel & Montagu 1999). We sim-ulated both low and high kill rates to investigate howdiffering predation pressure may affect the wildebeestpopulation. It is feasible that each lion removes fourwildebeest per year because of the enclosed and there-fore more sedentary and (presumably) vulnerable natureof the population in comparison with Kruger. Predationwas assumed to be even across age classes, excludingcalves (Starfield, Smuts & Shiell 1976; Mills & Shenk1992). Predation on calves was incorporated into thecalf survival rates. The proportion of the wildebeestpopulation removed by management each year wascalculated from the Pilanesberg harvesting records andaerial census data. All analyses involving lions used thenumber of adult and subadult lions, i.e. those capableof killing and consuming wildebeest.
Equal age distribution across sexes was assumed forwildebeest cohorts less than 2 years of age, after which
434C. J. Tambling & J. T. du Toit
© 2005 British Ecological Society, Journal of Applied Ecology, 42, 431–441
male-biased mortality was expected (Estes 1968), andan estimate of 60% females (confirmed by field surveys)was adopted for the adult cohorts. Before lions wereintroduced to the park, adult female wildebeest fecundityshould have been high, approaching the 95% recordedfor western Masailand (Talbot & Talbot 1963). Assum-ing 95% of the adult females conceived each year, and60% of adults were females, the adult reproductive ratefor the model is 57% (i.e. excluding in utero and neonatalmortalities). Conception rates for 2-year-old wildebeestvary widely across Africa, reaching as high as 87% inwestern Masailand (Talbot & Talbot 1963), but rang-ing between 0% in Etosha, Namibia (Berry 1981b)and 32% in Kruger (Starfield, Smuts & Shiell 1976) forsouthern Africa. There is evidence that young femalefecundity in ungulates is related to habitat quality(Gaillard et al. 2000), which is in turn related to rainfall(Owen-Smith & Ogutu 2003). The average annual rain-fall in Pilanesberg was c. 620 mm year−1, which is greaterthan the long-term mean annual rainfall for Kruger(589 mm; Mills & Shenk 1992). Therefore, without dataon the calving rate of 2-year-old wildebeest in Pilanes-berg, we assumed that 2-year-olds have a conceptionrate of 30%, similar to that observed in Kruger. The 2-year-old age class in the wildebeest population consistsof approximately 60% females, so, in combination witha conception rate of 30%, the reproductive rate for all 2-year-olds is 18%. For simplicity the reproductive ratesof adult and 2-year-old wildebeest were kept the samebefore and after lions were introduced. Calf mortalitywas set at 50% (Starfield, Smuts & Shiell 1976; Berry1981b) throughout all stages of the population’s his-tory and in all modelled scenarios.
We used a step-ahead analysis to evaluate how differentpredation scenarios perform in predicting observed valuesone time step ahead (Turchin 2003). Specifically, if weuse the model retrospectively to predict an outcome (e.g.population level in a specific year) y* at time t in the past,from initial conditions defined at time t − 1, then letting yt
be the value actually observed at time t and ¥ the mean orestimate of the total counts over the census history (averagepopulation size over a set period of time), the quantity:
eqn 9
provides a measure of the performance of the model. Inparticular, r2 = 1 implies the model fits the observeddata perfectly, r2 = 0 implies that the model fit is nomore informative than using the mean or estimate ofthe total counts, and r2 < 0 implies that the model fitsthe data worse than the mean or estimate of the totalcounts (Turchin 2003).
Once the model was parameterized, two manage-ment scenarios (MSi) were simulated: MS1 assumed nolion introductions into the park; MS2 assumed thatwildebeest harvesting was terminated following lionintroductions in 1993. The model was also run undertwo predation scenarios: PS1 assumed a low predation
rate by lions (each lion kills two wildebeest per year);PS2 assumed a larger predation rate (each lion kills fourwildebeest per year). Under each predation scenario, afurther subset of four experimental scenarios was con-sidered: ES1 allowed the adult lion population to increaseat approximately 12% per year and maintained theaverage rate at which the park management removedwildebeest since lions were introduced (7% per year);ES2 stopped wildebeest harvesting and maintainedthe lion kill rate at a constant level per year (density-dependent predation; Hirst 1969); ES3 stopped wilde-beest harvesting and kept the lion population constantat its present level (density-independent predation);ES4 stopped wildebeest harvesting and maintainedthe lion population at 50% of its present level. The ESj
scenarios were run from 2001 until 2006 to predict whatcould happen under each scenario and to represent casesfrom the worst-case scenario (ES1) to the best-case sce-nario (ES4).
The model was simulated for a further 5 years until2006 using the parameters outlined by PS2 with no harv-esting and parameter values adjusted to determine thesensitivity of the model to changes in the parameterspace (Starfield & Bleloch 1991). Parameters testedincluded lion numbers, juvenile survival and reproduc-tive rates (2-year-old and adult rates). The parameterswere increased and decreased by 10% to test how theprojected population would react to changes in para-meter values (Berry 1981b). The sensitivity of the para-meters was investigated over a short time frame (1 year)and a longer time frame (5 years).
Results
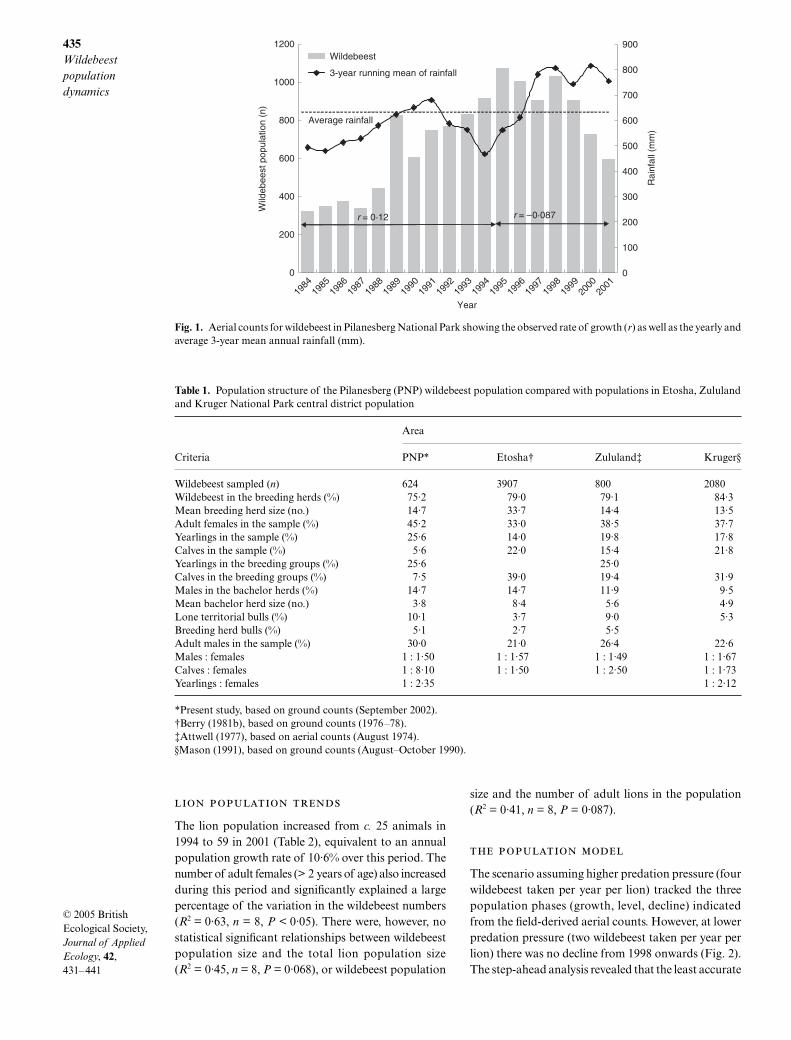
Between 1984 and 1995 the wildebeest population grewby 12% per annum despite continual harvesting (Fig. 1).Lions were introduced in 1993. From 1995 to 1998 thewildebeest population levelled off and then went intoa steady decline of c. 8% per annum. This cannot beexplained by resource limitation because the 3-yearmean annual rainfall has remained stable since 1997at c. 780 mm, which is 25% higher than the long-termmean annual rainfall.
The survival of wildebeest calves in Pilanesberg wasvery low, with calves comprising only 5·6% of the sam-pled population (Table 1), and so the cow : calf ratiowas very high (8 : 1). This cannot be accounted for byresource limitation because, in addition to the rainfalltrend described above, the body condition of adultwildebeest was generally good. In the sample of terri-torial males, 63% were in good condition and none werein poor condition, even though most were found in areasof tall, low-nutrient, grass rather than on the higher qualityburnt patches. The adult sex ratio (females : males) was1 : 1·5, indicating a clear bias towards females (χ2 = 9·71,d.f. = 1, P < 0·05), which was unchanged from a 1998survey in Pilanesberg.
ry y
y
tt
n
tt
n
2
2
1
2
1
1 ( * )
( )= −
−
−
=
=
∑∑ ¥
435Wildebeest population dynamics
© 2005 British Ecological Society, Journal of Applied Ecology, 42, 431–441
The lion population increased from c. 25 animals in1994 to 59 in 2001 (Table 2), equivalent to an annualpopulation growth rate of 10·6% over this period. Thenumber of adult females (> 2 years of age) also increasedduring this period and significantly explained a largepercentage of the variation in the wildebeest numbers(R2 = 0·63, n = 8, P < 0·05). There were, however, nostatistical significant relationships between wildebeestpopulation size and the total lion population size(R2 = 0·45, n = 8, P = 0·068), or wildebeest population
size and the number of adult lions in the population(R2 = 0·41, n = 8, P = 0·087).
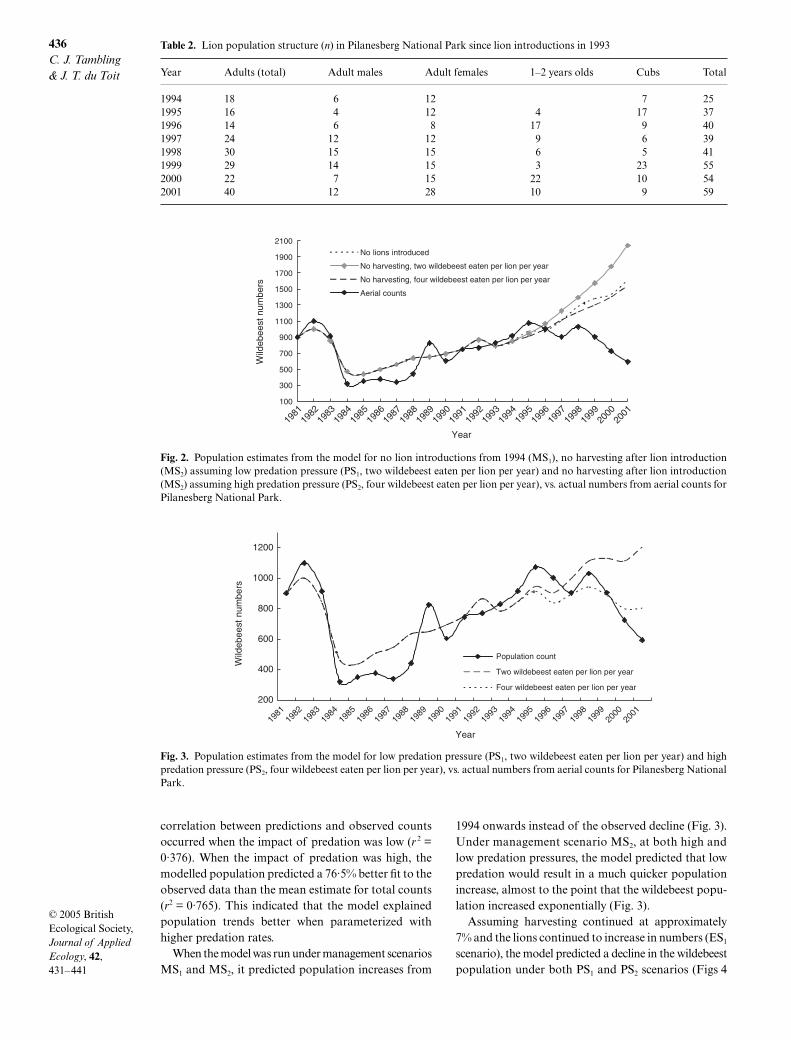
The scenario assuming higher predation pressure (fourwildebeest taken per year per lion) tracked the threepopulation phases (growth, level, decline) indicatedfrom the field-derived aerial counts. However, at lowerpredation pressure (two wildebeest taken per year perlion) there was no decline from 1998 onwards (Fig. 2).The step-ahead analysis revealed that the least accurate
Fig. 1. Aerial counts for wildebeest in Pilanesberg National Park showing the observed rate of growth (r) as well as the yearly andaverage 3-year mean annual rainfall (mm).
Table 1. Population structure of the Pilanesberg (PNP) wildebeest population compared with populations in Etosha, Zululandand Kruger National Park central district population
Criteria
Area
PNP* Etosha† Zululand‡ Kruger§
Wildebeest sampled (n) 624 3907 800 2080Wildebeest in the breeding herds (%) 75·2 79·0 79·1 84·3Mean breeding herd size (no.) 14·7 33·7 14·4 13·5Adult females in the sample (%) 45·2 33·0 38·5 37·7Yearlings in the sample (%) 25·6 14·0 19·8 17·8Calves in the sample (%) 5·6 22·0 15·4 21·8Yearlings in the breeding groups (%) 25·6 25·0Calves in the breeding groups (%) 7·5 39·0 19·4 31·9Males in the bachelor herds (%) 14·7 14·7 11·9 9·5Mean bachelor herd size (no.) 3·8 8·4 5·6 4·9Lone territorial bulls (%) 10·1 3·7 9·0 5·3Breeding herd bulls (%) 5·1 2·7 5·5Adult males in the sample (%) 30·0 21·0 26·4 22·6Males : females 1 : 1·50 1 : 1·57 1 : 1·49 1 : 1·67Calves : females 1 : 8·10 1 : 1·50 1 : 2·50 1 : 1·73Yearlings : females 1 : 2·35 1 : 2·12
*Present study, based on ground counts (September 2002).†Berry (1981b), based on ground counts (1976–78).‡Attwell (1977), based on aerial counts (August 1974).§Mason (1991), based on ground counts (August–October 1990).
436C. J. Tambling & J. T. du Toit
© 2005 British Ecological Society, Journal of Applied Ecology, 42, 431–441
correlation between predictions and observed countsoccurred when the impact of predation was low (r 2 =0·376). When the impact of predation was high, themodelled population predicted a 76·5% better fit to theobserved data than the mean estimate for total counts(r2 = 0·765). This indicated that the model explainedpopulation trends better when parameterized withhigher predation rates.
When the model was run under management scenariosMS1 and MS2, it predicted population increases from
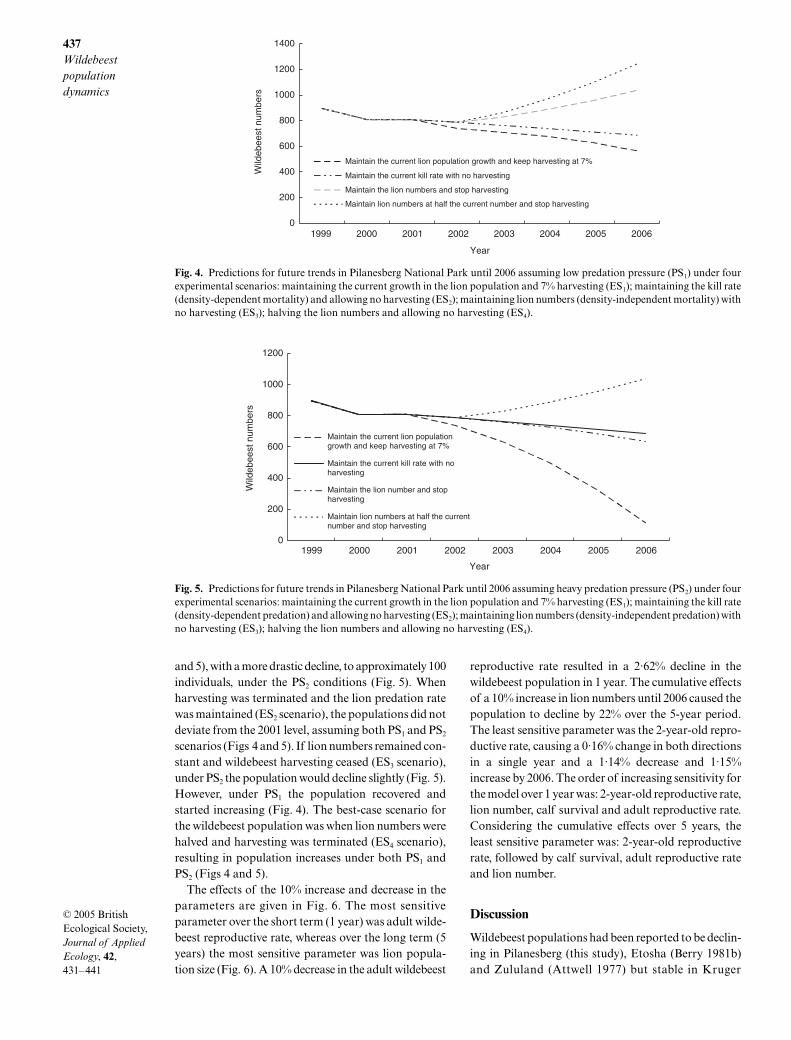
1994 onwards instead of the observed decline (Fig. 3).Under management scenario MS2, at both high andlow predation pressures, the model predicted that lowpredation would result in a much quicker populationincrease, almost to the point that the wildebeest popu-lation increased exponentially (Fig. 3).
Assuming harvesting continued at approximately7% and the lions continued to increase in numbers (ES1
scenario), the model predicted a decline in the wildebeestpopulation under both PS1 and PS2 scenarios (Figs 4
Table 2. Lion population structure (n) in Pilanesberg National Park since lion introductions in 1993
Year Adults (total) Adult males Adult females 1–2 years olds Cubs Total
1994 18 6 12 7 251995 16 4 12 4 17 371996 14 6 8 17 9 401997 24 12 12 9 6 391998 30 15 15 6 5 411999 29 14 15 3 23 552000 22 7 15 22 10 542001 40 12 28 10 9 59
Fig. 2. Population estimates from the model for no lion introductions from 1994 (MS1), no harvesting after lion introduction(MS2) assuming low predation pressure (PS1, two wildebeest eaten per lion per year) and no harvesting after lion introduction(MS2) assuming high predation pressure (PS2, four wildebeest eaten per lion per year), vs. actual numbers from aerial counts forPilanesberg National Park.
Fig. 3. Population estimates from the model for low predation pressure (PS1, two wildebeest eaten per lion per year) and highpredation pressure (PS2, four wildebeest eaten per lion per year), vs. actual numbers from aerial counts for Pilanesberg NationalPark.
437Wildebeest population dynamics
© 2005 British Ecological Society, Journal of Applied Ecology, 42, 431–441
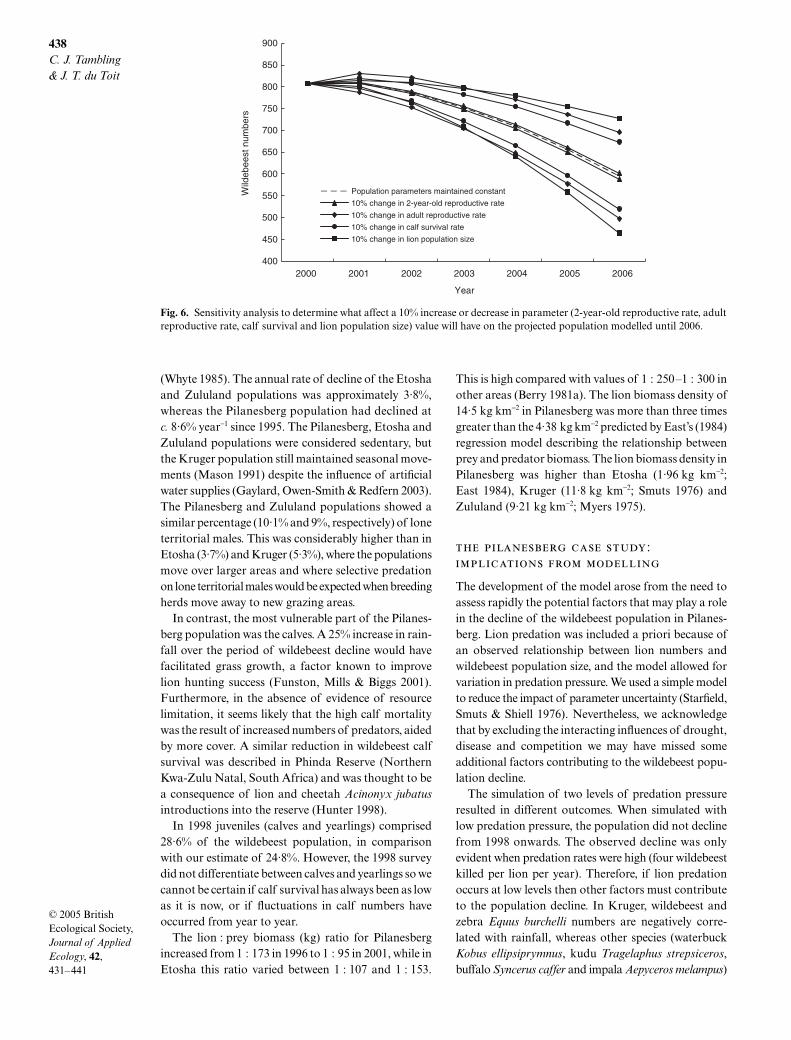
and 5), with a more drastic decline, to approximately 100individuals, under the PS2 conditions (Fig. 5). Whenharvesting was terminated and the lion predation ratewas maintained (ES2 scenario), the populations did notdeviate from the 2001 level, assuming both PS1 and PS2
scenarios (Figs 4 and 5). If lion numbers remained con-stant and wildebeest harvesting ceased (ES3 scenario),under PS2 the population would decline slightly (Fig. 5).However, under PS1 the population recovered andstarted increasing (Fig. 4). The best-case scenario forthe wildebeest population was when lion numbers werehalved and harvesting was terminated (ES4 scenario),resulting in population increases under both PS1 andPS2 (Figs 4 and 5).
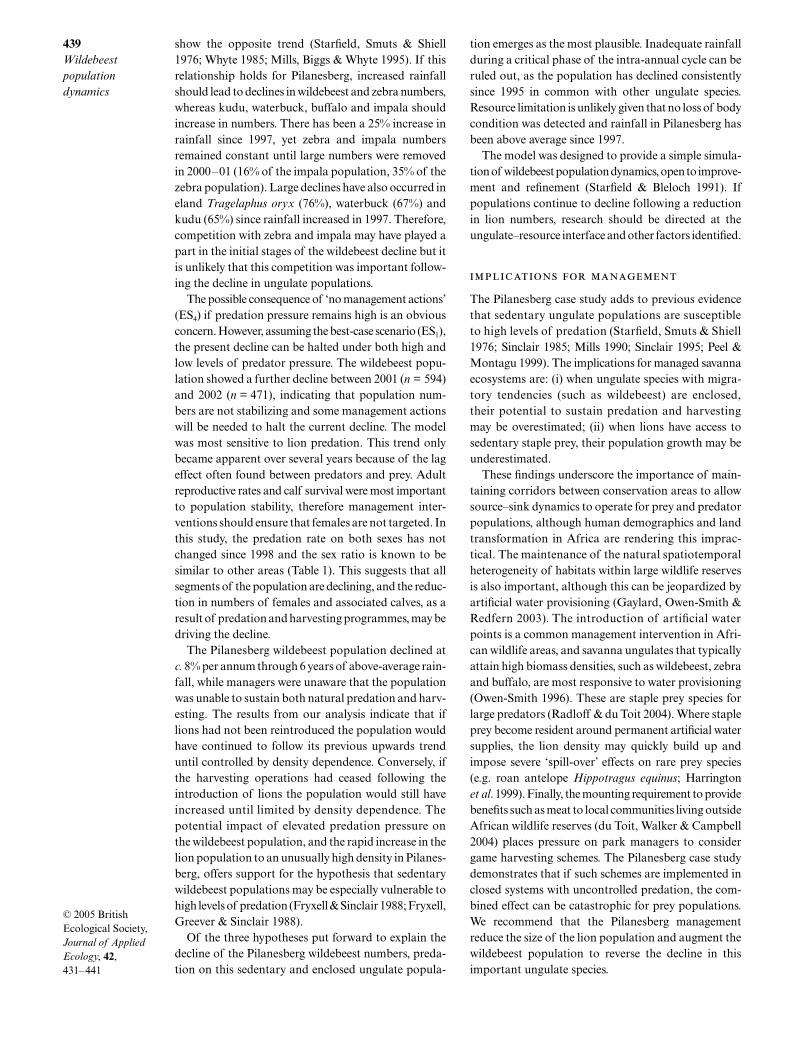
The effects of the 10% increase and decrease in theparameters are given in Fig. 6. The most sensitiveparameter over the short term (1 year) was adult wilde-beest reproductive rate, whereas over the long term (5years) the most sensitive parameter was lion popula-tion size (Fig. 6). A 10% decrease in the adult wildebeest
reproductive rate resulted in a 2·62% decline in thewildebeest population in 1 year. The cumulative effectsof a 10% increase in lion numbers until 2006 caused thepopulation to decline by 22% over the 5-year period.The least sensitive parameter was the 2-year-old repro-ductive rate, causing a 0·16% change in both directionsin a single year and a 1·14% decrease and 1·15%increase by 2006. The order of increasing sensitivity forthe model over 1 year was: 2-year-old reproductive rate,lion number, calf survival and adult reproductive rate.Considering the cumulative effects over 5 years, theleast sensitive parameter was: 2-year-old reproductiverate, followed by calf survival, adult reproductive rateand lion number.
Discussion
Wildebeest populations had been reported to be declin-ing in Pilanesberg (this study), Etosha (Berry 1981b)and Zululand (Attwell 1977) but stable in Kruger
Fig. 4. Predictions for future trends in Pilanesberg National Park until 2006 assuming low predation pressure (PS1) under fourexperimental scenarios: maintaining the current growth in the lion population and 7% harvesting (ES1); maintaining the kill rate(density-dependent mortality) and allowing no harvesting (ES2); maintaining lion numbers (density-independent mortality) withno harvesting (ES3); halving the lion numbers and allowing no harvesting (ES4).
Fig. 5. Predictions for future trends in Pilanesberg National Park until 2006 assuming heavy predation pressure (PS2) under fourexperimental scenarios: maintaining the current growth in the lion population and 7% harvesting (ES1); maintaining the kill rate(density-dependent predation) and allowing no harvesting (ES2); maintaining lion numbers (density-independent predation) withno harvesting (ES3); halving the lion numbers and allowing no harvesting (ES4).
438C. J. Tambling & J. T. du Toit
© 2005 British Ecological Society, Journal of Applied Ecology, 42, 431–441
(Whyte 1985). The annual rate of decline of the Etoshaand Zululand populations was approximately 3·8%,whereas the Pilanesberg population had declined atc. 8·6% year−1 since 1995. The Pilanesberg, Etosha andZululand populations were considered sedentary, butthe Kruger population still maintained seasonal move-ments (Mason 1991) despite the influence of artificialwater supplies (Gaylard, Owen-Smith & Redfern 2003).The Pilanesberg and Zululand populations showed asimilar percentage (10·1% and 9%, respectively) of loneterritorial males. This was considerably higher than inEtosha (3·7%) and Kruger (5·3%), where the populationsmove over larger areas and where selective predationon lone territorial males would be expected when breedingherds move away to new grazing areas.
In contrast, the most vulnerable part of the Pilanes-berg population was the calves. A 25% increase in rain-fall over the period of wildebeest decline would havefacilitated grass growth, a factor known to improvelion hunting success (Funston, Mills & Biggs 2001).Furthermore, in the absence of evidence of resourcelimitation, it seems likely that the high calf mortalitywas the result of increased numbers of predators, aidedby more cover. A similar reduction in wildebeest calfsurvival was described in Phinda Reserve (NorthernKwa-Zulu Natal, South Africa) and was thought to bea consequence of lion and cheetah Acinonyx jubatusintroductions into the reserve (Hunter 1998).
In 1998 juveniles (calves and yearlings) comprised28·6% of the wildebeest population, in comparisonwith our estimate of 24·8%. However, the 1998 surveydid not differentiate between calves and yearlings so wecannot be certain if calf survival has always been as lowas it is now, or if fluctuations in calf numbers haveoccurred from year to year.
The lion : prey biomass (kg) ratio for Pilanesbergincreased from 1 : 173 in 1996 to 1 : 95 in 2001, while inEtosha this ratio varied between 1 : 107 and 1 : 153.
This is high compared with values of 1 : 250–1 : 300 inother areas (Berry 1981a). The lion biomass density of14·5 kg km−2 in Pilanesberg was more than three timesgreater than the 4·38 kg km−2 predicted by East’s (1984)regression model describing the relationship betweenprey and predator biomass. The lion biomass density inPilanesberg was higher than Etosha (1·96 kg km−2;East 1984), Kruger (11·8 kg km−2; Smuts 1976) andZululand (9·21 kg km−2; Myers 1975).
:
The development of the model arose from the need toassess rapidly the potential factors that may play a rolein the decline of the wildebeest population in Pilanes-berg. Lion predation was included a priori because ofan observed relationship between lion numbers andwildebeest population size, and the model allowed forvariation in predation pressure. We used a simple modelto reduce the impact of parameter uncertainty (Starfield,Smuts & Shiell 1976). Nevertheless, we acknowledgethat by excluding the interacting influences of drought,disease and competition we may have missed someadditional factors contributing to the wildebeest popu-lation decline.
The simulation of two levels of predation pressureresulted in different outcomes. When simulated withlow predation pressure, the population did not declinefrom 1998 onwards. The observed decline was onlyevident when predation rates were high (four wildebeestkilled per lion per year). Therefore, if lion predationoccurs at low levels then other factors must contributeto the population decline. In Kruger, wildebeest andzebra Equus burchelli numbers are negatively corre-lated with rainfall, whereas other species (waterbuckKobus ellipsiprymnus, kudu Tragelaphus strepsiceros,buffalo Syncerus caffer and impala Aepyceros melampus)
Fig. 6. Sensitivity analysis to determine what affect a 10% increase or decrease in parameter (2-year-old reproductive rate, adultreproductive rate, calf survival and lion population size) value will have on the projected population modelled until 2006.
439Wildebeest population dynamics
© 2005 British Ecological Society, Journal of Applied Ecology, 42, 431–441
show the opposite trend (Starfield, Smuts & Shiell1976; Whyte 1985; Mills, Biggs & Whyte 1995). If thisrelationship holds for Pilanesberg, increased rainfallshould lead to declines in wildebeest and zebra numbers,whereas kudu, waterbuck, buffalo and impala shouldincrease in numbers. There has been a 25% increase inrainfall since 1997, yet zebra and impala numbersremained constant until large numbers were removedin 2000–01 (16% of the impala population, 35% of thezebra population). Large declines have also occurred ineland Tragelaphus oryx (76%), waterbuck (67%) andkudu (65%) since rainfall increased in 1997. Therefore,competition with zebra and impala may have played apart in the initial stages of the wildebeest decline but itis unlikely that this competition was important follow-ing the decline in ungulate populations.
The possible consequence of ‘no management actions’(ES4) if predation pressure remains high is an obviousconcern. However, assuming the best-case scenario (ES1),the present decline can be halted under both high andlow levels of predator pressure. The wildebeest popu-lation showed a further decline between 2001 (n = 594)and 2002 (n = 471), indicating that population num-bers are not stabilizing and some management actionswill be needed to halt the current decline. The modelwas most sensitive to lion predation. This trend onlybecame apparent over several years because of the lageffect often found between predators and prey. Adultreproductive rates and calf survival were most importantto population stability, therefore management inter-ventions should ensure that females are not targeted. Inthis study, the predation rate on both sexes has notchanged since 1998 and the sex ratio is known to besimilar to other areas (Table 1). This suggests that allsegments of the population are declining, and the reduc-tion in numbers of females and associated calves, as aresult of predation and harvesting programmes, may bedriving the decline.
The Pilanesberg wildebeest population declined atc. 8% per annum through 6 years of above-average rain-fall, while managers were unaware that the populationwas unable to sustain both natural predation and harv-esting. The results from our analysis indicate that iflions had not been reintroduced the population wouldhave continued to follow its previous upwards trenduntil controlled by density dependence. Conversely, ifthe harvesting operations had ceased following theintroduction of lions the population would still haveincreased until limited by density dependence. Thepotential impact of elevated predation pressure onthe wildebeest population, and the rapid increase in thelion population to an unusually high density in Pilanes-berg, offers support for the hypothesis that sedentarywildebeest populations may be especially vulnerable tohigh levels of predation (Fryxell & Sinclair 1988; Fryxell,Greever & Sinclair 1988).
Of the three hypotheses put forward to explain thedecline of the Pilanesberg wildebeest numbers, preda-tion on this sedentary and enclosed ungulate popula-
tion emerges as the most plausible. Inadequate rainfallduring a critical phase of the intra-annual cycle can beruled out, as the population has declined consistentlysince 1995 in common with other ungulate species.Resource limitation is unlikely given that no loss of bodycondition was detected and rainfall in Pilanesberg hasbeen above average since 1997.
The model was designed to provide a simple simula-tion of wildebeest population dynamics, open to improve-ment and refinement (Starfield & Bleloch 1991). Ifpopulations continue to decline following a reductionin lion numbers, research should be directed at theungulate–resource interface and other factors identified.
The Pilanesberg case study adds to previous evidencethat sedentary ungulate populations are susceptibleto high levels of predation (Starfield, Smuts & Shiell1976; Sinclair 1985; Mills 1990; Sinclair 1995; Peel &Montagu 1999). The implications for managed savannaecosystems are: (i) when ungulate species with migra-tory tendencies (such as wildebeest) are enclosed,their potential to sustain predation and harvestingmay be overestimated; (ii) when lions have access tosedentary staple prey, their population growth may beunderestimated.
These findings underscore the importance of main-taining corridors between conservation areas to allowsource–sink dynamics to operate for prey and predatorpopulations, although human demographics and landtransformation in Africa are rendering this imprac-tical. The maintenance of the natural spatiotemporalheterogeneity of habitats within large wildlife reservesis also important, although this can be jeopardized byartificial water provisioning (Gaylard, Owen-Smith &Redfern 2003). The introduction of artificial waterpoints is a common management intervention in Afri-can wildlife areas, and savanna ungulates that typicallyattain high biomass densities, such as wildebeest, zebraand buffalo, are most responsive to water provisioning(Owen-Smith 1996). These are staple prey species forlarge predators (Radloff & du Toit 2004). Where stapleprey become resident around permanent artificial watersupplies, the lion density may quickly build up andimpose severe ‘spill-over’ effects on rare prey species(e.g. roan antelope Hippotragus equinus; Harringtonet al. 1999). Finally, the mounting requirement to providebenefits such as meat to local communities living outsideAfrican wildlife reserves (du Toit, Walker & Campbell2004) places pressure on park managers to considergame harvesting schemes. The Pilanesberg case studydemonstrates that if such schemes are implemented inclosed systems with uncontrolled predation, the com-bined effect can be catastrophic for prey populations.We recommend that the Pilanesberg managementreduce the size of the lion population and augment thewildebeest population to reverse the decline in thisimportant ungulate species.
440C. J. Tambling & J. T. du Toit
© 2005 British Ecological Society, Journal of Applied Ecology, 42, 431–441
Acknowledgements
The managers and researchers in Pilanesberg arethanked for their support, including the provision ofaccommodation and free access to data, and for theiropen-mindedness in inviting us to undertake the study.Special thanks go to Bruce Brockett for providing dataand stimulating discussion, to Tony Starfield for invalu-able help with the modelling, and to Clare Dobson for helpwith fieldwork. Funding was provided by the NationalResearch Foundation (grant GUN-2046965 to Johandu Toit).
ReferencesAttwell, C.A.M. (1977) Reproduction and population ecology
of the blue wildebeest Connochaetes taurinus taurinus inZululand. PhD Thesis. University of Natal, Pietermaritz-burg, South Africa.
Attwell, C.A.M. (1980) Age determination of the blue wilde-beest Connochaetes taurinus in Zululand. South AfricanJournal of Zoology, 15, 121–130.
Berry, H.H. (1981a) Abnormal level of disease and predationas limiting factors for wildebeest in the Etosha NationalPark. Madoqua, 12, 242–252.
Berry, H.H. (1981b) Population structure, mortality patternsand a predictive model for estimating future trends in wilde-beest numbers in the Etosha National Park. Madoqua, 12,255–266.
Brockett, B.H. (2002) Accuracy, bias and precision of helicopter-based counts of black rhinoceros in PNP National Park,South Africa. South African Journal of Wildlife Research,32, 121–136.
Caughley, G. & Birch, L.C. (1971) Rate of increase. Journal ofWildlife Management, 35, 658–663.
East, R. (1984) Rainfall, soil nutrient status and biomass oflarge African savanna mammals. East African Journal ofEcology, 22, 245–270.
Estes, R.D. (1968) Territorial behavior of the wildebeest(Connochaetes taurinus Burchell, 1823). PhD Thesis. CornellUniversity, Ithaca, NY.
Estes, R.D. (1991) The Behavior Guide to African Mammals:Including Hoofed Mammals, Carnivores, Primates. Universityof California Press, Cape Town, South Africa.
Fryxell, J.M. & Sinclair, A.R.E. (1988) Causes and consequencesof migration by large herbivores. Trends in Ecology andEvolution, 3, 237–241.
Fryxell, J.M., Greever, J. & Sinclair, A.R.E. (1988) Why aremigratory ungulates so abundant? American Naturalist,131, 781–798.
Funston, P.J., Mills, M.G.L. & Biggs, H.C. (2001) Factorsaffecting the hunting success of male and female lions in theKruger National Park. Journal of Zoology, London, 253,419–431.
Gaillard, J.-M., Festa-Bianchet, M., Yoccoz, N.G., Loison, A. &Toigo, C. (2000) Temporal variation in fitness componentsand population dynamics of large herbivores. Annual Reviewof Ecology and Systematics, 31, 367–393.
Gaylard, A., Owen-Smith, N. & Redfern, J. (2003) Surfacewater availability: implications for heterogeneity andecosystem processes. The Kruger Experience: Ecology andManagement of Savanna Heterogeneity (eds J.T. du Toit,K.M. Rogers & H.C. Biggs), pp. 171–188. Island Press,Washington, DC.
Harrington, R., Owen-Smith, N., Viljoen, P.C., Biggs, H.C.,Mason, D.R. & Funston, P. (1999) Establishing the causesof the roan antelope decline in the Kruger National Park,South Africa. Biological Conservation, 90, 69–78.
Hirst, S.M. (1969) Populations in a Transvaal lowveld naturereserve. Zoologica Africana, 4, 199–230.
Hunter, L.T.B. (1998) Behavioural ecology of reintroducedlions and cheetah in the Phinda Resource Reserve, Kwa-ZuluNatal, South Africa. PhD Thesis. University of Pretoria,Pretoria, South Africa.
Mason, D.R. (1991) Monitoring of Ungulate PopulationStructure in the Kruger National Park: Reports on Surveysduring August, September and October 1988–90. NationalParks Board, Skukuza, South Africa.
Mduma, S.A.R., Sinclair, A.R.E. & Hilborn, R. (1999) Foodregulates the Serengeti wildebeest: a 40-year record. Journalof Animal Ecology, 68, 1101–1122.
Mills, M.G.L. (1990) Kalahari Hyenas. Unwin-Hyman, London,UK.
Mills, M.G.L. & Shenk, T.M. (1992) Predator–prey relationships:the impact of lion predation on wildebeest and zebra popu-lations. Journal of Animal Ecology, 61, 693–702.
Mills, M.G.L., Biggs, H.C. & Whyte, I.J. (1995) The relation-ship between rainfall, lion predation and population trendsin African herbivores. Wildlife Research, 22, 75–88.
Myers, N. (1975) The cheetah Acinonyx jubatus in Africa.IUCN Monographs, 4, 1–90.
Ottichilo, W.K., De Leeuw, J. & Prins, H.H.T. (2001) Popu-lation trends of resident wildebeest [Connochaetes taurinushecki (Neumann)] and factors influencing them in theMasai Mara ecosystem. Biological Conservation, 97, 271–282.
Owen-Smith, N. (1996) Ecological guidelines for waterpointsin extensive protected areas. South African Journal of Wild-life Research, 26, 107–112.
Owen-Smith, N. & Ogutu, J. (2003) Rainfall influences onungulate population dynamics. The Kruger Experience:Ecology and Management of Savanna Heterogeneity (edsJ.T. du Toit, K.H. Rogers & H.C. Biggs), pp. 310–331.Island Press, Washington, DC.
Pascual, M.A. & Hilborn, R. (1995) Conservation of harv-ested populations in fluctuation environments: the case ofthe Serengeti wildebeest. Journal of Applied Ecology, 32,468–480.
Pascual, M.A., Kareiva, P. & Hilborn, R. (1997) The influenceof model structure on conclusions about the viability andharvesting of Serengeti wildebeest. Conservation Biology,11, 966–976.
Peel, M.J.S. & Montagu, G.P. (1999) Modelling predator–prey interactions on a northern province game ranch. SouthAfrican Journal of Wildlife Research, 29, 31–34.
Radloff, F.G.T. & du Toit, J.T. (2004) Large predators andtheir prey in a southern African savanna: predator body sizedetermines maximum prey size. Journal of Animal Ecology,73, 410–423.
Riney, T. (1960) A field technique for assessing physical con-dition of some ungulates. Journal of Wildlife Management,24, 92–93.
Sinclair, A.R.E. (1985) Does interspecific competition orpredation shape the African ungulate community? Journalof Animal Ecology, 54, 899–918.
Sinclair, A.R.E. (1995) Population limitation of residentherbivores. Serengeti II: Research, Management and Con-servation of an Ecosystem (eds A.R.E. Sinclair & P. Arcese),pp. 194–219. The University of Chicago Press, Chicago, IL.
Skinner, J.D. & Smithers, R.H.N. (1990) Mammals of theSouthern African Subregion. University of Pretoria, Preto-ria, South Africa.
Slotow, R. & van Dyk, G. (2001) Role of delinquent young‘orphan’ male elephants in high mortality of white rhinocerosin PNP National Park, South Africa. Koedoe, 44, 85–94.
Smuts, G.L. (1976) Population characteristics and recenthistory of lions in two parts of the Kruger National Park.Koedoe, 19, 153–164.
441Wildebeest population dynamics
© 2005 British Ecological Society, Journal of Applied Ecology, 42, 431–441
Smuts, G.L. (1978) Interrelations between predators, prey,and their environment. Bioscience, 28, 316–320.
Spinage, C.A. (1992) The decline of the Kalahari wildebeest.Oryx, 26, 147–150.
Starfield, A.M. & Bleloch, A.L. (1991) Building Models forConservation and Wildlife Management. Burgess Press,Edina, Minnesota.
Starfield, A.M., Smuts, G.L. & Shiell, J.D. (1976) A simplewildebeest population model and its applications. SouthAfrican Journal of Wildlife Research, 6, 95–98.
Talbot, L.M. & Talbot, M.H. (1963) The wildebeest of westernMasailand, east Africa. Wildlife Monographs, 12, 1–88.
Turchin, P. (2003) Phenomenological time series analysis.Complex Population Dynamics: A Theoretical/EmpiricalSynthesis, pp. 171–196. Monographs in Population BiologyNo. 35. Princeton University Press, Princeton, NJ.
du Toit, J.T., Walker, B.H. & Campbell, B.M. (2004) Conserv-ing tropical nature: current challenges for ecologists. Trendsin Ecology and Evolution, 19, 12–17.
Whyte, I.J. (1985) The present ecological status of the bluewildebeest (Connochaetes taurinus taurinus, Burchell,1823) in the Central District of the Kruger National Park.MSc Thesis. University of Natal, Pietermaritzburg, SouthAfrica.
Whyte, I.J. & Joubert, S.C.J. (1988) Blue wildebeest popu-lation trends in the Kruger National Park and the effectsof fencing. South African Journal of Wildlife Research, 18,78–87.
Received 12 August 2004; final copy received 7 February 2005Editor: Steve Rushton