Modelling the correlation between the geometrical features and the forming limit strains of...
11
ORIGINAL RESEARCH Modelling the correlation between the geometrical features and the forming limit strains of perforated Al 8011 sheets using artificial neural network K. Elangovan & C. Sathiya Narayanan & R. Narayanasamy Received: 1 June 2010 / Accepted: 8 October 2010 / Published online: 16 November 2010 # Springer-Verlag France 2010 Abstract In the recent years, sheet metals are produced with perforations in various shapes and patterns to improve the appearance of sheet and to save weight of components. As in conventional metal sheets, it is important to form the perforated sheet metals also within their safe strain regions to avoid the forming failures like necking, fracture and wrinkling. The Forming Limit Diagram (FLD) is an appro- priate tool to determine the forming limit strains. The limiting strains of perforated sheet metals mainly depend on the geometry of the perforations and forming variables. This leads to large increase in number of test to be conducted with various geometry and forming variables for determining the forming limit strain for perforated sheets. Aiming to reduce the number of experiments needed, in this work, an Artificial Neural Network (ANN) model has been developed for forming limit diagram of perforated Al 8011 sheets based on experimental results and correlated with the geometrical features of the perforated sheets. This model is a feed forward back propagation neural network (BPNN) with a set of geometrical variables as its inputs and the safe true strains as its output. This ANN model can be applied for prediction of FLD of perforated sheet having any geometry. Keywords Forming limit diagram . Artificial neural network . Perforated Al 8011 Introduction Forming limit diagram (FLD), an effective tool for evaluating the formability of a sheet metal for various strain states and various strain ratios, can be used for finding out the limiting major strain and limiting minor strain for any strain states and strain ratios. These forming limit diagrams are being used by both manufacturers and users of the sheet metals. From the initiation of FLD concept, many numbers of works have been carried out in this field of FLD of sheet metals [1–3]. The important limitation of the FLD is that a FLD is applicable only for a particular sheet quality [4]. As the chemical composition, processing method, thickness, heat treatment after manu- facture of sheet metal, strain path, strain condition and etc., are varied, there will be variation in limiting strain for the sheet which alters the FLD suitably. The construction of a FLD that suits for all above variation needs a lot of experimental work to be carried out. With the aim to reduce the experimental work for constructing FLD, many researchers have developed no of mathematical models [5–7]. In recent years, researchers are attempting to develop ANN model, which has universal approximation capability and more accurate in predicting any system [8]. This ANN is also being used for sheet metal problems. The application of ANN for sheet metal problems including the following works. Sivasankaran et al. [9] developed an ANN model of deep drawing process which predicts the onset of wrinkling for the commercial pure aluminium sheets drawn through conical die by considering mechanical properties, annealing temperature, soaking time, blank diameter, and number of drawn as input neurons for ANN model. Wang et al. [10] generalized and correlated the geometrical features of various formed parts are with surface behaviour and a model based on an artificial neural K. Elangovan : C. S. Narayanan (*) : R. Narayanasamy Department of Production Engineering, National Institute of Technology, Trichy, 620 015 Tamilnadu, India e-mail: [email protected] K. Elangovan e-mail: [email protected] R. Narayanasamy e-mail: [email protected] Int J Mater Form (2011) 4:389–399 DOI 10.1007/s12289-010-1003-x
-
Upload
independent -
Category
Documents
-
view
1 -
download
0
Transcript of Modelling the correlation between the geometrical features and the forming limit strains of...
ORIGINAL RESEARCH
Modelling the correlation between the geometrical featuresand the forming limit strains of perforated Al 8011 sheetsusing artificial neural network
K. Elangovan & C. Sathiya Narayanan &
R. Narayanasamy
Received: 1 June 2010 /Accepted: 8 October 2010 /Published online: 16 November 2010# Springer-Verlag France 2010
Abstract In the recent years, sheet metals are produced withperforations in various shapes and patterns to improve theappearance of sheet and to save weight of components. As inconventional metal sheets, it is important to form theperforated sheet metals also within their safe strain regionsto avoid the forming failures like necking, fracture andwrinkling. The Forming Limit Diagram (FLD) is an appro-priate tool to determine the forming limit strains. The limitingstrains of perforated sheet metals mainly depend on thegeometry of the perforations and forming variables. This leadsto large increase in number of test to be conducted withvarious geometry and forming variables for determining theforming limit strain for perforated sheets. Aiming to reducethe number of experiments needed, in this work, an ArtificialNeural Network (ANN) model has been developed forforming limit diagram of perforated Al 8011 sheets based onexperimental results and correlated with the geometricalfeatures of the perforated sheets. This model is a feed forwardback propagation neural network (BPNN) with a set ofgeometrical variables as its inputs and the safe true strains asits output. This ANN model can be applied for prediction ofFLD of perforated sheet having any geometry.
Keywords Forming limit diagram . Artificial neuralnetwork . Perforated Al 8011
Introduction
Forming limit diagram (FLD), an effective tool forevaluating the formability of a sheet metal for variousstrain states and various strain ratios, can be used forfinding out the limiting major strain and limiting minorstrain for any strain states and strain ratios. These forminglimit diagrams are being used by both manufacturers andusers of the sheet metals. From the initiation of FLDconcept, many numbers of works have been carried out inthis field of FLD of sheet metals [1–3]. The importantlimitation of the FLD is that a FLD is applicable only for aparticular sheet quality [4]. As the chemical composition,processing method, thickness, heat treatment after manu-facture of sheet metal, strain path, strain condition and etc.,are varied, there will be variation in limiting strain for the sheetwhich alters the FLD suitably. The construction of a FLD thatsuits for all above variation needs a lot of experimental work tobe carried out. With the aim to reduce the experimental workfor constructing FLD, many researchers have developed no ofmathematical models [5–7]. In recent years, researchers areattempting to develop ANN model, which has universalapproximation capability and more accurate in predicting anysystem [8]. This ANN is also being used for sheet metalproblems. The application of ANN for sheet metal problemsincluding the following works.
Sivasankaran et al. [9] developed an ANN model ofdeep drawing process which predicts the onset ofwrinkling for the commercial pure aluminium sheetsdrawn through conical die by considering mechanicalproperties, annealing temperature, soaking time, blankdiameter, and number of drawn as input neurons for ANNmodel. Wang et al. [10] generalized and correlated thegeometrical features of various formed parts are withsurface behaviour and a model based on an artificial neural
K. Elangovan : C. S. Narayanan (*) :R. NarayanasamyDepartment of Production Engineering,National Institute of Technology,Trichy,620 015 Tamilnadu, Indiae-mail: [email protected]
K. Elangovane-mail: [email protected]
R. Narayanasamye-mail: [email protected]
Int J Mater Form (2011) 4:389–399DOI 10.1007/s12289-010-1003-x
network is introduced to reveal the critical geometricalcriteria for wrinkling. Veera Babu et al. [11] developed anartificial neural network model to predict the tensilebehavior of tailor welded blanks made of steel grade andaluminium alloy base materials. Zemin Fu et al. [12] usedneural network to predict punch radius based on the resultsof air-bending experiments of sheet metal which was thethree-layer back propagation neural network. They used agenetic algorithm (GA) to optimize the weights of neuralnetwork for minimizing the error between the predictivepunch radius and the experimental one. Wenjuan Liu et al.[13] proposed a technique based on artificial neuralnetwork and genetic algorithm to solve the problem ofspringback and used an improved genetic algorithm tooptimize the weights of neural network. In addition to thiswork Recep Kazan et al. [14] developed the model ofspringback in wipe-bending process using artificial neuralnetwork approach. Swadesh Kumar Singh et al. [15] andCapdevila et al. [16] developed a neural network modelfor describing the evolution of mechanical properties suchas yield strength, ultimate tensile strength and elongationon low carbon sheet steels.
However, the application of ANN is very limited inpredicting FLD for sheet metals. In sheet metal field,perforated sheets are being produced in order to reduce theweight of the components and to import aesthetic appear-ance and components are being made out of perforatedsheets by forming operations. Such perforations havenegative effects on FLD of sheet metals. In spite of thesedisadvantages, perforated sheets are being used for theabove said advantages. The perforated aluminium sheetsare widely used in automotive, acoustics, architecture,interior design, displays, manufacturing, safety flooring,agriculture, pollution control, transportation, and miningetc. [17]. Therefore the manufacturers/users are in aposition to develop FLD for the perforated sheet metalsalso. Perforations are made in various patterns and variousdimensions.
The deformation behaviour of perforated sheets duringmetal forming operations is different from that of plain sheetmetals and this had been studied by chen and coworkers [18,19] and baik et al. [20–22]. In attempt to study theformability of perforated sheets, Yi-Che Lee et al. [23]developed yield criterion for perforated sheets in terms ofapparent stresses by employing the equivalent–continuationapproach. However it is focuses on perforated sheets withlow ligament ratios. The above works on perforated sheetswere limited to the perforated sheets having one or two typesof geometrical features. Therefore it is needed to develop amodel which accommodates all the variations. Among thealuminium alloys of various grades, Al 8000 series whichhas more strength is preferred by all the manufacturers/userseven though the strength of the perforated sheets are less.
This makes the authors to develop a model for the predictionof FLD of perforated Al 8011 sheets. In this work, it isconcentrated on the development of ANN model that suits topredict the formability of Al 8011 alloy sheets with variouscombinations of thicknesses, size of circular perforations andligament widths.
Experimental data collection
Chemical composition
The chemical composition of the aluminium alloy 8011 sheettaken for this study is given in Table 1. The aluminium alloy8011 grade contains a smaller percentage of iron (Fe) andsilicon (Si), which increases the strength of aluminium [24].In addition to this, it contains very little amount ofmanganese, which increases the corrosion resistance.
Specifications of perforated sheet blanks
Perforated sheet blanks were prepared from solid Al 8011sheet with various combination of diameter of circularperforation and ligament width by punching operation inthe straight pattern as shown in Fig. 1. The differentspecifications of the 27 set of perforated Al 8011 blankstaken for forming limit diagram study are shown in Table 2.
Forming limit diagram
As in a standard FLD test [3], blanks of dimensions 300×200, 300×180, 300×160, 300×140, 300×120, 300×120,300×100 and 300×80mm were sheared from the preparedperforated sheets by shearing. Samples were formed up tofracture using a double action hydraulic press of capacity2,000 kN with standard die and punch set up. A typical
Table 1 Chemical composition of Al 8011 (%W)
Al Fe Si Mn Zn Cr Mg
Reminder 0.797 0.433 0.131 0.033 0.011 0.109
Fig. 1 Straight pattern ofperforations
390 Int J Mater Form (2011) 4:389–399

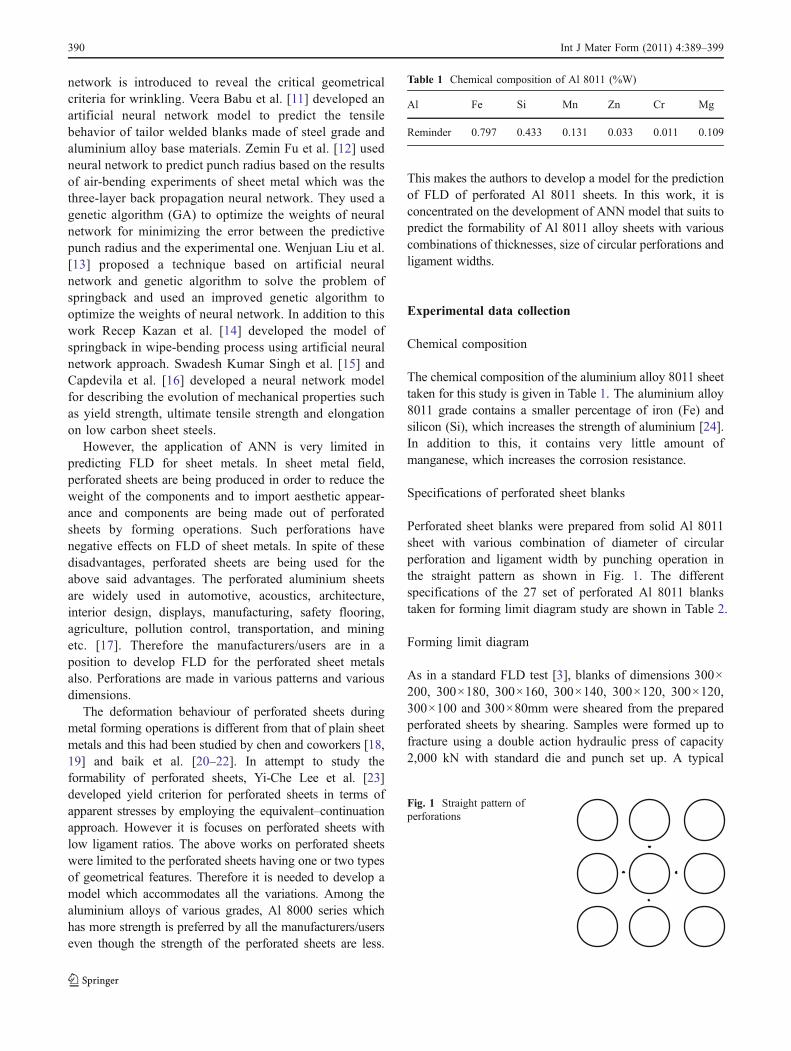
punch-die assembly used in the experiments is shown inFig. 2. As the perforated sheet samples were subjected todifferent conditions of strain namely tension–tension, planestrain and tension–compression by varying width of thesamples during forming. During forming the perforatedsheets deformed plastically. Before and after forming, thedistances between two equivalent points along longitudinal
(major) and transverse (minor) directions were measured inthe necked region [25]. The major true strain (ε1) and minortrue strain (ε2) are then calculated using the formulae givenin Eqs. 1 and 2 respectively. FLD was drawn by plotting theminor strain in abscissa and corresponding major strain inordinate and by drawing a smooth curve connecting thesepoints [26].
Major true strain ð"1Þ ¼ lnDistance between two equivalent points after forming in the major axis
Distance between two equivalent points before forming in the major axis
� �ð1Þ
Minor true strain ð"2Þ ¼ lnDistance between two equivalent points after forming in the minor axis
Distance between two equivalent points before forming in the minor axis
� �ð2Þ
Artificial neural network
The artificial neural networks (ANN) have been developed bygeneralization of the mathematical model of the human brain’sability and neural biology. An ANN is a set of processingelements or neurons, and connections with adjustable weights.One of the advantages of using the neural network approach isthat a model can be constructed very easily based on the giveninput and output and trained to accurately predict processdynamics [5, 6]. This modeling technique is particularlyprecious in processes where a complete understanding of thephysical mechanisms is very complicated as in the case ofsheet metal forming process. The neural network learns byusing training data. Input variables are supplied and theresultant output is compared with the desired output. Thenetwork then adjusts the interconnection weights betweenlayers. This process is repeated until the network performswell on the training set. The network can then be assessed ondata not included in the training set, the validation data, toestimate its performance in order to achieve better networkconvergence.
Backpropagation (BP) network
There exist many different architecture and learningalgorithms for neural network models. Most successfuland powerful network is three layer backpropagationnetwork designs [27], and is described with the help offlow diagram as shown in Fig. 3. Neural network is alogical structure with multi-processing elements, which areconnected through interconnection weights. The knowledgeis presented by the interconnection weights, which are
Table 2 Specifications of perforated Al 8011 sheets
Sl no Thickness(mm)
Diameter ofperforation (mm)
Ligamentwidth (mm)
1 2.0 3.0 5.0
2 2.0 3.0 7.5
3 2.0 3.0 10.0
4 2.0 4.0 5.0
5 2.0 4.0 7.5
6 2.0 4.0 10.0
7 2.0 5.0 5.0
8 2.0 5.0 7.5
9 2.0 5.0 10.0
10 1.6 3.0 5.0
11 1.6 3.0 7.5
12 1.6 3.0 10.0
13 1.6 4.0 5.0
14 1.6 4.0 7.5
15 1.6 4.0 10.0
16 1.6 5.0 5.0
17 1.6 5.0 7.5
18 1.6 5.0 10.0
19 1.0 3.0 5.0
20 1.0 3.0 7.5
21 1.0 3.0 10.0
22 1.0 4.0 5.0
23 1.0 4.0 7.5
24 1.0 4.0 10.0
25 1.0 5.0 5.0
26 1.0 5.0 7.5
27 1.0 5.0 10.0
Int J Mater Form (2011) 4:389–399 391
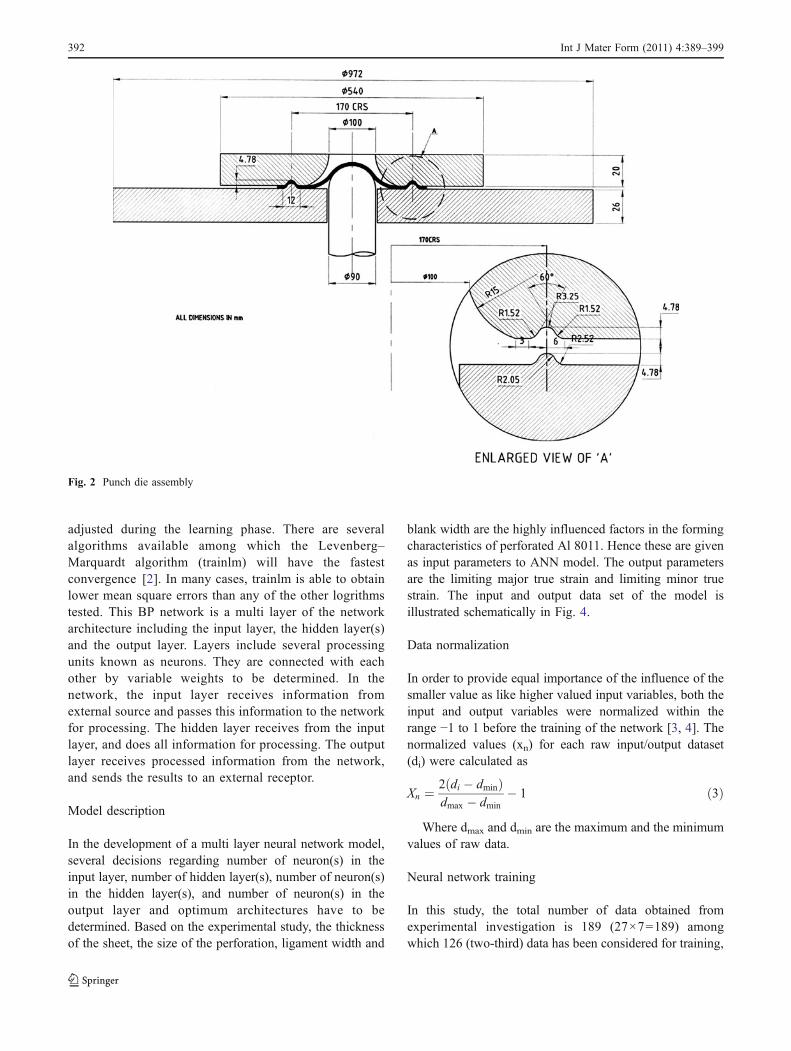
adjusted during the learning phase. There are severalalgorithms available among which the Levenberg–Marquardt algorithm (trainlm) will have the fastestconvergence [2]. In many cases, trainlm is able to obtainlower mean square errors than any of the other logrithmstested. This BP network is a multi layer of the networkarchitecture including the input layer, the hidden layer(s)and the output layer. Layers include several processingunits known as neurons. They are connected with eachother by variable weights to be determined. In thenetwork, the input layer receives information fromexternal source and passes this information to the networkfor processing. The hidden layer receives from the inputlayer, and does all information for processing. The outputlayer receives processed information from the network,and sends the results to an external receptor.
Model description
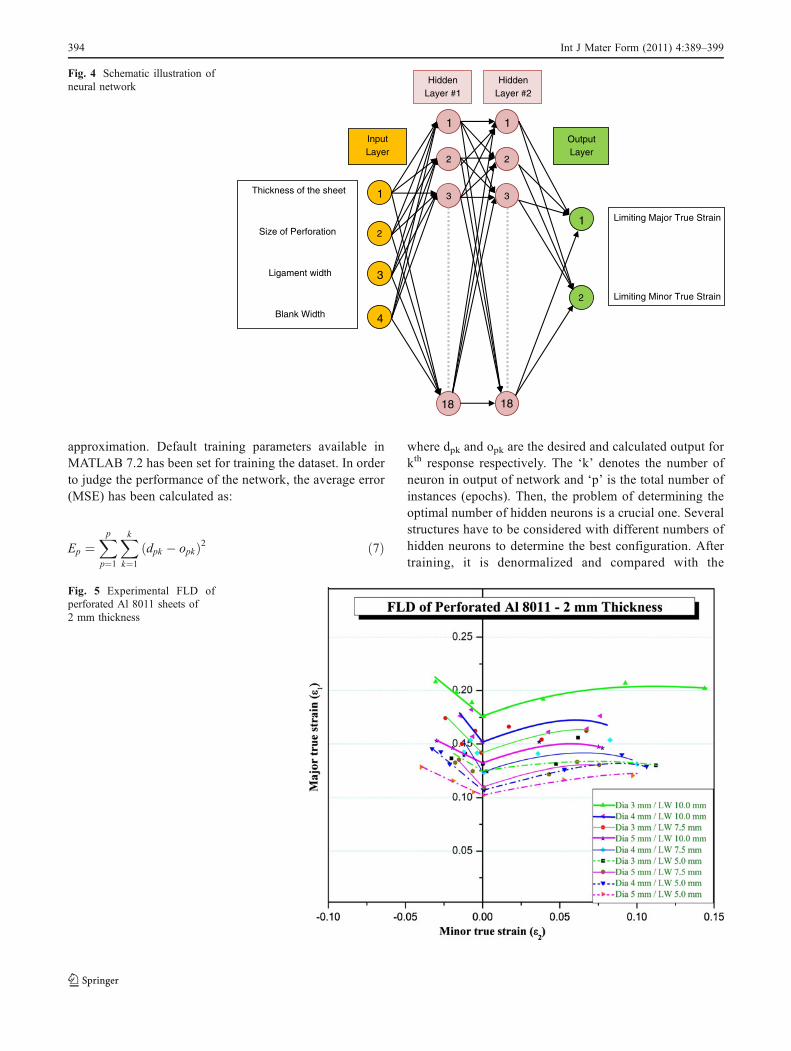
In the development of a multi layer neural network model,several decisions regarding number of neuron(s) in theinput layer, number of hidden layer(s), number of neuron(s)in the hidden layer(s), and number of neuron(s) in theoutput layer and optimum architectures have to bedetermined. Based on the experimental study, the thicknessof the sheet, the size of the perforation, ligament width and
blank width are the highly influenced factors in the formingcharacteristics of perforated Al 8011. Hence these are givenas input parameters to ANN model. The output parametersare the limiting major true strain and limiting minor truestrain. The input and output data set of the model isillustrated schematically in Fig. 4.
Data normalization
In order to provide equal importance of the influence of thesmaller value as like higher valued input variables, both theinput and output variables were normalized within therange −1 to 1 before the training of the network [3, 4]. Thenormalized values (xn) for each raw input/output dataset(di) were calculated as
Xn ¼ 2ðdi � dminÞdmax � dmin
� 1 ð3Þ
Where dmax and dmin are the maximum and the minimumvalues of raw data.
Neural network training
In this study, the total number of data obtained fromexperimental investigation is 189 (27×7=189) amongwhich 126 (two-third) data has been considered for training,
Fig. 2 Punch die assembly
392 Int J Mater Form (2011) 4:389–399
and 69 data for testing. The standard multilayer feedforward backpropagation hierarchical neural networks weredesigned with MATLAB 7.2 Neural Network Toolbox. Thenetworks consist of three layers: the input, the hidden layer,and the output layer. Now, the designed network has fourinput neurons and two output neurons. In the network, eachneuron receives total input from all of the neurons in theproceeding layer as:
netj ¼Xi
W nji ðXiÞn�1 ð4Þ
where netj is the total or net input, Xin is the output of the
node j in the nth layer, and Wjin represents the weights
from node i in the (n-1)th layer to node j in the nth layer. Aneuron in the network produces its input by processing thenet input through an activation (transfer) function which is
usually nonlinear. There are several types of activationfunctions used for BP. However, the tan-sigmoid transferfunction is mostly used which is assigned in hidden layer(s) for processing the inputs as:
f ðxÞ ¼ 2
ð1þ e�xÞ � 1rangeð�1; 1Þ ð5Þ
and purelin a transfer function calculates a hidden layer’soutput from its net input which is assigned for output layer as:
f ðxÞ ¼ ðex � e�xÞðex þ e�xÞ � 1rangeð�1; 1Þ ð6Þ
the weights are dynamically updated using the BPalgorithm. The network has been trained with Levenberg–Marquardt algorithm. This training algorithm has beenselected due to its high accuracy in similar function
Normalize the raw data (input and output)
Select two-third data for training and one third data for testing
Design Network type, training function, Perform function,Number of layers, Neurons and transfer function
Set training parameters
Declare failure network did not converge within
Start
Feed the data into Neural Network Tool box (MATLAB 7.2)
Execute network training
Error within
tolerance
Feed the entire data set to that corresponding architecture
Denormalize the test and entire data
Find the correlation coefficient (R)
Is meanR ≥ 0.95
Select optimum architecture
Declare success/savetraining weightsSelect next architecture
No
Yes
Yes
No
Fig. 3 Flow diagram
Int J Mater Form (2011) 4:389–399 393
approximation. Default training parameters available inMATLAB 7.2 has been set for training the dataset. In orderto judge the performance of the network, the average error(MSE) has been calculated as:
Ep ¼Xpp¼1
Xkk¼1
ðdpk � opkÞ2 ð7Þ
where dpk and opk are the desired and calculated output forkth response respectively. The ‘k’ denotes the number ofneuron in output of network and ‘p’ is the total number ofinstances (epochs). Then, the problem of determining theoptimal number of hidden neurons is a crucial one. Severalstructures have to be considered with different numbers ofhidden neurons to determine the best configuration. Aftertraining, it is denormalized and compared with the
1
2
1
2
3
1
2
3
1
2
InputLayer
OutputLayer
HiddenLayer #1
HiddenLayer #2
Thickness of the sheet
Size of Perforation
Ligament width
Blank Width
Limiting Major True Strain
Limiting Minor True Strain
3
4
18 18
Fig. 4 Schematic illustration ofneural network
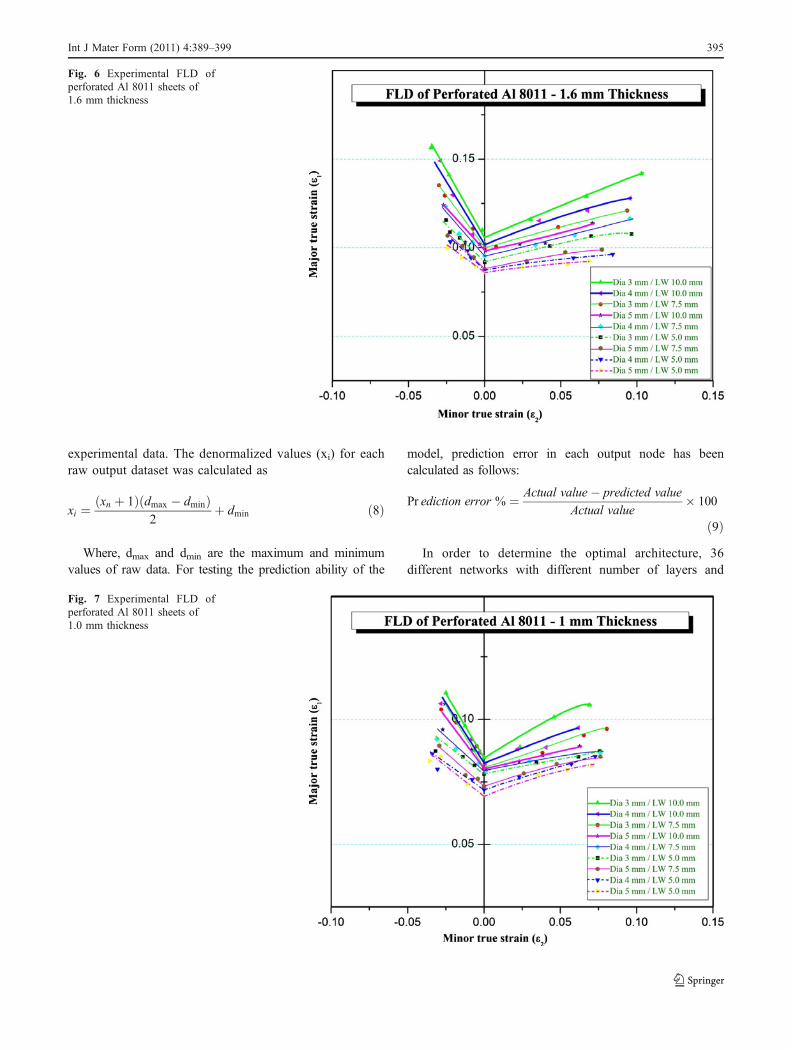
Fig. 5 Experimental FLD ofperforated Al 8011 sheets of2 mm thickness
394 Int J Mater Form (2011) 4:389–399
experimental data. The denormalized values (xi) for eachraw output dataset was calculated as
xi ¼ ðxn þ 1Þðdmax � dminÞ2
þ dmin ð8Þ
Where, dmax and dmin are the maximum and minimumvalues of raw data. For testing the prediction ability of the
model, prediction error in each output node has beencalculated as follows:
Pr ediction error % ¼ Actual value� predicted value
Actual value� 100
ð9ÞIn order to determine the optimal architecture, 36
different networks with different number of layers and
Fig. 6 Experimental FLD ofperforated Al 8011 sheets of1.6 mm thickness
Fig. 7 Experimental FLD ofperforated Al 8011 sheets of1.0 mm thickness
Int J Mater Form (2011) 4:389–399 395
neurons in the hidden layer have been designed and testedfor perforated Al 8011.
Result and discussion
The main objective of the proposed research scheme is todevelop an expert system for the perforated aluminium sheetthat can predict it’s forming behavior. To start with, in thepresent work, ANN models are developed to predict theforming limit diagram of Al 8011sheets for a chosen range of
size of perforation and ligament width with differentthickness. Preliminary results are discussed in this section.The deformation behavior was evaluated by the major truestrain and minor true strain.
The experimentally evaluated forming limit diagram forthe perforated Al 8011 sheets of thickness 2 mm, 1.6 and1 mm are shown in Figs. 5, 6 and 7. It is identified that theforming limit strain values are increased with the thicknessirrespective of the size of the perforation and ligament widthand also, the forming limiting stains of the perforated Al8011 sheets are mainly depends with geometrical feature of
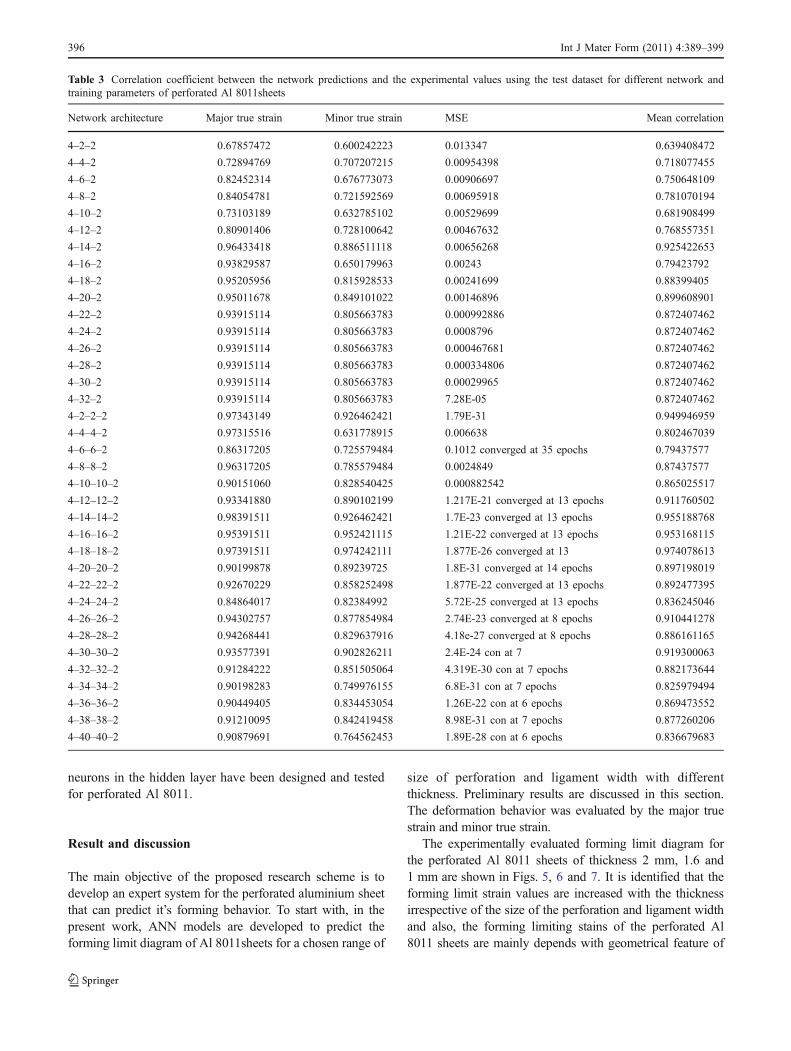
Table 3 Correlation coefficient between the network predictions and the experimental values using the test dataset for different network andtraining parameters of perforated Al 8011sheets
Network architecture Major true strain Minor true strain MSE Mean correlation
4–2–2 0.67857472 0.600242223 0.013347 0.639408472
4–4–2 0.72894769 0.707207215 0.00954398 0.718077455
4–6–2 0.82452314 0.676773073 0.00906697 0.750648109
4–8–2 0.84054781 0.721592569 0.00695918 0.781070194
4–10–2 0.73103189 0.632785102 0.00529699 0.681908499
4–12–2 0.80901406 0.728100642 0.00467632 0.768557351
4–14–2 0.96433418 0.886511118 0.00656268 0.925422653
4–16–2 0.93829587 0.650179963 0.00243 0.79423792
4–18–2 0.95205956 0.815928533 0.00241699 0.88399405
4–20–2 0.95011678 0.849101022 0.00146896 0.899608901
4–22–2 0.93915114 0.805663783 0.000992886 0.872407462
4–24–2 0.93915114 0.805663783 0.0008796 0.872407462
4–26–2 0.93915114 0.805663783 0.000467681 0.872407462
4–28–2 0.93915114 0.805663783 0.000334806 0.872407462
4–30–2 0.93915114 0.805663783 0.00029965 0.872407462
4–32–2 0.93915114 0.805663783 7.28E-05 0.872407462
4–2–2–2 0.97343149 0.926462421 1.79E-31 0.949946959
4–4–4–2 0.97315516 0.631778915 0.006638 0.802467039
4–6–6–2 0.86317205 0.725579484 0.1012 converged at 35 epochs 0.79437577
4–8–8–2 0.96317205 0.785579484 0.0024849 0.87437577
4–10–10–2 0.90151060 0.828540425 0.000882542 0.865025517
4–12–12–2 0.93341880 0.890102199 1.217E-21 converged at 13 epochs 0.911760502
4–14–14–2 0.98391511 0.926462421 1.7E-23 converged at 13 epochs 0.955188768
4–16–16–2 0.95391511 0.952421115 1.21E-22 converged at 13 epochs 0.953168115
4–18–18–2 0.97391511 0.974242111 1.877E-26 converged at 13 0.974078613
4–20–20–2 0.90199878 0.89239725 1.8E-31 converged at 14 epochs 0.897198019
4–22–22–2 0.92670229 0.858252498 1.877E-22 converged at 13 epochs 0.892477395
4–24–24–2 0.84864017 0.82384992 5.72E-25 converged at 13 epochs 0.836245046
4–26–26–2 0.94302757 0.877854984 2.74E-23 converged at 8 epochs 0.910441278
4–28–28–2 0.94268441 0.829637916 4.18e-27 converged at 8 epochs 0.886161165
4–30–30–2 0.93577391 0.902826211 2.4E-24 con at 7 0.919300063
4–32–32–2 0.91284222 0.851505064 4.319E-30 con at 7 epochs 0.882173644
4–34–34–2 0.90198283 0.749976155 6.8E-31 con at 7 epochs 0.825979494
4–36–36–2 0.90449405 0.834453054 1.26E-22 con at 6 epochs 0.869473552
4–38–38–2 0.91210095 0.842419458 8.98E-31 con at 7 epochs 0.877260206
4–40–40–2 0.90879691 0.764562453 1.89E-28 con at 6 epochs 0.836679683
396 Int J Mater Form (2011) 4:389–399
the perforated sheet (size of the perforation and ligamentwidth). These strain values are increased with ligament widthand decreased with size of perforation. Forming limit strainsis too difficult to be calculated exactly. However, artificialneural network provides a new way to map the complex andnon-linear relationship. The performance capability of eachnetwork has been examined based on the correlationcoefficient. In order to decide the optimum structure ofneural network, the rate of error convergence was checkedby changing the number of hidden neurons and number ofhidden layers. From Table 3, it is identified that the networkswith two hidden layers of 18 neurons in each layer producedthe best performance for each of the output parameters (4-18-18-2). It has the mean correlation coefficient of 0.97407.
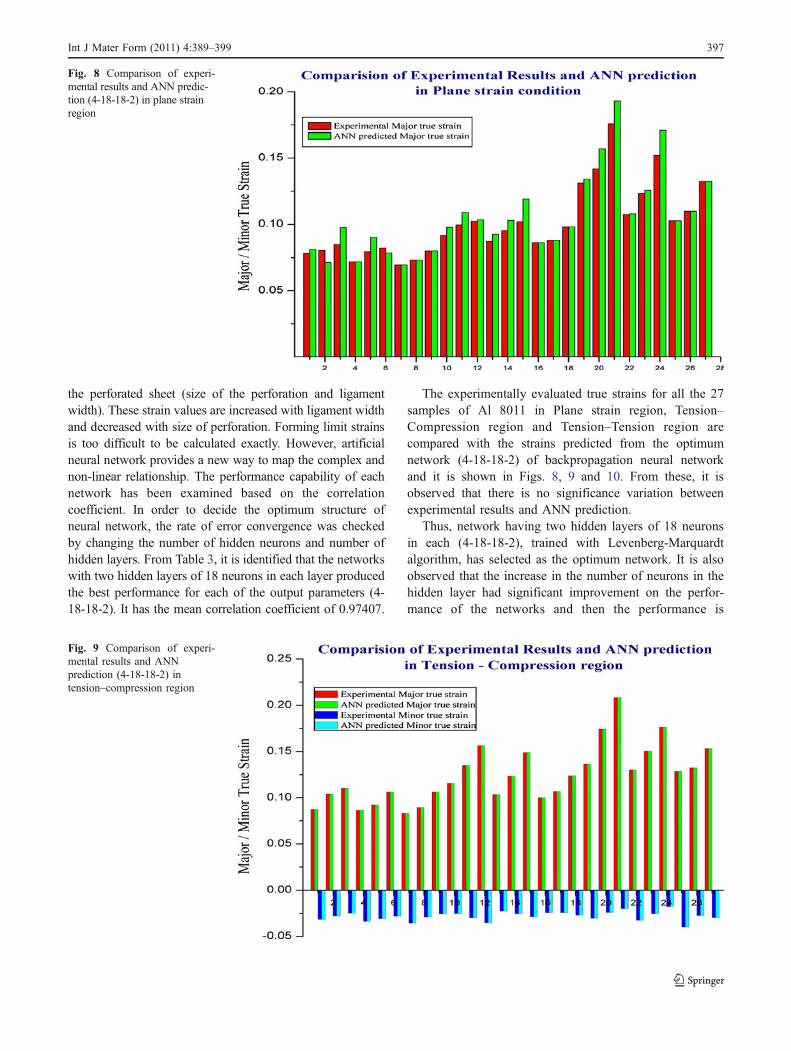
The experimentally evaluated true strains for all the 27samples of Al 8011 in Plane strain region, Tension–Compression region and Tension–Tension region arecompared with the strains predicted from the optimumnetwork (4-18-18-2) of backpropagation neural networkand it is shown in Figs. 8, 9 and 10. From these, it isobserved that there is no significance variation betweenexperimental results and ANN prediction.
Thus, network having two hidden layers of 18 neuronsin each (4-18-18-2), trained with Levenberg-Marquardtalgorithm, has selected as the optimum network. It is alsoobserved that the increase in the number of neurons in thehidden layer had significant improvement on the perfor-mance of the networks and then the performance is
Fig. 8 Comparison of experi-mental results and ANN predic-tion (4-18-18-2) in plane strainregion
Fig. 9 Comparison of experi-mental results and ANNprediction (4-18-18-2) intension–compression region
Int J Mater Form (2011) 4:389–399 397
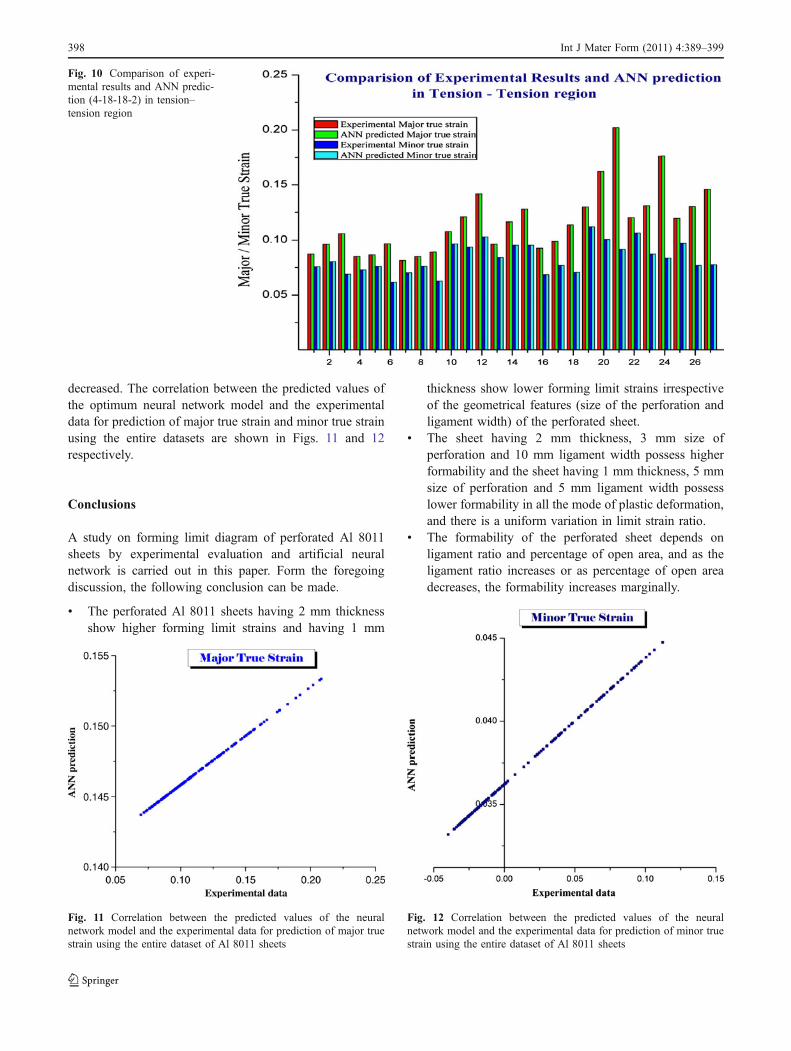
decreased. The correlation between the predicted values ofthe optimum neural network model and the experimentaldata for prediction of major true strain and minor true strainusing the entire datasets are shown in Figs. 11 and 12respectively.
Conclusions
A study on forming limit diagram of perforated Al 8011sheets by experimental evaluation and artificial neuralnetwork is carried out in this paper. Form the foregoingdiscussion, the following conclusion can be made.
& The perforated Al 8011 sheets having 2 mm thicknessshow higher forming limit strains and having 1 mm
thickness show lower forming limit strains irrespectiveof the geometrical features (size of the perforation andligament width) of the perforated sheet.
& The sheet having 2 mm thickness, 3 mm size ofperforation and 10 mm ligament width possess higherformability and the sheet having 1 mm thickness, 5 mmsize of perforation and 5 mm ligament width possesslower formability in all the mode of plastic deformation,and there is a uniform variation in limit strain ratio.
& The formability of the perforated sheet depends onligament ratio and percentage of open area, and as theligament ratio increases or as percentage of open areadecreases, the formability increases marginally.
Fig. 10 Comparison of experi-mental results and ANN predic-tion (4-18-18-2) in tension–tension region
Fig. 12 Correlation between the predicted values of the neuralnetwork model and the experimental data for prediction of minor truestrain using the entire dataset of Al 8011 sheets
Fig. 11 Correlation between the predicted values of the neuralnetwork model and the experimental data for prediction of major truestrain using the entire dataset of Al 8011 sheets
398 Int J Mater Form (2011) 4:389–399

& Based upon the correlation coefficient and convergence,36 different backpropagation neural network architec-tures are trained/analyzed using the experimental datauntil an optimum architecture is identified.
& Out of the different multi-layer backpropagation neuralnetwork architectures trained, the backpropagationneural network architectures with two hidden layershaving 18 neurons in each (4—18—18—2) trained withLevenberg–Marquardt algorithm was found to be theoptimum network model.
& A sound performance was achieved with the neuralnetwork model, and it shows good correlation betweenthe predicted values of the optimum neural networkmodel and the experimental data for prediction of majortrue strain and minor true strain using the entire datasets
In whole, the formability of the perforated Al 8011sheets from artificial neural network are in good agreementwith the experimental results for chosen thickness of thesheet, size of perforation and ligament width. Also theANN models are able to predict the formability behaviourof the blanks within acceptable error limits.
References
1. Kim SB, Huh H, Bok HH, Moon MB (2010) Forming limitdiagram of auto-body steel sheets for high-speed sheet metalforming. J Mater Process Technol article in press
2. Ahmadi S, Eivani AR, Akbarzadeh A (2009) Experimental andanalytical studies on the prediction of forming limit diagrams.Comp Mater Sci 44:1252–1257
3. Moshksar MM, Mansorzadeh S (2003) Determination of theforming limit diagram for Al 3105 sheet. J Mater Process Technol141:138–142
4. Tourki Z, Bargui H, Sidhom H (2005) The kinetic of inducedmartensitic formation and its effect on forming limit curves in theAISI 304 stainless steel. J Mater Process Technol 166:330–336
5. Assempour A, Hashemi R, Abrinia K, Ganjiani M, Masoumi E(2009)Amethodology for prediction of forming limit stress diagramsconsidering the strain path effect. Comp Mater Sci 45:195–204
6. Bleck W, Deng Z, Papamantellos K, Gusek CO (1998) Acomparative study of the forming-limit diagram models for sheetsteels. J Mater Process Technol 83:223–230
7. Chen MH, Gao L, Zuo DW, Wang M (2007) Application of theforming limit stress diagram to forming limit prediction for themulti-step forming of auto panels. J Mater Process Technol 187–188:173–177
8. Wanga J, Zongben Xu (2010) New study on neural networks: theessential order of approximation. Neural Netw 23:618–624
9. Sivasankaran S, Narayanasamy R, Jeyapaul R, Loganathan C(2009) Modelling of wrinkling in deep drawing of different gradesof annealed commercially pure aluminium sheets when drawnthrough a conical die using artificial neural network. Mater Des30:3193–3205
10. Wang J, Wu X, Thomson PF, Flitman A (2000) A neural networksapproach to investigating the geometrical influence on wrinklingin sheet metal forming. J Mater Process Technol 105:215–220
11. Veera Babu K, Ganesh Narayanan R, Saravana Kumar G (2009)An expert system based on artificial neural network for predictingthe tensile behavior of tailor welded blanks. Expert Syst Appl36:10683–10695
12. Fu Z, Mo J, Chen L, Chen W (2010) Using genetic algorithm-back propagation neural network prediction and finite-elementmodel simulation to optimize the process of multiple-stepincremental air-bending forming of sheet metal. Mater Des31:267–277
13. Liu W, Liu Q, Ruan F, Liang Z, Qiu H (2007) Springbackprediction for sheet metal forming based on GA-ANN technology.J Mater Process Technol 187–188:27–231
14. Kazan R, Fırat M, Tiryaki AE (2009) Prediction of springback inwipe-bending process of sheet metal using neural network. MaterDes 30:418–423
15. Singh SK, Mahesh K, Gupta AK (2010) Prediction of mechanicalproperties of extra deep drawn steel in blue brittle region usingArtificial Neural Network. Mater Des 31:2288–2295
16. Capdevila C, Garcia-Mateo C, Caballero FG, Garcıa de Andres C(2006) Neural network analysis of the influence of processing onstrength and ductility of automotive low carbon sheet steels.Comp Mater Sci 38:192–201
17. http://www.perforatedsheet.net/perforatedsheet/uses.html18. Chen FK, Hung C, Kobayashi S (1988) In: Proceedings of the
16th NAMRC, SME, North American Manufacturing Research,Institute of SME, pp 15–21
19. Chen FK (1993) Analysis of plastic deformation for sheet metalswith circular perforations. J Mater Process Technol 37:175–188
20. Baik SC, Oh KH, Lee DN (1995) Forming limit diagram ofperforated sheet. Scr Metall Mater 33:1201–1207
21. Baik SC, Oh KH, Lee DN (1996) Analysis of the deformation of aperforated sheet under uniaxial tension. J Mater Process Technol58:139–144
22. Baik SC, Oh KH, Lee DN (1997) Plastic behaviour of perforatedsheets under biaxial stress state. Int J Mech Sci 39:781–793
23. Lee Y-C, Chen F-K (2000) Yield criterion for a perforated sheetwith a uniform triangular pattern of round holes and a lowligament ratio. J Mater Process Technol 103:353–361
24. Narayanasamy R, Ravi chandran M, Parthasarathi NL (2008)Effect of annealing on formability of aluminium grade 19000.Mater Des 29:1633–1653
25. Baik SC, Oh KH, Lee DN (1995) Forming limit diagram ofperforated sheet. Scr Metall Mater 33(8):1201–1207
26. Narayanasamy R, Sathiya Narayanan C (2006) Forming limitdiagram for Indian interstitial free steels. Mater Des 27:882–899
27. Cheng PJ, Lin SC (2000) Using neural networks to predictbending angle of sheet metal formed by laser. Int J Mach ToolsManuf 40:1185–1197
Int J Mater Form (2011) 4:389–399 399