
Energy balance sheets - European Commission
238
STATISTICAL BOOKS Energy balance sheets 2017 DATA 2019 edition
-
Upload
khangminh22 -
Category
Documents
-
view
0 -
download
0
Transcript of Energy balance sheets - European Commission

S TAT I S T I C A L B O O K S
S TAT I S T I C A L B O O K S
Main title
2016 edition
Energy balance sheets2017 DATA 2019 edition


Energy balance sheets 2017 DATA
2019 edition

Manuscript completed in August 2019
Neither the European Commission nor any person acting on behalf of the Commission is responsible for
the use that might be made of the following information.
Luxembourg: Publications Office of the European Union, 2019
© European Union, 2019
The European Commission is not liable for any consequence stemming from the reuse of this publication.
Reuse is authorised provided the source is acknowledged.
The reuse policy of European Commission documents is regulated by Decision 2011/833/EU (OJ L 330,
14.12.2011, p. 39).
For any use or reproduction of photos or other material that is not under the copyright of the European
Union, permission must be sought directly from the copyright holders. For more information:
https://ec.europa.eu/eurostat/about/policies/copyright
Copyright for the cover photo © pan demin/Shutterstock
Theme: Environment and energy
Collection: Statistical books
ISBN 978-92-76-08714-4 ISSN 1830-7558 doi: 10.2785/10223 Cat. No: KS-EN-19-001-EN-N

Table of contents
3 Energy balance sheets – 2017 data
Publication title
Energy balance sheets – 2017 data
Table of contents
1 Introduction .............................................................................................................. 4
2 Energy balance methodology ................................................................................. 7
3 General notes ......................................................................................................... 14
4 Cross country comparisons ................................................................................. 15
5 Simplified energy balances, key balance indicators and charts ........................ 23
European Union (28 countries) ....... 24
Euro Area (19 countries) ................. 28
Belgium ............................................. 32
Bulgaria ............................................. 36
Czechia .............................................. 40
Denmark ............................................ 44
Germany ............................................ 48
Estonia .............................................. 52
Ireland ............................................... 56
Greece ............................................... 60
Spain ................................................. 64
France ............................................... 68
Croatia ............................................... 72
Italy .................................................... 76
Cyprus ............................................... 80
Latvia ................................................. 84
Lithuania ........................................... 88
Luxembourg ..................................... 92
Hungary ............................................. 96
Malta ................................................ 100
Netherlands .................................... 104
Austria ............................................. 108
Poland ............................................. 112
Portugal .......................................... 116
Romania .......................................... 120
Slovenia .......................................... 124
Slovakia .......................................... 128
Finland ............................................ 132
Sweden ........................................... 136
United Kingdom ............................. 140
Iceland ............................................. 144
Norway ............................................ 148
Montenegro .................................... 152
North Macedonia ............................ 156
Albania ............................................ 160
Serbia .............................................. 164
Turkey ............................................. 168
Bosnia and Herzegovina ............... 172
Kosovo (UNSCR 1244/99) .............. 176
Ukraine ............................................ 180
Georgia ........................................... 184
6 Sankey diagrams (energy flow diagrams) .......................................................... 188

1 Introduction
4 Energy balance sheets – 2017 data
What is an energy balance? The energy balance is the most complete statistical accounting of energy products and their flow in
the economy. The energy balance allows users to see the total amount of energy extracted from the
environment, traded, transformed and used by end-users. It also allows seeing the relative
contribution of each energy carrier (fuel, product). The energy balance allows studying the overall
domestic energy market and monitoring impacts of energy policies. The energy balance offers a
complete view on the energy situation of a country in a compact format, such as on energy
consumption of the whole economy and of individual sectors.
The energy balance presents all statistically significant energy products (fuels) of a country and their
production, transformation and consumption by different types of economic actors (industry,
transport, etc.). Therefore, an energy balance is the natural starting point to study the energy sector.
The energy balance is a multi-purpose tool to:
Provide comprehensive information on the energy supply and demand in order to
understand the energy security situation, the effective functioning of energy markets and
other relevant policy goals, as well as to formulate energy policies;
Provide the essential basis for calculating various indicators, including indicators monitoring
progress towards Energy Union and Europe 2020 targets (energy efficiency indicators,
share of renewable energy, energy dependency, etc.);
Ensure comparability of statistical information between different reference periods and
between different countries/regions;
Provide data for the calculation of greenhouse gas emissions from fuel combustion;
Serve as a quality tool to ensure completeness, consistency and comparability of energy
statistics;
Provide an input for modelling and forecasting.
The use of energy balances In 1976 the United Nations Statistical Commission agreed on the use of energy balances as the key
instrument to coordinate work on energy statistics and to provide data in a suitable form to
understand and analyse the role of energy in the economy. Energy balance is the starting point for
constructing several indicators, such as import dependency. Certain aggregates of the energy
balance contribute to cross-domain indicators, such as energy intensity (energy input per unit of
output (GDP)). More generally, a number of questions can be answered by looking at the data in the
energy balance (such as the evolution of energy consumption by sector or efficiency of electricity
generation from combustible fuels).
1 Introduction

1 Introduction
5 Energy balance sheets – 2017 data
In addition, the energy balance can be used as a high-level check on data quality, i.e. the coherence
and accuracy of energy statistics reported for individual energy products. Substantial statistical
differences in energy units, apparent energy gains, significant losses in transformation processes,
unexplained variations in indicators may point towards underlying data problems.
Overall, the energy balance is an extremely useful and powerful tool, which is complemented by
additional indicators calculated and disseminated by Eurostat. Such indicators include:
Detailed data on origin and destinations of international trade (import/export data);
Technical data: generation and production capacities, data on fuel stockholding, various
product or flow specific indicators;
Additional disaggregation of individual statistics into specific subcategories.
Legal basis Eurostat’s energy balances are based on the data collected under Regulation (EC) No 1099/2008 on
energy statistics. In this Regulation, Annex A defines the geographical scope, aggregates as well as
the sectors (supply, transformation sector, energy sector, final consumption, end-use specification).
Annex B defines the specific modalities for annual energy statistics (including energy products).
Energy balances in European policy decision making The European Energy strategy and energy union needs to be underpinned by statistical evidence for
sound decision making. To this end, energy balances are a key input for the Commission's impact
assessments in the area of energy policies. As energy is vital to many sectors of the economy,
energy data are used in other policy domains too, the most notable are transport and climate
change.
The European Union's energy policy targets include secure energy supplies, sustainable energy
consumption and lower fossil fuel dependence. Energy balances help assessing progress in these
areas. They are also an essential input for monitoring the energy efficiency target of the Europe 2020
and 2030 strategies. Directive 2012/27/EU on energy efficiency and its implementation measures
refer to the aggregates of energy balances published by Eurostat. In the context of Eurostat's work
on sustainable development indicators, energy balances provide a central contribution to SDG 7
affordable and clean energy.
The current edition The current publication presents the simplified energy balance sheets for the reference year 2017
and key time series for the years 2005 and 2010 – 2017. Energy data are available for all Member
States of the European Union as well as Iceland, Norway, Montenegro, North Macedonia, Albania,
Serbia, Turkey, Bosnia and Herzegovina, Kosovo1, Ukraine and Georgia. The energy balance
expresses all forms of energy in a common accounting unit “toe” (tonnes of oil equivalent) as ktoe
(thousands toe) or Mtoe (millions toe).
1 This designation is without prejudice to positions on status, and in line with UNSCR 1244 and the ICJ Opinion on the Kosovo
Declaration of Independence.

1 Introduction
6 Energy balance sheets – 2017 data
Access to detailed data and additional information Annual data are available as time series starting in 1990. Full energy balances cannot be properly
presented in a pdf publication. Readers requiring more detailed energy data are kindly requested to
visit Eurostat’s website, which offers user-friendly access to detailed data in the energy domain:
Eurostat’s energy database (free commercial and non-commercial use of data)
https://ec.europa.eu/eurostat/web/energy/data/database
Complete energy balances in the MS Excel format for all years (1990-2017)
https://ec.europa.eu/eurostat/web/energy/data/energy-balances
Sankey diagrams (Energy flow diagrams)
https://ec.europa.eu/eurostat/cache/sankey/sankey.html
Shedding light on energy in the EU (Digital publication on energy)
https://ec.europa.eu/eurostat/cache/infographs/energy/
Statistics Explained articles – Energy
https://ec.europa.eu/eurostat/statistics-explained/index.php/Category:Energy
Contact Please use the following link for any questions or comments:
https://ec.europa.eu/eurostat/help/support

2 Energy balance methodology
7 Energy balance sheets — 2017 data
General methodology In a simplified way, we can say that an energy balance is a matrix, where columns are energy
products (fuels) and rows are energy flows (production – transformation – consumption). Put
differently, the energy balance is an accounting framework for the compiling, reconciliating and
understanding of data on all energy products entering, exiting and used within a country. The energy
balance is constructed for each calendar year.
When constructing energy balances, one has to bear in mind the first law of thermodynamics.
The law of conservation of energy states that total energy in an isolated system is constant; energy
can be transformed from one form to another but can be neither created nor destroyed. The first law
is often formulated by stating that the change in the internal energy of a closed system is equal to the
amount of heat supplied to the system, minus the amount of work done by the system on its
surroundings. Consequently, energy gains are not possible. If energy gains are present in data, they
are results of either statistical discrepancy (data of low accuracy) or the data collection system is not
fully considering all input products in the scope of energy statistics.
Constructing energy balances in 3 steps The first step is to construct commodity balances for each energy carrier in natural measurement
units of the energy carrier – either physical unit (tonnes and cubic meters) or energy units (GWh for
electricity and TJ for heat).
The second step is to convert the commodity balance in various units into a common energy unit, by
multiplying all the data by the appropriate conversion factor (calorific values for energy carriers in
physical units and unit conversion factor for energy carriers measured in energy units).
The third step refers to organising the columns and rows of the energy balance to avoid double
counting of energy. For example, the production of secondary products is shown in the production
row in commodity balances and it is reported as a transformation output in the energy balance.
The choice of the primary energy form The choice of the primary energy form defines the boundaries of energy statistics. The general
principle of Eurostat’s approach is that the primary energy form should be the first energy form in the
production process for which various energy uses are practised/implemented. Eurostat’s
methodology is based on the physical energy content method. For directly combustible energy
products (for example coal, crude oil, natural gas, biofuels, waste) it is their actual energy content
measured by their gross and net calorific values. For products that are not directly combustible, this
2 Energy balance methodology

2 Energy balance methodology
8 Energy balance sheets — 2017 data
principle implies choosing heat as the primary energy form for nuclear, geothermal and solar thermal;
and choosing electricity as the primary energy form for solar photovoltaic, wind, hydro, tide, wave,
ocean.
The measurement of the primary energy form for the not directly combustible fuels is done as gross
electricity production for those where electricity is the primary energy form and as gross heat
production for those where heat is the primary energy form.
According to Regulation (EC) No 1099/2008 on energy statistics the reporting is covering geothermal
and solar thermal inputs for electricity and/or heat production. In a similar way, the heat generated by
nuclear reactors has to be declared according to the reporting obligations on annual nuclear
statistics. If countries do not have information on energy inputs available, but only the amount of
electricity and/or heat produced is known, the reporting countries are advised to use the following
efficiencies to estimate inputs:
For electricity from geothermal sources: 10%
For derived heat from geothermal sources: 50%
For electricity from concentrating solar: 33%
For derived heat from solar thermal energy: 100%
For electricity and derived heat from nuclear sources: 33%
The choice of units in the energy balance The data for the different products need to be expressed in a common energy unit. The unit chosen
can be any energy unit: terajoule (TJ), gigawatt-hour (GWh), thousands of tons of oil equivalent
(ktoe), million tons of oil equivalent (Mtoe), etc.
The unit adopted by Eurostat is the joule. The joule is a derived unit of energy in the International
System of Units. It is the energy dissipated as heat when an electric current of one ampere passes
through a resistance of one ohm for one second. This definition forms one of the bases of conversion
between energy units: 1 GWh = 3.6 TJ.
Another unit used for energy balances is “the tonne of oil equivalent”. It corresponds roughly to the
average quantity of energy contained in a tonne of crude oil. Based on its energy content definition of
10⁷kilocalories, the following conversion can be derived: 1 Mtoe = 41 868 TJ.
Energy balances can be converted from one energy unit into another. Eurostat offers energy balance
data in TJ, ktoe and GWh in its database. The Eurostat’s energy balance builder tool adds Mtoe. The
table below presents the conversion factors between various energy units.
Table 1: Conversion factors between units
To: TJ Mtoe GWh
From:
TJ / 41 868 / 3.6
Mtoe × 41 868 × 11 630
GWh × 3.6 / 11 630

2 Energy balance methodology
9 Energy balance sheets — 2017 data
The choice of a heating value The energy balance can be expressed in the “net” or “gross” energy content, where net/gross refers
to the calorific values used for conversion.
The quantity known as gross calorific value (GCV) (or higher heating value or gross energy or upper
heating value or higher calorific value) is determined by bringing all the combusted products back to
their original pre-combustion temperature, and in particular, condensing any water vapour produced.
This is the same as the thermodynamic heat of combustion since the enthalpy change for the
reaction assumes a common temperature of the compounds before and after combustion, in which
case the water produced by combustion is condensed to a liquid, hence yielding its latent heat of
vaporization.
The quantity known as net calorific value (NCV) (or lower heating value or lower calorific value) is
determined by subtracting the heat of vaporization of the water vapour from the higher heating value.
This approach treats any H2O formed as a vapour. The energy required to vaporize the water,
therefore, is not released as heat.
As the net calorific value represents the amount of energy that can be actually used, Eurostat
adopted the methodology of using the net calorific values for its energy balances. This applies
to the conversion of all energy carriers (products, fuels) of energy balance for all flows of energy
balance.
The actual choice of calorific values Related to the choice of heating value is the actual choice of net calorific values used for converting
data from physical units to energy units. For this choice, Eurostat set up a cascade system:
1. The net calorific values are covered by the data transmission obligations in Regulation (EC) No
1099/2008 on energy statistics. Eurostat uses the values transmitted by countries for constructing
energy balances.
2. For primary and secondary coal products, also a reporting of gross calorific values is imposed. If
net calorific values are not provided but gross calorific values are provided, Eurostat will estimate
the net calorific value. The estimation is based on the assumption that GCV = 1.05 × NCV (the
gross calorific value is 5% higher than the net calorific value).
3. For primary and secondary coal products, if some specific calorific values are missing, then the
arithmetic average of available calorific values is used for constructing the energy balance.
For oil products in table 1 of the oil questionnaire (crude oil, NGL, refinery feedstock,
additives/oxygenates or other hydrocarbons), if an average calorific value is not reported but
calorific values for production, imports or exports are provided, then the arithmetic average of
available calorific values is used for constructing the energy balance.
4. If no calorific values are provided by a reporting country, Eurostat uses the net calorific values
enacted in Commission Regulation (EU) No 601/2012 on the monitoring and reporting of
greenhouse gas emissions pursuant to Directive 2003/87/EC of the European Parliament and of
the Council.
5. For products not covered by Commission Regulation (EU) No 601/2012, the net calorific values
used are Eurostat’s estimates. These estimates take into account the Commission Decision
2007/589/EC establishing guidelines for the monitoring and reporting of greenhouse gas
emissions pursuant to Directive 2003/87/EC of the European Parliament and of the Council.

2 Energy balance methodology
10 Energy balance sheets — 2017 data
All legal acts above refer to their consolidated versions in force on 16 August 2017. In practical
terms, Commission Decision 2007/589/EC and Commission Regulation (EU) No 601/2012 refer to
the 2006 IPCC Guidelines.
For coal and coal products, calorific values reported under "For other uses" are used also for the
following flows of the energy balance: recovered products, stock changes, autoproducers, gas works,
coal liquefaction plants, final non-energy consumption and distribution losses.
The table below presents an overview of calorific values with respect to point 4 (no shading) and
point 5 (light shading).
Table 2: Default calorific values
Product Net calorific value (TJ/kt)
Product Net calorific value (TJ/kt)
Anthracite 26.7
Aviation gasoline 44.3
Coking coal 28.2
Gasoline-type jet fuel 44.3
Other bituminous coal 25.8
Kerosene-type jet fuel 44.1
Sub-bituminous coal 18.9
Other kerosene 43.8
Lignite 11.9
Naphtha 44.5
Patent fuels 20.7
Gas oil and diesel oil (w/o bio) 43.0
Coke oven coke 28.2
(Residual) Fuel oil 40.4
Gas coke 28.2
White spirit and SPB 40.2
Coal tar 28.0
Lubricants 40.2
Brown coal briquettes 19.0
Bitumen 40.2
Peat 9.8
Petroleum coke 32.5
Peat products 16.0
Paraffin waxes 40.2
Oil shale and oil sands 8.9
Other oil products 40.2
Crude oil 42.3
Charcoal 29.5
Natural gas liquids 44.2
Pure biogasoline 27.0
Refinery feedstocks 43.0
Blended biogasoline 27.0
Additives and oxygenates 42.5
Pure biodiesels 27.0
Other hydrocarbons (w/o bio) 42.5
Blended biodiesels 27.0
Refinery gas 49.5
Pure bio jet kerosene 44.0
Ethane 46.4
Blended bio jet kerosene 44.0
Liquefied petroleum gases 47.3
Other liquid biofuels 27.4
Motor gasoline (w/o bio) 44.3
Source: Eurostat (Energy balance guide)
Creating the matrix The energy balance is presented as a matrix: a two-dimensional table with rows and columns. This
matrix can be created in different energy units, for different geographical regions and also for
different time periods. While the choice of unit, country and time period, is intuitive and has user-
specific needs, the choice of rows and columns needs to be harmonised within one me+thodological
approach. The actual link between the matrix and source data for each position of the energy
balance is available within Eurostat's energy balance builder tool.

2 Energy balance methodology
11 Energy balance sheets — 2017 data
In the tool, each cell of the energy balance matrix is linked2 to the source data cell. These links could
be to one data point in source data, to a sum of several data points, difference or other formula.
In the calculation process, the quantities are also combined with a conversion factor to TJ.
Consequently, the actually applied calculations are described in the most exhaustive level of details
in the MS Excel file representing Eurostat's energy balance builder tool.
Products (columns of the energy balance) This chapter presents the basic relationships between energy products (fuels) used in this
publication. For the full set of relationships between products, please refer to the Energy balance
guide. For the definition of individual fuels, please refer to Regulation (EC) No 1099/2008 on energy
statistics.
Total = Solid fossil fuels + Manufactured gases + Peat and peat products + Oil shale and oil sands +
Oil and petroleum products (excluding biofuel portion) + Natural gas + Renewables and biofuels +
Non-renewable waste + Nuclear heat + Heat + Electricity
Fossil fuels = Solid fossil fuels + Manufactured gases + Peat and peat products + Oil shale and oil
sands + Oil and petroleum products (excluding biofuel portion) + Natural gas + Non-renewable waste
Solid fossil fuels = Anthracite + Coking coal + Other bituminous coal + Sub-bituminous coal +
Lignite + Patent fuels + Coke oven coke + Gas coke + Coal tar + Brown coal briquettes
Manufactured gases = Gas works gas + Coke oven gas + Blast furnace gas and Other recovered
gases
Peat and peat products = Peat + Peat products
Oil and petroleum products = Crude oil + Natural gas liquids + Refinery feedstocks + Additives and
oxygenates (excluding biofuel portion) + Other hydrocarbons + Refinery gas + Ethane + Liquefied
petroleum gas + Motor gasoline (excluding biofuel portion) + Aviation gasoline + Gasoline-type jet
fuel + Kerosene-type jet fuel (excluding biofuel portion) + Other kerosene + Naphtha + Gas oil and
diesel oil (excluding biofuel portion) + Fuel oil + White spirit and special boiling point industrial spirits
+ Lubricants + Bitumen + Petroleum coke + Paraffin waxes + Other oil products not elsewhere
specified
Renewables and biofuels = Hydro power + Tide, wave and ocean + Wind power + Solar
photovoltaic + Solar thermal + Geothermal + Primary solid biofuels + Charcoal + Biogases +
Renewable municipal waste + Pure biogasoline + Blended biogasoline + Pure biodiesels + Blended
biodiesels + Pure bio jet kerosene + Blended bio jet kerosene + Other liquid biofuels + Ambient heat
(heat pumps)
Non-renewable waste = Industrial waste (non-renewable) + Non-renewable municipal waste
Flows (rows of the energy balance) Eurostat's energy balance has 3 blocks:
Top block: Supply
Medium block: Transformation input, Transformation output, Consumption of the energy
branch and Distribution losses
Bottom block: Final non-energy consumption and Final energy consumption (disaggregated
into subsectors of the industry, transport and other sectors)
2 Tracing precedent cell in MS Excel is facilitated with the keyboard shortcut: Ctrl + [

2 Energy balance methodology
12 Energy balance sheets — 2017 data
In the medium block, the Transformation input and Transformation output include real energy product
transformations as well as virtual product transformations. These virtual transformations cover the
following aspects:
blending of various products into each other
methodological transformations of electricity produced from non-combustible fuels such as
nuclear heat, hydro, wind, geothermal, solar thermal and photovoltaic
interproduct transfers, backflows and exchanges between petroleum refineries and
petrochemical industries
The difference between transformation input and transformation output constitutes the transformation
losses.
This chapter presents only the relationships between the elements used in this publication. For the
full set of relationships as well as a more detailed definition of each category, please refer to the
Energy balance guide.
Gross available energy = Primary production + Recovered & Recycled products + Imports – Export
+ Stock changes
Gross inland consumption = Gross available energy – International maritime bunkers
Total energy supply = Gross available energy – International maritime bunkers – International
aviation
Transformation input = Electricity & heat generation + Coke ovens + Blast furnaces + Gas works +
Refineries & petrochemical industry + Patent fuel plants + BKB & PB plants + Coal liquefaction plants
+ For blended natural gas + Liquid biofuels blended + Charcoal production plants + Gas-to-liquids
plants + Not elsewhere specified
Transformation output = Electricity & Heat generation + Coke ovens + Blast furnaces + Gas works
+ Refineries & Petrochemical industry + Patent fuel plants + BKB & PB plants + Coal liquefaction
plants + Blended in Natural gas + Liquid biofuels blended + Charcoal production plants + Gas-to-
liquids plants + Not elsewhere specified
Energy sector = Own use in electricity & heat generation + Coal mines + Oil & natural gas extraction
plants + Patent fuel plants + Coke ovens + BKB & PB plants + Gas works + Blast furnaces +
Petroleum refineries (oil refineries) + Nuclear industry + Coal liquefaction plants + Liquefaction &
regasification plants (LNG) + Gasification plants for biogas + Gas-to-liquids (GTL) plants + Charcoal
production plants + Not elsewhere specified (energy)
Energy available for final consumption = Total energy supply – Transformation input +
Transformation output – Energy sector – Distribution losses
Final energy consumption = Industry sector + Transport sector + Other sectors
Industry sector = Iron & steel + Chemical & petrochemical + Non-ferrous metals + Non-metallic
minerals + Transport equipment + Machinery + Mining & quarrying + Food, beverages & tobacco +
Paper, pulp & printing + Wood & wood products + Construction + Textile & leather + Not elsewhere
specified (industry)
Transport sector = Rail + Road + Domestic aviation + Domestic navigation + Pipeline transport +
Not elsewhere specified (transport)
Other sectors = Commercial & public services + Households + Agriculture & forestry + Fishing + Not
elsewhere specified (other)
Statistical differences = Energy available for final consumption – Final non-energy consumption –
Final energy consumption

2 Energy balance methodology
13 Energy balance sheets — 2017 data
Europe 2020-2030 indicators In order to allow comparison with Europe 2020 targets established prior to the actual methodology of
energy balance, these indicators approximates those calculated under the old energy balance
methodology – the methodology in place at the time of establishing the Europe 2020 targets. These
specific indicators should be used also for tracking progress towards Europe 2020 targets, regular
energy balance aggregates should not be used for this purpose. Also progress towards Europe 2030
targets can be traced using these indicators.
Gross inland consumption (Europe 2020-2030)
Primary energy consumption (Europe 2020-2030)
Final energy consumption (Europe 2020-2030)
International Recommendation for Energy Statistics Eurostat’s framework and methodology for producing energy balances are coherent with
recommendations described in the International Recommendation for Energy Statistics adopted by
the United Nations Statistical Commission in 2011. While many aspects are fully coherent, some
minor divergences exist. Please refer to the Energy balance guide for more detailed elaborations.
Literature and information sources These sources offer additional information:
Energy balance guide; Eurostat; 2019
International Recommendations for Energy Statistics; United Nations; 2016
Energy Statistics Compilers Manual; United Nations; 2016
Energy Statistics Manual; International Energy Agency – Eurostat; 2004 edition
Energy statistics methodology; Eurostat; 1988
Concepts and methods in energy statistics, with special reference to energy accounts and
balances; United Nations; 1982
In order to understand better, energy statistics and energy balances disseminated by Eurostat, it is
highly recommended to analyse the quality reports on EU energy statistics and country-specific
metadata files.

3 Notes for tables, charts, and Sankey diagrams
14 Energy balance sheets – 2017 data
Notes on geographical areas and regional aggregates EU-28 = Belgium + Bulgaria + Czechia + Denmark + Germany + Estonia + Ireland + Greece + Spain
+ France + Croatia + Italy + Cyprus + Latvia + Lithuania + Luxembourg + Hungary + Malta +
Netherlands + Austria + Poland + Portugal + Romania + Slovenia + Slovakia + Finland + Sweden +
United Kingdom
EA-19 = Belgium + Germany + Estonia + Ireland + Greece + Spain + France + Italy + Cyprus +
Latvia + Lithuania + Luxembourg + Malta + Netherlands + Austria + Portugal + Slovenia + Slovakia +
Finland
Designation ”Kosovo” is without prejudice to positions on status, and in line with UNSCR 1244 and
the ICJ Opinion on the Kosovo Declaration of Independence.
Interpretations of zeros The statistical data collection system for energy statistics cannot distinguish between the following
cases:
Energy quantity is a real zero (real no consumption)
Consumption is negligible (quantity is less than half of the respective lowest reporting unit)
Data are not available to the reporting authority
Data are confidential and not shown
All these cases are shown as “zero” in the tables in this publication and interpreted as zero for charts
shown.
Specific flags used Symbol “Z” means data are not applicable. This is either due to a methodologically impossible
combination in the energy balance matrix or due to the non-existence at the data collection phase.
For example, the following elements are not feasible: consumption of solid fossil fuel in aviation, use
of hydro power in households and renewables as transformation output of blast furnaces.
Symbol “:” means data are not available. This is when countries did not transmit data for the
reference period concerned. It only relates to periods in past. If a country transmit some data, all not
available data for that reference year will be shown as zero (see section Interpretations of zeros).
3 General notes

4 Cross country comparisons
15 Energy balance sheets – 2017 data
Selected key indicators for cross country comparisons This chapter presents selected indicators allowing meaningful comparisons between countries. The
indicators reflecting mostly the size of a country (such as absolute levels of energy consumption) are
not presented here.
Share of fossil fuels in gross available energy
This indicator is calculated as a ratio:
Numerator = Solid fossil fuels + Manufactured gases + Peat and peat products + Oil shale and oil
sands + Natural gas + Oil and petroleum products (excluding biofuel portion) + Non-renewable waste
Denominator = Total of all energies
Calculations are done for Gross available energy from dataset nrg_bal_s.
Resulting values are shown as a percentage.
Share of electricity from renewable sources in total electricity generation
This indicator is calculated as a ratio:
Numerator = Gross electricity production from Renewables and biofuels
Denominator = Total gross electricity production
Electricity produced from “other sources” and electricity produced from “chemical heat” are excluded
as information on its origin is missing – it is not known if it is renewable or not. Electricity produced
from water previously pumped uphill is neither considered as renewable.
Calculations are based on datasets nrg_bal_peh and nrg_bal_c.
Resulting values are shown as a percentage.
Energy intensity of the economy (energy per GDP in PPS)
Gross domestic product measured in purchasing power standards is more suitable to compare
across countries in a given time period.
This indicator is calculated as a ratio:
4 Cross country comparisons

4 Cross country comparisons
16 Energy balance sheets – 2017 data
Numerator = Gross available energy (Total)
Denominator = Gross domestic product at market prices measured in current prices in million
purchasing power standards
Resulting values are shown in kilograms of oil equivalent per thousand euro in purchasing power
standards.
Energy intensity of the economy (energy per chain-linked GDP)
Gross domestic product measured in chain-linked volumes is more suitable to compare development
over time in one country.
This indicator is calculated as a ratio:
Numerator = Gross available energy (Total)
Denominator = Gross domestic product at market prices measured in chain-linked volumes (2010) in
million euro
Resulting values are shown in kilograms of oil equivalent per thousand euro.
Energy use in households per capita
This indicator is calculated as a ratio:
Numerator = Final energy consumption in households of all products (Total)
Denominator = Population
Calculations are based on datasets nrg_bal_s and demo_pjan.
Resulting values are shown in kilograms of oil equivalent per capita.
Overall import dependency
This indicator is calculated as a ratio:
Numerator = Net imports (Total imports – Total exports)
Denominator = Gross available energy
Calculations are done for the total of all energies from dataset nrg_bal_s.
Resulting values are shown as a percentage.

4 Cross country comparisons
17 Energy balance sheets – 2017 data
Table 3: Share of fossil fuels in gross available energy
% 2000 2005 2010 2015 2016 2017
EU-28 80.6 79.8 77.3 73.9 74.1 74.1
EA-19 79.0 78.4 75.6 73.0 73.3 73.5
Belgium 79.3 79.0 77.6 79.3 75.1 75.7
Bulgaria 72.7 73.7 74.3 72.9 70.1 71.4
Czechia 89.7 83.6 79.9 75.7 76.7 76.0
Denmark 90.7 85.2 81.3 69.2 69.0 66.0
Germany 84.6 83.1 81.5 81.9 82.5 82.2
Estonia 91.1 91.7 90.4 85.5 87.4 86.4
Ireland 98.3 96.5 95.4 92.1 93.1 91.5
Greece 95.5 94.2 91.5 86.0 86.5 86.9
Spain 82.2 84.9 78.1 75.6 74.4 76.1
France 54.9 54.5 51.7 49.2 50.1 50.7
Croatia 78.1 77.3 74.6 70.0 71.1 71.9
Italy 92.1 90.4 85.7 80.8 81.3 80.2
Cyprus 98.3 98.1 96.4 94.2 94.4 94.1
Latvia 65.3 65.7 69.1 63.5 63.6 59.9
Lithuania 60.4 61.6 77.3 70.8 70.0 69.4
Luxembourg 85.5 92.7 89.7 83.5 81.7 81.4
Hungary 80.9 79.5 73.0 67.5 68.1 69.5
Malta 100.0 100.0 99.8 95.2 93.7 96.1
Netherlands 95.6 95.1 95.5 93.8 94.2 94.0
Austria 77.9 78.9 73.2 68.1 68.5 69.5
Poland 96.4 96.2 92.9 90.6 91.1 91.3
Portugal 85.3 85.5 77.1 78.2 78.1 81.4
Romania 85.3 84.2 75.5 73.9 73.0 74.0
Slovenia 70.5 69.2 68.6 63.4 65.1 63.6
Slovakia 74.6 71.9 70.3 64.3 65.1 66.1
Finland 56.3 55.8 57.2 46.6 47.6 44.8
Sweden 39.0 38.7 39.9 32.0 34.4 32.6
United Kingdom 89.2 89.2 90.0 83.0 82.5 81.6
Iceland 29.4 30.7 14.5 15.8 18.4 18.7
Norway 55.1 56.9 62.6 58.7 54.4 57.1
Montenegro : 56.0 64.8 65.7 63.7 64.0
North Macedonia 87.5 83.5 81.4 76.5 79.5 81.3
Albania 59.9 67.7 63.7 60.6 59.4 62.7
Serbia 86.0 89.9 87.0 87.5 88.1 87.6
Turkey 86.6 88.4 89.1 88.0 87.5 88.3
Bosnia and Herzegovina : : : 86.1 89.2 90.6
Kosovo 84.0 87.2 88.5 88.6 87.3 83.7
Ukraine 84.4 83.4 80.7 72.4 74.0 70.9
Georgia : : : 75.6 75.3 74.4
Source: Eurostat (calculations based on dataset nrg_bal_s)

4 Cross country comparisons
18 Energy balance sheets – 2017 data
Table 4: Share of electricity from renewable sources in total electricity generation
% 2000 2005 2010 2015 2016 2017
EU-28 13.9 14.1 20.4 29.2 29.5 29.9
EA-19 13.9 13.6 21.3 28.7 29.7 29.4
Belgium 1.3 2.5 6.9 21.2 17.0 18.6
Bulgaria 6.6 9.9 12.6 18.0 15.9 13.7
Czechia 3.1 3.8 6.9 11.4 11.4 11.2
Denmark 15.5 27.1 32.0 65.5 60.4 70.6
Germany 6.2 10.2 16.8 29.3 29.4 33.5
Estonia 0.2 1.1 8.1 14.4 12.4 13.8
Ireland 5.0 7.3 13.2 28.0 24.9 28.9
Greece 7.8 10.8 18.3 28.7 27.4 25.0
Spain 15.6 14.9 32.8 35.0 38.6 32.3
France 13.0 9.9 13.9 16.0 17.7 16.6
Croatia 57.3 54.1 62.8 66.8 66.3 60.4
Italy 18.9 16.4 25.8 38.8 37.6 35.4
Cyprus 0.0 0.0 1.4 8.8 8.7 8.7
Latvia 68.3 69.6 54.9 50.2 54.2 72.5
Lithuania 3.1 3.2 19.2 42.0 61.5 75.6
Luxembourg 40.7 6.3 8.3 32.3 58.3 66.8
Hungary 0.7 5.2 8.1 10.7 10.2 10.6
Malta 0.0 0.0 0.0 7.8 15.8 10.0
Netherlands 3.3 7.5 9.4 12.4 12.8 14.9
Austria 72.6 63.4 66.2 76.7 78.0 75.4
Poland 1.6 2.5 6.9 13.8 13.7 14.2
Portugal 29.7 17.9 52.8 47.5 54.6 39.1
Romania 28.7 34.0 33.5 39.7 41.8 38.0
Slovenia 28.7 23.6 29.2 29.4 31.2 27.7
Slovakia 15.0 14.9 21.7 22.8 24.8 23.9
Finland 33.5 33.4 30.1 44.7 44.4 46.9
Sweden 57.2 51.3 55.3 63.3 57.2 57.9
United Kingdom 2.7 4.3 6.9 24.8 24.7 29.6
Iceland 99.9 99.9 100.0 100.0 100.0 100.0
Norway 99.8 99.6 95.8 97.9 98.0 98.0
Montenegro : 65.2 68.4 49.7 58.7 45.1
North Macedonia 17.2 21.5 33.5 35.9 36.7 23.1
Albania 96.1 98.7 100.0 100.0 100.0 100.0
Serbia 30.7 31.8 31.8 26.9 28.1 25.5
Turkey 24.9 24.6 26.4 32.0 33.0 29.4
Bosnia and Herzegovina : : : 33.8 31.9 23.5
Kosovo 1.8 2.5 3.0 2.3 4.1 3.0
Ukraine 6.6 6.7 7.1 4.4 5.7 7.0
Georgia : : : 78.0 80.7 80.6
Source: Eurostat (calculations based on datasets nrg_bal_peh and nrg_bal_c)

4 Cross country comparisons
19 Energy balance sheets – 2017 data
Table 5: Energy intensity of the economy (energy per GDP PPS)
kgoe per 000 € 2000 2005 2010 2015 2016 2017
EU-28 183.6 162.5 141.5 113.3 113.2 111.8
EA-19 175.1 158.8 140.1 114.1 113.6 112.6
Belgium 257.7 224.6 205.9 154.3 163.2 161.6
Bulgaria 409.6 303.9 212.6 191.0 181.4 181.3
Czechia 283.7 239.0 205.6 158.6 154.8 152.7
Denmark 155.0 130.9 115.6 86.6 87.6 84.7
Germany 175.3 155.1 137.6 108.3 107.6 105.8
Estonia 419.7 283.6 267.1 197.8 211.7 195.2
Ireland 144.3 108.9 100.5 58.7 61.3 56.8
Greece 169.6 141.3 128.9 117.3 117.6 121.5
Spain 170.5 148.8 122.0 107.0 106.5 107.3
France 185.9 170.8 152.3 128.1 126.2 123.5
Croatia 202.9 175.7 145.6 116.9 115.1 115.9
Italy 130.7 129.5 113.2 93.8 90.9 92.4
Cyprus 201.9 162.7 139.4 125.9 131.4 128.3
Latvia 232.8 184.0 173.2 126.2 127.8 123.7
Lithuania 281.3 217.5 146.3 110.7 114.6 113.6
Luxembourg 172.8 178.1 139.9 95.0 94.3 95.7
Hungary 237.4 194.8 161.4 129.3 133.5 134.1
Malta 234.7 208.6 270.7 189.7 194.5 214.1
Netherlands 205.6 190.3 174.6 137.6 140.9 136.6
Austria 141.7 139.8 127.8 103.5 102.9 102.9
Poland 250.6 206.1 166.1 125.2 131.4 131.3
Portugal 152.9 138.0 112.4 102.2 101.6 104.6
Romania 319.6 222.1 133.3 99.0 92.9 91.0
Slovenia 205.0 180.4 166.4 132.6 136.3 131.5
Slovakia 330.7 246.4 172.0 134.4 133.9 138.7
Finland 274.7 246.9 232.3 188.6 195.0 190.1
Sweden 215.3 205.4 176.3 140.6 148.6 144.8
United Kingdom 173.7 142.0 124.8 94.3 93.2 89.7
Iceland 467.2 366.3 581.6 483.5 443.4 442.3
Norway 181.3 148.7 155.8 127.3 127.9 132.8
Montenegro : : 174.7 134.9 122.1 122.0
North Macedonia 247.0 215.1 161.3 122.9 120.3 122.8
Albania 176.7 149.9 100.3 87.9 92.0 91.7
Serbia 359.8 276.4 218.6 186.5 192.7 193.5
Turkey 146.3 125.8 109.6 88.1 92.5 94.8
Bosnia and Herzegovina : : : 199.7 214.2 207.8
Source: Eurostat (nrg_ind_ei)

4 Cross country comparisons
20 Energy balance sheets – 2017 data
Table 6: Energy intensity of the economy (energy per chain-linked GDP)
kgoe per 000 € 1995 2000 2005 2010 2015 2017
EU-28 176.7 158.7 153.5 141.5 123.6 121.0
EA-19 157.5 147.1 146.1 135.2 120.3 117.9
Belgium 215.3 208.3 196.0 188.4 154.9 161.5
Bulgaria 882.9 766.2 627.7 470.0 453.9 426.2
Czechia 398.7 359.9 327.8 291.0 248.6 238.5
Denmark 111.7 92.3 85.6 86.8 70.0 69.0
Germany 160.0 146.1 143.2 130.7 113.6 110.7
Estonia 665.1 454.0 359.1 399.1 323.6 317.0
Ireland 135.6 114.7 95.0 90.5 59.5 54.7
Greece 170.2 165.1 146.9 136.6 138.8 140.8
Spain 149.0 150.4 149.1 128.5 121.9 120.9
France 158.9 146.9 146.1 136.3 124.7 118.7
Croatia 265.7 239.8 224.2 209.6 189.7 186.0
Italy 116.1 113.3 117.6 112.1 101.2 101.1
Cyprus 179.1 187.0 166.4 152.4 142.0 144.1
Latvia 500.3 315.0 266.0 274.4 219.1 213.0
Lithuania 612.1 398.2 337.5 248.6 207.1 209.9
Luxembourg 144.1 118.8 134.9 115.6 90.6 90.4
Hungary 373.0 311.9 285.4 269.1 231.5 230.1
Malta : 272.1 267.0 361.8 266.0 302.2
Netherlands 192.2 163.8 166.4 156.5 132.8 129.0
Austria 124.5 115.1 123.5 116.2 107.3 105.4
Poland 524.5 363.5 324.0 281.3 228.4 232.2
Portugal 155.0 155.8 160.5 138.0 137.2 137.3
Romania 558.0 443.3 354.2 279.4 219.7 205.6
Slovenia 269.2 231.2 220.8 199.6 176.0 173.5
Slovakia 504.9 423.2 348.9 262.1 212.0 211.2
Finland 239.4 210.9 196.1 197.4 174.8 173.3
Sweden 204.5 163.5 157.0 142.5 122.2 122.8
United Kingdom 169.1 149.3 130.6 116.6 94.6 88.4
Iceland 385.0 429.9 351.8 542.2 494.4 448.1
Norway 101.8 95.2 90.4 104.3 85.0 84.5
Montenegro : : : 361.3 301.2 281.5
North Macedonia : 508.9 500.0 405.4 331.1 334.0
Albania : 353.2 323.5 239.2 225.8 228.1
Serbia 751.5 702.8 589.2 494.8 450.2 453.7
Turkey : 198.1 174.3 182.0 162.6 166.6
Bosnia and Herzegovina : : : : 446.2 458.0
Kosovo : : : 571.7 490.3 460.0
Source: Eurostat (nrg_ind_ei)

4 Cross country comparisons
21 Energy balance sheets – 2017 data
Table 7: Energy use in households per capita
kgoe per capita 2000 2005 2010 2015 2016 2017
EU-28 598 627 640 548 564 563
EA-19 607 634 639 549 565 567
Belgium 927 955 879 735 733 714
Bulgaria 257 272 302 304 315 326
Czechia 626 654 711 641 670 679
Denmark 791 834 904 785 805 791
Germany 795 770 764 655 682 685
Estonia 662 655 770 652 707 716
Ireland 663 717 723 578 563 539
Greece 418 503 415 405 398 410
Spain 298 351 365 323 327 332
France 670 685 702 590 620 608
Croatia 510 653 640 572 571 572
Italy 485 586 598 534 531 543
Cyprus 254 433 406 374 385 394
Latvia 557 669 655 557 581 614
Lithuania 389 449 507 465 496 511
Luxembourg 1 079 1 139 1 022 908 915 886
Hungary 548 690 664 606 626 643
Malta 197 179 167 181 182 205
Netherlands 683 659 753 568 583 568
Austria 793 784 794 739 749 752
Poland 450 510 578 499 521 525
Portugal 275 307 281 245 252 250
Romania 375 374 399 371 375 391
Slovenia 568 596 648 539 556 542
Slovakia 479 473 429 367 374 388
Finland 869 959 1 097 905 974 1 047
Sweden 824 811 860 738 757 751
United Kingdom 733 735 728 575 589 563
Iceland 1 114 1 141 1 189 1 193 1 427 1 252
Norway 854 841 912 772 776 779
Montenegro : 397 444 427 425 423
North Macedonia 238 265 262 257 237 255
Albania 123 171 168 184 169 171
Serbia 415 415 421 397 413 405
Turkey 261 281 268 259 263 278
Kosovo : 169 209 : 310 320
Ukraine 498 496 521 387 407 387
Georgia : : : 324 342 358
Source: Eurostat (calculations based on datasets nrg_bal_s and demo_pjan)

4 Cross country comparisons
22 Energy balance sheets – 2017 data
Table 8: Overall import dependency
% 2000 2005 2010 2015 2016 2017
EU-28 46.6 52.3 52.7 53.9 53.8 55.1
EA-19 64.1 65.1 62.0 62.2 62.0 63.1
Belgium 78.2 80.1 78.0 83.9 75.4 74.8
Bulgaria 46.4 47.3 40.2 36.5 38.6 39.5
Czechia 22.7 27.8 25.3 31.9 32.6 37.2
Denmark -35.9 -50.9 -16.3 13.0 13.4 11.7
Germany 59.4 60.9 60.5 62.2 63.7 63.9
Estonia 33.8 28.2 15.3 9.6 7.9 4.1
Ireland 85.4 89.6 87.2 88.9 69.1 67.1
Greece 69.0 68.2 68.6 71.0 72.9 71.1
Spain 76.9 81.6 77.2 72.9 71.5 73.9
France 51.2 51.7 48.7 46.0 47.4 48.6
Croatia 48.5 52.6 46.8 48.9 48.5 53.3
Italy 86.5 83.3 82.6 77.0 77.7 77.0
Cyprus 98.6 100.7 100.8 97.7 96.2 96.3
Latvia 61.0 63.8 45.5 51.2 47.2 44.1
Lithuania 58.9 56.6 81.9 78.4 77.6 75.6
Luxembourg 99.6 97.4 97.0 95.9 96.1 95.4
Hungary 55.0 62.2 56.9 53.9 55.8 62.6
Malta 100.2 100.0 99.0 97.3 101.1 102.9
Netherlands 38.3 37.8 28.3 48.4 45.9 51.8
Austria 65.6 72.1 63.7 60.6 62.5 64.4
Poland 10.7 17.7 31.6 29.9 30.8 38.3
Portugal 85.3 88.6 75.2 78.2 74.0 79.9
Romania 21.9 27.2 21.2 16.4 21.6 23.1
Slovenia 52.8 52.5 49.5 49.7 49.3 50.4
Slovakia 65.1 66.0 64.4 60.1 60.6 64.8
Finland 55.6 54.7 48.9 48.2 46.0 44.0
Sweden 39.3 37.9 37.8 29.3 32.3 26.6
United Kingdom -17.1 13.4 29.0 37.5 35.7 35.3
Iceland 30.6 31.2 13.9 16.4 18.9 18.6
Norway -723.8 -700.6 -518.4 -586.5 -635.6 -597.2
Montenegro : 42.5 26.4 29.8 34.7 40.2
North Macedonia 40.8 42.8 44.0 52.5 59.0 56.1
Albania 45.8 49.7 28.9 12.6 20.2 38.3
Serbia 13.9 36.6 33.5 27.7 29.7 33.8
Turkey 65.4 71.7 70.6 77.9 75.5 77.2
Bosnia and Herzegovina : : : 33.7 31.5 34.0
Kosovo 27.1 28.2 24.6 27.6 23.6 30.0
Ukraine 43.1 42.3 31.6 32.5 29.5 37.1
Georgia : : : 72.4 71.7 72.4
Source: Eurostat (nrg_ind_id)

6 Notes for tables, charts, and Sankey diagrams
23 Energy balance sheets – 2017 data
Notes for tables Definitions, methodology and notes specified in chapters 2 and 3 applies.
Notes for charts In order to avoid problems with negative values for countries that are net exporters of electricity,
chart Gross available energy by fuel does not show data on net imports or net exports of electricity
and heat. Trade of other energy commodities is included in the respective fuel categories.
In chart Gross electricity production by fuel category Other includes peat and peat products, oil
shale and oil sands, manufactured gases, non-renewable municipal and industrial wastes, heat from
chemical sources and values reported by countries as “non-specific other sources”. Electricity
produced in hydro plants from water previously pumped uphill is included under Renewables and
biofuels. In the energy balance, this electricity does not count as primary energy source for hydro
power and is included within the transformation sector.
In chart Final energy consumption by fuel category Other includes includes peat and peat
products, oil shale and oil sands, manufactured gases and non-renewable municipal and industrial
wastes.
In chart Final consumption by sector category Transport includes pipeline transport and excluded
international marine and aviation bunkers (shipping and aviation between countries). Category
Industry includes the industry sector as defined in Regulation (EC) No 1099/2008 on energy statistics
and also agriculture, forestry, fishing and data reported under other non-specified.
5 Simplified energy balances, key balance indicators and charts

+ Primary production 758 208.9 124 466.3 0.0 1 603.8 4 147.1 73 389.7 103 091.0 226 586.0 14 200.9 210 724.2 0.0 0.0
+ Recovered & recycled products 1 627.3 467.5 0.0 0.0 0.0 1 159.7 0.0 0.0 0.0 0.0 0.0 0.0
+ Imports 1 528 082.9 115 369.6 0.0 58.3 0.0 968 451.1 392 136.5 18 493.1 486.8 0.0 6.2 33 081.4
- Exports 580 305.7 15 016.1 0.0 15.0 0.0 425 156.3 96 028.5 11 843.9 36.5 0.0 5.0 32 204.4
+ Change in stock 11 810.3 3 098.3 0.0 526.8 54.8 8 680.4 -787.6 240.6 -2.9 0.0 0.0 0.0
= Gross available energy 1 719 423.6 228 385.6 0.0 2 173.9 4 201.8 626 524.6 398 411.3 233 475.7 14 648.3 210 724.2 1.3 877.0
- International maritime bunkers 44 499.4 0.0 0.0 0.0 0.0 44 472.3 27.1 0.0 0.0 0.0 0.0 0.0
= Gross inland consumption 1 674 924.2 228 385.6 0.0 2 173.9 4 201.8 582 052.3 398 384.1 233 475.7 14 648.3 210 724.2 1.3 877.0
- International aviation 51 158.0 0.0 0.0 0.0 0.0 51 158.0 0.0 0.0 0.0 0.0 0.0 0.0
= Total energy supply 1 623 766.1 228 385.6 0.0 2 173.9 4 201.8 530 894.3 398 384.1 233 475.7 14 648.3 210 724.2 1.3 877.0
Transformation input 1 528 380.7 231 541.7 8 504.7 1 874.5 4 135.6 786 331.0 125 258.4 144 557.8 10 723.6 210 724.2 775.4 3 953.7
+ Electricity & heat generation 665 619.2 157 823.5 8 504.1 1 763.9 2 494.2 16 278.7 123 326.6 129 251.3 10 723.6 210 724.2 775.4 3 953.7
+ Coke ovens 36 454.2 36 027.4 0.0 0.0 16.3 399.0 11.5 0.0 0.0 0.0 0.0 0.0
+ Blast furnaces 33 150.2 33 090.0 0.0 0.0 0.0 27.4 32.8 0.0 0.0 0.0 0.0 0.0
+ Gas works 721.0 517.9 0.0 0.0 184.8 0.4 17.9 0.0 0.0 0.0 0.0 0.0
+ Refineries & petrochemical industry 769 433.0 0.0 0.0 0.0 0.0 769 433.0 0.0 0.0 0.0 0.0 0.0 0.0
+ Patent fuel plants 208.2 145.5 0.0 0.0 0.0 62.7 0.0 0.0 0.0 0.0 0.0 0.0
+ BKB & PB plants 3 807.1 3 696.5 0.0 110.6 0.0 0.0 0.0 0.0 0.0 0.0 0.0 0.0
+ Coal liquefaction plants 1 440.2 0.0 0.0 0.0 1 440.2 0.0 0.0 0.0 0.0 0.0 0.0 0.0
+ For blended natural gas 598.7 0.0 0.0 0.0 0.0 129.5 0.0 469.1 0.0 0.0 0.0 0.0
+ Liquid biofuels blended 14 503.4 0.0 0.0 0.0 0.0 0.0 0.0 14 503.4 0.0 0.0 0.0 0.0
+ Charcoal production plants 244.2 0.0 0.0 0.0 0.0 0.0 0.0 244.2 0.0 0.0 0.0 0.0
+ Gas-to-liquids plants 0.0 0.0 0.0 0.0 0.0 0.0 0.0 0.0 0.0 0.0 0.0 0.0
+ Not elsewhere specified 2 201.4 241.0 0.6 0.0 0.0 0.3 1 869.7 89.8 0.0 0.0 0.0 0.0
Transformation output 1 175 553.5 31 254.8 19 888.2 77.0 0.0 766 501.4 501.5 14 259.5 0.0 0.0 59 391.4 283 679.8
+ Electricity & heat generation 343 071.1 0.0 0.0 0.0 0.0 0.0 0.0 0.0 0.0 0.0 59 391.4 283 679.8
+ Coke ovens 33 926.0 27 315.1 6 611.0 0.0 0.0 0.0 0.0 0.0 0.0 0.0 0.0 0.0
+ Blast furnaces 12 762.3 0.0 12 762.3 0.0 0.0 0.0 0.0 0.0 0.0 0.0 0.0 0.0
+ Gas works 468.4 0.0 468.4 0.0 0.0 0.0 0.0 0.0 0.0 0.0 0.0 0.0
+ Refineries & petrochemical industry 763 655.5 0.0 0.0 0.0 0.0 763 655.5 0.0 0.0 0.0 0.0 0.0 0.0
+ Patent fuel plants 137.2 137.2 0.0 0.0 0.0 0.0 0.0 0.0 0.0 0.0 0.0 0.0
+ BKB & PB plants 3 879.5 3 802.5 0.0 77.0 0.0 0.0 0.0 0.0 0.0 0.0 0.0 0.0
+ Coal liquefaction plants 955.0 0.0 0.0 0.0 0.0 955.0 0.0 0.0 0.0 0.0 0.0 0.0
+ Blended in natural gas 501.5 0.0 0.0 0.0 0.0 0.0 501.5 0.0 0.0 0.0 0.0 0.0
+ Liquid biofuels blended 14 173.8 0.0 0.0 0.0 0.0 0.0 0.0 14 173.8 0.0 0.0 0.0 0.0
+ Charcoal production plants 85.8 0.0 0.0 0.0 0.0 0.0 0.0 85.8 0.0 0.0 0.0 0.0
+ Gas-to-liquids plants 1 643.7 0.0 0.0 0.0 0.0 1 643.7 0.0 0.0 0.0 0.0 0.0 0.0
+ Not elsewhere specified 293.8 0.0 46.5 0.0 0.0 247.2 0.0 0.0 0.0 0.0 0.0 0.0
Energy sector 79 194.4 653.1 5 124.7 20.0 2.0 30 098.4 16 613.8 666.3 75.1 0.0 4 866.0 21 075.0
+ Own use in electricity & heat generation 15 182.7 19.0 14.8 0.0 0.0 30.1 65.9 22.6 8.1 0.0 1 159.9 13 862.4
+ Coal mines 1 467.2 301.4 32.3 0.0 2.0 71.9 31.4 0.4 0.1 0.0 122.6 905.1
+ Oil & natural gas extraction plants 8 314.9 0.0 0.0 0.0 0.0 699.6 6 911.0 0.0 0.0 0.0 16.9 687.5
+ Patent fuel plants 0.4 0.0 0.0 0.0 0.0 0.0 0.0 0.0 0.0 0.0 0.4 0.0
+ Coke ovens 3 417.3 122.6 3 045.9 0.0 0.0 0.2 28.6 0.0 0.1 0.0 93.1 126.8
+ BKB & PB plants 1 019.2 187.4 0.0 20.0 0.0 0.0 0.0 17.6 0.0 0.0 367.1 427.1
+ Gas works 14.1 0.0 0.0 0.0 0.0 0.0 0.0 3.7 0.0 0.0 0.3 10.0
+ Blast furnaces 2 235.6 1.5 1 996.2 0.0 0.0 0.6 37.0 0.0 39.3 0.0 10.7 150.4
+ Petroleum refineries (oil refineries) 43 104.2 21.3 25.0 0.0 0.0 29 067.2 8 537.9 40.1 0.0 0.0 2 246.0 3 166.8
+ Nuclear industry 102.5 0.0 0.0 0.0 0.0 0.0 0.0 0.0 0.0 0.0 0.0 102.5
+ Coal liquefaction plants 26.2 0.0 0.0 0.0 0.0 0.0 0.0 0.0 0.0 0.0 8.4 17.9
+ Liquefaction & regasification plants (LNG) 199.0 0.0 0.0 0.0 0.0 0.0 196.6 0.0 0.0 0.0 0.4 1.9
+ Gasification plants for biogas 537.8 0.0 0.0 0.0 0.0 0.0 0.0 535.2 0.0 0.0 2.6 0.0
+ Gas-to-liquids (GTL) plants 0.0 0.0 0.0 0.0 0.0 0.0 0.0 0.0 0.0 0.0 0.0 0.0
+ Charcoal production plants 0.0 0.0 0.0 0.0 0.0 0.0 0.0 0.0 0.0 0.0 0.0 0.0
+ Not elsewhere specified (energy) 3 573.5 0.0 10.4 0.0 0.0 228.7 805.4 46.8 27.6 0.0 837.8 1 616.7
Distribution losses 25 892.4 29.9 905.0 0.8 0.0 30.1 1 937.4 66.5 0.2 0.0 5 186.1 17 736.3
Available for final consumption 1 165 852.1 27 415.6 5 353.7 355.5 64.2 480 936.2 255 076.0 102 444.6 3 849.4 0.0 48 565.1 241 791.7
Final non-energy consumption 102 207.9 1 659.8 17.5 0.0 53.4 85 371.9 15 105.4 0.0 0.0 0.0 0.0 0.0
Final energy consumption 1 060 037.3 25 608.5 5 246.6 432.7 19.1 394 124.8 239 278.5 102 366.4 3 847.4 0.0 48 527.9 240 585.4
+ Industry 261 036.8 14 443.5 5 232.9 153.9 19.1 26 833.3 82 617.2 23 041.9 3 537.8 0.0 16 122.5 89 034.7
+ Iron & steel 27 860.2 3 656.4 4 976.1 0.0 0.0 609.8 8 342.6 6.5 2.6 0.0 486.4 9 779.8
+ Chemical & petrochemical 52 695.5 3 106.9 78.2 2.6 0.0 7 267.2 18 783.1 316.1 481.1 0.0 6 859.3 15 801.1
+ Non-ferrous metals 10 322.9 297.1 34.0 0.2 0.0 308.8 3 573.1 1.7 11.0 0.0 157.6 5 939.3
+ Non-metallic minerals 34 184.0 4 175.8 81.0 1.1 18.8 5 847.1 13 310.0 1 767.9 2 736.0 0.0 226.7 6 019.5
+ Transport equipment 8 697.2 240.8 37.3 0.0 0.0 387.7 2 783.2 16.0 0.1 0.0 577.0 4 655.1
+ Machinery 19 565.3 111.4 12.7 0.1 0.0 994.0 7 110.4 99.8 6.5 0.0 593.0 10 637.4
+ Mining & quarrying 3 515.9 172.1 11.5 0.0 0.0 879.8 601.3 49.2 1.6 0.0 119.3 1 681.0
+ Food, beverages & tobacco 29 947.5 1 366.4 0.9 0.6 0.3 1 792.4 14 198.0 1 142.4 6.7 0.0 1 309.0 10 130.9
+ Paper, pulp & printing 34 355.6 869.3 0.0 147.7 0.0 699.9 6 834.8 13 438.2 139.7 0.0 2 138.4 10 087.5
+ Wood & wood products 8 859.1 43.2 0.0 1.2 0.0 230.7 677.3 5 028.6 32.6 0.0 584.4 2 261.1
+ Construction 7 504.9 44.6 0.0 0.0 0.0 3 746.3 1 771.8 92.9 1.4 0.0 40.0 1 808.0
+ Textile & leather 4 244.6 56.8 0.0 0.0 0.0 218.2 2 033.4 20.7 0.7 0.0 146.8 1 768.0
+ Not elsewhere specified (industry) 18 988.5 302.5 1.2 0.4 0.0 3 851.5 2 598.1 766.5 117.9 0.0 2 884.6 8 465.9
+ Transport 326 872.1 11.7 0.0 0.0 0.0 303 030.6 3 382.6 14 890.5 0.0 0.0 0.0 5 556.8
+ Rail 6 532.4 11.7 0.0 0.0 0.0 1 932.4 0.0 28.0 0.0 0.0 0.0 4 560.4
+ Road 306 246.9 0.0 0.0 0.0 0.0 289 575.6 1 687.3 14 854.8 0.0 0.0 0.0 129.3
+ Domestic aviation 6 138.7 0.0 0.0 0.0 0.0 6 138.7 0.0 0.0 0.0 0.0 0.0 0.0
+ Domestic navigation 5 051.9 0.0 0.0 0.0 0.0 5 047.5 0.0 4.4 0.0 0.0 0.0 0.0
+ Pipeline transport 1 806.7 0.0 0.0 0.0 0.0 8.8 1 638.3 0.0 0.0 0.0 0.0 159.7
+ Not elsewhere specified (transport) 1 095.4 0.0 0.0 0.0 0.0 327.6 57.1 3.4 0.0 0.0 0.0 707.4
+ Other 472 128.4 11 153.3 13.7 278.7 0.0 64 260.9 153 278.7 64 434.0 309.6 0.0 32 405.4 145 994.0
+ Commercial & public services 154 040.6 896.2 3.0 9.4 0.0 16 002.8 45 205.7 10 060.1 303.0 0.0 9 632.3 71 928.0
+ Households 287 975.0 9 201.4 10.7 207.4 0.0 32 371.4 103 789.2 50 499.8 6.7 0.0 22 443.3 69 445.1
+ Agriculture & forestry 24 281.7 1 012.0 0.0 61.8 0.0 12 871.8 3 418.2 2 389.6 0.0 0.0 249.9 4 278.3
+ Fishing 1 493.4 0.0 0.0 0.0 0.0 1 296.7 1.3 47.3 0.0 0.0 0.0 148.2
+ Not elsewhere specified (other) 4 337.7 43.7 0.0 0.0 0.0 1 718.2 864.3 1 437.2 0.0 0.0 79.9 194.5
Statistical differences 3 606.9 147.3 89.6 -77.1 -8.2 1 439.5 692.2 78.2 1.9 0.0 37.2 1 206.3
Gross electricity production 283 260.0 56 910.4 2 803.8 450.8 852.3 5 215.9 57 034.5 86 467.3 2 182.0 71 343.0 0.0 0.0
Gross heat production 57 628.4 13 378.4 908.3 722.0 45.6 2 342.4 21 698.7 15 270.7 3 108.1 108.2 0.0 45.9
Source: Eurostat (nrg_bal_c)
24Energy balance sheets — 2017 data
Electricity
ktoe 2017
Oil and
petroleum
products
Natural
gas
Renewables
and
biofuels
Non-
renewable
waste
Nuclear
heatHeat
European Union (28 countries)Total
Solid
fossil
fuels
Manufac-
tured
gases
Peat and
peat
products
Oil shale
and oil
sands

2005 2010 2011 2012 2013 2014 2015 2016 2017
Gross available energy 1 885 707 1 817 609 1 757 302 1 738 117 1 717 327 1 655 884 1 680 744 1 692 907 1 719 424
Solid fossil fuels 311 956 276 947 281 411 288 106 281 777 262 198 258 427 236 842 228 386
Peat & peat products 2 794 3 347 3 155 3 008 2 062 2 345 2 343 2 333 2 174
Oil shale & oil sands 3 132 3 843 3 984 3 653 4 355 4 158 3 771 4 201 4 202
Crude oil & other hydrocarbons 718 802 639 325 626 396 623 995 596 445 592 793 622 352 618 796 631 501
Petroleum products 14 661 23 575 18 812 -5 423 4 894 4 616 -16 142 -4 612 -4 977
Natural gas 445 128 447 604 403 822 393 755 387 120 343 451 357 905 382 741 398 411
Nuclear heat 257 828 234 583 232 008 224 539 223 008 223 611 220 092 213 521 210 724
Renewable energies 122 177 176 703 175 492 193 033 204 406 208 438 217 385 222 860 233 476
Non-renewable wastes 7 886 11 035 11 608 11 850 12 177 12 942 13 371 14 643 14 648
Primary production 906 299 838 118 806 572 797 857 792 777 776 491 772 015 758 613 758 209
Solid fossil fuels 188 630 157 150 159 972 160 661 148 327 142 152 138 896 127 171 124 466
Peat 3 329 3 157 2 773 1 513 3 306 2 815 1 769 1 560 1 604
Oil shale and oil sands 3 091 3 855 3 982 3 996 4 360 4 253 4 216 3 629 4 147
Crude oil & other hydrocarbons 134 390 98 540 85 465 76 570 71 623 70 497 75 301 74 529 73 390
Natural gas 190 516 159 290 142 506 133 104 131 259 118 048 107 335 107 319 103 091
Nuclear heat 257 828 234 583 232 008 224 539 223 008 223 611 220 092 213 521 210 724
Renewable energies 120 632 170 559 168 412 185 837 199 017 202 516 211 425 216 678 226 586
Non-renewable wastes 7 883 10 984 11 454 11 637 11 878 12 599 12 982 14 207 14 201
Net imports 985 926 957 605 953 163 933 398 915 669 887 386 905 802 910 718 947 777
Solid fossil fuels 125 204 109 758 120 944 126 168 126 885 122 970 110 305 98 200 100 353
Crude oil 563 177 518 992 511 715 526 113 494 864 493 318 524 598 516 987 531 850
Gas/Diesel Oil (w/o bio) 25 005 27 690 25 564 14 866 23 591 21 057 25 422 28 315 24 121
Motor Gasoline (w/o bio) -39 102 -45 220 -42 111 -50 789 -47 862 -48 065 -55 766 -55 620 -57 937
Naphtha 12 255 13 667 8 971 12 662 11 731 14 003 12 651 11 897 15 801
LPG 6 564 9 003 9 410 7 881 10 988 13 542 13 527 13 526 12 899
All other oil & petroleum products 35 729 37 209 39 077 28 082 35 289 30 956 20 497 19 865 16 561
Natural gas 254 071 279 718 271 353 259 249 253 306 231 874 246 976 269 432 296 108
Transformation input 1 663 916 1 584 548 1 554 845 1 550 795 1 503 395 1 489 602 1 519 977 1 510 020 1 528 381
Electricity & heat generation 748 384 724 700 710 364 708 297 691 760 671 201 673 006 665 363 665 619
Refinery intake 736 724 668 278 656 147 653 122 621 937 620 672 647 727 646 245 657 900
Coke ovens 45 966 42 191 41 732 40 117 39 162 38 676 37 584 36 507 36 454
Blast furnaces 39 347 34 338 33 331 32 935 33 503 34 206 33 499 32 560 33 150
Transformation output 1 228 939 1 182 591 1 157 539 1 155 811 1 124 118 1 119 698 1 152 905 1 155 646 1 175 554
Electricity & heat generation 347 912 353 839 343 980 344 540 342 139 331 111 335 812 340 027 343 071
Refinery output 728 859 662 065 650 017 646 620 616 462 615 708 642 396 641 110 651 677
Coke ovens 43 175 38 537 38 293 37 015 36 097 35 662 34 952 34 030 33 926
Blast furnaces 15 160 13 237 12 922 12 790 13 103 13 527 13 350 12 778 12 762
Energy sector 89 876 86 907 85 184 82 733 79 224 77 019 79 582 78 624 79 194
Distribution losses 29 023 28 149 26 574 26 786 26 398 25 247 26 326 26 197 25 892
Available for final consumption 1 239 167 1 208 099 1 153 604 1 143 318 1 144 477 1 096 457 1 119 487 1 141 661 1 165 852
Solid fossil fuels 32 116 34 303 34 034 27 873 29 966 25 997 27 350 28 814 27 416
Manufactured gases 6 931 5 801 5 594 5 603 5 564 5 828 5 766 5 563 5 354
Peat & peat products 435 321 459 737 24 296 409 426 356
Oil shale & oil sands 192 72 -31 -105 293 58 45 448 64
Gas/Diesel Oil (w/o bio) 281 385 271 367 266 769 260 445 260 344 260 277 266 105 270 219 272 790
Motor Gasoline (w/o bio) 114 091 93 975 91 732 85 765 81 656 81 763 79 757 79 954 80 238
Naphtha 44 614 40 346 36 378 37 429 34 798 36 108 35 230 34 441 39 487
LPG 26 577 26 643 26 340 24 754 27 233 28 833 29 413 29 518 29 848
All other oil & petroleum products 87 743 73 173 68 699 60 788 57 838 53 920 55 981 57 536 58 573
Natural gas 291 755 277 878 250 466 259 426 265 991 232 936 240 487 248 400 255 076
Primary solid biofuels & charcoal 53 735 65 253 60 401 64 387 66 281 63 177 66 660 68 252 69 369
Liquid biofuels 3 292 13 192 13 412 14 059 12 966 14 095 13 759 13 480 15 091
All other renewable energies 2 695 5 738 7 342 8 171 9 221 9 731 11 406 12 619 17 985
Non-renewable wastes 1 482 2 647 2 776 2 739 3 173 3 362 3 414 3 762 3 849
Electricity 239 394 244 206 240 841 241 658 239 645 234 278 237 518 240 150 241 792
Heat 52 731 53 182 48 392 49 588 49 484 45 799 46 189 48 078 48 565
Statistical difference -117 3 314 3 969 -2 943 1 479 -3 102 -1 019 -269 3 607
Final non-energy consumption 116 090 106 172 104 065 99 179 96 058 97 931 95 647 95 581 102 208
Final energy consumption 1 123 194 1 098 612 1 045 570 1 047 081 1 046 940 1 001 628 1 024 858 1 046 348 1 060 037
Industry 305 402 267 927 265 388 260 169 257 899 254 669 254 519 257 056 261 037
Transport 325 291 320 442 317 940 307 979 304 488 308 811 313 270 320 825 326 872
Other sectors 492 502 510 244 462 242 478 933 484 553 438 148 457 069 468 467 472 128
Services 144 040 157 281 145 453 149 064 150 558 141 319 148 722 151 105 154 041
Households 310 093 321 912 286 155 299 297 303 071 266 740 278 601 287 630 287 975
Europe 2020-2030 indicators 2005 2010 2011 2012 2013 2014 2015 2016 2017
Gross inland consumption 1 836 054 1 766 381 1 704 692 1 688 542 1 669 747 1 609 220 1 633 128 1 642 521 1 663 797
Primary energy consumption 1 719 964 1 660 210 1 600 626 1 589 363 1 573 690 1 511 289 1 537 481 1 546 940 1 561 589
Final energy consumption 1 192 824 1 163 130 1 110 648 1 110 619 1 110 572 1 065 569 1 088 270 1 110 084 1 122 771
Source: Eurostat (nrg_bal_c)
25
European Union (28 countries)ktoe
Energy balance sheets — 2017 data

Source: Eurostat (nrg_bal_c)
Source: Eurostat (nrg_bal_c)
Note: Please refer to page 23 for related methodological definitions.
European Union (28 countries)
26Energy balance sheets — 2017 data
0
500 000
1 000 000
1 500 000
2 000 000
2 500 000
3 000 000
3 500 000
4 000 000
1990 1995 2000 2005 2010 2015 2017
Gross electricity production by fuel, GWh
Solid fossil fuels Oil and petroleum products Natural gas
Renewables and biofuels Nuclear heat Other
0
100 000
200 000
300 000
400 000
500 000
600 000
700 000
800 000
1990 1995 2000 2005 2010 2015 2017
Gross available energy by fuel, ktoe
Solid fossil fuels Oil and petroleum products Natural gas
Renewables and biofuels Nuclear heat Non-renewable waste

Source: Eurostat (nrg_bal_c)
Source: Eurostat (nrg_bal_c)
Note: Please refer to page 23 for related methodological definitions.
European Union (28 countries)
27Energy balance sheets — 2017 data
0
200 000
400 000
600 000
800 000
1 000 000
1 200 000
1990 1995 2000 2005 2010 2015 2017
Final energy consumption by fuel, ktoe
Solid fossil fuels Oil and petroleum products Natural gas
Renewables and biofuels Electricity Heat
Other
0
200 000
400 000
600 000
800 000
1 000 000
1 200 000
1 400 000
1990 1995 2000 2005 2010 2015 2017
Final consumption by sector, ktoe
Industry Transport Services Households Non-energy use

+ Primary production 443 768.6 46 517.2 0.0 1 489.8 4 147.1 11 441.2 47 794.5 160 641.8 10 436.2 161 300.9 0.0 0.0
+ Recovered & recycled products 1 100.2 10.2 0.0 0.0 0.0 1 090.0 0.0 0.0 0.0 0.0 0.0 0.0
+ Imports 1 195 034.3 91 271.9 0.0 24.9 0.0 756 127.6 313 839.6 10 179.1 321.4 0.0 2.0 23 267.8
- Exports 423 073.0 2 456.5 0.0 14.9 0.0 308 642.8 80 562.3 8 877.4 36.1 0.0 3.0 22 480.1
+ Change in stock 6 314.9 38.4 0.0 526.8 54.8 5 837.2 -249.1 107.8 -1.0 0.0 0.0 0.0
= Gross available energy 1 223 145.1 135 381.3 0.0 2 026.6 4 201.8 465 853.2 280 822.8 162 051.3 10 720.5 161 300.9 -1.0 787.7
- International maritime bunkers 38 760.0 0.0 0.0 0.0 0.0 38 751.9 8.1 0.0 0.0 0.0 0.0 0.0
= Gross inland consumption 1 184 385.1 135 381.3 0.0 2 026.6 4 201.8 427 101.4 280 814.7 162 051.3 10 720.5 161 300.9 -1.0 787.7
- International aviation 35 649.5 0.0 0.0 0.0 0.0 35 649.5 0.0 0.0 0.0 0.0 0.0 0.0
= Total energy supply 1 148 735.6 135 381.3 0.0 2 026.6 4 201.8 391 451.8 280 814.7 162 051.3 10 720.5 161 300.9 -1.0 787.7
Transformation input 1 128 500.3 144 515.9 5 984.0 1 739.3 4 135.6 607 914.2 88 815.1 102 160.2 8 154.3 161 300.9 741.0 3 039.7
+ Electricity & heat generation 470 758.3 93 814.7 5 984.0 1 628.7 2 494.2 14 526.7 88 067.9 91 006.1 8 154.3 161 300.9 741.0 3 039.7
+ Coke ovens 21 811.3 21 396.1 0.0 0.0 16.3 399.0 0.0 0.0 0.0 0.0 0.0 0.0
+ Blast furnaces 25 988.3 25 960.9 0.0 0.0 0.0 27.4 0.0 0.0 0.0 0.0 0.0 0.0
+ Gas works 185.2 0.0 0.0 0.0 184.8 0.4 0.0 0.0 0.0 0.0 0.0 0.0
+ Refineries & petrochemical industry 592 830.9 0.0 0.0 0.0 0.0 592 830.9 0.0 0.0 0.0 0.0 0.0 0.0
+ Patent fuel plants 0.0 0.0 0.0 0.0 0.0 0.0 0.0 0.0 0.0 0.0 0.0 0.0
+ BKB & PB plants 3 319.1 3 208.5 0.0 110.6 0.0 0.0 0.0 0.0 0.0 0.0 0.0 0.0
+ Coal liquefaction plants 1 440.2 0.0 0.0 0.0 1 440.2 0.0 0.0 0.0 0.0 0.0 0.0 0.0
+ For blended natural gas 263.3 0.0 0.0 0.0 0.0 129.5 0.0 133.7 0.0 0.0 0.0 0.0
+ Liquid biofuels blended 10 794.9 0.0 0.0 0.0 0.0 0.0 0.0 10 794.9 0.0 0.0 0.0 0.0
+ Charcoal production plants 225.5 0.0 0.0 0.0 0.0 0.0 0.0 225.5 0.0 0.0 0.0 0.0
+ Gas-to-liquids plants 0.0 0.0 0.0 0.0 0.0 0.0 0.0 0.0 0.0 0.0 0.0 0.0
+ Not elsewhere specified 883.3 135.7 0.0 0.0 0.0 0.3 747.3 0.0 0.0 0.0 0.0 0.0
Transformation output 872 242.9 19 655.1 13 857.1 77.0 0.0 590 114.2 166.1 10 560.8 0.0 0.0 35 466.0 202 346.6
+ Electricity & heat generation 237 812.6 0.0 0.0 0.0 0.0 0.0 0.0 0.0 0.0 0.0 35 466.0 202 346.6
+ Coke ovens 20 128.1 16 283.1 3 845.0 0.0 0.0 0.0 0.0 0.0 0.0 0.0 0.0 0.0
+ Blast furnaces 9 869.9 0.0 9 869.9 0.0 0.0 0.0 0.0 0.0 0.0 0.0 0.0 0.0
+ Gas works 142.2 0.0 142.2 0.0 0.0 0.0 0.0 0.0 0.0 0.0 0.0 0.0
+ Refineries & petrochemical industry 588 276.3 0.0 0.0 0.0 0.0 588 276.3 0.0 0.0 0.0 0.0 0.0 0.0
+ Patent fuel plants 0.0 0.0 0.0 0.0 0.0 0.0 0.0 0.0 0.0 0.0 0.0 0.0
+ BKB & PB plants 3 449.0 3 372.0 0.0 77.0 0.0 0.0 0.0 0.0 0.0 0.0 0.0 0.0
+ Coal liquefaction plants 955.0 0.0 0.0 0.0 0.0 955.0 0.0 0.0 0.0 0.0 0.0 0.0
+ Blended in natural gas 166.1 0.0 0.0 0.0 0.0 0.0 166.1 0.0 0.0 0.0 0.0 0.0
+ Liquid biofuels blended 10 482.9 0.0 0.0 0.0 0.0 0.0 0.0 10 482.9 0.0 0.0 0.0 0.0
+ Charcoal production plants 77.9 0.0 0.0 0.0 0.0 0.0 0.0 77.9 0.0 0.0 0.0 0.0
+ Gas-to-liquids plants 636.8 0.0 0.0 0.0 0.0 636.8 0.0 0.0 0.0 0.0 0.0 0.0
+ Not elsewhere specified 246.1 0.0 0.0 0.0 0.0 246.1 0.0 0.0 0.0 0.0 0.0 0.0
Energy sector 51 561.0 258.7 3 189.6 20.0 2.0 21 780.1 9 229.8 616.4 75.0 0.0 2 675.7 13 713.6
+ Own use in electricity & heat generation 9 335.0 1.6 0.6 0.0 0.0 7.8 27.7 9.4 8.1 0.0 114.2 9 165.5
+ Coal mines 224.6 1.0 0.0 0.0 2.0 30.8 16.1 0.0 0.0 0.0 6.0 168.7
+ Oil & natural gas extraction plants 2 347.7 0.0 0.0 0.0 0.0 3.3 1 866.9 0.0 0.0 0.0 16.8 460.7
+ Patent fuel plants 0.0 0.0 0.0 0.0 0.0 0.0 0.0 0.0 0.0 0.0 0.0 0.0
+ Coke ovens 1 677.2 67.3 1 522.2 0.0 0.0 0.2 5.4 0.0 0.0 0.0 36.4 45.7
+ BKB & PB plants 894.7 187.4 0.0 20.0 0.0 0.0 0.0 17.6 0.0 0.0 245.6 424.1
+ Gas works 0.0 0.0 0.0 0.0 0.0 0.0 0.0 0.0 0.0 0.0 0.0 0.0
+ Blast furnaces 1 847.8 1.5 1 631.3 0.0 0.0 0.6 37.0 0.0 39.3 0.0 10.7 127.5
+ Petroleum refineries (oil refineries) 32 655.7 0.0 25.0 0.0 0.0 21 728.8 6 814.9 40.0 0.0 0.0 1 781.9 2 265.1
+ Nuclear industry 98.9 0.0 0.0 0.0 0.0 0.0 0.0 0.0 0.0 0.0 0.0 98.9
+ Coal liquefaction plants 26.2 0.0 0.0 0.0 0.0 0.0 0.0 0.0 0.0 0.0 8.4 17.9
+ Liquefaction & regasification plants (LNG) 87.8 0.0 0.0 0.0 0.0 0.0 87.3 0.0 0.0 0.0 0.4 0.0
+ Gasification plants for biogas 520.6 0.0 0.0 0.0 0.0 0.0 0.0 520.6 0.0 0.0 0.0 0.0
+ Gas-to-liquids (GTL) plants 0.0 0.0 0.0 0.0 0.0 0.0 0.0 0.0 0.0 0.0 0.0 0.0
+ Charcoal production plants 0.0 0.0 0.0 0.0 0.0 0.0 0.0 0.0 0.0 0.0 0.0 0.0
+ Not elsewhere specified (energy) 1 844.8 0.0 10.4 0.0 0.0 8.7 374.5 28.8 27.6 0.0 455.3 939.5
Distribution losses 16 849.3 3.3 698.7 0.8 0.0 22.0 1 086.0 66.0 0.2 0.0 2 951.1 12 021.2
Available for final consumption 824 067.9 10 258.5 3 984.8 343.5 64.2 351 849.7 181 849.9 69 769.5 2 491.0 0.0 29 097.2 174 359.8
Final non-energy consumption 78 914.6 1 129.9 0.0 0.0 53.4 67 151.7 10 579.7 0.0 0.0 0.0 0.0 0.0
Final energy consumption 741 689.8 9 026.3 3 915.6 417.5 19.1 282 580.9 170 965.0 69 761.8 2 489.1 0.0 29 120.3 173 394.2
+ Industry 187 950.1 7 863.9 3 915.6 150.6 19.1 18 426.8 63 097.1 14 779.5 2 297.9 0.0 12 612.0 64 787.7
+ Iron & steel 21 224.7 2 188.3 3 804.4 0.0 0.0 380.4 6 566.5 6.2 1.6 0.0 290.7 7 986.5
+ Chemical & petrochemical 41 091.4 1 386.2 28.9 0.0 0.0 5 927.3 15 179.2 264.3 427.5 0.0 5 668.0 12 210.0
+ Non-ferrous metals 8 175.6 211.0 0.0 0.2 0.0 237.6 2 963.0 1.5 11.0 0.0 97.5 4 653.8
+ Non-metallic minerals 24 332.1 2 589.2 32.0 1.1 18.8 4 659.5 9 613.5 1 410.4 1 664.1 0.0 173.4 4 170.1
+ Transport equipment 5 901.4 184.6 37.3 0.0 0.0 145.8 1 785.9 15.1 0.0 0.0 462.5 3 270.0
+ Machinery 14 287.0 58.0 12.6 0.1 0.0 884.6 5 034.9 67.6 5.5 0.0 417.6 7 806.1
+ Mining & quarrying 2 179.7 65.1 0.0 0.0 0.0 631.3 460.2 21.3 0.0 0.0 50.7 951.0
+ Food, beverages & tobacco 22 087.5 641.7 0.0 0.6 0.3 1 413.8 10 585.8 880.3 0.1 0.0 1 053.6 7 511.5
+ Paper, pulp & printing 23 785.1 492.6 0.0 146.9 0.0 448.8 5 896.0 8 051.4 120.8 0.0 2 003.1 6 625.5
+ Wood & wood products 6 123.7 0.1 0.0 1.2 0.0 117.4 534.1 3 378.4 32.6 0.0 438.6 1 621.3
+ Construction 5 413.0 6.5 0.0 0.0 0.0 2 828.8 1 161.6 81.5 1.3 0.0 19.0 1 314.3
+ Textile & leather 3 127.0 4.6 0.0 0.0 0.0 161.7 1 565.2 14.7 0.6 0.0 108.4 1 271.7
+ Not elsewhere specified (industry) 10 035.3 35.9 0.4 0.4 0.0 589.7 1 751.0 400.0 32.9 0.0 1 828.9 5 396.0
+ Transport 228 204.4 0.3 0.0 0.0 0.0 210 823.9 2 589.2 10 578.4 0.0 0.0 0.0 4 212.6
+ Rail 4 173.0 0.3 0.0 0.0 0.0 869.2 0.0 21.6 0.0 0.0 0.0 3 281.8
+ Road 213 052.9 0.0 0.0 0.0 0.0 200 899.7 1 507.9 10 548.9 0.0 0.0 0.0 96.5
+ Domestic aviation 4 899.7 0.0 0.0 0.0 0.0 4 899.7 0.0 0.0 0.0 0.0 0.0 0.0
+ Domestic navigation 3 891.3 0.0 0.0 0.0 0.0 3 886.8 0.0 4.4 0.0 0.0 0.0 0.0
+ Pipeline transport 1 160.2 0.0 0.0 0.0 0.0 7.8 1 024.3 0.0 0.0 0.0 0.0 128.1
+ Not elsewhere specified (transport) 1 027.4 0.0 0.0 0.0 0.0 260.8 57.1 3.4 0.0 0.0 0.0 706.2
+ Other 325 535.3 1 162.1 0.0 266.9 0.0 53 330.3 105 278.7 44 403.9 191.2 0.0 16 508.2 104 393.9
+ Commercial & public services 113 618.4 169.2 0.0 9.4 0.0 13 773.5 33 755.6 8 073.7 191.2 0.0 5 134.7 52 511.1
+ Households 193 042.9 937.0 0.0 207.4 0.0 28 628.0 68 610.6 35 229.1 0.0 0.0 11 140.6 48 290.0
+ Agriculture & forestry 16 199.5 17.0 0.0 50.0 0.0 8 691.6 2 907.6 1 025.5 0.0 0.0 155.6 3 352.2
+ Fishing 1 132.8 0.0 0.0 0.0 0.0 1 032.1 1.0 47.2 0.0 0.0 0.0 52.4
+ Not elsewhere specified (other) 1 541.6 38.8 0.0 0.0 0.0 1 205.0 3.8 28.5 0.0 0.0 77.4 188.1
Statistical differences 3 463.6 102.3 69.2 -74.0 -8.2 2 117.0 305.2 7.7 1.9 0.0 -23.1 965.6
Gross electricity production 201 951.0 35 787.8 2 247.8 433.7 852.3 4 729.8 41 888.3 60 946.2 1 566.0 53 499.1 0.0 0.0
Gross heat production 34 058.9 4 671.5 215.5 649.4 45.6 1 866.5 15 378.2 9 044.7 2 133.4 50.1 0.0 4.0
Source: Eurostat (nrg_bal_c)
28Energy balance sheets — 2017 data
Electricity
ktoe 2017
Oil and
petroleum
products
Natural
gas
Renewables
and
biofuels
Non-
renewable
waste
Nuclear
heatHeat
Euro Area (19 countries)Total
Solid
fossil
fuels
Manufac-
tured
gases
Peat and
peat
products
Oil shale
and oil
sands

2005 2010 2011 2012 2013 2014 2015 2016 2017
Gross available energy 1 339 021 1 291 610 1 248 226 1 233 630 1 221 669 1 177 628 1 195 795 1 203 642 1 223 145
Solid fossil fuels 173 874 147 782 152 591 159 116 154 621 147 958 149 725 140 705 135 381
Peat & peat products 2 485 2 988 2 816 2 755 1 823 2 169 2 200 2 179 2 027
Oil shale & oil sands 3 132 3 843 3 984 3 653 4 355 4 158 3 771 4 201 4 202
Crude oil & other hydrocarbons 537 020 473 785 461 953 459 916 445 814 443 375 468 483 467 806 476 032
Petroleum products 24 194 28 210 26 382 6 912 10 887 7 040 -12 405 -8 816 -10 179
Natural gas 303 284 310 488 283 298 278 324 274 160 239 614 251 102 265 999 280 823
Nuclear heat 201 743 188 111 182 712 174 785 173 074 174 652 171 240 165 234 161 301
Renewable energies 84 306 125 612 122 946 135 929 145 364 146 739 149 718 154 761 162 051
Non-renewable wastes 5 803 8 921 9 150 9 344 9 774 10 108 10 270 10 761 10 720
Primary production 470 535 483 161 469 021 471 635 481 345 470 499 453 125 444 302 443 769
Solid fossil fuels 73 142 58 391 58 711 59 813 55 251 53 597 51 334 45 827 46 517
Peat 3 116 2 918 2 553 1 372 3 119 2 680 1 658 1 431 1 490
Oil shale and oil sands 3 091 3 855 3 982 3 996 4 360 4 253 4 216 3 629 4 147
Crude oil & other hydrocarbons 16 909 13 452 13 322 13 380 13 628 13 919 13 628 11 339 11 441
Natural gas 83 415 85 139 79 805 77 731 79 265 65 980 52 631 52 981 47 795
Nuclear heat 201 743 188 111 182 712 174 785 173 074 174 652 171 240 165 234 161 301
Renewable energies 83 316 122 393 118 887 131 352 143 081 145 535 148 389 153 362 160 642
Non-renewable wastes 5 804 8 902 9 050 9 206 9 566 9 882 10 028 10 497 10 436
Net imports 872 329 800 623 781 503 755 689 733 865 709 603 743 981 745 919 771 961
Solid fossil fuels 100 865 89 550 93 345 96 445 94 661 93 712 94 929 91 301 88 815
Crude oil 500 155 442 083 425 055 430 570 410 110 406 021 436 571 435 875 445 741
Gas/Diesel Oil (w/o bio) 26 179 23 126 20 895 11 618 17 714 13 693 14 907 13 104 9 828
Motor Gasoline (w/o bio) -31 061 -36 317 -31 679 -37 978 -36 006 -36 778 -42 133 -42 219 -43 284
Naphtha 13 915 14 659 10 040 13 497 11 734 13 691 12 544 11 956 15 256
LPG 4 246 6 836 6 912 6 488 8 833 10 859 10 793 10 328 9 677
All other oil & petroleum products 34 673 36 239 38 958 27 434 30 141 26 293 16 610 14 628 10 268
Natural gas 219 183 219 504 211 210 199 956 192 355 178 772 196 587 208 549 233 277
Transformation input 1 206 700 1 151 543 1 126 502 1 123 016 1 090 493 1 082 957 1 111 901 1 110 476 1 128 500
Electricity & heat generation 518 308 505 609 493 497 491 944 482 184 470 142 473 359 470 534 470 758
Refinery intake 555 814 499 712 488 447 484 766 465 606 464 595 488 120 488 805 498 293
Coke ovens 26 512 24 315 24 525 23 757 22 221 21 738 21 432 22 028 21 811
Blast furnaces 28 800 26 627 26 239 25 729 25 590 25 901 25 236 25 302 25 988
Transformation output 900 639 865 744 846 066 845 185 823 324 820 660 848 708 854 128 872 243
Electricity & heat generation 236 934 242 913 236 559 236 823 236 524 228 846 232 091 235 928 237 813
Refinery output 550 329 495 782 484 581 481 051 461 943 461 794 484 276 485 169 493 548
Coke ovens 24 906 21 873 21 930 21 533 20 298 19 796 19 705 20 340 20 128
Blast furnaces 11 048 10 169 10 020 9 796 9 829 10 139 10 009 9 846 9 870
Energy sector 56 032 56 168 55 303 53 662 51 506 49 851 51 631 51 554 51 561
Distribution losses 16 894 17 040 16 294 16 610 17 017 16 216 16 932 17 077 16 849
Available for final consumption 887 665 859 815 821 813 814 348 817 279 781 690 795 576 806 969 824 068
Solid fossil fuels 12 906 13 286 14 444 11 115 10 806 9 874 10 437 11 633 10 258
Manufactured gases 4 483 4 251 4 159 4 128 4 116 4 333 4 338 4 228 3 985
Peat & peat products 432 312 448 735 15 287 401 416 343
Oil shale & oil sands 192 72 -31 -105 293 58 45 448 64
Gas/Diesel Oil (w/o bio) 224 034 209 021 203 656 197 681 199 342 198 327 201 150 200 314 200 338
Motor Gasoline (w/o bio) 77 224 62 773 62 047 57 639 55 197 55 494 54 225 53 798 54 513
Naphtha 38 324 35 589 32 153 33 380 30 709 31 876 30 816 30 662 34 582
LPG 17 313 17 917 17 604 16 985 19 299 20 459 20 618 20 348 20 638
All other oil & petroleum products 63 928 53 669 51 215 44 952 43 074 38 384 40 000 42 026 41 778
Natural gas 203 281 195 055 177 111 182 912 189 682 165 057 170 769 176 041 181 850
Primary solid biofuels & charcoal 36 395 43 360 38 605 41 883 43 081 40 930 43 322 44 260 45 278
Liquid biofuels 3 012 10 291 10 283 10 949 9 765 10 496 10 346 10 068 10 817
All other renewable energies 2 168 4 824 5 232 5 900 6 700 7 175 7 779 8 398 13 675
Non-renewable wastes 924 1 921 2 000 2 000 2 324 2 352 2 397 2 547 2 491
Electricity 171 940 176 634 174 411 174 978 173 474 169 167 171 490 173 170 174 360
Heat 31 108 30 839 28 475 29 217 29 404 27 421 27 443 28 612 29 097
Statistical difference 1 862 -273 1 944 -1 988 1 191 -1 345 -302 -1 059 3 464
Final non-energy consumption 88 232 82 999 81 484 78 310 75 259 76 503 73 949 74 241 78 915
Final energy consumption 797 571 777 089 738 385 738 026 740 829 706 532 721 928 733 787 741 690
Industry 219 641 195 085 193 088 189 100 186 918 184 610 183 862 186 482 187 950
Transport 238 862 230 995 228 923 220 426 218 984 221 360 223 169 226 543 228 204
Other sectors 339 068 351 010 316 375 328 500 334 927 300 562 314 897 320 763 325 535
Services 104 445 115 253 105 992 109 439 111 087 103 642 109 312 109 850 113 618
Households 208 021 214 185 190 006 198 839 203 296 176 971 186 024 191 999 193 043
Europe 2020-2030 indicators 2005 2010 2011 2012 2013 2014 2015 2016 2017
Gross inland consumption 1 294 692 1 246 418 1 203 111 1 190 972 1 181 218 1 138 436 1 156 594 1 162 145 1 176 477
Primary energy consumption 1 206 460 1 163 419 1 121 627 1 112 661 1 105 960 1 061 933 1 082 645 1 087 905 1 097 562
Final energy consumption 845 181 822 905 785 818 784 383 786 923 752 538 768 226 781 074 787 228
Source: Eurostat (nrg_bal_c)
29
Euro Area (19 countries)ktoe
Energy balance sheets — 2017 data
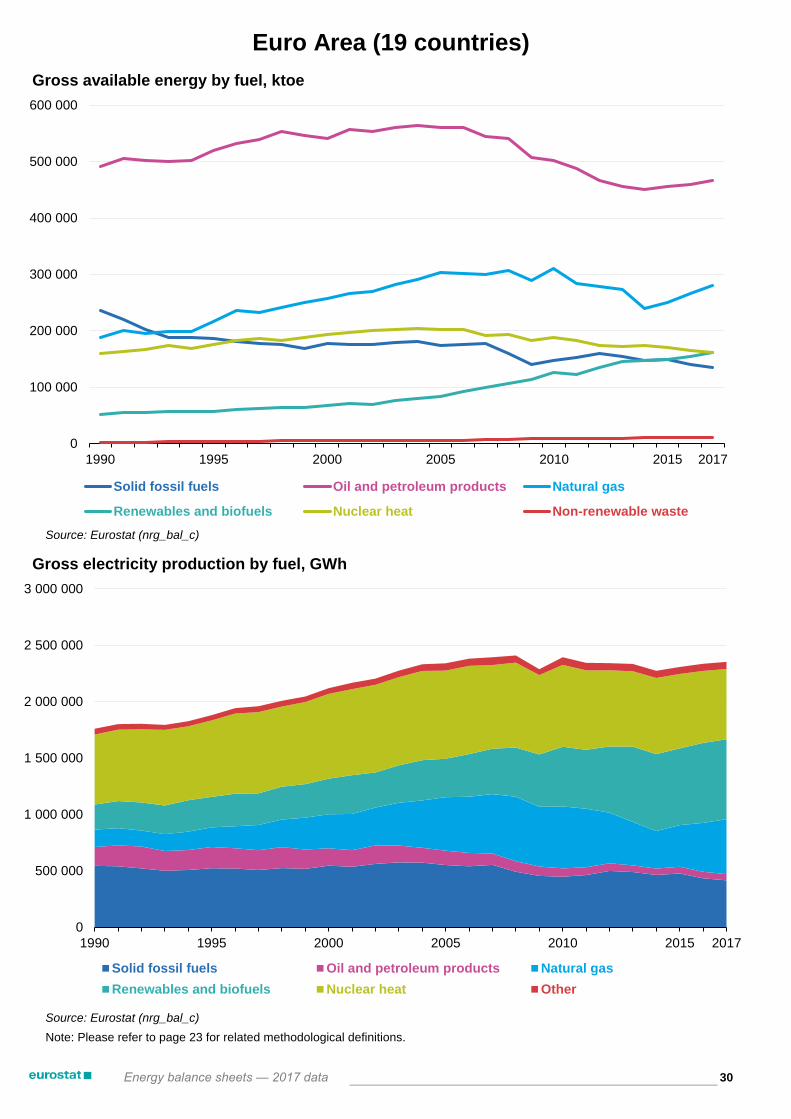
Source: Eurostat (nrg_bal_c)
Source: Eurostat (nrg_bal_c)
Note: Please refer to page 23 for related methodological definitions.
Euro Area (19 countries)
30Energy balance sheets — 2017 data
0
500 000
1 000 000
1 500 000
2 000 000
2 500 000
3 000 000
1990 1995 2000 2005 2010 2015 2017
Gross electricity production by fuel, GWh
Solid fossil fuels Oil and petroleum products Natural gas
Renewables and biofuels Nuclear heat Other
0
100 000
200 000
300 000
400 000
500 000
600 000
1990 1995 2000 2005 2010 2015 2017
Gross available energy by fuel, ktoe
Solid fossil fuels Oil and petroleum products Natural gas
Renewables and biofuels Nuclear heat Non-renewable waste

Source: Eurostat (nrg_bal_c)
Source: Eurostat (nrg_bal_c)
Note: Please refer to page 23 for related methodological definitions.
Euro Area (19 countries)
31Energy balance sheets — 2017 data
0
100 000
200 000
300 000
400 000
500 000
600 000
700 000
800 000
900 000
1990 1995 2000 2005 2010 2015 2017
Final energy consumption by fuel, ktoe
Solid fossil fuels Oil and petroleum products Natural gas
Renewables and biofuels Electricity Heat
Other
0
100 000
200 000
300 000
400 000
500 000
600 000
700 000
800 000
900 000
1 000 000
1990 1995 2000 2005 2010 2015 2017
Final consumption by sector, ktoe
Industry Transport Services Households Non-energy use

+ Primary production 14 863.8 0.0 Z 0.0 0.0 0.0 0.0 3 208.1 653.7 11 002.0 Z Z
+ Recovered & recycled products 37.0 10.2 Z 0.0 0.0 26.8 Z 0.0 Z Z Z Z
+ Imports 83 715.3 3 010.6 0.0 0.0 0.0 63 459.2 14 898.3 1 126.3 0.9 Z 0.0 1 220.1
- Exports 35 729.0 71.0 0.0 0.0 0.0 34 067.7 644.8 243.2 0.0 Z 0.0 702.3
+ Change in stock 1 229.2 130.8 0.0 0.0 0.0 865.8 232.6 0.0 0.0 Z Z Z
= Gross available energy 64 116.2 3 080.6 0.0 0.0 0.0 30 284.1 14 486.0 4 091.1 654.6 11 002.0 0.0 517.8
- International maritime bunkers 7 486.7 0.0 0.0 0.0 0.0 7 486.7 0.0 0.0 Z Z Z Z
= Gross inland consumption 56 629.5 3 080.6 0.0 0.0 0.0 22 797.4 14 486.0 4 091.1 654.6 11 002.0 0.0 517.8
- International aviation 1 581.3 Z Z Z Z 1 581.3 Z 0.0 Z Z Z Z
= Total energy supply 55 048.2 3 080.6 0.0 0.0 0.0 21 216.0 14 486.0 4 091.1 654.6 11 002.0 0.0 517.8
Transformation input 65 133.0 3 234.3 472.3 0.0 0.0 43 270.2 3 603.8 2 638.9 514.4 11 002.0 269.2 127.7
+ Electricity & heat generation 18 193.4 8.2 472.3 0.0 0.0 35.3 3 603.8 2 160.4 514.4 11 002.0 269.2 127.7
+ Coke ovens 1 092.8 1 092.8 0.0 0.0 0.0 0.0 0.0 0.0 Z Z Z Z
+ Blast furnaces 2 133.4 2 133.4 0.0 0.0 0.0 0.0 0.0 0.0 Z Z Z Z
+ Gas works 0.0 0.0 0.0 0.0 0.0 0.0 0.0 0.0 Z Z Z Z
+ Refineries & petrochemical industry 43 234.9 Z Z Z Z 43 234.9 Z Z Z Z Z Z
+ Patent fuel plants 0.0 0.0 0.0 0.0 0.0 0.0 Z 0.0 0.0 Z Z Z
+ BKB & PB plants 0.0 0.0 0.0 0.0 0.0 Z Z 0.0 0.0 Z Z Z
+ Coal liquefaction plants 0.0 0.0 0.0 0.0 0.0 Z Z Z Z Z Z Z
+ For blended natural gas 0.0 Z 0.0 Z Z 0.0 Z 0.0 Z Z Z Z
+ Liquid biofuels blended 478.5 Z Z Z Z Z Z 478.5 Z Z Z Z
+ Charcoal production plants 0.0 Z Z Z Z Z Z 0.0 Z Z Z Z
+ Gas-to-liquids plants 0.0 Z Z Z Z Z 0.0 Z Z Z Z Z
+ Not elsewhere specified 0.0 0.0 0.0 0.0 0.0 0.0 0.0 0.0 0.0 Z Z Z
Transformation output 53 503.9 873.7 881.3 0.0 Z 43 024.1 0.0 478.5 Z Z 799.3 7 446.9
+ Electricity & heat generation 8 246.3 Z Z Z Z Z Z Z Z Z 799.3 7 446.9
+ Coke ovens 1 090.0 873.7 216.3 Z Z Z Z Z Z Z Z Z
+ Blast furnaces 665.0 0.0 665.0 Z Z Z Z Z Z Z Z Z
+ Gas works 0.0 0.0 0.0 Z Z Z Z Z Z Z Z Z
+ Refineries & petrochemical industry 43 024.1 Z Z Z Z 43 024.1 Z 0.0 Z Z Z Z
+ Patent fuel plants 0.0 0.0 Z Z Z Z Z Z Z Z Z Z
+ BKB & PB plants 0.0 0.0 Z 0.0 Z Z Z Z Z Z Z Z
+ Coal liquefaction plants 0.0 Z Z Z Z 0.0 Z Z Z Z Z Z
+ Blended in natural gas 0.0 Z Z Z Z Z 0.0 Z Z Z Z Z
+ Liquid biofuels blended 478.5 Z Z Z Z Z Z 478.5 Z Z Z Z
+ Charcoal production plants 0.0 Z Z Z Z Z Z 0.0 Z Z Z Z
+ Gas-to-liquids plants 0.0 Z Z Z Z 0.0 Z Z Z Z Z Z
+ Not elsewhere specified 0.0 0.0 0.0 0.0 Z 0.0 Z Z Z Z Z Z
Energy sector 2 512.9 0.0 257.9 0.0 0.0 1 291.2 399.0 0.0 0.0 Z 107.6 457.2
+ Own use in electricity & heat generation 323.3 0.0 0.0 0.0 0.0 1.2 7.1 0.0 0.0 Z 0.3 314.7
+ Coal mines 0.0 0.0 0.0 0.0 0.0 0.0 0.0 0.0 0.0 Z 0.0 0.0
+ Oil & natural gas extraction plants 0.0 Z Z Z Z 0.0 0.0 0.0 Z Z 0.0 0.0
+ Patent fuel plants 0.0 0.0 0.0 0.0 0.0 Z Z 0.0 0.0 Z 0.0 0.0
+ Coke ovens 90.4 0.0 90.2 0.0 0.0 0.2 0.0 0.0 0.0 Z 0.0 0.0
+ BKB & PB plants 0.0 0.0 0.0 0.0 0.0 Z Z 0.0 0.0 Z 0.0 0.0
+ Gas works 0.0 0.0 0.0 0.0 0.0 0.0 0.0 0.0 0.0 Z 0.0 0.0
+ Blast furnaces 168.1 0.0 167.7 0.0 0.0 0.4 0.0 0.0 0.0 Z 0.0 0.0
+ Petroleum refineries (oil refineries) 1 922.0 0.0 0.0 0.0 0.0 1 289.4 391.9 0.0 0.0 Z 104.5 136.2
+ Nuclear industry 0.0 Z Z Z Z Z Z Z Z Z 0.0 0.0
+ Coal liquefaction plants 0.0 0.0 0.0 0.0 0.0 Z Z Z Z Z 0.0 0.0
+ Liquefaction & regasification plants (LNG) 0.4 Z Z Z Z Z 0.0 Z Z Z 0.4 0.0
+ Gasification plants for biogas 0.0 Z Z Z Z Z Z 0.0 0.0 Z 0.0 0.0
+ Gas-to-liquids (GTL) plants 0.0 Z Z Z Z Z 0.0 Z Z Z 0.0 0.0
+ Charcoal production plants 0.0 Z Z Z Z Z Z 0.0 0.0 Z 0.0 0.0
+ Not elsewhere specified (energy) 8.7 0.0 0.0 0.0 0.0 0.0 0.0 0.0 0.0 Z 2.4 6.3
Distribution losses 353.2 3.1 0.0 0.0 0.0 0.0 24.0 0.6 0.0 Z 6.6 319.0
Available for final consumption 40 552.9 717.0 151.1 0.0 0.0 19 678.7 10 459.1 1 930.1 140.2 0.0 415.9 7 060.8
Final non-energy consumption 7 453.6 254.1 0.0 0.0 0.0 6 138.6 1 060.9 0.0 Z Z Z Z
Final energy consumption 32 888.0 484.9 171.6 0.0 0.0 13 268.6 9 432.9 1 930.1 140.2 Z 415.7 7 043.9
+ Industry 10 494.6 397.4 171.6 0.0 0.0 1 412.3 3 999.4 702.3 108.3 Z 350.1 3 353.3
+ Iron & steel 1 080.7 13.4 171.6 0.0 0.0 12.5 498.3 0.0 1.6 Z 0.0 383.4
+ Chemical & petrochemical 4 020.5 7.1 0.0 0.0 0.0 1 176.0 1 326.0 7.8 2.9 Z 280.6 1 219.9
+ Non-ferrous metals 311.7 0.0 0.0 0.0 0.0 1.0 132.7 0.0 0.0 Z 0.0 178.0
+ Non-metallic minerals 1 331.3 308.1 0.0 0.0 0.0 41.5 527.8 123.3 89.6 Z 0.0 241.1
+ Transport equipment 130.4 0.0 0.0 0.0 0.0 4.4 46.3 0.0 0.0 Z 0.1 79.6
+ Machinery 291.6 0.0 0.0 0.0 0.0 16.0 121.5 1.9 0.0 Z 0.0 152.1
+ Mining & quarrying 49.2 0.0 0.0 0.0 0.0 0.0 10.3 0.0 0.0 Z 0.0 38.9
+ Food, beverages & tobacco 1 522.7 27.6 0.0 0.0 0.0 7.5 883.0 80.4 0.0 Z 40.4 483.9
+ Paper, pulp & printing 740.3 23.3 0.0 0.0 0.0 9.3 141.0 302.6 13.5 Z 28.5 222.1
+ Wood & wood products 236.4 0.0 0.0 0.0 0.0 0.0 23.7 181.3 0.0 Z 0.0 31.4
+ Construction 206.8 0.0 0.0 0.0 0.0 73.1 63.1 0.0 0.0 Z 0.0 70.7
+ Textile & leather 181.3 0.0 0.0 0.0 0.0 0.7 89.8 0.3 0.6 Z 0.5 89.3
+ Not elsewhere specified (industry) 388.5 17.9 0.0 0.0 0.0 70.4 135.8 1.5 0.0 Z 0.0 162.8
+ Transport 8 856.4 0.0 0.0 0.0 0.0 8 197.4 37.5 478.5 0.0 Z Z 142.9
+ Rail 156.1 0.0 0.0 0.0 0.0 21.7 Z 0.0 0.0 Z Z 134.4
+ Road 8 515.3 Z Z Z Z 8 024.8 8.7 478.5 0.0 Z Z 3.4
+ Domestic aviation 2.5 Z Z Z Z 2.5 Z 0.0 Z Z Z Z
+ Domestic navigation 146.8 0.0 0.0 0.0 0.0 146.8 Z 0.0 0.0 Z Z Z
+ Pipeline transport 34.0 Z Z Z Z 0.0 28.9 0.0 Z Z Z 5.1
+ Not elsewhere specified (transport) 1.7 0.0 0.0 0.0 0.0 1.7 0.0 0.0 0.0 Z Z 0.0
+ Other 13 537.0 87.5 0.0 0.0 0.0 3 658.8 5 396.0 749.3 32.0 Z 65.6 3 547.8
+ Commercial & public services 4 595.8 0.0 0.0 0.0 0.0 773.4 1 822.4 53.9 31.9 Z 60.2 1 853.9
+ Households 8 108.5 78.7 0.0 0.0 0.0 2 512.7 3 310.2 649.9 0.0 Z 0.9 1 556.0
+ Agriculture & forestry 788.1 8.8 0.0 0.0 0.0 328.4 263.4 45.3 0.0 Z 4.5 137.8
+ Fishing 0.0 0.0 0.0 0.0 0.0 0.0 0.0 0.0 0.0 Z 0.0 0.0
+ Not elsewhere specified (other) 44.6 0.0 0.0 0.0 0.0 44.4 0.0 0.3 0.0 Z 0.0 0.0
Statistical differences 211.3 -22.0 -20.5 0.0 0.0 271.5 -34.7 0.0 0.0 0.0 0.2 16.8
Gross electricity production 7 401.6 7.8 200.7 0.0 0.0 14.2 1 969.7 1 458.1 120.2 3 630.9 Z Z
Gross heat production 530.1 0.0 0.0 0.0 0.0 9.8 438.0 43.7 38.6 0.0 Z 0.0
Source: Eurostat (nrg_bal_c)
32Energy balance sheets — 2017 data
Electricity
ktoe 2017
Oil and
petroleum
products
Natural
gas
Renewables
and
biofuels
Non-
renewable
waste
Nuclear
heatHeat
BelgiumTotal
Solid
fossil
fuels
Manufac-
tured
gases
Peat and
peat
products
Oil shale
and oil
sands
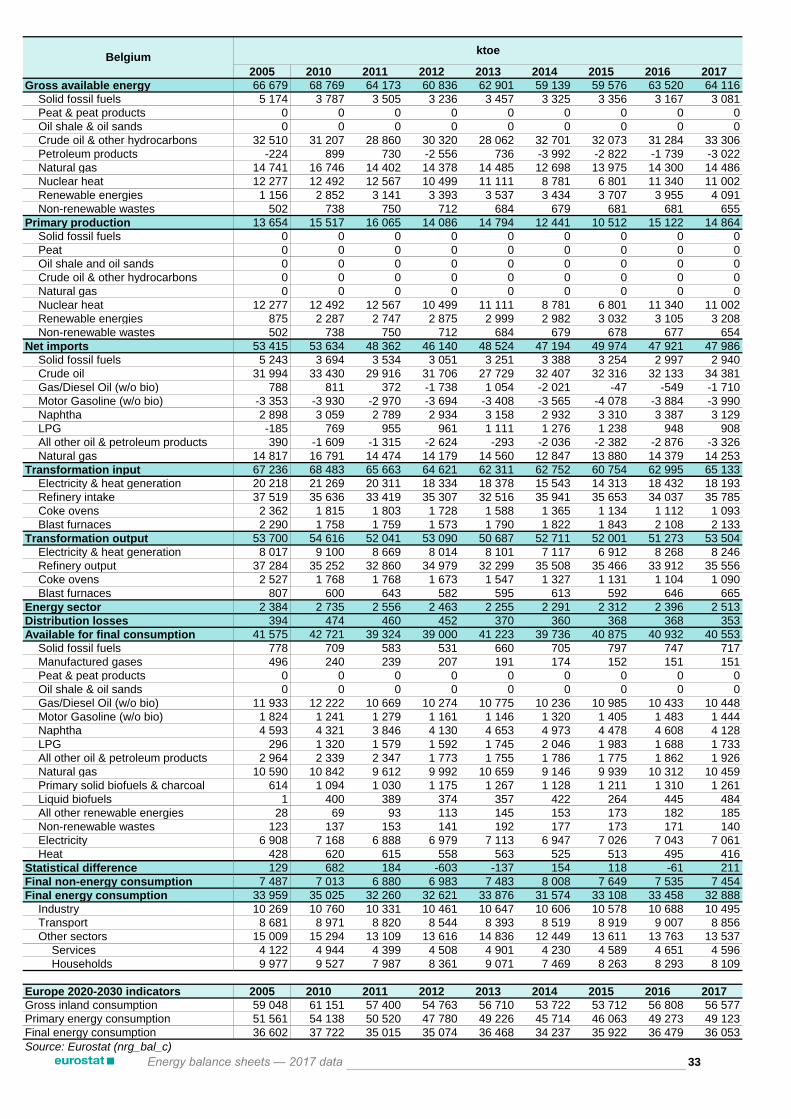
2005 2010 2011 2012 2013 2014 2015 2016 2017
Gross available energy 66 679 68 769 64 173 60 836 62 901 59 139 59 576 63 520 64 116
Solid fossil fuels 5 174 3 787 3 505 3 236 3 457 3 325 3 356 3 167 3 081
Peat & peat products 0 0 0 0 0 0 0 0 0
Oil shale & oil sands 0 0 0 0 0 0 0 0 0
Crude oil & other hydrocarbons 32 510 31 207 28 860 30 320 28 062 32 701 32 073 31 284 33 306
Petroleum products -224 899 730 -2 556 736 -3 992 -2 822 -1 739 -3 022
Natural gas 14 741 16 746 14 402 14 378 14 485 12 698 13 975 14 300 14 486
Nuclear heat 12 277 12 492 12 567 10 499 11 111 8 781 6 801 11 340 11 002
Renewable energies 1 156 2 852 3 141 3 393 3 537 3 434 3 707 3 955 4 091
Non-renewable wastes 502 738 750 712 684 679 681 681 655
Primary production 13 654 15 517 16 065 14 086 14 794 12 441 10 512 15 122 14 864
Solid fossil fuels 0 0 0 0 0 0 0 0 0
Peat 0 0 0 0 0 0 0 0 0
Oil shale and oil sands 0 0 0 0 0 0 0 0 0
Crude oil & other hydrocarbons 0 0 0 0 0 0 0 0 0
Natural gas 0 0 0 0 0 0 0 0 0
Nuclear heat 12 277 12 492 12 567 10 499 11 111 8 781 6 801 11 340 11 002
Renewable energies 875 2 287 2 747 2 875 2 999 2 982 3 032 3 105 3 208
Non-renewable wastes 502 738 750 712 684 679 678 677 654
Net imports 53 415 53 634 48 362 46 140 48 524 47 194 49 974 47 921 47 986
Solid fossil fuels 5 243 3 694 3 534 3 051 3 251 3 388 3 254 2 997 2 940
Crude oil 31 994 33 430 29 916 31 706 27 729 32 407 32 316 32 133 34 381
Gas/Diesel Oil (w/o bio) 788 811 372 -1 738 1 054 -2 021 -47 -549 -1 710
Motor Gasoline (w/o bio) -3 353 -3 930 -2 970 -3 694 -3 408 -3 565 -4 078 -3 884 -3 990
Naphtha 2 898 3 059 2 789 2 934 3 158 2 932 3 310 3 387 3 129
LPG -185 769 955 961 1 111 1 276 1 238 948 908
All other oil & petroleum products 390 -1 609 -1 315 -2 624 -293 -2 036 -2 382 -2 876 -3 326
Natural gas 14 817 16 791 14 474 14 179 14 560 12 847 13 880 14 379 14 253
Transformation input 67 236 68 483 65 663 64 621 62 311 62 752 60 754 62 995 65 133
Electricity & heat generation 20 218 21 269 20 311 18 334 18 378 15 543 14 313 18 432 18 193
Refinery intake 37 519 35 636 33 419 35 307 32 516 35 941 35 653 34 037 35 785
Coke ovens 2 362 1 815 1 803 1 728 1 588 1 365 1 134 1 112 1 093
Blast furnaces 2 290 1 758 1 759 1 573 1 790 1 822 1 843 2 108 2 133
Transformation output 53 700 54 616 52 041 53 090 50 687 52 711 52 001 51 273 53 504
Electricity & heat generation 8 017 9 100 8 669 8 014 8 101 7 117 6 912 8 268 8 246
Refinery output 37 284 35 252 32 860 34 979 32 299 35 508 35 466 33 912 35 556
Coke ovens 2 527 1 768 1 768 1 673 1 547 1 327 1 131 1 104 1 090
Blast furnaces 807 600 643 582 595 613 592 646 665
Energy sector 2 384 2 735 2 556 2 463 2 255 2 291 2 312 2 396 2 513
Distribution losses 394 474 460 452 370 360 368 368 353
Available for final consumption 41 575 42 721 39 324 39 000 41 223 39 736 40 875 40 932 40 553
Solid fossil fuels 778 709 583 531 660 705 797 747 717
Manufactured gases 496 240 239 207 191 174 152 151 151
Peat & peat products 0 0 0 0 0 0 0 0 0
Oil shale & oil sands 0 0 0 0 0 0 0 0 0
Gas/Diesel Oil (w/o bio) 11 933 12 222 10 669 10 274 10 775 10 236 10 985 10 433 10 448
Motor Gasoline (w/o bio) 1 824 1 241 1 279 1 161 1 146 1 320 1 405 1 483 1 444
Naphtha 4 593 4 321 3 846 4 130 4 653 4 973 4 478 4 608 4 128
LPG 296 1 320 1 579 1 592 1 745 2 046 1 983 1 688 1 733
All other oil & petroleum products 2 964 2 339 2 347 1 773 1 755 1 786 1 775 1 862 1 926
Natural gas 10 590 10 842 9 612 9 992 10 659 9 146 9 939 10 312 10 459
Primary solid biofuels & charcoal 614 1 094 1 030 1 175 1 267 1 128 1 211 1 310 1 261
Liquid biofuels 1 400 389 374 357 422 264 445 484
All other renewable energies 28 69 93 113 145 153 173 182 185
Non-renewable wastes 123 137 153 141 192 177 173 171 140
Electricity 6 908 7 168 6 888 6 979 7 113 6 947 7 026 7 043 7 061
Heat 428 620 615 558 563 525 513 495 416
Statistical difference 129 682 184 -603 -137 154 118 -61 211
Final non-energy consumption 7 487 7 013 6 880 6 983 7 483 8 008 7 649 7 535 7 454
Final energy consumption 33 959 35 025 32 260 32 621 33 876 31 574 33 108 33 458 32 888
Industry 10 269 10 760 10 331 10 461 10 647 10 606 10 578 10 688 10 495
Transport 8 681 8 971 8 820 8 544 8 393 8 519 8 919 9 007 8 856
Other sectors 15 009 15 294 13 109 13 616 14 836 12 449 13 611 13 763 13 537
Services 4 122 4 944 4 399 4 508 4 901 4 230 4 589 4 651 4 596
Households 9 977 9 527 7 987 8 361 9 071 7 469 8 263 8 293 8 109
Europe 2020-2030 indicators 2005 2010 2011 2012 2013 2014 2015 2016 2017
Gross inland consumption 59 048 61 151 57 400 54 763 56 710 53 722 53 712 56 808 56 577
Primary energy consumption 51 561 54 138 50 520 47 780 49 226 45 714 46 063 49 273 49 123
Final energy consumption 36 602 37 722 35 015 35 074 36 468 34 237 35 922 36 479 36 053
Source: Eurostat (nrg_bal_c)
33
Belgiumktoe
Energy balance sheets — 2017 data

Source: Eurostat (nrg_bal_c)
Source: Eurostat (nrg_bal_c)
Note: Please refer to page 23 for related methodological definitions.
Belgium
34Energy balance sheets — 2017 data
0
10 000
20 000
30 000
40 000
50 000
60 000
70 000
80 000
90 000
100 000
1990 1995 2000 2005 2010 2015 2017
Gross electricity production by fuel, GWh
Solid fossil fuels Oil and petroleum products Natural gas
Renewables and biofuels Nuclear heat Other
0
5 000
10 000
15 000
20 000
25 000
30 000
35 000
40 000
1990 1995 2000 2005 2010 2015 2017
Gross available energy by fuel, ktoe
Solid fossil fuels Oil and petroleum products Natural gas
Renewables and biofuels Nuclear heat Non-renewable waste

Source: Eurostat (nrg_bal_c)
Source: Eurostat (nrg_bal_c)
Note: Please refer to page 23 for related methodological definitions.
Belgium
35Energy balance sheets — 2017 data
0
5 000
10 000
15 000
20 000
25 000
30 000
35 000
40 000
1990 1995 2000 2005 2010 2015 2017
Final energy consumption by fuel, ktoe
Solid fossil fuels Oil and petroleum products Natural gas
Renewables and biofuels Electricity Heat
Other
0
5 000
10 000
15 000
20 000
25 000
30 000
35 000
40 000
45 000
1990 1995 2000 2005 2010 2015 2017
Final consumption by sector, ktoe
Industry Transport Services Households Non-energy use

+ Primary production 11 673.9 5 669.5 Z 0.0 0.0 24.3 66.3 1 938.1 35.1 3 940.7 Z Z
+ Recovered & recycled products 42.8 29.2 Z 0.0 0.0 13.6 Z 0.0 Z Z Z Z
+ Imports 13 312.3 582.5 0.0 0.0 0.0 9 588.0 2 723.0 100.2 0.0 Z 0.0 318.6
- Exports 5 813.3 9.3 0.0 0.0 0.0 4 880.1 26.8 107.3 0.0 Z 0.0 789.8
+ Change in stock -237.3 -149.2 0.0 0.0 0.0 -108.9 -0.2 21.0 0.0 Z Z Z
= Gross available energy 18 978.4 6 122.8 0.0 0.0 0.0 4 636.9 2 762.2 1 951.9 35.1 3 940.7 0.0 -471.2
- International maritime bunkers 80.1 0.0 0.0 0.0 0.0 80.1 0.0 0.0 Z Z Z Z
= Gross inland consumption 18 898.3 6 122.8 0.0 0.0 0.0 4 556.8 2 762.2 1 951.9 35.1 3 940.7 0.0 -471.2
- International aviation 238.0 Z Z Z Z 238.0 Z 0.0 Z Z Z Z
= Total energy supply 18 660.4 6 122.8 0.0 0.0 0.0 4 318.9 2 762.2 1 951.9 35.1 3 940.7 0.0 -471.2
Transformation input 20 108.0 6 038.6 0.0 0.0 0.0 8 228.9 1 054.4 751.0 0.1 3 940.7 12.7 81.6
+ Electricity & heat generation 11 240.0 5 627.0 0.0 0.0 0.0 166.0 834.8 577.0 0.1 3 940.7 12.7 81.6
+ Coke ovens 0.0 0.0 0.0 0.0 0.0 0.0 0.0 0.0 Z Z Z Z
+ Blast furnaces 0.0 0.0 0.0 0.0 0.0 0.0 0.0 0.0 Z Z Z Z
+ Gas works 0.0 0.0 0.0 0.0 0.0 0.0 0.0 0.0 Z Z Z Z
+ Refineries & petrochemical industry 8 062.9 Z Z Z Z 8 062.9 Z Z Z Z Z Z
+ Patent fuel plants 0.0 0.0 0.0 0.0 0.0 0.0 Z 0.0 0.0 Z Z Z
+ BKB & PB plants 411.6 411.6 0.0 0.0 0.0 Z Z 0.0 0.0 Z Z Z
+ Coal liquefaction plants 0.0 0.0 0.0 0.0 0.0 Z Z Z Z Z Z Z
+ For blended natural gas 0.0 Z 0.0 Z Z 0.0 Z 0.0 Z Z Z Z
+ Liquid biofuels blended 171.2 Z Z Z Z Z Z 171.2 Z Z Z Z
+ Charcoal production plants 2.9 Z Z Z Z Z Z 2.9 Z Z Z Z
+ Gas-to-liquids plants 0.0 Z Z Z Z Z 0.0 Z Z Z Z Z
+ Not elsewhere specified 219.5 0.0 0.0 0.0 0.0 0.0 219.5 0.0 0.0 Z Z Z
Transformation output 13 336.6 359.3 0.0 0.0 Z 7 827.8 0.0 172.7 Z Z 1 054.9 3 922.0
+ Electricity & heat generation 4 976.9 Z Z Z Z Z Z Z Z Z 1 054.9 3 922.0
+ Coke ovens 0.0 0.0 0.0 Z Z Z Z Z Z Z Z Z
+ Blast furnaces 0.0 0.0 0.0 Z Z Z Z Z Z Z Z Z
+ Gas works 0.0 0.0 0.0 Z Z Z Z Z Z Z Z Z
+ Refineries & petrochemical industry 7 610.2 Z Z Z Z 7 610.2 Z 0.0 Z Z Z Z
+ Patent fuel plants 0.0 0.0 Z Z Z Z Z Z Z Z Z Z
+ BKB & PB plants 359.3 359.3 Z 0.0 Z Z Z Z Z Z Z Z
+ Coal liquefaction plants 0.0 Z Z Z Z 0.0 Z Z Z Z Z Z
+ Blended in natural gas 0.0 Z Z Z Z Z 0.0 Z Z Z Z Z
+ Liquid biofuels blended 171.2 Z Z Z Z Z Z 171.2 Z Z Z Z
+ Charcoal production plants 1.5 Z Z Z Z Z Z 1.5 Z Z Z Z
+ Gas-to-liquids plants 217.6 Z Z Z Z 217.6 Z Z Z Z Z Z
+ Not elsewhere specified 0.0 0.0 0.0 0.0 Z 0.0 Z Z Z Z Z Z
Energy sector 1 126.3 0.6 0.0 0.0 0.0 394.2 34.1 0.7 0.0 Z 202.0 494.6
+ Own use in electricity & heat generation 435.7 0.0 0.0 0.0 0.0 0.4 0.3 0.7 0.0 Z 67.9 366.4
+ Coal mines 68.1 0.5 0.0 0.0 0.0 0.0 0.0 0.0 0.0 Z 12.5 55.1
+ Oil & natural gas extraction plants 1.0 Z Z Z Z 0.0 0.6 0.0 Z Z 0.0 0.4
+ Patent fuel plants 0.0 0.0 0.0 0.0 0.0 Z Z 0.0 0.0 Z 0.0 0.0
+ Coke ovens 0.0 0.0 0.0 0.0 0.0 0.0 0.0 0.0 0.0 Z 0.0 0.0
+ BKB & PB plants 124.0 0.0 0.0 0.0 0.0 Z Z 0.0 0.0 Z 121.5 2.5
+ Gas works 0.0 0.0 0.0 0.0 0.0 0.0 0.0 0.0 0.0 Z 0.0 0.0
+ Blast furnaces 0.0 0.0 0.0 0.0 0.0 0.0 0.0 0.0 0.0 Z 0.0 0.0
+ Petroleum refineries (oil refineries) 487.6 0.0 0.0 0.0 0.0 393.6 33.2 0.0 0.0 Z 0.0 60.8
+ Nuclear industry 0.0 Z Z Z Z Z Z Z Z Z 0.0 0.0
+ Coal liquefaction plants 0.0 0.0 0.0 0.0 0.0 Z Z Z Z Z 0.0 0.0
+ Liquefaction & regasification plants (LNG) 0.0 Z Z Z Z Z 0.0 Z Z Z 0.0 0.0
+ Gasification plants for biogas 0.0 Z Z Z Z Z Z 0.0 0.0 Z 0.0 0.0
+ Gas-to-liquids (GTL) plants 0.0 Z Z Z Z Z 0.0 Z Z Z 0.0 0.0
+ Charcoal production plants 0.0 Z Z Z Z Z Z 0.0 0.0 Z 0.0 0.0
+ Not elsewhere specified (energy) 9.9 0.0 0.0 0.0 0.0 0.2 0.1 0.0 0.0 Z 0.1 9.4
Distribution losses 486.5 5.5 0.0 0.0 0.0 1.8 11.2 0.0 0.0 Z 169.2 298.9
Available for final consumption 10 276.2 437.5 0.0 0.0 0.0 3 521.7 1 662.5 1 372.8 35.0 0.0 671.1 2 575.6
Final non-energy consumption 476.6 48.0 0.0 0.0 0.0 150.6 278.0 0.0 Z Z Z Z
Final energy consumption 9 738.3 371.6 0.0 0.0 0.0 3 370.5 1 352.7 1 378.2 35.0 Z 658.6 2 571.7
+ Industry 2 721.3 199.5 0.0 0.0 0.0 313.2 928.8 238.0 35.0 Z 198.0 808.7
+ Iron & steel 118.7 0.1 0.0 0.0 0.0 0.3 50.6 0.0 0.0 Z 0.0 67.7
+ Chemical & petrochemical 881.2 138.5 0.0 0.0 0.0 166.8 308.0 13.7 0.0 Z 154.9 99.2
+ Non-ferrous metals 162.4 1.1 0.0 0.0 0.0 11.8 39.3 0.0 0.0 Z 20.1 90.2
+ Non-metallic minerals 567.7 55.0 0.0 0.0 0.0 86.9 278.2 32.2 35.0 Z 0.0 80.3
+ Transport equipment 18.8 0.2 0.0 0.0 0.0 0.5 7.9 0.0 0.0 Z 0.0 10.2
+ Machinery 139.5 0.3 0.0 0.0 0.0 7.4 41.8 0.4 0.0 Z 0.6 89.0
+ Mining & quarrying 122.0 0.5 0.0 0.0 0.0 4.7 21.9 0.0 0.0 Z 0.0 94.9
+ Food, beverages & tobacco 227.7 0.8 0.0 0.0 0.0 10.3 89.1 9.4 0.0 Z 10.3 107.9
+ Paper, pulp & printing 220.5 1.4 0.0 0.0 0.0 0.9 41.8 138.3 0.0 Z 0.4 37.8
+ Wood & wood products 62.3 0.2 0.0 0.0 0.0 0.6 3.6 38.2 0.0 Z 0.0 19.5
+ Construction 55.9 0.1 0.0 0.0 0.0 20.1 13.2 0.1 0.0 Z 0.9 21.5
+ Textile & leather 66.6 1.4 0.0 0.0 0.0 1.7 19.6 1.8 0.0 Z 10.7 31.5
+ Not elsewhere specified (industry) 78.0 0.1 0.0 0.0 0.0 1.1 13.7 3.9 0.0 Z 0.2 59.0
+ Transport 3 325.2 0.0 0.0 0.0 0.0 2 880.5 246.0 166.2 0.0 Z Z 32.5
+ Rail 39.7 0.0 0.0 0.0 0.0 13.5 Z 0.0 0.0 Z Z 26.2
+ Road 3 092.2 Z Z Z Z 2 846.4 75.0 166.2 0.0 Z Z 4.5
+ Domestic aviation 20.6 Z Z Z Z 20.6 Z 0.0 Z Z Z Z
+ Domestic navigation 0.0 0.0 0.0 0.0 0.0 0.0 Z 0.0 0.0 Z Z Z
+ Pipeline transport 172.7 Z Z Z Z 0.0 171.0 0.0 Z Z Z 1.8
+ Not elsewhere specified (transport) 0.0 0.0 0.0 0.0 0.0 0.0 0.0 0.0 0.0 Z Z 0.0
+ Other 3 691.8 172.1 0.0 0.0 0.0 176.7 177.9 974.0 0.0 Z 460.5 1 730.5
+ Commercial & public services 1 199.5 3.9 0.0 0.0 0.0 34.8 94.7 196.7 0.0 Z 115.8 753.7
+ Households 2 318.7 158.7 0.0 0.0 0.0 24.9 68.1 769.6 0.0 Z 339.8 957.7
+ Agriculture & forestry 173.2 9.5 0.0 0.0 0.0 117.0 15.1 7.8 0.0 Z 5.0 18.8
+ Fishing 0.3 0.0 0.0 0.0 0.0 0.0 0.0 0.0 0.0 Z 0.0 0.3
+ Not elsewhere specified (other) 0.0 0.0 0.0 0.0 0.0 0.0 0.0 0.0 0.0 Z 0.0 0.0
Statistical differences 61.2 17.8 0.0 0.0 0.0 0.6 31.8 -5.4 0.0 0.0 12.5 3.9
Gross electricity production 3 919.1 1 798.3 0.0 0.0 0.0 34.5 165.3 584.3 0.0 1 336.7 Z Z
Gross heat production 1 010.9 340.0 0.0 0.0 0.0 89.5 547.4 17.3 0.1 16.6 Z 0.0
Source: Eurostat (nrg_bal_c)
36Energy balance sheets — 2017 data
Electricity
ktoe 2017
Oil and
petroleum
products
Natural
gas
Renewables
and
biofuels
Non-
renewable
waste
Nuclear
heatHeat
BulgariaTotal
Solid
fossil
fuels
Manufac-
tured
gases
Peat and
peat
products
Oil shale
and oil
sands

2005 2010 2011 2012 2013 2014 2015 2016 2017
Gross available energy 20 197 17 969 19 210 18 431 17 122 17 925 18 732 18 338 18 978
Solid fossil fuels 6 916 6 938 8 094 6 915 5 947 6 357 6 607 5 699 6 123
Peat & peat products 0 0 0 0 0 0 0 0 0
Oil shale & oil sands 0 0 0 0 0 0 0 0 0
Crude oil & other hydrocarbons 6 588 6 096 5 932 6 490 6 507 6 074 6 734 6 967 7 153
Petroleum products -1 487 -1 990 -2 048 -2 412 -2 751 -1 978 -2 304 -2 537 -2 516
Natural gas 2 804 2 300 2 630 2 451 2 398 2 363 2 595 2 687 2 762
Nuclear heat 4 855 3 849 4 105 4 020 3 668 4 047 3 912 4 011 3 941
Renewable energies 1 115 1 494 1 405 1 674 1 879 1 853 2 067 2 029 1 952
Non-renewable wastes 58 8 8 7 8 23 30 32 35
Primary production 10 646 10 409 12 174 11 652 10 610 11 269 11 991 11 227 11 674
Solid fossil fuels 4 178 4 927 6 207 5 608 4 782 5 106 5 832 5 081 5 669
Peat 0 0 0 0 0 0 0 0 0
Oil shale and oil sands 0 0 0 0 0 0 0 0 0
Crude oil & other hydrocarbons 30 23 22 24 28 26 25 24 24
Natural gas 384 59 351 308 234 159 85 77 66
Nuclear heat 4 855 3 849 4 105 4 020 3 668 4 047 3 912 4 011 3 941
Renewable energies 1 140 1 541 1 481 1 685 1 890 1 907 2 107 2 002 1 938
Non-renewable wastes 58 8 8 7 8 23 30 32 35
Net imports 9 560 7 232 7 081 6 810 6 586 6 324 6 845 7 081 7 499
Solid fossil fuels 2 550 1 700 1 979 1 487 971 931 741 557 573
Crude oil 6 140 5 521 5 069 5 979 5 731 5 185 6 165 6 294 6 969
Gas/Diesel Oil (w/o bio) -311 1 64 -305 -182 78 69 -425 -742
Motor Gasoline (w/o bio) -834 -931 -1 028 -1 190 -1 364 -1 177 -1 392 -1 376 -1 446
Naphtha -46 -333 -287 -327 -284 -262 -311 -376 -453
LPG 357 288 280 293 343 365 418 436 425
All other oil & petroleum products -75 -363 -267 -458 -317 -146 -437 -100 -45
Natural gas 2 458 2 131 2 264 2 043 2 226 2 222 2 517 2 591 2 696
Transformation input 20 988 18 779 20 127 19 510 18 464 18 975 19 679 19 452 20 108
Electricity & heat generation 12 161 12 007 13 213 12 122 10 919 11 724 11 854 11 085 11 240
Refinery intake 6 721 6 196 6 253 6 712 6 727 6 343 7 006 7 362 7 710
Coke ovens 719 0 0 0 0 0 0 0 0
Blast furnaces 441 0 0 0 0 0 0 0 0
Transformation output 13 302 12 013 12 455 12 550 12 239 12 339 12 906 13 023 13 337
Electricity & heat generation 5 059 5 429 5 763 5 451 5 031 5 377 5 435 5 044 4 977
Refinery output 6 428 6 037 6 077 6 498 6 494 6 170 6 741 7 037 7 266
Coke ovens 624 0 0 0 0 0 0 0 0
Blast furnaces 181 0 0 0 0 0 0 0 0
Energy sector 1 111 1 137 1 075 1 094 996 1 032 1 134 1 089 1 126
Distribution losses 580 549 538 520 480 499 490 469 486
Available for final consumption 10 519 9 253 9 681 9 630 9 172 9 507 10 072 10 062 10 276
Solid fossil fuels 657 522 499 462 420 382 436 396 437
Manufactured gases 94 0 0 0 0 0 0 0 0
Peat & peat products 0 0 0 0 0 0 0 0 0
Oil shale & oil sands 0 0 0 0 0 0 0 0 0
Gas/Diesel Oil (w/o bio) 1 783 1 659 1 732 1 809 1 555 1 841 2 001 2 020 2 034
Motor Gasoline (w/o bio) 571 624 564 539 443 505 521 493 505
Naphtha 298 0 0 0 0 0 1 0 0
LPG 484 419 402 430 446 479 517 548 530
All other oil & petroleum products 993 464 380 413 378 389 437 333 453
Natural gas 1 693 1 269 1 551 1 382 1 397 1 414 1 591 1 622 1 663
Primary solid biofuels & charcoal 691 879 936 999 1 004 949 992 993 1 018
Liquid biofuels 0 13 17 86 111 111 146 163 166
All other renewable energies 49 94 102 119 135 127 143 193 189
Non-renewable wastes 54 8 8 7 8 23 30 32 35
Electricity 2 211 2 338 2 446 2 397 2 368 2 385 2 437 2 488 2 576
Heat 939 964 1 043 986 907 902 818 782 671
Statistical difference 68 120 43 47 37 113 78 49 61
Final non-energy consumption 849 422 507 465 464 510 605 495 477
Final energy consumption 9 602 8 710 9 130 9 118 8 671 8 884 9 390 9 518 9 738
Industry 3 650 2 561 2 702 2 582 2 586 2 620 2 713 2 641 2 721
Transport 2 717 2 695 2 760 2 914 2 620 2 916 3 212 3 267 3 325
Other sectors 3 235 3 455 3 669 3 622 3 465 3 347 3 465 3 609 3 692
Services 841 1 027 1 090 1 070 1 030 992 1 086 1 172 1 200
Households 2 090 2 243 2 374 2 353 2 241 2 165 2 193 2 252 2 319
Europe 2020-2030 indicators 2005 2010 2011 2012 2013 2014 2015 2016 2017
Gross inland consumption 20 068 17 835 19 092 18 321 16 967 17 779 18 570 18 179 18 811
Primary energy consumption 19 219 17 412 18 585 17 856 16 504 17 269 17 965 17 684 18 334
Final energy consumption 10 138 8 840 9 257 9 235 8 766 8 989 9 491 9 649 9 889
Source: Eurostat (nrg_bal_c)
37
Bulgariaktoe
Energy balance sheets — 2017 data

Source: Eurostat (nrg_bal_c)
Source: Eurostat (nrg_bal_c)
Note: Please refer to page 23 for related methodological definitions.
Bulgaria
38Energy balance sheets — 2017 data
0
10 000
20 000
30 000
40 000
50 000
60 000
1990 1995 2000 2005 2010 2015 2017
Gross electricity production by fuel, GWh
Solid fossil fuels Oil and petroleum products Natural gas
Renewables and biofuels Nuclear heat Other
0
2 000
4 000
6 000
8 000
10 000
12 000
1990 1995 2000 2005 2010 2015 2017
Gross available energy by fuel, ktoe
Solid fossil fuels Oil and petroleum products Natural gas
Renewables and biofuels Nuclear heat Non-renewable waste

Source: Eurostat (nrg_bal_c)
Source: Eurostat (nrg_bal_c)
Note: Please refer to page 23 for related methodological definitions.
Bulgaria
39Energy balance sheets — 2017 data
0
2 000
4 000
6 000
8 000
10 000
12 000
14 000
16 000
18 000
1990 1995 2000 2005 2010 2015 2017
Final energy consumption by fuel, ktoe
Solid fossil fuels Oil and petroleum products Natural gas
Renewables and biofuels Electricity Heat
Other
0
2 000
4 000
6 000
8 000
10 000
12 000
14 000
16 000
18 000
20 000
1990 1995 2000 2005 2010 2015 2017
Final consumption by sector, ktoe
Industry Transport Services Households Non-energy use

+ Primary production 27 330.8 15 164.7 Z 0.0 0.0 208.4 188.5 4 446.7 305.7 7 016.8 Z Z
+ Recovered & recycled products 138.3 117.7 Z 0.0 0.0 20.7 Z 0.0 Z Z Z Z
+ Imports 23 888.4 3 013.7 0.0 0.0 0.0 11 793.0 7 334.7 449.8 0.0 Z 1.3 1 296.0
- Exports 7 737.1 2 538.7 0.0 0.0 0.0 2 405.0 0.0 374.4 0.0 Z 2.0 2 416.9
+ Change in stock -188.7 80.2 0.0 0.0 0.0 55.4 -322.2 -2.1 0.0 Z Z Z
= Gross available energy 43 431.8 15 837.6 0.0 0.0 0.0 9 672.4 7 201.0 4 520.0 305.7 7 016.8 -0.7 -1 121.0
- International maritime bunkers 0.0 0.0 0.0 0.0 0.0 0.0 0.0 0.0 Z Z Z Z
= Gross inland consumption 43 431.8 15 837.6 0.0 0.0 0.0 9 672.4 7 201.0 4 520.0 305.7 7 016.8 -0.7 -1 121.0
- International aviation 354.7 Z Z Z Z 354.7 Z 0.0 Z Z Z Z
= Total energy supply 43 077.1 15 837.6 0.0 0.0 0.0 9 317.7 7 201.0 4 520.0 305.7 7 016.8 -0.7 -1 121.0
Transformation input 34 930.4 15 157.3 649.1 0.0 0.0 8 582.2 1 395.9 1 927.8 64.5 7 016.8 4.1 132.8
+ Electricity & heat generation 21 805.6 10 880.8 649.1 0.0 0.0 53.2 1 395.9 1 608.4 64.5 7 016.8 4.1 132.8
+ Coke ovens 2 365.7 2 365.7 0.0 0.0 0.0 0.0 0.0 0.0 Z Z Z Z
+ Blast furnaces 1 316.5 1 316.5 0.0 0.0 0.0 0.0 0.0 0.0 Z Z Z Z
+ Gas works 517.9 517.9 0.0 0.0 0.0 0.0 0.0 0.0 Z Z Z Z
+ Refineries & petrochemical industry 8 529.0 Z Z Z Z 8 529.0 Z Z Z Z Z Z
+ Patent fuel plants 0.0 0.0 0.0 0.0 0.0 0.0 Z 0.0 0.0 Z Z Z
+ BKB & PB plants 76.4 76.4 0.0 0.0 0.0 Z Z 0.0 0.0 Z Z Z
+ Coal liquefaction plants 0.0 0.0 0.0 0.0 0.0 Z Z Z Z Z Z Z
+ For blended natural gas 0.0 Z 0.0 Z Z 0.0 Z 0.0 Z Z Z Z
+ Liquid biofuels blended 319.4 Z Z Z Z Z Z 319.4 Z Z Z Z
+ Charcoal production plants 0.0 Z Z Z Z Z Z 0.0 Z Z Z Z
+ Gas-to-liquids plants 0.0 Z Z Z Z Z 0.0 Z Z Z Z Z
+ Not elsewhere specified 0.0 0.0 0.0 0.0 0.0 0.0 0.0 0.0 0.0 Z Z Z
Transformation output 22 632.5 1 952.9 1 324.5 0.0 Z 8 614.1 0.0 319.4 Z Z 2 936.7 7 485.0
+ Electricity & heat generation 10 421.6 Z Z Z Z Z Z Z Z Z 2 936.7 7 485.0
+ Coke ovens 2 318.5 1 881.7 436.8 Z Z Z Z Z Z Z Z Z
+ Blast furnaces 561.4 0.0 561.4 Z Z Z Z Z Z Z Z Z
+ Gas works 326.2 0.0 326.2 Z Z Z Z Z Z Z Z Z
+ Refineries & petrochemical industry 8 614.1 Z Z Z Z 8 614.1 Z 0.0 Z Z Z Z
+ Patent fuel plants 0.0 0.0 Z Z Z Z Z Z Z Z Z Z
+ BKB & PB plants 71.2 71.2 Z 0.0 Z Z Z Z Z Z Z Z
+ Coal liquefaction plants 0.0 Z Z Z Z 0.0 Z Z Z Z Z Z
+ Blended in natural gas 0.0 Z Z Z Z Z 0.0 Z Z Z Z Z
+ Liquid biofuels blended 319.4 Z Z Z Z Z Z 319.4 Z Z Z Z
+ Charcoal production plants 0.0 Z Z Z Z Z Z 0.0 Z Z Z Z
+ Gas-to-liquids plants 0.0 Z Z Z Z 0.0 Z Z Z Z Z Z
+ Not elsewhere specified 0.0 0.0 0.0 0.0 Z 0.0 Z Z Z Z Z Z
Energy sector 2 273.5 279.6 346.8 0.0 0.0 241.7 95.1 0.0 0.0 Z 545.9 764.4
+ Own use in electricity & heat generation 1 107.3 0.0 0.2 0.0 0.0 0.0 0.0 0.0 0.0 Z 491.0 616.0
+ Coal mines 430.2 279.6 32.3 0.0 0.0 6.2 0.0 0.0 0.0 Z 18.1 94.0
+ Oil & natural gas extraction plants 3.9 Z Z Z Z 0.0 2.0 0.0 Z Z 0.0 1.8
+ Patent fuel plants 0.0 0.0 0.0 0.0 0.0 Z Z 0.0 0.0 Z 0.0 0.0
+ Coke ovens 268.7 0.0 221.9 0.0 0.0 0.0 0.0 0.0 0.0 Z 36.7 10.0
+ BKB & PB plants 0.5 0.0 0.0 0.0 0.0 Z Z 0.0 0.0 Z 0.0 0.5
+ Gas works 3.7 0.0 0.0 0.0 0.0 0.0 0.0 0.0 0.0 Z 0.0 3.7
+ Blast furnaces 97.2 0.0 92.3 0.0 0.0 0.0 0.0 0.0 0.0 Z 0.0 4.9
+ Petroleum refineries (oil refineries) 358.2 0.0 0.0 0.0 0.0 235.6 93.1 0.0 0.0 Z 0.0 29.6
+ Nuclear industry 0.0 Z Z Z Z Z Z Z Z Z 0.0 0.0
+ Coal liquefaction plants 0.0 0.0 0.0 0.0 0.0 Z Z Z Z Z 0.0 0.0
+ Liquefaction & regasification plants (LNG) 0.0 Z Z Z Z Z 0.0 Z Z Z 0.0 0.0
+ Gasification plants for biogas 0.0 Z Z Z Z Z Z 0.0 0.0 Z 0.0 0.0
+ Gas-to-liquids (GTL) plants 0.0 Z Z Z Z Z 0.0 Z Z Z 0.0 0.0
+ Charcoal production plants 0.0 Z Z Z Z Z Z 0.0 0.0 Z 0.0 0.0
+ Not elsewhere specified (energy) 3.8 0.0 0.0 0.0 0.0 0.0 0.0 0.0 0.0 Z 0.0 3.8
Distribution losses 679.8 21.2 25.6 0.0 0.0 0.0 91.8 0.0 0.0 Z 165.1 376.2
Available for final consumption 27 825.8 2 332.4 303.1 0.0 0.0 9 107.9 5 618.2 2 911.5 241.1 0.0 2 220.9 5 090.7
Final non-energy consumption 2 950.0 343.0 17.5 0.0 0.0 2 500.7 88.7 0.0 Z Z Z Z
Final energy consumption 24 406.1 1 749.7 279.4 0.0 0.0 6 633.3 5 529.4 2 911.5 241.1 Z 2 131.7 4 930.0
+ Industry 6 701.4 872.6 279.4 0.0 0.0 128.1 2 140.8 450.2 211.5 Z 571.5 2 047.3
+ Iron & steel 1 021.2 306.1 246.2 0.0 0.0 0.0 191.6 0.0 0.0 Z 78.1 199.2
+ Chemical & petrochemical 1 046.3 286.2 30.4 0.0 0.0 37.3 221.0 0.7 3.1 Z 176.6 291.0
+ Non-ferrous metals 99.1 3.5 0.0 0.0 0.0 0.0 58.9 0.1 0.0 Z 1.2 35.4
+ Non-metallic minerals 1 147.9 173.2 2.7 0.0 0.0 5.9 536.9 1.7 208.0 Z 10.4 209.0
+ Transport equipment 475.0 6.3 0.0 0.0 0.0 2.1 161.8 0.2 0.0 Z 43.4 261.3
+ Machinery 724.7 10.6 0.0 0.0 0.0 5.1 256.0 9.1 0.0 Z 70.5 373.4
+ Mining & quarrying 89.3 0.9 0.0 0.0 0.0 1.9 52.9 0.3 0.0 Z 1.0 32.3
+ Food, beverages & tobacco 590.0 46.5 0.0 0.0 0.0 5.0 314.4 6.4 0.0 Z 79.5 138.1
+ Paper, pulp & printing 598.9 30.6 0.0 0.0 0.0 1.9 103.5 279.0 0.0 Z 29.4 154.6
+ Wood & wood products 215.2 0.9 0.0 0.0 0.0 3.9 12.3 144.7 0.0 Z 8.2 45.2
+ Construction 191.1 3.3 0.0 0.0 0.0 49.2 81.9 2.9 0.0 Z 7.0 46.9
+ Textile & leather 129.4 2.3 0.0 0.0 0.0 1.0 53.6 0.1 0.0 Z 9.1 63.3
+ Not elsewhere specified (industry) 373.2 2.3 0.0 0.0 0.0 14.9 95.8 5.1 0.4 Z 57.1 197.6
+ Transport 6 616.4 1.0 0.0 0.0 0.0 6 085.6 69.9 313.8 0.0 Z Z 146.0
+ Rail 224.7 1.0 0.0 0.0 0.0 82.0 Z 6.2 0.0 Z Z 135.5
+ Road 6 315.9 Z Z Z Z 5 946.7 55.8 307.7 0.0 Z Z 5.8
+ Domestic aviation 52.8 Z Z Z Z 52.8 Z 0.0 Z Z Z Z
+ Domestic navigation 4.1 0.0 0.0 0.0 0.0 4.1 Z 0.0 0.0 Z Z Z
+ Pipeline transport 17.7 Z Z Z Z 0.0 14.2 0.0 Z Z Z 3.5
+ Not elsewhere specified (transport) 1.2 0.0 0.0 0.0 0.0 0.0 0.0 0.0 0.0 Z Z 1.2
+ Other 11 088.3 876.1 0.0 0.0 0.0 419.5 3 318.7 2 147.5 29.6 Z 1 560.2 2 736.7
+ Commercial & public services 3 189.4 32.1 0.0 0.0 0.0 26.0 1 190.1 81.5 29.6 Z 487.1 1 342.9
+ Households 7 187.0 837.6 0.0 0.0 0.0 45.0 2 004.5 1 926.1 0.0 Z 1 065.9 1 307.9
+ Agriculture & forestry 641.1 6.3 0.0 0.0 0.0 337.3 65.3 139.8 0.0 Z 7.2 85.2
+ Fishing 0.9 0.0 0.0 0.0 0.0 0.0 0.1 0.0 0.0 Z 0.0 0.7
+ Not elsewhere specified (other) 69.9 0.0 0.0 0.0 0.0 11.2 58.7 0.0 0.0 Z 0.0 0.0
Statistical differences 469.8 239.7 6.2 0.0 0.0 -26.1 0.0 0.0 0.0 0.0 89.1 160.7
Gross electricity production 7 476.1 3 563.5 213.4 0.0 0.0 10.3 316.4 927.9 7.9 2 436.8 Z Z
Gross heat production 2 903.4 1 639.9 136.0 0.0 0.0 28.7 809.9 230.9 36.2 21.7 Z 0.3
Source: Eurostat (nrg_bal_c)
40Energy balance sheets — 2017 data
Electricity
ktoe 2017
Oil and
petroleum
products
Natural
gas
Renewables
and
biofuels
Non-
renewable
waste
Nuclear
heatHeat
CzechiaTotal
Solid
fossil
fuels
Manufac-
tured
gases
Peat and
peat
products
Oil shale
and oil
sands

2005 2010 2011 2012 2013 2014 2015 2016 2017
Gross available energy 45 537 45 599 43 785 43 461 43 707 42 183 42 346 41 935 43 432
Solid fossil fuels 20 239 18 847 18 301 17 283 17 276 15 972 16 395 16 554 15 838
Peat & peat products 0 0 0 0 0 0 0 0 0
Oil shale & oil sands 0 0 0 0 0 0 0 0 0
Crude oil & other hydrocarbons 8 121 8 124 7 362 7 512 6 880 7 700 7 412 5 587 8 103
Petroleum products 1 831 1 173 1 692 1 405 1 686 1 404 1 494 2 720 1 569
Natural gas 7 703 8 070 6 809 6 856 6 946 6 182 6 483 7 016 7 201
Nuclear heat 6 457 7 293 7 369 7 901 8 036 7 821 6 994 6 282 7 017
Renewable energies 2 103 3 180 3 499 3 752 4 119 4 256 4 370 4 416 4 520
Non-renewable wastes 172 201 220 225 216 251 277 304 306
Primary production 33 235 31 995 32 547 32 587 30 574 29 670 28 847 27 309 27 331
Solid fossil fuels 23 570 20 730 20 896 20 142 17 674 16 848 16 795 15 973 15 165
Peat 0 0 0 0 0 0 0 0 0
Oil shale and oil sands 0 0 0 0 0 0 0 0 0
Crude oil & other hydrocarbons 593 269 334 314 256 260 206 185 208
Natural gas 154 202 189 214 206 212 205 180 188
Nuclear heat 6 457 7 293 7 369 7 901 8 036 7 821 6 994 6 282 7 017
Renewable energies 2 290 3 301 3 539 3 792 4 187 4 277 4 370 4 385 4 447
Non-renewable wastes 172 201 220 225 216 251 277 304 306
Net imports 12 680 11 539 12 576 10 989 11 982 12 699 13 494 13 664 16 151
Solid fossil fuels -3 281 -2 875 -2 068 -2 120 -1 713 -721 -299 -219 475
Crude oil 7 699 7 805 6 989 7 141 6 610 7 437 7 194 5 364 7 889
Gas/Diesel Oil (w/o bio) 786 537 994 740 1 024 943 1 160 2 033 1 205
Motor Gasoline (w/o bio) 662 350 335 175 250 8 -55 435 -16
Naphtha 188 45 93 116 145 210 -2 -282 93
LPG 34 -60 -23 10 51 89 38 46 86
All other oil & petroleum products 333 298 253 331 184 199 377 484 131
Natural gas 7 535 6 846 7 505 6 101 6 961 5 952 6 164 6 715 7 335
Transformation input 37 018 37 452 36 586 36 524 35 541 35 972 34 651 32 364 34 930
Electricity & heat generation 23 481 24 175 24 039 23 926 23 623 22 909 22 212 21 854 21 806
Refinery intake 8 197 8 326 7 578 7 725 7 070 7 940 7 619 5 766 8 333
Coke ovens 3 056 2 320 2 367 2 288 2 304 2 357 2 191 2 073 2 366
Blast furnaces 1 507 1 415 1 406 1 370 1 405 1 474 1 424 1 481 1 316
Transformation output 22 886 23 274 22 352 22 431 21 776 22 377 21 584 19 608 22 632
Electricity & heat generation 10 426 10 936 10 773 10 770 10 753 10 267 10 111 10 211 10 422
Refinery output 8 138 8 326 7 565 7 754 7 105 7 986 7 661 5 716 8 340
Coke ovens 3 012 2 329 2 365 2 275 2 308 2 341 2 168 2 063 2 318
Blast furnaces 641 652 637 599 621 626 600 630 561
Energy sector 1 877 2 606 2 689 2 552 2 512 2 420 2 411 2 303 2 274
Distribution losses 1 085 744 708 687 679 664 693 704 680
Available for final consumption 28 129 27 757 25 844 25 835 26 468 25 212 25 881 25 856 27 826
Solid fossil fuels 3 310 2 252 1 960 1 791 2 594 1 534 2 014 2 022 2 332
Manufactured gases 464 357 357 354 331 342 329 334 303
Peat & peat products 0 0 0 0 0 0 0 0 0
Oil shale & oil sands 0 0 0 0 0 0 0 0 0
Gas/Diesel Oil (w/o bio) 3 818 3 965 3 991 3 955 3 994 4 177 4 395 4 585 4 734
Motor Gasoline (w/o bio) 2 098 1 868 1 799 1 674 1 570 1 581 1 570 1 617 1 600
Naphtha 928 963 886 968 910 1 091 678 185 981
LPG 277 194 201 254 270 357 292 300 451
All other oil & petroleum products 2 029 1 704 1 564 1 529 1 388 1 441 1 484 1 087 1 342
Natural gas 6 184 6 640 5 456 5 484 5 460 4 901 5 120 5 384 5 618
Primary solid biofuels & charcoal 1 603 1 932 1 959 2 051 2 151 2 196 2 251 2 278 2 275
Liquid biofuels 3 231 300 275 280 318 296 301 314
All other renewable energies 50 132 159 195 240 254 270 310 323
Non-renewable wastes 132 161 164 169 164 197 222 246 241
Electricity 4 754 4 828 4 765 4 809 4 786 4 792 4 880 4 986 5 091
Heat 2 478 2 529 2 282 2 325 2 332 2 031 2 080 2 219 2 221
Statistical difference 84 758 -178 -270 666 -145 300 400 470
Final non-energy consumption 3 008 2 876 2 685 2 789 2 687 2 931 2 502 1 783 2 950
Final energy consumption 25 036 24 123 23 337 23 317 23 115 22 426 23 079 23 673 24 406
Industry 8 684 6 886 6 767 6 717 6 415 6 318 6 463 6 396 6 701
Transport 5 780 5 916 5 936 5 789 5 739 5 949 6 195 6 417 6 616
Other sectors 10 572 11 321 10 634 10 811 10 961 10 160 10 421 10 860 11 088
Services 3 106 3 252 3 137 3 044 3 014 2 928 2 984 3 099 3 189
Households 6 667 7 442 6 864 7 112 7 260 6 544 6 757 7 076 7 187
Europe 2020-2030 indicators 2005 2010 2011 2012 2013 2014 2015 2016 2017
Gross inland consumption 45 522 45 549 43 726 43 397 43 637 42 104 42 255 41 829 43 307
Primary energy consumption 42 514 42 673 41 040 40 608 40 951 39 173 39 753 40 046 40 357
Final energy consumption 26 294 25 253 24 456 24 414 24 213 23 581 24 197 24 823 25 486
Source: Eurostat (nrg_bal_c)
41
Czechiaktoe
Energy balance sheets — 2017 data

Source: Eurostat (nrg_bal_c)
Source: Eurostat (nrg_bal_c)
Note: Please refer to page 23 for related methodological definitions.
Czechia
42Energy balance sheets — 2017 data
0
10 000
20 000
30 000
40 000
50 000
60 000
70 000
80 000
90 000
100 000
1990 1995 2000 2005 2010 2015 2017
Gross electricity production by fuel, GWh
Solid fossil fuels Oil and petroleum products Natural gas
Renewables and biofuels Nuclear heat Other
0
5 000
10 000
15 000
20 000
25 000
30 000
35 000
1990 1995 2000 2005 2010 2015 2017
Gross available energy by fuel, ktoe
Solid fossil fuels Oil and petroleum products Natural gas
Renewables and biofuels Nuclear heat Non-renewable waste

Source: Eurostat (nrg_bal_c)
Source: Eurostat (nrg_bal_c)
Note: Please refer to page 23 for related methodological definitions.
Czechia
43Energy balance sheets — 2017 data
0
5 000
10 000
15 000
20 000
25 000
30 000
35 000
1990 1995 2000 2005 2010 2015 2017
Final energy consumption by fuel, ktoe
Solid fossil fuels Oil and petroleum products Natural gas
Renewables and biofuels Electricity Heat
Other
0
5 000
10 000
15 000
20 000
25 000
30 000
35 000
1990 1995 2000 2005 2010 2015 2017
Final consumption by sector, ktoe
Industry Transport Services Households Non-energy use

+ Primary production 15 855.9 0.0 Z 0.0 0.0 6 919.1 4 350.4 4 203.7 382.7 0.0 Z Z
+ Recovered & recycled products 0.0 0.0 Z 0.0 0.0 0.0 Z 0.0 Z Z Z Z
+ Imports 16 054.7 1 794.6 0.0 0.0 0.0 10 631.5 464.4 1 809.3 43.5 Z 3.0 1 308.5
- Exports 13 869.7 0.0 0.0 0.0 0.0 10 926.3 2 007.2 20.1 0.0 Z 0.0 916.2
+ Change in stock 701.6 -246.0 0.0 0.0 0.0 1 020.7 -60.4 -12.7 0.0 Z Z Z
= Gross available energy 18 742.5 1 548.6 0.0 0.0 0.0 7 645.0 2 747.3 5 980.2 426.1 0.0 3.0 392.3
- International maritime bunkers 534.7 0.0 0.0 0.0 0.0 534.7 0.0 0.0 Z Z Z Z
= Gross inland consumption 18 207.8 1 548.6 0.0 0.0 0.0 7 110.3 2 747.3 5 980.2 426.1 0.0 3.0 392.3
- International aviation 979.3 Z Z Z Z 979.3 Z 0.0 Z Z Z Z
= Total energy supply 17 228.5 1 548.6 0.0 0.0 0.0 6 131.0 2 747.3 5 980.2 426.1 0.0 3.0 392.3
Transformation input 17 872.7 1 448.9 0.0 0.0 0.0 10 889.1 760.7 4 345.7 402.6 0.0 0.0 25.6
+ Electricity & heat generation 6 706.5 1 448.9 0.0 0.0 0.0 89.7 749.5 3 990.1 402.6 0.0 0.0 25.6
+ Coke ovens 0.0 0.0 0.0 0.0 0.0 0.0 0.0 0.0 Z Z Z Z
+ Blast furnaces 0.0 0.0 0.0 0.0 0.0 0.0 0.0 0.0 Z Z Z Z
+ Gas works 11.2 0.0 0.0 0.0 0.0 0.0 11.2 0.0 Z Z Z Z
+ Refineries & petrochemical industry 10 799.5 Z Z Z Z 10 799.5 Z Z Z Z Z Z
+ Patent fuel plants 0.0 0.0 0.0 0.0 0.0 0.0 Z 0.0 0.0 Z Z Z
+ BKB & PB plants 0.0 0.0 0.0 0.0 0.0 Z Z 0.0 0.0 Z Z Z
+ Coal liquefaction plants 0.0 0.0 0.0 0.0 0.0 Z Z Z Z Z Z Z
+ For blended natural gas 122.5 Z 0.0 Z Z 0.0 Z 122.5 Z Z Z Z
+ Liquid biofuels blended 233.1 Z Z Z Z Z Z 233.1 Z Z Z Z
+ Charcoal production plants 0.0 Z Z Z Z Z Z 0.0 Z Z Z Z
+ Gas-to-liquids plants 0.0 Z Z Z Z Z 0.0 Z Z Z Z Z
+ Not elsewhere specified 0.0 0.0 0.0 0.0 0.0 0.0 0.0 0.0 0.0 Z Z Z
Transformation output 16 963.8 0.0 14.7 0.0 Z 10 703.9 122.5 215.4 Z Z 3 238.4 2 668.9
+ Electricity & heat generation 5 907.3 Z Z Z Z Z Z Z Z Z 3 238.4 2 668.9
+ Coke ovens 0.0 0.0 0.0 Z Z Z Z Z Z Z Z Z
+ Blast furnaces 0.0 0.0 0.0 Z Z Z Z Z Z Z Z Z
+ Gas works 0.0 0.0 0.0 Z Z Z Z Z Z Z Z Z
+ Refineries & petrochemical industry 10 703.9 Z Z Z Z 10 703.9 Z 0.0 Z Z Z Z
+ Patent fuel plants 0.0 0.0 Z Z Z Z Z Z Z Z Z Z
+ BKB & PB plants 0.0 0.0 Z 0.0 Z Z Z Z Z Z Z Z
+ Coal liquefaction plants 0.0 Z Z Z Z 0.0 Z Z Z Z Z Z
+ Blended in natural gas 122.5 Z Z Z Z Z 122.5 Z Z Z Z Z
+ Liquid biofuels blended 215.4 Z Z Z Z Z Z 215.4 Z Z Z Z
+ Charcoal production plants 0.0 Z Z Z Z Z Z 0.0 Z Z Z Z
+ Gas-to-liquids plants 0.0 Z Z Z Z 0.0 Z Z Z Z Z Z
+ Not elsewhere specified 14.7 0.0 14.7 0.0 Z 0.0 Z Z Z Z Z Z
Energy sector 1 139.5 0.0 0.0 0.0 0.0 362.4 543.8 3.1 0.0 Z 30.4 199.8
+ Own use in electricity & heat generation 134.9 0.0 0.0 0.0 0.0 0.0 0.0 0.0 0.0 Z 15.8 119.1
+ Coal mines 0.0 0.0 0.0 0.0 0.0 0.0 0.0 0.0 0.0 Z 0.0 0.0
+ Oil & natural gas extraction plants 543.8 Z Z Z Z 0.0 543.8 0.0 Z Z 0.0 0.0
+ Patent fuel plants 0.0 0.0 0.0 0.0 0.0 Z Z 0.0 0.0 Z 0.0 0.0
+ Coke ovens 0.0 0.0 0.0 0.0 0.0 0.0 0.0 0.0 0.0 Z 0.0 0.0
+ BKB & PB plants 0.0 0.0 0.0 0.0 0.0 Z Z 0.0 0.0 Z 0.0 0.0
+ Gas works 3.1 0.0 0.0 0.0 0.0 0.0 0.0 3.1 0.0 Z 0.0 0.0
+ Blast furnaces 0.0 0.0 0.0 0.0 0.0 0.0 0.0 0.0 0.0 Z 0.0 0.0
+ Petroleum refineries (oil refineries) 403.2 0.0 0.0 0.0 0.0 362.4 0.0 0.0 0.0 Z 14.7 26.1
+ Nuclear industry 0.0 Z Z Z Z Z Z Z Z Z 0.0 0.0
+ Coal liquefaction plants 0.0 0.0 0.0 0.0 0.0 Z Z Z Z Z 0.0 0.0
+ Liquefaction & regasification plants (LNG) 0.0 Z Z Z Z Z 0.0 Z Z Z 0.0 0.0
+ Gasification plants for biogas 0.0 Z Z Z Z Z Z 0.0 0.0 Z 0.0 0.0
+ Gas-to-liquids (GTL) plants 0.0 Z Z Z Z Z 0.0 Z Z Z 0.0 0.0
+ Charcoal production plants 0.0 Z Z Z Z Z Z 0.0 0.0 Z 0.0 0.0
+ Not elsewhere specified (energy) 54.5 0.0 0.0 0.0 0.0 0.0 0.0 0.0 0.0 Z 0.0 54.5
Distribution losses 792.7 0.0 0.6 0.0 0.0 0.0 2.7 0.1 0.0 Z 645.1 144.2
Available for final consumption 14 387.3 99.7 14.1 0.0 0.0 5 583.4 1 562.6 1 846.7 23.5 0.0 2 565.7 2 691.6
Final non-energy consumption 247.2 0.0 0.0 0.0 0.0 247.2 0.0 0.0 Z Z Z Z
Final energy consumption 13 861.6 119.5 14.1 0.0 0.0 5 096.4 1 509.5 1 841.5 23.5 Z 2 565.9 2 691.3
+ Industry 2 344.0 109.9 4.9 0.0 0.0 437.5 692.8 267.6 16.0 Z 78.1 737.3
+ Iron & steel 88.6 0.0 0.0 0.0 0.0 2.5 45.7 0.0 0.0 Z 4.0 36.3
+ Chemical & petrochemical 296.0 12.1 4.0 0.0 0.0 8.1 115.5 9.6 0.0 Z 14.7 132.0
+ Non-ferrous metals 0.0 0.0 0.0 0.0 0.0 0.0 0.0 0.0 0.0 Z 0.0 0.0
+ Non-metallic minerals 501.7 62.5 0.0 0.0 0.0 207.1 118.9 21.1 15.6 Z 7.7 68.9
+ Transport equipment 13.7 0.0 0.0 0.0 0.0 0.8 4.3 0.2 0.0 Z 0.8 7.6
+ Machinery 206.5 0.0 0.0 0.0 0.0 13.9 52.6 11.7 0.3 Z 12.8 115.2
+ Mining & quarrying 73.6 2.7 0.0 0.0 0.0 15.8 20.9 25.3 0.0 Z 0.9 7.9
+ Food, beverages & tobacco 633.0 32.6 0.9 0.0 0.0 51.3 278.7 39.0 0.0 Z 23.0 207.3
+ Paper, pulp & printing 67.6 0.0 0.0 0.0 0.0 2.8 24.9 9.4 0.1 Z 3.0 27.4
+ Wood & wood products 108.4 0.0 0.0 0.0 0.0 2.6 2.2 83.3 0.0 Z 2.0 18.3
+ Construction 172.4 0.0 0.0 0.0 0.0 129.6 7.8 0.4 0.0 Z 0.0 34.6
+ Textile & leather 16.8 0.0 0.0 0.0 0.0 0.2 5.3 0.7 0.0 Z 1.1 9.6
+ Not elsewhere specified (industry) 118.4 0.0 0.0 0.0 0.0 3.0 15.9 19.5 0.0 Z 8.0 72.1
+ Transport 4 219.9 0.0 0.0 0.0 0.0 3 963.1 6.0 215.7 0.0 Z Z 35.0
+ Rail 113.7 0.0 0.0 0.0 0.0 78.7 Z 0.0 0.0 Z Z 35.0
+ Road 3 860.8 Z Z Z Z 3 639.0 6.0 215.7 0.0 Z Z 0.0
+ Domestic aviation 30.1 Z Z Z Z 30.1 Z 0.0 Z Z Z Z
+ Domestic navigation 148.4 0.0 0.0 0.0 0.0 148.4 Z 0.0 0.0 Z Z Z
+ Pipeline transport 0.0 Z Z Z Z 0.0 0.0 0.0 Z Z Z 0.0
+ Not elsewhere specified (transport) 66.8 0.0 0.0 0.0 0.0 66.8 0.0 0.0 0.0 Z Z 0.0
+ Other 7 297.7 9.6 9.2 0.0 0.0 695.7 810.6 1 358.2 7.5 Z 2 487.8 1 919.0
+ Commercial & public services 2 009.7 0.0 0.7 0.0 0.0 57.0 182.4 65.6 7.5 Z 776.7 919.7
+ Households 4 545.2 0.0 8.4 0.0 0.0 215.6 581.7 1 218.0 0.0 Z 1 673.3 848.1
+ Agriculture & forestry 602.8 9.6 0.0 0.0 0.0 306.2 40.8 57.1 0.0 Z 37.9 151.2
+ Fishing 116.8 0.0 0.0 0.0 0.0 116.8 0.0 0.0 0.0 Z 0.0 0.0
+ Not elsewhere specified (other) 23.3 0.0 0.0 0.0 0.0 0.1 5.7 17.5 0.0 Z 0.0 0.0
Statistical differences 278.5 -19.8 -0.0 0.0 0.0 239.9 53.1 5.1 0.0 0.0 -0.1 0.3
Gross electricity production 2 668.9 533.8 0.0 0.0 0.0 24.1 164.4 1 884.4 62.2 0.0 Z Z
Gross heat production 3 147.8 459.5 0.0 0.0 0.0 29.3 493.0 1 843.6 299.5 0.0 Z 22.9
Source: Eurostat (nrg_bal_c)
44Energy balance sheets — 2017 data
Electricity
ktoe 2017
Oil and
petroleum
products
Natural
gas
Renewables
and
biofuels
Non-
renewable
waste
Nuclear
heatHeat
DenmarkTotal
Solid
fossil
fuels
Manufac-
tured
gases
Peat and
peat
products
Oil shale
and oil
sands

2005 2010 2011 2012 2013 2014 2015 2016 2017
Gross available energy 20 593 21 099 19 666 18 781 18 933 18 111 18 138 18 512 18 743
Solid fossil fuels 3 714 3 809 3 234 2 468 3 174 2 534 1 818 1 974 1 549
Peat & peat products 0 0 0 0 0 0 0 0 0
Oil shale & oil sands 0 0 0 0 0 0 0 0 0
Crude oil & other hydrocarbons 7 867 7 336 6 689 7 573 7 207 6 808 7 273 6 735 7 316
Petroleum products 1 161 1 177 1 353 69 243 586 176 763 329
Natural gas 4 399 4 422 3 717 3 484 3 316 2 804 2 852 2 878 2 747
Nuclear heat 0 0 0 0 0 0 0 0 0
Renewable energies 2 925 4 042 4 141 4 333 4 495 4 714 5 080 5 301 5 980
Non-renewable wastes 406 406 413 401 403 416 427 425 426
Primary production 31 406 23 471 20 753 18 893 16 807 16 250 16 257 15 405 15 856
Solid fossil fuels 0 0 0 0 0 0 0 0 0
Peat 0 0 0 0 0 0 0 0 0
Oil shale and oil sands 0 0 0 0 0 0 0 0 0
Crude oil & other hydrocarbons 19 018 12 486 11 237 10 250 8 918 8 351 7 898 7 112 6 919
Natural gas 9 383 7 343 5 899 5 159 4 282 4 138 4 144 4 054 4 350
Nuclear heat 0 0 0 0 0 0 0 0 0
Renewable energies 2 598 3 236 3 204 3 101 3 230 3 382 3 841 3 871 4 204
Non-renewable wastes 406 406 413 383 377 379 374 368 383
Net imports -10 487 -3 440 -1 242 -510 2 340 2 224 2 367 2 486 2 185
Solid fossil fuels 3 505 2 643 3 589 2 311 2 880 2 658 1 545 1 670 1 795
Crude oil -11 202 -5 125 -4 370 -2 405 -1 535 -1 377 -369 -43 745
Gas/Diesel Oil (w/o bio) 1 161 1 232 1 050 498 729 982 1 166 952 491
Motor Gasoline (w/o bio) -21 -216 -363 -634 -752 -599 -699 -620 -870
Naphtha -3 -40 0 0 0 0 0 0 0
LPG -89 -113 -94 -123 -62 -91 -76 -51 -55
All other oil & petroleum products 725 488 -93 -14 464 351 372 -46 -606
Natural gas -5 010 -3 022 -2 044 -1 851 -770 -1 314 -1 376 -1 285 -1 543
Transformation input 16 327 16 669 15 158 15 275 18 425 18 298 17 863 19 057 17 873
Electricity & heat generation 8 231 9 155 7 943 7 186 7 820 7 012 6 399 6 830 6 706
Refinery intake 7 934 7 442 7 001 7 841 8 866 9 074 9 362 9 374 9 104
Coke ovens 0 0 0 0 0 0 0 0 0
Blast furnaces 0 0 0 0 0 0 0 0 0
Transformation output 14 073 14 232 13 183 13 802 16 649 16 774 16 850 18 022 16 964
Electricity & heat generation 6 198 6 973 6 208 5 905 6 231 5 719 5 594 5 847 5 907
Refinery output 7 716 7 189 6 760 7 648 8 689 8 839 9 161 9 315 8 991
Coke ovens 0 0 0 0 0 0 0 0 0
Blast furnaces 0 0 0 0 0 0 0 0 0
Energy sector 1 286 1 215 1 193 1 194 1 179 1 121 1 141 1 095 1 140
Distribution losses 743 942 823 835 808 755 774 806 793
Available for final consumption 14 683 15 001 14 139 13 919 13 705 13 067 13 556 13 954 14 387
Solid fossil fuels 269 37 126 34 64 93 109 -18 100
Manufactured gases 13 13 13 13 15 16 16 17 14
Peat & peat products 0 0 0 0 0 0 0 0 0
Oil shale & oil sands 0 0 0 0 0 0 0 0 0
Gas/Diesel Oil (w/o bio) 3 693 3 947 3 800 3 702 3 503 3 471 3 546 3 609 3 778
Motor Gasoline (w/o bio) 1 954 1 694 1 588 1 488 1 374 1 346 1 352 1 360 1 335
Naphtha 0 1 0 0 0 0 0 0 0
LPG 73 55 48 58 47 41 49 53 58
All other oil & petroleum products 726 458 320 327 392 235 186 385 412
Natural gas 1 615 1 738 1 555 1 553 1 583 1 400 1 462 1 521 1 563
Primary solid biofuels & charcoal 854 1 182 1 094 1 018 1 031 1 001 1 224 1 234 1 275
Liquid biofuels 0 27 123 222 212 227 220 221 216
All other renewable energies 150 189 202 209 223 235 256 324 356
Non-renewable wastes 29 19 24 21 21 24 19 21 23
Electricity 2 879 2 762 2 724 2 682 2 675 2 647 2 653 2 675 2 692
Heat 2 429 2 880 2 523 2 592 2 565 2 330 2 464 2 551 2 566
Statistical difference -342 -108 -270 95 42 -47 -38 -4 278
Final non-energy consumption 289 263 295 274 278 252 251 251 247
Final energy consumption 14 736 14 847 14 114 13 550 13 385 12 861 13 342 13 707 13 862
Industry 2 873 2 447 2 443 2 304 2 180 2 123 2 165 2 243 2 344
Transport 4 469 4 369 4 376 4 019 3 947 3 980 4 054 4 142 4 220
Other sectors 7 394 8 030 7 295 7 227 7 258 6 757 7 124 7 322 7 298
Services 2 002 2 128 1 948 1 979 1 964 1 847 1 900 1 952 2 010
Households 4 515 5 004 4 496 4 444 4 483 4 146 4 443 4 595 4 545
Europe 2020-2030 indicators 2005 2010 2011 2012 2013 2014 2015 2016 2017
Gross inland consumption 19 732 20 271 18 819 18 106 18 134 17 194 17 174 17 626 17 988
Primary energy consumption 19 443 20 008 18 523 17 832 17 855 16 942 16 923 17 375 17 741
Final energy consumption 15 503 15 522 14 802 14 235 14 051 13 590 14 034 14 445 14 624
Source: Eurostat (nrg_bal_c)
45
Denmarkktoe
Energy balance sheets — 2017 data

Source: Eurostat (nrg_bal_c)
Source: Eurostat (nrg_bal_c)
Note: Please refer to page 23 for related methodological definitions.
Denmark
46Energy balance sheets — 2017 data
0
10 000
20 000
30 000
40 000
50 000
60 000
1990 1995 2000 2005 2010 2015 2017
Gross electricity production by fuel, GWh
Solid fossil fuels Oil and petroleum products Natural gas
Renewables and biofuels Nuclear heat Other
0
2 000
4 000
6 000
8 000
10 000
12 000
1990 1995 2000 2005 2010 2015 2017
Gross available energy by fuel, ktoe
Solid fossil fuels Oil and petroleum products Natural gas
Renewables and biofuels Nuclear heat Non-renewable waste

Source: Eurostat (nrg_bal_c)
Source: Eurostat (nrg_bal_c)
Note: Please refer to page 23 for related methodological definitions.
Denmark
47Energy balance sheets — 2017 data
0
2 000
4 000
6 000
8 000
10 000
12 000
14 000
16 000
1990 1995 2000 2005 2010 2015 2017
Final energy consumption by fuel, ktoe
Solid fossil fuels Oil and petroleum products Natural gas
Renewables and biofuels Electricity Heat
Other
0
2 000
4 000
6 000
8 000
10 000
12 000
14 000
16 000
18 000
1990 1995 2000 2005 2010 2015 2017
Final consumption by sector, ktoe
Industry Transport Services Households Non-energy use

+ Primary production 115 787.7 39 442.4 Z 0.0 0.0 3 529.6 6 028.9 42 618.2 4 514.0 19 654.7 Z Z
+ Recovered & recycled products 484.9 0.0 Z 0.0 0.0 484.9 Z 0.0 Z Z Z Z
+ Imports 267 891.2 33 802.0 0.0 0.0 0.0 133 911.3 95 741.2 2 042.7 0.0 Z 0.0 2 394.0
- Exports 60 522.6 1 501.1 0.0 0.0 0.0 23 260.1 26 900.4 1 953.4 0.0 Z 3.0 6 904.6
+ Change in stock 831.7 -434.8 0.0 0.0 0.0 795.6 470.9 0.0 0.0 Z Z Z
= Gross available energy 324 472.9 71 308.5 0.0 0.0 0.0 115 461.2 75 340.7 42 707.5 4 514.0 19 654.7 -3.0 -4 510.7
- International maritime bunkers 2 289.1 0.0 0.0 0.0 0.0 2 289.1 0.0 0.0 Z Z Z Z
= Gross inland consumption 322 183.8 71 308.5 0.0 0.0 0.0 113 172.1 75 340.7 42 707.5 4 514.0 19 654.7 -3.0 -4 510.7
- International aviation 9 526.4 Z Z Z Z 9 526.4 Z 0.0 Z Z Z Z
= Total energy supply 312 657.4 71 308.5 0.0 0.0 0.0 103 645.6 75 340.7 42 707.5 4 514.0 19 654.7 -3.0 -4 510.7
Transformation input 280 260.7 75 559.5 2 503.3 0.0 0.0 131 120.5 18 310.8 29 015.0 3 387.3 19 654.7 0.0 709.5
+ Electricity & heat generation 125 728.1 53 629.9 2 503.3 0.0 0.0 1 308.3 18 310.8 26 224.3 3 387.3 19 654.7 0.0 709.5
+ Coke ovens 9 049.1 8 650.2 0.0 0.0 0.0 399.0 0.0 0.0 Z Z Z Z
+ Blast furnaces 10 097.9 10 071.0 0.0 0.0 0.0 27.0 0.0 0.0 Z Z Z Z
+ Gas works 0.0 0.0 0.0 0.0 0.0 0.0 0.0 0.0 Z Z Z Z
+ Refineries & petrochemical industry 129 386.3 Z Z Z Z 129 386.3 Z Z Z Z Z Z
+ Patent fuel plants 0.0 0.0 0.0 0.0 0.0 0.0 Z 0.0 0.0 Z Z Z
+ BKB & PB plants 3 208.5 3 208.5 0.0 0.0 0.0 Z Z 0.0 0.0 Z Z Z
+ Coal liquefaction plants 0.0 0.0 0.0 0.0 0.0 Z Z Z Z Z Z Z
+ For blended natural gas 0.0 Z 0.0 Z Z 0.0 Z 0.0 Z Z Z Z
+ Liquid biofuels blended 2 757.6 Z Z Z Z Z Z 2 757.6 Z Z Z Z
+ Charcoal production plants 33.1 Z Z Z Z Z Z 33.1 Z Z Z Z
+ Gas-to-liquids plants 0.0 Z Z Z Z Z 0.0 Z Z Z Z Z
+ Not elsewhere specified 0.0 0.0 0.0 0.0 0.0 0.0 0.0 0.0 0.0 Z Z Z
Transformation output 211 958.5 9 798.9 5 907.8 0.0 Z 126 036.7 0.0 2 782.8 Z Z 11 221.0 56 211.3
+ Electricity & heat generation 67 432.3 Z Z Z Z Z Z Z Z Z 11 221.0 56 211.3
+ Coke ovens 7 889.6 6 426.9 1 462.7 Z Z Z Z Z Z Z Z Z
+ Blast furnaces 4 445.1 0.0 4 445.1 Z Z Z Z Z Z Z Z Z
+ Gas works 0.0 0.0 0.0 Z Z Z Z Z Z Z Z Z
+ Refineries & petrochemical industry 126 036.7 Z Z Z Z 126 036.7 Z 0.0 Z Z Z Z
+ Patent fuel plants 0.0 0.0 Z Z Z Z Z Z Z Z Z Z
+ BKB & PB plants 3 372.0 3 372.0 Z 0.0 Z Z Z Z Z Z Z Z
+ Coal liquefaction plants 0.0 Z Z Z Z 0.0 Z Z Z Z Z Z
+ Blended in natural gas 0.0 Z Z Z Z Z 0.0 Z Z Z Z Z
+ Liquid biofuels blended 2 757.6 Z Z Z Z Z Z 2 757.6 Z Z Z Z
+ Charcoal production plants 25.2 Z Z Z Z Z Z 25.2 Z Z Z Z
+ Gas-to-liquids plants 0.0 Z Z Z Z 0.0 Z Z Z Z Z Z
+ Not elsewhere specified 0.0 0.0 0.0 0.0 Z 0.0 Z Z Z Z Z Z
Energy sector 11 565.6 187.9 646.1 0.0 0.0 4 435.1 1 374.7 538.4 0.0 Z 338.4 4 045.0
+ Own use in electricity & heat generation 2 981.8 0.0 0.0 0.0 0.0 0.0 0.0 0.0 0.0 Z 0.0 2 981.8
+ Coal mines 63.8 0.5 0.0 0.0 0.0 3.1 14.6 0.0 0.0 Z 2.4 43.3
+ Oil & natural gas extraction plants 250.0 Z Z Z Z 0.0 196.9 0.0 Z Z 0.7 52.4
+ Patent fuel plants 0.0 0.0 0.0 0.0 0.0 Z Z 0.0 0.0 Z 0.0 0.0
+ Coke ovens 646.3 0.0 621.1 0.0 0.0 0.0 0.0 0.0 0.0 Z 0.0 25.2
+ BKB & PB plants 867.7 187.4 0.0 0.0 0.0 Z Z 17.6 0.0 Z 245.5 417.2
+ Gas works 0.0 0.0 0.0 0.0 0.0 0.0 0.0 0.0 0.0 Z 0.0 0.0
+ Blast furnaces 0.0 0.0 0.0 0.0 0.0 0.0 0.0 0.0 0.0 Z 0.0 0.0
+ Petroleum refineries (oil refineries) 6 234.1 0.0 25.0 0.0 0.0 4 427.2 1 163.2 3.7 0.0 Z 89.9 525.2
+ Nuclear industry 0.0 Z Z Z Z Z Z Z Z Z 0.0 0.0
+ Coal liquefaction plants 0.0 0.0 0.0 0.0 0.0 Z Z Z Z Z 0.0 0.0
+ Liquefaction & regasification plants (LNG) 0.0 Z Z Z Z Z 0.0 Z Z Z 0.0 0.0
+ Gasification plants for biogas 516.8 Z Z Z Z Z Z 516.8 0.0 Z 0.0 0.0
+ Gas-to-liquids (GTL) plants 0.0 Z Z Z Z Z 0.0 Z Z Z 0.0 0.0
+ Charcoal production plants 0.0 Z Z Z Z Z Z 0.0 0.0 Z 0.0 0.0
+ Not elsewhere specified (energy) 5.2 0.0 0.0 0.0 0.0 4.8 0.0 0.4 0.0 Z 0.0 0.0
Distribution losses 4 025.3 0.0 563.7 0.0 0.0 0.0 0.0 65.2 0.0 Z 1 072.7 2 323.6
Available for final consumption 228 764.3 5 360.0 2 194.8 0.0 0.0 94 126.7 55 655.2 15 871.6 1 126.7 0.0 9 807.0 44 622.4
Final non-energy consumption 22 803.3 391.3 0.0 0.0 0.0 19 829.9 2 582.1 0.0 Z Z Z Z
Final energy consumption 204 604.4 4 547.9 2 194.8 0.0 0.0 73 663.0 52 771.6 15 871.0 1 126.7 Z 9 807.0 44 622.4
+ Industry 56 272.6 4 029.2 2 194.8 0.0 0.0 2 075.1 20 360.7 2 763.4 1 126.7 Z 4 110.4 19 612.3
+ Iron & steel 7 630.4 917.8 2 115.5 0.0 0.0 30.3 2 240.6 0.1 0.0 Z 30.6 2 295.4
+ Chemical & petrochemical 15 115.9 862.0 28.9 0.0 0.0 1 015.6 5 866.3 78.3 237.2 Z 2 365.6 4 662.0
+ Non-ferrous metals 2 353.0 28.9 0.0 0.0 0.0 61.0 834.8 0.3 6.4 Z 22.1 1 399.5
+ Non-metallic minerals 6 709.7 1 419.1 0.0 0.0 0.0 333.1 2 538.8 502.5 802.4 Z 17.5 1 096.4
+ Transport equipment 3 025.7 177.9 37.3 0.0 0.0 40.0 934.5 6.3 0.0 Z 300.7 1 528.9
+ Machinery 5 298.7 37.6 12.6 0.0 0.0 230.7 1 803.2 38.6 1.8 Z 258.6 2 915.6
+ Mining & quarrying 355.6 60.0 0.0 0.0 0.0 31.7 102.1 6.7 0.0 Z 3.1 152.0
+ Food, beverages & tobacco 5 104.4 207.8 0.0 0.0 0.0 153.6 2 820.2 59.6 0.0 Z 260.6 1 602.7
+ Paper, pulp & printing 5 691.6 313.6 0.0 0.0 0.0 37.5 2 080.3 724.1 78.4 Z 617.2 1 840.6
+ Wood & wood products 1 866.0 0.0 0.0 0.0 0.0 15.3 137.3 1 234.9 0.3 Z 63.9 414.2
+ Construction 0.0 0.0 0.0 0.0 0.0 0.0 0.0 0.0 0.0 Z 0.0 0.0
+ Textile & leather 471.8 4.3 0.0 0.0 0.0 19.5 242.9 2.2 0.0 Z 15.6 187.3
+ Not elsewhere specified (industry) 2 649.8 0.0 0.4 0.0 0.0 106.8 759.6 110.0 0.1 Z 155.0 1 517.9
+ Transport 57 242.6 0.0 0.0 0.0 0.0 53 158.2 457.0 2 599.3 0.0 Z Z 1 028.1
+ Rail 1 301.6 0.0 0.0 0.0 0.0 272.8 Z 14.2 0.0 Z Z 1 014.6
+ Road 54 579.4 Z Z Z Z 51 837.7 143.0 2 585.2 0.0 Z Z 13.5
+ Domestic aviation 673.8 Z Z Z Z 673.8 Z 0.0 Z Z Z Z
+ Domestic navigation 244.1 0.0 0.0 0.0 0.0 244.1 Z 0.0 0.0 Z Z Z
+ Pipeline transport 314.0 Z Z Z Z 0.0 314.0 0.0 Z Z Z 0.0
+ Not elsewhere specified (transport) 129.6 0.0 0.0 0.0 0.0 129.6 0.0 0.0 0.0 Z Z 0.0
+ Other 91 089.2 518.7 0.0 0.0 0.0 18 429.8 31 954.0 10 508.2 0.0 Z 5 696.6 23 982.0
+ Commercial & public services 34 451.7 18.3 0.0 0.0 0.0 6 996.6 10 355.7 2 856.8 0.0 Z 1 265.5 12 958.8
+ Households 56 552.3 500.4 0.0 0.0 0.0 11 347.9 21 598.2 7 651.4 0.0 Z 4 431.1 11 023.2
+ Agriculture & forestry 0.0 0.0 0.0 0.0 0.0 0.0 0.0 0.0 0.0 Z 0.0 0.0
+ Fishing 0.0 0.0 0.0 0.0 0.0 0.0 0.0 0.0 0.0 Z 0.0 0.0
+ Not elsewhere specified (other) 85.2 0.0 0.0 0.0 0.0 85.2 0.0 0.0 0.0 Z 0.0 0.0
Statistical differences 1 356.7 420.9 0.0 0.0 0.0 633.7 301.4 0.6 0.0 0.0 0.0 0.0
Gross electricity production 56 065.0 20 802.2 936.8 0.0 0.0 479.0 7 539.6 19 117.9 626.9 6 562.7 Z Z
Gross heat production 11 042.1 3 125.6 14.3 0.0 0.0 108.9 5 241.5 1 615.6 936.2 0.0 Z 0.0
Source: Eurostat (nrg_bal_c)
48Energy balance sheets — 2017 data
Electricity
ktoe 2017
Oil and
petroleum
products
Natural
gas
Renewables
and
biofuels
Non-
renewable
waste
Nuclear
heatHeat
GermanyTotal
Solid
fossil
fuels
Manufac-
tured
gases
Peat and
peat
products
Oil shale
and oil
sands

2005 2010 2011 2012 2013 2014 2015 2016 2017
Gross available energy 347 418 337 327 320 346 321 946 328 833 316 813 318 941 321 927 324 473
Solid fossil fuels 81 841 79 076 77 966 79 919 81 561 79 605 79 415 77 131 71 308
Peat & peat products 2 0 0 0 0 0 0 0 0
Oil shale & oil sands 0 0 0 0 0 0 0 0 0
Crude oil & other hydrocarbons 119 259 97 747 95 523 97 185 95 521 93 989 96 150 96 899 95 901
Petroleum products 7 818 18 215 16 609 14 909 18 864 18 043 16 134 16 691 19 560
Natural gas 77 782 75 905 69 596 69 819 73 102 63 374 65 154 70 330 75 341
Nuclear heat 42 061 36 201 27 807 25 619 25 052 25 011 23 636 21 795 19 655
Renewable energies 17 210 27 571 29 300 32 252 33 397 35 406 38 354 38 915 42 707
Non-renewable wastes 1 845 3 906 3 874 4 016 4 107 4 302 4 252 4 513 4 514
Primary production 136 676 128 510 122 534 122 621 120 486 119 764 119 653 115 662 115 788
Solid fossil fuels 56 458 45 906 46 697 47 596 45 055 44 133 43 004 39 725 39 442
Peat 26 0 0 0 0 0 0 0 0
Oil shale and oil sands 0 0 0 0 0 0 0 0 0
Crude oil & other hydrocarbons 5 103 3 672 3 807 3 736 3 726 3 436 3 540 3 597 3 530
Natural gas 14 334 11 113 10 893 9 569 8 866 6 864 6 335 6 551 6 029
Nuclear heat 42 061 36 201 27 807 25 619 25 052 25 011 23 636 21 795 19 655
Renewable energies 16 851 27 712 29 456 32 086 33 679 36 018 38 886 39 481 42 618
Non-renewable wastes 1 845 3 906 3 874 4 016 4 107 4 302 4 252 4 513 4 514
Net imports 211 521 204 051 199 383 199 238 207 109 196 225 198 461 205 106 207 369
Solid fossil fuels 25 977 31 639 32 405 32 118 36 268 35 632 36 072 38 264 32 301
Crude oil 114 493 93 970 91 675 94 792 92 144 90 767 92 326 92 530 92 119
Gas/Diesel Oil (w/o bio) 3 696 9 150 7 398 7 494 11 086 9 574 10 313 10 145 10 765
Motor Gasoline (w/o bio) -2 565 -2 953 -2 950 -3 556 -3 316 -3 134 -2 535 -3 551 -3 585
Naphtha 6 603 6 894 6 322 6 040 6 609 7 556 6 681 7 182 7 761
LPG 100 711 657 863 782 435 513 618 764
All other oil & petroleum products 1 340 4 427 3 984 3 267 3 047 2 249 1 103 2 547 2 827
Natural gas 61 940 61 645 60 377 59 826 63 541 56 673 58 676 62 285 68 841
Transformation input 313 048 290 974 279 485 284 801 283 018 278 802 280 801 282 102 280 261
Electricity & heat generation 142 015 139 242 130 422 133 995 134 628 130 783 130 472 130 095 125 728
Refinery intake 128 292 105 033 103 523 104 467 101 711 100 385 102 801 104 175 105 327
Coke ovens 7 540 8 316 8 229 8 072 8 328 8 552 8 504 9 060 9 049
Blast furnaces 9 737 10 188 9 682 9 874 9 745 9 932 10 094 9 915 10 098
Transformation output 227 711 209 979 204 327 207 800 206 466 204 551 207 486 210 536 211 959
Electricity & heat generation 65 331 66 731 63 874 65 638 66 584 64 450 66 551 67 022 67 432
Refinery output 125 115 103 088 101 376 102 389 99 533 98 968 100 165 102 178 101 945
Coke ovens 7 130 7 052 6 898 6 943 7 135 7 564 7 608 8 096 7 890
Blast furnaces 4 578 4 524 4 332 4 255 4 374 4 357 4 486 4 351 4 445
Energy sector 13 135 12 361 12 309 12 364 12 076 11 835 11 949 12 472 11 566
Distribution losses 4 135 3 612 3 504 3 537 3 592 3 689 3 821 3 906 4 025
Available for final consumption 234 878 229 639 218 999 218 339 225 987 216 730 219 423 222 548 228 764
Solid fossil fuels 5 145 6 805 6 561 3 753 4 220 5 149 5 594 5 807 5 360
Manufactured gases 2 566 2 553 2 610 2 545 2 493 2 481 2 591 2 374 2 195
Peat & peat products 2 0 0 0 0 0 0 0 0
Oil shale & oil sands 0 0 0 0 0 0 0 0 0
Gas/Diesel Oil (w/o bio) 53 196 51 075 49 088 50 656 52 954 51 791 51 670 51 958 52 500
Motor Gasoline (w/o bio) 23 795 19 136 19 130 17 887 17 908 17 731 17 558 17 524 17 536
Naphtha 14 396 12 953 12 040 12 327 12 677 13 329 12 681 12 543 12 192
LPG 2 722 3 056 2 946 3 144 3 101 2 759 2 843 2 805 3 702
All other oil & petroleum products 9 600 8 715 8 604 7 659 7 491 7 952 7 982 8 202 8 197
Natural gas 58 682 54 673 49 726 51 718 56 206 48 049 49 662 51 665 55 655
Primary solid biofuels & charcoal 6 107 8 051 7 400 7 308 7 488 7 837 8 671 8 949 9 244
Liquid biofuels 1 919 3 151 2 991 3 092 2 832 2 929 2 714 2 720 2 743
All other renewable energies 814 1 469 1 770 1 886 2 239 2 459 2 577 2 600 3 885
Non-renewable wastes 276 953 906 900 1 006 1 018 1 026 1 132 1 127
Electricity 44 907 45 780 45 189 45 214 44 987 44 096 44 259 44 486 44 622
Heat 10 751 11 268 10 036 10 250 10 385 9 150 9 594 9 782 9 807
Statistical difference 4 098 629 389 -1 861 510 -416 -229 -1 408 1 357
Final non-energy consumption 24 662 22 585 22 380 21 817 21 733 22 124 21 260 21 422 22 803
Final energy consumption 206 117 206 425 196 230 198 382 203 744 195 022 198 392 202 534 204 604
Industry 54 195 55 261 55 930 55 088 55 145 54 858 55 231 55 833 56 273
Transport 54 877 53 155 53 651 53 264 54 253 55 466 55 158 56 556 57 243
Other sectors 97 046 98 009 86 648 90 030 94 346 84 698 88 004 90 146 91 089
Services 33 193 35 356 31 909 33 249 34 489 33 043 34 716 34 001 34 452
Households 63 502 62 475 54 578 56 624 59 711 51 526 53 170 56 040 56 552
Europe 2020-2030 indicators 2005 2010 2011 2012 2013 2014 2015 2016 2017
Gross inland consumption 344 928 334 553 317 626 319 407 326 538 314 505 316 518 319 109 321 114
Primary energy consumption 320 266 311 968 295 246 297 590 304 804 292 381 295 258 297 688 298 311
Final energy consumption 218 720 220 036 209 235 212 170 217 447 208 597 212 011 216 715 218 714
Source: Eurostat (nrg_bal_c)
49
Germanyktoe
Energy balance sheets — 2017 data

Source: Eurostat (nrg_bal_c)
Source: Eurostat (nrg_bal_c)
Note: Please refer to page 23 for related methodological definitions.
Germany
50Energy balance sheets — 2017 data
0
100 000
200 000
300 000
400 000
500 000
600 000
700 000
1990 1995 2000 2005 2010 2015 2017
Gross electricity production by fuel, GWh
Solid fossil fuels Oil and petroleum products Natural gas
Renewables and biofuels Nuclear heat Other
0
20 000
40 000
60 000
80 000
100 000
120 000
140 000
160 000
1990 1995 2000 2005 2010 2015 2017
Gross available energy by fuel, ktoe
Solid fossil fuels Oil and petroleum products Natural gas
Renewables and biofuels Nuclear heat Non-renewable waste

Source: Eurostat (nrg_bal_c)
Source: Eurostat (nrg_bal_c)
Note: Please refer to page 23 for related methodological definitions.
Germany
51Energy balance sheets — 2017 data
0
50 000
100 000
150 000
200 000
250 000
1990 1995 2000 2005 2010 2015 2017
Final energy consumption by fuel, ktoe
Solid fossil fuels Oil and petroleum products Natural gas
Renewables and biofuels Electricity Heat
Other
0
50 000
100 000
150 000
200 000
250 000
300 000
1990 1995 2000 2005 2010 2015 2017
Final consumption by sector, ktoe
Industry Transport Services Households Non-energy use

+ Primary production 5 791.7 0.0 Z 7.7 4 147.1 0.0 0.0 1 564.6 72.4 0.0 Z Z
+ Recovered & recycled products 0.0 0.0 Z 0.0 0.0 0.0 Z 0.0 Z Z Z Z
+ Imports 2 533.7 23.6 0.0 0.0 0.0 1 889.4 406.0 18.6 0.0 Z 0.0 196.1
- Exports 2 286.6 12.9 0.0 7.5 0.0 1 294.6 0.0 540.4 0.0 Z 0.0 431.2
+ Change in stock 32.6 1.6 0.0 35.4 54.8 -78.4 0.0 19.4 -0.2 Z Z Z
= Gross available energy 6 071.4 12.3 0.0 35.6 4 201.8 516.4 406.0 1 062.3 72.2 0.0 0.0 -235.1
- International maritime bunkers 307.0 0.0 0.0 0.0 0.0 307.0 0.0 0.0 Z Z Z Z
= Gross inland consumption 5 764.5 12.3 0.0 35.6 4 201.8 209.4 406.0 1 062.3 72.2 0.0 0.0 -235.1
- International aviation 59.7 Z Z Z Z 59.7 Z 0.0 Z Z Z Z
= Total energy supply 5 704.8 12.3 0.0 35.6 4 201.8 149.8 406.0 1 062.3 72.2 0.0 0.0 -235.1
Transformation input 5 254.8 2.6 142.2 35.6 4 135.6 128.2 165.7 591.9 53.0 0.0 0.0 0.0
+ Electricity & heat generation 3 525.0 2.6 142.2 35.6 2 494.2 39.8 165.7 591.9 53.0 0.0 0.0 0.0
+ Coke ovens 16.3 0.0 0.0 0.0 16.3 0.0 0.0 0.0 Z Z Z Z
+ Blast furnaces 0.0 0.0 0.0 0.0 0.0 0.0 0.0 0.0 Z Z Z Z
+ Gas works 184.8 0.0 0.0 0.0 184.8 0.0 0.0 0.0 Z Z Z Z
+ Refineries & petrochemical industry 88.4 Z Z Z Z 88.4 Z Z Z Z Z Z
+ Patent fuel plants 0.0 0.0 0.0 0.0 0.0 0.0 Z 0.0 0.0 Z Z Z
+ BKB & PB plants 0.0 0.0 0.0 0.0 0.0 Z Z 0.0 0.0 Z Z Z
+ Coal liquefaction plants 1 440.2 0.0 0.0 0.0 1 440.2 Z Z Z Z Z Z Z
+ For blended natural gas 0.0 Z 0.0 Z Z 0.0 Z 0.0 Z Z Z Z
+ Liquid biofuels blended 0.0 Z Z Z Z Z Z 0.0 Z Z Z Z
+ Charcoal production plants 0.0 Z Z Z Z Z Z 0.0 Z Z Z Z
+ Gas-to-liquids plants 0.0 Z Z Z Z Z 0.0 Z Z Z Z Z
+ Not elsewhere specified 0.0 0.0 0.0 0.0 0.0 0.0 0.0 0.0 0.0 Z Z Z
Transformation output 2 890.2 12.9 142.2 0.0 Z 1 046.2 0.0 0.0 Z Z 579.5 1 109.5
+ Electricity & heat generation 1 688.9 Z Z Z Z Z Z Z Z Z 579.5 1 109.5
+ Coke ovens 12.9 12.9 0.0 Z Z Z Z Z Z Z Z Z
+ Blast furnaces 0.0 0.0 0.0 Z Z Z Z Z Z Z Z Z
+ Gas works 142.2 0.0 142.2 Z Z Z Z Z Z Z Z Z
+ Refineries & petrochemical industry 91.2 Z Z Z Z 91.2 Z 0.0 Z Z Z Z
+ Patent fuel plants 0.0 0.0 Z Z Z Z Z Z Z Z Z Z
+ BKB & PB plants 0.0 0.0 Z 0.0 Z Z Z Z Z Z Z Z
+ Coal liquefaction plants 955.0 Z Z Z Z 955.0 Z Z Z Z Z Z
+ Blended in natural gas 0.0 Z Z Z Z Z 0.0 Z Z Z Z Z
+ Liquid biofuels blended 0.0 Z Z Z Z Z Z 0.0 Z Z Z Z
+ Charcoal production plants 0.0 Z Z Z Z Z Z 0.0 Z Z Z Z
+ Gas-to-liquids plants 0.0 Z Z Z Z 0.0 Z Z Z Z Z Z
+ Not elsewhere specified 0.0 0.0 0.0 0.0 Z 0.0 Z Z Z Z Z Z
Energy sector 217.4 1.6 0.0 0.0 2.0 13.1 4.5 1.0 0.0 Z 8.4 186.8
+ Own use in electricity & heat generation 146.0 1.6 0.0 0.0 0.0 0.0 0.0 1.0 0.0 Z 0.0 143.5
+ Coal mines 35.9 0.0 0.0 0.0 2.0 13.1 0.0 0.0 0.0 Z 0.1 20.7
+ Oil & natural gas extraction plants 4.5 Z Z Z Z 0.0 4.5 0.0 Z Z 0.0 0.0
+ Patent fuel plants 0.0 0.0 0.0 0.0 0.0 Z Z 0.0 0.0 Z 0.0 0.0
+ Coke ovens 0.0 0.0 0.0 0.0 0.0 0.0 0.0 0.0 0.0 Z 0.0 0.0
+ BKB & PB plants 0.8 0.0 0.0 0.0 0.0 Z Z 0.0 0.0 Z 0.0 0.8
+ Gas works 0.0 0.0 0.0 0.0 0.0 0.0 0.0 0.0 0.0 Z 0.0 0.0
+ Blast furnaces 0.0 0.0 0.0 0.0 0.0 0.0 0.0 0.0 0.0 Z 0.0 0.0
+ Petroleum refineries (oil refineries) 0.0 0.0 0.0 0.0 0.0 0.0 0.0 0.0 0.0 Z 0.0 0.0
+ Nuclear industry 0.0 Z Z Z Z Z Z Z Z Z 0.0 0.0
+ Coal liquefaction plants 26.2 0.0 0.0 0.0 0.0 Z Z Z Z Z 8.4 17.9
+ Liquefaction & regasification plants (LNG) 0.0 Z Z Z Z Z 0.0 Z Z Z 0.0 0.0
+ Gasification plants for biogas 0.0 Z Z Z Z Z Z 0.0 0.0 Z 0.0 0.0
+ Gas-to-liquids (GTL) plants 0.0 Z Z Z Z Z 0.0 Z Z Z 0.0 0.0
+ Charcoal production plants 0.0 Z Z Z Z Z Z 0.0 0.0 Z 0.0 0.0
+ Not elsewhere specified (energy) 3.9 0.0 0.0 0.0 0.0 0.0 0.0 0.0 0.0 Z 0.0 3.9
Distribution losses 149.5 0.0 0.0 0.0 0.0 0.0 0.0 0.0 0.0 Z 82.5 67.0
Available for final consumption 2 973.4 21.1 0.0 0.0 64.2 1 054.7 235.7 469.4 19.2 0.0 488.5 620.6
Final non-energy consumption 120.6 0.0 0.0 0.0 53.4 67.3 0.0 0.0 Z Z Z Z
Final energy consumption 2 805.8 21.1 0.0 0.0 19.1 987.6 235.7 428.6 17.2 Z 475.9 620.6
+ Industry 456.2 17.9 0.0 0.0 19.1 55.8 98.3 18.7 17.2 Z 37.0 192.3
+ Iron & steel 0.4 0.0 0.0 0.0 0.0 0.0 0.3 0.0 0.0 Z 0.0 0.2
+ Chemical & petrochemical 36.3 0.0 0.0 0.0 0.0 5.2 4.1 0.0 0.0 Z 17.2 9.8
+ Non-ferrous metals 1.1 0.0 0.0 0.0 0.0 0.0 1.1 0.0 0.0 Z 0.0 0.0
+ Non-metallic minerals 85.0 17.9 0.0 0.0 18.8 1.0 15.4 0.0 17.2 Z 1.7 12.9
+ Transport equipment 7.1 0.0 0.0 0.0 0.0 1.0 1.9 0.3 0.0 Z 1.5 2.3
+ Machinery 37.2 0.0 0.0 0.0 0.0 1.1 4.0 1.0 0.0 Z 5.2 26.0
+ Mining & quarrying 9.2 0.0 0.0 0.0 0.0 4.0 4.3 0.0 0.0 Z 0.0 0.9
+ Food, beverages & tobacco 57.7 0.0 0.0 0.0 0.3 4.0 23.5 0.4 0.0 Z 3.0 26.6
+ Paper, pulp & printing 72.4 0.0 0.0 0.0 0.0 0.0 22.2 7.2 0.0 Z 0.8 42.2
+ Wood & wood products 66.2 0.0 0.0 0.0 0.0 4.0 9.5 8.4 0.0 Z 1.5 42.9
+ Construction 50.2 0.0 0.0 0.0 0.0 33.3 7.1 0.7 0.0 Z 2.0 7.1
+ Textile & leather 8.8 0.0 0.0 0.0 0.0 0.0 2.1 0.1 0.0 Z 1.6 5.0
+ Not elsewhere specified (industry) 24.6 0.0 0.0 0.0 0.0 2.1 3.0 0.5 0.0 Z 2.5 16.5
+ Transport 802.8 0.0 0.0 0.0 0.0 793.2 4.7 1.0 0.0 Z Z 4.0
+ Rail 16.9 0.0 0.0 0.0 0.0 15.8 Z 0.0 0.0 Z Z 1.1
+ Road 776.6 Z Z Z Z 769.6 4.7 1.0 0.0 Z Z 1.4
+ Domestic aviation 1.2 Z Z Z Z 1.2 Z 0.0 Z Z Z Z
+ Domestic navigation 6.6 0.0 0.0 0.0 0.0 6.6 Z 0.0 0.0 Z Z Z
+ Pipeline transport 0.0 Z Z Z Z 0.0 0.0 0.0 Z Z Z 0.0
+ Not elsewhere specified (transport) 1.5 0.0 0.0 0.0 0.0 0.0 0.0 0.0 0.0 Z Z 1.5
+ Other 1 546.8 3.2 0.0 0.0 0.0 138.6 132.8 409.0 0.0 Z 438.9 424.4
+ Commercial & public services 471.3 0.0 0.0 0.0 0.0 30.0 73.0 13.2 0.0 Z 118.9 236.1
+ Households 942.5 2.1 0.0 0.0 0.0 9.6 55.4 390.4 0.0 Z 318.1 166.8
+ Agriculture & forestry 131.8 1.1 0.0 0.0 0.0 99.0 4.4 5.3 0.0 Z 1.8 20.3
+ Fishing 1.2 0.0 0.0 0.0 0.0 0.0 0.0 0.0 0.0 Z 0.0 1.2
+ Not elsewhere specified (other) 0.0 0.0 0.0 0.0 0.0 0.0 0.0 0.0 0.0 Z 0.0 0.0
Statistical differences 46.9 0.0 0.0 0.0 -8.2 -0.3 0.0 40.9 1.9 0.0 12.6 0.0
Gross electricity production 1 109.5 1.5 64.8 9.3 852.3 10.3 5.4 153.6 12.1 0.0 Z Z
Gross heat production 579.5 0.4 45.9 17.0 45.6 19.1 127.8 297.0 26.7 0.0 Z 0.0
Source: Eurostat (nrg_bal_c)
52Energy balance sheets — 2017 data
Electricity
ktoe 2017
Oil and
petroleum
products
Natural
gas
Renewables
and
biofuels
Non-
renewable
waste
Nuclear
heatHeat
EstoniaTotal
Solid
fossil
fuels
Manufac-
tured
gases
Peat and
peat
products
Oil shale
and oil
sands
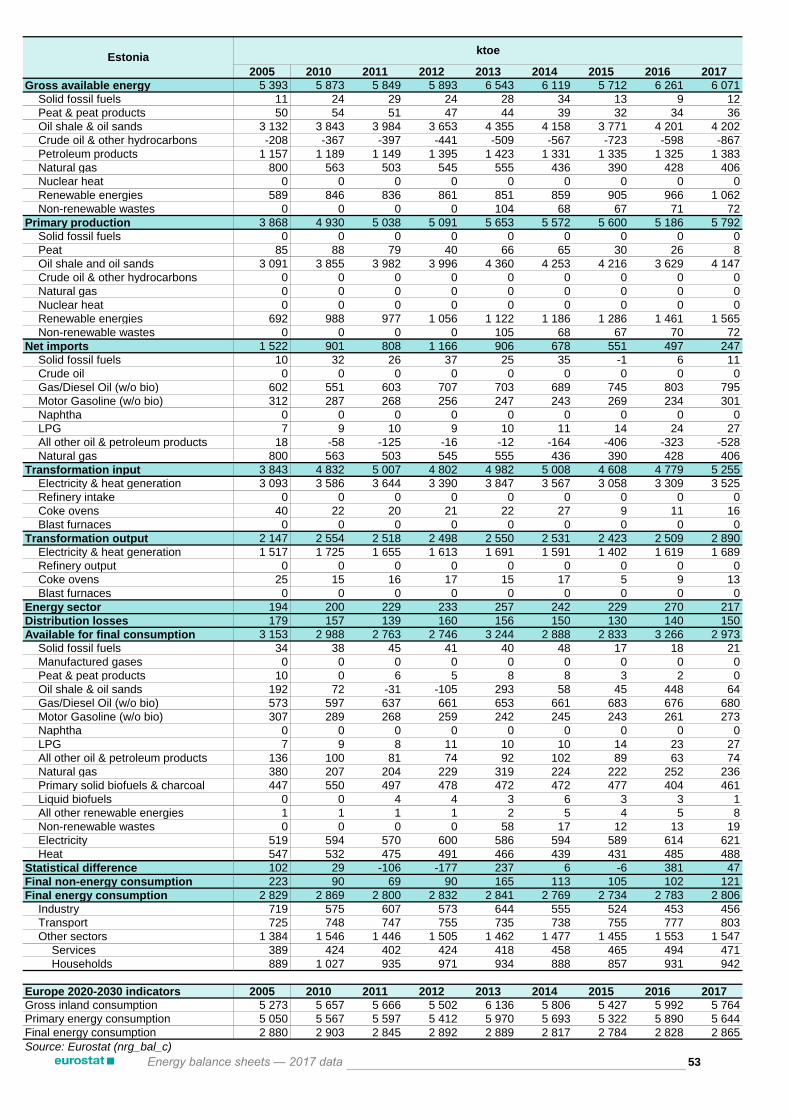
2005 2010 2011 2012 2013 2014 2015 2016 2017
Gross available energy 5 393 5 873 5 849 5 893 6 543 6 119 5 712 6 261 6 071
Solid fossil fuels 11 24 29 24 28 34 13 9 12
Peat & peat products 50 54 51 47 44 39 32 34 36
Oil shale & oil sands 3 132 3 843 3 984 3 653 4 355 4 158 3 771 4 201 4 202
Crude oil & other hydrocarbons -208 -367 -397 -441 -509 -567 -723 -598 -867
Petroleum products 1 157 1 189 1 149 1 395 1 423 1 331 1 335 1 325 1 383
Natural gas 800 563 503 545 555 436 390 428 406
Nuclear heat 0 0 0 0 0 0 0 0 0
Renewable energies 589 846 836 861 851 859 905 966 1 062
Non-renewable wastes 0 0 0 0 104 68 67 71 72
Primary production 3 868 4 930 5 038 5 091 5 653 5 572 5 600 5 186 5 792
Solid fossil fuels 0 0 0 0 0 0 0 0 0
Peat 85 88 79 40 66 65 30 26 8
Oil shale and oil sands 3 091 3 855 3 982 3 996 4 360 4 253 4 216 3 629 4 147
Crude oil & other hydrocarbons 0 0 0 0 0 0 0 0 0
Natural gas 0 0 0 0 0 0 0 0 0
Nuclear heat 0 0 0 0 0 0 0 0 0
Renewable energies 692 988 977 1 056 1 122 1 186 1 286 1 461 1 565
Non-renewable wastes 0 0 0 0 105 68 67 70 72
Net imports 1 522 901 808 1 166 906 678 551 497 247
Solid fossil fuels 10 32 26 37 25 35 -1 6 11
Crude oil 0 0 0 0 0 0 0 0 0
Gas/Diesel Oil (w/o bio) 602 551 603 707 703 689 745 803 795
Motor Gasoline (w/o bio) 312 287 268 256 247 243 269 234 301
Naphtha 0 0 0 0 0 0 0 0 0
LPG 7 9 10 9 10 11 14 24 27
All other oil & petroleum products 18 -58 -125 -16 -12 -164 -406 -323 -528
Natural gas 800 563 503 545 555 436 390 428 406
Transformation input 3 843 4 832 5 007 4 802 4 982 5 008 4 608 4 779 5 255
Electricity & heat generation 3 093 3 586 3 644 3 390 3 847 3 567 3 058 3 309 3 525
Refinery intake 0 0 0 0 0 0 0 0 0
Coke ovens 40 22 20 21 22 27 9 11 16
Blast furnaces 0 0 0 0 0 0 0 0 0
Transformation output 2 147 2 554 2 518 2 498 2 550 2 531 2 423 2 509 2 890
Electricity & heat generation 1 517 1 725 1 655 1 613 1 691 1 591 1 402 1 619 1 689
Refinery output 0 0 0 0 0 0 0 0 0
Coke ovens 25 15 16 17 15 17 5 9 13
Blast furnaces 0 0 0 0 0 0 0 0 0
Energy sector 194 200 229 233 257 242 229 270 217
Distribution losses 179 157 139 160 156 150 130 140 150
Available for final consumption 3 153 2 988 2 763 2 746 3 244 2 888 2 833 3 266 2 973
Solid fossil fuels 34 38 45 41 40 48 17 18 21
Manufactured gases 0 0 0 0 0 0 0 0 0
Peat & peat products 10 0 6 5 8 8 3 2 0
Oil shale & oil sands 192 72 -31 -105 293 58 45 448 64
Gas/Diesel Oil (w/o bio) 573 597 637 661 653 661 683 676 680
Motor Gasoline (w/o bio) 307 289 268 259 242 245 243 261 273
Naphtha 0 0 0 0 0 0 0 0 0
LPG 7 9 8 11 10 10 14 23 27
All other oil & petroleum products 136 100 81 74 92 102 89 63 74
Natural gas 380 207 204 229 319 224 222 252 236
Primary solid biofuels & charcoal 447 550 497 478 472 472 477 404 461
Liquid biofuels 0 0 4 4 3 6 3 3 1
All other renewable energies 1 1 1 1 2 5 4 5 8
Non-renewable wastes 0 0 0 0 58 17 12 13 19
Electricity 519 594 570 600 586 594 589 614 621
Heat 547 532 475 491 466 439 431 485 488
Statistical difference 102 29 -106 -177 237 6 -6 381 47
Final non-energy consumption 223 90 69 90 165 113 105 102 121
Final energy consumption 2 829 2 869 2 800 2 832 2 841 2 769 2 734 2 783 2 806
Industry 719 575 607 573 644 555 524 453 456
Transport 725 748 747 755 735 738 755 777 803
Other sectors 1 384 1 546 1 446 1 505 1 462 1 477 1 455 1 553 1 547
Services 389 424 402 424 418 458 465 494 471
Households 889 1 027 935 971 934 888 857 931 942
Europe 2020-2030 indicators 2005 2010 2011 2012 2013 2014 2015 2016 2017
Gross inland consumption 5 273 5 657 5 666 5 502 6 136 5 806 5 427 5 992 5 764
Primary energy consumption 5 050 5 567 5 597 5 412 5 970 5 693 5 322 5 890 5 644
Final energy consumption 2 880 2 903 2 845 2 892 2 889 2 817 2 784 2 828 2 865
Source: Eurostat (nrg_bal_c)
53
Estoniaktoe
Energy balance sheets — 2017 data
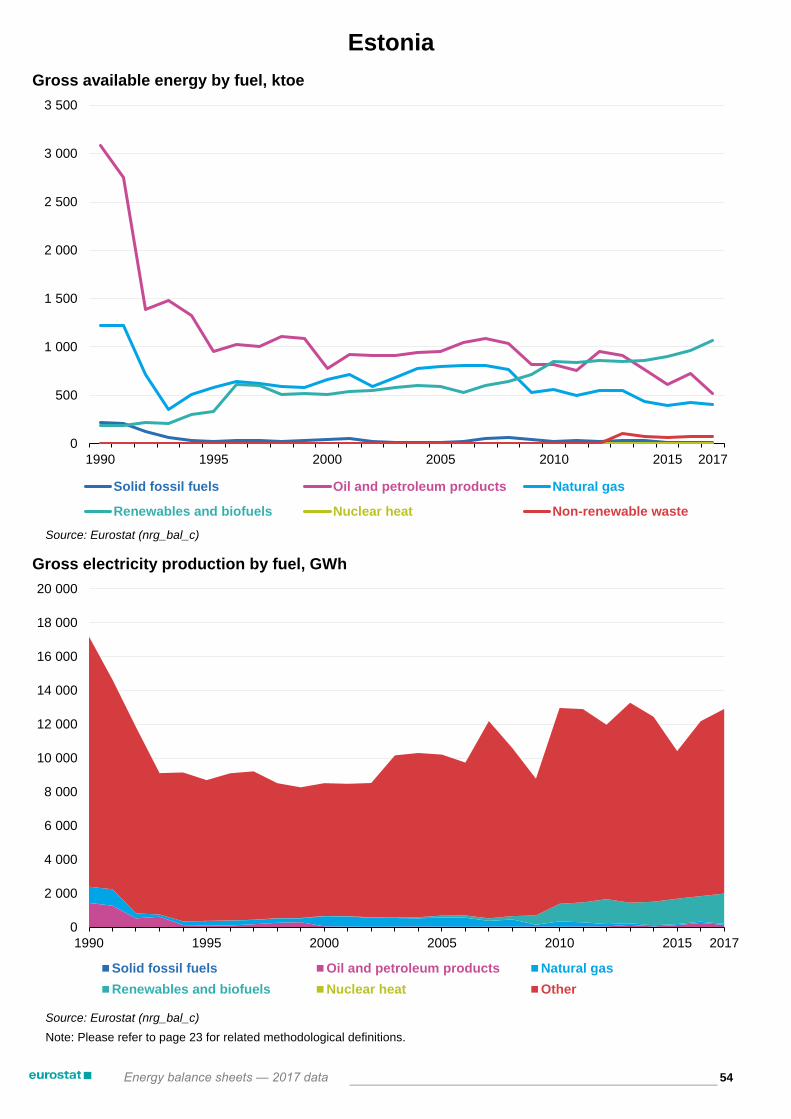
Source: Eurostat (nrg_bal_c)
Source: Eurostat (nrg_bal_c)
Note: Please refer to page 23 for related methodological definitions.
Estonia
54Energy balance sheets — 2017 data
0
2 000
4 000
6 000
8 000
10 000
12 000
14 000
16 000
18 000
20 000
1990 1995 2000 2005 2010 2015 2017
Gross electricity production by fuel, GWh
Solid fossil fuels Oil and petroleum products Natural gas
Renewables and biofuels Nuclear heat Other
0
500
1 000
1 500
2 000
2 500
3 000
3 500
1990 1995 2000 2005 2010 2015 2017
Gross available energy by fuel, ktoe
Solid fossil fuels Oil and petroleum products Natural gas
Renewables and biofuels Nuclear heat Non-renewable waste

Source: Eurostat (nrg_bal_c)
Source: Eurostat (nrg_bal_c)
Note: Please refer to page 23 for related methodological definitions.
Estonia
55Energy balance sheets — 2017 data
0
1 000
2 000
3 000
4 000
5 000
6 000
1990 1995 2000 2005 2010 2015 2017
Final energy consumption by fuel, ktoe
Solid fossil fuels Oil and petroleum products Natural gas
Renewables and biofuels Electricity Heat
Other
0
1 000
2 000
3 000
4 000
5 000
6 000
1990 1995 2000 2005 2010 2015 2017
Final consumption by sector, ktoe
Industry Transport Services Households Non-energy use

+ Primary production 4 860.7 0.0 Z 743.9 0.0 0.0 2 848.2 1 142.2 126.4 0.0 Z Z
+ Recovered & recycled products 0.0 0.0 Z 0.0 0.0 0.0 Z 0.0 Z Z Z Z
+ Imports 12 304.4 1 229.9 0.0 0.0 0.0 9 400.5 1 409.4 168.6 0.0 Z 0.0 96.0
- Exports 2 364.1 9.6 0.0 5.5 0.0 2 194.4 0.0 0.2 0.0 Z 0.0 154.3
+ Change in stock 3.9 -121.4 0.0 -65.1 0.0 127.3 55.0 8.2 0.0 Z Z Z
= Gross available energy 14 804.9 1 098.9 0.0 673.3 0.0 7 333.4 4 312.6 1 318.7 126.4 0.0 0.0 -58.3
- International maritime bunkers 150.4 0.0 0.0 0.0 0.0 150.4 0.0 0.0 Z Z Z Z
= Gross inland consumption 14 654.5 1 098.9 0.0 673.3 0.0 7 183.0 4 312.6 1 318.7 126.4 0.0 0.0 -58.3
- International aviation 1 017.5 Z Z Z Z 1 017.5 Z 0.0 Z Z Z Z
= Total energy supply 13 637.0 1 098.9 0.0 673.3 0.0 6 165.5 4 312.6 1 318.7 126.4 0.0 0.0 -58.3
Transformation input 8 684.5 867.6 0.0 613.8 0.0 3 654.0 2 472.5 985.9 56.4 0.0 0.0 34.3
+ Electricity & heat generation 4 800.9 867.6 0.0 505.7 0.0 34.6 2 418.6 883.8 56.4 0.0 0.0 34.3
+ Coke ovens 0.0 0.0 0.0 0.0 0.0 0.0 0.0 0.0 Z Z Z Z
+ Blast furnaces 0.0 0.0 0.0 0.0 0.0 0.0 0.0 0.0 Z Z Z Z
+ Gas works 0.0 0.0 0.0 0.0 0.0 0.0 0.0 0.0 Z Z Z Z
+ Refineries & petrochemical industry 3 619.4 Z Z Z Z 3 619.4 Z Z Z Z Z Z
+ Patent fuel plants 0.0 0.0 0.0 0.0 0.0 0.0 Z 0.0 0.0 Z Z Z
+ BKB & PB plants 108.1 0.0 0.0 108.1 0.0 Z Z 0.0 0.0 Z Z Z
+ Coal liquefaction plants 0.0 0.0 0.0 0.0 0.0 Z Z Z Z Z Z Z
+ For blended natural gas 0.0 Z 0.0 Z Z 0.0 Z 0.0 Z Z Z Z
+ Liquid biofuels blended 102.1 Z Z Z Z Z Z 102.1 Z Z Z Z
+ Charcoal production plants 0.0 Z Z Z Z Z Z 0.0 Z Z Z Z
+ Gas-to-liquids plants 0.0 Z Z Z Z Z 0.0 Z Z Z Z Z
+ Not elsewhere specified 54.0 0.0 0.0 0.0 0.0 0.0 54.0 0.0 0.0 Z Z Z
Transformation output 6 517.9 0.0 0.0 75.1 Z 3 686.3 0.0 102.1 Z Z 0.0 2 654.4
+ Electricity & heat generation 2 654.4 Z Z Z Z Z Z Z Z Z 0.0 2 654.4
+ Coke ovens 0.0 0.0 0.0 Z Z Z Z Z Z Z Z Z
+ Blast furnaces 0.0 0.0 0.0 Z Z Z Z Z Z Z Z Z
+ Gas works 0.0 0.0 0.0 Z Z Z Z Z Z Z Z Z
+ Refineries & petrochemical industry 3 641.2 Z Z Z Z 3 641.2 Z 0.0 Z Z Z Z
+ Patent fuel plants 0.0 0.0 Z Z Z Z Z Z Z Z Z Z
+ BKB & PB plants 75.1 0.0 Z 75.1 Z Z Z Z Z Z Z Z
+ Coal liquefaction plants 0.0 Z Z Z Z 0.0 Z Z Z Z Z Z
+ Blended in natural gas 0.0 Z Z Z Z Z 0.0 Z Z Z Z Z
+ Liquid biofuels blended 102.1 Z Z Z Z Z Z 102.1 Z Z Z Z
+ Charcoal production plants 0.0 Z Z Z Z Z Z 0.0 Z Z Z Z
+ Gas-to-liquids plants 45.1 Z Z Z Z 45.1 Z Z Z Z Z Z
+ Not elsewhere specified 0.0 0.0 0.0 0.0 Z 0.0 Z Z Z Z Z Z
Energy sector 232.4 0.0 0.0 20.0 0.0 135.0 0.0 0.0 0.0 Z 0.0 77.5
+ Own use in electricity & heat generation 67.4 0.0 0.0 0.0 0.0 0.0 0.0 0.0 0.0 Z 0.0 67.4
+ Coal mines 0.0 0.0 0.0 0.0 0.0 0.0 0.0 0.0 0.0 Z 0.0 0.0
+ Oil & natural gas extraction plants 0.0 Z Z Z Z 0.0 0.0 0.0 Z Z 0.0 0.0
+ Patent fuel plants 0.0 0.0 0.0 0.0 0.0 Z Z 0.0 0.0 Z 0.0 0.0
+ Coke ovens 0.0 0.0 0.0 0.0 0.0 0.0 0.0 0.0 0.0 Z 0.0 0.0
+ BKB & PB plants 25.4 0.0 0.0 20.0 0.0 Z Z 0.0 0.0 Z 0.0 5.5
+ Gas works 0.0 0.0 0.0 0.0 0.0 0.0 0.0 0.0 0.0 Z 0.0 0.0
+ Blast furnaces 0.0 0.0 0.0 0.0 0.0 0.0 0.0 0.0 0.0 Z 0.0 0.0
+ Petroleum refineries (oil refineries) 138.8 0.0 0.0 0.0 0.0 135.0 0.0 0.0 0.0 Z 0.0 3.8
+ Nuclear industry 0.0 Z Z Z Z Z Z Z Z Z 0.0 0.0
+ Coal liquefaction plants 0.0 0.0 0.0 0.0 0.0 Z Z Z Z Z 0.0 0.0
+ Liquefaction & regasification plants (LNG) 0.0 Z Z Z Z Z 0.0 Z Z Z 0.0 0.0
+ Gasification plants for biogas 0.0 Z Z Z Z Z Z 0.0 0.0 Z 0.0 0.0
+ Gas-to-liquids (GTL) plants 0.0 Z Z Z Z Z 0.0 Z Z Z 0.0 0.0
+ Charcoal production plants 0.0 Z Z Z Z Z Z 0.0 0.0 Z 0.0 0.0
+ Not elsewhere specified (energy) 0.8 0.0 0.0 0.0 0.0 0.0 0.0 0.0 0.0 Z 0.0 0.8
Distribution losses 236.7 0.0 0.0 0.0 0.0 0.0 49.6 0.0 0.0 Z 0.0 187.1
Available for final consumption 11 001.3 231.2 0.0 114.7 0.0 6 062.8 1 790.5 434.9 70.0 0.0 0.0 2 297.2
Final non-energy consumption 243.8 0.0 0.0 0.0 0.0 243.8 0.0 0.0 Z Z Z Z
Final energy consumption 10 741.5 233.0 0.0 188.7 0.0 5 783.2 1 799.7 444.3 70.0 Z 0.0 2 222.7
+ Industry 2 509.5 102.3 0.0 0.4 0.0 492.5 762.0 200.8 70.0 Z 0.0 881.7
+ Iron & steel 0.0 0.0 0.0 0.0 0.0 0.0 0.0 0.0 0.0 Z 0.0 0.0
+ Chemical & petrochemical 251.9 0.0 0.0 0.0 0.0 27.2 64.2 0.0 0.0 Z 0.0 160.5
+ Non-ferrous metals 494.5 0.0 0.0 0.0 0.0 7.7 418.4 0.0 0.0 Z 0.0 68.5
+ Non-metallic minerals 457.2 80.5 0.0 0.0 0.0 182.2 16.7 51.5 70.0 Z 0.0 56.2
+ Transport equipment 24.9 0.0 0.0 0.0 0.0 4.4 1.8 0.0 0.0 Z 0.0 18.7
+ Machinery 307.2 0.0 0.0 0.0 0.0 48.0 127.6 0.0 0.0 Z 0.0 131.6
+ Mining & quarrying 108.3 0.0 0.0 0.0 0.0 33.1 11.8 0.0 0.0 Z 0.0 63.4
+ Food, beverages & tobacco 472.3 21.3 0.0 0.4 0.0 135.0 104.0 23.1 0.0 Z 0.0 188.4
+ Paper, pulp & printing 26.2 0.1 0.0 0.0 0.0 2.1 3.3 0.0 0.0 Z 0.0 20.7
+ Wood & wood products 168.1 0.0 0.0 0.0 0.0 2.1 2.0 126.1 0.0 Z 0.0 37.9
+ Construction 6.3 0.0 0.0 0.0 0.0 0.0 0.0 0.0 0.0 Z 0.0 6.3
+ Textile & leather 15.5 0.0 0.0 0.0 0.0 3.1 1.1 0.0 0.0 Z 0.0 11.3
+ Not elsewhere specified (industry) 177.2 0.3 0.0 0.0 0.0 47.7 10.8 0.0 0.0 Z 0.0 118.3
+ Transport 4 043.0 0.0 0.0 0.0 0.0 3 863.1 0.0 175.4 0.0 Z Z 4.5
+ Rail 41.1 0.0 0.0 0.0 0.0 37.2 Z 0.0 0.0 Z Z 3.9
+ Road 3 922.8 Z Z Z Z 3 746.8 0.0 175.4 0.0 Z Z 0.6
+ Domestic aviation 3.6 Z Z Z Z 3.6 Z 0.0 Z Z Z Z
+ Domestic navigation 75.5 0.0 0.0 0.0 0.0 75.5 Z 0.0 0.0 Z Z Z
+ Pipeline transport 0.0 Z Z Z Z 0.0 0.0 0.0 Z Z Z 0.0
+ Not elsewhere specified (transport) 0.0 0.0 0.0 0.0 0.0 0.0 0.0 0.0 0.0 Z Z 0.0
+ Other 4 189.0 130.7 0.0 188.3 0.0 1 427.6 1 037.6 68.1 0.0 Z 0.0 1 336.5
+ Commercial & public services 1 373.5 0.0 0.0 0.0 0.0 257.2 483.3 28.8 0.0 Z 0.0 604.2
+ Households 2 579.2 130.7 0.0 188.3 0.0 982.1 554.4 39.3 0.0 Z 0.0 684.4
+ Agriculture & forestry 213.5 0.0 0.0 0.0 0.0 165.5 0.0 0.0 0.0 Z 0.0 48.0
+ Fishing 22.8 0.0 0.0 0.0 0.0 22.8 0.0 0.0 0.0 Z 0.0 0.0
+ Not elsewhere specified (other) 0.0 0.0 0.0 0.0 0.0 0.0 0.0 0.0 0.0 Z 0.0 0.0
Statistical differences 16.0 -1.7 0.0 -74.0 0.0 35.8 -9.2 -9.4 0.0 0.0 0.0 74.5
Gross electricity production 2 654.4 313.4 0.0 186.1 0.0 12.2 1 348.2 780.8 13.7 0.0 Z Z
Gross heat production 0.0 0.0 0.0 0.0 0.0 0.0 0.0 0.0 0.0 0.0 Z 0.0
Source: Eurostat (nrg_bal_c)
56Energy balance sheets — 2017 data
Electricity
ktoe 2017
Oil and
petroleum
products
Natural
gas
Renewables
and
biofuels
Non-
renewable
waste
Nuclear
heatHeat
IrelandTotal
Solid
fossil
fuels
Manufac-
tured
gases
Peat and
peat
products
Oil shale
and oil
sands

2005 2010 2011 2012 2013 2014 2015 2016 2017
Gross available energy 15 564 15 185 13 941 14 105 13 525 13 586 14 301 15 038 14 805
Solid fossil fuels 1 882 1 231 1 232 1 485 1 311 1 233 1 426 1 370 1 099
Peat & peat products 762 616 704 1 115 386 672 762 773 673
Oil shale & oil sands 0 0 0 0 0 0 0 0 0
Crude oil & other hydrocarbons 3 385 2 971 3 006 3 125 2 875 2 805 3 441 3 270 3 253
Petroleum products 5 497 4 952 4 039 3 489 4 005 3 934 3 713 4 270 4 081
Natural gas 3 495 4 702 4 137 4 031 3 853 3 732 3 759 4 247 4 313
Nuclear heat 0 0 0 0 0 0 0 0 0
Renewable energies 366 663 767 778 841 960 1 074 1 103 1 319
Non-renewable wastes 0 9 14 46 61 66 69 67 126
Primary production 1 697 1 874 1 705 1 272 2 308 2 033 1 934 4 204 4 861
Solid fossil fuels 0 0 0 0 0 0 0 0 0
Peat 845 1 011 774 321 1 327 982 769 679 744
Oil shale and oil sands 0 0 0 0 0 0 0 0 0
Crude oil & other hydrocarbons 0 0 0 0 0 0 0 0 0
Natural gas 487 234 196 179 165 132 113 2 488 2 848
Nuclear heat 0 0 0 0 0 0 0 0 0
Renewable energies 366 620 721 726 755 852 983 970 1 142
Non-renewable wastes 0 9 14 46 61 66 69 67 126
Net imports 13 951 13 234 12 609 11 819 12 408 11 717 12 712 10 390 9 940
Solid fossil fuels 1 897 956 1 409 1 330 1 473 1 205 1 469 1 146 1 220
Crude oil 3 342 3 019 3 038 3 005 2 999 2 762 3 724 3 269 2 984
Gas/Diesel Oil (w/o bio) 2 083 1 908 2 048 1 967 2 194 2 286 2 297 2 616 2 690
Motor Gasoline (w/o bio) 888 1 079 949 646 710 660 491 480 422
Naphtha -17 -23 -21 -5 -32 -17 -26 -75 -101
LPG 112 90 66 51 74 77 106 118 122
All other oil & petroleum products 2 470 1 651 1 088 904 1 007 864 890 1 062 1 089
Natural gas 3 010 4 480 3 954 3 838 3 710 3 592 3 621 1 700 1 409
Transformation input 8 850 8 531 7 957 8 269 7 789 7 613 8 548 8 701 8 684
Electricity & heat generation 5 006 4 931 4 473 4 634 4 270 4 230 4 494 4 863 4 801
Refinery intake 3 386 2 971 3 032 3 143 2 915 2 826 3 457 3 307 3 265
Coke ovens 0 0 0 0 0 0 0 0 0
Blast furnaces 0 0 0 0 0 0 0 0 0
Transformation output 5 885 5 982 5 739 5 914 5 649 5 542 6 469 6 388 6 518
Electricity & heat generation 2 233 2 438 2 336 2 352 2 229 2 243 2 441 2 624 2 654
Refinery output 3 227 2 964 2 995 3 110 2 870 2 789 3 461 3 274 3 286
Coke ovens 0 0 0 0 0 0 0 0 0
Blast furnaces 0 0 0 0 0 0 0 0 0
Energy sector 287 236 212 241 232 218 223 232 232
Distribution losses 266 267 254 245 250 250 252 235 237
Available for final consumption 11 125 11 306 10 467 10 584 10 129 10 176 10 749 11 240 11 001
Solid fossil fuels 459 364 319 325 341 291 299 268 231
Manufactured gases 0 0 0 0 0 0 0 0 0
Peat & peat products 183 27 146 472 -221 45 154 180 115
Oil shale & oil sands 0 0 0 0 0 0 0 0 0
Gas/Diesel Oil (w/o bio) 2 907 3 089 2 995 3 102 3 275 3 225 3 436 3 738 3 738
Motor Gasoline (w/o bio) 1 704 1 456 1 430 1 178 1 208 1 164 1 117 1 028 901
Naphtha -11 0 0 0 0 0 0 0 1
LPG 164 152 140 133 142 143 157 163 175
All other oil & petroleum products 2 095 2 163 1 543 1 370 1 329 1 175 1 273 1 407 1 248
Natural gas 1 366 1 575 1 514 1 634 1 627 1 633 1 747 1 805 1 790
Primary solid biofuels & charcoal 178 180 165 154 167 194 185 182 190
Liquid biofuels 1 93 58 60 73 90 88 114 173
All other renewable energies 7 22 29 38 40 45 51 59 72
Non-renewable wastes 0 9 14 27 39 42 44 42 70
Electricity 2 072 2 176 2 116 2 091 2 111 2 129 2 197 2 252 2 297
Heat 0 0 0 0 0 0 0 0 0
Statistical difference -1 229 -305 -92 214 -308 -115 160 246 16
Final non-energy consumption 516 342 306 281 294 208 216 267 244
Final energy consumption 11 838 11 269 10 252 10 089 10 144 10 082 10 372 10 727 10 741
Industry 2 596 2 145 2 231 2 193 2 185 2 240 2 385 2 438 2 510
Transport 4 316 4 036 3 675 3 584 3 625 3 799 3 785 4 082 4 043
Other sectors 4 927 5 088 4 346 4 313 4 333 4 043 4 202 4 207 4 189
Services 1 597 1 498 1 310 1 310 1 280 1 213 1 257 1 320 1 374
Households 2 947 3 289 2 760 2 735 2 795 2 583 2 703 2 660 2 579
Europe 2020-2030 indicators 2005 2010 2011 2012 2013 2014 2015 2016 2017
Gross inland consumption 15 457 15 100 13 844 14 007 13 392 13 456 14 142 14 885 14 654
Primary energy consumption 14 941 14 758 13 538 13 725 13 099 13 248 13 927 14 618 14 411
Final energy consumption 12 652 12 010 10 945 10 670 10 785 10 824 11 211 11 593 11 759
Source: Eurostat (nrg_bal_c)
57
Irelandktoe
Energy balance sheets — 2017 data

Source: Eurostat (nrg_bal_c)
Source: Eurostat (nrg_bal_c)
Note: Please refer to page 23 for related methodological definitions.
Ireland
58Energy balance sheets — 2017 data
0
5 000
10 000
15 000
20 000
25 000
30 000
35 000
1990 1995 2000 2005 2010 2015 2017
Gross electricity production by fuel, GWh
Solid fossil fuels Oil and petroleum products Natural gas
Renewables and biofuels Nuclear heat Other
0
1 000
2 000
3 000
4 000
5 000
6 000
7 000
8 000
9 000
10 000
1990 1995 2000 2005 2010 2015 2017
Gross available energy by fuel, ktoe
Solid fossil fuels Oil and petroleum products Natural gas
Renewables and biofuels Nuclear heat Non-renewable waste

Source: Eurostat (nrg_bal_c)
Source: Eurostat (nrg_bal_c)
Note: Please refer to page 23 for related methodological definitions.
Ireland
59Energy balance sheets — 2017 data
0
2 000
4 000
6 000
8 000
10 000
12 000
14 000
1990 1995 2000 2005 2010 2015 2017
Final energy consumption by fuel, ktoe
Solid fossil fuels Oil and petroleum products Natural gas
Renewables and biofuels Electricity Heat
Other
0
2 000
4 000
6 000
8 000
10 000
12 000
14 000
1990 1995 2000 2005 2010 2015 2017
Final consumption by sector, ktoe
Industry Transport Services Households Non-energy use

+ Primary production 7 500.9 4 567.3 Z 0.0 0.0 139.4 9.1 2 785.2 0.0 0.0 Z Z
+ Recovered & recycled products 10.9 0.0 Z 0.0 0.0 10.9 Z 0.0 Z Z Z Z
+ Imports 38 191.3 228.8 0.0 0.0 0.0 32 845.6 4 225.1 144.1 0.0 Z 0.0 747.7
- Exports 19 454.8 0.0 0.0 0.0 0.0 19 230.3 0.0 13.1 0.0 Z 0.0 211.4
+ Change in stock 117.0 20.6 0.0 0.0 0.0 127.6 -30.5 -0.7 0.0 Z Z Z
= Gross available energy 26 365.2 4 816.6 0.0 0.0 0.0 13 893.2 4 203.7 2 915.4 0.0 0.0 0.0 536.3
- International maritime bunkers 2 134.2 0.0 0.0 0.0 0.0 2 134.2 0.0 0.0 Z Z Z Z
= Gross inland consumption 24 231.0 4 816.6 0.0 0.0 0.0 11 759.0 4 203.7 2 915.4 0.0 0.0 0.0 536.3
- International aviation 986.6 Z Z Z Z 986.6 Z 0.0 Z Z Z Z
= Total energy supply 23 244.4 4 816.6 0.0 0.0 0.0 10 772.5 4 203.7 2 915.4 0.0 0.0 0.0 536.3
Transformation input 44 419.6 4 600.5 0.0 0.0 0.0 35 764.3 2 614.5 1 430.8 0.0 0.0 0.0 9.5
+ Electricity & heat generation 9 902.1 4 600.5 0.0 0.0 0.0 1 425.4 2 614.5 1 252.3 0.0 0.0 0.0 9.5
+ Coke ovens 0.0 0.0 0.0 0.0 0.0 0.0 0.0 0.0 Z Z Z Z
+ Blast furnaces 0.5 0.0 0.0 0.0 0.0 0.5 0.0 0.0 Z Z Z Z
+ Gas works 0.4 0.0 0.0 0.0 0.0 0.4 0.0 0.0 Z Z Z Z
+ Refineries & petrochemical industry 34 337.8 Z Z Z Z 34 337.8 Z Z Z Z Z Z
+ Patent fuel plants 0.0 0.0 0.0 0.0 0.0 0.0 Z 0.0 0.0 Z Z Z
+ BKB & PB plants 0.0 0.0 0.0 0.0 0.0 Z Z 0.0 0.0 Z Z Z
+ Coal liquefaction plants 0.0 0.0 0.0 0.0 0.0 Z Z Z Z Z Z Z
+ For blended natural gas 0.0 Z 0.0 Z Z 0.0 Z 0.0 Z Z Z Z
+ Liquid biofuels blended 177.0 Z Z Z Z Z Z 177.0 Z Z Z Z
+ Charcoal production plants 1.6 Z Z Z Z Z Z 1.6 Z Z Z Z
+ Gas-to-liquids plants 0.0 Z Z Z Z Z 0.0 Z Z Z Z Z
+ Not elsewhere specified 0.3 0.0 0.0 0.0 0.0 0.3 0.0 0.0 0.0 Z Z Z
Transformation output 40 045.3 0.0 0.0 0.0 Z 35 070.0 0.0 172.2 Z Z 51.1 4 752.0
+ Electricity & heat generation 4 803.1 Z Z Z Z Z Z Z Z Z 51.1 4 752.0
+ Coke ovens 0.0 0.0 0.0 Z Z Z Z Z Z Z Z Z
+ Blast furnaces 0.0 0.0 0.0 Z Z Z Z Z Z Z Z Z
+ Gas works 0.0 0.0 0.0 Z Z Z Z Z Z Z Z Z
+ Refineries & petrochemical industry 35 070.0 Z Z Z Z 35 070.0 Z 0.0 Z Z Z Z
+ Patent fuel plants 0.0 0.0 Z Z Z Z Z Z Z Z Z Z
+ BKB & PB plants 0.0 0.0 Z 0.0 Z Z Z Z Z Z Z Z
+ Coal liquefaction plants 0.0 Z Z Z Z 0.0 Z Z Z Z Z Z
+ Blended in natural gas 0.0 Z Z Z Z Z 0.0 Z Z Z Z Z
+ Liquid biofuels blended 171.5 Z Z Z Z Z Z 171.5 Z Z Z Z
+ Charcoal production plants 0.7 Z Z Z Z Z Z 0.7 Z Z Z Z
+ Gas-to-liquids plants 0.0 Z Z Z Z 0.0 Z Z Z Z Z Z
+ Not elsewhere specified 0.0 0.0 0.0 0.0 Z 0.0 Z Z Z Z Z Z
Energy sector 2 016.8 0.0 0.0 0.0 0.0 1 459.6 12.6 1.0 0.0 Z 0.0 543.6
+ Own use in electricity & heat generation 403.2 0.0 0.0 0.0 0.0 0.0 0.0 1.0 0.0 Z 0.0 402.1
+ Coal mines 56.5 0.0 0.0 0.0 0.0 0.0 0.0 0.0 0.0 Z 0.0 56.5
+ Oil & natural gas extraction plants 17.4 Z Z Z Z 0.0 12.6 0.0 Z Z 0.0 4.8
+ Patent fuel plants 0.0 0.0 0.0 0.0 0.0 Z Z 0.0 0.0 Z 0.0 0.0
+ Coke ovens 0.0 0.0 0.0 0.0 0.0 0.0 0.0 0.0 0.0 Z 0.0 0.0
+ BKB & PB plants 0.0 0.0 0.0 0.0 0.0 Z Z 0.0 0.0 Z 0.0 0.0
+ Gas works 0.0 0.0 0.0 0.0 0.0 0.0 0.0 0.0 0.0 Z 0.0 0.0
+ Blast furnaces 0.2 0.0 0.0 0.0 0.0 0.2 0.0 0.0 0.0 Z 0.0 0.0
+ Petroleum refineries (oil refineries) 1 535.0 0.0 0.0 0.0 0.0 1 459.3 0.0 0.0 0.0 Z 0.0 75.7
+ Nuclear industry 0.0 Z Z Z Z Z Z Z Z Z 0.0 0.0
+ Coal liquefaction plants 0.0 0.0 0.0 0.0 0.0 Z Z Z Z Z 0.0 0.0
+ Liquefaction & regasification plants (LNG) 0.0 Z Z Z Z Z 0.0 Z Z Z 0.0 0.0
+ Gasification plants for biogas 0.0 Z Z Z Z Z Z 0.0 0.0 Z 0.0 0.0
+ Gas-to-liquids (GTL) plants 0.0 Z Z Z Z Z 0.0 Z Z Z 0.0 0.0
+ Charcoal production plants 0.0 Z Z Z Z Z Z 0.0 0.0 Z 0.0 0.0
+ Not elsewhere specified (energy) 4.5 0.0 0.0 0.0 0.0 0.1 0.0 0.0 0.0 Z 0.0 4.5
Distribution losses 104.2 0.0 0.0 0.0 0.0 0.0 9.4 0.0 0.0 Z 0.0 94.7
Available for final consumption 16 749.2 216.1 0.0 0.0 0.0 8 618.6 1 567.1 1 655.8 0.0 0.0 51.1 4 640.5
Final non-energy consumption 818.2 0.0 0.0 0.0 0.0 462.5 355.7 0.0 Z Z Z Z
Final energy consumption 16 054.2 195.7 0.0 0.0 0.0 8 329.2 1 180.1 1 657.7 0.0 Z 51.1 4 640.5
+ Industry 3 096.3 190.4 0.0 0.0 0.0 1 058.7 655.5 135.4 0.0 Z 0.0 1 056.2
+ Iron & steel 128.5 0.0 0.0 0.0 0.0 14.5 27.9 0.0 0.0 Z 0.0 86.1
+ Chemical & petrochemical 121.1 0.0 0.0 0.0 0.0 21.2 42.4 0.0 0.0 Z 0.0 57.5
+ Non-ferrous metals 869.8 153.6 0.0 0.0 0.0 7.8 315.3 0.0 0.0 Z 0.0 393.0
+ Non-metallic minerals 680.5 36.8 0.0 0.0 0.0 537.0 16.4 3.3 0.0 Z 0.0 87.0
+ Transport equipment 18.3 0.0 0.0 0.0 0.0 13.8 0.0 0.0 0.0 Z 0.0 4.6
+ Machinery 49.9 0.0 0.0 0.0 0.0 10.5 2.8 0.0 0.0 Z 0.0 36.5
+ Mining & quarrying 90.9 0.0 0.0 0.0 0.0 85.5 0.0 0.0 0.0 Z 0.0 5.4
+ Food, beverages & tobacco 423.6 0.0 0.0 0.0 0.0 161.3 60.3 112.8 0.0 Z 0.0 89.2
+ Paper, pulp & printing 48.4 0.0 0.0 0.0 0.0 15.8 11.5 3.0 0.0 Z 0.0 18.2
+ Wood & wood products 27.1 0.0 0.0 0.0 0.0 2.4 4.3 14.8 0.0 Z 0.0 5.7
+ Construction 165.2 0.0 0.0 0.0 0.0 110.4 12.1 0.0 0.0 Z 0.0 42.7
+ Textile & leather 38.0 0.0 0.0 0.0 0.0 7.2 11.1 0.0 0.0 Z 0.0 19.8
+ Not elsewhere specified (industry) 434.9 0.0 0.0 0.0 0.0 71.3 151.4 1.6 0.0 Z 0.0 210.6
+ Transport 5 815.3 0.0 0.0 0.0 0.0 5 620.5 12.8 165.8 0.0 Z Z 16.2
+ Rail 55.5 0.0 0.0 0.0 0.0 39.7 Z 1.7 0.0 Z Z 14.1
+ Road 4 992.1 Z Z Z Z 4 813.7 12.8 163.6 0.0 Z Z 2.1
+ Domestic aviation 195.2 Z Z Z Z 195.2 Z 0.0 Z Z Z Z
+ Domestic navigation 570.6 0.0 0.0 0.0 0.0 570.1 Z 0.4 0.0 Z Z Z
+ Pipeline transport 0.0 Z Z Z Z 0.0 0.0 0.0 Z Z Z 0.0
+ Not elsewhere specified (transport) 2.0 0.0 0.0 0.0 0.0 1.9 0.0 0.1 0.0 Z Z 0.0
+ Other 7 142.6 5.3 0.0 0.0 0.0 1 650.0 511.7 1 356.5 0.0 Z 51.1 3 568.1
+ Commercial & public services 2 191.7 0.0 0.0 0.0 0.0 123.4 150.7 263.0 0.0 Z 0.0 1 654.6
+ Households 4 413.3 4.4 0.0 0.0 0.0 1 246.1 360.7 1 063.4 0.0 Z 51.1 1 687.7
+ Agriculture & forestry 291.2 0.5 0.0 0.0 0.0 34.5 0.4 30.0 0.0 Z 0.0 225.8
+ Fishing 12.4 0.0 0.0 0.0 0.0 12.3 0.0 0.1 0.0 Z 0.0 0.0
+ Not elsewhere specified (other) 234.0 0.4 0.0 0.0 0.0 233.7 0.0 0.0 0.0 Z 0.0 0.0
Statistical differences -123.2 20.4 0.0 0.0 0.0 -173.1 31.3 -1.9 0.0 0.0 0.0 0.0
Gross electricity production 4 752.0 1 613.5 0.0 0.0 0.0 473.8 1 471.5 1 193.3 0.0 0.0 Z Z
Gross heat production 51.1 50.7 0.0 0.0 0.0 0.4 0.0 0.0 0.0 0.0 Z 0.0
Source: Eurostat (nrg_bal_c)
60Energy balance sheets — 2017 data
Electricity
ktoe 2017
Oil and
petroleum
products
Natural
gas
Renewables
and
biofuels
Non-
renewable
waste
Nuclear
heatHeat
GreeceTotal
Solid
fossil
fuels
Manufac-
tured
gases
Peat and
peat
products
Oil shale
and oil
sands

2005 2010 2011 2012 2013 2014 2015 2016 2017
Gross available energy 33 748 30 868 30 125 29 308 25 992 25 648 25 649 25 150 26 365
Solid fossil fuels 8 952 7 863 7 887 8 135 6 981 6 687 5 606 4 369 4 817
Peat & peat products 0 0 0 0 0 0 0 0 0
Oil shale & oil sands 0 0 0 0 0 0 0 0 0
Crude oil & other hydrocarbons 19 882 20 527 17 988 22 098 23 293 25 428 26 030 27 627 29 077
Petroleum products 567 -3 410 -2 168 -7 205 -10 318 -12 175 -12 357 -13 792 -15 184
Natural gas 2 354 3 235 3 972 3 662 3 236 2 484 2 677 3 490 4 204
Nuclear heat 0 0 0 0 0 0 0 0 0
Renewable energies 1 643 2 131 2 140 2 449 2 616 2 444 2 777 2 640 2 915
Non-renewable wastes 25 32 28 15 21 21 89 60 0
Primary production 10 323 9 443 9 628 10 425 9 311 8 803 8 471 6 720 7 501
Solid fossil fuels 8 538 7 315 7 505 8 045 6 728 6 384 5 675 3 973 4 567
Peat 0 0 0 0 0 0 0 0 0
Oil shale and oil sands 0 0 0 0 0 0 0 0 0
Crude oil & other hydrocarbons 99 113 97 93 69 63 61 173 139
Natural gas 18 8 6 7 6 5 5 10 9
Nuclear heat 0 0 0 0 0 0 0 0 0
Renewable energies 1 643 1 974 1 992 2 266 2 487 2 329 2 641 2 505 2 785
Non-renewable wastes 25 32 28 15 21 21 89 60 0
Net imports 23 015 21 163 19 478 19 292 16 029 16 772 18 217 18 328 18 736
Solid fossil fuels 371 401 232 185 225 194 159 190 229
Crude oil 17 509 18 987 15 588 20 379 18 994 20 450 21 669 22 950 23 145
Gas/Diesel Oil (w/o bio) 2 339 -501 -186 -3 407 -4 439 -5 746 -5 655 -6 334 -6 075
Motor Gasoline (w/o bio) -252 -1 052 -864 -2 104 -1 770 -2 333 -2 387 -2 983 -3 798
Naphtha -200 -364 -354 -439 -838 -758 -971 -970 -478
LPG -280 -377 -204 -179 -151 -225 -124 -238 -292
All other oil & petroleum products 870 190 867 845 482 1 851 1 896 1 355 1 113
Natural gas 2 332 3 231 3 973 3 674 3 235 2 467 2 674 3 462 4 225
Transformation input 35 592 35 282 32 271 38 489 36 338 39 534 40 120 41 621 44 420
Electricity & heat generation 13 042 12 082 12 319 12 547 11 342 10 266 9 588 9 070 9 902
Refinery intake 21 035 21 889 19 065 23 559 23 890 27 172 28 086 29 785 31 307
Coke ovens 0 0 0 0 0 0 0 0 0
Blast furnaces 0 0 0 0 0 0 0 0 0
Transformation output 28 379 28 725 25 489 31 704 30 311 34 212 35 615 37 998 40 045
Electricity & heat generation 5 210 4 981 5 165 5 287 4 956 4 389 4 510 4 732 4 803
Refinery output 21 636 22 454 19 475 24 049 24 257 27 758 28 670 30 499 32 022
Coke ovens 0 0 0 0 0 0 0 0 0
Blast furnaces 0 0 0 0 0 0 0 0 0
Energy sector 1 736 1 632 1 514 1 896 1 943 1 843 1 785 1 921 2 017
Distribution losses 488 343 258 158 335 357 429 350 104
Available for final consumption 20 644 18 944 18 078 17 562 14 893 15 483 16 324 16 659 16 749
Solid fossil fuels 272 297 206 223 206 204 204 209 216
Manufactured gases 0 0 0 0 0 0 0 0 0
Peat & peat products 0 0 0 0 0 0 0 0 0
Oil shale & oil sands 0 0 0 0 0 0 0 0 0
Gas/Diesel Oil (w/o bio) 7 152 5 621 5 211 4 305 3 165 3 595 4 023 3 954 3 941
Motor Gasoline (w/o bio) 4 148 3 962 3 396 3 183 2 780 2 614 2 551 2 522 2 447
Naphtha 86 117 39 68 19 4 5 3 7
LPG 403 335 360 447 463 499 532 554 560
All other oil & petroleum products 2 369 1 704 1 447 1 930 1 453 1 736 1 752 2 232 1 663
Natural gas 712 1 138 1 546 1 407 1 250 1 189 1 340 1 233 1 567
Primary solid biofuels & charcoal 957 823 1 033 1 133 922 927 1 010 849 857
Liquid biofuels 0 91 75 90 136 149 159 164 164
All other renewable energies 119 244 259 258 262 260 268 271 634
Non-renewable wastes 0 0 0 0 0 0 65 28 0
Electricity 4 377 4 567 4 454 4 473 4 195 4 256 4 367 4 588 4 641
Heat 49 46 54 45 42 50 50 51 51
Statistical difference -287 -447 -903 527 -366 35 -54 251 -123
Final non-energy consumption 768 1 108 883 725 650 705 700 593 818
Final energy consumption 20 164 18 282 18 099 16 310 14 608 14 743 15 678 15 815 16 054
Industry 4 168 3 471 3 322 2 992 2 835 3 088 3 128 3 073 3 096
Transport 7 374 7 443 6 678 5 588 5 609 5 635 5 753 5 897 5 815
Other sectors 8 622 7 367 8 099 7 731 6 164 6 019 6 797 6 845 7 143
Services 1 948 1 952 1 868 1 937 1 818 1 712 1 873 2 035 2 192
Households 5 518 4 615 5 470 5 039 3 764 3 786 4 400 4 287 4 413
Europe 2020-2030 indicators 2005 2010 2011 2012 2013 2014 2015 2016 2017
Gross inland consumption 30 879 28 158 27 373 27 059 23 871 23 783 23 866 23 431 23 941
Primary energy consumption 30 111 27 050 26 490 26 334 23 221 23 078 23 166 22 838 23 123
Final energy consumption 20 961 18 964 18 838 16 969 15 282 15 520 16 502 16 694 16 752
Source: Eurostat (nrg_bal_c)
61
Greecektoe
Energy balance sheets — 2017 data

Source: Eurostat (nrg_bal_c)
Source: Eurostat (nrg_bal_c)
Note: Please refer to page 23 for related methodological definitions.
Greece
62Energy balance sheets — 2017 data
0
10 000
20 000
30 000
40 000
50 000
60 000
70 000
1990 1995 2000 2005 2010 2015 2017
Gross electricity production by fuel, GWh
Solid fossil fuels Oil and petroleum products Natural gas
Renewables and biofuels Nuclear heat Other
0
5 000
10 000
15 000
20 000
25 000
1990 1995 2000 2005 2010 2015 2017
Gross available energy by fuel, ktoe
Solid fossil fuels Oil and petroleum products Natural gas
Renewables and biofuels Nuclear heat Non-renewable waste

Source: Eurostat (nrg_bal_c)
Source: Eurostat (nrg_bal_c)
Note: Please refer to page 23 for related methodological definitions.
Greece
63Energy balance sheets — 2017 data
0
5 000
10 000
15 000
20 000
25 000
1990 1995 2000 2005 2010 2015 2017
Final energy consumption by fuel, ktoe
Solid fossil fuels Oil and petroleum products Natural gas
Renewables and biofuels Electricity Heat
Other
0
5 000
10 000
15 000
20 000
25 000
1990 1995 2000 2005 2010 2015 2017
Final consumption by sector, ktoe
Industry Transport Services Households Non-energy use

+ Primary production 34 226.6 1 127.8 Z 0.0 0.0 122.3 23.8 17 561.5 259.7 15 131.5 Z Z
+ Recovered & recycled products 0.0 0.0 Z 0.0 0.0 0.0 Z 0.0 Z Z Z Z
+ Imports 134 731.8 11 151.9 0.0 0.0 0.0 90 541.3 30 125.7 869.7 0.0 Z 0.0 2 043.2
- Exports 32 817.9 237.5 0.0 0.0 0.0 27 360.9 2 506.9 1 457.8 0.0 Z 0.0 1 254.8
+ Change in stock 1 688.0 705.0 0.0 0.0 0.0 1 254.6 -376.2 104.6 0.0 Z Z Z
= Gross available energy 137 828.4 12 747.2 0.0 0.0 0.0 64 557.2 27 266.4 17 078.0 259.7 15 131.5 0.0 788.4
- International maritime bunkers 6 681.0 0.0 0.0 0.0 0.0 6 681.0 0.0 0.0 Z Z Z Z
= Gross inland consumption 131 147.4 12 747.2 0.0 0.0 0.0 57 876.2 27 266.4 17 078.0 259.7 15 131.5 0.0 788.4
- International aviation 4 580.8 Z Z Z Z 4 580.8 Z 0.0 Z Z Z Z
= Total energy supply 126 566.5 12 747.2 0.0 0.0 0.0 53 295.3 27 266.4 17 078.0 259.7 15 131.5 0.0 788.4
Transformation input 136 363.1 13 635.5 282.6 0.0 0.0 84 786.1 9 929.2 12 029.4 252.7 15 131.5 0.0 316.0
+ Electricity & heat generation 50 598.9 10 829.5 282.6 0.0 0.0 3 240.0 9 929.2 10 617.3 252.7 15 131.5 0.0 316.0
+ Coke ovens 1 397.9 1 397.9 0.0 0.0 0.0 0.0 0.0 0.0 Z Z Z Z
+ Blast furnaces 1 408.0 1 408.0 0.0 0.0 0.0 0.0 0.0 0.0 Z Z Z Z
+ Gas works 0.0 0.0 0.0 0.0 0.0 0.0 0.0 0.0 Z Z Z Z
+ Refineries & petrochemical industry 81 546.1 Z Z Z Z 81 546.1 Z Z Z Z Z Z
+ Patent fuel plants 0.0 0.0 0.0 0.0 0.0 0.0 Z 0.0 0.0 Z Z Z
+ BKB & PB plants 0.0 0.0 0.0 0.0 0.0 Z Z 0.0 0.0 Z Z Z
+ Coal liquefaction plants 0.0 0.0 0.0 0.0 0.0 Z Z Z Z Z Z Z
+ For blended natural gas 7.1 Z 0.0 Z Z 0.0 Z 7.1 Z Z Z Z
+ Liquid biofuels blended 1 273.4 Z Z Z Z Z Z 1 273.4 Z Z Z Z
+ Charcoal production plants 131.6 Z Z Z Z Z Z 131.6 Z Z Z Z
+ Gas-to-liquids plants 0.0 Z Z Z Z Z 0.0 Z Z Z Z Z
+ Not elsewhere specified 0.0 0.0 0.0 0.0 0.0 0.0 0.0 0.0 0.0 Z Z Z
Transformation output 107 282.3 1 374.9 698.2 0.0 Z 80 500.1 7.1 993.8 Z Z 0.0 23 708.2
+ Electricity & heat generation 23 708.2 Z Z Z Z Z Z Z Z Z 0.0 23 708.2
+ Coke ovens 1 609.8 1 374.9 234.9 Z Z Z Z Z Z Z Z Z
+ Blast furnaces 463.3 0.0 463.3 Z Z Z Z Z Z Z Z Z
+ Gas works 0.0 0.0 0.0 Z Z Z Z Z Z Z Z Z
+ Refineries & petrochemical industry 80 500.1 Z Z Z Z 80 500.1 Z 0.0 Z Z Z Z
+ Patent fuel plants 0.0 0.0 Z Z Z Z Z Z Z Z Z Z
+ BKB & PB plants 0.0 0.0 Z 0.0 Z Z Z Z Z Z Z Z
+ Coal liquefaction plants 0.0 Z Z Z Z 0.0 Z Z Z Z Z Z
+ Blended in natural gas 7.1 Z Z Z Z Z 7.1 Z Z Z Z Z
+ Liquid biofuels blended 967.3 Z Z Z Z Z Z 967.3 Z Z Z Z
+ Charcoal production plants 26.5 Z Z Z Z Z Z 26.5 Z Z Z Z
+ Gas-to-liquids plants 0.0 Z Z Z Z 0.0 Z Z Z Z Z Z
+ Not elsewhere specified 0.0 0.0 0.0 0.0 Z 0.0 Z Z Z Z Z Z
Energy sector 9 754.6 20.1 140.3 0.0 0.0 4 923.6 3 113.7 0.1 0.0 Z 0.0 1 556.8
+ Own use in electricity & heat generation 929.4 0.0 0.0 0.0 0.0 0.0 0.0 0.1 0.0 Z 0.0 929.3
+ Coal mines 46.5 0.0 0.0 0.0 0.0 14.4 1.3 0.0 0.0 Z 0.0 30.8
+ Oil & natural gas extraction plants 74.6 Z Z Z Z 3.1 0.0 0.0 Z Z 0.0 71.5
+ Patent fuel plants 0.0 0.0 0.0 0.0 0.0 Z Z 0.0 0.0 Z 0.0 0.0
+ Coke ovens 161.3 20.1 140.3 0.0 0.0 0.0 0.0 0.0 0.0 Z 0.0 0.9
+ BKB & PB plants 0.0 0.0 0.0 0.0 0.0 Z Z 0.0 0.0 Z 0.0 0.0
+ Gas works 0.0 0.0 0.0 0.0 0.0 0.0 0.0 0.0 0.0 Z 0.0 0.0
+ Blast furnaces 0.0 0.0 0.0 0.0 0.0 0.0 0.0 0.0 0.0 Z 0.0 0.0
+ Petroleum refineries (oil refineries) 8 047.9 0.0 0.0 0.0 0.0 4 906.1 2 857.5 0.0 0.0 Z 0.0 284.3
+ Nuclear industry 0.0 Z Z Z Z Z Z Z Z Z 0.0 0.0
+ Coal liquefaction plants 0.0 0.0 0.0 0.0 0.0 Z Z Z Z Z 0.0 0.0
+ Liquefaction & regasification plants (LNG) 0.0 Z Z Z Z Z 0.0 Z Z Z 0.0 0.0
+ Gasification plants for biogas 0.0 Z Z Z Z Z Z 0.0 0.0 Z 0.0 0.0
+ Gas-to-liquids (GTL) plants 0.0 Z Z Z Z Z 0.0 Z Z Z 0.0 0.0
+ Charcoal production plants 0.0 Z Z Z Z Z Z 0.0 0.0 Z 0.0 0.0
+ Not elsewhere specified (energy) 494.9 0.0 0.0 0.0 0.0 0.0 254.8 0.0 0.0 Z 0.0 240.1
Distribution losses 2 483.5 0.0 38.6 0.0 0.0 0.0 117.0 0.0 0.0 Z 0.0 2 327.9
Available for final consumption 85 247.7 466.7 236.7 0.0 0.0 44 085.7 14 113.6 6 042.3 7.0 0.0 0.0 20 295.9
Final non-energy consumption 4 925.0 38.8 0.0 0.0 0.0 4 449.2 437.1 0.0 Z Z Z Z
Final energy consumption 79 397.4 649.5 236.7 0.0 0.0 38 805.8 13 485.8 6 043.2 7.0 Z 0.0 20 169.5
+ Industry 18 973.8 531.7 236.7 0.0 0.0 2 878.0 6 884.6 1 611.3 0.0 Z 0.0 6 831.5
+ Iron & steel 2 532.3 375.1 236.7 0.0 0.0 75.5 629.9 0.0 0.0 Z 0.0 1 215.2
+ Chemical & petrochemical 2 925.1 113.9 0.0 0.0 0.0 114.5 1 878.8 5.1 0.0 Z 0.0 812.8
+ Non-ferrous metals 1 131.6 13.1 0.0 0.0 0.0 63.1 206.0 0.3 0.0 Z 0.0 849.1
+ Non-metallic minerals 3 375.6 8.6 0.0 0.0 0.0 1 389.9 1 223.7 226.9 0.0 Z 0.0 526.6
+ Transport equipment 575.6 0.0 0.0 0.0 0.0 30.5 165.3 0.3 0.0 Z 0.0 379.4
+ Machinery 741.4 0.0 0.0 0.0 0.0 105.9 218.4 1.0 0.0 Z 0.0 416.2
+ Mining & quarrying 484.0 0.0 0.0 0.0 0.0 164.5 150.9 1.3 0.0 Z 0.0 167.2
+ Food, beverages & tobacco 2 527.8 21.1 0.0 0.0 0.0 325.4 1 081.4 211.1 0.0 Z 0.0 888.8
+ Paper, pulp & printing 1 764.9 0.0 0.0 0.0 0.0 79.0 607.2 574.9 0.0 Z 0.0 503.9
+ Wood & wood products 627.8 0.0 0.0 0.0 0.0 22.2 153.1 318.2 0.0 Z 0.0 134.3
+ Construction 1 008.2 0.0 0.0 0.0 0.0 446.8 331.5 25.5 0.0 Z 0.0 204.5
+ Textile & leather 300.1 0.0 0.0 0.0 0.0 27.9 128.1 2.9 0.0 Z 0.0 141.1
+ Not elsewhere specified (industry) 801.5 0.0 0.0 0.0 0.0 32.8 110.3 65.9 0.0 Z 0.0 592.4
+ Transport 31 722.8 0.0 0.0 0.0 0.0 29 935.1 373.2 959.5 0.0 Z Z 454.9
+ Rail 393.0 0.0 0.0 0.0 0.0 79.1 Z 0.0 0.0 Z Z 313.9
+ Road 27 935.6 Z Z Z Z 26 648.7 326.2 955.7 0.0 Z Z 5.0
+ Domestic aviation 2 162.5 Z Z Z Z 2 162.5 Z 0.0 Z Z Z Z
+ Domestic navigation 958.1 0.0 0.0 0.0 0.0 957.4 Z 0.6 0.0 Z Z Z
+ Pipeline transport 0.0 Z Z Z Z 0.0 0.0 0.0 Z Z Z 0.0
+ Not elsewhere specified (transport) 273.6 0.0 0.0 0.0 0.0 87.4 47.0 3.2 0.0 Z Z 136.0
+ Other 28 700.8 117.8 0.0 0.0 0.0 5 992.7 6 228.1 3 472.3 7.0 Z 0.0 12 883.1
+ Commercial & public services 10 413.0 0.0 0.0 0.0 0.0 1 290.6 2 404.6 471.0 7.0 Z 0.0 6 239.8
+ Households 15 435.2 79.3 0.0 0.0 0.0 2 674.4 3 747.5 2 914.3 0.0 Z 0.0 6 019.7
+ Agriculture & forestry 2 404.2 0.0 0.0 0.0 0.0 1 754.8 75.6 76.9 0.0 Z 0.0 496.8
+ Fishing 245.0 0.0 0.0 0.0 0.0 241.7 0.0 3.3 0.0 Z 0.0 0.0
+ Not elsewhere specified (other) 203.5 38.5 0.0 0.0 0.0 31.2 0.3 6.8 0.0 Z 0.0 126.7
Statistical differences 925.2 -221.6 0.0 0.0 0.0 830.7 190.6 -0.9 0.0 0.0 0.0 126.4
Gross electricity production 23 700.3 3 880.2 105.1 0.0 0.0 1 355.6 5 506.2 7 796.4 66.4 4 990.5 Z Z
Gross heat production 0.0 0.0 0.0 0.0 0.0 0.0 0.0 0.0 0.0 0.0 Z 0.0
Source: Eurostat (nrg_bal_c)
64Energy balance sheets — 2017 data
Electricity
ktoe 2017
Oil and
petroleum
products
Natural
gas
Renewables
and
biofuels
Non-
renewable
waste
Nuclear
heatHeat
SpainTotal
Solid
fossil
fuels
Manufac-
tured
gases
Peat and
peat
products
Oil shale
and oil
sands

2005 2010 2011 2012 2013 2014 2015 2016 2017
Gross available energy 152 911 138 852 138 404 137 828 128 347 126 460 130 824 132 223 137 828
Solid fossil fuels 20 517 7 281 12 716 15 519 11 448 11 568 13 583 10 798 12 747
Peat & peat products 0 0 0 0 0 0 0 0 0
Oil shale & oil sands 0 0 0 0 0 0 0 0 0
Crude oil & other hydrocarbons 61 466 57 511 57 072 62 111 61 415 61 831 66 519 65 593 66 711
Petroleum products 17 770 12 291 10 133 285 -2 826 -3 548 -5 990 -3 324 -2 154
Natural gas 29 844 31 129 28 936 28 574 26 163 23 666 24 538 25 040 27 266
Nuclear heat 14 842 16 135 15 045 15 991 14 785 14 931 14 903 15 273 15 132
Renewable energies 8 398 15 047 14 830 16 135 17 744 18 100 17 031 17 948 17 078
Non-renewable wastes 189 174 195 176 200 204 252 235 260
Primary production 30 008 34 410 31 989 33 469 34 734 35 430 33 975 34 638 34 227
Solid fossil fuels 6 265 3 296 2 649 2 461 1 763 1 628 1 246 736 1 128
Peat 0 0 0 0 0 0 0 0 0
Oil shale and oil sands 0 0 0 0 0 0 0 0 0
Crude oil & other hydrocarbons 169 125 102 145 375 311 236 144 122
Natural gas 144 45 45 52 50 21 54 48 24
Nuclear heat 14 842 16 135 15 045 15 991 14 785 14 931 14 903 15 273 15 132
Renewable energies 8 398 14 635 13 953 14 646 17 562 18 335 17 284 18 202 17 561
Non-renewable wastes 189 174 195 176 200 204 252 235 260
Net imports 124 766 107 129 105 425 100 569 90 075 91 998 95 423 94 527 101 914
Solid fossil fuels 14 418 6 757 8 612 11 608 7 590 8 710 10 240 7 746 10 914
Crude oil 60 677 53 460 53 140 59 926 58 973 60 178 65 958 65 393 67 214
Gas/Diesel Oil (w/o bio) 12 730 9 914 6 335 518 -762 -1 301 -778 -605 -1 539
Motor Gasoline (w/o bio) -2 246 -3 449 -3 416 -3 489 -3 523 -3 370 -4 907 -4 531 -4 335
Naphtha 940 978 1 486 58 701 796 923 711 1 686
LPG 902 647 362 62 -81 246 435 1 108 828
All other oil & petroleum products 7 212 8 168 9 159 3 310 1 742 2 694 186 -285 -674
Natural gas 30 248 30 950 29 403 28 073 25 802 24 503 23 775 24 725 27 619
Transformation input 127 329 122 347 123 182 131 960 125 157 125 745 133 647 131 197 136 363
Electricity & heat generation 54 251 49 932 50 706 53 357 48 564 48 499 50 756 48 216 50 599
Refinery intake 62 063 59 303 58 278 63 091 62 222 62 351 66 918 66 952 68 103
Coke ovens 2 581 1 846 1 894 1 664 1 468 1 412 1 416 1 434 1 398
Blast furnaces 1 516 1 212 1 221 1 103 1 500 1 311 1 410 1 281 1 408
Transformation output 96 345 96 561 95 696 101 938 99 191 99 127 105 155 104 805 107 282
Electricity & heat generation 25 287 25 927 25 266 25 585 24 560 23 968 24 154 23 626 23 708
Refinery output 61 558 58 739 57 757 62 359 61 493 61 244 66 213 66 029 66 892
Coke ovens 2 266 1 834 1 688 1 467 1 463 1 302 1 325 1 574 1 610
Blast furnaces 434 400 439 408 446 491 568 531 463
Energy sector 6 473 7 850 7 511 8 807 8 519 8 597 9 315 9 702 9 755
Distribution losses 2 444 2 570 2 420 2 422 2 515 2 480 2 570 2 596 2 483
Available for final consumption 101 915 91 104 88 646 84 487 80 440 77 207 79 004 81 813 85 248
Solid fossil fuels 404 -188 868 987 480 -371 -91 648 467
Manufactured gases 325 298 309 275 260 224 228 229 237
Peat & peat products 0 0 0 0 0 0 0 0 0
Oil shale & oil sands 0 0 0 0 0 0 0 0 0
Gas/Diesel Oil (w/o bio) 34 186 29 925 27 759 25 410 25 754 25 686 26 966 27 460 28 398
Motor Gasoline (w/o bio) 7 624 5 614 5 210 4 874 4 628 4 525 4 568 4 789 4 966
Naphtha 2 473 2 263 2 148 1 493 1 567 1 529 1 555 1 305 1 509
LPG 2 519 2 060 1 851 1 767 1 745 1 836 2 088 2 754 2 572
All other oil & petroleum products 10 949 10 175 9 756 7 960 5 649 4 276 4 666 4 919 6 641
Natural gas 18 857 14 828 14 489 15 376 15 643 14 754 13 576 13 907 14 114
Primary solid biofuels & charcoal 3 441 3 652 3 790 3 850 3 745 3 734 3 926 4 005 4 059
Liquid biofuels 219 1 099 1 303 1 587 702 760 770 852 981
All other renewable energies 91 279 302 321 409 737 794 890 1 003
Non-renewable wastes 0 0 0 0 0 0 2 6 7
Electricity 20 828 21 100 20 862 20 587 19 858 19 516 19 956 20 049 20 296
Heat 0 0 0 0 0 0 0 0 0
Statistical difference -343 -1 163 -154 -3 -487 -1 875 -1 307 -1 169 925
Final non-energy consumption 8 434 7 110 6 842 6 044 5 067 4 138 4 350 4 977 4 925
Final energy consumption 93 824 85 157 81 957 78 446 75 859 74 943 75 961 78 005 79 397
Industry 30 083 20 777 20 603 20 088 19 588 19 293 18 206 18 379 18 974
Transport 36 824 33 877 32 058 29 298 28 059 28 223 29 518 30 643 31 723
Other sectors 26 916 30 502 29 296 29 059 28 213 27 426 28 237 28 984 28 701
Services 8 428 9 806 10 197 10 036 9 596 8 924 10 269 10 893 10 413
Households 15 187 16 964 15 662 15 559 14 918 14 814 14 998 15 209 15 435
Europe 2020-2030 indicators 2005 2010 2011 2012 2013 2014 2015 2016 2017
Gross inland consumption 144 994 130 433 129 800 129 429 121 121 118 316 122 930 124 205 130 559
Primary energy consumption 136 559 123 323 122 958 123 385 116 053 114 178 118 580 119 229 125 634
Final energy consumption 98 083 89 090 86 476 82 833 80 734 79 188 80 351 82 457 84 335
Source: Eurostat (nrg_bal_c)
65
Spainktoe
Energy balance sheets — 2017 data

Source: Eurostat (nrg_bal_c)
Source: Eurostat (nrg_bal_c)
Note: Please refer to page 23 for related methodological definitions.
Spain
66Energy balance sheets — 2017 data
0
50 000
100 000
150 000
200 000
250 000
300 000
350 000
1990 1995 2000 2005 2010 2015 2017
Gross electricity production by fuel, GWh
Solid fossil fuels Oil and petroleum products Natural gas
Renewables and biofuels Nuclear heat Other
0
10 000
20 000
30 000
40 000
50 000
60 000
70 000
80 000
90 000
1990 1995 2000 2005 2010 2015 2017
Gross available energy by fuel, ktoe
Solid fossil fuels Oil and petroleum products Natural gas
Renewables and biofuels Nuclear heat Non-renewable waste

Source: Eurostat (nrg_bal_c)
Source: Eurostat (nrg_bal_c)
Note: Please refer to page 23 for related methodological definitions.
Spain
67Energy balance sheets — 2017 data
0
10 000
20 000
30 000
40 000
50 000
60 000
70 000
80 000
90 000
100 000
1990 1995 2000 2005 2010 2015 2017
Final energy consumption by fuel, ktoe
Solid fossil fuels Oil and petroleum products Natural gas
Renewables and biofuels Electricity Heat
Other
0
20 000
40 000
60 000
80 000
100 000
120 000
1990 1995 2000 2005 2010 2015 2017
Final consumption by sector, ktoe
Industry Transport Services Households Non-energy use

+ Primary production 132 150.9 0.0 Z 0.0 0.0 911.3 14.1 25 874.0 1 491.4 103 860.0 Z Z
+ Recovered & recycled products 81.6 0.0 Z 0.0 0.0 81.6 Z 0.0 Z Z Z Z
+ Imports 156 839.8 10 107.6 0.0 0.0 0.0 100 707.2 43 155.6 1 052.2 0.0 Z 0.0 1 817.2
- Exports 31 656.0 3.7 0.0 0.0 0.0 20 630.8 5 422.4 332.7 0.0 Z 0.0 5 266.4
+ Change in stock 202.3 -193.0 0.0 0.0 0.0 -342.5 744.2 -6.5 0.0 Z Z Z
= Gross available energy 257 618.6 9 910.9 0.0 0.0 0.0 80 726.9 38 491.6 26 587.0 1 491.4 103 860.0 0.0 -3 449.2
- International maritime bunkers 1 651.8 0.0 0.0 0.0 0.0 1 651.8 0.0 0.0 Z Z Z Z
= Gross inland consumption 255 966.8 9 910.9 0.0 0.0 0.0 79 075.1 38 491.6 26 587.0 1 491.4 103 860.0 0.0 -3 449.2
- International aviation 6 424.8 Z Z Z Z 6 424.8 Z 0.0 Z Z Z Z
= Total energy supply 249 541.9 9 910.9 0.0 0.0 0.0 72 650.2 38 491.6 26 587.0 1 491.4 103 860.0 0.0 -3 449.2
Transformation input 207 053.6 10 579.6 609.7 0.0 0.0 67 725.2 7 291.6 15 022.8 1 341.4 103 860.0 0.0 623.5
+ Electricity & heat generation 130 301.6 3 242.2 609.7 0.0 0.0 1 677.7 7 291.6 11 655.6 1 341.4 103 860.0 0.0 623.5
+ Coke ovens 3 182.5 3 182.5 0.0 0.0 0.0 0.0 0.0 0.0 Z Z Z Z
+ Blast furnaces 4 154.9 4 154.9 0.0 0.0 0.0 0.0 0.0 0.0 Z Z Z Z
+ Gas works 0.0 0.0 0.0 0.0 0.0 0.0 0.0 0.0 Z Z Z Z
+ Refineries & petrochemical industry 66 047.5 Z Z Z Z 66 047.5 Z Z Z Z Z Z
+ Patent fuel plants 0.0 0.0 0.0 0.0 0.0 0.0 Z 0.0 0.0 Z Z Z
+ BKB & PB plants 0.0 0.0 0.0 0.0 0.0 Z Z 0.0 0.0 Z Z Z
+ Coal liquefaction plants 0.0 0.0 0.0 0.0 0.0 Z Z Z Z Z Z Z
+ For blended natural gas 31.4 Z 0.0 Z Z 0.0 Z 31.4 Z Z Z Z
+ Liquid biofuels blended 3 335.7 Z Z Z Z Z Z 3 335.7 Z Z Z Z
+ Charcoal production plants 0.0 Z Z Z Z Z Z 0.0 Z Z Z Z
+ Gas-to-liquids plants 0.0 Z Z Z Z Z 0.0 Z Z Z Z Z
+ Not elsewhere specified 0.0 0.0 0.0 0.0 0.0 0.0 0.0 0.0 0.0 Z Z Z
Transformation output 125 465.4 2 269.2 1 622.3 0.0 Z 65 632.6 31.4 3 335.2 Z Z 4 239.1 48 335.6
+ Electricity & heat generation 52 574.7 Z Z Z Z Z Z Z Z Z 4 239.1 48 335.6
+ Coke ovens 2 802.9 2 269.2 533.7 Z Z Z Z Z Z Z Z Z
+ Blast furnaces 1 088.5 0.0 1 088.5 Z Z Z Z Z Z Z Z Z
+ Gas works 0.0 0.0 0.0 Z Z Z Z Z Z Z Z Z
+ Refineries & petrochemical industry 65 632.6 Z Z Z Z 65 632.6 Z 0.0 Z Z Z Z
+ Patent fuel plants 0.0 0.0 Z Z Z Z Z Z Z Z Z Z
+ BKB & PB plants 0.0 0.0 Z 0.0 Z Z Z Z Z Z Z Z
+ Coal liquefaction plants 0.0 Z Z Z Z 0.0 Z Z Z Z Z Z
+ Blended in natural gas 31.4 Z Z Z Z Z 31.4 Z Z Z Z Z
+ Liquid biofuels blended 3 335.2 Z Z Z Z Z Z 3 335.2 Z Z Z Z
+ Charcoal production plants 0.0 Z Z Z Z Z Z 0.0 Z Z Z Z
+ Gas-to-liquids plants 0.0 Z Z Z Z 0.0 Z Z Z Z Z Z
+ Not elsewhere specified 0.0 0.0 0.0 0.0 Z 0.0 Z Z Z Z Z Z
Energy sector 6 342.7 0.0 922.9 0.0 0.0 1 688.9 1 013.3 39.5 35.7 Z 0.0 2 642.4
+ Own use in electricity & heat generation 2 088.4 0.0 0.6 0.0 0.0 0.0 0.0 7.4 8.1 Z 0.0 2 072.3
+ Coal mines 2.7 0.0 0.0 0.0 0.0 0.0 0.1 0.0 0.0 Z 0.0 2.7
+ Oil & natural gas extraction plants 32.8 Z Z Z Z 0.0 0.4 0.0 Z Z 0.0 32.4
+ Patent fuel plants 0.0 0.0 0.0 0.0 0.0 Z Z 0.0 0.0 Z 0.0 0.0
+ Coke ovens 188.5 0.0 188.4 0.0 0.0 0.0 0.0 0.0 0.0 Z 0.0 0.0
+ BKB & PB plants 0.0 0.0 0.0 0.0 0.0 Z Z 0.0 0.0 Z 0.0 0.0
+ Gas works 0.0 0.0 0.0 0.0 0.0 0.0 0.0 0.0 0.0 Z 0.0 0.0
+ Blast furnaces 733.9 0.0 733.9 0.0 0.0 0.0 0.0 0.0 0.0 Z 0.0 0.0
+ Petroleum refineries (oil refineries) 2 856.9 0.0 0.0 0.0 0.0 1 688.9 968.3 0.0 0.0 Z 0.0 199.7
+ Nuclear industry 98.4 Z Z Z Z Z Z Z Z Z 0.0 98.4
+ Coal liquefaction plants 0.0 0.0 0.0 0.0 0.0 Z Z Z Z Z 0.0 0.0
+ Liquefaction & regasification plants (LNG) 0.0 Z Z Z Z Z 0.0 Z Z Z 0.0 0.0
+ Gasification plants for biogas 3.8 Z Z Z Z Z Z 3.8 0.0 Z 0.0 0.0
+ Gas-to-liquids (GTL) plants 0.0 Z Z Z Z Z 0.0 Z Z Z 0.0 0.0
+ Charcoal production plants 0.0 Z Z Z Z Z Z 0.0 0.0 Z 0.0 0.0
+ Not elsewhere specified (energy) 337.4 0.0 0.0 0.0 0.0 0.0 44.5 28.3 27.6 Z 0.0 236.9
Distribution losses 4 320.8 0.0 0.0 0.0 0.0 0.0 436.3 0.0 0.0 Z 565.6 3 318.9
Available for final consumption 157 290.1 1 600.5 89.7 0.0 0.0 68 868.7 29 781.8 14 859.9 114.3 0.0 3 673.5 38 301.6
Final non-energy consumption 14 157.6 297.0 0.0 0.0 0.0 12 750.1 1 110.5 0.0 Z Z Z Z
Final energy consumption 141 002.8 1 143.2 0.0 0.0 0.0 54 970.0 28 671.3 14 867.1 114.3 Z 3 673.5 37 563.5
+ Industry 26 538.9 1 065.1 0.0 0.0 0.0 2 463.7 9 745.1 1 638.6 3.6 Z 1 472.4 10 150.5
+ Iron & steel 1 949.6 125.5 0.0 0.0 0.0 50.4 773.0 0.4 0.0 Z 0.0 1 000.4
+ Chemical & petrochemical 4 151.6 377.1 0.0 0.0 0.0 110.6 1 886.1 72.7 0.1 Z 0.0 1 705.1
+ Non-ferrous metals 1 114.4 0.1 0.0 0.0 0.0 9.9 336.3 0.0 0.0 Z 0.0 768.1
+ Non-metallic minerals 3 366.3 220.8 0.0 0.0 0.0 624.5 1 689.3 124.2 0.0 Z 0.0 707.5
+ Transport equipment 1 086.0 5.0 0.0 0.0 0.0 25.6 428.7 6.6 0.0 Z 0.0 620.1
+ Machinery 1 876.8 19.9 0.0 0.0 0.0 114.6 621.0 3.5 0.0 Z 0.0 1 117.8
+ Mining & quarrying 378.8 0.0 0.0 0.0 0.0 191.5 36.8 10.5 0.0 Z 0.0 140.1
+ Food, beverages & tobacco 4 890.5 303.0 0.0 0.0 0.0 212.2 2 341.4 237.0 0.1 Z 0.0 1 796.9
+ Paper, pulp & printing 2 398.4 13.8 0.0 0.0 0.0 38.8 847.0 840.5 2.8 Z 0.0 655.7
+ Wood & wood products 591.9 0.0 0.0 0.0 0.0 32.9 55.4 313.6 0.0 Z 0.0 189.9
+ Construction 1 819.4 0.0 0.0 0.0 0.0 931.0 302.1 1.1 0.6 Z 0.0 584.5
+ Textile & leather 323.8 0.0 0.0 0.0 0.0 16.7 167.0 0.1 0.0 Z 0.0 140.0
+ Not elsewhere specified (industry) 2 591.2 0.0 0.0 0.0 0.0 104.9 261.0 28.4 0.0 Z 1 472.4 724.4
+ Transport 45 359.5 0.0 0.0 0.0 0.0 40 998.0 92.3 3 335.2 0.0 Z Z 934.1
+ Rail 973.7 0.0 0.0 0.0 0.0 141.4 Z 0.0 0.0 Z Z 832.3
+ Road 43 000.9 Z Z Z Z 39 575.8 72.0 3 335.2 0.0 Z Z 17.9
+ Domestic aviation 804.5 Z Z Z Z 804.5 Z 0.0 Z Z Z Z
+ Domestic navigation 476.2 0.0 0.0 0.0 0.0 476.2 Z 0.0 0.0 Z Z Z
+ Pipeline transport 87.8 Z Z Z Z 0.0 20.3 0.0 Z Z Z 67.6
+ Not elsewhere specified (transport) 16.3 0.0 0.0 0.0 0.0 0.0 0.0 0.0 0.0 Z Z 16.3
+ Other 69 104.4 78.1 0.0 0.0 0.0 11 508.3 18 833.9 9 893.3 110.7 Z 2 201.1 26 478.9
+ Commercial & public services 23 831.5 40.9 0.0 0.0 0.0 2 750.5 7 285.7 803.8 110.7 Z 861.0 11 978.9
+ Households 40 649.2 35.2 0.0 0.0 0.0 5 342.4 11 339.6 8 910.8 0.0 Z 1 331.8 13 689.3
+ Agriculture & forestry 3 801.0 2.1 0.0 0.0 0.0 2 670.0 207.7 170.4 0.0 Z 8.2 742.7
+ Fishing 342.4 0.0 0.0 0.0 0.0 316.4 0.9 8.3 0.0 Z 0.0 16.7
+ Not elsewhere specified (other) 480.3 0.0 0.0 0.0 0.0 429.0 0.0 0.0 0.0 Z 0.0 51.3
Statistical differences 2 129.7 160.3 89.7 0.0 0.0 1 148.7 0.0 -7.2 0.0 0.0 0.0 738.2
Gross electricity production 48 277.2 1 086.6 208.1 0.0 0.0 635.4 3 477.1 8 404.5 212.7 34 252.7 Z Z
Gross heat production 4 147.7 211.0 0.0 0.0 0.0 240.3 1 495.2 1 759.2 441.7 0.0 Z 0.2
Source: Eurostat (nrg_bal_c)
68Energy balance sheets — 2017 data
Electricity
ktoe 2017
Oil and
petroleum
products
Natural
gas
Renewables
and
biofuels
Non-
renewable
waste
Nuclear
heatHeat
FranceTotal
Solid
fossil
fuels
Manufac-
tured
gases
Peat and
peat
products
Oil shale
and oil
sands

2005 2010 2011 2012 2013 2014 2015 2016 2017
Gross available energy 279 768 271 993 266 978 267 086 268 099 257 620 261 756 257 378 257 619
Solid fossil fuels 14 155 11 962 11 300 12 553 13 268 9 876 9 346 9 127 9 911
Peat & peat products 0 0 0 0 0 0 0 0 0
Oil shale & oil sands 0 0 0 0 0 0 0 0 0
Crude oil & other hydrocarbons 87 534 66 978 67 707 59 250 58 129 57 343 60 488 59 078 59 484
Petroleum products 8 770 17 895 19 959 25 757 24 777 24 692 22 371 21 068 21 243
Natural gas 41 025 42 618 36 990 38 215 38 816 32 595 35 040 38 289 38 492
Nuclear heat 116 474 111 612 115 209 110 863 110 414 113 747 113 996 105 078 103 860
Renewable energies 15 939 22 317 19 455 22 953 25 518 23 797 24 608 26 825 26 587
Non-renewable wastes 1 058 1 251 1 209 1 324 1 345 1 348 1 414 1 480 1 491
Primary production 135 820 136 766 137 066 136 262 138 305 139 523 140 624 133 662 132 151
Solid fossil fuels 0 0 0 0 0 0 0 0 0
Peat 0 0 0 0 0 0 0 0 0
Oil shale and oil sands 0 0 0 0 0 0 0 0 0
Crude oil & other hydrocarbons 1 381 1 091 1 063 964 990 952 990 939 911
Natural gas 909 646 506 452 289 13 19 18 14
Nuclear heat 116 474 111 612 115 209 110 863 110 414 113 747 113 996 105 078 103 860
Renewable energies 15 999 22 166 19 079 22 659 25 268 23 464 24 205 26 147 25 874
Non-renewable wastes 1 058 1 251 1 209 1 324 1 345 1 348 1 414 1 480 1 491
Net imports 144 633 132 342 131 383 129 138 128 953 119 133 120 394 121 900 125 184
Solid fossil fuels 13 359 12 077 11 381 12 140 12 466 9 777 9 196 8 550 10 104
Crude oil 85 996 65 485 65 676 58 336 57 112 55 382 58 664 56 091 58 229
Gas/Diesel Oil (w/o bio) 16 471 16 078 18 226 21 142 22 533 22 116 22 356 20 715 19 623
Motor Gasoline (w/o bio) -6 785 -5 343 -4 425 -4 048 -3 272 -3 491 -3 584 -3 559 -3 029
Naphtha 1 504 -118 -954 597 -1 286 -595 -949 -1 804 -814
LPG 625 1 845 1 644 1 775 2 224 2 959 2 534 2 521 2 296
All other oil & petroleum products -2 017 5 251 6 101 5 734 5 086 4 541 2 734 4 354 3 772
Natural gas 40 720 39 553 38 221 36 995 38 004 33 841 34 517 37 898 37 733
Transformation input 242 415 227 602 228 931 213 972 209 444 211 211 212 907 206 105 207 054
Electricity & heat generation 140 167 137 338 137 885 135 590 135 878 135 140 136 685 130 457 130 302
Refinery intake 88 824 73 176 74 005 63 251 59 846 60 043 62 018 61 111 61 076
Coke ovens 4 221 3 049 2 871 3 172 3 260 3 169 3 146 3 060 3 183
Blast furnaces 4 679 3 998 3 933 3 852 4 168 4 288 3 866 3 691 4 155
Transformation output 151 283 139 318 140 149 127 581 123 529 124 886 126 205 124 760 125 465
Electricity & heat generation 53 791 52 611 52 745 52 821 53 734 52 620 53 476 52 661 52 575
Refinery output 87 672 72 432 73 272 62 521 59 284 59 438 61 413 60 494 60 557
Coke ovens 3 756 2 671 2 518 2 713 2 847 2 835 2 832 2 696 2 803
Blast furnaces 1 513 1 246 1 110 1 226 1 248 1 293 1 201 1 016 1 089
Energy sector 10 087 10 002 8 939 7 640 6 902 6 562 6 744 6 445 6 343
Distribution losses 3 459 4 215 4 198 4 270 4 542 3 971 4 319 4 452 4 321
Available for final consumption 167 100 161 691 156 340 160 389 162 632 152 900 156 014 157 365 157 290
Solid fossil fuels 1 995 2 361 2 231 2 480 2 312 1 715 1 608 1 893 1 601
Manufactured gases -51 20 -89 -138 -24 120 64 93 90
Peat & peat products 0 0 0 0 0 0 0 0 0
Oil shale & oil sands 0 0 0 0 0 0 0 0 0
Gas/Diesel Oil (w/o bio) 49 355 45 095 46 813 46 256 46 815 46 416 47 151 45 084 44 202
Motor Gasoline (w/o bio) 9 964 8 730 9 203 8 597 8 091 8 361 8 575 8 388 9 142
Naphtha 6 054 4 271 3 897 4 545 3 015 3 651 3 982 2 836 4 014
LPG 3 532 3 898 3 474 3 290 3 731 4 315 4 009 3 946 3 807
All other oil & petroleum products 11 482 9 212 9 626 8 938 9 111 7 482 7 186 8 138 7 703
Natural gas 34 723 34 002 29 453 31 432 32 904 27 890 28 860 30 270 29 782
Primary solid biofuels & charcoal 8 442 8 929 7 389 8 626 9 447 7 906 8 370 8 934 8 653
Liquid biofuels 585 2 420 2 442 2 676 2 683 2 921 2 969 3 104 3 335
All other renewable energies 370 1 600 1 573 1 901 2 164 2 007 2 285 2 695 2 872
Non-renewable wastes 63 139 155 149 126 112 95 130 114
Electricity 36 328 38 166 37 324 38 669 39 263 37 156 37 936 38 510 38 302
Heat 4 258 2 850 2 850 2 967 2 993 2 849 2 925 3 344 3 673
Statistical difference 212 1 447 3 515 2 734 2 643 2 898 3 373 2 650 2 130
Final non-energy consumption 16 080 13 933 14 243 14 094 13 780 14 434 13 941 13 485 14 158
Final energy consumption 150 807 146 311 138 582 143 562 146 209 135 569 138 700 141 230 141 003
Industry 32 517 27 739 27 815 27 494 27 380 26 382 26 066 26 808 26 539
Transport 44 372 43 569 44 635 44 534 44 234 44 463 44 919 45 019 45 360
Other sectors 73 919 75 004 66 132 71 533 74 594 64 724 67 715 69 403 69 104
Services 20 989 24 103 21 923 23 562 24 284 22 291 23 183 23 451 23 832
Households 43 009 45 408 38 747 42 737 44 911 37 129 39 242 41 339 40 649
Europe 2020-2030 indicators 2005 2010 2011 2012 2013 2014 2015 2016 2017
Gross inland consumption 277 002 268 380 263 317 263 249 264 199 254 214 258 269 253 721 253 677
Primary energy consumption 260 921 254 447 249 074 249 155 250 419 239 780 244 328 240 236 239 520
Final energy consumption 160 189 154 017 147 302 151 586 154 143 143 757 146 741 148 722 148 947
Source: Eurostat (nrg_bal_c)
69
Francektoe
Energy balance sheets — 2017 data

Source: Eurostat (nrg_bal_c)
Source: Eurostat (nrg_bal_c)
Note: Please refer to page 23 for related methodological definitions.
France
70Energy balance sheets — 2017 data
0
100 000
200 000
300 000
400 000
500 000
600 000
700 000
1990 1995 2000 2005 2010 2015 2017
Gross electricity production by fuel, GWh
Solid fossil fuels Oil and petroleum products Natural gas
Renewables and biofuels Nuclear heat Other
0
20 000
40 000
60 000
80 000
100 000
120 000
140 000
1990 1995 2000 2005 2010 2015 2017
Gross available energy by fuel, ktoe
Solid fossil fuels Oil and petroleum products Natural gas
Renewables and biofuels Nuclear heat Non-renewable waste

Source: Eurostat (nrg_bal_c)
Source: Eurostat (nrg_bal_c)
Note: Please refer to page 23 for related methodological definitions.
France
71Energy balance sheets — 2017 data
0
20 000
40 000
60 000
80 000
100 000
120 000
140 000
160 000
1990 1995 2000 2005 2010 2015 2017
Final energy consumption by fuel, ktoe
Solid fossil fuels Oil and petroleum products Natural gas
Renewables and biofuels Electricity Heat
Other
0
20 000
40 000
60 000
80 000
100 000
120 000
140 000
160 000
180 000
1990 1995 2000 2005 2010 2015 2017
Final consumption by sector, ktoe
Industry Transport Services Households Non-energy use

+ Primary production 4 208.7 0.0 Z 0.0 0.0 773.3 1 229.5 2 194.4 11.5 0.0 Z Z
+ Recovered & recycled products 0.0 0.0 Z 0.0 0.0 0.0 Z 0.0 Z Z Z Z
+ Imports 8 211.6 395.2 0.0 0.0 0.0 5 227.4 1 507.0 36.6 0.0 Z 0.0 1 045.4
- Exports 3 486.6 0.0 0.0 0.0 0.0 2 540.4 165.5 333.3 0.0 Z 0.0 447.5
+ Change in stock -61.2 -2.8 0.0 0.0 0.0 23.0 -77.7 -3.5 0.0 Z Z Z
= Gross available energy 8 872.6 392.3 0.0 0.0 0.0 3 483.3 2 493.3 1 894.3 11.5 0.0 0.0 597.9
- International maritime bunkers 6.4 0.0 0.0 0.0 0.0 6.4 0.0 0.0 Z Z Z Z
= Gross inland consumption 8 866.2 392.3 0.0 0.0 0.0 3 476.9 2 493.3 1 894.3 11.5 0.0 0.0 597.9
- International aviation 147.8 Z Z Z Z 147.8 Z 0.0 Z Z Z Z
= Total energy supply 8 718.4 392.3 0.0 0.0 0.0 3 329.1 2 493.3 1 894.3 11.5 0.0 0.0 597.9
Transformation input 6 086.2 316.2 0.0 0.0 0.0 4 186.0 812.4 747.1 0.0 0.0 0.0 24.6
+ Electricity & heat generation 1 856.4 316.2 0.0 0.0 0.0 53.4 730.9 731.3 0.0 0.0 0.0 24.6
+ Coke ovens 0.0 0.0 0.0 0.0 0.0 0.0 0.0 0.0 Z Z Z Z
+ Blast furnaces 0.0 0.0 0.0 0.0 0.0 0.0 0.0 0.0 Z Z Z Z
+ Gas works 0.0 0.0 0.0 0.0 0.0 0.0 0.0 0.0 Z Z Z Z
+ Refineries & petrochemical industry 4 132.5 Z Z Z Z 4 132.5 Z Z Z Z Z Z
+ Patent fuel plants 0.0 0.0 0.0 0.0 0.0 0.0 Z 0.0 0.0 Z Z Z
+ BKB & PB plants 0.0 0.0 0.0 0.0 0.0 Z Z 0.0 0.0 Z Z Z
+ Coal liquefaction plants 0.0 0.0 0.0 0.0 0.0 Z Z Z Z Z Z Z
+ For blended natural gas 0.0 Z 0.0 Z Z 0.0 Z 0.0 Z Z Z Z
+ Liquid biofuels blended 0.0 Z Z Z Z Z Z 0.0 Z Z Z Z
+ Charcoal production plants 15.9 Z Z Z Z Z Z 15.9 Z Z Z Z
+ Gas-to-liquids plants 0.0 Z Z Z Z Z 0.0 Z Z Z Z Z
+ Not elsewhere specified 81.5 0.0 0.0 0.0 0.0 0.0 81.5 0.0 0.0 Z Z Z
Transformation output 5 478.3 0.0 0.0 0.0 Z 4 144.6 0.0 6.3 Z Z 296.9 1 030.4
+ Electricity & heat generation 1 327.3 Z Z Z Z Z Z Z Z Z 296.9 1 030.4
+ Coke ovens 0.0 0.0 0.0 Z Z Z Z Z Z Z Z Z
+ Blast furnaces 0.0 0.0 0.0 Z Z Z Z Z Z Z Z Z
+ Gas works 0.0 0.0 0.0 Z Z Z Z Z Z Z Z Z
+ Refineries & petrochemical industry 4 063.1 Z Z Z Z 4 063.1 Z 0.0 Z Z Z Z
+ Patent fuel plants 0.0 0.0 Z Z Z Z Z Z Z Z Z Z
+ BKB & PB plants 0.0 0.0 Z 0.0 Z Z Z Z Z Z Z Z
+ Coal liquefaction plants 0.0 Z Z Z Z 0.0 Z Z Z Z Z Z
+ Blended in natural gas 0.0 Z Z Z Z Z 0.0 Z Z Z Z Z
+ Liquid biofuels blended 0.0 Z Z Z Z Z Z 0.0 Z Z Z Z
+ Charcoal production plants 6.3 Z Z Z Z Z Z 6.3 Z Z Z Z
+ Gas-to-liquids plants 81.5 Z Z Z Z 81.5 Z Z Z Z Z Z
+ Not elsewhere specified 0.0 0.0 0.0 0.0 Z 0.0 Z Z Z Z Z Z
Energy sector 585.1 0.0 0.0 0.0 0.0 313.4 163.7 0.7 0.0 Z 29.5 78.0
+ Own use in electricity & heat generation 66.4 0.0 0.0 0.0 0.0 0.0 0.0 0.0 0.0 Z 26.8 39.6
+ Coal mines 0.0 0.0 0.0 0.0 0.0 0.0 0.0 0.0 0.0 Z 0.0 0.0
+ Oil & natural gas extraction plants 89.5 Z Z Z Z 0.0 75.1 0.0 Z Z 0.0 14.4
+ Patent fuel plants 0.0 0.0 0.0 0.0 0.0 Z Z 0.0 0.0 Z 0.0 0.0
+ Coke ovens 0.0 0.0 0.0 0.0 0.0 0.0 0.0 0.0 0.0 Z 0.0 0.0
+ BKB & PB plants 0.0 0.0 0.0 0.0 0.0 Z Z 0.0 0.0 Z 0.0 0.0
+ Gas works 0.0 0.0 0.0 0.0 0.0 0.0 0.0 0.0 0.0 Z 0.0 0.0
+ Blast furnaces 0.0 0.0 0.0 0.0 0.0 0.0 0.0 0.0 0.0 Z 0.0 0.0
+ Petroleum refineries (oil refineries) 425.9 0.0 0.0 0.0 0.0 313.4 88.6 0.0 0.0 Z 0.0 24.0
+ Nuclear industry 0.0 Z Z Z Z Z Z Z Z Z 0.0 0.0
+ Coal liquefaction plants 0.0 0.0 0.0 0.0 0.0 Z Z Z Z Z 0.0 0.0
+ Liquefaction & regasification plants (LNG) 0.0 Z Z Z Z Z 0.0 Z Z Z 0.0 0.0
+ Gasification plants for biogas 3.3 Z Z Z Z Z Z 0.7 0.0 Z 2.6 0.0
+ Gas-to-liquids (GTL) plants 0.0 Z Z Z Z Z 0.0 Z Z Z 0.0 0.0
+ Charcoal production plants 0.0 Z Z Z Z Z Z 0.0 0.0 Z 0.0 0.0
+ Not elsewhere specified (energy) 0.0 0.0 0.0 0.0 0.0 0.0 0.0 0.0 0.0 Z 0.0 0.0
Distribution losses 215.1 0.0 0.0 0.0 0.0 0.0 26.7 0.0 0.0 Z 36.6 151.8
Available for final consumption 7 310.2 76.2 0.0 0.0 0.0 2 974.4 1 490.5 1 152.8 11.5 0.0 230.8 1 373.9
Final non-energy consumption 533.7 0.0 0.0 0.0 0.0 124.6 409.1 0.0 Z Z Z Z
Final energy consumption 6 776.5 76.2 0.0 0.0 0.0 2 849.8 1 081.4 1 152.8 11.5 Z 230.8 1 373.9
+ Industry 1 179.5 72.4 0.0 0.0 0.0 295.4 386.5 32.0 11.5 Z 71.5 310.1
+ Iron & steel 6.8 0.2 0.0 0.0 0.0 0.2 1.7 0.0 0.0 Z 0.0 4.6
+ Chemical & petrochemical 166.3 0.0 0.0 0.0 0.0 2.9 120.9 0.0 0.0 Z 16.0 26.4
+ Non-ferrous metals 16.2 0.0 0.0 0.0 0.0 0.9 7.8 0.1 0.0 Z 0.0 7.4
+ Non-metallic minerals 373.6 56.7 0.0 0.0 0.0 157.6 87.4 2.1 11.5 Z 0.0 58.2
+ Transport equipment 11.8 0.0 0.0 0.0 0.0 0.7 2.7 0.0 0.0 Z 0.0 8.4
+ Machinery 76.7 0.2 0.0 0.0 0.0 6.6 21.3 0.3 0.0 Z 9.1 39.3
+ Mining & quarrying 14.8 0.0 0.0 0.0 0.0 11.9 0.0 0.0 0.0 Z 0.0 2.8
+ Food, beverages & tobacco 199.0 15.3 0.0 0.0 0.0 17.2 89.9 4.1 0.0 Z 12.6 59.8
+ Paper, pulp & printing 68.9 0.0 0.0 0.0 0.0 4.5 34.6 1.2 0.0 Z 0.6 27.9
+ Wood & wood products 74.1 0.0 0.0 0.0 0.0 0.4 1.4 16.5 0.0 Z 29.1 26.7
+ Construction 95.6 0.0 0.0 0.0 0.0 89.0 0.0 0.0 0.0 Z 0.0 6.6
+ Textile & leather 25.6 0.0 0.0 0.0 0.0 1.4 10.1 0.2 0.0 Z 0.8 13.2
+ Not elsewhere specified (industry) 50.1 0.0 0.0 0.0 0.0 2.0 8.5 7.5 0.0 Z 3.3 28.8
+ Transport 2 189.0 0.0 0.0 0.0 0.0 2 161.3 4.2 0.5 0.0 Z Z 23.0
+ Rail 37.6 0.0 0.0 0.0 0.0 18.0 Z 0.0 0.0 Z Z 19.7
+ Road 2 092.3 Z Z Z Z 2 087.6 4.2 0.5 0.0 Z Z 0.0
+ Domestic aviation 10.6 Z Z Z Z 10.6 Z 0.0 Z Z Z Z
+ Domestic navigation 45.2 0.0 0.0 0.0 0.0 45.2 Z 0.0 0.0 Z Z Z
+ Pipeline transport 3.3 Z Z Z Z 0.0 0.0 0.0 Z Z Z 3.3
+ Not elsewhere specified (transport) 0.0 0.0 0.0 0.0 0.0 0.0 0.0 0.0 0.0 Z Z 0.0
+ Other 3 407.9 3.8 0.0 0.0 0.0 393.1 690.7 1 120.3 0.0 Z 159.3 1 040.8
+ Commercial & public services 800.5 0.1 0.0 0.0 0.0 58.7 191.7 16.6 0.0 Z 36.6 496.7
+ Households 2 376.9 3.6 0.0 0.0 0.0 138.4 479.1 1 099.9 0.0 Z 117.0 538.8
+ Agriculture & forestry 204.9 0.0 0.0 0.0 0.0 170.3 19.9 3.8 0.0 Z 5.6 5.3
+ Fishing 25.7 0.0 0.0 0.0 0.0 25.7 0.0 0.0 0.0 Z 0.0 0.0
+ Not elsewhere specified (other) 0.0 0.0 0.0 0.0 0.0 0.0 0.0 0.0 0.0 Z 0.0 0.0
Statistical differences 0.0 0.0 0.0 0.0 0.0 0.0 0.0 0.0 0.0 0.0 0.0 0.0
Gross electricity production 1 030.4 117.5 0.0 0.0 0.0 18.1 265.7 629.1 0.0 0.0 Z Z
Gross heat production 296.9 0.0 0.0 0.0 0.0 17.9 235.4 43.6 0.0 0.0 Z 0.0
Source: Eurostat (nrg_bal_c)
72Energy balance sheets — 2017 data
Electricity
ktoe 2017
Oil and
petroleum
products
Natural
gas
Renewables
and
biofuels
Non-
renewable
waste
Nuclear
heatHeat
CroatiaTotal
Solid
fossil
fuels
Manufac-
tured
gases
Peat and
peat
products
Oil shale
and oil
sands

2005 2010 2011 2012 2013 2014 2015 2016 2017
Gross available energy 9 839 9 464 9 269 8 716 8 545 8 144 8 493 8 570 8 873
Solid fossil fuels 684 683 703 631 675 647 606 651 392
Peat & peat products 0 0 0 0 0 0 0 0 0
Oil shale & oil sands 0 0 0 0 0 0 0 0 0
Crude oil & other hydrocarbons 5 436 4 449 3 723 3 701 3 444 3 017 3 426 3 813 4 005
Petroleum products -890 -713 -51 -425 -279 106 -174 -553 -522
Natural gas 2 370 2 632 2 570 2 413 2 282 2 019 2 082 2 171 2 493
Nuclear heat 0 0 0 0 0 0 0 0 0
Renewable energies 1 855 2 064 1 704 1 748 2 082 2 005 1 960 2 002 1 894
Non-renewable wastes 4 8 4 8 9 10 9 10 12
Primary production 4 759 5 154 4 604 4 218 4 443 4 354 4 400 4 423 4 209
Solid fossil fuels 0 0 0 0 0 0 0 0 0
Peat 0 0 0 0 0 0 0 0 0
Oil shale and oil sands 0 0 0 0 0 0 0 0 0
Crude oil & other hydrocarbons 1 034 765 707 631 614 611 693 763 773
Natural gas 1 865 2 215 2 007 1 635 1 507 1 444 1 471 1 369 1 230
Nuclear heat 0 0 0 0 0 0 0 0 0
Renewable energies 1 855 2 167 1 886 1 944 2 313 2 289 2 226 2 282 2 194
Non-renewable wastes 4 8 4 8 9 10 9 10 12
Net imports 5 174 4 426 4 608 4 353 4 061 3 606 4 151 4 158 4 725
Solid fossil fuels 624 700 691 555 743 597 624 664 395
Crude oil 4 050 3 598 2 894 2 371 2 511 1 888 2 374 2 563 2 874
Gas/Diesel Oil (w/o bio) 198 402 578 313 351 504 517 340 484
Motor Gasoline (w/o bio) -479 -462 -304 -405 -397 -305 -321 -344 -515
Naphtha -171 -79 -101 -64 -31 -39 -52 -71 -53
LPG -251 -159 -127 -148 -118 -99 -120 -113 -158
All other oil & petroleum products 263 -287 42 394 178 417 250 200 55
Natural gas 562 475 501 894 726 577 564 728 1 341
Transformation input 7 876 6 783 5 878 5 942 5 721 5 121 5 395 5 989 6 086
Electricity & heat generation 2 233 2 191 1 929 1 821 2 065 1 894 1 749 1 945 1 856
Refinery intake 5 243 4 345 3 694 3 823 3 466 3 049 3 456 3 855 4 040
Coke ovens 0 0 0 0 0 0 0 0 0
Blast furnaces 0 0 0 0 0 0 0 0 0
Transformation output 7 063 6 131 5 208 5 305 5 118 4 611 4 846 5 345 5 478
Electricity & heat generation 1 450 1 580 1 266 1 202 1 489 1 407 1 246 1 375 1 327
Refinery output 5 214 4 307 3 691 3 809 3 444 3 032 3 419 3 789 3 970
Coke ovens 0 0 0 0 0 0 0 0 0
Blast furnaces 0 0 0 0 0 0 0 0 0
Energy sector 814 736 773 647 593 638 604 545 585
Distribution losses 274 260 242 239 233 212 220 220 215
Available for final consumption 7 827 7 711 7 456 7 078 6 992 6 658 6 999 7 032 7 310
Solid fossil fuels 146 151 145 131 116 103 81 67 76
Manufactured gases 11 4 3 2 2 1 0 0 0
Peat & peat products 0 0 0 0 0 0 0 0 0
Oil shale & oil sands 0 0 0 0 0 0 0 0 0
Gas/Diesel Oil (w/o bio) 1 796 1 755 1 708 1 616 1 629 1 615 1 737 1 791 1 962
Motor Gasoline (w/o bio) 755 692 676 628 613 568 567 569 547
Naphtha 0 0 0 0 0 0 0 0 0
LPG 130 183 168 161 161 156 157 162 160
All other oil & petroleum products 626 361 341 273 299 283 289 309 306
Natural gas 1 616 1 693 1 598 1 448 1 389 1 352 1 387 1 410 1 491
Primary solid biofuels & charcoal 1 243 1 236 1 202 1 209 1 195 1 052 1 192 1 149 1 124
Liquid biofuels 0 3 4 37 33 30 24 1 0
All other renewable energies 2 16 17 16 18 21 24 26 28
Non-renewable wastes 4 8 4 8 9 10 9 10 12
Electricity 1 240 1 364 1 353 1 320 1 296 1 275 1 319 1 316 1 374
Heat 258 245 238 229 231 193 212 222 231
Statistical difference 0 0 0 1 0 0 0 0 0
Final non-energy consumption 675 596 596 532 539 540 530 516 534
Final energy consumption 7 152 7 114 6 861 6 545 6 453 6 118 6 469 6 516 6 776
Industry 1 565 1 367 1 286 1 138 1 117 1 098 1 090 1 087 1 180
Transport 1 837 1 971 1 933 1 896 1 917 1 894 1 991 2 039 2 189
Other sectors 3 750 3 777 3 642 3 511 3 419 3 126 3 389 3 389 3 408
Services 693 776 763 733 714 676 743 763 800
Households 2 815 2 756 2 629 2 547 2 478 2 216 2 415 2 393 2 377
Europe 2020-2030 indicators 2005 2010 2011 2012 2013 2014 2015 2016 2017
Gross inland consumption 9 814 9 457 9 246 8 712 8 542 8 139 8 489 8 565 8 866
Primary energy consumption 9 139 8 861 8 650 8 179 8 003 7 599 7 960 8 048 8 333
Final energy consumption 7 238 7 213 6 965 6 655 6 574 6 239 6 586 6 640 6 924
Source: Eurostat (nrg_bal_c)
73
Croatiaktoe
Energy balance sheets — 2017 data

Source: Eurostat (nrg_bal_c)
Source: Eurostat (nrg_bal_c)
Note: Please refer to page 23 for related methodological definitions.
Croatia
74Energy balance sheets — 2017 data
0
2 000
4 000
6 000
8 000
10 000
12 000
14 000
16 000
1990 1995 2000 2005 2010 2015 2017
Gross electricity production by fuel, GWh
Solid fossil fuels Oil and petroleum products Natural gas
Renewables and biofuels Nuclear heat Other
0
1 000
2 000
3 000
4 000
5 000
6 000
1990 1995 2000 2005 2010 2015 2017
Gross available energy by fuel, ktoe
Solid fossil fuels Oil and petroleum products Natural gas
Renewables and biofuels Nuclear heat Non-renewable waste

Source: Eurostat (nrg_bal_c)
Source: Eurostat (nrg_bal_c)
Note: Please refer to page 23 for related methodological definitions.
Croatia
75Energy balance sheets — 2017 data
0
1 000
2 000
3 000
4 000
5 000
6 000
7 000
8 000
1990 1995 2000 2005 2010 2015 2017
Final energy consumption by fuel, ktoe
Solid fossil fuels Oil and petroleum products Natural gas
Renewables and biofuels Electricity Heat
Other
0
1 000
2 000
3 000
4 000
5 000
6 000
7 000
8 000
9 000
1990 1995 2000 2005 2010 2015 2017
Final consumption by sector, ktoe
Industry Transport Services Households Non-energy use

+ Primary production 36 666.4 0.0 Z 0.0 0.0 4 456.1 4 535.9 26 540.2 1 134.2 0.0 Z Z
+ Recovered & recycled products 0.0 0.0 Z 0.0 0.0 0.0 Z 0.0 Z Z Z Z
+ Imports 157 930.4 9 594.0 0.0 0.0 0.0 84 961.0 57 043.6 2 643.5 0.0 Z 0.0 3 688.3
- Exports 33 366.3 234.2 0.0 0.0 0.0 32 136.5 223.2 330.8 0.0 Z 0.0 441.5
+ Change in stock 584.8 -18.0 0.0 0.0 0.0 441.7 192.8 -31.7 0.0 Z Z Z
= Gross available energy 161 815.3 9 341.8 0.0 0.0 0.0 57 722.3 61 549.0 28 821.1 1 134.2 0.0 0.0 3 246.8
- International maritime bunkers 2 302.6 0.0 0.0 0.0 0.0 2 302.6 0.0 0.0 Z Z Z Z
= Gross inland consumption 159 512.7 9 341.8 0.0 0.0 0.0 55 419.7 61 549.0 28 821.1 1 134.2 0.0 0.0 3 246.8
- International aviation 3 419.2 Z Z Z Z 3 419.2 Z 0.0 Z Z Z Z
= Total energy supply 156 093.5 9 341.8 0.0 0.0 0.0 52 000.5 61 549.0 28 821.1 1 134.2 0.0 0.0 3 246.8
Transformation input 139 366.7 10 224.6 655.5 0.0 0.0 83 573.9 25 233.1 18 577.5 889.1 0.0 0.0 213.1
+ Electricity & heat generation 55 904.4 7 253.1 655.5 0.0 0.0 4 166.7 25 233.1 17 493.8 889.1 0.0 0.0 213.1
+ Coke ovens 1 668.0 1 668.0 0.0 0.0 0.0 0.0 0.0 0.0 Z Z Z Z
+ Blast furnaces 1 303.5 1 303.5 0.0 0.0 0.0 0.0 0.0 0.0 Z Z Z Z
+ Gas works 0.0 0.0 0.0 0.0 0.0 0.0 0.0 0.0 Z Z Z Z
+ Refineries & petrochemical industry 79 407.2 Z Z Z Z 79 407.2 Z Z Z Z Z Z
+ Patent fuel plants 0.0 0.0 0.0 0.0 0.0 0.0 Z 0.0 0.0 Z Z Z
+ BKB & PB plants 0.0 0.0 0.0 0.0 0.0 Z Z 0.0 0.0 Z Z Z
+ Coal liquefaction plants 0.0 0.0 0.0 0.0 0.0 Z Z Z Z Z Z Z
+ For blended natural gas 7.2 Z 0.0 Z Z 0.0 Z 7.2 Z Z Z Z
+ Liquid biofuels blended 1 061.7 Z Z Z Z Z Z 1 061.7 Z Z Z Z
+ Charcoal production plants 14.7 Z Z Z Z Z Z 14.7 Z Z Z Z
+ Gas-to-liquids plants 0.0 Z Z Z Z Z 0.0 Z Z Z Z Z
+ Not elsewhere specified 0.0 0.0 0.0 0.0 0.0 0.0 0.0 0.0 0.0 Z Z Z
Transformation output 114 137.9 1 200.5 823.3 0.0 Z 80 025.9 7.2 1 069.1 Z Z 5 575.2 25 436.8
+ Electricity & heat generation 31 012.0 Z Z Z Z Z Z Z Z Z 5 575.2 25 436.8
+ Coke ovens 1 525.8 1 200.5 325.3 Z Z Z Z Z Z Z Z Z
+ Blast furnaces 498.0 0.0 498.0 Z Z Z Z Z Z Z Z Z
+ Gas works 0.0 0.0 0.0 Z Z Z Z Z Z Z Z Z
+ Refineries & petrochemical industry 80 025.9 Z Z Z Z 80 025.9 Z 0.0 Z Z Z Z
+ Patent fuel plants 0.0 0.0 Z Z Z Z Z Z Z Z Z Z
+ BKB & PB plants 0.0 0.0 Z 0.0 Z Z Z Z Z Z Z Z
+ Coal liquefaction plants 0.0 Z Z Z Z 0.0 Z Z Z Z Z Z
+ Blended in natural gas 7.2 Z Z Z Z Z 7.2 Z Z Z Z Z
+ Liquid biofuels blended 1 061.7 Z Z Z Z Z Z 1 061.7 Z Z Z Z
+ Charcoal production plants 7.4 Z Z Z Z Z Z 7.4 Z Z Z Z
+ Gas-to-liquids plants 0.0 Z Z Z Z 0.0 Z Z Z Z Z Z
+ Not elsewhere specified 0.0 0.0 0.0 0.0 Z 0.0 Z Z Z Z Z Z
Energy sector 7 698.6 47.2 8.6 0.0 0.0 3 061.6 1 416.8 0.0 0.0 Z 1 403.4 1 760.9
+ Own use in electricity & heat generation 908.5 0.0 0.0 0.0 0.0 0.0 0.0 0.0 0.0 Z 0.2 908.4
+ Coal mines 3.8 0.0 0.0 0.0 0.0 0.0 0.0 0.0 0.0 Z 0.0 3.8
+ Oil & natural gas extraction plants 1 023.1 Z Z Z Z 0.0 978.1 0.0 Z Z 16.2 28.9
+ Patent fuel plants 0.0 0.0 0.0 0.0 0.0 Z Z 0.0 0.0 Z 0.0 0.0
+ Coke ovens 67.6 47.2 8.6 0.0 0.0 0.0 0.0 0.0 0.0 Z 8.0 3.7
+ BKB & PB plants 0.0 0.0 0.0 0.0 0.0 Z Z 0.0 0.0 Z 0.0 0.0
+ Gas works 0.0 0.0 0.0 0.0 0.0 0.0 0.0 0.0 0.0 Z 0.0 0.0
+ Blast furnaces 0.0 0.0 0.0 0.0 0.0 0.0 0.0 0.0 0.0 Z 0.0 0.0
+ Petroleum refineries (oil refineries) 4 804.4 0.0 0.0 0.0 0.0 3 061.6 336.1 0.0 0.0 Z 958.7 448.0
+ Nuclear industry 0.5 Z Z Z Z Z Z Z Z Z 0.0 0.5
+ Coal liquefaction plants 0.0 0.0 0.0 0.0 0.0 Z Z Z Z Z 0.0 0.0
+ Liquefaction & regasification plants (LNG) 71.0 Z Z Z Z Z 71.0 Z Z Z 0.0 0.0
+ Gasification plants for biogas 0.0 Z Z Z Z Z Z 0.0 0.0 Z 0.0 0.0
+ Gas-to-liquids (GTL) plants 0.0 Z Z Z Z Z 0.0 Z Z Z 0.0 0.0
+ Charcoal production plants 0.0 Z Z Z Z Z Z 0.0 0.0 Z 0.0 0.0
+ Not elsewhere specified (energy) 819.8 0.0 0.0 0.0 0.0 0.0 31.6 0.0 0.0 Z 420.5 367.7
Distribution losses 1 992.3 0.0 0.0 0.0 0.0 0.0 329.3 0.0 0.0 Z 57.9 1 605.1
Available for final consumption 121 173.8 270.5 159.2 0.0 0.0 45 391.0 34 577.0 11 312.7 245.1 0.0 4 113.9 25 104.5
Final non-energy consumption 7 914.7 61.4 0.0 0.0 0.0 7 197.7 655.5 0.0 Z Z Z Z
Final energy consumption 113 611.2 489.3 159.2 0.0 0.0 38 265.1 33 921.5 11 312.7 245.1 Z 4 113.9 25 104.5
+ Industry 24 925.7 489.3 159.2 0.0 0.0 1 954.3 8 870.6 392.7 245.1 Z 2 873.9 9 940.6
+ Iron & steel 3 597.1 341.5 159.2 0.0 0.0 68.2 1 255.9 0.0 0.0 Z 162.3 1 610.0
+ Chemical & petrochemical 3 654.1 0.0 0.0 0.0 0.0 303.3 1 008.2 7.4 73.7 Z 1 033.3 1 228.2
+ Non-ferrous metals 694.4 0.0 0.0 0.0 0.0 46.9 427.5 0.0 0.0 Z 0.2 219.8
+ Non-metallic minerals 4 193.1 147.8 0.0 0.0 0.0 882.3 2 004.0 133.7 133.2 Z 126.4 765.7
+ Transport equipment 419.9 0.0 0.0 0.0 0.0 0.0 0.0 0.0 0.0 Z 111.2 308.7
+ Machinery 3 501.6 0.0 0.0 0.0 0.0 251.6 1 419.5 2.3 3.0 Z 29.2 1 796.1
+ Mining & quarrying 112.7 0.0 0.0 0.0 0.0 28.8 31.1 0.0 0.0 Z 0.8 52.1
+ Food, beverages & tobacco 2 853.1 0.0 0.0 0.0 0.0 188.3 1 174.0 44.8 0.0 Z 378.7 1 067.3
+ Paper, pulp & printing 2 286.4 0.0 0.0 0.0 0.0 55.3 657.5 0.4 0.0 Z 833.3 739.8
+ Wood & wood products 485.0 0.0 0.0 0.0 0.0 0.0 32.9 154.3 5.7 Z 36.0 256.2
+ Construction 380.5 0.0 0.0 0.0 0.0 31.5 228.9 0.8 0.0 Z 0.2 119.2
+ Textile & leather 1 163.2 0.0 0.0 0.0 0.0 69.7 609.3 0.1 0.0 Z 40.1 444.0
+ Not elsewhere specified (industry) 1 584.5 0.0 0.0 0.0 0.0 28.3 21.7 49.0 29.6 Z 122.2 1 333.6
+ Transport 34 525.4 0.0 0.0 0.0 0.0 31 420.8 1 064.1 1 061.8 0.0 Z Z 978.8
+ Rail 507.8 0.0 0.0 0.0 0.0 33.6 Z 0.0 0.0 Z Z 474.2
+ Road 31 654.0 Z Z Z Z 29 738.0 847.1 1 061.8 0.0 Z Z 7.1
+ Domestic aviation 780.4 Z Z Z Z 780.4 Z 0.0 Z Z Z Z
+ Domestic navigation 868.7 0.0 0.0 0.0 0.0 868.7 Z 0.0 0.0 Z Z Z
+ Pipeline transport 249.7 Z Z Z Z 0.0 217.0 0.0 Z Z Z 32.6
+ Not elsewhere specified (transport) 464.8 0.0 0.0 0.0 0.0 0.0 0.0 0.0 0.0 Z Z 464.8
+ Other 54 160.1 0.0 0.0 0.0 0.0 4 890.0 23 986.8 9 858.2 0.0 Z 1 239.9 14 185.1
+ Commercial & public services 18 242.2 0.0 0.0 0.0 0.0 546.4 6 590.2 2 758.6 0.0 Z 308.1 8 038.9
+ Households 32 898.6 0.0 0.0 0.0 0.0 2 087.5 17 260.6 7 014.4 0.0 Z 904.9 5 631.2
+ Agriculture & forestry 2 695.8 0.0 0.0 0.0 0.0 2 010.0 136.0 50.8 0.0 Z 10.5 488.5
+ Fishing 221.9 0.0 0.0 0.0 0.0 160.9 0.0 34.4 0.0 Z 0.0 26.6
+ Not elsewhere specified (other) 101.6 0.0 0.0 0.0 0.0 85.2 0.0 0.0 0.0 Z 16.4 0.0
Statistical differences -352.1 -280.2 0.0 0.0 0.0 -71.9 -0.0 0.0 0.0 0.0 0.0 0.0
Gross electricity production 25 380.0 2 805.5 212.3 0.0 0.0 991.1 12 067.9 9 090.6 212.7 0.0 Z Z
Gross heat production 5 575.2 46.0 103.0 0.0 0.0 770.9 3 563.0 959.7 132.6 0.0 Z 0.0
Source: Eurostat (nrg_bal_c)
76Energy balance sheets — 2017 data
Electricity
ktoe 2017
Oil and
petroleum
products
Natural
gas
Renewables
and
biofuels
Non-
renewable
waste
Nuclear
heatHeat
ItalyTotal
Solid
fossil
fuels
Manufac-
tured
gases
Peat and
peat
products
Oil shale
and oil
sands

2005 2010 2011 2012 2013 2014 2015 2016 2017
Gross available energy 191 687 179 819 173 688 166 908 160 570 151 759 157 630 156 490 161 815
Solid fossil fuels 16 469 13 674 15 331 15 715 13 536 13 059 12 300 10 983 9 342
Peat & peat products 0 0 0 0 0 0 0 0 0
Oil shale & oil sands 0 0 0 0 0 0 0 0 0
Crude oil & other hydrocarbons 99 866 88 452 84 792 79 254 69 227 64 347 73 138 70 221 73 923
Petroleum products -14 306 -17 066 -16 342 -18 139 -10 711 -7 782 -14 515 -13 178 -16 201
Natural gas 70 651 68 057 63 814 61 356 57 387 50 706 55 302 58 080 61 549
Nuclear heat 0 0 0 0 0 0 0 0 0
Renewable energies 14 107 21 864 21 026 23 885 26 371 26 512 26 269 26 018 28 821
Non-renewable wastes 673 1 041 1 135 1 132 1 138 1 158 1 149 1 183 1 134
Primary production 30 208 32 945 31 917 34 964 36 767 36 694 36 098 33 519 36 666
Solid fossil fuels 60 64 58 51 46 55 51 0 0
Peat 0 0 0 0 0 0 0 0 0
Oil shale and oil sands 0 0 0 0 0 0 0 0 0
Crude oil & other hydrocarbons 6 260 5 560 5 581 5 629 5 748 5 983 5 788 4 029 4 456
Natural gas 9 886 6 885 6 920 7 048 6 335 5 855 5 545 4 738 4 536
Nuclear heat 0 0 0 0 0 0 0 0 0
Renewable energies 13 328 19 395 18 224 21 104 23 500 23 644 23 564 23 569 26 540
Non-renewable wastes 673 1 041 1 135 1 132 1 138 1 158 1 149 1 183 1 134
Net imports 159 766 148 479 141 300 132 039 123 216 115 050 121 422 121 520 124 564
Solid fossil fuels 16 374 13 787 14 726 15 187 13 023 12 889 12 318 10 711 9 360
Crude oil 88 497 78 236 71 762 67 932 57 824 53 475 61 748 60 254 65 652
Gas/Diesel Oil (w/o bio) -8 189 -8 342 -6 882 -8 795 -5 541 -2 371 -6 016 -4 998 -5 241
Motor Gasoline (w/o bio) -7 551 -9 217 -8 717 -9 653 -7 924 -6 976 -8 439 -8 175 -8 728
Naphtha 729 876 -270 -73 572 235 266 602 108
LPG 1 234 1 736 1 784 1 916 2 086 2 185 2 226 2 282 2 259
All other oil & petroleum products 3 827 3 511 4 639 3 715 6 065 3 531 2 643 1 914 -1 224
Natural gas 59 840 61 600 57 531 55 353 50 564 45 471 49 996 53 294 56 820
Transformation input 176 392 161 454 158 130 151 504 133 242 127 106 136 658 134 470 139 367
Electricity & heat generation 63 018 59 351 59 777 58 172 54 589 52 666 54 234 54 863 55 904
Refinery intake 101 314 90 380 85 868 81 739 69 867 66 530 74 724 72 086 75 671
Coke ovens 3 745 3 639 4 137 3 702 2 128 1 690 1 593 1 741 1 668
Blast furnaces 3 739 3 055 3 279 2 945 2 085 2 130 1 495 1 765 1 303
Transformation output 141 641 131 199 127 925 122 846 108 248 102 972 111 221 108 992 114 138
Electricity & heat generation 30 725 30 877 31 251 30 677 30 087 28 980 29 515 30 262 31 012
Refinery output 101 935 91 404 87 095 82 973 70 968 67 705 75 144 72 538 76 359
Coke ovens 3 472 3 193 3 729 3 551 2 092 1 523 1 459 1 546 1 526
Blast furnaces 1 029 770 862 788 585 745 546 695 498
Energy sector 9 841 9 439 9 974 8 548 7 443 6 714 7 518 6 836 7 699
Distribution losses 2 264 2 255 2 151 2 264 2 253 1 963 1 980 1 913 1 992
Available for final consumption 139 592 131 728 125 612 121 870 120 700 113 958 117 629 116 754 121 174
Solid fossil fuels 1 497 754 1 156 1 096 836 697 576 753 270
Manufactured gases 19 0 0 206 165 280 209 235 159
Peat & peat products 0 0 0 0 0 0 0 0 0
Oil shale & oil sands 0 0 0 0 0 0 0 0 0
Gas/Diesel Oil (w/o bio) 31 609 28 693 28 448 26 672 25 912 26 833 26 151 25 871 24 555
Motor Gasoline (w/o bio) 14 646 10 604 10 871 9 650 8 997 9 232 8 167 7 759 7 657
Naphtha 2 859 3 196 2 677 2 477 1 869 2 455 2 127 2 436 5 144
LPG 3 855 3 684 3 548 3 551 3 699 3 465 3 569 3 525 3 635
All other oil & petroleum products 9 965 7 368 7 018 4 581 6 357 3 906 6 070 5 423 4 401
Natural gas 41 583 39 065 35 961 35 821 35 672 31 412 33 556 33 890 34 577
Primary solid biofuels & charcoal 4 073 7 336 4 811 6 851 6 865 6 001 6 800 6 582 7 173
Liquid biofuels 177 1 419 1 401 1 368 1 252 1 065 1 167 1 041 1 062
All other renewable energies 294 318 326 369 380 387 398 420 3 078
Non-renewable wastes 62 223 249 281 281 272 269 276 245
Electricity 25 871 25 736 25 952 25 515 24 711 24 204 24 719 24 594 25 104
Heat 3 082 3 332 3 195 3 433 3 702 3 747 3 851 3 950 4 114
Statistical difference -528 -885 -1 093 -2 569 306 -2 078 -1 085 -1 107 -352
Final non-energy consumption 8 611 9 560 9 187 7 880 6 339 7 188 6 605 6 306 7 915
Final energy consumption 131 509 123 053 117 518 116 559 114 054 108 848 112 108 111 555 113 611
Industry 37 212 29 015 27 745 26 949 25 354 24 739 24 853 25 089 24 926
Transport 41 839 38 566 38 572 36 349 35 701 37 009 36 374 35 815 34 525
Other sectors 52 459 55 472 51 201 53 262 52 999 47 100 50 880 50 651 54 160
Services 15 053 16 979 15 751 15 931 15 847 14 667 15 391 15 440 18 242
Households 33 922 35 393 32 378 34 348 34 231 29 546 32 494 32 185 32 899
Europe 2020-2030 indicators 2005 2010 2011 2012 2013 2014 2015 2016 2017
Gross inland consumption 189 445 176 845 171 192 164 441 158 391 149 846 155 730 154 278 156 862
Primary energy consumption 180 834 167 284 162 005 156 561 152 052 142 658 149 124 147 971 148 948
Final energy consumption 137 216 128 506 123 184 121 816 118 554 113 310 116 224 115 920 115 186
Source: Eurostat (nrg_bal_c)
77
Italyktoe
Energy balance sheets — 2017 data

Source: Eurostat (nrg_bal_c)
Source: Eurostat (nrg_bal_c)
Note: Please refer to page 23 for related methodological definitions.
Italy
78Energy balance sheets — 2017 data
0
50 000
100 000
150 000
200 000
250 000
300 000
350 000
1990 1995 2000 2005 2010 2015 2017
Gross electricity production by fuel, GWh
Solid fossil fuels Oil and petroleum products Natural gas
Renewables and biofuels Nuclear heat Other
0
20 000
40 000
60 000
80 000
100 000
120 000
1990 1995 2000 2005 2010 2015 2017
Gross available energy by fuel, ktoe
Solid fossil fuels Oil and petroleum products Natural gas
Renewables and biofuels Nuclear heat Non-renewable waste

Source: Eurostat (nrg_bal_c)
Source: Eurostat (nrg_bal_c)
Note: Please refer to page 23 for related methodological definitions.
Italy
79Energy balance sheets — 2017 data
0
20 000
40 000
60 000
80 000
100 000
120 000
140 000
1990 1995 2000 2005 2010 2015 2017
Final energy consumption by fuel, ktoe
Solid fossil fuels Oil and petroleum products Natural gas
Renewables and biofuels Electricity Heat
Other
0
20 000
40 000
60 000
80 000
100 000
120 000
140 000
160 000
1990 1995 2000 2005 2010 2015 2017
Final consumption by sector, ktoe
Industry Transport Services Households Non-energy use

+ Primary production 132.1 0.0 Z 0.0 0.0 0.0 0.0 128.8 3.3 0.0 Z Z
+ Recovered & recycled products 5.6 0.0 Z 0.0 0.0 5.6 Z 0.0 Z Z Z Z
+ Imports 2 711.4 9.7 0.0 0.0 0.0 2 647.2 0.0 36.8 17.6 Z 0.0 0.0
- Exports 0.0 0.0 0.0 0.0 0.0 0.0 0.0 0.0 0.0 Z 0.0 0.0
+ Change in stock -34.4 -6.7 0.0 0.0 0.0 -29.2 0.0 0.8 0.7 Z Z Z
= Gross available energy 2 814.6 3.0 0.0 0.0 0.0 2 623.6 0.0 166.5 21.6 0.0 0.0 0.0
- International maritime bunkers 253.3 0.0 0.0 0.0 0.0 253.3 0.0 0.0 Z Z Z Z
= Gross inland consumption 2 561.3 3.0 0.0 0.0 0.0 2 370.3 0.0 166.5 21.6 0.0 0.0 0.0
- International aviation 315.1 Z Z Z Z 315.1 Z 0.0 Z Z Z Z
= Total energy supply 2 246.2 3.0 0.0 0.0 0.0 2 055.2 0.0 166.5 21.6 0.0 0.0 0.0
Transformation input 1 065.7 0.0 0.0 0.0 0.0 1 018.7 0.0 47.0 0.0 0.0 0.0 0.0
+ Electricity & heat generation 1 059.4 0.0 0.0 0.0 0.0 1 018.7 0.0 40.7 0.0 0.0 0.0 0.0
+ Coke ovens 0.0 0.0 0.0 0.0 0.0 0.0 0.0 0.0 Z Z Z Z
+ Blast furnaces 0.0 0.0 0.0 0.0 0.0 0.0 0.0 0.0 Z Z Z Z
+ Gas works 0.0 0.0 0.0 0.0 0.0 0.0 0.0 0.0 Z Z Z Z
+ Refineries & petrochemical industry 0.0 Z Z Z Z 0.0 Z Z Z Z Z Z
+ Patent fuel plants 0.0 0.0 0.0 0.0 0.0 0.0 Z 0.0 0.0 Z Z Z
+ BKB & PB plants 0.0 0.0 0.0 0.0 0.0 Z Z 0.0 0.0 Z Z Z
+ Coal liquefaction plants 0.0 0.0 0.0 0.0 0.0 Z Z Z Z Z Z Z
+ For blended natural gas 0.0 Z 0.0 Z Z 0.0 Z 0.0 Z Z Z Z
+ Liquid biofuels blended 2.2 Z Z Z Z Z Z 2.2 Z Z Z Z
+ Charcoal production plants 4.1 Z Z Z Z Z Z 4.1 Z Z Z Z
+ Gas-to-liquids plants 0.0 Z Z Z Z Z 0.0 Z Z Z Z Z
+ Not elsewhere specified 0.0 0.0 0.0 0.0 0.0 0.0 0.0 0.0 0.0 Z Z Z
Transformation output 435.6 0.0 0.0 0.0 Z 0.0 0.0 4.0 Z Z 1.3 430.3
+ Electricity & heat generation 431.6 Z Z Z Z Z Z Z Z Z 1.3 430.3
+ Coke ovens 0.0 0.0 0.0 Z Z Z Z Z Z Z Z Z
+ Blast furnaces 0.0 0.0 0.0 Z Z Z Z Z Z Z Z Z
+ Gas works 0.0 0.0 0.0 Z Z Z Z Z Z Z Z Z
+ Refineries & petrochemical industry 0.0 Z Z Z Z 0.0 Z 0.0 Z Z Z Z
+ Patent fuel plants 0.0 0.0 Z Z Z Z Z Z Z Z Z Z
+ BKB & PB plants 0.0 0.0 Z 0.0 Z Z Z Z Z Z Z Z
+ Coal liquefaction plants 0.0 Z Z Z Z 0.0 Z Z Z Z Z Z
+ Blended in natural gas 0.0 Z Z Z Z Z 0.0 Z Z Z Z Z
+ Liquid biofuels blended 2.2 Z Z Z Z Z Z 2.2 Z Z Z Z
+ Charcoal production plants 1.8 Z Z Z Z Z Z 1.8 Z Z Z Z
+ Gas-to-liquids plants 0.0 Z Z Z Z 0.0 Z Z Z Z Z Z
+ Not elsewhere specified 0.0 0.0 0.0 0.0 Z 0.0 Z Z Z Z Z Z
Energy sector 19.9 0.0 0.0 0.0 0.0 0.0 0.0 0.0 0.0 Z 0.0 19.9
+ Own use in electricity & heat generation 19.4 0.0 0.0 0.0 0.0 0.0 0.0 0.0 0.0 Z 0.0 19.4
+ Coal mines 0.0 0.0 0.0 0.0 0.0 0.0 0.0 0.0 0.0 Z 0.0 0.0
+ Oil & natural gas extraction plants 0.0 Z Z Z Z 0.0 0.0 0.0 Z Z 0.0 0.0
+ Patent fuel plants 0.0 0.0 0.0 0.0 0.0 Z Z 0.0 0.0 Z 0.0 0.0
+ Coke ovens 0.0 0.0 0.0 0.0 0.0 0.0 0.0 0.0 0.0 Z 0.0 0.0
+ BKB & PB plants 0.0 0.0 0.0 0.0 0.0 Z Z 0.0 0.0 Z 0.0 0.0
+ Gas works 0.0 0.0 0.0 0.0 0.0 0.0 0.0 0.0 0.0 Z 0.0 0.0
+ Blast furnaces 0.0 0.0 0.0 0.0 0.0 0.0 0.0 0.0 0.0 Z 0.0 0.0
+ Petroleum refineries (oil refineries) 0.2 0.0 0.0 0.0 0.0 0.0 0.0 0.0 0.0 Z 0.0 0.2
+ Nuclear industry 0.0 Z Z Z Z Z Z Z Z Z 0.0 0.0
+ Coal liquefaction plants 0.0 0.0 0.0 0.0 0.0 Z Z Z Z Z 0.0 0.0
+ Liquefaction & regasification plants (LNG) 0.0 Z Z Z Z Z 0.0 Z Z Z 0.0 0.0
+ Gasification plants for biogas 0.0 Z Z Z Z Z Z 0.0 0.0 Z 0.0 0.0
+ Gas-to-liquids (GTL) plants 0.0 Z Z Z Z Z 0.0 Z Z Z 0.0 0.0
+ Charcoal production plants 0.0 Z Z Z Z Z Z 0.0 0.0 Z 0.0 0.0
+ Not elsewhere specified (energy) 0.2 0.0 0.0 0.0 0.0 0.0 0.0 0.0 0.0 Z 0.0 0.2
Distribution losses 19.6 0.0 0.0 0.0 0.0 0.0 0.0 0.0 0.0 Z 0.0 19.6
Available for final consumption 1 576.7 3.0 0.0 0.0 0.0 1 036.5 0.0 123.5 21.6 0.0 1.3 390.8
Final non-energy consumption 38.8 0.0 0.0 0.0 0.0 38.8 0.0 0.0 Z Z Z Z
Final energy consumption 1 536.5 3.0 0.0 0.0 0.0 996.6 0.0 123.5 21.6 Z 1.3 390.5
+ Industry 229.5 3.0 0.0 0.0 0.0 138.7 0.0 21.7 21.6 Z 0.0 44.6
+ Iron & steel 0.2 0.0 0.0 0.0 0.0 0.0 0.0 0.0 0.0 Z 0.0 0.2
+ Chemical & petrochemical 5.9 0.0 0.0 0.0 0.0 1.6 0.0 0.5 0.0 Z 0.0 3.8
+ Non-ferrous metals 0.8 0.0 0.0 0.0 0.0 0.8 0.0 0.0 0.0 Z 0.0 0.0
+ Non-metallic minerals 154.4 3.0 0.0 0.0 0.0 94.9 0.0 20.0 21.6 Z 0.0 15.0
+ Transport equipment 0.2 0.0 0.0 0.0 0.0 0.0 0.0 0.0 0.0 Z 0.0 0.2
+ Machinery 1.9 0.0 0.0 0.0 0.0 0.1 0.0 0.0 0.0 Z 0.0 1.8
+ Mining & quarrying 5.6 0.0 0.0 0.0 0.0 3.1 0.0 0.0 0.0 Z 0.0 2.5
+ Food, beverages & tobacco 38.5 0.0 0.0 0.0 0.0 22.2 0.0 1.2 0.0 Z 0.0 15.1
+ Paper, pulp & printing 2.4 0.0 0.0 0.0 0.0 1.0 0.0 0.0 0.0 Z 0.0 1.4
+ Wood & wood products 0.5 0.0 0.0 0.0 0.0 0.0 0.0 0.0 0.0 Z 0.0 0.5
+ Construction 14.9 0.0 0.0 0.0 0.0 14.4 0.0 0.0 0.0 Z 0.0 0.4
+ Textile & leather 0.4 0.0 0.0 0.0 0.0 0.0 0.0 0.0 0.0 Z 0.0 0.4
+ Not elsewhere specified (industry) 3.8 0.0 0.0 0.0 0.0 0.6 0.0 0.0 0.0 Z 0.0 3.2
+ Transport 676.6 0.0 0.0 0.0 0.0 668.0 0.0 8.6 0.0 Z Z 0.0
+ Rail 0.0 0.0 0.0 0.0 0.0 0.0 Z 0.0 0.0 Z Z 0.0
+ Road 676.6 Z Z Z Z 668.0 0.0 8.6 0.0 Z Z 0.0
+ Domestic aviation 0.0 Z Z Z Z 0.0 Z 0.0 Z Z Z Z
+ Domestic navigation 0.0 0.0 0.0 0.0 0.0 0.0 Z 0.0 0.0 Z Z Z
+ Pipeline transport 0.0 Z Z Z Z 0.0 0.0 0.0 Z Z Z 0.0
+ Not elsewhere specified (transport) 0.0 0.0 0.0 0.0 0.0 0.0 0.0 0.0 0.0 Z Z 0.0
+ Other 630.4 0.0 0.0 0.0 0.0 189.9 0.0 93.2 0.0 Z 1.3 346.0
+ Commercial & public services 229.5 0.0 0.0 0.0 0.0 31.4 0.0 17.8 0.0 Z 0.0 180.3
+ Households 336.7 0.0 0.0 0.0 0.0 122.1 0.0 71.5 0.0 Z 0.0 143.1
+ Agriculture & forestry 45.0 0.0 0.0 0.0 0.0 25.4 0.0 3.9 0.0 Z 1.3 14.4
+ Fishing 2.3 0.0 0.0 0.0 0.0 2.0 0.0 0.0 0.0 Z 0.0 0.3
+ Not elsewhere specified (other) 16.8 0.0 0.0 0.0 0.0 8.9 0.0 0.0 0.0 Z 0.0 7.8
Statistical differences 1.4 0.0 0.0 0.0 0.0 1.2 0.0 0.0 0.0 0.0 0.0 0.3
Gross electricity production 430.3 0.0 0.0 0.0 0.0 392.9 0.0 37.4 0.0 0.0 Z Z
Gross heat production 1.3 0.0 0.0 0.0 0.0 0.0 0.0 1.3 0.0 0.0 Z 0.0
Source: Eurostat (nrg_bal_c)
80Energy balance sheets — 2017 data
Electricity
ktoe 2017
Oil and
petroleum
products
Natural
gas
Renewables
and
biofuels
Non-
renewable
waste
Nuclear
heatHeat
CyprusTotal
Solid
fossil
fuels
Manufac-
tured
gases
Peat and
peat
products
Oil shale
and oil
sands

2005 2010 2011 2012 2013 2014 2015 2016 2017
Gross available energy 2 835 2 941 2 905 2 730 2 435 2 473 2 533 2 741 2 815
Solid fossil fuels 36 17 7 0 0 2 4 0 3
Peat & peat products 0 0 0 0 0 0 0 0 0
Oil shale & oil sands 0 0 0 0 0 0 0 0 0
Crude oil & other hydrocarbons 0 0 0 0 0 0 0 0 0
Petroleum products 2 743 2 812 2 777 2 599 2 299 2 331 2 370 2 572 2 624
Natural gas 0 0 0 0 0 0 0 0 0
Nuclear heat 0 0 0 0 0 0 0 0 0
Renewable energies 54 106 121 129 134 133 147 153 166
Non-renewable wastes 3 7 0 1 1 8 12 16 22
Primary production 51 89 96 107 109 118 121 129 132
Solid fossil fuels 0 0 0 0 0 0 0 0 0
Peat 0 0 0 0 0 0 0 0 0
Oil shale and oil sands 0 0 0 0 0 0 0 0 0
Crude oil & other hydrocarbons 0 0 0 0 0 0 0 0 0
Natural gas 0 0 0 0 0 0 0 0 0
Nuclear heat 0 0 0 0 0 0 0 0 0
Renewable energies 48 82 96 107 109 111 118 124 129
Non-renewable wastes 3 7 0 0 0 7 3 5 3
Net imports 2 855 2 964 2 685 2 647 2 345 2 306 2 474 2 636 2 711
Solid fossil fuels 43 11 0 0 0 3 4 0 10
Crude oil 0 0 0 0 0 0 0 0 0
Gas/Diesel Oil (w/o bio) 619 698 636 721 687 561 576 632 805
Motor Gasoline (w/o bio) 350 425 398 385 363 362 383 377 370
Naphtha 0 0 0 0 0 0 0 0 0
LPG 55 58 61 60 56 54 61 60 63
All other oil & petroleum products 1 781 1 749 1 565 1 459 1 212 1 304 1 416 1 522 1 410
Natural gas 0 0 0 0 0 0 0 0 0
Transformation input 1 092 1 208 1 174 1 128 914 937 973 1 056 1 066
Electricity & heat generation 1 088 1 201 1 167 1 120 907 932 968 1 052 1 059
Refinery intake 0 0 0 0 0 0 0 0 0
Coke ovens 0 0 0 0 0 0 0 0 0
Blast furnaces 0 0 0 0 0 0 0 0 0
Transformation output 378 464 431 413 376 379 395 423 436
Electricity & heat generation 376 458 425 406 370 375 391 421 432
Refinery output 0 0 0 0 0 0 0 0 0
Coke ovens 0 0 0 0 0 0 0 0 0
Blast furnaces 0 0 0 0 0 0 0 0 0
Energy sector 22 20 21 16 16 20 20 19 20
Distribution losses 14 19 14 12 16 15 18 23 20
Available for final consumption 1 492 1 690 1 622 1 514 1 381 1 407 1 429 1 504 1 577
Solid fossil fuels 36 17 7 0 0 2 4 0 3
Manufactured gases 0 0 0 0 0 0 0 0 0
Peat & peat products 0 0 0 0 0 0 0 0 0
Oil shale & oil sands 0 0 0 0 0 0 0 0 0
Gas/Diesel Oil (w/o bio) 517 447 467 427 345 346 367 389 428
Motor Gasoline (w/o bio) 346 416 398 385 365 360 368 372 370
Naphtha 0 0 0 0 0 0 0 0 0
LPG 58 55 62 59 59 54 61 60 61
All other oil & petroleum products 142 231 194 160 170 193 155 177 176
Natural gas 0 0 0 0 0 0 0 0 0
Primary solid biofuels & charcoal 2 11 11 4 4 7 7 6 8
Liquid biofuels 0 15 16 18 15 10 10 9 10
All other renewable energies 49 72 77 82 84 85 91 96 106
Non-renewable wastes 3 7 0 1 1 8 12 16 22
Electricity 340 419 390 378 337 341 352 378 391
Heat 0 0 1 1 1 1 1 1 1
Statistical difference -108 -37 -55 -12 -13 9 -10 -17 1
Final non-energy consumption 73 85 67 39 27 24 24 39 39
Final energy consumption 1 527 1 642 1 609 1 487 1 367 1 373 1 415 1 481 1 536
Industry 320 236 209 172 184 224 210 214 230
Transport 676 765 744 688 620 600 622 654 677
Other sectors 531 641 656 627 563 550 583 614 630
Services 161 248 237 223 203 201 207 226 230
Households 317 332 352 345 301 290 317 326 337
Europe 2020-2030 indicators 2005 2010 2011 2012 2013 2014 2015 2016 2017
Gross inland consumption 2 548 2 757 2 709 2 534 2 198 2 243 2 291 2 456 2 561
Primary energy consumption 2 475 2 671 2 642 2 495 2 171 2 219 2 267 2 417 2 523
Final energy consumption 1 834 1 926 1 919 1 765 1 615 1 617 1 660 1 759 1 852
Source: Eurostat (nrg_bal_c)
81
Cyprusktoe
Energy balance sheets — 2017 data
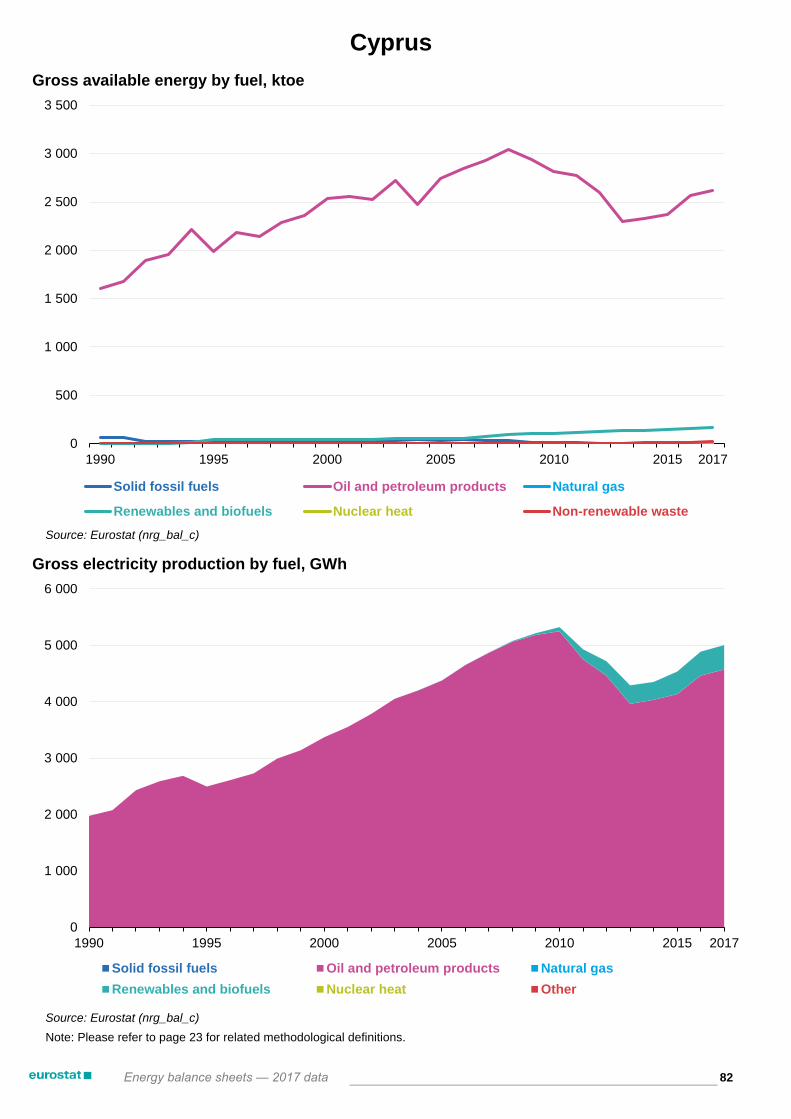
Source: Eurostat (nrg_bal_c)
Source: Eurostat (nrg_bal_c)
Note: Please refer to page 23 for related methodological definitions.
Cyprus
82Energy balance sheets — 2017 data
0
1 000
2 000
3 000
4 000
5 000
6 000
1990 1995 2000 2005 2010 2015 2017
Gross electricity production by fuel, GWh
Solid fossil fuels Oil and petroleum products Natural gas
Renewables and biofuels Nuclear heat Other
0
500
1 000
1 500
2 000
2 500
3 000
3 500
1990 1995 2000 2005 2010 2015 2017
Gross available energy by fuel, ktoe
Solid fossil fuels Oil and petroleum products Natural gas
Renewables and biofuels Nuclear heat Non-renewable waste
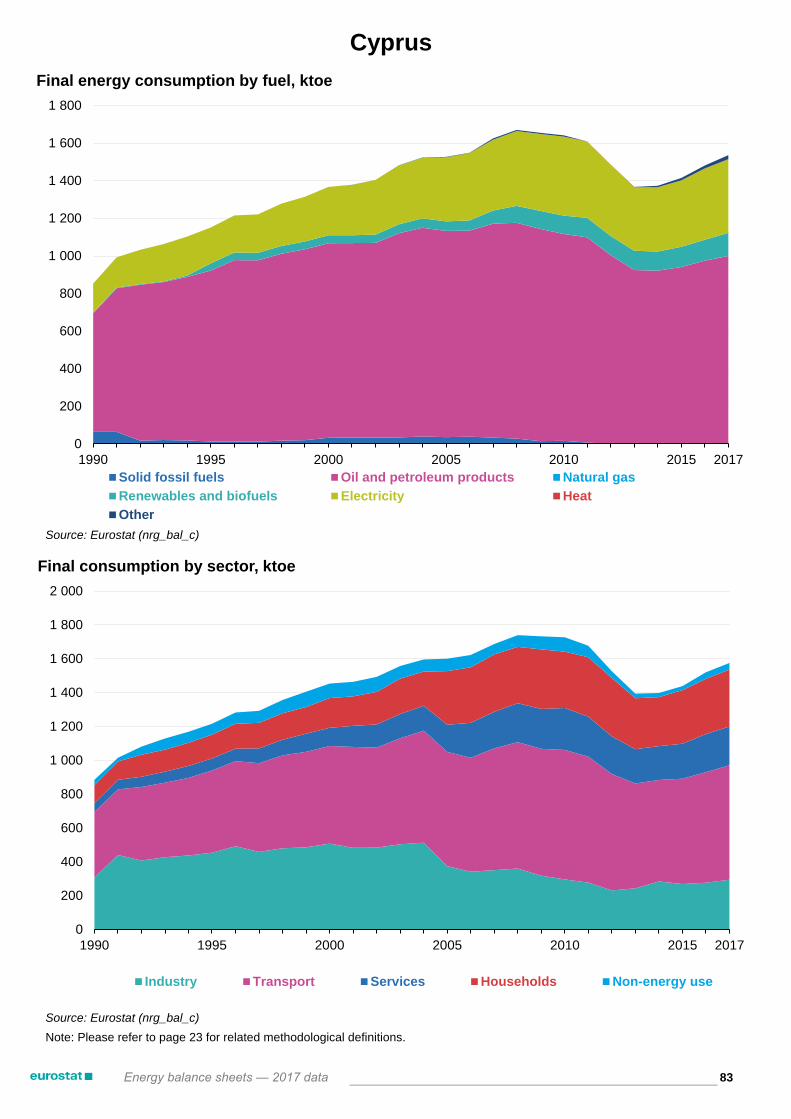
Source: Eurostat (nrg_bal_c)
Source: Eurostat (nrg_bal_c)
Note: Please refer to page 23 for related methodological definitions.
Cyprus
83Energy balance sheets — 2017 data
0
200
400
600
800
1 000
1 200
1 400
1 600
1 800
1990 1995 2000 2005 2010 2015 2017
Final energy consumption by fuel, ktoe
Solid fossil fuels Oil and petroleum products Natural gas
Renewables and biofuels Electricity Heat
Other
0
200
400
600
800
1 000
1 200
1 400
1 600
1 800
2 000
1990 1995 2000 2005 2010 2015 2017
Final consumption by sector, ktoe
Industry Transport Services Households Non-energy use

+ Primary production 2 587.2 0.0 Z 0.5 0.0 0.0 0.0 2 580.1 6.7 0.0 Z Z
+ Recovered & recycled products 13.0 0.0 Z 0.0 0.0 13.0 Z 0.0 Z Z Z Z
+ Imports 4 174.3 39.1 0.0 0.0 0.0 2 593.9 1 012.7 158.5 19.9 Z 0.0 350.2
- Exports 2 054.6 3.4 0.0 0.3 0.0 769.9 0.0 925.2 0.0 Z 0.0 355.7
+ Change in stock 91.6 4.6 0.0 0.5 0.0 -15.2 -19.8 121.8 -0.5 Z Z Z
= Gross available energy 4 811.6 40.4 0.0 0.7 0.0 1 821.8 993.0 1 935.2 26.1 0.0 0.0 -5.5
- International maritime bunkers 260.2 0.0 0.0 0.0 0.0 260.2 0.0 0.0 Z Z Z Z
= Gross inland consumption 4 551.4 40.4 0.0 0.7 0.0 1 561.6 993.0 1 935.2 26.1 0.0 0.0 -5.5
- International aviation 139.9 Z Z Z Z 139.9 Z 0.0 Z Z Z Z
= Total energy supply 4 411.4 40.4 0.0 0.7 0.0 1 421.7 993.0 1 935.2 26.1 0.0 0.0 -5.5
Transformation input 1 622.1 3.7 0.0 0.7 0.0 1.2 643.1 973.3 0.0 0.0 0.0 0.1
+ Electricity & heat generation 1 588.3 3.7 0.0 0.0 0.0 1.1 643.1 940.2 0.0 0.0 0.0 0.1
+ Coke ovens 0.0 0.0 0.0 0.0 0.0 0.0 0.0 0.0 Z Z Z Z
+ Blast furnaces 0.0 0.0 0.0 0.0 0.0 0.0 0.0 0.0 Z Z Z Z
+ Gas works 0.0 0.0 0.0 0.0 0.0 0.0 0.0 0.0 Z Z Z Z
+ Refineries & petrochemical industry 0.0 Z Z Z Z 0.0 Z Z Z Z Z Z
+ Patent fuel plants 0.0 0.0 0.0 0.0 0.0 0.0 Z 0.0 0.0 Z Z Z
+ BKB & PB plants 0.7 0.0 0.0 0.7 0.0 Z Z 0.0 0.0 Z Z Z
+ Coal liquefaction plants 0.0 0.0 0.0 0.0 0.0 Z Z Z Z Z Z Z
+ For blended natural gas 0.0 Z 0.0 Z Z 0.0 Z 0.0 Z Z Z Z
+ Liquid biofuels blended 10.8 Z Z Z Z Z Z 10.8 Z Z Z Z
+ Charcoal production plants 22.3 Z Z Z Z Z Z 22.3 Z Z Z Z
+ Gas-to-liquids plants 0.0 Z Z Z Z Z 0.0 Z Z Z Z Z
+ Not elsewhere specified 0.0 0.0 0.0 0.0 0.0 0.0 0.0 0.0 0.0 Z Z Z
Transformation output 1 384.0 0.0 0.0 0.3 Z 0.0 0.0 19.8 Z Z 716.3 647.6
+ Electricity & heat generation 1 363.8 Z Z Z Z Z Z Z Z Z 716.3 647.6
+ Coke ovens 0.0 0.0 0.0 Z Z Z Z Z Z Z Z Z
+ Blast furnaces 0.0 0.0 0.0 Z Z Z Z Z Z Z Z Z
+ Gas works 0.0 0.0 0.0 Z Z Z Z Z Z Z Z Z
+ Refineries & petrochemical industry 0.0 Z Z Z Z 0.0 Z 0.0 Z Z Z Z
+ Patent fuel plants 0.0 0.0 Z Z Z Z Z Z Z Z Z Z
+ BKB & PB plants 0.3 0.0 Z 0.3 Z Z Z Z Z Z Z Z
+ Coal liquefaction plants 0.0 Z Z Z Z 0.0 Z Z Z Z Z Z
+ Blended in natural gas 0.0 Z Z Z Z Z 0.0 Z Z Z Z Z
+ Liquid biofuels blended 10.8 Z Z Z Z Z Z 10.8 Z Z Z Z
+ Charcoal production plants 9.0 Z Z Z Z Z Z 9.0 Z Z Z Z
+ Gas-to-liquids plants 0.0 Z Z Z Z 0.0 Z Z Z Z Z Z
+ Not elsewhere specified 0.0 0.0 0.0 0.0 Z 0.0 Z Z Z Z Z Z
Energy sector 85.9 0.0 0.0 0.0 0.0 5.8 10.5 0.0 0.0 Z 26.1 43.5
+ Own use in electricity & heat generation 85.9 0.0 0.0 0.0 0.0 5.8 10.5 0.0 0.0 Z 26.1 43.5
+ Coal mines 0.0 0.0 0.0 0.0 0.0 0.0 0.0 0.0 0.0 Z 0.0 0.0
+ Oil & natural gas extraction plants 0.0 Z Z Z Z 0.0 0.0 0.0 Z Z 0.0 0.0
+ Patent fuel plants 0.0 0.0 0.0 0.0 0.0 Z Z 0.0 0.0 Z 0.0 0.0
+ Coke ovens 0.0 0.0 0.0 0.0 0.0 0.0 0.0 0.0 0.0 Z 0.0 0.0
+ BKB & PB plants 0.0 0.0 0.0 0.0 0.0 Z Z 0.0 0.0 Z 0.0 0.0
+ Gas works 0.0 0.0 0.0 0.0 0.0 0.0 0.0 0.0 0.0 Z 0.0 0.0
+ Blast furnaces 0.0 0.0 0.0 0.0 0.0 0.0 0.0 0.0 0.0 Z 0.0 0.0
+ Petroleum refineries (oil refineries) 0.0 0.0 0.0 0.0 0.0 0.0 0.0 0.0 0.0 Z 0.0 0.0
+ Nuclear industry 0.0 Z Z Z Z Z Z Z Z Z 0.0 0.0
+ Coal liquefaction plants 0.0 0.0 0.0 0.0 0.0 Z Z Z Z Z 0.0 0.0
+ Liquefaction & regasification plants (LNG) 0.0 Z Z Z Z Z 0.0 Z Z Z 0.0 0.0
+ Gasification plants for biogas 0.0 Z Z Z Z Z Z 0.0 0.0 Z 0.0 0.0
+ Gas-to-liquids (GTL) plants 0.0 Z Z Z Z Z 0.0 Z Z Z 0.0 0.0
+ Charcoal production plants 0.0 Z Z Z Z Z Z 0.0 0.0 Z 0.0 0.0
+ Not elsewhere specified (energy) 0.0 0.0 0.0 0.0 0.0 0.0 0.0 0.0 0.0 Z 0.0 0.0
Distribution losses 137.6 0.0 0.0 0.0 0.0 0.0 11.4 0.0 0.0 Z 85.4 40.8
Available for final consumption 3 949.8 36.7 0.0 0.3 0.0 1 414.7 328.0 981.7 26.1 0.0 604.8 557.6
Final non-energy consumption 85.3 0.0 0.0 0.0 0.0 85.3 0.0 0.0 Z Z Z Z
Final energy consumption 3 875.2 36.7 0.0 0.3 0.0 1 340.1 328.0 981.7 26.1 Z 604.8 557.6
+ Industry 793.4 23.3 0.0 0.0 0.0 55.1 107.6 351.1 26.1 Z 78.6 151.6
+ Iron & steel 1.5 0.0 0.0 0.0 0.0 0.0 0.1 0.0 0.0 Z 0.1 1.3
+ Chemical & petrochemical 25.9 0.0 0.0 0.0 0.0 3.6 10.7 5.1 0.0 Z 1.0 5.5
+ Non-ferrous metals 1.0 0.0 0.0 0.0 0.0 0.0 0.6 0.0 0.0 Z 0.0 0.4
+ Non-metallic minerals 130.7 21.5 0.0 0.0 0.0 8.0 30.6 21.8 26.1 Z 0.3 22.5
+ Transport equipment 7.6 0.1 0.0 0.0 0.0 0.7 1.0 0.1 0.0 Z 1.7 4.0
+ Machinery 17.4 0.2 0.0 0.0 0.0 0.8 5.0 3.2 0.0 Z 0.4 7.7
+ Mining & quarrying 7.8 0.0 0.0 0.0 0.0 4.4 0.8 0.3 0.0 Z 0.0 2.4
+ Food, beverages & tobacco 78.0 1.0 0.0 0.0 0.0 8.5 29.6 8.9 0.0 Z 5.2 24.8
+ Paper, pulp & printing 5.5 0.0 0.0 0.0 0.0 0.1 2.5 0.2 0.0 Z 0.2 2.4
+ Wood & wood products 464.8 0.1 0.0 0.0 0.0 10.7 15.0 306.3 0.0 Z 67.2 65.5
+ Construction 32.0 0.2 0.0 0.0 0.0 17.7 6.0 1.3 0.0 Z 1.0 5.8
+ Textile & leather 8.2 0.1 0.0 0.0 0.0 0.1 4.4 0.3 0.0 Z 0.6 2.6
+ Not elsewhere specified (industry) 12.8 0.2 0.0 0.0 0.0 0.5 1.2 3.3 0.0 Z 0.9 6.7
+ Transport 1 080.8 0.0 0.0 0.0 0.0 1 062.6 0.0 9.3 0.0 Z Z 9.0
+ Rail 56.5 0.0 0.0 0.0 0.0 52.4 Z 0.7 0.0 Z Z 3.4
+ Road 1 017.3 Z Z Z Z 1 004.1 0.0 8.6 0.0 Z Z 4.6
+ Domestic aviation 1.5 Z Z Z Z 1.5 Z 0.0 Z Z Z Z
+ Domestic navigation 4.6 0.0 0.0 0.0 0.0 4.6 Z 0.0 0.0 Z Z Z
+ Pipeline transport 1.0 Z Z Z Z 0.0 0.0 0.0 Z Z Z 1.0
+ Not elsewhere specified (transport) 0.0 0.0 0.0 0.0 0.0 0.0 0.0 0.0 0.0 Z Z 0.0
+ Other 2 001.0 13.4 0.0 0.3 0.0 222.4 220.5 621.3 0.0 Z 526.2 397.0
+ Commercial & public services 608.0 3.6 0.0 0.3 0.0 37.2 101.1 85.9 0.0 Z 142.3 237.7
+ Households 1 196.6 9.8 0.0 0.0 0.0 55.3 111.3 505.4 0.0 Z 372.4 142.4
+ Agriculture & forestry 186.8 0.0 0.0 0.0 0.0 121.9 8.0 29.9 0.0 Z 11.3 15.7
+ Fishing 8.7 0.0 0.0 0.0 0.0 7.5 0.1 0.1 0.0 Z 0.0 1.0
+ Not elsewhere specified (other) 0.8 0.0 0.0 0.0 0.0 0.5 0.0 0.0 0.0 Z 0.1 0.1
Statistical differences -10.7 0.0 0.0 0.0 0.0 -10.7 0.0 0.0 0.0 0.0 0.0 0.0
Gross electricity production 647.6 0.0 0.0 0.0 0.0 0.0 177.9 469.6 0.0 0.0 Z Z
Gross heat production 716.0 2.4 0.0 0.0 0.0 0.9 396.6 316.0 0.0 0.0 Z 0.1
Source: Eurostat (nrg_bal_c)
84Energy balance sheets — 2017 data
Electricity
ktoe 2017
Oil and
petroleum
products
Natural
gas
Renewables
and
biofuels
Non-
renewable
waste
Nuclear
heatHeat
LatviaTotal
Solid
fossil
fuels
Manufac-
tured
gases
Peat and
peat
products
Oil shale
and oil
sands

2005 2010 2011 2012 2013 2014 2015 2016 2017
Gross available energy 4 849 4 881 4 592 4 778 4 706 4 684 4 634 4 707 4 812
Solid fossil fuels 80 107 110 91 71 59 46 40 40
Peat & peat products 2 2 1 1 2 1 0 1 1
Oil shale & oil sands 0 0 0 0 0 0 0 0 0
Crude oil & other hydrocarbons 4 1 2 1 0 0 0 0 0
Petroleum products 1 741 1 771 1 613 1 622 1 648 1 665 1 741 1 803 1 822
Natural gas 1 358 1 462 1 288 1 211 1 205 1 082 1 098 1 113 993
Nuclear heat 0 0 0 0 0 0 0 0 0
Renewable energies 1 476 1 434 1 418 1 651 1 611 1 613 1 537 1 624 1 935
Non-renewable wastes 4 28 53 56 53 65 55 37 26
Primary production 1 861 1 977 2 075 2 337 2 143 2 380 2 338 2 447 2 587
Solid fossil fuels 0 0 0 0 0 0 0 0 0
Peat 3 2 0 2 2 1 0 1 0
Oil shale and oil sands 0 0 0 0 0 0 0 0 0
Crude oil & other hydrocarbons 0 0 0 0 0 0 0 0 0
Natural gas 0 0 0 0 0 0 0 0 0
Nuclear heat 0 0 0 0 0 0 0 0 0
Renewable energies 1 854 1 964 2 071 2 331 2 137 2 371 2 330 2 437 2 580
Non-renewable wastes 4 10 4 3 4 8 8 9 7
Net imports 3 096 2 223 2 749 2 694 2 630 1 901 2 372 2 219 2 120
Solid fossil fuels 78 113 112 90 65 46 39 35 36
Crude oil 0 0 0 0 0 0 0 0 0
Gas/Diesel Oil (w/o bio) 905 949 915 980 956 873 1 160 1 302 1 202
Motor Gasoline (w/o bio) 363 248 265 239 215 205 202 203 185
Naphtha 0 0 0 0 0 0 0 0 0
LPG 61 49 59 78 90 103 97 101 103
All other oil & petroleum products 453 428 405 352 393 358 333 362 335
Natural gas 1 434 903 1 410 1 378 1 392 780 1 083 923 1 013
Transformation input 1 663 1 492 1 349 1 395 1 466 1 329 1 391 1 527 1 622
Electricity & heat generation 1 342 1 452 1 308 1 359 1 430 1 286 1 350 1 497 1 588
Refinery intake 0 0 0 0 0 0 0 0 0
Coke ovens 0 0 0 0 0 0 0 0 0
Blast furnaces 0 0 0 0 0 0 0 0 0
Transformation output 1 467 1 289 1 154 1 202 1 189 1 090 1 116 1 266 1 384
Electricity & heat generation 1 166 1 254 1 121 1 172 1 161 1 057 1 084 1 244 1 364
Refinery output 0 0 0 0 0 0 0 0 0
Coke ovens 0 0 0 0 0 0 0 0 0
Blast furnaces 0 0 0 0 0 0 0 0 0
Energy sector 89 87 87 82 86 91 87 90 86
Distribution losses 197 167 151 151 143 134 124 134 138
Available for final consumption 4 049 4 055 3 827 3 994 3 838 3 878 3 786 3 784 3 950
Solid fossil fuels 73 93 97 77 59 53 42 35 37
Manufactured gases 0 0 0 0 0 0 0 0 0
Peat & peat products 0 1 1 1 0 1 0 1 0
Oil shale & oil sands 0 0 0 0 0 0 0 0 0
Gas/Diesel Oil (w/o bio) 779 926 835 833 857 894 954 960 1 036
Motor Gasoline (w/o bio) 355 283 264 230 214 224 206 198 189
Naphtha 0 0 0 0 0 0 0 0 0
LPG 61 50 58 78 91 101 98 99 101
All other oil & petroleum products 159 123 105 106 112 98 114 102 89
Natural gas 508 498 397 402 350 327 317 321 328
Primary solid biofuels & charcoal 1 008 914 957 1 057 987 1 010 906 870 940
Liquid biofuels 3 27 25 22 22 24 25 13 11
All other renewable energies 3 4 5 8 10 11 10 10 31
Non-renewable wastes 4 28 53 56 53 65 55 37 26
Electricity 493 534 532 589 565 566 556 557 558
Heat 603 575 499 535 518 505 504 581 605
Statistical difference -7 -20 -21 -13 -1 8 -7 -10 -11
Final non-energy consumption 97 73 97 98 107 94 113 97 85
Final energy consumption 3 959 4 002 3 751 3 908 3 732 3 776 3 680 3 697 3 875
Industry 699 774 748 827 768 791 788 749 793
Transport 1 008 1 083 965 930 940 982 1 038 1 034 1 081
Other sectors 2 253 2 145 2 039 2 151 2 025 2 003 1 855 1 915 2 001
Services 595 598 557 623 600 609 586 592 608
Households 1 504 1 389 1 327 1 376 1 267 1 238 1 106 1 143 1 197
Europe 2020-2030 indicators 2005 2010 2011 2012 2013 2014 2015 2016 2017
Gross inland consumption 4 589 4 629 4 377 4 538 4 466 4 452 4 379 4 392 4 550
Primary energy consumption 4 492 4 556 4 280 4 440 4 359 4 358 4 266 4 295 4 465
Final energy consumption 4 018 4 120 3 869 4 027 3 855 3 885 3 788 3 820 4 014
Source: Eurostat (nrg_bal_c)
85
Latviaktoe
Energy balance sheets — 2017 data

Source: Eurostat (nrg_bal_c)
Source: Eurostat (nrg_bal_c)
Note: Please refer to page 23 for related methodological definitions.
Latvia
86Energy balance sheets — 2017 data
0
1 000
2 000
3 000
4 000
5 000
6 000
7 000
8 000
1990 1995 2000 2005 2010 2015 2017
Gross electricity production by fuel, GWh
Solid fossil fuels Oil and petroleum products Natural gas
Renewables and biofuels Nuclear heat Other
0
500
1 000
1 500
2 000
2 500
3 000
3 500
4 000
4 500
1990 1995 2000 2005 2010 2015 2017
Gross available energy by fuel, ktoe
Solid fossil fuels Oil and petroleum products Natural gas
Renewables and biofuels Nuclear heat Non-renewable waste

Source: Eurostat (nrg_bal_c)
Source: Eurostat (nrg_bal_c)
Note: Please refer to page 23 for related methodological definitions.
Latvia
87Energy balance sheets — 2017 data
0
1 000
2 000
3 000
4 000
5 000
6 000
7 000
1990 1995 2000 2005 2010 2015 2017
Final energy consumption by fuel, ktoe
Solid fossil fuels Oil and petroleum products Natural gas
Renewables and biofuels Electricity Heat
Other
0
1 000
2 000
3 000
4 000
5 000
6 000
7 000
1990 1995 2000 2005 2010 2015 2017
Final consumption by sector, ktoe
Industry Transport Services Households Non-energy use

+ Primary production 1 753.8 0.0 Z 6.8 0.0 56.5 0.0 1 656.4 34.1 0.0 Z Z
+ Recovered & recycled products 6.5 0.0 Z 0.0 0.0 6.5 Z 0.0 Z Z Z Z
+ Imports 14 789.2 175.9 0.0 18.8 0.0 11 330.1 2 079.9 159.1 0.0 Z 0.0 1 025.5
- Exports 9 083.5 0.0 0.0 1.6 0.0 8 356.9 171.5 274.1 0.0 Z 0.0 279.4
+ Change in stock 80.5 -12.7 0.0 9.6 0.0 49.7 13.1 21.3 -0.5 Z Z Z
= Gross available energy 7 546.6 163.2 0.0 33.6 0.0 3 085.9 1 921.4 1 562.7 33.7 0.0 0.0 746.1
- International maritime bunkers 174.7 0.0 0.0 0.0 0.0 174.7 0.0 0.0 Z Z Z Z
= Gross inland consumption 7 371.8 163.2 0.0 33.6 0.0 2 911.2 1 921.4 1 562.7 33.7 0.0 0.0 746.1
- International aviation 105.9 Z Z Z Z 105.9 Z 0.0 Z Z Z Z
= Total energy supply 7 266.0 163.2 0.0 33.6 0.0 2 805.3 1 921.4 1 562.7 33.7 0.0 0.0 746.1
Transformation input 12 591.9 1.6 0.0 10.0 0.0 11 117.4 337.7 956.2 33.5 0.0 66.6 68.9
+ Electricity & heat generation 1 438.4 1.6 0.0 8.2 0.0 28.4 337.7 893.5 33.5 0.0 66.6 68.9
+ Coke ovens 0.0 0.0 0.0 0.0 0.0 0.0 0.0 0.0 Z Z Z Z
+ Blast furnaces 0.0 0.0 0.0 0.0 0.0 0.0 0.0 0.0 Z Z Z Z
+ Gas works 0.0 0.0 0.0 0.0 0.0 0.0 0.0 0.0 Z Z Z Z
+ Refineries & petrochemical industry 11 089.0 Z Z Z Z 11 089.0 Z Z Z Z Z Z
+ Patent fuel plants 0.0 0.0 0.0 0.0 0.0 0.0 Z 0.0 0.0 Z Z Z
+ BKB & PB plants 1.8 0.0 0.0 1.8 0.0 Z Z 0.0 0.0 Z Z Z
+ Coal liquefaction plants 0.0 0.0 0.0 0.0 0.0 Z Z Z Z Z Z Z
+ For blended natural gas 0.0 Z 0.0 Z Z 0.0 Z 0.0 Z Z Z Z
+ Liquid biofuels blended 62.2 Z Z Z Z Z Z 62.2 Z Z Z Z
+ Charcoal production plants 0.5 Z Z Z Z Z Z 0.5 Z Z Z Z
+ Gas-to-liquids plants 0.0 Z Z Z Z Z 0.0 Z Z Z Z Z
+ Not elsewhere specified 0.0 0.0 0.0 0.0 0.0 0.0 0.0 0.0 0.0 Z Z Z
Transformation output 12 585.4 0.0 0.0 1.5 Z 11 044.9 0.0 62.4 Z Z 1 116.5 360.0
+ Electricity & heat generation 1 476.5 Z Z Z Z Z Z Z Z Z 1 116.5 360.0
+ Coke ovens 0.0 0.0 0.0 Z Z Z Z Z Z Z Z Z
+ Blast furnaces 0.0 0.0 0.0 Z Z Z Z Z Z Z Z Z
+ Gas works 0.0 0.0 0.0 Z Z Z Z Z Z Z Z Z
+ Refineries & petrochemical industry 11 044.9 Z Z Z Z 11 044.9 Z 0.0 Z Z Z Z
+ Patent fuel plants 0.0 0.0 Z Z Z Z Z Z Z Z Z Z
+ BKB & PB plants 1.5 0.0 Z 1.5 Z Z Z Z Z Z Z Z
+ Coal liquefaction plants 0.0 Z Z Z Z 0.0 Z Z Z Z Z Z
+ Blended in natural gas 0.0 Z Z Z Z Z 0.0 Z Z Z Z Z
+ Liquid biofuels blended 62.2 Z Z Z Z Z Z 62.2 Z Z Z Z
+ Charcoal production plants 0.2 Z Z Z Z Z Z 0.2 Z Z Z Z
+ Gas-to-liquids plants 0.0 Z Z Z Z 0.0 Z Z Z Z Z Z
+ Not elsewhere specified 0.0 0.0 0.0 0.0 Z 0.0 Z Z Z Z Z Z
Energy sector 622.9 0.0 0.0 0.0 0.0 501.3 18.5 0.0 0.0 Z 9.5 93.7
+ Own use in electricity & heat generation 26.3 0.0 0.0 0.0 0.0 0.5 0.0 0.0 0.0 Z 9.4 16.4
+ Coal mines 0.0 0.0 0.0 0.0 0.0 0.0 0.0 0.0 0.0 Z 0.0 0.0
+ Oil & natural gas extraction plants 1.8 Z Z Z Z 0.2 0.0 0.0 Z Z 0.0 1.5
+ Patent fuel plants 0.0 0.0 0.0 0.0 0.0 Z Z 0.0 0.0 Z 0.0 0.0
+ Coke ovens 0.0 0.0 0.0 0.0 0.0 0.0 0.0 0.0 0.0 Z 0.0 0.0
+ BKB & PB plants 0.8 0.0 0.0 0.0 0.0 Z Z 0.0 0.0 Z 0.1 0.7
+ Gas works 0.0 0.0 0.0 0.0 0.0 0.0 0.0 0.0 0.0 Z 0.0 0.0
+ Blast furnaces 0.0 0.0 0.0 0.0 0.0 0.0 0.0 0.0 0.0 Z 0.0 0.0
+ Petroleum refineries (oil refineries) 553.5 0.0 0.0 0.0 0.0 496.7 1.5 0.0 0.0 Z 0.0 55.2
+ Nuclear industry 0.0 Z Z Z Z Z Z Z Z Z 0.0 0.0
+ Coal liquefaction plants 0.0 0.0 0.0 0.0 0.0 Z Z Z Z Z 0.0 0.0
+ Liquefaction & regasification plants (LNG) 16.4 Z Z Z Z Z 16.4 Z Z Z 0.0 0.0
+ Gasification plants for biogas 0.0 Z Z Z Z Z Z 0.0 0.0 Z 0.0 0.0
+ Gas-to-liquids (GTL) plants 0.0 Z Z Z Z Z 0.0 Z Z Z 0.0 0.0
+ Charcoal production plants 0.0 Z Z Z Z Z Z 0.0 0.0 Z 0.0 0.0
+ Not elsewhere specified (energy) 24.1 0.0 0.0 0.0 0.0 3.8 0.6 0.0 0.0 Z 0.0 19.8
Distribution losses 200.4 0.0 0.0 0.8 0.0 0.9 0.0 0.1 0.2 Z 119.8 78.6
Available for final consumption 6 436.2 161.6 0.0 24.2 0.0 2 230.7 1 565.3 668.8 0.0 0.0 920.6 864.9
Final non-energy consumption 1 208.7 0.0 0.0 0.0 0.0 213.2 995.5 0.0 Z Z Z Z
Final energy consumption 5 241.2 161.6 0.0 24.2 0.0 2 017.5 569.8 682.5 0.0 Z 920.6 864.9
+ Industry 1 070.9 84.6 0.0 1.4 0.0 40.5 291.7 101.0 0.0 Z 239.1 312.6
+ Iron & steel 2.1 0.5 0.0 0.0 0.0 0.0 0.0 0.0 0.0 Z 0.0 1.6
+ Chemical & petrochemical 418.2 0.1 0.0 0.0 0.0 1.0 116.5 16.8 0.0 Z 212.4 71.5
+ Non-ferrous metals 0.1 0.0 0.0 0.0 0.0 0.1 0.0 0.0 0.0 Z 0.0 0.0
+ Non-metallic minerals 134.2 80.9 0.0 0.9 0.0 3.9 23.6 4.0 0.0 Z 0.0 21.0
+ Transport equipment 3.8 0.0 0.0 0.0 0.0 0.1 1.4 0.0 0.0 Z 0.2 2.0
+ Machinery 32.6 0.2 0.0 0.1 0.0 0.2 8.6 0.2 0.0 Z 2.2 21.0
+ Mining & quarrying 5.7 0.0 0.0 0.0 0.0 2.5 0.2 0.4 0.0 Z 0.0 2.7
+ Food, beverages & tobacco 194.2 2.5 0.0 0.2 0.0 14.3 83.0 16.7 0.0 Z 9.9 67.6
+ Paper, pulp & printing 37.5 0.0 0.0 0.0 0.0 0.3 14.0 6.2 0.0 Z 0.5 16.5
+ Wood & wood products 95.2 0.0 0.0 0.1 0.0 2.6 11.3 42.4 0.0 Z 7.5 31.4
+ Construction 42.8 0.3 0.0 0.0 0.0 12.1 14.6 1.7 0.0 Z 2.1 11.9
+ Textile & leather 31.7 0.2 0.0 0.0 0.0 1.1 13.2 0.7 0.0 Z 2.4 14.0
+ Not elsewhere specified (industry) 72.8 0.1 0.0 0.2 0.0 2.3 5.2 12.0 0.0 Z 1.6 51.4
+ Transport 1 962.1 0.0 0.0 0.0 0.0 1 861.0 33.7 61.0 0.0 Z Z 6.4
+ Rail 56.9 0.0 0.0 0.0 0.0 54.1 Z 1.9 0.0 Z Z 1.0
+ Road 1 865.0 Z Z Z Z 1 794.9 7.8 59.1 0.0 Z Z 3.1
+ Domestic aviation 0.5 Z Z Z Z 0.5 Z 0.0 Z Z Z Z
+ Domestic navigation 5.5 0.0 0.0 0.0 0.0 5.5 Z 0.0 0.0 Z Z Z
+ Pipeline transport 28.2 Z Z Z Z 0.0 25.9 0.0 Z Z Z 2.3
+ Not elsewhere specified (transport) 6.0 0.0 0.0 0.0 0.0 6.0 0.0 0.0 0.0 Z Z 0.0
+ Other 2 208.1 76.9 0.0 22.8 0.0 116.0 244.4 520.5 0.0 Z 681.5 546.0
+ Commercial & public services 633.9 33.0 0.0 6.8 0.0 3.2 68.9 35.5 0.0 Z 202.2 284.4
+ Households 1 455.4 41.8 0.0 15.6 0.0 55.2 153.8 470.2 0.0 Z 474.8 244.0
+ Agriculture & forestry 109.2 2.2 0.0 0.5 0.0 48.3 21.8 14.7 0.0 Z 4.6 17.2
+ Fishing 1.1 0.0 0.0 0.0 0.0 0.7 0.0 0.0 0.0 Z 0.0 0.4
+ Not elsewhere specified (other) 8.6 0.0 0.0 0.0 0.0 8.6 0.0 0.0 0.0 Z 0.0 0.0
Statistical differences -13.7 0.0 0.0 0.0 0.0 0.0 0.0 -13.7 0.0 0.0 0.0 0.0
Gross electricity production 338.5 0.0 0.0 0.0 0.0 12.0 51.4 268.0 7.2 0.0 Z Z
Gross heat production 835.5 1.2 0.0 6.2 0.0 7.5 237.5 564.1 18.7 0.0 Z 0.2
Source: Eurostat (nrg_bal_c)
88Energy balance sheets — 2017 data
Electricity
ktoe 2017
Oil and
petroleum
products
Natural
gas
Renewables
and
biofuels
Non-
renewable
waste
Nuclear
heatHeat
LithuaniaTotal
Solid
fossil
fuels
Manufac-
tured
gases
Peat and
peat
products
Oil shale
and oil
sands

2005 2010 2011 2012 2013 2014 2015 2016 2017
Gross available energy 8 923 6 968 7 198 7 264 6 839 6 771 6 985 7 246 7 547
Solid fossil fuels 168 182 210 200 227 196 160 159 163
Peat & peat products 17 24 29 33 41 31 20 25 34
Oil shale & oil sands 0 0 0 0 0 0 0 0 0
Crude oil & other hydrocarbons 9 480 9 486 9 672 9 261 9 799 8 203 9 060 10 009 10 233
Petroleum products -6 649 -6 796 -7 067 -6 616 -7 217 -5 675 -6 384 -7 013 -7 147
Natural gas 2 476 2 492 2 718 2 654 2 165 2 065 2 067 1 842 1 921
Nuclear heat 2 805 0 0 0 0 0 0 0 0
Renewable energies 881 1 065 1 057 1 161 1 212 1 277 1 419 1 464 1 563
Non-renewable wastes 0 0 0 0 15 18 23 49 34
Primary production 3 944 1 311 1 290 1 319 1 415 1 488 1 585 1 621 1 754
Solid fossil fuels 0 0 0 0 0 0 0 0 0
Peat 20 9 12 17 24 28 21 5 7
Oil shale and oil sands 0 0 0 0 0 0 0 0 0
Crude oil & other hydrocarbons 220 118 116 104 88 84 75 65 57
Natural gas 0 0 0 0 0 0 0 0 0
Nuclear heat 2 805 0 0 0 0 0 0 0 0
Renewable energies 900 1 185 1 162 1 198 1 288 1 358 1 466 1 502 1 656
Non-renewable wastes 0 0 0 0 15 18 23 49 34
Net imports 5 049 5 708 5 885 5 845 5 367 5 299 5 478 5 622 5 706
Solid fossil fuels 169 174 233 192 244 192 145 146 176
Crude oil 8 927 9 089 9 043 8 617 9 089 7 565 8 456 9 369 9 880
Gas/Diesel Oil (w/o bio) -2 153 -2 567 -2 675 -2 597 -2 733 -2 044 -2 390 -2 476 -2 525
Motor Gasoline (w/o bio) -2 259 -2 665 -2 706 -2 494 -2 622 -2 114 -2 340 -2 591 -2 736
Naphtha -78 0 0 0 0 0 0 0 0
LPG -203 -74 -55 -34 -81 -49 -114 -146 -175
All other oil & petroleum products -1 588 -1 128 -1 223 -1 028 -1 242 -1 003 -916 -1 223 -1 471
Natural gas 2 493 2 485 2 725 2 656 2 165 2 150 2 061 1 853 1 908
Transformation input 14 580 12 281 12 060 11 727 12 263 10 543 11 589 12 436 12 592
Electricity & heat generation 4 679 2 024 1 678 1 730 1 557 1 450 1 529 1 434 1 438
Refinery intake 9 440 9 486 9 672 9 261 9 796 8 203 9 059 10 009 10 232
Coke ovens 0 0 0 0 0 0 0 0 0
Blast furnaces 0 0 0 0 0 0 0 0 0
Transformation output 12 360 11 859 11 827 11 473 12 073 10 423 11 458 12 327 12 585
Electricity & heat generation 2 463 1 660 1 511 1 543 1 451 1 412 1 415 1 397 1 477
Refinery output 9 413 9 434 9 611 9 199 9 718 8 126 9 052 9 946 10 197
Coke ovens 0 0 0 0 0 0 0 0 0
Blast furnaces 0 0 0 0 0 0 0 0 0
Energy sector 870 702 673 613 627 559 614 633 623
Distribution losses 300 237 216 215 204 196 188 198 200
Available for final consumption 5 345 5 420 5 880 5 998 5 661 5 808 5 896 6 048 6 436
Solid fossil fuels 162 178 207 197 225 194 158 158 162
Manufactured gases 0 0 0 0 0 0 0 0 0
Peat & peat products 12 21 25 30 30 26 19 22 24
Oil shale & oil sands 0 0 0 0 0 0 0 0 0
Gas/Diesel Oil (w/o bio) 860 1 023 1 067 1 110 1 132 1 302 1 388 1 507 1 616
Motor Gasoline (w/o bio) 355 298 260 233 212 206 201 217 215
Naphtha 0 0 0 0 0 0 0 0 0
LPG 301 224 216 210 196 188 175 172 167
All other oil & petroleum products 278 200 204 174 202 155 196 221 233
Natural gas 1 099 1 100 1 567 1 617 1 315 1 396 1 461 1 392 1 565
Primary solid biofuels & charcoal 682 687 678 690 670 635 620 621 598
Liquid biofuels 3 45 45 61 58 63 68 57 61
All other renewable energies 1 6 5 4 5 7 9 10 10
Non-renewable wastes 0 0 0 0 0 0 0 0 0
Electricity 686 716 738 767 770 794 803 838 865
Heat 905 922 869 905 848 839 798 834 921
Statistical difference -11 0 0 0 0 0 0 0 -14
Final non-energy consumption 733 662 1 152 1 159 949 1 007 1 116 1 045 1 209
Final energy consumption 4 622 4 757 4 728 4 839 4 712 4 801 4 780 5 003 5 241
Industry 1 058 950 1 013 1 072 1 037 1 034 983 989 1 071
Transport 1 386 1 497 1 484 1 508 1 502 1 663 1 750 1 865 1 962
Other sectors 2 178 2 311 2 231 2 259 2 173 2 104 2 047 2 150 2 208
Services 562 601 584 610 593 586 575 603 634
Households 1 507 1 593 1 532 1 535 1 467 1 401 1 359 1 433 1 455
Europe 2020-2030 indicators 2005 2010 2011 2012 2013 2014 2015 2016 2017
Gross inland consumption 8 781 6 829 7 058 7 144 6 752 6 760 6 910 7 084 7 372
Primary energy consumption 8 048 6 167 5 906 5 985 5 803 5 752 5 794 6 040 6 163
Final energy consumption 4 669 4 806 4 784 4 902 4 782 4 878 4 861 5 099 5 347
Source: Eurostat (nrg_bal_c)
89
Lithuaniaktoe
Energy balance sheets — 2017 data

Source: Eurostat (nrg_bal_c)
Source: Eurostat (nrg_bal_c)
Note: Please refer to page 23 for related methodological definitions.
Lithuania
90Energy balance sheets — 2017 data
0
5 000
10 000
15 000
20 000
25 000
30 000
35 000
1990 1995 2000 2005 2010 2015 2017
Gross electricity production by fuel, GWh
Solid fossil fuels Oil and petroleum products Natural gas
Renewables and biofuels Nuclear heat Other
0
1 000
2 000
3 000
4 000
5 000
6 000
7 000
8 000
9 000
1990 1995 2000 2005 2010 2015 2017
Gross available energy by fuel, ktoe
Solid fossil fuels Oil and petroleum products Natural gas
Renewables and biofuels Nuclear heat Non-renewable waste
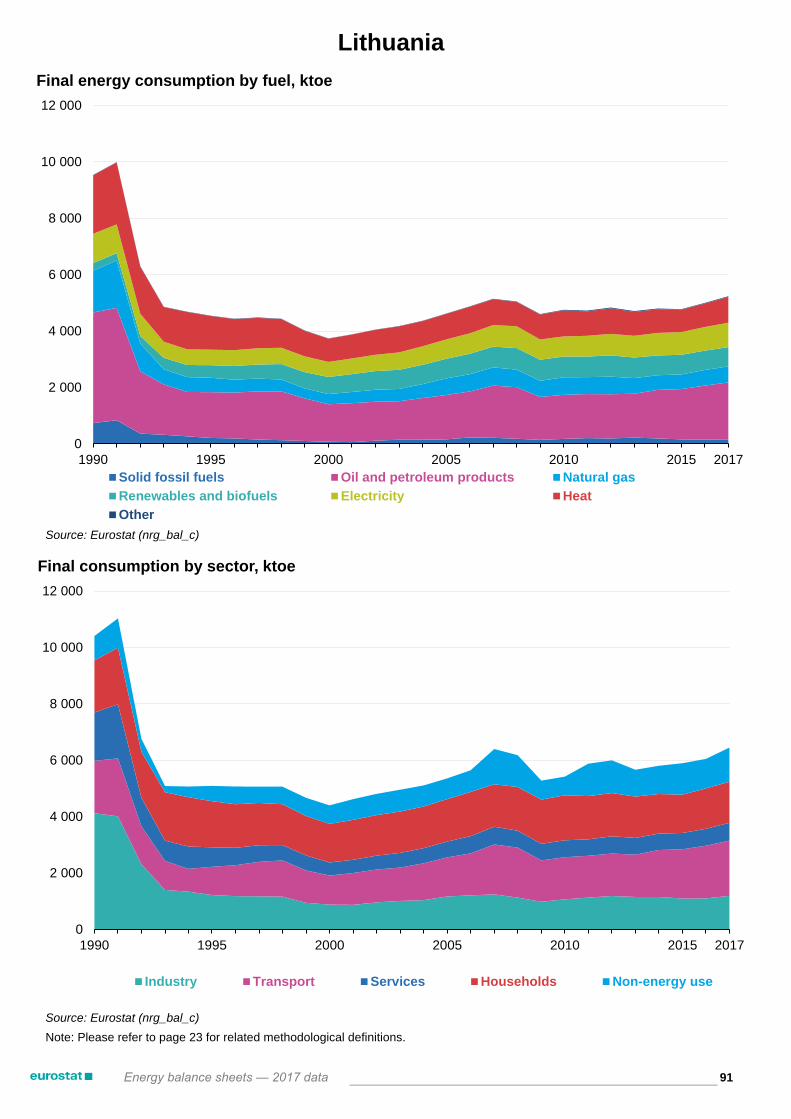
Source: Eurostat (nrg_bal_c)
Source: Eurostat (nrg_bal_c)
Note: Please refer to page 23 for related methodological definitions.
Lithuania
91Energy balance sheets — 2017 data
0
2 000
4 000
6 000
8 000
10 000
12 000
1990 1995 2000 2005 2010 2015 2017
Final energy consumption by fuel, ktoe
Solid fossil fuels Oil and petroleum products Natural gas
Renewables and biofuels Electricity Heat
Other
0
2 000
4 000
6 000
8 000
10 000
12 000
1990 1995 2000 2005 2010 2015 2017
Final consumption by sector, ktoe
Industry Transport Services Households Non-energy use

+ Primary production 192.2 0.0 Z 0.0 0.0 0.0 0.0 155.3 36.9 0.0 Z Z
+ Recovered & recycled products 0.0 0.0 Z 0.0 0.0 0.0 Z 0.0 Z Z Z Z
+ Imports 4 305.4 45.3 0.0 0.0 0.0 2 774.2 693.1 142.1 0.0 Z 0.0 650.6
- Exports 167.3 0.0 0.0 0.0 0.0 25.9 0.0 22.0 0.0 Z 0.0 119.4
+ Change in stock 7.3 0.0 0.0 0.0 0.0 8.0 0.0 -0.7 0.0 Z Z Z
= Gross available energy 4 337.5 45.3 0.0 0.0 0.0 2 756.3 693.1 274.6 36.9 0.0 0.0 531.2
- International maritime bunkers 0.0 0.0 0.0 0.0 0.0 0.0 0.0 0.0 Z Z Z Z
= Gross inland consumption 4 337.5 45.3 0.0 0.0 0.0 2 756.3 693.1 274.6 36.9 0.0 0.0 531.2
- International aviation 574.2 Z Z Z Z 574.2 Z 0.0 Z Z Z Z
= Total energy supply 3 763.3 45.3 0.0 0.0 0.0 2 182.1 693.1 274.6 36.9 0.0 0.0 531.2
Transformation input 358.5 0.0 0.0 0.0 0.0 0.6 74.9 102.2 23.1 0.0 0.0 157.7
+ Electricity & heat generation 353.2 0.0 0.0 0.0 0.0 0.6 74.9 96.9 23.1 0.0 0.0 157.7
+ Coke ovens 0.0 0.0 0.0 0.0 0.0 0.0 0.0 0.0 Z Z Z Z
+ Blast furnaces 0.0 0.0 0.0 0.0 0.0 0.0 0.0 0.0 Z Z Z Z
+ Gas works 0.0 0.0 0.0 0.0 0.0 0.0 0.0 0.0 Z Z Z Z
+ Refineries & petrochemical industry 0.0 Z Z Z Z 0.0 Z Z Z Z Z Z
+ Patent fuel plants 0.0 0.0 0.0 0.0 0.0 0.0 Z 0.0 0.0 Z Z Z
+ BKB & PB plants 0.0 0.0 0.0 0.0 0.0 Z Z 0.0 0.0 Z Z Z
+ Coal liquefaction plants 0.0 0.0 0.0 0.0 0.0 Z Z Z Z Z Z Z
+ For blended natural gas 5.3 Z 0.0 Z Z 0.0 Z 5.3 Z Z Z Z
+ Liquid biofuels blended 0.0 Z Z Z Z Z Z 0.0 Z Z Z Z
+ Charcoal production plants 0.0 Z Z Z Z Z Z 0.0 Z Z Z Z
+ Gas-to-liquids plants 0.0 Z Z Z Z Z 0.0 Z Z Z Z Z
+ Not elsewhere specified 0.0 0.0 0.0 0.0 0.0 0.0 0.0 0.0 0.0 Z Z Z
Transformation output 264.7 0.0 0.0 0.0 Z 0.0 5.3 0.0 Z Z 67.2 192.2
+ Electricity & heat generation 259.4 Z Z Z Z Z Z Z Z Z 67.2 192.2
+ Coke ovens 0.0 0.0 0.0 Z Z Z Z Z Z Z Z Z
+ Blast furnaces 0.0 0.0 0.0 Z Z Z Z Z Z Z Z Z
+ Gas works 0.0 0.0 0.0 Z Z Z Z Z Z Z Z Z
+ Refineries & petrochemical industry 0.0 Z Z Z Z 0.0 Z 0.0 Z Z Z Z
+ Patent fuel plants 0.0 0.0 Z Z Z Z Z Z Z Z Z Z
+ BKB & PB plants 0.0 0.0 Z 0.0 Z Z Z Z Z Z Z Z
+ Coal liquefaction plants 0.0 Z Z Z Z 0.0 Z Z Z Z Z Z
+ Blended in natural gas 5.3 Z Z Z Z Z 5.3 Z Z Z Z Z
+ Liquid biofuels blended 0.0 Z Z Z Z Z Z 0.0 Z Z Z Z
+ Charcoal production plants 0.0 Z Z Z Z Z Z 0.0 Z Z Z Z
+ Gas-to-liquids plants 0.0 Z Z Z Z 0.0 Z Z Z Z Z Z
+ Not elsewhere specified 0.0 0.0 0.0 0.0 Z 0.0 Z Z Z Z Z Z
Energy sector 2.7 0.0 0.0 0.0 0.0 0.1 0.0 0.0 0.0 Z 0.0 2.6
+ Own use in electricity & heat generation 2.7 0.0 0.0 0.0 0.0 0.1 0.0 0.0 0.0 Z 0.0 2.6
+ Coal mines 0.0 0.0 0.0 0.0 0.0 0.0 0.0 0.0 0.0 Z 0.0 0.0
+ Oil & natural gas extraction plants 0.0 Z Z Z Z 0.0 0.0 0.0 Z Z 0.0 0.0
+ Patent fuel plants 0.0 0.0 0.0 0.0 0.0 Z Z 0.0 0.0 Z 0.0 0.0
+ Coke ovens 0.0 0.0 0.0 0.0 0.0 0.0 0.0 0.0 0.0 Z 0.0 0.0
+ BKB & PB plants 0.0 0.0 0.0 0.0 0.0 Z Z 0.0 0.0 Z 0.0 0.0
+ Gas works 0.0 0.0 0.0 0.0 0.0 0.0 0.0 0.0 0.0 Z 0.0 0.0
+ Blast furnaces 0.0 0.0 0.0 0.0 0.0 0.0 0.0 0.0 0.0 Z 0.0 0.0
+ Petroleum refineries (oil refineries) 0.0 0.0 0.0 0.0 0.0 0.0 0.0 0.0 0.0 Z 0.0 0.0
+ Nuclear industry 0.0 Z Z Z Z Z Z Z Z Z 0.0 0.0
+ Coal liquefaction plants 0.0 0.0 0.0 0.0 0.0 Z Z Z Z Z 0.0 0.0
+ Liquefaction & regasification plants (LNG) 0.0 Z Z Z Z Z 0.0 Z Z Z 0.0 0.0
+ Gasification plants for biogas 0.0 Z Z Z Z Z Z 0.0 0.0 Z 0.0 0.0
+ Gas-to-liquids (GTL) plants 0.0 Z Z Z Z Z 0.0 Z Z Z 0.0 0.0
+ Charcoal production plants 0.0 Z Z Z Z Z Z 0.0 0.0 Z 0.0 0.0
+ Not elsewhere specified (energy) 0.0 0.0 0.0 0.0 0.0 0.0 0.0 0.0 0.0 Z 0.0 0.0
Distribution losses 20.3 0.0 0.0 0.0 0.0 0.0 0.0 0.0 0.0 Z 6.9 13.4
Available for final consumption 3 646.5 45.3 0.0 0.0 0.0 2 181.5 623.6 172.3 13.8 0.0 60.3 549.7
Final non-energy consumption 34.2 0.0 0.0 0.0 0.0 34.2 0.0 0.0 Z Z Z Z
Final energy consumption 3 614.8 45.3 0.0 0.0 0.0 2 148.7 623.6 173.3 13.8 Z 60.3 549.8
+ Industry 642.0 45.0 0.0 0.0 0.0 13.1 273.8 22.2 13.8 Z 0.5 273.7
+ Iron & steel 297.3 3.6 0.0 0.0 0.0 0.7 135.1 0.0 0.0 Z 0.1 157.9
+ Chemical & petrochemical 45.2 0.0 0.0 0.0 0.0 0.1 17.6 0.0 0.0 Z 0.1 27.4
+ Non-ferrous metals 0.0 0.0 0.0 0.0 0.0 0.0 0.0 0.0 0.0 Z 0.0 0.0
+ Non-metallic minerals 140.2 36.6 0.0 0.0 0.0 2.2 66.2 4.8 13.8 Z 0.0 16.6
+ Transport equipment 1.4 0.0 0.0 0.0 0.0 0.0 0.5 0.0 0.0 Z 0.0 0.9
+ Machinery 10.7 0.0 0.0 0.0 0.0 1.4 2.9 0.0 0.0 Z 0.0 6.4
+ Mining & quarrying 1.8 0.0 0.0 0.0 0.0 0.7 0.2 0.0 0.0 Z 0.0 0.8
+ Food, beverages & tobacco 21.3 0.0 0.0 0.0 0.0 1.8 6.9 0.0 0.0 Z 0.0 12.6
+ Paper, pulp & printing 5.0 0.0 0.0 0.0 0.0 0.0 2.2 0.0 0.0 Z 0.0 2.8
+ Wood & wood products 19.7 0.0 0.0 0.0 0.0 0.0 1.9 17.4 0.0 Z 0.0 0.4
+ Construction 24.9 4.7 0.0 0.0 0.0 3.0 4.7 0.0 0.0 Z 0.0 12.5
+ Textile & leather 35.0 0.0 0.0 0.0 0.0 0.2 27.5 0.0 0.0 Z 0.2 7.2
+ Not elsewhere specified (industry) 39.4 0.0 0.0 0.0 0.0 2.8 8.3 0.0 0.0 Z 0.1 28.2
+ Transport 1 968.2 0.0 0.0 0.0 0.0 1 843.3 0.0 113.4 0.0 Z Z 11.6
+ Rail 26.6 0.0 0.0 0.0 0.0 15.1 Z 0.0 0.0 Z Z 11.5
+ Road 1 941.4 Z Z Z Z 1 827.9 0.0 113.4 0.0 Z Z 0.1
+ Domestic aviation 0.2 Z Z Z Z 0.2 Z 0.0 Z Z Z Z
+ Domestic navigation 0.0 0.0 0.0 0.0 0.0 0.0 Z 0.0 0.0 Z Z Z
+ Pipeline transport 0.0 Z Z Z Z 0.0 0.0 0.0 Z Z Z 0.0
+ Not elsewhere specified (transport) 0.0 0.0 0.0 0.0 0.0 0.0 0.0 0.0 0.0 Z Z 0.0
+ Other 1 004.6 0.4 0.0 0.0 0.0 292.4 349.8 37.7 0.0 Z 59.8 264.5
+ Commercial & public services 455.5 0.0 0.0 0.0 0.0 101.4 111.5 1.1 0.0 Z 59.8 181.7
+ Households 523.2 0.4 0.0 0.0 0.0 171.4 238.3 33.0 0.0 Z 0.0 80.0
+ Agriculture & forestry 25.9 0.0 0.0 0.0 0.0 19.5 0.0 3.6 0.0 Z 0.0 2.8
+ Fishing 0.0 0.0 0.0 0.0 0.0 0.0 0.0 0.0 0.0 Z 0.0 0.0
+ Not elsewhere specified (other) 0.0 0.0 0.0 0.0 0.0 0.0 0.0 0.0 0.0 Z 0.0 0.0
Statistical differences -2.4 0.0 0.0 0.0 0.0 -1.4 0.0 -1.0 0.0 0.0 0.0 -0.1
Gross electricity production 192.2 0.0 0.0 0.0 0.0 0.0 19.0 166.5 6.6 0.0 Z Z
Gross heat production 67.2 0.0 0.0 0.0 0.0 0.3 41.2 25.7 0.0 0.0 Z 0.0
Source: Eurostat (nrg_bal_c)
92Energy balance sheets — 2017 data
Electricity
ktoe 2017
Oil and
petroleum
products
Natural
gas
Renewables
and
biofuels
Non-
renewable
waste
Nuclear
heatHeat
LuxembourgTotal
Solid
fossil
fuels
Manufac-
tured
gases
Peat and
peat
products
Oil shale
and oil
sands

2005 2010 2011 2012 2013 2014 2015 2016 2017
Gross available energy 4 802 4 646 4 570 4 461 4 337 4 224 4 180 4 194 4 338
Solid fossil fuels 78 67 58 54 48 53 49 52 45
Peat & peat products 0 0 0 0 0 0 0 0 0
Oil shale & oil sands 0 0 0 0 0 0 0 0 0
Crude oil & other hydrocarbons 0 0 0 0 0 0 0 0 0
Petroleum products 3 161 2 872 2 934 2 831 2 784 2 684 2 637 2 633 2 756
Natural gas 1 176 1 197 1 032 1 051 890 843 769 709 693
Nuclear heat 0 0 0 0 0 0 0 0 0
Renewable energies 71 130 127 139 156 190 210 224 275
Non-renewable wastes 35 31 32 32 34 33 34 34 37
Primary production 107 119 114 124 134 154 153 163 192
Solid fossil fuels 0 0 0 0 0 0 0 0 0
Peat 0 0 0 0 0 0 0 0 0
Oil shale and oil sands 0 0 0 0 0 0 0 0 0
Crude oil & other hydrocarbons 0 0 0 0 0 0 0 0 0
Natural gas 0 0 0 0 0 0 0 0 0
Nuclear heat 0 0 0 0 0 0 0 0 0
Renewable energies 72 88 82 92 100 122 119 129 155
Non-renewable wastes 35 31 32 32 34 33 34 34 37
Net imports 4 676 4 508 4 446 4 350 4 213 4 077 4 009 4 033 4 138
Solid fossil fuels 78 67 58 54 48 53 49 52 45
Crude oil 0 0 0 0 0 0 0 0 0
Gas/Diesel Oil (w/o bio) 2 157 2 014 2 106 2 059 2 043 1 923 1 833 1 788 1 826
Motor Gasoline (w/o bio) 507 357 368 358 325 314 283 289 301
Naphtha 0 0 0 0 0 0 0 0 0
LPG 13 13 11 11 11 11 11 11 10
All other oil & petroleum products 464 470 440 415 414 443 492 546 611
Natural gas 1 176 1 197 1 032 1 051 890 843 769 709 693
Transformation input 688 736 616 636 487 483 432 344 358
Electricity & heat generation 688 736 615 632 484 479 427 340 353
Refinery intake 0 0 0 0 0 0 0 0 0
Coke ovens 0 0 0 0 0 0 0 0 0
Blast furnaces 0 0 0 0 0 0 0 0 0
Transformation output 430 469 396 406 330 319 299 252 265
Electricity & heat generation 430 469 395 402 326 315 294 247 259
Refinery output 0 0 0 0 0 0 0 0 0
Coke ovens 0 0 0 0 0 0 0 0 0
Blast furnaces 0 0 0 0 0 0 0 0 0
Energy sector 3 3 2 3 3 2 3 3 3
Distribution losses 13 15 18 18 18 18 19 19 20
Available for final consumption 4 096 3 930 3 926 3 838 3 785 3 634 3 569 3 572 3 647
Solid fossil fuels 78 67 58 54 48 53 49 52 45
Manufactured gases 0 0 0 0 0 0 0 0 0
Peat & peat products 0 0 0 0 0 0 0 0 0
Oil shale & oil sands 0 0 0 0 0 0 0 0 0
Gas/Diesel Oil (w/o bio) 2 166 2 031 2 111 2 044 2 032 1 916 1 840 1 791 1 834
Motor Gasoline (w/o bio) 515 362 369 359 327 315 293 285 301
Naphtha 0 0 0 0 0 0 0 0 0
LPG 13 13 10 11 12 11 11 11 10
All other oil & petroleum products 32 36 39 43 39 37 35 38 37
Natural gas 631 675 601 611 601 575 602 633 624
Primary solid biofuels & charcoal 38 46 39 40 43 48 47 50 48
Liquid biofuels 1 42 47 48 55 70 83 89 113
All other renewable energies 4 7 7 8 8 8 9 11 11
Non-renewable wastes 17 14 14 14 15 15 14 13 14
Electricity 528 567 558 535 532 532 536 547 550
Heat 73 71 72 70 73 56 51 53 60
Statistical difference 22 0 1 -1 -1 0 -1 -2 -2
Final non-energy consumption 28 32 36 41 37 35 33 36 34
Final energy consumption 4 045 3 897 3 889 3 799 3 749 3 599 3 537 3 538 3 615
Industry 781 755 725 679 647 657 646 674 642
Transport 2 350 2 176 2 308 2 207 2 166 2 086 1 958 1 907 1 968
Other sectors 915 966 856 913 937 856 933 957 1 005
Services 367 424 353 397 411 361 397 401 455
Households 526 513 478 491 499 469 511 527 523
Europe 2020-2030 indicators 2005 2010 2011 2012 2013 2014 2015 2016 2017
Gross inland consumption 4 802 4 645 4 568 4 459 4 335 4 222 4 177 4 190 4 333
Primary energy consumption 4 774 4 613 4 532 4 418 4 298 4 187 4 144 4 154 4 299
Final energy consumption 4 478 4 327 4 291 4 169 4 121 4 003 3 991 4 042 4 184
Source: Eurostat (nrg_bal_c)
93
Luxembourgktoe
Energy balance sheets — 2017 data

Source: Eurostat (nrg_bal_c)
Source: Eurostat (nrg_bal_c)
Note: Please refer to page 23 for related methodological definitions.
Luxembourg
94Energy balance sheets — 2017 data
0
500
1 000
1 500
2 000
2 500
3 000
3 500
4 000
4 500
5 000
1990 1995 2000 2005 2010 2015 2017
Gross electricity production by fuel, GWh
Solid fossil fuels Oil and petroleum products Natural gas
Renewables and biofuels Nuclear heat Other
0
500
1 000
1 500
2 000
2 500
3 000
3 500
1990 1995 2000 2005 2010 2015 2017
Gross available energy by fuel, ktoe
Solid fossil fuels Oil and petroleum products Natural gas
Renewables and biofuels Nuclear heat Non-renewable waste

Source: Eurostat (nrg_bal_c)
Source: Eurostat (nrg_bal_c)
Note: Please refer to page 23 for related methodological definitions.
Luxembourg
95Energy balance sheets — 2017 data
0
500
1 000
1 500
2 000
2 500
3 000
3 500
4 000
4 500
1990 1995 2000 2005 2010 2015 2017
Final energy consumption by fuel, ktoe
Solid fossil fuels Oil and petroleum products Natural gas
Renewables and biofuels Electricity Heat
Other
0
500
1 000
1 500
2 000
2 500
3 000
3 500
4 000
4 500
1990 1995 2000 2005 2010 2015 2017
Final consumption by sector, ktoe
Industry Transport Services Households Non-energy use

+ Primary production 11 147.2 1 283.2 Z 0.0 0.0 1 048.4 1 410.7 3 190.7 130.2 4 084.0 Z Z
+ Recovered & recycled products 0.0 0.0 Z 0.0 0.0 0.0 Z 0.0 Z Z Z Z
+ Imports 24 123.4 1 259.4 0.0 0.0 0.0 9 738.8 11 163.4 225.4 33.7 Z 0.0 1 702.8
- Exports 7 429.1 273.6 0.0 0.0 0.0 3 159.9 2 941.9 458.3 0.0 Z 0.0 595.4
+ Change in stock -1 162.1 -34.3 0.0 0.0 0.0 -31.8 -1 090.4 -5.6 0.0 Z Z Z
= Gross available energy 26 679.4 2 234.7 0.0 0.0 0.0 7 595.5 8 541.8 2 952.2 163.9 4 084.0 0.0 1 107.3
- International maritime bunkers 0.0 0.0 0.0 0.0 0.0 0.0 0.0 0.0 Z Z Z Z
= Gross inland consumption 26 679.4 2 234.7 0.0 0.0 0.0 7 595.5 8 541.8 2 952.2 163.9 4 084.0 0.0 1 107.3
- International aviation 223.5 Z Z Z Z 223.5 Z 0.0 Z Z Z Z
= Total energy supply 26 455.9 2 234.7 0.0 0.0 0.0 7 372.0 8 541.8 2 952.2 163.9 4 084.0 0.0 1 107.3
Transformation input 18 081.3 2 668.6 169.3 0.0 0.0 7 908.3 2 206.2 959.9 85.0 4 084.0 0.0 0.0
+ Electricity & heat generation 8 526.1 1 258.2 169.3 0.0 0.0 27.3 2 044.5 857.8 85.0 4 084.0 0.0 0.0
+ Coke ovens 947.9 947.9 0.0 0.0 0.0 0.0 0.0 0.0 Z Z Z Z
+ Blast furnaces 495.2 462.5 0.0 0.0 0.0 0.0 32.8 0.0 Z Z Z Z
+ Gas works 0.0 0.0 0.0 0.0 0.0 0.0 0.0 0.0 Z Z Z Z
+ Refineries & petrochemical industry 7 881.0 Z Z Z Z 7 881.0 Z Z Z Z Z Z
+ Patent fuel plants 0.0 0.0 0.0 0.0 0.0 0.0 Z 0.0 0.0 Z Z Z
+ BKB & PB plants 0.0 0.0 0.0 0.0 0.0 Z Z 0.0 0.0 Z Z Z
+ Coal liquefaction plants 0.0 0.0 0.0 0.0 0.0 Z Z Z Z Z Z Z
+ For blended natural gas 0.0 Z 0.0 Z Z 0.0 Z 0.0 Z Z Z Z
+ Liquid biofuels blended 102.0 Z Z Z Z Z Z 102.0 Z Z Z Z
+ Charcoal production plants 0.0 Z Z Z Z Z Z 0.0 Z Z Z Z
+ Gas-to-liquids plants 0.0 Z Z Z Z Z 0.0 Z Z Z Z Z
+ Not elsewhere specified 129.0 0.0 0.0 0.0 0.0 0.0 129.0 0.0 0.0 Z Z Z
Transformation output 13 136.0 715.1 384.1 0.0 Z 7 850.1 0.0 102.0 Z Z 1 258.2 2 826.4
+ Electricity & heat generation 4 084.6 Z Z Z Z Z Z Z Z Z 1 258.2 2 826.4
+ Coke ovens 911.3 715.1 196.2 Z Z Z Z Z Z Z Z Z
+ Blast furnaces 174.9 0.0 174.9 Z Z Z Z Z Z Z Z Z
+ Gas works 0.0 0.0 0.0 Z Z Z Z Z Z Z Z Z
+ Refineries & petrochemical industry 7 818.5 Z Z Z Z 7 818.5 Z 0.0 Z Z Z Z
+ Patent fuel plants 0.0 0.0 Z Z Z Z Z Z Z Z Z Z
+ BKB & PB plants 0.0 0.0 Z 0.0 Z Z Z Z Z Z Z Z
+ Coal liquefaction plants 0.0 Z Z Z Z 0.0 Z Z Z Z Z Z
+ Blended in natural gas 0.0 Z Z Z Z Z 0.0 Z Z Z Z Z
+ Liquid biofuels blended 102.0 Z Z Z Z Z Z 102.0 Z Z Z Z
+ Charcoal production plants 0.0 Z Z Z Z Z Z 0.0 Z Z Z Z
+ Gas-to-liquids plants 31.5 Z Z Z Z 31.5 Z Z Z Z Z Z
+ Not elsewhere specified 13.1 0.0 13.1 0.0 Z 0.0 Z Z Z Z Z Z
Energy sector 1 055.1 0.0 72.9 0.0 0.0 343.7 217.7 13.9 0.0 Z 118.9 288.0
+ Own use in electricity & heat generation 304.9 0.0 0.0 0.0 0.0 0.0 0.0 0.0 0.0 Z 116.2 188.7
+ Coal mines 20.6 0.0 0.0 0.0 0.0 0.0 0.0 0.0 0.0 Z 0.0 20.6
+ Oil & natural gas extraction plants 74.6 Z Z Z Z 0.0 53.1 0.0 Z Z 0.0 21.5
+ Patent fuel plants 0.0 0.0 0.0 0.0 0.0 Z Z 0.0 0.0 Z 0.0 0.0
+ Coke ovens 81.1 0.0 72.9 0.0 0.0 0.0 0.0 0.0 0.0 Z 2.7 5.4
+ BKB & PB plants 0.0 0.0 0.0 0.0 0.0 Z Z 0.0 0.0 Z 0.0 0.0
+ Gas works 0.0 0.0 0.0 0.0 0.0 0.0 0.0 0.0 0.0 Z 0.0 0.0
+ Blast furnaces 0.0 0.0 0.0 0.0 0.0 0.0 0.0 0.0 0.0 Z 0.0 0.0
+ Petroleum refineries (oil refineries) 560.0 0.0 0.0 0.0 0.0 343.7 164.6 0.0 0.0 Z 0.0 51.8
+ Nuclear industry 0.0 Z Z Z Z Z Z Z Z Z 0.0 0.0
+ Coal liquefaction plants 0.0 0.0 0.0 0.0 0.0 Z Z Z Z Z 0.0 0.0
+ Liquefaction & regasification plants (LNG) 0.0 Z Z Z Z Z 0.0 Z Z Z 0.0 0.0
+ Gasification plants for biogas 13.9 Z Z Z Z Z Z 13.9 0.0 Z 0.0 0.0
+ Gas-to-liquids (GTL) plants 0.0 Z Z Z Z Z 0.0 Z Z Z 0.0 0.0
+ Charcoal production plants 0.0 Z Z Z Z Z Z 0.0 0.0 Z 0.0 0.0
+ Not elsewhere specified (energy) 0.0 0.0 0.0 0.0 0.0 0.0 0.0 0.0 0.0 Z 0.0 0.0
Distribution losses 522.1 0.0 14.8 0.0 0.0 0.0 107.5 0.0 0.0 Z 102.6 297.2
Available for final consumption 19 933.5 281.2 127.2 0.0 0.0 6 970.0 6 010.4 2 080.4 78.9 0.0 1 036.7 3 348.6
Final non-energy consumption 2 186.2 4.5 0.0 0.0 0.0 1 624.6 557.0 0.0 Z Z Z Z
Final energy consumption 17 975.0 283.7 127.2 0.0 0.0 5 345.5 5 710.0 2 080.4 78.9 Z 1 040.1 3 309.3
+ Industry 4 347.2 140.3 127.2 0.0 0.0 664.6 1 362.6 178.9 75.6 Z 359.5 1 438.6
+ Iron & steel 302.0 37.9 127.2 0.0 0.0 2.0 56.3 0.2 0.0 Z 19.3 59.2
+ Chemical & petrochemical 1 153.1 0.0 0.0 0.0 0.0 357.0 259.8 1.1 0.3 Z 246.3 288.7
+ Non-ferrous metals 129.5 0.0 0.0 0.0 0.0 2.1 81.7 0.0 0.0 Z 8.8 36.9
+ Non-metallic minerals 539.4 33.9 0.0 0.0 0.0 95.7 193.5 25.8 65.4 Z 4.0 121.1
+ Transport equipment 236.7 0.0 0.0 0.0 0.0 3.2 73.3 0.3 0.0 Z 12.0 147.8
+ Machinery 437.7 0.7 0.0 0.0 0.0 9.6 181.3 3.6 0.0 Z 6.1 236.5
+ Mining & quarrying 28.5 0.0 0.0 0.0 0.0 16.4 3.5 0.0 0.0 Z 0.0 8.6
+ Food, beverages & tobacco 619.5 1.4 0.0 0.0 0.0 12.9 294.2 68.0 0.0 Z 31.4 211.5
+ Paper, pulp & printing 238.9 63.6 0.0 0.0 0.0 3.1 45.9 20.6 9.9 Z 20.0 75.9
+ Wood & wood products 91.0 0.0 0.0 0.0 0.0 6.2 10.4 44.5 0.0 Z 0.8 29.0
+ Construction 239.3 2.4 0.0 0.0 0.0 153.1 48.5 3.8 0.0 Z 2.8 28.7
+ Textile & leather 41.6 0.0 0.0 0.0 0.0 0.0 20.9 0.5 0.0 Z 0.5 19.7
+ Not elsewhere specified (industry) 288.1 0.4 0.0 0.0 0.0 3.2 93.4 8.6 0.0 Z 7.5 175.2
+ Transport 4 525.8 0.0 0.0 0.0 0.0 4 207.4 66.0 148.4 0.0 Z Z 104.0
+ Rail 143.9 0.0 0.0 0.0 0.0 43.0 Z 0.0 0.0 Z Z 100.9
+ Road 4 318.5 Z Z Z Z 4 159.2 8.7 148.4 0.0 Z Z 2.2
+ Domestic aviation 0.0 Z Z Z Z 0.0 Z 0.0 Z Z Z Z
+ Domestic navigation 5.1 0.0 0.0 0.0 0.0 5.1 Z 0.0 0.0 Z Z Z
+ Pipeline transport 58.2 Z Z Z Z 0.0 57.3 0.0 Z Z Z 0.9
+ Not elsewhere specified (transport) 0.0 0.0 0.0 0.0 0.0 0.0 0.0 0.0 0.0 Z Z 0.0
+ Other 9 102.0 143.4 0.0 0.0 0.0 473.5 4 281.4 1 753.1 3.2 Z 680.6 1 766.7
+ Commercial & public services 2 155.7 1.5 0.0 0.0 0.0 30.1 1 170.3 55.9 3.2 Z 179.0 715.6
+ Households 6 298.5 141.6 0.0 0.0 0.0 74.9 2 971.7 1 644.3 0.0 Z 498.7 967.2
+ Agriculture & forestry 610.6 0.3 0.0 0.0 0.0 358.2 122.5 52.9 0.0 Z 0.4 76.3
+ Fishing 2.3 0.0 0.0 0.0 0.0 1.0 0.1 0.0 0.0 Z 0.0 1.2
+ Not elsewhere specified (other) 34.9 0.0 0.0 0.0 0.0 9.2 16.8 0.0 0.0 Z 2.5 6.4
Statistical differences -227.7 -7.0 0.0 0.0 0.0 0.0 -256.6 0.0 0.0 0.0 -3.4 39.3
Gross electricity production 2 819.3 424.1 14.3 0.0 0.0 7.3 673.9 298.2 17.4 1 384.2 Z Z
Gross heat production 1 196.4 21.3 83.3 0.0 0.0 3.9 857.7 190.7 19.8 19.8 Z 0.0
Source: Eurostat (nrg_bal_c)
96Energy balance sheets — 2017 data
Electricity
ktoe 2017
Oil and
petroleum
products
Natural
gas
Renewables
and
biofuels
Non-
renewable
waste
Nuclear
heatHeat
HungaryTotal
Solid
fossil
fuels
Manufac-
tured
gases
Peat and
peat
products
Oil shale
and oil
sands

2005 2010 2011 2012 2013 2014 2015 2016 2017
Gross available energy 28 523 26 592 26 063 24 771 23 920 23 823 25 203 25 585 26 679
Solid fossil fuels 3 070 2 703 2 708 2 604 2 266 2 209 2 359 2 189 2 235
Peat & peat products 0 0 0 0 0 0 0 0 0
Oil shale & oil sands 0 0 0 0 0 0 0 0 0
Crude oil & other hydrocarbons 7 683 6 941 7 181 6 794 6 528 7 208 7 156 7 145 7 038
Petroleum products -228 -143 -704 -717 -663 -627 -125 -104 558
Natural gas 12 094 9 815 9 354 8 377 7 704 6 982 7 490 8 028 8 542
Nuclear heat 3 616 3 963 3 965 3 986 3 870 3 937 3 994 4 071 4 084
Renewable energies 1 690 2 778 2 886 2 953 3 112 2 860 3 020 3 005 2 952
Non-renewable wastes 62 88 100 89 83 102 132 158 164
Primary production 10 888 11 707 11 635 11 613 11 298 10 880 11 105 11 280 11 147
Solid fossil fuels 1 748 1 593 1 645 1 606 1 612 1 588 1 518 1 462 1 283
Peat 0 0 0 0 0 0 0 0 0
Oil shale and oil sands 0 0 0 0 0 0 0 0 0
Crude oil & other hydrocarbons 1 441 1 084 958 1 030 877 837 866 992 1 048
Natural gas 2 331 2 235 2 115 1 768 1 544 1 437 1 369 1 429 1 411
Nuclear heat 3 616 3 963 3 965 3 986 3 870 3 937 3 994 4 071 4 084
Renewable energies 1 690 2 744 2 857 3 133 3 314 2 981 3 250 3 200 3 191
Non-renewable wastes 62 88 94 88 81 99 107 125 130
Net imports 17 730 15 139 13 102 12 422 11 989 14 257 13 578 14 280 16 694
Solid fossil fuels 1 303 1 132 980 888 601 616 795 711 986
Crude oil 6 126 5 722 5 877 5 440 5 307 6 038 6 105 5 927 5 814
Gas/Diesel Oil (w/o bio) -39 319 34 -217 -120 -149 291 274 210
Motor Gasoline (w/o bio) 185 184 37 79 82 135 162 264 276
Naphtha 166 218 206 153 261 230 304 213 495
LPG -30 80 81 116 115 187 277 310 402
All other oil & petroleum products -324 -723 -851 -588 -645 -631 -551 -669 -618
Natural gas 9 807 7 726 6 133 6 054 5 557 6 819 5 218 6 332 8 221
Transformation input 21 656 23 012 21 805 20 903 19 569 19 446 18 915 18 188 18 081
Electricity & heat generation 9 904 9 722 9 319 9 048 8 132 7 946 8 193 8 432 8 526
Refinery intake 8 455 8 560 8 286 7 883 7 704 8 011 7 546 7 393 7 214
Coke ovens 632 1 065 1 067 1 013 908 913 950 876 948
Blast furnaces 464 526 515 473 257 340 483 337 495
Transformation output 15 670 17 080 16 094 15 435 14 785 14 663 13 981 13 367 13 136
Electricity & heat generation 4 593 4 479 4 273 4 160 3 779 3 674 3 855 4 032 4 085
Refinery output 8 092 8 387 8 132 7 741 7 570 7 853 7 379 7 325 7 151
Coke ovens 564 985 1 013 979 865 872 921 847 911
Blast furnaces 148 185 172 171 90 122 168 116 175
Energy sector 1 102 966 950 822 900 1 020 959 1 038 1 055
Distribution losses 830 603 569 530 521 515 516 502 522
Available for final consumption 20 344 18 861 18 600 17 785 17 552 17 334 18 618 19 031 19 933
Solid fossil fuels 477 249 257 223 166 117 208 208 281
Manufactured gases 108 149 146 133 82 102 136 88 127
Peat & peat products 0 0 0 0 0 0 0 0 0
Oil shale & oil sands 0 0 0 0 0 0 0 0 0
Gas/Diesel Oil (w/o bio) 2 883 2 882 2 670 2 477 2 433 2 734 3 073 3 144 3 395
Motor Gasoline (w/o bio) 1 568 1 348 1 245 1 235 1 159 1 243 1 283 1 388 1 366
Naphtha 964 929 988 915 902 876 943 938 1 107
LPG 382 386 361 346 467 513 585 478 542
All other oil & petroleum products 642 446 461 475 303 536 528 493 560
Natural gas 8 047 6 435 6 233 5 513 5 536 5 120 5 461 5 776 6 010
Primary solid biofuels & charcoal 1 072 1 695 1 944 2 085 2 169 1 797 1 921 1 891 1 820
Liquid biofuels 3 175 160 155 142 188 175 187 148
All other renewable energies 83 104 109 113 120 88 80 78 112
Non-renewable wastes 26 32 38 35 33 48 60 64 79
Electricity 2 781 2 941 2 973 3 030 2 999 3 073 3 181 3 232 3 349
Heat 1 308 1 089 1 013 1 050 1 042 899 985 1 066 1 037
Statistical difference 10 7 11 144 -218 -327 -198 -229 -228
Final non-energy consumption 2 170 1 974 1 672 1 637 1 515 1 828 1 905 1 848 2 186
Final energy consumption 18 165 16 880 16 918 16 004 16 255 15 832 16 911 17 412 17 975
Industry 3 098 2 605 2 998 3 182 3 726 3 762 3 948 4 045 4 347
Transport 4 036 4 089 3 813 3 692 3 460 3 873 4 181 4 342 4 526
Other sectors 11 030 10 185 10 106 9 129 9 070 8 197 8 781 9 024 9 102
Services 3 501 3 049 3 054 2 354 2 337 2 115 2 204 2 183 2 156
Households 6 969 6 649 6 570 6 376 6 210 5 487 5 970 6 157 6 299
Europe 2020-2030 indicators 2005 2010 2011 2012 2013 2014 2015 2016 2017
Gross inland consumption 28 523 26 592 26 063 24 771 23 920 23 823 25 203 25 585 26 667
Primary energy consumption 26 353 24 618 24 391 23 134 22 405 21 995 23 298 23 736 24 481
Final energy consumption 18 742 17 450 17 493 16 473 16 584 16 221 17 400 17 825 18 506
Source: Eurostat (nrg_bal_c)
97
Hungaryktoe
Energy balance sheets — 2017 data

Source: Eurostat (nrg_bal_c)
Source: Eurostat (nrg_bal_c)
Note: Please refer to page 23 for related methodological definitions.
Hungary
98Energy balance sheets — 2017 data
0
5 000
10 000
15 000
20 000
25 000
30 000
35 000
40 000
45 000
1990 1995 2000 2005 2010 2015 2017
Gross electricity production by fuel, GWh
Solid fossil fuels Oil and petroleum products Natural gas
Renewables and biofuels Nuclear heat Other
0
2 000
4 000
6 000
8 000
10 000
12 000
14 000
1990 1995 2000 2005 2010 2015 2017
Gross available energy by fuel, ktoe
Solid fossil fuels Oil and petroleum products Natural gas
Renewables and biofuels Nuclear heat Non-renewable waste

Source: Eurostat (nrg_bal_c)
Source: Eurostat (nrg_bal_c)
Note: Please refer to page 23 for related methodological definitions.
Hungary
99Energy balance sheets — 2017 data
0
2 000
4 000
6 000
8 000
10 000
12 000
14 000
16 000
18 000
20 000
1990 1995 2000 2005 2010 2015 2017
Final energy consumption by fuel, ktoe
Solid fossil fuels Oil and petroleum products Natural gas
Renewables and biofuels Electricity Heat
Other
0
5 000
10 000
15 000
20 000
25 000
1990 1995 2000 2005 2010 2015 2017
Final consumption by sector, ktoe
Industry Transport Services Households Non-energy use

+ Primary production 30.3 0.0 Z 0.0 0.0 0.0 0.0 30.3 0.0 0.0 Z Z
+ Recovered & recycled products 0.0 0.0 Z 0.0 0.0 0.0 Z 0.0 Z Z Z Z
+ Imports 3 179.2 0.0 0.0 0.0 0.0 2 840.9 254.3 6.9 0.0 Z 0.0 77.1
- Exports 154.0 0.0 0.0 0.0 0.0 151.0 0.0 0.0 0.0 Z 0.0 3.1
+ Change in stock -116.7 0.0 0.0 0.0 0.0 -107.2 -12.6 3.1 0.0 Z Z Z
= Gross available energy 2 938.8 0.0 0.0 0.0 0.0 2 582.7 241.7 40.3 0.0 0.0 0.0 74.1
- International maritime bunkers 2 109.6 0.0 0.0 0.0 0.0 2 109.6 0.0 0.0 Z Z Z Z
= Gross inland consumption 829.2 0.0 0.0 0.0 0.0 473.1 241.7 40.3 0.0 0.0 0.0 74.1
- International aviation 139.4 Z Z Z Z 139.4 Z 0.0 Z Z Z Z
= Total energy supply 689.8 0.0 0.0 0.0 0.0 333.7 241.7 40.3 0.0 0.0 0.0 74.1
Transformation input 305.6 0.0 0.0 0.0 0.0 51.6 231.6 22.3 0.0 0.0 0.0 0.0
+ Electricity & heat generation 298.4 0.0 0.0 0.0 0.0 51.6 231.6 15.1 0.0 0.0 0.0 0.0
+ Coke ovens 0.0 0.0 0.0 0.0 0.0 0.0 0.0 0.0 Z Z Z Z
+ Blast furnaces 0.0 0.0 0.0 0.0 0.0 0.0 0.0 0.0 Z Z Z Z
+ Gas works 0.0 0.0 0.0 0.0 0.0 0.0 0.0 0.0 Z Z Z Z
+ Refineries & petrochemical industry 0.0 Z Z Z Z 0.0 Z Z Z Z Z Z
+ Patent fuel plants 0.0 0.0 0.0 0.0 0.0 0.0 Z 0.0 0.0 Z Z Z
+ BKB & PB plants 0.0 0.0 0.0 0.0 0.0 Z Z 0.0 0.0 Z Z Z
+ Coal liquefaction plants 0.0 0.0 0.0 0.0 0.0 Z Z Z Z Z Z Z
+ For blended natural gas 0.0 Z 0.0 Z Z 0.0 Z 0.0 Z Z Z Z
+ Liquid biofuels blended 7.2 Z Z Z Z Z Z 7.2 Z Z Z Z
+ Charcoal production plants 0.0 Z Z Z Z Z Z 0.0 Z Z Z Z
+ Gas-to-liquids plants 0.0 Z Z Z Z Z 0.0 Z Z Z Z Z
+ Not elsewhere specified 0.0 0.0 0.0 0.0 0.0 0.0 0.0 0.0 0.0 Z Z Z
Transformation output 149.0 0.0 0.0 0.0 Z 0.0 0.0 7.2 Z Z 0.4 141.4
+ Electricity & heat generation 141.8 Z Z Z Z Z Z Z Z Z 0.4 141.4
+ Coke ovens 0.0 0.0 0.0 Z Z Z Z Z Z Z Z Z
+ Blast furnaces 0.0 0.0 0.0 Z Z Z Z Z Z Z Z Z
+ Gas works 0.0 0.0 0.0 Z Z Z Z Z Z Z Z Z
+ Refineries & petrochemical industry 0.0 Z Z Z Z 0.0 Z 0.0 Z Z Z Z
+ Patent fuel plants 0.0 0.0 Z Z Z Z Z Z Z Z Z Z
+ BKB & PB plants 0.0 0.0 Z 0.0 Z Z Z Z Z Z Z Z
+ Coal liquefaction plants 0.0 Z Z Z Z 0.0 Z Z Z Z Z Z
+ Blended in natural gas 0.0 Z Z Z Z Z 0.0 Z Z Z Z Z
+ Liquid biofuels blended 7.2 Z Z Z Z Z Z 7.2 Z Z Z Z
+ Charcoal production plants 0.0 Z Z Z Z Z Z 0.0 Z Z Z Z
+ Gas-to-liquids plants 0.0 Z Z Z Z 0.0 Z Z Z Z Z Z
+ Not elsewhere specified 0.0 0.0 0.0 0.0 Z 0.0 Z Z Z Z Z Z
Energy sector 4.3 0.0 0.0 0.0 0.0 0.0 0.0 0.0 0.0 Z 0.0 4.3
+ Own use in electricity & heat generation 4.3 0.0 0.0 0.0 0.0 0.0 0.0 0.0 0.0 Z 0.0 4.3
+ Coal mines 0.0 0.0 0.0 0.0 0.0 0.0 0.0 0.0 0.0 Z 0.0 0.0
+ Oil & natural gas extraction plants 0.0 Z Z Z Z 0.0 0.0 0.0 Z Z 0.0 0.0
+ Patent fuel plants 0.0 0.0 0.0 0.0 0.0 Z Z 0.0 0.0 Z 0.0 0.0
+ Coke ovens 0.0 0.0 0.0 0.0 0.0 0.0 0.0 0.0 0.0 Z 0.0 0.0
+ BKB & PB plants 0.0 0.0 0.0 0.0 0.0 Z Z 0.0 0.0 Z 0.0 0.0
+ Gas works 0.0 0.0 0.0 0.0 0.0 0.0 0.0 0.0 0.0 Z 0.0 0.0
+ Blast furnaces 0.0 0.0 0.0 0.0 0.0 0.0 0.0 0.0 0.0 Z 0.0 0.0
+ Petroleum refineries (oil refineries) 0.0 0.0 0.0 0.0 0.0 0.0 0.0 0.0 0.0 Z 0.0 0.0
+ Nuclear industry 0.0 Z Z Z Z Z Z Z Z Z 0.0 0.0
+ Coal liquefaction plants 0.0 0.0 0.0 0.0 0.0 Z Z Z Z Z 0.0 0.0
+ Liquefaction & regasification plants (LNG) 0.0 Z Z Z Z Z 0.0 Z Z Z 0.0 0.0
+ Gasification plants for biogas 0.0 Z Z Z Z Z Z 0.0 0.0 Z 0.0 0.0
+ Gas-to-liquids (GTL) plants 0.0 Z Z Z Z Z 0.0 Z Z Z 0.0 0.0
+ Charcoal production plants 0.0 Z Z Z Z Z Z 0.0 0.0 Z 0.0 0.0
+ Not elsewhere specified (energy) 0.0 0.0 0.0 0.0 0.0 0.0 0.0 0.0 0.0 Z 0.0 0.0
Distribution losses 20.7 0.0 0.0 0.0 0.0 0.0 10.1 0.0 0.0 Z 0.0 10.7
Available for final consumption 508.1 0.0 0.0 0.0 0.0 282.1 0.0 25.2 0.0 0.0 0.4 200.5
Final non-energy consumption 10.3 0.0 0.0 0.0 0.0 10.3 0.0 0.0 Z Z Z Z
Final energy consumption 495.3 0.0 0.0 0.0 0.0 269.2 0.0 25.2 0.0 Z 0.4 200.5
+ Industry 57.2 0.0 0.0 0.0 0.0 17.7 0.0 0.0 0.0 Z 0.0 39.5
+ Iron & steel 0.0 0.0 0.0 0.0 0.0 0.0 0.0 0.0 0.0 Z 0.0 0.0
+ Chemical & petrochemical 4.3 0.0 0.0 0.0 0.0 0.0 0.0 0.0 0.0 Z 0.0 4.3
+ Non-ferrous metals 0.0 0.0 0.0 0.0 0.0 0.0 0.0 0.0 0.0 Z 0.0 0.0
+ Non-metallic minerals 0.8 0.0 0.0 0.0 0.0 0.0 0.0 0.0 0.0 Z 0.0 0.8
+ Transport equipment 1.8 0.0 0.0 0.0 0.0 0.0 0.0 0.0 0.0 Z 0.0 1.8
+ Machinery 9.9 0.0 0.0 0.0 0.0 0.0 0.0 0.0 0.0 Z 0.0 9.9
+ Mining & quarrying 1.2 0.0 0.0 0.0 0.0 1.1 0.0 0.0 0.0 Z 0.0 0.1
+ Food, beverages & tobacco 5.9 0.0 0.0 0.0 0.0 0.0 0.0 0.0 0.0 Z 0.0 5.9
+ Paper, pulp & printing 2.2 0.0 0.0 0.0 0.0 0.0 0.0 0.0 0.0 Z 0.0 2.2
+ Wood & wood products 0.2 0.0 0.0 0.0 0.0 0.0 0.0 0.0 0.0 Z 0.0 0.2
+ Construction 3.1 0.0 0.0 0.0 0.0 0.8 0.0 0.0 0.0 Z 0.0 2.4
+ Textile & leather 2.6 0.0 0.0 0.0 0.0 0.0 0.0 0.0 0.0 Z 0.0 2.6
+ Not elsewhere specified (industry) 25.3 0.0 0.0 0.0 0.0 15.9 0.0 0.0 0.0 Z 0.0 9.4
+ Transport 208.8 0.0 0.0 0.0 0.0 199.9 0.0 8.9 0.0 Z Z 0.0
+ Rail 0.0 0.0 0.0 0.0 0.0 0.0 Z 0.0 0.0 Z Z 0.0
+ Road 194.8 Z Z Z Z 186.0 0.0 8.8 0.0 Z Z 0.0
+ Domestic aviation 0.6 Z Z Z Z 0.6 Z 0.0 Z Z Z Z
+ Domestic navigation 13.4 0.0 0.0 0.0 0.0 13.3 Z 0.1 0.0 Z Z Z
+ Pipeline transport 0.0 Z Z Z Z 0.0 0.0 0.0 Z Z Z 0.0
+ Not elsewhere specified (transport) 0.0 0.0 0.0 0.0 0.0 0.0 0.0 0.0 0.0 Z Z 0.0
+ Other 229.3 0.0 0.0 0.0 0.0 51.6 0.0 16.3 0.0 Z 0.4 161.0
+ Commercial & public services 126.4 0.0 0.0 0.0 0.0 29.9 0.0 4.4 0.0 Z 0.4 91.7
+ Households 94.2 0.0 0.0 0.0 0.0 16.4 0.0 11.9 0.0 Z 0.0 65.9
+ Agriculture & forestry 4.8 0.0 0.0 0.0 0.0 3.7 0.0 0.0 0.0 Z 0.0 1.1
+ Fishing 1.8 0.0 0.0 0.0 0.0 1.7 0.0 0.0 0.0 Z 0.0 0.2
+ Not elsewhere specified (other) 2.1 0.0 0.0 0.0 0.0 0.0 0.0 0.0 0.0 Z 0.0 2.1
Statistical differences 2.6 0.0 0.0 0.0 0.0 2.6 0.0 0.0 0.0 0.0 0.0 0.0
Gross electricity production 141.4 0.0 0.0 0.0 0.0 16.6 110.6 14.2 0.0 0.0 Z Z
Gross heat production 0.4 0.0 0.0 0.0 0.0 0.0 0.0 0.4 0.0 0.0 Z 0.0
Source: Eurostat (nrg_bal_c)
100Energy balance sheets — 2017 data
Electricity
ktoe 2017
Oil and
petroleum
products
Natural
gas
Renewables
and
biofuels
Non-
renewable
waste
Nuclear
heatHeat
MaltaTotal
Solid
fossil
fuels
Manufac-
tured
gases
Peat and
peat
products
Oil shale
and oil
sands
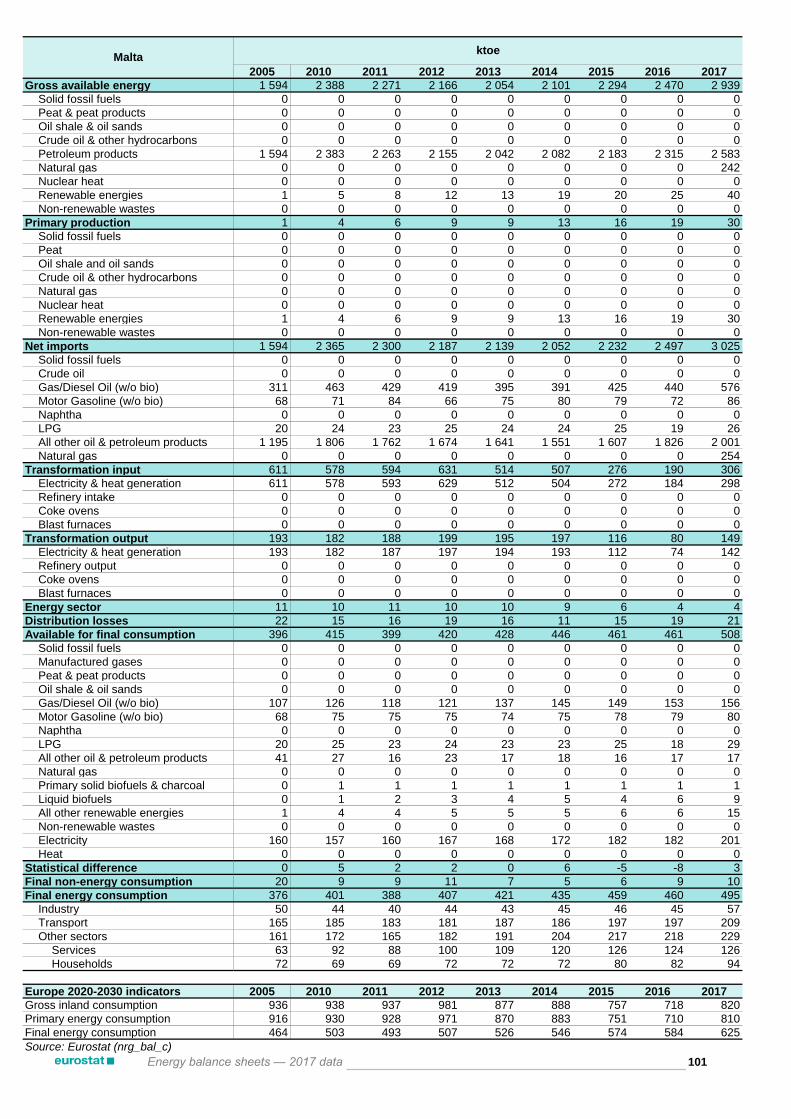
2005 2010 2011 2012 2013 2014 2015 2016 2017
Gross available energy 1 594 2 388 2 271 2 166 2 054 2 101 2 294 2 470 2 939
Solid fossil fuels 0 0 0 0 0 0 0 0 0
Peat & peat products 0 0 0 0 0 0 0 0 0
Oil shale & oil sands 0 0 0 0 0 0 0 0 0
Crude oil & other hydrocarbons 0 0 0 0 0 0 0 0 0
Petroleum products 1 594 2 383 2 263 2 155 2 042 2 082 2 183 2 315 2 583
Natural gas 0 0 0 0 0 0 0 0 242
Nuclear heat 0 0 0 0 0 0 0 0 0
Renewable energies 1 5 8 12 13 19 20 25 40
Non-renewable wastes 0 0 0 0 0 0 0 0 0
Primary production 1 4 6 9 9 13 16 19 30
Solid fossil fuels 0 0 0 0 0 0 0 0 0
Peat 0 0 0 0 0 0 0 0 0
Oil shale and oil sands 0 0 0 0 0 0 0 0 0
Crude oil & other hydrocarbons 0 0 0 0 0 0 0 0 0
Natural gas 0 0 0 0 0 0 0 0 0
Nuclear heat 0 0 0 0 0 0 0 0 0
Renewable energies 1 4 6 9 9 13 16 19 30
Non-renewable wastes 0 0 0 0 0 0 0 0 0
Net imports 1 594 2 365 2 300 2 187 2 139 2 052 2 232 2 497 3 025
Solid fossil fuels 0 0 0 0 0 0 0 0 0
Crude oil 0 0 0 0 0 0 0 0 0
Gas/Diesel Oil (w/o bio) 311 463 429 419 395 391 425 440 576
Motor Gasoline (w/o bio) 68 71 84 66 75 80 79 72 86
Naphtha 0 0 0 0 0 0 0 0 0
LPG 20 24 23 25 24 24 25 19 26
All other oil & petroleum products 1 195 1 806 1 762 1 674 1 641 1 551 1 607 1 826 2 001
Natural gas 0 0 0 0 0 0 0 0 254
Transformation input 611 578 594 631 514 507 276 190 306
Electricity & heat generation 611 578 593 629 512 504 272 184 298
Refinery intake 0 0 0 0 0 0 0 0 0
Coke ovens 0 0 0 0 0 0 0 0 0
Blast furnaces 0 0 0 0 0 0 0 0 0
Transformation output 193 182 188 199 195 197 116 80 149
Electricity & heat generation 193 182 187 197 194 193 112 74 142
Refinery output 0 0 0 0 0 0 0 0 0
Coke ovens 0 0 0 0 0 0 0 0 0
Blast furnaces 0 0 0 0 0 0 0 0 0
Energy sector 11 10 11 10 10 9 6 4 4
Distribution losses 22 15 16 19 16 11 15 19 21
Available for final consumption 396 415 399 420 428 446 461 461 508
Solid fossil fuels 0 0 0 0 0 0 0 0 0
Manufactured gases 0 0 0 0 0 0 0 0 0
Peat & peat products 0 0 0 0 0 0 0 0 0
Oil shale & oil sands 0 0 0 0 0 0 0 0 0
Gas/Diesel Oil (w/o bio) 107 126 118 121 137 145 149 153 156
Motor Gasoline (w/o bio) 68 75 75 75 74 75 78 79 80
Naphtha 0 0 0 0 0 0 0 0 0
LPG 20 25 23 24 23 23 25 18 29
All other oil & petroleum products 41 27 16 23 17 18 16 17 17
Natural gas 0 0 0 0 0 0 0 0 0
Primary solid biofuels & charcoal 0 1 1 1 1 1 1 1 1
Liquid biofuels 0 1 2 3 4 5 4 6 9
All other renewable energies 1 4 4 5 5 5 6 6 15
Non-renewable wastes 0 0 0 0 0 0 0 0 0
Electricity 160 157 160 167 168 172 182 182 201
Heat 0 0 0 0 0 0 0 0 0
Statistical difference 0 5 2 2 0 6 -5 -8 3
Final non-energy consumption 20 9 9 11 7 5 6 9 10
Final energy consumption 376 401 388 407 421 435 459 460 495
Industry 50 44 40 44 43 45 46 45 57
Transport 165 185 183 181 187 186 197 197 209
Other sectors 161 172 165 182 191 204 217 218 229
Services 63 92 88 100 109 120 126 124 126
Households 72 69 69 72 72 72 80 82 94
Europe 2020-2030 indicators 2005 2010 2011 2012 2013 2014 2015 2016 2017
Gross inland consumption 936 938 937 981 877 888 757 718 820
Primary energy consumption 916 930 928 971 870 883 751 710 810
Final energy consumption 464 503 493 507 526 546 574 584 625
Source: Eurostat (nrg_bal_c)
101
Maltaktoe
Energy balance sheets — 2017 data

Source: Eurostat (nrg_bal_c)
Source: Eurostat (nrg_bal_c)
Note: Please refer to page 23 for related methodological definitions.
Malta
102Energy balance sheets — 2017 data
0
500
1 000
1 500
2 000
2 500
1990 1995 2000 2005 2010 2015 2017
Gross electricity production by fuel, GWh
Solid fossil fuels Oil and petroleum products Natural gas
Renewables and biofuels Nuclear heat Other
0
500
1 000
1 500
2 000
2 500
3 000
1990 1995 2000 2005 2010 2015 2017
Gross available energy by fuel, ktoe
Solid fossil fuels Oil and petroleum products Natural gas
Renewables and biofuels Nuclear heat Non-renewable waste

Source: Eurostat (nrg_bal_c)
Source: Eurostat (nrg_bal_c)
Note: Please refer to page 23 for related methodological definitions.
Malta
103Energy balance sheets — 2017 data
0
100
200
300
400
500
600
1990 1995 2000 2005 2010 2015 2017
Final energy consumption by fuel, ktoe
Solid fossil fuels Oil and petroleum products Natural gas
Renewables and biofuels Electricity Heat
Other
0
100
200
300
400
500
600
1990 1995 2000 2005 2010 2015 2017
Final consumption by sector, ktoe
Industry Transport Services Households Non-energy use

+ Primary production 41 712.2 0.0 Z 0.0 0.0 1 471.6 33 167.6 5 605.8 677.7 789.5 Z Z
+ Recovered & recycled products 446.6 0.0 Z 0.0 0.0 446.6 Z 0.0 Z Z Z Z
+ Imports 204 403.8 9 413.7 0.0 0.0 0.0 153 574.1 38 801.1 469.5 214.4 Z 0.0 1 931.0
- Exports 157 805.5 190.7 0.0 0.0 0.0 114 072.5 40 165.3 1 711.4 36.1 Z 0.0 1 629.5
+ Change in stock 1 180.1 -75.5 0.0 0.0 0.0 2 238.7 -889.6 -93.4 0.0 Z Z Z
= Gross available energy 89 937.2 9 147.6 0.0 0.0 0.0 43 658.4 30 913.8 4 270.5 856.0 789.5 0.0 301.5
- International maritime bunkers 11 652.4 0.0 0.0 0.0 0.0 11 649.0 3.5 0.0 Z Z Z Z
= Gross inland consumption 78 284.7 9 147.6 0.0 0.0 0.0 32 009.4 30 910.3 4 270.5 856.0 789.5 0.0 301.5
- International aviation 4 013.6 Z Z Z Z 4 013.6 Z 0.0 Z Z Z Z
= Total energy supply 74 271.2 9 147.6 0.0 0.0 0.0 27 995.8 30 910.3 4 270.5 856.0 789.5 0.0 301.5
Transformation input 120 391.8 10 447.2 602.3 0.0 0.0 94 395.5 9 782.5 3 192.4 824.5 789.5 358.0 0.0
+ Electricity & heat generation 21 695.3 6 126.3 602.3 0.0 0.0 496.2 9 782.5 2 716.1 824.5 789.5 358.0 0.0
+ Coke ovens 1 882.2 1 882.2 0.0 0.0 0.0 0.0 0.0 0.0 Z Z Z Z
+ Blast furnaces 2 438.8 2 438.8 0.0 0.0 0.0 0.0 0.0 0.0 Z Z Z Z
+ Gas works 0.0 0.0 0.0 0.0 0.0 0.0 0.0 0.0 Z Z Z Z
+ Refineries & petrochemical industry 93 769.7 Z Z Z Z 93 769.7 Z Z Z Z Z Z
+ Patent fuel plants 0.0 0.0 0.0 0.0 0.0 0.0 Z 0.0 0.0 Z Z Z
+ BKB & PB plants 0.0 0.0 0.0 0.0 0.0 Z Z 0.0 0.0 Z Z Z
+ Coal liquefaction plants 0.0 0.0 0.0 0.0 0.0 Z Z Z Z Z Z Z
+ For blended natural gas 203.6 Z 0.0 Z Z 129.5 Z 74.1 Z Z Z Z
+ Liquid biofuels blended 402.2 Z Z Z Z Z Z 402.2 Z Z Z Z
+ Charcoal production plants 0.0 Z Z Z Z Z Z 0.0 Z Z Z Z
+ Gas-to-liquids plants 0.0 Z Z Z Z Z 0.0 Z Z Z Z Z
+ Not elsewhere specified 0.0 0.0 0.0 0.0 0.0 0.0 0.0 0.0 0.0 Z Z Z
Transformation output 109 595.2 1 408.7 1 289.1 0.0 Z 93 511.9 106.4 402.2 Z Z 2 794.3 10 082.5
+ Electricity & heat generation 12 876.8 Z Z Z Z Z Z Z Z Z 2 794.3 10 082.5
+ Coke ovens 1 813.7 1 408.7 405.0 Z Z Z Z Z Z Z Z Z
+ Blast furnaces 884.2 0.0 884.2 Z Z Z Z Z Z Z Z Z
+ Gas works 0.0 0.0 0.0 Z Z Z Z Z Z Z Z Z
+ Refineries & petrochemical industry 93 511.9 Z Z Z Z 93 511.9 Z 0.0 Z Z Z Z
+ Patent fuel plants 0.0 0.0 Z Z Z Z Z Z Z Z Z Z
+ BKB & PB plants 0.0 0.0 Z 0.0 Z Z Z Z Z Z Z Z
+ Coal liquefaction plants 0.0 Z Z Z Z 0.0 Z Z Z Z Z Z
+ Blended in natural gas 106.4 Z Z Z Z Z 106.4 Z Z Z Z Z
+ Liquid biofuels blended 402.2 Z Z Z Z Z Z 402.2 Z Z Z Z
+ Charcoal production plants 0.0 Z Z Z Z Z Z 0.0 Z Z Z Z
+ Gas-to-liquids plants 0.0 Z Z Z Z 0.0 Z Z Z Z Z Z
+ Not elsewhere specified 0.0 0.0 0.0 0.0 Z 0.0 Z Z Z Z Z Z
Energy sector 4 794.9 0.0 196.3 0.0 0.0 2 139.7 1 373.1 0.0 0.0 Z 260.8 824.9
+ Own use in electricity & heat generation 334.5 0.0 0.0 0.0 0.0 0.0 8.2 0.0 0.0 Z 0.0 326.3
+ Coal mines 0.0 0.0 0.0 0.0 0.0 0.0 0.0 0.0 0.0 Z 0.0 0.0
+ Oil & natural gas extraction plants 814.2 Z Z Z Z 0.0 578.2 0.0 Z Z 0.0 236.0
+ Patent fuel plants 0.0 0.0 0.0 0.0 0.0 Z Z 0.0 0.0 Z 0.0 0.0
+ Coke ovens 204.0 0.0 196.3 0.0 0.0 0.0 0.0 0.0 0.0 Z 0.0 7.7
+ BKB & PB plants 0.0 0.0 0.0 0.0 0.0 Z Z 0.0 0.0 Z 0.0 0.0
+ Gas works 0.0 0.0 0.0 0.0 0.0 0.0 0.0 0.0 0.0 Z 0.0 0.0
+ Blast furnaces 0.0 0.0 0.0 0.0 0.0 0.0 0.0 0.0 0.0 Z 0.0 0.0
+ Petroleum refineries (oil refineries) 3 330.3 0.0 0.0 0.0 0.0 2 139.7 747.9 0.0 0.0 Z 228.5 214.1
+ Nuclear industry 0.0 Z Z Z Z Z Z Z Z Z 0.0 0.0
+ Coal liquefaction plants 0.0 0.0 0.0 0.0 0.0 Z Z Z Z Z 0.0 0.0
+ Liquefaction & regasification plants (LNG) 0.0 Z Z Z Z Z 0.0 Z Z Z 0.0 0.0
+ Gasification plants for biogas 0.0 Z Z Z Z Z Z 0.0 0.0 Z 0.0 0.0
+ Gas-to-liquids (GTL) plants 0.0 Z Z Z Z Z 0.0 Z Z Z 0.0 0.0
+ Charcoal production plants 0.0 Z Z Z Z Z Z 0.0 0.0 Z 0.0 0.0
+ Not elsewhere specified (energy) 111.9 0.0 0.0 0.0 0.0 0.0 38.8 0.0 0.0 Z 32.2 40.8
Distribution losses 563.7 0.0 0.0 0.0 0.0 0.0 0.0 0.0 0.0 Z 98.2 465.5
Available for final consumption 58 115.9 109.0 490.5 0.0 0.0 24 972.6 19 861.2 1 480.3 31.6 0.0 2 077.3 9 093.5
Final non-energy consumption 13 567.1 5.6 0.0 0.0 0.0 11 002.5 2 559.0 0.0 Z Z Z Z
Final energy consumption 44 953.3 103.4 490.5 0.0 0.0 14 223.4 17 427.3 1 479.4 31.6 Z 2 113.8 9 083.9
+ Industry 13 844.6 100.2 490.5 0.0 0.0 3 221.6 5 272.7 136.0 0.0 Z 1 545.0 3 078.5
+ Iron & steel 986.8 2.9 490.5 0.0 0.0 5.2 265.8 0.0 0.0 Z 0.1 222.3
+ Chemical & petrochemical 7 305.6 0.0 0.0 0.0 0.0 2 762.4 2 144.7 0.0 0.0 Z 1 308.9 1 089.6
+ Non-ferrous metals 270.7 0.0 0.0 0.0 0.0 0.0 73.8 0.0 0.0 Z 25.4 171.5
+ Non-metallic minerals 588.0 43.7 0.0 0.0 0.0 13.2 422.2 0.0 0.0 Z 0.1 108.7
+ Transport equipment 104.9 0.0 0.0 0.0 0.0 4.1 50.1 0.0 0.0 Z 0.1 50.7
+ Machinery 548.2 0.0 0.0 0.0 0.0 3.1 264.6 0.0 0.0 Z 0.9 279.5
+ Mining & quarrying 119.4 4.1 0.0 0.0 0.0 3.1 47.9 0.0 0.0 Z 40.8 23.5
+ Food, beverages & tobacco 2 132.3 30.9 0.0 0.0 0.0 1.1 1 368.5 10.3 0.0 Z 118.6 603.0
+ Paper, pulp & printing 589.6 0.0 0.0 0.0 0.0 0.0 327.2 5.2 0.0 Z 42.9 214.4
+ Wood & wood products 51.8 0.0 0.0 0.0 0.0 0.0 11.0 27.4 0.0 Z 0.0 13.4
+ Construction 627.7 1.3 0.0 0.0 0.0 428.3 102.0 17.0 0.0 Z 0.0 79.1
+ Textile & leather 97.5 0.0 0.0 0.0 0.0 0.0 61.6 0.0 0.0 Z 4.0 31.8
+ Not elsewhere specified (industry) 422.0 17.3 0.0 0.0 0.0 1.1 133.2 76.2 0.0 Z 3.1 191.1
+ Transport 10 674.1 0.0 0.0 0.0 0.0 10 154.9 45.9 306.6 0.0 Z Z 166.7
+ Rail 162.3 0.0 0.0 0.0 0.0 26.8 Z 0.9 0.0 Z Z 134.5
+ Road 10 197.0 Z Z Z Z 9 813.2 45.9 305.7 0.0 Z Z 32.2
+ Domestic aviation 10.4 Z Z Z Z 10.4 Z 0.0 Z Z Z Z
+ Domestic navigation 304.5 0.0 0.0 0.0 0.0 304.5 Z 0.0 0.0 Z Z Z
+ Pipeline transport 0.0 Z Z Z Z 0.0 0.0 0.0 Z Z Z 0.0
+ Not elsewhere specified (transport) 0.0 0.0 0.0 0.0 0.0 0.0 0.0 0.0 0.0 Z Z 0.0
+ Other 20 434.6 3.2 0.0 0.0 0.0 846.9 12 108.7 1 036.7 31.6 Z 568.9 5 838.7
+ Commercial & public services 6 830.6 2.0 0.0 0.0 0.0 168.2 3 079.7 260.3 31.6 Z 195.3 3 093.5
+ Households 9 699.2 1.1 0.0 0.0 0.0 37.2 6 885.8 547.2 0.0 Z 285.2 1 942.7
+ Agriculture & forestry 3 675.0 0.0 0.0 0.0 0.0 422.6 2 139.7 221.8 0.0 Z 88.4 802.5
+ Fishing 154.8 0.0 0.0 0.0 0.0 154.8 0.0 0.0 0.0 Z 0.0 0.0
+ Not elsewhere specified (other) 75.0 0.0 0.0 0.0 0.0 64.1 3.5 7.4 0.0 Z 0.0 0.0
Statistical differences -404.5 0.0 0.0 0.0 0.0 -253.4 -125.1 0.9 0.0 0.0 -36.5 9.6
Gross electricity production 10 072.1 2 689.2 237.0 0.0 0.0 101.9 5 107.3 1 499.0 145.2 292.6 Z Z
Gross heat production 2 656.1 62.8 6.0 0.0 0.0 274.8 1 682.1 384.7 245.7 0.0 Z 0.0
Source: Eurostat (nrg_bal_c)
104Energy balance sheets — 2017 data
Electricity
ktoe 2017
Oil and
petroleum
products
Natural
gas
Renewables
and
biofuels
Non-
renewable
waste
Nuclear
heatHeat
NetherlandsTotal
Solid
fossil
fuels
Manufac-
tured
gases
Peat and
peat
products
Oil shale
and oil
sands

2005 2010 2011 2012 2013 2014 2015 2016 2017
Gross available energy 99 332 100 014 95 475 94 449 92 261 87 969 88 096 89 605 89 937
Solid fossil fuels 8 094 7 541 7 439 8 152 8 125 9 007 10 915 10 146 9 148
Peat & peat products 0 0 0 0 0 0 0 0 0
Oil shale & oil sands 0 0 0 0 0 0 0 0 0
Crude oil & other hydrocarbons 64 135 62 189 59 992 59 696 57 314 58 280 61 647 62 607 62 580
Petroleum products -13 827 -14 978 -13 013 -13 657 -13 117 -15 004 -19 342 -19 280 -18 921
Natural gas 35 325 40 066 35 043 33 486 33 381 29 103 28 629 30 033 30 914
Nuclear heat 1 031 917 959 920 656 941 937 916 790
Renewable energies 2 282 3 315 3 512 3 633 3 539 3 556 3 760 3 900 4 270
Non-renewable wastes 718 725 760 747 795 819 797 860 856
Primary production 62 459 71 124 66 390 66 102 69 774 60 297 47 935 46 123 41 712
Solid fossil fuels 0 0 0 0 0 0 0 0 0
Peat 0 0 0 0 0 0 0 0 0
Oil shale and oil sands 0 0 0 0 0 0 0 0 0
Crude oil & other hydrocarbons 2 546 1 636 1 642 1 691 1 735 2 088 2 038 1 578 1 472
Natural gas 56 177 64 718 59 757 58 816 62 258 51 923 39 447 38 083 33 168
Nuclear heat 1 031 917 959 920 656 941 937 916 790
Renewable energies 1 987 3 129 3 286 4 004 4 471 4 668 4 866 4 869 5 606
Non-renewable wastes 718 725 746 671 654 677 647 676 678
Net imports 37 527 28 282 28 029 28 931 21 896 27 214 42 671 41 142 46 598
Solid fossil fuels 8 197 7 645 7 507 8 065 7 930 9 240 10 535 10 100 9 223
Crude oil 52 257 51 589 49 910 50 518 47 567 47 797 52 977 55 065 53 452
Gas/Diesel Oil (w/o bio) -11 948 -12 689 -12 930 -11 395 -11 973 -12 745 -10 684 -11 617 -12 818
Motor Gasoline (w/o bio) -5 827 -7 070 -4 745 -7 460 -7 853 -9 615 -11 197 -9 908 -9 719
Naphtha 1 052 2 802 628 4 806 3 259 3 974 3 666 3 361 4 408
LPG 715 404 568 -1 1 226 1 938 2 144 1 367 1 254
All other oil & petroleum products 12 152 9 447 9 907 8 607 9 887 8 183 5 941 2 974 2 923
Natural gas -20 940 -24 209 -23 880 -25 439 -29 020 -21 783 -10 494 -9 850 -1 364
Transformation input 111 740 113 014 108 076 108 803 108 096 111 818 118 039 119 573 120 392
Electricity & heat generation 22 411 23 925 22 408 20 985 20 545 21 319 21 917 22 158 21 695
Refinery intake 61 240 60 612 59 333 59 213 57 576 58 627 60 978 61 877 61 407
Coke ovens 2 162 2 008 2 026 1 878 1 922 1 991 2 030 1 980 1 882
Blast furnaces 2 383 2 098 2 290 2 364 2 233 2 287 2 326 2 311 2 439
Transformation output 99 317 100 579 96 750 97 461 97 603 100 715 106 609 108 156 109 595
Electricity & heat generation 12 855 14 074 13 476 12 438 12 323 12 402 12 433 12 677 12 877
Refinery output 59 980 59 432 58 463 58 172 56 818 58 058 60 752 61 595 61 171
Coke ovens 2 040 1 881 1 862 1 757 1 815 1 850 1 881 1 853 1 814
Blast furnaces 901 857 886 884 851 864 877 851 884
Energy sector 4 945 4 907 5 283 4 977 4 993 5 021 5 233 4 988 4 795
Distribution losses 585 584 539 528 524 499 548 557 564
Available for final consumption 62 113 64 819 59 858 60 360 59 631 54 791 55 138 56 875 58 116
Solid fossil fuels 215 248 243 238 201 141 -14 36 109
Manufactured gases 487 459 455 444 438 437 475 474 491
Peat & peat products 0 0 0 0 0 0 0 0 0
Oil shale & oil sands 0 0 0 0 0 0 0 0 0
Gas/Diesel Oil (w/o bio) 7 909 7 919 7 943 7 536 7 678 6 932 6 857 6 795 6 879
Motor Gasoline (w/o bio) 4 040 4 048 4 100 3 920 3 823 3 894 3 782 3 906 4 036
Naphtha 5 059 5 550 4 794 5 970 4 589 3 730 3 901 4 974 5 686
LPG 1 627 1 459 1 605 1 227 2 006 2 566 2 749 2 267 2 024
All other oil & petroleum products 7 341 7 299 6 516 6 241 6 123 5 941 5 971 6 347 6 347
Natural gas 21 950 24 544 20 937 21 757 21 838 18 270 18 976 19 645 19 861
Primary solid biofuels & charcoal 467 519 530 550 564 620 642 662 719
Liquid biofuels 10 243 322 335 320 375 321 257 332
All other renewable energies 136 258 264 287 322 355 392 404 430
Non-renewable wastes 46 58 50 41 41 41 36 34 32
Electricity 8 978 9 236 9 282 9 159 9 020 8 849 8 881 8 988 9 094
Heat 3 849 2 979 2 817 2 656 2 668 2 641 2 169 2 086 2 077
Statistical difference -433 -302 -368 -443 -340 -497 -1 178 -562 -405
Final non-energy consumption 13 579 14 370 13 428 13 769 12 790 12 560 12 234 12 755 13 567
Final energy consumption 48 967 50 751 46 798 47 034 47 182 42 727 44 081 44 682 44 953
Industry 15 640 14 419 13 868 13 680 13 502 13 237 13 429 13 781 13 845
Transport 11 379 11 657 11 786 11 278 10 985 10 262 10 380 10 399 10 674
Other sectors 21 948 24 676 21 144 22 076 22 695 19 229 20 272 20 502 20 435
Services 6 944 7 847 6 989 7 239 7 268 6 412 6 801 6 694 6 831
Households 10 749 12 481 10 278 10 879 11 434 9 152 9 592 9 898 9 699
Europe 2020-2030 indicators 2005 2010 2011 2012 2013 2014 2015 2016 2017
Gross inland consumption 83 696 86 090 80 477 80 528 79 021 74 912 76 015 77 583 78 106
Primary energy consumption 70 117 71 720 67 050 66 759 66 232 62 352 63 781 64 827 64 539
Final energy consumption 54 079 55 337 51 673 51 834 51 944 47 647 49 198 49 887 50 343
Source: Eurostat (nrg_bal_c)
105
Netherlandsktoe
Energy balance sheets — 2017 data

Source: Eurostat (nrg_bal_c)
Source: Eurostat (nrg_bal_c)
Note: Please refer to page 23 for related methodological definitions.
Netherlands
106Energy balance sheets — 2017 data
0
20 000
40 000
60 000
80 000
100 000
120 000
140 000
1990 1995 2000 2005 2010 2015 2017
Gross electricity production by fuel, GWh
Solid fossil fuels Oil and petroleum products Natural gas
Renewables and biofuels Nuclear heat Other
0
10 000
20 000
30 000
40 000
50 000
60 000
1990 1995 2000 2005 2010 2015 2017
Gross available energy by fuel, ktoe
Solid fossil fuels Oil and petroleum products Natural gas
Renewables and biofuels Nuclear heat Non-renewable waste

Source: Eurostat (nrg_bal_c)
Source: Eurostat (nrg_bal_c)
Note: Please refer to page 23 for related methodological definitions.
Netherlands
107Energy balance sheets — 2017 data
0
10 000
20 000
30 000
40 000
50 000
60 000
1990 1995 2000 2005 2010 2015 2017
Final energy consumption by fuel, ktoe
Solid fossil fuels Oil and petroleum products Natural gas
Renewables and biofuels Electricity Heat
Other
0
10 000
20 000
30 000
40 000
50 000
60 000
70 000
1990 1995 2000 2005 2010 2015 2017
Final consumption by sector, ktoe
Industry Transport Services Households Non-energy use

+ Primary production 12 335.0 0.0 Z 0.0 0.0 745.8 1 042.9 9 812.8 733.5 0.0 Z Z
+ Recovered & recycled products 0.0 0.0 Z 0.0 0.0 0.0 Z 0.0 Z Z Z Z
+ Imports 32 002.8 3 110.8 0.0 0.0 0.0 14 038.1 11 538.0 774.8 16.5 Z 0.0 2 524.7
- Exports 9 810.9 36.3 0.0 0.0 0.0 2 663.8 4 524.6 624.4 0.0 Z 0.0 1 961.9
+ Change in stock -81.9 5.5 0.0 0.0 0.0 212.4 -279.9 -19.8 0.0 Z Z Z
= Gross available energy 34 444.9 3 080.0 0.0 0.0 0.0 12 332.4 7 776.4 9 943.3 750.0 0.0 0.0 562.8
- International maritime bunkers 21.1 0.0 0.0 0.0 0.0 21.1 0.0 0.0 Z Z Z Z
= Gross inland consumption 34 423.9 3 080.0 0.0 0.0 0.0 12 311.4 7 776.4 9 943.3 750.0 0.0 0.0 562.8
- International aviation 737.4 Z Z Z Z 737.4 Z 0.0 Z Z Z Z
= Total energy supply 33 686.5 3 080.0 0.0 0.0 0.0 11 574.0 7 776.4 9 943.3 750.0 0.0 0.0 562.8
Transformation input 23 104.5 3 697.6 479.6 0.0 0.0 9 373.0 2 439.8 6 215.3 414.5 0.0 2.1 482.4
+ Electricity & heat generation 10 410.8 375.8 479.6 0.0 0.0 267.5 2 439.8 5 949.1 414.5 0.0 2.1 482.4
+ Coke ovens 1 229.3 1 229.3 0.0 0.0 0.0 0.0 0.0 0.0 Z Z Z Z
+ Blast furnaces 2 092.5 2 092.5 0.0 0.0 0.0 0.0 0.0 0.0 Z Z Z Z
+ Gas works 0.0 0.0 0.0 0.0 0.0 0.0 0.0 0.0 Z Z Z Z
+ Refineries & petrochemical industry 9 105.6 Z Z Z Z 9 105.6 Z Z Z Z Z Z
+ Patent fuel plants 0.0 0.0 0.0 0.0 0.0 0.0 Z 0.0 0.0 Z Z Z
+ BKB & PB plants 0.0 0.0 0.0 0.0 0.0 Z Z 0.0 0.0 Z Z Z
+ Coal liquefaction plants 0.0 0.0 0.0 0.0 0.0 Z Z Z Z Z Z Z
+ For blended natural gas 0.0 Z 0.0 Z Z 0.0 Z 0.0 Z Z Z Z
+ Liquid biofuels blended 264.1 Z Z Z Z Z Z 264.1 Z Z Z Z
+ Charcoal production plants 2.2 Z Z Z Z Z Z 2.2 Z Z Z Z
+ Gas-to-liquids plants 0.0 Z Z Z Z Z 0.0 Z Z Z Z Z
+ Not elsewhere specified 0.0 0.0 0.0 0.0 0.0 0.0 0.0 0.0 0.0 Z Z Z
Transformation output 19 381.9 961.4 1 056.2 0.0 Z 8 841.9 0.0 264.9 Z Z 2 124.7 6 132.8
+ Electricity & heat generation 8 257.5 Z Z Z Z Z Z Z Z Z 2 124.7 6 132.8
+ Coke ovens 1 179.7 961.4 218.3 Z Z Z Z Z Z Z Z Z
+ Blast furnaces 837.9 0.0 837.9 Z Z Z Z Z Z Z Z Z
+ Gas works 0.0 0.0 0.0 Z Z Z Z Z Z Z Z Z
+ Refineries & petrochemical industry 8 841.9 Z Z Z Z 8 841.9 Z 0.0 Z Z Z Z
+ Patent fuel plants 0.0 0.0 Z Z Z Z Z Z Z Z Z Z
+ BKB & PB plants 0.0 0.0 Z 0.0 Z Z Z Z Z Z Z Z
+ Coal liquefaction plants 0.0 Z Z Z Z 0.0 Z Z Z Z Z Z
+ Blended in natural gas 0.0 Z Z Z Z Z 0.0 Z Z Z Z Z
+ Liquid biofuels blended 264.1 Z Z Z Z Z Z 264.1 Z Z Z Z
+ Charcoal production plants 0.9 Z Z Z Z Z Z 0.9 Z Z Z Z
+ Gas-to-liquids plants 0.0 Z Z Z Z 0.0 Z Z Z Z Z Z
+ Not elsewhere specified 0.0 0.0 0.0 0.0 Z 0.0 Z Z Z Z Z Z
Energy sector 1 475.1 1.5 450.5 0.0 0.0 237.4 219.1 0.0 39.3 Z 0.0 527.3
+ Own use in electricity & heat generation 312.5 0.0 0.0 0.0 0.0 0.0 0.0 0.0 0.0 Z 0.0 312.5
+ Coal mines 0.0 0.0 0.0 0.0 0.0 0.0 0.0 0.0 0.0 Z 0.0 0.0
+ Oil & natural gas extraction plants 120.5 Z Z Z Z 0.0 88.2 0.0 Z Z 0.0 32.3
+ Patent fuel plants 0.0 0.0 0.0 0.0 0.0 Z Z 0.0 0.0 Z 0.0 0.0
+ Coke ovens 56.7 0.0 48.8 0.0 0.0 0.0 5.3 0.0 0.0 Z 0.0 2.6
+ BKB & PB plants 0.0 0.0 0.0 0.0 0.0 Z Z 0.0 0.0 Z 0.0 0.0
+ Gas works 0.0 0.0 0.0 0.0 0.0 0.0 0.0 0.0 0.0 Z 0.0 0.0
+ Blast furnaces 587.5 1.5 401.7 0.0 0.0 0.0 35.1 0.0 39.3 Z 0.0 109.9
+ Petroleum refineries (oil refineries) 397.9 0.0 0.0 0.0 0.0 237.4 90.5 0.0 0.0 Z 0.0 70.0
+ Nuclear industry 0.0 Z Z Z Z Z Z Z Z Z 0.0 0.0
+ Coal liquefaction plants 0.0 0.0 0.0 0.0 0.0 Z Z Z Z Z 0.0 0.0
+ Liquefaction & regasification plants (LNG) 0.0 Z Z Z Z Z 0.0 Z Z Z 0.0 0.0
+ Gasification plants for biogas 0.0 Z Z Z Z Z Z 0.0 0.0 Z 0.0 0.0
+ Gas-to-liquids (GTL) plants 0.0 Z Z Z Z Z 0.0 Z Z Z 0.0 0.0
+ Charcoal production plants 0.0 Z Z Z Z Z Z 0.0 0.0 Z 0.0 0.0
+ Not elsewhere specified (energy) 0.0 0.0 0.0 0.0 0.0 0.0 0.0 0.0 0.0 Z 0.0 0.0
Distribution losses 624.7 0.0 19.3 0.0 0.0 0.0 2.7 0.0 0.0 Z 315.6 287.1
Available for final consumption 27 864.1 342.2 106.8 0.0 0.0 10 805.4 5 114.8 3 992.9 296.1 0.0 1 806.9 5 398.8
Final non-energy consumption 1 652.0 22.0 0.0 0.0 0.0 1 299.2 330.8 0.0 Z Z Z Z
Final energy consumption 26 212.9 321.0 106.8 0.0 0.0 9 506.3 4 784.1 3 992.9 296.1 Z 1 806.9 5 398.8
+ Industry 8 052.3 302.2 106.8 0.0 0.0 457.4 2 699.2 1 362.3 296.1 Z 279.2 2 549.2
+ Iron & steel 886.4 140.0 106.8 0.0 0.0 3.2 406.6 0.9 0.0 Z 8.4 220.4
+ Chemical & petrochemical 1 076.1 26.0 0.0 0.0 0.0 13.5 454.5 39.2 74.7 Z 72.1 396.3
+ Non-ferrous metals 223.6 4.1 0.0 0.0 0.0 1.4 118.9 0.9 4.5 Z 1.6 92.0
+ Non-metallic minerals 877.8 51.4 0.0 0.0 0.0 54.9 330.8 82.6 184.4 Z 1.9 171.9
+ Transport equipment 167.9 0.0 0.0 0.0 0.0 3.4 52.4 0.9 0.0 Z 20.6 90.5
+ Machinery 712.6 0.0 0.0 0.0 0.0 41.5 258.5 8.1 0.0 Z 27.3 377.1
+ Mining & quarrying 186.1 0.4 0.0 0.0 0.0 8.8 55.8 0.2 0.0 Z 0.1 120.8
+ Food, beverages & tobacco 688.8 3.8 0.0 0.0 0.0 51.1 328.1 33.5 0.0 Z 36.2 236.0
+ Paper, pulp & printing 1 811.3 76.5 0.0 0.0 0.0 8.9 479.7 816.5 3.9 Z 21.4 404.5
+ Wood & wood products 635.3 0.0 0.0 0.0 0.0 7.8 61.0 306.3 26.6 Z 65.4 168.3
+ Construction 421.2 0.0 0.0 0.0 0.0 257.3 53.8 29.1 0.7 Z 12.5 67.8
+ Textile & leather 83.1 0.0 0.0 0.0 0.0 1.7 43.9 0.3 0.0 Z 0.5 36.8
+ Not elsewhere specified (industry) 276.6 0.0 0.0 0.0 0.0 3.9 55.1 38.4 1.4 Z 11.2 166.6
+ Transport 8 656.8 0.1 0.0 0.0 0.0 7 620.9 290.7 468.2 0.0 Z Z 277.0
+ Rail 217.4 0.1 0.0 0.0 0.0 39.7 Z 2.3 0.0 Z Z 175.3
+ Road 8 031.8 Z Z Z Z 7 547.6 17.2 465.8 0.0 Z Z 1.2
+ Domestic aviation 29.8 Z Z Z Z 29.8 Z 0.0 Z Z Z Z
+ Domestic navigation 3.8 0.0 0.0 0.0 0.0 3.8 Z 0.0 0.0 Z Z Z
+ Pipeline transport 292.6 Z Z Z Z 0.0 273.5 0.0 Z Z Z 19.1
+ Not elsewhere specified (transport) 81.4 0.0 0.0 0.0 0.0 0.0 0.0 0.0 0.0 Z Z 81.4
+ Other 9 503.9 18.8 0.0 0.0 0.0 1 428.0 1 794.2 2 162.5 0.0 Z 1 527.8 2 572.6
+ Commercial & public services 2 386.6 0.0 0.0 0.0 0.0 156.3 324.0 179.1 0.0 Z 738.8 988.4
+ Households 6 594.5 18.4 0.0 0.0 0.0 1 045.2 1 448.8 1 817.6 0.0 Z 778.0 1 486.5
+ Agriculture & forestry 520.8 0.4 0.0 0.0 0.0 226.5 21.3 163.7 0.0 Z 11.0 97.8
+ Fishing 0.0 0.0 0.0 0.0 0.0 0.0 0.0 0.0 0.0 Z 0.0 0.0
+ Not elsewhere specified (other) 2.1 0.0 0.0 0.0 0.0 0.0 0.0 2.1 0.0 Z 0.0 0.0
Statistical differences -0.8 -0.8 0.0 0.0 0.0 0.0 0.0 -0.0 0.0 0.0 0.0 0.0
Gross electricity production 6 131.7 151.2 185.5 0.0 0.0 70.0 944.1 4 706.4 74.5 0.0 Z Z
Gross heat production 2 122.6 73.1 20.4 0.0 0.0 111.8 771.7 993.2 152.4 0.0 Z 0.0
Source: Eurostat (nrg_bal_c)
108Energy balance sheets — 2017 data
Electricity
ktoe 2017
Oil and
petroleum
products
Natural
gas
Renewables
and
biofuels
Non-
renewable
waste
Nuclear
heatHeat
AustriaTotal
Solid
fossil
fuels
Manufac-
tured
gases
Peat and
peat
products
Oil shale
and oil
sands

2005 2010 2011 2012 2013 2014 2015 2016 2017
Gross available energy 34 236 34 371 33 389 33 186 33 973 32 899 33 512 33 779 34 445
Solid fossil fuels 4 030 3 375 3 475 3 235 3 319 3 031 3 198 2 970 3 080
Peat & peat products 0 0 0 0 0 0 0 0 0
Oil shale & oil sands 0 0 0 0 0 0 0 0 0
Crude oil & other hydrocarbons 9 238 8 088 8 668 8 719 8 826 8 846 8 971 8 678 8 445
Petroleum products 5 224 4 953 3 578 3 264 3 438 3 059 3 043 3 601 3 887
Natural gas 8 086 8 123 7 667 7 327 7 061 6 444 6 872 7 118 7 776
Nuclear heat 0 0 0 0 0 0 0 0 0
Renewable energies 6 991 9 008 8 591 9 723 10 027 10 002 9 815 10 039 9 943
Non-renewable wastes 441 615 705 676 677 718 748 758 750
Primary production 9 748 11 662 10 999 12 295 12 228 12 320 12 069 12 294 12 335
Solid fossil fuels 0 0 0 0 0 0 0 0 0
Peat 0 0 0 0 0 0 0 0 0
Oil shale and oil sands 0 0 0 0 0 0 0 0 0
Crude oil & other hydrocarbons 947 1 053 835 933 886 991 888 804 746
Natural gas 1 331 1 397 1 377 1 480 1 190 1 081 1 032 965 1 043
Nuclear heat 0 0 0 0 0 0 0 0 0
Renewable energies 7 029 8 596 8 081 9 206 9 475 9 530 9 402 9 768 9 813
Non-renewable wastes 441 615 705 676 677 718 748 758 734
Net imports 24 687 21 889 23 684 21 394 20 901 21 605 20 296 21 115 22 192
Solid fossil fuels 4 031 3 376 3 124 3 338 3 133 3 065 2 767 2 850 3 074
Crude oil 7 951 6 898 7 403 7 585 7 895 7 624 8 201 7 443 7 328
Gas/Diesel Oil (w/o bio) 4 214 4 143 3 497 3 243 3 496 3 297 3 480 4 028 3 985
Motor Gasoline (w/o bio) 328 240 189 85 -22 -99 -149 -73 -110
Naphtha 31 0 -124 -206 -203 -183 -165 -172 -163
LPG 125 114 68 65 42 47 -31 -16 -1
All other oil & petroleum products 664 394 270 282 129 199 -63 62 335
Natural gas 7 152 6 115 7 998 6 270 5 252 6 388 4 989 6 106 7 013
Transformation input 22 517 22 570 22 858 23 347 23 023 22 327 23 069 22 435 23 104
Electricity & heat generation 9 900 10 684 10 210 10 750 10 166 9 584 9 744 9 974 10 411
Refinery intake 9 323 8 302 9 022 9 031 9 152 9 132 9 408 8 850 8 776
Coke ovens 1 320 1 281 1 240 1 249 1 250 1 228 1 227 1 256 1 229
Blast furnaces 1 846 1 854 1 809 1 743 1 863 1 826 1 974 1 926 2 093
Transformation output 18 511 18 698 19 061 19 743 19 601 19 066 19 506 18 976 19 382
Electricity & heat generation 7 158 8 094 7 551 8 256 7 972 7 535 7 594 7 970 8 257
Refinery output 9 227 8 144 8 918 8 936 8 989 8 974 9 219 8 621 8 511
Coke ovens 1 228 1 222 1 191 1 191 1 207 1 169 1 178 1 178 1 180
Blast furnaces 770 791 825 787 844 832 803 779 838
Energy sector 1 891 1 857 1 982 1 855 1 787 1 779 1 535 1 357 1 475
Distribution losses 572 588 587 616 630 617 630 625 625
Available for final consumption 27 098 27 364 26 302 26 411 27 464 26 573 27 064 27 553 27 864
Solid fossil fuels 513 373 359 359 374 365 348 322 342
Manufactured gases 74 100 97 90 95 83 81 100 107
Peat & peat products 0 0 0 0 0 0 0 0 0
Oil shale & oil sands 0 0 0 0 0 0 0 0 0
Gas/Diesel Oil (w/o bio) 8 273 7 406 7 032 6 943 7 301 7 055 7 237 7 455 7 731
Motor Gasoline (w/o bio) 2 137 1 767 1 635 1 588 1 557 1 527 1 542 1 524 1 507
Naphtha 553 800 706 914 916 895 882 896 726
LPG 188 177 150 93 108 112 101 88 92
All other oil & petroleum products 1 291 943 933 842 805 796 750 821 749
Natural gas 4 927 5 115 4 848 4 854 5 011 4 697 4 870 4 964 5 115
Primary solid biofuels & charcoal 2 483 2 758 2 630 2 665 3 069 2 965 2 925 2 955 3 027
Liquid biofuels 83 532 535 527 531 624 683 570 497
All other renewable energies 188 317 333 364 390 408 434 454 469
Non-renewable wastes 229 220 263 234 252 268 280 289 296
Electricity 4 944 5 145 5 141 5 212 5 261 5 176 5 252 5 334 5 399
Heat 1 215 1 711 1 639 1 725 1 791 1 603 1 680 1 781 1 807
Statistical difference 31 0 0 0 0 0 0 0 -1
Final non-energy consumption 1 586 1 810 1 668 1 816 1 805 1 834 1 758 1 845 1 652
Final energy consumption 25 481 25 554 24 634 24 595 25 660 24 740 25 306 25 708 26 213
Industry 7 177 7 494 7 538 7 504 7 770 7 756 7 603 7 810 8 052
Transport 8 415 8 162 7 873 7 795 8 198 8 171 8 429 8 511 8 657
Other sectors 9 889 9 898 9 222 9 296 9 692 8 813 9 275 9 387 9 504
Services 2 987 2 760 2 570 2 513 2 397 2 364 2 418 2 347 2 387
Households 6 426 6 631 6 153 6 288 6 764 5 946 6 341 6 520 6 594
Europe 2020-2030 indicators 2005 2010 2011 2012 2013 2014 2015 2016 2017
Gross inland consumption 34 141 34 230 33 236 33 021 33 793 32 709 33 299 33 551 34 199
Primary energy consumption 32 555 32 419 31 568 31 205 31 988 30 875 31 541 31 705 32 547
Final energy consumption 27 651 27 690 26 809 26 715 27 849 26 863 27 433 27 845 28 418
Source: Eurostat (nrg_bal_c)
109
Austriaktoe
Energy balance sheets — 2017 data

Source: Eurostat (nrg_bal_c)
Source: Eurostat (nrg_bal_c)
Note: Please refer to page 23 for related methodological definitions.
Austria
110Energy balance sheets — 2017 data
0
10 000
20 000
30 000
40 000
50 000
60 000
70 000
80 000
1990 1995 2000 2005 2010 2015 2017
Gross electricity production by fuel, GWh
Solid fossil fuels Oil and petroleum products Natural gas
Renewables and biofuels Nuclear heat Other
0
2 000
4 000
6 000
8 000
10 000
12 000
14 000
16 000
1990 1995 2000 2005 2010 2015 2017
Gross available energy by fuel, ktoe
Solid fossil fuels Oil and petroleum products Natural gas
Renewables and biofuels Nuclear heat Non-renewable waste
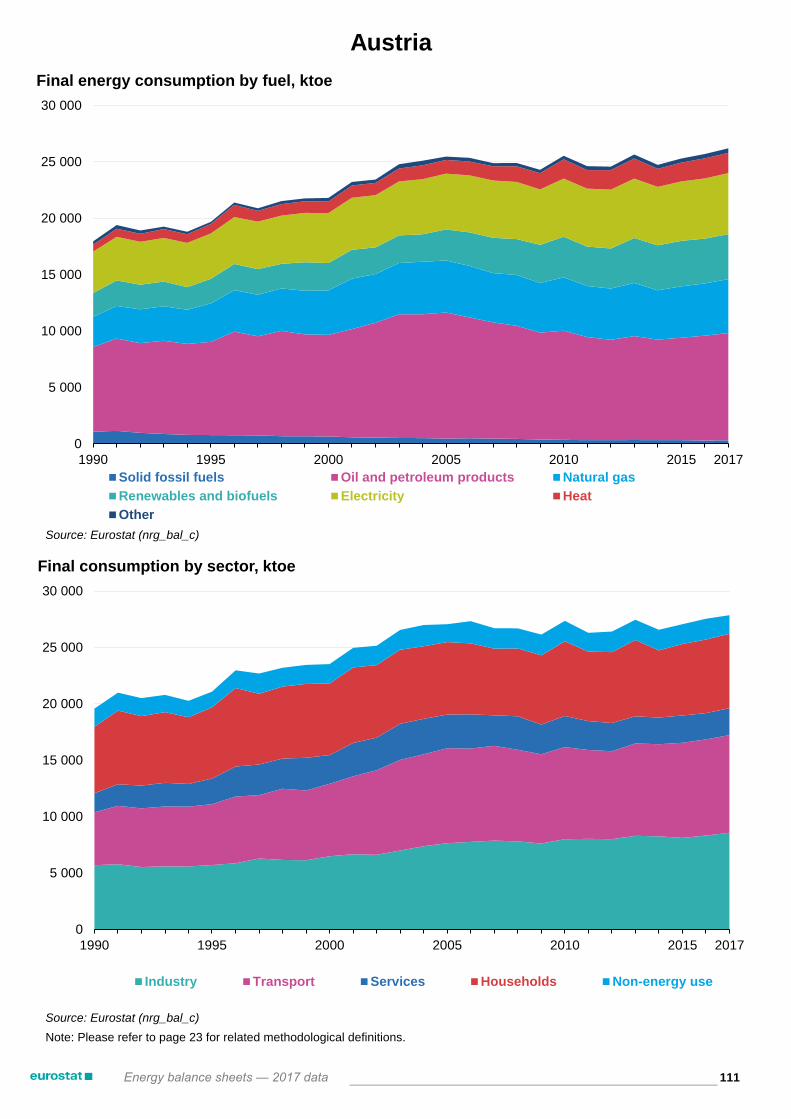
Source: Eurostat (nrg_bal_c)
Source: Eurostat (nrg_bal_c)
Note: Please refer to page 23 for related methodological definitions.
Austria
111Energy balance sheets — 2017 data
0
5 000
10 000
15 000
20 000
25 000
30 000
1990 1995 2000 2005 2010 2015 2017
Final energy consumption by fuel, ktoe
Solid fossil fuels Oil and petroleum products Natural gas
Renewables and biofuels Electricity Heat
Other
0
5 000
10 000
15 000
20 000
25 000
30 000
1990 1995 2000 2005 2010 2015 2017
Final consumption by sector, ktoe
Industry Transport Services Households Non-energy use
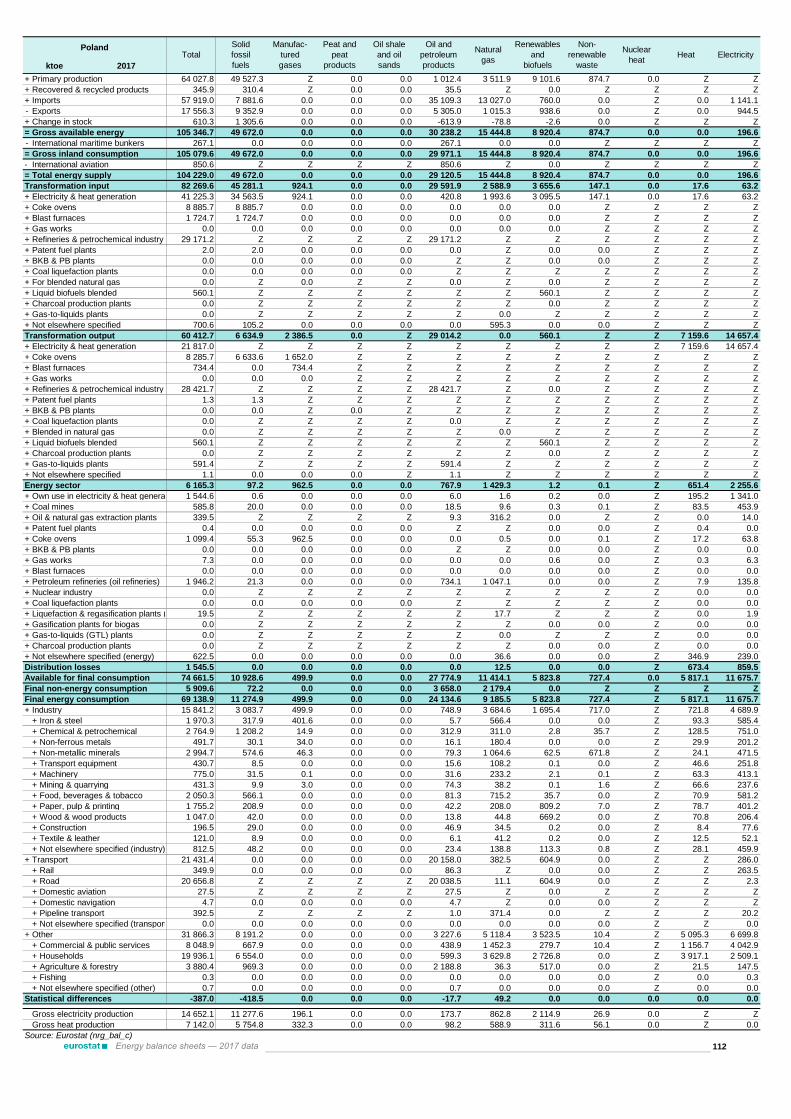
+ Primary production 64 027.8 49 527.3 Z 0.0 0.0 1 012.4 3 511.9 9 101.6 874.7 0.0 Z Z
+ Recovered & recycled products 345.9 310.4 Z 0.0 0.0 35.5 Z 0.0 Z Z Z Z
+ Imports 57 919.0 7 881.6 0.0 0.0 0.0 35 109.3 13 027.0 760.0 0.0 Z 0.0 1 141.1
- Exports 17 556.3 9 352.9 0.0 0.0 0.0 5 305.0 1 015.3 938.6 0.0 Z 0.0 944.5
+ Change in stock 610.3 1 305.6 0.0 0.0 0.0 -613.9 -78.8 -2.6 0.0 Z Z Z
= Gross available energy 105 346.7 49 672.0 0.0 0.0 0.0 30 238.2 15 444.8 8 920.4 874.7 0.0 0.0 196.6
- International maritime bunkers 267.1 0.0 0.0 0.0 0.0 267.1 0.0 0.0 Z Z Z Z
= Gross inland consumption 105 079.6 49 672.0 0.0 0.0 0.0 29 971.1 15 444.8 8 920.4 874.7 0.0 0.0 196.6
- International aviation 850.6 Z Z Z Z 850.6 Z 0.0 Z Z Z Z
= Total energy supply 104 229.0 49 672.0 0.0 0.0 0.0 29 120.5 15 444.8 8 920.4 874.7 0.0 0.0 196.6
Transformation input 82 269.6 45 281.1 924.1 0.0 0.0 29 591.9 2 588.9 3 655.6 147.1 0.0 17.6 63.2
+ Electricity & heat generation 41 225.3 34 563.5 924.1 0.0 0.0 420.8 1 993.6 3 095.5 147.1 0.0 17.6 63.2
+ Coke ovens 8 885.7 8 885.7 0.0 0.0 0.0 0.0 0.0 0.0 Z Z Z Z
+ Blast furnaces 1 724.7 1 724.7 0.0 0.0 0.0 0.0 0.0 0.0 Z Z Z Z
+ Gas works 0.0 0.0 0.0 0.0 0.0 0.0 0.0 0.0 Z Z Z Z
+ Refineries & petrochemical industry 29 171.2 Z Z Z Z 29 171.2 Z Z Z Z Z Z
+ Patent fuel plants 2.0 2.0 0.0 0.0 0.0 0.0 Z 0.0 0.0 Z Z Z
+ BKB & PB plants 0.0 0.0 0.0 0.0 0.0 Z Z 0.0 0.0 Z Z Z
+ Coal liquefaction plants 0.0 0.0 0.0 0.0 0.0 Z Z Z Z Z Z Z
+ For blended natural gas 0.0 Z 0.0 Z Z 0.0 Z 0.0 Z Z Z Z
+ Liquid biofuels blended 560.1 Z Z Z Z Z Z 560.1 Z Z Z Z
+ Charcoal production plants 0.0 Z Z Z Z Z Z 0.0 Z Z Z Z
+ Gas-to-liquids plants 0.0 Z Z Z Z Z 0.0 Z Z Z Z Z
+ Not elsewhere specified 700.6 105.2 0.0 0.0 0.0 0.0 595.3 0.0 0.0 Z Z Z
Transformation output 60 412.7 6 634.9 2 386.5 0.0 Z 29 014.2 0.0 560.1 Z Z 7 159.6 14 657.4
+ Electricity & heat generation 21 817.0 Z Z Z Z Z Z Z Z Z 7 159.6 14 657.4
+ Coke ovens 8 285.7 6 633.6 1 652.0 Z Z Z Z Z Z Z Z Z
+ Blast furnaces 734.4 0.0 734.4 Z Z Z Z Z Z Z Z Z
+ Gas works 0.0 0.0 0.0 Z Z Z Z Z Z Z Z Z
+ Refineries & petrochemical industry 28 421.7 Z Z Z Z 28 421.7 Z 0.0 Z Z Z Z
+ Patent fuel plants 1.3 1.3 Z Z Z Z Z Z Z Z Z Z
+ BKB & PB plants 0.0 0.0 Z 0.0 Z Z Z Z Z Z Z Z
+ Coal liquefaction plants 0.0 Z Z Z Z 0.0 Z Z Z Z Z Z
+ Blended in natural gas 0.0 Z Z Z Z Z 0.0 Z Z Z Z Z
+ Liquid biofuels blended 560.1 Z Z Z Z Z Z 560.1 Z Z Z Z
+ Charcoal production plants 0.0 Z Z Z Z Z Z 0.0 Z Z Z Z
+ Gas-to-liquids plants 591.4 Z Z Z Z 591.4 Z Z Z Z Z Z
+ Not elsewhere specified 1.1 0.0 0.0 0.0 Z 1.1 Z Z Z Z Z Z
Energy sector 6 165.3 97.2 962.5 0.0 0.0 767.9 1 429.3 1.2 0.1 Z 651.4 2 255.6
+ Own use in electricity & heat generation 1 544.6 0.6 0.0 0.0 0.0 6.0 1.6 0.2 0.0 Z 195.2 1 341.0
+ Coal mines 585.8 20.0 0.0 0.0 0.0 18.5 9.6 0.3 0.1 Z 83.5 453.9
+ Oil & natural gas extraction plants 339.5 Z Z Z Z 9.3 316.2 0.0 Z Z 0.0 14.0
+ Patent fuel plants 0.4 0.0 0.0 0.0 0.0 Z Z 0.0 0.0 Z 0.4 0.0
+ Coke ovens 1 099.4 55.3 962.5 0.0 0.0 0.0 0.5 0.0 0.1 Z 17.2 63.8
+ BKB & PB plants 0.0 0.0 0.0 0.0 0.0 Z Z 0.0 0.0 Z 0.0 0.0
+ Gas works 7.3 0.0 0.0 0.0 0.0 0.0 0.0 0.6 0.0 Z 0.3 6.3
+ Blast furnaces 0.0 0.0 0.0 0.0 0.0 0.0 0.0 0.0 0.0 Z 0.0 0.0
+ Petroleum refineries (oil refineries) 1 946.2 21.3 0.0 0.0 0.0 734.1 1 047.1 0.0 0.0 Z 7.9 135.8
+ Nuclear industry 0.0 Z Z Z Z Z Z Z Z Z 0.0 0.0
+ Coal liquefaction plants 0.0 0.0 0.0 0.0 0.0 Z Z Z Z Z 0.0 0.0
+ Liquefaction & regasification plants (LNG) 19.5 Z Z Z Z Z 17.7 Z Z Z 0.0 1.9
+ Gasification plants for biogas 0.0 Z Z Z Z Z Z 0.0 0.0 Z 0.0 0.0
+ Gas-to-liquids (GTL) plants 0.0 Z Z Z Z Z 0.0 Z Z Z 0.0 0.0
+ Charcoal production plants 0.0 Z Z Z Z Z Z 0.0 0.0 Z 0.0 0.0
+ Not elsewhere specified (energy) 622.5 0.0 0.0 0.0 0.0 0.0 36.6 0.0 0.0 Z 346.9 239.0
Distribution losses 1 545.5 0.0 0.0 0.0 0.0 0.0 12.5 0.0 0.0 Z 673.4 859.5
Available for final consumption 74 661.5 10 928.6 499.9 0.0 0.0 27 774.9 11 414.1 5 823.8 727.4 0.0 5 817.1 11 675.7
Final non-energy consumption 5 909.6 72.2 0.0 0.0 0.0 3 658.0 2 179.4 0.0 Z Z Z Z
Final energy consumption 69 138.9 11 274.9 499.9 0.0 0.0 24 134.6 9 185.5 5 823.8 727.4 Z 5 817.1 11 675.7
+ Industry 15 841.2 3 083.7 499.9 0.0 0.0 748.9 3 684.6 1 695.4 717.0 Z 721.8 4 689.9
+ Iron & steel 1 970.3 317.9 401.6 0.0 0.0 5.7 566.4 0.0 0.0 Z 93.3 585.4
+ Chemical & petrochemical 2 764.9 1 208.2 14.9 0.0 0.0 312.9 311.0 2.8 35.7 Z 128.5 751.0
+ Non-ferrous metals 491.7 30.1 34.0 0.0 0.0 16.1 180.4 0.0 0.0 Z 29.9 201.2
+ Non-metallic minerals 2 994.7 574.6 46.3 0.0 0.0 79.3 1 064.6 62.5 671.8 Z 24.1 471.5
+ Transport equipment 430.7 8.5 0.0 0.0 0.0 15.6 108.2 0.1 0.0 Z 46.6 251.8
+ Machinery 775.0 31.5 0.1 0.0 0.0 31.6 233.2 2.1 0.1 Z 63.3 413.1
+ Mining & quarrying 431.3 9.9 3.0 0.0 0.0 74.3 38.2 0.1 1.6 Z 66.6 237.6
+ Food, beverages & tobacco 2 050.3 566.1 0.0 0.0 0.0 81.3 715.2 35.7 0.0 Z 70.9 581.2
+ Paper, pulp & printing 1 755.2 208.9 0.0 0.0 0.0 42.2 208.0 809.2 7.0 Z 78.7 401.2
+ Wood & wood products 1 047.0 42.0 0.0 0.0 0.0 13.8 44.8 669.2 0.0 Z 70.8 206.4
+ Construction 196.5 29.0 0.0 0.0 0.0 46.9 34.5 0.2 0.0 Z 8.4 77.6
+ Textile & leather 121.0 8.9 0.0 0.0 0.0 6.1 41.2 0.2 0.0 Z 12.5 52.1
+ Not elsewhere specified (industry) 812.5 48.2 0.0 0.0 0.0 23.4 138.8 113.3 0.8 Z 28.1 459.9
+ Transport 21 431.4 0.0 0.0 0.0 0.0 20 158.0 382.5 604.9 0.0 Z Z 286.0
+ Rail 349.9 0.0 0.0 0.0 0.0 86.3 Z 0.0 0.0 Z Z 263.5
+ Road 20 656.8 Z Z Z Z 20 038.5 11.1 604.9 0.0 Z Z 2.3
+ Domestic aviation 27.5 Z Z Z Z 27.5 Z 0.0 Z Z Z Z
+ Domestic navigation 4.7 0.0 0.0 0.0 0.0 4.7 Z 0.0 0.0 Z Z Z
+ Pipeline transport 392.5 Z Z Z Z 1.0 371.4 0.0 Z Z Z 20.2
+ Not elsewhere specified (transport) 0.0 0.0 0.0 0.0 0.0 0.0 0.0 0.0 0.0 Z Z 0.0
+ Other 31 866.3 8 191.2 0.0 0.0 0.0 3 227.6 5 118.4 3 523.5 10.4 Z 5 095.3 6 699.8
+ Commercial & public services 8 048.9 667.9 0.0 0.0 0.0 438.9 1 452.3 279.7 10.4 Z 1 156.7 4 042.9
+ Households 19 936.1 6 554.0 0.0 0.0 0.0 599.3 3 629.8 2 726.8 0.0 Z 3 917.1 2 509.1
+ Agriculture & forestry 3 880.4 969.3 0.0 0.0 0.0 2 188.8 36.3 517.0 0.0 Z 21.5 147.5
+ Fishing 0.3 0.0 0.0 0.0 0.0 0.0 0.0 0.0 0.0 Z 0.0 0.3
+ Not elsewhere specified (other) 0.7 0.0 0.0 0.0 0.0 0.7 0.0 0.0 0.0 Z 0.0 0.0
Statistical differences -387.0 -418.5 0.0 0.0 0.0 -17.7 49.2 0.0 0.0 0.0 0.0 0.0
Gross electricity production 14 652.1 11 277.6 196.1 0.0 0.0 173.7 862.8 2 114.9 26.9 0.0 Z Z
Gross heat production 7 142.0 5 754.8 332.3 0.0 0.0 98.2 588.9 311.6 56.1 0.0 Z 0.0
Source: Eurostat (nrg_bal_c)
112Energy balance sheets — 2017 data
Electricity
ktoe 2017
Oil and
petroleum
products
Natural
gas
Renewables
and
biofuels
Non-
renewable
waste
Nuclear
heatHeat
PolandTotal
Solid
fossil
fuels
Manufac-
tured
gases
Peat and
peat
products
Oil shale
and oil
sands

2005 2010 2011 2012 2013 2014 2015 2016 2017
Gross available energy 92 883 101 774 101 770 98 175 98 680 94 853 95 932 100 641 105 347
Solid fossil fuels 54 657 55 222 54 639 50 262 53 191 49 273 48 375 49 537 49 672
Peat & peat products 0 0 0 0 0 0 0 0 0
Oil shale & oil sands 0 0 0 0 0 0 0 0 0
Crude oil & other hydrocarbons 18 878 23 897 25 165 25 965 24 827 24 650 26 643 26 366 26 206
Petroleum products 3 433 2 275 1 174 -552 -1 742 -1 828 -2 376 386 4 032
Natural gas 12 235 12 805 12 836 13 680 13 736 13 404 13 776 14 633 15 445
Nuclear heat 0 0 0 0 0 0 0 0 0
Renewable energies 4 487 7 294 7 966 8 644 8 606 8 653 9 019 8 806 8 920
Non-renewable wastes 156 398 441 419 451 515 523 742 875
Primary production 77 919 66 787 67 741 71 044 70 651 66 963 67 625 66 476 64 028
Solid fossil fuels 68 420 55 077 55 298 57 507 56 835 53 639 53 590 52 092 49 527
Peat 0 0 0 0 0 0 0 0 0
Oil shale and oil sands 0 0 0 0 0 0 0 0 0
Crude oil & other hydrocarbons 909 747 681 709 983 965 943 1 027 1 012
Natural gas 3 884 3 693 3 850 3 907 3 823 3 726 3 683 3 553 3 512
Nuclear heat 0 0 0 0 0 0 0 0 0
Renewable energies 4 549 6 872 7 471 8 502 8 559 8 117 8 886 9 063 9 102
Non-renewable wastes 156 398 441 419 451 515 523 742 875
Net imports 16 474 32 145 34 644 31 268 26 027 27 940 28 677 30 996 40 363
Solid fossil fuels -12 990 -2 741 -546 -3 235 -5 411 -4 220 -5 532 -5 798 -1 471
Crude oil 17 956 22 816 23 855 25 081 23 418 23 645 26 637 24 717 24 795
Gas/Diesel Oil (w/o bio) 2 211 2 164 1 897 1 122 336 483 256 2 707 5 125
Motor Gasoline (w/o bio) -95 -52 13 -259 -492 -316 -410 -168 241
Naphtha -131 -185 -246 -467 -375 -366 -549 -563 -505
LPG 2 389 2 112 2 124 2 012 1 925 1 985 1 999 2 128 2 241
All other oil & petroleum products -371 -1 153 -2 138 -2 931 -3 210 -3 643 -3 784 -3 418 -2 092
Natural gas 8 531 8 874 9 640 10 041 10 192 9 647 9 947 11 469 12 012
Transformation input 72 558 79 710 81 808 82 879 81 642 79 700 83 135 82 261 82 270
Electricity & heat generation 42 686 42 505 42 832 42 369 42 289 40 240 40 939 40 896 41 225
Refinery intake 19 413 24 710 26 122 27 465 26 226 26 019 28 257 27 896 27 651
Coke ovens 7 989 9 185 8 764 8 410 8 903 9 018 9 198 9 091 8 886
Blast furnaces 1 400 1 236 1 307 1 388 1 392 1 639 1 716 1 667 1 725
Transformation output 49 653 56 999 58 017 59 132 58 383 57 216 60 837 60 398 60 413
Electricity & heat generation 21 526 21 577 21 203 21 323 21 373 20 290 20 904 21 322 21 817
Refinery output 18 998 24 140 25 199 26 116 25 373 25 146 27 623 27 198 26 863
Coke ovens 7 500 8 678 8 258 7 869 8 238 8 359 8 593 8 527 8 286
Blast furnaces 721 675 688 689 691 770 795 728 734
Energy sector 5 535 6 045 6 154 6 166 5 883 5 683 6 168 6 050 6 165
Distribution losses 2 095 1 932 1 618 1 737 1 503 1 424 1 537 1 507 1 545
Available for final consumption 61 697 70 362 69 538 65 842 67 369 64 531 65 087 70 355 74 661
Solid fossil fuels 11 437 13 775 13 214 10 169 12 526 10 721 9 704 11 018 10 929
Manufactured gases 819 537 527 521 542 596 487 462 500
Peat & peat products 0 0 0 0 0 0 0 0 0
Oil shale & oil sands 0 0 0 0 0 0 0 0 0
Gas/Diesel Oil (w/o bio) 9 516 12 700 13 094 12 581 11 611 11 411 12 172 14 113 16 719
Motor Gasoline (w/o bio) 4 185 4 252 4 040 3 935 3 722 3 552 3 658 3 865 4 226
Naphtha 733 992 694 681 872 919 1 094 978 1 123
LPG 2 672 2 606 2 530 2 528 2 475 2 527 2 552 2 702 2 794
All other oil & petroleum products 2 757 2 714 2 926 2 424 2 192 2 295 2 520 2 632 2 913
Natural gas 9 926 10 384 10 298 10 680 10 750 10 441 10 473 11 281 11 414
Primary solid biofuels & charcoal 3 755 4 303 4 470 4 462 4 739 4 438 4 599 4 851 4 943
Liquid biofuels 46 867 916 807 748 705 653 458 606
All other renewable energies 52 100 144 165 179 207 233 268 275
Non-renewable wastes 136 378 420 401 434 495 486 637 727
Electricity 9 029 10 206 10 446 10 505 10 624 10 778 10 991 11 422 11 676
Heat 6 634 6 547 5 820 5 984 5 954 5 447 5 462 5 669 5 817
Statistical difference -388 155 932 -2 279 341 -775 -1 326 -249 -387
Final non-energy consumption 4 604 4 969 5 022 4 896 4 970 5 167 5 635 5 571 5 910
Final energy consumption 57 480 65 238 63 584 63 224 62 058 60 139 60 777 65 032 69 139
Industry 14 618 13 499 13 961 13 733 14 211 14 153 14 096 14 652 15 841
Transport 12 221 17 187 17 408 16 680 15 744 15 805 16 561 18 557 21 431
Other sectors 30 641 34 551 32 214 32 811 32 103 30 180 30 121 31 823 31 866
Services 6 730 8 837 8 430 8 364 8 079 7 788 7 842 8 503 8 049
Households 19 469 21 983 20 104 20 779 20 444 18 970 18 948 19 782 19 936
Europe 2020-2030 indicators 2005 2010 2011 2012 2013 2014 2015 2016 2017
Gross inland consumption 92 560 101 533 101 570 97 995 98 501 94 662 95 690 100 405 105 023
Primary energy consumption 87 955 96 564 96 548 93 099 93 532 89 494 90 055 94 833 99 113
Final energy consumption 58 487 66 283 64 672 64 427 63 247 61 547 62 299 66 601 70 923
Source: Eurostat (nrg_bal_c)
113
Polandktoe
Energy balance sheets — 2017 data

Source: Eurostat (nrg_bal_c)
Source: Eurostat (nrg_bal_c)
Note: Please refer to page 23 for related methodological definitions.
Poland
114Energy balance sheets — 2017 data
0
20 000
40 000
60 000
80 000
100 000
120 000
140 000
160 000
180 000
1990 1995 2000 2005 2010 2015 2017
Gross electricity production by fuel, GWh
Solid fossil fuels Oil and petroleum products Natural gas
Renewables and biofuels Nuclear heat Other
0
10 000
20 000
30 000
40 000
50 000
60 000
70 000
80 000
90 000
1990 1995 2000 2005 2010 2015 2017
Gross available energy by fuel, ktoe
Solid fossil fuels Oil and petroleum products Natural gas
Renewables and biofuels Nuclear heat Non-renewable waste

Source: Eurostat (nrg_bal_c)
Source: Eurostat (nrg_bal_c)
Note: Please refer to page 23 for related methodological definitions.
Poland
115Energy balance sheets — 2017 data
0
10 000
20 000
30 000
40 000
50 000
60 000
70 000
80 000
1990 1995 2000 2005 2010 2015 2017
Final energy consumption by fuel, ktoe
Solid fossil fuels Oil and petroleum products Natural gas
Renewables and biofuels Electricity Heat
Other
0
10 000
20 000
30 000
40 000
50 000
60 000
70 000
80 000
1990 1995 2000 2005 2010 2015 2017
Final consumption by sector, ktoe
Industry Transport Services Households Non-energy use

+ Primary production 5 225.1 0.0 Z 0.0 0.0 0.0 0.0 5 071.8 153.2 0.0 Z Z
+ Recovered & recycled products 0.0 0.0 Z 0.0 0.0 0.0 Z 0.0 Z Z Z Z
+ Imports 27 814.9 3 408.0 0.0 0.0 0.0 18 394.6 5 438.0 55.9 45.0 Z 0.0 473.4
- Exports 8 034.7 0.0 0.0 0.0 0.0 7 046.8 0.0 283.7 0.0 Z 0.0 704.2
+ Change in stock -238.5 -180.8 0.0 0.0 0.0 -22.9 -22.6 -12.1 0.0 Z Z Z
= Gross available energy 24 766.8 3 227.1 0.0 0.0 0.0 11 324.9 5 415.4 4 831.9 198.3 0.0 0.0 -230.8
- International maritime bunkers 777.2 0.0 0.0 0.0 0.0 777.2 0.0 0.0 Z Z Z Z
= Gross inland consumption 23 989.6 3 227.1 0.0 0.0 0.0 10 547.7 5 415.4 4 831.9 198.3 0.0 0.0 -230.8
- International aviation 1 280.5 Z Z Z Z 1 280.5 Z 0.0 Z Z Z Z
= Total energy supply 22 709.1 3 227.1 0.0 0.0 0.0 9 267.2 5 415.4 4 831.9 198.3 0.0 0.0 -230.8
Transformation input 26 870.7 3 236.5 0.0 0.0 0.0 16 806.8 3 592.0 2 941.5 102.6 0.0 0.0 191.2
+ Electricity & heat generation 9 798.7 3 236.5 0.0 0.0 0.0 250.8 3 344.5 2 673.1 102.6 0.0 0.0 191.2
+ Coke ovens 0.0 0.0 0.0 0.0 0.0 0.0 0.0 0.0 Z Z Z Z
+ Blast furnaces 0.0 0.0 0.0 0.0 0.0 0.0 0.0 0.0 Z Z Z Z
+ Gas works 0.0 0.0 0.0 0.0 0.0 0.0 0.0 0.0 Z Z Z Z
+ Refineries & petrochemical industry 16 556.0 Z Z Z Z 16 556.0 Z Z Z Z Z Z
+ Patent fuel plants 0.0 0.0 0.0 0.0 0.0 0.0 Z 0.0 0.0 Z Z Z
+ BKB & PB plants 0.0 0.0 0.0 0.0 0.0 Z Z 0.0 0.0 Z Z Z
+ Coal liquefaction plants 0.0 0.0 0.0 0.0 0.0 Z Z Z Z Z Z Z
+ For blended natural gas 0.0 Z 0.0 Z Z 0.0 Z 0.0 Z Z Z Z
+ Liquid biofuels blended 253.0 Z Z Z Z Z Z 253.0 Z Z Z Z
+ Charcoal production plants 15.4 Z Z Z Z Z Z 15.4 Z Z Z Z
+ Gas-to-liquids plants 0.0 Z Z Z Z Z 0.0 Z Z Z Z Z
+ Not elsewhere specified 247.6 0.0 0.0 0.0 0.0 0.0 247.6 0.0 0.0 Z Z Z
Transformation output 22 419.3 0.0 0.0 0.0 Z 16 593.6 0.0 259.3 Z Z 456.2 5 110.2
+ Electricity & heat generation 5 566.4 Z Z Z Z Z Z Z Z Z 456.2 5 110.2
+ Coke ovens 0.0 0.0 0.0 Z Z Z Z Z Z Z Z Z
+ Blast furnaces 0.0 0.0 0.0 Z Z Z Z Z Z Z Z Z
+ Gas works 0.0 0.0 0.0 Z Z Z Z Z Z Z Z Z
+ Refineries & petrochemical industry 16 360.2 Z Z Z Z 16 360.2 Z 0.0 Z Z Z Z
+ Patent fuel plants 0.0 0.0 Z Z Z Z Z Z Z Z Z Z
+ BKB & PB plants 0.0 0.0 Z 0.0 Z Z Z Z Z Z Z Z
+ Coal liquefaction plants 0.0 Z Z Z Z 0.0 Z Z Z Z Z Z
+ Blended in natural gas 0.0 Z Z Z Z Z 0.0 Z Z Z Z Z
+ Liquid biofuels blended 253.1 Z Z Z Z Z Z 253.1 Z Z Z Z
+ Charcoal production plants 6.2 Z Z Z Z Z Z 6.2 Z Z Z Z
+ Gas-to-liquids plants 203.0 Z Z Z Z 203.0 Z Z Z Z Z Z
+ Not elsewhere specified 30.4 0.0 0.0 0.0 Z 30.4 Z Z Z Z Z Z
Energy sector 1 416.9 0.0 0.0 0.0 0.0 821.6 105.4 0.0 0.0 Z 250.7 239.2
+ Own use in electricity & heat generation 151.6 0.0 0.0 0.0 0.0 0.0 0.0 0.0 0.0 Z 0.0 151.6
+ Coal mines 0.1 0.0 0.0 0.0 0.0 0.0 0.0 0.0 0.0 Z 0.0 0.1
+ Oil & natural gas extraction plants 0.1 Z Z Z Z 0.0 0.0 0.0 Z Z 0.0 0.1
+ Patent fuel plants 0.0 0.0 0.0 0.0 0.0 Z Z 0.0 0.0 Z 0.0 0.0
+ Coke ovens 0.0 0.0 0.0 0.0 0.0 0.0 0.0 0.0 0.0 Z 0.0 0.0
+ BKB & PB plants 0.0 0.0 0.0 0.0 0.0 Z Z 0.0 0.0 Z 0.0 0.0
+ Gas works 0.0 0.0 0.0 0.0 0.0 0.0 0.0 0.0 0.0 Z 0.0 0.0
+ Blast furnaces 0.0 0.0 0.0 0.0 0.0 0.0 0.0 0.0 0.0 Z 0.0 0.0
+ Petroleum refineries (oil refineries) 1 251.2 0.0 0.0 0.0 0.0 821.6 105.4 0.0 0.0 Z 250.7 73.5
+ Nuclear industry 0.0 Z Z Z Z Z Z Z Z Z 0.0 0.0
+ Coal liquefaction plants 0.0 0.0 0.0 0.0 0.0 Z Z Z Z Z 0.0 0.0
+ Liquefaction & regasification plants (LNG) 0.0 Z Z Z Z Z 0.0 Z Z Z 0.0 0.0
+ Gasification plants for biogas 0.0 Z Z Z Z Z Z 0.0 0.0 Z 0.0 0.0
+ Gas-to-liquids (GTL) plants 0.0 Z Z Z Z Z 0.0 Z Z Z 0.0 0.0
+ Charcoal production plants 0.0 Z Z Z Z Z Z 0.0 0.0 Z 0.0 0.0
+ Not elsewhere specified (energy) 14.0 0.0 0.0 0.0 0.0 0.0 0.0 0.0 0.0 Z 0.0 14.0
Distribution losses 444.9 0.0 0.0 0.0 0.0 0.0 6.3 0.0 0.0 Z 0.0 438.6
Available for final consumption 16 395.9 -9.4 0.0 0.0 0.0 8 232.3 1 711.7 2 149.7 95.6 0.0 205.5 4 010.4
Final non-energy consumption 1 203.9 0.0 0.0 0.0 0.0 1 203.9 0.0 0.0 Z Z Z Z
Final energy consumption 15 275.2 11.0 0.0 0.0 0.0 7 061.3 1 740.8 2 150.5 95.6 Z 205.5 4 010.4
+ Industry 4 525.7 11.0 0.0 0.0 0.0 621.3 1 214.1 1 016.3 95.6 Z 179.3 1 388.0
+ Iron & steel 182.3 5.4 0.0 0.0 0.0 2.2 40.9 0.1 0.0 Z 0.0 133.7
+ Chemical & petrochemical 398.8 0.0 0.0 0.0 0.0 7.0 168.4 1.2 0.1 Z 17.9 204.2
+ Non-ferrous metals 29.4 0.0 0.0 0.0 0.0 2.2 17.3 0.0 0.0 Z 0.0 9.9
+ Non-metallic minerals 1 123.3 5.3 0.0 0.0 0.0 319.7 446.0 83.5 95.2 Z 8.6 165.1
+ Transport equipment 69.7 0.0 0.0 0.0 0.0 5.7 18.6 0.2 0.0 Z 0.0 45.1
+ Machinery 145.3 0.1 0.0 0.0 0.0 17.8 32.9 0.2 0.0 Z 1.1 93.3
+ Mining & quarrying 73.1 0.0 0.0 0.0 0.0 32.3 1.8 1.7 0.0 Z 0.6 36.7
+ Food, beverages & tobacco 454.4 0.0 0.0 0.0 0.0 70.4 157.4 29.8 0.0 Z 26.9 169.9
+ Paper, pulp & printing 1 408.7 0.0 0.0 0.0 0.0 50.2 158.0 854.5 0.0 Z 80.1 265.9
+ Wood & wood products 110.5 0.0 0.0 0.0 0.0 5.9 10.1 34.1 0.0 Z 0.0 60.4
+ Construction 163.9 0.0 0.0 0.0 0.0 94.5 15.4 3.7 0.0 Z 0.0 50.3
+ Textile & leather 296.9 0.0 0.0 0.0 0.0 10.5 137.1 6.5 0.0 Z 33.6 109.1
+ Not elsewhere specified (industry) 69.4 0.1 0.0 0.0 0.0 2.9 10.2 0.8 0.4 Z 10.6 44.4
+ Transport 5 793.8 0.0 0.0 0.0 0.0 5 495.2 14.7 242.2 0.0 Z Z 41.7
+ Rail 51.2 0.0 0.0 0.0 0.0 10.1 Z 0.0 0.0 Z Z 41.1
+ Road 5 482.0 Z Z Z Z 5 226.2 14.7 240.9 0.0 Z Z 0.2
+ Domestic aviation 168.5 Z Z Z Z 168.5 Z 0.0 Z Z Z Z
+ Domestic navigation 83.9 0.0 0.0 0.0 0.0 82.7 Z 1.3 0.0 Z Z Z
+ Pipeline transport 8.3 Z Z Z Z 7.8 0.0 0.0 Z Z Z 0.5
+ Not elsewhere specified (transport) 0.0 0.0 0.0 0.0 0.0 0.0 0.0 0.0 0.0 Z Z 0.0
+ Other 4 955.7 0.0 0.0 0.0 0.0 944.8 512.0 892.0 0.0 Z 26.2 2 580.7
+ Commercial & public services 1 898.8 0.0 0.0 0.0 0.0 140.0 255.5 70.5 0.0 Z 25.4 1 407.5
+ Households 2 572.5 0.0 0.0 0.0 0.0 421.0 250.7 817.4 0.0 Z 0.9 1 082.5
+ Agriculture & forestry 372.2 0.0 0.0 0.0 0.0 279.1 5.8 2.7 0.0 Z 0.0 84.6
+ Fishing 88.6 0.0 0.0 0.0 0.0 81.5 0.0 1.1 0.0 Z 0.0 6.0
+ Not elsewhere specified (other) 23.6 0.0 0.0 0.0 0.0 23.2 0.0 0.4 0.0 Z 0.0 0.0
Statistical differences -83.3 -20.4 0.0 0.0 0.0 -32.9 -29.1 -0.8 0.0 0.0 0.0 -0.0
Gross electricity production 5 110.2 1 261.0 0.0 0.0 0.0 110.1 1 624.6 2 090.1 24.4 0.0 Z Z
Gross heat production 456.2 0.0 0.0 0.0 0.0 0.8 455.4 0.0 0.0 0.0 Z 0.0
Source: Eurostat (nrg_bal_c)
116Energy balance sheets — 2017 data
Electricity
ktoe 2017
Oil and
petroleum
products
Natural
gas
Renewables
and
biofuels
Non-
renewable
waste
Nuclear
heatHeat
PortugalTotal
Solid
fossil
fuels
Manufac-
tured
gases
Peat and
peat
products
Oil shale
and oil
sands

2005 2010 2011 2012 2013 2014 2015 2016 2017
Gross available energy 28 015 24 828 24 317 22 964 23 035 22 722 23 621 23 687 24 767
Solid fossil fuels 3 349 1 658 2 208 2 934 2 650 2 680 3 258 2 846 3 227
Peat & peat products 0 0 0 0 0 0 0 0 0
Oil shale & oil sands 0 0 0 0 0 0 0 0 0
Crude oil & other hydrocarbons 13 706 12 147 11 043 11 900 14 084 12 654 15 165 14 981 15 497
Petroleum products 3 008 692 1 040 -989 -3 164 -1 847 -4 169 -3 860 -4 172
Natural gas 3 751 4 489 4 464 3 933 3 756 3 473 4 051 4 323 5 415
Nuclear heat 0 0 0 0 0 0 0 0 0
Renewable energies 3 475 5 459 5 141 4 355 5 301 5 513 4 966 5 625 4 832
Non-renewable wastes 140 159 180 152 170 170 155 208 198
Primary production 3 615 5 800 5 530 4 707 5 751 5 981 5 304 6 002 5 225
Solid fossil fuels 0 0 0 0 0 0 0 0 0
Peat 0 0 0 0 0 0 0 0 0
Oil shale and oil sands 0 0 0 0 0 0 0 0 0
Crude oil & other hydrocarbons 0 0 0 0 0 0 0 0 0
Natural gas 0 0 0 0 0 0 0 0 0
Nuclear heat 0 0 0 0 0 0 0 0 0
Renewable energies 3 475 5 642 5 380 4 563 5 607 5 835 5 182 5 827 5 072
Non-renewable wastes 140 159 149 144 144 146 122 174 153
Net imports 24 811 18 675 18 914 18 249 16 896 16 377 18 482 17 540 19 780
Solid fossil fuels 3 225 1 629 2 148 3 032 2 529 2 597 3 209 2 912 3 408
Crude oil 13 425 11 479 10 634 11 368 12 551 10 838 14 360 14 115 14 588
Gas/Diesel Oil (w/o bio) 689 1 170 1 250 547 -1 151 -617 -1 567 -1 152 -1 222
Motor Gasoline (w/o bio) -710 -901 -639 -778 -1 255 -867 -1 738 -1 660 -1 851
Naphtha 184 80 259 -335 -182 -272 -367 -488 -561
LPG 531 403 439 389 589 862 735 680 618
All other oil & petroleum products 2 987 293 240 -369 56 580 -238 -517 -225
Natural gas 3 893 4 505 4 533 3 922 3 813 3 475 4 065 4 261 5 438
Transformation input 22 984 20 724 19 745 20 305 23 180 22 241 25 252 25 592 26 871
Electricity & heat generation 8 651 8 065 8 232 7 831 7 950 8 038 8 607 9 167 9 799
Refinery intake 13 915 12 241 11 117 12 028 14 494 13 170 15 623 15 427 16 015
Coke ovens 0 0 0 0 0 0 0 0 0
Blast furnaces 0 0 0 0 0 0 0 0 0
Transformation output 18 730 17 709 16 369 16 808 20 007 18 978 21 382 21 805 22 419
Electricity & heat generation 4 332 5 155 5 004 4 521 5 054 5 052 4 976 5 637 5 566
Refinery output 13 966 12 136 10 971 11 872 14 266 12 933 15 443 15 250 15 832
Coke ovens 0 0 0 0 0 0 0 0 0
Blast furnaces 0 0 0 0 0 0 0 0 0
Energy sector 1 101 1 149 1 000 1 067 1 507 1 225 1 370 1 424 1 417
Distribution losses 387 396 356 423 474 452 429 426 445
Available for final consumption 20 941 18 932 18 113 16 449 16 304 16 210 16 264 16 137 16 396
Solid fossil fuels 30 60 8 25 25 14 12 14 -9
Manufactured gases 0 0 0 0 0 0 0 0 0
Peat & peat products 0 0 0 0 0 0 0 0 0
Oil shale & oil sands 0 0 0 0 0 0 0 0 0
Gas/Diesel Oil (w/o bio) 5 652 5 194 4 838 4 415 4 329 4 406 4 514 4 670 4 746
Motor Gasoline (w/o bio) 1 925 1 462 1 313 1 209 1 132 1 133 1 092 1 073 1 088
Naphtha 1 467 1 232 1 246 959 803 758 694 564 667
LPG 977 783 769 625 894 1 066 927 862 785
All other oil & petroleum products 2 672 1 428 1 255 1 035 961 919 1 023 884 946
Natural gas 1 345 1 565 1 582 1 640 1 628 1 539 1 580 1 607 1 712
Primary solid biofuels & charcoal 2 505 2 151 2 162 1 756 1 837 1 741 1 719 1 773 1 772
Liquid biofuels 0 326 310 286 275 274 343 279 253
All other renewable energies 23 49 61 114 105 117 120 119 125
Non-renewable wastes 34 55 76 63 70 86 56 90 96
Electricity 3 983 4 290 4 159 3 976 3 891 3 886 3 939 3 989 4 010
Heat 328 338 334 345 352 270 244 211 206
Statistical difference 97 -17 -38 23 25 -31 -35 -61 -83
Final non-energy consumption 2 587 1 728 1 755 1 318 1 358 1 437 1 335 1 161 1 204
Final energy consumption 18 257 17 221 16 396 15 108 14 921 14 804 14 964 15 037 15 275
Industry 5 797 5 454 5 349 4 606 4 599 4 406 4 412 4 382 4 526
Transport 6 434 6 425 5 964 5 528 5 446 5 475 5 567 5 690 5 794
Other sectors 6 026 5 342 5 083 4 974 4 875 4 923 4 985 4 965 4 956
Services 2 200 1 883 1 855 1 843 1 787 1 901 1 969 1 900 1 899
Households 3 219 2 969 2 776 2 695 2 635 2 566 2 539 2 605 2 572
Europe 2020-2030 indicators 2005 2010 2011 2012 2013 2014 2015 2016 2017
Gross inland consumption 27 438 24 370 23 759 22 360 22 392 22 116 22 980 22 924 23 990
Primary energy consumption 24 851 22 643 22 004 21 042 21 034 20 680 21 645 21 763 22 786
Final energy consumption 19 011 18 099 17 311 16 031 15 854 15 770 16 010 16 187 16 556
Source: Eurostat (nrg_bal_c)
117
Portugalktoe
Energy balance sheets — 2017 data

Source: Eurostat (nrg_bal_c)
Source: Eurostat (nrg_bal_c)
Note: Please refer to page 23 for related methodological definitions.
Portugal
118Energy balance sheets — 2017 data
0
10 000
20 000
30 000
40 000
50 000
60 000
70 000
1990 1995 2000 2005 2010 2015 2017
Gross electricity production by fuel, GWh
Solid fossil fuels Oil and petroleum products Natural gas
Renewables and biofuels Nuclear heat Other
0
2 000
4 000
6 000
8 000
10 000
12 000
14 000
16 000
18 000
1990 1995 2000 2005 2010 2015 2017
Gross available energy by fuel, ktoe
Solid fossil fuels Oil and petroleum products Natural gas
Renewables and biofuels Nuclear heat Non-renewable waste

Source: Eurostat (nrg_bal_c)
Source: Eurostat (nrg_bal_c)
Note: Please refer to page 23 for related methodological definitions.
Portugal
119Energy balance sheets — 2017 data
0
2 000
4 000
6 000
8 000
10 000
12 000
14 000
16 000
18 000
20 000
1990 1995 2000 2005 2010 2015 2017
Final energy consumption by fuel, ktoe
Solid fossil fuels Oil and petroleum products Natural gas
Renewables and biofuels Electricity Heat
Other
0
5 000
10 000
15 000
20 000
25 000
1990 1995 2000 2005 2010 2015 2017
Final consumption by sector, ktoe
Industry Transport Services Households Non-energy use

+ Primary production 25 475.1 4 466.8 Z 1.5 0.0 3 638.5 8 522.2 5 844.5 94.8 2 907.0 Z Z
+ Recovered & recycled products 0.0 0.0 Z 0.0 0.0 0.0 Z 0.0 Z Z Z Z
+ Imports 13 692.0 990.0 0.0 10.5 0.0 11 047.8 952.7 274.7 0.0 Z 0.0 416.3
- Exports 5 953.6 0.5 0.0 0.1 0.0 5 197.3 20.7 69.9 0.0 Z 0.0 665.1
+ Change in stock 259.5 -67.7 0.0 0.0 0.0 172.0 165.9 -8.9 -1.8 Z Z Z
= Gross available energy 33 473.0 5 388.7 0.0 11.9 0.0 9 660.9 9 620.0 6 040.5 92.9 2 907.0 0.0 -248.8
- International maritime bunkers 27.9 0.0 0.0 0.0 0.0 27.9 0.0 0.0 Z Z Z Z
= Gross inland consumption 33 445.1 5 388.7 0.0 11.9 0.0 9 633.0 9 620.0 6 040.5 92.9 2 907.0 0.0 -248.8
- International aviation 335.9 Z Z Z Z 335.9 Z 0.0 Z Z Z Z
= Total energy supply 33 109.1 5 388.7 0.0 11.9 0.0 9 297.0 9 620.0 6 040.5 92.9 2 907.0 0.0 -248.8
Transformation input 26 101.8 4 717.1 29.6 0.0 0.0 12 846.8 3 036.2 2 524.8 0.2 2 907.0 0.0 40.1
+ Electricity & heat generation 12 941.7 4 483.0 29.6 0.0 0.0 291.0 2 939.1 2 251.7 0.2 2 907.0 0.0 40.1
+ Coke ovens 0.0 0.0 0.0 0.0 0.0 0.0 0.0 0.0 Z Z Z Z
+ Blast furnaces 234.0 234.0 0.0 0.0 0.0 0.0 0.0 0.0 Z Z Z Z
+ Gas works 0.0 0.0 0.0 0.0 0.0 0.0 0.0 0.0 Z Z Z Z
+ Refineries & petrochemical industry 12 555.8 Z Z Z Z 12 555.8 Z Z Z Z Z Z
+ Patent fuel plants 0.0 0.0 0.0 0.0 0.0 0.0 Z 0.0 0.0 Z Z Z
+ BKB & PB plants 0.0 0.0 0.0 0.0 0.0 Z Z 0.0 0.0 Z Z Z
+ Coal liquefaction plants 0.0 0.0 0.0 0.0 0.0 Z Z Z Z Z Z Z
+ For blended natural gas 0.0 Z 0.0 Z Z 0.0 Z 0.0 Z Z Z Z
+ Liquid biofuels blended 273.1 Z Z Z Z Z Z 273.1 Z Z Z Z
+ Charcoal production plants 0.0 Z Z Z Z Z Z 0.0 Z Z Z Z
+ Gas-to-liquids plants 0.0 Z Z Z Z Z 0.0 Z Z Z Z Z
+ Not elsewhere specified 97.1 0.0 0.0 0.0 0.0 0.0 97.1 0.0 0.0 Z Z Z
Transformation output 20 834.2 0.0 224.7 0.0 Z 13 026.4 0.0 273.1 Z Z 1 781.6 5 528.5
+ Electricity & heat generation 7 310.0 Z Z Z Z Z Z Z Z Z 1 781.6 5 528.5
+ Coke ovens 0.0 0.0 0.0 Z Z Z Z Z Z Z Z Z
+ Blast furnaces 224.7 0.0 224.7 Z Z Z Z Z Z Z Z Z
+ Gas works 0.0 0.0 0.0 Z Z Z Z Z Z Z Z Z
+ Refineries & petrochemical industry 12 941.5 Z Z Z Z 12 941.5 Z 0.0 Z Z Z Z
+ Patent fuel plants 0.0 0.0 Z Z Z Z Z Z Z Z Z Z
+ BKB & PB plants 0.0 0.0 Z 0.0 Z Z Z Z Z Z Z Z
+ Coal liquefaction plants 0.0 Z Z Z Z 0.0 Z Z Z Z Z Z
+ Blended in natural gas 0.0 Z Z Z Z Z 0.0 Z Z Z Z Z
+ Liquid biofuels blended 273.1 Z Z Z Z Z Z 273.1 Z Z Z Z
+ Charcoal production plants 0.0 Z Z Z Z Z Z 0.0 Z Z Z Z
+ Gas-to-liquids plants 84.8 Z Z Z Z 84.8 Z Z Z Z Z Z
+ Not elsewhere specified 0.0 0.0 0.0 0.0 Z 0.0 Z Z Z Z Z Z
Energy sector 2 480.3 17.0 13.9 0.0 0.0 910.2 468.8 12.3 0.0 Z 275.5 782.7
+ Own use in electricity & heat generation 652.8 16.8 13.9 0.0 0.0 15.9 36.4 12.2 0.0 Z 132.8 424.8
+ Coal mines 91.5 0.2 0.0 0.0 0.0 16.5 0.1 0.0 0.0 Z 2.4 72.3
+ Oil & natural gas extraction plants 369.8 Z Z Z Z 12.8 233.6 0.0 Z Z 0.0 123.3
+ Patent fuel plants 0.0 0.0 0.0 0.0 0.0 Z Z 0.0 0.0 Z 0.0 0.0
+ Coke ovens 0.0 0.0 0.0 0.0 0.0 0.0 0.0 0.0 0.0 Z 0.0 0.0
+ BKB & PB plants 0.0 0.0 0.0 0.0 0.0 Z Z 0.0 0.0 Z 0.0 0.0
+ Gas works 0.0 0.0 0.0 0.0 0.0 0.0 0.0 0.0 0.0 Z 0.0 0.0
+ Blast furnaces 0.0 0.0 0.0 0.0 0.0 0.0 0.0 0.0 0.0 Z 0.0 0.0
+ Petroleum refineries (oil refineries) 1 054.4 0.0 0.0 0.0 0.0 645.1 194.9 0.0 0.0 Z 104.8 109.5
+ Nuclear industry 1.1 Z Z Z Z Z Z Z Z Z 0.0 1.1
+ Coal liquefaction plants 0.0 0.0 0.0 0.0 0.0 Z Z Z Z Z 0.0 0.0
+ Liquefaction & regasification plants (LNG) 0.0 Z Z Z Z Z 0.0 Z Z Z 0.0 0.0
+ Gasification plants for biogas 0.0 Z Z Z Z Z Z 0.0 0.0 Z 0.0 0.0
+ Gas-to-liquids (GTL) plants 0.0 Z Z Z Z Z 0.0 Z Z Z 0.0 0.0
+ Charcoal production plants 0.0 Z Z Z Z Z Z 0.0 0.0 Z 0.0 0.0
+ Not elsewhere specified (energy) 310.7 0.0 0.0 0.0 0.0 219.9 3.7 0.0 0.0 Z 35.4 51.7
Distribution losses 996.4 0.0 30.9 0.0 0.0 6.3 77.2 0.4 0.0 Z 280.2 601.4
Available for final consumption 24 364.9 654.6 150.2 11.9 0.0 8 560.1 6 037.9 3 776.1 92.7 0.0 1 225.9 3 855.5
Final non-energy consumption 1 070.5 1.3 0.0 0.0 0.0 726.6 342.6 0.0 Z Z Z Z
Final energy consumption 22 860.0 627.8 150.2 11.8 0.0 7 571.6 5 520.3 3 778.6 92.7 Z 1 263.6 3 843.4
+ Industry 6 390.2 593.5 150.2 0.0 0.0 945.1 2 181.1 292.2 88.9 Z 271.3 1 867.9
+ Iron & steel 1 352.6 490.5 150.2 0.0 0.0 4.6 486.6 0.0 1.1 Z 1.1 218.5
+ Chemical & petrochemical 1 329.1 32.9 0.0 0.0 0.0 258.5 586.8 4.9 14.5 Z 165.1 266.3
+ Non-ferrous metals 288.7 0.0 0.0 0.0 0.0 0.0 0.0 0.0 0.0 Z 0.0 288.7
+ Non-metallic minerals 1 015.0 60.3 0.0 0.0 0.0 337.9 269.6 48.1 64.5 Z 7.0 227.6
+ Transport equipment 229.6 0.0 0.0 0.0 0.0 0.0 95.0 0.0 0.0 Z 11.6 123.1
+ Machinery 392.6 0.0 0.0 0.0 0.0 15.6 148.1 4.5 0.1 Z 13.1 211.2
+ Mining & quarrying 41.3 0.0 0.0 0.0 0.0 15.6 0.7 2.3 0.0 Z 0.1 22.7
+ Food, beverages & tobacco 578.8 9.5 0.0 0.0 0.0 46.1 295.1 34.6 6.6 Z 24.7 162.2
+ Paper, pulp & printing 170.2 0.0 0.0 0.0 0.0 0.2 96.9 3.6 2.0 Z 3.1 64.4
+ Wood & wood products 329.1 0.0 0.0 0.0 0.0 13.6 25.1 165.0 0.0 Z 34.9 90.5
+ Construction 349.6 0.2 0.0 0.0 0.0 245.6 63.1 3.9 0.1 Z 1.9 34.7
+ Textile & leather 162.5 0.0 0.0 0.0 0.0 2.3 97.2 0.8 0.0 Z 3.7 58.5
+ Not elsewhere specified (industry) 151.0 0.0 0.0 0.0 0.0 5.2 16.8 24.6 0.0 Z 5.0 99.6
+ Transport 6 149.2 0.0 0.0 0.0 0.0 5 757.9 0.2 297.4 0.0 Z Z 93.7
+ Rail 204.1 0.0 0.0 0.0 0.0 115.4 Z 0.1 0.0 Z Z 88.6
+ Road 5 853.4 Z Z Z Z 5 552.8 0.0 297.2 0.0 Z Z 3.3
+ Domestic aviation 49.3 Z Z Z Z 49.3 Z 0.0 Z Z Z Z
+ Domestic navigation 40.4 0.0 0.0 0.0 0.0 40.4 Z 0.0 0.0 Z Z Z
+ Pipeline transport 2.0 Z Z Z Z 0.0 0.2 0.0 Z Z Z 1.8
+ Not elsewhere specified (transport) 0.0 0.0 0.0 0.0 0.0 0.0 0.0 0.0 0.0 Z Z 0.0
+ Other 10 320.5 34.3 0.0 11.8 0.0 868.5 3 339.0 3 189.0 3.7 Z 992.3 1 881.8
+ Commercial & public services 1 840.7 0.0 0.0 0.0 0.0 89.4 812.0 22.8 3.7 Z 177.8 735.0
+ Households 7 679.3 34.3 0.0 0.0 0.0 281.7 2 421.2 3 054.0 0.0 Z 804.9 1 083.1
+ Agriculture & forestry 493.5 0.0 0.0 11.8 0.0 296.2 105.7 6.4 0.0 Z 9.6 63.7
+ Fishing 0.1 0.0 0.0 0.0 0.0 0.0 0.0 0.0 0.0 Z 0.0 0.0
+ Not elsewhere specified (other) 306.9 0.0 0.0 0.0 0.0 201.1 0.0 105.8 0.0 Z 0.0 0.0
Statistical differences 434.4 25.6 0.0 0.0 0.0 261.9 175.0 -2.5 0.0 0.0 -37.8 12.1
Gross electricity production 5 528.5 1 442.8 6.6 0.0 0.0 54.4 916.3 2 118.7 0.0 989.6 Z Z
Gross heat production 1 781.6 393.6 5.1 0.0 0.0 118.0 1 188.5 76.2 0.2 0.0 Z 0.0
Source: Eurostat (nrg_bal_c)
120Energy balance sheets — 2017 data
Electricity
ktoe 2017
Oil and
petroleum
products
Natural
gas
Renewables
and
biofuels
Non-
renewable
waste
Nuclear
heatHeat
RomaniaTotal
Solid
fossil
fuels
Manufac-
tured
gases
Peat and
peat
products
Oil shale
and oil
sands

2005 2010 2011 2012 2013 2014 2015 2016 2017
Gross available energy 38 636 35 041 35 784 34 999 31 910 31 647 31 899 31 789 33 473
Solid fossil fuels 8 754 6 949 8 093 7 560 5 708 5 728 5 892 5 278 5 389
Peat & peat products 3 8 8 0 8 7 8 9 12
Oil shale & oil sands 0 0 0 0 0 0 0 0 0
Crude oil & other hydrocarbons 14 544 10 264 9 808 8 918 9 639 10 816 11 005 11 848 12 278
Petroleum products -4 798 -1 587 -1 143 -509 -1 625 -2 775 -2 330 -3 017 -2 617
Natural gas 13 923 10 788 11 105 10 777 9 839 9 349 8 917 9 024 9 620
Nuclear heat 1 433 2 923 2 979 3 009 2 922 2 941 2 940 2 811 2 907
Renewable energies 4 940 5 860 5 070 5 195 5 551 6 124 5 973 6 189 6 040
Non-renewable wastes 85 30 29 27 41 70 72 80 93
Primary production 27 988 27 449 27 570 27 262 25 875 26 339 26 439 24 799 25 475
Solid fossil fuels 5 793 5 903 6 662 6 346 4 656 4 449 4 711 4 234 4 467
Peat 1 1 0 0 0 0 1 1 1
Oil shale and oil sands 0 0 0 0 0 0 0 0 0
Crude oil & other hydrocarbons 5 989 4 265 4 206 3 955 4 095 4 026 3 993 3 795 3 638
Natural gas 9 701 8 619 8 667 8 683 8 600 8 766 8 785 7 784 8 522
Nuclear heat 1 433 2 923 2 979 3 009 2 922 2 941 2 940 2 811 2 907
Renewable energies 4 984 5 708 5 027 5 242 5 561 6 090 5 935 6 096 5 844
Non-renewable wastes 85 30 29 27 41 68 74 78 95
Net imports 10 502 7 430 7 504 7 798 5 778 5 192 5 243 6 876 7 738
Solid fossil fuels 2 904 1 172 1 077 1 222 1 042 953 982 1 028 990
Crude oil 8 560 5 684 5 319 5 014 5 172 6 590 6 463 7 358 7 645
Gas/Diesel Oil (w/o bio) -1 755 460 562 848 255 -650 -398 -464 -184
Motor Gasoline (w/o bio) -2 759 -1 347 -1 711 -1 492 -1 624 -1 714 -1 745 -2 075 -1 894
Naphtha -124 -143 -103 -59 -65 -109 -129 -108 -246
LPG -20 -115 -109 -110 -105 -83 -86 -136 -91
All other oil & petroleum products -247 -43 83 122 119 309 528 412 620
Natural gas 4 190 1 816 2 464 2 297 1 165 465 161 1 175 932
Transformation input 32 203 26 030 26 342 25 260 23 778 26 066 26 056 25 537 26 102
Electricity & heat generation 14 105 13 811 15 038 14 142 12 617 13 031 13 321 12 749 12 942
Refinery intake 14 746 10 876 10 375 9 768 10 030 11 558 11 439 12 073 12 397
Coke ovens 1 595 2 0 0 0 0 0 0 0
Blast furnaces 1 480 558 178 213 226 222 254 249 234
Transformation output 25 956 20 622 20 085 18 608 18 603 20 942 20 647 20 632 20 834
Electricity & heat generation 8 158 7 610 7 711 7 211 7 089 7 509 7 530 7 431 7 310
Refinery output 15 246 11 473 11 008 10 092 10 399 11 979 11 845 12 517 12 790
Coke ovens 1 462 2 0 0 0 0 0 0 0
Blast furnaces 593 223 178 213 226 213 244 239 225
Energy sector 4 476 3 229 3 013 2 846 2 709 2 631 2 337 2 411 2 480
Distribution losses 1 879 1 425 1 363 1 335 1 116 1 069 1 077 1 073 996
Available for final consumption 25 907 24 797 24 996 24 018 22 702 22 536 22 792 23 078 24 365
Solid fossil fuels 749 450 681 759 533 603 659 654 655
Manufactured gases 572 172 142 189 196 174 169 159 150
Peat & peat products 3 8 8 0 8 7 8 9 12
Oil shale & oil sands 0 0 0 0 0 0 0 0 0
Gas/Diesel Oil (w/o bio) 2 934 4 218 4 706 4 589 4 267 4 348 4 661 4 904 5 431
Motor Gasoline (w/o bio) 1 622 1 586 1 415 1 408 1 316 1 431 1 369 1 405 1 457
Naphtha 405 279 185 3 7 -50 -10 79 1
LPG 747 496 510 350 387 478 447 475 532
All other oil & petroleum products 1 848 1 490 1 382 884 1 019 836 1 328 1 084 1 140
Natural gas 8 313 6 779 7 074 6 922 6 325 6 149 5 600 5 557 6 038
Primary solid biofuels & charcoal 3 159 3 920 3 358 3 565 3 499 3 442 3 325 3 413 3 446
Liquid biofuels 0 99 152 195 203 167 202 253 296
All other renewable energies 17 24 32 27 35 26 25 33 34
Non-renewable wastes 60 30 27 27 40 69 72 78 93
Electricity 3 341 3 566 3 665 3 616 3 466 3 608 3 709 3 746 3 856
Heat 2 135 1 681 1 658 1 484 1 401 1 247 1 228 1 229 1 226
Statistical difference -306 720 220 -340 -386 -454 67 0 434
Final non-energy consumption 2 627 2 057 2 223 1 729 1 457 1 520 1 125 1 143 1 070
Final energy consumption 23 587 22 021 22 553 22 629 21 631 21 470 21 600 21 935 22 860
Industry 8 998 6 484 7 060 6 748 6 273 6 427 6 419 6 264 6 390
Transport 4 155 4 948 5 175 5 315 5 189 5 266 5 338 5 738 6 149
Other sectors 10 434 10 589 10 318 10 566 10 170 9 777 9 844 9 933 10 321
Services 1 670 1 881 1 774 1 763 1 785 1 768 1 762 1 806 1 841
Households 7 991 8 102 7 860 8 061 7 722 7 410 7 375 7 415 7 679
Europe 2020-2030 indicators 2005 2010 2011 2012 2013 2014 2015 2016 2017
Gross inland consumption 38 636 35 025 35 775 34 985 31 868 31 566 31 855 31 758 33 445
Primary energy consumption 36 009 32 968 33 552 33 256 30 411 30 047 30 730 30 615 32 375
Final energy consumption 24 600 22 522 22 698 22 763 21 796 21 686 21 850 22 237 23 205
Source: Eurostat (nrg_bal_c)
121
Romaniaktoe
Energy balance sheets — 2017 data

Source: Eurostat (nrg_bal_c)
Source: Eurostat (nrg_bal_c)
Note: Please refer to page 23 for related methodological definitions.
Romania
122Energy balance sheets — 2017 data
0
10 000
20 000
30 000
40 000
50 000
60 000
70 000
1990 1995 2000 2005 2010 2015 2017
Gross electricity production by fuel, GWh
Solid fossil fuels Oil and petroleum products Natural gas
Renewables and biofuels Nuclear heat Other
0
5 000
10 000
15 000
20 000
25 000
30 000
35 000
1990 1995 2000 2005 2010 2015 2017
Gross available energy by fuel, ktoe
Solid fossil fuels Oil and petroleum products Natural gas
Renewables and biofuels Nuclear heat Non-renewable waste

Source: Eurostat (nrg_bal_c)
Source: Eurostat (nrg_bal_c)
Note: Please refer to page 23 for related methodological definitions.
Romania
123Energy balance sheets — 2017 data
0
5 000
10 000
15 000
20 000
25 000
30 000
35 000
40 000
45 000
1990 1995 2000 2005 2010 2015 2017
Final energy consumption by fuel, ktoe
Solid fossil fuels Oil and petroleum products Natural gas
Renewables and biofuels Electricity Heat
Other
0
5 000
10 000
15 000
20 000
25 000
30 000
35 000
40 000
45 000
50 000
1990 1995 2000 2005 2010 2015 2017
Final consumption by sector, ktoe
Industry Transport Services Households Non-energy use

+ Primary production 3 515.0 933.4 Z 0.0 0.0 0.5 7.2 1 034.7 51.1 1 488.1 Z Z
+ Recovered & recycled products 0.0 0.0 Z 0.0 0.0 0.0 Z 0.0 Z Z Z Z
+ Imports 6 444.0 197.9 0.0 0.0 0.0 4 681.0 734.5 45.3 0.0 Z 0.0 785.3
- Exports 2 950.0 0.0 0.0 0.0 0.0 2 117.3 3.1 0.0 0.0 Z 0.0 829.6
+ Change in stock -74.0 9.1 0.0 0.0 0.0 -82.2 0.0 -0.9 0.0 Z Z Z
= Gross available energy 6 935.0 1 140.4 0.0 0.0 0.0 2 482.0 738.6 1 079.1 51.1 1 488.1 0.0 -44.3
- International maritime bunkers 154.2 0.0 0.0 0.0 0.0 154.2 0.0 0.0 Z Z Z Z
= Gross inland consumption 6 780.8 1 140.4 0.0 0.0 0.0 2 327.8 738.6 1 079.1 51.1 1 488.1 0.0 -44.3
- International aviation 26.4 Z Z Z Z 26.4 Z 0.0 Z Z Z Z
= Total energy supply 6 754.4 1 140.4 0.0 0.0 0.0 2 301.4 738.6 1 079.1 51.1 1 488.1 0.0 -44.3
Transformation input 3 227.7 1 089.2 0.0 0.0 0.0 8.5 122.1 479.4 8.9 1 488.1 0.0 31.4
+ Electricity & heat generation 3 192.5 1 089.2 0.0 0.0 0.0 8.5 122.1 444.3 8.9 1 488.1 0.0 31.4
+ Coke ovens 0.0 0.0 0.0 0.0 0.0 0.0 0.0 0.0 Z Z Z Z
+ Blast furnaces 0.0 0.0 0.0 0.0 0.0 0.0 0.0 0.0 Z Z Z Z
+ Gas works 0.0 0.0 0.0 0.0 0.0 0.0 0.0 0.0 Z Z Z Z
+ Refineries & petrochemical industry 0.0 Z Z Z Z 0.0 Z Z Z Z Z Z
+ Patent fuel plants 0.0 0.0 0.0 0.0 0.0 0.0 Z 0.0 0.0 Z Z Z
+ BKB & PB plants 0.0 0.0 0.0 0.0 0.0 Z Z 0.0 0.0 Z Z Z
+ Coal liquefaction plants 0.0 0.0 0.0 0.0 0.0 Z Z Z Z Z Z Z
+ For blended natural gas 0.0 Z 0.0 Z Z 0.0 Z 0.0 Z Z Z Z
+ Liquid biofuels blended 35.2 Z Z Z Z Z Z 35.2 Z Z Z Z
+ Charcoal production plants 0.0 Z Z Z Z Z Z 0.0 Z Z Z Z
+ Gas-to-liquids plants 0.0 Z Z Z Z Z 0.0 Z Z Z Z Z
+ Not elsewhere specified 0.0 0.0 0.0 0.0 0.0 0.0 0.0 0.0 0.0 Z Z Z
Transformation output 1 664.7 0.0 0.0 0.0 Z 0.0 0.0 35.2 Z Z 225.7 1 403.8
+ Electricity & heat generation 1 629.5 Z Z Z Z Z Z Z Z Z 225.7 1 403.8
+ Coke ovens 0.0 0.0 0.0 Z Z Z Z Z Z Z Z Z
+ Blast furnaces 0.0 0.0 0.0 Z Z Z Z Z Z Z Z Z
+ Gas works 0.0 0.0 0.0 Z Z Z Z Z Z Z Z Z
+ Refineries & petrochemical industry 0.0 Z Z Z Z 0.0 Z 0.0 Z Z Z Z
+ Patent fuel plants 0.0 0.0 Z Z Z Z Z Z Z Z Z Z
+ BKB & PB plants 0.0 0.0 Z 0.0 Z Z Z Z Z Z Z Z
+ Coal liquefaction plants 0.0 Z Z Z Z 0.0 Z Z Z Z Z Z
+ Blended in natural gas 0.0 Z Z Z Z Z 0.0 Z Z Z Z Z
+ Liquid biofuels blended 35.2 Z Z Z Z Z Z 35.2 Z Z Z Z
+ Charcoal production plants 0.0 Z Z Z Z Z Z 0.0 Z Z Z Z
+ Gas-to-liquids plants 0.0 Z Z Z Z 0.0 Z Z Z Z Z Z
+ Not elsewhere specified 0.0 0.0 0.0 0.0 Z 0.0 Z Z Z Z Z Z
Energy sector 102.4 0.0 0.0 0.0 0.0 0.3 1.3 0.0 0.0 Z 12.9 87.9
+ Own use in electricity & heat generation 91.9 0.0 0.0 0.0 0.0 0.1 1.2 0.0 0.0 Z 10.7 79.9
+ Coal mines 7.1 0.0 0.0 0.0 0.0 0.2 0.0 0.0 0.0 Z 2.0 4.8
+ Oil & natural gas extraction plants 0.0 Z Z Z Z 0.0 0.0 0.0 Z Z 0.0 0.0
+ Patent fuel plants 0.0 0.0 0.0 0.0 0.0 Z Z 0.0 0.0 Z 0.0 0.0
+ Coke ovens 0.0 0.0 0.0 0.0 0.0 0.0 0.0 0.0 0.0 Z 0.0 0.0
+ BKB & PB plants 0.0 0.0 0.0 0.0 0.0 Z Z 0.0 0.0 Z 0.0 0.0
+ Gas works 0.0 0.0 0.0 0.0 0.0 0.0 0.0 0.0 0.0 Z 0.0 0.0
+ Blast furnaces 0.0 0.0 0.0 0.0 0.0 0.0 0.0 0.0 0.0 Z 0.0 0.0
+ Petroleum refineries (oil refineries) 0.0 0.0 0.0 0.0 0.0 0.0 0.0 0.0 0.0 Z 0.0 0.0
+ Nuclear industry 0.0 Z Z Z Z Z Z Z Z Z 0.0 0.0
+ Coal liquefaction plants 0.0 0.0 0.0 0.0 0.0 Z Z Z Z Z 0.0 0.0
+ Liquefaction & regasification plants (LNG) 0.0 Z Z Z Z Z 0.0 Z Z Z 0.0 0.0
+ Gasification plants for biogas 0.0 Z Z Z Z Z Z 0.0 0.0 Z 0.0 0.0
+ Gas-to-liquids (GTL) plants 0.0 Z Z Z Z Z 0.0 Z Z Z 0.0 0.0
+ Charcoal production plants 0.0 Z Z Z Z Z Z 0.0 0.0 Z 0.0 0.0
+ Not elsewhere specified (energy) 3.4 0.0 0.0 0.0 0.0 0.0 0.0 0.0 0.0 Z 0.2 3.2
Distribution losses 108.6 0.0 0.0 0.0 0.0 0.0 0.0 0.0 0.0 Z 31.8 76.8
Available for final consumption 4 980.5 51.3 0.0 0.0 0.0 2 292.6 615.3 634.8 42.1 0.0 181.1 1 163.4
Final non-energy consumption 140.4 7.0 0.0 0.0 0.0 128.0 5.4 0.0 Z Z Z Z
Final energy consumption 4 837.1 38.6 0.0 0.0 0.0 2 167.3 609.9 634.8 42.1 Z 181.1 1 163.4
+ Industry 1 295.6 38.3 0.0 0.0 0.0 96.1 438.7 74.7 42.1 Z 51.4 554.3
+ Iron & steel 158.3 6.2 0.0 0.0 0.0 2.1 78.0 0.0 0.0 Z 1.3 70.7
+ Chemical & petrochemical 163.9 0.0 0.0 0.0 0.0 4.1 46.8 22.7 1.3 Z 29.5 59.6
+ Non-ferrous metals 169.6 1.6 0.0 0.0 0.0 7.1 44.0 0.0 0.0 Z 0.7 116.2
+ Non-metallic minerals 192.8 11.3 0.0 0.0 0.0 31.5 75.6 0.9 40.9 Z 0.0 32.6
+ Transport equipment 36.1 0.0 0.0 0.0 0.0 1.6 12.9 0.0 0.0 Z 0.2 21.2
+ Machinery 142.6 0.0 0.0 0.0 0.0 10.5 37.2 1.7 0.0 Z 6.8 86.4
+ Mining & quarrying 18.6 0.0 0.0 0.0 0.0 2.2 3.7 0.0 0.0 Z 0.0 12.7
+ Food, beverages & tobacco 66.5 0.0 0.0 0.0 0.0 9.0 27.0 1.1 0.0 Z 3.6 25.8
+ Paper, pulp & printing 170.2 19.2 0.0 0.0 0.0 1.2 76.8 11.8 0.0 Z 1.1 60.1
+ Wood & wood products 47.0 0.0 0.0 0.0 0.0 1.2 0.0 32.0 0.0 Z 0.4 13.3
+ Construction 30.9 0.0 0.0 0.0 0.0 21.4 4.8 0.2 0.0 Z 0.3 4.2
+ Textile & leather 20.8 0.0 0.0 0.0 0.0 1.5 8.3 0.9 0.0 Z 1.2 8.9
+ Not elsewhere specified (industry) 78.3 0.0 0.0 0.0 0.0 2.7 23.5 3.4 0.0 Z 6.2 42.5
+ Transport 1 848.7 0.2 0.0 0.0 0.0 1 781.9 3.3 43.3 0.0 Z Z 20.0
+ Rail 28.7 0.2 0.0 0.0 0.0 9.2 Z 0.0 0.0 Z Z 19.4
+ Road 1 819.0 Z Z Z Z 1 772.4 3.3 43.3 0.0 Z Z 0.1
+ Domestic aviation 0.4 Z Z Z Z 0.4 Z 0.0 Z Z Z Z
+ Domestic navigation 0.0 0.0 0.0 0.0 0.0 0.0 Z 0.0 0.0 Z Z Z
+ Pipeline transport 0.0 Z Z Z Z 0.0 0.0 0.0 Z Z Z 0.0
+ Not elsewhere specified (transport) 0.6 0.0 0.0 0.0 0.0 0.0 0.0 0.0 0.0 Z Z 0.6
+ Other 1 692.8 0.1 0.0 0.0 0.0 289.2 167.9 516.8 0.0 Z 129.7 589.1
+ Commercial & public services 480.2 0.0 0.0 0.0 0.0 65.7 48.9 12.0 0.0 Z 50.7 303.0
+ Households 1 120.4 0.1 0.0 0.0 0.0 134.0 119.1 502.2 0.0 Z 79.0 286.1
+ Agriculture & forestry 72.9 0.0 0.0 0.0 0.0 70.3 0.0 2.6 0.0 Z 0.0 0.0
+ Fishing 0.0 0.0 0.0 0.0 0.0 0.0 0.0 0.0 0.0 Z 0.0 0.0
+ Not elsewhere specified (other) 19.2 0.0 0.0 0.0 0.0 19.2 0.0 0.0 0.0 Z 0.0 0.0
Statistical differences 3.0 5.7 0.0 0.0 0.0 -2.7 0.0 0.0 0.0 0.0 0.0 0.0
Gross electricity production 1 403.8 414.8 0.0 0.0 0.0 1.2 40.7 405.9 0.8 540.4 Z Z
Gross heat production 225.7 120.8 0.0 0.0 0.0 4.7 60.7 36.5 3.1 0.0 Z 0.0
Source: Eurostat (nrg_bal_c)
124Energy balance sheets — 2017 data
Electricity
ktoe 2017
Oil and
petroleum
products
Natural
gas
Renewables
and
biofuels
Non-
renewable
waste
Nuclear
heatHeat
SloveniaTotal
Solid
fossil
fuels
Manufac-
tured
gases
Peat and
peat
products
Oil shale
and oil
sands

2005 2010 2011 2012 2013 2014 2015 2016 2017
Gross available energy 7 346 7 235 7 237 6 978 6 813 6 568 6 508 6 793 6 935
Solid fossil fuels 1 538 1 453 1 465 1 393 1 352 1 049 1 068 1 147 1 140
Peat & peat products 0 0 0 0 0 0 0 0 0
Oil shale & oil sands 0 0 0 0 0 0 0 0 0
Crude oil & other hydrocarbons 0 0 0 0 0 0 0 0 0
Petroleum products 2 602 2 622 2 613 2 556 2 420 2 384 2 353 2 524 2 482
Natural gas 929 863 738 710 692 626 664 705 739
Nuclear heat 1 518 1 335 1 471 1 308 1 251 1 500 1 332 1 349 1 488
Renewable energies 774 1 121 1 040 1 069 1 174 1 202 1 052 1 124 1 079
Non-renewable wastes 13 23 29 32 35 43 43 45 51
Primary production 3 492 3 652 3 705 3 453 3 478 3 521 3 262 3 445 3 515
Solid fossil fuels 1 184 1 196 1 201 1 093 1 075 818 862 942 933
Peat 0 0 0 0 0 0 0 0 0
Oil shale and oil sands 0 0 0 0 0 0 0 0 0
Crude oil & other hydrocarbons 0 0 0 0 0 0 0 0 1
Natural gas 3 6 2 2 3 3 3 4 7
Nuclear heat 1 518 1 335 1 471 1 308 1 251 1 500 1 332 1 349 1 488
Renewable energies 774 1 091 1 003 1 018 1 115 1 157 1 022 1 105 1 035
Non-renewable wastes 13 23 29 32 35 43 43 45 51
Net imports 3 855 3 584 3 516 3 635 3 254 2 987 3 236 3 349 3 494
Solid fossil fuels 323 280 257 300 264 226 204 198 198
Crude oil 0 0 0 0 0 0 0 0 0
Gas/Diesel Oil (w/o bio) 1 541 1 691 1 725 1 808 1 556 1 581 1 576 1 677 1 703
Motor Gasoline (w/o bio) 706 604 591 553 479 437 446 449 432
Naphtha 0 0 0 0 0 0 0 0 0
LPG 98 95 91 88 82 81 89 88 97
All other oil & petroleum products 290 210 199 215 237 230 232 318 332
Natural gas 925 857 736 708 689 623 662 701 731
Transformation input 3 413 3 407 3 475 3 304 3 275 3 309 2 954 3 099 3 228
Electricity & heat generation 3 413 3 365 3 443 3 258 3 222 3 273 2 931 3 085 3 193
Refinery intake 0 0 0 0 0 0 0 0 0
Coke ovens 0 0 0 0 0 0 0 0 0
Blast furnaces 0 0 0 0 0 0 0 0 0
Transformation output 1 541 1 688 1 645 1 626 1 667 1 731 1 529 1 648 1 665
Electricity & heat generation 1 541 1 647 1 613 1 580 1 610 1 695 1 506 1 634 1 630
Refinery output 0 0 0 0 0 0 0 0 0
Coke ovens 0 0 0 0 0 0 0 0 0
Blast furnaces 0 0 0 0 0 0 0 0 0
Energy sector 104 112 110 111 108 104 100 101 102
Distribution losses 122 119 106 109 105 101 103 105 109
Available for final consumption 5 204 5 238 5 135 5 006 4 906 4 702 4 790 4 993 4 980
Solid fossil fuels 127 71 68 66 70 48 50 52 51
Manufactured gases 0 0 0 0 0 0 0 0 0
Peat & peat products 0 0 0 0 0 0 0 0 0
Oil shale & oil sands 0 0 0 0 0 0 0 0 0
Gas/Diesel Oil (w/o bio) 1 510 1 710 1 729 1 711 1 609 1 582 1 582 1 708 1 627
Motor Gasoline (w/o bio) 693 604 587 530 483 452 442 438 422
Naphtha 0 0 0 0 0 0 0 0 0
LPG 101 93 88 92 85 81 90 88 92
All other oil & petroleum products 240 160 146 140 149 171 140 141 151
Natural gas 791 699 583 552 545 523 563 604 615
Primary solid biofuels & charcoal 438 576 571 546 571 491 538 556 531
Liquid biofuels 0 46 37 52 64 44 29 18 43
All other renewable energies 1 36 39 42 46 48 51 56 60
Non-renewable wastes 12 23 23 24 27 36 35 36 42
Electricity 1 096 1 027 1 075 1 069 1 073 1 071 1 100 1 120 1 163
Heat 196 192 191 183 183 154 169 175 181
Statistical difference 21 17 10 11 17 -5 4 10 3
Final non-energy consumption 311 211 126 122 117 141 126 128 140
Final energy consumption 4 872 5 009 4 999 4 873 4 771 4 565 4 660 4 855 4 837
Industry 1 646 1 274 1 237 1 207 1 198 1 231 1 228 1 242 1 296
Transport 1 463 1 778 1 882 1 899 1 814 1 795 1 773 1 883 1 849
Other sectors 1 764 1 957 1 880 1 766 1 760 1 538 1 659 1 730 1 693
Services 476 533 531 453 468 427 455 492 480
Households 1 190 1 326 1 265 1 219 1 203 1 017 1 111 1 148 1 120
Europe 2020-2030 indicators 2005 2010 2011 2012 2013 2014 2015 2016 2017
Gross inland consumption 7 324 7 216 7 205 6 928 6 752 6 511 6 444 6 672 6 781
Primary energy consumption 7 014 7 005 7 079 6 806 6 635 6 369 6 318 6 544 6 640
Final energy consumption 4 896 5 038 5 023 4 897 4 797 4 591 4 686 4 877 4 863
Source: Eurostat (nrg_bal_c)
125
Sloveniaktoe
Energy balance sheets — 2017 data

Source: Eurostat (nrg_bal_c)
Source: Eurostat (nrg_bal_c)
Note: Please refer to page 23 for related methodological definitions.
Slovenia
126Energy balance sheets — 2017 data
0
2 000
4 000
6 000
8 000
10 000
12 000
14 000
16 000
18 000
20 000
1990 1995 2000 2005 2010 2015 2017
Gross electricity production by fuel, GWh
Solid fossil fuels Oil and petroleum products Natural gas
Renewables and biofuels Nuclear heat Other
0
500
1 000
1 500
2 000
2 500
3 000
3 500
1990 1995 2000 2005 2010 2015 2017
Gross available energy by fuel, ktoe
Solid fossil fuels Oil and petroleum products Natural gas
Renewables and biofuels Nuclear heat Non-renewable waste

Source: Eurostat (nrg_bal_c)
Source: Eurostat (nrg_bal_c)
Note: Please refer to page 23 for related methodological definitions.
Slovenia
127Energy balance sheets — 2017 data
0
1 000
2 000
3 000
4 000
5 000
6 000
1990 1995 2000 2005 2010 2015 2017
Final energy consumption by fuel, ktoe
Solid fossil fuels Oil and petroleum products Natural gas
Renewables and biofuels Electricity Heat
Other
0
1 000
2 000
3 000
4 000
5 000
6 000
1990 1995 2000 2005 2010 2015 2017
Final consumption by sector, ktoe
Industry Transport Services Households Non-energy use

+ Primary production 6 369.6 446.4 Z 0.0 0.0 8.0 116.8 1 615.1 198.3 3 985.0 Z Z
+ Recovered & recycled products 0.0 0.0 Z 0.0 0.0 0.0 Z 0.0 Z Z Z Z
+ Imports 16 431.2 3 018.6 0.0 0.0 0.0 7 578.3 4 367.8 119.2 7.2 Z 2.0 1 338.2
- Exports 5 246.3 53.2 0.0 0.0 0.0 3 978.3 0.0 137.0 0.0 Z 0.0 1 077.8
+ Change in stock -306.4 -35.0 0.0 0.0 0.0 82.6 -347.9 -5.5 -0.6 Z Z Z
= Gross available energy 17 248.2 3 376.8 0.0 0.0 0.0 3 690.6 4 136.7 1 591.9 204.9 3 985.0 2.0 260.4
- International maritime bunkers 0.0 0.0 0.0 0.0 0.0 0.0 0.0 0.0 Z Z Z Z
= Gross inland consumption 17 248.2 3 376.8 0.0 0.0 0.0 3 690.6 4 136.7 1 591.9 204.9 3 985.0 2.0 260.4
- International aviation 40.3 Z Z Z Z 40.3 Z 0.0 Z Z Z Z
= Total energy supply 17 207.9 3 376.8 0.0 0.0 0.0 3 650.3 4 136.7 1 591.9 204.9 3 985.0 2.0 260.4
Transformation input 16 991.8 4 001.0 76.1 0.0 0.0 6 878.5 826.1 1 169.7 17.5 3 985.0 0.0 37.9
+ Electricity & heat generation 6 924.1 940.2 76.1 0.0 0.0 222.4 652.0 993.1 17.5 3 985.0 0.0 37.9
+ Coke ovens 1 462.5 1 462.5 0.0 0.0 0.0 0.0 0.0 0.0 Z Z Z Z
+ Blast furnaces 1 598.4 1 598.4 0.0 0.0 0.0 0.0 0.0 0.0 Z Z Z Z
+ Gas works 0.0 0.0 0.0 0.0 0.0 0.0 0.0 0.0 Z Z Z Z
+ Refineries & petrochemical industry 6 656.2 Z Z Z Z 6 656.2 Z Z Z Z Z Z
+ Patent fuel plants 0.0 0.0 0.0 0.0 0.0 0.0 Z 0.0 0.0 Z Z Z
+ BKB & PB plants 0.0 0.0 0.0 0.0 0.0 Z Z 0.0 0.0 Z Z Z
+ Coal liquefaction plants 0.0 0.0 0.0 0.0 0.0 Z Z Z Z Z Z Z
+ For blended natural gas 0.0 Z 0.0 Z Z 0.0 Z 0.0 Z Z Z Z
+ Liquid biofuels blended 176.6 Z Z Z Z Z Z 176.6 Z Z Z Z
+ Charcoal production plants 0.0 Z Z Z Z Z Z 0.0 Z Z Z Z
+ Gas-to-liquids plants 0.0 Z Z Z Z Z 0.0 Z Z Z Z Z
+ Not elsewhere specified 174.1 0.0 0.0 0.0 0.0 0.0 174.1 0.0 0.0 Z Z Z
Transformation output 12 434.7 1 118.4 914.7 0.0 Z 6 937.6 0.0 176.6 Z Z 902.4 2 385.0
+ Electricity & heat generation 3 287.4 Z Z Z Z Z Z Z Z Z 902.4 2 385.0
+ Coke ovens 1 391.1 1 118.4 272.7 Z Z Z Z Z Z Z Z Z
+ Blast furnaces 642.0 0.0 642.0 Z Z Z Z Z Z Z Z Z
+ Gas works 0.0 0.0 0.0 Z Z Z Z Z Z Z Z Z
+ Refineries & petrochemical industry 6 577.2 Z Z Z Z 6 577.2 Z 0.0 Z Z Z Z
+ Patent fuel plants 0.0 0.0 Z Z Z Z Z Z Z Z Z Z
+ BKB & PB plants 0.0 0.0 Z 0.0 Z Z Z Z Z Z Z Z
+ Coal liquefaction plants 0.0 Z Z Z Z 0.0 Z Z Z Z Z Z
+ Blended in natural gas 0.0 Z Z Z Z Z 0.0 Z Z Z Z Z
+ Liquid biofuels blended 176.6 Z Z Z Z Z Z 176.6 Z Z Z Z
+ Charcoal production plants 0.0 Z Z Z Z Z Z 0.0 Z Z Z Z
+ Gas-to-liquids plants 144.7 Z Z Z Z 144.7 Z Z Z Z Z Z
+ Not elsewhere specified 215.7 0.0 0.0 0.0 Z 215.7 Z Z Z Z Z Z
Energy sector 1 285.5 0.5 376.4 0.0 0.0 408.3 92.9 0.0 0.0 Z 127.1 280.2
+ Own use in electricity & heat generation 244.2 0.0 0.0 0.0 0.0 0.0 0.6 0.0 0.0 Z 67.6 175.9
+ Coal mines 8.3 0.5 0.0 0.0 0.0 0.0 0.1 0.0 0.0 Z 1.5 6.1
+ Oil & natural gas extraction plants 8.7 Z Z Z Z 0.0 7.9 0.0 Z Z 0.0 0.8
+ Patent fuel plants 0.0 0.0 0.0 0.0 0.0 Z Z 0.0 0.0 Z 0.0 0.0
+ Coke ovens 185.0 0.0 151.0 0.0 0.0 0.0 0.0 0.0 0.0 Z 28.4 5.5
+ BKB & PB plants 0.0 0.0 0.0 0.0 0.0 Z Z 0.0 0.0 Z 0.0 0.0
+ Gas works 0.0 0.0 0.0 0.0 0.0 0.0 0.0 0.0 0.0 Z 0.0 0.0
+ Blast furnaces 255.5 0.0 225.4 0.0 0.0 0.0 1.8 0.0 0.0 Z 10.7 17.6
+ Petroleum refineries (oil refineries) 578.3 0.0 0.0 0.0 0.0 408.3 78.2 0.0 0.0 Z 18.8 72.9
+ Nuclear industry 0.0 Z Z Z Z Z Z Z Z Z 0.0 0.0
+ Coal liquefaction plants 0.0 0.0 0.0 0.0 0.0 Z Z Z Z Z 0.0 0.0
+ Liquefaction & regasification plants (LNG) 0.0 Z Z Z Z Z 0.0 Z Z Z 0.0 0.0
+ Gasification plants for biogas 0.0 Z Z Z Z Z Z 0.0 0.0 Z 0.0 0.0
+ Gas-to-liquids (GTL) plants 0.0 Z Z Z Z Z 0.0 Z Z Z 0.0 0.0
+ Charcoal production plants 0.0 Z Z Z Z Z Z 0.0 0.0 Z 0.0 0.0
+ Not elsewhere specified (energy) 5.5 0.0 0.0 0.0 0.0 0.0 4.1 0.0 0.0 Z 0.0 1.4
Distribution losses 327.9 0.3 28.2 0.0 0.0 0.0 82.9 0.0 0.0 Z 107.9 108.6
Available for final consumption 11 037.3 493.3 434.0 0.0 0.0 3 301.0 3 134.8 598.8 187.4 0.0 669.4 2 218.7
Final non-energy consumption 1 099.3 52.7 0.0 0.0 0.0 661.4 385.3 0.0 Z Z Z Z
Final energy consumption 9 903.0 405.7 434.0 0.0 0.0 2 639.6 2 749.5 598.8 187.4 Z 669.4 2 218.7
+ Industry 3 452.4 299.3 434.0 0.0 0.0 140.8 854.9 349.7 177.4 Z 133.9 1 062.4
+ Iron & steel 1 054.8 232.5 434.0 0.0 0.0 0.0 158.8 4.7 0.0 Z 0.0 224.8
+ Chemical & petrochemical 368.5 0.0 0.0 0.0 0.0 73.5 109.9 0.3 25.5 Z 64.0 95.3
+ Non-ferrous metals 266.5 3.4 0.0 0.0 0.0 3.1 35.2 0.0 0.0 Z 0.0 224.9
+ Non-metallic minerals 468.5 49.3 0.0 0.0 0.0 50.8 160.9 0.2 151.2 Z 4.0 52.1
+ Transport equipment 158.1 1.6 0.0 0.0 0.0 0.0 69.8 0.1 0.0 Z 3.2 83.3
+ Machinery 254.8 0.0 0.0 0.0 0.0 1.1 102.7 4.7 0.7 Z 0.0 145.6
+ Mining & quarrying 10.6 0.5 0.0 0.0 0.0 4.1 2.4 0.1 0.0 Z 0.0 3.5
+ Food, beverages & tobacco 141.3 12.0 0.0 0.0 0.0 1.0 80.8 1.7 0.0 Z 4.8 41.0
+ Paper, pulp & printing 478.3 0.0 0.0 0.0 0.0 1.0 45.8 308.7 0.0 Z 54.2 68.5
+ Wood & wood products 47.5 0.0 0.0 0.0 0.0 0.0 5.6 23.6 0.0 Z 1.8 16.4
+ Construction 29.3 0.0 0.0 0.0 0.0 6.2 15.5 0.5 0.0 Z 0.9 6.3
+ Textile & leather 26.3 0.0 0.0 0.0 0.0 0.0 14.1 0.1 0.0 Z 1.0 11.0
+ Not elsewhere specified (industry) 148.2 0.0 0.0 0.0 0.0 0.0 53.4 5.0 0.0 Z 0.0 89.8
+ Transport 2 772.7 0.0 0.0 0.0 0.0 2 422.2 150.6 149.5 0.0 Z Z 50.4
+ Rail 42.6 0.0 0.0 0.0 0.0 0.0 Z 0.0 0.0 Z Z 42.6
+ Road 2 539.7 Z Z Z Z 2 388.1 0.0 149.5 0.0 Z Z 2.2
+ Domestic aviation 0.0 Z Z Z Z 0.0 Z 0.0 Z Z Z Z
+ Domestic navigation 0.0 0.0 0.0 0.0 0.0 0.0 Z 0.0 0.0 Z Z Z
+ Pipeline transport 143.6 Z Z Z Z 0.0 143.6 0.0 Z Z Z 0.0
+ Not elsewhere specified (transport) 46.8 0.0 0.0 0.0 0.0 34.1 7.1 0.0 0.0 Z Z 5.7
+ Other 3 677.9 106.3 0.0 0.0 0.0 76.6 1 744.0 99.7 10.0 Z 535.4 1 105.8
+ Commercial & public services 1 426.7 71.5 0.0 0.0 0.0 6.3 571.5 24.8 10.0 Z 82.9 659.8
+ Households 2 108.6 34.6 0.0 0.0 0.0 8.8 1 150.0 40.6 0.0 Z 451.9 422.7
+ Agriculture & forestry 142.6 0.3 0.0 0.0 0.0 61.5 22.6 34.3 0.0 Z 0.7 23.3
+ Fishing 0.0 0.0 0.0 0.0 0.0 0.0 0.0 0.0 0.0 Z 0.0 0.0
+ Not elsewhere specified (other) 0.0 0.0 0.0 0.0 0.0 0.0 0.0 0.0 0.0 Z 0.0 0.0
Statistical differences 35.0 35.0 0.0 0.0 0.0 0.0 0.0 0.0 0.0 0.0 0.0 0.0
Gross electricity production 2 371.7 257.2 47.2 0.0 0.0 37.7 143.3 587.4 2.2 1 296.7 Z Z
Gross heat production 902.2 206.1 3.3 0.0 0.0 117.2 372.4 150.7 0.7 50.1 Z 1.6
Source: Eurostat (nrg_bal_c)
128Energy balance sheets — 2017 data
Electricity
ktoe 2017
Oil and
petroleum
products
Natural
gas
Renewables
and
biofuels
Non-
renewable
waste
Nuclear
heatHeat
Slovak RepublicTotal
Solid
fossil
fuels
Manufac-
tured
gases
Peat and
peat
products
Oil shale
and oil
sands
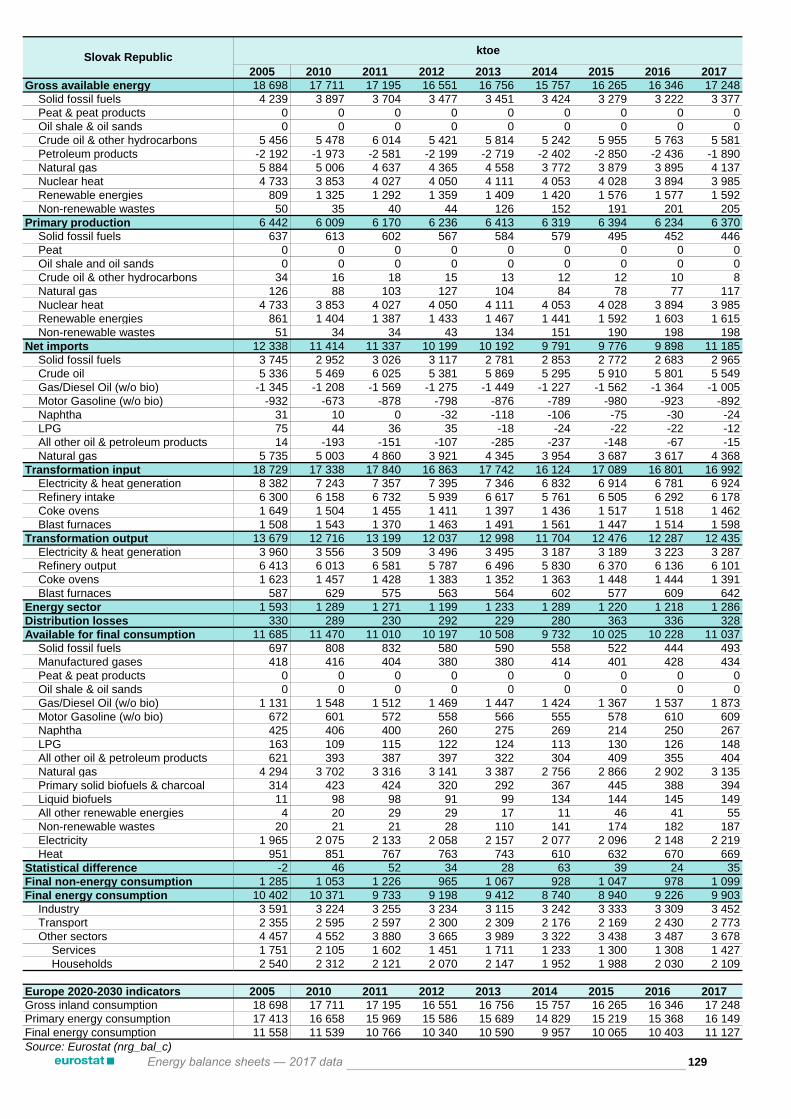
2005 2010 2011 2012 2013 2014 2015 2016 2017
Gross available energy 18 698 17 711 17 195 16 551 16 756 15 757 16 265 16 346 17 248
Solid fossil fuels 4 239 3 897 3 704 3 477 3 451 3 424 3 279 3 222 3 377
Peat & peat products 0 0 0 0 0 0 0 0 0
Oil shale & oil sands 0 0 0 0 0 0 0 0 0
Crude oil & other hydrocarbons 5 456 5 478 6 014 5 421 5 814 5 242 5 955 5 763 5 581
Petroleum products -2 192 -1 973 -2 581 -2 199 -2 719 -2 402 -2 850 -2 436 -1 890
Natural gas 5 884 5 006 4 637 4 365 4 558 3 772 3 879 3 895 4 137
Nuclear heat 4 733 3 853 4 027 4 050 4 111 4 053 4 028 3 894 3 985
Renewable energies 809 1 325 1 292 1 359 1 409 1 420 1 576 1 577 1 592
Non-renewable wastes 50 35 40 44 126 152 191 201 205
Primary production 6 442 6 009 6 170 6 236 6 413 6 319 6 394 6 234 6 370
Solid fossil fuels 637 613 602 567 584 579 495 452 446
Peat 0 0 0 0 0 0 0 0 0
Oil shale and oil sands 0 0 0 0 0 0 0 0 0
Crude oil & other hydrocarbons 34 16 18 15 13 12 12 10 8
Natural gas 126 88 103 127 104 84 78 77 117
Nuclear heat 4 733 3 853 4 027 4 050 4 111 4 053 4 028 3 894 3 985
Renewable energies 861 1 404 1 387 1 433 1 467 1 441 1 592 1 603 1 615
Non-renewable wastes 51 34 34 43 134 151 190 198 198
Net imports 12 338 11 414 11 337 10 199 10 192 9 791 9 776 9 898 11 185
Solid fossil fuels 3 745 2 952 3 026 3 117 2 781 2 853 2 772 2 683 2 965
Crude oil 5 336 5 469 6 025 5 381 5 869 5 295 5 910 5 801 5 549
Gas/Diesel Oil (w/o bio) -1 345 -1 208 -1 569 -1 275 -1 449 -1 227 -1 562 -1 364 -1 005
Motor Gasoline (w/o bio) -932 -673 -878 -798 -876 -789 -980 -923 -892
Naphtha 31 10 0 -32 -118 -106 -75 -30 -24
LPG 75 44 36 35 -18 -24 -22 -22 -12
All other oil & petroleum products 14 -193 -151 -107 -285 -237 -148 -67 -15
Natural gas 5 735 5 003 4 860 3 921 4 345 3 954 3 687 3 617 4 368
Transformation input 18 729 17 338 17 840 16 863 17 742 16 124 17 089 16 801 16 992
Electricity & heat generation 8 382 7 243 7 357 7 395 7 346 6 832 6 914 6 781 6 924
Refinery intake 6 300 6 158 6 732 5 939 6 617 5 761 6 505 6 292 6 178
Coke ovens 1 649 1 504 1 455 1 411 1 397 1 436 1 517 1 518 1 462
Blast furnaces 1 508 1 543 1 370 1 463 1 491 1 561 1 447 1 514 1 598
Transformation output 13 679 12 716 13 199 12 037 12 998 11 704 12 476 12 287 12 435
Electricity & heat generation 3 960 3 556 3 509 3 496 3 495 3 187 3 189 3 223 3 287
Refinery output 6 413 6 013 6 581 5 787 6 496 5 830 6 370 6 136 6 101
Coke ovens 1 623 1 457 1 428 1 383 1 352 1 363 1 448 1 444 1 391
Blast furnaces 587 629 575 563 564 602 577 609 642
Energy sector 1 593 1 289 1 271 1 199 1 233 1 289 1 220 1 218 1 286
Distribution losses 330 289 230 292 229 280 363 336 328
Available for final consumption 11 685 11 470 11 010 10 197 10 508 9 732 10 025 10 228 11 037
Solid fossil fuels 697 808 832 580 590 558 522 444 493
Manufactured gases 418 416 404 380 380 414 401 428 434
Peat & peat products 0 0 0 0 0 0 0 0 0
Oil shale & oil sands 0 0 0 0 0 0 0 0 0
Gas/Diesel Oil (w/o bio) 1 131 1 548 1 512 1 469 1 447 1 424 1 367 1 537 1 873
Motor Gasoline (w/o bio) 672 601 572 558 566 555 578 610 609
Naphtha 425 406 400 260 275 269 214 250 267
LPG 163 109 115 122 124 113 130 126 148
All other oil & petroleum products 621 393 387 397 322 304 409 355 404
Natural gas 4 294 3 702 3 316 3 141 3 387 2 756 2 866 2 902 3 135
Primary solid biofuels & charcoal 314 423 424 320 292 367 445 388 394
Liquid biofuels 11 98 98 91 99 134 144 145 149
All other renewable energies 4 20 29 29 17 11 46 41 55
Non-renewable wastes 20 21 21 28 110 141 174 182 187
Electricity 1 965 2 075 2 133 2 058 2 157 2 077 2 096 2 148 2 219
Heat 951 851 767 763 743 610 632 670 669
Statistical difference -2 46 52 34 28 63 39 24 35
Final non-energy consumption 1 285 1 053 1 226 965 1 067 928 1 047 978 1 099
Final energy consumption 10 402 10 371 9 733 9 198 9 412 8 740 8 940 9 226 9 903
Industry 3 591 3 224 3 255 3 234 3 115 3 242 3 333 3 309 3 452
Transport 2 355 2 595 2 597 2 300 2 309 2 176 2 169 2 430 2 773
Other sectors 4 457 4 552 3 880 3 665 3 989 3 322 3 438 3 487 3 678
Services 1 751 2 105 1 602 1 451 1 711 1 233 1 300 1 308 1 427
Households 2 540 2 312 2 121 2 070 2 147 1 952 1 988 2 030 2 109
Europe 2020-2030 indicators 2005 2010 2011 2012 2013 2014 2015 2016 2017
Gross inland consumption 18 698 17 711 17 195 16 551 16 756 15 757 16 265 16 346 17 248
Primary energy consumption 17 413 16 658 15 969 15 586 15 689 14 829 15 219 15 368 16 149
Final energy consumption 11 558 11 539 10 766 10 340 10 590 9 957 10 065 10 403 11 127
Source: Eurostat (nrg_bal_c)
129
Slovak Republicktoe
Energy balance sheets — 2017 data

Source: Eurostat (nrg_bal_c)
Source: Eurostat (nrg_bal_c)
Note: Please refer to page 23 for related methodological definitions.
Slovak Republic
130Energy balance sheets — 2017 data
0
5 000
10 000
15 000
20 000
25 000
30 000
35 000
1990 1995 2000 2005 2010 2015 2017
Gross electricity production by fuel, GWh
Solid fossil fuels Oil and petroleum products Natural gas
Renewables and biofuels Nuclear heat Other
0
1 000
2 000
3 000
4 000
5 000
6 000
7 000
8 000
9 000
1990 1995 2000 2005 2010 2015 2017
Gross available energy by fuel, ktoe
Solid fossil fuels Oil and petroleum products Natural gas
Renewables and biofuels Nuclear heat Non-renewable waste

Source: Eurostat (nrg_bal_c)
Source: Eurostat (nrg_bal_c)
Note: Please refer to page 23 for related methodological definitions.
Slovak Republic
131Energy balance sheets — 2017 data
0
2 000
4 000
6 000
8 000
10 000
12 000
14 000
16 000
1990 1995 2000 2005 2010 2015 2017
Final energy consumption by fuel, ktoe
Solid fossil fuels Oil and petroleum products Natural gas
Renewables and biofuels Electricity Heat
Other
0
2 000
4 000
6 000
8 000
10 000
12 000
14 000
16 000
18 000
1990 1995 2000 2005 2010 2015 2017
Final consumption by sector, ktoe
Industry Transport Services Households Non-energy use
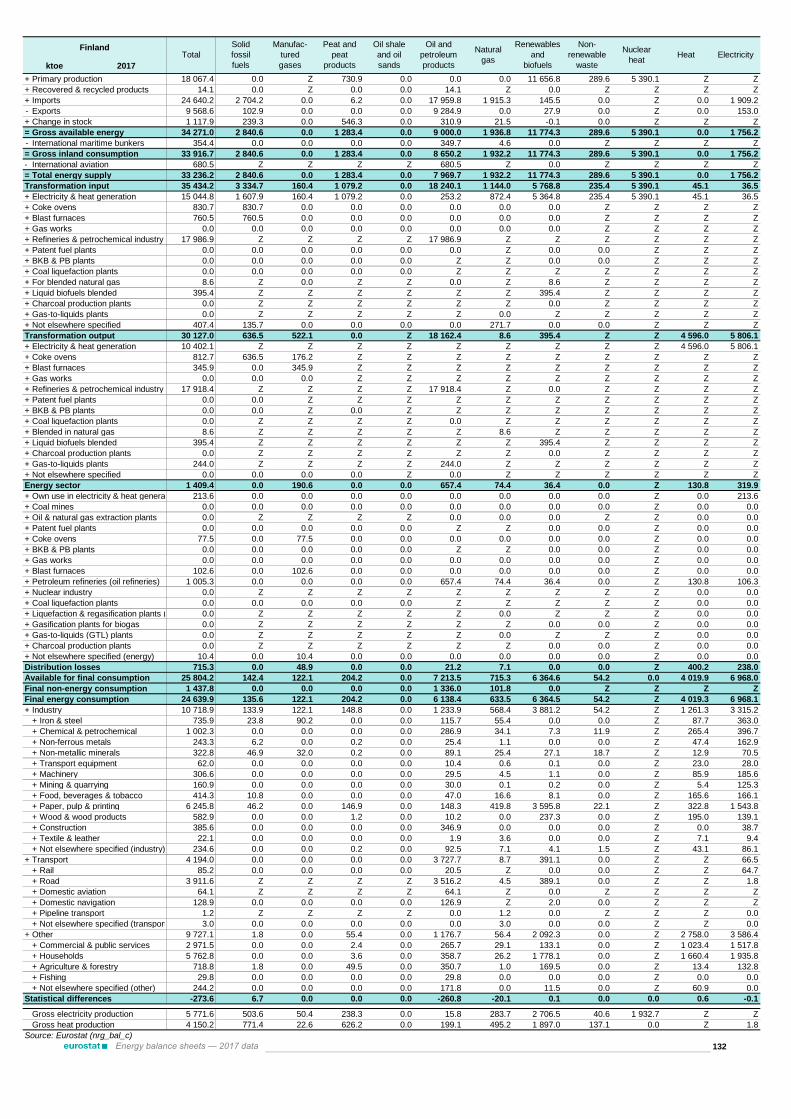
+ Primary production 18 067.4 0.0 Z 730.9 0.0 0.0 0.0 11 656.8 289.6 5 390.1 Z Z
+ Recovered & recycled products 14.1 0.0 Z 0.0 0.0 14.1 Z 0.0 Z Z Z Z
+ Imports 24 640.2 2 704.2 0.0 6.2 0.0 17 959.8 1 915.3 145.5 0.0 Z 0.0 1 909.2
- Exports 9 568.6 102.9 0.0 0.0 0.0 9 284.9 0.0 27.9 0.0 Z 0.0 153.0
+ Change in stock 1 117.9 239.3 0.0 546.3 0.0 310.9 21.5 -0.1 0.0 Z Z Z
= Gross available energy 34 271.0 2 840.6 0.0 1 283.4 0.0 9 000.0 1 936.8 11 774.3 289.6 5 390.1 0.0 1 756.2
- International maritime bunkers 354.4 0.0 0.0 0.0 0.0 349.7 4.6 0.0 Z Z Z Z
= Gross inland consumption 33 916.7 2 840.6 0.0 1 283.4 0.0 8 650.2 1 932.2 11 774.3 289.6 5 390.1 0.0 1 756.2
- International aviation 680.5 Z Z Z Z 680.5 Z 0.0 Z Z Z Z
= Total energy supply 33 236.2 2 840.6 0.0 1 283.4 0.0 7 969.7 1 932.2 11 774.3 289.6 5 390.1 0.0 1 756.2
Transformation input 35 434.2 3 334.7 160.4 1 079.2 0.0 18 240.1 1 144.0 5 768.8 235.4 5 390.1 45.1 36.5
+ Electricity & heat generation 15 044.8 1 607.9 160.4 1 079.2 0.0 253.2 872.4 5 364.8 235.4 5 390.1 45.1 36.5
+ Coke ovens 830.7 830.7 0.0 0.0 0.0 0.0 0.0 0.0 Z Z Z Z
+ Blast furnaces 760.5 760.5 0.0 0.0 0.0 0.0 0.0 0.0 Z Z Z Z
+ Gas works 0.0 0.0 0.0 0.0 0.0 0.0 0.0 0.0 Z Z Z Z
+ Refineries & petrochemical industry 17 986.9 Z Z Z Z 17 986.9 Z Z Z Z Z Z
+ Patent fuel plants 0.0 0.0 0.0 0.0 0.0 0.0 Z 0.0 0.0 Z Z Z
+ BKB & PB plants 0.0 0.0 0.0 0.0 0.0 Z Z 0.0 0.0 Z Z Z
+ Coal liquefaction plants 0.0 0.0 0.0 0.0 0.0 Z Z Z Z Z Z Z
+ For blended natural gas 8.6 Z 0.0 Z Z 0.0 Z 8.6 Z Z Z Z
+ Liquid biofuels blended 395.4 Z Z Z Z Z Z 395.4 Z Z Z Z
+ Charcoal production plants 0.0 Z Z Z Z Z Z 0.0 Z Z Z Z
+ Gas-to-liquids plants 0.0 Z Z Z Z Z 0.0 Z Z Z Z Z
+ Not elsewhere specified 407.4 135.7 0.0 0.0 0.0 0.0 271.7 0.0 0.0 Z Z Z
Transformation output 30 127.0 636.5 522.1 0.0 Z 18 162.4 8.6 395.4 Z Z 4 596.0 5 806.1
+ Electricity & heat generation 10 402.1 Z Z Z Z Z Z Z Z Z 4 596.0 5 806.1
+ Coke ovens 812.7 636.5 176.2 Z Z Z Z Z Z Z Z Z
+ Blast furnaces 345.9 0.0 345.9 Z Z Z Z Z Z Z Z Z
+ Gas works 0.0 0.0 0.0 Z Z Z Z Z Z Z Z Z
+ Refineries & petrochemical industry 17 918.4 Z Z Z Z 17 918.4 Z 0.0 Z Z Z Z
+ Patent fuel plants 0.0 0.0 Z Z Z Z Z Z Z Z Z Z
+ BKB & PB plants 0.0 0.0 Z 0.0 Z Z Z Z Z Z Z Z
+ Coal liquefaction plants 0.0 Z Z Z Z 0.0 Z Z Z Z Z Z
+ Blended in natural gas 8.6 Z Z Z Z Z 8.6 Z Z Z Z Z
+ Liquid biofuels blended 395.4 Z Z Z Z Z Z 395.4 Z Z Z Z
+ Charcoal production plants 0.0 Z Z Z Z Z Z 0.0 Z Z Z Z
+ Gas-to-liquids plants 244.0 Z Z Z Z 244.0 Z Z Z Z Z Z
+ Not elsewhere specified 0.0 0.0 0.0 0.0 Z 0.0 Z Z Z Z Z Z
Energy sector 1 409.4 0.0 190.6 0.0 0.0 657.4 74.4 36.4 0.0 Z 130.8 319.9
+ Own use in electricity & heat generation 213.6 0.0 0.0 0.0 0.0 0.0 0.0 0.0 0.0 Z 0.0 213.6
+ Coal mines 0.0 0.0 0.0 0.0 0.0 0.0 0.0 0.0 0.0 Z 0.0 0.0
+ Oil & natural gas extraction plants 0.0 Z Z Z Z 0.0 0.0 0.0 Z Z 0.0 0.0
+ Patent fuel plants 0.0 0.0 0.0 0.0 0.0 Z Z 0.0 0.0 Z 0.0 0.0
+ Coke ovens 77.5 0.0 77.5 0.0 0.0 0.0 0.0 0.0 0.0 Z 0.0 0.0
+ BKB & PB plants 0.0 0.0 0.0 0.0 0.0 Z Z 0.0 0.0 Z 0.0 0.0
+ Gas works 0.0 0.0 0.0 0.0 0.0 0.0 0.0 0.0 0.0 Z 0.0 0.0
+ Blast furnaces 102.6 0.0 102.6 0.0 0.0 0.0 0.0 0.0 0.0 Z 0.0 0.0
+ Petroleum refineries (oil refineries) 1 005.3 0.0 0.0 0.0 0.0 657.4 74.4 36.4 0.0 Z 130.8 106.3
+ Nuclear industry 0.0 Z Z Z Z Z Z Z Z Z 0.0 0.0
+ Coal liquefaction plants 0.0 0.0 0.0 0.0 0.0 Z Z Z Z Z 0.0 0.0
+ Liquefaction & regasification plants (LNG) 0.0 Z Z Z Z Z 0.0 Z Z Z 0.0 0.0
+ Gasification plants for biogas 0.0 Z Z Z Z Z Z 0.0 0.0 Z 0.0 0.0
+ Gas-to-liquids (GTL) plants 0.0 Z Z Z Z Z 0.0 Z Z Z 0.0 0.0
+ Charcoal production plants 0.0 Z Z Z Z Z Z 0.0 0.0 Z 0.0 0.0
+ Not elsewhere specified (energy) 10.4 0.0 10.4 0.0 0.0 0.0 0.0 0.0 0.0 Z 0.0 0.0
Distribution losses 715.3 0.0 48.9 0.0 0.0 21.2 7.1 0.0 0.0 Z 400.2 238.0
Available for final consumption 25 804.2 142.4 122.1 204.2 0.0 7 213.5 715.3 6 364.6 54.2 0.0 4 019.9 6 968.0
Final non-energy consumption 1 437.8 0.0 0.0 0.0 0.0 1 336.0 101.8 0.0 Z Z Z Z
Final energy consumption 24 639.9 135.6 122.1 204.2 0.0 6 138.4 633.5 6 364.5 54.2 Z 4 019.3 6 968.1
+ Industry 10 718.9 133.9 122.1 148.8 0.0 1 233.9 568.4 3 881.2 54.2 Z 1 261.3 3 315.2
+ Iron & steel 735.9 23.8 90.2 0.0 0.0 115.7 55.4 0.0 0.0 Z 87.7 363.0
+ Chemical & petrochemical 1 002.3 0.0 0.0 0.0 0.0 286.9 34.1 7.3 11.9 Z 265.4 396.7
+ Non-ferrous metals 243.3 6.2 0.0 0.2 0.0 25.4 1.1 0.0 0.0 Z 47.4 162.9
+ Non-metallic minerals 322.8 46.9 32.0 0.2 0.0 89.1 25.4 27.1 18.7 Z 12.9 70.5
+ Transport equipment 62.0 0.0 0.0 0.0 0.0 10.4 0.6 0.1 0.0 Z 23.0 28.0
+ Machinery 306.6 0.0 0.0 0.0 0.0 29.5 4.5 1.1 0.0 Z 85.9 185.6
+ Mining & quarrying 160.9 0.0 0.0 0.0 0.0 30.0 0.1 0.2 0.0 Z 5.4 125.3
+ Food, beverages & tobacco 414.3 10.8 0.0 0.0 0.0 47.0 16.6 8.1 0.0 Z 165.6 166.1
+ Paper, pulp & printing 6 245.8 46.2 0.0 146.9 0.0 148.3 419.8 3 595.8 22.1 Z 322.8 1 543.8
+ Wood & wood products 582.9 0.0 0.0 1.2 0.0 10.2 0.0 237.3 0.0 Z 195.0 139.1
+ Construction 385.6 0.0 0.0 0.0 0.0 346.9 0.0 0.0 0.0 Z 0.0 38.7
+ Textile & leather 22.1 0.0 0.0 0.0 0.0 1.9 3.6 0.0 0.0 Z 7.1 9.4
+ Not elsewhere specified (industry) 234.6 0.0 0.0 0.2 0.0 92.5 7.1 4.1 1.5 Z 43.1 86.1
+ Transport 4 194.0 0.0 0.0 0.0 0.0 3 727.7 8.7 391.1 0.0 Z Z 66.5
+ Rail 85.2 0.0 0.0 0.0 0.0 20.5 Z 0.0 0.0 Z Z 64.7
+ Road 3 911.6 Z Z Z Z 3 516.2 4.5 389.1 0.0 Z Z 1.8
+ Domestic aviation 64.1 Z Z Z Z 64.1 Z 0.0 Z Z Z Z
+ Domestic navigation 128.9 0.0 0.0 0.0 0.0 126.9 Z 2.0 0.0 Z Z Z
+ Pipeline transport 1.2 Z Z Z Z 0.0 1.2 0.0 Z Z Z 0.0
+ Not elsewhere specified (transport) 3.0 0.0 0.0 0.0 0.0 0.0 3.0 0.0 0.0 Z Z 0.0
+ Other 9 727.1 1.8 0.0 55.4 0.0 1 176.7 56.4 2 092.3 0.0 Z 2 758.0 3 586.4
+ Commercial & public services 2 971.5 0.0 0.0 2.4 0.0 265.7 29.1 133.1 0.0 Z 1 023.4 1 517.8
+ Households 5 762.8 0.0 0.0 3.6 0.0 358.7 26.2 1 778.1 0.0 Z 1 660.4 1 935.8
+ Agriculture & forestry 718.8 1.8 0.0 49.5 0.0 350.7 1.0 169.5 0.0 Z 13.4 132.8
+ Fishing 29.8 0.0 0.0 0.0 0.0 29.8 0.0 0.0 0.0 Z 0.0 0.0
+ Not elsewhere specified (other) 244.2 0.0 0.0 0.0 0.0 171.8 0.0 11.5 0.0 Z 60.9 0.0
Statistical differences -273.6 6.7 0.0 0.0 0.0 -260.8 -20.1 0.1 0.0 0.0 0.6 -0.1
Gross electricity production 5 771.6 503.6 50.4 238.3 0.0 15.8 283.7 2 706.5 40.6 1 932.7 Z Z
Gross heat production 4 150.2 771.4 22.6 626.2 0.0 199.1 495.2 1 897.0 137.1 0.0 Z 1.8
Source: Eurostat (nrg_bal_c)
132Energy balance sheets — 2017 data
Electricity
ktoe 2017
Oil and
petroleum
products
Natural
gas
Renewables
and
biofuels
Non-
renewable
waste
Nuclear
heatHeat
FinlandTotal
Solid
fossil
fuels
Manufac-
tured
gases
Peat and
peat
products
Oil shale
and oil
sands

2005 2010 2011 2012 2013 2014 2015 2016 2017
Gross available energy 35 223 36 939 35 573 34 194 33 649 34 316 32 779 34 085 34 271
Solid fossil fuels 3 262 4 587 3 948 2 995 3 788 3 070 2 702 3 168 2 841
Peat & peat products 1 652 2 291 2 030 1 558 1 350 1 427 1 385 1 346 1 283
Oil shale & oil sands 0 0 0 0 0 0 0 0 0
Crude oil & other hydrocarbons 11 306 11 372 12 012 12 015 11 965 12 273 10 569 12 392 12 908
Petroleum products -261 -1 114 -1 884 -2 590 -3 477 -2 740 -1 855 -2 997 -3 908
Natural gas 3 607 3 837 3 360 3 005 2 856 2 513 2 236 2 059 1 937
Nuclear heat 6 003 5 565 5 627 5 536 5 694 5 689 5 606 5 590 5 390
Renewable energies 8 086 9 352 9 144 9 991 9 912 10 303 10 491 10 635 11 774
Non-renewable wastes 106 146 145 184 209 236 239 263 290
Primary production 16 561 17 020 16 703 16 756 17 534 17 648 17 079 17 113 18 067
Solid fossil fuels 0 0 0 0 0 0 0 0 0
Peat 2 138 1 808 1 688 992 1 701 1 603 838 720 731
Oil shale and oil sands 0 0 0 0 0 0 0 0 0
Crude oil & other hydrocarbons 150 68 61 71 0 0 0 0 0
Natural gas 0 0 0 0 0 0 0 0 0
Nuclear heat 6 003 5 565 5 627 5 536 5 694 5 689 5 606 5 590 5 390
Renewable energies 8 164 9 433 9 183 9 973 9 930 10 120 10 396 10 539 11 657
Non-renewable wastes 106 146 145 184 209 236 239 263 290
Net imports 19 253 18 079 19 210 16 156 16 812 17 228 15 801 15 678 15 072
Solid fossil fuels 3 326 3 958 4 553 2 600 3 346 3 607 2 498 2 716 2 601
Crude oil 9 751 10 974 11 245 11 026 11 365 11 480 10 264 11 462 11 222
Gas/Diesel Oil (w/o bio) 668 -1 107 -405 -780 -940 -1 526 -1 153 -1 945 -2 008
Motor Gasoline (w/o bio) -2 103 -2 377 -2 480 -2 495 -2 579 -2 726 -1 954 -2 485 -2 609
Naphtha 238 463 279 152 93 128 251 252 305
LPG 242 277 338 313 755 847 857 805 782
All other oil & petroleum products 2 150 1 234 1 145 796 574 1 156 1 289 1 077 983
Natural gas 3 607 3 837 3 360 3 005 2 856 2 513 2 236 2 059 1 915
Transformation input 33 978 38 690 38 090 36 459 37 252 35 568 32 793 35 453 35 434
Electricity & heat generation 16 333 18 604 16 948 16 236 16 569 15 753 15 100 15 556 15 045
Refinery intake 13 163 14 525 15 381 14 736 15 003 14 453 12 889 14 896 15 151
Coke ovens 893 836 850 861 858 867 857 855 831
Blast furnaces 1 102 921 896 812 715 744 779 789 760
Transformation output 26 942 31 159 31 164 30 444 30 653 29 526 27 249 29 650 30 127
Electricity & heat generation 10 351 11 976 10 807 10 823 10 626 10 264 10 137 10 588 10 402
Refinery output 12 904 14 290 15 207 14 706 14 950 14 464 12 906 14 697 15 121
Coke ovens 838 780 831 838 826 846 838 839 813
Blast furnaces 430 351 349 304 323 343 360 367 346
Energy sector 1 269 1 575 1 620 1 536 1 511 1 447 1 370 1 440 1 409
Distribution losses 722 717 676 720 645 672 625 676 715
Available for final consumption 25 264 26 362 25 511 25 184 24 127 25 433 24 303 25 238 25 804
Solid fossil fuels 394 232 596 82 120 7 262 177 142
Manufactured gases 149 166 134 119 117 121 135 144 122
Peat & peat products 225 263 271 228 197 206 224 211 204
Oil shale & oil sands 0 0 0 0 0 0 0 0 0
Gas/Diesel Oil (w/o bio) 4 219 4 376 4 385 3 736 3 174 3 883 3 828 4 175 3 951
Motor Gasoline (w/o bio) 2 107 1 826 1 691 1 763 1 445 1 562 1 460 1 341 1 331
Naphtha 370 481 359 236 326 283 296 245 240
LPG 307 415 601 508 1 064 1 070 1 057 1 100 917
All other oil & petroleum products 1 551 1 052 999 1 505 937 1 336 398 678 775
Natural gas 844 827 775 727 727 679 631 638 715
Primary solid biofuels & charcoal 4 200 4 662 4 491 4 679 4 668 4 845 4 820 5 162 5 342
Liquid biofuels 0 244 183 256 284 531 503 183 397
All other renewable energies 35 50 55 72 67 66 62 68 626
Non-renewable wastes 32 35 22 40 53 55 49 51 54
Electricity 6 958 7 179 6 888 6 941 6 874 6 805 6 747 6 950 6 968
Heat 3 872 4 554 4 061 4 293 4 075 3 983 3 831 4 114 4 020
Statistical difference 99 46 622 150 -922 493 -80 -214 -274
Final non-energy consumption 1 153 1 224 1 128 1 058 1 482 1 519 1 331 1 461 1 438
Final energy consumption 24 013 25 091 23 762 23 976 23 567 23 421 23 052 23 991 24 640
Industry 11 124 10 719 10 521 10 236 10 278 10 228 10 214 10 527 10 719
Transport 4 224 4 305 4 301 4 198 4 210 4 111 4 105 4 178 4 194
Other sectors 8 666 10 067 8 940 9 542 9 079 9 082 8 733 9 286 9 727
Services 2 619 3 101 2 866 3 030 2 907 2 890 2 735 2 877 2 972
Households 5 020 5 871 5 139 5 492 5 173 5 126 4 952 5 342 5 763
Europe 2020-2030 indicators 2005 2010 2011 2012 2013 2014 2015 2016 2017
Gross inland consumption 34 713 36 725 35 372 34 071 33 519 34 219 32 483 33 799 33 368
Primary energy consumption 33 560 35 500 34 244 33 013 32 037 32 700 31 152 32 338 31 930
Final energy consumption 25 218 26 274 25 038 25 186 24 687 24 530 24 216 25 161 25 289
Source: Eurostat (nrg_bal_c)
133
Finlandktoe
Energy balance sheets — 2017 data

Source: Eurostat (nrg_bal_c)
Source: Eurostat (nrg_bal_c)
Note: Please refer to page 23 for related methodological definitions.
Finland
134Energy balance sheets — 2017 data
0
10 000
20 000
30 000
40 000
50 000
60 000
70 000
80 000
90 000
100 000
1990 1995 2000 2005 2010 2015 2017
Gross electricity production by fuel, GWh
Solid fossil fuels Oil and petroleum products Natural gas
Renewables and biofuels Nuclear heat Other
0
2 000
4 000
6 000
8 000
10 000
12 000
14 000
1990 1995 2000 2005 2010 2015 2017
Gross available energy by fuel, ktoe
Solid fossil fuels Oil and petroleum products Natural gas
Renewables and biofuels Nuclear heat Non-renewable waste

Source: Eurostat (nrg_bal_c)
Source: Eurostat (nrg_bal_c)
Note: Please refer to page 23 for related methodological definitions.
Finland
135Energy balance sheets — 2017 data
0
5 000
10 000
15 000
20 000
25 000
30 000
1990 1995 2000 2005 2010 2015 2017
Final energy consumption by fuel, ktoe
Solid fossil fuels Oil and petroleum products Natural gas
Renewables and biofuels Electricity Heat
Other
0
5 000
10 000
15 000
20 000
25 000
30 000
1990 1995 2000 2005 2010 2015 2017
Final consumption by sector, ktoe
Industry Transport Services Households Non-energy use

+ Primary production 36 590.4 0.0 Z 112.6 0.0 0.0 0.0 19 389.8 737.0 16 351.0 Z Z
+ Recovered & recycled products 0.0 0.0 Z 0.0 0.0 0.0 Z 0.0 Z Z Z Z
+ Imports 35 276.8 1 955.2 0.0 22.9 0.0 29 589.5 943.0 1 655.1 88.3 Z 0.0 1 022.9
- Exports 21 236.2 20.1 0.0 0.0 0.0 18 274.7 4.4 280.8 0.4 Z 0.0 2 655.9
+ Change in stock 2 216.7 -24.9 0.0 0.0 0.0 2 081.8 0.0 159.8 0.0 Z Z Z
= Gross available energy 52 847.6 1 910.2 0.0 135.4 0.0 13 396.6 938.6 20 923.9 824.9 16 351.0 0.0 -1 633.0
- International maritime bunkers 2 382.0 0.0 0.0 0.0 0.0 2 362.9 19.0 0.0 Z Z Z Z
= Gross inland consumption 50 465.6 1 910.2 0.0 135.4 0.0 11 033.7 919.6 20 923.9 824.9 16 351.0 0.0 -1 633.0
- International aviation 894.6 Z Z Z Z 894.6 Z 0.0 Z Z Z Z
= Total energy supply 49 571.0 1 910.2 0.0 135.4 0.0 10 139.1 919.6 20 923.9 824.9 16 351.0 0.0 -1 633.0
Transformation input 57 065.1 2 233.8 237.3 135.2 0.0 23 257.8 113.7 13 697.2 824.9 16 351.0 0.0 214.1
+ Electricity & heat generation 30 627.0 149.3 237.3 135.2 0.0 104.0 107.0 12 504.2 824.9 16 351.0 0.0 214.1
+ Coke ovens 1 068.4 1 068.4 0.0 0.0 0.0 0.0 0.0 0.0 Z Z Z Z
+ Blast furnaces 1 016.2 1 016.2 0.0 0.0 0.0 0.0 0.0 0.0 Z Z Z Z
+ Gas works 6.7 0.0 0.0 0.0 0.0 0.0 6.7 0.0 Z Z Z Z
+ Refineries & petrochemical industry 23 153.8 Z Z Z Z 23 153.8 Z Z Z Z Z Z
+ Patent fuel plants 0.0 0.0 0.0 0.0 0.0 0.0 Z 0.0 0.0 Z Z Z
+ BKB & PB plants 0.0 0.0 0.0 0.0 0.0 Z Z 0.0 0.0 Z Z Z
+ Coal liquefaction plants 0.0 0.0 0.0 0.0 0.0 Z Z Z Z Z Z Z
+ For blended natural gas 0.0 Z 0.0 Z Z 0.0 Z 0.0 Z Z Z Z
+ Liquid biofuels blended 1 103.3 Z Z Z Z Z Z 1 103.3 Z Z Z Z
+ Charcoal production plants 0.0 Z Z Z Z Z Z 0.0 Z Z Z Z
+ Gas-to-liquids plants 0.0 Z Z Z Z Z 0.0 Z Z Z Z Z
+ Not elsewhere specified 89.8 0.0 0.0 0.0 0.0 0.0 0.0 89.8 0.0 Z Z Z
Transformation output 44 085.2 774.6 555.3 0.0 Z 22 993.2 0.0 1 103.3 Z Z 4 535.9 14 123.0
+ Electricity & heat generation 18 658.8 Z Z Z Z Z Z Z Z Z 4 535.9 14 123.0
+ Coke ovens 965.7 774.6 191.1 Z Z Z Z Z Z Z Z Z
+ Blast furnaces 357.5 0.0 357.5 Z Z Z Z Z Z Z Z Z
+ Gas works 0.0 0.0 0.0 Z Z Z Z Z Z Z Z Z
+ Refineries & petrochemical industry 22 993.2 Z Z Z Z 22 993.2 Z 0.0 Z Z Z Z
+ Patent fuel plants 0.0 0.0 Z Z Z Z Z Z Z Z Z Z
+ BKB & PB plants 0.0 0.0 Z 0.0 Z Z Z Z Z Z Z Z
+ Coal liquefaction plants 0.0 Z Z Z Z 0.0 Z Z Z Z Z Z
+ Blended in natural gas 0.0 Z Z Z Z Z 0.0 Z Z Z Z Z
+ Liquid biofuels blended 1 103.3 Z Z Z Z Z Z 1 103.3 Z Z Z Z
+ Charcoal production plants 0.0 Z Z Z Z Z Z 0.0 Z Z Z Z
+ Gas-to-liquids plants 0.0 Z Z Z Z 0.0 Z Z Z Z Z Z
+ Not elsewhere specified 6.7 0.0 6.7 0.0 Z 0.0 Z Z Z Z Z Z
Energy sector 1 669.3 0.0 97.9 0.0 0.0 939.1 18.6 18.1 0.0 Z 0.0 595.8
+ Own use in electricity & heat generation 320.2 0.0 0.0 0.0 0.0 0.0 0.0 0.0 0.0 Z 0.0 320.2
+ Coal mines 0.0 0.0 0.0 0.0 0.0 0.0 0.0 0.0 0.0 Z 0.0 0.0
+ Oil & natural gas extraction plants 0.0 Z Z Z Z 0.0 0.0 0.0 Z Z 0.0 0.0
+ Patent fuel plants 0.0 0.0 0.0 0.0 0.0 Z Z 0.0 0.0 Z 0.0 0.0
+ Coke ovens 99.7 0.0 97.9 0.0 0.0 0.0 0.0 0.0 0.0 Z 0.0 1.8
+ BKB & PB plants 0.0 0.0 0.0 0.0 0.0 Z Z 0.0 0.0 Z 0.0 0.0
+ Gas works 0.0 0.0 0.0 0.0 0.0 0.0 0.0 0.0 0.0 Z 0.0 0.0
+ Blast furnaces 0.0 0.0 0.0 0.0 0.0 0.0 0.0 0.0 0.0 Z 0.0 0.0
+ Petroleum refineries (oil refineries) 1 046.4 0.0 0.0 0.0 0.0 939.1 18.6 0.0 0.0 Z 0.0 88.7
+ Nuclear industry 0.0 Z Z Z Z Z Z Z Z Z 0.0 0.0
+ Coal liquefaction plants 0.0 0.0 0.0 0.0 0.0 Z Z Z Z Z 0.0 0.0
+ Liquefaction & regasification plants (LNG) 0.0 Z Z Z Z Z 0.0 Z Z Z 0.0 0.0
+ Gasification plants for biogas 0.0 Z Z Z Z Z Z 0.0 0.0 Z 0.0 0.0
+ Gas-to-liquids (GTL) plants 0.0 Z Z Z Z Z 0.0 Z Z Z 0.0 0.0
+ Charcoal production plants 0.0 Z Z Z Z Z Z 0.0 0.0 Z 0.0 0.0
+ Not elsewhere specified (energy) 203.1 0.0 0.0 0.0 0.0 0.0 0.0 18.1 0.0 Z 0.0 185.0
Distribution losses 927.4 0.0 26.5 0.0 0.0 0.0 0.0 0.0 0.0 Z 162.7 738.2
Available for final consumption 33 994.4 451.0 193.6 0.2 0.0 8 935.4 787.3 8 311.9 0.0 0.0 4 373.1 10 941.9
Final non-energy consumption 2 436.8 15.4 0.0 0.0 0.0 2 134.0 287.3 0.0 Z Z Z Z
Final energy consumption 32 369.6 374.3 181.2 3.4 0.0 7 746.4 511.4 8 238.0 0.0 Z 4 373.1 10 941.9
+ Industry 10 816.5 374.3 176.6 3.4 0.0 826.8 376.1 4 163.4 0.0 Z 516.0 4 380.0
+ Iron & steel 932.0 84.0 167.3 0.0 0.0 209.7 78.9 0.0 0.0 Z 0.0 392.3
+ Chemical & petrochemical 613.4 0.0 0.0 2.6 0.0 88.5 107.5 14.5 0.0 Z 0.0 400.3
+ Non-ferrous metals 326.7 31.4 0.0 0.0 0.0 32.9 6.8 0.0 0.0 Z 0.0 255.5
+ Non-metallic minerals 340.8 151.9 0.0 0.0 0.0 53.2 47.1 0.0 0.0 Z 0.0 88.7
+ Transport equipment 208.2 7.4 0.0 0.0 0.0 22.3 8.6 0.0 0.0 Z 0.0 170.0
+ Machinery 321.8 0.0 0.0 0.0 0.0 19.7 15.8 0.0 0.0 Z 0.0 286.3
+ Mining & quarrying 532.8 93.0 8.6 0.0 0.0 107.9 2.9 0.0 0.0 Z 0.0 320.5
+ Food, beverages & tobacco 360.6 4.0 0.0 0.0 0.0 51.5 73.9 25.0 0.0 Z 0.0 206.1
+ Paper, pulp & printing 5 632.6 2.6 0.0 0.8 0.0 166.1 31.4 3 688.7 0.0 Z 0.0 1 743.1
+ Wood & wood products 600.5 0.0 0.0 0.0 0.0 35.3 0.1 406.0 0.0 Z 0.0 159.2
+ Construction 118.5 0.0 0.0 0.0 0.0 0.0 0.0 0.0 0.0 Z 0.0 118.5
+ Textile & leather 24.6 0.0 0.0 0.0 0.0 3.2 2.0 1.9 0.0 Z 0.0 17.5
+ Not elsewhere specified (industry) 804.0 0.0 0.7 0.0 0.0 36.6 1.2 27.3 0.0 Z 516.0 222.2
+ Transport 8 359.6 0.0 0.0 0.0 0.0 6 497.0 18.4 1 631.3 0.0 Z Z 212.9
+ Rail 214.9 0.0 0.0 0.0 0.0 2.0 Z 0.0 0.0 Z Z 212.9
+ Road 7 921.7 Z Z Z Z 6 272.0 18.4 1 631.3 0.0 Z Z 0.0
+ Domestic aviation 183.7 Z Z Z Z 183.7 Z 0.0 Z Z Z Z
+ Domestic navigation 39.3 0.0 0.0 0.0 0.0 39.3 Z 0.0 0.0 Z Z Z
+ Pipeline transport 0.0 Z Z Z Z 0.0 0.0 0.0 Z Z Z 0.0
+ Not elsewhere specified (transport) 0.0 0.0 0.0 0.0 0.0 0.0 0.0 0.0 0.0 Z Z 0.0
+ Other 13 193.5 0.0 4.5 0.0 0.0 422.6 116.9 2 443.3 0.0 Z 3 857.1 6 349.0
+ Commercial & public services 4 069.0 0.0 2.3 0.0 0.0 320.6 74.8 65.3 0.0 Z 1 236.0 2 370.0
+ Households 7 507.5 0.0 2.3 0.0 0.0 20.2 36.1 954.4 0.0 Z 2 613.9 3 880.7
+ Agriculture & forestry 318.4 0.0 0.0 0.0 0.0 68.7 6.0 138.1 0.0 Z 7.2 98.4
+ Fishing 13.1 0.0 0.0 0.0 0.0 13.1 0.0 0.0 0.0 Z 0.0 0.0
+ Not elsewhere specified (other) 1 285.5 0.0 0.0 0.0 0.0 0.0 0.0 1 285.5 0.0 Z 0.0 0.0
Statistical differences -812.0 61.2 12.4 -3.1 0.0 -945.0 -11.4 73.9 0.0 0.0 0.0 0.0
Gross electricity production 14 123.0 27.7 60.9 17.1 0.0 24.9 23.3 8 175.7 144.5 5 648.8 Z Z
Gross heat production 4 427.3 95.5 135.4 72.6 0.0 58.1 76.3 3 419.7 551.1 0.0 Z 18.7
Source: Eurostat (nrg_bal_c)
136Energy balance sheets — 2017 data
Electricity
ktoe 2017
Oil and
petroleum
products
Natural
gas
Renewables
and
biofuels
Non-
renewable
waste
Nuclear
heatHeat
SwedenTotal
Solid
fossil
fuels
Manufac-
tured
gases
Peat and
peat
products
Oil shale
and oil
sands

2005 2010 2011 2012 2013 2014 2015 2016 2017
Gross available energy 53 614 52 666 52 643 52 548 51 519 51 217 50 136 52 662 52 848
Solid fossil fuels 2 321 2 139 2 160 1 941 1 987 1 933 1 980 1 906 1 910
Peat & peat products 305 351 331 253 231 168 136 144 135
Oil shale & oil sands 0 0 0 0 0 0 0 0 0
Crude oil & other hydrocarbons 19 937 19 746 18 837 20 775 16 715 18 408 19 497 19 019 19 303
Petroleum products -3 160 -3 228 -2 678 -5 842 -2 462 -4 398 -6 935 -4 563 -5 906
Natural gas 843 1 466 1 159 1 007 955 794 724 818 939
Nuclear heat 18 670 14 498 15 252 15 632 15 996 16 362 15 532 15 699 16 351
Renewable energies 14 852 17 001 17 699 19 935 18 385 18 701 20 522 19 861 20 924
Non-renewable wastes 482 515 505 531 573 592 623 786 825
Primary production 34 084 32 006 33 320 35 724 34 477 34 918 35 863 35 390 36 590
Solid fossil fuels 0 0 0 0 0 0 0 0 0
Peat 211 238 220 141 186 134 110 127 113
Oil shale and oil sands 0 0 0 0 0 0 0 0 0
Crude oil & other hydrocarbons 0 0 0 0 0 0 0 0 0
Natural gas 0 0 0 0 0 0 0 0 0
Nuclear heat 18 670 14 498 15 252 15 632 15 996 16 362 15 532 15 699 16 351
Renewable energies 14 723 16 787 17 391 19 475 17 785 17 903 19 669 18 860 19 390
Non-renewable wastes 479 483 457 476 510 519 552 704 737
Net imports 20 311 19 914 19 175 15 808 16 892 16 509 14 690 17 021 14 041
Solid fossil fuels 2 458 2 433 2 240 1 602 1 783 1 956 1 928 2 206 1 935
Crude oil 20 239 20 000 18 897 20 788 16 887 18 864 20 251 19 827 19 194
Gas/Diesel Oil (w/o bio) -1 992 -2 517 -1 788 -3 101 -1 450 -2 495 -3 059 -2 285 -4 064
Motor Gasoline (w/o bio) -134 -291 -889 -1 748 -749 -1 804 -2 289 -1 811 -2 410
Naphtha 393 282 66 132 57 356 252 173 245
LPG 505 541 1 054 280 811 806 472 722 655
All other oil & petroleum products -1 582 -2 544 -1 403 -2 090 -1 242 -1 496 -2 630 -2 720 -2 306
Natural gas 843 1 466 1 159 1 007 955 794 724 818 939
Transformation input 55 507 54 862 52 362 56 650 51 759 54 715 56 916 56 989 57 065
Electricity & heat generation 31 020 28 710 27 982 30 184 29 120 29 312 29 989 29 415 30 627
Refinery intake 20 850 21 430 20 116 22 324 18 345 20 491 21 424 21 300 20 906
Coke ovens 1 352 1 348 1 174 1 058 1 003 1 044 1 133 1 097 1 068
Blast furnaces 1 322 1 168 1 081 938 971 986 954 1 016 1 016
Transformation output 40 663 42 839 40 438 44 133 39 096 41 798 44 064 44 233 44 085
Electricity & heat generation 17 948 18 128 17 195 19 014 17 712 17 509 18 321 18 034 18 659
Refinery output 20 104 21 073 19 928 21 785 17 850 20 236 21 132 20 839 20 594
Coke ovens 1 147 986 1 022 930 896 924 992 982 966
Blast furnaces 436 353 323 317 306 333 319 352 357
Energy sector 1 325 1 466 1 397 1 517 1 349 1 660 1 628 1 641 1 669
Distribution losses 1 189 1 190 1 102 1 165 968 791 760 904 927
Available for final consumption 33 675 35 322 35 742 34 937 34 125 33 390 32 311 34 515 33 994
Solid fossil fuels 339 159 498 498 438 455 499 456 451
Manufactured gases 255 139 124 188 198 192 185 192 194
Peat & peat products 0 1 2 2 1 2 0 0 0
Oil shale & oil sands 0 0 0 0 0 0 0 0 0
Gas/Diesel Oil (w/o bio) 4 612 5 516 5 918 5 103 5 324 5 046 4 507 5 666 4 299
Motor Gasoline (w/o bio) 4 145 3 618 3 442 3 039 2 904 2 894 2 555 2 675 2 191
Naphtha 622 580 332 385 293 358 255 254 328
LPG 978 1 020 1 131 916 1 168 1 083 1 070 1 285 1 103
All other oil & petroleum products 1 962 1 487 1 811 1 582 1 026 977 393 339 1 014
Natural gas 611 734 662 657 599 594 530 552 787
Primary solid biofuels & charcoal 4 574 5 211 5 438 5 491 5 272 5 186 5 371 5 376 5 275
Liquid biofuels 160 335 394 439 450 684 762 882 1 594
All other renewable energies 6 97 1 140 1 194 1 244 1 238 1 256 1 446 1 443
Non-renewable wastes 0 0 0 0 0 0 0 0 0
Electricity 11 238 11 283 10 716 10 945 10 749 10 506 10 736 10 963 10 942
Heat 4 174 5 141 4 135 4 499 4 456 4 174 4 193 4 430 4 373
Statistical difference -745 695 1 962 1 103 899 642 -724 169 -812
Final non-energy consumption 2 286 2 116 1 932 1 825 2 079 1 977 1 785 2 185 2 437
Final energy consumption 32 134 32 510 31 848 32 009 31 147 30 771 31 250 32 161 32 370
Industry 11 757 11 396 11 131 11 052 10 830 10 589 10 896 10 773 10 817
Transport 7 953 7 834 7 708 7 498 7 397 7 659 7 680 7 992 8 360
Other sectors 12 424 13 280 13 009 13 460 12 920 12 523 12 674 13 396 13 193
Services 4 300 4 552 4 027 4 086 3 962 4 040 4 006 4 304 4 069
Households 7 306 8 035 7 466 7 829 7 479 7 018 7 197 7 462 7 507
Europe 2020-2030 indicators 2005 2010 2011 2012 2013 2014 2015 2016 2017
Gross inland consumption 51 680 50 709 49 554 49 414 48 518 48 097 46 888 49 086 48 915
Primary energy consumption 49 394 48 592 47 622 47 589 46 440 46 120 45 104 46 900 46 478
Final energy consumption 33 667 34 032 32 324 32 272 31 505 31 062 31 541 32 382 32 637
Source: Eurostat (nrg_bal_c)
137
Swedenktoe
Energy balance sheets — 2017 data

Source: Eurostat (nrg_bal_c)
Source: Eurostat (nrg_bal_c)
Note: Please refer to page 23 for related methodological definitions.
Sweden
138Energy balance sheets — 2017 data
0
20 000
40 000
60 000
80 000
100 000
120 000
140 000
160 000
180 000
1990 1995 2000 2005 2010 2015 2017
Gross electricity production by fuel, GWh
Solid fossil fuels Oil and petroleum products Natural gas
Renewables and biofuels Nuclear heat Other
0
5 000
10 000
15 000
20 000
25 000
1990 1995 2000 2005 2010 2015 2017
Gross available energy by fuel, ktoe
Solid fossil fuels Oil and petroleum products Natural gas
Renewables and biofuels Nuclear heat Non-renewable waste

Source: Eurostat (nrg_bal_c)
Source: Eurostat (nrg_bal_c)
Note: Please refer to page 23 for related methodological definitions.
Sweden
139Energy balance sheets — 2017 data
0
5 000
10 000
15 000
20 000
25 000
30 000
35 000
40 000
1990 1995 2000 2005 2010 2015 2017
Final energy consumption by fuel, ktoe
Solid fossil fuels Oil and petroleum products Natural gas
Renewables and biofuels Electricity Heat
Other
0
5 000
10 000
15 000
20 000
25 000
30 000
35 000
40 000
1990 1995 2000 2005 2010 2015 2017
Final consumption by sector, ktoe
Industry Transport Services Households Non-energy use

+ Primary production 118 130.5 1 837.6 Z 0.0 0.0 48 324.2 36 017.0 15 634.8 1 193.0 15 123.8 Z Z
+ Recovered & recycled products 0.0 0.0 Z 0.0 0.0 0.0 Z 0.0 Z Z Z Z
+ Imports 140 570.2 6 225.6 0.0 0.0 0.0 89 598.1 40 181.7 3 002.7 0.0 Z 0.0 1 562.1
- Exports 74 150.7 364.6 0.0 0.0 0.0 63 824.9 9 284.4 383.9 0.0 Z 0.0 293.0
+ Change in stock 3 356.5 2 198.8 0.0 0.0 0.0 245.0 925.2 -12.5 0.0 Z Z Z
= Gross available energy 187 906.5 9 897.5 0.0 0.0 0.0 74 342.5 67 839.4 18 241.1 1 193.0 15 123.8 0.0 1 269.1
- International maritime bunkers 2 441.3 0.0 0.0 0.0 0.0 2 441.3 0.0 0.0 Z Z Z Z
= Gross inland consumption 185 465.1 9 897.5 0.0 0.0 0.0 71 901.2 67 839.4 18 241.1 1 193.0 15 123.8 0.0 1 269.1
- International aviation 11 484.0 Z Z Z Z 11 484.0 Z 0.0 Z Z Z Z
= Total energy supply 173 981.1 9 897.5 0.0 0.0 0.0 60 417.2 67 839.4 18 241.1 1 193.0 15 123.8 0.0 1 269.1
Transformation input 137 365.3 9 164.3 511.4 0.0 0.0 72 925.7 24 474.9 13 788.4 1 044.9 15 123.8 0.0 331.8
+ Electricity & heat generation 59 932.4 5 281.9 510.8 0.0 0.0 546.7 24 463.4 12 629.1 1 044.9 15 123.8 0.0 331.8
+ Coke ovens 1 375.1 1 363.6 0.0 0.0 0.0 0.0 11.5 0.0 Z Z Z Z
+ Blast furnaces 2 375.3 2 375.3 0.0 0.0 0.0 0.0 0.0 0.0 Z Z Z Z
+ Gas works 0.0 0.0 0.0 0.0 0.0 0.0 0.0 0.0 Z Z Z Z
+ Refineries & petrochemical industry 72 316.4 Z Z Z Z 72 316.4 Z Z Z Z Z Z
+ Patent fuel plants 206.2 143.5 0.0 0.0 0.0 62.7 Z 0.0 0.0 Z Z Z
+ BKB & PB plants 0.0 0.0 0.0 0.0 0.0 Z Z 0.0 0.0 Z Z Z
+ Coal liquefaction plants 0.0 0.0 0.0 0.0 0.0 Z Z Z Z Z Z Z
+ For blended natural gas 212.9 Z 0.0 Z Z 0.0 Z 212.9 Z Z Z Z
+ Liquid biofuels blended 946.4 Z Z Z Z Z Z 946.4 Z Z Z Z
+ Charcoal production plants 0.0 Z Z Z Z Z Z 0.0 Z Z Z Z
+ Gas-to-liquids plants 0.0 Z Z Z Z Z 0.0 Z Z Z Z Z
+ Not elsewhere specified 0.6 0.0 0.6 0.0 0.0 0.0 0.0 0.0 0.0 Z Z Z
Transformation output 106 431.3 1 162.9 1 141.3 0.0 Z 72 212.9 212.9 946.4 Z Z 1 663.3 29 091.7
+ Electricity & heat generation 30 755.0 Z Z Z Z Z Z Z Z Z 1 663.3 29 091.7
+ Coke ovens 1 316.8 1 026.9 289.8 Z Z Z Z Z Z Z Z Z
+ Blast furnaces 839.5 0.0 839.5 Z Z Z Z Z Z Z Z Z
+ Gas works 0.0 0.0 0.0 Z Z Z Z Z Z Z Z Z
+ Refineries & petrochemical industry 72 212.9 Z Z Z Z 72 212.9 Z 0.0 Z Z Z Z
+ Patent fuel plants 135.9 135.9 Z Z Z Z Z Z Z Z Z Z
+ BKB & PB plants 0.0 0.0 Z 0.0 Z Z Z Z Z Z Z Z
+ Coal liquefaction plants 0.0 Z Z Z Z 0.0 Z Z Z Z Z Z
+ Blended in natural gas 212.9 Z Z Z Z Z 212.9 Z Z Z Z Z
+ Liquid biofuels blended 946.4 Z Z Z Z Z Z 946.4 Z Z Z Z
+ Charcoal production plants 0.0 Z Z Z Z Z Z 0.0 Z Z Z Z
+ Gas-to-liquids plants 0.0 Z Z Z Z 0.0 Z Z Z Z Z Z
+ Not elsewhere specified 12.0 0.0 12.0 0.0 Z 0.0 Z Z Z Z Z Z
Energy sector 11 139.0 0.0 441.1 0.0 0.0 4 045.7 4 412.9 0.0 0.0 Z 336.6 1 902.7
+ Own use in electricity & heat generation 1 280.9 0.0 0.0 0.0 0.0 0.0 0.0 0.0 0.0 Z 0.0 1 280.9
+ Coal mines 46.2 0.0 0.0 0.0 0.0 0.0 5.6 0.0 0.0 Z 0.0 40.6
+ Oil & natural gas extraction plants 4 545.1 Z Z Z Z 674.2 3 819.5 0.0 Z Z 0.0 51.3
+ Patent fuel plants 0.0 0.0 0.0 0.0 0.0 Z Z 0.0 0.0 Z 0.0 0.0
+ Coke ovens 191.3 0.0 168.5 0.0 0.0 0.0 22.7 0.0 0.0 Z 0.0 0.0
+ BKB & PB plants 0.0 0.0 0.0 0.0 0.0 Z Z 0.0 0.0 Z 0.0 0.0
+ Gas works 0.0 0.0 0.0 0.0 0.0 0.0 0.0 0.0 0.0 Z 0.0 0.0
+ Blast furnaces 290.6 0.0 272.6 0.0 0.0 0.0 0.0 0.0 0.0 Z 0.0 18.0
+ Petroleum refineries (oil refineries) 4 166.5 0.0 0.0 0.0 0.0 3 371.5 82.9 0.0 0.0 Z 336.6 375.5
+ Nuclear industry 2.5 Z Z Z Z Z Z Z Z Z 0.0 2.5
+ Coal liquefaction plants 0.0 0.0 0.0 0.0 0.0 Z Z Z Z Z 0.0 0.0
+ Liquefaction & regasification plants (LNG) 91.7 Z Z Z Z Z 91.7 Z Z Z 0.0 0.0
+ Gasification plants for biogas 0.0 Z Z Z Z Z Z 0.0 0.0 Z 0.0 0.0
+ Gas-to-liquids (GTL) plants 0.0 Z Z Z Z Z 0.0 Z Z Z 0.0 0.0
+ Charcoal production plants 0.0 Z Z Z Z Z Z 0.0 0.0 Z 0.0 0.0
+ Not elsewhere specified (energy) 524.2 0.0 0.0 0.0 0.0 0.0 390.4 0.0 0.0 Z 0.0 133.8
Distribution losses 2 877.7 0.0 107.9 0.0 0.0 0.0 521.9 0.0 0.0 Z 0.0 2 247.9
Available for final consumption 129 030.5 1 896.0 80.9 0.0 0.0 55 658.6 38 642.6 5 399.1 148.1 0.0 1 326.6 25 878.4
Final non-energy consumption 7 482.7 45.4 0.0 0.0 0.0 7 053.8 383.5 0.0 Z Z Z Z
Final energy consumption 121 221.5 1 704.6 79.1 0.0 0.0 48 795.9 37 913.3 5 399.7 148.1 Z 1 326.6 25 854.1
+ Industry 22 745.2 1 133.5 79.1 0.0 0.0 4 046.8 7 767.0 944.7 84.3 Z 722.6 7 967.2
+ Iron & steel 843.3 231.4 79.1 0.0 0.0 4.3 298.2 0.0 0.0 Z 0.0 230.2
+ Chemical & petrochemical 3 353.9 42.7 0.0 0.0 0.0 107.9 1 573.2 4.6 0.0 Z 289.2 1 336.3
+ Non-ferrous metals 633.0 20.1 0.0 0.0 0.0 7.4 235.2 0.0 0.0 Z 0.0 370.2
+ Non-metallic minerals 2 371.0 418.6 0.0 0.0 0.0 164.2 1 100.1 163.8 0.0 Z 0.0 524.2
+ Transport equipment 1 171.1 33.9 0.0 0.0 0.0 196.7 535.6 0.0 0.0 Z 0.0 404.9
+ Machinery 2 203.8 10.1 0.0 0.0 0.0 0.0 1 125.4 0.5 0.5 Z 0.0 1 067.3
+ Mining & quarrying 2.7 0.0 0.0 0.0 0.0 0.0 0.0 0.0 0.0 Z 0.0 2.7
+ Food, beverages & tobacco 2 601.1 48.4 0.0 0.0 0.0 102.9 1 461.7 39.9 0.0 Z 2.9 945.2
+ Paper, pulp & printing 1 817.6 69.8 0.0 0.0 0.0 29.6 351.7 436.8 0.0 Z 0.0 929.8
+ Wood & wood products 207.9 0.0 0.0 0.0 0.0 36.9 43.2 82.8 0.0 Z 0.0 45.0
+ Construction 673.1 3.1 0.0 0.0 0.0 184.1 361.2 0.0 0.0 Z 0.0 124.6
+ Textile & leather 529.4 39.6 0.0 0.0 0.0 40.6 218.3 0.0 0.0 Z 0.0 231.0
+ Not elsewhere specified (industry) 6 277.7 215.6 0.0 0.0 0.0 3 172.4 463.1 156.8 83.7 Z 430.5 1 755.6
+ Transport 41 851.3 10.4 0.0 0.0 0.0 40 495.8 0.0 933.9 0.0 Z Z 411.2
+ Rail 1 030.9 10.4 0.0 0.0 0.0 624.1 Z 0.0 0.0 Z Z 396.4
+ Road 39 082.6 Z Z Z Z 38 133.9 0.0 933.9 0.0 Z Z 14.8
+ Domestic aviation 864.4 Z Z Z Z 864.4 Z 0.0 Z Z Z Z
+ Domestic navigation 873.4 0.0 0.0 0.0 0.0 873.4 Z 0.0 0.0 Z Z Z
+ Pipeline transport 0.0 Z Z Z Z 0.0 0.0 0.0 Z Z Z 0.0
+ Not elsewhere specified (transport) 0.0 0.0 0.0 0.0 0.0 0.0 0.0 0.0 0.0 Z Z 0.0
+ Other 56 625.0 560.8 0.0 0.0 0.0 4 253.3 30 146.3 3 521.1 63.8 Z 604.0 17 475.7
+ Commercial & public services 17 108.7 21.5 0.0 0.0 0.0 1 173.8 6 281.7 1 202.3 57.2 Z 331.9 8 040.3
+ Households 37 082.9 534.4 0.0 0.0 0.0 2 343.3 22 986.4 1 877.5 6.7 Z 272.1 9 062.4
+ Agriculture & forestry 1 157.4 0.0 0.0 0.0 0.0 337.5 98.9 441.2 0.0 Z 0.0 279.7
+ Fishing 201.1 0.0 0.0 0.0 0.0 107.8 0.0 0.0 0.0 Z 0.0 93.2
+ Not elsewhere specified (other) 1 074.9 4.9 0.0 0.0 0.0 290.8 779.3 0.0 0.0 Z 0.0 0.0
Statistical differences 326.2 146.0 1.8 0.0 0.0 -191.1 345.9 -0.6 -0.0 0.0 0.0 24.3
Gross electricity production 29 091.7 1 937.3 64.8 0.0 0.0 138.8 11 758.0 8 787.9 357.1 6 047.8 Z Z
Gross heat production 1 663.3 2.4 0.7 0.0 0.0 32.5 1 523.5 92.5 11.7 0.0 Z 0.0
Source: Eurostat (nrg_bal_c)
140Energy balance sheets — 2017 data
Electricity
ktoe 2017
Oil and
petroleum
products
Natural
gas
Renewables
and
biofuels
Non-
renewable
waste
Nuclear
heatHeat
United KingdomTotal
Solid
fossil
fuels
Manufac-
tured
gases
Peat and
peat
products
Oil shale
and oil
sands

2005 2010 2011 2012 2013 2014 2015 2016 2017
Gross available energy 236 864 215 795 200 886 204 604 201 321 190 352 194 070 191 233 187 906
Solid fossil fuels 37 729 31 874 30 889 39 326 36 933 29 588 24 670 12 350 9 897
Peat & peat products 0 0 0 0 0 0 0 0 0
Oil shale & oil sands 0 0 0 0 0 0 0 0 0
Crude oil & other hydrocarbons 92 728 78 688 79 745 76 351 68 885 64 735 64 723 63 510 64 068
Petroleum products -5 395 -1 599 -5 166 -3 352 1 602 7 086 8 836 11 110 10 275
Natural gas 85 473 84 817 70 343 66 385 65 784 59 940 61 885 69 487 67 839
Nuclear heat 21 054 13 947 15 626 15 206 15 443 13 850 15 479 15 414 15 124
Renewable energies 3 905 7 378 8 175 8 870 10 813 12 533 15 657 16 490 18 241
Non-renewable wastes 656 461 739 798 620 855 1 007 1 346 1 193
Primary production 204 839 145 980 127 207 113 230 106 698 105 350 116 363 118 003 118 130
Solid fossil fuels 11 779 10 528 10 552 9 639 7 516 6 924 5 115 2 501 1 838
Peat 0 0 0 0 0 0 0 0 0
Oil shale and oil sands 0 0 0 0 0 0 0 0 0
Crude oil & other hydrocarbons 88 467 65 450 53 997 46 276 42 223 41 500 47 049 49 293 48 324
Natural gas 79 397 49 786 39 624 33 699 31 797 32 185 34 962 35 892 36 017
Nuclear heat 21 054 13 947 15 626 15 206 15 443 13 850 15 479 15 414 15 124
Renewable energies 3 486 5 808 6 669 7 611 9 098 10 035 12 751 13 556 15 635
Non-renewable wastes 656 461 739 798 620 855 1 007 1 346 1 193
Net imports 31 653 62 598 74 212 88 772 96 148 89 033 72 775 68 235 66 419
Solid fossil fuels 27 264 16 046 19 657 27 014 31 328 26 487 14 593 6 079 5 861
Crude oil 3 454 10 888 22 130 26 134 20 653 19 027 13 207 9 106 10 184
Gas/Diesel Oil (w/o bio) -1 432 1 966 1 278 3 349 4 934 7 669 10 513 12 080 11 768
Motor Gasoline (w/o bio) -4 565 -6 139 -6 524 -7 336 -6 810 -5 514 -6 883 -7 705 -8 019
Naphtha -1 932 -756 -696 -320 288 292 594 957 970
LPG -578 -406 -687 -937 -806 -476 -186 -145 -283
All other oil & petroleum products 2 334 5 298 4 493 5 882 9 616 9 302 9 761 11 094 11 154
Natural gas 5 973 33 901 32 521 32 707 33 938 27 939 26 470 32 338 30 897
Transformation input 193 083 169 708 168 276 164 837 158 002 148 353 145 464 139 707 137 365
Electricity & heat generation 86 255 76 816 74 572 75 555 72 992 66 990 64 992 61 623 59 932
Refinery intake 89 351 76 681 78 274 74 815 67 896 63 592 63 500 62 421 62 252
Coke ovens 4 111 3 955 3 835 3 590 3 824 3 606 2 681 1 342 1 375
Blast furnaces 3 932 2 808 2 604 2 824 3 662 3 644 3 433 2 508 2 375
Transformation output 139 035 123 658 123 641 119 231 114 145 108 318 108 482 106 890 106 431
Electricity & heat generation 35 618 34 213 33 029 32 681 32 159 30 512 30 727 30 803 30 755
Refinery output 88 593 75 351 77 077 74 127 67 596 62 673 63 160 62 204 62 165
Coke ovens 3 960 3 685 3 704 3 429 3 494 3 370 2 572 1 271 1 317
Blast furnaces 1 393 981 903 1 005 1 339 1 323 1 215 868 839
Energy sector 16 318 13 338 12 638 12 232 11 596 10 962 11 568 10 898 11 139
Distribution losses 3 455 3 464 3 319 3 129 3 073 3 101 3 328 2 935 2 878
Available for final consumption 148 722 139 219 125 794 129 924 129 113 122 534 128 596 130 809 129 030
Solid fossil fuels 1 826 3 422 2 209 2 691 2 304 2 116 3 202 2 379 1 896
Manufactured gases 113 178 122 76 83 73 107 84 81
Peat & peat products 0 0 0 0 0 0 0 0 0
Oil shale & oil sands 0 0 0 0 0 0 0 0 0
Gas/Diesel Oil (w/o bio) 26 315 25 704 25 496 26 931 26 687 27 307 28 863 30 074 30 100
Motor Gasoline (w/o bio) 19 969 15 520 14 914 14 180 13 358 13 148 12 657 12 784 12 498
Naphtha 2 339 1 013 1 141 1 097 1 105 1 038 1 453 1 345 1 365
LPG 3 520 3 368 3 384 2 727 2 511 2 739 3 125 3 166 3 040
All other oil & petroleum products 12 232 10 379 8 300 7 929 7 767 8 545 8 816 8 847 8 656
Natural gas 50 469 47 151 38 927 42 874 43 270 36 507 38 094 39 257 38 643
Primary solid biofuels & charcoal 390 1 534 1 396 1 622 2 140 2 186 2 463 2 808 2 917
Liquid biofuels 69 1 151 1 063 895 1 023 1 168 933 946 933
All other renewable energies 116 158 206 233 326 360 1 339 1 544 1 549
Non-renewable wastes 116 90 90 71 139 144 119 127 148
Electricity 29 981 28 286 27 342 27 377 27 207 26 048 26 122 26 152 25 878
Heat 1 268 1 266 1 206 1 222 1 192 1 155 1 304 1 297 1 327
Statistical difference -360 1 240 -695 544 -1 095 -763 1 124 654 326
Final non-energy consumption 11 351 7 899 7 649 6 721 6 812 6 702 7 361 7 548 7 483
Final energy consumption 137 731 130 080 118 840 122 659 123 395 116 594 120 112 122 607 121 221
Industry 30 518 25 597 23 952 23 613 23 644 22 968 22 868 22 472 22 745
Transport 43 260 40 437 39 908 39 749 39 492 40 108 40 889 41 787 41 851
Other sectors 63 953 64 046 54 980 59 297 60 260 53 518 56 355 58 348 56 625
Services 16 753 16 527 15 240 16 232 16 586 15 524 16 883 17 472 17 109
Households 44 249 45 513 37 786 40 958 41 458 35 813 37 278 38 499 37 083
Europe 2020-2030 indicators 2005 2010 2011 2012 2013 2014 2015 2016 2017
Gross inland consumption 234 828 212 992 197 738 201 870 198 441 187 420 190 409 187 344 184 298
Primary energy consumption 223 478 205 093 190 089 195 149 191 629 180 717 183 048 179 797 176 816
Final energy consumption 152 975 143 109 132 162 135 764 136 913 130 117 132 646 134 409 133 347
Source: Eurostat (nrg_bal_c)
141
United Kingdomktoe
Energy balance sheets — 2017 data

Source: Eurostat (nrg_bal_c)
Source: Eurostat (nrg_bal_c)
Note: Please refer to page 23 for related methodological definitions.
United Kingdom
142Energy balance sheets — 2017 data
0
50 000
100 000
150 000
200 000
250 000
300 000
350 000
400 000
450 000
1990 1995 2000 2005 2010 2015 2017
Gross electricity production by fuel, GWh
Solid fossil fuels Oil and petroleum products Natural gas
Renewables and biofuels Nuclear heat Other
0
10 000
20 000
30 000
40 000
50 000
60 000
70 000
80 000
90 000
100 000
1990 1995 2000 2005 2010 2015 2017
Gross available energy by fuel, ktoe
Solid fossil fuels Oil and petroleum products Natural gas
Renewables and biofuels Nuclear heat Non-renewable waste

Source: Eurostat (nrg_bal_c)
Source: Eurostat (nrg_bal_c)
Note: Please refer to page 23 for related methodological definitions.
United Kingdom
143Energy balance sheets — 2017 data
0
20 000
40 000
60 000
80 000
100 000
120 000
140 000
160 000
1990 1995 2000 2005 2010 2015 2017
Final energy consumption by fuel, ktoe
Solid fossil fuels Oil and petroleum products Natural gas
Renewables and biofuels Electricity Heat
Other
0
20 000
40 000
60 000
80 000
100 000
120 000
140 000
160 000
1990 1995 2000 2005 2010 2015 2017
Final consumption by sector, ktoe
Industry Transport Services Households Non-energy use

+ Primary production 4 807.5 0.0 Z 0.0 0.0 0.0 0.0 4 807.5 0.0 0.0 Z Z
+ Recovered & recycled products 0.0 0.0 Z 0.0 0.0 0.0 Z 0.0 Z Z Z Z
+ Imports 1 106.5 99.2 0.0 0.3 0.0 988.6 0.0 18.4 0.0 Z 0.0 0.0
- Exports 0.0 0.0 0.0 0.0 0.0 0.0 0.0 0.0 0.0 Z 0.0 0.0
+ Change in stock 19.8 0.0 0.0 0.0 0.0 19.8 0.0 0.0 0.0 Z Z Z
= Gross available energy 5 933.7 99.2 0.0 0.3 0.0 1 008.4 0.0 4 825.9 0.0 0.0 0.0 0.0
- International maritime bunkers 60.9 0.0 0.0 0.0 0.0 60.9 0.0 0.0 Z Z Z Z
= Gross inland consumption 5 872.9 99.2 0.0 0.3 0.0 947.5 0.0 4 825.9 0.0 0.0 0.0 0.0
- International aviation 382.2 Z Z Z Z 382.2 Z 0.0 Z Z Z Z
= Total energy supply 5 490.7 99.2 0.0 0.3 0.0 565.3 0.0 4 825.9 0.0 0.0 0.0 0.0
Transformation input 4 778.8 0.0 0.0 0.0 0.0 2.2 0.0 4 759.9 0.0 0.0 0.0 16.7
+ Electricity & heat generation 4 762.1 0.0 0.0 0.0 0.0 2.2 0.0 4 743.2 0.0 0.0 0.0 16.7
+ Coke ovens 0.0 0.0 0.0 0.0 0.0 0.0 0.0 0.0 Z Z Z Z
+ Blast furnaces 0.0 0.0 0.0 0.0 0.0 0.0 0.0 0.0 Z Z Z Z
+ Gas works 0.0 0.0 0.0 0.0 0.0 0.0 0.0 0.0 Z Z Z Z
+ Refineries & petrochemical industry 0.0 Z Z Z Z 0.0 Z Z Z Z Z Z
+ Patent fuel plants 0.0 0.0 0.0 0.0 0.0 0.0 Z 0.0 0.0 Z Z Z
+ BKB & PB plants 0.0 0.0 0.0 0.0 0.0 Z Z 0.0 0.0 Z Z Z
+ Coal liquefaction plants 0.0 0.0 0.0 0.0 0.0 Z Z Z Z Z Z Z
+ For blended natural gas 0.0 Z 0.0 Z Z 0.0 Z 0.0 Z Z Z Z
+ Liquid biofuels blended 16.7 Z Z Z Z Z Z 16.7 Z Z Z Z
+ Charcoal production plants 0.0 Z Z Z Z Z Z 0.0 Z Z Z Z
+ Gas-to-liquids plants 0.0 Z Z Z Z Z 0.0 Z Z Z Z Z
+ Not elsewhere specified 0.0 0.0 0.0 0.0 0.0 0.0 0.0 0.0 0.0 Z Z Z
Transformation output 2 416.5 0.0 0.0 0.0 Z 0.0 0.0 16.7 Z Z 745.6 1 654.2
+ Electricity & heat generation 2 399.9 Z Z Z Z Z Z Z Z Z 745.6 1 654.2
+ Coke ovens 0.0 0.0 0.0 Z Z Z Z Z Z Z Z Z
+ Blast furnaces 0.0 0.0 0.0 Z Z Z Z Z Z Z Z Z
+ Gas works 0.0 0.0 0.0 Z Z Z Z Z Z Z Z Z
+ Refineries & petrochemical industry 0.0 Z Z Z Z 0.0 Z 0.0 Z Z Z Z
+ Patent fuel plants 0.0 0.0 Z Z Z Z Z Z Z Z Z Z
+ BKB & PB plants 0.0 0.0 Z 0.0 Z Z Z Z Z Z Z Z
+ Coal liquefaction plants 0.0 Z Z Z Z 0.0 Z Z Z Z Z Z
+ Blended in natural gas 0.0 Z Z Z Z Z 0.0 Z Z Z Z Z
+ Liquid biofuels blended 16.7 Z Z Z Z Z Z 16.7 Z Z Z Z
+ Charcoal production plants 0.0 Z Z Z Z Z Z 0.0 Z Z Z Z
+ Gas-to-liquids plants 0.0 Z Z Z Z 0.0 Z Z Z Z Z Z
+ Not elsewhere specified 0.0 0.0 0.0 0.0 Z 0.0 Z Z Z Z Z Z
Energy sector 48.3 0.0 0.0 0.0 0.0 0.0 0.0 0.0 0.0 Z 0.0 48.3
+ Own use in electricity & heat generation 33.8 0.0 0.0 0.0 0.0 0.0 0.0 0.0 0.0 Z 0.0 33.7
+ Coal mines 0.0 0.0 0.0 0.0 0.0 0.0 0.0 0.0 0.0 Z 0.0 0.0
+ Oil & natural gas extraction plants 0.0 Z Z Z Z 0.0 0.0 0.0 Z Z 0.0 0.0
+ Patent fuel plants 0.0 0.0 0.0 0.0 0.0 Z Z 0.0 0.0 Z 0.0 0.0
+ Coke ovens 0.0 0.0 0.0 0.0 0.0 0.0 0.0 0.0 0.0 Z 0.0 0.0
+ BKB & PB plants 0.0 0.0 0.0 0.0 0.0 Z Z 0.0 0.0 Z 0.0 0.0
+ Gas works 0.0 0.0 0.0 0.0 0.0 0.0 0.0 0.0 0.0 Z 0.0 0.0
+ Blast furnaces 0.0 0.0 0.0 0.0 0.0 0.0 0.0 0.0 0.0 Z 0.0 0.0
+ Petroleum refineries (oil refineries) 0.0 0.0 0.0 0.0 0.0 0.0 0.0 0.0 0.0 Z 0.0 0.0
+ Nuclear industry 0.0 Z Z Z Z Z Z Z Z Z 0.0 0.0
+ Coal liquefaction plants 0.0 0.0 0.0 0.0 0.0 Z Z Z Z Z 0.0 0.0
+ Liquefaction & regasification plants (LNG) 0.0 Z Z Z Z Z 0.0 Z Z Z 0.0 0.0
+ Gasification plants for biogas 0.0 Z Z Z Z Z Z 0.0 0.0 Z 0.0 0.0
+ Gas-to-liquids (GTL) plants 0.0 Z Z Z Z Z 0.0 Z Z Z 0.0 0.0
+ Charcoal production plants 0.0 Z Z Z Z Z Z 0.0 0.0 Z 0.0 0.0
+ Not elsewhere specified (energy) 14.6 0.0 0.0 0.0 0.0 0.0 0.0 0.0 0.0 Z 0.0 14.6
Distribution losses 128.8 0.0 0.0 0.0 0.0 0.0 0.0 6.7 0.0 Z 71.3 50.8
Available for final consumption 2 951.3 99.2 0.0 0.3 0.0 563.2 0.0 75.9 0.0 0.0 674.3 1 538.4
Final non-energy consumption 18.6 0.0 0.0 0.0 0.0 18.6 0.0 0.0 Z Z Z Z
Final energy consumption 2 971.1 102.6 0.0 0.3 0.0 568.8 0.0 117.3 0.0 Z 643.6 1 538.4
+ Industry 1 500.8 102.6 0.0 0.3 0.0 44.5 0.0 30.1 0.0 Z 0.0 1 323.2
+ Iron & steel 214.2 102.6 0.0 0.0 0.0 6.6 0.0 17.9 0.0 Z 0.0 87.1
+ Chemical & petrochemical 7.3 0.0 0.0 0.0 0.0 0.0 0.0 0.0 0.0 Z 0.0 7.2
+ Non-ferrous metals 1 160.5 0.0 0.0 0.0 0.0 0.4 0.0 0.0 0.0 Z 0.0 1 160.0
+ Non-metallic minerals 10.7 0.0 0.0 0.0 0.0 0.0 0.0 0.0 0.0 Z 0.0 10.7
+ Transport equipment 0.5 0.0 0.0 0.0 0.0 0.0 0.0 0.0 0.0 Z 0.0 0.5
+ Machinery 0.9 0.0 0.0 0.0 0.0 0.0 0.0 0.0 0.0 Z 0.0 0.9
+ Mining & quarrying 0.2 0.0 0.0 0.0 0.0 0.0 0.0 0.0 0.0 Z 0.0 0.2
+ Food, beverages & tobacco 53.0 0.0 0.0 0.0 0.0 3.6 0.0 0.0 0.0 Z 0.0 49.4
+ Paper, pulp & printing 1.3 0.0 0.0 0.0 0.0 0.0 0.0 0.0 0.0 Z 0.0 1.3
+ Wood & wood products 0.3 0.0 0.0 0.0 0.0 0.0 0.0 0.0 0.0 Z 0.0 0.3
+ Construction 33.5 0.0 0.0 0.0 0.0 30.2 0.0 0.0 0.0 Z 0.0 3.3
+ Textile & leather 0.2 0.0 0.0 0.0 0.0 0.0 0.0 0.0 0.0 Z 0.0 0.2
+ Not elsewhere specified (industry) 18.2 0.0 0.0 0.3 0.0 3.7 0.0 12.1 0.0 Z 0.0 2.0
+ Transport 357.2 0.0 0.0 0.0 0.0 333.4 0.0 18.3 0.0 Z Z 5.5
+ Rail 0.0 0.0 0.0 0.0 0.0 0.0 Z 0.0 0.0 Z Z 0.0
+ Road 333.9 Z Z Z Z 315.6 0.0 18.3 0.0 Z Z 0.0
+ Domestic aviation 7.7 Z Z Z Z 7.7 Z 0.0 Z Z Z Z
+ Domestic navigation 10.2 0.0 0.0 0.0 0.0 10.2 Z 0.0 0.0 Z Z Z
+ Pipeline transport 0.0 Z Z Z Z 0.0 0.0 0.0 Z Z Z 0.0
+ Not elsewhere specified (transport) 5.5 0.0 0.0 0.0 0.0 0.0 0.0 0.0 0.0 Z Z 5.5
+ Other 1 113.2 0.0 0.0 0.0 0.0 190.9 0.0 68.9 0.0 Z 643.6 209.8
+ Commercial & public services 399.3 0.0 0.0 0.0 0.0 0.3 0.0 37.9 0.0 Z 246.7 114.5
+ Households 423.6 0.0 0.0 0.0 0.0 3.8 0.0 12.1 0.0 Z 337.0 70.8
+ Agriculture & forestry 41.2 0.0 0.0 0.0 0.0 6.2 0.0 5.7 0.0 Z 10.0 19.3
+ Fishing 229.5 0.0 0.0 0.0 0.0 170.4 0.0 13.2 0.0 Z 40.8 5.2
+ Not elsewhere specified (other) 19.4 0.0 0.0 0.0 0.0 10.3 0.0 0.0 0.0 Z 9.1 0.0
Statistical differences -38.4 -3.5 0.0 0.0 0.0 -24.2 0.0 -41.4 0.0 0.0 30.7 0.0
Gross electricity production 1 654.2 0.0 0.0 0.0 0.0 0.2 0.0 1 654.0 0.0 0.0 Z Z
Gross heat production 745.6 0.0 0.0 0.0 0.0 1.5 0.0 724.5 0.0 0.0 Z 19.6
Source: Eurostat (nrg_bal_c)
144Energy balance sheets — 2017 data
Electricity
ktoe 2017
Oil and
petroleum
products
Natural
gas
Renewables
and
biofuels
Non-
renewable
waste
Nuclear
heatHeat
IcelandTotal
Solid
fossil
fuels
Manufac-
tured
gases
Peat and
peat
products
Oil shale
and oil
sands

2005 2010 2011 2012 2013 2014 2015 2016 2017
Gross available energy 3 439 5 602 6 000 5 864 6 091 6 089 5 871 5 663 5 934
Solid fossil fuels 99 90 91 93 98 87 93 99 99
Peat & peat products 0 0 0 0 0 0 0 0 0
Oil shale & oil sands 0 0 0 0 0 0 0 0 0
Crude oil & other hydrocarbons 0 0 0 0 0 0 0 0 0
Petroleum products 955 721 710 701 709 768 836 943 1 008
Natural gas 0 0 0 0 0 0 0 0 0
Nuclear heat 0 0 0 0 0 0 0 0 0
Renewable energies 2 384 4 790 5 199 5 071 5 284 5 235 4 942 4 621 4 826
Non-renewable wastes 1 0 0 0 0 0 0 0 0
Primary production 2 384 4 791 5 199 5 071 5 282 5 233 4 928 4 605 4 807
Solid fossil fuels 0 0 0 0 0 0 0 0 0
Peat 0 0 0 0 0 0 0 0 0
Oil shale and oil sands 0 0 0 0 0 0 0 0 0
Crude oil & other hydrocarbons 0 0 0 0 0 0 0 0 0
Natural gas 0 0 0 0 0 0 0 0 0
Nuclear heat 0 0 0 0 0 0 0 0 0
Renewable energies 2 384 4 790 5 199 5 071 5 282 5 233 4 928 4 605 4 807
Non-renewable wastes 1 0 0 0 0 0 0 0 0
Net imports 1 074 777 803 803 823 850 964 1 069 1 106
Solid fossil fuels 99 87 89 97 98 87 93 99 99
Crude oil 0 0 0 0 0 0 0 0 0
Gas/Diesel Oil (w/o bio) 429 300 308 287 280 296 351 350 357
Motor Gasoline (w/o bio) 172 151 152 145 140 140 146 142 144
Naphtha 0 0 0 0 0 0 0 0 0
LPG 2 3 3 3 3 2 3 3 3
All other oil & petroleum products 370 235 250 271 298 322 357 458 486
Natural gas 0 0 0 0 0 0 0 0 0
Transformation input 2 284 4 700 5 108 4 972 5 180 5 118 4 855 4 626 4 779
Electricity & heat generation 2 284 4 700 5 108 4 953 5 154 5 116 4 822 4 611 4 762
Refinery intake 0 0 0 0 0 0 0 0 0
Coke ovens 0 0 0 0 0 0 0 0 0
Blast furnaces 0 0 0 0 0 0 0 0 0
Transformation output 1 218 1 982 1 994 2 077 2 129 2 114 2 286 2 429 2 417
Electricity & heat generation 1 218 1 982 1 994 2 057 2 101 2 112 2 252 2 415 2 400
Refinery output 0 0 0 0 0 0 0 0 0
Coke ovens 0 0 0 0 0 0 0 0 0
Blast furnaces 0 0 0 0 0 0 0 0 0
Energy sector 29 40 43 36 24 43 37 48 48
Distribution losses 92 125 108 113 103 116 126 135 129
Available for final consumption 2 050 2 535 2 531 2 614 2 721 2 718 2 866 2 920 2 951
Solid fossil fuels 99 90 91 93 98 87 93 99 99
Manufactured gases 0 0 0 0 0 0 0 0 0
Peat & peat products 0 0 0 0 0 0 0 0 0
Oil shale & oil sands 0 0 0 0 0 0 0 0 0
Gas/Diesel Oil (w/o bio) 376 293 273 274 274 295 327 313 333
Motor Gasoline (w/o bio) 158 156 150 144 142 139 139 143 144
Naphtha 0 0 0 0 0 0 0 0 0
LPG 2 3 3 3 3 2 3 3 3
All other oil & petroleum products 216 85 79 73 98 121 94 118 84
Natural gas 0 0 0 0 0 0 0 0 0
Primary solid biofuels & charcoal 0 0 0 0 11 10 11 11 16
Liquid biofuels 0 0 0 0 2 2 14 15 17
All other renewable energies 108 99 100 127 128 117 107 -6 43
Non-renewable wastes 0 0 0 0 0 0 0 0 0
Electricity 671 1 351 1 377 1 414 1 485 1 456 1 511 1 488 1 538
Heat 420 458 458 485 481 489 567 735 674
Statistical difference 15 -1 -6 2 3 -36 -3 -84 -38
Final non-energy consumption 162 18 15 11 11 13 20 18 19
Final energy consumption 1 873 2 517 2 521 2 600 2 707 2 740 2 849 2 985 2 971
Industry 739 1 300 1 324 1 359 1 424 1 442 1 460 1 444 1 501
Transport 229 284 276 270 277 279 301 330 357
Other sectors 905 933 921 971 1 005 1 019 1 088 1 211 1 113
Services 272 303 302 325 333 364 397 454 399
Households 335 378 371 401 399 385 392 475 424
Europe 2020-2030 indicators 2005 2010 2011 2012 2013 2014 2015 2016 2017
Gross inland consumption 3 373 5 544 5 937 5 805 6 066 6 066 5 823 5 605 5 873
Primary energy consumption 3 211 5 526 5 922 5 794 6 055 6 053 5 803 5 587 5 854
Final energy consumption 2 010 2 644 2 662 2 748 2 873 2 926 3 074 3 291 3 353
Source: Eurostat (nrg_bal_c)
145
Icelandktoe
Energy balance sheets — 2017 data
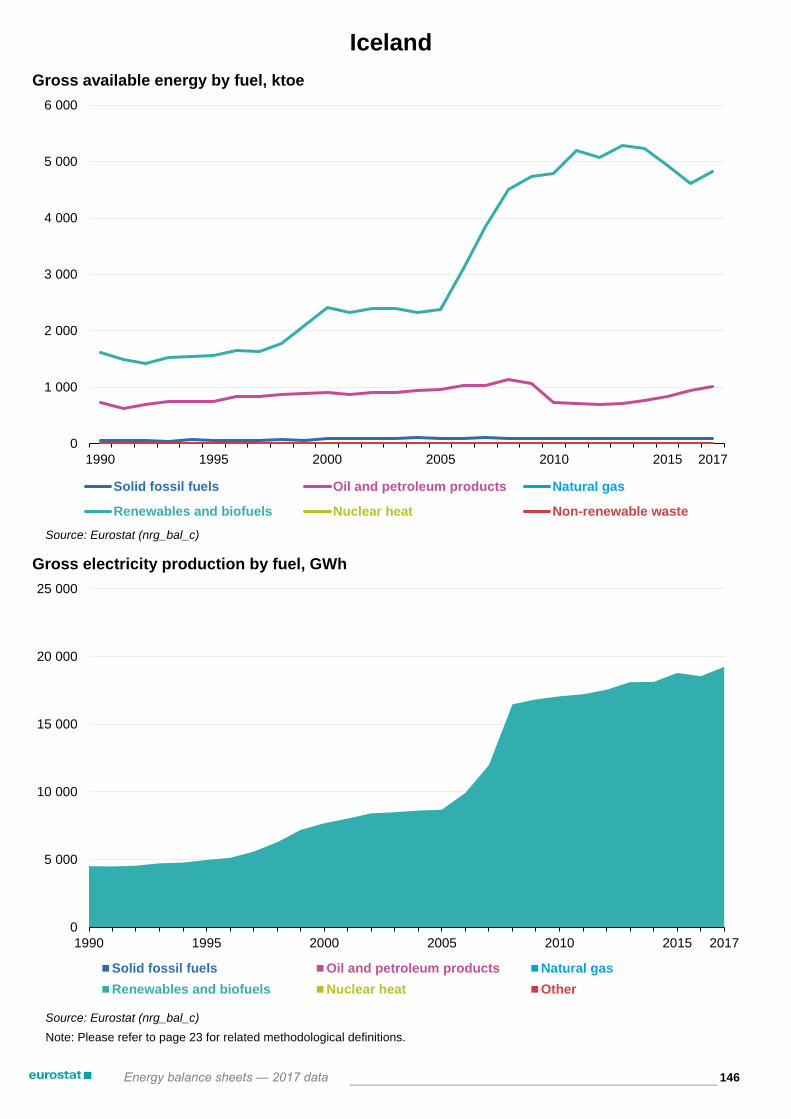
Source: Eurostat (nrg_bal_c)
Source: Eurostat (nrg_bal_c)
Note: Please refer to page 23 for related methodological definitions.
Iceland
146Energy balance sheets — 2017 data
0
5 000
10 000
15 000
20 000
25 000
1990 1995 2000 2005 2010 2015 2017
Gross electricity production by fuel, GWh
Solid fossil fuels Oil and petroleum products Natural gas
Renewables and biofuels Nuclear heat Other
0
1 000
2 000
3 000
4 000
5 000
6 000
1990 1995 2000 2005 2010 2015 2017
Gross available energy by fuel, ktoe
Solid fossil fuels Oil and petroleum products Natural gas
Renewables and biofuels Nuclear heat Non-renewable waste

Source: Eurostat (nrg_bal_c)
Source: Eurostat (nrg_bal_c)
Note: Please refer to page 23 for related methodological definitions.
Iceland
147Energy balance sheets — 2017 data
0
500
1 000
1 500
2 000
2 500
3 000
3 500
1990 1995 2000 2005 2010 2015 2017
Final energy consumption by fuel, ktoe
Solid fossil fuels Oil and petroleum products Natural gas
Renewables and biofuels Electricity Heat
Other
0
500
1 000
1 500
2 000
2 500
3 000
3 500
1990 1995 2000 2005 2010 2015 2017
Final consumption by sector, ktoe
Industry Transport Services Households Non-energy use

+ Primary production 213 437.1 87.9 Z 0.0 0.0 90 269.3 108 719.9 14 107.5 252.5 0.0 Z Z
+ Recovered & recycled products 0.0 0.0 Z 0.0 0.0 0.0 Z 0.0 Z Z Z Z
+ Imports 9 685.5 803.9 0.0 0.0 0.0 7 863.4 0.0 492.6 0.0 Z 0.0 525.5
- Exports 193 480.5 50.3 0.0 0.0 0.0 87 516.6 103 993.2 90.9 0.0 Z 0.0 1 829.4
+ Change in stock 1 133.0 6.2 0.0 0.0 0.0 1 173.1 -46.3 0.0 0.0 Z Z Z
= Gross available energy 30 775.1 847.7 0.0 0.0 0.0 11 789.2 4 680.5 14 509.2 252.5 0.0 0.0 -1 304.0
- International maritime bunkers 184.8 0.0 0.0 0.0 0.0 150.8 34.0 0.0 Z Z Z Z
= Gross inland consumption 30 590.3 847.7 0.0 0.0 0.0 11 638.4 4 646.5 14 509.2 252.5 0.0 0.0 -1 304.0
- International aviation 539.4 Z Z Z Z 539.4 Z 0.0 Z Z Z Z
= Total energy supply 30 050.9 847.7 0.0 0.0 0.0 11 099.0 4 646.5 14 509.2 252.5 0.0 0.0 -1 304.0
Transformation input 56 068.5 259.5 30.6 0.0 0.0 41 746.6 332.4 13 300.7 168.0 0.0 0.0 230.7
+ Electricity & heat generation 13 603.9 19.5 30.6 0.0 0.0 17.0 332.4 12 805.8 168.0 0.0 0.0 230.7
+ Coke ovens 0.0 0.0 0.0 0.0 0.0 0.0 0.0 0.0 Z Z Z Z
+ Blast furnaces 240.0 240.0 0.0 0.0 0.0 0.0 0.0 0.0 Z Z Z Z
+ Gas works 0.0 0.0 0.0 0.0 0.0 0.0 0.0 0.0 Z Z Z Z
+ Refineries & petrochemical industry 41 729.7 Z Z Z Z 41 729.7 Z Z Z Z Z Z
+ Patent fuel plants 0.0 0.0 0.0 0.0 0.0 0.0 Z 0.0 0.0 Z Z Z
+ BKB & PB plants 0.0 0.0 0.0 0.0 0.0 Z Z 0.0 0.0 Z Z Z
+ Coal liquefaction plants 0.0 0.0 0.0 0.0 0.0 Z Z Z Z Z Z Z
+ For blended natural gas 0.0 Z 0.0 Z Z 0.0 Z 0.0 Z Z Z Z
+ Liquid biofuels blended 495.0 Z Z Z Z Z Z 495.0 Z Z Z Z
+ Charcoal production plants 0.0 Z Z Z Z Z Z 0.0 Z Z Z Z
+ Gas-to-liquids plants 0.0 Z Z Z Z Z 0.0 Z Z Z Z Z
+ Not elsewhere specified 0.0 0.0 0.0 0.0 0.0 0.0 0.0 0.0 0.0 Z Z Z
Transformation output 56 512.2 0.0 95.8 0.0 Z 42 528.4 0.0 495.0 Z Z 550.4 12 842.6
+ Electricity & heat generation 13 393.0 Z Z Z Z Z Z Z Z Z 550.4 12 842.6
+ Coke ovens 0.0 0.0 0.0 Z Z Z Z Z Z Z Z Z
+ Blast furnaces 95.8 0.0 95.8 Z Z Z Z Z Z Z Z Z
+ Gas works 0.0 0.0 0.0 Z Z Z Z Z Z Z Z Z
+ Refineries & petrochemical industry 42 528.4 Z Z Z Z 42 528.4 Z 0.0 Z Z Z Z
+ Patent fuel plants 0.0 0.0 Z Z Z Z Z Z Z Z Z Z
+ BKB & PB plants 0.0 0.0 Z 0.0 Z Z Z Z Z Z Z Z
+ Coal liquefaction plants 0.0 Z Z Z Z 0.0 Z Z Z Z Z Z
+ Blended in natural gas 0.0 Z Z Z Z Z 0.0 Z Z Z Z Z
+ Liquid biofuels blended 495.0 Z Z Z Z Z Z 495.0 Z Z Z Z
+ Charcoal production plants 0.0 Z Z Z Z Z Z 0.0 Z Z Z Z
+ Gas-to-liquids plants 0.0 Z Z Z Z 0.0 Z Z Z Z Z Z
+ Not elsewhere specified 0.0 0.0 0.0 0.0 Z 0.0 Z Z Z Z Z Z
Energy sector 5 940.8 0.0 0.0 0.0 0.0 531.5 4 637.1 0.1 0.0 Z 0.0 772.1
+ Own use in electricity & heat generation 62.9 0.0 0.0 0.0 0.0 1.0 0.0 0.1 0.0 Z 0.0 61.7
+ Coal mines 1.2 0.0 0.0 0.0 0.0 0.0 0.0 0.0 0.0 Z 0.0 1.2
+ Oil & natural gas extraction plants 5 270.8 Z Z Z Z 0.0 4 608.2 0.0 Z Z 0.0 662.6
+ Patent fuel plants 0.0 0.0 0.0 0.0 0.0 Z Z 0.0 0.0 Z 0.0 0.0
+ Coke ovens 0.0 0.0 0.0 0.0 0.0 0.0 0.0 0.0 0.0 Z 0.0 0.0
+ BKB & PB plants 0.0 0.0 0.0 0.0 0.0 Z Z 0.0 0.0 Z 0.0 0.0
+ Gas works 0.0 0.0 0.0 0.0 0.0 0.0 0.0 0.0 0.0 Z 0.0 0.0
+ Blast furnaces 0.0 0.0 0.0 0.0 0.0 0.0 0.0 0.0 0.0 Z 0.0 0.0
+ Petroleum refineries (oil refineries) 605.9 0.0 0.0 0.0 0.0 530.5 28.8 0.0 0.0 Z 0.0 46.6
+ Nuclear industry 0.0 Z Z Z Z Z Z Z Z Z 0.0 0.0
+ Coal liquefaction plants 0.0 0.0 0.0 0.0 0.0 Z Z Z Z Z 0.0 0.0
+ Liquefaction & regasification plants (LNG) 0.0 Z Z Z Z Z 0.0 Z Z Z 0.0 0.0
+ Gasification plants for biogas 0.0 Z Z Z Z Z Z 0.0 0.0 Z 0.0 0.0
+ Gas-to-liquids (GTL) plants 0.0 Z Z Z Z Z 0.0 Z Z Z 0.0 0.0
+ Charcoal production plants 0.0 Z Z Z Z Z Z 0.0 0.0 Z 0.0 0.0
+ Not elsewhere specified (energy) 0.0 0.0 0.0 0.0 0.0 0.0 0.0 0.0 0.0 Z 0.0 0.0
Distribution losses 850.4 0.0 3.8 0.0 0.0 0.0 0.0 0.0 0.0 Z 59.6 787.0
Available for final consumption 23 703.4 588.2 61.4 0.0 0.0 11 349.3 -323.0 1 703.3 84.5 0.0 490.8 9 748.8
Final non-energy consumption 2 493.8 59.7 0.0 0.0 0.0 1 928.5 505.5 0.0 Z Z Z Z
Final energy consumption 18 531.8 498.8 61.4 0.0 0.0 5 463.6 458.7 1 698.5 84.6 Z 490.1 9 776.1
+ Industry 6 042.2 498.8 61.4 0.0 0.0 854.6 290.7 257.0 76.4 Z 47.1 3 956.1
+ Iron & steel 736.9 198.2 47.2 0.0 0.0 9.5 0.9 4.2 0.3 Z 0.2 476.5
+ Chemical & petrochemical 1 365.7 219.3 9.8 0.0 0.0 310.6 108.1 48.2 18.6 Z 10.2 640.9
+ Non-ferrous metals 1 852.9 0.0 0.0 0.0 0.0 21.9 39.2 0.0 0.0 Z 0.9 1 790.9
+ Non-metallic minerals 350.5 81.3 4.4 0.0 0.0 54.2 51.7 27.8 49.7 Z 0.6 80.7
+ Transport equipment 41.5 0.0 0.0 0.0 0.0 4.2 1.1 0.0 0.0 Z 2.1 34.1
+ Machinery 106.5 0.0 0.0 0.0 0.0 8.4 3.1 0.1 0.1 Z 3.7 91.1
+ Mining & quarrying 89.4 0.0 0.0 0.0 0.0 51.6 2.5 0.0 0.0 Z 0.0 35.3
+ Food, beverages & tobacco 417.8 0.0 0.0 0.0 0.0 78.8 64.9 2.2 0.0 Z 17.0 254.9
+ Paper, pulp & printing 460.9 0.0 0.0 0.0 0.0 9.0 10.8 94.4 7.6 Z 3.0 336.0
+ Wood & wood products 147.4 0.0 0.0 0.0 0.0 6.2 3.9 76.9 0.0 Z 7.6 52.9
+ Construction 408.7 0.0 0.0 0.0 0.0 287.1 0.5 0.0 0.0 Z 1.5 119.6
+ Textile & leather 7.7 0.0 0.0 0.0 0.0 1.1 0.6 0.0 0.0 Z 0.1 5.9
+ Not elsewhere specified (industry) 56.3 0.0 0.0 0.0 0.0 12.0 3.5 3.3 0.0 Z 0.4 37.1
+ Transport 4 632.4 0.0 0.0 0.0 0.0 3 951.0 97.8 505.1 0.0 Z Z 78.5
+ Rail 64.0 0.0 0.0 0.0 0.0 14.4 Z 0.0 0.0 Z Z 49.6
+ Road 3 396.8 Z Z Z Z 2 844.4 22.8 500.6 0.0 Z Z 28.9
+ Domestic aviation 360.4 Z Z Z Z 360.4 Z 0.0 Z Z Z Z
+ Domestic navigation 736.3 0.0 0.0 0.0 0.0 731.8 Z 4.5 0.0 Z Z Z
+ Pipeline transport 0.0 Z Z Z Z 0.0 0.0 0.0 Z Z Z 0.0
+ Not elsewhere specified (transport) 75.0 0.0 0.0 0.0 0.0 0.0 75.0 0.0 0.0 Z Z 0.0
+ Other 7 857.2 0.0 0.0 0.0 0.0 658.0 70.3 936.3 8.3 Z 442.9 5 741.4
+ Commercial & public services 2 836.6 0.0 0.0 0.0 0.0 264.7 49.2 30.6 8.3 Z 333.2 2 150.6
+ Households 4 097.1 0.0 0.0 0.0 0.0 65.2 7.7 501.3 0.0 Z 109.3 3 413.6
+ Agriculture & forestry 307.9 0.0 0.0 0.0 0.0 134.5 13.4 0.0 0.0 Z 0.5 159.5
+ Fishing 131.0 0.0 0.0 0.0 0.0 113.2 0.0 0.0 0.0 Z 0.0 17.7
+ Not elsewhere specified (other) 484.7 0.0 0.0 0.0 0.0 80.3 0.0 404.4 0.0 Z 0.0 0.0
Statistical differences 2 677.8 29.7 0.0 0.0 0.0 3 957.2 -1 287.3 4.9 -0.1 0.0 0.7 -27.3
Gross electricity production 12 818.4 3.7 12.3 0.0 0.0 2.4 216.8 12 561.1 22.1 0.0 Z Z
Gross heat production 467.6 5.8 0.6 0.0 0.0 11.8 12.3 243.6 125.7 0.0 Z 67.8
Source: Eurostat (nrg_bal_c)
148Energy balance sheets — 2017 data
Electricity
ktoe 2017
Oil and
petroleum
products
Natural
gas
Renewables
and
biofuels
Non-
renewable
waste
Nuclear
heatHeat
NorwayTotal
Solid
fossil
fuels
Manufac-
tured
gases
Peat and
peat
products
Oil shale
and oil
sands

2005 2010 2011 2012 2013 2014 2015 2016 2017
Gross available energy 27 921 33 781 29 258 31 869 33 822 29 370 30 031 28 318 30 775
Solid fossil fuels 776 763 846 816 775 850 821 758 848
Peat & peat products 0 0 0 0 0 0 0 0 0
Oil shale & oil sands 0 0 0 0 0 0 0 0 0
Crude oil & other hydrocarbons 22 434 22 268 23 491 24 213 25 072 22 231 24 526 21 261 25 298
Petroleum products -11 508 -8 331 -12 479 -11 453 -10 425 -11 758 -14 129 -12 456 -13 509
Natural gas 4 071 6 280 5 139 5 437 5 652 5 780 6 141 5 583 4 680
Nuclear heat 0 0 0 0 0 0 0 0 0
Renewable energies 13 080 11 990 12 339 14 175 12 942 13 363 13 674 14 335 14 509
Non-renewable wastes 103 162 187 213 236 245 257 249 252
Primary production 223 879 208 875 199 251 205 312 195 214 195 770 206 390 208 595 213 437
Solid fossil fuels 987 1 299 930 825 1 245 1 124 742 549 88
Peat 0 0 0 0 0 0 0 0 0
Oil shale and oil sands 0 0 0 0 0 0 0 0 0
Crude oil & other hydrocarbons 134 689 100 951 95 491 88 862 84 622 85 427 89 069 91 470 90 269
Natural gas 75 040 94 721 90 549 101 450 96 389 95 797 102 847 102 337 108 720
Nuclear heat 0 0 0 0 0 0 0 0 0
Renewable energies 13 059 11 741 12 093 13 962 12 721 13 178 13 475 13 990 14 108
Non-renewable wastes 103 162 187 213 236 245 257 249 252
Net imports -195 602 -175 112 -169 381 -173 210 -161 428 -166 858 -176 143 -179 986 -183 795
Solid fossil fuels -412 -383 -222 -53 -673 -259 1 121 754
Crude oil -111 896 -78 531 -71 538 -64 546 -59 494 -63 500 -64 422 -69 470 -65 953
Gas/Diesel Oil (w/o bio) -1 933 -811 -1 831 -1 084 -1 411 -1 696 -1 689 -904 -2 598
Motor Gasoline (w/o bio) -2 306 -1 819 -2 793 -2 365 -2 124 -2 068 -2 986 -3 099 -3 421
Naphtha -2 176 -2 038 -2 371 -2 532 -1 667 -2 610 -2 634 -2 877 -2 977
LPG -5 324 -4 534 -5 375 -5 003 -5 011 -5 237 -6 369 -6 128 -5 347
All other oil & petroleum products 428 581 150 -281 -112 -339 -240 201 643
Natural gas -70 969 -88 476 -85 384 -96 030 -90 728 -90 000 -96 744 -96 763 -103 993
Transformation input 47 401 45 537 47 356 49 805 49 768 46 667 54 890 51 889 56 069
Electricity & heat generation 12 249 11 827 11 991 13 419 12 205 12 852 13 138 13 607 13 604
Refinery intake 16 070 14 694 15 939 15 788 16 587 14 735 17 278 13 410 16 603
Coke ovens 0 0 0 0 0 0 0 0 0
Blast furnaces 110 158 233 222 226 244 225 192 240
Transformation output 47 738 44 902 47 201 49 530 49 828 47 134 54 582 51 986 56 512
Electricity & heat generation 12 171 11 062 11 350 13 121 12 003 12 661 12 919 13 396 13 393
Refinery output 16 128 14 521 16 159 15 526 16 549 15 113 16 917 13 407 16 969
Coke ovens 0 0 0 0 0 0 0 0 0
Blast furnaces 44 63 93 89 91 98 90 77 96
Energy sector 4 805 5 728 5 586 5 717 5 666 5 880 5 830 5 712 5 941
Distribution losses 917 883 687 837 746 710 699 849 850
Available for final consumption 21 486 25 703 22 015 24 308 26 616 22 595 22 436 21 218 23 703
Solid fossil fuels 649 588 596 579 533 589 579 548 588
Manufactured gases 22 37 67 68 69 70 61 51 61
Peat & peat products 0 0 0 0 0 0 0 0 0
Oil shale & oil sands 0 0 0 0 0 0 0 0 0
Gas/Diesel Oil (w/o bio) 4 435 4 747 4 158 4 774 5 014 4 472 5 013 4 362 4 337
Motor Gasoline (w/o bio) 1 673 1 840 1 180 1 473 1 891 1 460 1 194 857 1 445
Naphtha 1 470 1 844 1 402 1 963 2 723 585 -281 -58 147
LPG 1 168 1 493 861 1 221 1 101 1 109 374 780 1 703
All other oil & petroleum products 761 2 482 2 245 1 866 2 668 2 236 2 893 2 215 3 717
Natural gas 351 853 199 863 1 089 966 1 155 645 -323
Primary solid biofuels & charcoal 1 063 1 141 1 118 1 013 901 693 740 712 747
Liquid biofuels 0 137 132 145 143 134 149 347 499
All other renewable energies 142 329 365 381 390 401 426 445 458
Non-renewable wastes 23 65 75 75 83 92 92 88 85
Electricity 9 521 9 764 9 279 9 507 9 589 9 385 9 605 9 754 9 749
Heat 209 383 337 379 423 403 435 472 491
Statistical difference 899 3 939 1 104 3 290 5 533 2 029 1 652 261 2 678
Final non-energy consumption 2 313 2 341 2 298 2 309 2 328 2 382 2 503 2 342 2 494
Final energy consumption 18 273 19 424 18 612 18 709 18 755 18 184 18 280 18 616 18 532
Industry 6 717 6 125 6 112 5 909 5 848 5 762 5 902 5 900 6 042
Transport 4 399 4 890 4 719 4 637 4 809 4 843 4 958 4 993 4 632
Other sectors 7 158 8 409 7 781 8 163 8 098 7 579 7 420 7 723 7 857
Services 2 281 2 797 2 640 2 750 2 795 2 623 2 645 2 864 2 837
Households 3 875 4 429 3 957 4 150 4 100 3 818 3 988 4 041 4 097
Europe 2020-2030 indicators 2005 2010 2011 2012 2013 2014 2015 2016 2017
Gross inland consumption 27 121 33 115 28 567 31 205 33 106 28 854 29 506 27 805 30 186
Primary energy consumption 24 808 30 774 26 269 28 896 30 778 26 472 27 003 25 464 27 692
Final energy consumption 18 589 19 685 18 876 18 910 19 028 18 466 18 648 18 855 18 811
Source: Eurostat (nrg_bal_c)
149
Norwayktoe
Energy balance sheets — 2017 data

Source: Eurostat (nrg_bal_c)
Source: Eurostat (nrg_bal_c)
Note: Please refer to page 23 for related methodological definitions.
Norway
150Energy balance sheets — 2017 data
0
20 000
40 000
60 000
80 000
100 000
120 000
140 000
160 000
1990 1995 2000 2005 2010 2015 2017
Gross electricity production by fuel, GWh
Solid fossil fuels Oil and petroleum products Natural gas
Renewables and biofuels Nuclear heat Other
0
2 000
4 000
6 000
8 000
10 000
12 000
14 000
16 000
1990 1995 2000 2005 2010 2015 2017
Gross available energy by fuel, ktoe
Solid fossil fuels Oil and petroleum products Natural gas
Renewables and biofuels Nuclear heat Non-renewable waste

Source: Eurostat (nrg_bal_c)
Source: Eurostat (nrg_bal_c)
Note: Please refer to page 23 for related methodological definitions.
Norway
151Energy balance sheets — 2017 data
0
5 000
10 000
15 000
20 000
25 000
1990 1995 2000 2005 2010 2015 2017
Final energy consumption by fuel, ktoe
Solid fossil fuels Oil and petroleum products Natural gas
Renewables and biofuels Electricity Heat
Other
0
5 000
10 000
15 000
20 000
25 000
1990 1995 2000 2005 2010 2015 2017
Final consumption by sector, ktoe
Industry Transport Services Households Non-energy use

+ Primary production 630.5 324.4 Z 0.0 0.0 0.0 0.0 306.1 0.0 0.0 Z Z
+ Recovered & recycled products 0.0 0.0 Z 0.0 0.0 0.0 Z 0.0 Z Z Z Z
+ Imports 539.5 1.1 0.0 0.0 0.0 405.0 0.0 1.3 0.0 Z 0.0 132.2
- Exports 121.9 21.3 0.0 0.0 0.0 34.6 0.0 30.1 0.0 Z 0.0 35.8
+ Change in stock -10.3 0.0 0.0 0.0 0.0 -10.4 0.0 0.0 0.0 Z Z Z
= Gross available energy 1 037.8 304.2 0.0 0.0 0.0 360.0 0.0 277.3 0.0 0.0 0.0 96.3
- International maritime bunkers 0.0 0.0 0.0 0.0 0.0 0.0 0.0 0.0 Z Z Z Z
= Gross inland consumption 1 037.8 304.2 0.0 0.0 0.0 360.0 0.0 277.3 0.0 0.0 0.0 96.3
- International aviation 21.0 Z Z Z Z 21.0 Z 0.0 Z Z Z Z
= Total energy supply 1 016.8 304.2 0.0 0.0 0.0 339.0 0.0 277.3 0.0 0.0 0.0 96.3
Transformation input 408.3 294.8 0.0 0.0 0.0 0.0 0.0 113.4 0.0 0.0 0.0 0.0
+ Electricity & heat generation 391.2 294.8 0.0 0.0 0.0 0.0 0.0 96.4 0.0 0.0 0.0 0.0
+ Coke ovens 0.0 0.0 0.0 0.0 0.0 0.0 0.0 0.0 Z Z Z Z
+ Blast furnaces 0.0 0.0 0.0 0.0 0.0 0.0 0.0 0.0 Z Z Z Z
+ Gas works 0.0 0.0 0.0 0.0 0.0 0.0 0.0 0.0 Z Z Z Z
+ Refineries & petrochemical industry 0.0 Z Z Z Z 0.0 Z Z Z Z Z Z
+ Patent fuel plants 0.0 0.0 0.0 0.0 0.0 0.0 Z 0.0 0.0 Z Z Z
+ BKB & PB plants 0.0 0.0 0.0 0.0 0.0 Z Z 0.0 0.0 Z Z Z
+ Coal liquefaction plants 0.0 0.0 0.0 0.0 0.0 Z Z Z Z Z Z Z
+ For blended natural gas 0.0 Z 0.0 Z Z 0.0 Z 0.0 Z Z Z Z
+ Liquid biofuels blended 0.0 Z Z Z Z Z Z 0.0 Z Z Z Z
+ Charcoal production plants 17.1 Z Z Z Z Z Z 17.1 Z Z Z Z
+ Gas-to-liquids plants 0.0 Z Z Z Z Z 0.0 Z Z Z Z Z
+ Not elsewhere specified 0.0 0.0 0.0 0.0 0.0 0.0 0.0 0.0 0.0 Z Z Z
Transformation output 213.5 0.0 0.0 0.0 Z 0.0 0.0 0.0 Z Z 0.0 213.5
+ Electricity & heat generation 213.5 Z Z Z Z Z Z Z Z Z 0.0 213.5
+ Coke ovens 0.0 0.0 0.0 Z Z Z Z Z Z Z Z Z
+ Blast furnaces 0.0 0.0 0.0 Z Z Z Z Z Z Z Z Z
+ Gas works 0.0 0.0 0.0 Z Z Z Z Z Z Z Z Z
+ Refineries & petrochemical industry 0.0 Z Z Z Z 0.0 Z 0.0 Z Z Z Z
+ Patent fuel plants 0.0 0.0 Z Z Z Z Z Z Z Z Z Z
+ BKB & PB plants 0.0 0.0 Z 0.0 Z Z Z Z Z Z Z Z
+ Coal liquefaction plants 0.0 Z Z Z Z 0.0 Z Z Z Z Z Z
+ Blended in natural gas 0.0 Z Z Z Z Z 0.0 Z Z Z Z Z
+ Liquid biofuels blended 0.0 Z Z Z Z Z Z 0.0 Z Z Z Z
+ Charcoal production plants 0.0 Z Z Z Z Z Z 0.0 Z Z Z Z
+ Gas-to-liquids plants 0.0 Z Z Z Z 0.0 Z Z Z Z Z Z
+ Not elsewhere specified 0.0 0.0 0.0 0.0 Z 0.0 Z Z Z Z Z Z
Energy sector 10.2 0.0 0.0 0.0 0.0 0.0 0.0 0.0 0.0 Z 0.0 10.2
+ Own use in electricity & heat generation 10.2 0.0 0.0 0.0 0.0 0.0 0.0 0.0 0.0 Z 0.0 10.2
+ Coal mines 0.0 0.0 0.0 0.0 0.0 0.0 0.0 0.0 0.0 Z 0.0 0.0
+ Oil & natural gas extraction plants 0.0 Z Z Z Z 0.0 0.0 0.0 Z Z 0.0 0.0
+ Patent fuel plants 0.0 0.0 0.0 0.0 0.0 Z Z 0.0 0.0 Z 0.0 0.0
+ Coke ovens 0.0 0.0 0.0 0.0 0.0 0.0 0.0 0.0 0.0 Z 0.0 0.0
+ BKB & PB plants 0.0 0.0 0.0 0.0 0.0 Z Z 0.0 0.0 Z 0.0 0.0
+ Gas works 0.0 0.0 0.0 0.0 0.0 0.0 0.0 0.0 0.0 Z 0.0 0.0
+ Blast furnaces 0.0 0.0 0.0 0.0 0.0 0.0 0.0 0.0 0.0 Z 0.0 0.0
+ Petroleum refineries (oil refineries) 0.0 0.0 0.0 0.0 0.0 0.0 0.0 0.0 0.0 Z 0.0 0.0
+ Nuclear industry 0.0 Z Z Z Z Z Z Z Z Z 0.0 0.0
+ Coal liquefaction plants 0.0 0.0 0.0 0.0 0.0 Z Z Z Z Z 0.0 0.0
+ Liquefaction & regasification plants (LNG) 0.0 Z Z Z Z Z 0.0 Z Z Z 0.0 0.0
+ Gasification plants for biogas 0.0 Z Z Z Z Z Z 0.0 0.0 Z 0.0 0.0
+ Gas-to-liquids (GTL) plants 0.0 Z Z Z Z Z 0.0 Z Z Z 0.0 0.0
+ Charcoal production plants 0.0 Z Z Z Z Z Z 0.0 0.0 Z 0.0 0.0
+ Not elsewhere specified (energy) 0.0 0.0 0.0 0.0 0.0 0.0 0.0 0.0 0.0 Z 0.0 0.0
Distribution losses 44.0 0.0 0.0 0.0 0.0 0.0 0.0 0.0 0.0 Z 0.0 44.0
Available for final consumption 767.7 9.3 0.0 0.0 0.0 339.0 0.0 163.9 0.0 0.0 0.0 255.5
Final non-energy consumption 35.6 0.0 0.0 0.0 0.0 35.6 0.0 0.0 Z Z Z Z
Final energy consumption 722.1 9.3 0.0 0.0 0.0 303.4 0.0 163.9 0.0 Z 0.0 245.5
+ Industry 132.3 5.5 0.0 0.0 0.0 55.6 0.0 8.3 0.0 Z 0.0 62.9
+ Iron & steel 7.9 4.1 0.0 0.0 0.0 0.3 0.0 0.0 0.0 Z 0.0 3.5
+ Chemical & petrochemical 3.0 0.0 0.0 0.0 0.0 1.0 0.0 1.6 0.0 Z 0.0 0.4
+ Non-ferrous metals 50.7 0.0 0.0 0.0 0.0 0.0 0.0 0.0 0.0 Z 0.0 50.7
+ Non-metallic minerals 2.8 0.0 0.0 0.0 0.0 2.2 0.0 0.0 0.0 Z 0.0 0.6
+ Transport equipment 0.0 0.0 0.0 0.0 0.0 0.0 0.0 0.0 0.0 Z 0.0 0.0
+ Machinery 3.6 0.2 0.0 0.0 0.0 2.4 0.0 0.5 0.0 Z 0.0 0.5
+ Mining & quarrying 13.4 0.0 0.0 0.0 0.0 12.6 0.0 0.0 0.0 Z 0.0 0.7
+ Food, beverages & tobacco 18.6 0.7 0.0 0.0 0.0 9.5 0.0 5.7 0.0 Z 0.0 2.6
+ Paper, pulp & printing 1.0 0.0 0.0 0.0 0.0 0.5 0.0 0.0 0.0 Z 0.0 0.5
+ Wood & wood products 12.5 0.2 0.0 0.0 0.0 11.0 0.0 0.2 0.0 Z 0.0 1.1
+ Construction 0.0 0.0 0.0 0.0 0.0 0.0 0.0 0.0 0.0 Z 0.0 0.0
+ Textile & leather 0.5 0.0 0.0 0.0 0.0 0.3 0.0 0.1 0.0 Z 0.0 0.1
+ Not elsewhere specified (industry) 18.3 0.2 0.0 0.0 0.0 15.6 0.0 0.2 0.0 Z 0.0 2.2
+ Transport 235.5 0.0 0.0 0.0 0.0 233.8 0.0 0.0 0.0 Z Z 1.7
+ Rail 1.7 0.0 0.0 0.0 0.0 0.0 Z 0.0 0.0 Z Z 1.7
+ Road 233.8 Z Z Z Z 233.8 0.0 0.0 0.0 Z Z 0.0
+ Domestic aviation 0.0 Z Z Z Z 0.0 Z 0.0 Z Z Z Z
+ Domestic navigation 0.0 0.0 0.0 0.0 0.0 0.0 Z 0.0 0.0 Z Z Z
+ Pipeline transport 0.0 Z Z Z Z 0.0 0.0 0.0 Z Z Z 0.0
+ Not elsewhere specified (transport) 0.0 0.0 0.0 0.0 0.0 0.0 0.0 0.0 0.0 Z Z 0.0
+ Other 354.2 3.9 0.0 0.0 0.0 14.0 0.0 155.6 0.0 Z 0.0 180.8
+ Commercial & public services 86.4 1.6 0.0 0.0 0.0 9.5 0.0 6.5 0.0 Z 0.0 68.7
+ Households 263.1 2.2 0.0 0.0 0.0 1.2 0.0 149.0 0.0 Z 0.0 110.6
+ Agriculture & forestry 4.7 0.0 0.0 0.0 0.0 3.2 0.0 0.0 0.0 Z 0.0 1.6
+ Fishing 0.0 0.0 0.0 0.0 0.0 0.0 0.0 0.0 0.0 Z 0.0 0.0
+ Not elsewhere specified (other) 0.0 0.0 0.0 0.0 0.0 0.0 0.0 0.0 0.0 Z 0.0 0.0
Statistical differences 10.0 0.0 0.0 0.0 0.0 0.0 0.0 0.0 0.0 0.0 0.0 10.0
Gross electricity production 213.5 117.1 0.0 0.0 0.0 0.0 0.0 96.4 0.0 0.0 Z Z
Gross heat production 0.0 0.0 0.0 0.0 0.0 0.0 0.0 0.0 0.0 0.0 Z 0.0
Source: Eurostat (nrg_bal_c)
152Energy balance sheets — 2017 data
Electricity
ktoe 2017
Oil and
petroleum
products
Natural
gas
Renewables
and
biofuels
Non-
renewable
waste
Nuclear
heatHeat
MontenegroTotal
Solid
fossil
fuels
Manufac-
tured
gases
Peat and
peat
products
Oil shale
and oil
sands

2005 2010 2011 2012 2013 2014 2015 2016 2017
Gross available energy 1 041 1 129 1 134 1 071 996 975 1 030 988 1 038
Solid fossil fuels 287 420 424 381 368 359 378 299 304
Peat & peat products 0 0 0 0 0 0 0 0 0
Oil shale & oil sands 0 0 0 0 0 0 0 0 0
Crude oil & other hydrocarbons 0 0 0 0 0 0 0 0 0
Petroleum products 297 312 298 282 274 278 298 330 360
Natural gas 0 0 0 0 0 0 0 0 0
Nuclear heat 0 0 0 0 0 0 0 0 0
Renewable energies 304 397 278 304 384 316 309 333 277
Non-renewable wastes 0 0 0 0 0 0 0 0 0
Primary production 593 826 722 704 762 692 716 660 631
Solid fossil fuels 287 426 434 393 372 364 390 308 324
Peat 0 0 0 0 0 0 0 0 0
Oil shale and oil sands 0 0 0 0 0 0 0 0 0
Crude oil & other hydrocarbons 0 0 0 0 0 0 0 0 0
Natural gas 0 0 0 0 0 0 0 0 0
Nuclear heat 0 0 0 0 0 0 0 0 0
Renewable energies 306 399 288 311 390 328 326 353 306
Non-renewable wastes 0 0 0 0 0 0 0 0 0
Net imports 442 298 411 367 234 291 306 343 418
Solid fossil fuels -6 -12 -12 -12 -4 -5 -12 -8 -20
Crude oil 0 0 0 0 0 0 0 0 0
Gas/Diesel Oil (w/o bio) 104 177 170 173 173 181 190 227 257
Motor Gasoline (w/o bio) 55 61 46 39 34 34 33 37 36
Naphtha 0 0 0 0 0 0 0 0 0
LPG 11 20 21 19 16 20 22 21 21
All other oil & petroleum products 126 53 60 50 51 51 46 59 56
Natural gas 0 0 0 0 0 0 0 0 0
Transformation input 425 645 522 501 578 503 506 453 408
Electricity & heat generation 425 645 521 500 578 502 495 446 391
Refinery intake 0 0 0 0 0 0 0 0 0
Coke ovens 0 0 0 0 0 0 0 0 0
Blast furnaces 0 0 0 0 0 0 0 0 0
Transformation output 246 346 228 245 339 273 258 270 213
Electricity & heat generation 246 346 228 245 339 273 258 270 213
Refinery output 0 0 0 0 0 0 0 0 0
Coke ovens 0 0 0 0 0 0 0 0 0
Blast furnaces 0 0 0 0 0 0 0 0 0
Energy sector 12 16 14 13 12 12 11 10 10
Distribution losses 67 57 56 60 65 59 50 47 44
Available for final consumption 769 755 760 729 666 656 701 728 768
Solid fossil fuels 22 11 6 8 5 7 11 12 9
Manufactured gases 0 0 0 0 0 0 0 0 0
Peat & peat products 0 0 0 0 0 0 0 0 0
Oil shale & oil sands 0 0 0 0 0 0 0 0 0
Gas/Diesel Oil (w/o bio) 104 177 170 173 173 173 188 218 243
Motor Gasoline (w/o bio) 55 61 46 39 34 37 38 39 39
Naphtha 0 0 0 0 0 0 0 0 0
LPG 11 20 21 19 16 18 20 19 19
All other oil & petroleum products 110 48 49 36 37 32 33 33 38
Natural gas 0 0 0 0 0 0 0 0 0
Primary solid biofuels & charcoal 143 161 173 175 167 163 169 166 163
Liquid biofuels 0 0 0 0 0 0 0 0 0
All other renewable energies 0 0 1 1 1 1 1 1 1
Non-renewable wastes 0 0 0 0 0 0 0 0 0
Electricity 324 276 294 277 233 224 242 240 256
Heat 0 0 0 0 0 0 0 0 0
Statistical difference 0 0 0 0 0 0 11 10 10
Final non-energy consumption 18 40 41 30 25 28 28 30 36
Final energy consumption 751 715 719 699 641 629 663 688 722
Industry 341 199 227 203 183 133 132 120 132
Transport 158 230 213 203 165 163 187 219 236
Other sectors 251 285 279 293 292 333 344 349 354
Services 3 5 8 9 14 69 70 79 86
Households 244 275 269 281 269 256 265 264 263
Europe 2020-2030 indicators 2005 2010 2011 2012 2013 2014 2015 2016 2017
Gross inland consumption 1 041 1 129 1 134 1 071 996 975 1 030 988 1 038
Primary energy consumption 1 022 1 089 1 094 1 040 971 947 1 002 958 1 002
Final energy consumption 764 717 730 712 655 646 682 708 743
Source: Eurostat (nrg_bal_c)
153
Montenegroktoe
Energy balance sheets — 2017 data

Source: Eurostat (nrg_bal_c)
Source: Eurostat (nrg_bal_c)
Note: Please refer to page 23 for related methodological definitions.
Montenegro
154Energy balance sheets — 2017 data
0
500
1 000
1 500
2 000
2 500
3 000
3 500
4 000
4 500
1990 1995 2000 2005 2010 2015 2017
Gross electricity production by fuel, GWh
Solid fossil fuels Oil and petroleum products Natural gas
Renewables and biofuels Nuclear heat Other
0
50
100
150
200
250
300
350
400
450
1990 1995 2000 2005 2010 2015 2017
Gross available energy by fuel, ktoe
Solid fossil fuels Oil and petroleum products Natural gas
Renewables and biofuels Nuclear heat Non-renewable waste
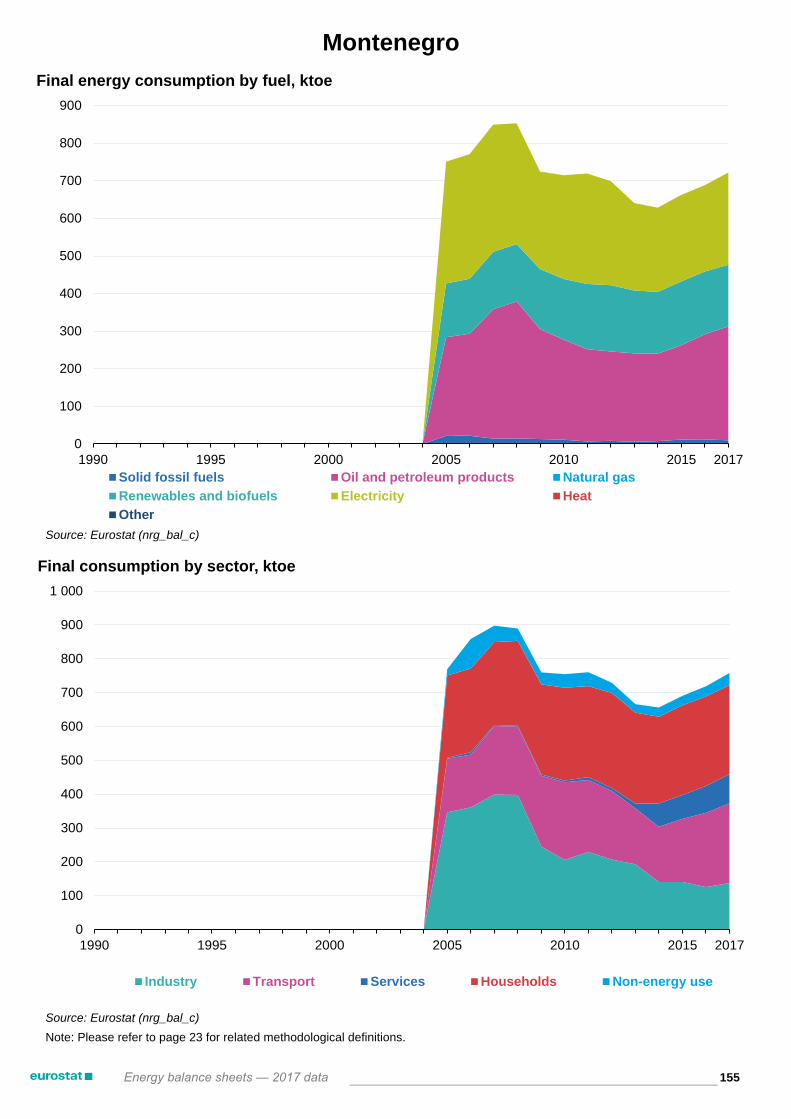
Source: Eurostat (nrg_bal_c)
Source: Eurostat (nrg_bal_c)
Note: Please refer to page 23 for related methodological definitions.
Montenegro
155Energy balance sheets — 2017 data
0
100
200
300
400
500
600
700
800
900
1990 1995 2000 2005 2010 2015 2017
Final energy consumption by fuel, ktoe
Solid fossil fuels Oil and petroleum products Natural gas
Renewables and biofuels Electricity Heat
Other
0
100
200
300
400
500
600
700
800
900
1 000
1990 1995 2000 2005 2010 2015 2017
Final consumption by sector, ktoe
Industry Transport Services Households Non-energy use

+ Primary production 1 161.4 852.5 Z 0.0 0.0 0.0 0.0 308.8 0.0 0.0 Z Z
+ Recovered & recycled products 0.0 0.0 Z 0.0 0.0 0.0 Z 0.0 Z Z Z Z
+ Imports 1 669.6 90.8 0.0 0.0 0.0 1 123.9 226.6 31.1 0.0 Z 0.0 197.2
- Exports 118.8 0.9 0.0 0.0 0.0 90.6 0.0 0.6 0.0 Z 0.0 26.7
+ Change in stock 50.2 37.6 0.0 0.0 0.0 6.2 -0.2 6.5 0.0 Z Z Z
= Gross available energy 2 762.3 980.0 0.0 0.0 0.0 1 039.6 226.4 345.8 0.0 0.0 0.0 170.5
- International maritime bunkers 0.0 0.0 0.0 0.0 0.0 0.0 0.0 0.0 Z Z Z Z
= Gross inland consumption 2 762.3 980.0 0.0 0.0 0.0 1 039.6 226.4 345.8 0.0 0.0 0.0 170.5
- International aviation 20.9 Z Z Z Z 20.9 Z 0.0 Z Z Z Z
= Total energy supply 2 741.4 980.0 0.0 0.0 0.0 1 018.7 226.4 345.8 0.0 0.0 0.0 170.5
Transformation input 1 176.8 859.7 0.0 0.0 0.0 23.4 182.0 111.7 0.0 0.0 0.0 0.0
+ Electricity & heat generation 1 176.6 859.7 0.0 0.0 0.0 23.4 182.0 111.6 0.0 0.0 0.0 0.0
+ Coke ovens 0.0 0.0 0.0 0.0 0.0 0.0 0.0 0.0 Z Z Z Z
+ Blast furnaces 0.0 0.0 0.0 0.0 0.0 0.0 0.0 0.0 Z Z Z Z
+ Gas works 0.0 0.0 0.0 0.0 0.0 0.0 0.0 0.0 Z Z Z Z
+ Refineries & petrochemical industry 0.0 Z Z Z Z 0.0 Z Z Z Z Z Z
+ Patent fuel plants 0.0 0.0 0.0 0.0 0.0 0.0 Z 0.0 0.0 Z Z Z
+ BKB & PB plants 0.0 0.0 0.0 0.0 0.0 Z Z 0.0 0.0 Z Z Z
+ Coal liquefaction plants 0.0 0.0 0.0 0.0 0.0 Z Z Z Z Z Z Z
+ For blended natural gas 0.0 Z 0.0 Z Z 0.0 Z 0.0 Z Z Z Z
+ Liquid biofuels blended 0.1 Z Z Z Z Z Z 0.1 Z Z Z Z
+ Charcoal production plants 0.0 Z Z Z Z Z Z 0.0 Z Z Z Z
+ Gas-to-liquids plants 0.0 Z Z Z Z Z 0.0 Z Z Z Z Z
+ Not elsewhere specified 0.0 0.0 0.0 0.0 0.0 0.0 0.0 0.0 0.0 Z Z Z
Transformation output 539.4 0.0 0.0 0.0 Z 0.0 0.0 0.1 Z Z 57.8 481.5
+ Electricity & heat generation 539.3 Z Z Z Z Z Z Z Z Z 57.8 481.5
+ Coke ovens 0.0 0.0 0.0 Z Z Z Z Z Z Z Z Z
+ Blast furnaces 0.0 0.0 0.0 Z Z Z Z Z Z Z Z Z
+ Gas works 0.0 0.0 0.0 Z Z Z Z Z Z Z Z Z
+ Refineries & petrochemical industry 0.0 Z Z Z Z 0.0 Z 0.0 Z Z Z Z
+ Patent fuel plants 0.0 0.0 Z Z Z Z Z Z Z Z Z Z
+ BKB & PB plants 0.0 0.0 Z 0.0 Z Z Z Z Z Z Z Z
+ Coal liquefaction plants 0.0 Z Z Z Z 0.0 Z Z Z Z Z Z
+ Blended in natural gas 0.0 Z Z Z Z Z 0.0 Z Z Z Z Z
+ Liquid biofuels blended 0.1 Z Z Z Z Z Z 0.1 Z Z Z Z
+ Charcoal production plants 0.0 Z Z Z Z Z Z 0.0 Z Z Z Z
+ Gas-to-liquids plants 0.0 Z Z Z Z 0.0 Z Z Z Z Z Z
+ Not elsewhere specified 0.0 0.0 0.0 0.0 Z 0.0 Z Z Z Z Z Z
Energy sector 42.8 0.0 0.0 0.0 0.0 1.5 0.0 0.0 0.0 Z 0.4 41.0
+ Own use in electricity & heat generation 32.9 0.0 0.0 0.0 0.0 0.4 0.0 0.0 0.0 Z 0.4 32.1
+ Coal mines 8.1 0.0 0.0 0.0 0.0 1.0 0.0 0.0 0.0 Z 0.0 7.1
+ Oil & natural gas extraction plants 0.0 Z Z Z Z 0.0 0.0 0.0 Z Z 0.0 0.0
+ Patent fuel plants 0.0 0.0 0.0 0.0 0.0 Z Z 0.0 0.0 Z 0.0 0.0
+ Coke ovens 0.0 0.0 0.0 0.0 0.0 0.0 0.0 0.0 0.0 Z 0.0 0.0
+ BKB & PB plants 0.0 0.0 0.0 0.0 0.0 Z Z 0.0 0.0 Z 0.0 0.0
+ Gas works 0.0 0.0 0.0 0.0 0.0 0.0 0.0 0.0 0.0 Z 0.0 0.0
+ Blast furnaces 0.0 0.0 0.0 0.0 0.0 0.0 0.0 0.0 0.0 Z 0.0 0.0
+ Petroleum refineries (oil refineries) 0.0 0.0 0.0 0.0 0.0 0.0 0.0 0.0 0.0 Z 0.0 0.0
+ Nuclear industry 0.0 Z Z Z Z Z Z Z Z Z 0.0 0.0
+ Coal liquefaction plants 0.0 0.0 0.0 0.0 0.0 Z Z Z Z Z 0.0 0.0
+ Liquefaction & regasification plants (LNG) 0.0 Z Z Z Z Z 0.0 Z Z Z 0.0 0.0
+ Gasification plants for biogas 0.0 Z Z Z Z Z Z 0.0 0.0 Z 0.0 0.0
+ Gas-to-liquids (GTL) plants 0.0 Z Z Z Z Z 0.0 Z Z Z 0.0 0.0
+ Charcoal production plants 0.0 Z Z Z Z Z Z 0.0 0.0 Z 0.0 0.0
+ Not elsewhere specified (energy) 1.9 0.0 0.0 0.0 0.0 0.1 0.0 0.0 0.0 Z 0.0 1.8
Distribution losses 95.0 0.0 0.0 0.0 0.0 0.0 0.3 0.8 0.0 Z 7.5 86.3
Available for final consumption 1 966.2 120.3 0.0 0.0 0.0 993.9 44.1 233.4 0.0 0.0 49.9 524.7
Final non-energy consumption 80.3 0.0 0.0 0.0 0.0 80.3 0.0 0.0 Z Z Z Z
Final energy consumption 1 866.7 101.1 0.0 0.0 0.0 913.5 44.1 233.4 0.0 Z 49.9 524.7
+ Industry 383.4 97.4 0.0 0.0 0.0 116.0 37.4 8.3 0.0 Z 2.2 122.2
+ Iron & steel 155.9 35.1 0.0 0.0 0.0 40.6 25.1 0.0 0.0 Z 2.2 53.0
+ Chemical & petrochemical 9.8 0.0 0.0 0.0 0.0 1.9 1.5 0.0 0.0 Z 0.0 6.4
+ Non-ferrous metals 2.5 0.0 0.0 0.0 0.0 1.3 0.0 0.0 0.0 Z 0.0 1.2
+ Non-metallic minerals 94.7 61.1 0.0 0.0 0.0 21.0 1.0 0.0 0.0 Z 0.0 11.6
+ Transport equipment 12.0 0.0 0.0 0.0 0.0 1.4 3.2 0.1 0.0 Z 0.0 7.4
+ Machinery 7.3 0.0 0.0 0.0 0.0 2.5 0.2 0.2 0.0 Z 0.0 4.5
+ Mining & quarrying 26.3 0.0 0.0 0.0 0.0 13.0 0.0 0.0 0.0 Z 0.0 13.3
+ Food, beverages & tobacco 39.4 0.0 0.0 0.0 0.0 14.9 5.8 6.4 0.0 Z 0.0 12.3
+ Paper, pulp & printing 1.9 0.0 0.0 0.0 0.0 0.6 0.4 0.0 0.0 Z 0.0 0.9
+ Wood & wood products 0.9 0.0 0.0 0.0 0.0 0.1 0.0 0.4 0.0 Z 0.0 0.4
+ Construction 15.0 0.0 0.0 0.0 0.0 13.3 0.0 0.1 0.0 Z 0.0 1.6
+ Textile & leather 12.2 1.2 0.0 0.0 0.0 5.1 0.1 0.5 0.0 Z 0.0 5.4
+ Not elsewhere specified (industry) 5.4 0.0 0.0 0.0 0.0 0.4 0.3 0.5 0.0 Z 0.0 4.3
+ Transport 709.4 0.0 0.0 0.0 0.0 707.9 0.2 0.1 0.0 Z Z 1.2
+ Rail 2.4 0.0 0.0 0.0 0.0 1.2 Z 0.0 0.0 Z Z 1.2
+ Road 707.0 Z Z Z Z 706.7 0.2 0.1 0.0 Z Z 0.0
+ Domestic aviation 0.0 Z Z Z Z 0.0 Z 0.0 Z Z Z Z
+ Domestic navigation 0.0 0.0 0.0 0.0 0.0 0.0 Z 0.0 0.0 Z Z Z
+ Pipeline transport 0.0 Z Z Z Z 0.0 0.0 0.0 Z Z Z 0.0
+ Not elsewhere specified (transport) 0.0 0.0 0.0 0.0 0.0 0.0 0.0 0.0 0.0 Z Z 0.0
+ Other 773.9 3.7 0.0 0.0 0.0 89.6 6.5 224.9 0.0 Z 47.8 401.3
+ Commercial & public services 220.9 1.2 0.0 0.0 0.0 63.4 6.4 5.6 0.0 Z 12.7 131.7
+ Households 529.3 1.5 0.0 0.0 0.0 12.0 0.2 214.3 0.0 Z 35.1 266.3
+ Agriculture & forestry 23.6 1.0 0.0 0.0 0.0 14.2 0.0 5.1 0.0 Z 0.0 3.4
+ Fishing 0.0 0.0 0.0 0.0 0.0 0.0 0.0 0.0 0.0 Z 0.0 0.0
+ Not elsewhere specified (other) 0.0 0.0 0.0 0.0 0.0 0.0 0.0 0.0 0.0 Z 0.0 0.0
Statistical differences 19.2 19.2 0.0 0.0 0.0 0.0 0.0 0.0 0.0 0.0 0.0 0.0
Gross electricity production 481.5 291.2 0.0 0.0 0.0 7.6 71.3 111.4 0.0 0.0 Z Z
Gross heat production 57.8 0.0 0.0 0.0 0.0 0.0 57.8 0.0 0.0 0.0 Z 0.0
Source: Eurostat (nrg_bal_c)
156Energy balance sheets — 2017 data
Electricity
ktoe 2017
Oil and
petroleum
products
Natural
gas
Renewables
and
biofuels
Non-
renewable
waste
Nuclear
heatHeat
North MacedoniaTotal
Solid
fossil
fuels
Manufac-
tured
gases
Peat and
peat
products
Oil shale
and oil
sands

2005 2010 2011 2012 2013 2014 2015 2016 2017
Gross available energy 2 923 2 881 3 122 3 004 2 783 2 707 2 656 2 696 2 762
Solid fossil fuels 1 465 1 305 1 460 1 398 1 163 1 084 948 880 980
Peat & peat products 0 0 0 0 0 0 0 0 0
Oil shale & oil sands 0 0 0 0 0 0 0 0 0
Crude oil & other hydrocarbons 968 875 722 266 63 0 0 0 0
Petroleum products -55 70 256 669 849 905 970 1 088 1 040
Natural gas 63 96 110 114 130 111 112 176 226
Nuclear heat 0 0 0 0 0 0 0 0 0
Renewable energies 345 414 344 327 369 353 409 378 346
Non-renewable wastes 0 0 0 0 0 0 0 0 0
Primary production 1 632 1 607 1 756 1 561 1 425 1 331 1 266 1 111 1 161
Solid fossil fuels 1 289 1 194 1 410 1 246 1 053 986 876 745 853
Peat 0 0 0 0 0 0 0 0 0
Oil shale and oil sands 0 0 0 0 0 0 0 0 0
Crude oil & other hydrocarbons 0 0 0 0 0 0 0 0 0
Natural gas 0 0 0 0 0 0 0 0 0
Nuclear heat 0 0 0 0 0 0 0 0 0
Renewable energies 343 413 345 315 372 345 389 366 309
Non-renewable wastes 0 0 0 0 0 0 0 0 0
Net imports 1 250 1 268 1 424 1 448 1 300 1 396 1 395 1 590 1 551
Solid fossil fuels 116 121 132 133 100 120 84 112 90
Crude oil 982 864 706 265 53 -7 0 0 0
Gas/Diesel Oil (w/o bio) -51 33 154 357 427 487 545 631 638
Motor Gasoline (w/o bio) -68 -29 8 72 89 106 109 110 110
Naphtha 0 0 0 0 0 0 0 0 0
LPG 25 42 40 54 60 68 78 86 86
All other oil & petroleum products 47 15 43 223 227 250 237 282 199
Natural gas 62 96 110 114 130 111 112 176 227
Transformation input 3 015 2 396 2 311 1 733 1 410 1 206 1 163 1 090 1 177
Electricity & heat generation 1 540 1 478 1 549 1 466 1 311 1 204 1 162 1 090 1 177
Refinery intake 1 221 896 742 266 80 1 0 0 0
Coke ovens 0 0 0 0 0 0 0 0 0
Blast furnaces 0 0 0 0 0 0 0 0 0
Transformation output 2 108 1 555 1 355 844 672 511 538 538 539
Electricity & heat generation 679 690 645 597 575 509 538 538 539
Refinery output 1 176 844 690 246 80 1 0 0 0
Coke ovens 0 0 0 0 0 0 0 0 0
Blast furnaces 0 0 0 0 0 0 0 0 0
Energy sector 78 78 83 80 60 48 44 42 43
Distribution losses 146 121 128 119 107 99 96 95 95
Available for final consumption 1 786 1 833 1 951 1 908 1 867 1 853 1 876 1 992 1 966
Solid fossil fuels 143 121 134 151 122 107 78 132 120
Manufactured gases 0 0 0 0 0 0 0 0 0
Peat & peat products 0 0 0 0 0 0 0 0 0
Oil shale & oil sands 0 0 0 0 0 0 0 0 0
Gas/Diesel Oil (w/o bio) 348 406 426 427 456 479 536 617 643
Motor Gasoline (w/o bio) 123 130 138 112 117 107 109 110 109
Naphtha 0 0 0 0 0 0 0 0 0
LPG 51 70 64 61 65 69 78 86 86
All other oil & petroleum products 249 223 234 244 220 196 193 231 156
Natural gas 50 42 44 23 27 34 31 38 44
Primary solid biofuels & charcoal 206 193 208 227 223 235 228 194 228
Liquid biofuels 0 0 0 0 1 0 0 0 0
All other renewable energies 9 10 11 9 7 6 5 5 5
Non-renewable wastes 0 0 0 0 0 0 0 0 0
Electricity 535 583 634 602 585 579 570 533 525
Heat 72 54 57 52 44 40 46 46 50
Statistical difference 11 9 -20 5 -1 5 -23 4 19
Final non-energy consumption 36 35 68 57 54 50 62 140 80
Final energy consumption 1 740 1 790 1 903 1 846 1 815 1 797 1 838 1 848 1 867
Industry 581 542 634 579 555 518 475 441 383
Transport 344 454 475 453 515 537 596 680 709
Other sectors 815 793 794 813 745 742 766 727 774
Services 239 234 206 229 202 196 212 213 221
Households 540 538 567 559 519 524 531 492 529
Europe 2020-2030 indicators 2005 2010 2011 2012 2013 2014 2015 2016 2017
Gross inland consumption 2 923 2 881 3 122 3 004 2 783 2 707 2 656 2 696 2 762
Primary energy consumption 2 887 2 847 3 054 2 947 2 729 2 657 2 594 2 557 2 682
Final energy consumption 1 746 1 797 1 907 1 854 1 825 1 810 1 852 1 864 1 888
Source: Eurostat (nrg_bal_c)
157
North Macedoniaktoe
Energy balance sheets — 2017 data

Source: Eurostat (nrg_bal_c)
Source: Eurostat (nrg_bal_c)
Note: Please refer to page 23 for related methodological definitions.
North Macedonia
158Energy balance sheets — 2017 data
0
1 000
2 000
3 000
4 000
5 000
6 000
7 000
8 000
1990 1995 2000 2005 2010 2015 2017
Gross electricity production by fuel, GWh
Solid fossil fuels Oil and petroleum products Natural gas
Renewables and biofuels Nuclear heat Other
0
200
400
600
800
1 000
1 200
1 400
1 600
1 800
1990 1995 2000 2005 2010 2015 2017
Gross available energy by fuel, ktoe
Solid fossil fuels Oil and petroleum products Natural gas
Renewables and biofuels Nuclear heat Non-renewable waste

Source: Eurostat (nrg_bal_c)
Source: Eurostat (nrg_bal_c)
Note: Please refer to page 23 for related methodological definitions.
North Macedonia
159Energy balance sheets — 2017 data
0
200
400
600
800
1 000
1 200
1 400
1 600
1 800
2 000
1990 1995 2000 2005 2010 2015 2017
Final energy consumption by fuel, ktoe
Solid fossil fuels Oil and petroleum products Natural gas
Renewables and biofuels Electricity Heat
Other
0
500
1 000
1 500
2 000
2 500
1990 1995 2000 2005 2010 2015 2017
Final consumption by sector, ktoe
Industry Transport Services Households Non-energy use

+ Primary production 1 634.4 67.6 Z 0.0 0.0 958.9 37.4 570.4 0.0 0.0 Z Z
+ Recovered & recycled products 0.0 0.0 Z 0.0 0.0 0.0 Z 0.0 Z Z Z Z
+ Imports 1 573.6 48.4 0.0 0.0 0.0 1 181.1 0.0 93.6 0.0 Z 0.0 250.6
- Exports 653.1 0.0 0.0 0.0 0.0 635.9 0.0 17.2 0.0 Z 0.0 0.0
+ Change in stock -149.8 0.0 0.0 0.0 0.0 -149.8 0.0 0.0 0.0 Z Z Z
= Gross available energy 2 405.1 116.0 0.0 0.0 0.0 1 354.3 37.4 646.7 0.0 0.0 0.0 250.6
- International maritime bunkers 36.8 0.0 0.0 0.0 0.0 36.8 0.0 0.0 Z Z Z Z
= Gross inland consumption 2 368.3 116.0 0.0 0.0 0.0 1 317.5 37.4 646.7 0.0 0.0 0.0 250.6
- International aviation 7.5 Z Z Z Z 7.5 Z 0.0 Z Z Z Z
= Total energy supply 2 360.8 116.0 0.0 0.0 0.0 1 310.1 37.4 646.7 0.0 0.0 0.0 250.6
Transformation input 986.3 0.0 0.0 0.0 0.0 513.6 0.0 472.7 0.0 0.0 0.0 0.0
+ Electricity & heat generation 389.2 0.0 0.0 0.0 0.0 0.0 0.0 389.2 0.0 0.0 0.0 0.0
+ Coke ovens 0.0 0.0 0.0 0.0 0.0 0.0 0.0 0.0 Z Z Z Z
+ Blast furnaces 0.0 0.0 0.0 0.0 0.0 0.0 0.0 0.0 Z Z Z Z
+ Gas works 0.0 0.0 0.0 0.0 0.0 0.0 0.0 0.0 Z Z Z Z
+ Refineries & petrochemical industry 513.2 Z Z Z Z 513.2 Z Z Z Z Z Z
+ Patent fuel plants 0.0 0.0 0.0 0.0 0.0 0.0 Z 0.0 0.0 Z Z Z
+ BKB & PB plants 0.0 0.0 0.0 0.0 0.0 Z Z 0.0 0.0 Z Z Z
+ Coal liquefaction plants 0.0 0.0 0.0 0.0 0.0 Z Z Z Z Z Z Z
+ For blended natural gas 0.0 Z 0.0 Z Z 0.0 Z 0.0 Z Z Z Z
+ Liquid biofuels blended 78.2 Z Z Z Z Z Z 78.2 Z Z Z Z
+ Charcoal production plants 5.3 Z Z Z Z Z Z 5.3 Z Z Z Z
+ Gas-to-liquids plants 0.0 Z Z Z Z Z 0.0 Z Z Z Z Z
+ Not elsewhere specified 0.4 0.0 0.0 0.0 0.0 0.4 0.0 0.0 0.0 Z Z Z
Transformation output 958.9 0.0 0.0 0.0 Z 489.4 0.0 80.3 Z Z 0.0 389.2
+ Electricity & heat generation 389.2 Z Z Z Z Z Z Z Z Z 0.0 389.2
+ Coke ovens 0.0 0.0 0.0 Z Z Z Z Z Z Z Z Z
+ Blast furnaces 0.0 0.0 0.0 Z Z Z Z Z Z Z Z Z
+ Gas works 0.0 0.0 0.0 Z Z Z Z Z Z Z Z Z
+ Refineries & petrochemical industry 489.4 Z Z Z Z 489.4 Z 0.0 Z Z Z Z
+ Patent fuel plants 0.0 0.0 Z Z Z Z Z Z Z Z Z Z
+ BKB & PB plants 0.0 0.0 Z 0.0 Z Z Z Z Z Z Z Z
+ Coal liquefaction plants 0.0 Z Z Z Z 0.0 Z Z Z Z Z Z
+ Blended in natural gas 0.0 Z Z Z Z Z 0.0 Z Z Z Z Z
+ Liquid biofuels blended 78.2 Z Z Z Z Z Z 78.2 Z Z Z Z
+ Charcoal production plants 2.1 Z Z Z Z Z Z 2.1 Z Z Z Z
+ Gas-to-liquids plants 0.0 Z Z Z Z 0.0 Z Z Z Z Z Z
+ Not elsewhere specified 0.0 0.0 0.0 0.0 Z 0.0 Z Z Z Z Z Z
Energy sector 107.1 0.0 0.0 0.0 0.0 64.4 24.9 0.0 0.0 Z 0.0 17.8
+ Own use in electricity & heat generation 2.4 0.0 0.0 0.0 0.0 0.0 0.0 0.0 0.0 Z 0.0 2.4
+ Coal mines 0.0 0.0 0.0 0.0 0.0 0.0 0.0 0.0 0.0 Z 0.0 0.0
+ Oil & natural gas extraction plants 31.9 Z Z Z Z 2.5 24.9 0.0 Z Z 0.0 4.5
+ Patent fuel plants 0.0 0.0 0.0 0.0 0.0 Z Z 0.0 0.0 Z 0.0 0.0
+ Coke ovens 0.0 0.0 0.0 0.0 0.0 0.0 0.0 0.0 0.0 Z 0.0 0.0
+ BKB & PB plants 0.0 0.0 0.0 0.0 0.0 Z Z 0.0 0.0 Z 0.0 0.0
+ Gas works 0.0 0.0 0.0 0.0 0.0 0.0 0.0 0.0 0.0 Z 0.0 0.0
+ Blast furnaces 0.0 0.0 0.0 0.0 0.0 0.0 0.0 0.0 0.0 Z 0.0 0.0
+ Petroleum refineries (oil refineries) 4.4 0.0 0.0 0.0 0.0 0.0 0.0 0.0 0.0 Z 0.0 4.4
+ Nuclear industry 0.0 Z Z Z Z Z Z Z Z Z 0.0 0.0
+ Coal liquefaction plants 0.0 0.0 0.0 0.0 0.0 Z Z Z Z Z 0.0 0.0
+ Liquefaction & regasification plants (LNG) 0.0 Z Z Z Z Z 0.0 Z Z Z 0.0 0.0
+ Gasification plants for biogas 0.0 Z Z Z Z Z Z 0.0 0.0 Z 0.0 0.0
+ Gas-to-liquids (GTL) plants 0.0 Z Z Z Z Z 0.0 Z Z Z 0.0 0.0
+ Charcoal production plants 0.0 Z Z Z Z Z Z 0.0 0.0 Z 0.0 0.0
+ Not elsewhere specified (energy) 68.3 0.0 0.0 0.0 0.0 61.9 0.0 0.0 0.0 Z 0.0 6.4
Distribution losses 115.9 0.0 0.0 0.0 0.0 6.1 0.0 0.0 0.0 Z 0.0 109.7
Available for final consumption 2 110.5 116.0 0.0 0.0 0.0 1 215.4 12.5 254.4 0.0 0.0 0.0 512.3
Final non-energy consumption 37.9 0.0 0.0 0.0 0.0 37.9 0.0 0.0 Z Z Z Z
Final energy consumption 2 071.8 116.0 0.0 0.0 0.0 1 176.8 12.5 254.4 0.0 Z 0.0 512.2
+ Industry 398.3 112.7 0.0 0.0 0.0 157.5 12.5 7.7 0.0 Z 0.0 107.9
+ Iron & steel 19.5 0.0 0.0 0.0 0.0 4.2 0.0 0.0 0.0 Z 0.0 15.3
+ Chemical & petrochemical 15.6 0.0 0.0 0.0 0.0 7.8 0.0 0.0 0.0 Z 0.0 7.8
+ Non-ferrous metals 7.1 0.0 0.0 0.0 0.0 0.3 0.0 0.0 0.0 Z 0.0 6.8
+ Non-metallic minerals 227.5 112.7 0.0 0.0 0.0 106.2 0.0 0.0 0.0 Z 0.0 8.6
+ Transport equipment 0.0 0.0 0.0 0.0 0.0 0.0 0.0 0.0 0.0 Z 0.0 0.0
+ Machinery 0.0 0.0 0.0 0.0 0.0 0.0 0.0 0.0 0.0 Z 0.0 0.0
+ Mining & quarrying 9.5 0.0 0.0 0.0 0.0 0.0 0.0 0.0 0.0 Z 0.0 9.5
+ Food, beverages & tobacco 60.1 0.0 0.0 0.0 0.0 20.9 6.5 7.7 0.0 Z 0.0 24.9
+ Paper, pulp & printing 11.7 0.0 0.0 0.0 0.0 1.5 0.0 0.0 0.0 Z 0.0 10.2
+ Wood & wood products 0.9 0.0 0.0 0.0 0.0 0.0 0.0 0.0 0.0 Z 0.0 0.9
+ Construction 8.5 0.0 0.0 0.0 0.0 1.2 0.0 0.0 0.0 Z 0.0 7.3
+ Textile & leather 14.6 0.0 0.0 0.0 0.0 2.3 0.0 0.0 0.0 Z 0.0 12.3
+ Not elsewhere specified (industry) 23.4 0.0 0.0 0.0 0.0 13.1 6.0 0.0 0.0 Z 0.0 4.4
+ Transport 831.9 0.0 0.0 0.0 0.0 753.7 0.0 78.2 0.0 Z Z 0.0
+ Rail 2.1 0.0 0.0 0.0 0.0 2.1 Z 0.0 0.0 Z Z 0.0
+ Road 793.9 Z Z Z Z 715.7 0.0 78.2 0.0 Z Z 0.0
+ Domestic aviation 0.0 Z Z Z Z 0.0 Z 0.0 Z Z Z Z
+ Domestic navigation 35.9 0.0 0.0 0.0 0.0 35.9 Z 0.0 0.0 Z Z Z
+ Pipeline transport 0.0 Z Z Z Z 0.0 0.0 0.0 Z Z Z 0.0
+ Not elsewhere specified (transport) 0.0 0.0 0.0 0.0 0.0 0.0 0.0 0.0 0.0 Z Z 0.0
+ Other 841.6 3.3 0.0 0.0 0.0 265.6 0.0 168.4 0.0 Z 0.0 404.3
+ Commercial & public services 213.7 3.3 0.0 0.0 0.0 61.6 0.0 23.5 0.0 Z 0.0 125.3
+ Households 492.6 0.0 0.0 0.0 0.0 107.4 0.0 132.9 0.0 Z 0.0 252.3
+ Agriculture & forestry 75.8 0.0 0.0 0.0 0.0 57.2 0.0 12.0 0.0 Z 0.0 6.6
+ Fishing 39.5 0.0 0.0 0.0 0.0 39.5 0.0 0.0 0.0 Z 0.0 0.0
+ Not elsewhere specified (other) 20.0 0.0 0.0 0.0 0.0 0.0 0.0 0.0 0.0 Z 0.0 20.0
Statistical differences 0.8 0.0 0.0 0.0 0.0 0.7 0.0 0.0 0.0 0.0 0.0 0.1
Gross electricity production 389.2 0.0 0.0 0.0 0.0 0.0 0.0 389.2 0.0 0.0 Z Z
Gross heat production 0.0 0.0 0.0 0.0 0.0 0.0 0.0 0.0 0.0 0.0 Z 0.0
Source: Eurostat (nrg_bal_c)
160Energy balance sheets — 2017 data
Electricity
ktoe 2017
Oil and
petroleum
products
Natural
gas
Renewables
and
biofuels
Non-
renewable
waste
Nuclear
heatHeat
AlbaniaTotal
Solid
fossil
fuels
Manufac-
tured
gases
Peat and
peat
products
Oil shale
and oil
sands

2005 2010 2011 2012 2013 2014 2015 2016 2017
Gross available energy 2 251 2 152 2 245 2 023 2 386 2 376 2 220 2 285 2 405
Solid fossil fuels 13 111 139 77 67 86 95 51 116
Peat & peat products 0 0 0 0 0 0 0 0 0
Oil shale & oil sands 0 0 0 0 0 0 0 0 0
Crude oil & other hydrocarbons 418 156 297 111 40 361 276 184 513
Petroleum products 1 085 1 093 942 979 1 253 1 002 947 1 089 841
Natural gas 9 12 12 13 15 25 27 35 37
Nuclear heat 0 0 0 0 0 0 0 0 0
Renewable energies 694 862 575 625 812 638 754 930 647
Non-renewable wastes 0 0 0 0 0 0 0 0 0
Primary production 1 132 1 620 1 483 1 670 2 034 2 013 2 073 1 943 1 634
Solid fossil fuels 11 2 1 1 1 0 34 2 68
Peat 0 0 0 0 0 0 0 0 0
Oil shale and oil sands 0 0 0 0 0 0 0 0 0
Crude oil & other hydrocarbons 418 744 895 1 031 1 207 1 368 1 279 1 056 959
Natural gas 9 12 12 13 15 25 27 35 37
Nuclear heat 0 0 0 0 0 0 0 0 0
Renewable energies 694 862 575 625 812 621 733 850 570
Non-renewable wastes 0 0 0 0 0 0 0 0 0
Net imports 1 119 622 801 316 604 682 280 461 920
Solid fossil fuels 2 109 138 76 66 86 61 49 48
Crude oil 0 -498 -598 -957 -1 167 -1 007 -987 -888 -488
Gas/Diesel Oil (w/o bio) 616 643 644 683 956 918 745 755 630
Motor Gasoline (w/o bio) 177 125 126 106 156 188 169 141 157
Naphtha 0 -3 -20 -4 -1 -10 -28 -1 -35
LPG 64 110 114 99 159 177 208 214 285
All other oil & petroleum products 227 218 116 95 235 49 -29 115 -3
Natural gas 0 0 0 0 0 0 0 0 0
Transformation input 924 812 662 517 638 793 813 935 986
Electricity & heat generation 506 655 365 406 598 406 507 669 389
Refinery intake 418 157 297 111 40 361 276 179 513
Coke ovens 0 0 0 0 0 0 0 0 0
Blast furnaces 0 0 0 0 0 0 0 0 0
Transformation output 851 798 641 510 636 756 813 928 959
Electricity & heat generation 468 651 360 406 598 406 507 669 389
Refinery output 383 147 280 104 38 324 275 175 489
Coke ovens 0 0 0 0 0 0 0 0 0
Blast furnaces 0 0 0 0 0 0 0 0 0
Energy sector 67 32 101 94 57 62 44 118 107
Distribution losses 54 82 101 96 167 96 107 128 116
Available for final consumption 1 998 2 006 2 002 1 806 2 117 2 152 2 045 1 991 2 111
Solid fossil fuels 13 111 139 77 67 86 95 51 116
Manufactured gases 0 0 0 0 0 0 0 0 0
Peat & peat products 0 0 0 0 0 0 0 0 0
Oil shale & oil sands 0 0 0 0 0 0 0 0 0
Gas/Diesel Oil (w/o bio) 690 664 731 703 761 770 762 723 739
Motor Gasoline (w/o bio) 192 125 126 106 119 127 125 113 112
Naphtha 0 0 0 0 0 9 0 0 0
LPG 64 110 114 99 123 133 150 156 181
All other oil & petroleum products 367 297 184 126 236 229 148 207 183
Natural gas 0 1 2 3 6 7 11 10 13
Primary solid biofuels & charcoal 230 205 208 207 201 193 204 159 159
Liquid biofuels 0 0 0 0 0 26 30 82 78
All other renewable energies 2 7 12 12 12 12 12 17 17
Non-renewable wastes 0 0 0 0 0 0 0 0 0
Electricity 439 486 486 472 593 560 507 473 512
Heat 0 0 0 0 0 0 0 0 0
Statistical difference 32 -2 0 -23 -5 1 1 5 1
Final non-energy consumption 123 110 48 38 161 92 81 102 38
Final energy consumption 1 843 1 898 1 953 1 791 1 962 2 059 1 963 1 883 2 072
Industry 211 355 380 277 281 373 302 284 398
Transport 785 733 768 737 804 834 829 833 832
Other sectors 847 810 806 777 876 852 832 767 842
Services 206 159 163 157 191 179 197 176 214
Households 517 489 498 509 580 556 532 486 493
Europe 2020-2030 indicators 2005 2010 2011 2012 2013 2014 2015 2016 2017
Gross inland consumption 2 251 2 152 2 245 2 023 2 365 2 355 2 199 2 250 2 368
Primary energy consumption 2 128 2 042 2 197 1 985 2 205 2 263 2 118 2 148 2 330
Final energy consumption 1 901 1 915 1 974 1 811 1 983 2 067 1 966 1 890 2 079
Source: Eurostat (nrg_bal_c)
161
Albaniaktoe
Energy balance sheets — 2017 data

Source: Eurostat (nrg_bal_c)
Source: Eurostat (nrg_bal_c)
Note: Please refer to page 23 for related methodological definitions.
Albania
162Energy balance sheets — 2017 data
0
1 000
2 000
3 000
4 000
5 000
6 000
7 000
8 000
9 000
1990 1995 2000 2005 2010 2015 2017
Gross electricity production by fuel, GWh
Solid fossil fuels Oil and petroleum products Natural gas
Renewables and biofuels Nuclear heat Other
0
200
400
600
800
1 000
1 200
1 400
1 600
1990 1995 2000 2005 2010 2015 2017
Gross available energy by fuel, ktoe
Solid fossil fuels Oil and petroleum products Natural gas
Renewables and biofuels Nuclear heat Non-renewable waste

Source: Eurostat (nrg_bal_c)
Source: Eurostat (nrg_bal_c)
Note: Please refer to page 23 for related methodological definitions.
Albania
163Energy balance sheets — 2017 data
0
500
1 000
1 500
2 000
2 500
1990 1995 2000 2005 2010 2015 2017
Final energy consumption by fuel, ktoe
Solid fossil fuels Oil and petroleum products Natural gas
Renewables and biofuels Electricity Heat
Other
0
500
1 000
1 500
2 000
2 500
1990 1995 2000 2005 2010 2015 2017
Final consumption by sector, ktoe
Industry Transport Services Households Non-energy use

+ Primary production 10 495.5 7 216.2 Z 0.0 0.0 987.8 389.4 1 901.1 1.0 0.0 Z Z
+ Recovered & recycled products 0.0 0.0 Z 0.0 0.0 0.0 Z 0.0 Z Z Z Z
+ Imports 6 769.2 686.3 0.0 0.0 0.0 3 745.7 1 737.9 36.2 0.0 Z 0.0 563.1
- Exports 1 438.9 16.7 0.0 0.0 0.0 867.4 0.0 62.6 0.0 Z 0.0 492.2
+ Change in stock -62.8 -13.2 0.0 0.0 0.0 -49.0 -10.2 9.6 0.0 Z Z Z
= Gross available energy 15 763.1 7 872.7 0.0 0.0 0.0 3 817.1 2 117.2 1 884.2 1.0 0.0 0.0 70.9
- International maritime bunkers 14.7 0.0 0.0 0.0 0.0 14.7 0.0 0.0 Z Z Z Z
= Gross inland consumption 15 748.4 7 872.7 0.0 0.0 0.0 3 802.4 2 117.2 1 884.2 1.0 0.0 0.0 70.9
- International aviation 132.8 Z Z Z Z 132.8 Z 0.0 Z Z Z Z
= Total energy supply 15 615.6 7 872.7 0.0 0.0 0.0 3 669.6 2 117.2 1 884.2 1.0 0.0 0.0 70.9
Transformation input 13 845.1 7 553.2 101.5 0.0 0.0 4 517.1 745.3 846.3 1.0 0.0 0.0 80.7
+ Electricity & heat generation 8 668.5 6 842.8 101.5 0.0 0.0 189.4 647.2 806.1 1.0 0.0 0.0 80.7
+ Coke ovens 0.0 0.0 0.0 0.0 0.0 0.0 0.0 0.0 Z Z Z Z
+ Blast furnaces 508.5 508.5 0.0 0.0 0.0 0.0 0.0 0.0 Z Z Z Z
+ Gas works 0.0 0.0 0.0 0.0 0.0 0.0 0.0 0.0 Z Z Z Z
+ Refineries & petrochemical industry 4 327.7 Z Z Z Z 4 327.7 Z Z Z Z Z Z
+ Patent fuel plants 0.0 0.0 0.0 0.0 0.0 0.0 Z 0.0 0.0 Z Z Z
+ BKB & PB plants 202.0 202.0 0.0 0.0 0.0 Z Z 0.0 0.0 Z Z Z
+ Coal liquefaction plants 0.0 0.0 0.0 0.0 0.0 Z Z Z Z Z Z Z
+ For blended natural gas 0.0 Z 0.0 Z Z 0.0 Z 0.0 Z Z Z Z
+ Liquid biofuels blended 0.0 Z Z Z Z Z Z 0.0 Z Z Z Z
+ Charcoal production plants 40.2 Z Z Z Z Z Z 40.2 Z Z Z Z
+ Gas-to-liquids plants 0.0 Z Z Z Z Z 0.0 Z Z Z Z Z
+ Not elsewhere specified 98.1 0.0 0.0 0.0 0.0 0.0 98.1 0.0 0.0 Z Z Z
Transformation output 8 782.3 215.8 253.4 0.0 Z 4 227.8 0.0 14.2 Z Z 885.8 3 185.3
+ Electricity & heat generation 4 071.2 Z Z Z Z Z Z Z Z Z 885.8 3 185.3
+ Coke ovens 0.0 0.0 0.0 Z Z Z Z Z Z Z Z Z
+ Blast furnaces 253.4 0.0 253.4 Z Z Z Z Z Z Z Z Z
+ Gas works 0.0 0.0 0.0 Z Z Z Z Z Z Z Z Z
+ Refineries & petrochemical industry 4 162.1 Z Z Z Z 4 162.1 Z 0.0 Z Z Z Z
+ Patent fuel plants 0.0 0.0 Z Z Z Z Z Z Z Z Z Z
+ BKB & PB plants 215.8 215.8 Z 0.0 Z Z Z Z Z Z Z Z
+ Coal liquefaction plants 0.0 Z Z Z Z 0.0 Z Z Z Z Z Z
+ Blended in natural gas 0.0 Z Z Z Z Z 0.0 Z Z Z Z Z
+ Liquid biofuels blended 0.0 Z Z Z Z Z Z 0.0 Z Z Z Z
+ Charcoal production plants 14.2 Z Z Z Z Z Z 14.2 Z Z Z Z
+ Gas-to-liquids plants 65.7 Z Z Z Z 65.7 Z Z Z Z Z Z
+ Not elsewhere specified 0.0 0.0 0.0 0.0 Z 0.0 Z Z Z Z Z Z
Energy sector 693.7 0.0 0.0 0.0 0.0 136.2 161.6 0.0 0.0 Z 51.7 344.1
+ Own use in electricity & heat generation 311.5 0.0 0.0 0.0 0.0 38.0 0.0 0.0 0.0 Z 37.3 236.2
+ Coal mines 50.3 0.0 0.0 0.0 0.0 0.0 0.0 0.0 0.0 Z 0.0 50.3
+ Oil & natural gas extraction plants 71.0 Z Z Z Z 0.0 63.5 0.0 Z Z 0.0 7.5
+ Patent fuel plants 0.0 0.0 0.0 0.0 0.0 Z Z 0.0 0.0 Z 0.0 0.0
+ Coke ovens 0.0 0.0 0.0 0.0 0.0 0.0 0.0 0.0 0.0 Z 0.0 0.0
+ BKB & PB plants 3.6 0.0 0.0 0.0 0.0 Z Z 0.0 0.0 Z 0.0 3.6
+ Gas works 0.0 0.0 0.0 0.0 0.0 0.0 0.0 0.0 0.0 Z 0.0 0.0
+ Blast furnaces 0.0 0.0 0.0 0.0 0.0 0.0 0.0 0.0 0.0 Z 0.0 0.0
+ Petroleum refineries (oil refineries) 215.6 0.0 0.0 0.0 0.0 98.2 95.5 0.0 0.0 Z 0.0 21.9
+ Nuclear industry 0.0 Z Z Z Z Z Z Z Z Z 0.0 0.0
+ Coal liquefaction plants 0.0 0.0 0.0 0.0 0.0 Z Z Z Z Z 0.0 0.0
+ Liquefaction & regasification plants (LNG) 0.0 Z Z Z Z Z 0.0 Z Z Z 0.0 0.0
+ Gasification plants for biogas 0.0 Z Z Z Z Z Z 0.0 0.0 Z 0.0 0.0
+ Gas-to-liquids (GTL) plants 0.0 Z Z Z Z Z 0.0 Z Z Z 0.0 0.0
+ Charcoal production plants 0.0 Z Z Z Z Z Z 0.0 0.0 Z 0.0 0.0
+ Not elsewhere specified (energy) 41.7 0.0 0.0 0.0 0.0 0.0 2.6 0.0 0.0 Z 14.5 24.6
Distribution losses 586.3 0.4 60.9 0.0 0.0 0.0 28.7 0.1 0.0 Z 82.9 413.3
Available for final consumption 9 272.9 534.8 91.0 0.0 0.0 3 244.1 1 181.5 1 052.0 0.0 0.0 751.2 2 418.2
Final non-energy consumption 855.5 2.9 0.0 0.0 0.0 614.3 238.3 0.0 Z Z Z Z
Final energy consumption 8 443.4 534.0 91.0 0.0 0.0 2 653.9 943.2 1 051.8 0.0 Z 751.2 2 418.2
+ Industry 2 347.6 261.4 91.0 0.0 0.0 329.8 543.2 185.7 0.0 Z 214.1 722.4
+ Iron & steel 327.0 55.1 91.0 0.0 0.0 0.3 87.2 0.0 0.0 Z 14.4 79.1
+ Chemical & petrochemical 475.3 55.8 0.0 0.0 0.0 60.8 158.1 5.7 0.0 Z 86.4 108.5
+ Non-ferrous metals 78.5 0.0 0.0 0.0 0.0 7.1 20.4 2.7 0.0 Z 10.0 38.3
+ Non-metallic minerals 374.3 84.2 0.0 0.0 0.0 143.3 74.8 6.3 0.0 Z 1.0 64.7
+ Transport equipment 56.1 0.0 0.0 0.0 0.0 6.6 26.3 0.5 0.0 Z 0.6 22.0
+ Machinery 135.6 8.5 0.0 0.0 0.0 33.7 12.8 23.0 0.0 Z 1.1 56.5
+ Mining & quarrying 54.9 0.0 0.0 0.0 0.0 15.4 0.3 0.2 0.0 Z 0.0 39.0
+ Food, beverages & tobacco 414.2 15.5 0.0 0.0 0.0 35.4 113.2 59.3 0.0 Z 50.9 139.8
+ Paper, pulp & printing 114.2 17.2 0.0 0.0 0.0 2.2 27.5 5.4 0.0 Z 18.4 43.3
+ Wood & wood products 32.1 0.0 0.0 0.0 0.0 0.8 1.2 18.6 0.0 Z 0.1 11.4
+ Construction 46.2 0.6 0.0 0.0 0.0 16.4 0.0 0.0 0.0 Z 0.0 29.2
+ Textile & leather 78.5 5.8 0.0 0.0 0.0 5.4 10.3 23.2 0.0 Z 1.4 32.3
+ Not elsewhere specified (industry) 160.9 18.6 0.0 0.0 0.0 2.4 11.1 40.8 0.0 Z 29.8 58.4
+ Transport 2 112.1 0.0 0.0 0.0 0.0 2 075.7 4.2 0.0 0.0 Z Z 32.2
+ Rail 42.5 0.0 0.0 0.0 0.0 10.2 Z 0.0 0.0 Z Z 32.2
+ Road 2 061.0 Z Z Z Z 2 058.7 2.4 0.0 0.0 Z Z 0.0
+ Domestic aviation 0.0 Z Z Z Z 0.0 Z 0.0 Z Z Z Z
+ Domestic navigation 6.8 0.0 0.0 0.0 0.0 6.8 Z 0.0 0.0 Z Z Z
+ Pipeline transport 1.9 Z Z Z Z 0.0 1.9 0.0 Z Z Z 0.0
+ Not elsewhere specified (transport) 0.0 0.0 0.0 0.0 0.0 0.0 0.0 0.0 0.0 Z Z 0.0
+ Other 3 983.7 272.6 0.0 0.0 0.0 248.4 395.8 866.1 0.0 Z 537.1 1 663.6
+ Commercial & public services 939.6 44.0 0.0 0.0 0.0 67.0 186.7 53.4 0.0 Z 142.2 446.3
+ Households 2 853.6 228.6 0.0 0.0 0.0 47.6 191.1 803.5 0.0 Z 394.9 1 187.9
+ Agriculture & forestry 190.5 0.1 0.0 0.0 0.0 133.8 18.0 9.2 0.0 Z 0.0 29.4
+ Fishing 0.0 0.0 0.0 0.0 0.0 0.0 0.0 0.0 0.0 Z 0.0 0.0
+ Not elsewhere specified (other) 0.0 0.0 0.0 0.0 0.0 0.0 0.0 0.0 0.0 Z 0.0 0.0
Statistical differences -26.0 -2.1 0.0 0.0 0.0 -24.1 0.0 0.2 0.0 0.0 0.0 0.0
Gross electricity production 3 185.3 2 275.5 7.7 0.0 0.0 4.1 47.2 850.3 0.4 0.0 Z Z
Gross heat production 885.8 162.3 52.4 0.0 0.0 155.7 512.0 3.3 0.0 0.0 Z 0.0
Source: Eurostat (nrg_bal_c)
164Energy balance sheets — 2017 data
Electricity
ktoe 2017
Oil and
petroleum
products
Natural
gas
Renewables
and
biofuels
Non-
renewable
waste
Nuclear
heatHeat
SerbiaTotal
Solid
fossil
fuels
Manufac-
tured
gases
Peat and
peat
products
Oil shale
and oil
sands

2005 2010 2011 2012 2013 2014 2015 2016 2017
Gross available energy 16 047 15 608 16 325 14 610 14 950 13 374 14 833 15 452 15 763
Solid fossil fuels 8 054 7 753 8 758 7 621 7 910 6 261 7 740 7 918 7 873
Peat & peat products 0 0 0 0 0 0 0 0 0
Oil shale & oil sands 0 0 0 0 0 0 0 0 0
Crude oil & other hydrocarbons 3 800 3 064 2 580 2 339 3 099 3 144 3 370 3 427 3 663
Petroleum products 630 899 1 316 1 095 363 219 119 380 154
Natural gas 1 947 1 853 1 903 1 678 1 867 1 609 1 750 1 891 2 117
Nuclear heat 0 0 0 0 0 0 0 0 0
Renewable energies 1 784 2 055 1 786 1 843 1 929 2 006 1 931 2 001 1 884
Non-renewable wastes 0 9 7 0 0 0 0 1 1
Primary production 10 236 10 551 11 169 10 793 11 371 9 443 10 762 10 695 10 496
Solid fossil fuels 7 461 7 229 7 825 7 278 7 671 5 713 7 201 7 201 7 216
Peat 0 0 0 0 0 0 0 0 0
Oil shale and oil sands 0 0 0 0 0 0 0 0 0
Crude oil & other hydrocarbons 663 940 1 122 1 229 1 277 1 216 1 121 1 028 988
Natural gas 229 308 405 425 423 444 456 417 389
Nuclear heat 0 0 0 0 0 0 0 0 0
Renewable energies 1 884 2 064 1 811 1 861 2 000 2 071 1 984 2 049 1 901
Non-renewable wastes 0 9 7 0 0 0 0 1 1
Net imports 5 875 5 231 4 970 4 082 3 602 3 736 4 108 4 593 5 330
Solid fossil fuels 657 726 794 405 275 469 622 625 670
Crude oil 3 138 1 988 1 466 1 074 1 697 1 515 1 899 2 312 2 583
Gas/Diesel Oil (w/o bio) 92 593 823 738 384 392 315 328 315
Motor Gasoline (w/o bio) 265 0 27 59 -17 -72 -88 -79 -69
Naphtha 185 260 245 53 8 -30 -3 78 45
LPG 80 279 328 294 170 164 98 132 102
All other oil & petroleum products 8 -155 -59 30 -139 107 15 -10 -97
Natural gas 1 718 1 567 1 391 1 425 1 503 1 111 1 386 1 429 1 738
Transformation input 13 734 12 518 12 675 11 440 13 266 11 487 13 309 13 621 13 845
Electricity & heat generation 9 370 8 619 9 186 8 496 8 930 7 344 8 647 8 688 8 669
Refinery intake 3 800 3 049 2 593 2 380 3 331 3 347 3 624 3 690 3 901
Coke ovens 0 0 0 0 0 0 0 0 0
Blast furnaces 179 410 347 109 146 207 346 449 509
Transformation output 7 962 7 734 7 483 6 761 8 326 7 543 8 394 8 717 8 782
Electricity & heat generation 4 302 4 188 4 309 4 005 4 248 3 662 4 135 4 245 4 071
Refinery output 3 336 2 975 2 540 2 328 3 234 3 232 3 479 3 534 3 738
Coke ovens 0 0 0 0 0 0 0 0 0
Blast furnaces 74 219 234 72 76 115 173 228 253
Energy sector 244 527 481 570 593 593 710 700 694
Distribution losses 531 681 663 602 597 554 570 567 586
Available for final consumption 9 451 9 571 9 940 8 715 8 766 8 196 8 549 9 142 9 273
Solid fossil fuels 703 809 1 017 677 535 462 519 666 535
Manufactured gases 3 74 92 29 33 47 62 81 91
Peat & peat products 0 0 0 0 0 0 0 0 0
Oil shale & oil sands 0 0 0 0 0 0 0 0 0
Gas/Diesel Oil (w/o bio) 1 334 1 535 1 593 1 502 1 547 1 601 1 585 1 632 1 733
Motor Gasoline (w/o bio) 1 074 518 486 444 421 423 430 443 450
Naphtha 334 378 361 98 354 228 254 327 354
LPG 178 414 435 408 409 333 294 319 249
All other oil & petroleum products 506 460 486 511 388 423 439 505 458
Natural gas 1 238 1 147 1 134 936 1 002 767 869 1 023 1 182
Primary solid biofuels & charcoal 803 1 025 1 020 1 023 1 026 1 029 1 030 1 034 1 035
Liquid biofuels 0 0 0 0 0 0 0 0 0
All other renewable energies 0 5 7 7 5 9 11 9 17
Non-renewable wastes 0 0 0 0 0 0 0 0 0
Electricity 2 207 2 388 2 425 2 351 2 328 2 255 2 338 2 373 2 418
Heat 1 071 818 884 729 718 621 716 730 751
Statistical difference -285 1 16 -27 6 -11 5 15 -26
Final non-energy consumption 387 807 842 331 558 526 601 849 856
Final energy consumption 9 348 8 763 9 082 8 412 8 202 7 681 7 942 8 278 8 443
Industry 3 352 2 429 2 740 2 464 2 396 1 955 2 103 2 246 2 348
Transport 2 206 2 231 2 042 1 807 1 972 2 041 1 986 2 029 2 112
Other sectors 3 791 4 103 4 300 4 142 3 834 3 685 3 853 4 003 3 984
Services 586 906 1 047 835 804 772 875 886 940
Households 3 096 3 079 3 135 3 122 2 847 2 753 2 826 2 924 2 854
Europe 2020-2030 indicators 2005 2010 2011 2012 2013 2014 2015 2016 2017
Gross inland consumption 16 047 15 608 16 325 14 607 14 940 13 358 14 808 15 432 15 748
Primary energy consumption 15 660 14 801 15 483 14 277 14 382 12 832 14 207 14 583 14 893
Final energy consumption 9 503 8 998 9 245 8 490 8 317 7 845 8 180 8 619 8 831
Source: Eurostat (nrg_bal_c)
165
Serbiaktoe
Energy balance sheets — 2017 data

Source: Eurostat (nrg_bal_c)
Source: Eurostat (nrg_bal_c)
Note: Please refer to page 23 for related methodological definitions.
Serbia
166Energy balance sheets — 2017 data
0
5 000
10 000
15 000
20 000
25 000
30 000
35 000
40 000
45 000
1990 1995 2000 2005 2010 2015 2017
Gross electricity production by fuel, GWh
Solid fossil fuels Oil and petroleum products Natural gas
Renewables and biofuels Nuclear heat Other
0
2 000
4 000
6 000
8 000
10 000
12 000
1990 1995 2000 2005 2010 2015 2017
Gross available energy by fuel, ktoe
Solid fossil fuels Oil and petroleum products Natural gas
Renewables and biofuels Nuclear heat Non-renewable waste

Source: Eurostat (nrg_bal_c)
Source: Eurostat (nrg_bal_c)
Note: Please refer to page 23 for related methodological definitions.
Serbia
167Energy balance sheets — 2017 data
0
2 000
4 000
6 000
8 000
10 000
12 000
14 000
1990 1995 2000 2005 2010 2015 2017
Final energy consumption by fuel, ktoe
Solid fossil fuels Oil and petroleum products Natural gas
Renewables and biofuels Electricity Heat
Other
0
2 000
4 000
6 000
8 000
10 000
12 000
14 000
1990 1995 2000 2005 2010 2015 2017
Final consumption by sector, ktoe
Industry Transport Services Households Non-energy use

+ Primary production 36 470.9 15 682.0 Z 0.0 0.0 2 699.8 291.6 17 739.1 58.4 0.0 Z Z
+ Recovered & recycled products 0.0 0.0 Z 0.0 0.0 0.0 Z 0.0 Z Z Z Z
+ Imports 124 605.2 24 911.6 0.0 0.0 0.0 53 971.6 45 487.5 0.0 0.0 Z 0.0 234.6
- Exports 7 896.0 173.1 0.0 0.0 0.0 6 919.6 519.3 0.0 0.0 Z 0.0 284.1
+ Change in stock -1 921.4 -329.4 0.0 0.0 0.0 -564.4 -1 027.3 -0.3 0.0 Z Z Z
= Gross available energy 151 258.7 40 091.1 0.0 0.0 0.0 49 187.3 44 232.5 17 738.9 58.4 0.0 0.0 -49.5
- International maritime bunkers 854.9 0.0 0.0 0.0 0.0 854.9 0.0 0.0 Z Z Z Z
= Gross inland consumption 150 403.8 40 091.1 0.0 0.0 0.0 48 332.4 44 232.5 17 738.9 58.4 0.0 0.0 -49.5
- International aviation 3 679.4 Z Z Z Z 3 679.4 Z 0.0 Z Z Z Z
= Total energy supply 146 724.4 40 091.1 0.0 0.0 0.0 44 653.0 44 232.5 17 738.9 58.4 0.0 0.0 -49.5
Transformation input 102 931.6 30 891.0 842.0 0.0 0.0 40 402.5 17 725.6 12 673.9 58.4 0.0 338.1 0.0
+ Electricity & heat generation 54 299.2 22 935.7 842.0 0.0 0.0 244.1 17 320.5 12 560.3 58.4 0.0 338.1 0.0
+ Coke ovens 4 181.5 4 181.5 0.0 0.0 0.0 0.0 0.0 0.0 Z Z Z Z
+ Blast furnaces 3 773.9 3 773.9 0.0 0.0 0.0 0.0 0.0 0.0 Z Z Z Z
+ Gas works 0.0 0.0 0.0 0.0 0.0 0.0 0.0 0.0 Z Z Z Z
+ Refineries & petrochemical industry 40 158.5 Z Z Z Z 40 158.5 Z Z Z Z Z Z
+ Patent fuel plants 0.0 0.0 0.0 0.0 0.0 0.0 Z 0.0 0.0 Z Z Z
+ BKB & PB plants 0.0 0.0 0.0 0.0 0.0 Z Z 0.0 0.0 Z Z Z
+ Coal liquefaction plants 0.0 0.0 0.0 0.0 0.0 Z Z Z Z Z Z Z
+ For blended natural gas 0.0 Z 0.0 Z Z 0.0 Z 0.0 Z Z Z Z
+ Liquid biofuels blended 113.5 Z Z Z Z Z Z 113.5 Z Z Z Z
+ Charcoal production plants 0.0 Z Z Z Z Z Z 0.0 Z Z Z Z
+ Gas-to-liquids plants 0.0 Z Z Z Z Z 0.0 Z Z Z Z Z
+ Not elsewhere specified 405.1 0.0 0.0 0.0 0.0 0.0 405.1 0.0 0.0 Z Z Z
Transformation output 71 782.0 2 917.1 2 000.4 0.0 Z 39 785.3 0.0 145.6 Z Z 1 372.4 25 561.3
+ Electricity & heat generation 26 933.6 Z Z Z Z Z Z Z Z Z 1 372.4 25 561.3
+ Coke ovens 3 628.9 2 917.1 711.7 Z Z Z Z Z Z Z Z Z
+ Blast furnaces 1 288.6 0.0 1 288.6 Z Z Z Z Z Z Z Z Z
+ Gas works 0.0 0.0 0.0 Z Z Z Z Z Z Z Z Z
+ Refineries & petrochemical industry 39 335.3 Z Z Z Z 39 335.3 Z 0.0 Z Z Z Z
+ Patent fuel plants 0.0 0.0 Z Z Z Z Z Z Z Z Z Z
+ BKB & PB plants 0.0 0.0 Z 0.0 Z Z Z Z Z Z Z Z
+ Coal liquefaction plants 0.0 Z Z Z Z 0.0 Z Z Z Z Z Z
+ Blended in natural gas 0.0 Z Z Z Z Z 0.0 Z Z Z Z Z
+ Liquid biofuels blended 145.6 Z Z Z Z Z Z 145.6 Z Z Z Z
+ Charcoal production plants 0.0 Z Z Z Z Z Z 0.0 Z Z Z Z
+ Gas-to-liquids plants 450.1 Z Z Z Z 450.1 Z Z Z Z Z Z
+ Not elsewhere specified 0.0 0.0 0.0 0.0 Z 0.0 Z Z Z Z Z Z
Energy sector 6 755.3 235.8 846.5 0.0 0.0 2 717.3 1 567.2 0.0 0.0 Z 0.0 1 388.5
+ Own use in electricity & heat generation 1 359.6 235.8 0.0 0.0 0.0 0.0 4.3 0.0 0.0 Z 0.0 1 119.5
+ Coal mines 77.9 0.0 0.0 0.0 0.0 0.0 0.0 0.0 0.0 Z 0.0 77.9
+ Oil & natural gas extraction plants 25.5 Z Z Z Z 0.0 0.0 0.0 Z Z 0.0 25.5
+ Patent fuel plants 0.0 0.0 0.0 0.0 0.0 Z Z 0.0 0.0 Z 0.0 0.0
+ Coke ovens 343.2 0.0 343.2 0.0 0.0 0.0 0.0 0.0 0.0 Z 0.0 0.0
+ BKB & PB plants 0.0 0.0 0.0 0.0 0.0 Z Z 0.0 0.0 Z 0.0 0.0
+ Gas works 0.0 0.0 0.0 0.0 0.0 0.0 0.0 0.0 0.0 Z 0.0 0.0
+ Blast furnaces 503.3 0.0 503.3 0.0 0.0 0.0 0.0 0.0 0.0 Z 0.0 0.0
+ Petroleum refineries (oil refineries) 4 440.7 0.0 0.0 0.0 0.0 2 717.3 1 562.9 0.0 0.0 Z 0.0 160.4
+ Nuclear industry 0.0 Z Z Z Z Z Z Z Z Z 0.0 0.0
+ Coal liquefaction plants 0.0 0.0 0.0 0.0 0.0 Z Z Z Z Z 0.0 0.0
+ Liquefaction & regasification plants (LNG) 0.0 Z Z Z Z Z 0.0 Z Z Z 0.0 0.0
+ Gasification plants for biogas 0.0 Z Z Z Z Z Z 0.0 0.0 Z 0.0 0.0
+ Gas-to-liquids (GTL) plants 0.0 Z Z Z Z Z 0.0 Z Z Z 0.0 0.0
+ Charcoal production plants 0.0 Z Z Z Z Z Z 0.0 0.0 Z 0.0 0.0
+ Not elsewhere specified (energy) 5.2 0.0 0.0 0.0 0.0 0.0 0.0 0.0 0.0 Z 0.0 5.2
Distribution losses 2 983.5 0.0 0.0 0.0 0.0 0.0 3.3 0.0 0.0 Z 0.0 2 980.2
Available for final consumption 105 836.0 11 881.5 311.9 0.0 0.0 41 318.5 24 936.3 5 210.6 0.0 0.0 1 034.2 21 143.1
Final non-energy consumption 4 921.6 0.0 0.0 0.0 0.0 4 515.5 406.1 0.0 Z Z Z Z
Final energy consumption 100 457.1 11 793.9 311.9 0.0 0.0 36 218.3 24 745.2 5 210.6 0.0 Z 1 034.2 21 143.1
+ Industry 32 114.4 6 027.7 311.9 0.0 0.0 4 402.2 10 296.6 295.0 0.0 Z 1 034.2 9 746.7
+ Iron & steel 4 531.8 755.9 311.9 0.0 0.0 17.8 1 252.8 0.0 0.0 Z 0.0 2 193.4
+ Chemical & petrochemical 2 694.3 494.7 0.0 0.0 0.0 5.3 1 667.2 0.0 0.0 Z 0.0 527.2
+ Non-ferrous metals 923.3 227.5 0.0 0.0 0.0 5.2 368.0 0.0 0.0 Z 0.0 322.7
+ Non-metallic minerals 9 620.4 2 704.2 0.0 0.0 0.0 3 903.4 1 775.0 0.0 0.0 Z 0.0 1 237.6
+ Transport equipment 163.9 5.7 0.0 0.0 0.0 14.2 144.1 0.0 0.0 Z 0.0 0.0
+ Machinery 932.3 23.0 0.0 0.0 0.0 7.6 222.3 0.0 0.0 Z 0.0 679.3
+ Mining & quarrying 488.6 89.4 0.0 0.0 0.0 160.0 118.6 0.0 0.0 Z 0.0 120.6
+ Food, beverages & tobacco 2 501.1 810.2 0.0 0.0 0.0 29.9 1 017.6 0.0 0.0 Z 0.0 643.4
+ Paper, pulp & printing 726.9 216.2 0.0 0.0 0.0 6.3 202.9 0.0 0.0 Z 0.0 301.5
+ Wood & wood products 375.7 10.1 0.0 0.0 0.0 4.1 161.4 0.0 0.0 Z 0.0 200.0
+ Construction 903.7 0.0 0.0 0.0 0.0 80.8 503.0 0.0 0.0 Z 0.0 320.0
+ Textile & leather 3 099.8 690.7 0.0 0.0 0.0 11.0 934.5 0.0 0.0 Z 0.0 1 463.7
+ Not elsewhere specified (industry) 5 152.5 0.0 0.0 0.0 0.0 156.7 1 929.2 295.0 0.0 Z 1 034.2 1 737.4
+ Transport 28 305.5 0.0 0.0 0.0 0.0 27 613.0 435.9 145.6 0.0 Z Z 111.1
+ Rail 206.7 0.0 0.0 0.0 0.0 122.2 Z 0.0 0.0 Z Z 84.6
+ Road 26 123.6 Z Z Z Z 25 909.2 68.8 145.6 0.0 Z Z 0.0
+ Domestic aviation 1 271.9 Z Z Z Z 1 271.9 Z 0.0 Z Z Z Z
+ Domestic navigation 309.8 0.0 0.0 0.0 0.0 309.8 Z 0.0 0.0 Z Z Z
+ Pipeline transport 392.5 Z Z Z Z 0.0 365.9 0.0 Z Z Z 26.5
+ Not elsewhere specified (transport) 1.1 0.0 0.0 0.0 0.0 0.0 1.1 0.0 0.0 Z Z 0.0
+ Other 40 037.2 5 766.2 0.0 0.0 0.0 4 203.0 14 012.7 4 770.0 0.0 Z 0.0 11 285.3
+ Commercial & public services 13 565.2 3 804.8 0.0 0.0 0.0 935.7 2 788.7 0.0 0.0 Z 0.0 6 036.0
+ Households 22 159.0 1 961.3 0.0 0.0 0.0 245.0 11 126.9 4 161.0 0.0 Z 0.0 4 664.8
+ Agriculture & forestry 4 168.8 0.0 0.0 0.0 0.0 2 937.4 56.8 609.0 0.0 Z 0.0 565.6
+ Fishing 144.2 0.0 0.0 0.0 0.0 84.9 40.4 0.0 0.0 Z 0.0 19.0
+ Not elsewhere specified (other) 0.0 0.0 0.0 0.0 0.0 0.0 0.0 0.0 0.0 Z 0.0 0.0
Statistical differences 457.3 87.6 0.0 0.0 0.0 584.7 -215.0 0.0 0.0 0.0 0.0 0.0
Gross electricity production 25 488.3 8 201.6 179.8 0.0 0.0 103.2 9 500.4 7 500.9 2.4 0.0 Z Z
Gross heat production 1 034.2 53.0 0.0 0.0 0.0 39.5 841.4 61.4 39.0 0.0 Z 0.0
Source: Eurostat (nrg_bal_c)
168Energy balance sheets — 2017 data
Electricity
ktoe 2017
Oil and
petroleum
products
Natural
gas
Renewables
and
biofuels
Non-
renewable
waste
Nuclear
heatHeat
TurkeyTotal
Solid
fossil
fuels
Manufac-
tured
gases
Peat and
peat
products
Oil shale
and oil
sands

2005 2010 2011 2012 2013 2014 2015 2016 2017
Gross available energy 86 321 105 737 112 981 118 045 114 832 123 245 133 178 140 511 151 259
Solid fossil fuels 22 563 31 095 33 100 34 668 29 820 33 884 34 598 37 870 40 091
Peat & peat products 0 0 0 0 0 0 0 0 0
Oil shale & oil sands 0 0 0 0 0 0 0 0 0
Crude oil & other hydrocarbons 25 585 19 455 20 608 21 106 20 597 20 673 27 797 28 320 29 251
Petroleum products 5 349 12 228 11 177 12 620 13 348 15 991 15 371 18 454 19 936
Natural gas 22 792 31 395 36 789 37 262 37 556 40 205 39 383 38 262 44 232
Nuclear heat 0 0 0 0 0 0 0 0 0
Renewable energies 10 131 11 627 11 223 12 138 12 975 12 037 15 658 17 136 17 739
Non-renewable wastes 3 4 6 5 4 3 33 49 58
Primary production 23 686 31 421 30 824 30 499 29 100 28 803 31 463 35 707 36 471
Solid fossil fuels 10 575 16 741 16 620 15 554 13 542 13 814 12 798 15 498 15 682
Peat 0 0 0 0 0 0 0 0 0
Oil shale and oil sands 0 0 0 0 0 0 0 0 0
Crude oil & other hydrocarbons 2 239 2 487 2 350 2 319 2 379 2 606 2 661 2 722 2 700
Natural gas 739 562 625 521 443 395 314 302 292
Nuclear heat 0 0 0 0 0 0 0 0 0
Renewable energies 10 131 11 627 11 223 12 100 12 733 11 985 15 658 17 135 17 739
Non-renewable wastes 3 4 6 5 4 3 33 49 58
Net imports 61 862 74 691 80 330 89 276 86 533 94 014 103 702 106 056 116 709
Solid fossil fuels 11 720 14 650 15 655 19 438 17 460 19 336 21 859 23 378 24 739
Crude oil 23 195 16 813 17 942 19 326 18 402 18 478 26 514 26 405 27 248
Gas/Diesel Oil (w/o bio) 2 946 9 590 10 301 11 349 12 114 13 275 12 681 13 242 14 641
Motor Gasoline (w/o bio) -1 113 -1 843 -2 417 -2 803 -2 695 -2 235 -3 325 -3 092 -3 394
Naphtha -647 1 282 1 149 1 465 1 471 1 144 1 630 1 890 1 905
LPG 3 807 3 423 3 325 3 254 3 352 3 396 3 562 3 567 3 523
All other oil & petroleum products -79 57 -1 240 -342 -1 058 77 1 079 2 639 3 130
Natural gas 22 134 30 786 35 538 37 305 36 713 40 039 39 362 37 609 44 968
Transformation input 58 084 65 050 72 529 76 561 76 505 79 337 90 470 94 287 102 932
Electricity & heat generation 26 863 36 960 40 207 41 590 40 769 45 485 46 118 49 364 54 299
Refinery intake 25 671 19 950 22 260 23 254 24 117 23 232 30 998 31 395 33 585
Coke ovens 3 170 3 981 3 890 4 033 4 168 4 280 4 409 4 093 4 181
Blast furnaces 2 212 2 804 2 484 3 384 3 409 3 360 3 479 3 351 3 774
Transformation output 44 673 45 632 51 554 55 404 56 107 53 755 64 442 66 470 71 782
Electricity & heat generation 14 801 19 422 20 974 21 854 21 951 22 924 23 658 24 858 26 934
Refinery output 26 110 20 482 22 806 24 296 25 103 22 778 30 075 30 662 32 963
Coke ovens 2 665 3 552 3 266 3 498 3 574 3 829 3 784 3 542 3 629
Blast furnaces 918 926 852 1 116 1 187 1 252 1 353 1 252 1 289
Energy sector 2 728 3 964 4 170 4 511 4 363 4 374 5 409 6 449 6 755
Distribution losses 2 138 2 602 2 787 3 070 3 198 3 211 3 144 3 065 2 983
Available for final consumption 65 867 78 132 83 704 88 045 84 870 86 340 94 068 98 737 105 836
Solid fossil fuels 10 155 13 875 13 415 13 583 10 086 11 013 11 515 11 556 11 881
Manufactured gases 722 318 304 432 397 442 511 462 312
Peat & peat products 0 0 0 0 0 0 0 0 0
Oil shale & oil sands 0 0 0 0 0 0 0 0 0
Gas/Diesel Oil (w/o bio) 10 297 14 834 15 515 16 531 17 265 18 068 20 084 21 907 23 995
Motor Gasoline (w/o bio) 2 828 2 160 2 043 1 938 2 031 2 023 2 134 2 320 2 382
Naphtha 746 1 197 658 985 962 771 207 125 155
LPG 4 692 4 153 4 163 4 062 4 179 4 239 4 401 4 677 4 623
All other oil & petroleum products 7 831 6 352 7 261 8 844 7 015 5 699 8 857 9 889 10 164
Natural gas 10 049 13 137 17 671 18 120 19 036 19 746 21 250 21 813 24 936
Primary solid biofuels & charcoal 5 324 4 435 3 531 3 453 3 281 3 115 2 804 2 589 2 362
Liquid biofuels 0 5 13 54 279 110 140 136 146
All other renewable energies 1 311 1 823 2 093 2 231 2 258 2 294 2 730 2 717 2 703
Non-renewable wastes 0 0 0 0 0 0 0 0 0
Electricity 11 061 14 619 15 821 16 586 16 867 17 665 18 444 19 619 21 143
Heat 850 1 226 1 216 1 226 1 213 1 156 991 928 1 034
Statistical difference 180 -11 1 449 1 639 -727 -46 216 322 457
Final non-energy consumption 4 431 7 109 6 182 7 266 7 225 5 569 7 005 8 097 4 922
Final energy consumption 61 256 71 034 76 073 79 140 78 372 80 817 86 847 90 318 100 457
Industry 21 271 22 316 24 892 25 567 24 029 25 102 26 110 26 330 32 114
Transport 12 578 14 812 15 034 17 707 19 543 20 944 24 503 27 030 28 306
Other sectors 27 407 33 907 36 148 35 867 34 800 34 770 36 235 36 958 40 037
Services 4 943 9 493 9 903 11 005 10 612 11 021 12 195 12 416 13 565
Households 19 129 19 415 20 810 20 187 19 808 19 166 20 153 20 711 22 159
Europe 2020-2030 indicators 2005 2010 2011 2012 2013 2014 2015 2016 2017
Gross inland consumption 85 257 105 364 112 829 117 851 113 909 122 213 132 326 139 620 150 404
Primary energy consumption 80 826 98 255 106 647 110 585 106 684 116 644 125 321 131 523 145 482
Final energy consumption 63 663 74 702 79 372 82 981 82 121 86 064 93 092 96 405 107 125
Source: Eurostat (nrg_bal_c)
169
Turkeyktoe
Energy balance sheets — 2017 data

Source: Eurostat (nrg_bal_c)
Source: Eurostat (nrg_bal_c)
Note: Please refer to page 23 for related methodological definitions.
Turkey
170Energy balance sheets — 2017 data
0
50 000
100 000
150 000
200 000
250 000
300 000
350 000
1990 1995 2000 2005 2010 2015 2017
Gross electricity production by fuel, GWh
Solid fossil fuels Oil and petroleum products Natural gas
Renewables and biofuels Nuclear heat Other
0
10 000
20 000
30 000
40 000
50 000
60 000
1990 1995 2000 2005 2010 2015 2017
Gross available energy by fuel, ktoe
Solid fossil fuels Oil and petroleum products Natural gas
Renewables and biofuels Nuclear heat Non-renewable waste

Source: Eurostat (nrg_bal_c)
Source: Eurostat (nrg_bal_c)
Note: Please refer to page 23 for related methodological definitions.
Turkey
171Energy balance sheets — 2017 data
0
20 000
40 000
60 000
80 000
100 000
120 000
1990 1995 2000 2005 2010 2015 2017
Final energy consumption by fuel, ktoe
Solid fossil fuels Oil and petroleum products Natural gas
Renewables and biofuels Electricity Heat
Other
0
20 000
40 000
60 000
80 000
100 000
120 000
1990 1995 2000 2005 2010 2015 2017
Final consumption by sector, ktoe
Industry Transport Services Households Non-energy use

+ Primary production 4 624.0 3 611.8 Z 0.0 0.0 0.0 0.0 1 012.2 0.0 0.0 Z Z
+ Recovered & recycled products 0.0 0.0 Z 0.0 0.0 0.0 Z 0.0 Z Z Z Z
+ Imports 3 496.3 1 009.5 0.0 0.0 0.0 1 993.1 199.7 6.3 0.0 Z 0.0 287.7
- Exports 1 197.7 269.9 0.0 0.0 0.0 255.4 0.0 226.5 0.0 Z 0.0 446.0
+ Change in stock -168.2 -162.7 0.0 0.0 0.0 -5.5 0.0 0.0 0.0 Z Z Z
= Gross available energy 6 754.5 4 188.7 0.0 0.0 0.0 1 732.2 199.7 792.1 0.0 0.0 0.0 -158.3
- International maritime bunkers 0.0 0.0 0.0 0.0 0.0 0.0 0.0 0.0 Z Z Z Z
= Gross inland consumption 6 754.5 4 188.7 0.0 0.0 0.0 1 732.2 199.7 792.1 0.0 0.0 0.0 -158.3
- International aviation 10.5 Z Z Z Z 10.5 Z 0.0 Z Z Z Z
= Total energy supply 6 744.0 4 188.7 0.0 0.0 0.0 1 721.7 199.7 792.1 0.0 0.0 0.0 -158.3
Transformation input 5 916.3 4 499.2 0.0 0.0 0.0 925.2 50.3 418.7 0.0 0.0 0.0 22.9
+ Electricity & heat generation 3 864.4 3 412.8 0.0 0.0 0.0 29.8 50.3 348.7 0.0 0.0 0.0 22.9
+ Coke ovens 820.6 820.6 0.0 0.0 0.0 0.0 0.0 0.0 Z Z Z Z
+ Blast furnaces 265.9 265.9 0.0 0.0 0.0 0.0 0.0 0.0 Z Z Z Z
+ Gas works 0.0 0.0 0.0 0.0 0.0 0.0 0.0 0.0 Z Z Z Z
+ Refineries & petrochemical industry 895.4 Z Z Z Z 895.4 Z Z Z Z Z Z
+ Patent fuel plants 0.0 0.0 0.0 0.0 0.0 0.0 Z 0.0 0.0 Z Z Z
+ BKB & PB plants 0.0 0.0 0.0 0.0 0.0 Z Z 0.0 0.0 Z Z Z
+ Coal liquefaction plants 0.0 0.0 0.0 0.0 0.0 Z Z Z Z Z Z Z
+ For blended natural gas 0.0 Z 0.0 Z Z 0.0 Z 0.0 Z Z Z Z
+ Liquid biofuels blended 0.0 Z Z Z Z Z Z 0.0 Z Z Z Z
+ Charcoal production plants 70.0 Z Z Z Z Z Z 70.0 Z Z Z Z
+ Gas-to-liquids plants 0.0 Z Z Z Z Z 0.0 Z Z Z Z Z
+ Not elsewhere specified 0.0 0.0 0.0 0.0 0.0 0.0 0.0 0.0 0.0 Z Z Z
Transformation output 3 276.6 582.8 240.5 0.0 Z 873.4 0.0 28.0 Z Z 138.4 1 413.4
+ Electricity & heat generation 1 551.8 Z Z Z Z Z Z Z Z Z 138.4 1 413.4
+ Coke ovens 723.1 582.8 140.3 Z Z Z Z Z Z Z Z Z
+ Blast furnaces 100.2 0.0 100.2 Z Z Z Z Z Z Z Z Z
+ Gas works 0.0 0.0 0.0 Z Z Z Z Z Z Z Z Z
+ Refineries & petrochemical industry 873.4 Z Z Z Z 873.4 Z 0.0 Z Z Z Z
+ Patent fuel plants 0.0 0.0 Z Z Z Z Z Z Z Z Z Z
+ BKB & PB plants 0.0 0.0 Z 0.0 Z Z Z Z Z Z Z Z
+ Coal liquefaction plants 0.0 Z Z Z Z 0.0 Z Z Z Z Z Z
+ Blended in natural gas 0.0 Z Z Z Z Z 0.0 Z Z Z Z Z
+ Liquid biofuels blended 0.0 Z Z Z Z Z Z 0.0 Z Z Z Z
+ Charcoal production plants 28.0 Z Z Z Z Z Z 28.0 Z Z Z Z
+ Gas-to-liquids plants 0.0 Z Z Z Z 0.0 Z Z Z Z Z Z
+ Not elsewhere specified 0.0 0.0 0.0 0.0 Z 0.0 Z Z Z Z Z Z
Energy sector 407.9 2.8 140.3 0.0 0.0 128.9 0.0 0.0 0.0 Z 0.6 135.3
+ Own use in electricity & heat generation 105.8 0.0 0.0 0.0 0.0 2.0 0.0 0.0 0.0 Z 0.6 103.1
+ Coal mines 55.3 2.8 0.0 0.0 0.0 33.7 0.0 0.0 0.0 Z 0.0 18.8
+ Oil & natural gas extraction plants 0.0 Z Z Z Z 0.0 0.0 0.0 Z Z 0.0 0.0
+ Patent fuel plants 0.0 0.0 0.0 0.0 0.0 Z Z 0.0 0.0 Z 0.0 0.0
+ Coke ovens 143.8 0.0 140.3 0.0 0.0 0.0 0.0 0.0 0.0 Z 0.0 3.5
+ BKB & PB plants 0.0 0.0 0.0 0.0 0.0 Z Z 0.0 0.0 Z 0.0 0.0
+ Gas works 0.0 0.0 0.0 0.0 0.0 0.0 0.0 0.0 0.0 Z 0.0 0.0
+ Blast furnaces 0.0 0.0 0.0 0.0 0.0 0.0 0.0 0.0 0.0 Z 0.0 0.0
+ Petroleum refineries (oil refineries) 100.4 0.0 0.0 0.0 0.0 93.2 0.0 0.0 0.0 Z 0.0 7.2
+ Nuclear industry 0.0 Z Z Z Z Z Z Z Z Z 0.0 0.0
+ Coal liquefaction plants 0.0 0.0 0.0 0.0 0.0 Z Z Z Z Z 0.0 0.0
+ Liquefaction & regasification plants (LNG) 0.0 Z Z Z Z Z 0.0 Z Z Z 0.0 0.0
+ Gasification plants for biogas 0.0 Z Z Z Z Z Z 0.0 0.0 Z 0.0 0.0
+ Gas-to-liquids (GTL) plants 0.0 Z Z Z Z Z 0.0 Z Z Z 0.0 0.0
+ Charcoal production plants 0.0 Z Z Z Z Z Z 0.0 0.0 Z 0.0 0.0
+ Not elsewhere specified (energy) 2.6 0.0 0.0 0.0 0.0 0.0 0.0 0.0 0.0 Z 0.0 2.6
Distribution losses 131.4 4.6 0.0 0.0 0.0 0.0 0.5 0.0 0.0 Z 10.5 115.8
Available for final consumption 3 565.1 264.9 100.2 0.0 0.0 1 541.1 149.0 401.4 0.0 0.0 127.3 981.2
Final non-energy consumption 63.4 0.0 0.0 0.0 0.0 63.4 0.0 0.0 Z Z Z Z
Final energy consumption 3 498.2 264.9 100.2 0.0 0.0 1 475.3 149.0 401.4 0.0 Z 127.3 980.1
+ Industry 829.1 115.1 100.2 0.0 0.0 136.9 85.6 17.2 0.0 Z 0.5 373.5
+ Iron & steel 188.2 0.0 100.2 0.0 0.0 0.0 17.5 0.0 0.0 Z 0.0 70.5
+ Chemical & petrochemical 16.0 0.0 0.0 0.0 0.0 3.1 1.2 0.0 0.0 Z 0.0 11.7
+ Non-ferrous metals 240.3 34.6 0.0 0.0 0.0 1.1 55.9 0.0 0.0 Z 0.0 148.6
+ Non-metallic minerals 99.2 72.1 0.0 0.0 0.0 11.4 1.2 0.0 0.0 Z 0.0 14.4
+ Transport equipment 6.9 0.0 0.0 0.0 0.0 2.2 0.2 0.0 0.0 Z 0.0 4.6
+ Machinery 34.1 1.5 0.0 0.0 0.0 7.3 0.2 0.0 0.0 Z 0.1 24.9
+ Mining & quarrying 35.3 0.8 0.0 0.0 0.0 26.5 0.0 0.0 0.0 Z 0.2 7.9
+ Food, beverages & tobacco 57.7 4.6 0.0 0.0 0.0 23.5 6.8 0.0 0.0 Z 0.0 22.7
+ Paper, pulp & printing 34.8 0.0 0.0 0.0 0.0 14.6 0.5 0.0 0.0 Z 0.0 19.7
+ Wood & wood products 23.4 0.0 0.0 0.0 0.0 7.1 0.8 0.0 0.0 Z 0.1 15.4
+ Construction 39.1 0.0 0.0 0.0 0.0 33.7 0.0 0.0 0.0 Z 0.0 5.4
+ Textile & leather 21.7 1.3 0.0 0.0 0.0 4.2 1.2 0.0 0.0 Z 0.0 15.0
+ Not elsewhere specified (industry) 32.4 0.3 0.0 0.0 0.0 2.1 0.1 17.2 0.0 Z 0.0 12.7
+ Transport 1 248.9 0.0 0.0 0.0 0.0 1 241.3 1.1 0.0 0.0 Z Z 6.5
+ Rail 6.5 0.0 0.0 0.0 0.0 0.0 Z 0.0 0.0 Z Z 6.5
+ Road 1 242.4 Z Z Z Z 1 241.3 1.1 0.0 0.0 Z Z 0.0
+ Domestic aviation 0.0 Z Z Z Z 0.0 Z 0.0 Z Z Z Z
+ Domestic navigation 0.0 0.0 0.0 0.0 0.0 0.0 Z 0.0 0.0 Z Z Z
+ Pipeline transport 0.0 Z Z Z Z 0.0 0.0 0.0 Z Z Z 0.0
+ Not elsewhere specified (transport) 0.0 0.0 0.0 0.0 0.0 0.0 0.0 0.0 0.0 Z Z 0.0
+ Other 1 420.2 149.8 0.0 0.0 0.0 97.2 62.3 384.2 0.0 Z 126.8 600.0
+ Commercial & public services 355.7 45.1 0.0 0.0 0.0 38.0 24.5 29.8 0.0 Z 31.3 186.9
+ Households 1 045.7 104.4 0.0 0.0 0.0 44.8 37.8 354.4 0.0 Z 95.5 408.9
+ Agriculture & forestry 18.8 0.3 0.0 0.0 0.0 14.4 0.0 0.0 0.0 Z 0.0 4.1
+ Fishing 0.0 0.0 0.0 0.0 0.0 0.0 0.0 0.0 0.0 Z 0.0 0.0
+ Not elsewhere specified (other) 0.0 0.0 0.0 0.0 0.0 0.0 0.0 0.0 0.0 Z 0.0 0.0
Statistical differences 3.5 0.0 0.0 0.0 0.0 2.4 0.0 -0.0 0.0 0.0 0.0 1.1
Gross electricity production 1 413.4 1 061.0 0.0 0.0 0.0 5.3 2.0 345.1 0.0 0.0 Z Z
Gross heat production 138.4 71.6 0.0 0.0 0.0 12.3 38.5 16.1 0.0 0.0 Z 0.0
Source: Eurostat (nrg_bal_c)
172Energy balance sheets — 2017 data
Electricity
ktoe 2017
Oil and
petroleum
products
Natural
gas
Renewables
and
biofuels
Non-
renewable
waste
Nuclear
heatHeat
Bosnia and HerzegovinaTotal
Solid
fossil
fuels
Manufac-
tured
gases
Peat and
peat
products
Oil shale
and oil
sands

2005 2010 2011 2012 2013 2014 2015 2016 2017
Gross available energy 0 0 0 0 0 6 003 6 183 6 767 6 754
Solid fossil fuels 0 0 0 0 0 3 658 3 615 4 112 4 189
Peat & peat products 0 0 0 0 0 0 0 0 0
Oil shale & oil sands 0 0 0 0 0 0 0 0 0
Crude oil & other hydrocarbons 0 0 0 0 0 1 027 944 869 895
Petroleum products 0 0 0 0 0 452 588 872 837
Natural gas 0 0 0 0 0 152 177 185 200
Nuclear heat 0 0 0 0 0 0 0 0 0
Renewable energies 0 0 0 0 0 958 1 041 1 053 792
Non-renewable wastes 0 0 0 0 0 0 0 0 0
Primary production 0 0 0 0 0 4 306 4 367 4 742 4 624
Solid fossil fuels 0 0 0 0 0 3 073 3 165 3 520 3 612
Peat 0 0 0 0 0 0 0 0 0
Oil shale and oil sands 0 0 0 0 0 0 0 0 0
Crude oil & other hydrocarbons 0 0 0 0 0 0 0 0 0
Natural gas 0 0 0 0 0 0 0 0 0
Nuclear heat 0 0 0 0 0 0 0 0 0
Renewable energies 0 0 0 0 0 1 232 1 202 1 221 1 012
Non-renewable wastes 0 0 0 0 0 0 0 0 0
Net imports 0 0 0 0 0 1 693 2 083 2 133 2 299
Solid fossil fuels 0 0 0 0 0 631 645 614 740
Crude oil 0 0 0 0 0 970 946 947 873
Gas/Diesel Oil (w/o bio) 0 0 0 0 0 539 606 810 812
Motor Gasoline (w/o bio) 0 0 0 0 0 43 76 56 62
Naphtha 0 0 0 0 0 -7 -11 -7 -7
LPG 0 0 0 0 0 48 50 71 85
All other oil & petroleum products 0 0 0 0 0 -164 -62 -52 -87
Natural gas 0 0 0 0 0 152 177 185 200
Transformation input 0 0 0 0 0 5 700 5 554 5 964 5 916
Electricity & heat generation 0 0 0 0 0 3 437 3 384 3 912 3 864
Refinery intake 0 0 0 0 0 1 027 944 869 895
Coke ovens 0 0 0 0 0 878 865 823 821
Blast furnaces 0 0 0 0 0 277 279 277 266
Transformation output 0 0 0 0 0 3 513 3 410 3 383 3 277
Electricity & heat generation 0 0 0 0 0 1 599 1 571 1 663 1 552
Refinery output 0 0 0 0 0 997 927 836 873
Coke ovens 0 0 0 0 0 781 776 747 723
Blast furnaces 0 0 0 0 0 104 105 105 100
Energy sector 0 0 0 0 0 430 426 424 408
Distribution losses 0 0 0 0 0 123 129 128 131
Available for final consumption 0 0 0 0 0 3 258 3 478 3 623 3 565
Solid fossil fuels 0 0 0 0 0 270 281 276 265
Manufactured gases 0 0 0 0 0 104 105 105 100
Peat & peat products 0 0 0 0 0 0 0 0 0
Oil shale & oil sands 0 0 0 0 0 0 0 0 0
Gas/Diesel Oil (w/o bio) 0 0 0 0 0 907 958 1 128 1 137
Motor Gasoline (w/o bio) 0 0 0 0 0 201 205 213 202
Naphtha 0 0 0 0 0 0 0 0 0
LPG 0 0 0 0 0 67 68 84 103
All other oil & petroleum products 0 0 0 0 0 91 92 104 98
Natural gas 0 0 0 0 0 111 132 136 149
Primary solid biofuels & charcoal 0 0 0 0 0 381 487 482 390
Liquid biofuels 0 0 0 0 0 0 0 0 0
All other renewable energies 0 0 0 0 0 13 14 15 11
Non-renewable wastes 0 0 0 0 0 0 0 0 0
Electricity 0 0 0 0 0 985 987 953 981
Heat 0 0 0 0 0 126 147 126 127
Statistical difference 0 0 0 0 0 88 92 3 3
Final non-energy consumption 0 0 0 0 0 66 69 76 63
Final energy consumption 0 0 0 0 0 3 104 3 317 3 544 3 498
Industry 0 0 0 0 0 717 757 754 829
Transport 0 0 0 0 0 989 1 031 1 197 1 249
Other sectors 0 0 0 0 0 1 397 1 529 1 593 1 420
Services 0 0 0 0 0 164 358 435 356
Households 0 0 0 0 0 981 1 113 1 139 1 046
Europe 2020-2030 indicators 2005 2010 2011 2012 2013 2014 2015 2016 2017
Gross inland consumption 0 0 0 0 0 6 003 6 183 6 767 6 754
Primary energy consumption 0 0 0 0 0 5 936 6 114 6 691 6 691
Final energy consumption 0 0 0 0 0 3 280 3 497 3 727 3 674
Source: Eurostat (nrg_bal_c)
173
Bosnia and Herzegovinaktoe
Energy balance sheets — 2017 data

Source: Eurostat (nrg_bal_c)
Source: Eurostat (nrg_bal_c)
Note: Please refer to page 23 for related methodological definitions.
Bosnia and Herzegovina
174Energy balance sheets — 2017 data
0
2 000
4 000
6 000
8 000
10 000
12 000
14 000
16 000
18 000
20 000
1990 1995 2000 2005 2010 2015 2017
Gross electricity production by fuel, GWh
Solid fossil fuels Oil and petroleum products Natural gas
Renewables and biofuels Nuclear heat Other
0
500
1 000
1 500
2 000
2 500
3 000
3 500
4 000
4 500
1990 1995 2000 2005 2010 2015 2017
Gross available energy by fuel, ktoe
Solid fossil fuels Oil and petroleum products Natural gas
Renewables and biofuels Nuclear heat Non-renewable waste

Source: Eurostat (nrg_bal_c)
Source: Eurostat (nrg_bal_c)
Note: Please refer to page 23 for related methodological definitions.
Bosnia and Herzegovina
175Energy balance sheets — 2017 data
0
500
1 000
1 500
2 000
2 500
3 000
3 500
4 000
1990 1995 2000 2005 2010 2015 2017
Final energy consumption by fuel, ktoe
Solid fossil fuels Oil and petroleum products Natural gas
Renewables and biofuels Electricity Heat
Other
0
500
1 000
1 500
2 000
2 500
3 000
3 500
4 000
1990 1995 2000 2005 2010 2015 2017
Final consumption by sector, ktoe
Industry Transport Services Households Non-energy use
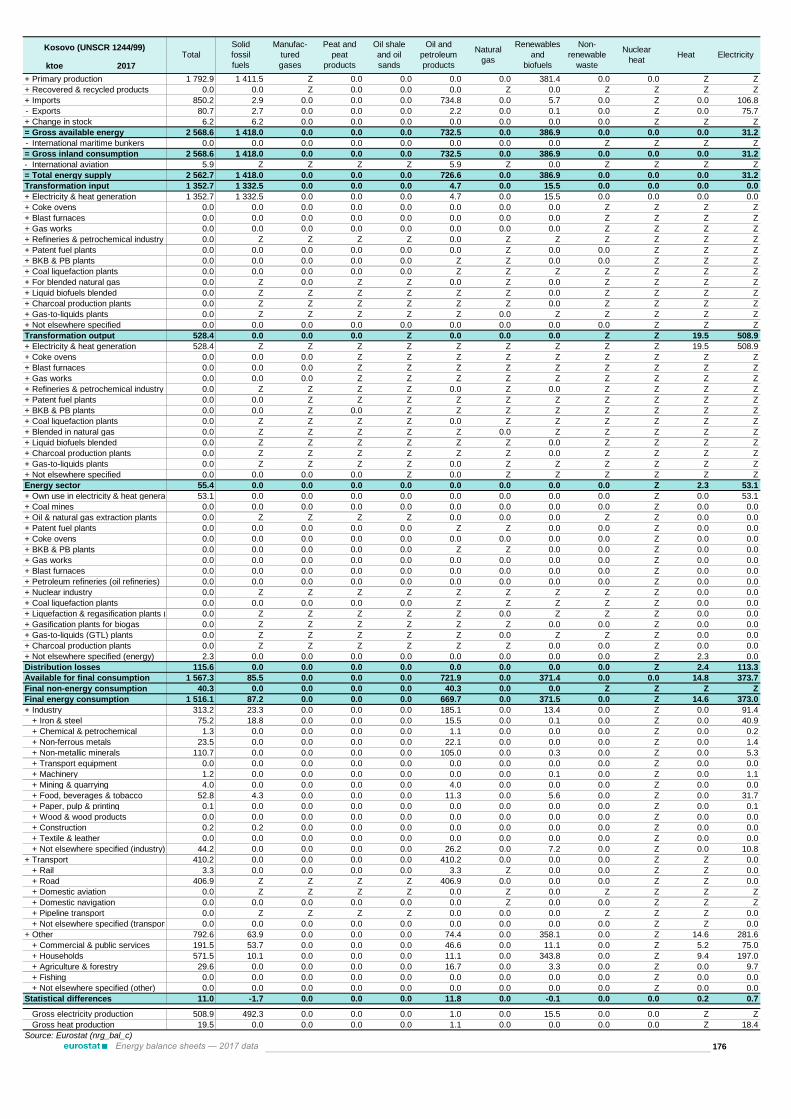
+ Primary production 1 792.9 1 411.5 Z 0.0 0.0 0.0 0.0 381.4 0.0 0.0 Z Z
+ Recovered & recycled products 0.0 0.0 Z 0.0 0.0 0.0 Z 0.0 Z Z Z Z
+ Imports 850.2 2.9 0.0 0.0 0.0 734.8 0.0 5.7 0.0 Z 0.0 106.8
- Exports 80.7 2.7 0.0 0.0 0.0 2.2 0.0 0.1 0.0 Z 0.0 75.7
+ Change in stock 6.2 6.2 0.0 0.0 0.0 0.0 0.0 0.0 0.0 Z Z Z
= Gross available energy 2 568.6 1 418.0 0.0 0.0 0.0 732.5 0.0 386.9 0.0 0.0 0.0 31.2
- International maritime bunkers 0.0 0.0 0.0 0.0 0.0 0.0 0.0 0.0 Z Z Z Z
= Gross inland consumption 2 568.6 1 418.0 0.0 0.0 0.0 732.5 0.0 386.9 0.0 0.0 0.0 31.2
- International aviation 5.9 Z Z Z Z 5.9 Z 0.0 Z Z Z Z
= Total energy supply 2 562.7 1 418.0 0.0 0.0 0.0 726.6 0.0 386.9 0.0 0.0 0.0 31.2
Transformation input 1 352.7 1 332.5 0.0 0.0 0.0 4.7 0.0 15.5 0.0 0.0 0.0 0.0
+ Electricity & heat generation 1 352.7 1 332.5 0.0 0.0 0.0 4.7 0.0 15.5 0.0 0.0 0.0 0.0
+ Coke ovens 0.0 0.0 0.0 0.0 0.0 0.0 0.0 0.0 Z Z Z Z
+ Blast furnaces 0.0 0.0 0.0 0.0 0.0 0.0 0.0 0.0 Z Z Z Z
+ Gas works 0.0 0.0 0.0 0.0 0.0 0.0 0.0 0.0 Z Z Z Z
+ Refineries & petrochemical industry 0.0 Z Z Z Z 0.0 Z Z Z Z Z Z
+ Patent fuel plants 0.0 0.0 0.0 0.0 0.0 0.0 Z 0.0 0.0 Z Z Z
+ BKB & PB plants 0.0 0.0 0.0 0.0 0.0 Z Z 0.0 0.0 Z Z Z
+ Coal liquefaction plants 0.0 0.0 0.0 0.0 0.0 Z Z Z Z Z Z Z
+ For blended natural gas 0.0 Z 0.0 Z Z 0.0 Z 0.0 Z Z Z Z
+ Liquid biofuels blended 0.0 Z Z Z Z Z Z 0.0 Z Z Z Z
+ Charcoal production plants 0.0 Z Z Z Z Z Z 0.0 Z Z Z Z
+ Gas-to-liquids plants 0.0 Z Z Z Z Z 0.0 Z Z Z Z Z
+ Not elsewhere specified 0.0 0.0 0.0 0.0 0.0 0.0 0.0 0.0 0.0 Z Z Z
Transformation output 528.4 0.0 0.0 0.0 Z 0.0 0.0 0.0 Z Z 19.5 508.9
+ Electricity & heat generation 528.4 Z Z Z Z Z Z Z Z Z 19.5 508.9
+ Coke ovens 0.0 0.0 0.0 Z Z Z Z Z Z Z Z Z
+ Blast furnaces 0.0 0.0 0.0 Z Z Z Z Z Z Z Z Z
+ Gas works 0.0 0.0 0.0 Z Z Z Z Z Z Z Z Z
+ Refineries & petrochemical industry 0.0 Z Z Z Z 0.0 Z 0.0 Z Z Z Z
+ Patent fuel plants 0.0 0.0 Z Z Z Z Z Z Z Z Z Z
+ BKB & PB plants 0.0 0.0 Z 0.0 Z Z Z Z Z Z Z Z
+ Coal liquefaction plants 0.0 Z Z Z Z 0.0 Z Z Z Z Z Z
+ Blended in natural gas 0.0 Z Z Z Z Z 0.0 Z Z Z Z Z
+ Liquid biofuels blended 0.0 Z Z Z Z Z Z 0.0 Z Z Z Z
+ Charcoal production plants 0.0 Z Z Z Z Z Z 0.0 Z Z Z Z
+ Gas-to-liquids plants 0.0 Z Z Z Z 0.0 Z Z Z Z Z Z
+ Not elsewhere specified 0.0 0.0 0.0 0.0 Z 0.0 Z Z Z Z Z Z
Energy sector 55.4 0.0 0.0 0.0 0.0 0.0 0.0 0.0 0.0 Z 2.3 53.1
+ Own use in electricity & heat generation 53.1 0.0 0.0 0.0 0.0 0.0 0.0 0.0 0.0 Z 0.0 53.1
+ Coal mines 0.0 0.0 0.0 0.0 0.0 0.0 0.0 0.0 0.0 Z 0.0 0.0
+ Oil & natural gas extraction plants 0.0 Z Z Z Z 0.0 0.0 0.0 Z Z 0.0 0.0
+ Patent fuel plants 0.0 0.0 0.0 0.0 0.0 Z Z 0.0 0.0 Z 0.0 0.0
+ Coke ovens 0.0 0.0 0.0 0.0 0.0 0.0 0.0 0.0 0.0 Z 0.0 0.0
+ BKB & PB plants 0.0 0.0 0.0 0.0 0.0 Z Z 0.0 0.0 Z 0.0 0.0
+ Gas works 0.0 0.0 0.0 0.0 0.0 0.0 0.0 0.0 0.0 Z 0.0 0.0
+ Blast furnaces 0.0 0.0 0.0 0.0 0.0 0.0 0.0 0.0 0.0 Z 0.0 0.0
+ Petroleum refineries (oil refineries) 0.0 0.0 0.0 0.0 0.0 0.0 0.0 0.0 0.0 Z 0.0 0.0
+ Nuclear industry 0.0 Z Z Z Z Z Z Z Z Z 0.0 0.0
+ Coal liquefaction plants 0.0 0.0 0.0 0.0 0.0 Z Z Z Z Z 0.0 0.0
+ Liquefaction & regasification plants (LNG) 0.0 Z Z Z Z Z 0.0 Z Z Z 0.0 0.0
+ Gasification plants for biogas 0.0 Z Z Z Z Z Z 0.0 0.0 Z 0.0 0.0
+ Gas-to-liquids (GTL) plants 0.0 Z Z Z Z Z 0.0 Z Z Z 0.0 0.0
+ Charcoal production plants 0.0 Z Z Z Z Z Z 0.0 0.0 Z 0.0 0.0
+ Not elsewhere specified (energy) 2.3 0.0 0.0 0.0 0.0 0.0 0.0 0.0 0.0 Z 2.3 0.0
Distribution losses 115.6 0.0 0.0 0.0 0.0 0.0 0.0 0.0 0.0 Z 2.4 113.3
Available for final consumption 1 567.3 85.5 0.0 0.0 0.0 721.9 0.0 371.4 0.0 0.0 14.8 373.7
Final non-energy consumption 40.3 0.0 0.0 0.0 0.0 40.3 0.0 0.0 Z Z Z Z
Final energy consumption 1 516.1 87.2 0.0 0.0 0.0 669.7 0.0 371.5 0.0 Z 14.6 373.0
+ Industry 313.2 23.3 0.0 0.0 0.0 185.1 0.0 13.4 0.0 Z 0.0 91.4
+ Iron & steel 75.2 18.8 0.0 0.0 0.0 15.5 0.0 0.1 0.0 Z 0.0 40.9
+ Chemical & petrochemical 1.3 0.0 0.0 0.0 0.0 1.1 0.0 0.0 0.0 Z 0.0 0.2
+ Non-ferrous metals 23.5 0.0 0.0 0.0 0.0 22.1 0.0 0.0 0.0 Z 0.0 1.4
+ Non-metallic minerals 110.7 0.0 0.0 0.0 0.0 105.0 0.0 0.3 0.0 Z 0.0 5.3
+ Transport equipment 0.0 0.0 0.0 0.0 0.0 0.0 0.0 0.0 0.0 Z 0.0 0.0
+ Machinery 1.2 0.0 0.0 0.0 0.0 0.0 0.0 0.1 0.0 Z 0.0 1.1
+ Mining & quarrying 4.0 0.0 0.0 0.0 0.0 4.0 0.0 0.0 0.0 Z 0.0 0.0
+ Food, beverages & tobacco 52.8 4.3 0.0 0.0 0.0 11.3 0.0 5.6 0.0 Z 0.0 31.7
+ Paper, pulp & printing 0.1 0.0 0.0 0.0 0.0 0.0 0.0 0.0 0.0 Z 0.0 0.1
+ Wood & wood products 0.0 0.0 0.0 0.0 0.0 0.0 0.0 0.0 0.0 Z 0.0 0.0
+ Construction 0.2 0.2 0.0 0.0 0.0 0.0 0.0 0.0 0.0 Z 0.0 0.0
+ Textile & leather 0.0 0.0 0.0 0.0 0.0 0.0 0.0 0.0 0.0 Z 0.0 0.0
+ Not elsewhere specified (industry) 44.2 0.0 0.0 0.0 0.0 26.2 0.0 7.2 0.0 Z 0.0 10.8
+ Transport 410.2 0.0 0.0 0.0 0.0 410.2 0.0 0.0 0.0 Z Z 0.0
+ Rail 3.3 0.0 0.0 0.0 0.0 3.3 Z 0.0 0.0 Z Z 0.0
+ Road 406.9 Z Z Z Z 406.9 0.0 0.0 0.0 Z Z 0.0
+ Domestic aviation 0.0 Z Z Z Z 0.0 Z 0.0 Z Z Z Z
+ Domestic navigation 0.0 0.0 0.0 0.0 0.0 0.0 Z 0.0 0.0 Z Z Z
+ Pipeline transport 0.0 Z Z Z Z 0.0 0.0 0.0 Z Z Z 0.0
+ Not elsewhere specified (transport) 0.0 0.0 0.0 0.0 0.0 0.0 0.0 0.0 0.0 Z Z 0.0
+ Other 792.6 63.9 0.0 0.0 0.0 74.4 0.0 358.1 0.0 Z 14.6 281.6
+ Commercial & public services 191.5 53.7 0.0 0.0 0.0 46.6 0.0 11.1 0.0 Z 5.2 75.0
+ Households 571.5 10.1 0.0 0.0 0.0 11.1 0.0 343.8 0.0 Z 9.4 197.0
+ Agriculture & forestry 29.6 0.0 0.0 0.0 0.0 16.7 0.0 3.3 0.0 Z 0.0 9.7
+ Fishing 0.0 0.0 0.0 0.0 0.0 0.0 0.0 0.0 0.0 Z 0.0 0.0
+ Not elsewhere specified (other) 0.0 0.0 0.0 0.0 0.0 0.0 0.0 0.0 0.0 Z 0.0 0.0
Statistical differences 11.0 -1.7 0.0 0.0 0.0 11.8 0.0 -0.1 0.0 0.0 0.2 0.7
Gross electricity production 508.9 492.3 0.0 0.0 0.0 1.0 0.0 15.5 0.0 0.0 Z Z
Gross heat production 19.5 0.0 0.0 0.0 0.0 1.1 0.0 0.0 0.0 0.0 Z 18.4
Source: Eurostat (nrg_bal_c)
176Energy balance sheets — 2017 data
Electricity
ktoe 2017
Oil and
petroleum
products
Natural
gas
Renewables
and
biofuels
Non-
renewable
waste
Nuclear
heatHeat
Kosovo (UNSCR 1244/99)Total
Solid
fossil
fuels
Manufac-
tured
gases
Peat and
peat
products
Oil shale
and oil
sands

2005 2010 2011 2012 2013 2014 2015 2016 2017
Gross available energy 1 950 2 517 2 541 2 384 2 312 2 217 2 524 2 704 2 569
Solid fossil fuels 1 242 1 675 1 623 1 532 1 556 1 355 1 558 1 688 1 418
Peat & peat products 0 0 0 0 0 0 0 0 0
Oil shale & oil sands 0 0 0 0 0 0 0 0 0
Crude oil & other hydrocarbons 0 0 0 0 0 0 0 0 0
Petroleum products 459 552 631 582 526 555 680 672 733
Natural gas 0 0 0 0 0 0 0 0 0
Nuclear heat 0 0 0 0 0 0 0 0 0
Renewable energies 226 250 251 256 260 265 276 387 387
Non-renewable wastes 0 0 0 0 0 0 0 0 0
Primary production 1 398 1 861 1 795 1 749 1 792 1 605 1 804 2 016 1 793
Solid fossil fuels 1 221 1 612 1 545 1 496 1 532 1 342 1 536 1 640 1 412
Peat 0 0 0 0 0 0 0 0 0
Oil shale and oil sands 0 0 0 0 0 0 0 0 0
Crude oil & other hydrocarbons 0 0 0 0 0 0 0 0 0
Natural gas 0 0 0 0 0 0 0 0 0
Nuclear heat 0 0 0 0 0 0 0 0 0
Renewable energies 176 249 250 253 261 263 268 375 381
Non-renewable wastes 0 0 0 0 0 0 0 0 0
Net imports 550 619 699 650 505 603 697 638 769
Solid fossil fuels 19 26 31 51 9 3 -2 -2 0
Crude oil 0 0 0 0 0 0 0 0 0
Gas/Diesel Oil (w/o bio) 245 292 312 319 261 340 399 440 467
Motor Gasoline (w/o bio) 75 83 79 72 68 70 70 73 67
Naphtha 0 0 0 0 0 0 0 0 0
LPG 41 50 51 47 40 34 38 38 36
All other oil & petroleum products 97 127 189 144 158 111 172 121 163
Natural gas 0 0 0 0 0 0 0 0 0
Transformation input 1 226 1 624 1 588 1 482 1 531 1 328 1 535 1 615 1 353
Electricity & heat generation 1 226 1 624 1 562 1 482 1 531 1 328 1 535 1 615 1 353
Refinery intake 0 0 13 0 0 0 0 0 0
Coke ovens 0 0 0 0 0 0 0 0 0
Blast furnaces 0 0 0 0 0 0 0 0 0
Transformation output 393 450 526 516 566 473 540 533 528
Electricity & heat generation 393 450 503 516 566 473 540 533 528
Refinery output 0 0 10 0 0 0 0 0 0
Coke ovens 0 0 0 0 0 0 0 0 0
Blast furnaces 0 0 0 0 0 0 0 0 0
Energy sector 40 52 64 63 58 38 55 39 55
Distribution losses 91 81 82 81 76 71 88 104 116
Available for final consumption 985 1 197 1 321 1 259 1 197 1 251 1 382 1 475 1 567
Solid fossil fuels 45 77 83 70 47 51 40 100 86
Manufactured gases 0 0 0 0 0 0 0 0 0
Peat & peat products 0 0 0 0 0 0 0 0 0
Oil shale & oil sands 0 0 0 0 0 0 0 0 0
Gas/Diesel Oil (w/o bio) 241 290 307 315 259 338 397 437 465
Motor Gasoline (w/o bio) 75 83 79 72 68 70 70 73 67
Naphtha 0 0 0 0 0 0 0 0 0
LPG 41 50 51 47 40 34 38 38 36
All other oil & petroleum products 81 104 162 119 133 101 164 113 154
Natural gas 0 0 0 0 0 0 0 0 0
Primary solid biofuels & charcoal 216 236 242 247 248 251 263 366 371
Liquid biofuels 0 0 0 0 0 0 0 0 0
All other renewable energies 0 0 0 0 0 0 0 0 0
Non-renewable wastes 0 0 0 0 0 0 0 0 0
Electricity 279 353 394 385 399 402 398 333 374
Heat 6 4 3 3 4 4 10 14 15
Statistical difference 0 -1 4 0 -13 -13 -7 1 11
Final non-energy consumption 7 7 51 39 43 34 48 41 40
Final energy consumption 978 1 191 1 266 1 219 1 168 1 231 1 340 1 433 1 516
Industry 189 278 308 274 263 245 307 281 313
Transport 271 320 331 333 270 344 380 396 410
Other sectors 519 594 628 612 634 641 652 756 793
Services 137 112 118 118 115 139 148 177 192
Households 345 462 491 474 494 480 476 549 571
Europe 2020-2030 indicators 2005 2010 2011 2012 2013 2014 2015 2016 2017
Gross inland consumption 1 950 2 517 2 541 2 384 2 312 2 217 2 524 2 704 2 569
Primary energy consumption 1 943 2 510 2 490 2 345 2 270 2 184 2 476 2 662 2 528
Final energy consumption 978 1 203 1 279 1 234 1 184 1 233 1 344 1 437 1 522
Source: Eurostat (nrg_bal_c)
177
Kosovo (UNSCR 1244/99)ktoe
Energy balance sheets — 2017 data

Source: Eurostat (nrg_bal_c)
Source: Eurostat (nrg_bal_c)
Note: Please refer to page 23 for related methodological definitions.
Kosovo (UNSCR 1244/99)
178Energy balance sheets — 2017 data
0
1 000
2 000
3 000
4 000
5 000
6 000
7 000
1990 1995 2000 2005 2010 2015 2017
Gross electricity production by fuel, GWh
Solid fossil fuels Oil and petroleum products Natural gas
Renewables and biofuels Nuclear heat Other
0
200
400
600
800
1 000
1 200
1 400
1 600
1 800
1990 1995 2000 2005 2010 2015 2017
Gross available energy by fuel, ktoe
Solid fossil fuels Oil and petroleum products Natural gas
Renewables and biofuels Nuclear heat Non-renewable waste

Source: Eurostat (nrg_bal_c)
Source: Eurostat (nrg_bal_c)
Note: Please refer to page 23 for related methodological definitions.
Kosovo (UNSCR 1244/99)
179Energy balance sheets — 2017 data
0
200
400
600
800
1 000
1 200
1 400
1 600
1990 1995 2000 2005 2010 2015 2017
Final energy consumption by fuel, ktoe
Solid fossil fuels Oil and petroleum products Natural gas
Renewables and biofuels Electricity Heat
Other
0
200
400
600
800
1 000
1 200
1 400
1 600
1 800
1990 1995 2000 2005 2010 2015 2017
Final consumption by sector, ktoe
Industry Transport Services Households Non-energy use

+ Primary production 58 380.9 13 516.6 Z 120.0 0.0 2 208.2 15 471.6 4 476.5 59.9 22 528.2 Z Z
+ Recovered & recycled products 0.0 0.0 Z 0.0 0.0 0.0 Z 0.0 Z Z Z Z
+ Imports 35 058.7 12 988.6 0.0 4.2 0.0 10 799.2 11 262.4 0.0 0.0 Z 0.0 4.3
- Exports 1 933.7 560.6 0.0 6.7 0.0 380.1 0.0 537.0 0.0 Z 0.0 449.4
+ Change in stock -2 309.8 -367.5 0.0 1.8 0.0 266.1 -2 180.2 -30.0 0.0 Z Z Z
= Gross available energy 89 196.1 25 577.1 0.0 119.3 0.0 12 893.4 24 553.7 3 909.5 59.9 22 528.2 0.0 -445.1
- International maritime bunkers 0.0 0.0 0.0 0.0 0.0 0.0 0.0 0.0 Z Z Z Z
= Gross inland consumption 89 196.1 25 577.1 0.0 119.3 0.0 12 893.4 24 553.7 3 909.5 59.9 22 528.2 0.0 -445.1
- International aviation 251.3 Z Z Z Z 251.3 Z 0.0 Z Z Z Z
= Total energy supply 88 944.8 25 577.1 0.0 119.3 0.0 12 642.2 24 553.7 3 909.5 59.9 22 528.2 0.0 -445.1
Transformation input 67 820.4 28 715.1 1 380.4 144.6 0.0 4 563.4 7 926.8 2 274.0 2.5 22 528.2 150.1 135.4
+ Electricity & heat generation 47 877.3 13 385.7 1 380.4 42.6 0.0 580.6 7 926.8 1 745.0 2.5 22 528.2 150.1 135.4
+ Coke ovens 9 972.8 9 972.8 0.0 0.0 0.0 0.0 0.0 0.0 Z Z Z Z
+ Blast furnaces 5 212.3 5 212.3 0.0 0.0 0.0 0.0 0.0 0.0 Z Z Z Z
+ Gas works 35.4 35.4 0.0 0.0 0.0 0.0 0.0 0.0 Z Z Z Z
+ Refineries & petrochemical industry 3 982.8 Z Z Z Z 3 982.8 Z Z Z Z Z Z
+ Patent fuel plants 0.0 0.0 0.0 0.0 0.0 0.0 Z 0.0 0.0 Z Z Z
+ BKB & PB plants 102.0 0.0 0.0 102.0 0.0 Z Z 0.0 0.0 Z Z Z
+ Coal liquefaction plants 0.0 0.0 0.0 0.0 0.0 Z Z Z Z Z Z Z
+ For blended natural gas 0.0 Z 0.0 Z Z 0.0 Z 0.0 Z Z Z Z
+ Liquid biofuels blended 45.3 Z Z Z Z Z Z 45.3 Z Z Z Z
+ Charcoal production plants 483.7 Z Z Z Z Z Z 483.7 Z Z Z Z
+ Gas-to-liquids plants 0.0 Z Z Z Z Z 0.0 Z Z Z Z Z
+ Not elsewhere specified 108.9 108.9 0.0 0.0 0.0 0.0 0.0 0.0 0.0 Z Z Z
Transformation output 37 391.7 6 600.4 4 035.7 98.4 Z 3 372.3 0.0 199.4 Z Z 9 668.9 13 416.6
+ Electricity & heat generation 23 085.5 Z Z Z Z Z Z Z Z Z 9 668.9 13 416.6
+ Coke ovens 8 349.7 6 600.4 1 749.2 Z Z Z Z Z Z Z Z Z
+ Blast furnaces 2 286.4 0.0 2 286.4 Z Z Z Z Z Z Z Z Z
+ Gas works 0.0 0.0 0.0 Z Z Z Z Z Z Z Z Z
+ Refineries & petrochemical industry 3 350.0 Z Z Z Z 3 350.0 Z 0.0 Z Z Z Z
+ Patent fuel plants 0.0 0.0 Z Z Z Z Z Z Z Z Z Z
+ BKB & PB plants 98.4 0.0 Z 98.4 Z Z Z Z Z Z Z Z
+ Coal liquefaction plants 0.0 Z Z Z Z 0.0 Z Z Z Z Z Z
+ Blended in natural gas 0.0 Z Z Z Z Z 0.0 Z Z Z Z Z
+ Liquid biofuels blended 46.5 Z Z Z Z Z Z 46.5 Z Z Z Z
+ Charcoal production plants 152.9 Z Z Z Z Z Z 152.9 Z Z Z Z
+ Gas-to-liquids plants 0.0 Z Z Z Z 0.0 Z Z Z Z Z Z
+ Not elsewhere specified 22.3 0.0 0.0 0.0 Z 22.3 Z Z Z Z Z Z
Energy sector 3 836.4 70.4 415.9 3.7 0.0 53.4 959.3 0.0 0.0 Z 1 032.6 1 301.2
+ Own use in electricity & heat generation 1 580.0 64.1 0.0 0.0 0.0 2.9 12.8 0.0 0.0 Z 543.3 957.0
+ Coal mines 263.1 6.3 0.0 0.0 0.0 2.0 0.0 0.0 0.0 Z 79.1 175.8
+ Oil & natural gas extraction plants 690.8 Z Z Z Z 9.0 575.9 0.0 Z Z 51.7 54.2
+ Patent fuel plants 0.0 0.0 0.0 0.0 0.0 Z Z 0.0 0.0 Z 0.0 0.0
+ Coke ovens 531.6 0.0 264.7 0.0 0.0 1.0 0.0 0.0 0.0 Z 231.0 34.9
+ BKB & PB plants 3.7 0.0 0.0 3.7 0.0 Z Z 0.0 0.0 Z 0.0 0.0
+ Gas works 316.8 0.0 0.0 0.0 0.0 0.0 301.8 0.0 0.0 Z 11.3 3.7
+ Blast furnaces 151.2 0.0 151.2 0.0 0.0 0.0 0.0 0.0 0.0 Z 0.0 0.0
+ Petroleum refineries (oil refineries) 191.9 0.0 0.0 0.0 0.0 37.5 0.0 0.0 0.0 Z 116.2 38.3
+ Nuclear industry 0.0 Z Z Z Z Z Z Z Z Z 0.0 0.0
+ Coal liquefaction plants 0.0 0.0 0.0 0.0 0.0 Z Z Z Z Z 0.0 0.0
+ Liquefaction & regasification plants (LNG) 0.0 Z Z Z Z Z 0.0 Z Z Z 0.0 0.0
+ Gasification plants for biogas 0.0 Z Z Z Z Z Z 0.0 0.0 Z 0.0 0.0
+ Gas-to-liquids (GTL) plants 0.0 Z Z Z Z Z 0.0 Z Z Z 0.0 0.0
+ Charcoal production plants 0.0 Z Z Z Z Z Z 0.0 0.0 Z 0.0 0.0
+ Not elsewhere specified (energy) 107.2 0.0 0.0 0.0 0.0 1.0 68.8 0.0 0.0 Z 0.0 37.4
Distribution losses 3 149.8 2.1 472.7 0.4 0.0 8.1 502.1 0.0 0.0 Z 721.0 1 443.4
Available for final consumption 51 529.8 3 389.9 1 766.6 69.0 0.0 11 389.5 15 165.5 1 835.0 57.4 0.0 7 765.3 10 091.6
Final non-energy consumption 2 514.6 518.8 9.1 0.0 0.0 818.6 1 168.1 0.0 Z Z Z Z
Final energy consumption 47 350.3 2 871.2 1 757.5 69.0 0.0 9 025.9 13 803.1 1 835.0 57.4 Z 7 839.6 10 091.6
+ Industry 15 093.6 2 607.8 1 757.5 3.2 0.0 370.8 2 627.3 51.9 0.8 Z 3 354.9 4 319.4
+ Iron & steel 7 949.0 1 985.9 1 757.5 0.0 0.0 61.5 1 398.2 14.6 0.0 Z 1 217.9 1 513.5
+ Chemical & petrochemical 854.8 2.2 0.0 0.0 0.0 8.7 141.0 0.3 0.0 Z 454.4 248.2
+ Non-ferrous metals 630.5 91.6 0.0 0.0 0.0 5.4 144.1 0.0 0.0 Z 258.6 130.7
+ Non-metallic minerals 1 108.9 496.5 0.0 2.8 0.0 4.8 338.0 1.6 0.8 Z 70.9 193.4
+ Transport equipment 152.2 0.0 0.0 0.0 0.0 12.6 20.8 0.3 0.0 Z 47.8 70.7
+ Machinery 562.6 2.1 0.0 0.0 0.0 4.0 121.7 1.8 0.0 Z 90.8 342.1
+ Mining & quarrying 1 331.0 4.7 0.0 0.0 0.0 165.2 266.0 0.5 0.0 Z 84.2 810.5
+ Food, beverages & tobacco 1 375.9 23.7 0.0 0.4 0.0 26.4 150.8 4.9 0.0 Z 818.9 350.8
+ Paper, pulp & printing 242.9 0.0 0.0 0.0 0.0 1.0 17.8 0.3 0.0 Z 138.6 85.3
+ Wood & wood products 189.5 0.0 0.0 0.0 0.0 5.1 2.8 26.1 0.0 Z 96.0 59.5
+ Construction 184.0 1.1 0.0 0.0 0.0 70.2 8.5 0.8 0.0 Z 26.8 76.7
+ Textile & leather 55.7 0.0 0.0 0.0 0.0 1.0 6.0 0.1 0.0 Z 18.4 30.3
+ Not elsewhere specified (industry) 456.5 0.0 0.0 0.0 0.0 4.9 11.6 0.6 0.0 Z 31.7 407.7
+ Transport 9 590.8 4.7 0.0 0.0 0.0 7 321.8 1 612.1 46.5 0.0 Z Z 605.7
+ Rail 652.8 3.7 0.0 0.0 0.0 131.0 Z 0.0 0.0 Z Z 518.1
+ Road 7 227.9 Z Z Z Z 7 152.9 28.5 46.5 0.0 Z Z 0.0
+ Domestic aviation 0.0 Z Z Z Z 0.0 Z 0.0 Z Z Z Z
+ Domestic navigation 32.8 0.0 0.0 0.0 0.0 32.8 Z 0.0 0.0 Z Z Z
+ Pipeline transport 1 643.3 Z Z Z Z 5.0 1 581.6 0.0 Z Z Z 56.7
+ Not elsewhere specified (transport) 34.0 1.1 0.0 0.0 0.0 0.0 2.0 0.0 0.0 Z Z 30.9
+ Other 22 665.9 258.7 0.0 65.8 0.0 1 333.3 9 563.7 1 736.6 56.6 Z 4 484.7 5 166.5
+ Commercial & public services 4 393.0 89.7 0.0 13.0 0.0 135.6 602.2 34.3 56.6 Z 1 623.5 1 838.1
+ Households 16 432.8 161.9 0.0 52.5 0.0 54.9 8 830.0 1 676.9 0.0 Z 2 643.4 3 013.1
+ Agriculture & forestry 1 836.8 7.0 0.0 0.4 0.0 1 141.8 131.4 25.4 0.0 Z 217.7 313.2
+ Fishing 3.3 0.0 0.0 0.0 0.0 1.0 0.1 0.0 0.0 Z 0.1 2.2
+ Not elsewhere specified (other) 0.0 0.0 0.0 0.0 0.0 0.0 0.0 0.0 0.0 Z 0.0 0.0
Statistical differences 1 664.9 0.0 0.0 0.0 0.0 1 545.0 194.3 0.0 0.0 0.0 -74.4 0.0
Gross electricity production 13 412.8 4 112.2 122.6 1.5 0.0 112.9 634.6 1 070.6 0.0 7 358.2 Z Z
Gross heat production 9 123.1 858.0 896.1 27.7 0.0 310.0 6 206.9 643.6 0.0 151.2 Z 29.8
Source: Eurostat (nrg_bal_c)
180Energy balance sheets — 2017 data
Electricity
ktoe 2017
Oil and
petroleum
products
Natural
gas
Renewables
and
biofuels
Non-
renewable
waste
Nuclear
heatHeat
UkraineTotal
Solid
fossil
fuels
Manufac-
tured
gases
Peat and
peat
products
Oil shale
and oil
sands

2005 2010 2011 2012 2013 2014 2015 2016 2017
Gross available energy 141 229 132 573 126 644 122 650 115 114 104 909 92 247 93 751 89 196
Solid fossil fuels 37 177 38 131 41 383 42 449 41 509 35 509 29 995 32 329 25 577
Peat & peat products 125 119 104 96 115 68 117 121 119
Oil shale & oil sands 0 0 0 0 0 0 0 0 0
Crude oil & other hydrocarbons 19 810 11 497 9 100 5 073 3 978 3 043 2 851 2 806 3 351
Petroleum products -5 052 1 956 3 590 6 841 6 043 7 728 7 776 8 501 9 543
Natural gas 65 665 55 250 46 853 43 035 39 461 33 450 26 083 25 600 24 554
Nuclear heat 22 895 23 234 23 519 23 490 21 685 23 035 22 836 21 096 22 528
Renewable energies 1 328 2 735 2 636 2 652 3 173 2 801 2 705 3 621 3 910
Non-renewable wastes 0 0 0 0 0 0 0 0 60
Primary production 78 929 77 303 81 887 84 193 82 694 71 055 63 527 63 344 58 381
Solid fossil fuels 34 528 32 142 36 596 39 052 38 213 26 778 19 916 20 516 13 517
Peat 149 100 119 106 108 107 114 125 120
Oil shale and oil sands 0 0 0 0 0 0 0 0 0
Crude oil & other hydrocarbons 4 392 3 590 3 407 3 437 3 167 2 817 2 618 2 304 2 208
Natural gas 15 638 15 436 15 530 15 413 16 032 15 055 14 839 15 171 15 472
Nuclear heat 22 895 23 234 23 519 23 490 21 685 23 035 22 836 21 096 22 528
Renewable energies 1 328 2 801 2 715 2 693 3 490 3 263 3 204 4 132 4 476
Non-renewable wastes 0 0 0 0 0 0 0 0 60
Net imports 59 751 41 906 47 684 38 499 31 400 27 438 30 002 27 681 33 125
Solid fossil fuels 2 625 2 982 2 764 4 740 2 895 5 499 9 369 10 124 12 428
Crude oil 14 561 7 804 5 707 1 530 733 139 220 505 826
Gas/Diesel Oil (w/o bio) -258 1 806 2 928 4 310 4 269 4 736 4 873 5 166 5 270
Motor Gasoline (w/o bio) 83 1 626 1 294 1 659 1 602 2 091 1 475 1 528 1 325
Naphtha 0 0 0 0 0 0 0 0 0
LPG -277 63 140 260 397 474 657 1 188 1 229
All other oil & petroleum products -4 525 -1 488 -724 465 99 7 739 1 198 1 768
Natural gas 48 263 29 555 36 189 26 598 22 595 15 724 13 292 8 809 11 262
Transformation input 114 413 100 117 101 814 96 265 90 898 78 104 71 492 74 530 67 820
Electricity & heat generation 65 892 61 028 63 561 63 736 60 907 55 277 49 781 51 165 47 877
Refinery intake 19 766 11 901 9 828 5 199 4 104 3 308 3 051 3 081 3 666
Coke ovens 20 381 18 395 19 190 18 810 17 230 12 112 11 583 12 771 9 973
Blast furnaces 7 064 7 788 8 185 7 712 7 797 6 333 6 086 6 471 5 212
Transformation output 71 371 62 726 61 459 56 067 53 345 44 425 38 384 41 637 37 392
Electricity & heat generation 32 900 31 100 31 295 31 418 30 715 26 321 23 107 24 840 23 086
Refinery output 19 429 12 065 9 762 5 179 4 148 3 331 2 832 3 188 2 997
Coke ovens 15 396 15 196 15 887 15 359 14 594 11 144 9 274 10 232 8 350
Blast furnaces 3 417 3 556 3 628 3 469 3 439 2 973 2 607 2 806 2 286
Energy sector 6 855 7 167 6 812 6 615 5 874 4 855 4 234 4 633 3 836
Distribution losses 8 041 4 204 4 201 4 098 4 139 3 556 3 295 3 388 3 150
Available for final consumption 82 916 83 536 75 032 71 436 67 422 62 689 51 488 52 682 51 530
Solid fossil fuels 8 194 4 649 5 509 5 472 5 606 6 454 4 047 3 963 3 390
Manufactured gases 3 104 3 264 3 397 3 182 2 952 2 674 2 176 2 284 1 767
Peat & peat products 206 70 108 102 67 25 67 59 69
Oil shale & oil sands 0 0 0 0 0 0 0 0 0
Gas/Diesel Oil (w/o bio) 5 221 5 621 5 514 5 674 5 122 5 659 5 571 5 442 6 300
Motor Gasoline (w/o bio) 4 998 4 589 4 314 3 410 2 633 2 981 2 168 2 225 2 094
Naphtha 0 0 0 0 0 0 0 0 0
LPG 574 804 843 879 940 956 1 008 1 604 1 632
All other oil & petroleum products 2 130 1 478 976 1 048 595 455 946 512 1 364
Natural gas 35 118 37 986 29 201 26 860 24 923 21 845 16 141 15 858 15 166
Primary solid biofuels & charcoal 204 955 1 009 999 1 043 1 125 1 218 1 655 1 758
Liquid biofuels 0 0 0 0 48 42 35 38 47
All other renewable energies 18 28 30 30 32 34 30 31 30
Non-renewable wastes 0 0 0 0 0 0 0 0 57
Electricity 10 585 11 534 12 021 11 837 11 826 11 504 10 733 10 636 10 092
Heat 12 565 12 559 12 111 11 941 11 634 8 935 7 350 8 375 7 765
Statistical difference 987 9 587 -638 -1 084 -2 650 1 296 681 950 1 665
Final non-energy consumption 8 575 5 562 6 024 6 116 4 929 3 499 3 318 2 910 2 515
Final energy consumption 73 355 68 388 69 646 66 404 65 144 57 894 47 488 48 822 47 350
Industry 33 223 24 939 25 811 23 982 21 842 20 568 16 378 15 509 15 094
Transport 11 775 12 917 12 875 11 772 11 849 10 300 8 721 9 134 9 591
Other sectors 28 357 30 532 30 961 30 650 31 453 27 026 22 389 24 180 22 666
Services 2 182 4 652 5 129 5 007 5 768 4 665 3 888 4 672 4 393
Households 23 351 23 839 23 588 23 454 23 446 20 357 16 552 17 348 16 433
Europe 2020-2030 indicators 2005 2010 2011 2012 2013 2014 2015 2016 2017
Gross inland consumption 141 229 132 573 126 644 122 650 115 114 104 909 92 247 93 751 89 196
Primary energy consumption 132 654 127 011 120 620 116 535 110 185 101 409 88 929 90 841 86 681
Final energy consumption 77 864 73 109 74 686 71 155 69 835 61 633 51 329 52 887 50 679
Source: Eurostat (nrg_bal_c)
181
Ukrainektoe
Energy balance sheets — 2017 data

Source: Eurostat (nrg_bal_c)
Source: Eurostat (nrg_bal_c)
Note: Please refer to page 23 for related methodological definitions.
Ukraine
182Energy balance sheets — 2017 data
0
50 000
100 000
150 000
200 000
250 000
300 000
350 000
1990 1995 2000 2005 2010 2015 2017
Gross electricity production by fuel, GWh
Solid fossil fuels Oil and petroleum products Natural gas
Renewables and biofuels Nuclear heat Other
0
10 000
20 000
30 000
40 000
50 000
60 000
70 000
80 000
90 000
100 000
1990 1995 2000 2005 2010 2015 2017
Gross available energy by fuel, ktoe
Solid fossil fuels Oil and petroleum products Natural gas
Renewables and biofuels Nuclear heat Non-renewable waste

Source: Eurostat (nrg_bal_c)
Source: Eurostat (nrg_bal_c)
Note: Please refer to page 23 for related methodological definitions.
Ukraine
183Energy balance sheets — 2017 data
0
20 000
40 000
60 000
80 000
100 000
120 000
140 000
160 000
1990 1995 2000 2005 2010 2015 2017
Final energy consumption by fuel, ktoe
Solid fossil fuels Oil and petroleum products Natural gas
Renewables and biofuels Electricity Heat
Other
0
20 000
40 000
60 000
80 000
100 000
120 000
140 000
160 000
1990 1995 2000 2005 2010 2015 2017
Final consumption by sector, ktoe
Industry Transport Services Households Non-energy use
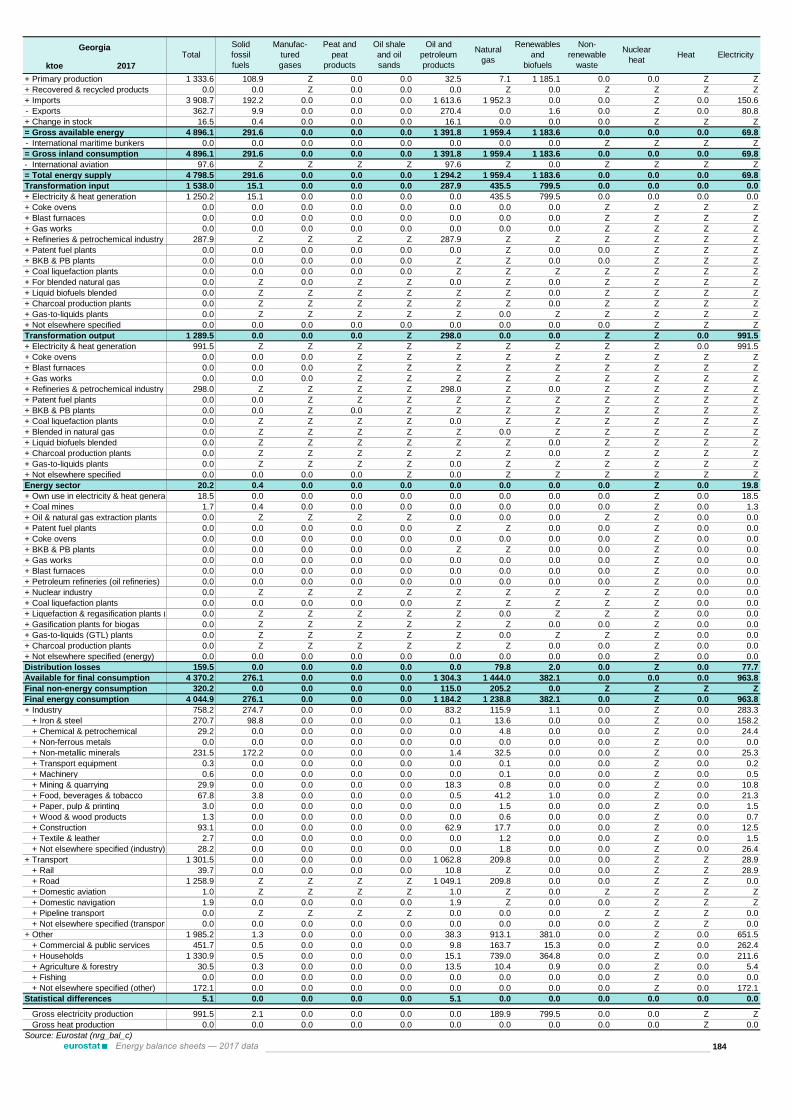
+ Primary production 1 333.6 108.9 Z 0.0 0.0 32.5 7.1 1 185.1 0.0 0.0 Z Z
+ Recovered & recycled products 0.0 0.0 Z 0.0 0.0 0.0 Z 0.0 Z Z Z Z
+ Imports 3 908.7 192.2 0.0 0.0 0.0 1 613.6 1 952.3 0.0 0.0 Z 0.0 150.6
- Exports 362.7 9.9 0.0 0.0 0.0 270.4 0.0 1.6 0.0 Z 0.0 80.8
+ Change in stock 16.5 0.4 0.0 0.0 0.0 16.1 0.0 0.0 0.0 Z Z Z
= Gross available energy 4 896.1 291.6 0.0 0.0 0.0 1 391.8 1 959.4 1 183.6 0.0 0.0 0.0 69.8
- International maritime bunkers 0.0 0.0 0.0 0.0 0.0 0.0 0.0 0.0 Z Z Z Z
= Gross inland consumption 4 896.1 291.6 0.0 0.0 0.0 1 391.8 1 959.4 1 183.6 0.0 0.0 0.0 69.8
- International aviation 97.6 Z Z Z Z 97.6 Z 0.0 Z Z Z Z
= Total energy supply 4 798.5 291.6 0.0 0.0 0.0 1 294.2 1 959.4 1 183.6 0.0 0.0 0.0 69.8
Transformation input 1 538.0 15.1 0.0 0.0 0.0 287.9 435.5 799.5 0.0 0.0 0.0 0.0
+ Electricity & heat generation 1 250.2 15.1 0.0 0.0 0.0 0.0 435.5 799.5 0.0 0.0 0.0 0.0
+ Coke ovens 0.0 0.0 0.0 0.0 0.0 0.0 0.0 0.0 Z Z Z Z
+ Blast furnaces 0.0 0.0 0.0 0.0 0.0 0.0 0.0 0.0 Z Z Z Z
+ Gas works 0.0 0.0 0.0 0.0 0.0 0.0 0.0 0.0 Z Z Z Z
+ Refineries & petrochemical industry 287.9 Z Z Z Z 287.9 Z Z Z Z Z Z
+ Patent fuel plants 0.0 0.0 0.0 0.0 0.0 0.0 Z 0.0 0.0 Z Z Z
+ BKB & PB plants 0.0 0.0 0.0 0.0 0.0 Z Z 0.0 0.0 Z Z Z
+ Coal liquefaction plants 0.0 0.0 0.0 0.0 0.0 Z Z Z Z Z Z Z
+ For blended natural gas 0.0 Z 0.0 Z Z 0.0 Z 0.0 Z Z Z Z
+ Liquid biofuels blended 0.0 Z Z Z Z Z Z 0.0 Z Z Z Z
+ Charcoal production plants 0.0 Z Z Z Z Z Z 0.0 Z Z Z Z
+ Gas-to-liquids plants 0.0 Z Z Z Z Z 0.0 Z Z Z Z Z
+ Not elsewhere specified 0.0 0.0 0.0 0.0 0.0 0.0 0.0 0.0 0.0 Z Z Z
Transformation output 1 289.5 0.0 0.0 0.0 Z 298.0 0.0 0.0 Z Z 0.0 991.5
+ Electricity & heat generation 991.5 Z Z Z Z Z Z Z Z Z 0.0 991.5
+ Coke ovens 0.0 0.0 0.0 Z Z Z Z Z Z Z Z Z
+ Blast furnaces 0.0 0.0 0.0 Z Z Z Z Z Z Z Z Z
+ Gas works 0.0 0.0 0.0 Z Z Z Z Z Z Z Z Z
+ Refineries & petrochemical industry 298.0 Z Z Z Z 298.0 Z 0.0 Z Z Z Z
+ Patent fuel plants 0.0 0.0 Z Z Z Z Z Z Z Z Z Z
+ BKB & PB plants 0.0 0.0 Z 0.0 Z Z Z Z Z Z Z Z
+ Coal liquefaction plants 0.0 Z Z Z Z 0.0 Z Z Z Z Z Z
+ Blended in natural gas 0.0 Z Z Z Z Z 0.0 Z Z Z Z Z
+ Liquid biofuels blended 0.0 Z Z Z Z Z Z 0.0 Z Z Z Z
+ Charcoal production plants 0.0 Z Z Z Z Z Z 0.0 Z Z Z Z
+ Gas-to-liquids plants 0.0 Z Z Z Z 0.0 Z Z Z Z Z Z
+ Not elsewhere specified 0.0 0.0 0.0 0.0 Z 0.0 Z Z Z Z Z Z
Energy sector 20.2 0.4 0.0 0.0 0.0 0.0 0.0 0.0 0.0 Z 0.0 19.8
+ Own use in electricity & heat generation 18.5 0.0 0.0 0.0 0.0 0.0 0.0 0.0 0.0 Z 0.0 18.5
+ Coal mines 1.7 0.4 0.0 0.0 0.0 0.0 0.0 0.0 0.0 Z 0.0 1.3
+ Oil & natural gas extraction plants 0.0 Z Z Z Z 0.0 0.0 0.0 Z Z 0.0 0.0
+ Patent fuel plants 0.0 0.0 0.0 0.0 0.0 Z Z 0.0 0.0 Z 0.0 0.0
+ Coke ovens 0.0 0.0 0.0 0.0 0.0 0.0 0.0 0.0 0.0 Z 0.0 0.0
+ BKB & PB plants 0.0 0.0 0.0 0.0 0.0 Z Z 0.0 0.0 Z 0.0 0.0
+ Gas works 0.0 0.0 0.0 0.0 0.0 0.0 0.0 0.0 0.0 Z 0.0 0.0
+ Blast furnaces 0.0 0.0 0.0 0.0 0.0 0.0 0.0 0.0 0.0 Z 0.0 0.0
+ Petroleum refineries (oil refineries) 0.0 0.0 0.0 0.0 0.0 0.0 0.0 0.0 0.0 Z 0.0 0.0
+ Nuclear industry 0.0 Z Z Z Z Z Z Z Z Z 0.0 0.0
+ Coal liquefaction plants 0.0 0.0 0.0 0.0 0.0 Z Z Z Z Z 0.0 0.0
+ Liquefaction & regasification plants (LNG) 0.0 Z Z Z Z Z 0.0 Z Z Z 0.0 0.0
+ Gasification plants for biogas 0.0 Z Z Z Z Z Z 0.0 0.0 Z 0.0 0.0
+ Gas-to-liquids (GTL) plants 0.0 Z Z Z Z Z 0.0 Z Z Z 0.0 0.0
+ Charcoal production plants 0.0 Z Z Z Z Z Z 0.0 0.0 Z 0.0 0.0
+ Not elsewhere specified (energy) 0.0 0.0 0.0 0.0 0.0 0.0 0.0 0.0 0.0 Z 0.0 0.0
Distribution losses 159.5 0.0 0.0 0.0 0.0 0.0 79.8 2.0 0.0 Z 0.0 77.7
Available for final consumption 4 370.2 276.1 0.0 0.0 0.0 1 304.3 1 444.0 382.1 0.0 0.0 0.0 963.8
Final non-energy consumption 320.2 0.0 0.0 0.0 0.0 115.0 205.2 0.0 Z Z Z Z
Final energy consumption 4 044.9 276.1 0.0 0.0 0.0 1 184.2 1 238.8 382.1 0.0 Z 0.0 963.8
+ Industry 758.2 274.7 0.0 0.0 0.0 83.2 115.9 1.1 0.0 Z 0.0 283.3
+ Iron & steel 270.7 98.8 0.0 0.0 0.0 0.1 13.6 0.0 0.0 Z 0.0 158.2
+ Chemical & petrochemical 29.2 0.0 0.0 0.0 0.0 0.0 4.8 0.0 0.0 Z 0.0 24.4
+ Non-ferrous metals 0.0 0.0 0.0 0.0 0.0 0.0 0.0 0.0 0.0 Z 0.0 0.0
+ Non-metallic minerals 231.5 172.2 0.0 0.0 0.0 1.4 32.5 0.0 0.0 Z 0.0 25.3
+ Transport equipment 0.3 0.0 0.0 0.0 0.0 0.0 0.1 0.0 0.0 Z 0.0 0.2
+ Machinery 0.6 0.0 0.0 0.0 0.0 0.0 0.1 0.0 0.0 Z 0.0 0.5
+ Mining & quarrying 29.9 0.0 0.0 0.0 0.0 18.3 0.8 0.0 0.0 Z 0.0 10.8
+ Food, beverages & tobacco 67.8 3.8 0.0 0.0 0.0 0.5 41.2 1.0 0.0 Z 0.0 21.3
+ Paper, pulp & printing 3.0 0.0 0.0 0.0 0.0 0.0 1.5 0.0 0.0 Z 0.0 1.5
+ Wood & wood products 1.3 0.0 0.0 0.0 0.0 0.0 0.6 0.0 0.0 Z 0.0 0.7
+ Construction 93.1 0.0 0.0 0.0 0.0 62.9 17.7 0.0 0.0 Z 0.0 12.5
+ Textile & leather 2.7 0.0 0.0 0.0 0.0 0.0 1.2 0.0 0.0 Z 0.0 1.5
+ Not elsewhere specified (industry) 28.2 0.0 0.0 0.0 0.0 0.0 1.8 0.0 0.0 Z 0.0 26.4
+ Transport 1 301.5 0.0 0.0 0.0 0.0 1 062.8 209.8 0.0 0.0 Z Z 28.9
+ Rail 39.7 0.0 0.0 0.0 0.0 10.8 Z 0.0 0.0 Z Z 28.9
+ Road 1 258.9 Z Z Z Z 1 049.1 209.8 0.0 0.0 Z Z 0.0
+ Domestic aviation 1.0 Z Z Z Z 1.0 Z 0.0 Z Z Z Z
+ Domestic navigation 1.9 0.0 0.0 0.0 0.0 1.9 Z 0.0 0.0 Z Z Z
+ Pipeline transport 0.0 Z Z Z Z 0.0 0.0 0.0 Z Z Z 0.0
+ Not elsewhere specified (transport) 0.0 0.0 0.0 0.0 0.0 0.0 0.0 0.0 0.0 Z Z 0.0
+ Other 1 985.2 1.3 0.0 0.0 0.0 38.3 913.1 381.0 0.0 Z 0.0 651.5
+ Commercial & public services 451.7 0.5 0.0 0.0 0.0 9.8 163.7 15.3 0.0 Z 0.0 262.4
+ Households 1 330.9 0.5 0.0 0.0 0.0 15.1 739.0 364.8 0.0 Z 0.0 211.6
+ Agriculture & forestry 30.5 0.3 0.0 0.0 0.0 13.5 10.4 0.9 0.0 Z 0.0 5.4
+ Fishing 0.0 0.0 0.0 0.0 0.0 0.0 0.0 0.0 0.0 Z 0.0 0.0
+ Not elsewhere specified (other) 172.1 0.0 0.0 0.0 0.0 0.0 0.0 0.0 0.0 Z 0.0 172.1
Statistical differences 5.1 0.0 0.0 0.0 0.0 5.1 0.0 0.0 0.0 0.0 0.0 0.0
Gross electricity production 991.5 2.1 0.0 0.0 0.0 0.0 189.9 799.5 0.0 0.0 Z Z
Gross heat production 0.0 0.0 0.0 0.0 0.0 0.0 0.0 0.0 0.0 0.0 Z 0.0
Source: Eurostat (nrg_bal_c)
184Energy balance sheets — 2017 data
Electricity
ktoe 2017
Oil and
petroleum
products
Natural
gas
Renewables
and
biofuels
Non-
renewable
waste
Nuclear
heatHeat
GeorgiaTotal
Solid
fossil
fuels
Manufac-
tured
gases
Peat and
peat
products
Oil shale
and oil
sands

2005 2010 2011 2012 2013 2014 2015 2016 2017
Gross available energy 0 0 0 0 3 986 4 472 4 703 4 860 4 896
Solid fossil fuels 0 0 0 0 315 291 272 262 292
Peat & peat products 0 0 0 0 0 0 0 0 0
Oil shale & oil sands 0 0 0 0 0 0 0 0 0
Crude oil & other hydrocarbons 0 0 0 0 0 0 14 -35 -125
Petroleum products 0 0 0 0 1 072 1 128 1 253 1 540 1 517
Natural gas 0 0 0 0 1 388 1 834 2 016 1 891 1 959
Nuclear heat 0 0 0 0 0 0 0 0 0
Renewable energies 0 0 0 0 1 208 1 199 1 144 1 210 1 184
Non-renewable wastes 0 0 0 0 0 0 0 0 0
Primary production 0 0 0 0 1 428 1 372 1 319 1 377 1 334
Solid fossil fuels 0 0 0 0 168 121 124 121 109
Peat 0 0 0 0 0 0 0 0 0
Oil shale and oil sands 0 0 0 0 0 0 0 0 0
Crude oil & other hydrocarbons 0 0 0 0 49 44 41 40 32
Natural gas 0 0 0 0 4 9 10 6 7
Nuclear heat 0 0 0 0 0 0 0 0 0
Renewable energies 0 0 0 0 1 208 1 199 1 144 1 211 1 185
Non-renewable wastes 0 0 0 0 0 0 0 0 0
Net imports 0 0 0 0 2 562 3 103 3 404 3 483 3 546
Solid fossil fuels 0 0 0 0 154 167 151 165 182
Crude oil 0 0 0 0 -58 -42 -20 25 54
Gas/Diesel Oil (w/o bio) 0 0 0 0 487 539 606 670 574
Motor Gasoline (w/o bio) 0 0 0 0 393 392 462 605 560
Naphtha 0 0 0 0 0 0 0 0 0
LPG 0 0 0 0 19 20 16 14 17
All other oil & petroleum products 0 0 0 0 180 180 178 127 139
Natural gas 0 0 0 0 1 384 1 825 2 007 1 885 1 952
Transformation input 0 0 0 0 1 076 1 197 1 284 1 413 1 538
Electricity & heat generation 0 0 0 0 1 076 1 197 1 270 1 250 1 250
Refinery intake 0 0 0 0 0 0 14 26 25
Coke ovens 0 0 0 0 0 0 0 0 0
Blast furnaces 0 0 0 0 0 0 0 0 0
Transformation output 0 0 0 0 865 892 943 1 164 1 289
Electricity & heat generation 0 0 0 0 865 892 931 995 992
Refinery output 0 0 0 0 0 0 12 27 24
Coke ovens 0 0 0 0 0 0 0 0 0
Blast furnaces 0 0 0 0 0 0 0 0 0
Energy sector 0 0 0 0 19 21 22 20 20
Distribution losses 0 0 0 0 141 129 172 183 160
Available for final consumption 0 0 0 0 3 526 3 935 4 097 4 334 4 370
Solid fossil fuels 0 0 0 0 315 290 271 250 276
Manufactured gases 0 0 0 0 0 0 0 0 0
Peat & peat products 0 0 0 0 0 0 0 0 0
Oil shale & oil sands 0 0 0 0 0 0 0 0 0
Gas/Diesel Oil (w/o bio) 0 0 0 0 473 528 616 662 598
Motor Gasoline (w/o bio) 0 0 0 0 401 400 445 627 564
Naphtha 0 0 0 0 0 0 0 0 2
LPG 0 0 0 0 19 20 20 18 18
All other oil & petroleum products 0 0 0 0 91 97 114 129 122
Natural gas 0 0 0 0 953 1 278 1 365 1 341 1 444
Primary solid biofuels & charcoal 0 0 0 0 481 465 398 386 363
Liquid biofuels 0 0 0 0 0 0 0 0 0
All other renewable energies 0 0 0 0 14 15 17 18 19
Non-renewable wastes 0 0 0 0 0 0 0 0 0
Electricity 0 0 0 0 780 841 852 902 964
Heat 0 0 0 0 0 0 0 0 0
Statistical difference 0 0 0 0 0 0 -1 5 5
Final non-energy consumption 0 0 0 0 278 310 332 300 320
Final energy consumption 0 0 0 0 3 248 3 625 3 766 4 029 4 045
Industry 0 0 0 0 645 678 693 680 758
Transport 0 0 0 0 1 011 1 171 1 288 1 448 1 302
Other sectors 0 0 0 0 1 592 1 777 1 785 1 902 1 985
Services 0 0 0 0 339 432 404 435 452
Households 0 0 0 0 1 103 1 191 1 208 1 273 1 331
Europe 2020-2030 indicators 2005 2010 2011 2012 2013 2014 2015 2016 2017
Gross inland consumption 0 0 0 0 3 986 4 472 4 703 4 860 4 896
Primary energy consumption 0 0 0 0 3 708 4 163 4 371 4 560 4 576
Final energy consumption 0 0 0 0 3 337 3 708 3 837 4 102 4 142
Source: Eurostat (nrg_bal_c)
185
Georgiaktoe
Energy balance sheets — 2017 data

Source: Eurostat (nrg_bal_c)
Source: Eurostat (nrg_bal_c)
Note: Please refer to page 23 for related methodological definitions.
Georgia
186Energy balance sheets — 2017 data
0
2 000
4 000
6 000
8 000
10 000
12 000
14 000
1990 1995 2000 2005 2010 2015 2017
Gross electricity production by fuel, GWh
Solid fossil fuels Oil and petroleum products Natural gas
Renewables and biofuels Nuclear heat Other
0
500
1 000
1 500
2 000
2 500
1990 1995 2000 2005 2010 2015 2017
Gross available energy by fuel, ktoe
Solid fossil fuels Oil and petroleum products Natural gas
Renewables and biofuels Nuclear heat Non-renewable waste

Source: Eurostat (nrg_bal_c)
Source: Eurostat (nrg_bal_c)
Note: Please refer to page 23 for related methodological definitions.
Georgia
187Energy balance sheets — 2017 data
0
500
1 000
1 500
2 000
2 500
3 000
3 500
4 000
4 500
1990 1995 2000 2005 2010 2015 2017
Final energy consumption by fuel, ktoe
Solid fossil fuels Oil and petroleum products Natural gas
Renewables and biofuels Electricity Heat
Other
0
500
1 000
1 500
2 000
2 500
3 000
3 500
4 000
4 500
5 000
1990 1995 2000 2005 2010 2015 2017
Final consumption by sector, ktoe
Industry Transport Services Households Non-energy use
6 Sankey diagrams (energy flow diagrams)
188 Energy balance sheets – 2017 data
Introduction A Sankey diagram is a graphic illustration of flows - like energy, material or money - where they can
be combined, split and traced through a series of events or stages. The width of each stream
represents the amount of material or energy in the flow. Sankey diagrams, which are typically used
to visualize energy transfers between processes, are named after the Matthew H. P. R. Sankey, who
used this type of diagram in a publication on energy efficiency of a steam engine in 1898.
Use for energy balances Sankey diagrams are ideal for visually representing energy balances. This is because an energy
balance represents the contribution and flow of various energy commodities (fuels, heat and
electricity, i.e. energy carriers in a marketable form) into the different sectors of the economy (e.g.
supply, transformation and consumption) in energy units. A Sankey diagram reproduces – in visual
form – energy balances that are normally represented as a matrix (a table or a spreadsheet).
Description of flows and nodes of the Sankey diagram Energy commodities:
enter the energy balance on the top/left (mainly from production or imports); and
exit on the bottom/right (mainly through final consumption, exports and losses).
The middle part of the diagram also shows:
which energy commodities are used in their original form; and
which go through the transformation sector.
Natural gas used for heating in the residential sector is an example of a commodity being used in its
original form (i.e. "Direct carry-over"). By contrast, natural gas transformed into electricity in a thermal
power plant is an example of an energy commodity going through the transformation sector. The
following sections describe the main groups of nodes and their meaning in relation to the energy
balance.
6 Sankey diagrams (energy flow diagrams)

6 Sankey diagrams (energy flow diagrams)
189 Energy balance sheets – 2017 data
The Sankey diagrams presented in this publication show energy products of
the following fuel families:
solid fuels (coal)
total petroleum products (crude oil and derived petroleum products)
gas
nuclear heat
derived heat
renewable energies
electricity
non-renewable waste.
Each fuel family is represented by a different colour.
Please see detailed description in our dedicated Statistics Explained article:
http://ec.europa.eu/eurostat/statistics-explained/index.php/Sankey_diagrams_for_energy_balance
Methodology notes The Sankey diagram tool takes its data from the "Sankey diagram dataset - annual data
(nrg_bal_sd)" in the Eurostat Energy database. The nrg_bal_sd dataset takes its data from the
"Complete energy balances - annual data (nrg_bal_c)" dataset. There are some limitations on how
some of the balance aggregates can be shown. For this reason, some balance aggregates have to
be displayed in a different form and others cannot be displayed at all. This is mainly because
negative flows cannot be represented visually. Therefore, to avoid having large artificial backflows,
two adjustments have to be made:
Fuels entering have to be displayed before the transformation sector. In this way, they also
make sense for products consumed in transformation.
Exiting fuels need to be displayed after the transformation sector. In this way, they also
make sense for products produced in transformation.
Modified and missing aggregates of energy balance in Sankey diagrams Here are some examples of aggregates that are displayed in a different way or which cannot be
displayed at all in the Sankey diagram:
Stock changes: this aggregate from the energy balance does not appear in the Sankey
diagram. Stock draw and stock build are displayed instead. A fuel taken from stocks (stock
draw) can be consumed in the transformation sector, so it has to be displayed before this
sector. Conversely, a fuel sent to stock (stock build) could have appeared only after
transformation, so the flow in the Sankey diagram needs to be displayed after the
transformation sector. For this reason, there is no "stock changes" flow in the Sankey
diagram, but rather two distinct flows: "stock build” and "stock draw".
Gross available energy, Gross inland consumption and Total energy supply: cannot be
displayed in the Sankey diagram since it depends on net imports. Imports are displayed
before the transformation sector and exports after the transformation sector for the same
reasons as with stock changes above. This makes it impossible to show the net imports

6 Sankey diagrams (energy flow diagrams)
190 Energy balance sheets – 2017 data
flow, as both flows cannot be meaningfully combined in the Sankey diagram.
Statistical difference: statistical difference is simply a positive or negative number in the
table of the energy balance. In the Sankey diagram, it is either an incoming or outgoing flow
depending on its sign.
Imports and exports: for aggregates of countries (e.g. EU-28), imports and exports are
calculated as the sum of total imports or total exports for each of the countries included in
the aggregate, without subtracting the internal trade between the countries of the aggregate
(i.e exports of one country of the aggregate to another country of the aggregate are
included).
New aggregates in Sankey diagrams Conversely, some new aggregates need to be included in the display of the Sankey diagram. This is
the case for the following aggregates, which are not shown in the energy balance:
Available from all sources: the aggregate where all the entering flows converge, namely
imports, production and stock draw
Transformation backflow: the minimal backflow needed to cover all transformation inputs,
for an exact definition see above
Direct carry-over: the total amount of fuels which are directly consumed and do not go
through transformation
Available after transformation: the sum of transformation and direct carry-over
Final consumption: the sum of the Final energy consumption and Final non-energy
consumption energy balance flows. This is created only to introduce the statistical difference
in a meaningful way in the display.
In addition, some flows shown separately in the energy balance are put together in the Sankey
diagram. This is done especially when they are very small and where separating them does not add
any value in the display. For an example of this see the "Other production" or "Transformation
losses" nodes created exclusively for the Sankey diagram. The nodes are defined above.
Small and negative flows When handling very small flows in the Sankey diagram, a special methodology is needed. Some
flows may even be negative due to statistical discrepancies. The method used is as follows: an ad
hoc threshold is applied to decide whether any given fuel on display inside a Sankey diagram flow
should be drawn or not. This threshold is subjective and reflects only the limitations on what can be
shown, given the size of the screen resolution used to display the diagram. In detail, two rules are
applied to each single flow in the Sankey tool:
The entire flow is drawn only if the energy content of at least one fuel on display inside this
flow, expressed in the currently selected unit, rounds to 1 or more.
If the resulting width of a fuel inside this flow on the screen, expressed in pixels, is less than
0.5, it is increased to 0.5 pixels.
Nodes to which no flow is attached after this selection (i.e. none flowing in and none flowing out) are
not drawn either.
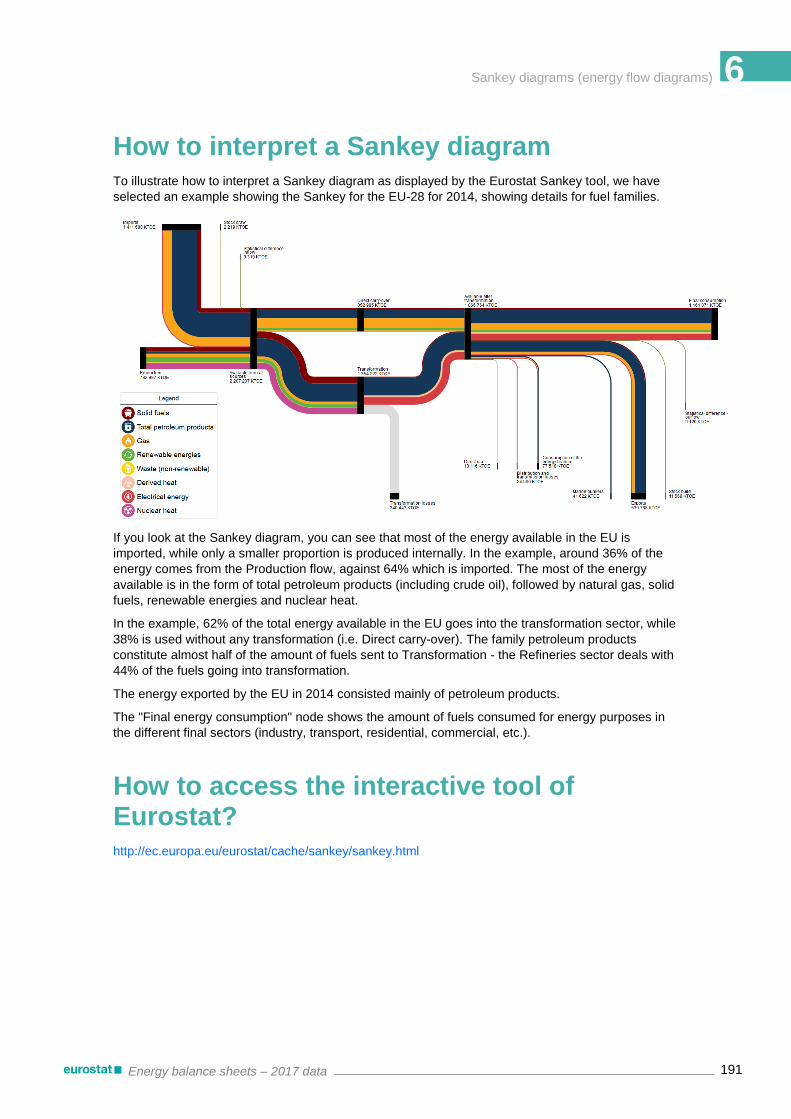
6 Sankey diagrams (energy flow diagrams)
191 Energy balance sheets – 2017 data
How to interpret a Sankey diagram To illustrate how to interpret a Sankey diagram as displayed by the Eurostat Sankey tool, we have
selected an example showing the Sankey for the EU-28 for 2014, showing details for fuel families.
If you look at the Sankey diagram, you can see that most of the energy available in the EU is
imported, while only a smaller proportion is produced internally. In the example, around 36% of the
energy comes from the Production flow, against 64% which is imported. The most of the energy
available is in the form of total petroleum products (including crude oil), followed by natural gas, solid
fuels, renewable energies and nuclear heat.
In the example, 62% of the total energy available in the EU goes into the transformation sector, while
38% is used without any transformation (i.e. Direct carry-over). The family petroleum products
constitute almost half of the amount of fuels sent to Transformation - the Refineries sector deals with
44% of the fuels going into transformation.
The energy exported by the EU in 2014 consisted mainly of petroleum products.
The "Final energy consumption" node shows the amount of fuels consumed for energy purposes in
the different final sectors (industry, transport, residential, commercial, etc.).
How to access the interactive tool of Eurostat? http://ec.europa.eu/eurostat/cache/sankey/sankey.html

6 Sankey diagrams (energy flow diagrams)
192 Energy balance sheets – 2017 data
What you can do with the Sankey tool You can use the Eurostat tool to perform a series of operations and access certain options and levels
of detail depending on your preferences. Eurostat's Sankey diagrams are based on a series of nodes
connected by energy balance flows:
the flows represent input and output amounts
the black nodes represent events or processes, e.g. imports, final energy consumption, etc.
Each flow is defined by 4 dimensions:
the variable of the balance (e.g. "Final energy consumption")
the energy product or product family (e.g. "Motor gasoline" or the "Total petroleum
products")
the country
the year.
The flow amount can be expressed in different units of energy measurement, for example ktoe
(thousand tonnes of oil equivalent), TJ (terajoules) and GWh (gigawatt hour). Only the non-zero
combinations are displayed in the Sankey diagram.
Further disaggregation of nodes The interactive tool on Eurostat website offers additional disaggregation of certain nodes, that is not
presented in this publication.
Example of a disaggregation of the transformation node

6 Sankey diagrams (energy flow diagrams)
193 Energy balance sheets – 2017 data
Example of a disaggregation of the final energy consumption node
Example of a disaggregation of the final non-energy consumption node

6 Sankey diagrams (energy flow diagrams)
194 Energy balance sheets – 2017 data
European Union (28 countries) 2017

6 Sankey diagrams (energy flow diagrams)
195 Energy balance sheets – 2017 data
Euro Area (19 countries) 2017

6 Sankey diagrams (energy flow diagrams)
196 Energy balance sheets – 2017 data
Belgium 2017

6 Sankey diagrams (energy flow diagrams)
197 Energy balance sheets – 2017 data
Bulgaria 2017

6 Sankey diagrams (energy flow diagrams)
198 Energy balance sheets – 2017 data
Czechia 2017

6 Sankey diagrams (energy flow diagrams)
199 Energy balance sheets – 2017 data
Denmark 2017

6 Sankey diagrams (energy flow diagrams)
200 Energy balance sheets – 2017 data
Germany 2017

6 Sankey diagrams (energy flow diagrams)
201 Energy balance sheets – 2017 data
Estonia 2017

6 Sankey diagrams (energy flow diagrams)
202 Energy balance sheets – 2017 data
Ireland 2017

6 Sankey diagrams (energy flow diagrams)
203 Energy balance sheets – 2017 data
Greece 2017

6 Sankey diagrams (energy flow diagrams)
204 Energy balance sheets – 2017 data
Spain 2017

6 Sankey diagrams (energy flow diagrams)
205 Energy balance sheets – 2017 data
France 2017

6 Sankey diagrams (energy flow diagrams)
206 Energy balance sheets – 2017 data
Croatia 2017

6 Sankey diagrams (energy flow diagrams)
207 Energy balance sheets – 2017 data
Italy 2017

6 Sankey diagrams (energy flow diagrams)
208 Energy balance sheets – 2017 data
Cyprus 2017
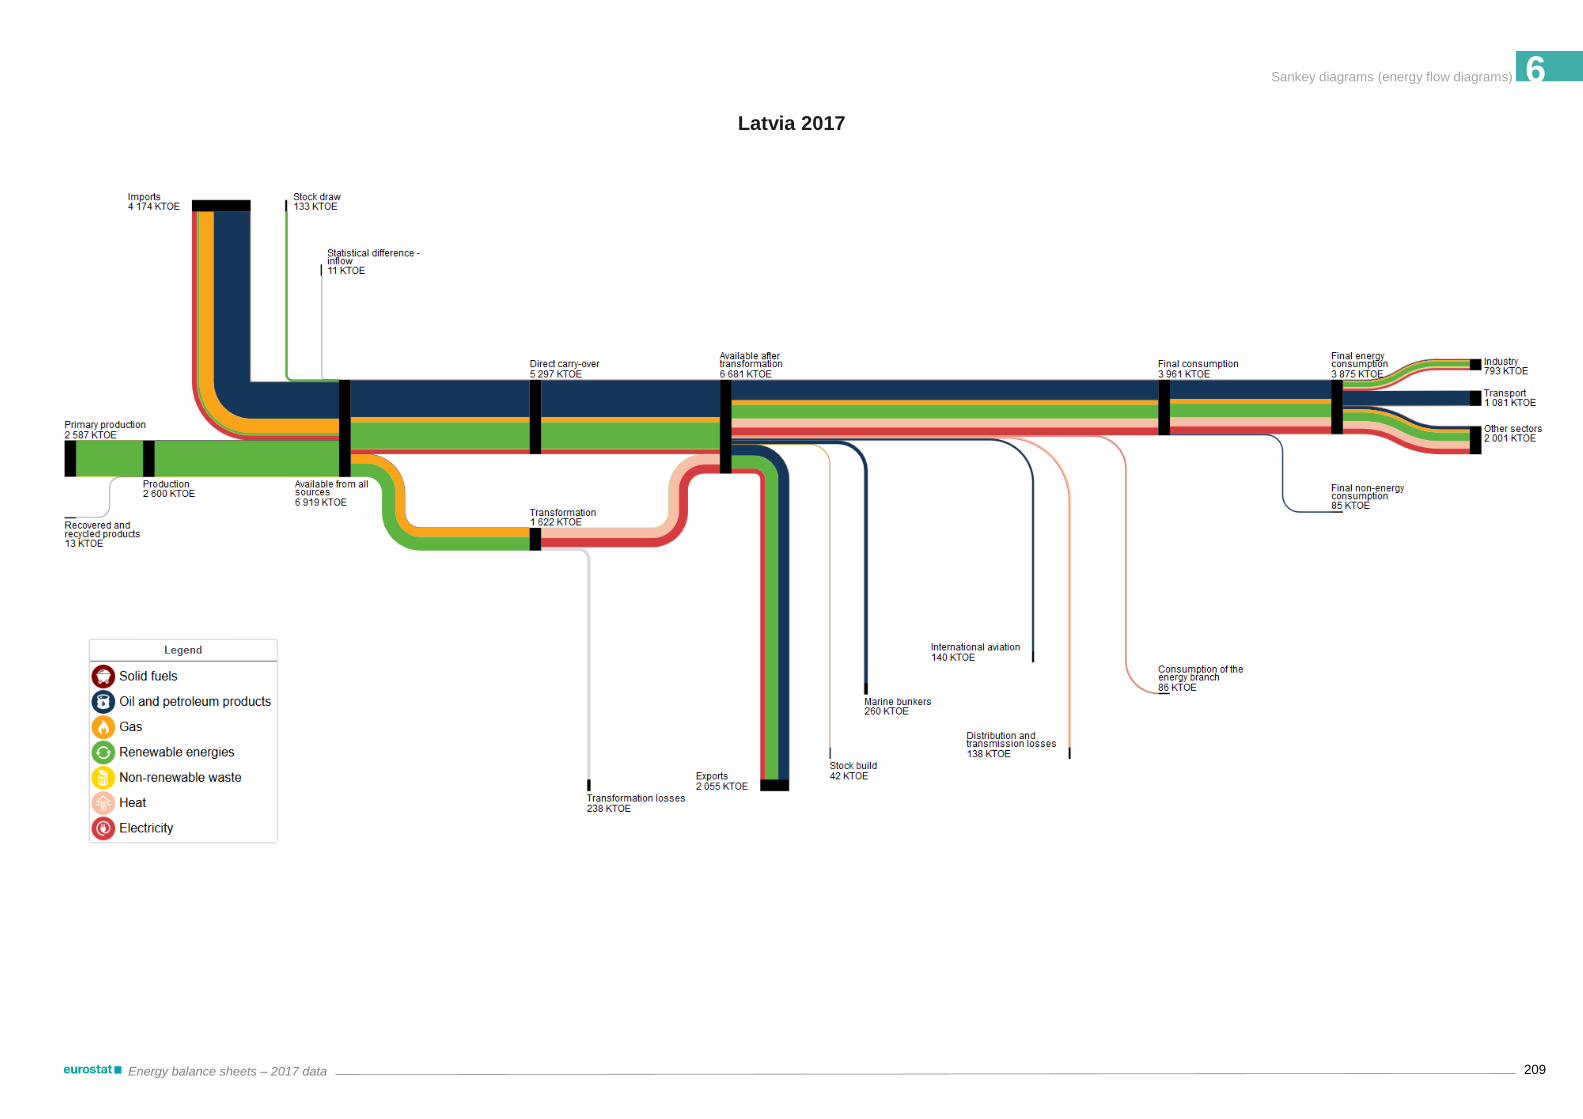
6 Sankey diagrams (energy flow diagrams)
209 Energy balance sheets – 2017 data
Latvia 2017

6 Sankey diagrams (energy flow diagrams)
210 Energy balance sheets – 2017 data
Lithuania 2017
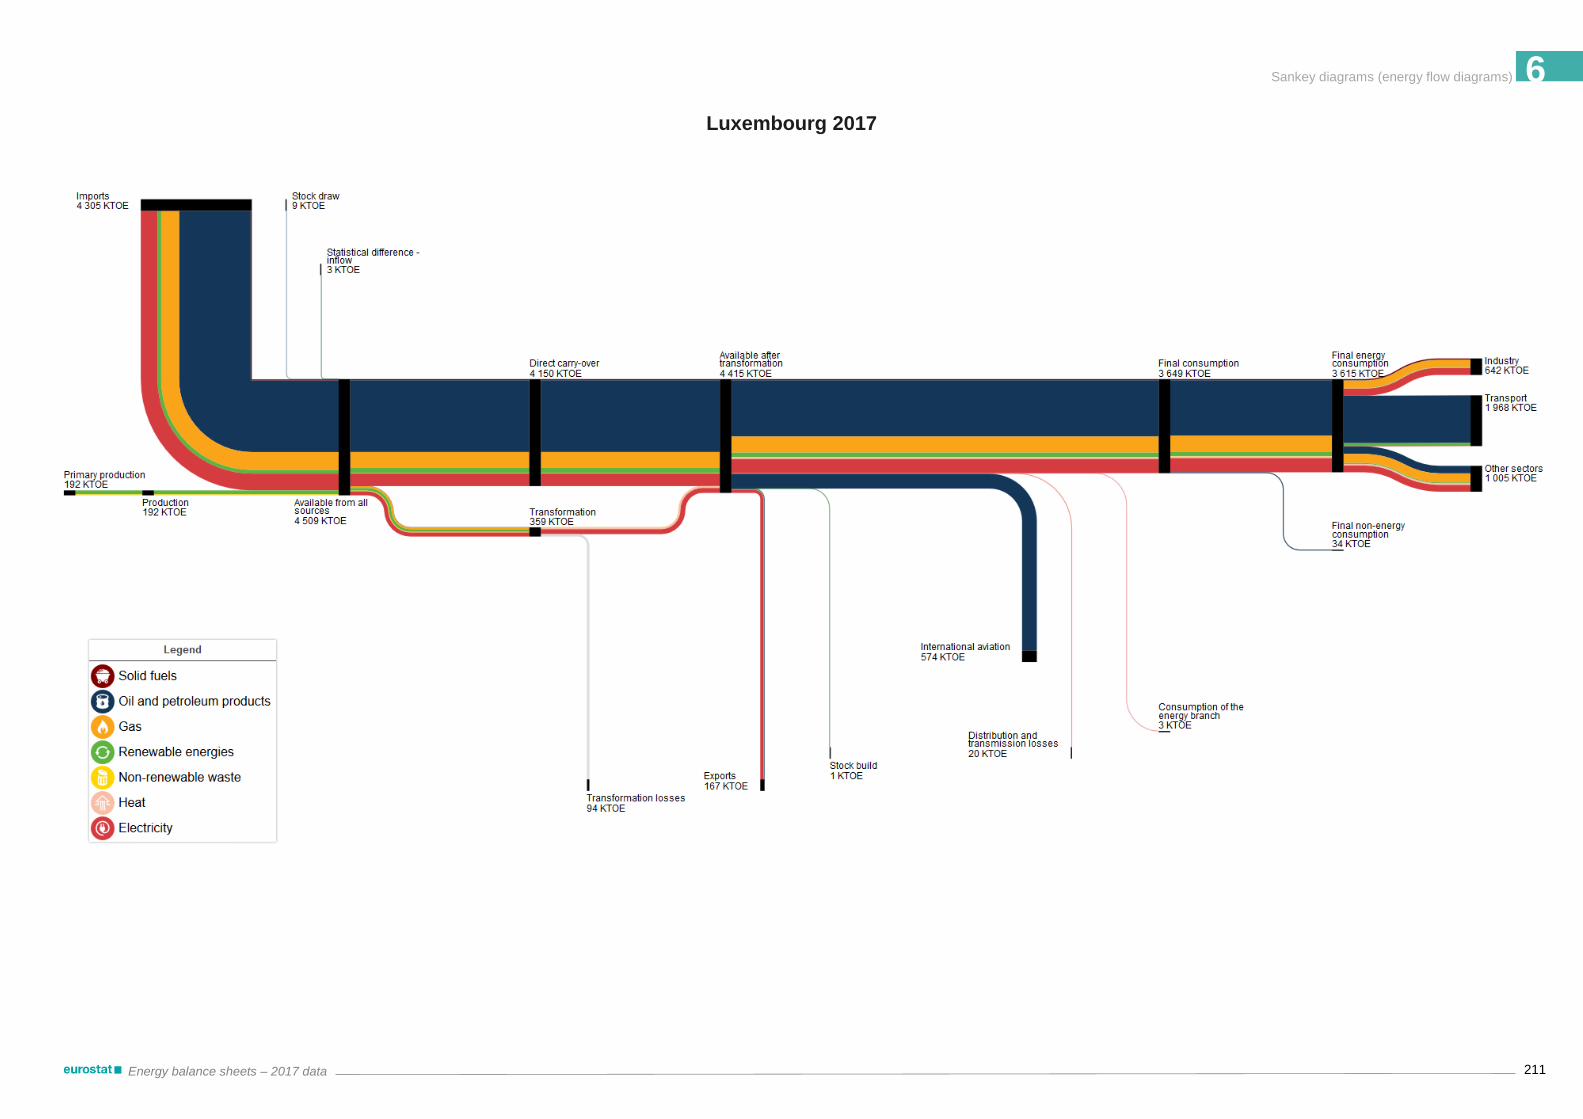
6 Sankey diagrams (energy flow diagrams)
211 Energy balance sheets – 2017 data
Luxembourg 2017

6 Sankey diagrams (energy flow diagrams)
212 Energy balance sheets – 2017 data
Hungary 2017

6 Sankey diagrams (energy flow diagrams)
213 Energy balance sheets – 2017 data
Malta 2017

6 Sankey diagrams (energy flow diagrams)
214 Energy balance sheets – 2017 data
Netherlands 2017

6 Sankey diagrams (energy flow diagrams)
215 Energy balance sheets – 2017 data
Austria 2017

6 Sankey diagrams (energy flow diagrams)
216 Energy balance sheets – 2017 data
Poland 2017
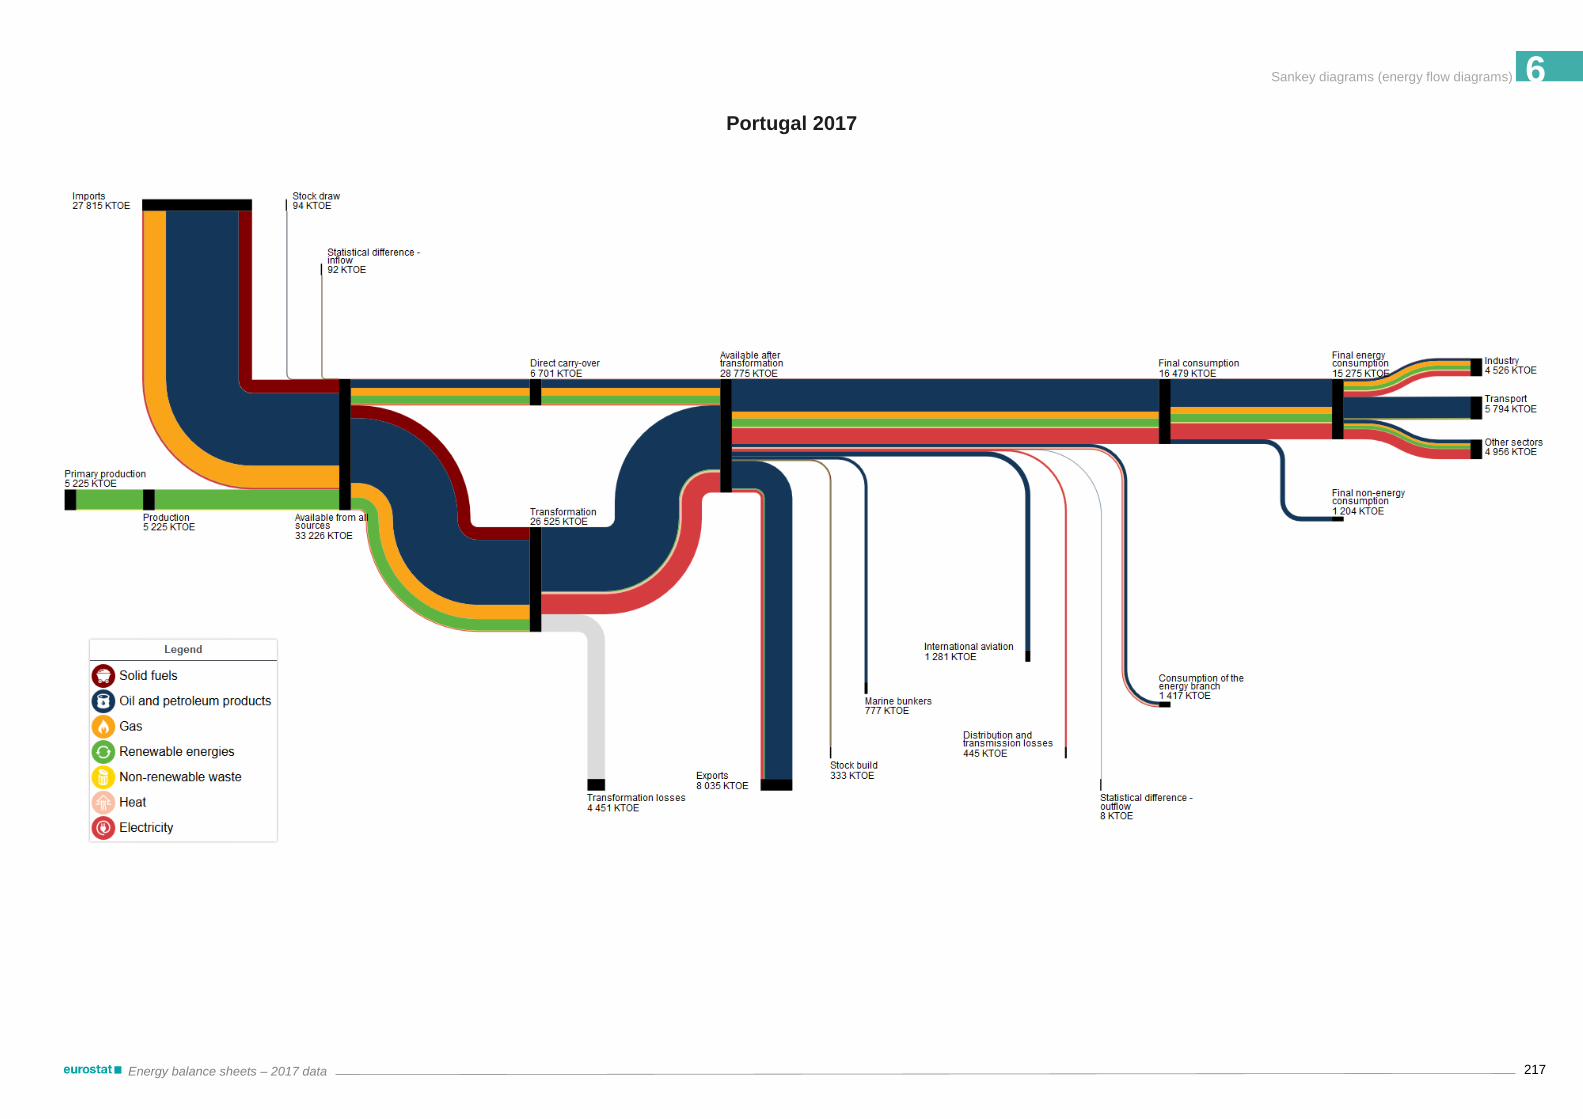
6 Sankey diagrams (energy flow diagrams)
217 Energy balance sheets – 2017 data
Portugal 2017

6 Sankey diagrams (energy flow diagrams)
218 Energy balance sheets – 2017 data
Romania 2017

6 Sankey diagrams (energy flow diagrams)
219 Energy balance sheets – 2017 data
Slovenia 2017

6 Sankey diagrams (energy flow diagrams)
220 Energy balance sheets – 2017 data
Slovakia 2017

6 Sankey diagrams (energy flow diagrams)
221 Energy balance sheets – 2017 data
Finland 2017

6 Sankey diagrams (energy flow diagrams)
222 Energy balance sheets – 2017 data
Sweden 2017

6 Sankey diagrams (energy flow diagrams)
223 Energy balance sheets – 2017 data
United Kingdom 2017
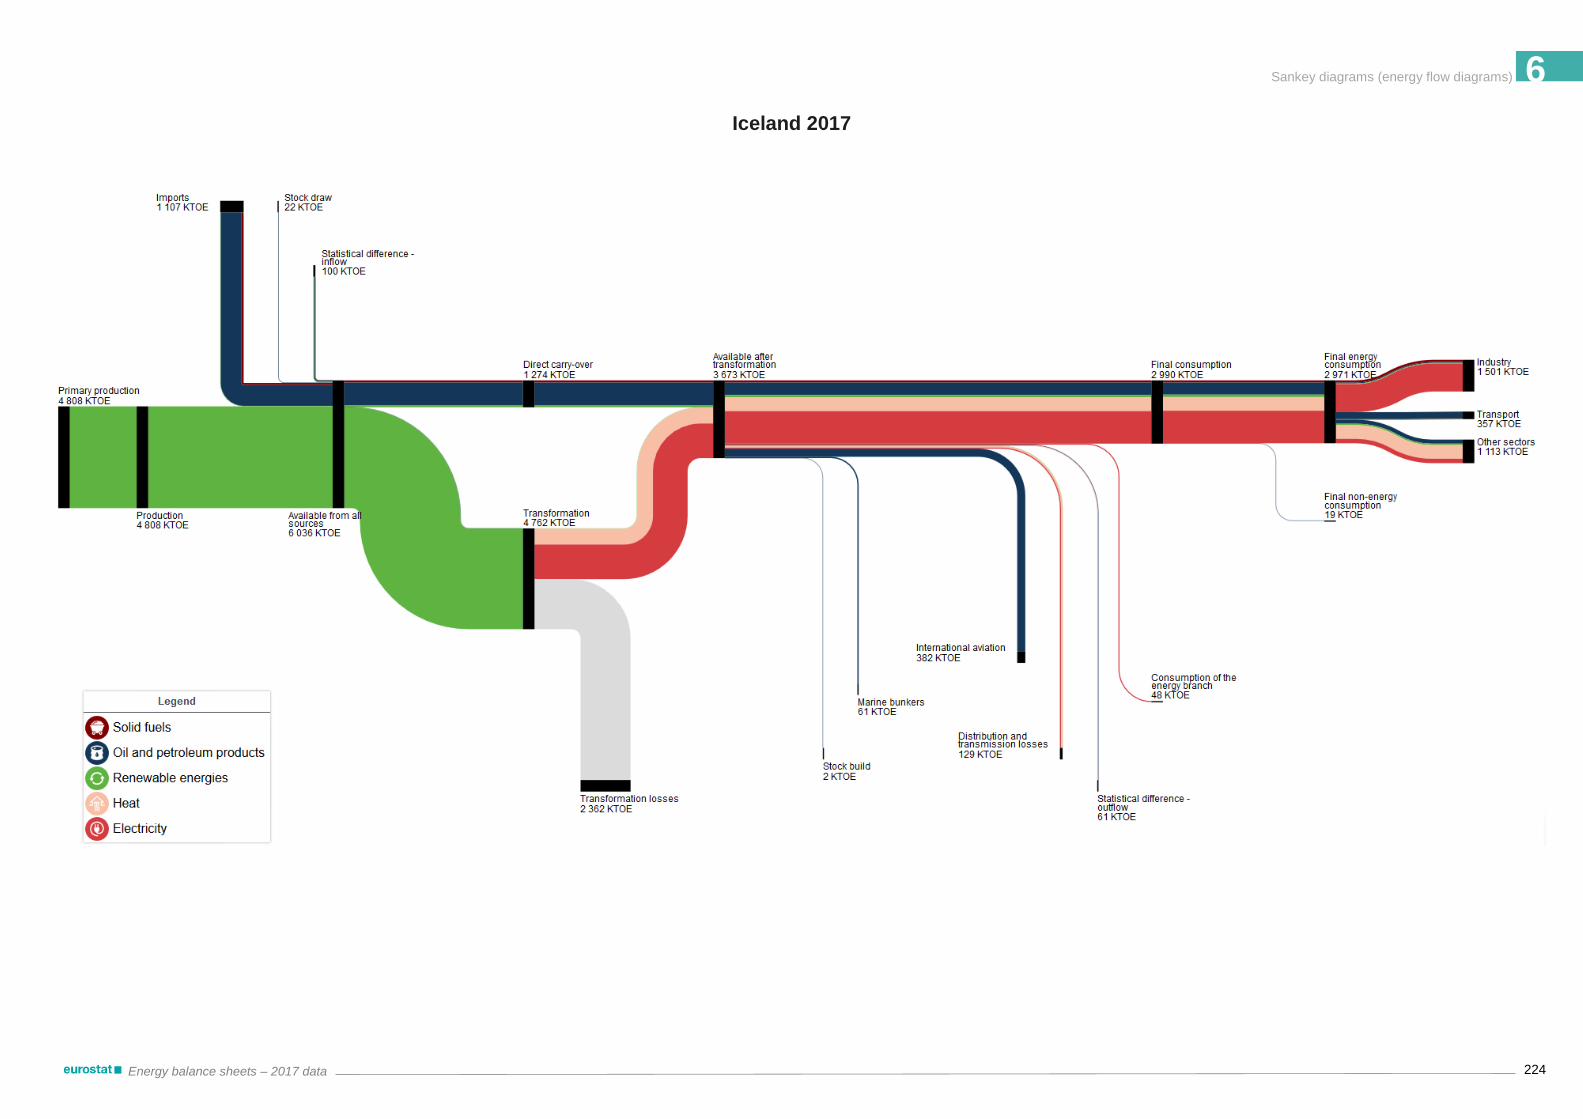
6 Sankey diagrams (energy flow diagrams)
224 Energy balance sheets – 2017 data
Iceland 2017

6 Sankey diagrams (energy flow diagrams)
225 Energy balance sheets – 2017 data
Norway 2017

6 Sankey diagrams (energy flow diagrams)
226 Energy balance sheets – 2017 data
Montenegro 2017

6 Sankey diagrams (energy flow diagrams)
227 Energy balance sheets – 2017 data
North Macedonia 2017

6 Sankey diagrams (energy flow diagrams)
228 Energy balance sheets – 2017 data
Albania 2017

6 Sankey diagrams (energy flow diagrams)
229 Energy balance sheets – 2017 data
Serbia 2017

6 Sankey diagrams (energy flow diagrams)
230 Energy balance sheets – 2017 data
Turkey 2017
+

6 Sankey diagrams (energy flow diagrams)
231 Energy balance sheets – 2017 data
Bosnia and Herzegovina 2017

6 Sankey diagrams (energy flow diagrams)
232 Energy balance sheets – 2017 data
Kosovo 2017

6 Sankey diagrams (energy flow diagrams)
233 Energy balance sheets – 2017 data
Ukraine 2017

6 Sankey diagrams (energy flow diagrams)
234 Energy balance sheets – 2017 data
Georgia 2017

Getting in touch with the EU
In person
All over the European Union there are hundreds of Europe Direct Information Centres. You can
find the address of the centre nearest you at: https://europa.eu/contact
On the phone or by e-mail
Europe Direct is a service that answers your questions about the European Union. You can
contact this service
– by freephone: 00 800 6 7 8 9 10 11 (certain operators may charge for these calls),
– at the following standard number: +32 22999696 or
– by electronic mail via: https://europa.eu/contact
Finding information about the EU
Online
Information about the European Union in all the official languages of the EU is available on the
Europa website at: http://europa.eu
EU Publications
You can download or order free and priced EU publications from EU Bookshop at:
http://bookshop.europa.eu. Multiple copies of free publications may be obtained by contacting
Europe Direct or your local information centre (see https://europa.eu/contact)
EU law and related documents
For access to legal information from the EU, including all EU law since 1951 in all the official
language versions, go to EUR-Lex at: https://eur-lex.europa.eu
Open data from the EU
The EU Open Data Portal (http://data.europa.eu/euodp/en/data) provides access to datasets from
the EU. Data can be downloaded and reused for free, both for commercial and non-commercial
purposes.

Main title
2016 edition
Energy balance sheets2017 DATA
The current publication presents the simplified energy balance sheets for 2017 and time series of key elements of energy balances for the years 2005, 2010, 2011, 2012, 2013, 2014 , 2015, 2016 and 2017. Energy data are available for all Member States of the European Union as well as Iceland, Norway, Montenegro, North Macedonia, Albania, Serbia, Turkey, Bosnia and Herzegovina, Kosovo (UNSCR 1244/99), Georgia and Ukraine. The energy balances have been constructed according to Eurostat’s methodology on the basis of the energy content of each source and form of energy. The energy balances are expressed in thousands of tonnes of oil equivalent (ktoe).
For more informationhttps://ec.europa.eu/eurostat/
KS-EN-19-001-EN
-N
ISBN 978-92-76-08714-4