F Financial Accounts of the United States Flow of Funds, Balance Sheets, and Integrated...
175
F EDERAL R ESERVE S TATISTICAL R ELEASE For use at 12:00 p.m., eastern time September 18, 2014 Z.1 Financial Accounts of the United States Flow of Funds, Balance Sheets, and Integrated Macroeconomic Accounts Second Quarter 2014 B OARD OF G OVERNORS OF THE F EDERAL R ESERVE S YSTEM
-
Upload
independent -
Category
Documents
-
view
0 -
download
0
Transcript of F Financial Accounts of the United States Flow of Funds, Balance Sheets, and Integrated...
F E D E R A L R E S E R V E S T A T I S T I C A L R E L E A S E
RFor use at 12:00 p.m., eastern time
September 18, 2014
Z.1
Financial Accounts of the United States
Flow of Funds, Balance Sheets,
and Integrated Macroeconomic Accounts
Second Quarter 2014
B O A R D O F G O V E R N O R S O F T H E F E D E R A L R E S E R V E S Y S T E M

i
Household Net Worth and Growth of Domestic Nonfinancial Debt
Year Household net worth
1
Growth of domestic nonfinancial debt2
Total Households Business State and
local govts. Federal
2005 61,886 9.0 11.2 8.1 5.8 7.0
2006 66,393 8.4 10.2 9.8 3.9 3.9
2007 66,803 8.2 7.0 12.4 5.5 4.9
2008 56,526 6.2 1.1 5.8 0.6 24.2
2009 58,269 3.3 0.0 -4.3 4.0 22.7
2010 62,484 4.1 -1.1 -0.9 2.3 20.2
2011 63,698 3.6 -0.2 3.0 -1.7 11.4
2012 69,523 5.0 1.6 4.8 -0.2 10.9
2013 78,868 3.8 1.6 5.1 -1.3 6.5
2012: Q1 65,860 5.1 1.1 4.0 0.0 12.6
Q2 66,046 5.5 2.7 3.7 2.1 11.6
Q3 68,241 3.8 0.6 4.2 -0.2 8.4
Q4 69,523 5.2 1.9 7.0 -2.6 9.3
2013: Q1 72,290 4.1 0.8 3.5 1.9 9.1
Q2 73,814 3.0 1.6 4.9 -0.2 3.5
Q3 76,160 3.5 3.1 7.0 -3.7 2.6
Q4 78,868 4.4 0.7 4.5 -3.3 10.5
2014: Q1 80,102 4.3 2.2 6.2 -1.3 6.0
Q2 81,493 3.8 3.6 6.3 1.2 2.5
1. Shown on table B.100, which includes nonprofit organizations. Billions of dollars; amounts outstanding end of period, not
seasonally adjusted
2. Percentage changes calculated as seasonally adjusted flow divided by previous quarter’s seasonally adjusted level, shown
at an annual rate.
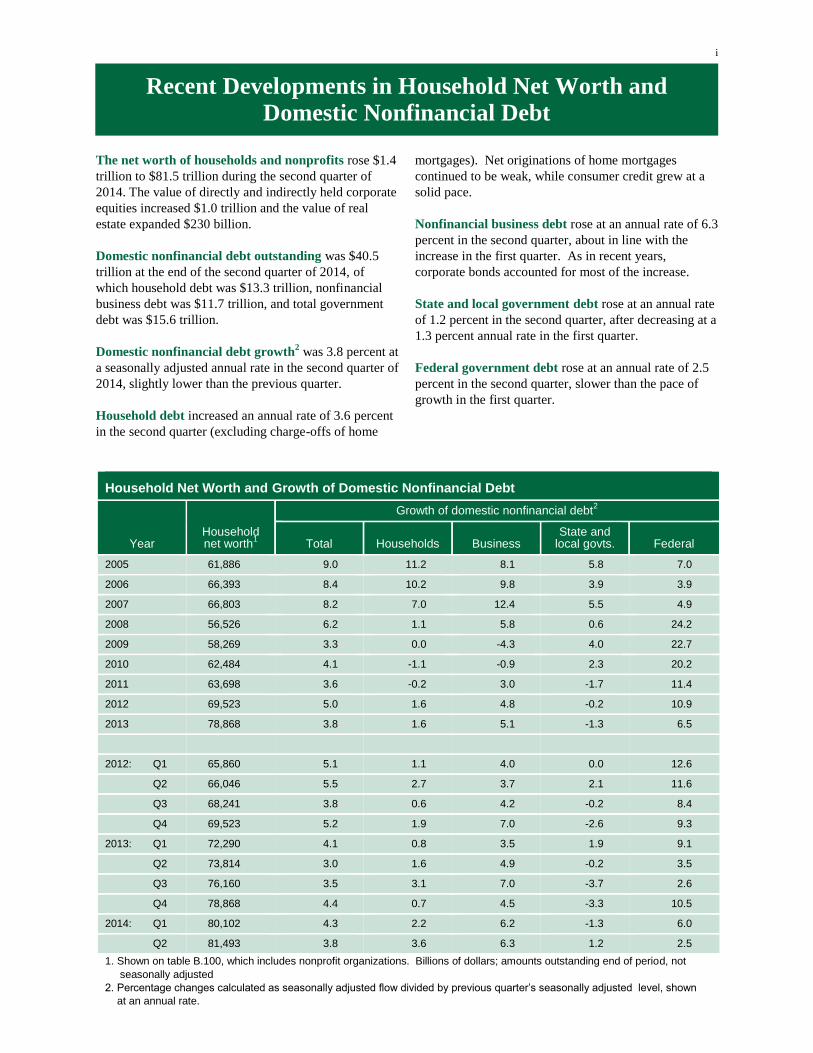
The net worth of households and nonprofits rose $1.4
trillion to $81.5 trillion during the second quarter of
2014. The value of directly and indirectly held corporate
equities increased $1.0 trillion and the value of real
estate expanded $230 billion.
Domestic nonfinancial debt outstanding was $40.5
trillion at the end of the second quarter of 2014, of
which household debt was $13.3 trillion, nonfinancial
business debt was $11.7 trillion, and total government
debt was $15.6 trillion.
Domestic nonfinancial debt growth2 was 3.8 percent at
a seasonally adjusted annual rate in the second quarter of
2014, slightly lower than the previous quarter.
Household debt increased an annual rate of 3.6 percent
in the second quarter (excluding charge-offs of home
mortgages). Net originations of home mortgages
continued to be weak, while consumer credit grew at a
solid pace.
Nonfinancial business debt rose at an annual rate of 6.3
percent in the second quarter, about in line with the
increase in the first quarter. As in recent years,
corporate bonds accounted for most of the increase.
State and local government debt rose at an annual rate
of 1.2 percent in the second quarter, after decreasing at a
1.3 percent annual rate in the first quarter.
Federal government debt rose at an annual rate of 2.5
percent in the second quarter, slower than the pace of
growth in the first quarter.
Recent Developments in Household Net Worth and Domestic Nonfinancial Debt

ii

iii
Topic Description
Annual revision of the national
income and product accounts
The statistics in this publication reflect the annual revisions to
the national income and product accounts (NIPAs) from
1999:Q1 forward released by the Bureau of Economic Analysis
(BEA) of the Department of Commerce on July 30, 2014, and
subsequent information for 2014:Q2 released on August 28,
2014. The August 2014 issue of the Survey of Current Business
provides details on the major features of this annual revision.
Fixed assets Data for investment and depreciation flows and capital stocks for
all sectors have been revised to reflect updated annual
estimates of fixed assets from the BEA.
Seasonal adjustment Seasonal factors for quarterly flows have been recalculated for
the period 2004:Q1 forward. The seasonal factors were
generated using the X-12-ARIMA seasonal adjustment program
by the U.S. Census Bureau.
Rest of the world comprehensive
revision
Revisions to the rest of the world sector (tables F.106 and
L.106) reflect new estimates of the U.S. international
transactions accounts (ITAs) and the U.S. international
investment position (IIP) accounts released by BEA for 1999
through 2013. With this revision, BEA introduced a new
presentation of the ITAs as part of a comprehensive
restructuring to bring the international accounts into closer
alignment with new international statistical guidelines detailed in
the International Monetary Funds' Balance of Payments and
International Investment Position Manual, 6th edition. BEA's
changes are detailed in the July 2014 Survey of Current
Business.
Direct investment table U.S. direct investment abroad and foreign direct investment in
the U.S. are no longer treated as part of the identified
miscellaneous financial claims instrument category. Starting
with this publication, a new instrument table "Direct Investment"
(tables F.229 and L.229) presents these items. This table also
shows additional detail on direct investment including
asset/liability-basis presentations and alternative valuations
made available with BEA's recent revision of the International
Economic Accounts. A forthcoming FEDS note by will provide
additional information.
Defined contribution retirement
funds for state and local
government employees
State and local government employee retirement funds (tables
F.118 and L.118) have been expanded to include defined
contribution (DC) plans. These DC plans consist of 403(b) and
457 plans. Previously, only defined benefit (DB) plans were
reported for this sector. A forthcoming FEDS note will provide
additional information.
Release Highlights Second Quarter 2014

iv
Topic Description
Public pension supplemental tables Detail on defined benefit (DB) and defined contribution (DC)
pension plans for the public sectors are now available on
supplementary tables. State and local government employee
retirement DB plans are shown on tables F.118.b and L.118.b
and DC plans are shown on tables F.118.c and L.118.c.
Similarly, federal government employee retirement DB plans are
shown on tables F.119.b and L.119.b and DC plans are shown
on tables F.119.c and L.119.c.
Nonfinancial corporate bonds Net issuance of corporate bonds (tables F.102, F.212, L.102,
L.212, and B.102) by the nonfinancial corporate business sector
has been revised from 1995:Q2 forward to reflect new
methodology and data sources. The amounts outstanding are
calculated using a perpetual inventory method.
SDDS plus international
submissions (SDMX)
International data submission tables in the “Financial Accounts
Guide”, previously located under “All Tables,” have been moved
to a new page, “International Data Submissions.” This page
includes two new tables: General Government Total Gross Debt
and Sectoral Balance Sheets, required by the International
Monetary Fund (IMF) for adherence to the SDDS Plus
initiative. It also includes the four matrices (tables 610, 620,
710, and 720) produced for the OECD. SDMX files for these six
tables are available on the “International Data Submissions”
page.
FEDS Notes More in-depth discussion of selected topics relevant to the
“Financial Accounts of the United States” are now available in
FEDS Notes. The following notes are currently available: “The
Federal Debt-Limit Standoff of 2013 in the Financial Accounts of
the United States” (Ivan Vidangos), “Repurchase Agreements in
the Financial Accounts of the United States” (Elizabeth
Holmquist and Josh Gallin), and “Enhanced Financial Accounts”
(Josh Gallin and Paul Smith). Topics for forthcoming FEDS
Notes include pension entitlements, direct investment, home
mortgage charge-offs, and defined contribution retirement funds
for state and local government employee. FEDS Notes are
available on the Federal Reserve Board’s website at
www.federalreserve.gov/econresdata/notes/feds-notes/default.html.
A link to the FEDS Notes website is available on the home page
of the “Financial Accounts Guide.” Links to the appropriate
FEDS Notes are also available in the table descriptions of the
“Financial Accounts Guide.”

v
Financial Accounts of the United States
The Statistical Release Z.1, “Financial Accounts of the
United States” are organized into the following sections:
■ Matrices summarizing flows and levels across
sectors, and tables summarizing credit market
borrowing, gross domestic product (GDP),
national income, saving, and so on
■ Flow of funds, by sector and financial
instrument
■ Levels of financial assets and liabilities, by
sector and financial instrument
■ Balance sheets, including nonfinancial assets,
and changes in net worth for households and
nonprofit organizations, nonfinancial corporate
businesses, and nonfinancial noncorporate
businesses
Supplementary tables providing additional ■detail on selected sectors
■ Integrated Macroeconomic Accounts
The Integrated Macroeconomic Accounts (IMA) relate
production, income, saving, and capital formation from
the national income and product accounts (NIPA) to
changes in net worth from the “Financial Accounts” on a
sector-by-sector basis. The IMA are published jointly
by the Federal Reserve Board and the Bureau of
Economic Analysis and are based on international
guidelines and terminology as defined in the System of
National Accounts (SNA1993, revised in 2008).
Federal Reserve Board staff have taken many steps over
the past several years to conform the “Financial
Accounts” with the SNA guidelines. Nonetheless, a few
important differences remain. In particular, in the
“Financial Accounts”:
■ The purchase of consumer durables is treated as
investment rather than as consumption.
■ Nonfinancial noncorporate business (which are
often small businesses) are shown in a separate
sector rather than being included in the
household sector.
■ Most debt securities are recorded at book value
rather than market value.
Concepts of Level and Flow in the SNA and the Financial Accounts
The level of an asset or liability (also referred to as the
stock or outstanding) measures the value of the asset or
liability in existence at a point in time. In the “Financial
Accounts,” the levels are reported as of the end of each
calendar quarter. In the SNA2008, the change in the
level from one period to the next is called the “economic
flow”, and can be decomposed into three broad
elements: transactions, which measure the exchange of
assets; revaluations, which measure changes in market
value of untraded assets; and other changes in volume,
which measure discontinuities or breaks in time series
due to disaster losses or a change in source data or
definition.
In the “Financial Accounts,” “flow of funds” refers to
the exchange of assets, corresponding to the SNA
definition of transactions, that is, “flow tables” in the
“Financial Accounts” are equivalent to “transaction
tables” in the SNA terminology. In practice, other
volume changes are relatively rare, and revaluations
only occur for series carried at market value (such as
corporate equities and mutual fund shares), so for many
series the change in the level is equal to the flow.
Growth Rates
Growth rates calculated from levels will include
revaluations and other changes in volume. To isolate
the effect of transactions on growth of a given asset or
liability, users should calculate the ratio of the flow in a
given period to the level in the preceding period.
Growth rates in table D.1 are calculated by dividing
seasonally adjusted flows from table D.2 by seasonally
adjusted levels at the end of the previous period from
table D.3. Growth rates calculated from changes in
unadjusted levels printed in table L.2 may differ from
those in table D.1.
Seasonal Adjustment
Seasonal factors are recalculated and updated every
year, and these revised factors are first published in the
September release of second-quarter data. All series that
exhibit significant seasonal patterns are adjusted. The
seasonal factors are generated using the X-12-ARIMA
seasonal adjustment program from the U.S. Census
Bureau, estimated using the most recent 10 years of
data. Because the effects of the recent financial crisis
resulted in large outliers in some series that would have
distorted the estimated seasonal factors, seasonal factors
for some series were extrapolated using pre-crisis data.
Seasonally adjusted levels shown in table D.3 are
derived by carrying forward year-end levels by
seasonally adjusted flows.
Explanatory Notes
vi
Data Revisions
Data shown for the most recent quarters are based on
preliminary and potentially incomplete information. A
summary list of the most recent data available for each
sector is provided in a table following these notes.
Nonetheless, when source data are revised or estimation
methods are improved, all data are subject to revision.
There is no specific revision schedule; rather, data are
revised on an ongoing basis. In each release of the
“Financial Accounts,” major revisions are highlighted at
the beginning of the publication.
Discrepancies
The data in the “Financial Accounts” come from a large
variety of sources and are subject to limitations and
uncertainty due to measurement errors, missing
information, and incompatibilities among data sources.
The size of this uncertainty cannot be quantified, but its
existence is acknowledged by the inclusion of
“statistical discrepancies” for various sectors and
financial instruments.
The discrepancy for a given sector is defined as the
difference between the aggregate value of the sector’s
sources of funds and the value of its uses of funds. For a
financial instrument category, the discrepancy is defined
as the difference between the measurement of funds
raised through the financial instrument and funds
disbursed through that instrument. The relative size of
the statistical discrepancy is one indication of the quality
of the underlying source data. Note that differences in
seasonal adjustment procedures sometimes result in
quarterly discrepancies that partially or completely
offset each other in the annual data.
The Financial Accounts Guide
Substantially more detail on the construction of the
“Financial Accounts” is available in the “Financial
Accounts Guide,” which provides interactive, online
documentation for each data series. The tools and
descriptions in the guide are designed to help users
understand the structure and content of the “Financial
Accounts.” The guide allows users to search for series,
browse tables of data, and identify links among series
within these accounts. It also provides descriptions of
each of the published tables and information on the
source data underlying each series.
The guide is not part of the quarterly release, but it is
continually updated and kept consistent with the most
recently published data. The guide and the data from the
“Financial Accounts” are available free of charge at the
following link:
www.federalreserve.gov/apps/fof/
Each input and calculated series in the Z.1 is identified
according to a unique string of patterned numbers and
letters. The series structure page of the guide provides a
breakdown of what the letters and numbers represent in
the series mnemonics. The relationships between
different components of a series (for example, levels,
seasonally adjusted annual rate flows, unadjusted flows,
revaluations, other changes in volume, seasonal factors,
and so on) are also described on the series structure
page.
Production Schedule
The “Financial Accounts” are published online and in
print 4 times per year, about 10 weeks following the end
of each calendar quarter. The publication and the guide
are available online here:
www.federalreserve.gov/releases/Z1
This website also provides coded tables and historical
annual tables beginning in 1945 that correspond with the
tables published in this release. There are also
compressed ASCII files of quarterly data for seasonally
adjusted flows, unadjusted flows, outstandings, balance
sheets, debt (tables D.1, D.2, and D.3), supplementary
tables, and the IMA.
In addition, the data are available as customizable
datasets through the Federal Reserve Board’s Data
Download Program (DDP) here:
www.federalreserve.gov/datadownload/Choose.aspx?rel=Z.1
Print Subscription Information
The Federal Reserve Board charges a fee for
subscriptions to print versions of statistical releases.
Inquiries regarding print versions should be directed to
the following office:
Publications Services, Stop 127
Board of Governors
of the Federal Reserve System
20th Street and Constitution Avenue, N.W.
Washington, DC 20551
(202) 452-3245

vii
Sector Table Available at time of publication
National income and product
accounts (NIPA)
(various tables)
Second estimate, seasonally adjusted, for 2014:Q2. Unadjusted
flows since 2012 for the government sectors and since 2006 for
all other sectors are unavailable.
Households and nonprofit
organizations sector
(tables F.100 and L.100)
Estimates for this sector are largely residuals and are derived
from data for other sectors. Availability of data depends on
schedules for other sectors. Data for consumer credit, which are
estimated directly, are available through 2014:Q2. The source
for nonprofit organizations data (tables F.100.a and L.100.a) is
the Internal Revenue Service Statistics of Income. Data for
nonprofit organizations are available for 1987 through 2000.
Nonfinancial corporate business
(tables F.102 and L.102)
Quarterly Financial Report (QFR) of the Census Bureau through
2014:Q2; Internal Revenue Service Statistics of Income
(IRS/SOI) data through 2012; securities offerings, mortgages,
bank loans, commercial paper, and other loans through
2014:Q2. Corporate farm data through 2013.
Nonfinancial noncorporate business
(tables F.103 and L.103)
IRS/SOI data through 2011; bank and finance company loans,
and mortgage borrowing through 2014:Q2. Noncorporate farm
data through 2013.
State and local governments
(tables F.104 and L.104)
Gross offerings and retirements of municipal securities, deposits
at banks, and nonmarketable U.S. government security issues
through 2014:Q2; total financial assets through 2011:Q2 from
the Census Bureau; breakdown of financial assets through
2011:Q2 from the comprehensive annual financial reports of
state and local governments.
Federal government
(tables F.105 and L.105)
Data from the Monthly Treasury Statement of Receipts and
Outlays and Treasury data for loan programs and the Troubled
Assets Relief Program (TARP) through 2014:Q2.
Rest of the world
(tables F.106 and L.106)
Balance of payments through 2014:Q2 and International
Investment Position data through 2014:Q1. NIPA estimates;
bank Call Reports and Treasury International Capital System
data through 2014:Q2.
Monetary authority
(tables F.108 and L.108)
All data through 2014:Q2.
U.S.-chartered depository
institutions
(tables F.110 and L.110)
All data through 2014:Q2.
Foreign banking offices in U.S.
(tables F.111 and L.111)
All data through 2014:Q2.
Banks in U.S.-affiliated areas
(tables F.112 and L.112)
All data through 2014:Q2.
Credit unions
(tables F.113 and L.113)
All data through 2014:Q2.
Description of Most Recent Data Available
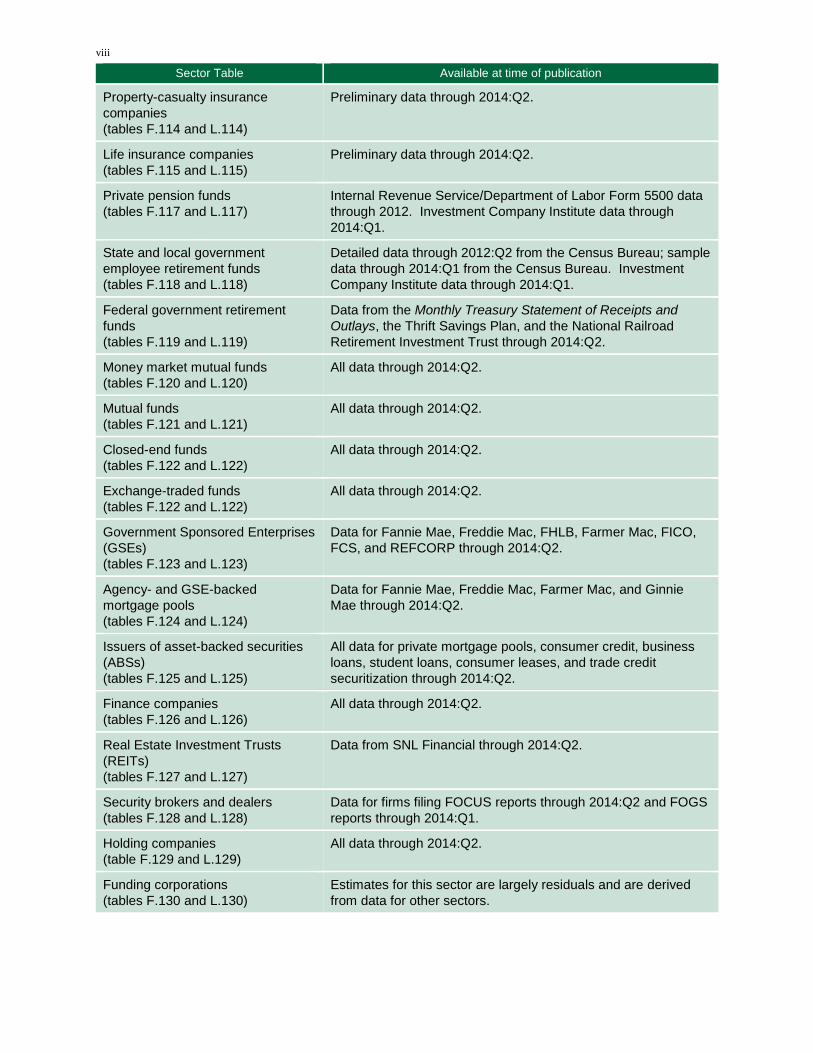
viii
Sector Table Available at time of publication
Property-casualty insurance
companies
(tables F.114 and L.114)
Preliminary data through 2014:Q2.
Life insurance companies
(tables F.115 and L.115)
Preliminary data through 2014:Q2.
Private pension funds
(tables F.117 and L.117)
Internal Revenue Service/Department of Labor Form 5500 data
through 2012. Investment Company Institute data through
2014:Q1.
State and local government
employee retirement funds
(tables F.118 and L.118)
Detailed data through 2012:Q2 from the Census Bureau; sample
data through 2014:Q1 from the Census Bureau. Investment
Company Institute data through 2014:Q1.
Federal government retirement
funds
(tables F.119 and L.119)
Data from the Monthly Treasury Statement of Receipts and
Outlays, the Thrift Savings Plan, and the National Railroad
Retirement Investment Trust through 2014:Q2.
Money market mutual funds
(tables F.120 and L.120)
All data through 2014:Q2.
Mutual funds
(tables F.121 and L.121)
All data through 2014:Q2.
Closed-end funds
(tables F.122 and L.122)
All data through 2014:Q2.
Exchange-traded funds
(tables F.122 and L.122)
All data through 2014:Q2.
Government Sponsored Enterprises
(GSEs)
(tables F.123 and L.123)
Data for Fannie Mae, Freddie Mac, FHLB, Farmer Mac, FICO,
FCS, and REFCORP through 2014:Q2.
Agency- and GSE-backed
mortgage pools
(tables F.124 and L.124)
Data for Fannie Mae, Freddie Mac, Farmer Mac, and Ginnie
Mae through 2014:Q2.
Issuers of asset-backed securities
(ABSs)
(tables F.125 and L.125)
All data for private mortgage pools, consumer credit, business
loans, student loans, consumer leases, and trade credit
securitization through 2014:Q2.
Finance companies
(tables F.126 and L.126)
All data through 2014:Q2.
Real Estate Investment Trusts
(REITs)
(tables F.127 and L.127)
Data from SNL Financial through 2014:Q2.
Security brokers and dealers
(tables F.128 and L.128)
Data for firms filing FOCUS reports through 2014:Q2 and FOGS
reports through 2014:Q1.
Holding companies
(table F.129 and L.129)
All data through 2014:Q2.
Funding corporations
(tables F.130 and L.130)
Estimates for this sector are largely residuals and are derived
from data for other sectors.

ix
Title Table Page
Summaries
Flow of Funds Matrix – Flows 1
Flow of Funds Matrix – Assets and Liabilities 2
Credit Market Debt Growth by Sector D.1 3
Credit Market Borrowing by Sector D.2 4
Credit Market Debt Outstanding by Sector D.3 5
Total Credit Market Borrowing and Lending F.1 6
Credit Market Borrowing by Nonfinancial Sectors F.2 7
Credit Market Borrowing by Financial Sectors F.3 7
Credit Market Borrowing, All Sectors, by Instrument F.4 8
Total Liabilities and Its Relation to Total Financial Assets F.5 8
Credit Market Debt Outstanding L.1 9
Credit Market Debt Owed by Nonfinancial Sectors L.2 10
Credit Market Debt Owed by Financial Sectors L.3 10
Credit Market Debt, All Sectors, by Instrument L.4 11
Total Liabilities and Its Relation to Total Financial Assets L.5 11
Distribution of Gross Domestic Product F.6 12
Distribution of National Income F.7 13
Saving and Investment F.8 14
Net Capital Transfers F.9 15
Derivation of Measures of Personal Saving F.10 16
Assets and Liabilities of the Personal Sector L.10 17
Title
Flows Levels
Table Page Table Page
Sectors
Households and Nonprofit Organizations F.100 18 L.100 68
Nonfinancial Business F.101 19 L.101 69
Nonfinancial Corporate Business F.102 20 L.102 70
Nonfinancial Noncorporate Business F.103 21 L.103 71
State and Local Governments F.104 22 L.104 72
Federal Government F.105 23 L.105 73
List of Data Tables
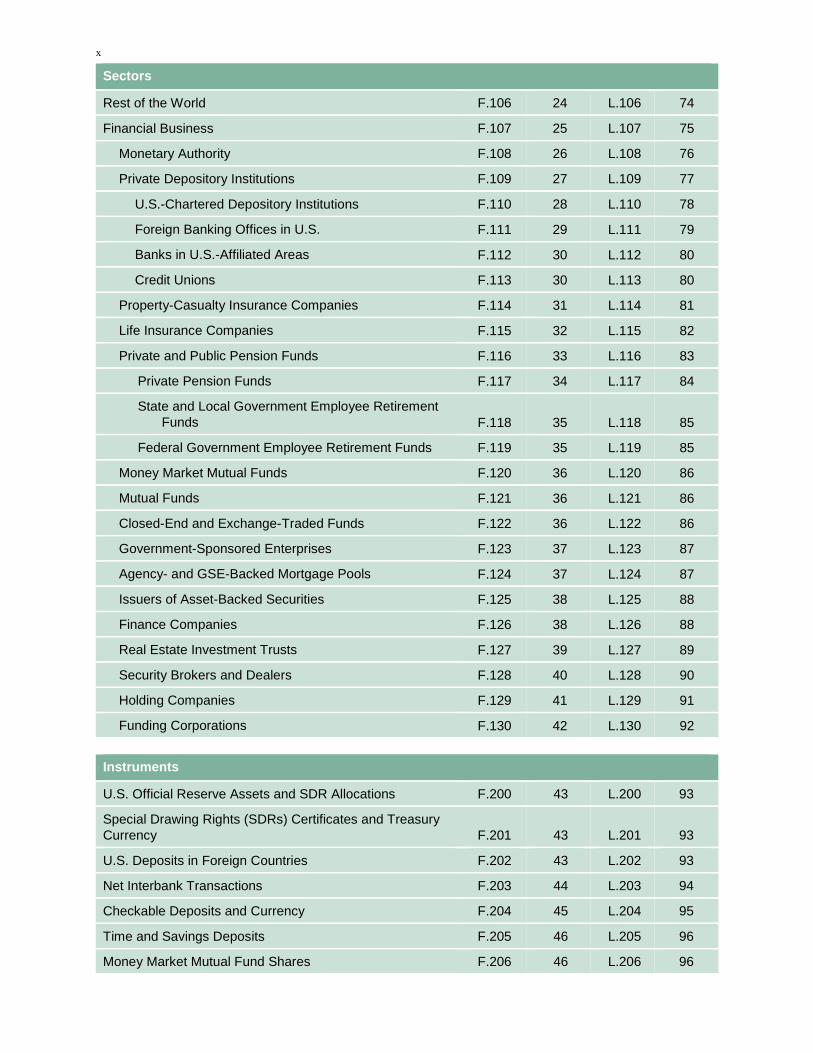
x
Sectors
Rest of the World F.106 24 L.106 74
Financial Business F.107 25 L.107 75
Monetary Authority F.108 26 L.108 76
Private Depository Institutions F.109 27 L.109 77
U.S.-Chartered Depository Institutions F.110 28 L.110 78
Foreign Banking Offices in U.S. F.111 29 L.111 79
Banks in U.S.-Affiliated Areas F.112 30 L.112 80
Credit Unions F.113 30 L.113 80
Property-Casualty Insurance Companies F.114 31 L.114 81
Life Insurance Companies F.115 32 L.115 82
Private and Public Pension Funds F.116 33 L.116 83
Private Pension Funds F.117 34 L.117 84
State and Local Government Employee Retirement
Funds F.118 35 L.118 85
Federal Government Employee Retirement Funds F.119 35 L.119 85
Money Market Mutual Funds F.120 36 L.120 86
Mutual Funds F.121 36 L.121 86
Closed-End and Exchange-Traded Funds F.122 36 L.122 86
Government-Sponsored Enterprises F.123 37 L.123 87
Agency- and GSE-Backed Mortgage Pools F.124 37 L.124 87
Issuers of Asset-Backed Securities F.125 38 L.125 88
Finance Companies F.126 38 L.126 88
Real Estate Investment Trusts F.127 39 L.127 89
Security Brokers and Dealers F.128 40 L.128 90
Holding Companies F.129 41 L.129 91
Funding Corporations F.130 42 L.130 92
Instruments
U.S. Official Reserve Assets and SDR Allocations F.200 43 L.200 93
Special Drawing Rights (SDRs) Certificates and Treasury
Currency F.201 43 L.201 93
U.S. Deposits in Foreign Countries F.202 43 L.202 93
Net Interbank Transactions F.203 44 L.203 94
Checkable Deposits and Currency F.204 45 L.204 95
Time and Savings Deposits F.205 46 L.205 96
Money Market Mutual Fund Shares F.206 46 L.206 96
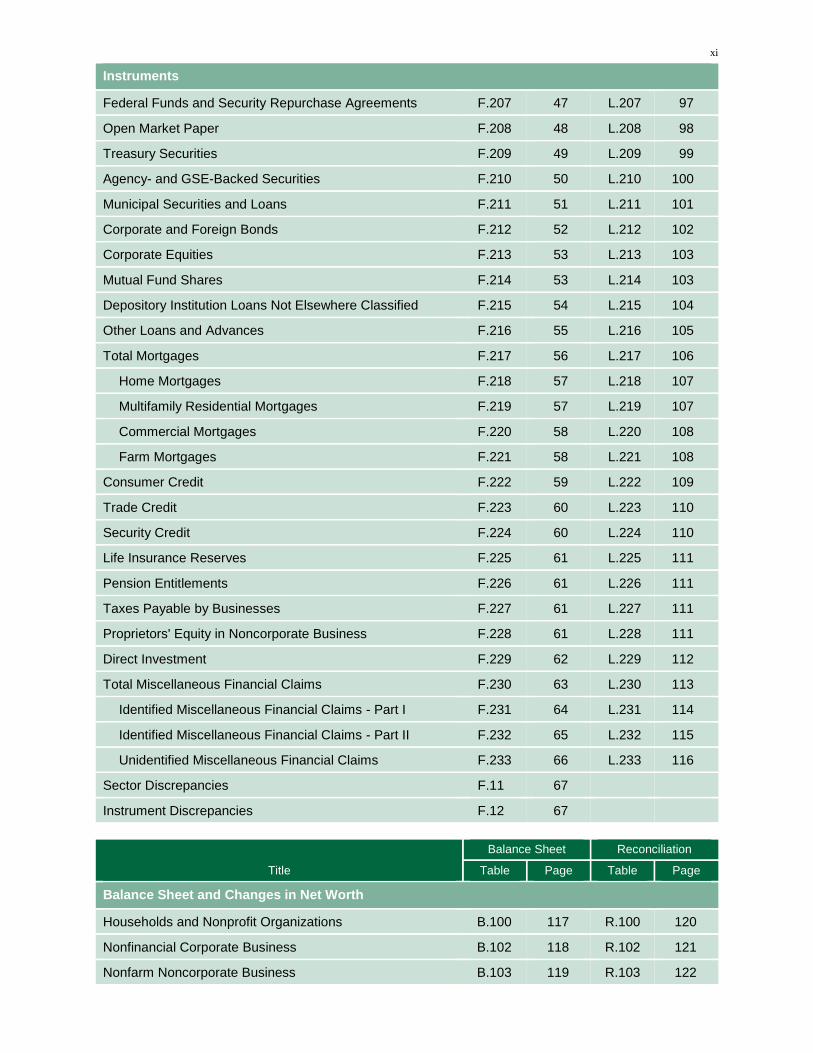
xi
Instruments
Federal Funds and Security Repurchase Agreements F.207 47 L.207 97
Open Market Paper F.208 48 L.208 98
Treasury Securities F.209 49 L.209 99
Agency- and GSE-Backed Securities F.210 50 L.210 100
Municipal Securities and Loans F.211 51 L.211 101
Corporate and Foreign Bonds F.212 52 L.212 102
Corporate Equities F.213 53 L.213 103
Mutual Fund Shares F.214 53 L.214 103
Depository Institution Loans Not Elsewhere Classified F.215 54 L.215 104
Other Loans and Advances F.216 55 L.216 105
Total Mortgages F.217 56 L.217 106
Home Mortgages F.218 57 L.218 107
Multifamily Residential Mortgages F.219 57 L.219 107
Commercial Mortgages F.220 58 L.220 108
Farm Mortgages F.221 58 L.221 108
Consumer Credit F.222 59 L.222 109
Trade Credit F.223 60 L.223 110
Security Credit F.224 60 L.224 110
Life Insurance Reserves F.225 61 L.225 111
Pension Entitlements F.226 61 L.226 111
Taxes Payable by Businesses F.227 61 L.227 111
Proprietors' Equity in Noncorporate Business F.228 61 L.228 111
Direct Investment F.229 62 L.229 112
Total Miscellaneous Financial Claims F.230 63 L.230 113
Identified Miscellaneous Financial Claims - Part I F.231 64 L.231 114
Identified Miscellaneous Financial Claims - Part II F.232 65 L.232 115
Unidentified Miscellaneous Financial Claims F.233 66 L.233 116
Sector Discrepancies F.11 67
Instrument Discrepancies F.12 67
Title
Balance Sheet Reconciliation
Table Page Table Page
Balance Sheet and Changes in Net Worth
Households and Nonprofit Organizations B.100 117 R.100 120
Nonfinancial Corporate Business B.102 118 R.102 121
Nonfarm Noncorporate Business B.103 119 R.103 122
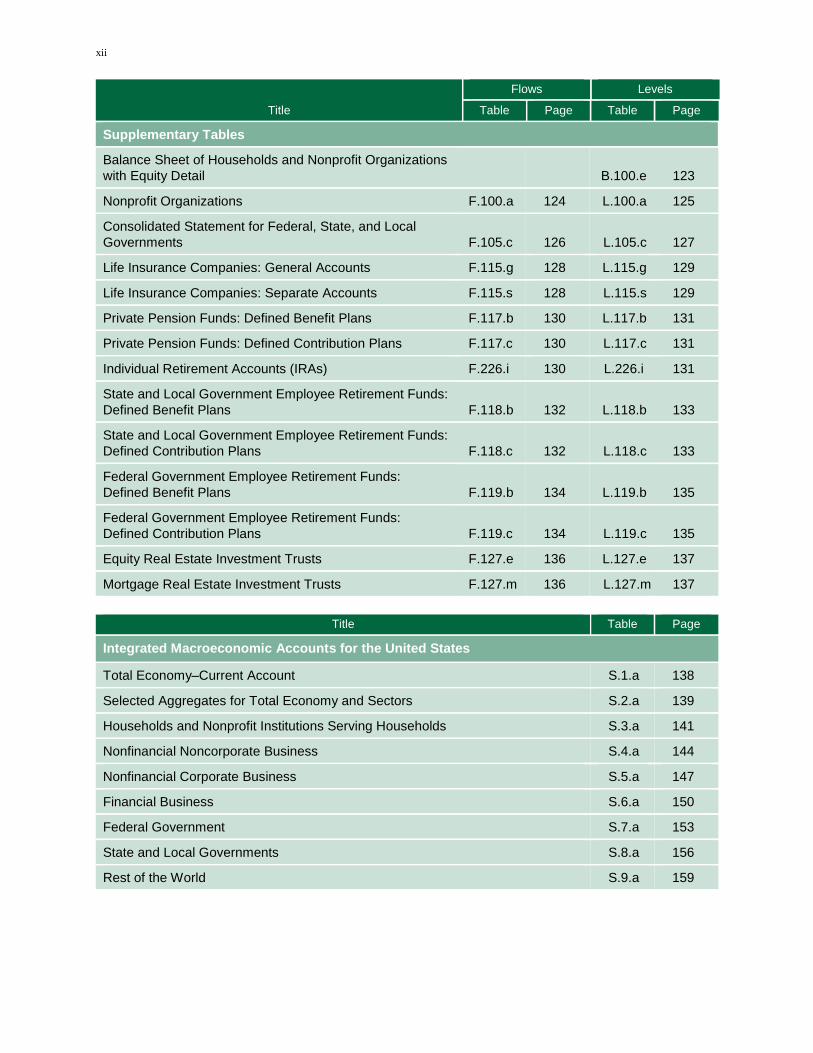
xii
Title
Flows Levels
Table Page Table Page
Supplementary Tables
Balance Sheet of Households and Nonprofit Organizations
with Equity Detail B.100.e 123
Nonprofit Organizations F.100.a 124 L.100.a 125
Consolidated Statement for Federal, State, and Local
Governments F.105.c 126 L.105.c 127
Life Insurance Companies: General Accounts F.115.g 128 L.115.g 129
Life Insurance Companies: Separate Accounts F.115.s 128 L.115.s 129
Private Pension Funds: Defined Benefit Plans F.117.b 130 L.117.b 131
Private Pension Funds: Defined Contribution Plans F.117.c 130 L.117.c 131
Individual Retirement Accounts (IRAs) F.226.i 130 L.226.i 131
State and Local Government Employee Retirement Funds:
Defined Benefit Plans F.118.b 132 L.118.b 133
State and Local Government Employee Retirement Funds:
Defined Contribution Plans F.118.c 132 L.118.c 133
Federal Government Employee Retirement Funds:
Defined Benefit Plans F.119.b 134 L.119.b 135
Federal Government Employee Retirement Funds:
Defined Contribution Plans F.119.c 134 L.119.c 135
Equity Real Estate Investment Trusts F.127.e 136 L.127.e 137
Mortgage Real Estate Investment Trusts F.127.m 136 L.127.m 137
Title Table Page
Integrated Macroeconomic Accounts for the United States
Total Economy–Current Account S.1.a 138
Selected Aggregates for Total Economy and Sectors S.2.a 139
Households and Nonprofit Institutions Serving Households S.3.a 141
Nonfinancial Noncorporate Business S.4.a 144
Nonfinancial Corporate Business S.5.a 147
Financial Business S.6.a 150
Federal Government S.7.a 153
State and Local Governments S.8.a 156
Rest of the World S.9.a 159

Su
mm
ary
1
Z.1
, Sep
tem
ber
18, 2
014
Flo
w o
f F
unds
Mat
rix
for
2013
(Bill
ions
of
dolla
rs; A
ll Se
ctor
s --
Flo
ws)
Hou
seho
lds
Stat
eD
omes
ticD
omes
ticIn
stru
men
tan
d N
onpr
ofit
Non
fina
ncia
lan
d L
ocal
Fede
ral
Non
fina
ncia
lFi
nanc
ial
Res
t of
All
Dis
crep
-O
rgan
izat
ions
Bus
ines
sG
over
nmen
tsG
over
nmen
tSe
ctor
sSe
ctor
sth
e W
orld
Sect
ors
ancy
U
SU
SU
SU
SU
SU
SU
SU
S
(1)
(2)
(3)
(4)
(5)
(6)
(7)
(8)
(9)
(10)
(11)
(12)
(13)
(14)
(15)
(16)
(17)
1G
ross
sav
ing
less
net
cap
. tra
nsfe
rs--
21
93.2
--
2090
.6--
84
.9--
-4
43.7
--
3924
.9--
28
1.8
--
423.
0--
46
29.8
--
2
Cap
ital c
onsu
mpt
ion
--
1411
.7--
15
15.0
--
238.
4--
26
8.0
--
3433
.1--
17
8.8
--
--
--
3611
.9--
3
N
et s
avin
g (1
less
2)
--
781.
4--
57
5.6
--
-153
.5--
-7
11.7
--
491.
8--
10
3.1
--
423.
0--
10
17.9
--
4G
ross
inve
stm
ent (
5 pl
us 1
1)24
88.1
--
1599
.6--
64
.0--
-3
97.2
--
3754
.5--
37
8.4
--
350.
9--
44
83.7
--
146.
0 5
Cap
ital e
xpen
ditu
res
1740
.4--
18
63.7
--
336.
8--
26
6.1
--
4207
.0--
21
6.2
--
0.0
--
4423
.2--
20
6.5
6
Con
sum
er d
urab
les
1178
.9--
--
--
--
--
--
--
11
78.9
--
--
--
--
--
1178
.9--
--
7
R
esid
entia
l43
3.4
--
71.8
--
5.1
--
1.6
--
511.
8--
14
.7--
--
--
52
6.5
--
--
8
Non
resi
dent
ial
136.
0--
17
16.5
--
322.
8--
26
6.9
--
2442
.2--
20
1.5
--
--
--
2643
.7--
--
9
In
vent
ory
chan
ge--
--
74
.1--
--
--
--
--
74
.1--
--
--
--
--
74
.1--
--
10
N
onpr
oduc
ed n
onfi
nanc
ial a
sset
s-7
.9--
1.
3--
9.
0--
-2
.4--
-0
.0--
--
--
0.
0--
--
--
--
11N
et le
ndin
g (+
) or
net
bor
row
ing
(-)
747.
7--
-2
64.1
--
-272
.8--
-6
63.3
--
-452
.5--
16
2.2
--
350.
8--
60
.5--
-6
0.5
12T
otal
fin
anci
al a
sset
s99
1.2
--
967.
4--
18
.0--
21
7.4
--
2194
.0--
35
45.8
--
1170
.6--
69
10.4
--
--
13T
otal
liab
ilitie
s--
24
3.6
--
1231
.5--
29
0.8
--
880.
7--
26
46.5
--
3383
.6--
81
9.7
--
6849
.9--
14
U.S
. off
icia
l res
erve
ass
ets
--
--
--
--
--
--
-3.3
0.0
-3.3
0.0
0.2
--
0.0
-3.1
-3.1
-3.1
--
15
SDR
cer
tific
ates
--
--
--
--
--
--
--
0.0
--
0.0
0.0
--
--
--
0.0
0.0
--
16
Tre
asur
y cu
rren
cy--
--
--
--
--
--
--
-0
.4--
-0
.40.
7--
--
--
0.
7-0
.4-1
.117
Fo
reig
n de
posi
ts2.
8--
51
.9--
--
--
--
--
54
.7--
-9
.6--
--
32
.745
.232
.7-1
2.4
18
Inte
rban
k cl
aim
s--
--
--
--
--
--
--
--
--
--
76
0.1
1111
.629
4.7
--
1054
.811
11.6
56.8
19
Che
ckab
le d
ep. a
nd c
urre
ncy
135.
9--
74
.2--
6.
7--
69
.6--
28
6.4
--
-2.9
332.
649
.9--
33
3.4
332.
6-0
.720
T
ime
and
savi
ngs
depo
sits
206.
4--
58
.4--
12
.4--
-0
.5--
27
6.7
--
82.3
409.
150
.1--
40
9.1
409.
1--
21
M
oney
mar
ket f
und
shar
es21
.3--
42
.2--
4.
7--
--
--
68
.2--
-5
6.0
28.7
16.4
--
28.7
28.7
--
22
Fed.
fun
ds a
nd s
ecur
ity R
Ps--
--
-0
.9--
4.
2--
--
--
3.
3--
-3
75.6
-393
.662
.1-8
3.5
-310
.2-4
77.1
-167
.0
23
Cre
dit m
arke
t ins
trum
ents
-536
.420
4.1
-41.
254
6.6
-29.
6-3
8.9
124.
275
9.1
-483
.114
70.9
1885
.521
3.7
551.
126
8.8
1953
.519
53.5
--
24
O
pen
mar
ket p
aper
-3.8
--
-21.
814
.2-8
.1--
--
--
-3
3.7
14.2
34.3
-48.
9-1
.434
.0-0
.8-0
.8--
25
Tre
asur
y se
curi
ties
-188
.1--
1.
7--
-1
4.5
--
--
759.
5-2
00.9
759.
552
9.1
--
431.
3--
75
9.5
759.
5--
26
Age
ncy-
and
GSE
-bac
ked
sec.
-94.
7--
-3
.8--
-1
3.8
--
0.0
-0.4
-112
.2-0
.443
6.5
239.
9-8
4.7
--
239.
523
9.5
--
27
M
unic
ipal
sec
uriti
es-4
3.3
-13.
1-1
1.8
9.3
0.2
-39.
4--
--
-5
5.0
-43.
27.
4--
4.
3--
-4
3.2
-43.
2--
28
Cor
pora
te a
nd f
gn. b
onds
-197
.8--
--
28
0.6
2.5
--
-0.1
--
-195
.428
0.6
381.
0-8
4.3
205.
219
4.4
390.
839
0.8
--
29
D
epos
itory
inst
. loa
ns n
.e.c
.--
30
.0--
96
.1--
--
--
--
--
12
6.1
186.
120
.9--
39
.118
6.1
186.
1--
30
Oth
er lo
ans
and
adva
nces
5.0
2.0
--
59.8
--
0.5
7.2
--
12.2
62.4
133.
478
.3-3
.51.
414
2.1
142.
1--
31
Mor
tgag
es-7
.210
.90.
186
.64.
2--
4.
00.
01.
097
.510
4.2
7.8
--
--
105.
210
5.2
--
32
C
onsu
mer
cre
dit
-6.5
174.
3-5
.6--
--
--
11
3.1
--
100.
917
4.3
73.4
--
--
--
174.
317
4.3
--
33
Cor
pora
te e
quiti
es-5
9.3
--
--
-373
.31.
3--
-4
.8--
-6
2.8
-373
.320
3.0
163.
5-7
4.8
275.
265
.465
.4--
34
M
utua
l fun
d sh
ares
642.
5--
0.
9--
0.
7--
--
--
64
4.0
--
21.7
638.
8-2
7.0
--
638.
863
8.8
--
35
Tra
de c
redi
t--
1.
015
6.8
120.
38.
439
.6-1
.516
.816
3.7
177.
8-2
.20.
311
.93.
417
3.4
181.
48.
136
Se
curi
ty c
redi
t58
.535
.4--
--
--
--
--
--
58
.535
.445
.968
.9--
--
10
4.3
104.
3--
37
Lif
e in
sura
nce
rese
rves
19.2
--
--
--
--
--
--
0.3
19.2
0.3
10.8
29.8
--
--
30.0
30.0
--
38
Pens
ion
entit
lem
ents
494.
9--
--
--
--
--
--
--
49
4.9
--
--
494.
9--
--
49
4.9
494.
9--
39
T
axes
pay
able
--
--
--
-6.3
3.1
--
27.8
--
30.9
-6.3
--
17.7
--
--
30.9
11.4
-19.
540
E
quity
in n
onco
rp. b
usin
ess
-46.
8--
--
-4
3.0
--
--
--
--
-46.
8-4
3.0
--
-3.9
--
--
-46.
8-4
6.8
--
41
U.S
. dir
ect i
nves
tmen
t abr
oad
--
--
317.
4--
--
--
--
--
31
7.4
--
32.1
--
--
349.
534
9.5
349.
5--
42
Fo
reig
n di
rect
inve
stm
ent i
n U
.S.
--
--
--
207.
6--
--
--
--
--
20
7.6
--
28.7
236.
3--
23
6.3
236.
3--
43
M
isce
llane
ous
52.2
3.0
307.
777
9.6
6.2
290.
05.
910
4.8
372.
011
77.5
949.
724
2.9
--
-23.
313
21.7
1397
.075
.3
44Se
ctor
dis
crep
anci
es (
1 le
ss 4
)-2
94.9
--
491.
0--
20
.9--
-4
6.4
--
170.
4--
-9
6.6
--
72.2
--
146.
0--
14
6.0
Gen
eral
not
es:
U =
use
of
fund
s; S
= s
ourc
e of
fun
ds. D
omes
tic n
onfi
nanc
ial s
ecto
rs (
colu
mns
9 a
nd 1
0) a
re h
ouse
hold
s an
d no
npro
fit o
rgan
izat
ions
, non
fina
ncia
l bus
ines
s, s
tate
and
loca
l gov
ernm
ents
, and
fed
eral
gov
ernm
ent.

Su
mm
ary
2
Z.1
, Sep
tem
ber
18, 2
014
Flo
w o
f F
unds
Mat
rix
for
2013
(Bill
ions
of
dolla
rs; A
ll Se
ctor
s --
Ass
ets
and
Lia
bilit
ies)
Hou
seho
lds
Stat
eD
omes
ticD
omes
ticIn
stru
men
tan
d N
onpr
ofit
Non
fina
ncia
lan
d L
ocal
Fede
ral
Non
fina
ncia
lFi
nanc
ial
Res
t of
All
Dis
crep
-O
rgan
izat
ions
Bus
ines
sG
over
nmen
tsG
over
nmen
tSe
ctor
sSe
ctor
sth
e W
orld
Sect
ors
ancy
A
LA
LA
LA
LA
LA
LA
LA
L
(1)
(2)
(3)
(4)
(5)
(6)
(7)
(8)
(9)
(10)
(11)
(12)
(13)
(14)
(15)
(16)
(17)
1T
otal
fin
anci
al a
sset
s65
000.
1--
20
235.
0--
29
38.2
--
1713
.7--
89
887.
0--
81
073.
2--
21
093.
4--
19
2053
.6--
-5
692.
4
2T
otal
liab
ilitie
s an
d eq
uity
--
1380
1.2
--
5161
2.7
--
4931
.0--
16
132.
6--
86
477.
5--
83
173.
9--
16
709.
8--
18
6361
.2--
3
Tot
al li
abili
ties
--
1380
1.2
--
2181
0.9
--
4931
.0--
16
132.
6--
56
675.
7--
76
690.
6--
10
265.
5--
14
3631
.9--
4U
.S. o
ffic
ial r
eser
ve a
sset
s--
--
--
--
--
--
10
9.8
54.4
109.
854
.434
.6--
54
.413
3.4
198.
818
7.7
-11.
0
5SD
R c
ertif
icat
es--
--
--
--
--
--
--
5.
2--
5.
25.
2--
--
--
5.
25.
2--
6T
reas
ury
curr
ency
--
--
--
--
--
--
--
25.6
--
25.6
45.5
--
--
--
45.5
25.6
-19.
9 7
Fore
ign
depo
sits
52.5
--
87.8
--
--
--
--
--
140.
3--
33
.7--
--
95
4.8
174.
095
4.8
780.
8
8In
terb
ank
clai
ms
--
--
--
--
--
--
--
--
--
--
2321
.827
95.4
396.
7--
27
18.5
2795
.476
.9
9C
heck
able
dep
. and
cur
renc
y10
35.0
--
897.
8--
12
3.9
--
163.
0--
22
19.7
--
371.
531
86.5
590.
3--
31
81.5
3186
.54.
9
10T
ime
and
savi
ngs
depo
sits
7397
.8--
10
22.3
--
301.
9--
1.
5--
87
23.6
--
706.
598
72.9
442.
8--
98
72.9
9872
.9--
11
Mon
ey m
arke
t fun
d sh
ares
1145
.2--
60
1.5
--
166.
6--
--
--
19
13.3
--
651.
726
78.3
113.
3--
26
78.3
2678
.3--
12Fe
d. f
unds
and
sec
urity
RPs
--
--
8.8
--
132.
5--
--
--
14
1.3
--
2739
.029
31.3
734.
172
1.6
3614
.336
52.9
38.6
13C
redi
t mar
ket i
nstr
umen
ts38
48.8
1317
9.2
269.
211
298.
015
61.5
2941
.110
39.8
1235
2.8
6719
.339
771.
140
234.
213
948.
497
32.3
2966
.256
685.
756
685.
7--
14 O
pen
mar
ket p
aper
15.0
--
38.0
144.
576
.9--
--
--
13
0.0
144.
572
0.0
400.
210
1.7
407.
095
1.6
951.
6--
15
Tre
asur
y se
curi
ties
949.
0--
90
.5--
59
3.4
--
--
1232
8.3
1632
.912
328.
349
00.5
--
5794
.9--
12
328.
312
328.
3--
16 A
genc
y- a
nd G
SE-b
acke
d s
ec.
97.7
--
9.4
--
490.
9--
0.
024
.559
8.0
24.5
6310
.977
69.7
885.
3--
77
94.1
7794
.1--
17 M
unic
ipal
sec
uriti
es16
17.7
227.
818
.051
8.5
13.9
2924
.9--
--
16
49.6
3671
.219
45.6
--
76.1
--
3671
.236
71.2
--
18 C
orpo
rate
and
fgn
. bon
ds10
04.6
--
--
4134
.517
2.5
--
0.6
--
1177
.741
34.5
7191
.647
18.3
2734
.022
50.4
1110
3.2
1110
3.2
--
19 D
epos
itory
inst
. loa
ns n
.e.c
.--
92
.7--
17
76.1
--
--
--
--
--
1868
.825
08.8
363.
2--
27
6.7
2508
.825
08.8
--
20 O
ther
loan
s an
d ad
vanc
es25
.914
1.3
--
1250
.4--
16
.219
3.9
--
219.
814
07.9
1574
.849
4.9
140.
432
.219
35.0
1935
.0--
21 M
ortg
ages
79.8
9619
.469
.834
74.0
213.
9--
11
5.5
0.0
478.
913
093.
412
816.
720
2.2
--
--
1329
5.5
1329
5.5
--
22 C
onsu
mer
cre
dit
59.1
3097
.943
.5--
--
--
72
9.8
--
832.
530
97.9
2265
.4--
--
--
30
97.9
3097
.9--
23C
orpo
rate
equ
ities
1245
1.3
--
--
2076
1.7
167.
6--
35
.1--
12
654.
020
761.
715
853.
964
65.6
5163
.764
44.2
3367
1.6
3367
1.6
--
24M
utua
l fun
d sh
ares
7152
.4--
21
1.4
--
81.2
--
--
--
7445
.1--
35
55.2
1154
4.8
544.
5--
11
544.
811
544.
8--
25T
rade
cre
dit
--
255.
030
27.4
2409
.616
8.7
785.
848
.825
0.7
3244
.937
01.1
131.
014
.514
4.4
45.3
3520
.337
60.9
240.
6
26Se
curi
ty c
redi
t81
5.5
339.
2--
--
--
--
--
--
81
5.5
339.
242
0.8
897.
1--
--
12
36.2
1236
.2--
27L
ife
insu
ranc
e re
serv
es12
32.8
--
--
--
--
--
--
50.3
1232
.850
.318
3.7
1366
.3--
--
14
16.5
1416
.5--
28
Pens
ion
entit
lem
ents
1988
6.1
--
--
--
--
--
--
--
1988
6.1
--
--
1988
6.1
--
--
1988
6.1
1988
6.1
--
29T
axes
pay
able
--
--
--
150.
112
3.8
--
165.
8--
28
9.6
150.
1--
-5
9.1
--
--
289.
690
.9-1
98.7
30E
quity
in n
onco
rp. b
usin
ess
9057
.7--
--
90
40.1
--
--
--
--
9057
.790
40.1
--
17.6
--
--
9057
.790
57.7
--
31U
.S. d
irec
t inv
estm
ent a
broa
d--
--
43
70.0
--
--
--
--
--
4370
.0--
91
4.0
--
--
5284
.052
84.0
5284
.0--
32Fo
reig
n di
rect
inve
stm
ent i
n U
.S.
--
--
--
2617
.5--
--
--
--
--
26
17.5
--
559.
331
76.9
--
3176
.931
76.9
--
33M
isce
llane
ous
924.
927
.997
38.7
5335
.711
0.5
1204
.114
9.9
3393
.710
924.
099
61.3
1287
1.0
7068
.9--
16
0.2
2379
5.0
1719
0.4
-660
4.6
Gen
eral
not
es:
A =
ass
ets;
L =
liab
ilitie
s. D
omes
tic n
onfi
nanc
ial s
ecto
rs (
colu
mns
9 a
nd 1
0) a
re h
ouse
hold
s an
d no
npro
fit o
rgan
izat
ions
, non
fina
ncia
l bus
ines
s, s
tate
and
loca
l gov
ernm
ents
, and
fed
eral
gov
ernm
ent.
Equ
ity in
clud
ed in
line
2 is
the
sum
of
cor
pora
te e
quiti
es (
line
23)
and
equi
ty in
non
corp
orat
e bu
sine
ss (
line
30).
The
mat
rix
show
s a
disc
repa
ncy
in c
olum
n 17
for
mon
etar
y go
ld (
line
4) b
ecau
se b
y in
tern
atio
nal a
ccou
ntin
g co
nven
tion,
mon
etar
y go
ld is
a f
inan
cial
ass
et
w
ithou
t a c
orre
spon
ding
liab
ility
.
Su
mm
ary
Z.1, September 18, 2014 3
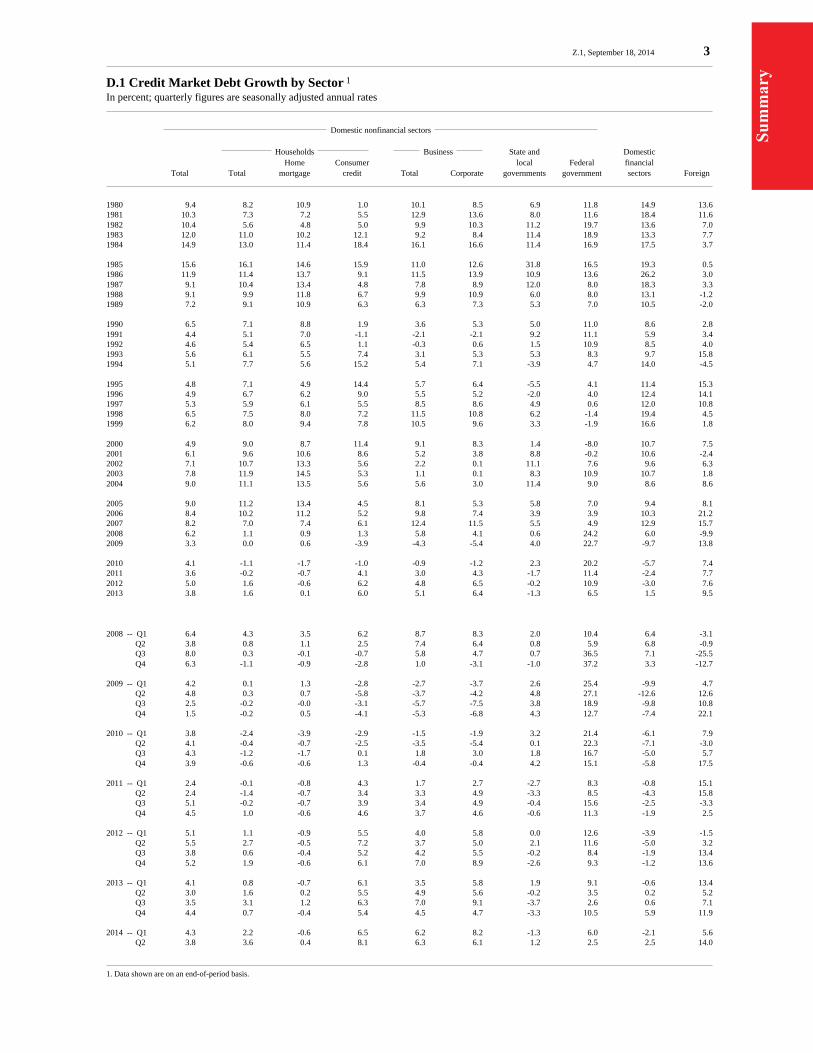
D.1 Credit Market Debt Growth by Sector 1
In percent; quarterly figures are seasonally adjusted annual rates
Domestic nonfinancial sectors
Households Business State and Domestic Home Consumer local Federal financial
Total Total mortgage credit Total Corporate governments government sectors Foreign
1980 9.4 8.2 10.9 1.0 10.1 8.5 6.9 11.8 14.9 13.61981 10.3 7.3 7.2 5.5 12.9 13.6 8.0 11.6 18.4 11.61982 10.4 5.6 4.8 5.0 9.9 10.3 11.2 19.7 13.6 7.01983 12.0 11.0 10.2 12.1 9.2 8.4 11.4 18.9 13.3 7.71984 14.9 13.0 11.4 18.4 16.1 16.6 11.4 16.9 17.5 3.7
1985 15.6 16.1 14.6 15.9 11.0 12.6 31.8 16.5 19.3 0.51986 11.9 11.4 13.7 9.1 11.5 13.9 10.9 13.6 26.2 3.01987 9.1 10.4 13.4 4.8 7.8 8.9 12.0 8.0 18.3 3.31988 9.1 9.9 11.8 6.7 9.9 10.9 6.0 8.0 13.1 -1.21989 7.2 9.1 10.9 6.3 6.3 7.3 5.3 7.0 10.5 -2.0
1990 6.5 7.1 8.8 1.9 3.6 5.3 5.0 11.0 8.6 2.81991 4.4 5.1 7.0 -1.1 -2.1 -2.1 9.2 11.1 5.9 3.41992 4.6 5.4 6.5 1.1 -0.3 0.6 1.5 10.9 8.5 4.01993 5.6 6.1 5.5 7.4 3.1 5.3 5.3 8.3 9.7 15.81994 5.1 7.7 5.6 15.2 5.4 7.1 -3.9 4.7 14.0 -4.5
1995 4.8 7.1 4.9 14.4 5.7 6.4 -5.5 4.1 11.4 15.31996 4.9 6.7 6.2 9.0 5.5 5.2 -2.0 4.0 12.4 14.11997 5.3 5.9 6.1 5.5 8.5 8.6 4.9 0.6 12.0 10.81998 6.5 7.5 8.0 7.2 11.5 10.8 6.2 -1.4 19.4 4.51999 6.2 8.0 9.4 7.8 10.5 9.6 3.3 -1.9 16.6 1.8
2000 4.9 9.0 8.7 11.4 9.1 8.3 1.4 -8.0 10.7 7.52001 6.1 9.6 10.6 8.6 5.2 3.8 8.8 -0.2 10.6 -2.42002 7.1 10.7 13.3 5.6 2.2 0.1 11.1 7.6 9.6 6.32003 7.8 11.9 14.5 5.3 1.1 0.1 8.3 10.9 10.7 1.82004 9.0 11.1 13.5 5.6 5.6 3.0 11.4 9.0 8.6 8.6
2005 9.0 11.2 13.4 4.5 8.1 5.3 5.8 7.0 9.4 8.12006 8.4 10.2 11.2 5.2 9.8 7.4 3.9 3.9 10.3 21.22007 8.2 7.0 7.4 6.1 12.4 11.5 5.5 4.9 12.9 15.72008 6.2 1.1 0.9 1.3 5.8 4.1 0.6 24.2 6.0 -9.92009 3.3 0.0 0.6 -3.9 -4.3 -5.4 4.0 22.7 -9.7 13.8
2010 4.1 -1.1 -1.7 -1.0 -0.9 -1.2 2.3 20.2 -5.7 7.42011 3.6 -0.2 -0.7 4.1 3.0 4.3 -1.7 11.4 -2.4 7.72012 5.0 1.6 -0.6 6.2 4.8 6.5 -0.2 10.9 -3.0 7.62013 3.8 1.6 0.1 6.0 5.1 6.4 -1.3 6.5 1.5 9.5
2008 -- Q1 6.4 4.3 3.5 6.2 8.7 8.3 2.0 10.4 6.4 -3.1 Q2 3.8 0.8 1.1 2.5 7.4 6.4 0.8 5.9 6.8 -0.9 Q3 8.0 0.3 -0.1 -0.7 5.8 4.7 0.7 36.5 7.1 -25.5 Q4 6.3 -1.1 -0.9 -2.8 1.0 -3.1 -1.0 37.2 3.3 -12.7
2009 -- Q1 4.2 0.1 1.3 -2.8 -2.7 -3.7 2.6 25.4 -9.9 4.7 Q2 4.8 0.3 0.7 -5.8 -3.7 -4.2 4.8 27.1 -12.6 12.6 Q3 2.5 -0.2 -0.0 -3.1 -5.7 -7.5 3.8 18.9 -9.8 10.8 Q4 1.5 -0.2 0.5 -4.1 -5.3 -6.8 4.3 12.7 -7.4 22.1
2010 -- Q1 3.8 -2.4 -3.9 -2.9 -1.5 -1.9 3.2 21.4 -6.1 7.9 Q2 4.1 -0.4 -0.7 -2.5 -3.5 -5.4 0.1 22.3 -7.1 -3.0 Q3 4.3 -1.2 -1.7 0.1 1.8 3.0 1.8 16.7 -5.0 5.7 Q4 3.9 -0.6 -0.6 1.3 -0.4 -0.4 4.2 15.1 -5.8 17.5
2011 -- Q1 2.4 -0.1 -0.8 4.3 1.7 2.7 -2.7 8.3 -0.8 15.1 Q2 2.4 -1.4 -0.7 3.4 3.3 4.9 -3.3 8.5 -4.3 15.8 Q3 5.1 -0.2 -0.7 3.9 3.4 4.9 -0.4 15.6 -2.5 -3.3 Q4 4.5 1.0 -0.6 4.6 3.7 4.6 -0.6 11.3 -1.9 2.5
2012 -- Q1 5.1 1.1 -0.9 5.5 4.0 5.8 0.0 12.6 -3.9 -1.5 Q2 5.5 2.7 -0.5 7.2 3.7 5.0 2.1 11.6 -5.0 3.2 Q3 3.8 0.6 -0.4 5.2 4.2 5.5 -0.2 8.4 -1.9 13.4 Q4 5.2 1.9 -0.6 6.1 7.0 8.9 -2.6 9.3 -1.2 13.6
2013 -- Q1 4.1 0.8 -0.7 6.1 3.5 5.8 1.9 9.1 -0.6 13.4 Q2 3.0 1.6 0.2 5.5 4.9 5.6 -0.2 3.5 0.2 5.2 Q3 3.5 3.1 1.2 6.3 7.0 9.1 -3.7 2.6 0.6 7.1 Q4 4.4 0.7 -0.4 5.4 4.5 4.7 -3.3 10.5 5.9 11.9
2014 -- Q1 4.3 2.2 -0.6 6.5 6.2 8.2 -1.3 6.0 -2.1 5.6 Q2 3.8 3.6 0.4 8.1 6.3 6.1 1.2 2.5 2.5 14.0
1. Data shown are on an end-of-period basis.
Su
mm
ary
4 Z.1, September 18, 2014
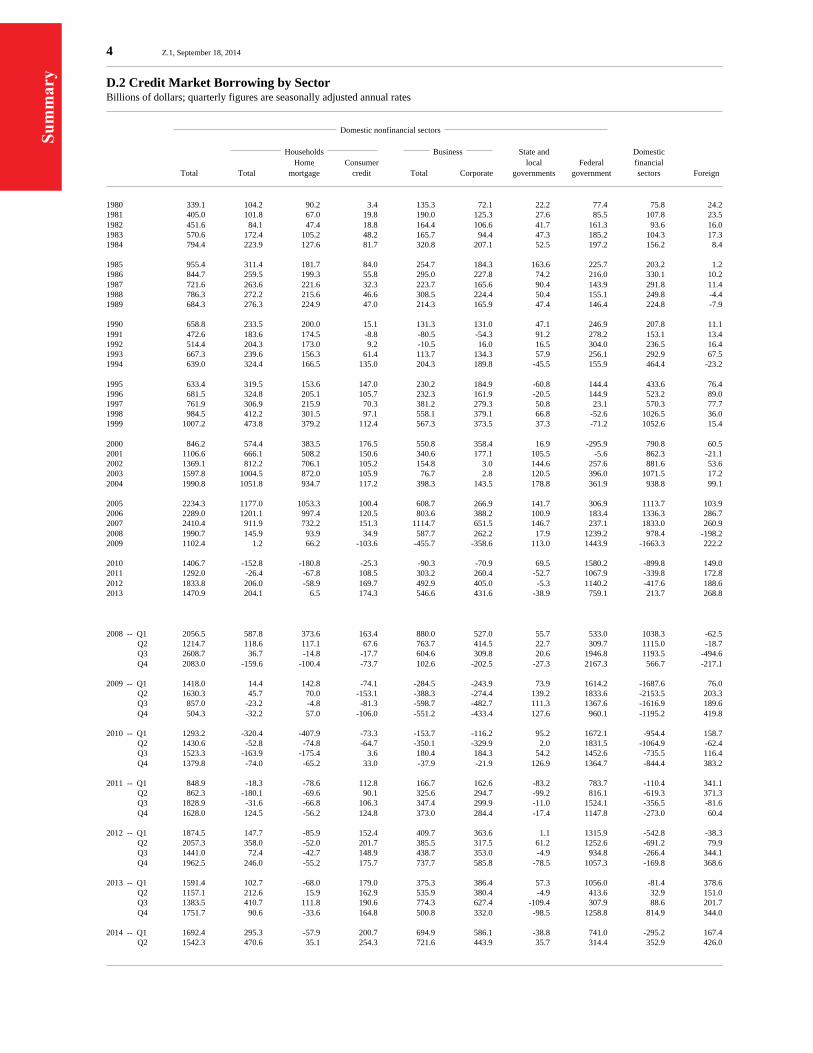
D.2 Credit Market Borrowing by SectorBillions of dollars; quarterly figures are seasonally adjusted annual rates
Domestic nonfinancial sectors
Households Business State and Domestic Home Consumer local Federal financial
Total Total mortgage credit Total Corporate governments government sectors Foreign
1980 339.1 104.2 90.2 3.4 135.3 72.1 22.2 77.4 75.8 24.21981 405.0 101.8 67.0 19.8 190.0 125.3 27.6 85.5 107.8 23.51982 451.6 84.1 47.4 18.8 164.4 106.6 41.7 161.3 93.6 16.01983 570.6 172.4 105.2 48.2 165.7 94.4 47.3 185.2 104.3 17.31984 794.4 223.9 127.6 81.7 320.8 207.1 52.5 197.2 156.2 8.4
1985 955.4 311.4 181.7 84.0 254.7 184.3 163.6 225.7 203.2 1.21986 844.7 259.5 199.3 55.8 295.0 227.8 74.2 216.0 330.1 10.21987 721.6 263.6 221.6 32.3 223.7 165.6 90.4 143.9 291.8 11.41988 786.3 272.2 215.6 46.6 308.5 224.4 50.4 155.1 249.8 -4.41989 684.3 276.3 224.9 47.0 214.3 165.9 47.4 146.4 224.8 -7.9
1990 658.8 233.5 200.0 15.1 131.3 131.0 47.1 246.9 207.8 11.11991 472.6 183.6 174.5 -8.8 -80.5 -54.3 91.2 278.2 153.1 13.41992 514.4 204.3 173.0 9.2 -10.5 16.0 16.5 304.0 236.5 16.41993 667.3 239.6 156.3 61.4 113.7 134.3 57.9 256.1 292.9 67.51994 639.0 324.4 166.5 135.0 204.3 189.8 -45.5 155.9 464.4 -23.2
1995 633.4 319.5 153.6 147.0 230.2 184.9 -60.8 144.4 433.6 76.41996 681.5 324.8 205.1 105.7 232.3 161.9 -20.5 144.9 523.2 89.01997 761.9 306.9 215.9 70.3 381.2 279.3 50.8 23.1 570.3 77.71998 984.5 412.2 301.5 97.1 558.1 379.1 66.8 -52.6 1026.5 36.01999 1007.2 473.8 379.2 112.4 567.3 373.5 37.3 -71.2 1052.6 15.4
2000 846.2 574.4 383.5 176.5 550.8 358.4 16.9 -295.9 790.8 60.52001 1106.6 666.1 508.2 150.6 340.6 177.1 105.5 -5.6 862.3 -21.12002 1369.1 812.2 706.1 105.2 154.8 3.0 144.6 257.6 881.6 53.62003 1597.8 1004.5 872.0 105.9 76.7 2.8 120.5 396.0 1071.5 17.22004 1990.8 1051.8 934.7 117.2 398.3 143.5 178.8 361.9 938.8 99.1
2005 2234.3 1177.0 1053.3 100.4 608.7 266.9 141.7 306.9 1113.7 103.92006 2289.0 1201.1 997.4 120.5 803.6 388.2 100.9 183.4 1336.3 286.72007 2410.4 911.9 732.2 151.3 1114.7 651.5 146.7 237.1 1833.0 260.92008 1990.7 145.9 93.9 34.9 587.7 262.2 17.9 1239.2 978.4 -198.22009 1102.4 1.2 66.2 -103.6 -455.7 -358.6 113.0 1443.9 -1663.3 222.2
2010 1406.7 -152.8 -180.8 -25.3 -90.3 -70.9 69.5 1580.2 -899.8 149.02011 1292.0 -26.4 -67.8 108.5 303.2 260.4 -52.7 1067.9 -339.8 172.82012 1833.8 206.0 -58.9 169.7 492.9 405.0 -5.3 1140.2 -417.6 188.62013 1470.9 204.1 6.5 174.3 546.6 431.6 -38.9 759.1 213.7 268.8
2008 -- Q1 2056.5 587.8 373.6 163.4 880.0 527.0 55.7 533.0 1038.3 -62.5 Q2 1214.7 118.6 117.1 67.6 763.7 414.5 22.7 309.7 1115.0 -18.7 Q3 2608.7 36.7 -14.8 -17.7 604.6 309.8 20.6 1946.8 1193.5 -494.6 Q4 2083.0 -159.6 -100.4 -73.7 102.6 -202.5 -27.3 2167.3 566.7 -217.1
2009 -- Q1 1418.0 14.4 142.8 -74.1 -284.5 -243.9 73.9 1614.2 -1687.6 76.0 Q2 1630.3 45.7 70.0 -153.1 -388.3 -274.4 139.2 1833.6 -2153.5 203.3 Q3 857.0 -23.2 -4.8 -81.3 -598.7 -482.7 111.3 1367.6 -1616.9 189.6 Q4 504.3 -32.2 57.0 -106.0 -551.2 -433.4 127.6 960.1 -1195.2 419.8
2010 -- Q1 1293.2 -320.4 -407.9 -73.3 -153.7 -116.2 95.2 1672.1 -954.4 158.7 Q2 1430.6 -52.8 -74.8 -64.7 -350.1 -329.9 2.0 1831.5 -1064.9 -62.4 Q3 1523.3 -163.9 -175.4 3.6 180.4 184.3 54.2 1452.6 -735.5 116.4 Q4 1379.8 -74.0 -65.2 33.0 -37.9 -21.9 126.9 1364.7 -844.4 383.2
2011 -- Q1 848.9 -18.3 -78.6 112.8 166.7 162.6 -83.2 783.7 -110.4 341.1 Q2 862.3 -180.1 -69.6 90.1 325.6 294.7 -99.2 816.1 -619.3 371.3 Q3 1828.9 -31.6 -66.8 106.3 347.4 299.9 -11.0 1524.1 -356.5 -81.6 Q4 1628.0 124.5 -56.2 124.8 373.0 284.4 -17.4 1147.8 -273.0 60.4
2012 -- Q1 1874.5 147.7 -85.9 152.4 409.7 363.6 1.1 1315.9 -542.8 -38.3 Q2 2057.3 358.0 -52.0 201.7 385.5 317.5 61.2 1252.6 -691.2 79.9 Q3 1441.0 72.4 -42.7 148.9 438.7 353.0 -4.9 934.8 -266.4 344.1 Q4 1962.5 246.0 -55.2 175.7 737.7 585.8 -78.5 1057.3 -169.8 368.6
2013 -- Q1 1591.4 102.7 -68.0 179.0 375.3 386.4 57.3 1056.0 -81.4 378.6 Q2 1157.1 212.6 15.9 162.9 535.9 380.4 -4.9 413.6 32.9 151.0 Q3 1383.5 410.7 111.8 190.6 774.3 627.4 -109.4 307.9 88.6 201.7 Q4 1751.7 90.6 -33.6 164.8 500.8 332.0 -98.5 1258.8 814.9 344.0
2014 -- Q1 1692.4 295.3 -57.9 200.7 694.9 586.1 -38.8 741.0 -295.2 167.4 Q2 1542.3 470.6 35.1 254.3 721.6 443.9 35.7 314.4 352.9 426.0
Su
mm
ary
Z.1, September 18, 2014 5
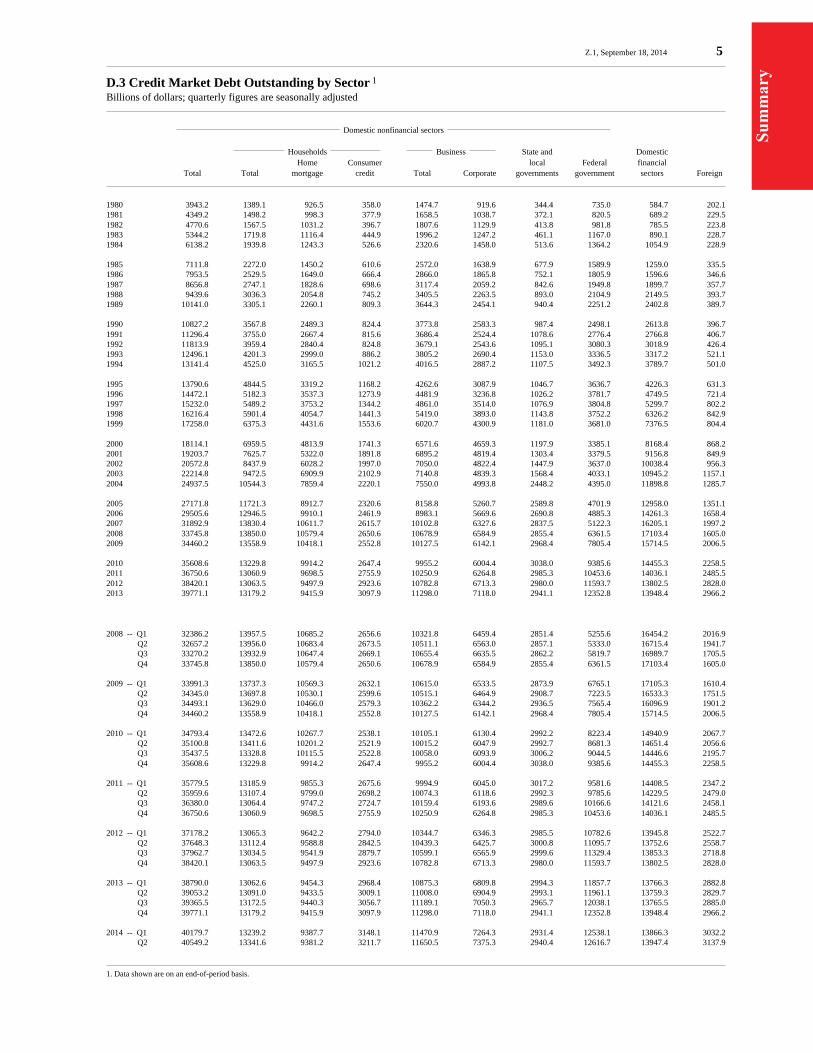
D.3 Credit Market Debt Outstanding by Sector 1
Billions of dollars; quarterly figures are seasonally adjusted
Domestic nonfinancial sectors
Households Business State and Domestic Home Consumer local Federal financial
Total Total mortgage credit Total Corporate governments government sectors Foreign
1980 3943.2 1389.1 926.5 358.0 1474.7 919.6 344.4 735.0 584.7 202.11981 4349.2 1498.2 998.3 377.9 1658.5 1038.7 372.1 820.5 689.2 229.51982 4770.6 1567.5 1031.2 396.7 1807.6 1129.9 413.8 981.8 785.5 223.81983 5344.2 1719.8 1116.4 444.9 1996.2 1247.2 461.1 1167.0 890.1 228.71984 6138.2 1939.8 1243.3 526.6 2320.6 1458.0 513.6 1364.2 1054.9 228.9
1985 7111.8 2272.0 1450.2 610.6 2572.0 1638.9 677.9 1589.9 1259.0 335.51986 7953.5 2529.5 1649.0 666.4 2866.0 1865.8 752.1 1805.9 1596.6 346.61987 8656.8 2747.1 1828.6 698.6 3117.4 2059.2 842.6 1949.8 1899.7 357.71988 9439.6 3036.3 2054.8 745.2 3405.5 2263.5 893.0 2104.9 2149.5 393.71989 10141.0 3305.1 2260.1 809.3 3644.3 2454.1 940.4 2251.2 2402.8 389.7
1990 10827.2 3567.8 2489.3 824.4 3773.8 2583.3 987.4 2498.1 2613.8 396.71991 11296.4 3755.0 2667.4 815.6 3686.4 2524.4 1078.6 2776.4 2766.8 406.71992 11813.9 3959.4 2840.4 824.8 3679.1 2543.6 1095.1 3080.3 3018.9 426.41993 12496.1 4201.3 2999.0 886.2 3805.2 2690.4 1153.0 3336.5 3317.2 521.11994 13141.4 4525.0 3165.5 1021.2 4016.5 2887.2 1107.5 3492.3 3789.7 501.0
1995 13790.6 4844.5 3319.2 1168.2 4262.6 3087.9 1046.7 3636.7 4226.3 631.31996 14472.1 5182.3 3537.3 1273.9 4481.9 3236.8 1026.2 3781.7 4749.5 721.41997 15232.0 5489.2 3753.2 1344.2 4861.0 3514.0 1076.9 3804.8 5299.7 802.21998 16216.4 5901.4 4054.7 1441.3 5419.0 3893.0 1143.8 3752.2 6326.2 842.91999 17258.0 6375.3 4431.6 1553.6 6020.7 4300.9 1181.0 3681.0 7376.5 804.4
2000 18114.1 6959.5 4813.9 1741.3 6571.6 4659.3 1197.9 3385.1 8168.4 868.22001 19203.7 7625.7 5322.0 1891.8 6895.2 4819.4 1303.4 3379.5 9156.8 849.92002 20572.8 8437.9 6028.2 1997.0 7050.0 4822.4 1447.9 3637.0 10038.4 956.32003 22214.8 9472.5 6909.9 2102.9 7140.8 4839.3 1568.4 4033.1 10945.2 1157.12004 24937.5 10544.3 7859.4 2220.1 7550.0 4993.8 2448.2 4395.0 11898.8 1285.7
2005 27171.8 11721.3 8912.7 2320.6 8158.8 5260.7 2589.8 4701.9 12958.0 1351.12006 29505.6 12946.5 9910.1 2461.9 8983.1 5669.6 2690.8 4885.3 14261.3 1658.42007 31892.9 13830.4 10611.7 2615.7 10102.8 6327.6 2837.5 5122.3 16205.1 1997.22008 33745.8 13850.0 10579.4 2650.6 10678.9 6584.9 2855.4 6361.5 17103.4 1605.02009 34460.2 13558.9 10418.1 2552.8 10127.5 6142.1 2968.4 7805.4 15714.5 2006.5
2010 35608.6 13229.8 9914.2 2647.4 9955.2 6004.4 3038.0 9385.6 14455.3 2258.52011 36750.6 13060.9 9698.5 2755.9 10250.9 6264.8 2985.3 10453.6 14036.1 2485.52012 38420.1 13063.5 9497.9 2923.6 10782.8 6713.3 2980.0 11593.7 13802.5 2828.02013 39771.1 13179.2 9415.9 3097.9 11298.0 7118.0 2941.1 12352.8 13948.4 2966.2
2008 -- Q1 32386.2 13957.5 10685.2 2656.6 10321.8 6459.4 2851.4 5255.6 16454.2 2016.9 Q2 32657.2 13956.0 10683.4 2673.5 10511.1 6563.0 2857.1 5333.0 16715.4 1941.7 Q3 33270.2 13932.9 10647.4 2669.1 10655.4 6635.5 2862.2 5819.7 16989.7 1705.5 Q4 33745.8 13850.0 10579.4 2650.6 10678.9 6584.9 2855.4 6361.5 17103.4 1605.0
2009 -- Q1 33991.3 13737.3 10569.3 2632.1 10615.0 6533.5 2873.9 6765.1 17105.3 1610.4 Q2 34345.0 13697.8 10530.1 2599.6 10515.1 6464.9 2908.7 7223.5 16533.3 1751.5 Q3 34493.1 13629.0 10466.0 2579.3 10362.2 6344.2 2936.5 7565.4 16096.9 1901.2 Q4 34460.2 13558.9 10418.1 2552.8 10127.5 6142.1 2968.4 7805.4 15714.5 2006.5
2010 -- Q1 34793.4 13472.6 10267.7 2538.1 10105.1 6130.4 2992.2 8223.4 14940.9 2067.7 Q2 35100.8 13411.6 10201.2 2521.9 10015.2 6047.9 2992.7 8681.3 14651.4 2056.6 Q3 35437.5 13328.8 10115.5 2522.8 10058.0 6093.9 3006.2 9044.5 14446.6 2195.7 Q4 35608.6 13229.8 9914.2 2647.4 9955.2 6004.4 3038.0 9385.6 14455.3 2258.5
2011 -- Q1 35779.5 13185.9 9855.3 2675.6 9994.9 6045.0 3017.2 9581.6 14408.5 2347.2 Q2 35959.6 13107.4 9799.0 2698.2 10074.3 6118.6 2992.3 9785.6 14229.5 2479.0 Q3 36380.0 13064.4 9747.2 2724.7 10159.4 6193.6 2989.6 10166.6 14121.6 2458.1 Q4 36750.6 13060.9 9698.5 2755.9 10250.9 6264.8 2985.3 10453.6 14036.1 2485.5
2012 -- Q1 37178.2 13065.3 9642.2 2794.0 10344.7 6346.3 2985.5 10782.6 13945.8 2522.7 Q2 37648.3 13112.4 9588.8 2842.5 10439.3 6425.7 3000.8 11095.7 13752.6 2558.7 Q3 37962.7 13034.5 9541.9 2879.7 10599.1 6565.9 2999.6 11329.4 13853.3 2718.8 Q4 38420.1 13063.5 9497.9 2923.6 10782.8 6713.3 2980.0 11593.7 13802.5 2828.0
2013 -- Q1 38790.0 13062.6 9454.3 2968.4 10875.3 6809.8 2994.3 11857.7 13766.3 2882.8 Q2 39053.2 13091.0 9433.5 3009.1 11008.0 6904.9 2993.1 11961.1 13759.3 2829.7 Q3 39365.5 13172.5 9440.3 3056.7 11189.1 7050.3 2965.7 12038.1 13765.5 2885.0 Q4 39771.1 13179.2 9415.9 3097.9 11298.0 7118.0 2941.1 12352.8 13948.4 2966.2
2014 -- Q1 40179.7 13239.2 9387.7 3148.1 11470.9 7264.3 2931.4 12538.1 13866.3 3032.2 Q2 40549.2 13341.6 9381.2 3211.7 11650.5 7375.3 2940.4 12616.7 13947.4 3137.9
1. Data shown are on an end-of-period basis.
Su
mm
ary
6 Z.1, September 18, 2014
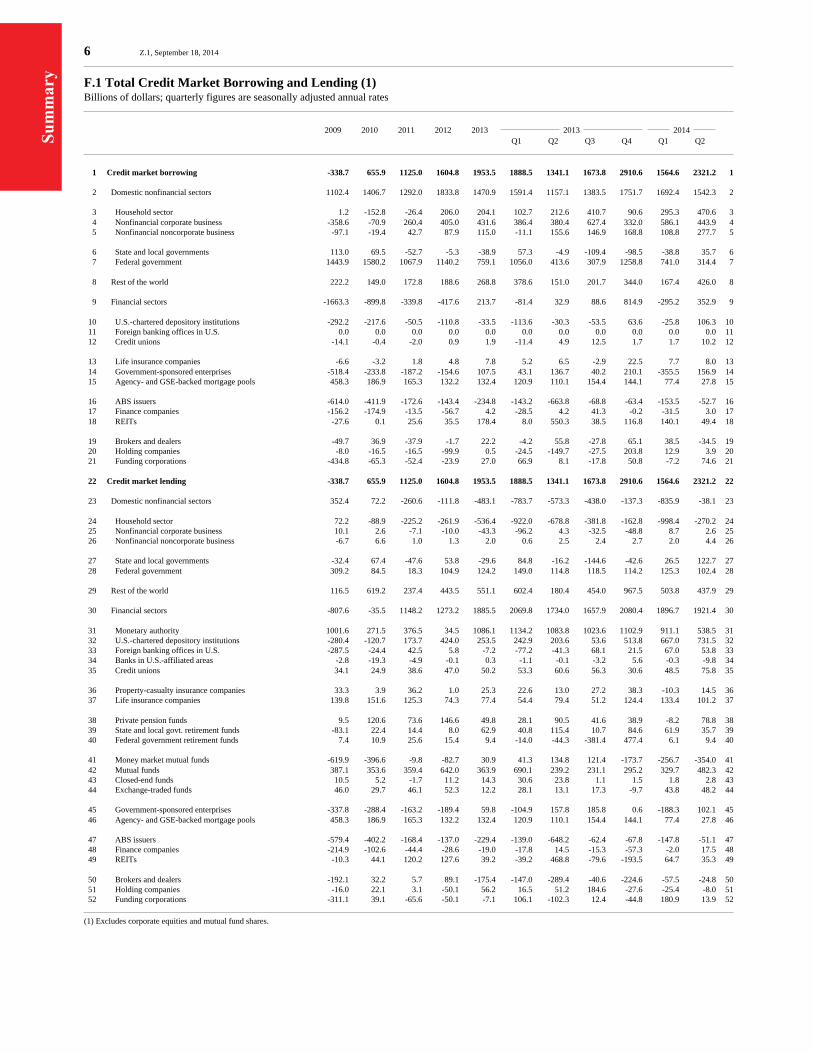
F.1 Total Credit Market Borrowing and Lending (1)Billions of dollars; quarterly figures are seasonally adjusted annual rates
2009 2010 2011 2012 2013 2013 2014 Q1 Q2 Q3 Q4 Q1 Q2
1 Credit market borrowing -338.7 655.9 1125.0 1604.8 1953.5 1888.5 1341.1 1673.8 2910.6 1564.6 2321.2 1
2 Domestic nonfinancial sectors 1102.4 1406.7 1292.0 1833.8 1470.9 1591.4 1157.1 1383.5 1751.7 1692.4 1542.3 2
3 Household sector 1.2 -152.8 -26.4 206.0 204.1 102.7 212.6 410.7 90.6 295.3 470.6 3 4 Nonfinancial corporate business -358.6 -70.9 260.4 405.0 431.6 386.4 380.4 627.4 332.0 586.1 443.9 4 5 Nonfinancial noncorporate business -97.1 -19.4 42.7 87.9 115.0 -11.1 155.6 146.9 168.8 108.8 277.7 5
6 State and local governments 113.0 69.5 -52.7 -5.3 -38.9 57.3 -4.9 -109.4 -98.5 -38.8 35.7 6 7 Federal government 1443.9 1580.2 1067.9 1140.2 759.1 1056.0 413.6 307.9 1258.8 741.0 314.4 7
8 Rest of the world 222.2 149.0 172.8 188.6 268.8 378.6 151.0 201.7 344.0 167.4 426.0 8
9 Financial sectors -1663.3 -899.8 -339.8 -417.6 213.7 -81.4 32.9 88.6 814.9 -295.2 352.9 9
10 U.S.-chartered depository institutions -292.2 -217.6 -50.5 -110.8 -33.5 -113.6 -30.3 -53.5 63.6 -25.8 106.3 10 11 Foreign banking offices in U.S. 0.0 0.0 0.0 0.0 0.0 0.0 0.0 0.0 0.0 0.0 0.0 11 12 Credit unions -14.1 -0.4 -2.0 0.9 1.9 -11.4 4.9 12.5 1.7 1.7 10.2 12
13 Life insurance companies -6.6 -3.2 1.8 4.8 7.8 5.2 6.5 -2.9 22.5 7.7 8.0 13 14 Government-sponsored enterprises -518.4 -233.8 -187.2 -154.6 107.5 43.1 136.7 40.2 210.1 -355.5 156.9 14 15 Agency- and GSE-backed mortgage pools 458.3 186.9 165.3 132.2 132.4 120.9 110.1 154.4 144.1 77.4 27.8 15
16 ABS issuers -614.0 -411.9 -172.6 -143.4 -234.8 -143.2 -663.8 -68.8 -63.4 -153.5 -52.7 16 17 Finance companies -156.2 -174.9 -13.5 -56.7 4.2 -28.5 4.2 41.3 -0.2 -31.5 3.0 17 18 REITs -27.6 0.1 25.6 35.5 178.4 8.0 550.3 38.5 116.8 140.1 49.4 18
19 Brokers and dealers -49.7 36.9 -37.9 -1.7 22.2 -4.2 55.8 -27.8 65.1 38.5 -34.5 19 20 Holding companies -8.0 -16.5 -16.5 -99.9 0.5 -24.5 -149.7 -27.5 203.8 12.9 3.9 20 21 Funding corporations -434.8 -65.3 -52.4 -23.9 27.0 66.9 8.1 -17.8 50.8 -7.2 74.6 21
22 Credit market lending -338.7 655.9 1125.0 1604.8 1953.5 1888.5 1341.1 1673.8 2910.6 1564.6 2321.2 22
23 Domestic nonfinancial sectors 352.4 72.2 -260.6 -111.8 -483.1 -783.7 -573.3 -438.0 -137.3 -835.9 -38.1 23
24 Household sector 72.2 -88.9 -225.2 -261.9 -536.4 -922.0 -678.8 -381.8 -162.8 -998.4 -270.2 24 25 Nonfinancial corporate business 10.1 2.6 -7.1 -10.0 -43.3 -96.2 4.3 -32.5 -48.8 8.7 2.6 25 26 Nonfinancial noncorporate business -6.7 6.6 1.0 1.3 2.0 0.6 2.5 2.4 2.7 2.0 4.4 26
27 State and local governments -32.4 67.4 -47.6 53.8 -29.6 84.8 -16.2 -144.6 -42.6 26.5 122.7 27 28 Federal government 309.2 84.5 18.3 104.9 124.2 149.0 114.8 118.5 114.2 125.3 102.4 28
29 Rest of the world 116.5 619.2 237.4 443.5 551.1 602.4 180.4 454.0 967.5 503.8 437.9 29
30 Financial sectors -807.6 -35.5 1148.2 1273.2 1885.5 2069.8 1734.0 1657.9 2080.4 1896.7 1921.4 30
31 Monetary authority 1001.6 271.5 376.5 34.5 1086.1 1134.2 1083.8 1023.6 1102.9 911.1 538.5 31 32 U.S.-chartered depository institutions -280.4 -120.7 173.7 424.0 253.5 242.9 203.6 53.6 513.8 667.0 731.5 32 33 Foreign banking offices in U.S. -287.5 -24.4 42.5 5.8 -7.2 -77.2 -41.3 68.1 21.5 67.0 53.8 33 34 Banks in U.S.-affiliated areas -2.8 -19.3 -4.9 -0.1 0.3 -1.1 -0.1 -3.2 5.6 -0.3 -9.8 34 35 Credit unions 34.1 24.9 38.6 47.0 50.2 53.3 60.6 56.3 30.6 48.5 75.8 35
36 Property-casualty insurance companies 33.3 3.9 36.2 1.0 25.3 22.6 13.0 27.2 38.3 -10.3 14.5 36 37 Life insurance companies 139.8 151.6 125.3 74.3 77.4 54.4 79.4 51.2 124.4 133.4 101.2 37
38 Private pension funds 9.5 120.6 73.6 146.6 49.8 28.1 90.5 41.6 38.9 -8.2 78.8 38 39 State and local govt. retirement funds -83.1 22.4 14.4 8.0 62.9 40.8 115.4 10.7 84.6 61.9 35.7 39 40 Federal government retirement funds 7.4 10.9 25.6 15.4 9.4 -14.0 -44.3 -381.4 477.4 6.1 9.4 40
41 Money market mutual funds -619.9 -396.6 -9.8 -82.7 30.9 41.3 134.8 121.4 -173.7 -256.7 -354.0 41 42 Mutual funds 387.1 353.6 359.4 642.0 363.9 690.1 239.2 231.1 295.2 329.7 482.3 42 43 Closed-end funds 10.5 5.2 -1.7 11.2 14.3 30.6 23.8 1.1 1.5 1.8 2.8 43 44 Exchange-traded funds 46.0 29.7 46.1 52.3 12.2 28.1 13.1 17.3 -9.7 43.8 48.2 44
45 Government-sponsored enterprises -337.8 -288.4 -163.2 -189.4 59.8 -104.9 157.8 185.8 0.6 -188.3 102.1 45 46 Agency- and GSE-backed mortgage pools 458.3 186.9 165.3 132.2 132.4 120.9 110.1 154.4 144.1 77.4 27.8 46
47 ABS issuers -579.4 -402.2 -168.4 -137.0 -229.4 -139.0 -648.2 -62.4 -67.8 -147.8 -51.1 47 48 Finance companies -214.9 -102.6 -44.4 -28.6 -19.0 -17.8 14.5 -15.3 -57.3 -2.0 17.5 48 49 REITs -10.3 44.1 120.2 127.6 39.2 -39.2 468.8 -79.6 -193.5 64.7 35.3 49
50 Brokers and dealers -192.1 32.2 5.7 89.1 -175.4 -147.0 -289.4 -40.6 -224.6 -57.5 -24.8 50 51 Holding companies -16.0 22.1 3.1 -50.1 56.2 16.5 51.2 184.6 -27.6 -25.4 -8.0 51 52 Funding corporations -311.1 39.1 -65.6 -50.1 -7.1 106.1 -102.3 12.4 -44.8 180.9 13.9 52
(1) Excludes corporate equities and mutual fund shares.

Su
mm
ary
Z.1, September 18, 2014 7
F.2 Credit Market Borrowing by Nonfinancial SectorsBillions of dollars; quarterly figures are seasonally adjusted annual rates
2009 2010 2011 2012 2013 2013 2014 Q1 Q2 Q3 Q4 Q1 Q2
1 Domestic 1102.4 1406.7 1292.0 1833.8 1470.9 1591.4 1157.1 1383.5 1751.7 1692.4 1542.3 1
2 By instrument 1102.4 1406.7 1292.0 1833.8 1470.9 1591.4 1157.1 1383.5 1751.7 1692.4 1542.3 2
3 Commercial paper -73.1 24.5 33.4 14.0 14.2 20.1 -20.1 92.0 -35.2 72.1 54.9 3 4 Treasury securities 1443.7 1579.6 1066.8 1140.6 759.5 1057.0 412.2 307.4 1261.2 743.0 314.3 4 5 Agency- and GSE-backed securities 0.1 0.7 1.1 -0.4 -0.4 -1.0 1.3 0.5 -2.4 -1.9 0.1 5 6 Municipal securities 155.3 99.7 -52.8 -4.9 -43.2 61.4 -15.1 -105.4 -113.8 -38.0 15.7 6 7 Corporate bonds 215.8 179.4 161.7 324.4 280.6 307.7 174.8 429.8 210.1 282.5 224.7 7
8 Depository institution loans n.e.c. -307.7 -53.7 70.7 276.9 126.1 65.3 158.5 196.9 83.8 252.1 402.0 8 9 Other loans and advances -164.8 -82.4 63.6 -22.7 62.4 17.4 163.0 19.7 49.3 147.5 69.6 9
10 Mortgages -63.5 -315.7 -161.0 -63.7 97.5 -115.6 119.5 252.0 133.9 34.5 206.8 10 11 Home 23.8 -160.4 -86.5 -71.3 3.9 -83.3 15.0 117.9 -33.8 -55.9 47.7 11 12 Multifamily residential 4.6 -5.0 7.2 36.7 34.2 -1.7 42.6 44.7 51.1 47.1 54.2 12 13 Commercial -103.2 -158.4 -94.8 -34.9 56.7 -33.2 59.2 86.7 113.9 37.2 98.6 13 14 Farm 11.3 8.1 13.1 5.8 2.7 2.7 2.7 2.7 2.7 6.1 6.2 14 15 Consumer credit -103.6 -25.3 108.5 169.7 174.3 179.0 162.9 190.6 164.8 200.7 254.3 15
16 By sector 1102.4 1406.7 1292.0 1833.8 1470.9 1591.4 1157.1 1383.5 1751.7 1692.4 1542.3 16
17 Household sector 1.2 -152.8 -26.4 206.0 204.1 102.7 212.6 410.7 90.6 295.3 470.6 17 18 Nonfinancial business -455.7 -90.3 303.2 492.9 546.6 375.3 535.9 774.3 500.8 694.9 721.6 18 19 Corporate -358.6 -70.9 260.4 405.0 431.6 386.4 380.4 627.4 332.0 586.1 443.9 19 20 Noncorporate -97.1 -19.4 42.7 87.9 115.0 -11.1 155.6 146.9 168.8 108.8 277.7 20
21 State and local governments 113.0 69.5 -52.7 -5.3 -38.9 57.3 -4.9 -109.4 -98.5 -38.8 35.7 21 22 Federal government 1443.9 1580.2 1067.9 1140.2 759.1 1056.0 413.6 307.9 1258.8 741.0 314.4 22
23 Foreign borrowing in U.S. 222.2 149.0 172.8 188.6 268.8 378.6 151.0 201.7 344.0 167.4 426.0 23
24 Commercial paper 59.4 -2.7 -53.5 27.9 34.0 120.7 13.7 -26.6 28.1 65.2 35.3 24 25 Bonds 177.2 127.4 181.7 124.7 194.4 225.5 108.7 183.7 259.7 46.8 329.5 25 26 Depository institution loans n.e.c. -14.8 24.0 43.2 30.4 39.1 33.3 24.9 41.0 57.0 54.9 60.0 26 27 Other loans and advances 0.5 0.3 1.4 5.6 1.4 -0.9 3.7 3.6 -0.8 0.5 1.1 27
28 Domestic and foreign 1324.6 1555.7 1464.8 2022.4 1739.8 1969.9 1308.2 1585.2 2095.7 1859.9 1968.3 28
F.3 Credit Market Borrowing by Financial SectorsBillions of dollars; quarterly figures are seasonally adjusted annual rates
1 By instrument -1663.3 -899.8 -339.8 -417.6 213.7 -81.4 32.9 88.6 814.9 -295.2 352.9 1
2 Open market paper -448.1 -102.2 -68.2 -58.8 -48.9 -36.7 -35.4 -94.4 -29.2 -83.2 30.9 2 3 GSE issues -518.4 -233.8 -187.2 -154.6 107.5 43.1 136.7 40.2 210.1 -355.5 156.9 3 4 Agency- and GSE-backed mortgage pool sec. 458.3 186.9 165.3 132.2 132.4 120.9 110.1 154.4 144.1 77.4 27.8 4 5 Corporate bonds -448.4 -544.3 -235.8 -223.5 -84.3 -282.7 -334.1 19.6 260.2 31.3 115.6 5
6 Depository institution loans n.e.c. -435.9 -62.5 32.6 -121.2 20.9 9.2 35.6 -75.5 114.4 6.1 -129.0 6 7 Other loans and advances -282.6 -144.7 -60.0 3.5 78.3 44.2 115.4 58.6 95.1 16.0 144.2 7 8 Mortgages 11.8 0.8 13.5 4.8 7.8 20.6 4.6 -14.3 20.2 12.6 6.5 8
9 By sector -1663.3 -899.8 -339.8 -417.6 213.7 -81.4 32.9 88.6 814.9 -295.2 352.9 9
10 U.S.-chartered depository institutions -292.2 -217.6 -50.5 -110.8 -33.5 -113.6 -30.3 -53.5 63.6 -25.8 106.3 10 11 Foreign banking offices in U.S. 0.0 0.0 0.0 0.0 0.0 0.0 0.0 0.0 0.0 0.0 0.0 11 12 Credit unions -14.1 -0.4 -2.0 0.9 1.9 -11.4 4.9 12.5 1.7 1.7 10.2 12
13 Life insurance companies -6.6 -3.2 1.8 4.8 7.8 5.2 6.5 -2.9 22.5 7.7 8.0 13 14 Government-sponsored enterprises -518.4 -233.8 -187.2 -154.6 107.5 43.1 136.7 40.2 210.1 -355.5 156.9 14 15 Agency- and GSE-backed mortgage pools 458.3 186.9 165.3 132.2 132.4 120.9 110.1 154.4 144.1 77.4 27.8 15
16 ABS issuers -614.0 -411.9 -172.6 -143.4 -234.8 -143.2 -663.8 -68.8 -63.4 -153.5 -52.7 16 17 Finance companies -156.2 -174.9 -13.5 -56.7 4.2 -28.5 4.2 41.3 -0.2 -31.5 3.0 17 18 REITs -27.6 0.1 25.6 35.5 178.4 8.0 550.3 38.5 116.8 140.1 49.4 18
19 Brokers and dealers -49.7 36.9 -37.9 -1.7 22.2 -4.2 55.8 -27.8 65.1 38.5 -34.5 19 20 Holding companies -8.0 -16.5 -16.5 -99.9 0.5 -24.5 -149.7 -27.5 203.8 12.9 3.9 20 21 Funding corporations -434.8 -65.3 -52.4 -23.9 27.0 66.9 8.1 -17.8 50.8 -7.2 74.6 21

Su
mm
ary
8 Z.1, September 18, 2014
F.4 Credit Market Borrowing, All Sectors, by InstrumentBillions of dollars; quarterly figures are seasonally adjusted annual rates
2009 2010 2011 2012 2013 2013 2014 Q1 Q2 Q3 Q4 Q1 Q2
1 Total -338.7 655.9 1125.0 1604.8 1953.5 1888.5 1341.1 1673.8 2910.6 1564.6 2321.2 1
2 Open market paper -461.8 -80.4 -88.3 -16.9 -0.8 104.0 -41.8 -29.0 -36.4 54.0 121.2 2 3 Treasury securities 1443.7 1579.6 1066.8 1140.6 759.5 1057.0 412.2 307.4 1261.2 743.0 314.3 3 4 Agency- and GSE-backed securities -59.9 -46.2 -20.8 -22.8 239.5 163.0 248.2 195.2 351.8 -280.0 184.8 4 5 Municipal securities 155.3 99.7 -52.8 -4.9 -43.2 61.4 -15.1 -105.4 -113.8 -38.0 15.7 5 6 Corporate and foreign bonds -55.4 -237.5 107.6 225.6 390.8 250.5 -50.5 633.1 730.0 360.6 669.8 6
7 Depository institution loans n.e.c. -758.5 -92.2 146.6 186.1 186.1 107.8 219.0 162.4 255.2 313.1 333.1 7 8 Other loans and advances -446.9 -226.8 4.9 -13.6 142.1 60.7 282.1 81.9 143.5 164.0 214.9 8 9 Mortgages -51.7 -314.8 -147.6 -58.9 105.2 -95.0 124.1 237.7 154.1 47.1 213.3 9 10 Consumer credit -103.6 -25.3 108.5 169.7 174.3 179.0 162.9 190.6 164.8 200.7 254.3 10
Memo: Funds raised through corporate equities and mutual fund shares
11 Total net issues 824.1 385.5 52.7 537.0 704.1 1256.5 534.7 523.2 502.1 541.1 1023.7 11
12 Corporate equities 327.1 15.4 -285.7 -87.9 65.4 285.8 42.5 -151.7 84.8 -155.0 289.4 12 13 Nonfinancial -52.5 -255.1 -456.7 -359.5 -373.3 -219.3 -376.1 -415.0 -483.0 -517.9 -353.4 13 Foreign shares purchased by 14 U.S. residents 63.7 79.2 7.0 103.3 275.2 269.2 371.3 78.7 381.8 325.0 342.5 14 15 Financial 315.9 191.4 164.1 168.3 163.5 235.9 47.4 184.6 186.0 37.9 300.3 15 16 Mutual fund shares 497.1 370.1 338.4 624.9 638.8 970.8 492.2 674.9 417.2 696.1 734.4 16
F.5 Net Increase in Liabilities and Its Relation to Net Acquisition of Financial AssetsBillions of dollars; quarterly figures are seasonally adjusted annual rates
Net flows through credit markets 1 (from table F.4, line 1) -338.7 655.9 1125.0 1604.8 1953.5 1888.5 1341.1 1673.8 2910.6 1564.6 2321.2 1
2 U.S. official reserve assets 99.9 1.8 15.9 4.5 -3.1 3.5 -0.8 -4.0 -11.1 -3.8 3.1 2 3 SDR certificates 3.0 0.0 0.0 0.0 0.0 0.0 0.0 0.0 0.0 0.0 0.0 3 4 Treasury currency -0.4 -0.3 0.0 0.0 -0.4 0.0 0.0 -1.4 0.0 0.0 0.0 4 5 Foreign deposits -43.9 71.6 -215.0 -144.0 32.7 205.0 166.3 -4.2 -236.2 -118.5 -109.0 5
6 Net interbank transactions -536.9 -142.8 820.5 -194.5 1111.6 1953.2 1896.2 516.4 80.5 1171.5 44.4 6 7 Checkable deposits and currency -7.9 266.3 234.5 267.7 332.6 268.7 192.5 126.2 743.1 183.4 569.5 7 8 Small time and savings deposits 517.2 298.3 577.4 539.6 307.0 153.2 344.1 557.4 173.2 517.3 359.2 8 9 Large time deposits -173.6 -182.7 -173.3 -19.2 102.1 0.0 46.0 242.6 120.0 231.4 73.0 9 10 Money market fund shares -498.7 -503.2 -112.8 7.1 28.7 -133.4 81.9 270.1 -104.0 -85.2 -143.8 10
11 Security repurchase agreements -346.6 421.3 276.2 251.3 -477.1 -700.6 -657.6 -111.6 -438.8 257.1 281.0 11 12 Corporate equities 327.1 15.4 -285.7 -87.9 65.4 285.8 42.5 -151.7 84.8 -155.0 289.4 12 13 Mutual fund shares 497.1 370.1 338.4 624.9 638.8 970.8 492.2 674.9 417.2 696.1 734.4 13 14 Trade payables 7.8 154.9 81.6 143.3 181.4 173.0 220.8 194.2 137.7 58.3 243.9 14
15 Security credit -5.4 105.0 -7.4 97.7 104.3 -9.8 172.3 44.8 209.9 147.6 240.0 15 16 Life insurance reserves 27.4 14.5 81.2 -11.9 30.0 11.7 28.7 45.3 34.4 64.6 17.1 16 17 Pension entitlements 397.6 595.8 499.2 497.9 494.9 447.9 441.4 499.2 591.3 514.8 570.3 17 18 Taxes payable -3.4 19.4 20.6 11.2 11.4 27.2 -91.5 34.3 75.6 33.2 43.8 18
19 Noncorporate proprietors’ equity -111.5 159.8 -61.4 -5.4 -46.8 -1.9 -59.8 -75.1 -50.7 10.8 -57.0 19 20 Miscellaneous 247.3 601.9 1232.5 1152.9 1397.0 2239.7 402.6 2155.5 790.3 2253.4 1384.8 20
21 Total financial sources 518.3 3430.0 5102.6 5248.3 6849.9 8268.9 5705.4 7265.1 6160.2 7095.3 7436.7 21
- Liabilities not identified as assets: 22 Treasury currency -4.4 -1.1 -0.7 -0.6 -1.1 -0.9 -0.7 -2.1 -0.6 -1.0 -0.9 22 23 Foreign deposits -55.1 49.2 -136.3 -137.7 -12.4 87.1 152.9 -9.9 -279.9 -8.4 -135.3 23 24 Net interbank liabilities 14.5 25.8 3.5 5.7 56.8 391.9 -131.1 -219.3 185.7 189.5 -64.2 24 25 Security repurchase agreements 207.1 55.0 68.7 -9.6 -167.0 -472.3 -137.3 13.9 -72.1 -138.5 -171.5 25 26 Taxes payable -33.5 -8.6 -7.0 -18.7 -19.5 -16.9 -108.5 8.4 39.0 -23.7 -71.4 26 27 Miscellaneous 235.3 301.0 614.3 542.8 75.3 -26.5 -685.0 1078.7 -65.9 -21.9 -243.2 27
- Floats not included in assets: 28 Checkable deposits: State and local govt. 0.0 0.0 0.0 0.0 0.0 0.0 0.0 0.0 0.0 0.0 0.0 28 29 Federal govt. 0.7 0.0 -0.1 0.6 0.4 -44.4 96.2 3.6 -53.6 -43.2 97.6 29 30 Private domestic -1.0 -1.1 0.9 0.9 -1.2 -5.2 2.2 1.0 -2.8 4.0 0.1 30 31 Trade credit 122.7 -10.2 -31.4 33.8 8.1 -40.4 -16.7 24.2 65.1 -60.7 18.1 31
Totals identified to sectors 32 as assets 32.1 3020.0 4590.6 4831.1 6910.4 8396.4 6533.3 6366.6 6345.2 7199.3 8007.3 32
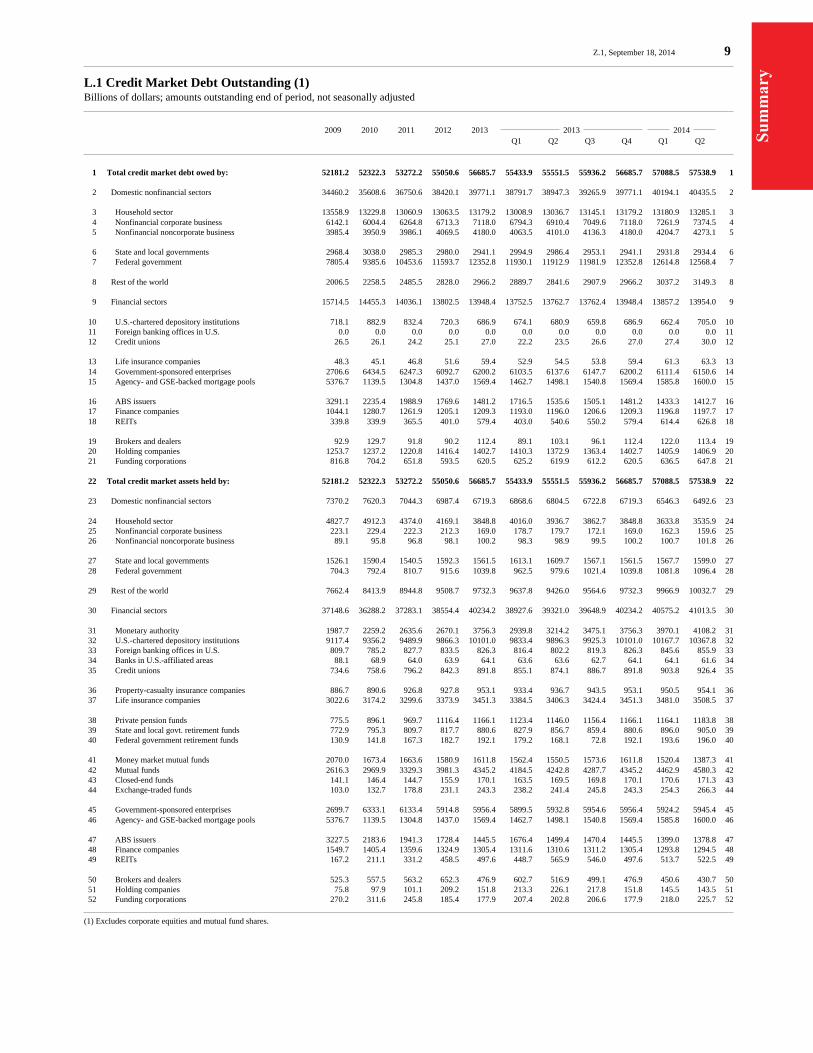
Su
mm
ary
Z.1, September 18, 2014 9
L.1 Credit Market Debt Outstanding (1)Billions of dollars; amounts outstanding end of period, not seasonally adjusted
2009 2010 2011 2012 2013 2013 2014 Q1 Q2 Q3 Q4 Q1 Q2
1 Total credit market debt owed by: 52181.2 52322.3 53272.2 55050.6 56685.7 55433.9 55551.5 55936.2 56685.7 57088.5 57538.9 1
2 Domestic nonfinancial sectors 34460.2 35608.6 36750.6 38420.1 39771.1 38791.7 38947.3 39265.9 39771.1 40194.1 40435.5 2
3 Household sector 13558.9 13229.8 13060.9 13063.5 13179.2 13008.9 13036.7 13145.1 13179.2 13180.9 13285.1 3 4 Nonfinancial corporate business 6142.1 6004.4 6264.8 6713.3 7118.0 6794.3 6910.4 7049.6 7118.0 7261.9 7374.5 4 5 Nonfinancial noncorporate business 3985.4 3950.9 3986.1 4069.5 4180.0 4063.5 4101.0 4136.3 4180.0 4204.7 4273.1 5
6 State and local governments 2968.4 3038.0 2985.3 2980.0 2941.1 2994.9 2986.4 2953.1 2941.1 2931.8 2934.4 6 7 Federal government 7805.4 9385.6 10453.6 11593.7 12352.8 11930.1 11912.9 11981.9 12352.8 12614.8 12568.4 7
8 Rest of the world 2006.5 2258.5 2485.5 2828.0 2966.2 2889.7 2841.6 2907.9 2966.2 3037.2 3149.3 8
9 Financial sectors 15714.5 14455.3 14036.1 13802.5 13948.4 13752.5 13762.7 13762.4 13948.4 13857.2 13954.0 9
10 U.S.-chartered depository institutions 718.1 882.9 832.4 720.3 686.9 674.1 680.9 659.8 686.9 662.4 705.0 10 11 Foreign banking offices in U.S. 0.0 0.0 0.0 0.0 0.0 0.0 0.0 0.0 0.0 0.0 0.0 11 12 Credit unions 26.5 26.1 24.2 25.1 27.0 22.2 23.5 26.6 27.0 27.4 30.0 12
13 Life insurance companies 48.3 45.1 46.8 51.6 59.4 52.9 54.5 53.8 59.4 61.3 63.3 13 14 Government-sponsored enterprises 2706.6 6434.5 6247.3 6092.7 6200.2 6103.5 6137.6 6147.7 6200.2 6111.4 6150.6 14 15 Agency- and GSE-backed mortgage pools 5376.7 1139.5 1304.8 1437.0 1569.4 1462.7 1498.1 1540.8 1569.4 1585.8 1600.0 15
16 ABS issuers 3291.1 2235.4 1988.9 1769.6 1481.2 1716.5 1535.6 1505.1 1481.2 1433.3 1412.7 16 17 Finance companies 1044.1 1280.7 1261.9 1205.1 1209.3 1193.0 1196.0 1206.6 1209.3 1196.8 1197.7 17 18 REITs 339.8 339.9 365.5 401.0 579.4 403.0 540.6 550.2 579.4 614.4 626.8 18
19 Brokers and dealers 92.9 129.7 91.8 90.2 112.4 89.1 103.1 96.1 112.4 122.0 113.4 19 20 Holding companies 1253.7 1237.2 1220.8 1416.4 1402.7 1410.3 1372.9 1363.4 1402.7 1405.9 1406.9 20 21 Funding corporations 816.8 704.2 651.8 593.5 620.5 625.2 619.9 612.2 620.5 636.5 647.8 21
22 Total credit market assets held by: 52181.2 52322.3 53272.2 55050.6 56685.7 55433.9 55551.5 55936.2 56685.7 57088.5 57538.9 22
23 Domestic nonfinancial sectors 7370.2 7620.3 7044.3 6987.4 6719.3 6868.6 6804.5 6722.8 6719.3 6546.3 6492.6 23
24 Household sector 4827.7 4912.3 4374.0 4169.1 3848.8 4016.0 3936.7 3862.7 3848.8 3633.8 3535.9 24 25 Nonfinancial corporate business 223.1 229.4 222.3 212.3 169.0 178.7 179.7 172.1 169.0 162.3 159.6 25 26 Nonfinancial noncorporate business 89.1 95.8 96.8 98.1 100.2 98.3 98.9 99.5 100.2 100.7 101.8 26
27 State and local governments 1526.1 1590.4 1540.5 1592.3 1561.5 1613.1 1609.7 1567.1 1561.5 1567.7 1599.0 27 28 Federal government 704.3 792.4 810.7 915.6 1039.8 962.5 979.6 1021.4 1039.8 1081.8 1096.4 28
29 Rest of the world 7662.4 8413.9 8944.8 9508.7 9732.3 9637.8 9426.0 9564.6 9732.3 9966.9 10032.7 29
30 Financial sectors 37148.6 36288.2 37283.1 38554.4 40234.2 38927.6 39321.0 39648.9 40234.2 40575.2 41013.5 30
31 Monetary authority 1987.7 2259.2 2635.6 2670.1 3756.3 2939.8 3214.2 3475.1 3756.3 3970.1 4108.2 31 32 U.S.-chartered depository institutions 9117.4 9356.2 9489.9 9866.3 10101.0 9833.4 9896.3 9925.3 10101.0 10167.7 10367.8 32 33 Foreign banking offices in U.S. 809.7 785.2 827.7 833.5 826.3 816.4 802.2 819.3 826.3 845.6 855.9 33 34 Banks in U.S.-affiliated areas 88.1 68.9 64.0 63.9 64.1 63.6 63.6 62.7 64.1 64.1 61.6 34 35 Credit unions 734.6 758.6 796.2 842.3 891.8 855.1 874.1 886.7 891.8 903.8 926.4 35
36 Property-casualty insurance companies 886.7 890.6 926.8 927.8 953.1 933.4 936.7 943.5 953.1 950.5 954.1 36 37 Life insurance companies 3022.6 3174.2 3299.6 3373.9 3451.3 3384.5 3406.3 3424.4 3451.3 3481.0 3508.5 37
38 Private pension funds 775.5 896.1 969.7 1116.4 1166.1 1123.4 1146.0 1156.4 1166.1 1164.1 1183.8 38 39 State and local govt. retirement funds 772.9 795.3 809.7 817.7 880.6 827.9 856.7 859.4 880.6 896.0 905.0 39 40 Federal government retirement funds 130.9 141.8 167.3 182.7 192.1 179.2 168.1 72.8 192.1 193.6 196.0 40
41 Money market mutual funds 2070.0 1673.4 1663.6 1580.9 1611.8 1562.4 1550.5 1573.6 1611.8 1520.4 1387.3 41 42 Mutual funds 2616.3 2969.9 3329.3 3981.3 4345.2 4184.5 4242.8 4287.7 4345.2 4462.9 4580.3 42 43 Closed-end funds 141.1 146.4 144.7 155.9 170.1 163.5 169.5 169.8 170.1 170.6 171.3 43 44 Exchange-traded funds 103.0 132.7 178.8 231.1 243.3 238.2 241.4 245.8 243.3 254.3 266.3 44
45 Government-sponsored enterprises 2699.7 6333.1 6133.4 5914.8 5956.4 5899.5 5932.8 5954.6 5956.4 5924.2 5945.4 45 46 Agency- and GSE-backed mortgage pools 5376.7 1139.5 1304.8 1437.0 1569.4 1462.7 1498.1 1540.8 1569.4 1585.8 1600.0 46
47 ABS issuers 3227.5 2183.6 1941.3 1728.4 1445.5 1676.4 1499.4 1470.4 1445.5 1399.0 1378.8 47 48 Finance companies 1549.7 1405.4 1359.6 1324.9 1305.4 1311.6 1310.6 1311.2 1305.4 1293.8 1294.5 48 49 REITs 167.2 211.1 331.2 458.5 497.6 448.7 565.9 546.0 497.6 513.7 522.5 49
50 Brokers and dealers 525.3 557.5 563.2 652.3 476.9 602.7 516.9 499.1 476.9 450.6 430.7 50 51 Holding companies 75.8 97.9 101.1 209.2 151.8 213.3 226.1 217.8 151.8 145.5 143.5 51 52 Funding corporations 270.2 311.6 245.8 185.4 177.9 207.4 202.8 206.6 177.9 218.0 225.7 52
(1) Excludes corporate equities and mutual fund shares.
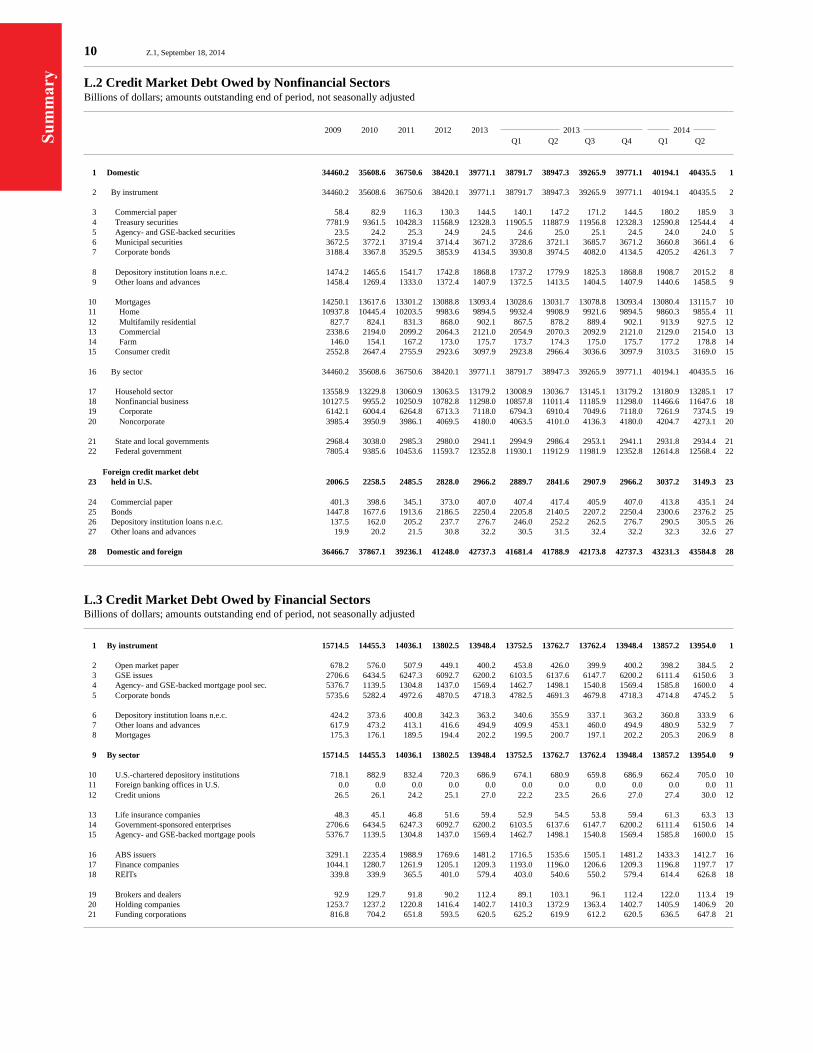
Su
mm
ary
10 Z.1, September 18, 2014
L.2 Credit Market Debt Owed by Nonfinancial SectorsBillions of dollars; amounts outstanding end of period, not seasonally adjusted
2009 2010 2011 2012 2013 2013 2014 Q1 Q2 Q3 Q4 Q1 Q2
1 Domestic 34460.2 35608.6 36750.6 38420.1 39771.1 38791.7 38947.3 39265.9 39771.1 40194.1 40435.5 1
2 By instrument 34460.2 35608.6 36750.6 38420.1 39771.1 38791.7 38947.3 39265.9 39771.1 40194.1 40435.5 2
3 Commercial paper 58.4 82.9 116.3 130.3 144.5 140.1 147.2 171.2 144.5 180.2 185.9 3 4 Treasury securities 7781.9 9361.5 10428.3 11568.9 12328.3 11905.5 11887.9 11956.8 12328.3 12590.8 12544.4 4 5 Agency- and GSE-backed securities 23.5 24.2 25.3 24.9 24.5 24.6 25.0 25.1 24.5 24.0 24.0 5 6 Municipal securities 3672.5 3772.1 3719.4 3714.4 3671.2 3728.6 3721.1 3685.7 3671.2 3660.8 3661.4 6 7 Corporate bonds 3188.4 3367.8 3529.5 3853.9 4134.5 3930.8 3974.5 4082.0 4134.5 4205.2 4261.3 7
8 Depository institution loans n.e.c. 1474.2 1465.6 1541.7 1742.8 1868.8 1737.2 1779.9 1825.3 1868.8 1908.7 2015.2 8 9 Other loans and advances 1458.4 1269.4 1333.0 1372.4 1407.9 1372.5 1413.5 1404.5 1407.9 1440.6 1458.5 9
10 Mortgages 14250.1 13617.6 13301.2 13088.8 13093.4 13028.6 13031.7 13078.8 13093.4 13080.4 13115.7 10 11 Home 10937.8 10445.4 10203.5 9983.6 9894.5 9932.4 9908.9 9921.6 9894.5 9860.3 9855.4 11 12 Multifamily residential 827.7 824.1 831.3 868.0 902.1 867.5 878.2 889.4 902.1 913.9 927.5 12 13 Commercial 2338.6 2194.0 2099.2 2064.3 2121.0 2054.9 2070.3 2092.9 2121.0 2129.0 2154.0 13 14 Farm 146.0 154.1 167.2 173.0 175.7 173.7 174.3 175.0 175.7 177.2 178.8 14 15 Consumer credit 2552.8 2647.4 2755.9 2923.6 3097.9 2923.8 2966.4 3036.6 3097.9 3103.5 3169.0 15
16 By sector 34460.2 35608.6 36750.6 38420.1 39771.1 38791.7 38947.3 39265.9 39771.1 40194.1 40435.5 16
17 Household sector 13558.9 13229.8 13060.9 13063.5 13179.2 13008.9 13036.7 13145.1 13179.2 13180.9 13285.1 17 18 Nonfinancial business 10127.5 9955.2 10250.9 10782.8 11298.0 10857.8 11011.4 11185.9 11298.0 11466.6 11647.6 18 19 Corporate 6142.1 6004.4 6264.8 6713.3 7118.0 6794.3 6910.4 7049.6 7118.0 7261.9 7374.5 19 20 Noncorporate 3985.4 3950.9 3986.1 4069.5 4180.0 4063.5 4101.0 4136.3 4180.0 4204.7 4273.1 20
21 State and local governments 2968.4 3038.0 2985.3 2980.0 2941.1 2994.9 2986.4 2953.1 2941.1 2931.8 2934.4 21 22 Federal government 7805.4 9385.6 10453.6 11593.7 12352.8 11930.1 11912.9 11981.9 12352.8 12614.8 12568.4 22
Foreign credit market debt 23 held in U.S. 2006.5 2258.5 2485.5 2828.0 2966.2 2889.7 2841.6 2907.9 2966.2 3037.2 3149.3 23
24 Commercial paper 401.3 398.6 345.1 373.0 407.0 407.4 417.4 405.9 407.0 413.8 435.1 24 25 Bonds 1447.8 1677.6 1913.6 2186.5 2250.4 2205.8 2140.5 2207.2 2250.4 2300.6 2376.2 25 26 Depository institution loans n.e.c. 137.5 162.0 205.2 237.7 276.7 246.0 252.2 262.5 276.7 290.5 305.5 26 27 Other loans and advances 19.9 20.2 21.5 30.8 32.2 30.5 31.5 32.4 32.2 32.3 32.6 27
28 Domestic and foreign 36466.7 37867.1 39236.1 41248.0 42737.3 41681.4 41788.9 42173.8 42737.3 43231.3 43584.8 28
L.3 Credit Market Debt Owed by Financial SectorsBillions of dollars; amounts outstanding end of period, not seasonally adjusted
1 By instrument 15714.5 14455.3 14036.1 13802.5 13948.4 13752.5 13762.7 13762.4 13948.4 13857.2 13954.0 1
2 Open market paper 678.2 576.0 507.9 449.1 400.2 453.8 426.0 399.9 400.2 398.2 384.5 2 3 GSE issues 2706.6 6434.5 6247.3 6092.7 6200.2 6103.5 6137.6 6147.7 6200.2 6111.4 6150.6 3 4 Agency- and GSE-backed mortgage pool sec. 5376.7 1139.5 1304.8 1437.0 1569.4 1462.7 1498.1 1540.8 1569.4 1585.8 1600.0 4 5 Corporate bonds 5735.6 5282.4 4972.6 4870.5 4718.3 4782.5 4691.3 4679.8 4718.3 4714.8 4745.2 5
6 Depository institution loans n.e.c. 424.2 373.6 400.8 342.3 363.2 340.6 355.9 337.1 363.2 360.8 333.9 6 7 Other loans and advances 617.9 473.2 413.1 416.6 494.9 409.9 453.1 460.0 494.9 480.9 532.9 7 8 Mortgages 175.3 176.1 189.5 194.4 202.2 199.5 200.7 197.1 202.2 205.3 206.9 8
9 By sector 15714.5 14455.3 14036.1 13802.5 13948.4 13752.5 13762.7 13762.4 13948.4 13857.2 13954.0 9
10 U.S.-chartered depository institutions 718.1 882.9 832.4 720.3 686.9 674.1 680.9 659.8 686.9 662.4 705.0 10 11 Foreign banking offices in U.S. 0.0 0.0 0.0 0.0 0.0 0.0 0.0 0.0 0.0 0.0 0.0 11 12 Credit unions 26.5 26.1 24.2 25.1 27.0 22.2 23.5 26.6 27.0 27.4 30.0 12
13 Life insurance companies 48.3 45.1 46.8 51.6 59.4 52.9 54.5 53.8 59.4 61.3 63.3 13 14 Government-sponsored enterprises 2706.6 6434.5 6247.3 6092.7 6200.2 6103.5 6137.6 6147.7 6200.2 6111.4 6150.6 14 15 Agency- and GSE-backed mortgage pools 5376.7 1139.5 1304.8 1437.0 1569.4 1462.7 1498.1 1540.8 1569.4 1585.8 1600.0 15
16 ABS issuers 3291.1 2235.4 1988.9 1769.6 1481.2 1716.5 1535.6 1505.1 1481.2 1433.3 1412.7 16 17 Finance companies 1044.1 1280.7 1261.9 1205.1 1209.3 1193.0 1196.0 1206.6 1209.3 1196.8 1197.7 17 18 REITs 339.8 339.9 365.5 401.0 579.4 403.0 540.6 550.2 579.4 614.4 626.8 18
19 Brokers and dealers 92.9 129.7 91.8 90.2 112.4 89.1 103.1 96.1 112.4 122.0 113.4 19 20 Holding companies 1253.7 1237.2 1220.8 1416.4 1402.7 1410.3 1372.9 1363.4 1402.7 1405.9 1406.9 20 21 Funding corporations 816.8 704.2 651.8 593.5 620.5 625.2 619.9 612.2 620.5 636.5 647.8 21

Su
mm
ary
Z.1, September 18, 2014 11
L.4 Credit Market Debt, All Sectors, by InstrumentBillions of dollars; amounts outstanding end of period, not seasonally adjusted
2009 2010 2011 2012 2013 2013 2014 Q1 Q2 Q3 Q4 Q1 Q2
1 Total 52181.2 52322.3 53272.2 55050.6 56685.7 55433.9 55551.5 55936.2 56685.7 57088.5 57538.9 1
2 Open market paper 1138.0 1057.6 969.3 952.4 951.6 1001.2 990.6 976.9 951.6 992.2 1005.5 2 3 Treasury securities 7781.9 9361.5 10428.3 11568.9 12328.3 11905.5 11887.9 11956.8 12328.3 12590.8 12544.4 3 4 Agency- and GSE-backed securities 8106.8 7598.2 7577.4 7554.6 7794.1 7590.8 7660.7 7713.6 7794.1 7721.1 7774.6 4 5 Municipal securities 3672.5 3772.1 3719.4 3714.4 3671.2 3728.6 3721.1 3685.7 3671.2 3660.8 3661.4 5 6 Corporate and foreign bonds 10371.8 10327.8 10415.7 10910.9 11103.2 10919.1 10806.3 10969.0 11103.2 11220.6 11382.8 6
7 Depository institution loans n.e.c. 2035.9 2001.2 2147.8 2322.7 2508.8 2323.8 2388.1 2424.8 2508.8 2560.0 2654.5 7 8 Other loans and advances 2096.1 1762.8 1767.7 1819.8 1935.0 1812.9 1898.0 1896.8 1935.0 1953.8 2024.0 8 9 Mortgages 14425.4 13793.7 13490.7 13283.2 13295.5 13228.1 13232.4 13275.9 13295.5 13285.8 13322.6 9 10 Consumer credit 2552.8 2647.4 2755.9 2923.6 3097.9 2923.8 2966.4 3036.6 3097.9 3103.5 3169.0 10
Memo: Selected claims not included above: 11 Corporate equities 20085.5 23567.2 22960.8 26237.2 33671.6 28730.7 29254.4 31186.3 33671.6 34230.4 35820.7 11 12 Mutual fund shares 6920.7 7873.0 7870.9 9326.1 11544.8 10088.7 10297.9 10904.9 11544.8 11898.6 12314.0 12
L.5 Total Liabilities and Its Relation to Total Financial AssetsBillions of dollars; amounts outstanding end of period, not seasonally adjusted
Total credit market debt 1 (from table L.4) 52181.2 52322.3 53272.2 55050.6 56685.7 55433.9 55551.5 55936.2 56685.7 57088.5 57538.9 1
2 U.S. official reserve assets 174.8 175.5 190.9 193.2 187.7 188.1 187.6 190.7 187.7 187.7 189.1 2 3 SDR certificates 5.2 5.2 5.2 5.2 5.2 5.2 5.2 5.2 5.2 5.2 5.2 3 4 Treasury currency 26.2 25.9 25.9 25.9 25.6 25.9 25.9 25.6 25.6 25.6 25.6 4 5 Foreign deposits 1258.4 1303.9 1066.4 922.8 954.8 974.1 1015.6 1014.7 954.8 927.9 906.4 5 6 Net interbank liabilities 1215.5 1068.5 1889.0 1683.8 2795.4 2096.9 2580.4 2767.7 2795.4 3006.6 3020.2 6
7 Checkable deposits and currency 2093.4 2359.8 2594.3 2853.8 3186.5 2872.9 2892.3 2924.6 3186.5 3183.8 3293.3 7 8 Small time and savings deposits 6326.5 6624.9 7202.2 7803.9 8110.8 7869.1 7890.1 8052.9 8110.8 8265.3 8291.6 8 9 Large time deposits 2105.9 1923.2 1750.0 1659.9 1762.0 1652.5 1682.4 1736.8 1762.0 1810.4 1849.4 9 10 Money market fund shares 3258.6 2755.4 2642.5 2649.6 2678.3 2553.8 2541.9 2638.9 2678.3 2592.5 2522.4 10 11 Security repurchase agreements 3175.6 3597.9 3878.7 4130.1 3652.9 3962.5 3798.2 3766.8 3652.9 3722.7 3791.7 11
12 Mutual fund shares 6920.7 7873.0 7870.9 9326.1 11544.8 10088.7 10297.9 10904.9 11544.8 11898.6 12314.0 12 13 Security credit 936.7 1041.7 1034.2 1131.9 1236.2 1129.5 1172.5 1183.8 1236.2 1273.1 1333.1 13 14 Life insurance reserves 1242.1 1278.3 1352.0 1359.0 1416.5 1370.1 1378.3 1397.4 1416.5 1434.4 1443.7 14 15 Pension entitlements 15455.1 17031.7 17444.7 18457.8 19886.1 18930.7 19085.2 19440.8 19886.1 20085.5 20406.1 15
16 Trade payables 3216.0 3370.8 3452.5 3593.3 3760.9 3636.9 3703.2 3734.2 3760.9 3779.0 3849.6 16 17 Taxes payable 40.6 53.1 74.0 79.5 90.9 97.0 68.6 80.2 90.9 110.0 114.9 17 18 Miscellaneous 15807.7 15907.9 16567.2 17363.9 17190.4 17454.1 17377.7 17513.4 17190.4 17361.7 17416.2 18
19 Total liabilities 121915.7 125616.2 129711.1 136257.6 143631.9 138395.1 139438.7 141668.0 143631.9 145229.1 146989.6 19
+ Financial assets not included in liabilities: 20 Gold 11.0 11.0 11.0 11.0 11.0 11.0 11.0 11.0 11.0 11.0 11.0 20 21 Corporate equities 20085.5 23567.2 22960.8 26237.2 33671.6 28730.7 29254.4 31186.3 33671.6 34230.4 35820.7 21 22 Household equity in noncorp. bus. 6301.6 6939.4 7418.3 8086.4 9057.7 8299.8 8561.8 8842.6 9057.7 9127.6 9188.4 22
- Liabilities not identified as assets: 23 Treasury currency -16.5 -17.6 -18.3 -18.8 -19.9 -19.0 -19.2 -19.8 -19.9 -20.2 -20.4 23 24 Foreign deposits 1067.0 1090.1 931.3 794.0 780.8 815.8 854.0 851.6 780.8 781.4 753.3 24 25 Net interbank transactions 3.0 24.8 28.3 20.1 76.9 49.9 26.6 32.9 76.9 49.8 36.4 25
26 Security repurchase agreements 206.4 255.3 324.5 205.6 38.6 127.8 85.1 63.2 38.6 46.6 -12.0 26 27 Taxes payable -210.4 -209.0 -198.8 -200.4 -198.7 -185.2 -216.2 -207.2 -198.7 -186.2 -182.1 27 28 Miscellaneous -5388.6 -5900.9 -6109.9 -6216.7 -6604.6 -6290.4 -6502.7 -6335.6 -6604.6 -6820.0 -6956.7 28
- Floats not included in assets: 29 Checkable deposits: State and local govt. 0.0 0.0 0.0 0.0 0.0 0.0 0.0 0.0 0.0 0.0 0.0 29 30 Federal govt. 1.7 2.2 2.3 2.1 1.2 1.3 0.9 1.2 1.2 1.6 1.8 30 31 Private domestic 4.2 3.2 4.1 4.9 3.7 3.3 4.1 4.5 3.7 4.4 4.6 31 32 Trade credit 245.1 238.5 207.2 238.4 240.6 167.4 132.4 141.6 240.6 162.5 134.6 32
33 Totals identified to sectors as assets 152401.9 160647.2 164930.7 175763.2 192053.6 180765.7 182901.0 187175.5 192053.6 194578.1 198250.1 33
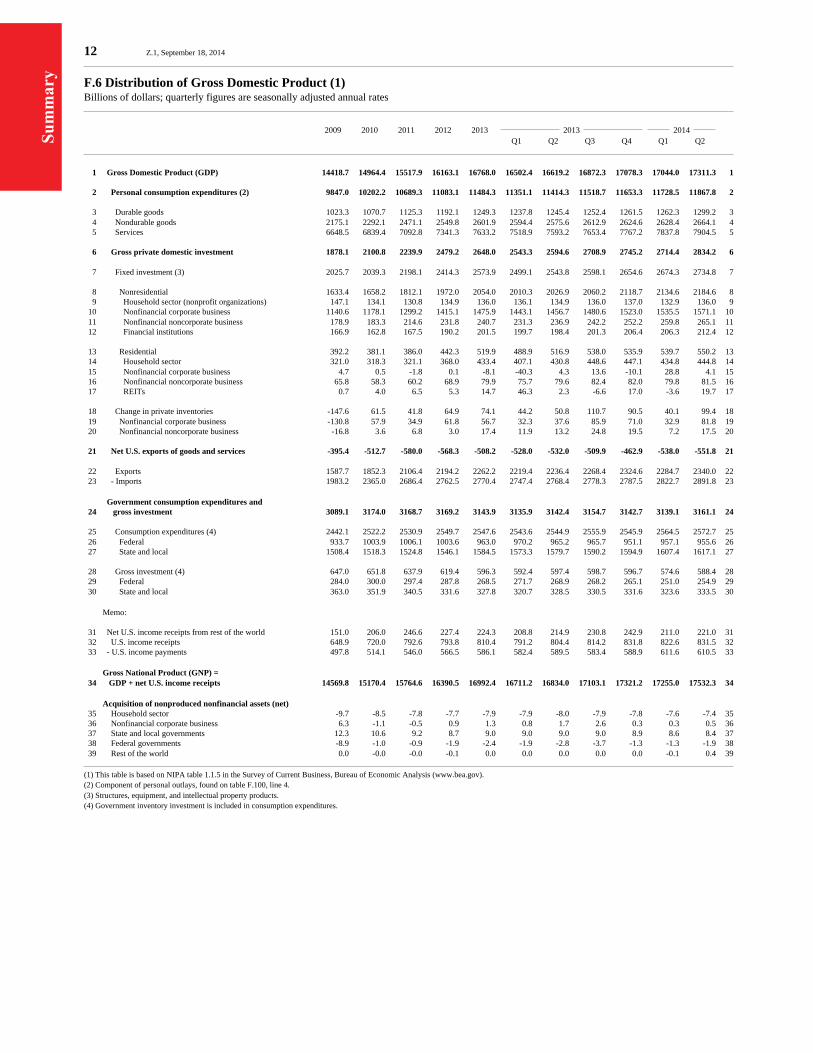
Su
mm
ary
12 Z.1, September 18, 2014
F.6 Distribution of Gross Domestic Product (1)Billions of dollars; quarterly figures are seasonally adjusted annual rates
2009 2010 2011 2012 2013 2013 2014 Q1 Q2 Q3 Q4 Q1 Q2
1 Gross Domestic Product (GDP) 14418.7 14964.4 15517.9 16163.1 16768.0 16502.4 16619.2 16872.3 17078.3 17044.0 17311.3 1
2 Personal consumption expenditures (2) 9847.0 10202.2 10689.3 11083.1 11484.3 11351.1 11414.3 11518.7 11653.3 11728.5 11867.8 2
3 Durable goods 1023.3 1070.7 1125.3 1192.1 1249.3 1237.8 1245.4 1252.4 1261.5 1262.3 1299.2 3 4 Nondurable goods 2175.1 2292.1 2471.1 2549.8 2601.9 2594.4 2575.6 2612.9 2624.6 2628.4 2664.1 4 5 Services 6648.5 6839.4 7092.8 7341.3 7633.2 7518.9 7593.2 7653.4 7767.2 7837.8 7904.5 5
6 Gross private domestic investment 1878.1 2100.8 2239.9 2479.2 2648.0 2543.3 2594.6 2708.9 2745.2 2714.4 2834.2 6
7 Fixed investment (3) 2025.7 2039.3 2198.1 2414.3 2573.9 2499.1 2543.8 2598.1 2654.6 2674.3 2734.8 7
8 Nonresidential 1633.4 1658.2 1812.1 1972.0 2054.0 2010.3 2026.9 2060.2 2118.7 2134.6 2184.6 8 9 Household sector (nonprofit organizations) 147.1 134.1 130.8 134.9 136.0 136.1 134.9 136.0 137.0 132.9 136.0 9 10 Nonfinancial corporate business 1140.6 1178.1 1299.2 1415.1 1475.9 1443.1 1456.7 1480.6 1523.0 1535.5 1571.1 10 11 Nonfinancial noncorporate business 178.9 183.3 214.6 231.8 240.7 231.3 236.9 242.2 252.2 259.8 265.1 11 12 Financial institutions 166.9 162.8 167.5 190.2 201.5 199.7 198.4 201.3 206.4 206.3 212.4 12
13 Residential 392.2 381.1 386.0 442.3 519.9 488.9 516.9 538.0 535.9 539.7 550.2 13 14 Household sector 321.0 318.3 321.1 368.0 433.4 407.1 430.8 448.6 447.1 434.8 444.8 14 15 Nonfinancial corporate business 4.7 0.5 -1.8 0.1 -8.1 -40.3 4.3 13.6 -10.1 28.8 4.1 15 16 Nonfinancial noncorporate business 65.8 58.3 60.2 68.9 79.9 75.7 79.6 82.4 82.0 79.8 81.5 16 17 REITs 0.7 4.0 6.5 5.3 14.7 46.3 2.3 -6.6 17.0 -3.6 19.7 17
18 Change in private inventories -147.6 61.5 41.8 64.9 74.1 44.2 50.8 110.7 90.5 40.1 99.4 18 19 Nonfinancial corporate business -130.8 57.9 34.9 61.8 56.7 32.3 37.6 85.9 71.0 32.9 81.8 19 20 Nonfinancial noncorporate business -16.8 3.6 6.8 3.0 17.4 11.9 13.2 24.8 19.5 7.2 17.5 20
21 Net U.S. exports of goods and services -395.4 -512.7 -580.0 -568.3 -508.2 -528.0 -532.0 -509.9 -462.9 -538.0 -551.8 21
22 Exports 1587.7 1852.3 2106.4 2194.2 2262.2 2219.4 2236.4 2268.4 2324.6 2284.7 2340.0 22 23 - Imports 1983.2 2365.0 2686.4 2762.5 2770.4 2747.4 2768.4 2778.3 2787.5 2822.7 2891.8 23
Government consumption expenditures and 24 gross investment 3089.1 3174.0 3168.7 3169.2 3143.9 3135.9 3142.4 3154.7 3142.7 3139.1 3161.1 24
25 Consumption expenditures (4) 2442.1 2522.2 2530.9 2549.7 2547.6 2543.6 2544.9 2555.9 2545.9 2564.5 2572.7 25 26 Federal 933.7 1003.9 1006.1 1003.6 963.0 970.2 965.2 965.7 951.1 957.1 955.6 26 27 State and local 1508.4 1518.3 1524.8 1546.1 1584.5 1573.3 1579.7 1590.2 1594.9 1607.4 1617.1 27
28 Gross investment (4) 647.0 651.8 637.9 619.4 596.3 592.4 597.4 598.7 596.7 574.6 588.4 28 29 Federal 284.0 300.0 297.4 287.8 268.5 271.7 268.9 268.2 265.1 251.0 254.9 29 30 State and local 363.0 351.9 340.5 331.6 327.8 320.7 328.5 330.5 331.6 323.6 333.5 30
Memo:
31 Net U.S. income receipts from rest of the world 151.0 206.0 246.6 227.4 224.3 208.8 214.9 230.8 242.9 211.0 221.0 31 32 U.S. income receipts 648.9 720.0 792.6 793.8 810.4 791.2 804.4 814.2 831.8 822.6 831.5 32 33 - U.S. income payments 497.8 514.1 546.0 566.5 586.1 582.4 589.5 583.4 588.9 611.6 610.5 33
Gross National Product (GNP) = 34 GDP + net U.S. income receipts 14569.8 15170.4 15764.6 16390.5 16992.4 16711.2 16834.0 17103.1 17321.2 17255.0 17532.3 34
Acquisition of nonproduced nonfinancial assets (net) 35 Household sector -9.7 -8.5 -7.8 -7.7 -7.9 -7.9 -8.0 -7.9 -7.8 -7.6 -7.4 35 36 Nonfinancial corporate business 6.3 -1.1 -0.5 0.9 1.3 0.8 1.7 2.6 0.3 0.3 0.5 36 37 State and local governments 12.3 10.6 9.2 8.7 9.0 9.0 9.0 9.0 8.9 8.6 8.4 37 38 Federal governments -8.9 -1.0 -0.9 -1.9 -2.4 -1.9 -2.8 -3.7 -1.3 -1.3 -1.9 38 39 Rest of the world 0.0 -0.0 -0.0 -0.1 0.0 0.0 0.0 0.0 0.0 -0.1 0.4 39
(1) This table is based on NIPA table 1.1.5 in the Survey of Current Business, Bureau of Economic Analysis (www.bea.gov).(2) Component of personal outlays, found on table F.100, line 4.(3) Structures, equipment, and intellectual property products.(4) Government inventory investment is included in consumption expenditures.
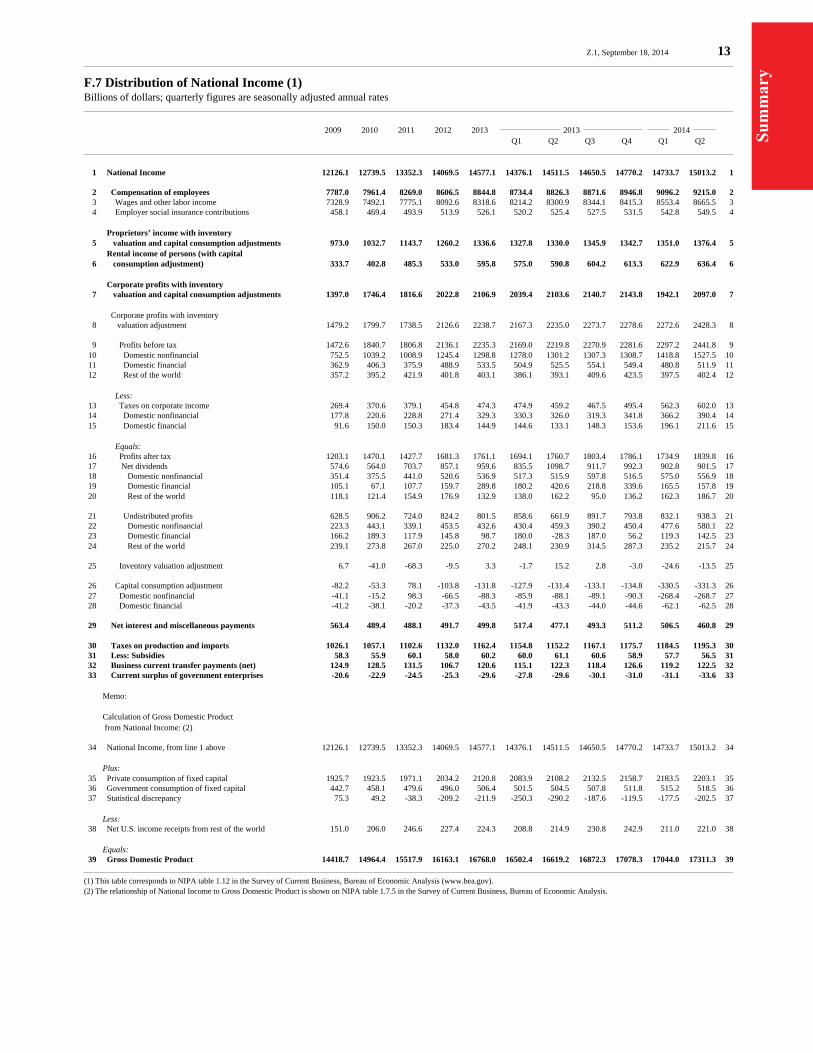
Su
mm
ary
Z.1, September 18, 2014 13
F.7 Distribution of National Income (1)Billions of dollars; quarterly figures are seasonally adjusted annual rates
2009 2010 2011 2012 2013 2013 2014 Q1 Q2 Q3 Q4 Q1 Q2
1 National Income 12126.1 12739.5 13352.3 14069.5 14577.1 14376.1 14511.5 14650.5 14770.2 14733.7 15013.2 1
2 Compensation of employees 7787.0 7961.4 8269.0 8606.5 8844.8 8734.4 8826.3 8871.6 8946.8 9096.2 9215.0 2 3 Wages and other labor income 7328.9 7492.1 7775.1 8092.6 8318.6 8214.2 8300.9 8344.1 8415.3 8553.4 8665.5 3 4 Employer social insurance contributions 458.1 469.4 493.9 513.9 526.1 520.2 525.4 527.5 531.5 542.8 549.5 4
Proprietors’ income with inventory 5 valuation and capital consumption adjustments 973.0 1032.7 1143.7 1260.2 1336.6 1327.8 1330.0 1345.9 1342.7 1351.0 1376.4 5 Rental income of persons (with capital 6 consumption adjustment) 333.7 402.8 485.3 533.0 595.8 575.0 590.8 604.2 613.3 622.9 636.4 6
Corporate profits with inventory 7 valuation and capital consumption adjustments 1397.0 1746.4 1816.6 2022.8 2106.9 2039.4 2103.6 2140.7 2143.8 1942.1 2097.0 7
Corporate profits with inventory 8 valuation adjustment 1479.2 1799.7 1738.5 2126.6 2238.7 2167.3 2235.0 2273.7 2278.6 2272.6 2428.3 8
9 Profits before tax 1472.6 1840.7 1806.8 2136.1 2235.3 2169.0 2219.8 2270.9 2281.6 2297.2 2441.8 9 10 Domestic nonfinancial 752.5 1039.2 1008.9 1245.4 1298.8 1278.0 1301.2 1307.3 1308.7 1418.8 1527.5 10 11 Domestic financial 362.9 406.3 375.9 488.9 533.5 504.9 525.5 554.1 549.4 480.8 511.9 11 12 Rest of the world 357.2 395.2 421.9 401.8 403.1 386.1 393.1 409.6 423.5 397.5 402.4 12
Less: 13 Taxes on corporate income 269.4 370.6 379.1 454.8 474.3 474.9 459.2 467.5 495.4 562.3 602.0 13 14 Domestic nonfinancial 177.8 220.6 228.8 271.4 329.3 330.3 326.0 319.3 341.8 366.2 390.4 14 15 Domestic financial 91.6 150.0 150.3 183.4 144.9 144.6 133.1 148.3 153.6 196.1 211.6 15
Equals: 16 Profits after tax 1203.1 1470.1 1427.7 1681.3 1761.1 1694.1 1760.7 1803.4 1786.1 1734.9 1839.8 16 17 Net dividends 574.6 564.0 703.7 857.1 959.6 835.5 1098.7 911.7 992.3 902.8 901.5 17 18 Domestic nonfinancial 351.4 375.5 441.0 520.6 536.9 517.3 515.9 597.8 516.5 575.0 556.9 18 19 Domestic financial 105.1 67.1 107.7 159.7 289.8 180.2 420.6 218.8 339.6 165.5 157.8 19 20 Rest of the world 118.1 121.4 154.9 176.9 132.9 138.0 162.2 95.0 136.2 162.3 186.7 20
21 Undistributed profits 628.5 906.2 724.0 824.2 801.5 858.6 661.9 891.7 793.8 832.1 938.3 21 22 Domestic nonfinancial 223.3 443.1 339.1 453.5 432.6 430.4 459.3 390.2 450.4 477.6 580.1 22 23 Domestic financial 166.2 189.3 117.9 145.8 98.7 180.0 -28.3 187.0 56.2 119.3 142.5 23 24 Rest of the world 239.1 273.8 267.0 225.0 270.2 248.1 230.9 314.5 287.3 235.2 215.7 24
25 Inventory valuation adjustment 6.7 -41.0 -68.3 -9.5 3.3 -1.7 15.2 2.8 -3.0 -24.6 -13.5 25
26 Capital consumption adjustment -82.2 -53.3 78.1 -103.8 -131.8 -127.9 -131.4 -133.1 -134.8 -330.5 -331.3 26 27 Domestic nonfinancial -41.1 -15.2 98.3 -66.5 -88.3 -85.9 -88.1 -89.1 -90.3 -268.4 -268.7 27 28 Domestic financial -41.2 -38.1 -20.2 -37.3 -43.5 -41.9 -43.3 -44.0 -44.6 -62.1 -62.5 28
29 Net interest and miscellaneous payments 563.4 489.4 488.1 491.7 499.8 517.4 477.1 493.3 511.2 506.5 460.8 29
30 Taxes on production and imports 1026.1 1057.1 1102.6 1132.0 1162.4 1154.8 1152.2 1167.1 1175.7 1184.5 1195.3 30 31 Less: Subsidies 58.3 55.9 60.1 58.0 60.2 60.0 61.1 60.6 58.9 57.7 56.5 31 32 Business current transfer payments (net) 124.9 128.5 131.5 106.7 120.6 115.1 122.3 118.4 126.6 119.2 122.5 32 33 Current surplus of government enterprises -20.6 -22.9 -24.5 -25.3 -29.6 -27.8 -29.6 -30.1 -31.0 -31.1 -33.6 33
Memo:
Calculation of Gross Domestic Product from National Income: (2)
34 National Income, from line 1 above 12126.1 12739.5 13352.3 14069.5 14577.1 14376.1 14511.5 14650.5 14770.2 14733.7 15013.2 34
Plus: 35 Private consumption of fixed capital 1925.7 1923.5 1971.1 2034.2 2120.8 2083.9 2108.2 2132.5 2158.7 2183.5 2203.1 35 36 Government consumption of fixed capital 442.7 458.1 479.6 496.0 506.4 501.5 504.5 507.8 511.8 515.2 518.5 36 37 Statistical discrepancy 75.3 49.2 -38.3 -209.2 -211.9 -250.3 -290.2 -187.6 -119.5 -177.5 -202.5 37
Less: 38 Net U.S. income receipts from rest of the world 151.0 206.0 246.6 227.4 224.3 208.8 214.9 230.8 242.9 211.0 221.0 38
Equals: 39 Gross Domestic Product 14418.7 14964.4 15517.9 16163.1 16768.0 16502.4 16619.2 16872.3 17078.3 17044.0 17311.3 39
(1) This table corresponds to NIPA table 1.12 in the Survey of Current Business, Bureau of Economic Analysis (www.bea.gov).(2) The relationship of National Income to Gross Domestic Product is shown on NIPA table 1.7.5 in the Survey of Current Business, Bureau of Economic Analysis.
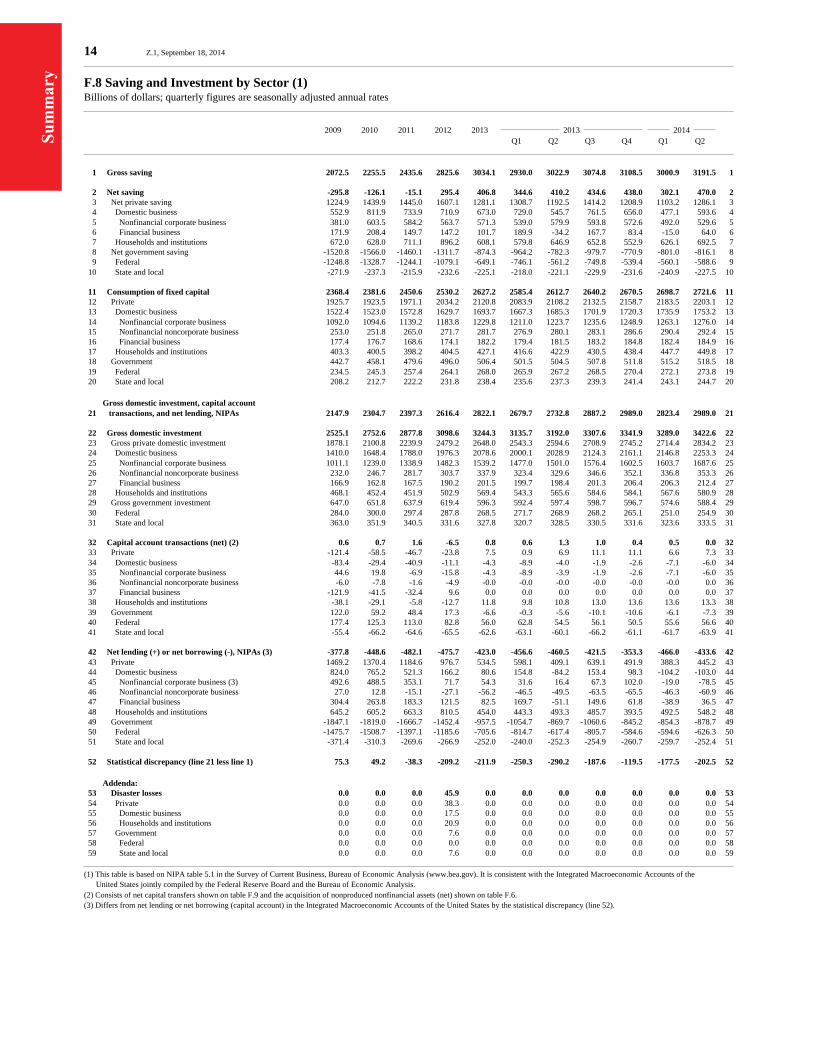
Su
mm
ary
14 Z.1, September 18, 2014
F.8 Saving and Investment by Sector (1)Billions of dollars; quarterly figures are seasonally adjusted annual rates
2009 2010 2011 2012 2013 2013 2014 Q1 Q2 Q3 Q4 Q1 Q2
1 Gross saving 2072.5 2255.5 2435.6 2825.6 3034.1 2930.0 3022.9 3074.8 3108.5 3000.9 3191.5 1
2 Net saving -295.8 -126.1 -15.1 295.4 406.8 344.6 410.2 434.6 438.0 302.1 470.0 2 3 Net private saving 1224.9 1439.9 1445.0 1607.1 1281.1 1308.7 1192.5 1414.2 1208.9 1103.2 1286.1 3 4 Domestic business 552.9 811.9 733.9 710.9 673.0 729.0 545.7 761.5 656.0 477.1 593.6 4 5 Nonfinancial corporate business 381.0 603.5 584.2 563.7 571.3 539.0 579.9 593.8 572.6 492.0 529.6 5 6 Financial business 171.9 208.4 149.7 147.2 101.7 189.9 -34.2 167.7 83.4 -15.0 64.0 6 7 Households and institutions 672.0 628.0 711.1 896.2 608.1 579.8 646.9 652.8 552.9 626.1 692.5 7 8 Net government saving -1520.8 -1566.0 -1460.1 -1311.7 -874.3 -964.2 -782.3 -979.7 -770.9 -801.0 -816.1 8 9 Federal -1248.8 -1328.7 -1244.1 -1079.1 -649.1 -746.1 -561.2 -749.8 -539.4 -560.1 -588.6 9 10 State and local -271.9 -237.3 -215.9 -232.6 -225.1 -218.0 -221.1 -229.9 -231.6 -240.9 -227.5 10
11 Consumption of fixed capital 2368.4 2381.6 2450.6 2530.2 2627.2 2585.4 2612.7 2640.2 2670.5 2698.7 2721.6 11 12 Private 1925.7 1923.5 1971.1 2034.2 2120.8 2083.9 2108.2 2132.5 2158.7 2183.5 2203.1 12 13 Domestic business 1522.4 1523.0 1572.8 1629.7 1693.7 1667.3 1685.3 1701.9 1720.3 1735.9 1753.2 13 14 Nonfinancial corporate business 1092.0 1094.6 1139.2 1183.8 1229.8 1211.0 1223.7 1235.6 1248.9 1263.1 1276.0 14 15 Nonfinancial noncorporate business 253.0 251.8 265.0 271.7 281.7 276.9 280.1 283.1 286.6 290.4 292.4 15 16 Financial business 177.4 176.7 168.6 174.1 182.2 179.4 181.5 183.2 184.8 182.4 184.9 16 17 Households and institutions 403.3 400.5 398.2 404.5 427.1 416.6 422.9 430.5 438.4 447.7 449.8 17 18 Government 442.7 458.1 479.6 496.0 506.4 501.5 504.5 507.8 511.8 515.2 518.5 18 19 Federal 234.5 245.3 257.4 264.1 268.0 265.9 267.2 268.5 270.4 272.1 273.8 19 20 State and local 208.2 212.7 222.2 231.8 238.4 235.6 237.3 239.3 241.4 243.1 244.7 20
Gross domestic investment, capital account 21 transactions, and net lending, NIPAs 2147.9 2304.7 2397.3 2616.4 2822.1 2679.7 2732.8 2887.2 2989.0 2823.4 2989.0 21
22 Gross domestic investment 2525.1 2752.6 2877.8 3098.6 3244.3 3135.7 3192.0 3307.6 3341.9 3289.0 3422.6 22 23 Gross private domestic investment 1878.1 2100.8 2239.9 2479.2 2648.0 2543.3 2594.6 2708.9 2745.2 2714.4 2834.2 23 24 Domestic business 1410.0 1648.4 1788.0 1976.3 2078.6 2000.1 2028.9 2124.3 2161.1 2146.8 2253.3 24 25 Nonfinancial corporate business 1011.1 1239.0 1338.9 1482.3 1539.2 1477.0 1501.0 1576.4 1602.5 1603.7 1687.6 25 26 Nonfinancial noncorporate business 232.0 246.7 281.7 303.7 337.9 323.4 329.6 346.6 352.1 336.8 353.3 26 27 Financial business 166.9 162.8 167.5 190.2 201.5 199.7 198.4 201.3 206.4 206.3 212.4 27 28 Households and institutions 468.1 452.4 451.9 502.9 569.4 543.3 565.6 584.6 584.1 567.6 580.9 28 29 Gross government investment 647.0 651.8 637.9 619.4 596.3 592.4 597.4 598.7 596.7 574.6 588.4 29 30 Federal 284.0 300.0 297.4 287.8 268.5 271.7 268.9 268.2 265.1 251.0 254.9 30 31 State and local 363.0 351.9 340.5 331.6 327.8 320.7 328.5 330.5 331.6 323.6 333.5 31
32 Capital account transactions (net) (2) 0.6 0.7 1.6 -6.5 0.8 0.6 1.3 1.0 0.4 0.5 0.0 32 33 Private -121.4 -58.5 -46.7 -23.8 7.5 0.9 6.9 11.1 11.1 6.6 7.3 33 34 Domestic business -83.4 -29.4 -40.9 -11.1 -4.3 -8.9 -4.0 -1.9 -2.6 -7.1 -6.0 34 35 Nonfinancial corporate business 44.6 19.8 -6.9 -15.8 -4.3 -8.9 -3.9 -1.9 -2.6 -7.1 -6.0 35 36 Nonfinancial noncorporate business -6.0 -7.8 -1.6 -4.9 -0.0 -0.0 -0.0 -0.0 -0.0 -0.0 0.0 36 37 Financial business -121.9 -41.5 -32.4 9.6 0.0 0.0 0.0 0.0 0.0 0.0 0.0 37 38 Households and institutions -38.1 -29.1 -5.8 -12.7 11.8 9.8 10.8 13.0 13.6 13.6 13.3 38 39 Government 122.0 59.2 48.4 17.3 -6.6 -0.3 -5.6 -10.1 -10.6 -6.1 -7.3 39 40 Federal 177.4 125.3 113.0 82.8 56.0 62.8 54.5 56.1 50.5 55.6 56.6 40 41 State and local -55.4 -66.2 -64.6 -65.5 -62.6 -63.1 -60.1 -66.2 -61.1 -61.7 -63.9 41
42 Net lending (+) or net borrowing (-), NIPAs (3) -377.8 -448.6 -482.1 -475.7 -423.0 -456.6 -460.5 -421.5 -353.3 -466.0 -433.6 42 43 Private 1469.2 1370.4 1184.6 976.7 534.5 598.1 409.1 639.1 491.9 388.3 445.2 43 44 Domestic business 824.0 765.2 521.3 166.2 80.6 154.8 -84.2 153.4 98.3 -104.2 -103.0 44 45 Nonfinancial corporate business (3) 492.6 488.5 353.1 71.7 54.3 31.6 16.4 67.3 102.0 -19.0 -78.5 45 46 Nonfinancial noncorporate business 27.0 12.8 -15.1 -27.1 -56.2 -46.5 -49.5 -63.5 -65.5 -46.3 -60.9 46 47 Financial business 304.4 263.8 183.3 121.5 82.5 169.7 -51.1 149.6 61.8 -38.9 36.5 47 48 Households and institutions 645.2 605.2 663.3 810.5 454.0 443.3 493.3 485.7 393.5 492.5 548.2 48 49 Government -1847.1 -1819.0 -1666.7 -1452.4 -957.5 -1054.7 -869.7 -1060.6 -845.2 -854.3 -878.7 49 50 Federal -1475.7 -1508.7 -1397.1 -1185.6 -705.6 -814.7 -617.4 -805.7 -584.6 -594.6 -626.3 50 51 State and local -371.4 -310.3 -269.6 -266.9 -252.0 -240.0 -252.3 -254.9 -260.7 -259.7 -252.4 51
52 Statistical discrepancy (line 21 less line 1) 75.3 49.2 -38.3 -209.2 -211.9 -250.3 -290.2 -187.6 -119.5 -177.5 -202.5 52
Addenda: 53 Disaster losses 0.0 0.0 0.0 45.9 0.0 0.0 0.0 0.0 0.0 0.0 0.0 53 54 Private 0.0 0.0 0.0 38.3 0.0 0.0 0.0 0.0 0.0 0.0 0.0 54 55 Domestic business 0.0 0.0 0.0 17.5 0.0 0.0 0.0 0.0 0.0 0.0 0.0 55 56 Households and institutions 0.0 0.0 0.0 20.9 0.0 0.0 0.0 0.0 0.0 0.0 0.0 56 57 Government 0.0 0.0 0.0 7.6 0.0 0.0 0.0 0.0 0.0 0.0 0.0 57 58 Federal 0.0 0.0 0.0 0.0 0.0 0.0 0.0 0.0 0.0 0.0 0.0 58 59 State and local 0.0 0.0 0.0 7.6 0.0 0.0 0.0 0.0 0.0 0.0 0.0 59
(1) This table is based on NIPA table 5.1 in the Survey of Current Business, Bureau of Economic Analysis (www.bea.gov). It is consistent with the Integrated Macroeconomic Accounts of the United States jointly compiled by the Federal Reserve Board and the Bureau of Economic Analysis.(2) Consists of net capital transfers shown on table F.9 and the acquisition of nonproduced nonfinancial assets (net) shown on table F.6.(3) Differs from net lending or net borrowing (capital account) in the Integrated Macroeconomic Accounts of the United States by the statistical discrepancy (line 52).
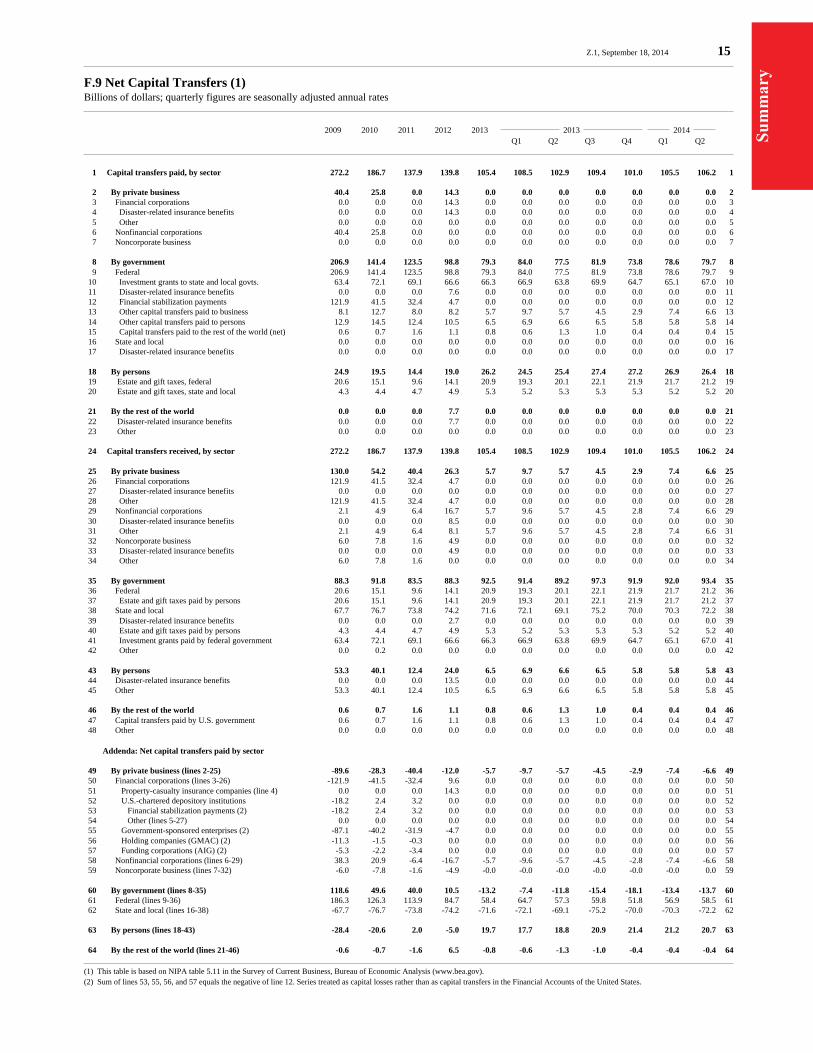
Su
mm
ary
Z.1, September 18, 2014 15
F.9 Net Capital Transfers (1)Billions of dollars; quarterly figures are seasonally adjusted annual rates
2009 2010 2011 2012 2013 2013 2014 Q1 Q2 Q3 Q4 Q1 Q2
1 Capital transfers paid, by sector 272.2 186.7 137.9 139.8 105.4 108.5 102.9 109.4 101.0 105.5 106.2 1
2 By private business 40.4 25.8 0.0 14.3 0.0 0.0 0.0 0.0 0.0 0.0 0.0 2 3 Financial corporations 0.0 0.0 0.0 14.3 0.0 0.0 0.0 0.0 0.0 0.0 0.0 3 4 Disaster-related insurance benefits 0.0 0.0 0.0 14.3 0.0 0.0 0.0 0.0 0.0 0.0 0.0 4 5 Other 0.0 0.0 0.0 0.0 0.0 0.0 0.0 0.0 0.0 0.0 0.0 5 6 Nonfinancial corporations 40.4 25.8 0.0 0.0 0.0 0.0 0.0 0.0 0.0 0.0 0.0 6 7 Noncorporate business 0.0 0.0 0.0 0.0 0.0 0.0 0.0 0.0 0.0 0.0 0.0 7
8 By government 206.9 141.4 123.5 98.8 79.3 84.0 77.5 81.9 73.8 78.6 79.7 8 9 Federal 206.9 141.4 123.5 98.8 79.3 84.0 77.5 81.9 73.8 78.6 79.7 9 10 Investment grants to state and local govts. 63.4 72.1 69.1 66.6 66.3 66.9 63.8 69.9 64.7 65.1 67.0 10 11 Disaster-related insurance benefits 0.0 0.0 0.0 7.6 0.0 0.0 0.0 0.0 0.0 0.0 0.0 11 12 Financial stabilization payments 121.9 41.5 32.4 4.7 0.0 0.0 0.0 0.0 0.0 0.0 0.0 12 13 Other capital transfers paid to business 8.1 12.7 8.0 8.2 5.7 9.7 5.7 4.5 2.9 7.4 6.6 13 14 Other capital transfers paid to persons 12.9 14.5 12.4 10.5 6.5 6.9 6.6 6.5 5.8 5.8 5.8 14 15 Capital transfers paid to the rest of the world (net) 0.6 0.7 1.6 1.1 0.8 0.6 1.3 1.0 0.4 0.4 0.4 15 16 State and local 0.0 0.0 0.0 0.0 0.0 0.0 0.0 0.0 0.0 0.0 0.0 16 17 Disaster-related insurance benefits 0.0 0.0 0.0 0.0 0.0 0.0 0.0 0.0 0.0 0.0 0.0 17
18 By persons 24.9 19.5 14.4 19.0 26.2 24.5 25.4 27.4 27.2 26.9 26.4 18 19 Estate and gift taxes, federal 20.6 15.1 9.6 14.1 20.9 19.3 20.1 22.1 21.9 21.7 21.2 19 20 Estate and gift taxes, state and local 4.3 4.4 4.7 4.9 5.3 5.2 5.3 5.3 5.3 5.2 5.2 20
21 By the rest of the world 0.0 0.0 0.0 7.7 0.0 0.0 0.0 0.0 0.0 0.0 0.0 21 22 Disaster-related insurance benefits 0.0 0.0 0.0 7.7 0.0 0.0 0.0 0.0 0.0 0.0 0.0 22 23 Other 0.0 0.0 0.0 0.0 0.0 0.0 0.0 0.0 0.0 0.0 0.0 23
24 Capital transfers received, by sector 272.2 186.7 137.9 139.8 105.4 108.5 102.9 109.4 101.0 105.5 106.2 24
25 By private business 130.0 54.2 40.4 26.3 5.7 9.7 5.7 4.5 2.9 7.4 6.6 25 26 Financial corporations 121.9 41.5 32.4 4.7 0.0 0.0 0.0 0.0 0.0 0.0 0.0 26 27 Disaster-related insurance benefits 0.0 0.0 0.0 0.0 0.0 0.0 0.0 0.0 0.0 0.0 0.0 27 28 Other 121.9 41.5 32.4 4.7 0.0 0.0 0.0 0.0 0.0 0.0 0.0 28 29 Nonfinancial corporations 2.1 4.9 6.4 16.7 5.7 9.6 5.7 4.5 2.8 7.4 6.6 29 30 Disaster-related insurance benefits 0.0 0.0 0.0 8.5 0.0 0.0 0.0 0.0 0.0 0.0 0.0 30 31 Other 2.1 4.9 6.4 8.1 5.7 9.6 5.7 4.5 2.8 7.4 6.6 31 32 Noncorporate business 6.0 7.8 1.6 4.9 0.0 0.0 0.0 0.0 0.0 0.0 0.0 32 33 Disaster-related insurance benefits 0.0 0.0 0.0 4.9 0.0 0.0 0.0 0.0 0.0 0.0 0.0 33 34 Other 6.0 7.8 1.6 0.0 0.0 0.0 0.0 0.0 0.0 0.0 0.0 34
35 By government 88.3 91.8 83.5 88.3 92.5 91.4 89.2 97.3 91.9 92.0 93.4 35 36 Federal 20.6 15.1 9.6 14.1 20.9 19.3 20.1 22.1 21.9 21.7 21.2 36 37 Estate and gift taxes paid by persons 20.6 15.1 9.6 14.1 20.9 19.3 20.1 22.1 21.9 21.7 21.2 37 38 State and local 67.7 76.7 73.8 74.2 71.6 72.1 69.1 75.2 70.0 70.3 72.2 38 39 Disaster-related insurance benefits 0.0 0.0 0.0 2.7 0.0 0.0 0.0 0.0 0.0 0.0 0.0 39 40 Estate and gift taxes paid by persons 4.3 4.4 4.7 4.9 5.3 5.2 5.3 5.3 5.3 5.2 5.2 40 41 Investment grants paid by federal government 63.4 72.1 69.1 66.6 66.3 66.9 63.8 69.9 64.7 65.1 67.0 41 42 Other 0.0 0.2 0.0 0.0 0.0 0.0 0.0 0.0 0.0 0.0 0.0 42
43 By persons 53.3 40.1 12.4 24.0 6.5 6.9 6.6 6.5 5.8 5.8 5.8 43 44 Disaster-related insurance benefits 0.0 0.0 0.0 13.5 0.0 0.0 0.0 0.0 0.0 0.0 0.0 44 45 Other 53.3 40.1 12.4 10.5 6.5 6.9 6.6 6.5 5.8 5.8 5.8 45
46 By the rest of the world 0.6 0.7 1.6 1.1 0.8 0.6 1.3 1.0 0.4 0.4 0.4 46 47 Capital transfers paid by U.S. government 0.6 0.7 1.6 1.1 0.8 0.6 1.3 1.0 0.4 0.4 0.4 47 48 Other 0.0 0.0 0.0 0.0 0.0 0.0 0.0 0.0 0.0 0.0 0.0 48
Addenda: Net capital transfers paid by sector
49 By private business (lines 2-25) -89.6 -28.3 -40.4 -12.0 -5.7 -9.7 -5.7 -4.5 -2.9 -7.4 -6.6 49 50 Financial corporations (lines 3-26) -121.9 -41.5 -32.4 9.6 0.0 0.0 0.0 0.0 0.0 0.0 0.0 50 51 Property-casualty insurance companies (line 4) 0.0 0.0 0.0 14.3 0.0 0.0 0.0 0.0 0.0 0.0 0.0 51 52 U.S.-chartered depository institutions -18.2 2.4 3.2 0.0 0.0 0.0 0.0 0.0 0.0 0.0 0.0 52 53 Financial stabilization payments (2) -18.2 2.4 3.2 0.0 0.0 0.0 0.0 0.0 0.0 0.0 0.0 53 54 Other (lines 5-27) 0.0 0.0 0.0 0.0 0.0 0.0 0.0 0.0 0.0 0.0 0.0 54 55 Government-sponsored enterprises (2) -87.1 -40.2 -31.9 -4.7 0.0 0.0 0.0 0.0 0.0 0.0 0.0 55 56 Holding companies (GMAC) (2) -11.3 -1.5 -0.3 0.0 0.0 0.0 0.0 0.0 0.0 0.0 0.0 56 57 Funding corporations (AIG) (2) -5.3 -2.2 -3.4 0.0 0.0 0.0 0.0 0.0 0.0 0.0 0.0 57 58 Nonfinancial corporations (lines 6-29) 38.3 20.9 -6.4 -16.7 -5.7 -9.6 -5.7 -4.5 -2.8 -7.4 -6.6 58 59 Noncorporate business (lines 7-32) -6.0 -7.8 -1.6 -4.9 -0.0 -0.0 -0.0 -0.0 -0.0 -0.0 0.0 59
60 By government (lines 8-35) 118.6 49.6 40.0 10.5 -13.2 -7.4 -11.8 -15.4 -18.1 -13.4 -13.7 60 61 Federal (lines 9-36) 186.3 126.3 113.9 84.7 58.4 64.7 57.3 59.8 51.8 56.9 58.5 61 62 State and local (lines 16-38) -67.7 -76.7 -73.8 -74.2 -71.6 -72.1 -69.1 -75.2 -70.0 -70.3 -72.2 62
63 By persons (lines 18-43) -28.4 -20.6 2.0 -5.0 19.7 17.7 18.8 20.9 21.4 21.2 20.7 63
64 By the rest of the world (lines 21-46) -0.6 -0.7 -1.6 6.5 -0.8 -0.6 -1.3 -1.0 -0.4 -0.4 -0.4 64
(1) This table is based on NIPA table 5.11 in the Survey of Current Business, Bureau of Economic Analysis (www.bea.gov).(2) Sum of lines 53, 55, 56, and 57 equals the negative of line 12. Series treated as capital losses rather than as capital transfers in the Financial Accounts of the United States.

Su
mm
ary
16 Z.1, September 18, 2014
F.10 Derivation of Measures of Personal Saving (1)Billions of dollars; quarterly figures are seasonally adjusted annual rates
2009 2010 2011 2012 2013 2013 2014 Q1 Q2 Q3 Q4 Q1 Q2
1 Net acquisition of financial assets 666.7 781.8 1132.2 1266.9 1069.6 1137.2 998.5 559.5 1583.4 1204.5 1934.5 1
2 Foreign deposits -7.2 4.5 -9.9 -7.7 2.8 13.0 13.2 1.9 -16.9 -3.9 -6.9 2 3 Checkable deposits and currency 115.8 36.2 326.1 175.5 132.2 221.1 59.8 -52.4 300.3 327.6 444.4 3 4 Time and savings deposits 101.1 165.8 375.3 418.5 214.0 114.5 196.5 296.3 248.6 633.4 182.7 4 5 Money market fund shares -269.0 -179.9 -14.4 10.0 23.0 33.2 102.9 71.2 -115.4 135.7 -28.5 5
6 Securities 435.8 -3.7 -193.9 129.4 56.6 361.5 -108.6 -347.3 321.1 -728.1 597.8 6 7 Open market paper 16.7 -1.5 -1.8 -0.6 -3.8 -3.2 -0.8 -0.8 -10.4 -2.9 -11.0 7 8 Treasury securities 533.1 320.4 -229.3 211.7 -188.1 -254.4 -102.6 -104.2 -291.1 -322.4 -287.2 8 9 Agency- and GSE-backed securities -670.9 -10.0 -11.3 -136.7 -94.7 -290.6 -46.7 -82.0 40.5 -435.1 -41.9 9 10 Municipal securities 107.3 44.2 -65.5 -144.8 -43.2 -6.4 -28.6 -66.9 -71.0 -78.2 -39.3 10 11 Corporate and foreign bonds 98.1 -419.5 88.8 -166.2 -197.8 -359.7 -489.7 -115.1 173.3 -150.6 116.7 11 12 Corporate equities (2) -19.0 -221.0 -308.7 -241.3 -59.3 298.8 47.7 -648.9 65.3 -405.1 228.8 12 13 Mutual fund shares 376.2 281.8 333.4 606.7 642.5 976.6 510.8 669.4 413.1 665.2 629.5 13
14 Life insurance reserves 24.6 6.2 73.5 -26.6 19.2 2.0 22.9 35.9 16.0 54.2 5.9 14 15 Pension entitlements 397.6 595.8 499.2 497.9 494.9 447.9 441.4 499.2 591.3 514.8 570.3 15
16 Miscellaneous and other assets -126.4 167.4 80.3 78.7 133.4 -48.6 278.1 62.2 241.9 276.2 173.9 16
17 Gross investment in nonfinancial assets 1657.2 1694.0 1783.0 1918.0 2078.4 2022.4 2062.6 2108.0 2120.5 2098.0 2163.7 17 18 Residential fixed investment 386.9 376.5 381.3 436.9 513.3 482.8 510.3 531.0 529.0 514.5 526.4 18 19 Nonresidential fixed investment 326.0 317.4 345.4 366.6 376.7 367.5 371.7 378.2 389.3 392.7 401.2 19 20 Consumer durables 970.8 1005.0 1057.2 1119.1 1178.9 1168.1 1175.2 1181.9 1190.5 1191.2 1226.0 20 21 Nonproduced nonfinancial assets -9.7 -8.5 -7.8 -7.7 -7.9 -7.9 -8.0 -7.9 -7.8 -7.6 -7.4 21 22 Inventories -16.8 3.6 6.8 3.0 17.4 11.9 13.2 24.8 19.5 7.2 17.5 22
23 Consumption of fixed capital 1590.1 1584.9 1605.6 1641.2 1697.8 1670.6 1689.3 1707.2 1724.0 1707.5 1716.7 23 24 Residential fixed investment 377.9 372.0 369.9 372.3 393.9 387.0 391.5 396.0 400.9 405.5 409.1 24 25 Nonresidential fixed investment 291.7 294.7 297.4 308.1 319.3 310.8 315.7 322.0 328.6 337.4 338.0 25 26 Consumer durables 920.6 918.1 938.2 960.7 984.6 972.8 982.1 989.1 994.5 964.6 969.5 26
27 Net investment in nonfinancial assets (3) 67.0 109.2 177.4 276.9 380.6 351.8 373.2 400.9 396.5 390.5 447.0 27
28 Residential fixed investment 9.0 4.5 11.5 64.6 119.4 95.8 118.8 135.0 128.1 109.0 117.2 28 29 Nonresidential fixed investment 34.3 22.7 48.0 58.5 57.4 56.7 56.0 56.2 60.7 55.3 63.2 29 30 Consumer durables 50.3 86.9 119.0 158.4 194.3 195.3 193.2 192.7 195.9 226.6 256.4 30 31 Nonproduced nonfinancial assets -9.7 -8.5 -7.8 -7.7 -7.9 -7.9 -8.0 -7.9 -7.8 -7.6 -7.4 31 32 Inventories -16.8 3.6 6.8 3.0 17.4 11.9 13.2 24.8 19.5 7.2 17.5 32
33 Net increase in liabilities 22.1 -144.8 21.3 384.6 373.9 139.1 357.8 623.1 375.4 351.3 994.0 33
34 Home mortgages 36.2 -153.6 -83.1 -70.8 3.7 -82.1 14.4 117.1 -34.8 -57.6 45.7 34 35 Other mortgages 44.0 -31.4 -5.6 2.4 66.6 -24.6 89.4 96.7 104.9 57.8 106.6 35 36 Consumer credit -103.6 -25.3 108.5 169.7 174.3 179.0 162.9 190.6 164.8 200.7 254.3 36 37 Policy loans 0.7 3.4 2.4 1.4 0.9 -0.0 2.7 1.6 -0.6 -0.2 1.2 37 38 Security credit 38.1 75.2 -39.3 64.9 35.4 16.4 -21.2 44.6 101.9 -74.3 222.4 38 39 Other liabilities 6.7 -12.9 38.4 217.1 92.9 50.4 109.7 172.6 39.2 224.9 363.8 39
40 Net capital transfers paid (4) -34.4 -28.4 0.4 -10.0 19.7 17.6 18.8 20.9 21.4 21.2 20.7 40
41 Personal saving, FOF concept (FOF) 677.2 1007.4 1288.8 1149.1 1096.1 1367.5 1032.7 358.1 1625.9 1264.9 1408.2 41
42 - Net investment in consumer durables 50.3 86.9 119.0 158.4 194.3 195.3 193.2 192.7 195.9 226.6 256.4 42 43 - Government insurance and pension fund reserves (5) 0.5 -1.7 -0.4 -1.4 -1.2 -1.7 -0.5 -2.7 0.0 -1.8 0.0 43
44 = Personal saving, NIPA concept (FOF) (6) 626.5 922.3 1170.2 992.2 903.0 1174.0 840.0 168.1 1429.9 1040.1 1151.7 44
45 Personal saving, NIPA concept (NIPA) 672.0 628.0 711.1 896.2 608.1 579.8 646.9 652.8 552.9 626.1 692.5 45
46 Difference -45.5 294.2 459.1 96.0 294.9 594.2 193.2 -484.7 877.0 414.0 459.2 46
Memo: 47 Disposable personal income 10942.5 11237.9 11801.4 12384.0 12505.1 12340.4 12470.7 12585.8 12623.7 12772.9 12979.5 47
Personal saving as a percentage of disposable personal income: 48 FOF concept (FOF data) (line 41) 6.2 9.0 10.9 9.3 8.8 11.1 8.3 2.8 12.9 9.9 10.8 48 49 NIPA concept (FOF data) (line 44) 5.7 8.2 9.9 8.0 7.2 9.5 6.7 1.3 11.3 8.1 8.9 49 50 NIPA concept (NIPA data) (line 45) 6.1 5.6 6.0 7.2 4.9 4.7 5.2 5.2 4.4 4.9 5.3 50 51 Difference (line 46) -0.4 2.6 3.9 0.8 2.4 4.8 1.5 -3.9 6.9 3.2 3.5 51
(1) Consolidated statement for households and nonprofit organizations and nonfinancial noncorporate business.(2) Directly held and those in closed-end and exchange-traded funds. Other equities are included in mutual fund shares (line 13), life insurance reserves (line 14), and pension entitlements (line 15).(3) Line 17 less line 23.(4) Table F.9, line 59 plus line 63.(5) Railroad Retirement Board, the National Railroad Retirement Investment Trust, and federal government life insurance reserves.(6) Line 44 and 45 are conceptually equivalent but measure saving using different data. Line 44 is net acquisition of financial assets net of government insurance and pension fund reserves (line 1 less line 43) plus net investment in nonfinancial assets net of consumer durables (line 27 less line 42) less net increase in liabilities (line 33) plus net capital transfers paid (line 40). Personal savings, NIPA concept (NIPA) (line 45) is disposable personal income (line 47) less personal outlays (table F.100, line 4).

Su
mm
ary
Z.1, September 18, 2014 17
L.10 Assets and Liabilities of the Personal Sector (1)Billions of dollars; amounts outstanding end of period, not seasonally adjusted
2009 2010 2011 2012 2013 2013 2014 Q1 Q2 Q3 Q4 Q1 Q2
1 Total financial assets 45943.3 49751.7 50263.4 53871.7 59814.4 55677.6 56250.8 57826.3 59814.4 60542.7 61796.1 1
2 Foreign deposits 62.7 67.3 57.4 49.7 52.5 52.9 56.2 56.7 52.5 51.5 49.8 2 3 Checkable deposits and currency 930.5 955.4 1281.5 1443.3 1575.5 1467.1 1449.4 1436.9 1575.5 1625.8 1699.5 3 4 Time and savings deposits 6679.3 6807.1 7182.3 7555.8 7770.5 7613.2 7623.3 7709.0 7770.5 7955.9 7967.5 4 5 Money market fund shares 1386.9 1206.9 1192.5 1202.6 1225.6 1148.5 1141.7 1189.1 1225.6 1195.0 1153.7 5
6 Securities 16011.9 18082.3 17367.1 19380.0 23343.9 20686.1 21041.7 22107.8 23343.9 23585.7 24427.2 6
7 Open market paper 22.7 21.1 19.4 18.8 15.0 18.0 17.8 17.6 15.0 14.3 11.5 7 8 Treasury securities 854.0 1126.6 707.0 929.3 949.0 955.5 1004.2 977.7 949.0 899.6 837.4 8 9 Agency- and GSE-backed securities 357.4 335.4 300.2 152.7 97.7 95.9 106.3 94.8 97.7 1.2 3.7 9
10 Municipal securities 1833.0 1877.1 1811.6 1666.8 1623.6 1674.8 1670.6 1646.0 1623.6 1614.6 1608.4 10 11 Corporate and foreign bonds 1539.2 1353.1 1343.0 1233.9 1004.6 1106.0 974.7 966.6 1004.6 947.6 920.2 11
12 Corporate equities (2) 7255.5 8679.9 8475.6 9623.9 12451.3 10590.4 10868.7 11595.5 12451.3 12622.1 13306.7 12 13 Mutual fund shares 4104.0 4641.1 4661.8 5705.4 7152.4 6196.2 6349.8 6759.6 7152.4 7435.8 7688.3 13
14 Life insurance reserves 1109.2 1137.2 1199.0 1186.1 1232.8 1194.8 1201.6 1218.3 1232.8 1248.1 1254.6 14 15 Pension entitlements 15455.1 17031.7 17444.7 18457.8 19886.1 18930.7 19085.2 19440.8 19886.1 20085.5 20406.1 15 16 Life insurance companies 2148.2 2343.2 2384.6 2576.6 2816.9 2673.1 2683.5 2743.0 2816.9 2845.8 2894.3 16 17 Private pension funds 6002.2 6650.1 6753.3 7278.0 8141.8 7575.3 7675.0 7884.8 8141.8 8228.5 8399.5 17 18 Governments 7304.7 8038.4 8306.8 8603.2 8927.4 8682.2 8726.7 8813.0 8927.4 9011.2 9112.2 18
19 Miscellaneous and other assets 4218.9 4385.5 4464.5 4530.7 4668.3 4520.6 4589.8 4607.9 4668.3 4737.4 4781.2 19
20 Total liabilities 19793.1 19457.0 19329.1 19503.2 19784.3 19455.6 19518.9 19679.3 19784.3 19798.4 20033.0 20
21 Home mortgages 10917.5 10431.8 10193.3 9973.9 9884.6 9923.0 9899.4 9911.8 9884.6 9849.9 9844.5 21 22 Other mortgages 2574.3 2542.8 2537.2 2539.7 2606.3 2533.5 2555.9 2580.0 2606.3 2620.7 2647.4 22 23 Consumer credit 2552.8 2647.4 2755.9 2923.6 3097.9 2923.8 2966.4 3036.6 3097.9 3103.5 3169.0 23
24 Policy loans 121.1 124.5 126.9 128.3 129.2 128.3 128.9 129.3 129.2 129.1 129.4 24 25 Security credit 203.0 278.2 238.9 303.7 339.2 307.9 302.6 313.7 339.2 320.6 376.2 25 26 Other liabilities 3424.4 3432.3 3476.8 3634.1 3727.2 3639.2 3665.7 3707.9 3727.2 3774.5 3866.5 26
(1) Combined statement for households and nonprofit organizations and nonfinancial noncorporate business.(2) Directly held and those in closed-end and exchange-traded funds. Other equities are included in mutual fund shares (line 13), life insurance reserves (line 14), and pension entitlements (line 15).
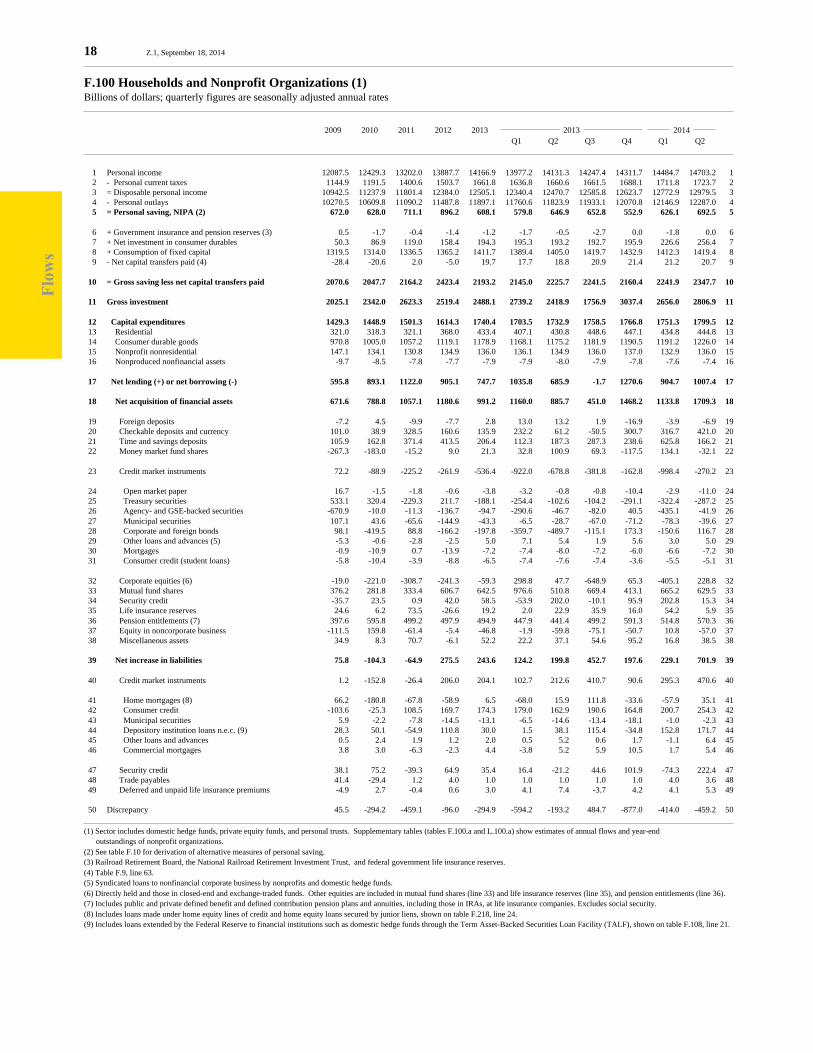
Flo
ws
18 Z.1, September 18, 2014
F.100 Households and Nonprofit Organizations (1)Billions of dollars; quarterly figures are seasonally adjusted annual rates
2009 2010 2011 2012 2013 2013 2014 Q1 Q2 Q3 Q4 Q1 Q2
1 Personal income 12087.5 12429.3 13202.0 13887.7 14166.9 13977.2 14131.3 14247.4 14311.7 14484.7 14703.2 1 2 - Personal current taxes 1144.9 1191.5 1400.6 1503.7 1661.8 1636.8 1660.6 1661.5 1688.1 1711.8 1723.7 2 3 = Disposable personal income 10942.5 11237.9 11801.4 12384.0 12505.1 12340.4 12470.7 12585.8 12623.7 12772.9 12979.5 3 4 - Personal outlays 10270.5 10609.8 11090.2 11487.8 11897.1 11760.6 11823.9 11933.1 12070.8 12146.9 12287.0 4 5 = Personal saving, NIPA (2) 672.0 628.0 711.1 896.2 608.1 579.8 646.9 652.8 552.9 626.1 692.5 5
6 + Government insurance and pension reserves (3) 0.5 -1.7 -0.4 -1.4 -1.2 -1.7 -0.5 -2.7 0.0 -1.8 0.0 6 7 + Net investment in consumer durables 50.3 86.9 119.0 158.4 194.3 195.3 193.2 192.7 195.9 226.6 256.4 7 8 + Consumption of fixed capital 1319.5 1314.0 1336.5 1365.2 1411.7 1389.4 1405.0 1419.7 1432.9 1412.3 1419.4 8 9 - Net capital transfers paid (4) -28.4 -20.6 2.0 -5.0 19.7 17.7 18.8 20.9 21.4 21.2 20.7 9
10 = Gross saving less net capital transfers paid 2070.6 2047.7 2164.2 2423.4 2193.2 2145.0 2225.7 2241.5 2160.4 2241.9 2347.7 10
11 Gross investment 2025.1 2342.0 2623.3 2519.4 2488.1 2739.2 2418.9 1756.9 3037.4 2656.0 2806.9 11
12 Capital expenditures 1429.3 1448.9 1501.3 1614.3 1740.4 1703.5 1732.9 1758.5 1766.8 1751.3 1799.5 12 13 Residential 321.0 318.3 321.1 368.0 433.4 407.1 430.8 448.6 447.1 434.8 444.8 13 14 Consumer durable goods 970.8 1005.0 1057.2 1119.1 1178.9 1168.1 1175.2 1181.9 1190.5 1191.2 1226.0 14 15 Nonprofit nonresidential 147.1 134.1 130.8 134.9 136.0 136.1 134.9 136.0 137.0 132.9 136.0 15 16 Nonproduced nonfinancial assets -9.7 -8.5 -7.8 -7.7 -7.9 -7.9 -8.0 -7.9 -7.8 -7.6 -7.4 16
17 Net lending (+) or net borrowing (-) 595.8 893.1 1122.0 905.1 747.7 1035.8 685.9 -1.7 1270.6 904.7 1007.4 17
18 Net acquisition of financial assets 671.6 788.8 1057.1 1180.6 991.2 1160.0 885.7 451.0 1468.2 1133.8 1709.3 18
19 Foreign deposits -7.2 4.5 -9.9 -7.7 2.8 13.0 13.2 1.9 -16.9 -3.9 -6.9 19 20 Checkable deposits and currency 101.0 38.9 328.5 160.6 135.9 232.2 61.2 -50.5 300.7 316.7 421.0 20 21 Time and savings deposits 105.9 162.8 371.4 413.5 206.4 112.3 187.3 287.3 238.6 625.8 166.2 21 22 Money market fund shares -267.3 -183.0 -15.2 9.0 21.3 32.8 100.9 69.3 -117.5 134.1 -32.1 22
23 Credit market instruments 72.2 -88.9 -225.2 -261.9 -536.4 -922.0 -678.8 -381.8 -162.8 -998.4 -270.2 23
24 Open market paper 16.7 -1.5 -1.8 -0.6 -3.8 -3.2 -0.8 -0.8 -10.4 -2.9 -11.0 24 25 Treasury securities 533.1 320.4 -229.3 211.7 -188.1 -254.4 -102.6 -104.2 -291.1 -322.4 -287.2 25 26 Agency- and GSE-backed securities -670.9 -10.0 -11.3 -136.7 -94.7 -290.6 -46.7 -82.0 40.5 -435.1 -41.9 26 27 Municipal securities 107.1 43.6 -65.6 -144.9 -43.3 -6.5 -28.7 -67.0 -71.2 -78.3 -39.6 27 28 Corporate and foreign bonds 98.1 -419.5 88.8 -166.2 -197.8 -359.7 -489.7 -115.1 173.3 -150.6 116.7 28 29 Other loans and advances (5) -5.3 -0.6 -2.8 -2.5 5.0 7.1 5.4 1.9 5.6 3.0 5.0 29 30 Mortgages -0.9 -10.9 0.7 -13.9 -7.2 -7.4 -8.0 -7.2 -6.0 -6.6 -7.2 30 31 Consumer credit (student loans) -5.8 -10.4 -3.9 -8.8 -6.5 -7.4 -7.6 -7.4 -3.6 -5.5 -5.1 31
32 Corporate equities (6) -19.0 -221.0 -308.7 -241.3 -59.3 298.8 47.7 -648.9 65.3 -405.1 228.8 32 33 Mutual fund shares 376.2 281.8 333.4 606.7 642.5 976.6 510.8 669.4 413.1 665.2 629.5 33 34 Security credit -35.7 23.5 0.9 42.0 58.5 -53.9 202.0 -10.1 95.9 202.8 15.3 34 35 Life insurance reserves 24.6 6.2 73.5 -26.6 19.2 2.0 22.9 35.9 16.0 54.2 5.9 35 36 Pension entitlements (7) 397.6 595.8 499.2 497.9 494.9 447.9 441.4 499.2 591.3 514.8 570.3 36 37 Equity in noncorporate business -111.5 159.8 -61.4 -5.4 -46.8 -1.9 -59.8 -75.1 -50.7 10.8 -57.0 37 38 Miscellaneous assets 34.9 8.3 70.7 -6.1 52.2 22.2 37.1 54.6 95.2 16.8 38.5 38
39 Net increase in liabilities 75.8 -104.3 -64.9 275.5 243.6 124.2 199.8 452.7 197.6 229.1 701.9 39
40 Credit market instruments 1.2 -152.8 -26.4 206.0 204.1 102.7 212.6 410.7 90.6 295.3 470.6 40
41 Home mortgages (8) 66.2 -180.8 -67.8 -58.9 6.5 -68.0 15.9 111.8 -33.6 -57.9 35.1 41 42 Consumer credit -103.6 -25.3 108.5 169.7 174.3 179.0 162.9 190.6 164.8 200.7 254.3 42 43 Municipal securities 5.9 -2.2 -7.8 -14.5 -13.1 -6.5 -14.6 -13.4 -18.1 -1.0 -2.3 43 44 Depository institution loans n.e.c. (9) 28.3 50.1 -54.9 110.8 30.0 1.5 38.1 115.4 -34.8 152.8 171.7 44 45 Other loans and advances 0.5 2.4 1.9 1.2 2.0 0.5 5.2 0.6 1.7 -1.1 6.4 45 46 Commercial mortgages 3.8 3.0 -6.3 -2.3 4.4 -3.8 5.2 5.9 10.5 1.7 5.4 46
47 Security credit 38.1 75.2 -39.3 64.9 35.4 16.4 -21.2 44.6 101.9 -74.3 222.4 47 48 Trade payables 41.4 -29.4 1.2 4.0 1.0 1.0 1.0 1.0 1.0 4.0 3.6 48 49 Deferred and unpaid life insurance premiums -4.9 2.7 -0.4 0.6 3.0 4.1 7.4 -3.7 4.2 4.1 5.3 49
50 Discrepancy 45.5 -294.2 -459.1 -96.0 -294.9 -594.2 -193.2 484.7 -877.0 -414.0 -459.2 50
(1) Sector includes domestic hedge funds, private equity funds, and personal trusts. Supplementary tables (tables F.100.a and L.100.a) show estimates of annual flows and year-end outstandings of nonprofit organizations.(2) See table F.10 for derivation of alternative measures of personal saving.(3) Railroad Retirement Board, the National Railroad Retirement Investment Trust, and federal government life insurance reserves.(4) Table F.9, line 63.(5) Syndicated loans to nonfinancial corporate business by nonprofits and domestic hedge funds.(6) Directly held and those in closed-end and exchange-traded funds. Other equities are included in mutual fund shares (line 33) and life insurance reserves (line 35), and pension entitlements (line 36).(7) Includes public and private defined benefit and defined contribution pension plans and annuities, including those in IRAs, at life insurance companies. Excludes social security.(8) Includes loans made under home equity lines of credit and home equity loans secured by junior liens, shown on table F.218, line 24.(9) Includes loans extended by the Federal Reserve to financial institutions such as domestic hedge funds through the Term Asset-Backed Securities Loan Facility (TALF), shown on table F.108, line 21.
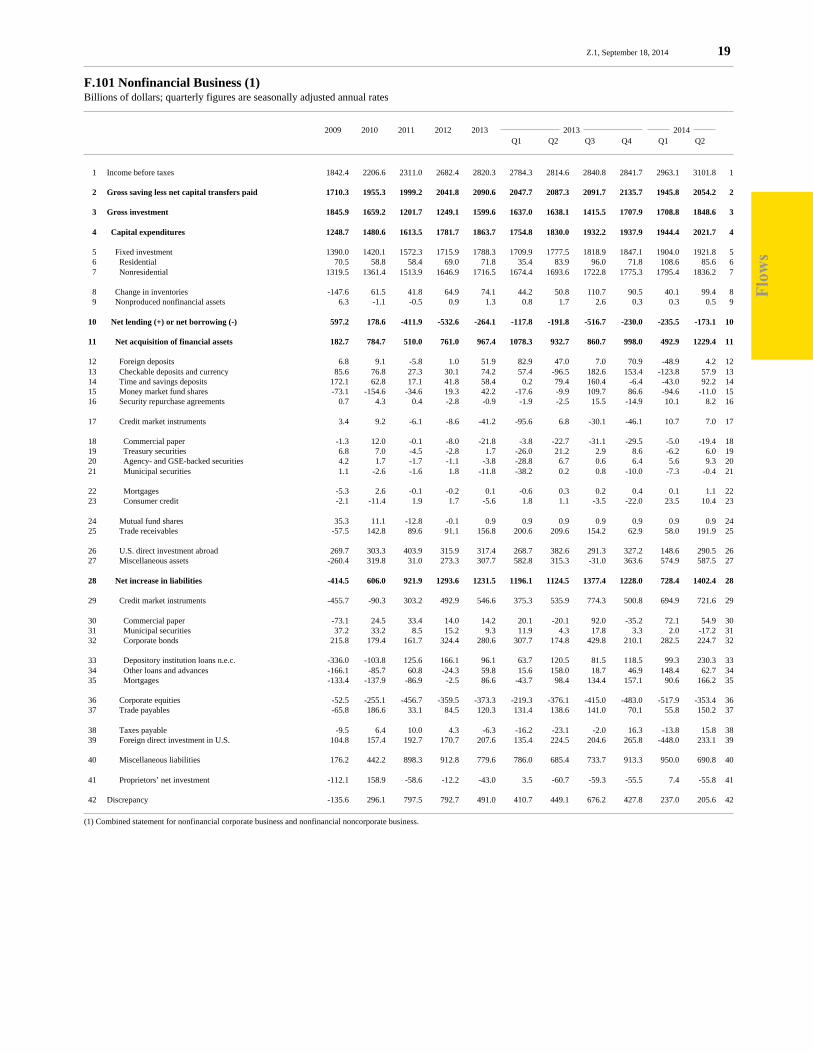
Flo
ws
Z.1, September 18, 2014 19
F.101 Nonfinancial Business (1)Billions of dollars; quarterly figures are seasonally adjusted annual rates
2009 2010 2011 2012 2013 2013 2014 Q1 Q2 Q3 Q4 Q1 Q2
1 Income before taxes 1842.4 2206.6 2311.0 2682.4 2820.3 2784.3 2814.6 2840.8 2841.7 2963.1 3101.8 1
2 Gross saving less net capital transfers paid 1710.3 1955.3 1999.2 2041.8 2090.6 2047.7 2087.3 2091.7 2135.7 1945.8 2054.2 2
3 Gross investment 1845.9 1659.2 1201.7 1249.1 1599.6 1637.0 1638.1 1415.5 1707.9 1708.8 1848.6 3
4 Capital expenditures 1248.7 1480.6 1613.5 1781.7 1863.7 1754.8 1830.0 1932.2 1937.9 1944.4 2021.7 4
5 Fixed investment 1390.0 1420.1 1572.3 1715.9 1788.3 1709.9 1777.5 1818.9 1847.1 1904.0 1921.8 5 6 Residential 70.5 58.8 58.4 69.0 71.8 35.4 83.9 96.0 71.8 108.6 85.6 6 7 Nonresidential 1319.5 1361.4 1513.9 1646.9 1716.5 1674.4 1693.6 1722.8 1775.3 1795.4 1836.2 7
8 Change in inventories -147.6 61.5 41.8 64.9 74.1 44.2 50.8 110.7 90.5 40.1 99.4 8 9 Nonproduced nonfinancial assets 6.3 -1.1 -0.5 0.9 1.3 0.8 1.7 2.6 0.3 0.3 0.5 9
10 Net lending (+) or net borrowing (-) 597.2 178.6 -411.9 -532.6 -264.1 -117.8 -191.8 -516.7 -230.0 -235.5 -173.1 10
11 Net acquisition of financial assets 182.7 784.7 510.0 761.0 967.4 1078.3 932.7 860.7 998.0 492.9 1229.4 11
12 Foreign deposits 6.8 9.1 -5.8 1.0 51.9 82.9 47.0 7.0 70.9 -48.9 4.2 12 13 Checkable deposits and currency 85.6 76.8 27.3 30.1 74.2 57.4 -96.5 182.6 153.4 -123.8 57.9 13 14 Time and savings deposits 172.1 62.8 17.1 41.8 58.4 0.2 79.4 160.4 -6.4 -43.0 92.2 14 15 Money market fund shares -73.1 -154.6 -34.6 19.3 42.2 -17.6 -9.9 109.7 86.6 -94.6 -11.0 15 16 Security repurchase agreements 0.7 4.3 0.4 -2.8 -0.9 -1.9 -2.5 15.5 -14.9 10.1 8.2 16
17 Credit market instruments 3.4 9.2 -6.1 -8.6 -41.2 -95.6 6.8 -30.1 -46.1 10.7 7.0 17
18 Commercial paper -1.3 12.0 -0.1 -8.0 -21.8 -3.8 -22.7 -31.1 -29.5 -5.0 -19.4 18 19 Treasury securities 6.8 7.0 -4.5 -2.8 1.7 -26.0 21.2 2.9 8.6 -6.2 6.0 19 20 Agency- and GSE-backed securities 4.2 1.7 -1.7 -1.1 -3.8 -28.8 6.7 0.6 6.4 5.6 9.3 20 21 Municipal securities 1.1 -2.6 -1.6 1.8 -11.8 -38.2 0.2 0.8 -10.0 -7.3 -0.4 21
22 Mortgages -5.3 2.6 -0.1 -0.2 0.1 -0.6 0.3 0.2 0.4 0.1 1.1 22 23 Consumer credit -2.1 -11.4 1.9 1.7 -5.6 1.8 1.1 -3.5 -22.0 23.5 10.4 23
24 Mutual fund shares 35.3 11.1 -12.8 -0.1 0.9 0.9 0.9 0.9 0.9 0.9 0.9 24 25 Trade receivables -57.5 142.8 89.6 91.1 156.8 200.6 209.6 154.2 62.9 58.0 191.9 25
26 U.S. direct investment abroad 269.7 303.3 403.9 315.9 317.4 268.7 382.6 291.3 327.2 148.6 290.5 26 27 Miscellaneous assets -260.4 319.8 31.0 273.3 307.7 582.8 315.3 -31.0 363.6 574.9 587.5 27
28 Net increase in liabilities -414.5 606.0 921.9 1293.6 1231.5 1196.1 1124.5 1377.4 1228.0 728.4 1402.4 28
29 Credit market instruments -455.7 -90.3 303.2 492.9 546.6 375.3 535.9 774.3 500.8 694.9 721.6 29
30 Commercial paper -73.1 24.5 33.4 14.0 14.2 20.1 -20.1 92.0 -35.2 72.1 54.9 30 31 Municipal securities 37.2 33.2 8.5 15.2 9.3 11.9 4.3 17.8 3.3 2.0 -17.2 31 32 Corporate bonds 215.8 179.4 161.7 324.4 280.6 307.7 174.8 429.8 210.1 282.5 224.7 32
33 Depository institution loans n.e.c. -336.0 -103.8 125.6 166.1 96.1 63.7 120.5 81.5 118.5 99.3 230.3 33 34 Other loans and advances -166.1 -85.7 60.8 -24.3 59.8 15.6 158.0 18.7 46.9 148.4 62.7 34 35 Mortgages -133.4 -137.9 -86.9 -2.5 86.6 -43.7 98.4 134.4 157.1 90.6 166.2 35
36 Corporate equities -52.5 -255.1 -456.7 -359.5 -373.3 -219.3 -376.1 -415.0 -483.0 -517.9 -353.4 36 37 Trade payables -65.8 186.6 33.1 84.5 120.3 131.4 138.6 141.0 70.1 55.8 150.2 37
38 Taxes payable -9.5 6.4 10.0 4.3 -6.3 -16.2 -23.1 -2.0 16.3 -13.8 15.8 38 39 Foreign direct investment in U.S. 104.8 157.4 192.7 170.7 207.6 135.4 224.5 204.6 265.8 -448.0 233.1 39
40 Miscellaneous liabilities 176.2 442.2 898.3 912.8 779.6 786.0 685.4 733.7 913.3 950.0 690.8 40
41 Proprietors’ net investment -112.1 158.9 -58.6 -12.2 -43.0 3.5 -60.7 -59.3 -55.5 7.4 -55.8 41
42 Discrepancy -135.6 296.1 797.5 792.7 491.0 410.7 449.1 676.2 427.8 237.0 205.6 42
(1) Combined statement for nonfinancial corporate business and nonfinancial noncorporate business.

Flo
ws
20 Z.1, September 18, 2014
F.102 Nonfinancial Corporate BusinessBillions of dollars; quarterly figures are seasonally adjusted annual rates
2009 2010 2011 2012 2013 2013 2014 Q1 Q2 Q3 Q4 Q1 Q2
1 Profits before tax (book) 752.5 1039.2 1008.9 1245.4 1298.8 1278.0 1301.2 1307.3 1308.7 1418.8 1527.5 1 2 - Taxes on corporate income 177.8 220.6 228.8 271.4 329.3 330.3 326.0 319.3 341.8 366.2 390.4 2 3 - Net dividends 351.4 375.5 441.0 520.6 536.9 517.3 515.9 597.8 516.5 575.0 556.9 3 4 + Capital consumption allowance (1) 1049.3 1077.3 1236.1 1115.7 1140.6 1124.8 1133.1 1147.8 1156.8 995.7 1005.2 4 5 = U.S. internal funds, book 1272.6 1520.4 1575.2 1569.2 1573.2 1555.2 1592.4 1538.0 1607.2 1473.4 1585.4 5 6 + Foreign earnings retained abroad 192.7 218.2 215.1 184.6 222.4 203.4 189.7 258.9 237.6 194.4 178.6 6 7 + Inventory valuation adjustment (IVA) 6.7 -41.0 -68.3 -9.5 3.3 -1.7 15.2 2.8 -3.0 -24.6 -13.5 7 8 - Net capital transfers paid (2) 38.3 20.9 -6.4 -16.7 -5.7 -9.6 -5.7 -4.5 -2.8 -7.4 -6.6 8 9 = Total internal funds + IVA 1433.7 1676.7 1728.5 1761.0 1804.6 1766.5 1802.9 1804.2 1844.6 1650.5 1756.9 9
10 Gross investment 1569.3 1380.6 931.0 968.3 1313.6 1355.8 1353.8 1128.0 1416.8 1413.6 1551.3 10
11 Capital expenditures 1020.8 1235.4 1331.9 1478.0 1525.8 1435.9 1500.3 1582.7 1584.2 1597.6 1657.5 11 12 Fixed investment (3) 1145.3 1178.6 1297.4 1415.2 1467.8 1402.9 1461.0 1494.2 1512.9 1564.3 1575.1 12 13 Inventory change + IVA -130.8 57.9 34.9 61.8 56.7 32.3 37.6 85.9 71.0 32.9 81.8 13 14 Nonproduced nonfinancial assets 6.3 -1.1 -0.5 0.9 1.3 0.8 1.7 2.6 0.3 0.3 0.5 14
15 Net lending (+) or net borrowing (-) 548.5 145.2 -400.9 -509.7 -212.2 -80.1 -146.5 -454.7 -167.4 -184.0 -106.2 15
16 Net acquisition of financial assets 299.8 632.7 493.4 686.9 932.0 1097.5 880.6 811.5 938.3 414.8 1059.9 16
17 Foreign deposits 6.8 9.1 -5.8 1.0 51.9 82.9 47.0 7.0 70.9 -48.9 4.2 17 18 Checkable deposits and currency 70.8 79.6 29.7 15.2 77.9 68.5 -95.2 184.5 153.7 -134.7 34.5 18 19 Time and savings deposits 176.9 59.9 13.2 36.8 50.8 -2.0 70.2 151.4 -16.4 -50.5 75.7 19 20 Money market fund shares -71.4 -157.7 -35.4 18.2 40.6 -18.1 -11.9 107.8 84.5 -96.3 -14.6 20 21 Security repurchase agreements 0.7 4.3 0.4 -2.8 -0.9 -1.9 -2.5 15.5 -14.9 10.1 8.2 21
22 Credit market instruments 10.1 2.6 -7.1 -10.0 -43.3 -96.2 4.3 -32.5 -48.8 8.7 2.6 22
23 Commercial paper -1.3 12.0 -0.1 -8.0 -21.8 -3.8 -22.7 -31.1 -29.5 -5.0 -19.4 23 24 Treasury securities 12.5 5.1 -5.1 -3.4 0.7 -26.3 20.0 1.7 7.2 -7.2 3.8 24 25 Agency- and GSE-backed securities 4.2 1.7 -1.7 -1.1 -3.8 -28.8 6.7 0.6 6.4 5.6 9.3 25 26 Municipal securities 0.9 -3.2 -1.6 1.7 -11.9 -38.3 0.1 0.7 -10.2 -7.4 -0.6 26 27 Mortgages -4.1 -1.6 -0.6 -0.8 -0.8 -0.8 -0.8 -0.8 -0.8 -0.8 -0.8 27 28 Consumer credit -2.1 -11.4 1.9 1.7 -5.6 1.8 1.1 -3.5 -22.0 23.5 10.4 28
29 Mutual fund shares 35.3 11.1 -12.8 -0.1 0.9 0.9 0.9 0.9 0.9 0.9 0.9 29 30 Trade receivables -31.2 105.7 83.8 83.6 145.4 197.3 195.8 140.8 47.9 46.7 167.1 30
31 U.S. direct investment abroad (4) 269.7 303.3 403.9 315.9 317.4 268.7 382.6 291.3 327.2 148.6 290.5 31 32 Miscellaneous assets -167.9 214.8 23.6 229.0 291.3 597.5 289.4 -55.2 333.3 530.3 490.8 32 33 Insurance receivables -4.0 11.7 10.1 7.6 -6.6 -12.5 0.8 -5.3 -9.3 2.2 13.5 33 34 Equity in GSEs 0.0 0.1 -0.0 0.0 0.0 0.3 -0.2 -0.1 0.1 0.6 -0.2 34 35 Investment in finance co. subs. -9.3 26.7 8.4 2.6 14.7 56.1 4.7 0.8 -2.6 11.3 -2.7 35 36 Other -154.7 176.3 5.1 218.7 283.1 553.7 284.1 -50.7 345.2 516.3 480.1 36
37 Net increase in liabilities -248.7 487.6 894.3 1196.6 1144.2 1177.7 1027.2 1266.2 1105.7 598.8 1166.1 37
38 Net funds raised in markets -411.1 -326.0 -196.3 45.5 58.2 167.1 4.2 212.4 -150.9 68.2 90.5 38
39 Net new equity issues -52.5 -255.1 -456.7 -359.5 -373.3 -219.3 -376.1 -415.0 -483.0 -517.9 -353.4 39
40 Credit market instruments -358.6 -70.9 260.4 405.0 431.6 386.4 380.4 627.4 332.0 586.1 443.9 40
41 Commercial paper -73.1 24.5 33.4 14.0 14.2 20.1 -20.1 92.0 -35.2 72.1 54.9 41 42 Municipal securities (5) 37.2 33.2 8.5 15.2 9.3 11.9 4.3 17.8 3.3 2.0 -17.2 42 43 Corporate bonds (4) 215.8 179.4 161.7 324.4 280.6 307.7 174.8 429.8 210.1 282.5 224.7 43 44 Depository institution loans n.e.c. -234.0 -87.0 68.9 80.4 46.6 25.2 63.7 39.2 58.1 36.7 81.9 44 45 Other loans and advances (6) -160.8 -90.4 60.2 -33.7 53.6 30.4 141.9 10.2 31.8 158.6 45.2 45 46 Mortgages -143.7 -130.6 -72.3 4.6 27.2 -8.9 15.7 38.3 63.8 34.3 54.5 46
47 Trade payables -82.6 156.3 25.2 83.3 113.4 119.1 134.2 135.7 64.6 51.2 139.7 47 48 Taxes payable -3.3 7.2 8.8 2.3 -9.3 -17.1 -26.9 -5.7 12.3 -16.8 9.1 48 49 Foreign direct investment in U.S. 104.6 157.0 192.7 170.1 207.1 135.6 224.4 203.0 265.4 -449.1 233.4 49 50 Miscellaneous liabilities 143.6 493.1 863.9 895.4 774.8 773.0 691.2 720.8 914.4 945.3 693.3 50 51 Pension fund contributions payable -8.6 15.4 3.0 -12.3 -0.6 1.3 0.3 -0.9 -3.0 -0.8 1.9 51 52 Claims of pension fund on sponsor 82.8 -20.7 -16.8 8.4 12.1 -5.1 -4.7 7.0 51.2 8.3 -47.1 52 53 Other 69.4 498.4 877.8 899.4 763.3 776.8 695.5 714.7 866.2 937.9 738.5 53
54 Discrepancy -135.6 296.1 797.5 792.7 491.0 410.7 449.1 676.2 427.8 237.0 205.6 54
Memo: 55 Financing gap (7) -258.5 -244.0 -175.1 -81.7 -50.7 -117.5 -107.2 41.9 -20.0 148.8 85.7 55
(1) Consumption of fixed capital plus capital consumption adjustment.(2) Table F.9, line 58.(3) Nonresidential fixed investment plus residential fixed investment, shown in table F.6, lines 10 and 15 respectively.(4) Through 1992:Q4, corporate bonds include net issues by Netherlands Antillean financial subsidiaries, and U.S. direct investment abroad excludes net inflows from those bond issues.(5) Industrial revenue bonds issued by state and local governments to finance private investment and secured in interest and principal by the industrial user of the funds.(6) Loans from rest of the world, U.S. government, and nonbank financial institutions. Detail can be found on table F.216.(7) Capital expenditures (line 11) less the sum of U.S. internal funds (line 5) and inventory valuation adjustment (line 7).
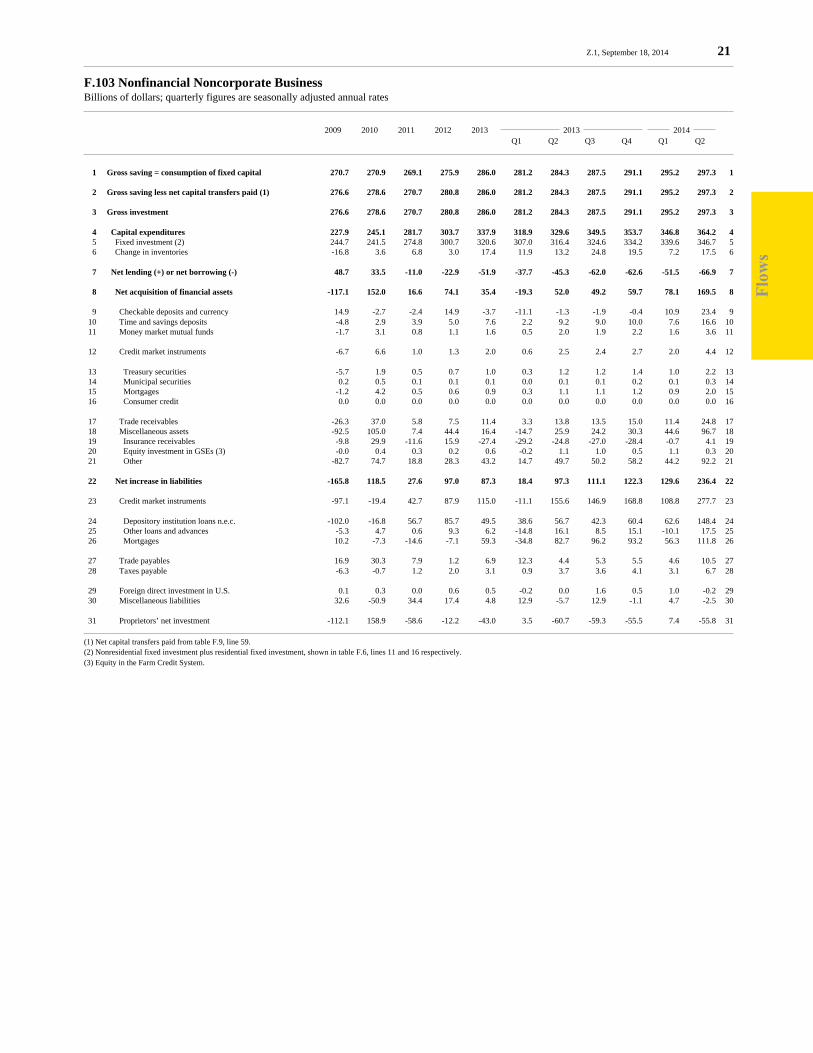
Flo
ws
Z.1, September 18, 2014 21
F.103 Nonfinancial Noncorporate BusinessBillions of dollars; quarterly figures are seasonally adjusted annual rates
2009 2010 2011 2012 2013 2013 2014 Q1 Q2 Q3 Q4 Q1 Q2
1 Gross saving = consumption of fixed capital 270.7 270.9 269.1 275.9 286.0 281.2 284.3 287.5 291.1 295.2 297.3 1
2 Gross saving less net capital transfers paid (1) 276.6 278.6 270.7 280.8 286.0 281.2 284.3 287.5 291.1 295.2 297.3 2
3 Gross investment 276.6 278.6 270.7 280.8 286.0 281.2 284.3 287.5 291.1 295.2 297.3 3
4 Capital expenditures 227.9 245.1 281.7 303.7 337.9 318.9 329.6 349.5 353.7 346.8 364.2 4 5 Fixed investment (2) 244.7 241.5 274.8 300.7 320.6 307.0 316.4 324.6 334.2 339.6 346.7 5 6 Change in inventories -16.8 3.6 6.8 3.0 17.4 11.9 13.2 24.8 19.5 7.2 17.5 6
7 Net lending (+) or net borrowing (-) 48.7 33.5 -11.0 -22.9 -51.9 -37.7 -45.3 -62.0 -62.6 -51.5 -66.9 7
8 Net acquisition of financial assets -117.1 152.0 16.6 74.1 35.4 -19.3 52.0 49.2 59.7 78.1 169.5 8
9 Checkable deposits and currency 14.9 -2.7 -2.4 14.9 -3.7 -11.1 -1.3 -1.9 -0.4 10.9 23.4 9 10 Time and savings deposits -4.8 2.9 3.9 5.0 7.6 2.2 9.2 9.0 10.0 7.6 16.6 10 11 Money market mutual funds -1.7 3.1 0.8 1.1 1.6 0.5 2.0 1.9 2.2 1.6 3.6 11
12 Credit market instruments -6.7 6.6 1.0 1.3 2.0 0.6 2.5 2.4 2.7 2.0 4.4 12
13 Treasury securities -5.7 1.9 0.5 0.7 1.0 0.3 1.2 1.2 1.4 1.0 2.2 13 14 Municipal securities 0.2 0.5 0.1 0.1 0.1 0.0 0.1 0.1 0.2 0.1 0.3 14 15 Mortgages -1.2 4.2 0.5 0.6 0.9 0.3 1.1 1.1 1.2 0.9 2.0 15 16 Consumer credit 0.0 0.0 0.0 0.0 0.0 0.0 0.0 0.0 0.0 0.0 0.0 16
17 Trade receivables -26.3 37.0 5.8 7.5 11.4 3.3 13.8 13.5 15.0 11.4 24.8 17 18 Miscellaneous assets -92.5 105.0 7.4 44.4 16.4 -14.7 25.9 24.2 30.3 44.6 96.7 18 19 Insurance receivables -9.8 29.9 -11.6 15.9 -27.4 -29.2 -24.8 -27.0 -28.4 -0.7 4.1 19 20 Equity investment in GSEs (3) -0.0 0.4 0.3 0.2 0.6 -0.2 1.1 1.0 0.5 1.1 0.3 20 21 Other -82.7 74.7 18.8 28.3 43.2 14.7 49.7 50.2 58.2 44.2 92.2 21
22 Net increase in liabilities -165.8 118.5 27.6 97.0 87.3 18.4 97.3 111.1 122.3 129.6 236.4 22
23 Credit market instruments -97.1 -19.4 42.7 87.9 115.0 -11.1 155.6 146.9 168.8 108.8 277.7 23
24 Depository institution loans n.e.c. -102.0 -16.8 56.7 85.7 49.5 38.6 56.7 42.3 60.4 62.6 148.4 24 25 Other loans and advances -5.3 4.7 0.6 9.3 6.2 -14.8 16.1 8.5 15.1 -10.1 17.5 25 26 Mortgages 10.2 -7.3 -14.6 -7.1 59.3 -34.8 82.7 96.2 93.2 56.3 111.8 26
27 Trade payables 16.9 30.3 7.9 1.2 6.9 12.3 4.4 5.3 5.5 4.6 10.5 27 28 Taxes payable -6.3 -0.7 1.2 2.0 3.1 0.9 3.7 3.6 4.1 3.1 6.7 28
29 Foreign direct investment in U.S. 0.1 0.3 0.0 0.6 0.5 -0.2 0.0 1.6 0.5 1.0 -0.2 29 30 Miscellaneous liabilities 32.6 -50.9 34.4 17.4 4.8 12.9 -5.7 12.9 -1.1 4.7 -2.5 30
31 Proprietors’ net investment -112.1 158.9 -58.6 -12.2 -43.0 3.5 -60.7 -59.3 -55.5 7.4 -55.8 31
(1) Net capital transfers paid from table F.9, line 59.(2) Nonresidential fixed investment plus residential fixed investment, shown in table F.6, lines 11 and 16 respectively.(3) Equity in the Farm Credit System.
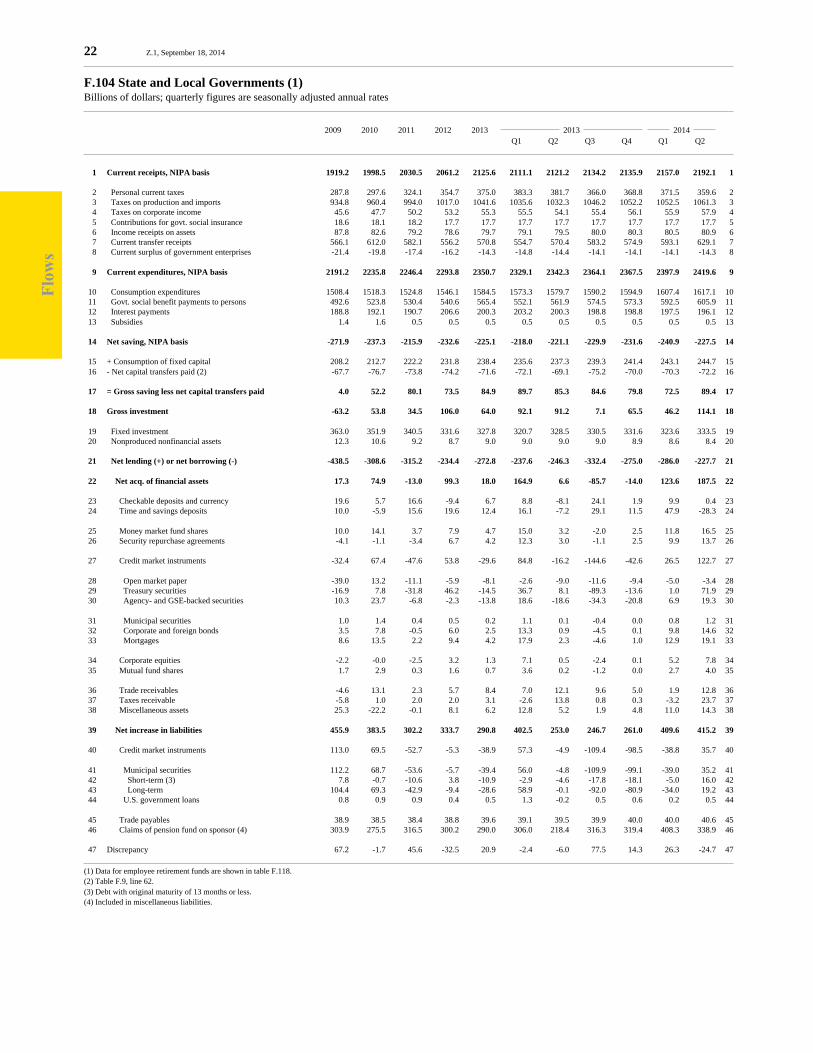
Flo
ws
22 Z.1, September 18, 2014
F.104 State and Local Governments (1)Billions of dollars; quarterly figures are seasonally adjusted annual rates
2009 2010 2011 2012 2013 2013 2014 Q1 Q2 Q3 Q4 Q1 Q2
1 Current receipts, NIPA basis 1919.2 1998.5 2030.5 2061.2 2125.6 2111.1 2121.2 2134.2 2135.9 2157.0 2192.1 1
2 Personal current taxes 287.8 297.6 324.1 354.7 375.0 383.3 381.7 366.0 368.8 371.5 359.6 2 3 Taxes on production and imports 934.8 960.4 994.0 1017.0 1041.6 1035.6 1032.3 1046.2 1052.2 1052.5 1061.3 3 4 Taxes on corporate income 45.6 47.7 50.2 53.2 55.3 55.5 54.1 55.4 56.1 55.9 57.9 4 5 Contributions for govt. social insurance 18.6 18.1 18.2 17.7 17.7 17.7 17.7 17.7 17.7 17.7 17.7 5 6 Income receipts on assets 87.8 82.6 79.2 78.6 79.7 79.1 79.5 80.0 80.3 80.5 80.9 6 7 Current transfer receipts 566.1 612.0 582.1 556.2 570.8 554.7 570.4 583.2 574.9 593.1 629.1 7 8 Current surplus of government enterprises -21.4 -19.8 -17.4 -16.2 -14.3 -14.8 -14.4 -14.1 -14.1 -14.1 -14.3 8
9 Current expenditures, NIPA basis 2191.2 2235.8 2246.4 2293.8 2350.7 2329.1 2342.3 2364.1 2367.5 2397.9 2419.6 9
10 Consumption expenditures 1508.4 1518.3 1524.8 1546.1 1584.5 1573.3 1579.7 1590.2 1594.9 1607.4 1617.1 10 11 Govt. social benefit payments to persons 492.6 523.8 530.4 540.6 565.4 552.1 561.9 574.5 573.3 592.5 605.9 11 12 Interest payments 188.8 192.1 190.7 206.6 200.3 203.2 200.3 198.8 198.8 197.5 196.1 12 13 Subsidies 1.4 1.6 0.5 0.5 0.5 0.5 0.5 0.5 0.5 0.5 0.5 13
14 Net saving, NIPA basis -271.9 -237.3 -215.9 -232.6 -225.1 -218.0 -221.1 -229.9 -231.6 -240.9 -227.5 14
15 + Consumption of fixed capital 208.2 212.7 222.2 231.8 238.4 235.6 237.3 239.3 241.4 243.1 244.7 15 16 - Net capital transfers paid (2) -67.7 -76.7 -73.8 -74.2 -71.6 -72.1 -69.1 -75.2 -70.0 -70.3 -72.2 16
17 = Gross saving less net capital transfers paid 4.0 52.2 80.1 73.5 84.9 89.7 85.3 84.6 79.8 72.5 89.4 17
18 Gross investment -63.2 53.8 34.5 106.0 64.0 92.1 91.2 7.1 65.5 46.2 114.1 18
19 Fixed investment 363.0 351.9 340.5 331.6 327.8 320.7 328.5 330.5 331.6 323.6 333.5 19 20 Nonproduced nonfinancial assets 12.3 10.6 9.2 8.7 9.0 9.0 9.0 9.0 8.9 8.6 8.4 20
21 Net lending (+) or net borrowing (-) -438.5 -308.6 -315.2 -234.4 -272.8 -237.6 -246.3 -332.4 -275.0 -286.0 -227.7 21
22 Net acq. of financial assets 17.3 74.9 -13.0 99.3 18.0 164.9 6.6 -85.7 -14.0 123.6 187.5 22
23 Checkable deposits and currency 19.6 5.7 16.6 -9.4 6.7 8.8 -8.1 24.1 1.9 9.9 0.4 23 24 Time and savings deposits 10.0 -5.9 15.6 19.6 12.4 16.1 -7.2 29.1 11.5 47.9 -28.3 24
25 Money market fund shares 10.0 14.1 3.7 7.9 4.7 15.0 3.2 -2.0 2.5 11.8 16.5 25 26 Security repurchase agreements -4.1 -1.1 -3.4 6.7 4.2 12.3 3.0 -1.1 2.5 9.9 13.7 26
27 Credit market instruments -32.4 67.4 -47.6 53.8 -29.6 84.8 -16.2 -144.6 -42.6 26.5 122.7 27
28 Open market paper -39.0 13.2 -11.1 -5.9 -8.1 -2.6 -9.0 -11.6 -9.4 -5.0 -3.4 28 29 Treasury securities -16.9 7.8 -31.8 46.2 -14.5 36.7 8.1 -89.3 -13.6 1.0 71.9 29 30 Agency- and GSE-backed securities 10.3 23.7 -6.8 -2.3 -13.8 18.6 -18.6 -34.3 -20.8 6.9 19.3 30
31 Municipal securities 1.0 1.4 0.4 0.5 0.2 1.1 0.1 -0.4 0.0 0.8 1.2 31 32 Corporate and foreign bonds 3.5 7.8 -0.5 6.0 2.5 13.3 0.9 -4.5 0.1 9.8 14.6 32 33 Mortgages 8.6 13.5 2.2 9.4 4.2 17.9 2.3 -4.6 1.0 12.9 19.1 33
34 Corporate equities -2.2 -0.0 -2.5 3.2 1.3 7.1 0.5 -2.4 0.1 5.2 7.8 34 35 Mutual fund shares 1.7 2.9 0.3 1.6 0.7 3.6 0.2 -1.2 0.0 2.7 4.0 35
36 Trade receivables -4.6 13.1 2.3 5.7 8.4 7.0 12.1 9.6 5.0 1.9 12.8 36 37 Taxes receivable -5.8 1.0 2.0 2.0 3.1 -2.6 13.8 0.8 0.3 -3.2 23.7 37 38 Miscellaneous assets 25.3 -22.2 -0.1 8.1 6.2 12.8 5.2 1.9 4.8 11.0 14.3 38
39 Net increase in liabilities 455.9 383.5 302.2 333.7 290.8 402.5 253.0 246.7 261.0 409.6 415.2 39
40 Credit market instruments 113.0 69.5 -52.7 -5.3 -38.9 57.3 -4.9 -109.4 -98.5 -38.8 35.7 40
41 Municipal securities 112.2 68.7 -53.6 -5.7 -39.4 56.0 -4.8 -109.9 -99.1 -39.0 35.2 41 42 Short-term (3) 7.8 -0.7 -10.6 3.8 -10.9 -2.9 -4.6 -17.8 -18.1 -5.0 16.0 42 43 Long-term 104.4 69.3 -42.9 -9.4 -28.6 58.9 -0.1 -92.0 -80.9 -34.0 19.2 43 44 U.S. government loans 0.8 0.9 0.9 0.4 0.5 1.3 -0.2 0.5 0.6 0.2 0.5 44
45 Trade payables 38.9 38.5 38.4 38.8 39.6 39.1 39.5 39.9 40.0 40.0 40.6 45 46 Claims of pension fund on sponsor (4) 303.9 275.5 316.5 300.2 290.0 306.0 218.4 316.3 319.4 408.3 338.9 46
47 Discrepancy 67.2 -1.7 45.6 -32.5 20.9 -2.4 -6.0 77.5 14.3 26.3 -24.7 47
(1) Data for employee retirement funds are shown in table F.118.(2) Table F.9, line 62.(3) Debt with original maturity of 13 months or less.(4) Included in miscellaneous liabilities.

Flo
ws
Z.1, September 18, 2014 23
F.105 Federal GovernmentBillions of dollars; quarterly figures are seasonally adjusted annual rates
2009 2010 2011 2012 2013 2013 2014 Q1 Q2 Q3 Q4 Q1 Q2
1 Current receipts, NIPA basis 2227.8 2391.7 2519.5 2684.1 3113.0 2974.9 3226.0 3043.9 3207.1 3242.6 3286.4 1
2 Personal current taxes 857.2 893.8 1076.6 1149.0 1286.8 1253.5 1278.9 1295.5 1319.3 1340.3 1364.1 2 3 Taxes on production and imports 91.4 96.8 108.6 115.0 120.9 119.2 120.0 120.9 123.5 132.0 134.0 3 4 Taxes on corporate income 200.4 298.7 299.4 369.5 384.9 386.5 371.8 378.2 403.2 470.0 507.2 4 5 Taxes from the rest of the world 14.8 15.7 16.7 18.0 19.2 18.6 18.6 19.9 19.6 20.4 17.9 5 6 Contributions for govt. social insurance 950.8 970.9 904.0 938.1 1092.3 1078.4 1089.8 1095.6 1105.2 1134.5 1149.2 6 7 Income receipts on assets 48.5 54.6 56.4 53.6 164.7 73.7 299.5 93.6 192.2 106.8 78.6 7 8 Current transfer receipts 64.0 64.4 65.0 49.9 59.5 58.1 62.7 56.3 61.0 55.5 54.6 8 9 Current surplus of government enterprises 0.7 -3.1 -7.1 -9.1 -15.3 -13.0 -15.2 -16.0 -16.9 -16.9 -19.3 9
10 Current expenditures, NIPA basis 3476.6 3720.5 3763.7 3763.2 3762.1 3721.0 3787.2 3793.7 3746.4 3802.7 3875.0 10
11 Consumption expenditures 933.7 1003.9 1006.1 1003.6 963.0 970.2 965.2 965.7 951.1 957.1 955.6 11 12 Government social benefits 1624.9 1726.6 1744.4 1785.1 1825.6 1819.4 1819.2 1828.6 1835.4 1854.3 1880.3 12 13 Other current transfer payments 507.5 555.0 528.0 493.2 496.3 482.8 500.8 513.6 488.1 513.0 507.3 13 14 Interest payments 353.6 380.6 425.7 423.8 417.4 389.0 441.3 425.8 413.5 421.1 475.9 14 15 Subsidies 56.9 54.3 59.5 57.6 59.7 59.6 60.7 60.1 58.4 57.2 56.0 15
16 Net saving, NIPA basis -1248.8 -1328.7 -1244.1 -1079.1 -649.1 -746.1 -561.2 -749.8 -539.4 -560.1 -588.6 16
17 + Consumption of fixed capital 234.5 245.3 257.4 264.1 268.0 265.9 267.2 268.5 270.4 272.1 273.8 17 18 - Insurance and pension reserves (1) 0.5 -1.7 -0.4 -1.4 -1.2 -1.7 -0.5 -2.7 0.0 -1.8 0.0 18 19 - Contr. for govt. soc. insur., U.S.-affiliated areas 5.0 4.9 4.4 4.6 5.4 5.3 5.4 5.4 5.4 5.6 5.6 19 20 - Net capital transfers paid (2) 64.4 84.8 81.5 80.0 58.4 64.7 57.3 59.8 51.8 56.9 58.5 20
21 = Gross saving less net capital transfers paid -1084.1 -1171.4 -1072.2 -898.2 -443.7 -548.5 -356.2 -543.8 -326.2 -348.6 -379.0 21
22 Gross investment -1023.1 -1115.9 -1055.9 -833.4 -397.2 -710.5 -18.7 -579.0 -280.6 -411.8 -109.1 22 23 Fixed investment 284.0 300.0 297.4 287.8 268.5 271.7 268.9 268.2 265.1 251.0 254.9 23 24 Nonproduced nonfinancial assets -8.9 -1.0 -0.9 -1.9 -2.4 -1.9 -2.8 -3.7 -1.3 -1.3 -1.9 24
25 Net lending (+) or net borrowing (-) -1298.2 -1414.9 -1352.4 -1119.3 -663.3 -980.4 -284.8 -843.6 -544.4 -661.5 -362.1 25
26 Net acq. of financial assets 237.8 281.9 -150.7 132.4 217.4 179.5 242.3 -49.6 497.2 163.3 106.8 26
27 U.S. official reserve assets 51.9 1.6 16.2 4.3 -3.3 3.3 -1.0 -4.2 -11.2 -4.0 3.0 27 28 Checkable deposits and currency -174.2 148.9 -257.6 6.7 69.6 -8.2 130.2 -188.9 345.3 -36.0 -104.1 28 29 Time and savings deposits 0.3 0.1 -0.3 0.2 -0.5 -1.7 0.9 0.2 -1.3 -0.1 -0.0 29 30 Credit market instruments 309.2 84.5 18.3 104.9 124.2 149.0 114.8 118.5 114.2 125.3 102.4 30 31 Agency- and GSE-backed securities 142.0 -47.2 -118.1 -31.1 0.0 0.0 0.0 0.0 0.0 0.0 0.0 31 32 Corporate and foreign bonds 0.6 0.3 -0.1 -0.2 -0.1 -0.2 -0.1 -0.1 -0.0 -0.0 -0.1 32 33 Other loans and advances 66.2 3.6 4.8 2.4 7.2 9.6 8.7 7.9 2.6 7.1 0.1 33 34 Mortgages 12.6 -5.4 3.3 1.6 4.0 7.2 -0.5 3.7 5.5 1.9 2.3 34 35 Consumer credit (3) 87.9 133.1 128.5 132.1 113.1 132.4 106.6 107.0 106.2 116.3 100.0 35 36 Corporate equities (4) 0.6 24.1 40.3 -13.2 -4.8 -5.2 -2.8 -10.3 -1.1 -0.6 -1.1 36 37 Trade receivables -21.1 -0.7 4.8 2.6 -1.5 -7.7 8.8 -5.1 -2.0 7.7 -4.8 37 38 Taxes receivable 35.9 27.1 25.6 27.9 27.8 46.7 3.2 25.1 36.3 60.1 91.4 38 39 Miscellaneous assets 35.2 -3.6 2.0 -1.0 5.9 3.2 -11.9 15.2 17.0 11.0 19.9 39
40 Net increase in liabilities 1536.0 1696.8 1201.7 1251.6 880.7 1159.9 527.1 794.0 1041.6 824.8 468.9 40
41 SDR allocations 47.6 0.0 0.0 0.0 0.0 0.0 0.0 0.0 0.0 0.0 0.0 41 42 SDR certificates 3.0 0.0 0.0 0.0 0.0 0.0 0.0 0.0 0.0 0.0 0.0 42 43 Treasury currency -0.4 -0.3 0.0 0.0 -0.4 0.0 0.0 -1.4 0.0 0.0 0.0 43 44 Credit market instruments 1443.9 1580.2 1067.9 1140.2 759.1 1056.0 413.6 307.9 1258.8 741.0 314.4 44 45 U.S. savings securities -2.8 -3.3 -2.7 -2.8 -3.3 -2.8 -3.6 -3.4 -3.4 -3.3 -3.0 45 46 Treasury bills -73.3 -19.0 -249.5 107.0 -35.9 646.7 -880.3 -160.7 250.6 238.7 -1055.3 46 47 Other Treasury securities 1519.8 1601.8 1319.0 1036.3 798.7 413.1 1296.2 471.4 1014.0 507.6 1372.7 47 48 Budget agency securities 0.1 0.7 1.1 -0.4 -0.4 -1.0 1.3 0.5 -2.4 -1.9 0.1 48 49 Multifamily residential mortgages 0.0 0.0 0.0 0.0 0.0 0.0 0.0 0.0 0.0 0.0 0.0 49 50 Trade payables -56.2 5.2 8.8 15.4 16.8 3.6 25.2 21.8 16.7 4.7 32.2 50 51 Insurance reserves 1.1 0.9 1.3 0.3 0.3 0.2 0.8 -0.5 0.5 -0.0 0.6 51 52 Miscellaneous liabilities 97.0 110.7 123.7 95.7 104.8 100.0 87.6 466.2 -234.4 79.2 121.7 52 53 Nonmarketable securities held by pension plans (5) 61.9 65.7 70.8 40.4 98.2 172.5 -308.1 -63.5 592.0 74.9 52.6 53 54 Claims of pension fund on sponsor 15.6 20.2 20.8 50.3 -6.8 -84.0 398.2 562.7 -904.1 19.8 42.1 54 55 Other 19.5 24.9 32.1 5.0 13.4 11.5 -2.5 -33.0 77.7 -15.5 27.0 55
56 Discrepancy -61.0 -55.5 -16.3 -64.7 -46.4 162.0 -337.5 35.2 -45.6 63.2 -269.9 56
Memo: 57 Change in cash balance (6) -173.2 148.9 -258.0 7.5 69.6 -54.3 227.3 -185.2 290.4 -79.3 -6.5 57
(1) Railroad Retirement Board, the National Railroad Retirement Investment Trust, and federal government life insurance reserves.(2) Table F.9, line 61 less line 12.(3) Includes loans originated by the Department of Education under the Federal Direct Loan Program, as well as Federal Family Education Loan Program loans that the government purchased from depository institutions and finance companies.(4) Corporate equities purchased from financial businesses under the Troubled Asset Relief Program (TARP) and from GSEs at issuance price.(5) Nonmarketable government securities held by the civil service retirement and disability fund, Railroad Retirement Board, judicial retirement fund, military retirement fund, and foreign service retirement and disability fund.(6) Time and savings deposits (line 29) plus checkable deposits and currency at the monetary authority and U.S.-chartered depository institutions sectors (table F.204, lines 3 and 8).
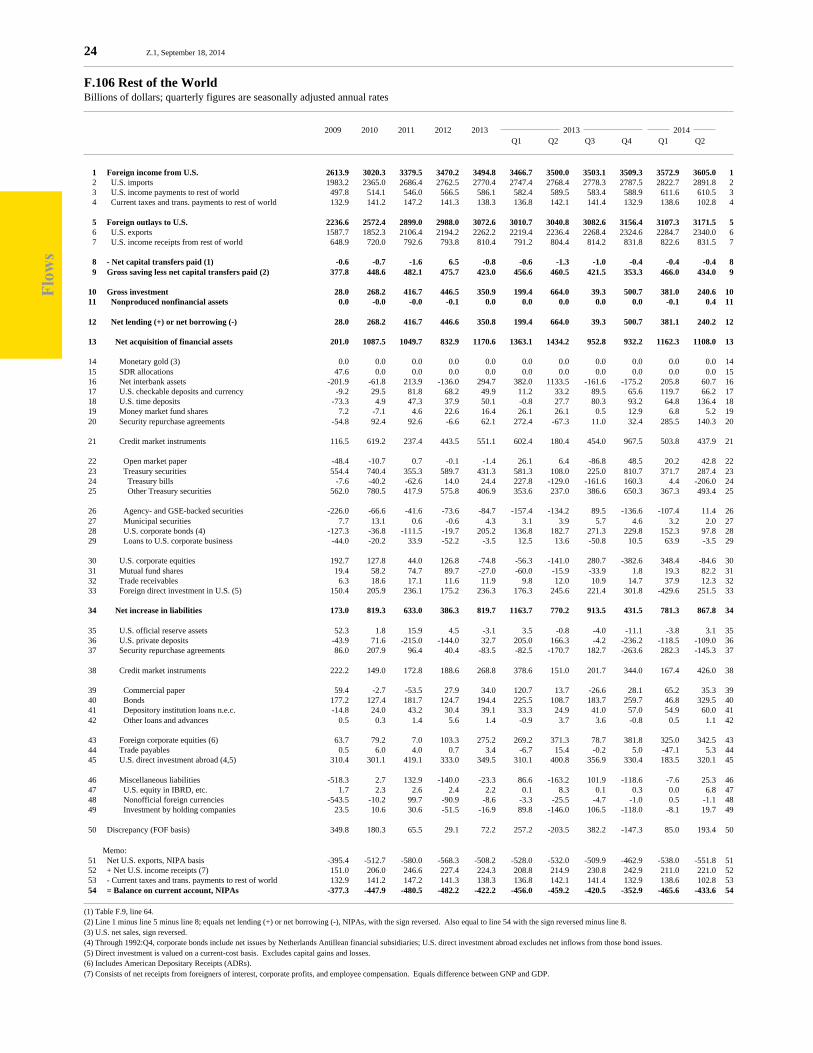
Flo
ws
24 Z.1, September 18, 2014
F.106 Rest of the WorldBillions of dollars; quarterly figures are seasonally adjusted annual rates
2009 2010 2011 2012 2013 2013 2014 Q1 Q2 Q3 Q4 Q1 Q2
1 Foreign income from U.S. 2613.9 3020.3 3379.5 3470.2 3494.8 3466.7 3500.0 3503.1 3509.3 3572.9 3605.0 1 2 U.S. imports 1983.2 2365.0 2686.4 2762.5 2770.4 2747.4 2768.4 2778.3 2787.5 2822.7 2891.8 2 3 U.S. income payments to rest of world 497.8 514.1 546.0 566.5 586.1 582.4 589.5 583.4 588.9 611.6 610.5 3 4 Current taxes and trans. payments to rest of world 132.9 141.2 147.2 141.3 138.3 136.8 142.1 141.4 132.9 138.6 102.8 4
5 Foreign outlays to U.S. 2236.6 2572.4 2899.0 2988.0 3072.6 3010.7 3040.8 3082.6 3156.4 3107.3 3171.5 5 6 U.S. exports 1587.7 1852.3 2106.4 2194.2 2262.2 2219.4 2236.4 2268.4 2324.6 2284.7 2340.0 6 7 U.S. income receipts from rest of world 648.9 720.0 792.6 793.8 810.4 791.2 804.4 814.2 831.8 822.6 831.5 7
8 - Net capital transfers paid (1) -0.6 -0.7 -1.6 6.5 -0.8 -0.6 -1.3 -1.0 -0.4 -0.4 -0.4 8 9 Gross saving less net capital transfers paid (2) 377.8 448.6 482.1 475.7 423.0 456.6 460.5 421.5 353.3 466.0 434.0 9
10 Gross investment 28.0 268.2 416.7 446.5 350.9 199.4 664.0 39.3 500.7 381.0 240.6 10 11 Nonproduced nonfinancial assets 0.0 -0.0 -0.0 -0.1 0.0 0.0 0.0 0.0 0.0 -0.1 0.4 11
12 Net lending (+) or net borrowing (-) 28.0 268.2 416.7 446.6 350.8 199.4 664.0 39.3 500.7 381.1 240.2 12
13 Net acquisition of financial assets 201.0 1087.5 1049.7 832.9 1170.6 1363.1 1434.2 952.8 932.2 1162.3 1108.0 13
14 Monetary gold (3) 0.0 0.0 0.0 0.0 0.0 0.0 0.0 0.0 0.0 0.0 0.0 14 15 SDR allocations 47.6 0.0 0.0 0.0 0.0 0.0 0.0 0.0 0.0 0.0 0.0 15 16 Net interbank assets -201.9 -61.8 213.9 -136.0 294.7 382.0 1133.5 -161.6 -175.2 205.8 60.7 16 17 U.S. checkable deposits and currency -9.2 29.5 81.8 68.2 49.9 11.2 33.2 89.5 65.6 119.7 66.2 17 18 U.S. time deposits -73.3 4.9 47.3 37.9 50.1 -0.8 27.7 80.3 93.2 64.8 136.4 18 19 Money market fund shares 7.2 -7.1 4.6 22.6 16.4 26.1 26.1 0.5 12.9 6.8 5.2 19 20 Security repurchase agreements -54.8 92.4 92.6 -6.6 62.1 272.4 -67.3 11.0 32.4 285.5 140.3 20
21 Credit market instruments 116.5 619.2 237.4 443.5 551.1 602.4 180.4 454.0 967.5 503.8 437.9 21
22 Open market paper -48.4 -10.7 0.7 -0.1 -1.4 26.1 6.4 -86.8 48.5 20.2 42.8 22 23 Treasury securities 554.4 740.4 355.3 589.7 431.3 581.3 108.0 225.0 810.7 371.7 287.4 23 24 Treasury bills -7.6 -40.2 -62.6 14.0 24.4 227.8 -129.0 -161.6 160.3 4.4 -206.0 24 25 Other Treasury securities 562.0 780.5 417.9 575.8 406.9 353.6 237.0 386.6 650.3 367.3 493.4 25
26 Agency- and GSE-backed securities -226.0 -66.6 -41.6 -73.6 -84.7 -157.4 -134.2 89.5 -136.6 -107.4 11.4 26 27 Municipal securities 7.7 13.1 0.6 -0.6 4.3 3.1 3.9 5.7 4.6 3.2 2.0 27 28 U.S. corporate bonds (4) -127.3 -36.8 -111.5 -19.7 205.2 136.8 182.7 271.3 229.8 152.3 97.8 28 29 Loans to U.S. corporate business -44.0 -20.2 33.9 -52.2 -3.5 12.5 13.6 -50.8 10.5 63.9 -3.5 29
30 U.S. corporate equities 192.7 127.8 44.0 126.8 -74.8 -56.3 -141.0 280.7 -382.6 348.4 -84.6 30 31 Mutual fund shares 19.4 58.2 74.7 89.7 -27.0 -60.0 -15.9 -33.9 1.8 19.3 82.2 31 32 Trade receivables 6.3 18.6 17.1 11.6 11.9 9.8 12.0 10.9 14.7 37.9 12.3 32 33 Foreign direct investment in U.S. (5) 150.4 205.9 236.1 175.2 236.3 176.3 245.6 221.4 301.8 -429.6 251.5 33
34 Net increase in liabilities 173.0 819.3 633.0 386.3 819.7 1163.7 770.2 913.5 431.5 781.3 867.8 34
35 U.S. official reserve assets 52.3 1.8 15.9 4.5 -3.1 3.5 -0.8 -4.0 -11.1 -3.8 3.1 35 36 U.S. private deposits -43.9 71.6 -215.0 -144.0 32.7 205.0 166.3 -4.2 -236.2 -118.5 -109.0 36 37 Security repurchase agreements 86.0 207.9 96.4 40.4 -83.5 -82.5 -170.7 182.7 -263.6 282.3 -145.3 37
38 Credit market instruments 222.2 149.0 172.8 188.6 268.8 378.6 151.0 201.7 344.0 167.4 426.0 38
39 Commercial paper 59.4 -2.7 -53.5 27.9 34.0 120.7 13.7 -26.6 28.1 65.2 35.3 39 40 Bonds 177.2 127.4 181.7 124.7 194.4 225.5 108.7 183.7 259.7 46.8 329.5 40 41 Depository institution loans n.e.c. -14.8 24.0 43.2 30.4 39.1 33.3 24.9 41.0 57.0 54.9 60.0 41 42 Other loans and advances 0.5 0.3 1.4 5.6 1.4 -0.9 3.7 3.6 -0.8 0.5 1.1 42
43 Foreign corporate equities (6) 63.7 79.2 7.0 103.3 275.2 269.2 371.3 78.7 381.8 325.0 342.5 43 44 Trade payables 0.5 6.0 4.0 0.7 3.4 -6.7 15.4 -0.2 5.0 -47.1 5.3 44 45 U.S. direct investment abroad (4,5) 310.4 301.1 419.1 333.0 349.5 310.1 400.8 356.9 330.4 183.5 320.1 45
46 Miscellaneous liabilities -518.3 2.7 132.9 -140.0 -23.3 86.6 -163.2 101.9 -118.6 -7.6 25.3 46 47 U.S. equity in IBRD, etc. 1.7 2.3 2.6 2.4 2.2 0.1 8.3 0.1 0.3 0.0 6.8 47 48 Nonofficial foreign currencies -543.5 -10.2 99.7 -90.9 -8.6 -3.3 -25.5 -4.7 -1.0 0.5 -1.1 48 49 Investment by holding companies 23.5 10.6 30.6 -51.5 -16.9 89.8 -146.0 106.5 -118.0 -8.1 19.7 49
50 Discrepancy (FOF basis) 349.8 180.3 65.5 29.1 72.2 257.2 -203.5 382.2 -147.3 85.0 193.4 50
Memo: 51 Net U.S. exports, NIPA basis -395.4 -512.7 -580.0 -568.3 -508.2 -528.0 -532.0 -509.9 -462.9 -538.0 -551.8 51 52 + Net U.S. income receipts (7) 151.0 206.0 246.6 227.4 224.3 208.8 214.9 230.8 242.9 211.0 221.0 52 53 - Current taxes and trans. payments to rest of world 132.9 141.2 147.2 141.3 138.3 136.8 142.1 141.4 132.9 138.6 102.8 53 54 = Balance on current account, NIPAs -377.3 -447.9 -480.5 -482.2 -422.2 -456.0 -459.2 -420.5 -352.9 -465.6 -433.6 54
(1) Table F.9, line 64.(2) Line 1 minus line 5 minus line 8; equals net lending (+) or net borrowing (-), NIPAs, with the sign reversed. Also equal to line 54 with the sign reversed minus line 8.(3) U.S. net sales, sign reversed.(4) Through 1992:Q4, corporate bonds include net issues by Netherlands Antillean financial subsidiaries; U.S. direct investment abroad excludes net inflows from those bond issues.(5) Direct investment is valued on a current-cost basis. Excludes capital gains and losses.(6) Includes American Depositary Receipts (ADRs).(7) Consists of net receipts from foreigners of interest, corporate profits, and employee compensation. Equals difference between GNP and GDP.
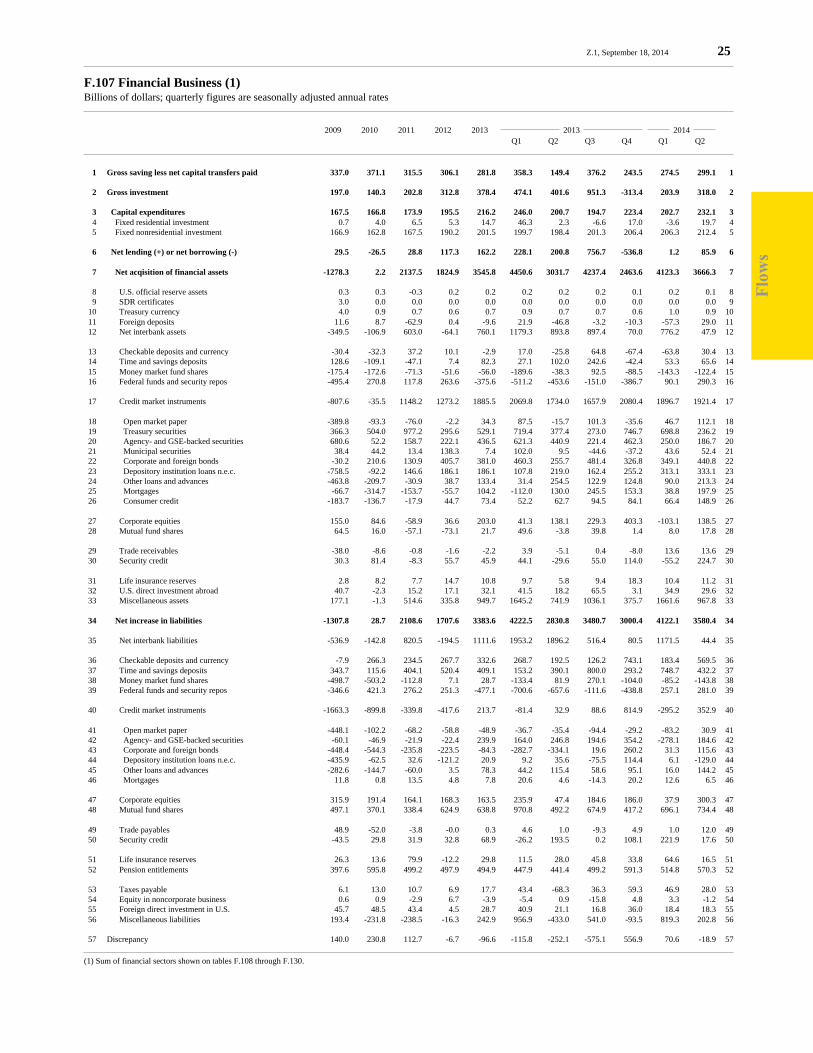
Flo
ws
Z.1, September 18, 2014 25
F.107 Financial Business (1)Billions of dollars; quarterly figures are seasonally adjusted annual rates
2009 2010 2011 2012 2013 2013 2014 Q1 Q2 Q3 Q4 Q1 Q2
1 Gross saving less net capital transfers paid 337.0 371.1 315.5 306.1 281.8 358.3 149.4 376.2 243.5 274.5 299.1 1
2 Gross investment 197.0 140.3 202.8 312.8 378.4 474.1 401.6 951.3 -313.4 203.9 318.0 2
3 Capital expenditures 167.5 166.8 173.9 195.5 216.2 246.0 200.7 194.7 223.4 202.7 232.1 3 4 Fixed residential investment 0.7 4.0 6.5 5.3 14.7 46.3 2.3 -6.6 17.0 -3.6 19.7 4 5 Fixed nonresidential investment 166.9 162.8 167.5 190.2 201.5 199.7 198.4 201.3 206.4 206.3 212.4 5
6 Net lending (+) or net borrowing (-) 29.5 -26.5 28.8 117.3 162.2 228.1 200.8 756.7 -536.8 1.2 85.9 6
7 Net acqisition of financial assets -1278.3 2.2 2137.5 1824.9 3545.8 4450.6 3031.7 4237.4 2463.6 4123.3 3666.3 7
8 U.S. official reserve assets 0.3 0.3 -0.3 0.2 0.2 0.2 0.2 0.2 0.1 0.2 0.1 8 9 SDR certificates 3.0 0.0 0.0 0.0 0.0 0.0 0.0 0.0 0.0 0.0 0.0 9 10 Treasury currency 4.0 0.9 0.7 0.6 0.7 0.9 0.7 0.7 0.6 1.0 0.9 10 11 Foreign deposits 11.6 8.7 -62.9 0.4 -9.6 21.9 -46.8 -3.2 -10.3 -57.3 29.0 11 12 Net interbank assets -349.5 -106.9 603.0 -64.1 760.1 1179.3 893.8 897.4 70.0 776.2 47.9 12
13 Checkable deposits and currency -30.4 -32.3 37.2 10.1 -2.9 17.0 -25.8 64.8 -67.4 -63.8 30.4 13 14 Time and savings deposits 128.6 -109.1 -47.1 7.4 82.3 27.1 102.0 242.6 -42.4 53.3 65.6 14 15 Money market fund shares -175.4 -172.6 -71.3 -51.6 -56.0 -189.6 -38.3 92.5 -88.5 -143.3 -122.4 15 16 Federal funds and security repos -495.4 270.8 117.8 263.6 -375.6 -511.2 -453.6 -151.0 -386.7 90.1 290.3 16
17 Credit market instruments -807.6 -35.5 1148.2 1273.2 1885.5 2069.8 1734.0 1657.9 2080.4 1896.7 1921.4 17
18 Open market paper -389.8 -93.3 -76.0 -2.2 34.3 87.5 -15.7 101.3 -35.6 46.7 112.1 18 19 Treasury securities 366.3 504.0 977.2 295.6 529.1 719.4 377.4 273.0 746.7 698.8 236.2 19 20 Agency- and GSE-backed securities 680.6 52.2 158.7 222.1 436.5 621.3 440.9 221.4 462.3 250.0 186.7 20 21 Municipal securities 38.4 44.2 13.4 138.3 7.4 102.0 9.5 -44.6 -37.2 43.6 52.4 21 22 Corporate and foreign bonds -30.2 210.6 130.9 405.7 381.0 460.3 255.7 481.4 326.8 349.1 440.8 22 23 Depository institution loans n.e.c. -758.5 -92.2 146.6 186.1 186.1 107.8 219.0 162.4 255.2 313.1 333.1 23 24 Other loans and advances -463.8 -209.7 -30.9 38.7 133.4 31.4 254.5 122.9 124.8 90.0 213.3 24 25 Mortgages -66.7 -314.7 -153.7 -55.7 104.2 -112.0 130.0 245.5 153.3 38.8 197.9 25 26 Consumer credit -183.7 -136.7 -17.9 44.7 73.4 52.2 62.7 94.5 84.1 66.4 148.9 26
27 Corporate equities 155.0 84.6 -58.9 36.6 203.0 41.3 138.1 229.3 403.3 -103.1 138.5 27 28 Mutual fund shares 64.5 16.0 -57.1 -73.1 21.7 49.6 -3.8 39.8 1.4 8.0 17.8 28
29 Trade receivables -38.0 -8.6 -0.8 -1.6 -2.2 3.9 -5.1 0.4 -8.0 13.6 13.6 29 30 Security credit 30.3 81.4 -8.3 55.7 45.9 44.1 -29.6 55.0 114.0 -55.2 224.7 30
31 Life insurance reserves 2.8 8.2 7.7 14.7 10.8 9.7 5.8 9.4 18.3 10.4 11.2 31 32 U.S. direct investment abroad 40.7 -2.3 15.2 17.1 32.1 41.5 18.2 65.5 3.1 34.9 29.6 32 33 Miscellaneous assets 177.1 -1.3 514.6 335.8 949.7 1645.2 741.9 1036.1 375.7 1661.6 967.8 33
34 Net increase in liabilities -1307.8 28.7 2108.6 1707.6 3383.6 4222.5 2830.8 3480.7 3000.4 4122.1 3580.4 34
35 Net interbank liabilities -536.9 -142.8 820.5 -194.5 1111.6 1953.2 1896.2 516.4 80.5 1171.5 44.4 35
36 Checkable deposits and currency -7.9 266.3 234.5 267.7 332.6 268.7 192.5 126.2 743.1 183.4 569.5 36 37 Time and savings deposits 343.7 115.6 404.1 520.4 409.1 153.2 390.1 800.0 293.2 748.7 432.2 37 38 Money market fund shares -498.7 -503.2 -112.8 7.1 28.7 -133.4 81.9 270.1 -104.0 -85.2 -143.8 38 39 Federal funds and security repos -346.6 421.3 276.2 251.3 -477.1 -700.6 -657.6 -111.6 -438.8 257.1 281.0 39
40 Credit market instruments -1663.3 -899.8 -339.8 -417.6 213.7 -81.4 32.9 88.6 814.9 -295.2 352.9 40
41 Open market paper -448.1 -102.2 -68.2 -58.8 -48.9 -36.7 -35.4 -94.4 -29.2 -83.2 30.9 41 42 Agency- and GSE-backed securities -60.1 -46.9 -21.9 -22.4 239.9 164.0 246.8 194.6 354.2 -278.1 184.6 42 43 Corporate and foreign bonds -448.4 -544.3 -235.8 -223.5 -84.3 -282.7 -334.1 19.6 260.2 31.3 115.6 43 44 Depository institution loans n.e.c. -435.9 -62.5 32.6 -121.2 20.9 9.2 35.6 -75.5 114.4 6.1 -129.0 44 45 Other loans and advances -282.6 -144.7 -60.0 3.5 78.3 44.2 115.4 58.6 95.1 16.0 144.2 45 46 Mortgages 11.8 0.8 13.5 4.8 7.8 20.6 4.6 -14.3 20.2 12.6 6.5 46
47 Corporate equities 315.9 191.4 164.1 168.3 163.5 235.9 47.4 184.6 186.0 37.9 300.3 47 48 Mutual fund shares 497.1 370.1 338.4 624.9 638.8 970.8 492.2 674.9 417.2 696.1 734.4 48
49 Trade payables 48.9 -52.0 -3.8 -0.0 0.3 4.6 1.0 -9.3 4.9 1.0 12.0 49 50 Security credit -43.5 29.8 31.9 32.8 68.9 -26.2 193.5 0.2 108.1 221.9 17.6 50
51 Life insurance reserves 26.3 13.6 79.9 -12.2 29.8 11.5 28.0 45.8 33.8 64.6 16.5 51 52 Pension entitlements 397.6 595.8 499.2 497.9 494.9 447.9 441.4 499.2 591.3 514.8 570.3 52
53 Taxes payable 6.1 13.0 10.7 6.9 17.7 43.4 -68.3 36.3 59.3 46.9 28.0 53 54 Equity in noncorporate business 0.6 0.9 -2.9 6.7 -3.9 -5.4 0.9 -15.8 4.8 3.3 -1.2 54 55 Foreign direct investment in U.S. 45.7 48.5 43.4 4.5 28.7 40.9 21.1 16.8 36.0 18.4 18.3 55 56 Miscellaneous liabilities 193.4 -231.8 -238.5 -16.3 242.9 956.9 -433.0 541.0 -93.5 819.3 202.8 56
57 Discrepancy 140.0 230.8 112.7 -6.7 -96.6 -115.8 -252.1 -575.1 556.9 70.6 -18.9 57
(1) Sum of financial sectors shown on tables F.108 through F.130.
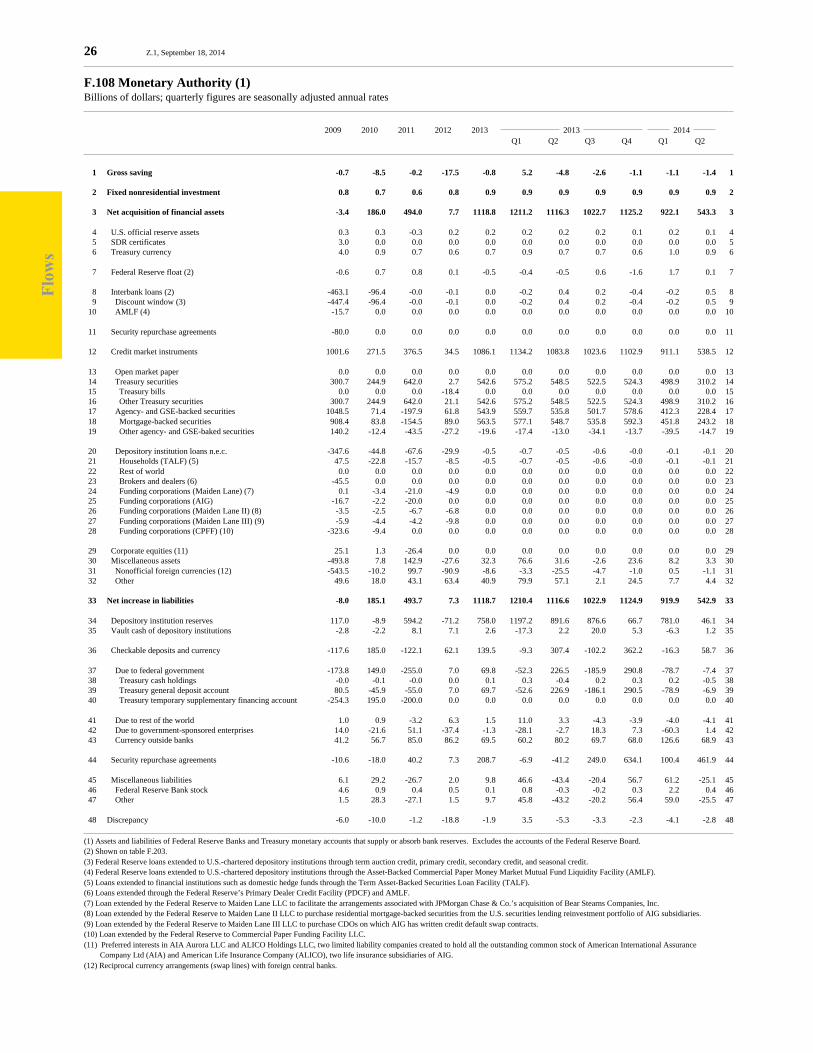
Flo
ws
26 Z.1, September 18, 2014
F.108 Monetary Authority (1)Billions of dollars; quarterly figures are seasonally adjusted annual rates
2009 2010 2011 2012 2013 2013 2014 Q1 Q2 Q3 Q4 Q1 Q2
1 Gross saving -0.7 -8.5 -0.2 -17.5 -0.8 5.2 -4.8 -2.6 -1.1 -1.1 -1.4 1
2 Fixed nonresidential investment 0.8 0.7 0.6 0.8 0.9 0.9 0.9 0.9 0.9 0.9 0.9 2
3 Net acquisition of financial assets -3.4 186.0 494.0 7.7 1118.8 1211.2 1116.3 1022.7 1125.2 922.1 543.3 3
4 U.S. official reserve assets 0.3 0.3 -0.3 0.2 0.2 0.2 0.2 0.2 0.1 0.2 0.1 4 5 SDR certificates 3.0 0.0 0.0 0.0 0.0 0.0 0.0 0.0 0.0 0.0 0.0 5 6 Treasury currency 4.0 0.9 0.7 0.6 0.7 0.9 0.7 0.7 0.6 1.0 0.9 6
7 Federal Reserve float (2) -0.6 0.7 0.8 0.1 -0.5 -0.4 -0.5 0.6 -1.6 1.7 0.1 7
8 Interbank loans (2) -463.1 -96.4 -0.0 -0.1 0.0 -0.2 0.4 0.2 -0.4 -0.2 0.5 8 9 Discount window (3) -447.4 -96.4 -0.0 -0.1 0.0 -0.2 0.4 0.2 -0.4 -0.2 0.5 9 10 AMLF (4) -15.7 0.0 0.0 0.0 0.0 0.0 0.0 0.0 0.0 0.0 0.0 10
11 Security repurchase agreements -80.0 0.0 0.0 0.0 0.0 0.0 0.0 0.0 0.0 0.0 0.0 11
12 Credit market instruments 1001.6 271.5 376.5 34.5 1086.1 1134.2 1083.8 1023.6 1102.9 911.1 538.5 12
13 Open market paper 0.0 0.0 0.0 0.0 0.0 0.0 0.0 0.0 0.0 0.0 0.0 13 14 Treasury securities 300.7 244.9 642.0 2.7 542.6 575.2 548.5 522.5 524.3 498.9 310.2 14 15 Treasury bills 0.0 0.0 0.0 -18.4 0.0 0.0 0.0 0.0 0.0 0.0 0.0 15 16 Other Treasury securities 300.7 244.9 642.0 21.1 542.6 575.2 548.5 522.5 524.3 498.9 310.2 16 17 Agency- and GSE-backed securities 1048.5 71.4 -197.9 61.8 543.9 559.7 535.8 501.7 578.6 412.3 228.4 17 18 Mortgage-backed securities 908.4 83.8 -154.5 89.0 563.5 577.1 548.7 535.8 592.3 451.8 243.2 18 19 Other agency- and GSE-baked securities 140.2 -12.4 -43.5 -27.2 -19.6 -17.4 -13.0 -34.1 -13.7 -39.5 -14.7 19
20 Depository institution loans n.e.c. -347.6 -44.8 -67.6 -29.9 -0.5 -0.7 -0.5 -0.6 -0.0 -0.1 -0.1 20 21 Households (TALF) (5) 47.5 -22.8 -15.7 -8.5 -0.5 -0.7 -0.5 -0.6 -0.0 -0.1 -0.1 21 22 Rest of world 0.0 0.0 0.0 0.0 0.0 0.0 0.0 0.0 0.0 0.0 0.0 22 23 Brokers and dealers (6) -45.5 0.0 0.0 0.0 0.0 0.0 0.0 0.0 0.0 0.0 0.0 23 24 Funding corporations (Maiden Lane) (7) 0.1 -3.4 -21.0 -4.9 0.0 0.0 0.0 0.0 0.0 0.0 0.0 24 25 Funding corporations (AIG) -16.7 -2.2 -20.0 0.0 0.0 0.0 0.0 0.0 0.0 0.0 0.0 25 26 Funding corporations (Maiden Lane II) (8) -3.5 -2.5 -6.7 -6.8 0.0 0.0 0.0 0.0 0.0 0.0 0.0 26 27 Funding corporations (Maiden Lane III) (9) -5.9 -4.4 -4.2 -9.8 0.0 0.0 0.0 0.0 0.0 0.0 0.0 27 28 Funding corporations (CPFF) (10) -323.6 -9.4 0.0 0.0 0.0 0.0 0.0 0.0 0.0 0.0 0.0 28
29 Corporate equities (11) 25.1 1.3 -26.4 0.0 0.0 0.0 0.0 0.0 0.0 0.0 0.0 29 30 Miscellaneous assets -493.8 7.8 142.9 -27.6 32.3 76.6 31.6 -2.6 23.6 8.2 3.3 30 31 Nonofficial foreign currencies (12) -543.5 -10.2 99.7 -90.9 -8.6 -3.3 -25.5 -4.7 -1.0 0.5 -1.1 31 32 Other 49.6 18.0 43.1 63.4 40.9 79.9 57.1 2.1 24.5 7.7 4.4 32
33 Net increase in liabilities -8.0 185.1 493.7 7.3 1118.7 1210.4 1116.6 1022.9 1124.9 919.9 542.9 33
34 Depository institution reserves 117.0 -8.9 594.2 -71.2 758.0 1197.2 891.6 876.6 66.7 781.0 46.1 34 35 Vault cash of depository institutions -2.8 -2.2 8.1 7.1 2.6 -17.3 2.2 20.0 5.3 -6.3 1.2 35
36 Checkable deposits and currency -117.6 185.0 -122.1 62.1 139.5 -9.3 307.4 -102.2 362.2 -16.3 58.7 36
37 Due to federal government -173.8 149.0 -255.0 7.0 69.8 -52.3 226.5 -185.9 290.8 -78.7 -7.4 37 38 Treasury cash holdings -0.0 -0.1 -0.0 0.0 0.1 0.3 -0.4 0.2 0.3 0.2 -0.5 38 39 Treasury general deposit account 80.5 -45.9 -55.0 7.0 69.7 -52.6 226.9 -186.1 290.5 -78.9 -6.9 39 40 Treasury temporary supplementary financing account -254.3 195.0 -200.0 0.0 0.0 0.0 0.0 0.0 0.0 0.0 0.0 40
41 Due to rest of the world 1.0 0.9 -3.2 6.3 1.5 11.0 3.3 -4.3 -3.9 -4.0 -4.1 41 42 Due to government-sponsored enterprises 14.0 -21.6 51.1 -37.4 -1.3 -28.1 -2.7 18.3 7.3 -60.3 1.4 42 43 Currency outside banks 41.2 56.7 85.0 86.2 69.5 60.2 80.2 69.7 68.0 126.6 68.9 43
44 Security repurchase agreements -10.6 -18.0 40.2 7.3 208.7 -6.9 -41.2 249.0 634.1 100.4 461.9 44
45 Miscellaneous liabilities 6.1 29.2 -26.7 2.0 9.8 46.6 -43.4 -20.4 56.7 61.2 -25.1 45 46 Federal Reserve Bank stock 4.6 0.9 0.4 0.5 0.1 0.8 -0.3 -0.2 0.3 2.2 0.4 46 47 Other 1.5 28.3 -27.1 1.5 9.7 45.8 -43.2 -20.2 56.4 59.0 -25.5 47
48 Discrepancy -6.0 -10.0 -1.2 -18.8 -1.9 3.5 -5.3 -3.3 -2.3 -4.1 -2.8 48
(1) Assets and liabilities of Federal Reserve Banks and Treasury monetary accounts that supply or absorb bank reserves. Excludes the accounts of the Federal Reserve Board.(2) Shown on table F.203.(3) Federal Reserve loans extended to U.S.-chartered depository institutions through term auction credit, primary credit, secondary credit, and seasonal credit.(4) Federal Reserve loans extended to U.S.-chartered depository institutions through the Asset-Backed Commercial Paper Money Market Mutual Fund Liquidity Facility (AMLF).(5) Loans extended to financial institutions such as domestic hedge funds through the Term Asset-Backed Securities Loan Facility (TALF).(6) Loans extended through the Federal Reserve’s Primary Dealer Credit Facility (PDCF) and AMLF.(7) Loan extended by the Federal Reserve to Maiden Lane LLC to facilitate the arrangements associated with JPMorgan Chase & Co.’s acquisition of Bear Stearns Companies, Inc.(8) Loan extended by the Federal Reserve to Maiden Lane II LLC to purchase residential mortgage-backed securities from the U.S. securities lending reinvestment portfolio of AIG subsidiaries.(9) Loan extended by the Federal Reserve to Maiden Lane III LLC to purchase CDOs on which AIG has written credit default swap contracts.(10) Loan extended by the Federal Reserve to Commercial Paper Funding Facility LLC.(11) Preferred interests in AIA Aurora LLC and ALICO Holdings LLC, two limited liability companies created to hold all the outstanding common stock of American International Assurance Company Ltd (AIA) and American Life Insurance Company (ALICO), two life insurance subsidiaries of AIG.(12) Reciprocal currency arrangements (swap lines) with foreign central banks.
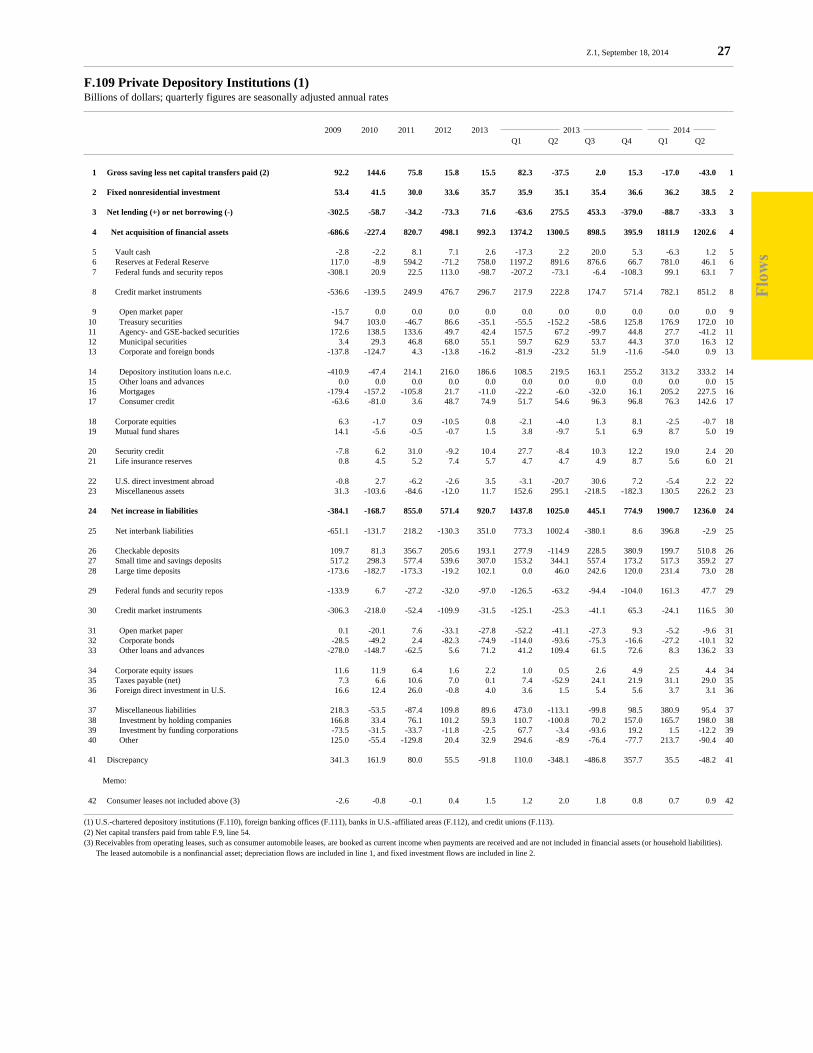
Flo
ws
Z.1, September 18, 2014 27
F.109 Private Depository Institutions (1)Billions of dollars; quarterly figures are seasonally adjusted annual rates
2009 2010 2011 2012 2013 2013 2014 Q1 Q2 Q3 Q4 Q1 Q2
1 Gross saving less net capital transfers paid (2) 92.2 144.6 75.8 15.8 15.5 82.3 -37.5 2.0 15.3 -17.0 -43.0 1
2 Fixed nonresidential investment 53.4 41.5 30.0 33.6 35.7 35.9 35.1 35.4 36.6 36.2 38.5 2
3 Net lending (+) or net borrowing (-) -302.5 -58.7 -34.2 -73.3 71.6 -63.6 275.5 453.3 -379.0 -88.7 -33.3 3
4 Net acquisition of financial assets -686.6 -227.4 820.7 498.1 992.3 1374.2 1300.5 898.5 395.9 1811.9 1202.6 4
5 Vault cash -2.8 -2.2 8.1 7.1 2.6 -17.3 2.2 20.0 5.3 -6.3 1.2 5 6 Reserves at Federal Reserve 117.0 -8.9 594.2 -71.2 758.0 1197.2 891.6 876.6 66.7 781.0 46.1 6 7 Federal funds and security repos -308.1 20.9 22.5 113.0 -98.7 -207.2 -73.1 -6.4 -108.3 99.1 63.1 7
8 Credit market instruments -536.6 -139.5 249.9 476.7 296.7 217.9 222.8 174.7 571.4 782.1 851.2 8
9 Open market paper -15.7 0.0 0.0 0.0 0.0 0.0 0.0 0.0 0.0 0.0 0.0 9 10 Treasury securities 94.7 103.0 -46.7 86.6 -35.1 -55.5 -152.2 -58.6 125.8 176.9 172.0 10 11 Agency- and GSE-backed securities 172.6 138.5 133.6 49.7 42.4 157.5 67.2 -99.7 44.8 27.7 -41.2 11 12 Municipal securities 3.4 29.3 46.8 68.0 55.1 59.7 62.9 53.7 44.3 37.0 16.3 12 13 Corporate and foreign bonds -137.8 -124.7 4.3 -13.8 -16.2 -81.9 -23.2 51.9 -11.6 -54.0 0.9 13
14 Depository institution loans n.e.c. -410.9 -47.4 214.1 216.0 186.6 108.5 219.5 163.1 255.2 313.2 333.2 14 15 Other loans and advances 0.0 0.0 0.0 0.0 0.0 0.0 0.0 0.0 0.0 0.0 0.0 15 16 Mortgages -179.4 -157.2 -105.8 21.7 -11.0 -22.2 -6.0 -32.0 16.1 205.2 227.5 16 17 Consumer credit -63.6 -81.0 3.6 48.7 74.9 51.7 54.6 96.3 96.8 76.3 142.6 17
18 Corporate equities 6.3 -1.7 0.9 -10.5 0.8 -2.1 -4.0 1.3 8.1 -2.5 -0.7 18 19 Mutual fund shares 14.1 -5.6 -0.5 -0.7 1.5 3.8 -9.7 5.1 6.9 8.7 5.0 19
20 Security credit -7.8 6.2 31.0 -9.2 10.4 27.7 -8.4 10.3 12.2 19.0 2.4 20 21 Life insurance reserves 0.8 4.5 5.2 7.4 5.7 4.7 4.7 4.9 8.7 5.6 6.0 21
22 U.S. direct investment abroad -0.8 2.7 -6.2 -2.6 3.5 -3.1 -20.7 30.6 7.2 -5.4 2.2 22 23 Miscellaneous assets 31.3 -103.6 -84.6 -12.0 11.7 152.6 295.1 -218.5 -182.3 130.5 226.2 23
24 Net increase in liabilities -384.1 -168.7 855.0 571.4 920.7 1437.8 1025.0 445.1 774.9 1900.7 1236.0 24
25 Net interbank liabilities -651.1 -131.7 218.2 -130.3 351.0 773.3 1002.4 -380.1 8.6 396.8 -2.9 25
26 Checkable deposits 109.7 81.3 356.7 205.6 193.1 277.9 -114.9 228.5 380.9 199.7 510.8 26 27 Small time and savings deposits 517.2 298.3 577.4 539.6 307.0 153.2 344.1 557.4 173.2 517.3 359.2 27 28 Large time deposits -173.6 -182.7 -173.3 -19.2 102.1 0.0 46.0 242.6 120.0 231.4 73.0 28
29 Federal funds and security repos -133.9 6.7 -27.2 -32.0 -97.0 -126.5 -63.2 -94.4 -104.0 161.3 47.7 29
30 Credit market instruments -306.3 -218.0 -52.4 -109.9 -31.5 -125.1 -25.3 -41.1 65.3 -24.1 116.5 30
31 Open market paper 0.1 -20.1 7.6 -33.1 -27.8 -52.2 -41.1 -27.3 9.3 -5.2 -9.6 31 32 Corporate bonds -28.5 -49.2 2.4 -82.3 -74.9 -114.0 -93.6 -75.3 -16.6 -27.2 -10.1 32 33 Other loans and advances -278.0 -148.7 -62.5 5.6 71.2 41.2 109.4 61.5 72.6 8.3 136.2 33
34 Corporate equity issues 11.6 11.9 6.4 1.6 2.2 1.0 0.5 2.6 4.9 2.5 4.4 34 35 Taxes payable (net) 7.3 6.6 10.6 7.0 0.1 7.4 -52.9 24.1 21.9 31.1 29.0 35 36 Foreign direct investment in U.S. 16.6 12.4 26.0 -0.8 4.0 3.6 1.5 5.4 5.6 3.7 3.1 36
37 Miscellaneous liabilities 218.3 -53.5 -87.4 109.8 89.6 473.0 -113.1 -99.8 98.5 380.9 95.4 37 38 Investment by holding companies 166.8 33.4 76.1 101.2 59.3 110.7 -100.8 70.2 157.0 165.7 198.0 38 39 Investment by funding corporations -73.5 -31.5 -33.7 -11.8 -2.5 67.7 -3.4 -93.6 19.2 1.5 -12.2 39 40 Other 125.0 -55.4 -129.8 20.4 32.9 294.6 -8.9 -76.4 -77.7 213.7 -90.4 40
41 Discrepancy 341.3 161.9 80.0 55.5 -91.8 110.0 -348.1 -486.8 357.7 35.5 -48.2 41
Memo:
42 Consumer leases not included above (3) -2.6 -0.8 -0.1 0.4 1.5 1.2 2.0 1.8 0.8 0.7 0.9 42
(1) U.S.-chartered depository institutions (F.110), foreign banking offices (F.111), banks in U.S.-affiliated areas (F.112), and credit unions (F.113).(2) Net capital transfers paid from table F.9, line 54.(3) Receivables from operating leases, such as consumer automobile leases, are booked as current income when payments are received and are not included in financial assets (or household liabilities). The leased automobile is a nonfinancial asset; depreciation flows are included in line 1, and fixed investment flows are included in line 2.
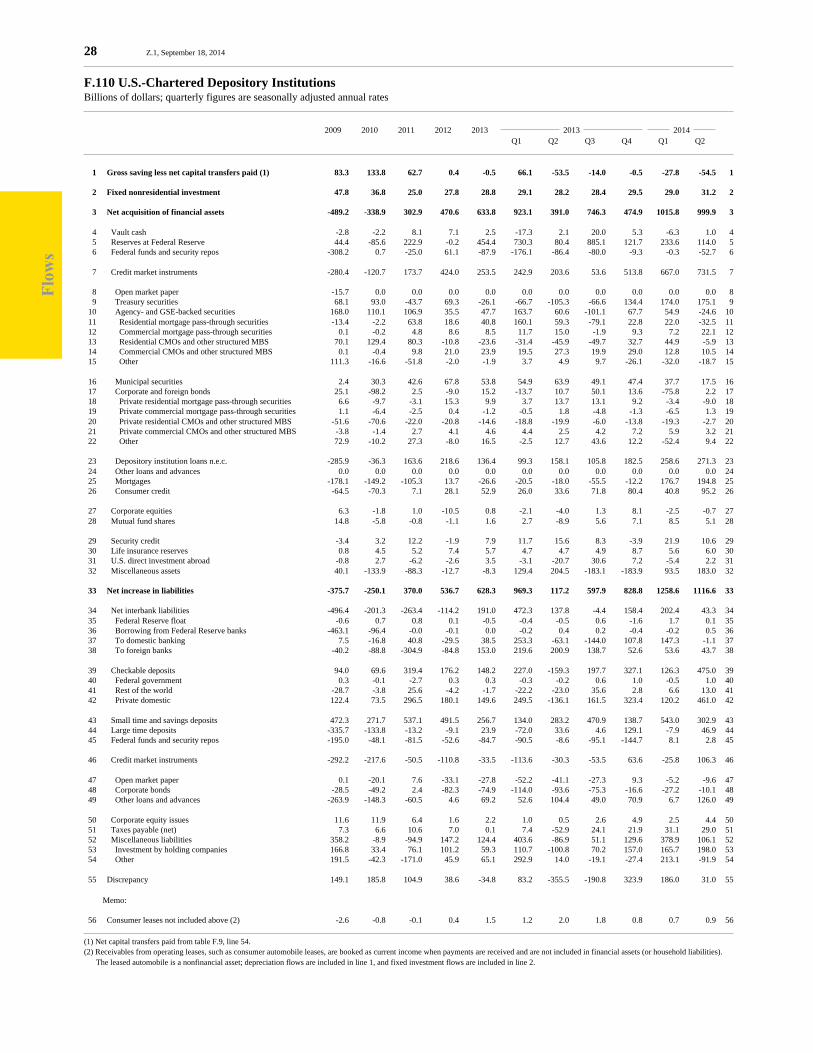
Flo
ws
28 Z.1, September 18, 2014
F.110 U.S.-Chartered Depository InstitutionsBillions of dollars; quarterly figures are seasonally adjusted annual rates
2009 2010 2011 2012 2013 2013 2014 Q1 Q2 Q3 Q4 Q1 Q2
1 Gross saving less net capital transfers paid (1) 83.3 133.8 62.7 0.4 -0.5 66.1 -53.5 -14.0 -0.5 -27.8 -54.5 1
2 Fixed nonresidential investment 47.8 36.8 25.0 27.8 28.8 29.1 28.2 28.4 29.5 29.0 31.2 2
3 Net acquisition of financial assets -489.2 -338.9 302.9 470.6 633.8 923.1 391.0 746.3 474.9 1015.8 999.9 3
4 Vault cash -2.8 -2.2 8.1 7.1 2.5 -17.3 2.1 20.0 5.3 -6.3 1.0 4 5 Reserves at Federal Reserve 44.4 -85.6 222.9 -0.2 454.4 730.3 80.4 885.1 121.7 233.6 114.0 5 6 Federal funds and security repos -308.2 0.7 -25.0 61.1 -87.9 -176.1 -86.4 -80.0 -9.3 -0.3 -52.7 6
7 Credit market instruments -280.4 -120.7 173.7 424.0 253.5 242.9 203.6 53.6 513.8 667.0 731.5 7
8 Open market paper -15.7 0.0 0.0 0.0 0.0 0.0 0.0 0.0 0.0 0.0 0.0 8 9 Treasury securities 68.1 93.0 -43.7 69.3 -26.1 -66.7 -105.3 -66.6 134.4 174.0 175.1 9 10 Agency- and GSE-backed securities 168.0 110.1 106.9 35.5 47.7 163.7 60.6 -101.1 67.7 54.9 -24.6 10 11 Residential mortgage pass-through securities -13.4 -2.2 63.8 18.6 40.8 160.1 59.3 -79.1 22.8 22.0 -32.5 11 12 Commercial mortgage pass-through securities 0.1 -0.2 4.8 8.6 8.5 11.7 15.0 -1.9 9.3 7.2 22.1 12 13 Residential CMOs and other structured MBS 70.1 129.4 80.3 -10.8 -23.6 -31.4 -45.9 -49.7 32.7 44.9 -5.9 13 14 Commercial CMOs and other structured MBS 0.1 -0.4 9.8 21.0 23.9 19.5 27.3 19.9 29.0 12.8 10.5 14 15 Other 111.3 -16.6 -51.8 -2.0 -1.9 3.7 4.9 9.7 -26.1 -32.0 -18.7 15
16 Municipal securities 2.4 30.3 42.6 67.8 53.8 54.9 63.9 49.1 47.4 37.7 17.5 16 17 Corporate and foreign bonds 25.1 -98.2 2.5 -9.0 15.2 -13.7 10.7 50.1 13.6 -75.8 2.2 17 18 Private residential mortgage pass-through securities 6.6 -9.7 -3.1 15.3 9.9 3.7 13.7 13.1 9.2 -3.4 -9.0 18 19 Private commercial mortgage pass-through securities 1.1 -6.4 -2.5 0.4 -1.2 -0.5 1.8 -4.8 -1.3 -6.5 1.3 19 20 Private residential CMOs and other structured MBS -51.6 -70.6 -22.0 -20.8 -14.6 -18.8 -19.9 -6.0 -13.8 -19.3 -2.7 20 21 Private commercial CMOs and other structured MBS -3.8 -1.4 2.7 4.1 4.6 4.4 2.5 4.2 7.2 5.9 3.2 21 22 Other 72.9 -10.2 27.3 -8.0 16.5 -2.5 12.7 43.6 12.2 -52.4 9.4 22
23 Depository institution loans n.e.c. -285.9 -36.3 163.6 218.6 136.4 99.3 158.1 105.8 182.5 258.6 271.3 23 24 Other loans and advances 0.0 0.0 0.0 0.0 0.0 0.0 0.0 0.0 0.0 0.0 0.0 24 25 Mortgages -178.1 -149.2 -105.3 13.7 -26.6 -20.5 -18.0 -55.5 -12.2 176.7 194.8 25 26 Consumer credit -64.5 -70.3 7.1 28.1 52.9 26.0 33.6 71.8 80.4 40.8 95.2 26
27 Corporate equities 6.3 -1.8 1.0 -10.5 0.8 -2.1 -4.0 1.3 8.1 -2.5 -0.7 27 28 Mutual fund shares 14.8 -5.8 -0.8 -1.1 1.6 2.7 -8.9 5.6 7.1 8.5 5.1 28
29 Security credit -3.4 3.2 12.2 -1.9 7.9 11.7 15.6 8.3 -3.9 21.9 10.6 29 30 Life insurance reserves 0.8 4.5 5.2 7.4 5.7 4.7 4.7 4.9 8.7 5.6 6.0 30 31 U.S. direct investment abroad -0.8 2.7 -6.2 -2.6 3.5 -3.1 -20.7 30.6 7.2 -5.4 2.2 31 32 Miscellaneous assets 40.1 -133.9 -88.3 -12.7 -8.3 129.4 204.5 -183.1 -183.9 93.5 183.0 32
33 Net increase in liabilities -375.7 -250.1 370.0 536.7 628.3 969.3 117.2 597.9 828.8 1258.6 1116.6 33
34 Net interbank liabilities -496.4 -201.3 -263.4 -114.2 191.0 472.3 137.8 -4.4 158.4 202.4 43.3 34 35 Federal Reserve float -0.6 0.7 0.8 0.1 -0.5 -0.4 -0.5 0.6 -1.6 1.7 0.1 35 36 Borrowing from Federal Reserve banks -463.1 -96.4 -0.0 -0.1 0.0 -0.2 0.4 0.2 -0.4 -0.2 0.5 36 37 To domestic banking 7.5 -16.8 40.8 -29.5 38.5 253.3 -63.1 -144.0 107.8 147.3 -1.1 37 38 To foreign banks -40.2 -88.8 -304.9 -84.8 153.0 219.6 200.9 138.7 52.6 53.6 43.7 38
39 Checkable deposits 94.0 69.6 319.4 176.2 148.2 227.0 -159.3 197.7 327.1 126.3 475.0 39 40 Federal government 0.3 -0.1 -2.7 0.3 0.3 -0.3 -0.2 0.6 1.0 -0.5 1.0 40 41 Rest of the world -28.7 -3.8 25.6 -4.2 -1.7 -22.2 -23.0 35.6 2.8 6.6 13.0 41 42 Private domestic 122.4 73.5 296.5 180.1 149.6 249.5 -136.1 161.5 323.4 120.2 461.0 42
43 Small time and savings deposits 472.3 271.7 537.1 491.5 256.7 134.0 283.2 470.9 138.7 543.0 302.9 43 44 Large time deposits -335.7 -133.8 -13.2 -9.1 23.9 -72.0 33.6 4.6 129.1 -7.9 46.9 44 45 Federal funds and security repos -195.0 -48.1 -81.5 -52.6 -84.7 -90.5 -8.6 -95.1 -144.7 8.1 2.8 45
46 Credit market instruments -292.2 -217.6 -50.5 -110.8 -33.5 -113.6 -30.3 -53.5 63.6 -25.8 106.3 46
47 Open market paper 0.1 -20.1 7.6 -33.1 -27.8 -52.2 -41.1 -27.3 9.3 -5.2 -9.6 47 48 Corporate bonds -28.5 -49.2 2.4 -82.3 -74.9 -114.0 -93.6 -75.3 -16.6 -27.2 -10.1 48 49 Other loans and advances -263.9 -148.3 -60.5 4.6 69.2 52.6 104.4 49.0 70.9 6.7 126.0 49
50 Corporate equity issues 11.6 11.9 6.4 1.6 2.2 1.0 0.5 2.6 4.9 2.5 4.4 50 51 Taxes payable (net) 7.3 6.6 10.6 7.0 0.1 7.4 -52.9 24.1 21.9 31.1 29.0 51 52 Miscellaneous liabilities 358.2 -8.9 -94.9 147.2 124.4 403.6 -86.9 51.1 129.6 378.9 106.1 52 53 Investment by holding companies 166.8 33.4 76.1 101.2 59.3 110.7 -100.8 70.2 157.0 165.7 198.0 53 54 Other 191.5 -42.3 -171.0 45.9 65.1 292.9 14.0 -19.1 -27.4 213.1 -91.9 54
55 Discrepancy 149.1 185.8 104.9 38.6 -34.8 83.2 -355.5 -190.8 323.9 186.0 31.0 55
Memo:
56 Consumer leases not included above (2) -2.6 -0.8 -0.1 0.4 1.5 1.2 2.0 1.8 0.8 0.7 0.9 56
(1) Net capital transfers paid from table F.9, line 54.(2) Receivables from operating leases, such as consumer automobile leases, are booked as current income when payments are received and are not included in financial assets (or household liabilities). The leased automobile is a nonfinancial asset; depreciation flows are included in line 1, and fixed investment flows are included in line 2.
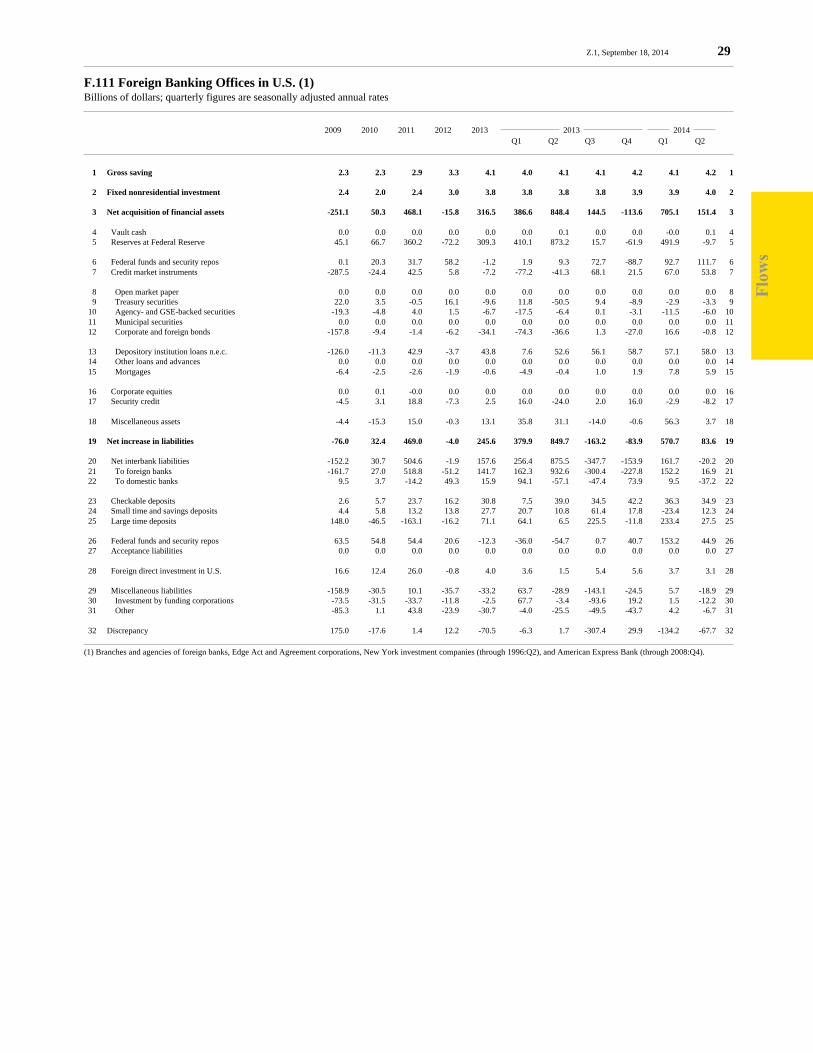
Flo
ws
Z.1, September 18, 2014 29
F.111 Foreign Banking Offices in U.S. (1)Billions of dollars; quarterly figures are seasonally adjusted annual rates
2009 2010 2011 2012 2013 2013 2014 Q1 Q2 Q3 Q4 Q1 Q2
1 Gross saving 2.3 2.3 2.9 3.3 4.1 4.0 4.1 4.1 4.2 4.1 4.2 1
2 Fixed nonresidential investment 2.4 2.0 2.4 3.0 3.8 3.8 3.8 3.8 3.9 3.9 4.0 2
3 Net acquisition of financial assets -251.1 50.3 468.1 -15.8 316.5 386.6 848.4 144.5 -113.6 705.1 151.4 3
4 Vault cash 0.0 0.0 0.0 0.0 0.0 0.0 0.1 0.0 0.0 -0.0 0.1 4 5 Reserves at Federal Reserve 45.1 66.7 360.2 -72.2 309.3 410.1 873.2 15.7 -61.9 491.9 -9.7 5
6 Federal funds and security repos 0.1 20.3 31.7 58.2 -1.2 1.9 9.3 72.7 -88.7 92.7 111.7 6 7 Credit market instruments -287.5 -24.4 42.5 5.8 -7.2 -77.2 -41.3 68.1 21.5 67.0 53.8 7
8 Open market paper 0.0 0.0 0.0 0.0 0.0 0.0 0.0 0.0 0.0 0.0 0.0 8 9 Treasury securities 22.0 3.5 -0.5 16.1 -9.6 11.8 -50.5 9.4 -8.9 -2.9 -3.3 9 10 Agency- and GSE-backed securities -19.3 -4.8 4.0 1.5 -6.7 -17.5 -6.4 0.1 -3.1 -11.5 -6.0 10 11 Municipal securities 0.0 0.0 0.0 0.0 0.0 0.0 0.0 0.0 0.0 0.0 0.0 11 12 Corporate and foreign bonds -157.8 -9.4 -1.4 -6.2 -34.1 -74.3 -36.6 1.3 -27.0 16.6 -0.8 12
13 Depository institution loans n.e.c. -126.0 -11.3 42.9 -3.7 43.8 7.6 52.6 56.1 58.7 57.1 58.0 13 14 Other loans and advances 0.0 0.0 0.0 0.0 0.0 0.0 0.0 0.0 0.0 0.0 0.0 14 15 Mortgages -6.4 -2.5 -2.6 -1.9 -0.6 -4.9 -0.4 1.0 1.9 7.8 5.9 15
16 Corporate equities 0.0 0.1 -0.0 0.0 0.0 0.0 0.0 0.0 0.0 0.0 0.0 16 17 Security credit -4.5 3.1 18.8 -7.3 2.5 16.0 -24.0 2.0 16.0 -2.9 -8.2 17
18 Miscellaneous assets -4.4 -15.3 15.0 -0.3 13.1 35.8 31.1 -14.0 -0.6 56.3 3.7 18
19 Net increase in liabilities -76.0 32.4 469.0 -4.0 245.6 379.9 849.7 -163.2 -83.9 570.7 83.6 19
20 Net interbank liabilities -152.2 30.7 504.6 -1.9 157.6 256.4 875.5 -347.7 -153.9 161.7 -20.2 20 21 To foreign banks -161.7 27.0 518.8 -51.2 141.7 162.3 932.6 -300.4 -227.8 152.2 16.9 21 22 To domestic banks 9.5 3.7 -14.2 49.3 15.9 94.1 -57.1 -47.4 73.9 9.5 -37.2 22
23 Checkable deposits 2.6 5.7 23.7 16.2 30.8 7.5 39.0 34.5 42.2 36.3 34.9 23 24 Small time and savings deposits 4.4 5.8 13.2 13.8 27.7 20.7 10.8 61.4 17.8 -23.4 12.3 24 25 Large time deposits 148.0 -46.5 -163.1 -16.2 71.1 64.1 6.5 225.5 -11.8 233.4 27.5 25
26 Federal funds and security repos 63.5 54.8 54.4 20.6 -12.3 -36.0 -54.7 0.7 40.7 153.2 44.9 26 27 Acceptance liabilities 0.0 0.0 0.0 0.0 0.0 0.0 0.0 0.0 0.0 0.0 0.0 27
28 Foreign direct investment in U.S. 16.6 12.4 26.0 -0.8 4.0 3.6 1.5 5.4 5.6 3.7 3.1 28
29 Miscellaneous liabilities -158.9 -30.5 10.1 -35.7 -33.2 63.7 -28.9 -143.1 -24.5 5.7 -18.9 29 30 Investment by funding corporations -73.5 -31.5 -33.7 -11.8 -2.5 67.7 -3.4 -93.6 19.2 1.5 -12.2 30 31 Other -85.3 1.1 43.8 -23.9 -30.7 -4.0 -25.5 -49.5 -43.7 4.2 -6.7 31
32 Discrepancy 175.0 -17.6 1.4 12.2 -70.5 -6.3 1.7 -307.4 29.9 -134.2 -67.7 32
(1) Branches and agencies of foreign banks, Edge Act and Agreement corporations, New York investment companies (through 1996:Q2), and American Express Bank (through 2008:Q4).
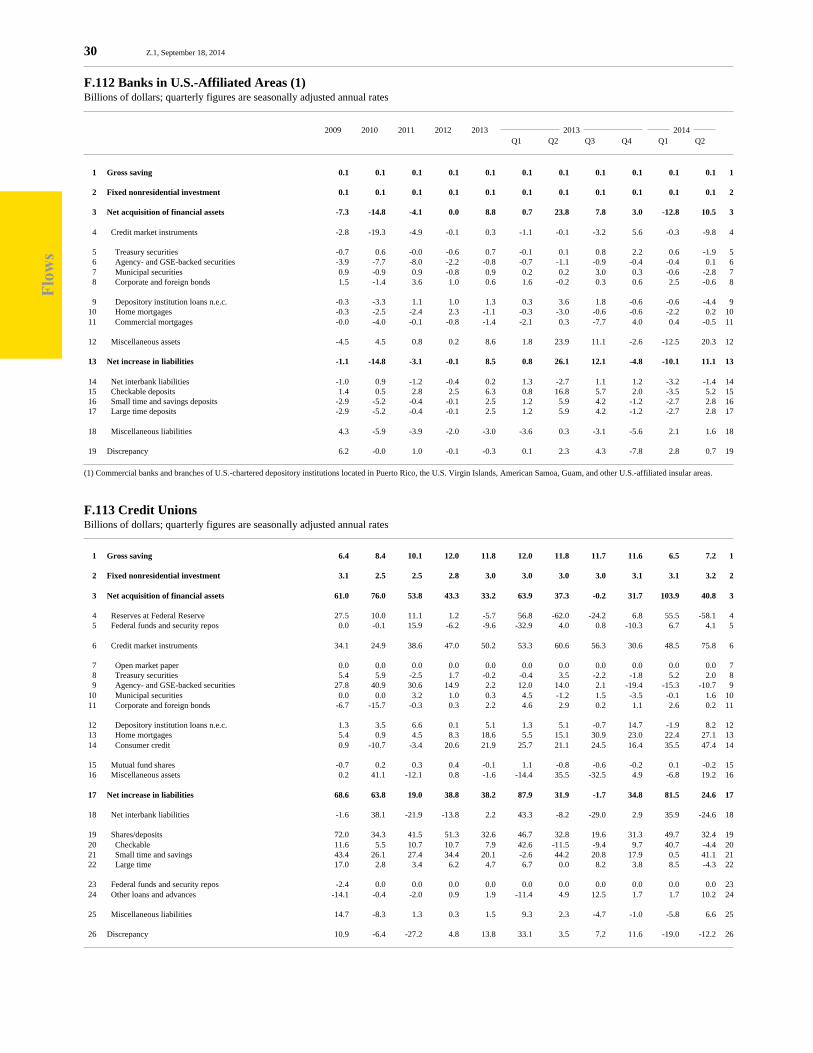
Flo
ws
30 Z.1, September 18, 2014
F.112 Banks in U.S.-Affiliated Areas (1)Billions of dollars; quarterly figures are seasonally adjusted annual rates
2009 2010 2011 2012 2013 2013 2014 Q1 Q2 Q3 Q4 Q1 Q2
1 Gross saving 0.1 0.1 0.1 0.1 0.1 0.1 0.1 0.1 0.1 0.1 0.1 1
2 Fixed nonresidential investment 0.1 0.1 0.1 0.1 0.1 0.1 0.1 0.1 0.1 0.1 0.1 2
3 Net acquisition of financial assets -7.3 -14.8 -4.1 0.0 8.8 0.7 23.8 7.8 3.0 -12.8 10.5 3
4 Credit market instruments -2.8 -19.3 -4.9 -0.1 0.3 -1.1 -0.1 -3.2 5.6 -0.3 -9.8 4
5 Treasury securities -0.7 0.6 -0.0 -0.6 0.7 -0.1 0.1 0.8 2.2 0.6 -1.9 5 6 Agency- and GSE-backed securities -3.9 -7.7 -8.0 -2.2 -0.8 -0.7 -1.1 -0.9 -0.4 -0.4 0.1 6 7 Municipal securities 0.9 -0.9 0.9 -0.8 0.9 0.2 0.2 3.0 0.3 -0.6 -2.8 7 8 Corporate and foreign bonds 1.5 -1.4 3.6 1.0 0.6 1.6 -0.2 0.3 0.6 2.5 -0.6 8
9 Depository institution loans n.e.c. -0.3 -3.3 1.1 1.0 1.3 0.3 3.6 1.8 -0.6 -0.6 -4.4 9 10 Home mortgages -0.3 -2.5 -2.4 2.3 -1.1 -0.3 -3.0 -0.6 -0.6 -2.2 0.2 10 11 Commercial mortgages -0.0 -4.0 -0.1 -0.8 -1.4 -2.1 0.3 -7.7 4.0 0.4 -0.5 11
12 Miscellaneous assets -4.5 4.5 0.8 0.2 8.6 1.8 23.9 11.1 -2.6 -12.5 20.3 12
13 Net increase in liabilities -1.1 -14.8 -3.1 -0.1 8.5 0.8 26.1 12.1 -4.8 -10.1 11.1 13
14 Net interbank liabilities -1.0 0.9 -1.2 -0.4 0.2 1.3 -2.7 1.1 1.2 -3.2 -1.4 14 15 Checkable deposits 1.4 0.5 2.8 2.5 6.3 0.8 16.8 5.7 2.0 -3.5 5.2 15 16 Small time and savings deposits -2.9 -5.2 -0.4 -0.1 2.5 1.2 5.9 4.2 -1.2 -2.7 2.8 16 17 Large time deposits -2.9 -5.2 -0.4 -0.1 2.5 1.2 5.9 4.2 -1.2 -2.7 2.8 17
18 Miscellaneous liabilities 4.3 -5.9 -3.9 -2.0 -3.0 -3.6 0.3 -3.1 -5.6 2.1 1.6 18
19 Discrepancy 6.2 -0.0 1.0 -0.1 -0.3 0.1 2.3 4.3 -7.8 2.8 0.7 19
(1) Commercial banks and branches of U.S.-chartered depository institutions located in Puerto Rico, the U.S. Virgin Islands, American Samoa, Guam, and other U.S.-affiliated insular areas.
F.113 Credit UnionsBillions of dollars; quarterly figures are seasonally adjusted annual rates
1 Gross saving 6.4 8.4 10.1 12.0 11.8 12.0 11.8 11.7 11.6 6.5 7.2 1
2 Fixed nonresidential investment 3.1 2.5 2.5 2.8 3.0 3.0 3.0 3.0 3.1 3.1 3.2 2
3 Net acquisition of financial assets 61.0 76.0 53.8 43.3 33.2 63.9 37.3 -0.2 31.7 103.9 40.8 3
4 Reserves at Federal Reserve 27.5 10.0 11.1 1.2 -5.7 56.8 -62.0 -24.2 6.8 55.5 -58.1 4 5 Federal funds and security repos 0.0 -0.1 15.9 -6.2 -9.6 -32.9 4.0 0.8 -10.3 6.7 4.1 5
6 Credit market instruments 34.1 24.9 38.6 47.0 50.2 53.3 60.6 56.3 30.6 48.5 75.8 6
7 Open market paper 0.0 0.0 0.0 0.0 0.0 0.0 0.0 0.0 0.0 0.0 0.0 7 8 Treasury securities 5.4 5.9 -2.5 1.7 -0.2 -0.4 3.5 -2.2 -1.8 5.2 2.0 8 9 Agency- and GSE-backed securities 27.8 40.9 30.6 14.9 2.2 12.0 14.0 2.1 -19.4 -15.3 -10.7 9 10 Municipal securities 0.0 0.0 3.2 1.0 0.3 4.5 -1.2 1.5 -3.5 -0.1 1.6 10 11 Corporate and foreign bonds -6.7 -15.7 -0.3 0.3 2.2 4.6 2.9 0.2 1.1 2.6 0.2 11
12 Depository institution loans n.e.c. 1.3 3.5 6.6 0.1 5.1 1.3 5.1 -0.7 14.7 -1.9 8.2 12 13 Home mortgages 5.4 0.9 4.5 8.3 18.6 5.5 15.1 30.9 23.0 22.4 27.1 13 14 Consumer credit 0.9 -10.7 -3.4 20.6 21.9 25.7 21.1 24.5 16.4 35.5 47.4 14
15 Mutual fund shares -0.7 0.2 0.3 0.4 -0.1 1.1 -0.8 -0.6 -0.2 0.1 -0.2 15 16 Miscellaneous assets 0.2 41.1 -12.1 0.8 -1.6 -14.4 35.5 -32.5 4.9 -6.8 19.2 16
17 Net increase in liabilities 68.6 63.8 19.0 38.8 38.2 87.9 31.9 -1.7 34.8 81.5 24.6 17
18 Net interbank liabilities -1.6 38.1 -21.9 -13.8 2.2 43.3 -8.2 -29.0 2.9 35.9 -24.6 18
19 Shares/deposits 72.0 34.3 41.5 51.3 32.6 46.7 32.8 19.6 31.3 49.7 32.4 19 20 Checkable 11.6 5.5 10.7 10.7 7.9 42.6 -11.5 -9.4 9.7 40.7 -4.4 20 21 Small time and savings 43.4 26.1 27.4 34.4 20.1 -2.6 44.2 20.8 17.9 0.5 41.1 21 22 Large time 17.0 2.8 3.4 6.2 4.7 6.7 0.0 8.2 3.8 8.5 -4.3 22
23 Federal funds and security repos -2.4 0.0 0.0 0.0 0.0 0.0 0.0 0.0 0.0 0.0 0.0 23 24 Other loans and advances -14.1 -0.4 -2.0 0.9 1.9 -11.4 4.9 12.5 1.7 1.7 10.2 24
25 Miscellaneous liabilities 14.7 -8.3 1.3 0.3 1.5 9.3 2.3 -4.7 -1.0 -5.8 6.6 25
26 Discrepancy 10.9 -6.4 -27.2 4.8 13.8 33.1 3.5 7.2 11.6 -19.0 -12.2 26
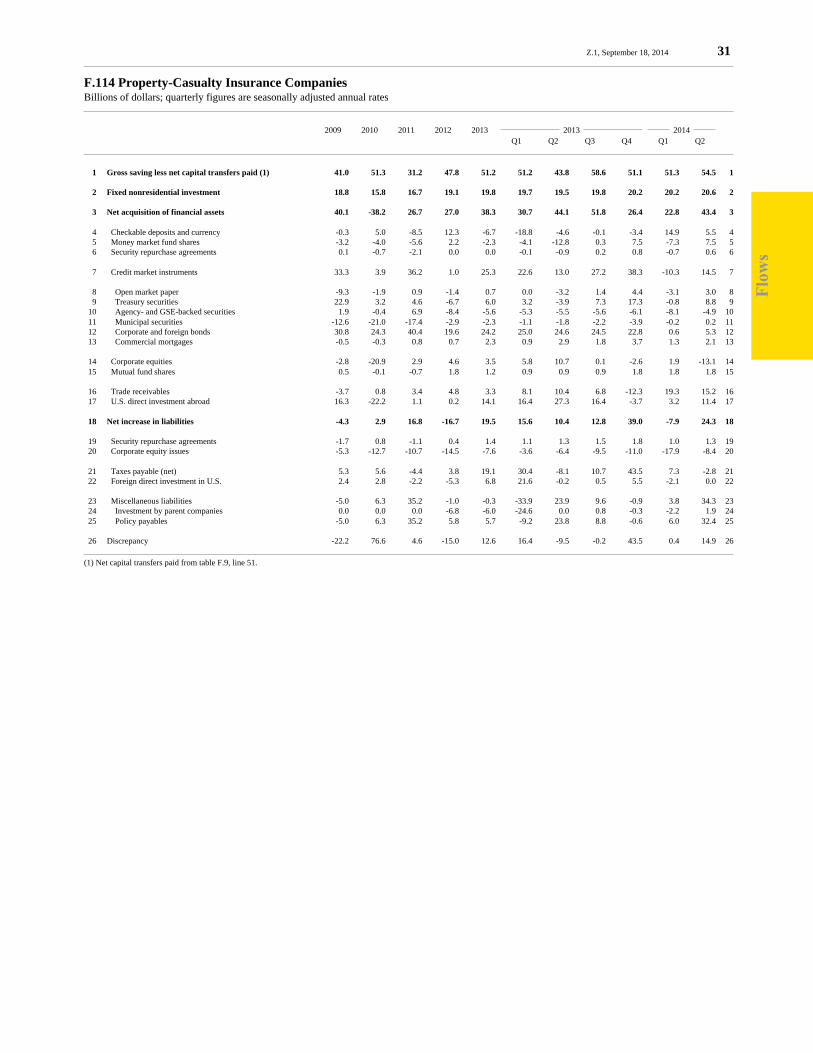
Flo
ws
Z.1, September 18, 2014 31
F.114 Property-Casualty Insurance CompaniesBillions of dollars; quarterly figures are seasonally adjusted annual rates
2009 2010 2011 2012 2013 2013 2014 Q1 Q2 Q3 Q4 Q1 Q2
1 Gross saving less net capital transfers paid (1) 41.0 51.3 31.2 47.8 51.2 51.2 43.8 58.6 51.1 51.3 54.5 1
2 Fixed nonresidential investment 18.8 15.8 16.7 19.1 19.8 19.7 19.5 19.8 20.2 20.2 20.6 2
3 Net acquisition of financial assets 40.1 -38.2 26.7 27.0 38.3 30.7 44.1 51.8 26.4 22.8 43.4 3
4 Checkable deposits and currency -0.3 5.0 -8.5 12.3 -6.7 -18.8 -4.6 -0.1 -3.4 14.9 5.5 4 5 Money market fund shares -3.2 -4.0 -5.6 2.2 -2.3 -4.1 -12.8 0.3 7.5 -7.3 7.5 5 6 Security repurchase agreements 0.1 -0.7 -2.1 0.0 0.0 -0.1 -0.9 0.2 0.8 -0.7 0.6 6
7 Credit market instruments 33.3 3.9 36.2 1.0 25.3 22.6 13.0 27.2 38.3 -10.3 14.5 7
8 Open market paper -9.3 -1.9 0.9 -1.4 0.7 0.0 -3.2 1.4 4.4 -3.1 3.0 8 9 Treasury securities 22.9 3.2 4.6 -6.7 6.0 3.2 -3.9 7.3 17.3 -0.8 8.8 9 10 Agency- and GSE-backed securities 1.9 -0.4 6.9 -8.4 -5.6 -5.3 -5.5 -5.6 -6.1 -8.1 -4.9 10 11 Municipal securities -12.6 -21.0 -17.4 -2.9 -2.3 -1.1 -1.8 -2.2 -3.9 -0.2 0.2 11 12 Corporate and foreign bonds 30.8 24.3 40.4 19.6 24.2 25.0 24.6 24.5 22.8 0.6 5.3 12 13 Commercial mortgages -0.5 -0.3 0.8 0.7 2.3 0.9 2.9 1.8 3.7 1.3 2.1 13
14 Corporate equities -2.8 -20.9 2.9 4.6 3.5 5.8 10.7 0.1 -2.6 1.9 -13.1 14 15 Mutual fund shares 0.5 -0.1 -0.7 1.8 1.2 0.9 0.9 0.9 1.8 1.8 1.8 15
16 Trade receivables -3.7 0.8 3.4 4.8 3.3 8.1 10.4 6.8 -12.3 19.3 15.2 16 17 U.S. direct investment abroad 16.3 -22.2 1.1 0.2 14.1 16.4 27.3 16.4 -3.7 3.2 11.4 17
18 Net increase in liabilities -4.3 2.9 16.8 -16.7 19.5 15.6 10.4 12.8 39.0 -7.9 24.3 18
19 Security repurchase agreements -1.7 0.8 -1.1 0.4 1.4 1.1 1.3 1.5 1.8 1.0 1.3 19 20 Corporate equity issues -5.3 -12.7 -10.7 -14.5 -7.6 -3.6 -6.4 -9.5 -11.0 -17.9 -8.4 20
21 Taxes payable (net) 5.3 5.6 -4.4 3.8 19.1 30.4 -8.1 10.7 43.5 7.3 -2.8 21 22 Foreign direct investment in U.S. 2.4 2.8 -2.2 -5.3 6.8 21.6 -0.2 0.5 5.5 -2.1 0.0 22
23 Miscellaneous liabilities -5.0 6.3 35.2 -1.0 -0.3 -33.9 23.9 9.6 -0.9 3.8 34.3 23 24 Investment by parent companies 0.0 0.0 0.0 -6.8 -6.0 -24.6 0.0 0.8 -0.3 -2.2 1.9 24 25 Policy payables -5.0 6.3 35.2 5.8 5.7 -9.2 23.8 8.8 -0.6 6.0 32.4 25
26 Discrepancy -22.2 76.6 4.6 -15.0 12.6 16.4 -9.5 -0.2 43.5 0.4 14.9 26
(1) Net capital transfers paid from table F.9, line 51.

Flo
ws
32 Z.1, September 18, 2014
F.115 Life Insurance Companies (1)Billions of dollars; quarterly figures are seasonally adjusted annual rates
2009 2010 2011 2012 2013 2013 2014 Q1 Q2 Q3 Q4 Q1 Q2
1 Gross saving 13.0 16.2 7.2 12.6 7.6 19.3 12.1 4.2 -5.2 16.9 17.6 1
2 Fixed nonresidential investment 13.5 11.5 12.3 14.0 14.6 14.5 14.4 14.6 14.9 14.9 15.2 2
3 Net acquisition of financial assets 116.4 181.5 229.0 127.0 102.7 96.9 21.4 115.9 176.4 225.0 200.6 3
4 Checkable deposits and currency -32.1 1.0 2.0 2.7 -9.2 -0.2 -43.4 31.9 -25.3 11.7 -8.2 4 5 Money market fund shares -5.5 -12.7 7.9 -1.4 -5.9 -27.4 -6.2 10.0 0.1 -5.4 -5.6 5 6 Security repurchase agreements 2.2 0.7 -0.8 -1.6 -0.0 -6.9 -0.5 5.4 2.0 -6.2 -1.9 6
7 Credit market instruments 139.8 151.6 125.3 74.3 77.4 54.4 79.4 51.2 124.4 133.4 101.2 7
8 Open market paper 11.5 -8.9 -11.2 13.9 3.2 -9.7 -4.5 5.3 21.5 7.1 -12.8 8 9 Treasury securities 27.7 23.2 18.8 5.5 -12.2 -19.3 -11.7 -8.9 -9.1 5.9 4.4 9 10 Agency- and GSE-backed securities 5.8 4.0 -1.6 -13.5 -6.8 -5.5 -5.6 -11.2 -5.0 -10.0 -11.4 10 11 Municipal securities 26.1 39.2 9.4 9.7 10.1 10.5 10.6 8.1 11.3 9.1 11.6 11 12 Corporate and foreign bonds 97.6 102.9 87.1 45.0 60.8 76.1 68.1 29.0 70.2 99.9 86.9 12 13 Other loans and advances -12.6 -0.2 7.9 1.8 3.5 -3.3 6.9 3.5 7.0 8.0 6.3 13 14 Mortgages -16.3 -8.6 15.0 11.9 18.8 5.6 15.7 25.3 28.5 13.4 16.3 14
15 Corporate equities 33.4 45.6 37.7 15.3 13.4 2.8 19.2 -2.8 34.5 31.3 37.3 15 16 Mutual fund shares 0.0 1.0 1.1 1.3 1.4 1.3 1.4 1.4 1.4 1.4 1.4 16
17 U.S. direct investment abroad 1.6 1.9 3.3 5.2 1.2 0.1 4.1 -0.5 1.0 -0.3 -4.3 17
18 Miscellaneous assets -23.1 -7.6 52.4 31.2 24.4 72.7 -32.5 19.3 38.1 59.1 80.6 18 19 Equity in FHLB -0.3 -0.0 -0.8 0.1 1.0 -0.4 0.1 0.6 3.7 0.2 0.6 19 20 Deferred and unpaid life ins. premiums -4.9 2.7 -0.4 0.6 3.0 4.1 7.4 -3.7 4.2 4.1 5.3 20 21 Other -17.8 -10.2 53.6 30.6 20.4 69.1 -40.0 22.4 30.3 54.7 74.7 21
22 Net increase in liabilities 32.2 145.0 203.7 90.4 87.1 74.4 27.3 122.5 124.4 181.6 170.0 22
23 Security repurchase agreements -0.5 -2.2 0.1 3.1 -0.8 0.5 0.6 -1.8 -2.5 0.8 -0.5 23 24 Corporate equity issues -0.9 -4.8 -11.5 -9.9 -9.2 -6.6 -9.7 -10.7 -9.6 -14.3 -11.7 24 25 Other loans and advances -6.6 -3.2 1.8 4.8 7.8 5.2 6.5 -2.9 22.5 7.7 8.0 25
26 Life insurance reserves 26.3 13.6 79.9 -12.2 29.8 11.5 28.0 45.8 33.8 64.6 16.5 26 27 Pension entitlements (2) -79.6 72.5 85.2 80.3 38.1 77.6 25.7 26.1 23.1 70.7 65.4 27
28 Taxes payable (net) -7.0 2.6 5.2 -4.6 -2.3 -0.6 -6.7 0.0 -1.8 5.0 -1.0 28 29 Foreign direct investment in U.S. 11.1 6.3 -5.4 1.4 5.1 6.4 10.4 6.8 -3.3 5.8 13.1 29
30 Miscellaneous liabilities 89.5 60.2 48.5 27.5 18.6 -19.6 -27.3 59.1 62.2 41.3 79.9 30 31 Investment by parent companies 9.3 22.2 9.3 10.3 3.4 0.9 -0.6 21.2 -8.1 0.9 2.3 31 32 Other reserves (3) 8.4 17.1 14.8 -1.8 0.4 -5.8 -1.2 14.4 -5.7 15.0 12.7 32 33 Unallocated insurance contracts 113.9 13.4 10.4 -1.7 16.9 -34.1 6.5 43.8 51.4 22.4 35.3 33 34 Other -42.1 7.4 14.0 20.7 -2.1 19.5 -32.0 -20.4 24.7 2.9 29.5 34
35 Discrepancy -84.7 -31.8 -30.3 -38.0 -22.5 -17.7 3.6 -3.8 -72.1 -41.5 -28.2 35
(1) Additional detail on the financial assets and liabilities held in life insurer’s general and separate accounts is available on tables F.115.g and F.115.s.(2) Annuity reserves held by life insurance companies, excluding unallocated contracts held by pension funds, which are shown on line 33.(3) Includes reserves for accident and health policies, policy dividend accumulation, and contract claims.

Flo
ws
Z.1, September 18, 2014 33
F.116 Private and Public Pension Funds (1)Billions of dollars; quarterly figures are seasonally adjusted annual rates
2009 2010 2011 2012 2013 2013 2014 Q1 Q2 Q3 Q4 Q1 Q2
1 Gross saving 0.1 0.0 0.0 0.1 0.1 0.1 0.1 0.1 0.1 0.1 0.1 1
2 Fixed nonresidential investment 0.0 0.0 0.0 0.1 0.1 0.1 0.1 0.1 0.1 0.1 0.1 2
3 Net acquisition of financial assets (2) 477.2 523.2 414.0 417.5 456.7 370.2 415.6 473.0 568.2 444.1 504.8 3
4 Checkable deposits and currency -3.1 2.7 6.0 -1.4 0.8 1.7 4.0 -1.1 -1.4 -0.6 6.7 4 5 Time and savings deposits 3.8 4.7 4.1 -4.5 7.7 5.9 1.6 3.7 19.6 -13.6 5.9 5
6 Money market fund shares -13.0 -7.9 15.5 -20.6 11.0 21.1 0.4 -1.8 24.5 -23.4 15.9 6 7 Security repurchase agreements 0.1 0.1 0.1 -0.5 0.6 0.4 0.1 0.2 1.7 -1.2 0.5 7
8 Credit market instruments -66.1 153.8 113.6 170.0 122.1 54.9 161.5 -329.0 601.0 59.7 124.0 8
9 Open market paper 0.9 2.5 4.5 -6.2 5.5 9.8 0.9 -0.7 11.8 -9.8 4.8 9 10 Treasury securities 65.0 52.0 62.0 75.6 61.8 55.6 38.7 -349.5 502.3 47.9 38.8 10 11 Agency- and GSE-backed securities -10.3 8.0 17.3 44.5 27.0 26.8 42.8 18.7 19.8 0.9 20.6 11
12 Corporate and foreign bonds -116.6 88.2 35.1 56.2 33.5 -31.4 83.1 8.3 74.2 14.9 52.6 12 13 Mortgages -5.2 2.4 -4.7 0.5 -6.0 -5.6 -5.3 -5.6 -7.5 6.7 7.2 13
14 Corporate equities -81.0 -50.4 -118.0 -68.7 -147.2 -109.0 -109.5 -157.8 -212.5 -198.7 -176.7 14 15 Mutual fund shares 49.9 20.8 -57.1 -75.5 17.7 43.6 3.6 32.4 -8.7 -3.9 9.6 15
16 Miscellaneous assets 586.6 399.4 449.8 418.8 444.0 351.6 353.9 926.4 144.0 625.7 518.9 16 17 Unallocated insurance contracts (3) 113.9 13.4 10.4 -1.7 16.9 -34.1 6.5 43.8 51.4 22.4 35.3 17 18 Contributions receivable -8.6 15.4 3.0 -12.3 -0.6 1.3 0.3 -0.9 -3.0 -0.8 1.9 18 19 Nonmarketable Treasury securities (4) 61.9 65.7 70.8 40.4 98.2 172.5 -308.1 -63.5 592.0 74.9 52.6 19 20 Claims of pension fund on sponsor (5) 402.2 274.9 320.6 358.8 295.3 217.0 611.8 886.1 -533.5 436.4 334.0 20 21 Other 17.2 29.9 45.1 33.6 34.1 -5.0 43.3 61.0 37.1 92.8 95.1 21
22 Pension entitlements (liabilities) (6) 477.2 523.2 414.0 417.6 456.8 370.3 415.7 473.0 568.2 444.1 504.9 22
Memo:
23 Household retirement assets (7) 547.5 628.1 462.4 577.8 349.4 45.1 311.1 732.1 309.0 627.3 ND 23 24 Defined benefit plans 348.8 352.4 351.8 321.9 311.6 300.3 304.6 313.7 328.0 326.8 327.5 24 25 Defined contribution plans 128.4 170.8 62.2 95.6 145.1 70.0 111.0 159.3 240.2 117.3 177.4 25 26 Individual retirement plans (IRAs) (8) 136.5 51.8 -26.6 94.2 -136.8 -396.7 -125.1 242.2 -267.8 125.0 ND 26 27 Annuities at life insurance companies (9) -66.1 53.2 75.0 66.1 29.4 71.6 20.6 17.0 8.6 58.2 ND 27
(1) Private pension funds, state and local government employee retirement funds, and federal government employee retirement funds defined benefit plans and defined contribution plans.(2) Includes claims on sponsor (i.e., unfunded pension entitlements).(3) Assets of pension plans held at life insurance companies; series begins 1985:Q4.(4) Nonmarketable government securities held by the civil service retirement and disability fund, Railroad Retirement Board, judicial retirement fund, military retirement fund, and foreign service retirement and disability fund.(5) Unfunded defined benefit pension entitlements.(6) Actuarial value of accrued pension entitlements in defined benefit plans and assets of defined contribution plans. These liabilities are assets of the household sector.(7) Households’ retirement assets in tax-deferred accounts, including employer sponsored pension plans, IRAs, Roth IRAs, and annuities.(8) IRA assets are not included above. See table L.226.i for a sectoral distribution of IRA accounts.(9) Annuities held in IRAs at life insurance companies are excluded. They are included in line 26.
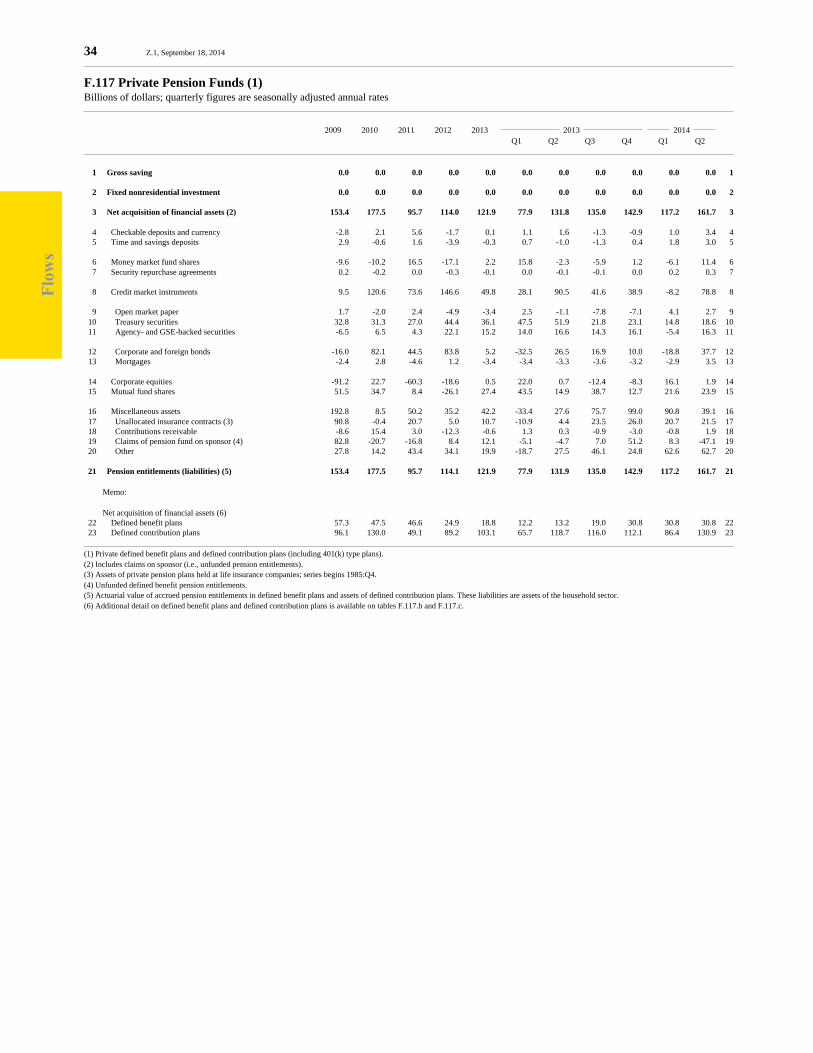
Flo
ws
34 Z.1, September 18, 2014
F.117 Private Pension Funds (1)Billions of dollars; quarterly figures are seasonally adjusted annual rates
2009 2010 2011 2012 2013 2013 2014 Q1 Q2 Q3 Q4 Q1 Q2
1 Gross saving 0.0 0.0 0.0 0.0 0.0 0.0 0.0 0.0 0.0 0.0 0.0 1
2 Fixed nonresidential investment 0.0 0.0 0.0 0.0 0.0 0.0 0.0 0.0 0.0 0.0 0.0 2
3 Net acquisition of financial assets (2) 153.4 177.5 95.7 114.0 121.9 77.9 131.8 135.0 142.9 117.2 161.7 3
4 Checkable deposits and currency -2.8 2.1 5.6 -1.7 0.1 1.1 1.6 -1.3 -0.9 1.0 3.4 4 5 Time and savings deposits 2.9 -0.6 1.6 -3.9 -0.3 0.7 -1.0 -1.3 0.4 1.8 3.0 5
6 Money market fund shares -9.6 -10.2 16.5 -17.1 2.2 15.8 -2.3 -5.9 1.2 -6.1 11.4 6 7 Security repurchase agreements 0.2 -0.2 0.0 -0.3 -0.1 0.0 -0.1 -0.1 0.0 0.2 0.3 7
8 Credit market instruments 9.5 120.6 73.6 146.6 49.8 28.1 90.5 41.6 38.9 -8.2 78.8 8
9 Open market paper 1.7 -2.0 2.4 -4.9 -3.4 2.5 -1.1 -7.8 -7.1 4.1 2.7 9 10 Treasury securities 32.8 31.3 27.0 44.4 36.1 47.5 51.9 21.8 23.1 14.8 18.6 10 11 Agency- and GSE-backed securities -6.5 6.5 4.3 22.1 15.2 14.0 16.6 14.3 16.1 -5.4 16.3 11
12 Corporate and foreign bonds -16.0 82.1 44.5 83.8 5.2 -32.5 26.5 16.9 10.0 -18.8 37.7 12 13 Mortgages -2.4 2.8 -4.6 1.2 -3.4 -3.4 -3.3 -3.6 -3.2 -2.9 3.5 13
14 Corporate equities -91.2 22.7 -60.3 -18.6 0.5 22.0 0.7 -12.4 -8.3 16.1 1.9 14 15 Mutual fund shares 51.5 34.7 8.4 -26.1 27.4 43.5 14.9 38.7 12.7 21.6 23.9 15
16 Miscellaneous assets 192.8 8.5 50.2 35.2 42.2 -33.4 27.6 75.7 99.0 90.8 39.1 16 17 Unallocated insurance contracts (3) 90.8 -0.4 20.7 5.0 10.7 -10.9 4.4 23.5 26.0 20.7 21.5 17 18 Contributions receivable -8.6 15.4 3.0 -12.3 -0.6 1.3 0.3 -0.9 -3.0 -0.8 1.9 18 19 Claims of pension fund on sponsor (4) 82.8 -20.7 -16.8 8.4 12.1 -5.1 -4.7 7.0 51.2 8.3 -47.1 19 20 Other 27.8 14.2 43.4 34.1 19.9 -18.7 27.5 46.1 24.8 62.6 62.7 20
21 Pension entitlements (liabilities) (5) 153.4 177.5 95.7 114.1 121.9 77.9 131.9 135.0 142.9 117.2 161.7 21
Memo:
Net acquisition of financial assets (6) 22 Defined benefit plans 57.3 47.5 46.6 24.9 18.8 12.2 13.2 19.0 30.8 30.8 30.8 22 23 Defined contribution plans 96.1 130.0 49.1 89.2 103.1 65.7 118.7 116.0 112.1 86.4 130.9 23
(1) Private defined benefit plans and defined contribution plans (including 401(k) type plans).(2) Includes claims on sponsor (i.e., unfunded pension entitlements).(3) Assets of private pension plans held at life insurance companies; series begins 1985:Q4.(4) Unfunded defined benefit pension entitlements.(5) Actuarial value of accrued pension entitlements in defined benefit plans and assets of defined contribution plans. These liabilities are assets of the household sector.(6) Additional detail on defined benefit plans and defined contribution plans is available on tables F.117.b and F.117.c.
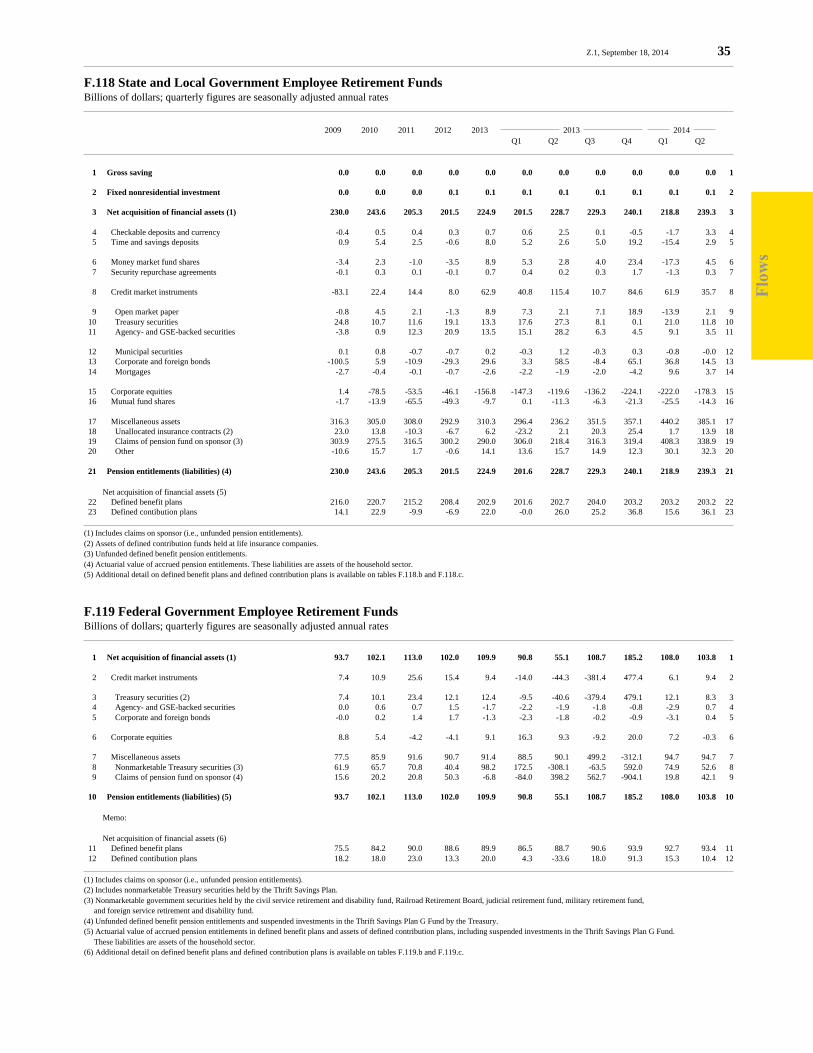
Flo
ws
Z.1, September 18, 2014 35
F.118 State and Local Government Employee Retirement FundsBillions of dollars; quarterly figures are seasonally adjusted annual rates
2009 2010 2011 2012 2013 2013 2014 Q1 Q2 Q3 Q4 Q1 Q2
1 Gross saving 0.0 0.0 0.0 0.0 0.0 0.0 0.0 0.0 0.0 0.0 0.0 1
2 Fixed nonresidential investment 0.0 0.0 0.0 0.1 0.1 0.1 0.1 0.1 0.1 0.1 0.1 2
3 Net acquisition of financial assets (1) 230.0 243.6 205.3 201.5 224.9 201.5 228.7 229.3 240.1 218.8 239.3 3
4 Checkable deposits and currency -0.4 0.5 0.4 0.3 0.7 0.6 2.5 0.1 -0.5 -1.7 3.3 4 5 Time and savings deposits 0.9 5.4 2.5 -0.6 8.0 5.2 2.6 5.0 19.2 -15.4 2.9 5
6 Money market fund shares -3.4 2.3 -1.0 -3.5 8.9 5.3 2.8 4.0 23.4 -17.3 4.5 6 7 Security repurchase agreements -0.1 0.3 0.1 -0.1 0.7 0.4 0.2 0.3 1.7 -1.3 0.3 7
8 Credit market instruments -83.1 22.4 14.4 8.0 62.9 40.8 115.4 10.7 84.6 61.9 35.7 8
9 Open market paper -0.8 4.5 2.1 -1.3 8.9 7.3 2.1 7.1 18.9 -13.9 2.1 9 10 Treasury securities 24.8 10.7 11.6 19.1 13.3 17.6 27.3 8.1 0.1 21.0 11.8 10 11 Agency- and GSE-backed securities -3.8 0.9 12.3 20.9 13.5 15.1 28.2 6.3 4.5 9.1 3.5 11
12 Municipal securities 0.1 0.8 -0.7 -0.7 0.2 -0.3 1.2 -0.3 0.3 -0.8 -0.0 12 13 Corporate and foreign bonds -100.5 5.9 -10.9 -29.3 29.6 3.3 58.5 -8.4 65.1 36.8 14.5 13 14 Mortgages -2.7 -0.4 -0.1 -0.7 -2.6 -2.2 -1.9 -2.0 -4.2 9.6 3.7 14
15 Corporate equities 1.4 -78.5 -53.5 -46.1 -156.8 -147.3 -119.6 -136.2 -224.1 -222.0 -178.3 15 16 Mutual fund shares -1.7 -13.9 -65.5 -49.3 -9.7 0.1 -11.3 -6.3 -21.3 -25.5 -14.3 16
17 Miscellaneous assets 316.3 305.0 308.0 292.9 310.3 296.4 236.2 351.5 357.1 440.2 385.1 17 18 Unallocated insurance contracts (2) 23.0 13.8 -10.3 -6.7 6.2 -23.2 2.1 20.3 25.4 1.7 13.9 18 19 Claims of pension fund on sponsor (3) 303.9 275.5 316.5 300.2 290.0 306.0 218.4 316.3 319.4 408.3 338.9 19 20 Other -10.6 15.7 1.7 -0.6 14.1 13.6 15.7 14.9 12.3 30.1 32.3 20
21 Pension entitlements (liabilities) (4) 230.0 243.6 205.3 201.5 224.9 201.6 228.7 229.3 240.1 218.9 239.3 21
Net acquisition of financial assets (5) 22 Defined benefit plans 216.0 220.7 215.2 208.4 202.9 201.6 202.7 204.0 203.2 203.2 203.2 22 23 Defined contibution plans 14.1 22.9 -9.9 -6.9 22.0 -0.0 26.0 25.2 36.8 15.6 36.1 23
(1) Includes claims on sponsor (i.e., unfunded pension entitlements).(2) Assets of defined contribution funds held at life insurance companies.(3) Unfunded defined benefit pension entitlements.(4) Actuarial value of accrued pension entitlements. These liabilities are assets of the household sector.(5) Additional detail on defined benefit plans and defined contribution plans is available on tables F.118.b and F.118.c.
F.119 Federal Government Employee Retirement FundsBillions of dollars; quarterly figures are seasonally adjusted annual rates
1 Net acquisition of financial assets (1) 93.7 102.1 113.0 102.0 109.9 90.8 55.1 108.7 185.2 108.0 103.8 1
2 Credit market instruments 7.4 10.9 25.6 15.4 9.4 -14.0 -44.3 -381.4 477.4 6.1 9.4 2
3 Treasury securities (2) 7.4 10.1 23.4 12.1 12.4 -9.5 -40.6 -379.4 479.1 12.1 8.3 3 4 Agency- and GSE-backed securities 0.0 0.6 0.7 1.5 -1.7 -2.2 -1.9 -1.8 -0.8 -2.9 0.7 4 5 Corporate and foreign bonds -0.0 0.2 1.4 1.7 -1.3 -2.3 -1.8 -0.2 -0.9 -3.1 0.4 5
6 Corporate equities 8.8 5.4 -4.2 -4.1 9.1 16.3 9.3 -9.2 20.0 7.2 -0.3 6
7 Miscellaneous assets 77.5 85.9 91.6 90.7 91.4 88.5 90.1 499.2 -312.1 94.7 94.7 7 8 Nonmarketable Treasury securities (3) 61.9 65.7 70.8 40.4 98.2 172.5 -308.1 -63.5 592.0 74.9 52.6 8 9 Claims of pension fund on sponsor (4) 15.6 20.2 20.8 50.3 -6.8 -84.0 398.2 562.7 -904.1 19.8 42.1 9
10 Pension entitlements (liabilities) (5) 93.7 102.1 113.0 102.0 109.9 90.8 55.1 108.7 185.2 108.0 103.8 10
Memo:
Net acquisition of financial assets (6) 11 Defined benefit plans 75.5 84.2 90.0 88.6 89.9 86.5 88.7 90.6 93.9 92.7 93.4 11 12 Defined contibution plans 18.2 18.0 23.0 13.3 20.0 4.3 -33.6 18.0 91.3 15.3 10.4 12
(1) Includes claims on sponsor (i.e., unfunded pension entitlements).(2) Includes nonmarketable Treasury securities held by the Thrift Savings Plan.(3) Nonmarketable government securities held by the civil service retirement and disability fund, Railroad Retirement Board, judicial retirement fund, military retirement fund, and foreign service retirement and disability fund.(4) Unfunded defined benefit pension entitlements and suspended investments in the Thrift Savings Plan G Fund by the Treasury.(5) Actuarial value of accrued pension entitlements in defined benefit plans and assets of defined contribution plans, including suspended investments in the Thrift Savings Plan G Fund. These liabilities are assets of the household sector.(6) Additional detail on defined benefit plans and defined contribution plans is available on tables F.119.b and F.119.c.
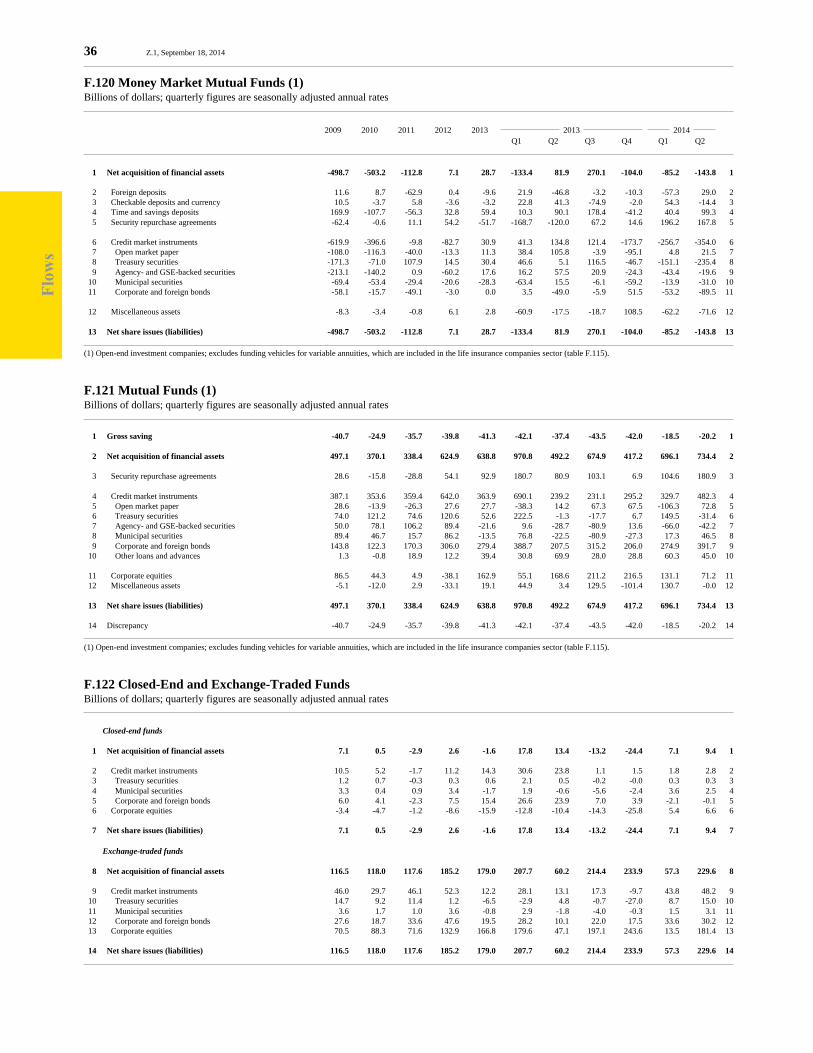
Flo
ws
36 Z.1, September 18, 2014
F.120 Money Market Mutual Funds (1)Billions of dollars; quarterly figures are seasonally adjusted annual rates
2009 2010 2011 2012 2013 2013 2014 Q1 Q2 Q3 Q4 Q1 Q2
1 Net acquisition of financial assets -498.7 -503.2 -112.8 7.1 28.7 -133.4 81.9 270.1 -104.0 -85.2 -143.8 1
2 Foreign deposits 11.6 8.7 -62.9 0.4 -9.6 21.9 -46.8 -3.2 -10.3 -57.3 29.0 2 3 Checkable deposits and currency 10.5 -3.7 5.8 -3.6 -3.2 22.8 41.3 -74.9 -2.0 54.3 -14.4 3 4 Time and savings deposits 169.9 -107.7 -56.3 32.8 59.4 10.3 90.1 178.4 -41.2 40.4 99.3 4 5 Security repurchase agreements -62.4 -0.6 11.1 54.2 -51.7 -168.7 -120.0 67.2 14.6 196.2 167.8 5
6 Credit market instruments -619.9 -396.6 -9.8 -82.7 30.9 41.3 134.8 121.4 -173.7 -256.7 -354.0 6 7 Open market paper -108.0 -116.3 -40.0 -13.3 11.3 38.4 105.8 -3.9 -95.1 4.8 21.5 7 8 Treasury securities -171.3 -71.0 107.9 14.5 30.4 46.6 5.1 116.5 -46.7 -151.1 -235.4 8 9 Agency- and GSE-backed securities -213.1 -140.2 0.9 -60.2 17.6 16.2 57.5 20.9 -24.3 -43.4 -19.6 9 10 Municipal securities -69.4 -53.4 -29.4 -20.6 -28.3 -63.4 15.5 -6.1 -59.2 -13.9 -31.0 10 11 Corporate and foreign bonds -58.1 -15.7 -49.1 -3.0 0.0 3.5 -49.0 -5.9 51.5 -53.2 -89.5 11
12 Miscellaneous assets -8.3 -3.4 -0.8 6.1 2.8 -60.9 -17.5 -18.7 108.5 -62.2 -71.6 12
13 Net share issues (liabilities) -498.7 -503.2 -112.8 7.1 28.7 -133.4 81.9 270.1 -104.0 -85.2 -143.8 13
(1) Open-end investment companies; excludes funding vehicles for variable annuities, which are included in the life insurance companies sector (table F.115).
F.121 Mutual Funds (1)Billions of dollars; quarterly figures are seasonally adjusted annual rates
1 Gross saving -40.7 -24.9 -35.7 -39.8 -41.3 -42.1 -37.4 -43.5 -42.0 -18.5 -20.2 1
2 Net acquisition of financial assets 497.1 370.1 338.4 624.9 638.8 970.8 492.2 674.9 417.2 696.1 734.4 2
3 Security repurchase agreements 28.6 -15.8 -28.8 54.1 92.9 180.7 80.9 103.1 6.9 104.6 180.9 3
4 Credit market instruments 387.1 353.6 359.4 642.0 363.9 690.1 239.2 231.1 295.2 329.7 482.3 4 5 Open market paper 28.6 -13.9 -26.3 27.6 27.7 -38.3 14.2 67.3 67.5 -106.3 72.8 5 6 Treasury securities 74.0 121.2 74.6 120.6 52.6 222.5 -1.3 -17.7 6.7 149.5 -31.4 6 7 Agency- and GSE-backed securities 50.0 78.1 106.2 89.4 -21.6 9.6 -28.7 -80.9 13.6 -66.0 -42.2 7 8 Municipal securities 89.4 46.7 15.7 86.2 -13.5 76.8 -22.5 -80.9 -27.3 17.3 46.5 8 9 Corporate and foreign bonds 143.8 122.3 170.3 306.0 279.4 388.7 207.5 315.2 206.0 274.9 391.7 9 10 Other loans and advances 1.3 -0.8 18.9 12.2 39.4 30.8 69.9 28.0 28.8 60.3 45.0 10
11 Corporate equities 86.5 44.3 4.9 -38.1 162.9 55.1 168.6 211.2 216.5 131.1 71.2 11 12 Miscellaneous assets -5.1 -12.0 2.9 -33.1 19.1 44.9 3.4 129.5 -101.4 130.7 -0.0 12
13 Net share issues (liabilities) 497.1 370.1 338.4 624.9 638.8 970.8 492.2 674.9 417.2 696.1 734.4 13
14 Discrepancy -40.7 -24.9 -35.7 -39.8 -41.3 -42.1 -37.4 -43.5 -42.0 -18.5 -20.2 14
(1) Open-end investment companies; excludes funding vehicles for variable annuities, which are included in the life insurance companies sector (table F.115).
F.122 Closed-End and Exchange-Traded FundsBillions of dollars; quarterly figures are seasonally adjusted annual rates
Closed-end funds
1 Net acquisition of financial assets 7.1 0.5 -2.9 2.6 -1.6 17.8 13.4 -13.2 -24.4 7.1 9.4 1
2 Credit market instruments 10.5 5.2 -1.7 11.2 14.3 30.6 23.8 1.1 1.5 1.8 2.8 2 3 Treasury securities 1.2 0.7 -0.3 0.3 0.6 2.1 0.5 -0.2 -0.0 0.3 0.3 3 4 Municipal securities 3.3 0.4 0.9 3.4 -1.7 1.9 -0.6 -5.6 -2.4 3.6 2.5 4 5 Corporate and foreign bonds 6.0 4.1 -2.3 7.5 15.4 26.6 23.9 7.0 3.9 -2.1 -0.1 5 6 Corporate equities -3.4 -4.7 -1.2 -8.6 -15.9 -12.8 -10.4 -14.3 -25.8 5.4 6.6 6
7 Net share issues (liabilities) 7.1 0.5 -2.9 2.6 -1.6 17.8 13.4 -13.2 -24.4 7.1 9.4 7
Exchange-traded funds
8 Net acquisition of financial assets 116.5 118.0 117.6 185.2 179.0 207.7 60.2 214.4 233.9 57.3 229.6 8
9 Credit market instruments 46.0 29.7 46.1 52.3 12.2 28.1 13.1 17.3 -9.7 43.8 48.2 9 10 Treasury securities 14.7 9.2 11.4 1.2 -6.5 -2.9 4.8 -0.7 -27.0 8.7 15.0 10 11 Municipal securities 3.6 1.7 1.0 3.6 -0.8 2.9 -1.8 -4.0 -0.3 1.5 3.1 11 12 Corporate and foreign bonds 27.6 18.7 33.6 47.6 19.5 28.2 10.1 22.0 17.5 33.6 30.2 12 13 Corporate equities 70.5 88.3 71.6 132.9 166.8 179.6 47.1 197.1 243.6 13.5 181.4 13
14 Net share issues (liabilities) 116.5 118.0 117.6 185.2 179.0 207.7 60.2 214.4 233.9 57.3 229.6 14

Flo
ws
Z.1, September 18, 2014 37
F.123 Government-Sponsored Enterprises (1)Billions of dollars; quarterly figures are seasonally adjusted annual rates
2009 2010 2011 2012 2013 2013 2014 Q1 Q2 Q3 Q4 Q1 Q2
1 Gross saving 9.6 10.5 8.8 8.4 8.5 9.4 7.8 8.9 7.8 5.3 5.8 1
2 Fixed nonresidential investment 1.1 3.7 3.4 3.5 3.8 3.8 3.8 3.8 3.9 3.9 4.0 2
3 Net acquisition of financial assets -360.8 -274.1 -205.7 -176.0 104.4 171.0 -57.0 224.2 79.6 -477.0 135.1 3
4 Checkable deposits and currency 11.1 -36.0 9.3 -20.1 29.0 46.1 -49.5 102.5 17.0 -144.7 15.6 4 5 Time and savings deposits -42.8 0.3 -12.7 -9.1 1.1 -2.7 4.8 10.8 -8.5 10.3 -8.1 5 6 Federal funds and security repos 7.5 20.7 -38.9 38.6 1.5 171.1 -169.3 -71.4 75.5 -100.1 28.2 6
7 Credit market instruments -337.8 -288.4 -163.2 -189.4 59.8 -104.9 157.8 185.8 0.6 -188.3 102.1 7
8 Open market paper 3.0 0.2 -3.4 -3.1 1.0 3.1 0.5 3.0 -2.5 1.3 3.6 8 9 Treasury securities 19.9 45.9 17.6 -31.2 -9.9 22.3 3.6 28.5 -94.1 24.4 -2.8 9 10 Agency- and GSE-backed securities -27.4 -85.1 -18.1 -48.3 -22.7 -39.9 -32.5 8.7 -27.2 -17.2 8.1 10
11 Municipal securities -2.2 -4.2 -3.9 -4.1 -3.5 -2.6 -5.9 -4.1 -1.4 -3.0 -2.1 11 12 Corporate and foreign bonds -48.6 -29.6 -30.8 -50.0 -59.4 -22.9 -45.2 -118.3 -51.2 -24.8 -42.9 12
13 Other loans and advances -284.8 -144.7 -64.2 18.6 81.9 27.9 127.2 61.4 110.9 11.6 157.7 13 14 Sallie Mae 0.0 0.0 0.0 0.0 0.0 0.0 0.0 0.0 0.0 0.0 0.0 14 15 Farm Credit System -0.2 7.2 -3.5 8.3 2.9 -18.5 11.4 2.8 15.9 -4.4 13.5 15 16 FHLB loans -284.6 -151.9 -60.7 10.3 79.0 46.4 115.8 58.6 95.1 16.0 144.2 16
17 Mortgages 2.4 -71.0 -60.5 -71.4 72.5 -92.7 110.2 206.5 66.0 -180.6 -19.6 17 18 Home -23.2 -76.4 -66.5 -82.5 92.8 -79.9 123.6 230.2 97.4 -165.3 -4.2 18 19 Consolidated trusts (2) 0.0 -192.7 -72.5 -44.9 148.0 62.9 160.5 238.1 130.4 -66.0 23.8 19 20 Other -23.2 116.3 5.9 -37.6 -55.1 -142.8 -36.9 -7.9 -33.0 -99.3 -28.0 20 21 Multifamily residential 14.2 2.0 2.8 6.2 -21.9 -14.1 -15.4 -25.1 -33.2 -18.5 -18.4 21 22 Consolidated trusts (2) 0.0 25.3 24.5 27.5 18.9 26.2 21.2 10.6 17.5 10.3 8.9 22 23 Other 14.2 -23.3 -21.7 -21.3 -40.8 -40.3 -36.6 -35.7 -50.7 -28.7 -27.2 23 24 Farm 11.4 3.4 3.3 4.9 1.6 1.4 2.0 1.4 1.8 3.1 3.0 24 25 Consumer credit (3) 0.0 0.0 0.0 0.0 0.0 0.0 0.0 0.0 0.0 0.0 0.0 25
26 Miscellaneous assets 1.2 29.3 -0.1 4.1 13.1 61.3 -0.8 -3.5 -4.8 -54.1 -2.7 26
27 Net increase in liabilities -360.2 -237.8 -208.1 -146.6 100.5 35.1 132.9 34.5 199.5 -375.1 156.1 27
28 Federal funds and security repos -0.1 0.1 -0.9 -0.4 0.0 0.9 -0.8 -0.1 0.0 0.1 -0.1 28
29 Credit market instruments -518.4 -233.8 -187.2 -154.6 107.5 43.1 136.7 40.2 210.1 -355.5 156.9 29
30 GSE issues (4) -518.4 -233.8 -187.2 -154.6 107.5 43.1 136.7 40.2 210.1 -355.5 156.9 30 31 Consolidated trusts (2) 0.0 -167.4 -48.0 -17.4 166.8 89.1 181.7 248.7 147.8 -55.7 32.7 31 32 Other -518.4 -66.4 -139.2 -137.2 -59.3 -45.9 -45.0 -208.5 62.3 -299.8 124.2 32 33 U.S. government loans 0.0 0.0 0.0 0.0 0.0 0.0 0.0 0.0 0.0 0.0 0.0 33
34 Corporate equities 96.0 38.1 29.2 14.5 2.4 7.8 -10.7 3.3 9.2 -5.9 0.0 34
35 Miscellaneous liabilities 62.3 -42.2 -49.2 -6.1 -9.4 -16.7 7.7 -8.9 -19.8 -13.8 -0.7 35
36 Discrepancy 9.1 43.0 3.0 34.3 0.7 -130.3 193.9 -184.7 123.7 103.2 22.8 36
(1) Federal Home Loan Banks, Fannie Mae, Freddie Mac, Farmer Mac, Farm Credit System, the Financing Corporation, and the Resolution Funding Corporation. The Student Loan Marketing Association (Sallie Mae) was included until it was fully privatized in 2004:Q4. Beginning 2010:Q1, almost all Fannie Mae and Freddie Mac mortgage pools (table F.124) are consolidated on Fannie Mae’s and Freddie Mac’s balance sheets.(2) Consolidated trusts refers to the unpaid balance of securitized mortgages Fannie Mae and Freddie Mac moved on to their balance sheets at the beginning of 2010 in response to new accounting rules.(3) Sallie Mae student loans.(4) Such issues are classified as agency- and GSE-backed securities.
F.124 Agency- and GSE-Backed Mortgage Pools (1)Billions of dollars; quarterly figures are seasonally adjusted annual rates
1 Net acquisition of financial assets 458.3 186.9 165.3 132.2 132.4 120.9 110.1 154.4 144.1 77.4 27.8 1
2 Home mortgages 445.6 175.8 148.0 105.0 98.8 92.0 72.6 119.7 111.1 57.9 5.6 2 3 Multifamily residential mortgages 13.0 11.3 19.4 27.0 33.7 29.1 37.7 34.8 33.2 19.7 22.3 3 4 Commercial mortgages 0.0 0.0 0.0 0.0 0.0 0.0 0.0 0.0 0.0 0.0 0.0 4 5 Farm mortgages -0.2 -0.2 -2.1 0.3 -0.2 -0.2 -0.1 -0.1 -0.2 -0.1 -0.1 5
6 Net increase in pool securities (liabilities)(2) 458.3 186.9 165.3 132.2 132.4 120.9 110.1 154.4 144.1 77.4 27.8 6
(1) GNMA, Fannie Mae, Freddie Mac, Farmer Mac, and Farmers Home Administration pools. Beginning 2010:Q1, almost all Fannie Mae and Freddie Mac mortgage pools are consolidated on Fannie Mae’s and Freddie Mac’s balance sheets (table F.123). Also includes agency- and GSE-backed mortgage pool securities that are used as collateral for agency- and GSE-backed CMOs and privately issued CMOs. Excludes Federal Financing Bank holdings of pool securities, which are included with federal government mortgages and other loans.(2) Such issues are classified as agency- and GSE-backed securities.
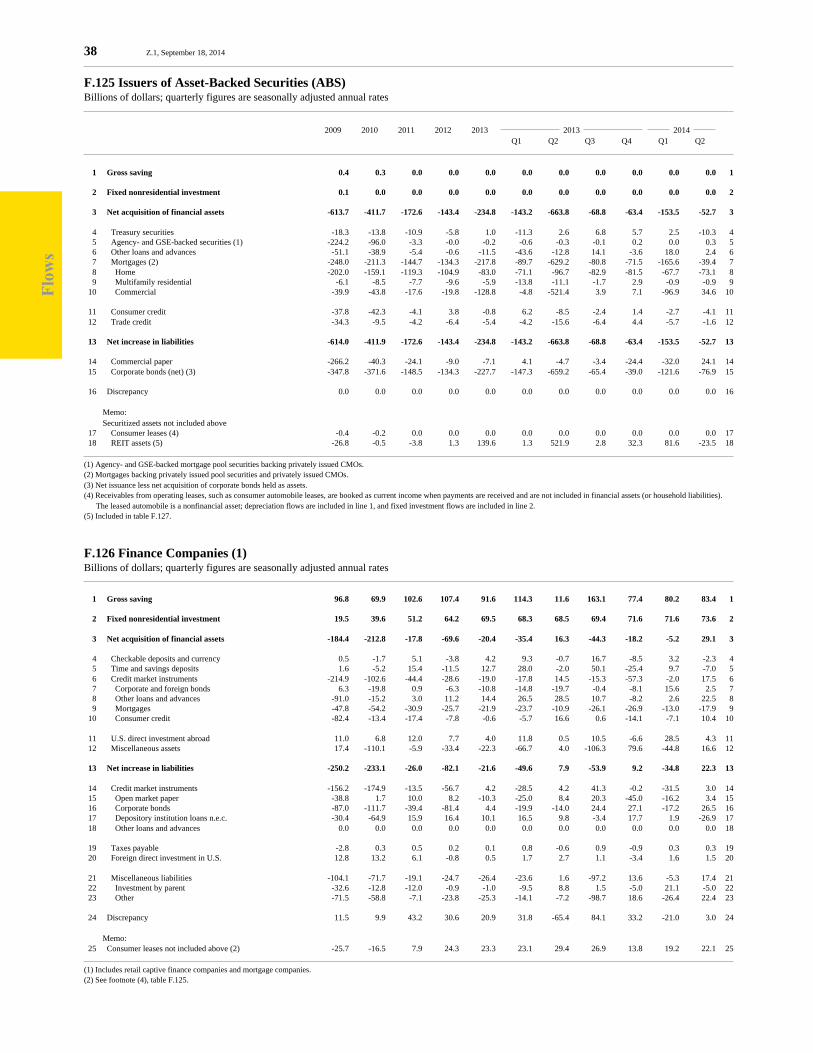
Flo
ws
38 Z.1, September 18, 2014
F.125 Issuers of Asset-Backed Securities (ABS)Billions of dollars; quarterly figures are seasonally adjusted annual rates
2009 2010 2011 2012 2013 2013 2014 Q1 Q2 Q3 Q4 Q1 Q2
1 Gross saving 0.4 0.3 0.0 0.0 0.0 0.0 0.0 0.0 0.0 0.0 0.0 1
2 Fixed nonresidential investment 0.1 0.0 0.0 0.0 0.0 0.0 0.0 0.0 0.0 0.0 0.0 2
3 Net acquisition of financial assets -613.7 -411.7 -172.6 -143.4 -234.8 -143.2 -663.8 -68.8 -63.4 -153.5 -52.7 3
4 Treasury securities -18.3 -13.8 -10.9 -5.8 1.0 -11.3 2.6 6.8 5.7 2.5 -10.3 4 5 Agency- and GSE-backed securities (1) -224.2 -96.0 -3.3 -0.0 -0.2 -0.6 -0.3 -0.1 0.2 0.0 0.3 5 6 Other loans and advances -51.1 -38.9 -5.4 -0.6 -11.5 -43.6 -12.8 14.1 -3.6 18.0 2.4 6 7 Mortgages (2) -248.0 -211.3 -144.7 -134.3 -217.8 -89.7 -629.2 -80.8 -71.5 -165.6 -39.4 7 8 Home -202.0 -159.1 -119.3 -104.9 -83.0 -71.1 -96.7 -82.9 -81.5 -67.7 -73.1 8 9 Multifamily residential -6.1 -8.5 -7.7 -9.6 -5.9 -13.8 -11.1 -1.7 2.9 -0.9 -0.9 9 10 Commercial -39.9 -43.8 -17.6 -19.8 -128.8 -4.8 -521.4 3.9 7.1 -96.9 34.6 10
11 Consumer credit -37.8 -42.3 -4.1 3.8 -0.8 6.2 -8.5 -2.4 1.4 -2.7 -4.1 11 12 Trade credit -34.3 -9.5 -4.2 -6.4 -5.4 -4.2 -15.6 -6.4 4.4 -5.7 -1.6 12
13 Net increase in liabilities -614.0 -411.9 -172.6 -143.4 -234.8 -143.2 -663.8 -68.8 -63.4 -153.5 -52.7 13
14 Commercial paper -266.2 -40.3 -24.1 -9.0 -7.1 4.1 -4.7 -3.4 -24.4 -32.0 24.1 14 15 Corporate bonds (net) (3) -347.8 -371.6 -148.5 -134.3 -227.7 -147.3 -659.2 -65.4 -39.0 -121.6 -76.9 15
16 Discrepancy 0.0 0.0 0.0 0.0 0.0 0.0 0.0 0.0 0.0 0.0 0.0 16
Memo: Securitized assets not included above 17 Consumer leases (4) -0.4 -0.2 0.0 0.0 0.0 0.0 0.0 0.0 0.0 0.0 0.0 17 18 REIT assets (5) -26.8 -0.5 -3.8 1.3 139.6 1.3 521.9 2.8 32.3 81.6 -23.5 18
(1) Agency- and GSE-backed mortgage pool securities backing privately issued CMOs.(2) Mortgages backing privately issued pool securities and privately issued CMOs.(3) Net issuance less net acquisition of corporate bonds held as assets.(4) Receivables from operating leases, such as consumer automobile leases, are booked as current income when payments are received and are not included in financial assets (or household liabilities). The leased automobile is a nonfinancial asset; depreciation flows are included in line 1, and fixed investment flows are included in line 2.(5) Included in table F.127.
F.126 Finance Companies (1)Billions of dollars; quarterly figures are seasonally adjusted annual rates
1 Gross saving 96.8 69.9 102.6 107.4 91.6 114.3 11.6 163.1 77.4 80.2 83.4 1
2 Fixed nonresidential investment 19.5 39.6 51.2 64.2 69.5 68.3 68.5 69.4 71.6 71.6 73.6 2
3 Net acquisition of financial assets -184.4 -212.8 -17.8 -69.6 -20.4 -35.4 16.3 -44.3 -18.2 -5.2 29.1 3
4 Checkable deposits and currency 0.5 -1.7 5.1 -3.8 4.2 9.3 -0.7 16.7 -8.5 3.2 -2.3 4 5 Time and savings deposits 1.6 -5.2 15.4 -11.5 12.7 28.0 -2.0 50.1 -25.4 9.7 -7.0 5 6 Credit market instruments -214.9 -102.6 -44.4 -28.6 -19.0 -17.8 14.5 -15.3 -57.3 -2.0 17.5 6 7 Corporate and foreign bonds 6.3 -19.8 0.9 -6.3 -10.8 -14.8 -19.7 -0.4 -8.1 15.6 2.5 7 8 Other loans and advances -91.0 -15.2 3.0 11.2 14.4 26.5 28.5 10.7 -8.2 2.6 22.5 8 9 Mortgages -47.8 -54.2 -30.9 -25.7 -21.9 -23.7 -10.9 -26.1 -26.9 -13.0 -17.9 9 10 Consumer credit -82.4 -13.4 -17.4 -7.8 -0.6 -5.7 16.6 0.6 -14.1 -7.1 10.4 10
11 U.S. direct investment abroad 11.0 6.8 12.0 7.7 4.0 11.8 0.5 10.5 -6.6 28.5 4.3 11 12 Miscellaneous assets 17.4 -110.1 -5.9 -33.4 -22.3 -66.7 4.0 -106.3 79.6 -44.8 16.6 12
13 Net increase in liabilities -250.2 -233.1 -26.0 -82.1 -21.6 -49.6 7.9 -53.9 9.2 -34.8 22.3 13
14 Credit market instruments -156.2 -174.9 -13.5 -56.7 4.2 -28.5 4.2 41.3 -0.2 -31.5 3.0 14 15 Open market paper -38.8 1.7 10.0 8.2 -10.3 -25.0 8.4 20.3 -45.0 -16.2 3.4 15 16 Corporate bonds -87.0 -111.7 -39.4 -81.4 4.4 -19.9 -14.0 24.4 27.1 -17.2 26.5 16 17 Depository institution loans n.e.c. -30.4 -64.9 15.9 16.4 10.1 16.5 9.8 -3.4 17.7 1.9 -26.9 17 18 Other loans and advances 0.0 0.0 0.0 0.0 0.0 0.0 0.0 0.0 0.0 0.0 0.0 18
19 Taxes payable -2.8 0.3 0.5 0.2 0.1 0.8 -0.6 0.9 -0.9 0.3 0.3 19 20 Foreign direct investment in U.S. 12.8 13.2 6.1 -0.8 0.5 1.7 2.7 1.1 -3.4 1.6 1.5 20
21 Miscellaneous liabilities -104.1 -71.7 -19.1 -24.7 -26.4 -23.6 1.6 -97.2 13.6 -5.3 17.4 21 22 Investment by parent -32.6 -12.8 -12.0 -0.9 -1.0 -9.5 8.8 1.5 -5.0 21.1 -5.0 22 23 Other -71.5 -58.8 -7.1 -23.8 -25.3 -14.1 -7.2 -98.7 18.6 -26.4 22.4 23
24 Discrepancy 11.5 9.9 43.2 30.6 20.9 31.8 -65.4 84.1 33.2 -21.0 3.0 24
Memo: 25 Consumer leases not included above (2) -25.7 -16.5 7.9 24.3 23.3 23.1 29.4 26.9 13.8 19.2 22.1 25
(1) Includes retail captive finance companies and mortgage companies.(2) See footnote (4), table F.125.

Flo
ws
Z.1, September 18, 2014 39
F.127 Real Estate Investment Trusts (REITs) (1)Billions of dollars; quarterly figures are seasonally adjusted annual rates
2009 2010 2011 2012 2013 2013 2014 Q1 Q2 Q3 Q4 Q1 Q2
1 Gross saving 2.6 -8.7 -11.2 -14.4 -11.6 -13.5 -16.1 1.9 -19.0 -13.1 -10.4 1
2 Fixed nonresidential investment 0.1 0.1 0.1 0.3 0.3 0.3 0.3 0.3 0.3 0.3 0.3 2 3 Multifamily residential investment 0.7 4.0 6.5 5.3 14.7 46.3 2.3 -6.6 17.0 -3.6 19.7 3
4 Net acquisition of financial assets 12.4 39.7 131.2 161.0 50.1 5.0 494.3 -124.3 -174.8 99.3 98.7 4
5 Checkable deposits and currency 12.4 -5.7 2.5 7.7 -1.3 22.3 -13.5 9.7 -23.5 -4.6 18.5 5
6 Credit market instruments -10.3 44.1 120.2 127.6 39.2 -39.2 468.8 -79.6 -193.5 64.7 35.3 6
7 Agency- and GSE-backed securities 15.6 38.2 104.7 109.5 -95.6 -46.7 -73.4 -82.7 -179.7 -35.4 44.1 7 8 Corporate and foreign bonds 4.3 7.2 3.8 9.5 -0.2 13.0 -0.4 1.1 -14.6 6.0 -2.7 8
9 Mortgages -30.2 -1.3 11.7 8.6 135.0 -5.5 542.6 2.0 0.7 94.0 -6.0 9 10 Home -25.2 0.2 11.0 6.9 -3.3 0.8 18.3 0.0 -32.3 9.1 6.8 10 11 Multifamily residential -2.0 -0.3 -0.2 0.1 0.5 1.1 2.6 -0.4 -1.2 -0.8 0.2 11 12 Commercial -2.9 -1.2 0.9 1.5 137.7 -7.3 521.6 2.4 34.2 85.8 -13.1 12
13 Miscellaneous assets 10.2 1.3 8.5 25.8 12.2 21.9 39.1 -54.4 42.2 39.3 44.8 13
14 Net increase in liabilities 2.5 62.3 168.0 211.0 136.4 50.4 576.3 -76.0 -5.3 131.8 150.8 14
15 Security repurchase agreements 11.1 29.9 97.7 102.4 -66.6 5.8 -48.9 -84.1 -139.3 -53.2 36.8 15
16 Credit market instruments -27.6 0.1 25.6 35.5 178.4 8.0 550.3 38.5 116.8 140.1 49.4 16
17 Open market paper 0.0 0.0 0.0 0.0 0.0 0.0 0.0 0.0 0.0 0.0 0.0 17 18 Corporate bonds -26.6 1.0 7.6 26.7 173.6 10.9 537.3 35.1 111.0 115.5 55.1 18
19 Depository institution loans n.e.c. -12.7 -1.8 4.6 4.0 -2.9 -23.5 8.3 17.8 -14.4 12.0 -12.2 19 20 Mortgages 11.8 0.8 13.5 4.8 7.8 20.6 4.6 -14.3 20.2 12.6 6.5 20
21 Corporate equity issues 24.2 28.2 37.5 47.6 46.2 64.2 63.1 24.9 32.6 18.9 46.9 21 22 Miscellaneous liabilities -5.3 4.1 7.1 25.4 -21.7 -27.6 11.8 -55.5 -15.4 26.1 17.7 22
23 Discrepancy -8.0 9.8 18.9 30.0 59.6 -14.6 63.3 56.5 133.2 22.7 21.6 23
Memo: 24 Securitized assets included above -26.8 -0.5 -3.8 1.3 139.6 1.3 521.9 2.8 32.3 81.6 -23.5 24 25 Agency- and GSE-backed securities 0.0 0.0 0.0 0.0 0.0 0.0 0.0 0.0 0.0 0.0 0.0 25 26 Home mortgages -25.7 1.1 -0.7 3.7 4.0 1.7 8.2 0.5 5.7 1.4 -1.6 26 27 Multifamily residential mortgages -0.0 -0.0 -0.0 -0.0 0.0 0.1 -0.0 -0.0 -0.1 -0.2 0.3 27 28 Commercial mortgages -1.1 -1.6 -3.0 -2.4 135.6 -0.6 513.7 2.3 26.8 80.3 -22.3 28
(1) Additional detail on financial assets and liabilities for equity and mortgage REITs is available on tables F.127.e and F.127.m.

Flo
ws
40 Z.1, September 18, 2014
F.128 Security Brokers and DealersBillions of dollars; quarterly figures are seasonally adjusted annual rates
2009 2010 2011 2012 2013 2013 2014 Q1 Q2 Q3 Q4 Q1 Q2
1 Gross saving 36.9 25.8 6.3 23.2 14.4 11.5 3.5 29.9 12.5 23.1 26.8 1
2 Fixed nonresidential investment 23.6 17.9 16.1 13.0 13.5 13.4 13.3 13.6 13.9 13.9 14.2 2
3 Net acquisition of financial assets -236.3 234.4 29.1 173.7 -298.1 -228.4 -138.5 -344.0 -481.6 219.9 -88.2 3
4 Checkable deposits and currency -29.4 6.2 14.9 16.3 -16.5 -66.2 40.5 -19.8 -20.3 2.0 8.9 4 5 Security repurchase agreements -103.3 243.4 154.6 55.1 -317.2 -478.6 -158.4 -260.2 -371.7 -201.3 -156.6 5
6 Credit market instruments -192.1 32.2 5.7 89.1 -175.4 -147.0 -289.4 -40.6 -224.6 -57.5 -24.8 6
7 Open market paper -24.2 -5.3 5.9 -12.2 -1.3 0.1 -2.2 6.2 -9.2 22.8 -7.8 7 8 Treasury securities -67.6 -28.5 89.1 63.0 -110.5 -124.3 -94.3 33.4 -256.8 -63.7 -54.2 8 9 Agency- and GSE-backed securities -131.8 38.9 -2.1 21.9 -55.4 -62.8 -112.3 -80.7 34.0 -3.3 3.4 9 10 Municipal securities -3.3 4.6 -9.1 -4.3 -8.0 17.7 -48.1 -3.0 1.5 -7.1 5.3 10 11 Corporate and foreign bonds 47.5 35.2 -85.0 35.5 -11.1 31.9 -52.8 -2.8 -20.6 -3.4 18.4 11 12 Other loans and advances -12.7 -12.7 6.9 -14.8 10.9 -9.5 20.2 6.3 26.5 -2.7 10.0 12
13 Corporate equities -4.6 -18.5 -5.0 9.7 18.6 -78.0 16.5 -5.5 141.5 -85.1 32.5 13 14 Security credit 38.1 75.2 -39.3 64.9 35.4 16.4 -21.2 44.6 101.9 -74.3 222.4 14
15 U.S. direct investment abroad 12.5 8.7 4.9 6.7 9.2 16.3 7.0 8.5 5.2 9.0 16.0 15 16 Miscellaneous assets 42.4 -112.9 -106.6 -68.1 147.7 508.8 266.5 -71.0 -113.5 627.1 -186.6 16
17 Net increase in liabilities -305.9 220.4 69.4 120.5 -329.1 -296.7 -174.3 -351.7 -493.8 207.1 -79.1 17
18 Security repurchase agreements -296.8 195.9 70.5 131.2 -439.3 -492.9 -334.6 -364.5 -565.3 -235.7 -120.9 18
19 Credit market instruments -49.7 36.9 -37.9 -1.7 22.2 -4.2 55.8 -27.8 65.1 38.5 -34.5 19
20 Corporate bonds -4.2 36.9 -37.9 -1.7 22.2 -4.2 55.8 -27.8 65.1 38.5 -34.5 20 21 Depository institution loans n.e.c. (1) -45.5 0.0 0.0 0.0 0.0 0.0 0.0 0.0 0.0 0.0 0.0 21
22 Corporate equity issues -32.4 -11.1 14.1 -50.7 -31.0 -45.4 -41.6 0.3 -37.1 -7.1 -0.1 22 23 Trade payables 48.9 -52.0 -3.8 -0.0 0.3 4.6 1.0 -9.3 4.9 1.0 12.0 23
24 Security credit -43.5 29.8 31.9 32.8 68.9 -26.2 193.5 0.2 108.1 221.9 17.6 24 25 From households -35.7 23.5 0.9 42.0 58.5 -53.9 202.0 -10.1 95.9 202.8 15.3 25 26 From U.S.-chartered depository institutions -3.4 3.2 12.2 -1.9 7.9 11.7 15.6 8.3 -3.9 21.9 10.6 26 27 From foreign banking offices in U.S. -4.5 3.1 18.8 -7.3 2.5 16.0 -24.0 2.0 16.0 -2.9 -8.2 27
28 Taxes payable 3.2 -2.1 -1.1 0.5 0.6 5.4 0.1 0.6 -3.5 3.2 2.5 28 29 Foreign direct investment in U.S. 2.1 13.2 18.2 9.4 11.6 7.0 6.2 2.3 31.0 8.8 0.0 29
30 Miscellaneous liabilities 61.7 9.0 -19.4 -7.7 41.3 260.5 -55.7 62.2 -101.8 173.2 45.5 30 31 Investment by parent companies -166.8 -51.2 40.4 71.3 72.6 36.0 50.5 -118.7 322.6 45.4 122.4 31 32 Other 228.6 60.2 -59.8 -79.0 -31.3 224.5 -106.2 180.8 -424.3 127.8 -76.9 32
33 Proprietors’ net investment 0.6 0.9 -2.9 6.7 -3.9 -5.4 0.9 -15.8 4.8 3.3 -1.2 33
34 Discrepancy -56.3 -6.0 30.5 -43.0 -30.2 -70.2 -45.6 8.5 -13.5 -3.6 21.8 34
(1) Includes loans extended through the Federal Reserve’s Primary Dealer Credit Facility (PDCF) and the Asset-Backed Commercial Paper Money Market Mutual Fund Liquidity Facility (AMLF).
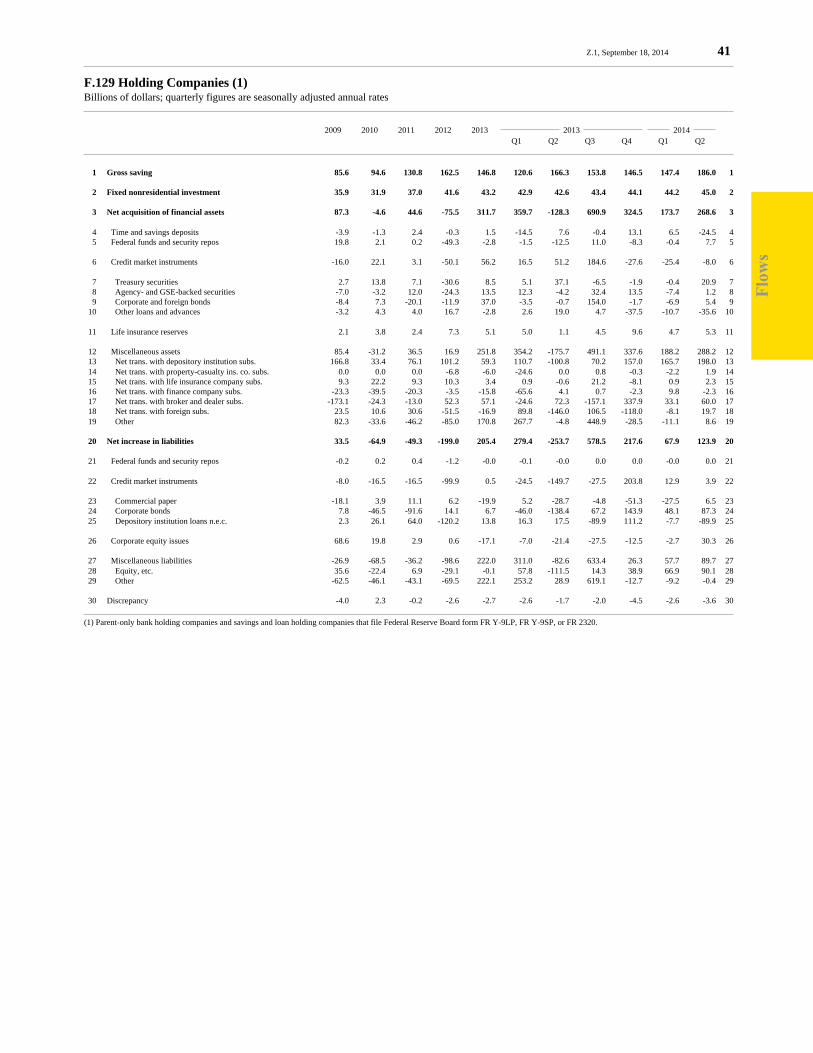
Flo
ws
Z.1, September 18, 2014 41
F.129 Holding Companies (1)Billions of dollars; quarterly figures are seasonally adjusted annual rates
2009 2010 2011 2012 2013 2013 2014 Q1 Q2 Q3 Q4 Q1 Q2
1 Gross saving 85.6 94.6 130.8 162.5 146.8 120.6 166.3 153.8 146.5 147.4 186.0 1
2 Fixed nonresidential investment 35.9 31.9 37.0 41.6 43.2 42.9 42.6 43.4 44.1 44.2 45.0 2
3 Net acquisition of financial assets 87.3 -4.6 44.6 -75.5 311.7 359.7 -128.3 690.9 324.5 173.7 268.6 3
4 Time and savings deposits -3.9 -1.3 2.4 -0.3 1.5 -14.5 7.6 -0.4 13.1 6.5 -24.5 4 5 Federal funds and security repos 19.8 2.1 0.2 -49.3 -2.8 -1.5 -12.5 11.0 -8.3 -0.4 7.7 5
6 Credit market instruments -16.0 22.1 3.1 -50.1 56.2 16.5 51.2 184.6 -27.6 -25.4 -8.0 6
7 Treasury securities 2.7 13.8 7.1 -30.6 8.5 5.1 37.1 -6.5 -1.9 -0.4 20.9 7 8 Agency- and GSE-backed securities -7.0 -3.2 12.0 -24.3 13.5 12.3 -4.2 32.4 13.5 -7.4 1.2 8 9 Corporate and foreign bonds -8.4 7.3 -20.1 -11.9 37.0 -3.5 -0.7 154.0 -1.7 -6.9 5.4 9 10 Other loans and advances -3.2 4.3 4.0 16.7 -2.8 2.6 19.0 4.7 -37.5 -10.7 -35.6 10
11 Life insurance reserves 2.1 3.8 2.4 7.3 5.1 5.0 1.1 4.5 9.6 4.7 5.3 11
12 Miscellaneous assets 85.4 -31.2 36.5 16.9 251.8 354.2 -175.7 491.1 337.6 188.2 288.2 12 13 Net trans. with depository institution subs. 166.8 33.4 76.1 101.2 59.3 110.7 -100.8 70.2 157.0 165.7 198.0 13 14 Net trans. with property-casualty ins. co. subs. 0.0 0.0 0.0 -6.8 -6.0 -24.6 0.0 0.8 -0.3 -2.2 1.9 14 15 Net trans. with life insurance company subs. 9.3 22.2 9.3 10.3 3.4 0.9 -0.6 21.2 -8.1 0.9 2.3 15 16 Net trans. with finance company subs. -23.3 -39.5 -20.3 -3.5 -15.8 -65.6 4.1 0.7 -2.3 9.8 -2.3 16 17 Net trans. with broker and dealer subs. -173.1 -24.3 -13.0 52.3 57.1 -24.6 72.3 -157.1 337.9 33.1 60.0 17 18 Net trans. with foreign subs. 23.5 10.6 30.6 -51.5 -16.9 89.8 -146.0 106.5 -118.0 -8.1 19.7 18 19 Other 82.3 -33.6 -46.2 -85.0 170.8 267.7 -4.8 448.9 -28.5 -11.1 8.6 19
20 Net increase in liabilities 33.5 -64.9 -49.3 -199.0 205.4 279.4 -253.7 578.5 217.6 67.9 123.9 20
21 Federal funds and security repos -0.2 0.2 0.4 -1.2 -0.0 -0.1 -0.0 0.0 0.0 -0.0 0.0 21
22 Credit market instruments -8.0 -16.5 -16.5 -99.9 0.5 -24.5 -149.7 -27.5 203.8 12.9 3.9 22
23 Commercial paper -18.1 3.9 11.1 6.2 -19.9 5.2 -28.7 -4.8 -51.3 -27.5 6.5 23 24 Corporate bonds 7.8 -46.5 -91.6 14.1 6.7 -46.0 -138.4 67.2 143.9 48.1 87.3 24 25 Depository institution loans n.e.c. 2.3 26.1 64.0 -120.2 13.8 16.3 17.5 -89.9 111.2 -7.7 -89.9 25
26 Corporate equity issues 68.6 19.8 2.9 0.6 -17.1 -7.0 -21.4 -27.5 -12.5 -2.7 30.3 26
27 Miscellaneous liabilities -26.9 -68.5 -36.2 -98.6 222.0 311.0 -82.6 633.4 26.3 57.7 89.7 27 28 Equity, etc. 35.6 -22.4 6.9 -29.1 -0.1 57.8 -111.5 14.3 38.9 66.9 90.1 28 29 Other -62.5 -46.1 -43.1 -69.5 222.1 253.2 28.9 619.1 -12.7 -9.2 -0.4 29
30 Discrepancy -4.0 2.3 -0.2 -2.6 -2.7 -2.6 -1.7 -2.0 -4.5 -2.6 -3.6 30
(1) Parent-only bank holding companies and savings and loan holding companies that file Federal Reserve Board form FR Y-9LP, FR Y-9SP, or FR 2320.

Flo
ws
42 Z.1, September 18, 2014
F.130 Funding Corporations (1)Billions of dollars; quarterly figures are seasonally adjusted annual rates
2009 2010 2011 2012 2013 2013 2014 Q1 Q2 Q3 Q4 Q1 Q2
1 Net acquisition of financial assets -506.8 -166.0 -161.5 -74.8 -53.1 54.8 -147.2 41.3 -161.5 87.6 -76.2 1
2 Money market fund shares -153.7 -148.0 -89.2 -31.9 -58.8 -179.0 -19.7 84.1 -120.7 -107.2 -140.2 2 3 Security repurchase agreements 0.1 0.0 0.0 0.0 -0.1 -0.5 0.0 0.0 0.0 0.0 0.0 3
4 Credit market instruments -311.1 39.1 -65.6 -50.1 -7.1 106.1 -102.3 12.4 -44.8 180.9 13.9 4
5 Open market paper -276.6 50.4 -6.3 -7.4 -13.7 84.0 -127.3 22.6 -34.1 129.9 27.0 5 6 Corporate and foreign bonds -24.7 -9.8 -57.3 -36.2 8.9 21.9 29.4 -4.4 -11.5 48.0 -18.1 6 7 Other loans and advances -9.8 -1.5 -2.0 -6.5 -2.3 0.1 -4.4 -5.8 0.8 3.0 5.0 7
8 Corporate equities (2) 25.1 1.3 -26.4 0.0 0.0 0.0 0.0 0.0 0.0 0.0 0.0 8
9 Miscellaneous assets -67.2 -58.4 19.6 7.2 13.0 128.3 -25.2 -55.2 4.0 13.8 50.2 9 10 Investment in foreign banking offices -73.5 -31.5 -33.7 -11.8 -2.5 67.7 -3.4 -93.6 19.2 1.5 -12.2 10 11 Investment in brokers and dealers 6.3 -26.9 53.4 19.0 15.5 60.6 -21.8 38.4 -15.3 12.4 62.4 11
12 Net increase in liabilities -506.8 -166.0 -161.5 -74.8 -53.1 54.8 -147.2 41.3 -161.5 87.6 -76.2 12
13 Credit market instruments -434.8 -65.3 -52.4 -23.9 27.0 66.9 8.1 -17.8 50.8 -7.2 74.6 13
14 Open market paper -125.1 -47.4 -72.7 -30.9 16.2 31.1 30.7 -79.3 82.3 -2.4 6.5 14 15 Corporate bonds 37.9 -3.2 71.6 35.3 11.4 37.9 -22.2 61.5 -31.4 -4.8 68.2 15 16 Depository institution loans n.e.c. (3) -349.6 -21.9 -51.9 -21.5 0.0 0.0 0.0 0.0 0.0 0.0 0.0 16 17 Other loans and advances (4) 2.0 7.2 0.7 -6.8 -0.7 -2.2 -0.4 0.0 0.0 0.0 0.0 17
18 Corporate equities (5) 30.5 3.5 -18.4 -8.6 0.0 0.0 0.0 0.0 0.0 0.0 0.0 18 19 Foreign direct investment in U.S. 0.6 0.6 0.6 0.6 0.6 0.6 0.6 0.6 0.6 0.6 0.6 19
20 Miscellaneous liabilities -103.1 -104.8 -91.4 -42.9 -80.7 -12.6 -155.9 58.5 -212.9 94.1 -151.4 20 21 Securities loaned (net) -30.2 -123.5 -74.6 -79.2 94.0 236.2 298.3 -43.6 -114.8 479.9 -181.1 21 22 Equity interest under PPIP 2.4 7.9 1.4 0.1 0.0 0.0 0.0 0.0 0.0 0.0 0.0 22 23 Other (net) -75.3 10.8 -18.1 36.2 -174.7 -248.8 -454.2 102.1 -98.1 -385.8 29.8 23
(1) Funding subsidiaries, custodial accounts for reinvested collateral of securities lending operations, Federal Reserve lending facilities, and funds associated with the Public-Private Investment Program (PPIP).(2) Common stock of American International Assurance Company Ltd. (AIA) and American Life Insurance Company (ALICO), two life insurance subsidiaries of AIG.(3) Loans extended by the Federal Reserve to Maiden Lane LLC, Maiden Lane II LLC, Maiden Lane III LLC, Commercial Paper Funding Facility LLC, and American International Group (AIG).(4) Loans extended by the federal government to the Term Asset-Backed Securities Loan Facility (TALF) LLC and to funds associated with PPIP.(5) Preferred shares issued by AIG to the federal goverment under the Troubled Asset Relief Program (TARP) program and the monetary authority sector’s preferred interest in AIA Aurora LLC and ALICO Holdings LLC.
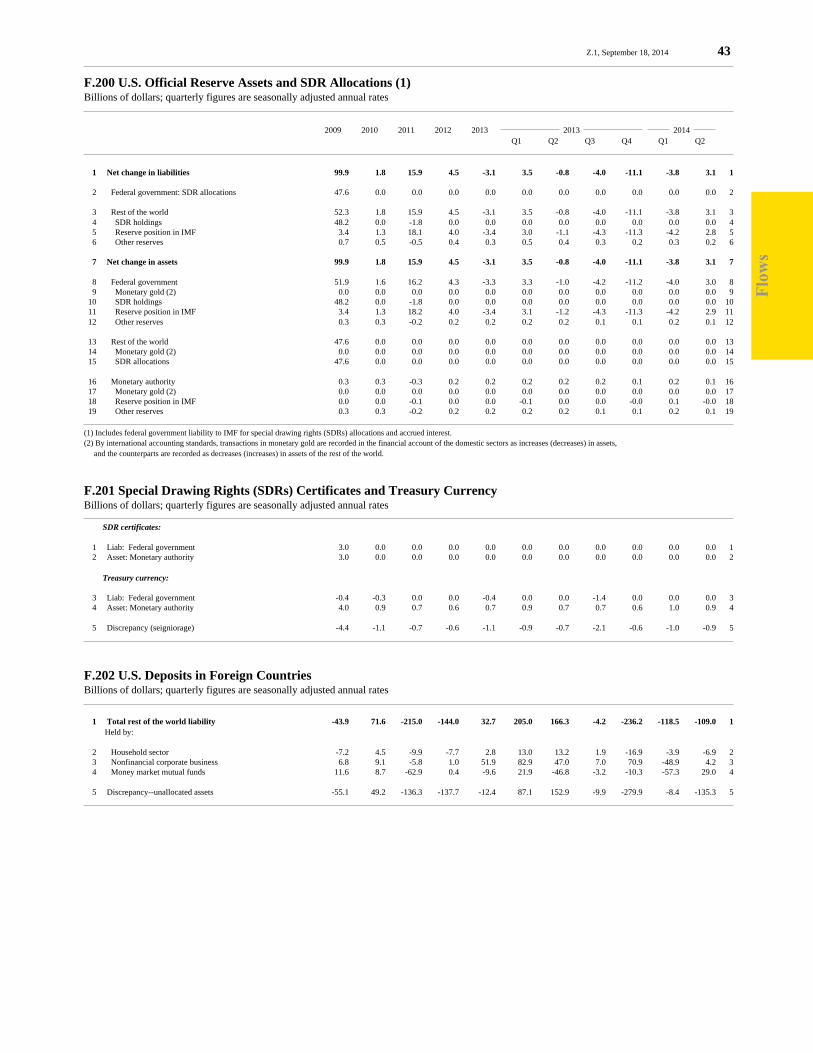
Flo
ws
Z.1, September 18, 2014 43
F.200 U.S. Official Reserve Assets and SDR Allocations (1)Billions of dollars; quarterly figures are seasonally adjusted annual rates
2009 2010 2011 2012 2013 2013 2014 Q1 Q2 Q3 Q4 Q1 Q2
1 Net change in liabilities 99.9 1.8 15.9 4.5 -3.1 3.5 -0.8 -4.0 -11.1 -3.8 3.1 1
2 Federal government: SDR allocations 47.6 0.0 0.0 0.0 0.0 0.0 0.0 0.0 0.0 0.0 0.0 2
3 Rest of the world 52.3 1.8 15.9 4.5 -3.1 3.5 -0.8 -4.0 -11.1 -3.8 3.1 3 4 SDR holdings 48.2 0.0 -1.8 0.0 0.0 0.0 0.0 0.0 0.0 0.0 0.0 4 5 Reserve position in IMF 3.4 1.3 18.1 4.0 -3.4 3.0 -1.1 -4.3 -11.3 -4.2 2.8 5 6 Other reserves 0.7 0.5 -0.5 0.4 0.3 0.5 0.4 0.3 0.2 0.3 0.2 6
7 Net change in assets 99.9 1.8 15.9 4.5 -3.1 3.5 -0.8 -4.0 -11.1 -3.8 3.1 7
8 Federal government 51.9 1.6 16.2 4.3 -3.3 3.3 -1.0 -4.2 -11.2 -4.0 3.0 8 9 Monetary gold (2) 0.0 0.0 0.0 0.0 0.0 0.0 0.0 0.0 0.0 0.0 0.0 9 10 SDR holdings 48.2 0.0 -1.8 0.0 0.0 0.0 0.0 0.0 0.0 0.0 0.0 10 11 Reserve position in IMF 3.4 1.3 18.2 4.0 -3.4 3.1 -1.2 -4.3 -11.3 -4.2 2.9 11 12 Other reserves 0.3 0.3 -0.2 0.2 0.2 0.2 0.2 0.1 0.1 0.2 0.1 12
13 Rest of the world 47.6 0.0 0.0 0.0 0.0 0.0 0.0 0.0 0.0 0.0 0.0 13 14 Monetary gold (2) 0.0 0.0 0.0 0.0 0.0 0.0 0.0 0.0 0.0 0.0 0.0 14 15 SDR allocations 47.6 0.0 0.0 0.0 0.0 0.0 0.0 0.0 0.0 0.0 0.0 15
16 Monetary authority 0.3 0.3 -0.3 0.2 0.2 0.2 0.2 0.2 0.1 0.2 0.1 16 17 Monetary gold (2) 0.0 0.0 0.0 0.0 0.0 0.0 0.0 0.0 0.0 0.0 0.0 17 18 Reserve position in IMF 0.0 0.0 -0.1 0.0 0.0 -0.1 0.0 0.0 -0.0 0.1 -0.0 18 19 Other reserves 0.3 0.3 -0.2 0.2 0.2 0.2 0.2 0.1 0.1 0.2 0.1 19
(1) Includes federal government liability to IMF for special drawing rights (SDRs) allocations and accrued interest.(2) By international accounting standards, transactions in monetary gold are recorded in the financial account of the domestic sectors as increases (decreases) in assets, and the counterparts are recorded as decreases (increases) in assets of the rest of the world.
F.201 Special Drawing Rights (SDRs) Certificates and Treasury CurrencyBillions of dollars; quarterly figures are seasonally adjusted annual rates
SDR certificates:
1 Liab: Federal government 3.0 0.0 0.0 0.0 0.0 0.0 0.0 0.0 0.0 0.0 0.0 1 2 Asset: Monetary authority 3.0 0.0 0.0 0.0 0.0 0.0 0.0 0.0 0.0 0.0 0.0 2
Treasury currency:
3 Liab: Federal government -0.4 -0.3 0.0 0.0 -0.4 0.0 0.0 -1.4 0.0 0.0 0.0 3 4 Asset: Monetary authority 4.0 0.9 0.7 0.6 0.7 0.9 0.7 0.7 0.6 1.0 0.9 4
5 Discrepancy (seigniorage) -4.4 -1.1 -0.7 -0.6 -1.1 -0.9 -0.7 -2.1 -0.6 -1.0 -0.9 5
F.202 U.S. Deposits in Foreign CountriesBillions of dollars; quarterly figures are seasonally adjusted annual rates
1 Total rest of the world liability -43.9 71.6 -215.0 -144.0 32.7 205.0 166.3 -4.2 -236.2 -118.5 -109.0 1 Held by:
2 Household sector -7.2 4.5 -9.9 -7.7 2.8 13.0 13.2 1.9 -16.9 -3.9 -6.9 2 3 Nonfinancial corporate business 6.8 9.1 -5.8 1.0 51.9 82.9 47.0 7.0 70.9 -48.9 4.2 3 4 Money market mutual funds 11.6 8.7 -62.9 0.4 -9.6 21.9 -46.8 -3.2 -10.3 -57.3 29.0 4
5 Discrepancy--unallocated assets -55.1 49.2 -136.3 -137.7 -12.4 87.1 152.9 -9.9 -279.9 -8.4 -135.3 5
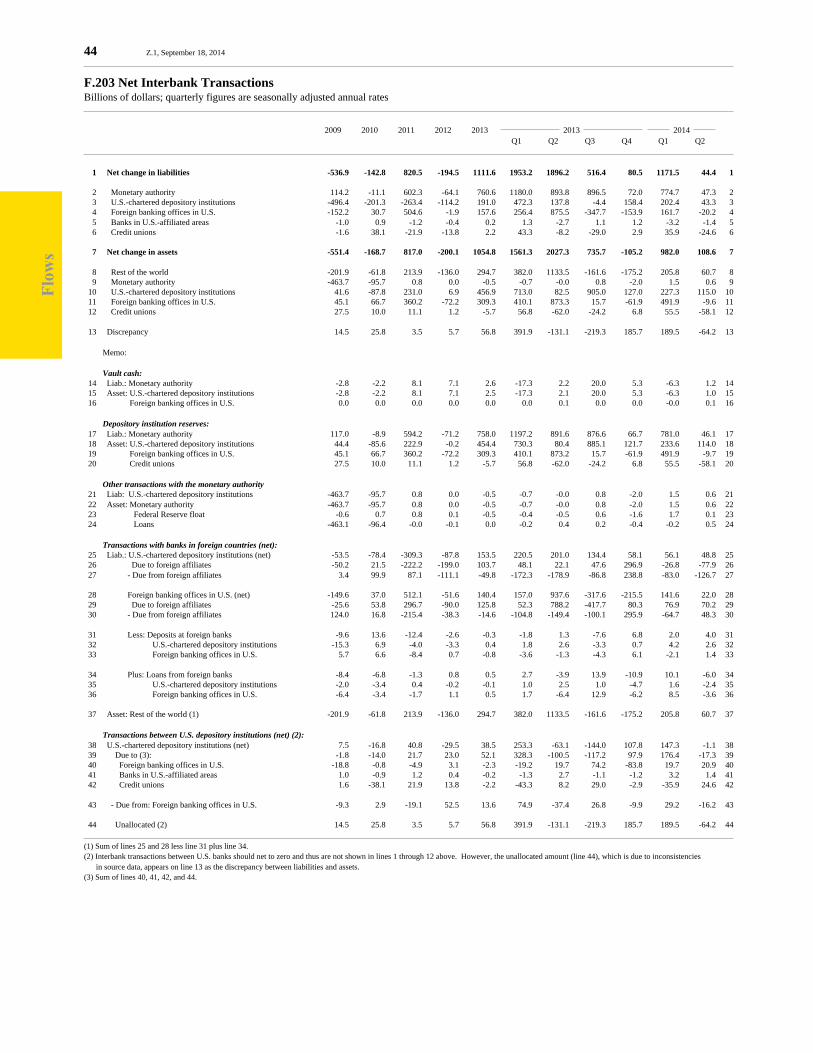
Flo
ws
44 Z.1, September 18, 2014
F.203 Net Interbank TransactionsBillions of dollars; quarterly figures are seasonally adjusted annual rates
2009 2010 2011 2012 2013 2013 2014 Q1 Q2 Q3 Q4 Q1 Q2
1 Net change in liabilities -536.9 -142.8 820.5 -194.5 1111.6 1953.2 1896.2 516.4 80.5 1171.5 44.4 1
2 Monetary authority 114.2 -11.1 602.3 -64.1 760.6 1180.0 893.8 896.5 72.0 774.7 47.3 2 3 U.S.-chartered depository institutions -496.4 -201.3 -263.4 -114.2 191.0 472.3 137.8 -4.4 158.4 202.4 43.3 3 4 Foreign banking offices in U.S. -152.2 30.7 504.6 -1.9 157.6 256.4 875.5 -347.7 -153.9 161.7 -20.2 4 5 Banks in U.S.-affiliated areas -1.0 0.9 -1.2 -0.4 0.2 1.3 -2.7 1.1 1.2 -3.2 -1.4 5 6 Credit unions -1.6 38.1 -21.9 -13.8 2.2 43.3 -8.2 -29.0 2.9 35.9 -24.6 6
7 Net change in assets -551.4 -168.7 817.0 -200.1 1054.8 1561.3 2027.3 735.7 -105.2 982.0 108.6 7
8 Rest of the world -201.9 -61.8 213.9 -136.0 294.7 382.0 1133.5 -161.6 -175.2 205.8 60.7 8 9 Monetary authority -463.7 -95.7 0.8 0.0 -0.5 -0.7 -0.0 0.8 -2.0 1.5 0.6 9 10 U.S.-chartered depository institutions 41.6 -87.8 231.0 6.9 456.9 713.0 82.5 905.0 127.0 227.3 115.0 10 11 Foreign banking offices in U.S. 45.1 66.7 360.2 -72.2 309.3 410.1 873.3 15.7 -61.9 491.9 -9.6 11 12 Credit unions 27.5 10.0 11.1 1.2 -5.7 56.8 -62.0 -24.2 6.8 55.5 -58.1 12
13 Discrepancy 14.5 25.8 3.5 5.7 56.8 391.9 -131.1 -219.3 185.7 189.5 -64.2 13
Memo:
Vault cash: 14 Liab.: Monetary authority -2.8 -2.2 8.1 7.1 2.6 -17.3 2.2 20.0 5.3 -6.3 1.2 14 15 Asset: U.S.-chartered depository institutions -2.8 -2.2 8.1 7.1 2.5 -17.3 2.1 20.0 5.3 -6.3 1.0 15 16 Foreign banking offices in U.S. 0.0 0.0 0.0 0.0 0.0 0.0 0.1 0.0 0.0 -0.0 0.1 16
Depository institution reserves: 17 Liab.: Monetary authority 117.0 -8.9 594.2 -71.2 758.0 1197.2 891.6 876.6 66.7 781.0 46.1 17 18 Asset: U.S.-chartered depository institutions 44.4 -85.6 222.9 -0.2 454.4 730.3 80.4 885.1 121.7 233.6 114.0 18 19 Foreign banking offices in U.S. 45.1 66.7 360.2 -72.2 309.3 410.1 873.2 15.7 -61.9 491.9 -9.7 19 20 Credit unions 27.5 10.0 11.1 1.2 -5.7 56.8 -62.0 -24.2 6.8 55.5 -58.1 20
Other transactions with the monetary authority 21 Liab: U.S.-chartered depository institutions -463.7 -95.7 0.8 0.0 -0.5 -0.7 -0.0 0.8 -2.0 1.5 0.6 21 22 Asset: Monetary authority -463.7 -95.7 0.8 0.0 -0.5 -0.7 -0.0 0.8 -2.0 1.5 0.6 22 23 Federal Reserve float -0.6 0.7 0.8 0.1 -0.5 -0.4 -0.5 0.6 -1.6 1.7 0.1 23 24 Loans -463.1 -96.4 -0.0 -0.1 0.0 -0.2 0.4 0.2 -0.4 -0.2 0.5 24
Transactions with banks in foreign countries (net): 25 Liab.: U.S.-chartered depository institutions (net) -53.5 -78.4 -309.3 -87.8 153.5 220.5 201.0 134.4 58.1 56.1 48.8 25 26 Due to foreign affiliates -50.2 21.5 -222.2 -199.0 103.7 48.1 22.1 47.6 296.9 -26.8 -77.9 26 27 - Due from foreign affiliates 3.4 99.9 87.1 -111.1 -49.8 -172.3 -178.9 -86.8 238.8 -83.0 -126.7 27
28 Foreign banking offices in U.S. (net) -149.6 37.0 512.1 -51.6 140.4 157.0 937.6 -317.6 -215.5 141.6 22.0 28 29 Due to foreign affiliates -25.6 53.8 296.7 -90.0 125.8 52.3 788.2 -417.7 80.3 76.9 70.2 29 30 - Due from foreign affiliates 124.0 16.8 -215.4 -38.3 -14.6 -104.8 -149.4 -100.1 295.9 -64.7 48.3 30
31 Less: Deposits at foreign banks -9.6 13.6 -12.4 -2.6 -0.3 -1.8 1.3 -7.6 6.8 2.0 4.0 31 32 U.S.-chartered depository institutions -15.3 6.9 -4.0 -3.3 0.4 1.8 2.6 -3.3 0.7 4.2 2.6 32 33 Foreign banking offices in U.S. 5.7 6.6 -8.4 0.7 -0.8 -3.6 -1.3 -4.3 6.1 -2.1 1.4 33
34 Plus: Loans from foreign banks -8.4 -6.8 -1.3 0.8 0.5 2.7 -3.9 13.9 -10.9 10.1 -6.0 34 35 U.S.-chartered depository institutions -2.0 -3.4 0.4 -0.2 -0.1 1.0 2.5 1.0 -4.7 1.6 -2.4 35 36 Foreign banking offices in U.S. -6.4 -3.4 -1.7 1.1 0.5 1.7 -6.4 12.9 -6.2 8.5 -3.6 36
37 Asset: Rest of the world (1) -201.9 -61.8 213.9 -136.0 294.7 382.0 1133.5 -161.6 -175.2 205.8 60.7 37
Transactions between U.S. depository institutions (net) (2): 38 U.S.-chartered depository institutions (net) 7.5 -16.8 40.8 -29.5 38.5 253.3 -63.1 -144.0 107.8 147.3 -1.1 38 39 Due to (3): -1.8 -14.0 21.7 23.0 52.1 328.3 -100.5 -117.2 97.9 176.4 -17.3 39 40 Foreign banking offices in U.S. -18.8 -0.8 -4.9 3.1 -2.3 -19.2 19.7 74.2 -83.8 19.7 20.9 40 41 Banks in U.S.-affiliated areas 1.0 -0.9 1.2 0.4 -0.2 -1.3 2.7 -1.1 -1.2 3.2 1.4 41 42 Credit unions 1.6 -38.1 21.9 13.8 -2.2 -43.3 8.2 29.0 -2.9 -35.9 24.6 42
43 - Due from: Foreign banking offices in U.S. -9.3 2.9 -19.1 52.5 13.6 74.9 -37.4 26.8 -9.9 29.2 -16.2 43
44 Unallocated (2) 14.5 25.8 3.5 5.7 56.8 391.9 -131.1 -219.3 185.7 189.5 -64.2 44
(1) Sum of lines 25 and 28 less line 31 plus line 34.(2) Interbank transactions between U.S. banks should net to zero and thus are not shown in lines 1 through 12 above. However, the unallocated amount (line 44), which is due to inconsistencies in source data, appears on line 13 as the discrepancy between liabilities and assets.(3) Sum of lines 40, 41, 42, and 44.
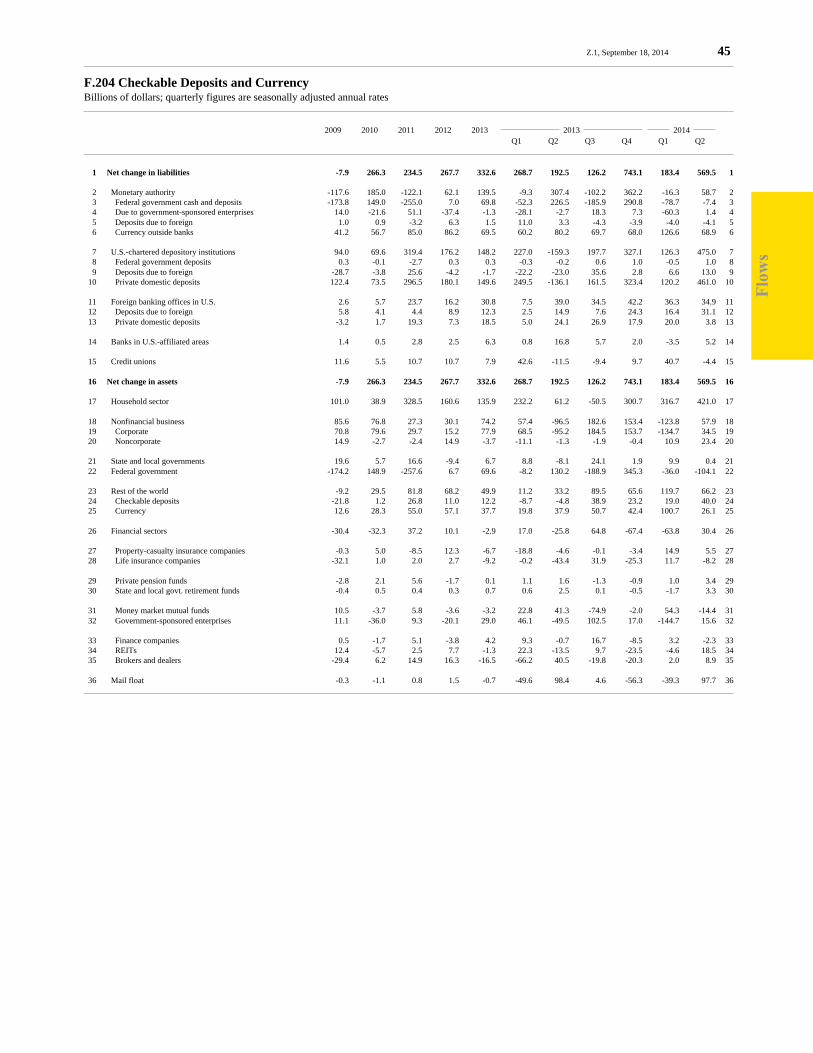
Flo
ws
Z.1, September 18, 2014 45
F.204 Checkable Deposits and CurrencyBillions of dollars; quarterly figures are seasonally adjusted annual rates
2009 2010 2011 2012 2013 2013 2014 Q1 Q2 Q3 Q4 Q1 Q2
1 Net change in liabilities -7.9 266.3 234.5 267.7 332.6 268.7 192.5 126.2 743.1 183.4 569.5 1
2 Monetary authority -117.6 185.0 -122.1 62.1 139.5 -9.3 307.4 -102.2 362.2 -16.3 58.7 2 3 Federal government cash and deposits -173.8 149.0 -255.0 7.0 69.8 -52.3 226.5 -185.9 290.8 -78.7 -7.4 3 4 Due to government-sponsored enterprises 14.0 -21.6 51.1 -37.4 -1.3 -28.1 -2.7 18.3 7.3 -60.3 1.4 4 5 Deposits due to foreign 1.0 0.9 -3.2 6.3 1.5 11.0 3.3 -4.3 -3.9 -4.0 -4.1 5 6 Currency outside banks 41.2 56.7 85.0 86.2 69.5 60.2 80.2 69.7 68.0 126.6 68.9 6
7 U.S.-chartered depository institutions 94.0 69.6 319.4 176.2 148.2 227.0 -159.3 197.7 327.1 126.3 475.0 7 8 Federal government deposits 0.3 -0.1 -2.7 0.3 0.3 -0.3 -0.2 0.6 1.0 -0.5 1.0 8 9 Deposits due to foreign -28.7 -3.8 25.6 -4.2 -1.7 -22.2 -23.0 35.6 2.8 6.6 13.0 9 10 Private domestic deposits 122.4 73.5 296.5 180.1 149.6 249.5 -136.1 161.5 323.4 120.2 461.0 10
11 Foreign banking offices in U.S. 2.6 5.7 23.7 16.2 30.8 7.5 39.0 34.5 42.2 36.3 34.9 11 12 Deposits due to foreign 5.8 4.1 4.4 8.9 12.3 2.5 14.9 7.6 24.3 16.4 31.1 12 13 Private domestic deposits -3.2 1.7 19.3 7.3 18.5 5.0 24.1 26.9 17.9 20.0 3.8 13
14 Banks in U.S.-affiliated areas 1.4 0.5 2.8 2.5 6.3 0.8 16.8 5.7 2.0 -3.5 5.2 14
15 Credit unions 11.6 5.5 10.7 10.7 7.9 42.6 -11.5 -9.4 9.7 40.7 -4.4 15
16 Net change in assets -7.9 266.3 234.5 267.7 332.6 268.7 192.5 126.2 743.1 183.4 569.5 16
17 Household sector 101.0 38.9 328.5 160.6 135.9 232.2 61.2 -50.5 300.7 316.7 421.0 17
18 Nonfinancial business 85.6 76.8 27.3 30.1 74.2 57.4 -96.5 182.6 153.4 -123.8 57.9 18 19 Corporate 70.8 79.6 29.7 15.2 77.9 68.5 -95.2 184.5 153.7 -134.7 34.5 19 20 Noncorporate 14.9 -2.7 -2.4 14.9 -3.7 -11.1 -1.3 -1.9 -0.4 10.9 23.4 20
21 State and local governments 19.6 5.7 16.6 -9.4 6.7 8.8 -8.1 24.1 1.9 9.9 0.4 21 22 Federal government -174.2 148.9 -257.6 6.7 69.6 -8.2 130.2 -188.9 345.3 -36.0 -104.1 22
23 Rest of the world -9.2 29.5 81.8 68.2 49.9 11.2 33.2 89.5 65.6 119.7 66.2 23 24 Checkable deposits -21.8 1.2 26.8 11.0 12.2 -8.7 -4.8 38.9 23.2 19.0 40.0 24 25 Currency 12.6 28.3 55.0 57.1 37.7 19.8 37.9 50.7 42.4 100.7 26.1 25
26 Financial sectors -30.4 -32.3 37.2 10.1 -2.9 17.0 -25.8 64.8 -67.4 -63.8 30.4 26
27 Property-casualty insurance companies -0.3 5.0 -8.5 12.3 -6.7 -18.8 -4.6 -0.1 -3.4 14.9 5.5 27 28 Life insurance companies -32.1 1.0 2.0 2.7 -9.2 -0.2 -43.4 31.9 -25.3 11.7 -8.2 28
29 Private pension funds -2.8 2.1 5.6 -1.7 0.1 1.1 1.6 -1.3 -0.9 1.0 3.4 29 30 State and local govt. retirement funds -0.4 0.5 0.4 0.3 0.7 0.6 2.5 0.1 -0.5 -1.7 3.3 30
31 Money market mutual funds 10.5 -3.7 5.8 -3.6 -3.2 22.8 41.3 -74.9 -2.0 54.3 -14.4 31 32 Government-sponsored enterprises 11.1 -36.0 9.3 -20.1 29.0 46.1 -49.5 102.5 17.0 -144.7 15.6 32
33 Finance companies 0.5 -1.7 5.1 -3.8 4.2 9.3 -0.7 16.7 -8.5 3.2 -2.3 33 34 REITs 12.4 -5.7 2.5 7.7 -1.3 22.3 -13.5 9.7 -23.5 -4.6 18.5 34 35 Brokers and dealers -29.4 6.2 14.9 16.3 -16.5 -66.2 40.5 -19.8 -20.3 2.0 8.9 35
36 Mail float -0.3 -1.1 0.8 1.5 -0.7 -49.6 98.4 4.6 -56.3 -39.3 97.7 36
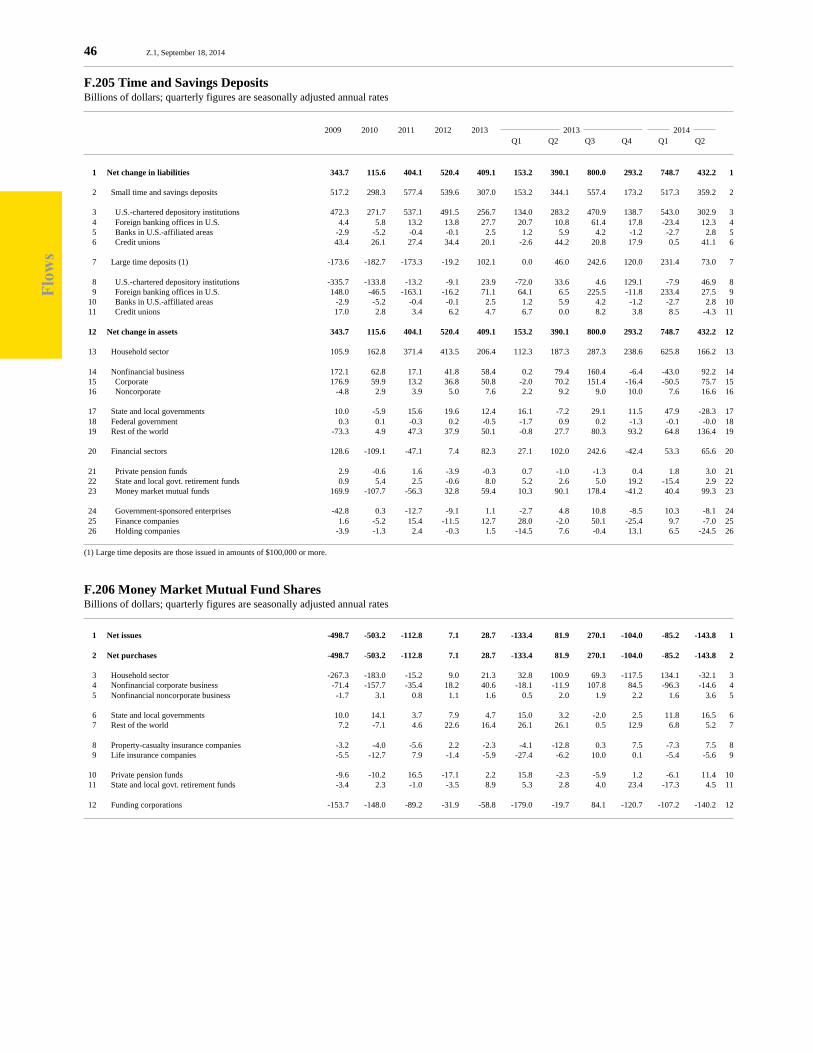
Flo
ws
46 Z.1, September 18, 2014
F.205 Time and Savings DepositsBillions of dollars; quarterly figures are seasonally adjusted annual rates
2009 2010 2011 2012 2013 2013 2014 Q1 Q2 Q3 Q4 Q1 Q2
1 Net change in liabilities 343.7 115.6 404.1 520.4 409.1 153.2 390.1 800.0 293.2 748.7 432.2 1
2 Small time and savings deposits 517.2 298.3 577.4 539.6 307.0 153.2 344.1 557.4 173.2 517.3 359.2 2
3 U.S.-chartered depository institutions 472.3 271.7 537.1 491.5 256.7 134.0 283.2 470.9 138.7 543.0 302.9 3 4 Foreign banking offices in U.S. 4.4 5.8 13.2 13.8 27.7 20.7 10.8 61.4 17.8 -23.4 12.3 4 5 Banks in U.S.-affiliated areas -2.9 -5.2 -0.4 -0.1 2.5 1.2 5.9 4.2 -1.2 -2.7 2.8 5 6 Credit unions 43.4 26.1 27.4 34.4 20.1 -2.6 44.2 20.8 17.9 0.5 41.1 6
7 Large time deposits (1) -173.6 -182.7 -173.3 -19.2 102.1 0.0 46.0 242.6 120.0 231.4 73.0 7
8 U.S.-chartered depository institutions -335.7 -133.8 -13.2 -9.1 23.9 -72.0 33.6 4.6 129.1 -7.9 46.9 8 9 Foreign banking offices in U.S. 148.0 -46.5 -163.1 -16.2 71.1 64.1 6.5 225.5 -11.8 233.4 27.5 9 10 Banks in U.S.-affiliated areas -2.9 -5.2 -0.4 -0.1 2.5 1.2 5.9 4.2 -1.2 -2.7 2.8 10 11 Credit unions 17.0 2.8 3.4 6.2 4.7 6.7 0.0 8.2 3.8 8.5 -4.3 11
12 Net change in assets 343.7 115.6 404.1 520.4 409.1 153.2 390.1 800.0 293.2 748.7 432.2 12
13 Household sector 105.9 162.8 371.4 413.5 206.4 112.3 187.3 287.3 238.6 625.8 166.2 13
14 Nonfinancial business 172.1 62.8 17.1 41.8 58.4 0.2 79.4 160.4 -6.4 -43.0 92.2 14 15 Corporate 176.9 59.9 13.2 36.8 50.8 -2.0 70.2 151.4 -16.4 -50.5 75.7 15 16 Noncorporate -4.8 2.9 3.9 5.0 7.6 2.2 9.2 9.0 10.0 7.6 16.6 16
17 State and local governments 10.0 -5.9 15.6 19.6 12.4 16.1 -7.2 29.1 11.5 47.9 -28.3 17 18 Federal government 0.3 0.1 -0.3 0.2 -0.5 -1.7 0.9 0.2 -1.3 -0.1 -0.0 18 19 Rest of the world -73.3 4.9 47.3 37.9 50.1 -0.8 27.7 80.3 93.2 64.8 136.4 19
20 Financial sectors 128.6 -109.1 -47.1 7.4 82.3 27.1 102.0 242.6 -42.4 53.3 65.6 20
21 Private pension funds 2.9 -0.6 1.6 -3.9 -0.3 0.7 -1.0 -1.3 0.4 1.8 3.0 21 22 State and local govt. retirement funds 0.9 5.4 2.5 -0.6 8.0 5.2 2.6 5.0 19.2 -15.4 2.9 22 23 Money market mutual funds 169.9 -107.7 -56.3 32.8 59.4 10.3 90.1 178.4 -41.2 40.4 99.3 23
24 Government-sponsored enterprises -42.8 0.3 -12.7 -9.1 1.1 -2.7 4.8 10.8 -8.5 10.3 -8.1 24 25 Finance companies 1.6 -5.2 15.4 -11.5 12.7 28.0 -2.0 50.1 -25.4 9.7 -7.0 25 26 Holding companies -3.9 -1.3 2.4 -0.3 1.5 -14.5 7.6 -0.4 13.1 6.5 -24.5 26
(1) Large time deposits are those issued in amounts of $100,000 or more.
F.206 Money Market Mutual Fund SharesBillions of dollars; quarterly figures are seasonally adjusted annual rates
1 Net issues -498.7 -503.2 -112.8 7.1 28.7 -133.4 81.9 270.1 -104.0 -85.2 -143.8 1
2 Net purchases -498.7 -503.2 -112.8 7.1 28.7 -133.4 81.9 270.1 -104.0 -85.2 -143.8 2
3 Household sector -267.3 -183.0 -15.2 9.0 21.3 32.8 100.9 69.3 -117.5 134.1 -32.1 3 4 Nonfinancial corporate business -71.4 -157.7 -35.4 18.2 40.6 -18.1 -11.9 107.8 84.5 -96.3 -14.6 4 5 Nonfinancial noncorporate business -1.7 3.1 0.8 1.1 1.6 0.5 2.0 1.9 2.2 1.6 3.6 5
6 State and local governments 10.0 14.1 3.7 7.9 4.7 15.0 3.2 -2.0 2.5 11.8 16.5 6 7 Rest of the world 7.2 -7.1 4.6 22.6 16.4 26.1 26.1 0.5 12.9 6.8 5.2 7
8 Property-casualty insurance companies -3.2 -4.0 -5.6 2.2 -2.3 -4.1 -12.8 0.3 7.5 -7.3 7.5 8 9 Life insurance companies -5.5 -12.7 7.9 -1.4 -5.9 -27.4 -6.2 10.0 0.1 -5.4 -5.6 9
10 Private pension funds -9.6 -10.2 16.5 -17.1 2.2 15.8 -2.3 -5.9 1.2 -6.1 11.4 10 11 State and local govt. retirement funds -3.4 2.3 -1.0 -3.5 8.9 5.3 2.8 4.0 23.4 -17.3 4.5 11
12 Funding corporations -153.7 -148.0 -89.2 -31.9 -58.8 -179.0 -19.7 84.1 -120.7 -107.2 -140.2 12
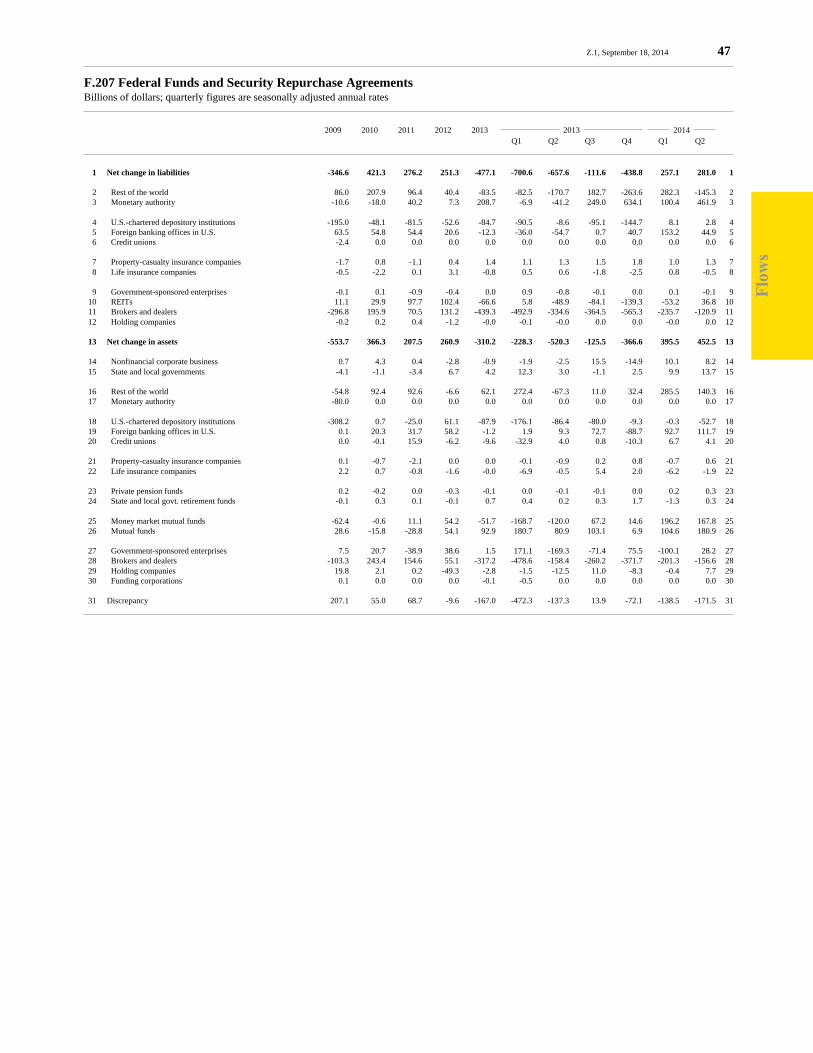
Flo
ws
Z.1, September 18, 2014 47
F.207 Federal Funds and Security Repurchase AgreementsBillions of dollars; quarterly figures are seasonally adjusted annual rates
2009 2010 2011 2012 2013 2013 2014 Q1 Q2 Q3 Q4 Q1 Q2
1 Net change in liabilities -346.6 421.3 276.2 251.3 -477.1 -700.6 -657.6 -111.6 -438.8 257.1 281.0 1
2 Rest of the world 86.0 207.9 96.4 40.4 -83.5 -82.5 -170.7 182.7 -263.6 282.3 -145.3 2 3 Monetary authority -10.6 -18.0 40.2 7.3 208.7 -6.9 -41.2 249.0 634.1 100.4 461.9 3
4 U.S.-chartered depository institutions -195.0 -48.1 -81.5 -52.6 -84.7 -90.5 -8.6 -95.1 -144.7 8.1 2.8 4 5 Foreign banking offices in U.S. 63.5 54.8 54.4 20.6 -12.3 -36.0 -54.7 0.7 40.7 153.2 44.9 5 6 Credit unions -2.4 0.0 0.0 0.0 0.0 0.0 0.0 0.0 0.0 0.0 0.0 6
7 Property-casualty insurance companies -1.7 0.8 -1.1 0.4 1.4 1.1 1.3 1.5 1.8 1.0 1.3 7 8 Life insurance companies -0.5 -2.2 0.1 3.1 -0.8 0.5 0.6 -1.8 -2.5 0.8 -0.5 8
9 Government-sponsored enterprises -0.1 0.1 -0.9 -0.4 0.0 0.9 -0.8 -0.1 0.0 0.1 -0.1 9 10 REITs 11.1 29.9 97.7 102.4 -66.6 5.8 -48.9 -84.1 -139.3 -53.2 36.8 10 11 Brokers and dealers -296.8 195.9 70.5 131.2 -439.3 -492.9 -334.6 -364.5 -565.3 -235.7 -120.9 11 12 Holding companies -0.2 0.2 0.4 -1.2 -0.0 -0.1 -0.0 0.0 0.0 -0.0 0.0 12
13 Net change in assets -553.7 366.3 207.5 260.9 -310.2 -228.3 -520.3 -125.5 -366.6 395.5 452.5 13
14 Nonfinancial corporate business 0.7 4.3 0.4 -2.8 -0.9 -1.9 -2.5 15.5 -14.9 10.1 8.2 14 15 State and local governments -4.1 -1.1 -3.4 6.7 4.2 12.3 3.0 -1.1 2.5 9.9 13.7 15
16 Rest of the world -54.8 92.4 92.6 -6.6 62.1 272.4 -67.3 11.0 32.4 285.5 140.3 16 17 Monetary authority -80.0 0.0 0.0 0.0 0.0 0.0 0.0 0.0 0.0 0.0 0.0 17
18 U.S.-chartered depository institutions -308.2 0.7 -25.0 61.1 -87.9 -176.1 -86.4 -80.0 -9.3 -0.3 -52.7 18 19 Foreign banking offices in U.S. 0.1 20.3 31.7 58.2 -1.2 1.9 9.3 72.7 -88.7 92.7 111.7 19 20 Credit unions 0.0 -0.1 15.9 -6.2 -9.6 -32.9 4.0 0.8 -10.3 6.7 4.1 20
21 Property-casualty insurance companies 0.1 -0.7 -2.1 0.0 0.0 -0.1 -0.9 0.2 0.8 -0.7 0.6 21 22 Life insurance companies 2.2 0.7 -0.8 -1.6 -0.0 -6.9 -0.5 5.4 2.0 -6.2 -1.9 22
23 Private pension funds 0.2 -0.2 0.0 -0.3 -0.1 0.0 -0.1 -0.1 0.0 0.2 0.3 23 24 State and local govt. retirement funds -0.1 0.3 0.1 -0.1 0.7 0.4 0.2 0.3 1.7 -1.3 0.3 24
25 Money market mutual funds -62.4 -0.6 11.1 54.2 -51.7 -168.7 -120.0 67.2 14.6 196.2 167.8 25 26 Mutual funds 28.6 -15.8 -28.8 54.1 92.9 180.7 80.9 103.1 6.9 104.6 180.9 26
27 Government-sponsored enterprises 7.5 20.7 -38.9 38.6 1.5 171.1 -169.3 -71.4 75.5 -100.1 28.2 27 28 Brokers and dealers -103.3 243.4 154.6 55.1 -317.2 -478.6 -158.4 -260.2 -371.7 -201.3 -156.6 28 29 Holding companies 19.8 2.1 0.2 -49.3 -2.8 -1.5 -12.5 11.0 -8.3 -0.4 7.7 29 30 Funding corporations 0.1 0.0 0.0 0.0 -0.1 -0.5 0.0 0.0 0.0 0.0 0.0 30
31 Discrepancy 207.1 55.0 68.7 -9.6 -167.0 -472.3 -137.3 13.9 -72.1 -138.5 -171.5 31

Flo
ws
48 Z.1, September 18, 2014
F.208 Open Market PaperBillions of dollars; quarterly figures are seasonally adjusted annual rates
2009 2010 2011 2012 2013 2013 2014 Q1 Q2 Q3 Q4 Q1 Q2
1 Total net issues, all types -461.8 -80.4 -88.3 -16.9 -0.8 104.0 -41.8 -29.0 -36.4 54.0 121.2 1
2 Commercial paper -461.9 -79.9 -88.2 -16.8 -0.8 104.0 -41.8 -28.9 -36.4 54.0 121.2 2
3 Nonfinancial corporate business -73.1 24.5 33.4 14.0 14.2 20.1 -20.1 92.0 -35.2 72.1 54.9 3
4 Foreign issues in U.S. 59.4 -2.7 -53.5 27.9 34.0 120.7 13.7 -26.6 28.1 65.2 35.3 4 5 Nonfinancial -15.2 -3.8 -0.5 10.3 11.2 -41.0 40.8 44.7 0.1 29.5 0.1 5 6 Financial 74.5 1.1 -53.0 17.6 22.8 161.7 -27.2 -71.3 27.9 35.7 35.2 6
7 Financial sectors -448.2 -101.7 -68.1 -58.7 -48.9 -36.8 -35.3 -94.4 -29.2 -83.2 30.9 7 8 U.S.-chartered depository institutions 0.0 -19.7 7.7 -33.1 -27.8 -52.3 -41.1 -27.2 9.3 -5.2 -9.6 8 9 ABS issuers -266.2 -40.3 -24.1 -9.0 -7.1 4.1 -4.7 -3.4 -24.4 -32.0 24.1 9 10 Finance companies -38.8 1.7 10.0 8.2 -10.3 -25.0 8.4 20.3 -45.0 -16.2 3.4 10 11 REITs 0.0 0.0 0.0 0.0 0.0 0.0 0.0 0.0 0.0 0.0 0.0 11 12 Holding companies -18.1 3.9 11.1 6.2 -19.9 5.2 -28.7 -4.8 -51.3 -27.5 6.5 12 13 Funding corporations -125.1 -47.4 -72.7 -30.9 16.2 31.1 30.7 -79.3 82.3 -2.4 6.5 13
14 Bankers’ acceptances (1) 0.1 -0.5 -0.1 -0.1 -0.0 0.0 -0.0 -0.0 0.0 0.0 0.0 14
15 U.S.-chartered depository institutions 0.1 -0.5 -0.1 -0.1 -0.0 0.0 -0.0 -0.0 0.0 0.0 0.0 15 16 Foreign banking offices in U.S. 0.0 0.0 0.0 0.0 0.0 0.0 0.0 0.0 0.0 0.0 0.0 16
17 Net purchases, by sector -461.8 -80.4 -88.3 -16.9 -0.8 104.0 -41.8 -29.0 -36.4 54.0 121.2 17
18 Household sector 16.7 -1.5 -1.8 -0.6 -3.8 -3.2 -0.8 -0.8 -10.4 -2.9 -11.0 18 19 Nonfinancial corporate business -1.3 12.0 -0.1 -8.0 -21.8 -3.8 -22.7 -31.1 -29.5 -5.0 -19.4 19
20 State and local governments -39.0 13.2 -11.1 -5.9 -8.1 -2.6 -9.0 -11.6 -9.4 -5.0 -3.4 20 21 Rest of the world -48.4 -10.7 0.7 -0.1 -1.4 26.1 6.4 -86.8 48.5 20.2 42.8 21
22 Monetary authority 0.0 0.0 0.0 0.0 0.0 0.0 0.0 0.0 0.0 0.0 0.0 22 23 U.S.-chartered depository institutions (1) -15.7 0.0 0.0 0.0 0.0 0.0 0.0 0.0 0.0 0.0 0.0 23 24 Foreign banking offices in U.S. (1) 0.0 0.0 0.0 0.0 0.0 0.0 0.0 0.0 0.0 0.0 0.0 24 25 Credit unions 0.0 0.0 0.0 0.0 0.0 0.0 0.0 0.0 0.0 0.0 0.0 25
26 Property-casualty insurance companies -9.3 -1.9 0.9 -1.4 0.7 0.0 -3.2 1.4 4.4 -3.1 3.0 26 27 Life insurance companies 11.5 -8.9 -11.2 13.9 3.2 -9.7 -4.5 5.3 21.5 7.1 -12.8 27
28 Private pension funds 1.7 -2.0 2.4 -4.9 -3.4 2.5 -1.1 -7.8 -7.1 4.1 2.7 28 29 State and local govt. retirement funds -0.8 4.5 2.1 -1.3 8.9 7.3 2.1 7.1 18.9 -13.9 2.1 29
30 Money market mutual funds -108.0 -116.3 -40.0 -13.3 11.3 38.4 105.8 -3.9 -95.1 4.8 21.5 30 31 Mutual funds 28.6 -13.9 -26.3 27.6 27.7 -38.3 14.2 67.3 67.5 -106.3 72.8 31
32 Government-sponsored enterprises 3.0 0.2 -3.4 -3.1 1.0 3.1 0.5 3.0 -2.5 1.3 3.6 32 33 Brokers and dealers -24.2 -5.3 5.9 -12.2 -1.3 0.1 -2.2 6.2 -9.2 22.8 -7.8 33 34 Funding corporations -276.6 50.4 -6.3 -7.4 -13.7 84.0 -127.3 22.6 -34.1 129.9 27.0 34
(1) Excludes banks’ holdings of own acceptances.
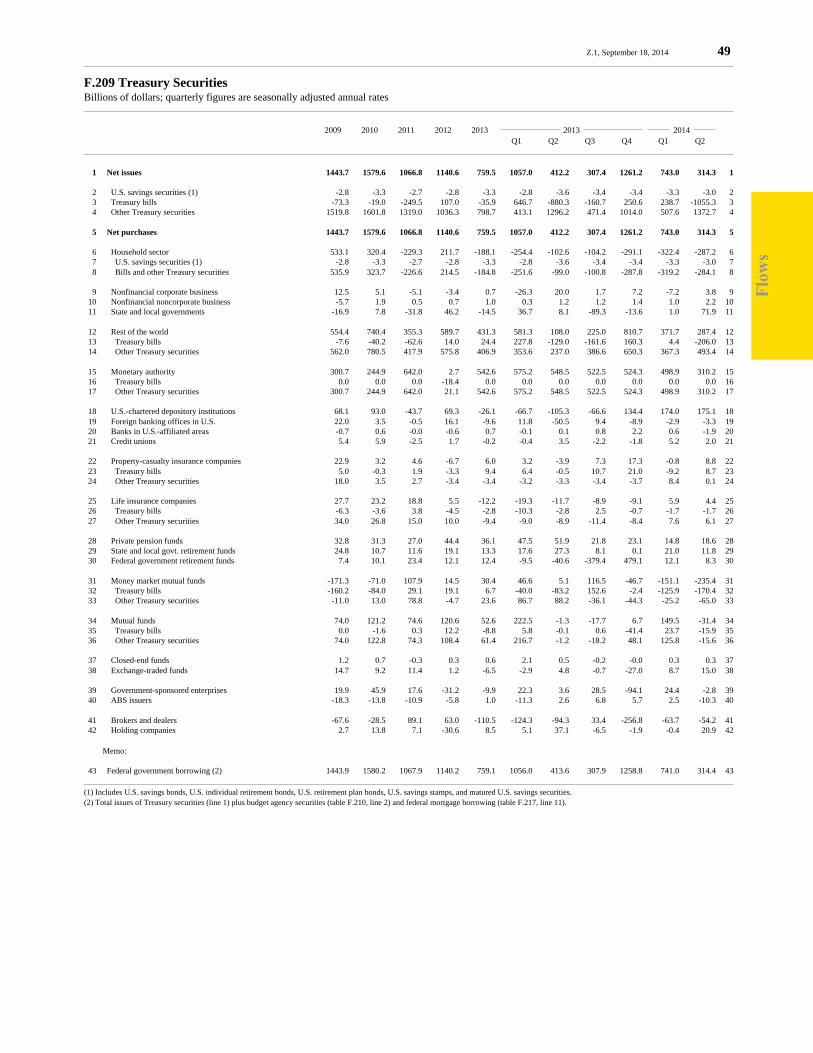
Flo
ws
Z.1, September 18, 2014 49
F.209 Treasury SecuritiesBillions of dollars; quarterly figures are seasonally adjusted annual rates
2009 2010 2011 2012 2013 2013 2014 Q1 Q2 Q3 Q4 Q1 Q2
1 Net issues 1443.7 1579.6 1066.8 1140.6 759.5 1057.0 412.2 307.4 1261.2 743.0 314.3 1
2 U.S. savings securities (1) -2.8 -3.3 -2.7 -2.8 -3.3 -2.8 -3.6 -3.4 -3.4 -3.3 -3.0 2 3 Treasury bills -73.3 -19.0 -249.5 107.0 -35.9 646.7 -880.3 -160.7 250.6 238.7 -1055.3 3 4 Other Treasury securities 1519.8 1601.8 1319.0 1036.3 798.7 413.1 1296.2 471.4 1014.0 507.6 1372.7 4
5 Net purchases 1443.7 1579.6 1066.8 1140.6 759.5 1057.0 412.2 307.4 1261.2 743.0 314.3 5
6 Household sector 533.1 320.4 -229.3 211.7 -188.1 -254.4 -102.6 -104.2 -291.1 -322.4 -287.2 6 7 U.S. savings securities (1) -2.8 -3.3 -2.7 -2.8 -3.3 -2.8 -3.6 -3.4 -3.4 -3.3 -3.0 7 8 Bills and other Treasury securities 535.9 323.7 -226.6 214.5 -184.8 -251.6 -99.0 -100.8 -287.8 -319.2 -284.1 8
9 Nonfinancial corporate business 12.5 5.1 -5.1 -3.4 0.7 -26.3 20.0 1.7 7.2 -7.2 3.8 9 10 Nonfinancial noncorporate business -5.7 1.9 0.5 0.7 1.0 0.3 1.2 1.2 1.4 1.0 2.2 10 11 State and local governments -16.9 7.8 -31.8 46.2 -14.5 36.7 8.1 -89.3 -13.6 1.0 71.9 11
12 Rest of the world 554.4 740.4 355.3 589.7 431.3 581.3 108.0 225.0 810.7 371.7 287.4 12 13 Treasury bills -7.6 -40.2 -62.6 14.0 24.4 227.8 -129.0 -161.6 160.3 4.4 -206.0 13 14 Other Treasury securities 562.0 780.5 417.9 575.8 406.9 353.6 237.0 386.6 650.3 367.3 493.4 14
15 Monetary authority 300.7 244.9 642.0 2.7 542.6 575.2 548.5 522.5 524.3 498.9 310.2 15 16 Treasury bills 0.0 0.0 0.0 -18.4 0.0 0.0 0.0 0.0 0.0 0.0 0.0 16 17 Other Treasury securities 300.7 244.9 642.0 21.1 542.6 575.2 548.5 522.5 524.3 498.9 310.2 17
18 U.S.-chartered depository institutions 68.1 93.0 -43.7 69.3 -26.1 -66.7 -105.3 -66.6 134.4 174.0 175.1 18 19 Foreign banking offices in U.S. 22.0 3.5 -0.5 16.1 -9.6 11.8 -50.5 9.4 -8.9 -2.9 -3.3 19 20 Banks in U.S.-affiliated areas -0.7 0.6 -0.0 -0.6 0.7 -0.1 0.1 0.8 2.2 0.6 -1.9 20 21 Credit unions 5.4 5.9 -2.5 1.7 -0.2 -0.4 3.5 -2.2 -1.8 5.2 2.0 21
22 Property-casualty insurance companies 22.9 3.2 4.6 -6.7 6.0 3.2 -3.9 7.3 17.3 -0.8 8.8 22 23 Treasury bills 5.0 -0.3 1.9 -3.3 9.4 6.4 -0.5 10.7 21.0 -9.2 8.7 23 24 Other Treasury securities 18.0 3.5 2.7 -3.4 -3.4 -3.2 -3.3 -3.4 -3.7 8.4 0.1 24
25 Life insurance companies 27.7 23.2 18.8 5.5 -12.2 -19.3 -11.7 -8.9 -9.1 5.9 4.4 25 26 Treasury bills -6.3 -3.6 3.8 -4.5 -2.8 -10.3 -2.8 2.5 -0.7 -1.7 -1.7 26 27 Other Treasury securities 34.0 26.8 15.0 10.0 -9.4 -9.0 -8.9 -11.4 -8.4 7.6 6.1 27
28 Private pension funds 32.8 31.3 27.0 44.4 36.1 47.5 51.9 21.8 23.1 14.8 18.6 28 29 State and local govt. retirement funds 24.8 10.7 11.6 19.1 13.3 17.6 27.3 8.1 0.1 21.0 11.8 29 30 Federal government retirement funds 7.4 10.1 23.4 12.1 12.4 -9.5 -40.6 -379.4 479.1 12.1 8.3 30
31 Money market mutual funds -171.3 -71.0 107.9 14.5 30.4 46.6 5.1 116.5 -46.7 -151.1 -235.4 31 32 Treasury bills -160.2 -84.0 29.1 19.1 6.7 -40.0 -83.2 152.6 -2.4 -125.9 -170.4 32 33 Other Treasury securities -11.0 13.0 78.8 -4.7 23.6 86.7 88.2 -36.1 -44.3 -25.2 -65.0 33
34 Mutual funds 74.0 121.2 74.6 120.6 52.6 222.5 -1.3 -17.7 6.7 149.5 -31.4 34 35 Treasury bills 0.0 -1.6 0.3 12.2 -8.8 5.8 -0.1 0.6 -41.4 23.7 -15.9 35 36 Other Treasury securities 74.0 122.8 74.3 108.4 61.4 216.7 -1.2 -18.2 48.1 125.8 -15.6 36
37 Closed-end funds 1.2 0.7 -0.3 0.3 0.6 2.1 0.5 -0.2 -0.0 0.3 0.3 37 38 Exchange-traded funds 14.7 9.2 11.4 1.2 -6.5 -2.9 4.8 -0.7 -27.0 8.7 15.0 38
39 Government-sponsored enterprises 19.9 45.9 17.6 -31.2 -9.9 22.3 3.6 28.5 -94.1 24.4 -2.8 39 40 ABS issuers -18.3 -13.8 -10.9 -5.8 1.0 -11.3 2.6 6.8 5.7 2.5 -10.3 40
41 Brokers and dealers -67.6 -28.5 89.1 63.0 -110.5 -124.3 -94.3 33.4 -256.8 -63.7 -54.2 41 42 Holding companies 2.7 13.8 7.1 -30.6 8.5 5.1 37.1 -6.5 -1.9 -0.4 20.9 42
Memo:
43 Federal government borrowing (2) 1443.9 1580.2 1067.9 1140.2 759.1 1056.0 413.6 307.9 1258.8 741.0 314.4 43
(1) Includes U.S. savings bonds, U.S. individual retirement bonds, U.S. retirement plan bonds, U.S. savings stamps, and matured U.S. savings securities.(2) Total issues of Treasury securities (line 1) plus budget agency securities (table F.210, line 2) and federal mortgage borrowing (table F.217, line 11).
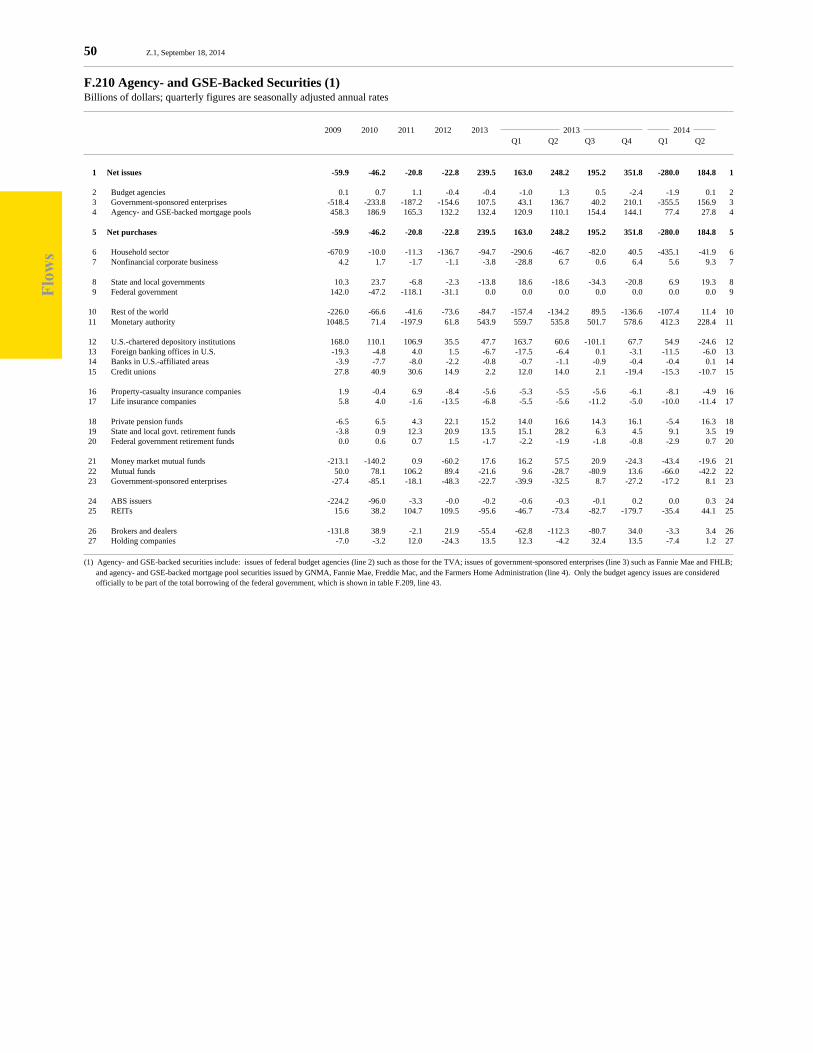
Flo
ws
50 Z.1, September 18, 2014
F.210 Agency- and GSE-Backed Securities (1)Billions of dollars; quarterly figures are seasonally adjusted annual rates
2009 2010 2011 2012 2013 2013 2014 Q1 Q2 Q3 Q4 Q1 Q2
1 Net issues -59.9 -46.2 -20.8 -22.8 239.5 163.0 248.2 195.2 351.8 -280.0 184.8 1
2 Budget agencies 0.1 0.7 1.1 -0.4 -0.4 -1.0 1.3 0.5 -2.4 -1.9 0.1 2 3 Government-sponsored enterprises -518.4 -233.8 -187.2 -154.6 107.5 43.1 136.7 40.2 210.1 -355.5 156.9 3 4 Agency- and GSE-backed mortgage pools 458.3 186.9 165.3 132.2 132.4 120.9 110.1 154.4 144.1 77.4 27.8 4
5 Net purchases -59.9 -46.2 -20.8 -22.8 239.5 163.0 248.2 195.2 351.8 -280.0 184.8 5
6 Household sector -670.9 -10.0 -11.3 -136.7 -94.7 -290.6 -46.7 -82.0 40.5 -435.1 -41.9 6 7 Nonfinancial corporate business 4.2 1.7 -1.7 -1.1 -3.8 -28.8 6.7 0.6 6.4 5.6 9.3 7
8 State and local governments 10.3 23.7 -6.8 -2.3 -13.8 18.6 -18.6 -34.3 -20.8 6.9 19.3 8 9 Federal government 142.0 -47.2 -118.1 -31.1 0.0 0.0 0.0 0.0 0.0 0.0 0.0 9
10 Rest of the world -226.0 -66.6 -41.6 -73.6 -84.7 -157.4 -134.2 89.5 -136.6 -107.4 11.4 10 11 Monetary authority 1048.5 71.4 -197.9 61.8 543.9 559.7 535.8 501.7 578.6 412.3 228.4 11
12 U.S.-chartered depository institutions 168.0 110.1 106.9 35.5 47.7 163.7 60.6 -101.1 67.7 54.9 -24.6 12 13 Foreign banking offices in U.S. -19.3 -4.8 4.0 1.5 -6.7 -17.5 -6.4 0.1 -3.1 -11.5 -6.0 13 14 Banks in U.S.-affiliated areas -3.9 -7.7 -8.0 -2.2 -0.8 -0.7 -1.1 -0.9 -0.4 -0.4 0.1 14 15 Credit unions 27.8 40.9 30.6 14.9 2.2 12.0 14.0 2.1 -19.4 -15.3 -10.7 15
16 Property-casualty insurance companies 1.9 -0.4 6.9 -8.4 -5.6 -5.3 -5.5 -5.6 -6.1 -8.1 -4.9 16 17 Life insurance companies 5.8 4.0 -1.6 -13.5 -6.8 -5.5 -5.6 -11.2 -5.0 -10.0 -11.4 17
18 Private pension funds -6.5 6.5 4.3 22.1 15.2 14.0 16.6 14.3 16.1 -5.4 16.3 18 19 State and local govt. retirement funds -3.8 0.9 12.3 20.9 13.5 15.1 28.2 6.3 4.5 9.1 3.5 19 20 Federal government retirement funds 0.0 0.6 0.7 1.5 -1.7 -2.2 -1.9 -1.8 -0.8 -2.9 0.7 20
21 Money market mutual funds -213.1 -140.2 0.9 -60.2 17.6 16.2 57.5 20.9 -24.3 -43.4 -19.6 21 22 Mutual funds 50.0 78.1 106.2 89.4 -21.6 9.6 -28.7 -80.9 13.6 -66.0 -42.2 22 23 Government-sponsored enterprises -27.4 -85.1 -18.1 -48.3 -22.7 -39.9 -32.5 8.7 -27.2 -17.2 8.1 23
24 ABS issuers -224.2 -96.0 -3.3 -0.0 -0.2 -0.6 -0.3 -0.1 0.2 0.0 0.3 24 25 REITs 15.6 38.2 104.7 109.5 -95.6 -46.7 -73.4 -82.7 -179.7 -35.4 44.1 25
26 Brokers and dealers -131.8 38.9 -2.1 21.9 -55.4 -62.8 -112.3 -80.7 34.0 -3.3 3.4 26 27 Holding companies -7.0 -3.2 12.0 -24.3 13.5 12.3 -4.2 32.4 13.5 -7.4 1.2 27
(1) Agency- and GSE-backed securities include: issues of federal budget agencies (line 2) such as those for the TVA; issues of government-sponsored enterprises (line 3) such as Fannie Mae and FHLB; and agency- and GSE-backed mortgage pool securities issued by GNMA, Fannie Mae, Freddie Mac, and the Farmers Home Administration (line 4). Only the budget agency issues are considered officially to be part of the total borrowing of the federal government, which is shown in table F.209, line 43.

Flo
ws
Z.1, September 18, 2014 51
F.211 Municipal Securities and LoansBillions of dollars; quarterly figures are seasonally adjusted annual rates
2009 2010 2011 2012 2013 2013 2014 Q1 Q2 Q3 Q4 Q1 Q2
1 Net change in liabilities 155.3 99.7 -52.8 -4.9 -43.2 61.4 -15.1 -105.4 -113.8 -38.0 15.7 1
2 State and local governments 112.2 68.7 -53.6 -5.7 -39.4 56.0 -4.8 -109.9 -99.1 -39.0 35.2 2 3 Short-term (1) 7.8 -0.7 -10.6 3.8 -10.9 -2.9 -4.6 -17.8 -18.1 -5.0 16.0 3 4 Long-term 104.4 69.3 -42.9 -9.4 -28.6 58.9 -0.1 -92.0 -80.9 -34.0 19.2 4
5 Nonprofit organizations (2) 5.9 -2.2 -7.8 -14.5 -13.1 -6.5 -14.6 -13.4 -18.1 -1.0 -2.3 5 6 Nonfinancial corporate business 37.2 33.2 8.5 15.2 9.3 11.9 4.3 17.8 3.3 2.0 -17.2 6 (industrial revenue bonds)
7 Net change in assets 155.3 99.7 -52.8 -4.9 -43.2 61.4 -15.1 -105.4 -113.8 -38.0 15.7 7
8 Household sector 107.1 43.6 -65.6 -144.9 -43.3 -6.5 -28.7 -67.0 -71.2 -78.3 -39.6 8 9 Nonfinancial corporate business 0.9 -3.2 -1.6 1.7 -11.9 -38.3 0.1 0.7 -10.2 -7.4 -0.6 9 10 Nonfinancial noncorporate business 0.2 0.5 0.1 0.1 0.1 0.0 0.1 0.1 0.2 0.1 0.3 10
11 State and local governments 1.0 1.4 0.4 0.5 0.2 1.1 0.1 -0.4 0.0 0.8 1.2 11 12 Rest of the world 7.7 13.1 0.6 -0.6 4.3 3.1 3.9 5.7 4.6 3.2 2.0 12
13 U.S.-chartered depository institutions 2.4 30.3 42.6 67.8 53.8 54.9 63.9 49.1 47.4 37.7 17.5 13 14 Foreign banking offices in U.S. 0.0 0.0 0.0 0.0 0.0 0.0 0.0 0.0 0.0 0.0 0.0 14 15 Banks in U.S.-affiliated areas 0.9 -0.9 0.9 -0.8 0.9 0.2 0.2 3.0 0.3 -0.6 -2.8 15 16 Credit unions 0.0 0.0 3.2 1.0 0.3 4.5 -1.2 1.5 -3.5 -0.1 1.6 16
17 Property-casualty insurance companies -12.6 -21.0 -17.4 -2.9 -2.3 -1.1 -1.8 -2.2 -3.9 -0.2 0.2 17 18 Life insurance companies 26.1 39.2 9.4 9.7 10.1 10.5 10.6 8.1 11.3 9.1 11.6 18 19 State and local govt. retirement funds 0.1 0.8 -0.7 -0.7 0.2 -0.3 1.2 -0.3 0.3 -0.8 -0.0 19
20 Money market mutual funds -69.4 -53.4 -29.4 -20.6 -28.3 -63.4 15.5 -6.1 -59.2 -13.9 -31.0 20 21 Mutual funds 89.4 46.7 15.7 86.2 -13.5 76.8 -22.5 -80.9 -27.3 17.3 46.5 21 22 Closed-end funds 3.3 0.4 0.9 3.4 -1.7 1.9 -0.6 -5.6 -2.4 3.6 2.5 22 23 Exchange-traded funds 3.6 1.7 1.0 3.6 -0.8 2.9 -1.8 -4.0 -0.3 1.5 3.1 23
24 Government-sponsored enterprises -2.2 -4.2 -3.9 -4.1 -3.5 -2.6 -5.9 -4.1 -1.4 -3.0 -2.1 24 25 Brokers and dealers -3.3 4.6 -9.1 -4.3 -8.0 17.7 -48.1 -3.0 1.5 -7.1 5.3 25
(1) Debt with original maturity of 13 months or less.(2) Liability of the households and nonprofit organizations sector (tables F.100 and L.100).
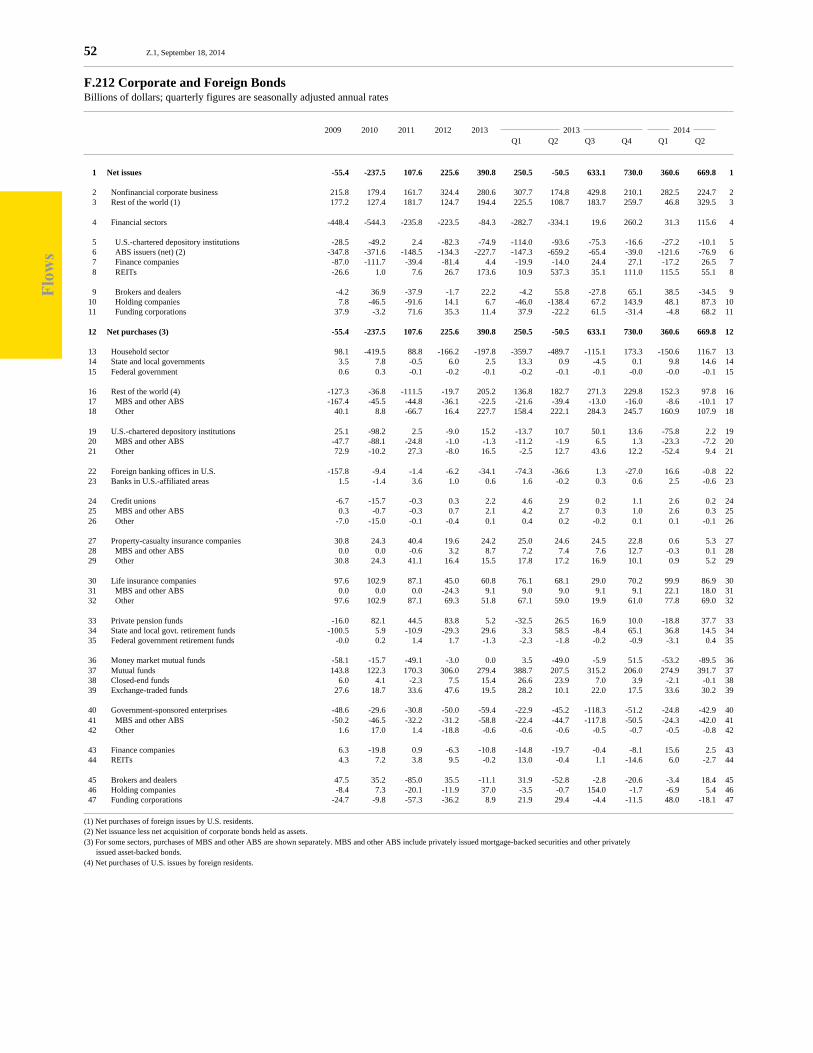
Flo
ws
52 Z.1, September 18, 2014
F.212 Corporate and Foreign BondsBillions of dollars; quarterly figures are seasonally adjusted annual rates
2009 2010 2011 2012 2013 2013 2014 Q1 Q2 Q3 Q4 Q1 Q2
1 Net issues -55.4 -237.5 107.6 225.6 390.8 250.5 -50.5 633.1 730.0 360.6 669.8 1
2 Nonfinancial corporate business 215.8 179.4 161.7 324.4 280.6 307.7 174.8 429.8 210.1 282.5 224.7 2 3 Rest of the world (1) 177.2 127.4 181.7 124.7 194.4 225.5 108.7 183.7 259.7 46.8 329.5 3
4 Financial sectors -448.4 -544.3 -235.8 -223.5 -84.3 -282.7 -334.1 19.6 260.2 31.3 115.6 4
5 U.S.-chartered depository institutions -28.5 -49.2 2.4 -82.3 -74.9 -114.0 -93.6 -75.3 -16.6 -27.2 -10.1 5 6 ABS issuers (net) (2) -347.8 -371.6 -148.5 -134.3 -227.7 -147.3 -659.2 -65.4 -39.0 -121.6 -76.9 6 7 Finance companies -87.0 -111.7 -39.4 -81.4 4.4 -19.9 -14.0 24.4 27.1 -17.2 26.5 7 8 REITs -26.6 1.0 7.6 26.7 173.6 10.9 537.3 35.1 111.0 115.5 55.1 8
9 Brokers and dealers -4.2 36.9 -37.9 -1.7 22.2 -4.2 55.8 -27.8 65.1 38.5 -34.5 9 10 Holding companies 7.8 -46.5 -91.6 14.1 6.7 -46.0 -138.4 67.2 143.9 48.1 87.3 10 11 Funding corporations 37.9 -3.2 71.6 35.3 11.4 37.9 -22.2 61.5 -31.4 -4.8 68.2 11
12 Net purchases (3) -55.4 -237.5 107.6 225.6 390.8 250.5 -50.5 633.1 730.0 360.6 669.8 12
13 Household sector 98.1 -419.5 88.8 -166.2 -197.8 -359.7 -489.7 -115.1 173.3 -150.6 116.7 13 14 State and local governments 3.5 7.8 -0.5 6.0 2.5 13.3 0.9 -4.5 0.1 9.8 14.6 14 15 Federal government 0.6 0.3 -0.1 -0.2 -0.1 -0.2 -0.1 -0.1 -0.0 -0.0 -0.1 15
16 Rest of the world (4) -127.3 -36.8 -111.5 -19.7 205.2 136.8 182.7 271.3 229.8 152.3 97.8 16 17 MBS and other ABS -167.4 -45.5 -44.8 -36.1 -22.5 -21.6 -39.4 -13.0 -16.0 -8.6 -10.1 17 18 Other 40.1 8.8 -66.7 16.4 227.7 158.4 222.1 284.3 245.7 160.9 107.9 18
19 U.S.-chartered depository institutions 25.1 -98.2 2.5 -9.0 15.2 -13.7 10.7 50.1 13.6 -75.8 2.2 19 20 MBS and other ABS -47.7 -88.1 -24.8 -1.0 -1.3 -11.2 -1.9 6.5 1.3 -23.3 -7.2 20 21 Other 72.9 -10.2 27.3 -8.0 16.5 -2.5 12.7 43.6 12.2 -52.4 9.4 21
22 Foreign banking offices in U.S. -157.8 -9.4 -1.4 -6.2 -34.1 -74.3 -36.6 1.3 -27.0 16.6 -0.8 22 23 Banks in U.S.-affiliated areas 1.5 -1.4 3.6 1.0 0.6 1.6 -0.2 0.3 0.6 2.5 -0.6 23
24 Credit unions -6.7 -15.7 -0.3 0.3 2.2 4.6 2.9 0.2 1.1 2.6 0.2 24 25 MBS and other ABS 0.3 -0.7 -0.3 0.7 2.1 4.2 2.7 0.3 1.0 2.6 0.3 25 26 Other -7.0 -15.0 -0.1 -0.4 0.1 0.4 0.2 -0.2 0.1 0.1 -0.1 26
27 Property-casualty insurance companies 30.8 24.3 40.4 19.6 24.2 25.0 24.6 24.5 22.8 0.6 5.3 27 28 MBS and other ABS 0.0 0.0 -0.6 3.2 8.7 7.2 7.4 7.6 12.7 -0.3 0.1 28 29 Other 30.8 24.3 41.1 16.4 15.5 17.8 17.2 16.9 10.1 0.9 5.2 29
30 Life insurance companies 97.6 102.9 87.1 45.0 60.8 76.1 68.1 29.0 70.2 99.9 86.9 30 31 MBS and other ABS 0.0 0.0 0.0 -24.3 9.1 9.0 9.0 9.1 9.1 22.1 18.0 31 32 Other 97.6 102.9 87.1 69.3 51.8 67.1 59.0 19.9 61.0 77.8 69.0 32
33 Private pension funds -16.0 82.1 44.5 83.8 5.2 -32.5 26.5 16.9 10.0 -18.8 37.7 33 34 State and local govt. retirement funds -100.5 5.9 -10.9 -29.3 29.6 3.3 58.5 -8.4 65.1 36.8 14.5 34 35 Federal government retirement funds -0.0 0.2 1.4 1.7 -1.3 -2.3 -1.8 -0.2 -0.9 -3.1 0.4 35
36 Money market mutual funds -58.1 -15.7 -49.1 -3.0 0.0 3.5 -49.0 -5.9 51.5 -53.2 -89.5 36 37 Mutual funds 143.8 122.3 170.3 306.0 279.4 388.7 207.5 315.2 206.0 274.9 391.7 37 38 Closed-end funds 6.0 4.1 -2.3 7.5 15.4 26.6 23.9 7.0 3.9 -2.1 -0.1 38 39 Exchange-traded funds 27.6 18.7 33.6 47.6 19.5 28.2 10.1 22.0 17.5 33.6 30.2 39
40 Government-sponsored enterprises -48.6 -29.6 -30.8 -50.0 -59.4 -22.9 -45.2 -118.3 -51.2 -24.8 -42.9 40 41 MBS and other ABS -50.2 -46.5 -32.2 -31.2 -58.8 -22.4 -44.7 -117.8 -50.5 -24.3 -42.0 41 42 Other 1.6 17.0 1.4 -18.8 -0.6 -0.6 -0.6 -0.5 -0.7 -0.5 -0.8 42
43 Finance companies 6.3 -19.8 0.9 -6.3 -10.8 -14.8 -19.7 -0.4 -8.1 15.6 2.5 43 44 REITs 4.3 7.2 3.8 9.5 -0.2 13.0 -0.4 1.1 -14.6 6.0 -2.7 44
45 Brokers and dealers 47.5 35.2 -85.0 35.5 -11.1 31.9 -52.8 -2.8 -20.6 -3.4 18.4 45 46 Holding companies -8.4 7.3 -20.1 -11.9 37.0 -3.5 -0.7 154.0 -1.7 -6.9 5.4 46 47 Funding corporations -24.7 -9.8 -57.3 -36.2 8.9 21.9 29.4 -4.4 -11.5 48.0 -18.1 47
(1) Net purchases of foreign issues by U.S. residents.(2) Net issuance less net acquisition of corporate bonds held as assets.(3) For some sectors, purchases of MBS and other ABS are shown separately. MBS and other ABS include privately issued mortgage-backed securities and other privately issued asset-backed bonds.(4) Net purchases of U.S. issues by foreign residents.

Flo
ws
Z.1, September 18, 2014 53
F.213 Corporate Equities (1)Billions of dollars; quarterly figures are seasonally adjusted annual rates
2009 2010 2011 2012 2013 2013 2014 Q1 Q2 Q3 Q4 Q1 Q2
1 Net issues 327.1 15.4 -285.7 -87.9 65.4 285.8 42.5 -151.7 84.8 -155.0 289.4 1
2 Nonfinancial corporate business -52.5 -255.1 -456.7 -359.5 -373.3 -219.3 -376.1 -415.0 -483.0 -517.9 -353.4 2
3 Rest of the world (2) 63.7 79.2 7.0 103.3 275.2 269.2 371.3 78.7 381.8 325.0 342.5 3
4 Financial sectors 315.9 191.4 164.1 168.3 163.5 235.9 47.4 184.6 186.0 37.9 300.3 4
5 U.S.-chartered depository institutions 11.6 11.9 6.4 1.6 2.2 1.0 0.5 2.6 4.9 2.5 4.4 5 6 Property-casualty insurance companies -5.3 -12.7 -10.7 -14.5 -7.6 -3.6 -6.4 -9.5 -11.0 -17.9 -8.4 6 7 Life insurance companies -0.9 -4.8 -11.5 -9.9 -9.2 -6.6 -9.7 -10.7 -9.6 -14.3 -11.7 7 8 Closed-end funds 7.1 0.5 -2.9 2.6 -1.6 17.8 13.4 -13.2 -24.4 7.1 9.4 8 9 Exchange-traded funds 116.5 118.0 117.6 185.2 179.0 207.7 60.2 214.4 233.9 57.3 229.6 9
10 REITs 24.2 28.2 37.5 47.6 46.2 64.2 63.1 24.9 32.6 18.9 46.9 10 11 Government-sponsored enterprises 96.0 38.1 29.2 14.5 2.4 7.8 -10.7 3.3 9.2 -5.9 0.0 11 12 Brokers and dealers -32.4 -11.1 14.1 -50.7 -31.0 -45.4 -41.6 0.3 -37.1 -7.1 -0.1 12 13 Holding companies 68.6 19.8 2.9 0.6 -17.1 -7.0 -21.4 -27.5 -12.5 -2.7 30.3 13 14 Funding corporations (3) 30.5 3.5 -18.4 -8.6 0.0 0.0 0.0 0.0 0.0 0.0 0.0 14
15 Net purchases 327.1 15.4 -285.7 -87.9 65.4 285.8 42.5 -151.7 84.8 -155.0 289.4 15
16 Household sector -19.0 -221.0 -308.7 -241.3 -59.3 298.8 47.7 -648.9 65.3 -405.1 228.8 16 17 State and local governments -2.2 -0.0 -2.5 3.2 1.3 7.1 0.5 -2.4 0.1 5.2 7.8 17 18 Federal government 0.6 24.1 40.3 -13.2 -4.8 -5.2 -2.8 -10.3 -1.1 -0.6 -1.1 18 19 Rest of the world (4) 192.7 127.8 44.0 126.8 -74.8 -56.3 -141.0 280.7 -382.6 348.4 -84.6 19
20 Monetary authority 25.1 1.3 -26.4 0.0 0.0 0.0 0.0 0.0 0.0 0.0 0.0 20 21 U.S.-chartered depository institutions 6.3 -1.8 1.0 -10.5 0.8 -2.1 -4.0 1.3 8.1 -2.5 -0.7 21 22 Foreign banking offices in U.S. 0.0 0.1 -0.0 0.0 0.0 0.0 0.0 0.0 0.0 0.0 0.0 22
23 Property-casualty insurance companies -2.8 -20.9 2.9 4.6 3.5 5.8 10.7 0.1 -2.6 1.9 -13.1 23 24 Life insurance companies 33.4 45.6 37.7 15.3 13.4 2.8 19.2 -2.8 34.5 31.3 37.3 24
25 Private pension funds -91.2 22.7 -60.3 -18.6 0.5 22.0 0.7 -12.4 -8.3 16.1 1.9 25 26 State and local govt. retirement funds 1.4 -78.5 -53.5 -46.1 -156.8 -147.3 -119.6 -136.2 -224.1 -222.0 -178.3 26 27 Federal government retirement funds 8.8 5.4 -4.2 -4.1 9.1 16.3 9.3 -9.2 20.0 7.2 -0.3 27
28 Mutual funds 86.5 44.3 4.9 -38.1 162.9 55.1 168.6 211.2 216.5 131.1 71.2 28 29 Closed-end funds -3.4 -4.7 -1.2 -8.6 -15.9 -12.8 -10.4 -14.3 -25.8 5.4 6.6 29 30 Exchange-traded funds 70.5 88.3 71.6 132.9 166.8 179.6 47.1 197.1 243.6 13.5 181.4 30
31 Brokers and dealers -4.6 -18.5 -5.0 9.7 18.6 -78.0 16.5 -5.5 141.5 -85.1 32.5 31 32 Funding corporations 25.1 1.3 -26.4 0.0 0.0 0.0 0.0 0.0 0.0 0.0 0.0 32
(1) Excludes mutual fund shares shown on table F.214.(2) Net purchases of foreign corporate equities and investment fund shares by U.S. residents; includes American Depositary Receipts (ADRs).(3) Preferred shares issued by AIG to the federal goverment under the TARP program and the monetary authority sector’s preferred interest in AIA Aurora LLC and ALICO Holdings LLC.(4) Net purchases of U.S. issues by foreign residents.
F.214 Mutual Fund Shares (1)Billions of dollars; quarterly figures are seasonally adjusted annual rates
1 Net issues 497.1 370.1 338.4 624.9 638.8 970.8 492.2 674.9 417.2 696.1 734.4 1
2 Net purchases 497.1 370.1 338.4 624.9 638.8 970.8 492.2 674.9 417.2 696.1 734.4 2
3 Household sector 376.2 281.8 333.4 606.7 642.5 976.6 510.8 669.4 413.1 665.2 629.5 3 4 Nonfinancial corporate business 35.3 11.1 -12.8 -0.1 0.9 0.9 0.9 0.9 0.9 0.9 0.9 4
5 State and local governments 1.7 2.9 0.3 1.6 0.7 3.6 0.2 -1.2 0.0 2.7 4.0 5 6 Rest of the world 19.4 58.2 74.7 89.7 -27.0 -60.0 -15.9 -33.9 1.8 19.3 82.2 6
7 U.S.-chartered depository institutions 14.8 -5.8 -0.8 -1.1 1.6 2.7 -8.9 5.6 7.1 8.5 5.1 7 8 Credit unions -0.7 0.2 0.3 0.4 -0.1 1.1 -0.8 -0.6 -0.2 0.1 -0.2 8
9 Property-casualty insurance companies 0.5 -0.1 -0.7 1.8 1.2 0.9 0.9 0.9 1.8 1.8 1.8 9 10 Life insurance companies 0.0 1.0 1.1 1.3 1.4 1.3 1.4 1.4 1.4 1.4 1.4 10
11 Private pension funds 51.5 34.7 8.4 -26.1 27.4 43.5 14.9 38.7 12.7 21.6 23.9 11 12 State and local govt. retirement funds -1.7 -13.9 -65.5 -49.3 -9.7 0.1 -11.3 -6.3 -21.3 -25.5 -14.3 12
(1) Shares of open-end investment companies; excludes shares of money market mutual funds, exchange-traded funds, and funding vehicles for variable annuities.
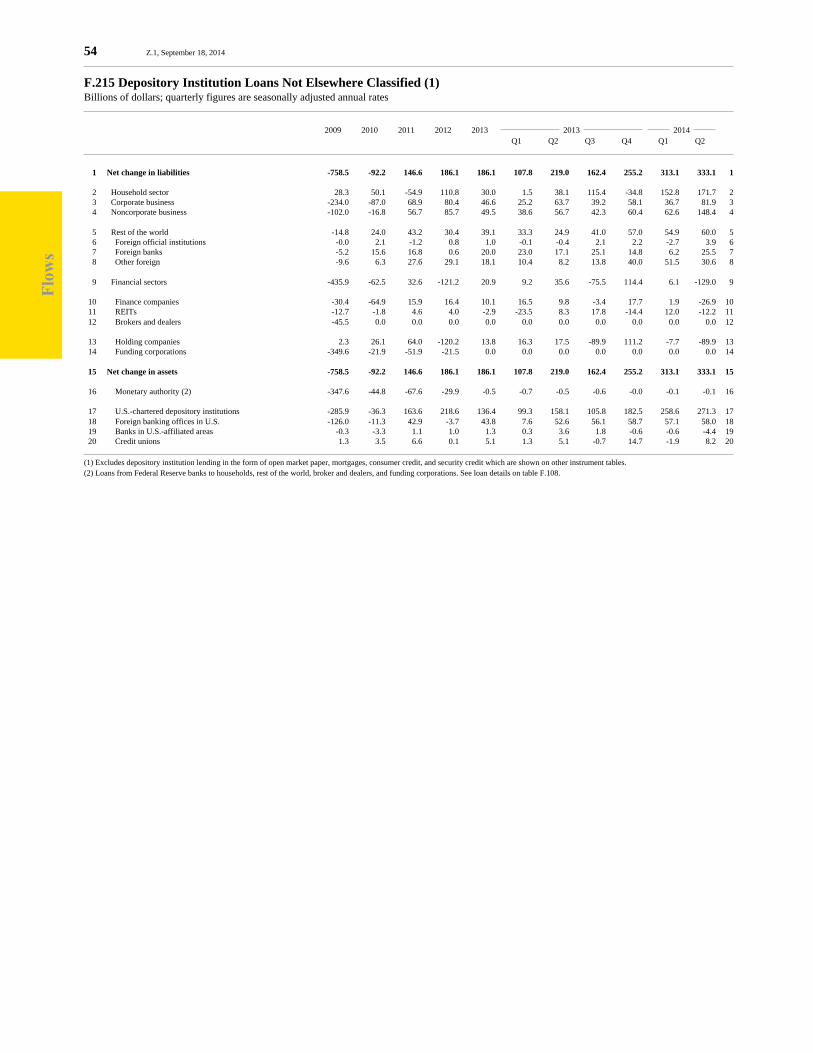
Flo
ws
54 Z.1, September 18, 2014
F.215 Depository Institution Loans Not Elsewhere Classified (1)Billions of dollars; quarterly figures are seasonally adjusted annual rates
2009 2010 2011 2012 2013 2013 2014 Q1 Q2 Q3 Q4 Q1 Q2
1 Net change in liabilities -758.5 -92.2 146.6 186.1 186.1 107.8 219.0 162.4 255.2 313.1 333.1 1
2 Household sector 28.3 50.1 -54.9 110.8 30.0 1.5 38.1 115.4 -34.8 152.8 171.7 2 3 Corporate business -234.0 -87.0 68.9 80.4 46.6 25.2 63.7 39.2 58.1 36.7 81.9 3 4 Noncorporate business -102.0 -16.8 56.7 85.7 49.5 38.6 56.7 42.3 60.4 62.6 148.4 4
5 Rest of the world -14.8 24.0 43.2 30.4 39.1 33.3 24.9 41.0 57.0 54.9 60.0 5 6 Foreign official institutions -0.0 2.1 -1.2 0.8 1.0 -0.1 -0.4 2.1 2.2 -2.7 3.9 6 7 Foreign banks -5.2 15.6 16.8 0.6 20.0 23.0 17.1 25.1 14.8 6.2 25.5 7 8 Other foreign -9.6 6.3 27.6 29.1 18.1 10.4 8.2 13.8 40.0 51.5 30.6 8
9 Financial sectors -435.9 -62.5 32.6 -121.2 20.9 9.2 35.6 -75.5 114.4 6.1 -129.0 9
10 Finance companies -30.4 -64.9 15.9 16.4 10.1 16.5 9.8 -3.4 17.7 1.9 -26.9 10 11 REITs -12.7 -1.8 4.6 4.0 -2.9 -23.5 8.3 17.8 -14.4 12.0 -12.2 11 12 Brokers and dealers -45.5 0.0 0.0 0.0 0.0 0.0 0.0 0.0 0.0 0.0 0.0 12
13 Holding companies 2.3 26.1 64.0 -120.2 13.8 16.3 17.5 -89.9 111.2 -7.7 -89.9 13 14 Funding corporations -349.6 -21.9 -51.9 -21.5 0.0 0.0 0.0 0.0 0.0 0.0 0.0 14
15 Net change in assets -758.5 -92.2 146.6 186.1 186.1 107.8 219.0 162.4 255.2 313.1 333.1 15
16 Monetary authority (2) -347.6 -44.8 -67.6 -29.9 -0.5 -0.7 -0.5 -0.6 -0.0 -0.1 -0.1 16
17 U.S.-chartered depository institutions -285.9 -36.3 163.6 218.6 136.4 99.3 158.1 105.8 182.5 258.6 271.3 17 18 Foreign banking offices in U.S. -126.0 -11.3 42.9 -3.7 43.8 7.6 52.6 56.1 58.7 57.1 58.0 18 19 Banks in U.S.-affiliated areas -0.3 -3.3 1.1 1.0 1.3 0.3 3.6 1.8 -0.6 -0.6 -4.4 19 20 Credit unions 1.3 3.5 6.6 0.1 5.1 1.3 5.1 -0.7 14.7 -1.9 8.2 20
(1) Excludes depository institution lending in the form of open market paper, mortgages, consumer credit, and security credit which are shown on other instrument tables.(2) Loans from Federal Reserve banks to households, rest of the world, broker and dealers, and funding corporations. See loan details on table F.108.
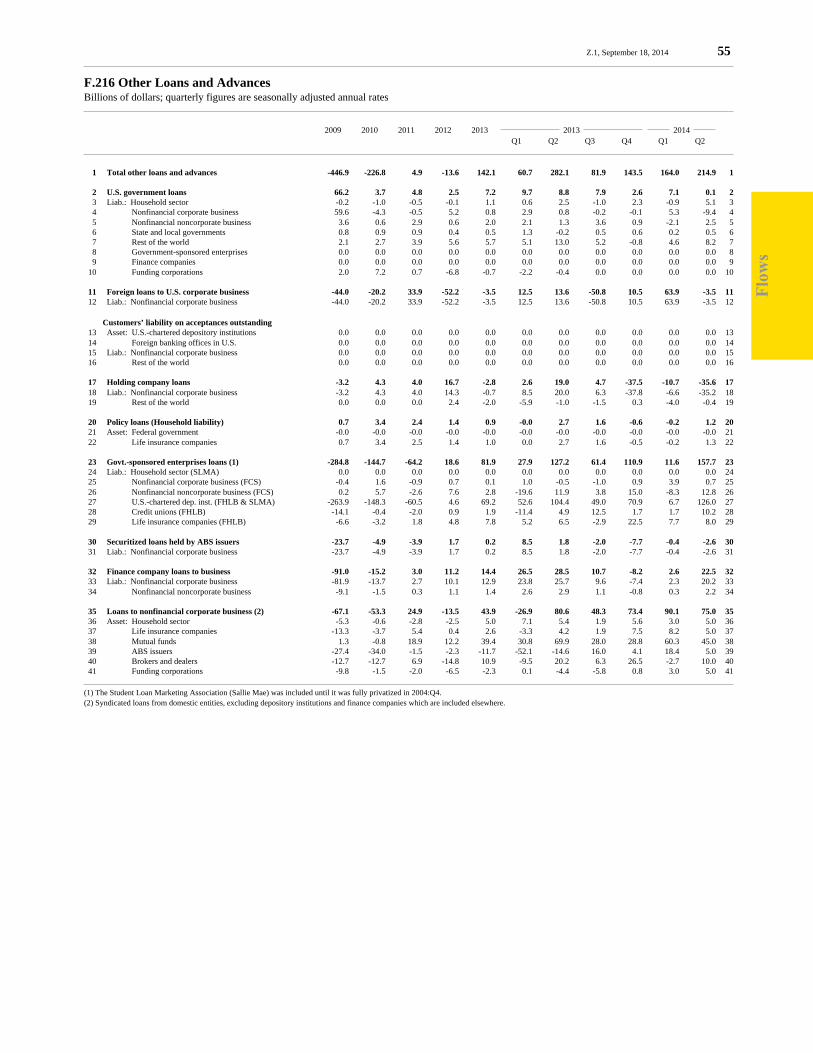
Flo
ws
Z.1, September 18, 2014 55
F.216 Other Loans and AdvancesBillions of dollars; quarterly figures are seasonally adjusted annual rates
2009 2010 2011 2012 2013 2013 2014 Q1 Q2 Q3 Q4 Q1 Q2
1 Total other loans and advances -446.9 -226.8 4.9 -13.6 142.1 60.7 282.1 81.9 143.5 164.0 214.9 1
2 U.S. government loans 66.2 3.7 4.8 2.5 7.2 9.7 8.8 7.9 2.6 7.1 0.1 2 3 Liab.: Household sector -0.2 -1.0 -0.5 -0.1 1.1 0.6 2.5 -1.0 2.3 -0.9 5.1 3 4 Nonfinancial corporate business 59.6 -4.3 -0.5 5.2 0.8 2.9 0.8 -0.2 -0.1 5.3 -9.4 4 5 Nonfinancial noncorporate business 3.6 0.6 2.9 0.6 2.0 2.1 1.3 3.6 0.9 -2.1 2.5 5 6 State and local governments 0.8 0.9 0.9 0.4 0.5 1.3 -0.2 0.5 0.6 0.2 0.5 6 7 Rest of the world 2.1 2.7 3.9 5.6 5.7 5.1 13.0 5.2 -0.8 4.6 8.2 7 8 Government-sponsored enterprises 0.0 0.0 0.0 0.0 0.0 0.0 0.0 0.0 0.0 0.0 0.0 8 9 Finance companies 0.0 0.0 0.0 0.0 0.0 0.0 0.0 0.0 0.0 0.0 0.0 9 10 Funding corporations 2.0 7.2 0.7 -6.8 -0.7 -2.2 -0.4 0.0 0.0 0.0 0.0 10
11 Foreign loans to U.S. corporate business -44.0 -20.2 33.9 -52.2 -3.5 12.5 13.6 -50.8 10.5 63.9 -3.5 11 12 Liab.: Nonfinancial corporate business -44.0 -20.2 33.9 -52.2 -3.5 12.5 13.6 -50.8 10.5 63.9 -3.5 12
Customers’ liability on acceptances outstanding 13 Asset: U.S.-chartered depository institutions 0.0 0.0 0.0 0.0 0.0 0.0 0.0 0.0 0.0 0.0 0.0 13 14 Foreign banking offices in U.S. 0.0 0.0 0.0 0.0 0.0 0.0 0.0 0.0 0.0 0.0 0.0 14 15 Liab.: Nonfinancial corporate business 0.0 0.0 0.0 0.0 0.0 0.0 0.0 0.0 0.0 0.0 0.0 15 16 Rest of the world 0.0 0.0 0.0 0.0 0.0 0.0 0.0 0.0 0.0 0.0 0.0 16
17 Holding company loans -3.2 4.3 4.0 16.7 -2.8 2.6 19.0 4.7 -37.5 -10.7 -35.6 17 18 Liab.: Nonfinancial corporate business -3.2 4.3 4.0 14.3 -0.7 8.5 20.0 6.3 -37.8 -6.6 -35.2 18 19 Rest of the world 0.0 0.0 0.0 2.4 -2.0 -5.9 -1.0 -1.5 0.3 -4.0 -0.4 19
20 Policy loans (Household liability) 0.7 3.4 2.4 1.4 0.9 -0.0 2.7 1.6 -0.6 -0.2 1.2 20 21 Asset: Federal government -0.0 -0.0 -0.0 -0.0 -0.0 -0.0 -0.0 -0.0 -0.0 -0.0 -0.0 21 22 Life insurance companies 0.7 3.4 2.5 1.4 1.0 0.0 2.7 1.6 -0.5 -0.2 1.3 22
23 Govt.-sponsored enterprises loans (1) -284.8 -144.7 -64.2 18.6 81.9 27.9 127.2 61.4 110.9 11.6 157.7 23 24 Liab.: Household sector (SLMA) 0.0 0.0 0.0 0.0 0.0 0.0 0.0 0.0 0.0 0.0 0.0 24 25 Nonfinancial corporate business (FCS) -0.4 1.6 -0.9 0.7 0.1 1.0 -0.5 -1.0 0.9 3.9 0.7 25 26 Nonfinancial noncorporate business (FCS) 0.2 5.7 -2.6 7.6 2.8 -19.6 11.9 3.8 15.0 -8.3 12.8 26 27 U.S.-chartered dep. inst. (FHLB & SLMA) -263.9 -148.3 -60.5 4.6 69.2 52.6 104.4 49.0 70.9 6.7 126.0 27 28 Credit unions (FHLB) -14.1 -0.4 -2.0 0.9 1.9 -11.4 4.9 12.5 1.7 1.7 10.2 28 29 Life insurance companies (FHLB) -6.6 -3.2 1.8 4.8 7.8 5.2 6.5 -2.9 22.5 7.7 8.0 29
30 Securitized loans held by ABS issuers -23.7 -4.9 -3.9 1.7 0.2 8.5 1.8 -2.0 -7.7 -0.4 -2.6 30 31 Liab.: Nonfinancial corporate business -23.7 -4.9 -3.9 1.7 0.2 8.5 1.8 -2.0 -7.7 -0.4 -2.6 31
32 Finance company loans to business -91.0 -15.2 3.0 11.2 14.4 26.5 28.5 10.7 -8.2 2.6 22.5 32 33 Liab.: Nonfinancial corporate business -81.9 -13.7 2.7 10.1 12.9 23.8 25.7 9.6 -7.4 2.3 20.2 33 34 Nonfinancial noncorporate business -9.1 -1.5 0.3 1.1 1.4 2.6 2.9 1.1 -0.8 0.3 2.2 34
35 Loans to nonfinancial corporate business (2) -67.1 -53.3 24.9 -13.5 43.9 -26.9 80.6 48.3 73.4 90.1 75.0 35 36 Asset: Household sector -5.3 -0.6 -2.8 -2.5 5.0 7.1 5.4 1.9 5.6 3.0 5.0 36 37 Life insurance companies -13.3 -3.7 5.4 0.4 2.6 -3.3 4.2 1.9 7.5 8.2 5.0 37 38 Mutual funds 1.3 -0.8 18.9 12.2 39.4 30.8 69.9 28.0 28.8 60.3 45.0 38 39 ABS issuers -27.4 -34.0 -1.5 -2.3 -11.7 -52.1 -14.6 16.0 4.1 18.4 5.0 39 40 Brokers and dealers -12.7 -12.7 6.9 -14.8 10.9 -9.5 20.2 6.3 26.5 -2.7 10.0 40 41 Funding corporations -9.8 -1.5 -2.0 -6.5 -2.3 0.1 -4.4 -5.8 0.8 3.0 5.0 41
(1) The Student Loan Marketing Association (Sallie Mae) was included until it was fully privatized in 2004:Q4.(2) Syndicated loans from domestic entities, excluding depository institutions and finance companies which are included elsewhere.

Flo
ws
56 Z.1, September 18, 2014
F.217 Total MortgagesBillions of dollars; quarterly figures are seasonally adjusted annual rates
2009 2010 2011 2012 2013 2013 2014 Q1 Q2 Q3 Q4 Q1 Q2
1 Net change in mortgages -51.7 -314.8 -147.6 -58.9 105.2 -95.0 124.1 237.7 154.1 47.1 213.3 1
2 Home 23.8 -160.4 -86.5 -71.3 3.9 -83.3 15.0 117.9 -33.8 -55.9 47.7 2 3 Multifamily residential 6.9 -4.5 7.3 35.5 37.5 16.6 42.0 43.0 48.4 45.3 56.3 3 4 Commercial -93.7 -158.0 -81.5 -28.9 61.1 -30.8 64.4 74.0 136.8 51.6 103.0 4 5 Farm 11.3 8.1 13.1 5.8 2.7 2.7 2.7 2.7 2.7 6.1 6.2 5
6 Net borrowing -51.7 -314.8 -147.6 -58.9 105.2 -95.0 124.1 237.7 154.1 47.1 213.3 6
7 Household sector 70.0 -177.8 -74.2 -61.2 10.9 -71.9 21.1 117.6 -23.1 -56.2 40.5 7
8 Nonfinancial business -133.4 -137.9 -86.9 -2.5 86.6 -43.7 98.4 134.4 157.1 90.6 166.2 8 9 Corporate -143.7 -130.6 -72.3 4.6 27.2 -8.9 15.7 38.3 63.8 34.3 54.5 9 10 Noncorporate 10.2 -7.3 -14.6 -7.1 59.3 -34.8 82.7 96.2 93.2 56.3 111.8 10
11 Federal government 0.0 0.0 0.0 0.0 0.0 0.0 0.0 0.0 0.0 0.0 0.0 11 12 REITs 11.8 0.8 13.5 4.8 7.8 20.6 4.6 -14.3 20.2 12.6 6.5 12
13 Net change in assets -51.7 -314.8 -147.6 -58.9 105.2 -95.0 124.1 237.7 154.1 47.1 213.3 13
14 Household sector -0.9 -10.9 0.7 -13.9 -7.2 -7.4 -8.0 -7.2 -6.0 -6.6 -7.2 14 15 Nonfinancial corporate business -4.1 -1.6 -0.6 -0.8 -0.8 -0.8 -0.8 -0.8 -0.8 -0.8 -0.8 15 16 Nonfinancial noncorporate business -1.2 4.2 0.5 0.6 0.9 0.3 1.1 1.1 1.2 0.9 2.0 16
17 State and local governments 8.6 13.5 2.2 9.4 4.2 17.9 2.3 -4.6 1.0 12.9 19.1 17 18 Federal government 12.6 -5.4 3.3 1.6 4.0 7.2 -0.5 3.7 5.5 1.9 2.3 18
19 U.S.-chartered depository institutions -178.1 -149.2 -105.3 13.7 -26.6 -20.5 -18.0 -55.5 -12.2 176.7 194.8 19 20 Foreign banking offices in U.S. -6.4 -2.5 -2.6 -1.9 -0.6 -4.9 -0.4 1.0 1.9 7.8 5.9 20 21 Banks in U.S.-affiliated areas -0.3 -6.5 -2.4 1.5 -2.5 -2.3 -2.7 -8.3 3.4 -1.8 -0.3 21 22 Credit unions 5.4 0.9 4.5 8.3 18.6 5.5 15.1 30.9 23.0 22.4 27.1 22
23 Property-casualty insurance companies -0.5 -0.3 0.8 0.7 2.3 0.9 2.9 1.8 3.7 1.3 2.1 23 24 Life insurance companies -16.3 -8.6 15.0 11.9 18.8 5.6 15.7 25.3 28.5 13.4 16.3 24
25 Private pension funds -2.4 2.8 -4.6 1.2 -3.4 -3.4 -3.3 -3.6 -3.2 -2.9 3.5 25 26 State and local govt. retirement funds -2.7 -0.4 -0.1 -0.7 -2.6 -2.2 -1.9 -2.0 -4.2 9.6 3.7 26
27 Government-sponsored enterprises (1) 2.4 -71.0 -60.5 -71.4 72.5 -92.7 110.2 206.5 66.0 -180.6 -19.6 27 28 Agency- and GSE-backed mortgage pools 458.3 186.9 165.3 132.2 132.4 120.9 110.1 154.4 144.1 77.4 27.8 28
29 ABS issuers -248.0 -211.3 -144.7 -134.3 -217.8 -89.7 -629.2 -80.8 -71.5 -165.6 -39.4 29 30 Finance companies -47.8 -54.2 -30.9 -25.7 -21.9 -23.7 -10.9 -26.1 -26.9 -13.0 -17.9 30 31 REITs -30.2 -1.3 11.7 8.6 135.0 -5.5 542.6 2.0 0.7 94.0 -6.0 31
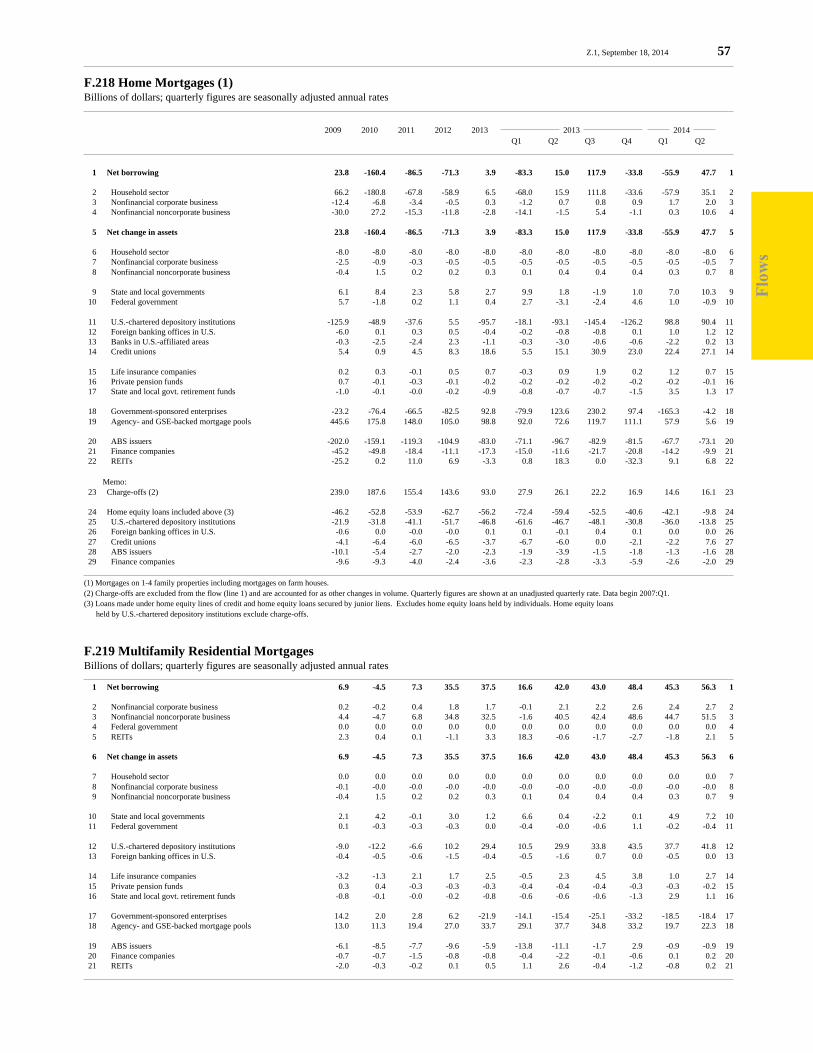
Flo
ws
Z.1, September 18, 2014 57
F.218 Home Mortgages (1)Billions of dollars; quarterly figures are seasonally adjusted annual rates
2009 2010 2011 2012 2013 2013 2014 Q1 Q2 Q3 Q4 Q1 Q2
1 Net borrowing 23.8 -160.4 -86.5 -71.3 3.9 -83.3 15.0 117.9 -33.8 -55.9 47.7 1
2 Household sector 66.2 -180.8 -67.8 -58.9 6.5 -68.0 15.9 111.8 -33.6 -57.9 35.1 2 3 Nonfinancial corporate business -12.4 -6.8 -3.4 -0.5 0.3 -1.2 0.7 0.8 0.9 1.7 2.0 3 4 Nonfinancial noncorporate business -30.0 27.2 -15.3 -11.8 -2.8 -14.1 -1.5 5.4 -1.1 0.3 10.6 4
5 Net change in assets 23.8 -160.4 -86.5 -71.3 3.9 -83.3 15.0 117.9 -33.8 -55.9 47.7 5
6 Household sector -8.0 -8.0 -8.0 -8.0 -8.0 -8.0 -8.0 -8.0 -8.0 -8.0 -8.0 6 7 Nonfinancial corporate business -2.5 -0.9 -0.3 -0.5 -0.5 -0.5 -0.5 -0.5 -0.5 -0.5 -0.5 7 8 Nonfinancial noncorporate business -0.4 1.5 0.2 0.2 0.3 0.1 0.4 0.4 0.4 0.3 0.7 8
9 State and local governments 6.1 8.4 2.3 5.8 2.7 9.9 1.8 -1.9 1.0 7.0 10.3 9 10 Federal government 5.7 -1.8 0.2 1.1 0.4 2.7 -3.1 -2.4 4.6 1.0 -0.9 10
11 U.S.-chartered depository institutions -125.9 -48.9 -37.6 5.5 -95.7 -18.1 -93.1 -145.4 -126.2 98.8 90.4 11 12 Foreign banking offices in U.S. -6.0 0.1 0.3 0.5 -0.4 -0.2 -0.8 -0.8 0.1 1.0 1.2 12 13 Banks in U.S.-affiliated areas -0.3 -2.5 -2.4 2.3 -1.1 -0.3 -3.0 -0.6 -0.6 -2.2 0.2 13 14 Credit unions 5.4 0.9 4.5 8.3 18.6 5.5 15.1 30.9 23.0 22.4 27.1 14
15 Life insurance companies 0.2 0.3 -0.1 0.5 0.7 -0.3 0.9 1.9 0.2 1.2 0.7 15 16 Private pension funds 0.7 -0.1 -0.3 -0.1 -0.2 -0.2 -0.2 -0.2 -0.2 -0.2 -0.1 16 17 State and local govt. retirement funds -1.0 -0.1 -0.0 -0.2 -0.9 -0.8 -0.7 -0.7 -1.5 3.5 1.3 17
18 Government-sponsored enterprises -23.2 -76.4 -66.5 -82.5 92.8 -79.9 123.6 230.2 97.4 -165.3 -4.2 18 19 Agency- and GSE-backed mortgage pools 445.6 175.8 148.0 105.0 98.8 92.0 72.6 119.7 111.1 57.9 5.6 19
20 ABS issuers -202.0 -159.1 -119.3 -104.9 -83.0 -71.1 -96.7 -82.9 -81.5 -67.7 -73.1 20 21 Finance companies -45.2 -49.8 -18.4 -11.1 -17.3 -15.0 -11.6 -21.7 -20.8 -14.2 -9.9 21 22 REITs -25.2 0.2 11.0 6.9 -3.3 0.8 18.3 0.0 -32.3 9.1 6.8 22
Memo: 23 Charge-offs (2) 239.0 187.6 155.4 143.6 93.0 27.9 26.1 22.2 16.9 14.6 16.1 23
24 Home equity loans included above (3) -46.2 -52.8 -53.9 -62.7 -56.2 -72.4 -59.4 -52.5 -40.6 -42.1 -9.8 24 25 U.S.-chartered depository institutions -21.9 -31.8 -41.1 -51.7 -46.8 -61.6 -46.7 -48.1 -30.8 -36.0 -13.8 25 26 Foreign banking offices in U.S. -0.6 0.0 -0.0 -0.0 0.1 0.1 -0.1 0.4 0.1 0.0 0.0 26 27 Credit unions -4.1 -6.4 -6.0 -6.5 -3.7 -6.7 -6.0 0.0 -2.1 -2.2 7.6 27 28 ABS issuers -10.1 -5.4 -2.7 -2.0 -2.3 -1.9 -3.9 -1.5 -1.8 -1.3 -1.6 28 29 Finance companies -9.6 -9.3 -4.0 -2.4 -3.6 -2.3 -2.8 -3.3 -5.9 -2.6 -2.0 29
(1) Mortgages on 1-4 family properties including mortgages on farm houses.(2) Charge-offs are excluded from the flow (line 1) and are accounted for as other changes in volume. Quarterly figures are shown at an unadjusted quarterly rate. Data begin 2007:Q1.(3) Loans made under home equity lines of credit and home equity loans secured by junior liens. Excludes home equity loans held by individuals. Home equity loans held by U.S.-chartered depository institutions exclude charge-offs.
F.219 Multifamily Residential MortgagesBillions of dollars; quarterly figures are seasonally adjusted annual rates
1 Net borrowing 6.9 -4.5 7.3 35.5 37.5 16.6 42.0 43.0 48.4 45.3 56.3 1
2 Nonfinancial corporate business 0.2 -0.2 0.4 1.8 1.7 -0.1 2.1 2.2 2.6 2.4 2.7 2 3 Nonfinancial noncorporate business 4.4 -4.7 6.8 34.8 32.5 -1.6 40.5 42.4 48.6 44.7 51.5 3 4 Federal government 0.0 0.0 0.0 0.0 0.0 0.0 0.0 0.0 0.0 0.0 0.0 4 5 REITs 2.3 0.4 0.1 -1.1 3.3 18.3 -0.6 -1.7 -2.7 -1.8 2.1 5
6 Net change in assets 6.9 -4.5 7.3 35.5 37.5 16.6 42.0 43.0 48.4 45.3 56.3 6
7 Household sector 0.0 0.0 0.0 0.0 0.0 0.0 0.0 0.0 0.0 0.0 0.0 7 8 Nonfinancial corporate business -0.1 -0.0 -0.0 -0.0 -0.0 -0.0 -0.0 -0.0 -0.0 -0.0 -0.0 8 9 Nonfinancial noncorporate business -0.4 1.5 0.2 0.2 0.3 0.1 0.4 0.4 0.4 0.3 0.7 9
10 State and local governments 2.1 4.2 -0.1 3.0 1.2 6.6 0.4 -2.2 0.1 4.9 7.2 10 11 Federal government 0.1 -0.3 -0.3 -0.3 0.0 -0.4 -0.0 -0.6 1.1 -0.2 -0.4 11
12 U.S.-chartered depository institutions -9.0 -12.2 -6.6 10.2 29.4 10.5 29.9 33.8 43.5 37.7 41.8 12 13 Foreign banking offices in U.S. -0.4 -0.5 -0.6 -1.5 -0.4 -0.5 -1.6 0.7 0.0 -0.5 0.0 13
14 Life insurance companies -3.2 -1.3 2.1 1.7 2.5 -0.5 2.3 4.5 3.8 1.0 2.7 14 15 Private pension funds 0.3 0.4 -0.3 -0.3 -0.3 -0.4 -0.4 -0.4 -0.3 -0.3 -0.2 15 16 State and local govt. retirement funds -0.8 -0.1 -0.0 -0.2 -0.8 -0.6 -0.6 -0.6 -1.3 2.9 1.1 16
17 Government-sponsored enterprises 14.2 2.0 2.8 6.2 -21.9 -14.1 -15.4 -25.1 -33.2 -18.5 -18.4 17 18 Agency- and GSE-backed mortgage pools 13.0 11.3 19.4 27.0 33.7 29.1 37.7 34.8 33.2 19.7 22.3 18
19 ABS issuers -6.1 -8.5 -7.7 -9.6 -5.9 -13.8 -11.1 -1.7 2.9 -0.9 -0.9 19 20 Finance companies -0.7 -0.7 -1.5 -0.8 -0.8 -0.4 -2.2 -0.1 -0.6 0.1 0.2 20 21 REITs -2.0 -0.3 -0.2 0.1 0.5 1.1 2.6 -0.4 -1.2 -0.8 0.2 21
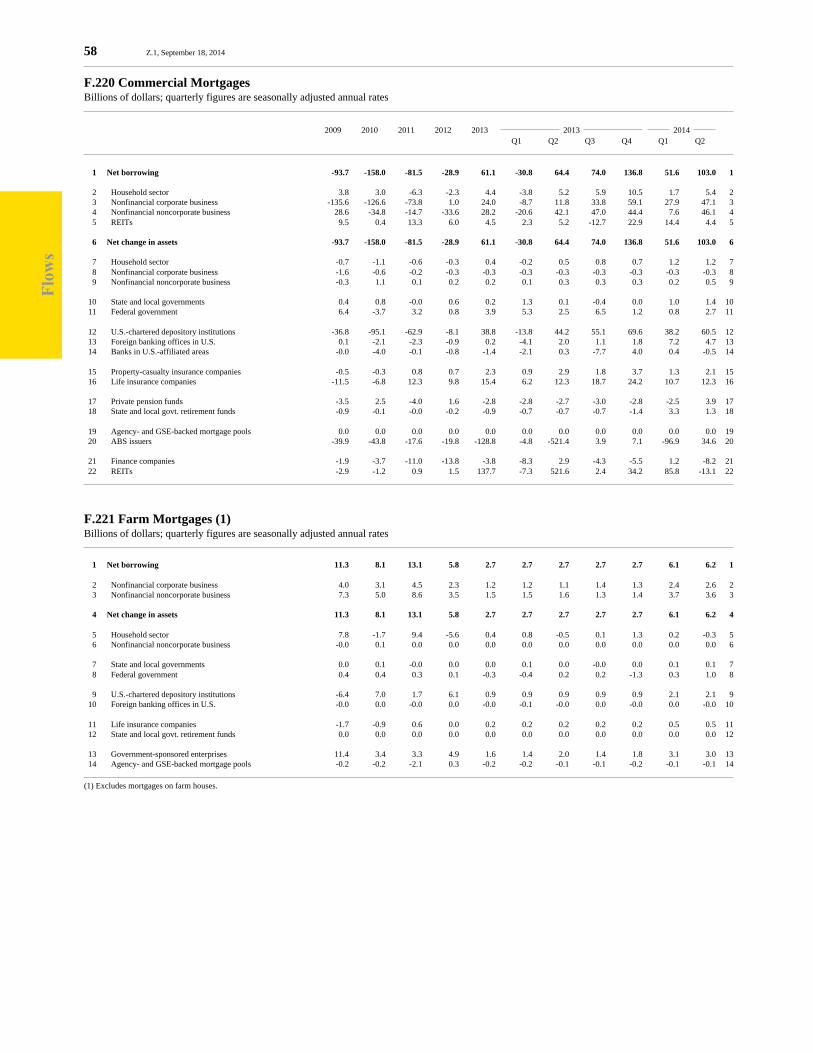
Flo
ws
58 Z.1, September 18, 2014
F.220 Commercial MortgagesBillions of dollars; quarterly figures are seasonally adjusted annual rates
2009 2010 2011 2012 2013 2013 2014 Q1 Q2 Q3 Q4 Q1 Q2
1 Net borrowing -93.7 -158.0 -81.5 -28.9 61.1 -30.8 64.4 74.0 136.8 51.6 103.0 1
2 Household sector 3.8 3.0 -6.3 -2.3 4.4 -3.8 5.2 5.9 10.5 1.7 5.4 2 3 Nonfinancial corporate business -135.6 -126.6 -73.8 1.0 24.0 -8.7 11.8 33.8 59.1 27.9 47.1 3 4 Nonfinancial noncorporate business 28.6 -34.8 -14.7 -33.6 28.2 -20.6 42.1 47.0 44.4 7.6 46.1 4 5 REITs 9.5 0.4 13.3 6.0 4.5 2.3 5.2 -12.7 22.9 14.4 4.4 5
6 Net change in assets -93.7 -158.0 -81.5 -28.9 61.1 -30.8 64.4 74.0 136.8 51.6 103.0 6
7 Household sector -0.7 -1.1 -0.6 -0.3 0.4 -0.2 0.5 0.8 0.7 1.2 1.2 7 8 Nonfinancial corporate business -1.6 -0.6 -0.2 -0.3 -0.3 -0.3 -0.3 -0.3 -0.3 -0.3 -0.3 8 9 Nonfinancial noncorporate business -0.3 1.1 0.1 0.2 0.2 0.1 0.3 0.3 0.3 0.2 0.5 9
10 State and local governments 0.4 0.8 -0.0 0.6 0.2 1.3 0.1 -0.4 0.0 1.0 1.4 10 11 Federal government 6.4 -3.7 3.2 0.8 3.9 5.3 2.5 6.5 1.2 0.8 2.7 11
12 U.S.-chartered depository institutions -36.8 -95.1 -62.9 -8.1 38.8 -13.8 44.2 55.1 69.6 38.2 60.5 12 13 Foreign banking offices in U.S. 0.1 -2.1 -2.3 -0.9 0.2 -4.1 2.0 1.1 1.8 7.2 4.7 13 14 Banks in U.S.-affiliated areas -0.0 -4.0 -0.1 -0.8 -1.4 -2.1 0.3 -7.7 4.0 0.4 -0.5 14
15 Property-casualty insurance companies -0.5 -0.3 0.8 0.7 2.3 0.9 2.9 1.8 3.7 1.3 2.1 15 16 Life insurance companies -11.5 -6.8 12.3 9.8 15.4 6.2 12.3 18.7 24.2 10.7 12.3 16
17 Private pension funds -3.5 2.5 -4.0 1.6 -2.8 -2.8 -2.7 -3.0 -2.8 -2.5 3.9 17 18 State and local govt. retirement funds -0.9 -0.1 -0.0 -0.2 -0.9 -0.7 -0.7 -0.7 -1.4 3.3 1.3 18
19 Agency- and GSE-backed mortgage pools 0.0 0.0 0.0 0.0 0.0 0.0 0.0 0.0 0.0 0.0 0.0 19 20 ABS issuers -39.9 -43.8 -17.6 -19.8 -128.8 -4.8 -521.4 3.9 7.1 -96.9 34.6 20
21 Finance companies -1.9 -3.7 -11.0 -13.8 -3.8 -8.3 2.9 -4.3 -5.5 1.2 -8.2 21 22 REITs -2.9 -1.2 0.9 1.5 137.7 -7.3 521.6 2.4 34.2 85.8 -13.1 22
F.221 Farm Mortgages (1)Billions of dollars; quarterly figures are seasonally adjusted annual rates
1 Net borrowing 11.3 8.1 13.1 5.8 2.7 2.7 2.7 2.7 2.7 6.1 6.2 1
2 Nonfinancial corporate business 4.0 3.1 4.5 2.3 1.2 1.2 1.1 1.4 1.3 2.4 2.6 2 3 Nonfinancial noncorporate business 7.3 5.0 8.6 3.5 1.5 1.5 1.6 1.3 1.4 3.7 3.6 3
4 Net change in assets 11.3 8.1 13.1 5.8 2.7 2.7 2.7 2.7 2.7 6.1 6.2 4
5 Household sector 7.8 -1.7 9.4 -5.6 0.4 0.8 -0.5 0.1 1.3 0.2 -0.3 5 6 Nonfinancial noncorporate business -0.0 0.1 0.0 0.0 0.0 0.0 0.0 0.0 0.0 0.0 0.0 6
7 State and local governments 0.0 0.1 -0.0 0.0 0.0 0.1 0.0 -0.0 0.0 0.1 0.1 7 8 Federal government 0.4 0.4 0.3 0.1 -0.3 -0.4 0.2 0.2 -1.3 0.3 1.0 8
9 U.S.-chartered depository institutions -6.4 7.0 1.7 6.1 0.9 0.9 0.9 0.9 0.9 2.1 2.1 9 10 Foreign banking offices in U.S. -0.0 0.0 -0.0 0.0 -0.0 -0.1 -0.0 0.0 -0.0 0.0 -0.0 10
11 Life insurance companies -1.7 -0.9 0.6 0.0 0.2 0.2 0.2 0.2 0.2 0.5 0.5 11 12 State and local govt. retirement funds 0.0 0.0 0.0 0.0 0.0 0.0 0.0 0.0 0.0 0.0 0.0 12
13 Government-sponsored enterprises 11.4 3.4 3.3 4.9 1.6 1.4 2.0 1.4 1.8 3.1 3.0 13 14 Agency- and GSE-backed mortgage pools -0.2 -0.2 -2.1 0.3 -0.2 -0.2 -0.1 -0.1 -0.2 -0.1 -0.1 14
(1) Excludes mortgages on farm houses.

Flo
ws
Z.1, September 18, 2014 59
F.222 Consumer CreditBillions of dollars; quarterly figures are seasonally adjusted annual rates
2009 2010 2011 2012 2013 2013 2014 Q1 Q2 Q3 Q4 Q1 Q2
1 Net change in liabilities (Households) -103.6 -25.3 108.5 169.7 174.3 179.0 162.9 190.6 164.8 200.7 254.3 1
2 Net change in assets -103.6 -25.3 108.5 169.7 174.3 179.0 162.9 190.6 164.8 200.7 254.3 2
3 Households (nonprofit organizations) (1) -5.8 -10.4 -3.9 -8.8 -6.5 -7.4 -7.6 -7.4 -3.6 -5.5 -5.1 3 4 Nonfinancial corporate business -2.1 -11.4 1.9 1.7 -5.6 1.8 1.1 -3.5 -22.0 23.5 10.4 4 5 Nonfinancial noncorporate business 0.0 0.0 0.0 0.0 0.0 0.0 0.0 0.0 0.0 0.0 0.0 5
6 Federal government (2) 87.9 133.1 128.5 132.1 113.1 132.4 106.6 107.0 106.2 116.3 100.0 6 7 U.S.-chartered depository institutions -64.5 -70.3 7.1 28.1 52.9 26.0 33.6 71.8 80.4 40.8 95.2 7 8 Credit unions 0.9 -10.7 -3.4 20.6 21.9 25.7 21.1 24.5 16.4 35.5 47.4 8
9 Government-sponsored enterprises 0.0 0.0 0.0 0.0 0.0 0.0 0.0 0.0 0.0 0.0 0.0 9 10 ABS issuers -37.8 -42.3 -4.1 3.8 -0.8 6.2 -8.5 -2.4 1.4 -2.7 -4.1 10 11 Finance companies -82.4 -13.4 -17.4 -7.8 -0.6 -5.7 16.6 0.6 -14.1 -7.1 10.4 11
Memo:
12 Credit card loans (3) -88.0 -69.7 1.8 5.0 10.9 11.0 8.1 7.5 17.2 15.7 54.5 12 13 Auto loans -58.2 -40.7 17.1 59.9 69.7 58.0 63.8 81.7 75.4 66.7 86.7 13 14 Student loans (4) 101.0 80.8 99.9 119.0 91.7 81.1 88.8 96.9 100.1 88.0 104.2 14 15 Other consumer credit (5) -58.4 4.2 -10.2 -14.2 1.9 28.8 2.2 4.5 -27.9 30.3 8.9 15
(1) Student loans originated under the Federal Family Education Loan Program.(2) Includes loans originated by the Department of Education under the Federal Direct Loan Program and Perkins Loans, as well as Federal Family Education Loan Program loans that the government purchased from depository institutions, finance companies, and nonprofit and educational institutions, and loans in default.(3) Revolving credit that also includes overdraft plans on checking accounts and other loans without a fixed repayment schedule.(4) Includes student loans held by nonprofit organizations (line 3), the federal government (line 6), depository institutions (part of lines 7 and 8), and finance companies (part of line 11). Data begin in 2006:Q1.(5) Includes student loans before 2006:Q1.
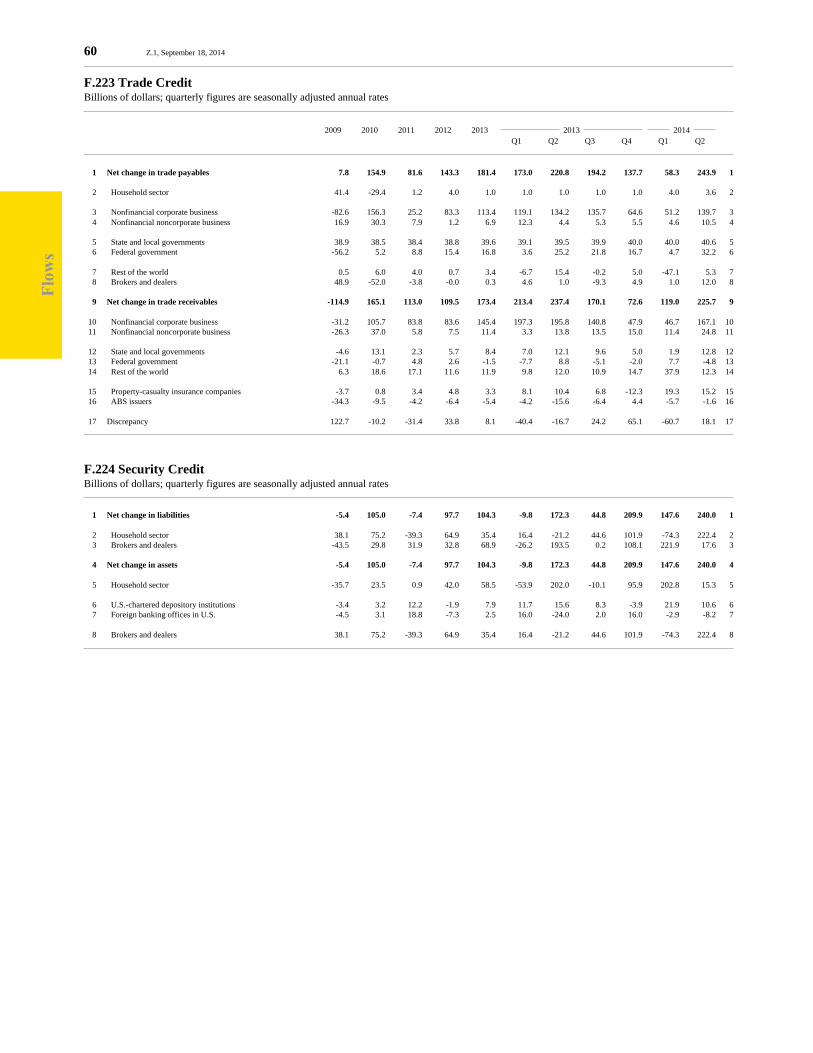
Flo
ws
60 Z.1, September 18, 2014
F.223 Trade CreditBillions of dollars; quarterly figures are seasonally adjusted annual rates
2009 2010 2011 2012 2013 2013 2014 Q1 Q2 Q3 Q4 Q1 Q2
1 Net change in trade payables 7.8 154.9 81.6 143.3 181.4 173.0 220.8 194.2 137.7 58.3 243.9 1
2 Household sector 41.4 -29.4 1.2 4.0 1.0 1.0 1.0 1.0 1.0 4.0 3.6 2
3 Nonfinancial corporate business -82.6 156.3 25.2 83.3 113.4 119.1 134.2 135.7 64.6 51.2 139.7 3 4 Nonfinancial noncorporate business 16.9 30.3 7.9 1.2 6.9 12.3 4.4 5.3 5.5 4.6 10.5 4
5 State and local governments 38.9 38.5 38.4 38.8 39.6 39.1 39.5 39.9 40.0 40.0 40.6 5 6 Federal government -56.2 5.2 8.8 15.4 16.8 3.6 25.2 21.8 16.7 4.7 32.2 6
7 Rest of the world 0.5 6.0 4.0 0.7 3.4 -6.7 15.4 -0.2 5.0 -47.1 5.3 7 8 Brokers and dealers 48.9 -52.0 -3.8 -0.0 0.3 4.6 1.0 -9.3 4.9 1.0 12.0 8
9 Net change in trade receivables -114.9 165.1 113.0 109.5 173.4 213.4 237.4 170.1 72.6 119.0 225.7 9
10 Nonfinancial corporate business -31.2 105.7 83.8 83.6 145.4 197.3 195.8 140.8 47.9 46.7 167.1 10 11 Nonfinancial noncorporate business -26.3 37.0 5.8 7.5 11.4 3.3 13.8 13.5 15.0 11.4 24.8 11
12 State and local governments -4.6 13.1 2.3 5.7 8.4 7.0 12.1 9.6 5.0 1.9 12.8 12 13 Federal government -21.1 -0.7 4.8 2.6 -1.5 -7.7 8.8 -5.1 -2.0 7.7 -4.8 13 14 Rest of the world 6.3 18.6 17.1 11.6 11.9 9.8 12.0 10.9 14.7 37.9 12.3 14
15 Property-casualty insurance companies -3.7 0.8 3.4 4.8 3.3 8.1 10.4 6.8 -12.3 19.3 15.2 15 16 ABS issuers -34.3 -9.5 -4.2 -6.4 -5.4 -4.2 -15.6 -6.4 4.4 -5.7 -1.6 16
17 Discrepancy 122.7 -10.2 -31.4 33.8 8.1 -40.4 -16.7 24.2 65.1 -60.7 18.1 17
F.224 Security CreditBillions of dollars; quarterly figures are seasonally adjusted annual rates
1 Net change in liabilities -5.4 105.0 -7.4 97.7 104.3 -9.8 172.3 44.8 209.9 147.6 240.0 1
2 Household sector 38.1 75.2 -39.3 64.9 35.4 16.4 -21.2 44.6 101.9 -74.3 222.4 2 3 Brokers and dealers -43.5 29.8 31.9 32.8 68.9 -26.2 193.5 0.2 108.1 221.9 17.6 3
4 Net change in assets -5.4 105.0 -7.4 97.7 104.3 -9.8 172.3 44.8 209.9 147.6 240.0 4
5 Household sector -35.7 23.5 0.9 42.0 58.5 -53.9 202.0 -10.1 95.9 202.8 15.3 5
6 U.S.-chartered depository institutions -3.4 3.2 12.2 -1.9 7.9 11.7 15.6 8.3 -3.9 21.9 10.6 6 7 Foreign banking offices in U.S. -4.5 3.1 18.8 -7.3 2.5 16.0 -24.0 2.0 16.0 -2.9 -8.2 7
8 Brokers and dealers 38.1 75.2 -39.3 64.9 35.4 16.4 -21.2 44.6 101.9 -74.3 222.4 8
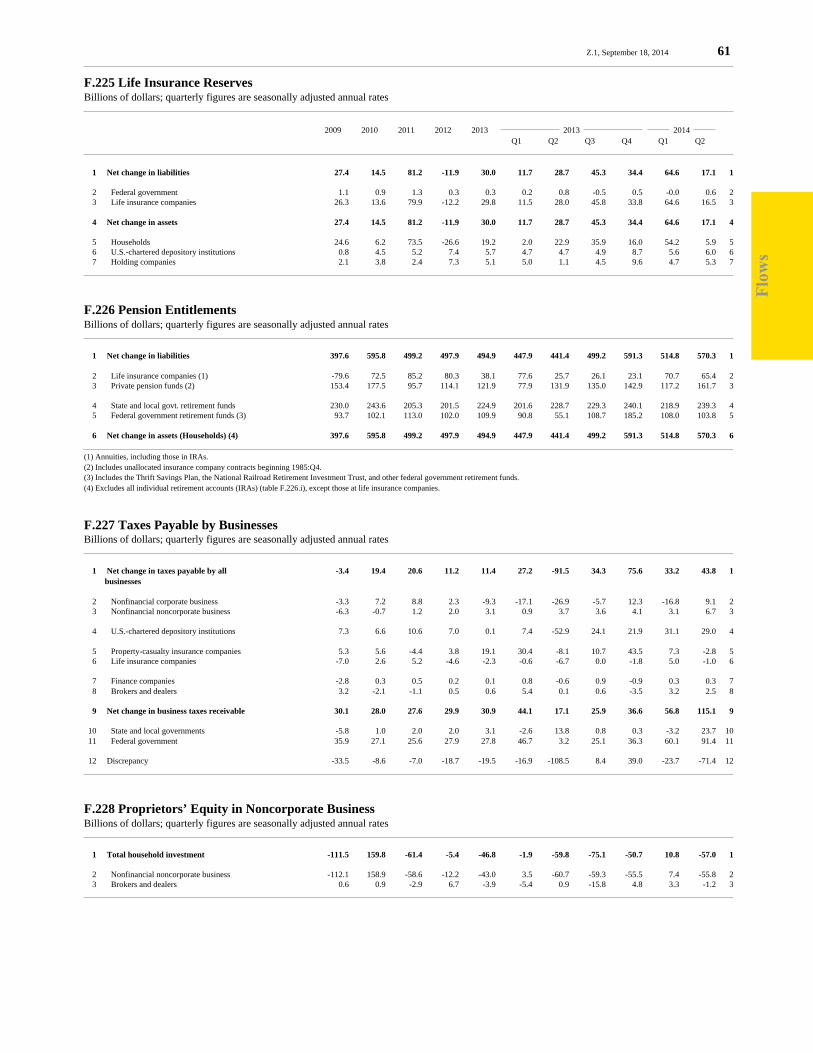
Flo
ws
Z.1, September 18, 2014 61
F.225 Life Insurance ReservesBillions of dollars; quarterly figures are seasonally adjusted annual rates
2009 2010 2011 2012 2013 2013 2014 Q1 Q2 Q3 Q4 Q1 Q2
1 Net change in liabilities 27.4 14.5 81.2 -11.9 30.0 11.7 28.7 45.3 34.4 64.6 17.1 1
2 Federal government 1.1 0.9 1.3 0.3 0.3 0.2 0.8 -0.5 0.5 -0.0 0.6 2 3 Life insurance companies 26.3 13.6 79.9 -12.2 29.8 11.5 28.0 45.8 33.8 64.6 16.5 3
4 Net change in assets 27.4 14.5 81.2 -11.9 30.0 11.7 28.7 45.3 34.4 64.6 17.1 4
5 Households 24.6 6.2 73.5 -26.6 19.2 2.0 22.9 35.9 16.0 54.2 5.9 5 6 U.S.-chartered depository institutions 0.8 4.5 5.2 7.4 5.7 4.7 4.7 4.9 8.7 5.6 6.0 6 7 Holding companies 2.1 3.8 2.4 7.3 5.1 5.0 1.1 4.5 9.6 4.7 5.3 7
F.226 Pension EntitlementsBillions of dollars; quarterly figures are seasonally adjusted annual rates
1 Net change in liabilities 397.6 595.8 499.2 497.9 494.9 447.9 441.4 499.2 591.3 514.8 570.3 1
2 Life insurance companies (1) -79.6 72.5 85.2 80.3 38.1 77.6 25.7 26.1 23.1 70.7 65.4 2 3 Private pension funds (2) 153.4 177.5 95.7 114.1 121.9 77.9 131.9 135.0 142.9 117.2 161.7 3
4 State and local govt. retirement funds 230.0 243.6 205.3 201.5 224.9 201.6 228.7 229.3 240.1 218.9 239.3 4 5 Federal government retirement funds (3) 93.7 102.1 113.0 102.0 109.9 90.8 55.1 108.7 185.2 108.0 103.8 5
6 Net change in assets (Households) (4) 397.6 595.8 499.2 497.9 494.9 447.9 441.4 499.2 591.3 514.8 570.3 6
(1) Annuities, including those in IRAs.(2) Includes unallocated insurance company contracts beginning 1985:Q4.(3) Includes the Thrift Savings Plan, the National Railroad Retirement Investment Trust, and other federal government retirement funds.(4) Excludes all individual retirement accounts (IRAs) (table F.226.i), except those at life insurance companies.
F.227 Taxes Payable by BusinessesBillions of dollars; quarterly figures are seasonally adjusted annual rates
1 Net change in taxes payable by all -3.4 19.4 20.6 11.2 11.4 27.2 -91.5 34.3 75.6 33.2 43.8 1 businesses
2 Nonfinancial corporate business -3.3 7.2 8.8 2.3 -9.3 -17.1 -26.9 -5.7 12.3 -16.8 9.1 2 3 Nonfinancial noncorporate business -6.3 -0.7 1.2 2.0 3.1 0.9 3.7 3.6 4.1 3.1 6.7 3
4 U.S.-chartered depository institutions 7.3 6.6 10.6 7.0 0.1 7.4 -52.9 24.1 21.9 31.1 29.0 4
5 Property-casualty insurance companies 5.3 5.6 -4.4 3.8 19.1 30.4 -8.1 10.7 43.5 7.3 -2.8 5 6 Life insurance companies -7.0 2.6 5.2 -4.6 -2.3 -0.6 -6.7 0.0 -1.8 5.0 -1.0 6
7 Finance companies -2.8 0.3 0.5 0.2 0.1 0.8 -0.6 0.9 -0.9 0.3 0.3 7 8 Brokers and dealers 3.2 -2.1 -1.1 0.5 0.6 5.4 0.1 0.6 -3.5 3.2 2.5 8
9 Net change in business taxes receivable 30.1 28.0 27.6 29.9 30.9 44.1 17.1 25.9 36.6 56.8 115.1 9
10 State and local governments -5.8 1.0 2.0 2.0 3.1 -2.6 13.8 0.8 0.3 -3.2 23.7 10 11 Federal government 35.9 27.1 25.6 27.9 27.8 46.7 3.2 25.1 36.3 60.1 91.4 11
12 Discrepancy -33.5 -8.6 -7.0 -18.7 -19.5 -16.9 -108.5 8.4 39.0 -23.7 -71.4 12
F.228 Proprietors’ Equity in Noncorporate BusinessBillions of dollars; quarterly figures are seasonally adjusted annual rates
1 Total household investment -111.5 159.8 -61.4 -5.4 -46.8 -1.9 -59.8 -75.1 -50.7 10.8 -57.0 1
2 Nonfinancial noncorporate business -112.1 158.9 -58.6 -12.2 -43.0 3.5 -60.7 -59.3 -55.5 7.4 -55.8 2 3 Brokers and dealers 0.6 0.9 -2.9 6.7 -3.9 -5.4 0.9 -15.8 4.8 3.3 -1.2 3
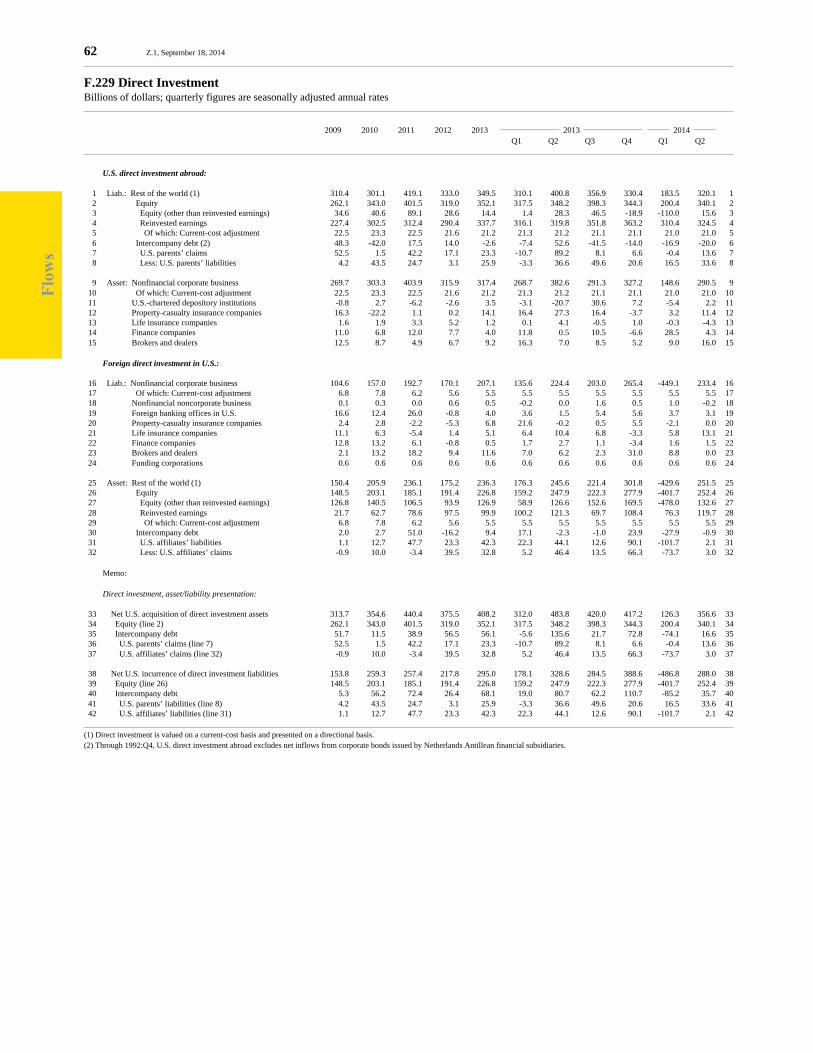
Flo
ws
62 Z.1, September 18, 2014
F.229 Direct InvestmentBillions of dollars; quarterly figures are seasonally adjusted annual rates
2009 2010 2011 2012 2013 2013 2014 Q1 Q2 Q3 Q4 Q1 Q2
U.S. direct investment abroad:
1 Liab.: Rest of the world (1) 310.4 301.1 419.1 333.0 349.5 310.1 400.8 356.9 330.4 183.5 320.1 1 2 Equity 262.1 343.0 401.5 319.0 352.1 317.5 348.2 398.3 344.3 200.4 340.1 2 3 Equity (other than reinvested earnings) 34.6 40.6 89.1 28.6 14.4 1.4 28.3 46.5 -18.9 -110.0 15.6 3 4 Reinvested earnings 227.4 302.5 312.4 290.4 337.7 316.1 319.8 351.8 363.2 310.4 324.5 4 5 Of which: Current-cost adjustment 22.5 23.3 22.5 21.6 21.2 21.3 21.2 21.1 21.1 21.0 21.0 5 6 Intercompany debt (2) 48.3 -42.0 17.5 14.0 -2.6 -7.4 52.6 -41.5 -14.0 -16.9 -20.0 6 7 U.S. parents’ claims 52.5 1.5 42.2 17.1 23.3 -10.7 89.2 8.1 6.6 -0.4 13.6 7 8 Less: U.S. parents’ liabilities 4.2 43.5 24.7 3.1 25.9 -3.3 36.6 49.6 20.6 16.5 33.6 8
9 Asset: Nonfinancial corporate business 269.7 303.3 403.9 315.9 317.4 268.7 382.6 291.3 327.2 148.6 290.5 9 10 Of which: Current-cost adjustment 22.5 23.3 22.5 21.6 21.2 21.3 21.2 21.1 21.1 21.0 21.0 10 11 U.S.-chartered depository institutions -0.8 2.7 -6.2 -2.6 3.5 -3.1 -20.7 30.6 7.2 -5.4 2.2 11 12 Property-casualty insurance companies 16.3 -22.2 1.1 0.2 14.1 16.4 27.3 16.4 -3.7 3.2 11.4 12 13 Life insurance companies 1.6 1.9 3.3 5.2 1.2 0.1 4.1 -0.5 1.0 -0.3 -4.3 13 14 Finance companies 11.0 6.8 12.0 7.7 4.0 11.8 0.5 10.5 -6.6 28.5 4.3 14 15 Brokers and dealers 12.5 8.7 4.9 6.7 9.2 16.3 7.0 8.5 5.2 9.0 16.0 15
Foreign direct investment in U.S.:
16 Liab.: Nonfinancial corporate business 104.6 157.0 192.7 170.1 207.1 135.6 224.4 203.0 265.4 -449.1 233.4 16 17 Of which: Current-cost adjustment 6.8 7.8 6.2 5.6 5.5 5.5 5.5 5.5 5.5 5.5 5.5 17 18 Nonfinancial noncorporate business 0.1 0.3 0.0 0.6 0.5 -0.2 0.0 1.6 0.5 1.0 -0.2 18 19 Foreign banking offices in U.S. 16.6 12.4 26.0 -0.8 4.0 3.6 1.5 5.4 5.6 3.7 3.1 19 20 Property-casualty insurance companies 2.4 2.8 -2.2 -5.3 6.8 21.6 -0.2 0.5 5.5 -2.1 0.0 20 21 Life insurance companies 11.1 6.3 -5.4 1.4 5.1 6.4 10.4 6.8 -3.3 5.8 13.1 21 22 Finance companies 12.8 13.2 6.1 -0.8 0.5 1.7 2.7 1.1 -3.4 1.6 1.5 22 23 Brokers and dealers 2.1 13.2 18.2 9.4 11.6 7.0 6.2 2.3 31.0 8.8 0.0 23 24 Funding corporations 0.6 0.6 0.6 0.6 0.6 0.6 0.6 0.6 0.6 0.6 0.6 24
25 Asset: Rest of the world (1) 150.4 205.9 236.1 175.2 236.3 176.3 245.6 221.4 301.8 -429.6 251.5 25 26 Equity 148.5 203.1 185.1 191.4 226.8 159.2 247.9 222.3 277.9 -401.7 252.4 26 27 Equity (other than reinvested earnings) 126.8 140.5 106.5 93.9 126.9 58.9 126.6 152.6 169.5 -478.0 132.6 27 28 Reinvested earnings 21.7 62.7 78.6 97.5 99.9 100.2 121.3 69.7 108.4 76.3 119.7 28 29 Of which: Current-cost adjustment 6.8 7.8 6.2 5.6 5.5 5.5 5.5 5.5 5.5 5.5 5.5 29 30 Intercompany debt 2.0 2.7 51.0 -16.2 9.4 17.1 -2.3 -1.0 23.9 -27.9 -0.9 30 31 U.S. affiliates’ liabilities 1.1 12.7 47.7 23.3 42.3 22.3 44.1 12.6 90.1 -101.7 2.1 31 32 Less: U.S. affiliates’ claims -0.9 10.0 -3.4 39.5 32.8 5.2 46.4 13.5 66.3 -73.7 3.0 32
Memo:
Direct investment, asset/liability presentation:
33 Net U.S. acquisition of direct investment assets 313.7 354.6 440.4 375.5 408.2 312.0 483.8 420.0 417.2 126.3 356.6 33 34 Equity (line 2) 262.1 343.0 401.5 319.0 352.1 317.5 348.2 398.3 344.3 200.4 340.1 34 35 Intercompany debt 51.7 11.5 38.9 56.5 56.1 -5.6 135.6 21.7 72.8 -74.1 16.6 35 36 U.S. parents’ claims (line 7) 52.5 1.5 42.2 17.1 23.3 -10.7 89.2 8.1 6.6 -0.4 13.6 36 37 U.S. affiliates’ claims (line 32) -0.9 10.0 -3.4 39.5 32.8 5.2 46.4 13.5 66.3 -73.7 3.0 37
38 Net U.S. incurrence of direct investment liabilities 153.8 259.3 257.4 217.8 295.0 178.1 328.6 284.5 388.6 -486.8 288.0 38 39 Equity (line 26) 148.5 203.1 185.1 191.4 226.8 159.2 247.9 222.3 277.9 -401.7 252.4 39 40 Intercompany debt 5.3 56.2 72.4 26.4 68.1 19.0 80.7 62.2 110.7 -85.2 35.7 40 41 U.S. parents’ liabilities (line 8) 4.2 43.5 24.7 3.1 25.9 -3.3 36.6 49.6 20.6 16.5 33.6 41 42 U.S. affiliates’ liabilities (line 31) 1.1 12.7 47.7 23.3 42.3 22.3 44.1 12.6 90.1 -101.7 2.1 42
(1) Direct investment is valued on a current-cost basis and presented on a directional basis.(2) Through 1992:Q4, U.S. direct investment abroad excludes net inflows from corporate bonds issued by Netherlands Antillean financial subsidiaries.

Flo
ws
Z.1, September 18, 2014 63
F.230 Total Miscellaneous Financial ClaimsBillions of dollars; quarterly figures are seasonally adjusted annual rates
2009 2010 2011 2012 2013 2013 2014 Q1 Q2 Q3 Q4 Q1 Q2
1 Net change in liabilities 247.3 601.9 1232.5 1152.9 1397.0 2239.7 402.6 2155.5 790.3 2253.4 1384.8 1
2 Household sector -4.9 2.7 -0.4 0.6 3.0 4.1 7.4 -3.7 4.2 4.1 5.3 2 3 Nonfinancial corporate business 143.6 493.1 863.9 895.4 774.8 773.0 691.2 720.8 914.4 945.3 693.3 3 4 Nonfinancial noncorporate business 32.6 -50.9 34.4 17.4 4.8 12.9 -5.7 12.9 -1.1 4.7 -2.5 4
5 State and local governments 303.9 275.5 316.5 300.2 290.0 306.0 218.4 316.3 319.4 408.3 338.9 5 6 Federal government 97.0 110.7 123.7 95.7 104.8 100.0 87.6 466.2 -234.4 79.2 121.7 6 7 Rest of the world -518.3 2.7 132.9 -140.0 -23.3 86.6 -163.2 101.9 -118.6 -7.6 25.3 7
8 Monetary authority 6.1 29.2 -26.7 2.0 9.8 46.6 -43.4 -20.4 56.7 61.2 -25.1 8 9 U.S.-chartered depository institutions 358.2 -8.9 -94.9 147.2 124.4 403.6 -86.9 51.1 129.6 378.9 106.1 9 10 Foreign banking offices in U.S. -158.9 -30.5 10.1 -35.7 -33.2 63.7 -28.9 -143.1 -24.5 5.7 -18.9 10 11 Banks in U.S.-affiliated areas 4.3 -5.9 -3.9 -2.0 -3.0 -3.6 0.3 -3.1 -5.6 2.1 1.6 11 12 Credit unions 14.7 -8.3 1.3 0.3 1.5 9.3 2.3 -4.7 -1.0 -5.8 6.6 12
13 Property-casualty insurance companies -5.0 6.3 35.2 -1.0 -0.3 -33.9 23.9 9.6 -0.9 3.8 34.3 13 14 Life insurance companies 89.5 60.2 48.5 27.5 18.6 -19.6 -27.3 59.1 62.2 41.3 79.9 14
15 Government-sponsored enterprises 62.3 -42.2 -49.2 -6.1 -9.4 -16.7 7.7 -8.9 -19.8 -13.8 -0.7 15 16 Finance companies -104.1 -71.7 -19.1 -24.7 -26.4 -23.6 1.6 -97.2 13.6 -5.3 17.4 16 17 REITs -5.3 4.1 7.1 25.4 -21.7 -27.6 11.8 -55.5 -15.4 26.1 17.7 17
18 Brokers and dealers 61.7 9.0 -19.4 -7.7 41.3 260.5 -55.7 62.2 -101.8 173.2 45.5 18 19 Holding companies -26.9 -68.5 -36.2 -98.6 222.0 311.0 -82.6 633.4 26.3 57.7 89.7 19 20 Funding corporations -103.1 -104.8 -91.4 -42.9 -80.7 -12.6 -155.9 58.5 -212.9 94.1 -151.4 20
21 Net change in assets 12.1 301.0 618.2 610.1 1321.7 2266.1 1087.6 1076.8 856.2 2275.3 1628.0 21
22 Household sector 34.9 8.3 70.7 -6.1 52.2 22.2 37.1 54.6 95.2 16.8 38.5 22 23 Nonfinancial corporate business -167.9 214.8 23.6 229.0 291.3 597.5 289.4 -55.2 333.3 530.3 490.8 23 24 Nonfinancial noncorporate business -92.5 105.0 7.4 44.4 16.4 -14.7 25.9 24.2 30.3 44.6 96.7 24
25 State and local governments 25.3 -22.2 -0.1 8.1 6.2 12.8 5.2 1.9 4.8 11.0 14.3 25 26 Federal government 35.2 -3.6 2.0 -1.0 5.9 3.2 -11.9 15.2 17.0 11.0 19.9 26
27 Monetary authority -493.8 7.8 142.9 -27.6 32.3 76.6 31.6 -2.6 23.6 8.2 3.3 27 28 U.S.-chartered depository institutions 40.1 -133.9 -88.3 -12.7 -8.3 129.4 204.5 -183.1 -183.9 93.5 183.0 28 29 Foreign banking offices in U.S. -4.4 -15.3 15.0 -0.3 13.1 35.8 31.1 -14.0 -0.6 56.3 3.7 29 30 Banks in U.S.-affiliated areas -4.5 4.5 0.8 0.2 8.6 1.8 23.9 11.1 -2.6 -12.5 20.3 30 31 Credit unions 0.2 41.1 -12.1 0.8 -1.6 -14.4 35.5 -32.5 4.9 -6.8 19.2 31
32 Life insurance companies -23.1 -7.6 52.4 31.2 24.4 72.7 -32.5 19.3 38.1 59.1 80.6 32 33 Private pension funds 192.8 8.5 50.2 35.2 42.2 -33.4 27.6 75.7 99.0 90.8 39.1 33 34 State and local govt. retirement funds 316.3 305.0 308.0 292.9 310.3 296.4 236.2 351.5 357.1 440.2 385.1 34 35 Federal government retirement funds 77.5 85.9 91.6 90.7 91.4 88.5 90.1 499.2 -312.1 94.7 94.7 35
36 Money market mutual funds -8.3 -3.4 -0.8 6.1 2.8 -60.9 -17.5 -18.7 108.5 -62.2 -71.6 36 37 Mutual funds -5.1 -12.0 2.9 -33.1 19.1 44.9 3.4 129.5 -101.4 130.7 -0.0 37
38 Government-sponsored enterprises 1.2 29.3 -0.1 4.1 13.1 61.3 -0.8 -3.5 -4.8 -54.1 -2.7 38 39 Finance companies 17.4 -110.1 -5.9 -33.4 -22.3 -66.7 4.0 -106.3 79.6 -44.8 16.6 39 40 REITs 10.2 1.3 8.5 25.8 12.2 21.9 39.1 -54.4 42.2 39.3 44.8 40
41 Brokers and dealers 42.4 -112.9 -106.6 -68.1 147.7 508.8 266.5 -71.0 -113.5 627.1 -186.6 41 42 Holding companies 85.4 -31.2 36.5 16.9 251.8 354.2 -175.7 491.1 337.6 188.2 288.2 42 43 Funding corporations -67.2 -58.4 19.6 7.2 13.0 128.3 -25.2 -55.2 4.0 13.8 50.2 43
44 Discrepancy 235.3 301.0 614.3 542.8 75.3 -26.5 -685.0 1078.7 -65.9 -21.9 -243.2 44
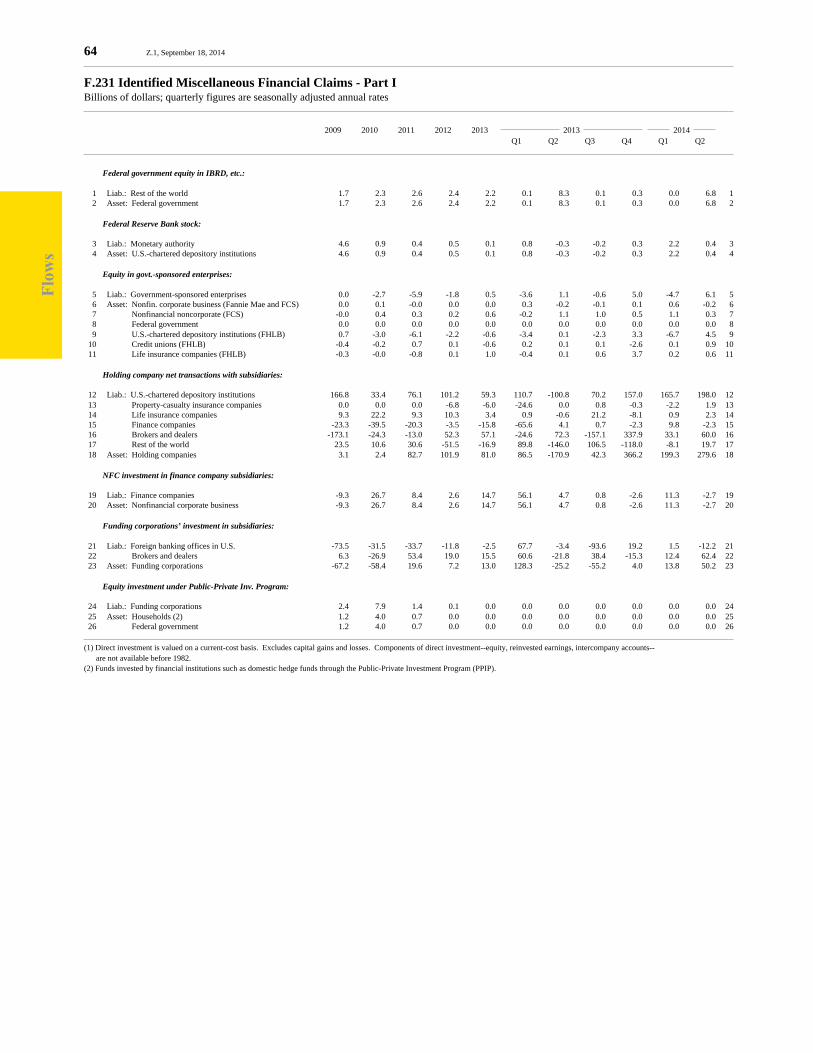
Flo
ws
64 Z.1, September 18, 2014
F.231 Identified Miscellaneous Financial Claims - Part IBillions of dollars; quarterly figures are seasonally adjusted annual rates
2009 2010 2011 2012 2013 2013 2014 Q1 Q2 Q3 Q4 Q1 Q2
Federal government equity in IBRD, etc.:
1 Liab.: Rest of the world 1.7 2.3 2.6 2.4 2.2 0.1 8.3 0.1 0.3 0.0 6.8 1 2 Asset: Federal government 1.7 2.3 2.6 2.4 2.2 0.1 8.3 0.1 0.3 0.0 6.8 2
Federal Reserve Bank stock:
3 Liab.: Monetary authority 4.6 0.9 0.4 0.5 0.1 0.8 -0.3 -0.2 0.3 2.2 0.4 3 4 Asset: U.S.-chartered depository institutions 4.6 0.9 0.4 0.5 0.1 0.8 -0.3 -0.2 0.3 2.2 0.4 4
Equity in govt.-sponsored enterprises:
5 Liab.: Government-sponsored enterprises 0.0 -2.7 -5.9 -1.8 0.5 -3.6 1.1 -0.6 5.0 -4.7 6.1 5 6 Asset: Nonfin. corporate business (Fannie Mae and FCS) 0.0 0.1 -0.0 0.0 0.0 0.3 -0.2 -0.1 0.1 0.6 -0.2 6 7 Nonfinancial noncorporate (FCS) -0.0 0.4 0.3 0.2 0.6 -0.2 1.1 1.0 0.5 1.1 0.3 7 8 Federal government 0.0 0.0 0.0 0.0 0.0 0.0 0.0 0.0 0.0 0.0 0.0 8 9 U.S.-chartered depository institutions (FHLB) 0.7 -3.0 -6.1 -2.2 -0.6 -3.4 0.1 -2.3 3.3 -6.7 4.5 9 10 Credit unions (FHLB) -0.4 -0.2 0.7 0.1 -0.6 0.2 0.1 0.1 -2.6 0.1 0.9 10 11 Life insurance companies (FHLB) -0.3 -0.0 -0.8 0.1 1.0 -0.4 0.1 0.6 3.7 0.2 0.6 11
Holding company net transactions with subsidiaries:
12 Liab.: U.S.-chartered depository institutions 166.8 33.4 76.1 101.2 59.3 110.7 -100.8 70.2 157.0 165.7 198.0 12 13 Property-casualty insurance companies 0.0 0.0 0.0 -6.8 -6.0 -24.6 0.0 0.8 -0.3 -2.2 1.9 13 14 Life insurance companies 9.3 22.2 9.3 10.3 3.4 0.9 -0.6 21.2 -8.1 0.9 2.3 14 15 Finance companies -23.3 -39.5 -20.3 -3.5 -15.8 -65.6 4.1 0.7 -2.3 9.8 -2.3 15 16 Brokers and dealers -173.1 -24.3 -13.0 52.3 57.1 -24.6 72.3 -157.1 337.9 33.1 60.0 16 17 Rest of the world 23.5 10.6 30.6 -51.5 -16.9 89.8 -146.0 106.5 -118.0 -8.1 19.7 17 18 Asset: Holding companies 3.1 2.4 82.7 101.9 81.0 86.5 -170.9 42.3 366.2 199.3 279.6 18
NFC investment in finance company subsidiaries:
19 Liab.: Finance companies -9.3 26.7 8.4 2.6 14.7 56.1 4.7 0.8 -2.6 11.3 -2.7 19 20 Asset: Nonfinancial corporate business -9.3 26.7 8.4 2.6 14.7 56.1 4.7 0.8 -2.6 11.3 -2.7 20
Funding corporations’ investment in subsidiaries:
21 Liab.: Foreign banking offices in U.S. -73.5 -31.5 -33.7 -11.8 -2.5 67.7 -3.4 -93.6 19.2 1.5 -12.2 21 22 Brokers and dealers 6.3 -26.9 53.4 19.0 15.5 60.6 -21.8 38.4 -15.3 12.4 62.4 22 23 Asset: Funding corporations -67.2 -58.4 19.6 7.2 13.0 128.3 -25.2 -55.2 4.0 13.8 50.2 23
Equity investment under Public-Private Inv. Program:
24 Liab.: Funding corporations 2.4 7.9 1.4 0.1 0.0 0.0 0.0 0.0 0.0 0.0 0.0 24 25 Asset: Households (2) 1.2 4.0 0.7 0.0 0.0 0.0 0.0 0.0 0.0 0.0 0.0 25 26 Federal government 1.2 4.0 0.7 0.0 0.0 0.0 0.0 0.0 0.0 0.0 0.0 26
(1) Direct investment is valued on a current-cost basis. Excludes capital gains and losses. Components of direct investment--equity, reinvested earnings, intercompany accounts-- are not available before 1982.(2) Funds invested by financial institutions such as domestic hedge funds through the Public-Private Investment Program (PPIP).
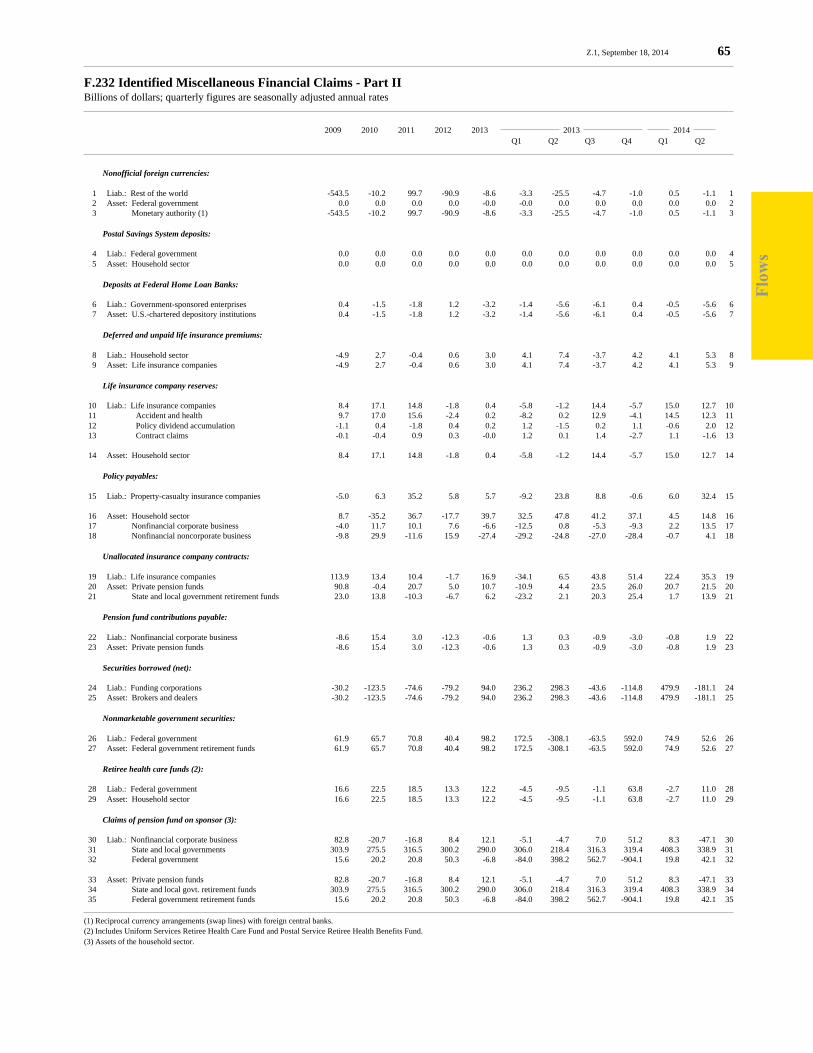
Flo
ws
Z.1, September 18, 2014 65
F.232 Identified Miscellaneous Financial Claims - Part IIBillions of dollars; quarterly figures are seasonally adjusted annual rates
2009 2010 2011 2012 2013 2013 2014 Q1 Q2 Q3 Q4 Q1 Q2
Nonofficial foreign currencies:
1 Liab.: Rest of the world -543.5 -10.2 99.7 -90.9 -8.6 -3.3 -25.5 -4.7 -1.0 0.5 -1.1 1 2 Asset: Federal government 0.0 0.0 0.0 0.0 -0.0 -0.0 0.0 0.0 0.0 0.0 0.0 2 3 Monetary authority (1) -543.5 -10.2 99.7 -90.9 -8.6 -3.3 -25.5 -4.7 -1.0 0.5 -1.1 3
Postal Savings System deposits:
4 Liab.: Federal government 0.0 0.0 0.0 0.0 0.0 0.0 0.0 0.0 0.0 0.0 0.0 4 5 Asset: Household sector 0.0 0.0 0.0 0.0 0.0 0.0 0.0 0.0 0.0 0.0 0.0 5
Deposits at Federal Home Loan Banks:
6 Liab.: Government-sponsored enterprises 0.4 -1.5 -1.8 1.2 -3.2 -1.4 -5.6 -6.1 0.4 -0.5 -5.6 6 7 Asset: U.S.-chartered depository institutions 0.4 -1.5 -1.8 1.2 -3.2 -1.4 -5.6 -6.1 0.4 -0.5 -5.6 7
Deferred and unpaid life insurance premiums:
8 Liab.: Household sector -4.9 2.7 -0.4 0.6 3.0 4.1 7.4 -3.7 4.2 4.1 5.3 8 9 Asset: Life insurance companies -4.9 2.7 -0.4 0.6 3.0 4.1 7.4 -3.7 4.2 4.1 5.3 9
Life insurance company reserves:
10 Liab.: Life insurance companies 8.4 17.1 14.8 -1.8 0.4 -5.8 -1.2 14.4 -5.7 15.0 12.7 10 11 Accident and health 9.7 17.0 15.6 -2.4 0.2 -8.2 0.2 12.9 -4.1 14.5 12.3 11 12 Policy dividend accumulation -1.1 0.4 -1.8 0.4 0.2 1.2 -1.5 0.2 1.1 -0.6 2.0 12 13 Contract claims -0.1 -0.4 0.9 0.3 -0.0 1.2 0.1 1.4 -2.7 1.1 -1.6 13
14 Asset: Household sector 8.4 17.1 14.8 -1.8 0.4 -5.8 -1.2 14.4 -5.7 15.0 12.7 14
Policy payables:
15 Liab.: Property-casualty insurance companies -5.0 6.3 35.2 5.8 5.7 -9.2 23.8 8.8 -0.6 6.0 32.4 15
16 Asset: Household sector 8.7 -35.2 36.7 -17.7 39.7 32.5 47.8 41.2 37.1 4.5 14.8 16 17 Nonfinancial corporate business -4.0 11.7 10.1 7.6 -6.6 -12.5 0.8 -5.3 -9.3 2.2 13.5 17 18 Nonfinancial noncorporate business -9.8 29.9 -11.6 15.9 -27.4 -29.2 -24.8 -27.0 -28.4 -0.7 4.1 18
Unallocated insurance company contracts:
19 Liab.: Life insurance companies 113.9 13.4 10.4 -1.7 16.9 -34.1 6.5 43.8 51.4 22.4 35.3 19 20 Asset: Private pension funds 90.8 -0.4 20.7 5.0 10.7 -10.9 4.4 23.5 26.0 20.7 21.5 20 21 State and local government retirement funds 23.0 13.8 -10.3 -6.7 6.2 -23.2 2.1 20.3 25.4 1.7 13.9 21
Pension fund contributions payable:
22 Liab.: Nonfinancial corporate business -8.6 15.4 3.0 -12.3 -0.6 1.3 0.3 -0.9 -3.0 -0.8 1.9 22 23 Asset: Private pension funds -8.6 15.4 3.0 -12.3 -0.6 1.3 0.3 -0.9 -3.0 -0.8 1.9 23
Securities borrowed (net):
24 Liab.: Funding corporations -30.2 -123.5 -74.6 -79.2 94.0 236.2 298.3 -43.6 -114.8 479.9 -181.1 24 25 Asset: Brokers and dealers -30.2 -123.5 -74.6 -79.2 94.0 236.2 298.3 -43.6 -114.8 479.9 -181.1 25
Nonmarketable government securities:
26 Liab.: Federal government 61.9 65.7 70.8 40.4 98.2 172.5 -308.1 -63.5 592.0 74.9 52.6 26 27 Asset: Federal government retirement funds 61.9 65.7 70.8 40.4 98.2 172.5 -308.1 -63.5 592.0 74.9 52.6 27
Retiree health care funds (2):
28 Liab.: Federal government 16.6 22.5 18.5 13.3 12.2 -4.5 -9.5 -1.1 63.8 -2.7 11.0 28 29 Asset: Household sector 16.6 22.5 18.5 13.3 12.2 -4.5 -9.5 -1.1 63.8 -2.7 11.0 29
Claims of pension fund on sponsor (3):
30 Liab.: Nonfinancial corporate business 82.8 -20.7 -16.8 8.4 12.1 -5.1 -4.7 7.0 51.2 8.3 -47.1 30 31 State and local governments 303.9 275.5 316.5 300.2 290.0 306.0 218.4 316.3 319.4 408.3 338.9 31 32 Federal government 15.6 20.2 20.8 50.3 -6.8 -84.0 398.2 562.7 -904.1 19.8 42.1 32
33 Asset: Private pension funds 82.8 -20.7 -16.8 8.4 12.1 -5.1 -4.7 7.0 51.2 8.3 -47.1 33 34 State and local govt. retirement funds 303.9 275.5 316.5 300.2 290.0 306.0 218.4 316.3 319.4 408.3 338.9 34 35 Federal government retirement funds 15.6 20.2 20.8 50.3 -6.8 -84.0 398.2 562.7 -904.1 19.8 42.1 35
(1) Reciprocal currency arrangements (swap lines) with foreign central banks.(2) Includes Uniform Services Retiree Health Care Fund and Postal Service Retiree Health Benefits Fund.(3) Assets of the household sector.

Flo
ws
66 Z.1, September 18, 2014
F.233 Unidentified Miscellaneous Financial ClaimsBillions of dollars; quarterly figures are seasonally adjusted annual rates
2009 2010 2011 2012 2013 2013 2014 Q1 Q2 Q3 Q4 Q1 Q2
1 Net change in liabilities 300.9 340.0 627.4 805.9 772.1 1398.9 -13.3 1338.7 364.2 996.2 747.0 1
2 Nonfinancial corporate business 69.4 498.4 877.8 899.4 763.3 776.8 695.5 714.7 866.2 937.9 738.5 2 3 Nonfinancial noncorporate business 32.6 -50.9 34.4 17.4 4.8 12.9 -5.7 12.9 -1.1 4.7 -2.5 3
4 Federal government 2.9 2.4 13.6 -8.3 1.3 16.1 7.0 -32.0 13.9 -12.8 16.0 4
5 Monetary authority 1.5 28.3 -27.1 1.5 9.7 45.8 -43.2 -20.2 56.4 59.0 -25.5 5 6 U.S.-chartered depository institutions 191.5 -42.3 -171.0 45.9 65.1 292.9 14.0 -19.1 -27.4 213.1 -91.9 6 7 Foreign banking offices in U.S. -85.1 0.9 43.9 -23.9 -30.6 -4.1 -25.2 -49.4 -43.7 4.3 -6.8 7 8 Banks in U.S.-affiliated areas 4.3 -5.9 -3.9 -2.0 -3.0 -3.6 0.3 -3.1 -5.6 2.1 1.6 8 9 Credit unions 14.7 -8.3 1.3 0.3 1.5 9.3 2.3 -4.7 -1.0 -5.8 6.6 9
10 Life insurance companies -42.1 7.4 14.0 20.7 -2.1 19.5 -32.0 -20.4 24.7 2.9 29.5 10 11 Government-sponsored enterprises 61.9 -37.9 -41.4 -5.4 -6.7 -11.8 12.2 -2.3 -25.1 -8.6 -1.2 11 12 Finance companies -71.5 -58.8 -7.1 -23.8 -25.3 -14.1 -7.2 -98.7 18.6 -26.4 22.4 12 13 REITs -5.3 4.1 7.1 25.4 -21.7 -27.6 11.8 -55.5 -15.4 26.1 17.7 13
14 Brokers and dealers 228.6 60.2 -59.8 -79.0 -31.3 224.5 -106.2 180.8 -424.3 127.8 -76.9 14 15 Holding companies -26.9 -68.5 -36.2 -98.6 222.0 311.0 -82.6 633.4 26.3 57.7 89.7 15 16 Funding corporations -75.3 10.8 -18.1 36.2 -174.7 -248.8 -454.2 102.1 -98.1 -385.8 29.8 16
17 Net change in assets 65.6 39.1 13.1 263.2 696.8 1425.3 671.7 259.9 430.1 1018.1 990.2 17
18 Nonfinancial corporate business -154.7 176.3 5.1 218.7 283.1 553.7 284.1 -50.7 345.2 516.3 480.1 18 19 Nonfinancial noncorporate business -82.7 74.7 18.8 28.3 43.2 14.7 49.7 50.2 58.2 44.2 92.2 19
20 State and local governments 25.3 -22.2 -0.1 8.1 6.2 12.8 5.2 1.9 4.8 11.0 14.3 20 21 Federal government 32.3 -9.8 -1.3 -3.5 3.7 3.1 -20.2 15.1 16.7 11.0 13.2 21
22 Monetary authority 49.6 18.0 43.1 63.4 40.9 79.9 57.1 2.1 24.5 7.7 4.4 22 23 U.S.-chartered depository institutions 34.4 -130.3 -80.7 -12.1 -4.7 133.4 210.4 -174.6 -187.9 98.5 183.7 23 24 Foreign banking offices in U.S. -4.4 -15.3 15.0 -0.3 13.1 35.8 31.1 -14.0 -0.6 56.3 3.7 24 25 Banks in U.S.-affiliated areas -4.5 4.5 0.8 0.2 8.6 1.8 23.9 11.1 -2.6 -12.5 20.3 25 26 Credit unions 0.6 41.3 -12.8 0.7 -1.1 -14.6 35.4 -32.6 7.5 -6.8 18.3 26
27 Life insurance companies -17.8 -10.2 53.6 30.6 20.4 69.1 -40.0 22.4 30.3 54.7 74.7 27 28 Private pension funds 27.8 14.2 43.4 34.1 19.9 -18.7 27.5 46.1 24.8 62.6 62.7 28 29 State and local govt. retirement funds -10.6 15.7 1.7 -0.6 14.1 13.6 15.7 14.9 12.3 30.1 32.3 29
30 Money market mutual funds -8.3 -3.4 -0.8 6.1 2.8 -60.9 -17.5 -18.7 108.5 -62.2 -71.6 30 31 Mutual funds -5.1 -12.0 2.9 -33.1 19.1 44.9 3.4 129.5 -101.4 130.7 -0.0 31
32 Government-sponsored enterprises 1.2 29.3 -0.1 4.1 13.1 61.3 -0.8 -3.5 -4.8 -54.1 -2.7 32 33 Finance companies 17.4 -110.1 -5.9 -33.4 -22.3 -66.7 4.0 -106.3 79.6 -44.8 16.6 33 34 REITs 10.2 1.3 8.5 25.8 12.2 21.9 39.1 -54.4 42.2 39.3 44.8 34
35 Brokers and dealers 72.6 10.6 -32.0 11.1 53.7 272.6 -31.8 -27.4 1.3 147.2 -5.5 35 36 Holding companies 82.3 -33.6 -46.2 -85.0 170.8 267.7 -4.8 448.9 -28.5 -11.1 8.6 36
37 Discrepancy 235.3 301.0 614.3 542.8 75.3 -26.5 -685.0 1078.7 -65.9 -21.9 -243.2 37
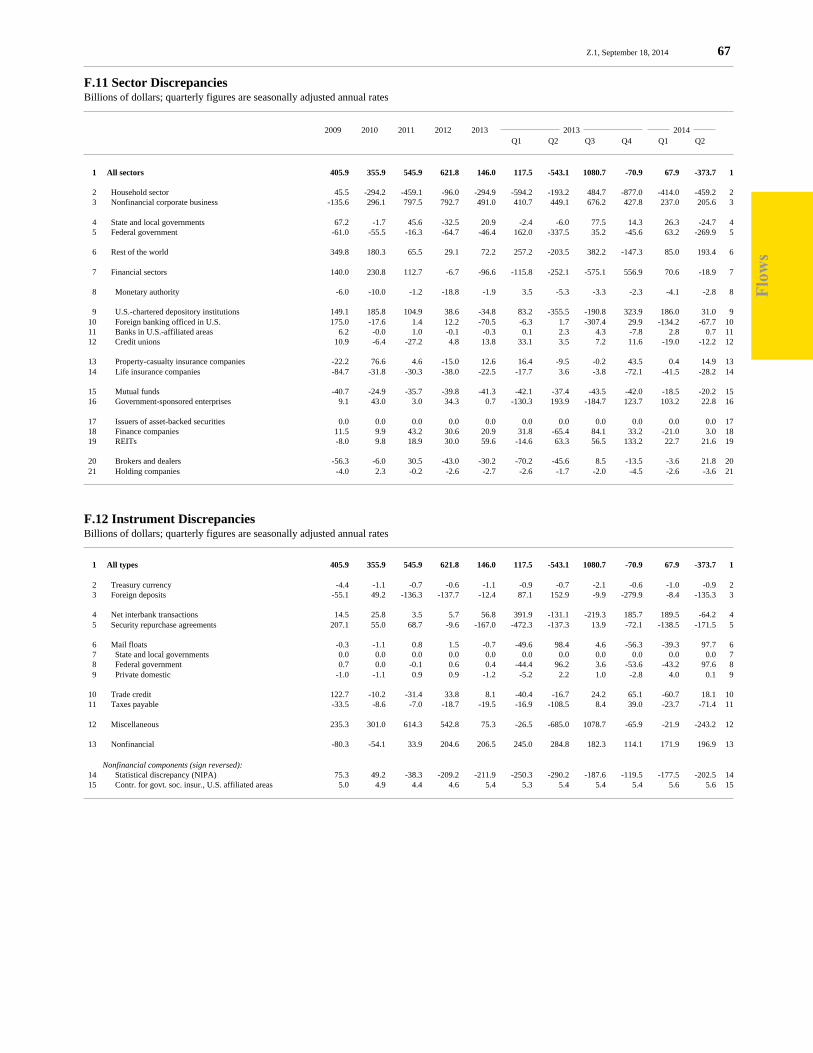
Flo
ws
Z.1, September 18, 2014 67
F.11 Sector DiscrepanciesBillions of dollars; quarterly figures are seasonally adjusted annual rates
2009 2010 2011 2012 2013 2013 2014 Q1 Q2 Q3 Q4 Q1 Q2
1 All sectors 405.9 355.9 545.9 621.8 146.0 117.5 -543.1 1080.7 -70.9 67.9 -373.7 1
2 Household sector 45.5 -294.2 -459.1 -96.0 -294.9 -594.2 -193.2 484.7 -877.0 -414.0 -459.2 2 3 Nonfinancial corporate business -135.6 296.1 797.5 792.7 491.0 410.7 449.1 676.2 427.8 237.0 205.6 3
4 State and local governments 67.2 -1.7 45.6 -32.5 20.9 -2.4 -6.0 77.5 14.3 26.3 -24.7 4 5 Federal government -61.0 -55.5 -16.3 -64.7 -46.4 162.0 -337.5 35.2 -45.6 63.2 -269.9 5
6 Rest of the world 349.8 180.3 65.5 29.1 72.2 257.2 -203.5 382.2 -147.3 85.0 193.4 6
7 Financial sectors 140.0 230.8 112.7 -6.7 -96.6 -115.8 -252.1 -575.1 556.9 70.6 -18.9 7
8 Monetary authority -6.0 -10.0 -1.2 -18.8 -1.9 3.5 -5.3 -3.3 -2.3 -4.1 -2.8 8
9 U.S.-chartered depository institutions 149.1 185.8 104.9 38.6 -34.8 83.2 -355.5 -190.8 323.9 186.0 31.0 9 10 Foreign banking officed in U.S. 175.0 -17.6 1.4 12.2 -70.5 -6.3 1.7 -307.4 29.9 -134.2 -67.7 10 11 Banks in U.S.-affiliated areas 6.2 -0.0 1.0 -0.1 -0.3 0.1 2.3 4.3 -7.8 2.8 0.7 11 12 Credit unions 10.9 -6.4 -27.2 4.8 13.8 33.1 3.5 7.2 11.6 -19.0 -12.2 12
13 Property-casualty insurance companies -22.2 76.6 4.6 -15.0 12.6 16.4 -9.5 -0.2 43.5 0.4 14.9 13 14 Life insurance companies -84.7 -31.8 -30.3 -38.0 -22.5 -17.7 3.6 -3.8 -72.1 -41.5 -28.2 14
15 Mutual funds -40.7 -24.9 -35.7 -39.8 -41.3 -42.1 -37.4 -43.5 -42.0 -18.5 -20.2 15 16 Government-sponsored enterprises 9.1 43.0 3.0 34.3 0.7 -130.3 193.9 -184.7 123.7 103.2 22.8 16
17 Issuers of asset-backed securities 0.0 0.0 0.0 0.0 0.0 0.0 0.0 0.0 0.0 0.0 0.0 17 18 Finance companies 11.5 9.9 43.2 30.6 20.9 31.8 -65.4 84.1 33.2 -21.0 3.0 18 19 REITs -8.0 9.8 18.9 30.0 59.6 -14.6 63.3 56.5 133.2 22.7 21.6 19
20 Brokers and dealers -56.3 -6.0 30.5 -43.0 -30.2 -70.2 -45.6 8.5 -13.5 -3.6 21.8 20 21 Holding companies -4.0 2.3 -0.2 -2.6 -2.7 -2.6 -1.7 -2.0 -4.5 -2.6 -3.6 21
F.12 Instrument DiscrepanciesBillions of dollars; quarterly figures are seasonally adjusted annual rates
1 All types 405.9 355.9 545.9 621.8 146.0 117.5 -543.1 1080.7 -70.9 67.9 -373.7 1
2 Treasury currency -4.4 -1.1 -0.7 -0.6 -1.1 -0.9 -0.7 -2.1 -0.6 -1.0 -0.9 2 3 Foreign deposits -55.1 49.2 -136.3 -137.7 -12.4 87.1 152.9 -9.9 -279.9 -8.4 -135.3 3
4 Net interbank transactions 14.5 25.8 3.5 5.7 56.8 391.9 -131.1 -219.3 185.7 189.5 -64.2 4 5 Security repurchase agreements 207.1 55.0 68.7 -9.6 -167.0 -472.3 -137.3 13.9 -72.1 -138.5 -171.5 5
6 Mail floats -0.3 -1.1 0.8 1.5 -0.7 -49.6 98.4 4.6 -56.3 -39.3 97.7 6 7 State and local governments 0.0 0.0 0.0 0.0 0.0 0.0 0.0 0.0 0.0 0.0 0.0 7 8 Federal government 0.7 0.0 -0.1 0.6 0.4 -44.4 96.2 3.6 -53.6 -43.2 97.6 8 9 Private domestic -1.0 -1.1 0.9 0.9 -1.2 -5.2 2.2 1.0 -2.8 4.0 0.1 9
10 Trade credit 122.7 -10.2 -31.4 33.8 8.1 -40.4 -16.7 24.2 65.1 -60.7 18.1 10 11 Taxes payable -33.5 -8.6 -7.0 -18.7 -19.5 -16.9 -108.5 8.4 39.0 -23.7 -71.4 11
12 Miscellaneous 235.3 301.0 614.3 542.8 75.3 -26.5 -685.0 1078.7 -65.9 -21.9 -243.2 12
13 Nonfinancial -80.3 -54.1 33.9 204.6 206.5 245.0 284.8 182.3 114.1 171.9 196.9 13
Nonfinancial components (sign reversed): 14 Statistical discrepancy (NIPA) 75.3 49.2 -38.3 -209.2 -211.9 -250.3 -290.2 -187.6 -119.5 -177.5 -202.5 14 15 Contr. for govt. soc. insur., U.S. affiliated areas 5.0 4.9 4.4 4.6 5.4 5.3 5.4 5.4 5.4 5.6 5.6 15
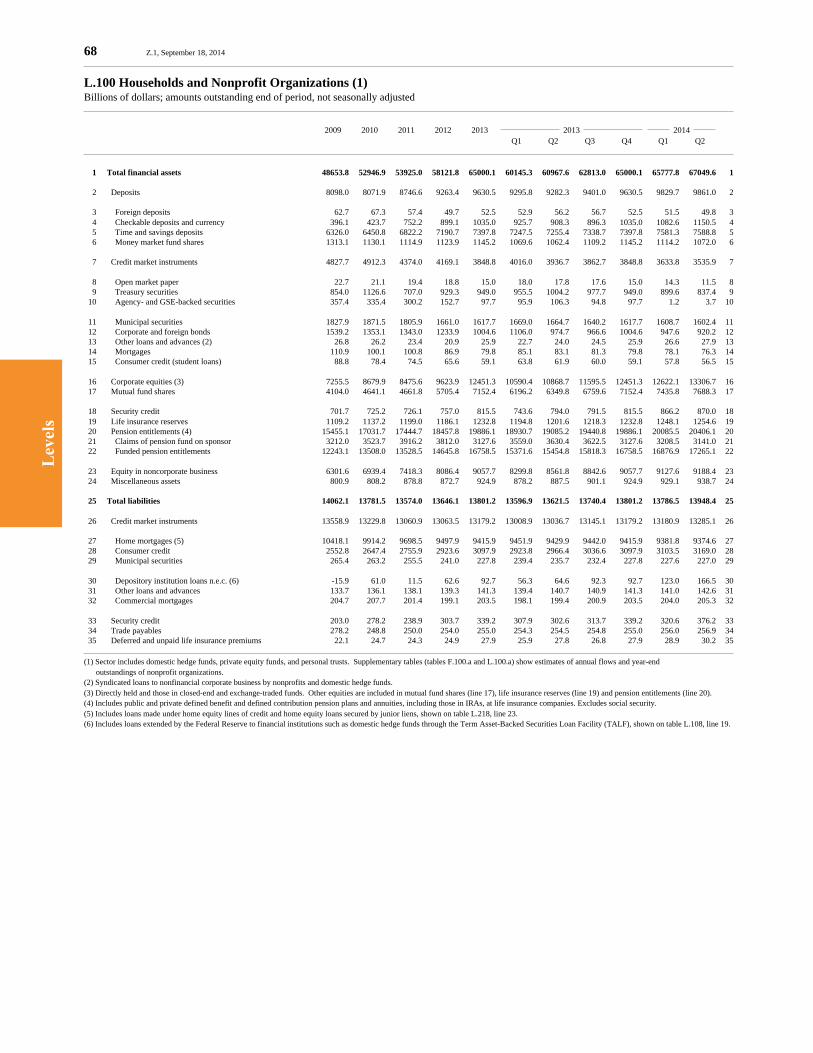
Lev
els
68 Z.1, September 18, 2014
L.100 Households and Nonprofit Organizations (1)Billions of dollars; amounts outstanding end of period, not seasonally adjusted
2009 2010 2011 2012 2013 2013 2014 Q1 Q2 Q3 Q4 Q1 Q2
1 Total financial assets 48653.8 52946.9 53925.0 58121.8 65000.1 60145.3 60967.6 62813.0 65000.1 65777.8 67049.6 1
2 Deposits 8098.0 8071.9 8746.6 9263.4 9630.5 9295.8 9282.3 9401.0 9630.5 9829.7 9861.0 2
3 Foreign deposits 62.7 67.3 57.4 49.7 52.5 52.9 56.2 56.7 52.5 51.5 49.8 3 4 Checkable deposits and currency 396.1 423.7 752.2 899.1 1035.0 925.7 908.3 896.3 1035.0 1082.6 1150.5 4 5 Time and savings deposits 6326.0 6450.8 6822.2 7190.7 7397.8 7247.5 7255.4 7338.7 7397.8 7581.3 7588.8 5 6 Money market fund shares 1313.1 1130.1 1114.9 1123.9 1145.2 1069.6 1062.4 1109.2 1145.2 1114.2 1072.0 6
7 Credit market instruments 4827.7 4912.3 4374.0 4169.1 3848.8 4016.0 3936.7 3862.7 3848.8 3633.8 3535.9 7
8 Open market paper 22.7 21.1 19.4 18.8 15.0 18.0 17.8 17.6 15.0 14.3 11.5 8 9 Treasury securities 854.0 1126.6 707.0 929.3 949.0 955.5 1004.2 977.7 949.0 899.6 837.4 9 10 Agency- and GSE-backed securities 357.4 335.4 300.2 152.7 97.7 95.9 106.3 94.8 97.7 1.2 3.7 10
11 Municipal securities 1827.9 1871.5 1805.9 1661.0 1617.7 1669.0 1664.7 1640.2 1617.7 1608.7 1602.4 11 12 Corporate and foreign bonds 1539.2 1353.1 1343.0 1233.9 1004.6 1106.0 974.7 966.6 1004.6 947.6 920.2 12 13 Other loans and advances (2) 26.8 26.2 23.4 20.9 25.9 22.7 24.0 24.5 25.9 26.6 27.9 13 14 Mortgages 110.9 100.1 100.8 86.9 79.8 85.1 83.1 81.3 79.8 78.1 76.3 14 15 Consumer credit (student loans) 88.8 78.4 74.5 65.6 59.1 63.8 61.9 60.0 59.1 57.8 56.5 15
16 Corporate equities (3) 7255.5 8679.9 8475.6 9623.9 12451.3 10590.4 10868.7 11595.5 12451.3 12622.1 13306.7 16 17 Mutual fund shares 4104.0 4641.1 4661.8 5705.4 7152.4 6196.2 6349.8 6759.6 7152.4 7435.8 7688.3 17
18 Security credit 701.7 725.2 726.1 757.0 815.5 743.6 794.0 791.5 815.5 866.2 870.0 18 19 Life insurance reserves 1109.2 1137.2 1199.0 1186.1 1232.8 1194.8 1201.6 1218.3 1232.8 1248.1 1254.6 19 20 Pension entitlements (4) 15455.1 17031.7 17444.7 18457.8 19886.1 18930.7 19085.2 19440.8 19886.1 20085.5 20406.1 20 21 Claims of pension fund on sponsor 3212.0 3523.7 3916.2 3812.0 3127.6 3559.0 3630.4 3622.5 3127.6 3208.5 3141.0 21 22 Funded pension entitlements 12243.1 13508.0 13528.5 14645.8 16758.5 15371.6 15454.8 15818.3 16758.5 16876.9 17265.1 22
23 Equity in noncorporate business 6301.6 6939.4 7418.3 8086.4 9057.7 8299.8 8561.8 8842.6 9057.7 9127.6 9188.4 23 24 Miscellaneous assets 800.9 808.2 878.8 872.7 924.9 878.2 887.5 901.1 924.9 929.1 938.7 24
25 Total liabilities 14062.1 13781.5 13574.0 13646.1 13801.2 13596.9 13621.5 13740.4 13801.2 13786.5 13948.4 25
26 Credit market instruments 13558.9 13229.8 13060.9 13063.5 13179.2 13008.9 13036.7 13145.1 13179.2 13180.9 13285.1 26
27 Home mortgages (5) 10418.1 9914.2 9698.5 9497.9 9415.9 9451.9 9429.9 9442.0 9415.9 9381.8 9374.6 27 28 Consumer credit 2552.8 2647.4 2755.9 2923.6 3097.9 2923.8 2966.4 3036.6 3097.9 3103.5 3169.0 28 29 Municipal securities 265.4 263.2 255.5 241.0 227.8 239.4 235.7 232.4 227.8 227.6 227.0 29
30 Depository institution loans n.e.c. (6) -15.9 61.0 11.5 62.6 92.7 56.3 64.6 92.3 92.7 123.0 166.5 30 31 Other loans and advances 133.7 136.1 138.1 139.3 141.3 139.4 140.7 140.9 141.3 141.0 142.6 31 32 Commercial mortgages 204.7 207.7 201.4 199.1 203.5 198.1 199.4 200.9 203.5 204.0 205.3 32
33 Security credit 203.0 278.2 238.9 303.7 339.2 307.9 302.6 313.7 339.2 320.6 376.2 33 34 Trade payables 278.2 248.8 250.0 254.0 255.0 254.3 254.5 254.8 255.0 256.0 256.9 34 35 Deferred and unpaid life insurance premiums 22.1 24.7 24.3 24.9 27.9 25.9 27.8 26.8 27.9 28.9 30.2 35
(1) Sector includes domestic hedge funds, private equity funds, and personal trusts. Supplementary tables (tables F.100.a and L.100.a) show estimates of annual flows and year-end outstandings of nonprofit organizations.(2) Syndicated loans to nonfinancial corporate business by nonprofits and domestic hedge funds.(3) Directly held and those in closed-end and exchange-traded funds. Other equities are included in mutual fund shares (line 17), life insurance reserves (line 19) and pension entitlements (line 20).(4) Includes public and private defined benefit and defined contribution pension plans and annuities, including those in IRAs, at life insurance companies. Excludes social security.(5) Includes loans made under home equity lines of credit and home equity loans secured by junior liens, shown on table L.218, line 23.(6) Includes loans extended by the Federal Reserve to financial institutions such as domestic hedge funds through the Term Asset-Backed Securities Loan Facility (TALF), shown on table L.108, line 19.
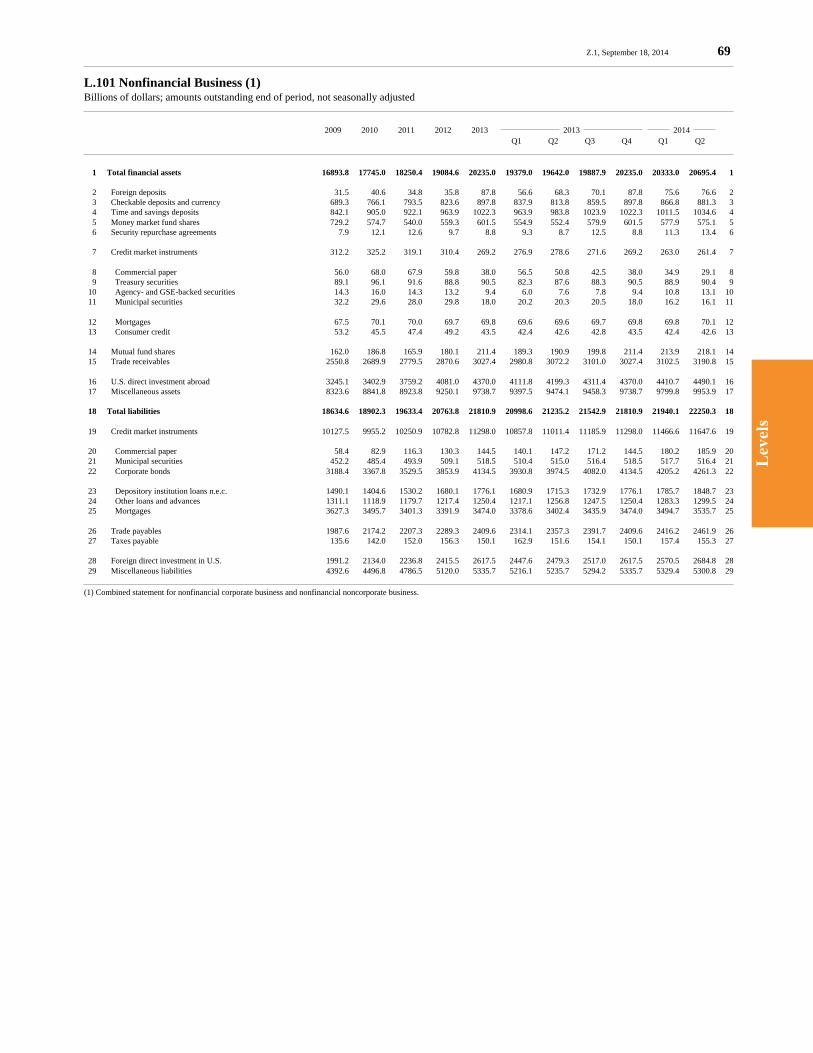
Lev
els
Z.1, September 18, 2014 69
L.101 Nonfinancial Business (1)Billions of dollars; amounts outstanding end of period, not seasonally adjusted
2009 2010 2011 2012 2013 2013 2014 Q1 Q2 Q3 Q4 Q1 Q2
1 Total financial assets 16893.8 17745.0 18250.4 19084.6 20235.0 19379.0 19642.0 19887.9 20235.0 20333.0 20695.4 1
2 Foreign deposits 31.5 40.6 34.8 35.8 87.8 56.6 68.3 70.1 87.8 75.6 76.6 2 3 Checkable deposits and currency 689.3 766.1 793.5 823.6 897.8 837.9 813.8 859.5 897.8 866.8 881.3 3 4 Time and savings deposits 842.1 905.0 922.1 963.9 1022.3 963.9 983.8 1023.9 1022.3 1011.5 1034.6 4 5 Money market fund shares 729.2 574.7 540.0 559.3 601.5 554.9 552.4 579.9 601.5 577.9 575.1 5 6 Security repurchase agreements 7.9 12.1 12.6 9.7 8.8 9.3 8.7 12.5 8.8 11.3 13.4 6
7 Credit market instruments 312.2 325.2 319.1 310.4 269.2 276.9 278.6 271.6 269.2 263.0 261.4 7
8 Commercial paper 56.0 68.0 67.9 59.8 38.0 56.5 50.8 42.5 38.0 34.9 29.1 8 9 Treasury securities 89.1 96.1 91.6 88.8 90.5 82.3 87.6 88.3 90.5 88.9 90.4 9 10 Agency- and GSE-backed securities 14.3 16.0 14.3 13.2 9.4 6.0 7.6 7.8 9.4 10.8 13.1 10 11 Municipal securities 32.2 29.6 28.0 29.8 18.0 20.2 20.3 20.5 18.0 16.2 16.1 11
12 Mortgages 67.5 70.1 70.0 69.7 69.8 69.6 69.6 69.7 69.8 69.8 70.1 12 13 Consumer credit 53.2 45.5 47.4 49.2 43.5 42.4 42.6 42.8 43.5 42.4 42.6 13
14 Mutual fund shares 162.0 186.8 165.9 180.1 211.4 189.3 190.9 199.8 211.4 213.9 218.1 14 15 Trade receivables 2550.8 2689.9 2779.5 2870.6 3027.4 2980.8 3072.2 3101.0 3027.4 3102.5 3190.8 15
16 U.S. direct investment abroad 3245.1 3402.9 3759.2 4081.0 4370.0 4111.8 4199.3 4311.4 4370.0 4410.7 4490.1 16 17 Miscellaneous assets 8323.6 8841.8 8923.8 9250.1 9738.7 9397.5 9474.1 9458.3 9738.7 9799.8 9953.9 17
18 Total liabilities 18634.6 18902.3 19633.4 20763.8 21810.9 20998.6 21235.2 21542.9 21810.9 21940.1 22250.3 18
19 Credit market instruments 10127.5 9955.2 10250.9 10782.8 11298.0 10857.8 11011.4 11185.9 11298.0 11466.6 11647.6 19
20 Commercial paper 58.4 82.9 116.3 130.3 144.5 140.1 147.2 171.2 144.5 180.2 185.9 20 21 Municipal securities 452.2 485.4 493.9 509.1 518.5 510.4 515.0 516.4 518.5 517.7 516.4 21 22 Corporate bonds 3188.4 3367.8 3529.5 3853.9 4134.5 3930.8 3974.5 4082.0 4134.5 4205.2 4261.3 22
23 Depository institution loans n.e.c. 1490.1 1404.6 1530.2 1680.1 1776.1 1680.9 1715.3 1732.9 1776.1 1785.7 1848.7 23 24 Other loans and advances 1311.1 1118.9 1179.7 1217.4 1250.4 1217.1 1256.8 1247.5 1250.4 1283.3 1299.5 24 25 Mortgages 3627.3 3495.7 3401.3 3391.9 3474.0 3378.6 3402.4 3435.9 3474.0 3494.7 3535.7 25
26 Trade payables 1987.6 2174.2 2207.3 2289.3 2409.6 2314.1 2357.3 2391.7 2409.6 2416.2 2461.9 26 27 Taxes payable 135.6 142.0 152.0 156.3 150.1 162.9 151.6 154.1 150.1 157.4 155.3 27
28 Foreign direct investment in U.S. 1991.2 2134.0 2236.8 2415.5 2617.5 2447.6 2479.3 2517.0 2617.5 2570.5 2684.8 28 29 Miscellaneous liabilities 4392.6 4496.8 4786.5 5120.0 5335.7 5216.1 5235.7 5294.2 5335.7 5329.4 5300.8 29
(1) Combined statement for nonfinancial corporate business and nonfinancial noncorporate business.

Lev
els
70 Z.1, September 18, 2014
L.102 Nonfinancial Corporate BusinessBillions of dollars; amounts outstanding end of period, not seasonally adjusted
2009 2010 2011 2012 2013 2013 2014 Q1 Q2 Q3 Q4 Q1 Q2
1 Total financial assets 13317.5 14016.8 14505.6 15265.6 16380.6 15564.8 15814.8 16048.4 16380.6 16459.1 16779.1 1
2 Foreign deposits 31.5 40.6 34.8 35.8 87.8 56.6 68.3 70.1 87.8 75.6 76.6 2 3 Checkable deposits and currency 154.9 234.5 264.2 279.4 357.3 296.5 272.7 318.9 357.3 323.6 332.2 3 4 Time and savings deposits 488.8 548.7 561.9 598.8 649.5 598.3 615.8 653.7 649.5 636.9 655.8 4 5 Money market fund shares 655.5 497.8 462.4 480.6 521.1 476.0 473.1 500.0 521.1 497.1 493.4 5 6 Security repurchase agreements 7.9 12.1 12.6 9.7 8.8 9.3 8.7 12.5 8.8 11.3 13.4 6
7 Credit market instruments 223.1 229.4 222.3 212.3 169.0 178.7 179.7 172.1 169.0 162.3 159.6 7
8 Commercial paper 56.0 68.0 67.9 59.8 38.0 56.5 50.8 42.5 38.0 34.9 29.1 8 9 Treasury securities 43.0 48.0 43.0 39.5 40.2 32.9 37.9 38.4 40.2 38.4 39.3 9 10 Agency- and GSE-backed securities 14.3 16.0 14.3 13.2 9.4 6.0 7.6 7.8 9.4 10.8 13.1 10 11 Municipal securities 27.1 23.9 22.3 24.0 12.1 14.5 14.5 14.6 12.1 10.3 10.1 11
12 Mortgages 29.5 28.0 27.4 26.6 25.8 26.4 26.2 26.0 25.8 25.6 25.4 12 13 Consumer credit 53.2 45.5 47.4 49.2 43.5 42.4 42.6 42.8 43.5 42.4 42.6 13
14 Mutual fund shares 162.0 186.8 165.9 180.1 211.4 189.3 190.9 199.8 211.4 213.9 218.1 14 15 Trade receivables 2054.5 2156.5 2240.3 2324.0 2469.4 2433.3 2521.3 2546.7 2469.4 2541.7 2623.8 15
16 U.S. direct investment abroad (1) 3245.1 3402.9 3759.2 4081.0 4370.0 4111.8 4199.3 4311.4 4370.0 4410.7 4490.1 16
17 Miscellaneous assets 6294.1 6707.4 6782.0 7063.9 7536.1 7215.0 7285.1 7263.3 7536.1 7586.0 7716.0 17 18 Insurance receivables 307.0 318.7 328.8 336.4 329.8 333.3 333.5 332.2 329.8 330.4 333.8 18 19 Equity in GSEs 0.4 0.6 0.5 0.6 0.6 0.6 0.6 0.6 0.6 0.7 0.7 19 20 Investment in finance company subs. 71.2 60.7 69.1 71.7 86.4 85.7 86.9 87.1 86.4 89.2 88.6 20 21 Other 5915.5 6327.4 6383.6 6655.3 7119.3 6795.4 6864.2 6843.5 7119.3 7165.7 7292.9 21
22 Total liabilities 12903.6 13226.7 13878.4 14906.7 15827.8 15139.9 15337.9 15604.0 15827.8 15928.2 16165.7 22
23 Credit market instruments 6142.1 6004.4 6264.8 6713.3 7118.0 6794.3 6910.4 7049.6 7118.0 7261.9 7374.5 23
24 Commercial paper 58.4 82.9 116.3 130.3 144.5 140.1 147.2 171.2 144.5 180.2 185.9 24 25 Municipal securities (2) 452.2 485.4 493.9 509.1 518.5 510.4 515.0 516.4 518.5 517.7 516.4 25 26 Corporate bonds (1) 3188.4 3367.8 3529.5 3853.9 4134.5 3930.8 3974.5 4082.0 4134.5 4205.2 4261.3 26
27 Depository institution loans n.e.c. 545.8 477.1 546.0 607.9 654.4 604.0 620.9 627.0 654.4 653.6 675.9 27 28 Other loans and advances (3) 1139.0 948.1 1008.3 1036.8 1063.5 1036.9 1076.2 1066.0 1063.5 1095.5 1111.0 28 29 Mortgages 758.3 643.0 570.7 575.3 602.5 572.0 576.5 587.0 602.5 609.9 623.8 29
30 Trade payables 1590.1 1746.4 1771.6 1854.8 1968.2 1875.5 1917.1 1949.7 1968.2 1972.9 2015.3 30 31 Taxes payable 35.7 42.9 51.7 54.0 44.6 60.4 48.1 49.7 44.6 51.2 47.4 31
32 Foreign direct investment in U.S. 1986.4 2128.7 2230.7 2408.9 2610.3 2441.0 2472.7 2510.1 2610.3 2563.0 2677.3 32
33 Miscellaneous liabilities 3149.3 3304.4 3559.6 3875.7 4086.7 3968.7 3989.7 4045.0 4086.7 4079.3 4051.3 33 34 Pension fund contributions payable 75.4 90.8 93.8 81.4 80.9 81.8 81.8 81.6 80.9 80.7 81.1 34 35 Claims of pension fund on sponsor 497.6 446.5 517.2 389.8 131.4 295.7 279.6 208.2 131.4 103.8 31.7 35 36 Other 2576.3 2767.0 2948.6 3404.5 3874.4 3591.2 3628.2 3755.2 3874.4 3894.8 3938.5 36
Memo:
37 Trade receivables net of payables 464.4 410.1 468.7 469.1 501.2 557.8 604.2 597.0 501.2 568.8 608.5 37 38 Market value of equities 12512.2 14371.6 14388.7 15994.4 20761.7 17705.1 18020.8 19187.8 20761.7 21032.0 22013.2 38
39 Securities and mortgages 4398.9 4496.2 4594.1 4938.3 5255.5 5013.2 5066.0 5185.4 5255.5 5332.7 5401.6 39 40 Loans and short-term paper 1743.3 1508.2 1670.7 1775.0 1862.4 1781.0 1844.3 1864.2 1862.4 1929.2 1972.9 40
41 Total short-term liabilities (4) 3369.0 3297.5 3493.9 3683.8 3875.3 3716.9 3809.5 3863.6 3875.3 3953.3 4035.6 41 42 Total liquid assets (5) 1641.0 1676.5 1649.2 1720.9 1935.7 1735.8 1740.4 1858.3 1935.7 1852.7 1881.3 42
Analytical measures (percent) 43 Long-term debt/credit market debt 71.6 74.9 73.3 73.6 73.8 73.8 73.3 73.6 73.8 73.4 73.2 43 44 Short-term debt/credit market debt 28.4 25.1 26.7 26.4 26.2 26.2 26.7 26.4 26.2 26.6 26.8 44
45 Liquid assets/short-term liabilities 48.7 50.8 47.2 46.7 50.0 46.7 45.7 48.1 50.0 46.9 46.6 45
(1) Through 1992:Q4, corporate bonds include net issues by Netherlands Antillean financial subsidiaries, and U.S. direct investment abroad excludes net inflows from those bond issues.(2) Industrial revenue bonds. Issued by state and local governments to finance private investment and secured in interest and principal by the industrial user of the funds.(3) Loans from rest of the world, U.S. government, and nonbank financial institutions. Detail can be found on table L.216.(4) Sum of lines 24, 27, 28, 30, and 31. Includes loans due in more than one year and excludes current maturities of bonds and mortgages.(5) Sum of lines 2 through 6, lines 8 through 11, and line 14.

Lev
els
Z.1, September 18, 2014 71
L.103 Nonfinancial Noncorporate BusinessBillions of dollars; amounts outstanding end of period, not seasonally adjusted
2009 2010 2011 2012 2013 2013 2014 Q1 Q2 Q3 Q4 Q1 Q2
1 Total financial assets 3576.3 3728.3 3744.9 3819.0 3854.4 3814.2 3827.2 3839.5 3854.4 3873.9 3916.3 1
2 Checkable deposits and currency 534.4 531.6 529.3 544.2 540.5 541.4 541.1 540.6 540.5 543.2 549.1 2 3 Time and savings deposits 353.3 356.2 360.1 365.1 372.7 365.7 368.0 370.2 372.7 374.6 378.8 3 4 Money market fund shares 73.7 76.8 77.7 78.7 80.4 78.9 79.4 79.8 80.4 80.8 81.7 4
5 Credit market instruments 89.1 95.8 96.8 98.1 100.2 98.3 98.9 99.5 100.2 100.7 101.8 5
6 Treasury securities 46.1 48.1 48.6 49.3 50.3 49.3 49.6 49.9 50.3 50.5 51.1 6 7 Municipal securities 5.1 5.6 5.7 5.8 5.9 5.8 5.8 5.8 5.9 5.9 6.0 7 8 Mortgages 37.9 42.1 42.5 43.1 44.0 43.2 43.4 43.7 44.0 44.2 44.7 8 9 Consumer credit 0.0 0.0 0.0 0.0 0.0 0.0 0.0 0.0 0.0 0.0 0.0 9
10 Trade receivables 496.3 533.4 539.2 546.6 558.0 547.5 550.9 554.3 558.0 560.9 567.1 10 11 Miscellaneous assets 2029.5 2134.4 2141.8 2186.2 2202.6 2182.5 2189.0 2195.0 2202.6 2213.7 2237.9 11 12 Insurance receivables 101.8 131.7 120.1 135.9 108.5 128.6 122.4 115.6 108.5 108.4 109.4 12 13 Equity investment in GSEs (1) 6.3 6.7 7.0 7.2 7.8 7.1 7.4 7.6 7.8 8.0 8.1 13 14 Other 1921.3 1996.0 2014.8 2043.1 2086.3 2046.8 2059.2 2071.8 2086.3 2097.4 2120.4 14
15 Total liabilities 5731.0 5675.6 5755.0 5857.1 5983.1 5858.7 5897.3 5939.0 5983.1 6011.9 6084.6 15
16 Credit market instruments 3985.4 3950.9 3986.1 4069.5 4180.0 4063.5 4101.0 4136.3 4180.0 4204.7 4273.1 16
17 Depository institution loans n.e.c. 944.2 927.4 984.2 1072.2 1121.8 1076.8 1094.4 1105.9 1121.8 1132.1 1172.7 17 18 Other loans and advances 172.1 170.8 171.3 180.7 186.9 180.2 180.6 181.5 186.9 187.8 188.4 18 19 Mortgages 2869.0 2852.7 2830.6 2816.6 2871.4 2806.5 2825.9 2848.9 2871.4 2884.8 2911.9 19
20 Trade payables 397.6 427.8 435.7 434.5 441.4 438.6 440.3 442.0 441.4 443.3 446.6 20 21 Taxes payable 99.9 99.2 100.3 102.3 105.4 102.6 103.5 104.4 105.4 106.2 107.9 21
22 Foreign direct investment in U.S. 4.8 5.3 6.1 6.6 7.3 6.5 6.6 7.0 7.3 7.5 7.5 22 23 Miscellaneous liabilities 1243.3 1192.4 1226.8 1244.2 1249.0 1247.4 1246.0 1249.2 1249.0 1250.2 1249.5 23
(1) Equity in the Farm Credit System.

Lev
els
72 Z.1, September 18, 2014
L.104 State and Local Governments (1)Billions of dollars; amounts outstanding end of period, not seasonally adjusted
2009 2010 2011 2012 2013 2013 2014 Q1 Q2 Q3 Q4 Q1 Q2
1 Total financial assets 2668.6 2761.8 2748.6 2883.1 2938.2 2934.6 2936.1 2914.5 2938.2 2971.2 3017.0 1
2 Checkable deposits and currency 99.0 104.6 121.2 117.2 123.9 114.4 111.2 114.9 123.9 121.3 120.3 2 3 Time and savings deposits 246.4 240.6 256.2 289.5 301.9 293.5 291.8 299.0 301.9 313.9 306.8 3
4 Money market fund shares 136.1 150.2 154.0 161.9 166.6 165.6 166.4 165.9 166.6 169.5 173.7 4 5 Security repurchase agreements 126.1 125.0 121.6 128.3 132.5 131.4 132.1 131.9 132.5 135.0 138.4 5
6 Credit market instruments 1526.1 1590.4 1540.5 1592.3 1561.5 1613.1 1609.7 1567.1 1561.5 1567.7 1599.0 6
7 Open market paper 88.9 102.1 91.0 85.1 76.9 84.4 82.2 79.3 76.9 75.7 74.8 7 8 Treasury securities 585.6 593.5 561.7 607.9 593.4 617.1 620.0 591.5 593.4 593.3 612.2 8 9 Agency- and GSE-backed securities 490.2 513.9 507.0 504.7 490.9 509.3 504.7 496.1 490.9 492.6 497.5 9
10 Municipal securities 11.5 12.9 13.2 13.7 13.9 14.0 14.0 13.9 13.9 14.1 14.4 10 11 Corporate and foreign bonds 156.8 164.6 164.1 170.1 172.5 173.4 173.6 172.5 172.5 175.0 178.6 11 12 Mortgages 193.0 203.5 203.4 210.8 213.9 214.9 215.2 213.8 213.9 216.9 221.4 12
13 Corporate equities 111.8 126.3 125.2 140.7 167.6 152.0 154.2 158.8 167.6 170.4 176.4 13 14 Mutual fund shares 48.5 58.4 59.3 67.3 81.2 73.1 74.3 76.7 81.2 82.6 85.7 14
15 Trade receivables 139.1 152.2 154.5 160.3 168.7 162.0 165.0 167.4 168.7 169.1 172.3 15 16 Taxes receivable 117.1 117.8 120.0 121.3 123.8 121.8 122.6 123.4 123.8 128.6 127.6 16 17 Miscellaneous assets 118.5 96.3 96.2 104.3 110.5 107.5 108.8 109.3 110.5 113.2 116.8 17
18 Total liabilities 4715.8 5050.4 5341.0 5348.4 4931.0 5203.8 5183.1 5082.0 4931.0 5003.9 5000.4 18
19 Credit market instruments 2968.4 3038.0 2985.3 2980.0 2941.1 2994.9 2986.4 2953.1 2941.1 2931.8 2934.4 19
20 Municipal securities 2954.9 3023.6 2970.0 2964.3 2924.9 2978.9 2970.4 2937.0 2924.9 2915.5 2918.0 20 21 Short-term (2) 63.6 63.0 52.3 56.1 45.3 54.5 39.4 46.0 45.3 43.0 33.6 21 22 Long-term 2891.3 2960.6 2917.6 2908.2 2879.6 2924.4 2931.0 2891.0 2879.6 2872.5 2884.4 22 23 U.S. government loans 13.5 14.4 15.3 15.7 16.2 16.0 16.0 16.1 16.2 16.3 16.4 23
24 Trade payables 630.5 669.0 707.4 746.2 785.8 755.9 765.8 775.8 785.8 795.8 806.0 24 25 Claims of pension fund on sponsor (3) 1116.9 1343.4 1648.3 1622.2 1204.1 1452.9 1430.9 1353.1 1204.1 1276.3 1260.1 25
(1) Data for employee retirement funds are shown in table L.118.(2) Debt with original maturity of 13 months or less.(3) Included in miscellaneous liabilities.
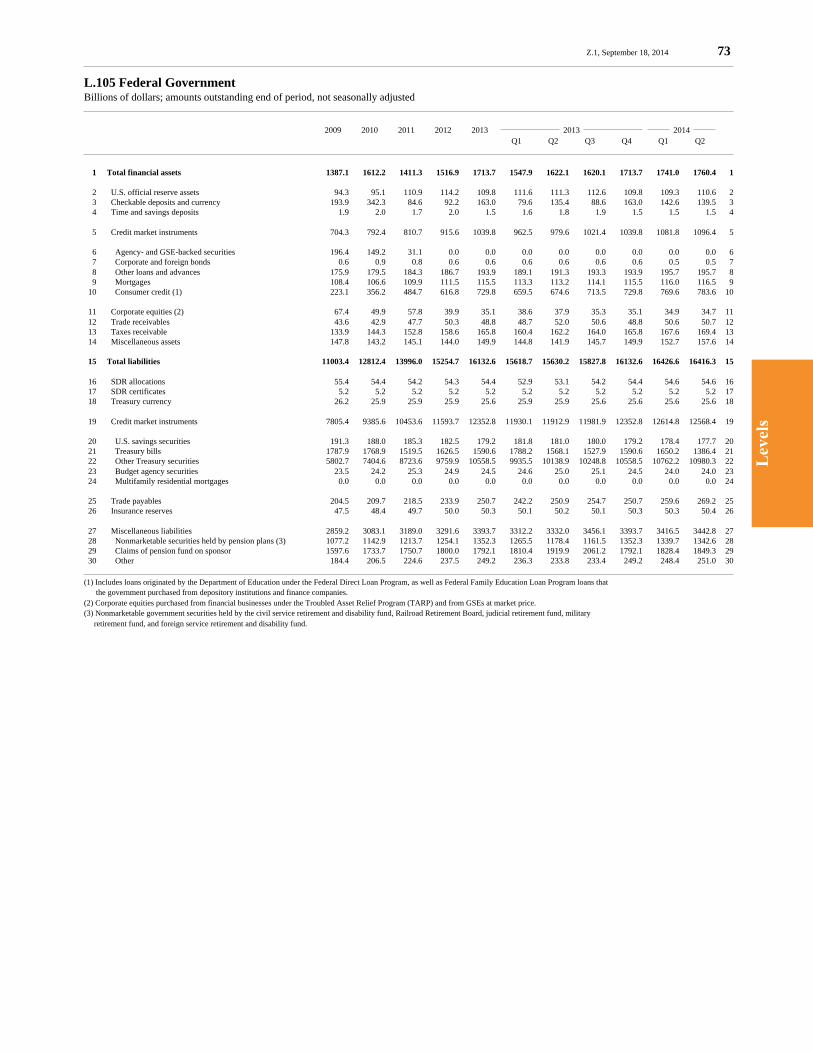
Lev
els
Z.1, September 18, 2014 73
L.105 Federal GovernmentBillions of dollars; amounts outstanding end of period, not seasonally adjusted
2009 2010 2011 2012 2013 2013 2014 Q1 Q2 Q3 Q4 Q1 Q2
1 Total financial assets 1387.1 1612.2 1411.3 1516.9 1713.7 1547.9 1622.1 1620.1 1713.7 1741.0 1760.4 1
2 U.S. official reserve assets 94.3 95.1 110.9 114.2 109.8 111.6 111.3 112.6 109.8 109.3 110.6 2 3 Checkable deposits and currency 193.9 342.3 84.6 92.2 163.0 79.6 135.4 88.6 163.0 142.6 139.5 3 4 Time and savings deposits 1.9 2.0 1.7 2.0 1.5 1.6 1.8 1.9 1.5 1.5 1.5 4
5 Credit market instruments 704.3 792.4 810.7 915.6 1039.8 962.5 979.6 1021.4 1039.8 1081.8 1096.4 5
6 Agency- and GSE-backed securities 196.4 149.2 31.1 0.0 0.0 0.0 0.0 0.0 0.0 0.0 0.0 6 7 Corporate and foreign bonds 0.6 0.9 0.8 0.6 0.6 0.6 0.6 0.6 0.6 0.5 0.5 7 8 Other loans and advances 175.9 179.5 184.3 186.7 193.9 189.1 191.3 193.3 193.9 195.7 195.7 8 9 Mortgages 108.4 106.6 109.9 111.5 115.5 113.3 113.2 114.1 115.5 116.0 116.5 9 10 Consumer credit (1) 223.1 356.2 484.7 616.8 729.8 659.5 674.6 713.5 729.8 769.6 783.6 10
11 Corporate equities (2) 67.4 49.9 57.8 39.9 35.1 38.6 37.9 35.3 35.1 34.9 34.7 11 12 Trade receivables 43.6 42.9 47.7 50.3 48.8 48.7 52.0 50.6 48.8 50.6 50.7 12 13 Taxes receivable 133.9 144.3 152.8 158.6 165.8 160.4 162.2 164.0 165.8 167.6 169.4 13 14 Miscellaneous assets 147.8 143.2 145.1 144.0 149.9 144.8 141.9 145.7 149.9 152.7 157.6 14
15 Total liabilities 11003.4 12812.4 13996.0 15254.7 16132.6 15618.7 15630.2 15827.8 16132.6 16426.6 16416.3 15
16 SDR allocations 55.4 54.4 54.2 54.3 54.4 52.9 53.1 54.2 54.4 54.6 54.6 16 17 SDR certificates 5.2 5.2 5.2 5.2 5.2 5.2 5.2 5.2 5.2 5.2 5.2 17 18 Treasury currency 26.2 25.9 25.9 25.9 25.6 25.9 25.9 25.6 25.6 25.6 25.6 18
19 Credit market instruments 7805.4 9385.6 10453.6 11593.7 12352.8 11930.1 11912.9 11981.9 12352.8 12614.8 12568.4 19
20 U.S. savings securities 191.3 188.0 185.3 182.5 179.2 181.8 181.0 180.0 179.2 178.4 177.7 20 21 Treasury bills 1787.9 1768.9 1519.5 1626.5 1590.6 1788.2 1568.1 1527.9 1590.6 1650.2 1386.4 21 22 Other Treasury securities 5802.7 7404.6 8723.6 9759.9 10558.5 9935.5 10138.9 10248.8 10558.5 10762.2 10980.3 22 23 Budget agency securities 23.5 24.2 25.3 24.9 24.5 24.6 25.0 25.1 24.5 24.0 24.0 23 24 Multifamily residential mortgages 0.0 0.0 0.0 0.0 0.0 0.0 0.0 0.0 0.0 0.0 0.0 24
25 Trade payables 204.5 209.7 218.5 233.9 250.7 242.2 250.9 254.7 250.7 259.6 269.2 25 26 Insurance reserves 47.5 48.4 49.7 50.0 50.3 50.1 50.2 50.1 50.3 50.3 50.4 26
27 Miscellaneous liabilities 2859.2 3083.1 3189.0 3291.6 3393.7 3312.2 3332.0 3456.1 3393.7 3416.5 3442.8 27 28 Nonmarketable securities held by pension plans (3) 1077.2 1142.9 1213.7 1254.1 1352.3 1265.5 1178.4 1161.5 1352.3 1339.7 1342.6 28 29 Claims of pension fund on sponsor 1597.6 1733.7 1750.7 1800.0 1792.1 1810.4 1919.9 2061.2 1792.1 1828.4 1849.3 29 30 Other 184.4 206.5 224.6 237.5 249.2 236.3 233.8 233.4 249.2 248.4 251.0 30
(1) Includes loans originated by the Department of Education under the Federal Direct Loan Program, as well as Federal Family Education Loan Program loans that the government purchased from depository institutions and finance companies.(2) Corporate equities purchased from financial businesses under the Troubled Asset Relief Program (TARP) and from GSEs at market price.(3) Nonmarketable government securities held by the civil service retirement and disability fund, Railroad Retirement Board, judicial retirement fund, military retirement fund, and foreign service retirement and disability fund.

Lev
els
74 Z.1, September 18, 2014
L.106 Rest of the WorldBillions of dollars; amounts outstanding end of period, not seasonally adjusted
2009 2010 2011 2012 2013 2013 2014 Q1 Q2 Q3 Q4 Q1 Q2
1 Total financial assets 14362.3 16054.1 17513.0 18951.0 21093.4 19744.9 19933.2 20411.5 21093.4 21642.3 22277.2 1
2 SDR allocations 55.4 54.4 54.2 54.3 54.4 52.9 53.1 54.2 54.4 54.6 54.6 2 3 Net interbank assets 86.0 24.2 238.1 102.1 396.7 197.6 480.9 440.5 396.7 448.2 463.4 3 4 U.S. checkable deposits and currency 361.0 390.5 472.3 540.4 590.3 543.2 551.5 573.9 590.3 620.2 636.8 4
5 U.S. time deposits 299.2 308.2 355.6 393.4 442.8 392.5 399.4 419.5 442.8 459.0 493.1 5 6 Money market fund shares 76.9 69.8 74.4 96.9 113.3 103.4 110.0 110.1 113.3 115.0 116.3 6 7 Security repurchase agreements 489.4 581.8 678.5 671.9 734.1 740.0 723.2 726.0 734.1 805.5 840.5 7
8 Credit market instruments 7662.4 8413.9 8944.8 9508.7 9732.3 9637.8 9426.0 9564.6 9732.3 9966.9 10032.7 8
9 Open market paper 117.2 102.1 102.7 102.8 101.7 109.8 111.4 89.6 101.7 106.8 117.5 9
10 Treasury securities 3670.6 4458.8 5004.4 5571.5 5794.9 5721.3 5595.0 5654.7 5794.9 5952.3 5934.0 10 11 Treasury bills 750.4 710.3 647.7 661.7 686.0 720.2 675.4 645.1 686.0 689.8 627.3 11 12 Other Treasury securities 2920.2 3748.5 4356.7 4909.8 5108.9 5001.1 4919.7 5009.5 5108.9 5262.4 5306.6 12
13 Agency- and GSE-backed securities 1150.0 1095.8 1078.2 1001.2 885.3 957.3 904.1 926.0 885.3 860.6 851.1 13 14 Municipal securities 58.7 71.7 72.4 71.8 76.1 72.5 73.5 74.9 76.1 76.9 77.4 14 15 U.S. corporate bonds (1) 2483.5 2523.1 2491.0 2617.6 2734.0 2635.3 2589.7 2680.4 2734.0 2818.7 2894.4 15 16 Loans to U.S. corporate business 182.5 162.3 196.1 143.9 140.4 141.5 152.3 138.9 140.4 151.7 158.4 16
17 U.S. corporate equities 2658.4 3216.0 3397.2 3953.0 5163.7 4393.3 4463.2 4749.3 5163.7 5323.7 5637.1 17 18 Mutual fund shares 182.4 260.0 370.4 495.4 544.5 503.7 503.5 517.2 544.5 554.9 586.2 18 19 Trade receivables 93.1 111.8 128.8 140.5 144.4 143.8 148.8 140.7 144.4 159.8 163.3 19
20 Foreign direct investment in U.S. (2) 2398.2 2623.6 2798.7 2994.3 3176.9 3036.6 3073.7 3115.6 3176.9 3134.4 3253.3 20
21 Total liabilities 8149.5 8862.5 9431.5 9907.1 10265.5 10060.1 10067.4 10318.3 10265.5 10421.5 10573.7 21
22 U.S. official reserve assets (3) 119.4 121.1 136.7 138.9 133.4 135.1 134.5 136.5 133.4 133.1 134.5 22 23 U.S. private deposits 1258.4 1303.9 1066.4 922.8 954.8 974.1 1015.6 1014.7 954.8 927.9 906.4 23 24 Security repurchase agreements 454.8 663.7 764.7 805.1 721.6 784.5 741.8 787.5 721.6 792.2 755.9 24
25 Credit market instruments 2006.5 2258.5 2485.5 2828.0 2966.2 2889.7 2841.6 2907.9 2966.2 3037.2 3149.3 25
26 Commercial paper 401.3 398.6 345.1 373.0 407.0 407.4 417.4 405.9 407.0 413.8 435.1 26 27 Bonds 1447.8 1677.6 1913.6 2186.5 2250.4 2205.8 2140.5 2207.2 2250.4 2300.6 2376.2 27
28 Depository institution loans n.e.c. 137.5 162.0 205.2 237.7 276.7 246.0 252.2 262.5 276.7 290.5 305.5 28 29 Other loans and advances 19.9 20.2 21.5 30.8 32.2 30.5 31.5 32.4 32.2 32.3 32.6 29
30 Trade payables 45.1 51.1 55.1 55.7 45.3 54.9 59.1 44.0 45.3 36.5 37.9 30 31 U.S. direct investment abroad (1,2) 4077.4 4273.6 4599.5 4972.9 5284.0 5016.6 5110.4 5237.7 5284.0 5336.3 5425.1 31
32 Miscellaneous liabilities 187.9 190.6 323.6 183.5 160.2 205.2 164.4 189.9 160.2 158.3 164.6 32 33 U.S. equity in IBRD, etc. 50.0 52.3 54.9 57.3 59.5 57.3 59.4 59.4 59.5 59.5 61.2 33 34 Nonofficial foreign currencies 12.9 2.7 102.5 11.5 2.9 10.7 4.3 3.1 2.9 3.0 2.8 34 35 Investment by holding companies 125.1 135.6 166.3 114.7 97.8 137.2 100.7 127.3 97.8 95.8 100.7 35
Memo:
36 Market value of foreign equities 3995.3 4900.2 4501.4 5311.5 6444.2 5524.3 5508.8 6037.3 6444.2 6595.3 6992.8 36 held by U.S. residents (4)
(1) Through 1992:Q4, corporate bonds include net issues by Netherlands Antillean financial subsidiaries; U.S. direct investment abroad excludes net inflows from those bond issues.(2) Direct investment is valued on a current-cost basis.(3) Does not include monetary gold.(4) Includes American Depositary Receipts (ADRs).
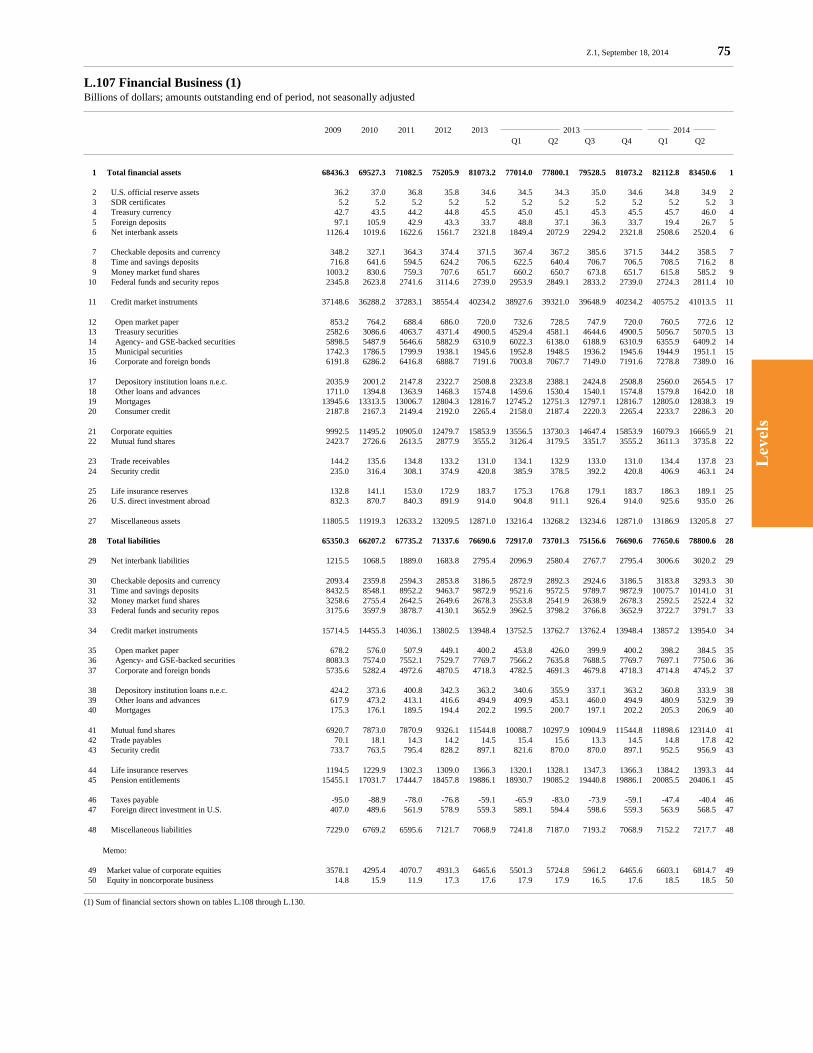
Lev
els
Z.1, September 18, 2014 75
L.107 Financial Business (1)Billions of dollars; amounts outstanding end of period, not seasonally adjusted
2009 2010 2011 2012 2013 2013 2014 Q1 Q2 Q3 Q4 Q1 Q2
1 Total financial assets 68436.3 69527.3 71082.5 75205.9 81073.2 77014.0 77800.1 79528.5 81073.2 82112.8 83450.6 1
2 U.S. official reserve assets 36.2 37.0 36.8 35.8 34.6 34.5 34.3 35.0 34.6 34.8 34.9 2 3 SDR certificates 5.2 5.2 5.2 5.2 5.2 5.2 5.2 5.2 5.2 5.2 5.2 3 4 Treasury currency 42.7 43.5 44.2 44.8 45.5 45.0 45.1 45.3 45.5 45.7 46.0 4 5 Foreign deposits 97.1 105.9 42.9 43.3 33.7 48.8 37.1 36.3 33.7 19.4 26.7 5 6 Net interbank assets 1126.4 1019.6 1622.6 1561.7 2321.8 1849.4 2072.9 2294.2 2321.8 2508.6 2520.4 6
7 Checkable deposits and currency 348.2 327.1 364.3 374.4 371.5 367.4 367.2 385.6 371.5 344.2 358.5 7 8 Time and savings deposits 716.8 641.6 594.5 624.2 706.5 622.5 640.4 706.7 706.5 708.5 716.2 8 9 Money market fund shares 1003.2 830.6 759.3 707.6 651.7 660.2 650.7 673.8 651.7 615.8 585.2 9 10 Federal funds and security repos 2345.8 2623.8 2741.6 3114.6 2739.0 2953.9 2849.1 2833.2 2739.0 2724.3 2811.4 10
11 Credit market instruments 37148.6 36288.2 37283.1 38554.4 40234.2 38927.6 39321.0 39648.9 40234.2 40575.2 41013.5 11
12 Open market paper 853.2 764.2 688.4 686.0 720.0 732.6 728.5 747.9 720.0 760.5 772.6 12 13 Treasury securities 2582.6 3086.6 4063.7 4371.4 4900.5 4529.4 4581.1 4644.6 4900.5 5056.7 5070.5 13 14 Agency- and GSE-backed securities 5898.5 5487.9 5646.6 5882.9 6310.9 6022.3 6138.0 6188.9 6310.9 6355.9 6409.2 14 15 Municipal securities 1742.3 1786.5 1799.9 1938.1 1945.6 1952.8 1948.5 1936.2 1945.6 1944.9 1951.1 15 16 Corporate and foreign bonds 6191.8 6286.2 6416.8 6888.7 7191.6 7003.8 7067.7 7149.0 7191.6 7278.8 7389.0 16
17 Depository institution loans n.e.c. 2035.9 2001.2 2147.8 2322.7 2508.8 2323.8 2388.1 2424.8 2508.8 2560.0 2654.5 17 18 Other loans and advances 1711.0 1394.8 1363.9 1468.3 1574.8 1459.6 1530.4 1540.1 1574.8 1579.8 1642.0 18 19 Mortgages 13945.6 13313.5 13006.7 12804.3 12816.7 12745.2 12751.3 12797.1 12816.7 12805.0 12838.3 19 20 Consumer credit 2187.8 2167.3 2149.4 2192.0 2265.4 2158.0 2187.4 2220.3 2265.4 2233.7 2286.3 20
21 Corporate equities 9992.5 11495.2 10905.0 12479.7 15853.9 13556.5 13730.3 14647.4 15853.9 16079.3 16665.9 21 22 Mutual fund shares 2423.7 2726.6 2613.5 2877.9 3555.2 3126.4 3179.5 3351.7 3555.2 3611.3 3735.8 22
23 Trade receivables 144.2 135.6 134.8 133.2 131.0 134.1 132.9 133.0 131.0 134.4 137.8 23 24 Security credit 235.0 316.4 308.1 374.9 420.8 385.9 378.5 392.2 420.8 406.9 463.1 24
25 Life insurance reserves 132.8 141.1 153.0 172.9 183.7 175.3 176.8 179.1 183.7 186.3 189.1 25 26 U.S. direct investment abroad 832.3 870.7 840.3 891.9 914.0 904.8 911.1 926.4 914.0 925.6 935.0 26
27 Miscellaneous assets 11805.5 11919.3 12633.2 13209.5 12871.0 13216.4 13268.2 13234.6 12871.0 13186.9 13205.8 27
28 Total liabilities 65350.3 66207.2 67735.2 71337.6 76690.6 72917.0 73701.3 75156.6 76690.6 77650.6 78800.6 28
29 Net interbank liabilities 1215.5 1068.5 1889.0 1683.8 2795.4 2096.9 2580.4 2767.7 2795.4 3006.6 3020.2 29
30 Checkable deposits and currency 2093.4 2359.8 2594.3 2853.8 3186.5 2872.9 2892.3 2924.6 3186.5 3183.8 3293.3 30 31 Time and savings deposits 8432.5 8548.1 8952.2 9463.7 9872.9 9521.6 9572.5 9789.7 9872.9 10075.7 10141.0 31 32 Money market fund shares 3258.6 2755.4 2642.5 2649.6 2678.3 2553.8 2541.9 2638.9 2678.3 2592.5 2522.4 32 33 Federal funds and security repos 3175.6 3597.9 3878.7 4130.1 3652.9 3962.5 3798.2 3766.8 3652.9 3722.7 3791.7 33
34 Credit market instruments 15714.5 14455.3 14036.1 13802.5 13948.4 13752.5 13762.7 13762.4 13948.4 13857.2 13954.0 34
35 Open market paper 678.2 576.0 507.9 449.1 400.2 453.8 426.0 399.9 400.2 398.2 384.5 35 36 Agency- and GSE-backed securities 8083.3 7574.0 7552.1 7529.7 7769.7 7566.2 7635.8 7688.5 7769.7 7697.1 7750.6 36 37 Corporate and foreign bonds 5735.6 5282.4 4972.6 4870.5 4718.3 4782.5 4691.3 4679.8 4718.3 4714.8 4745.2 37
38 Depository institution loans n.e.c. 424.2 373.6 400.8 342.3 363.2 340.6 355.9 337.1 363.2 360.8 333.9 38 39 Other loans and advances 617.9 473.2 413.1 416.6 494.9 409.9 453.1 460.0 494.9 480.9 532.9 39 40 Mortgages 175.3 176.1 189.5 194.4 202.2 199.5 200.7 197.1 202.2 205.3 206.9 40
41 Mutual fund shares 6920.7 7873.0 7870.9 9326.1 11544.8 10088.7 10297.9 10904.9 11544.8 11898.6 12314.0 41 42 Trade payables 70.1 18.1 14.3 14.2 14.5 15.4 15.6 13.3 14.5 14.8 17.8 42 43 Security credit 733.7 763.5 795.4 828.2 897.1 821.6 870.0 870.0 897.1 952.5 956.9 43
44 Life insurance reserves 1194.5 1229.9 1302.3 1309.0 1366.3 1320.1 1328.1 1347.3 1366.3 1384.2 1393.3 44 45 Pension entitlements 15455.1 17031.7 17444.7 18457.8 19886.1 18930.7 19085.2 19440.8 19886.1 20085.5 20406.1 45
46 Taxes payable -95.0 -88.9 -78.0 -76.8 -59.1 -65.9 -83.0 -73.9 -59.1 -47.4 -40.4 46 47 Foreign direct investment in U.S. 407.0 489.6 561.9 578.9 559.3 589.1 594.4 598.6 559.3 563.9 568.5 47
48 Miscellaneous liabilities 7229.0 6769.2 6595.6 7121.7 7068.9 7241.8 7187.0 7193.2 7068.9 7152.2 7217.7 48
Memo:
49 Market value of corporate equities 3578.1 4295.4 4070.7 4931.3 6465.6 5501.3 5724.8 5961.2 6465.6 6603.1 6814.7 49 50 Equity in noncorporate business 14.8 15.9 11.9 17.3 17.6 17.9 17.9 16.5 17.6 18.5 18.5 50
(1) Sum of financial sectors shown on tables L.108 through L.130.
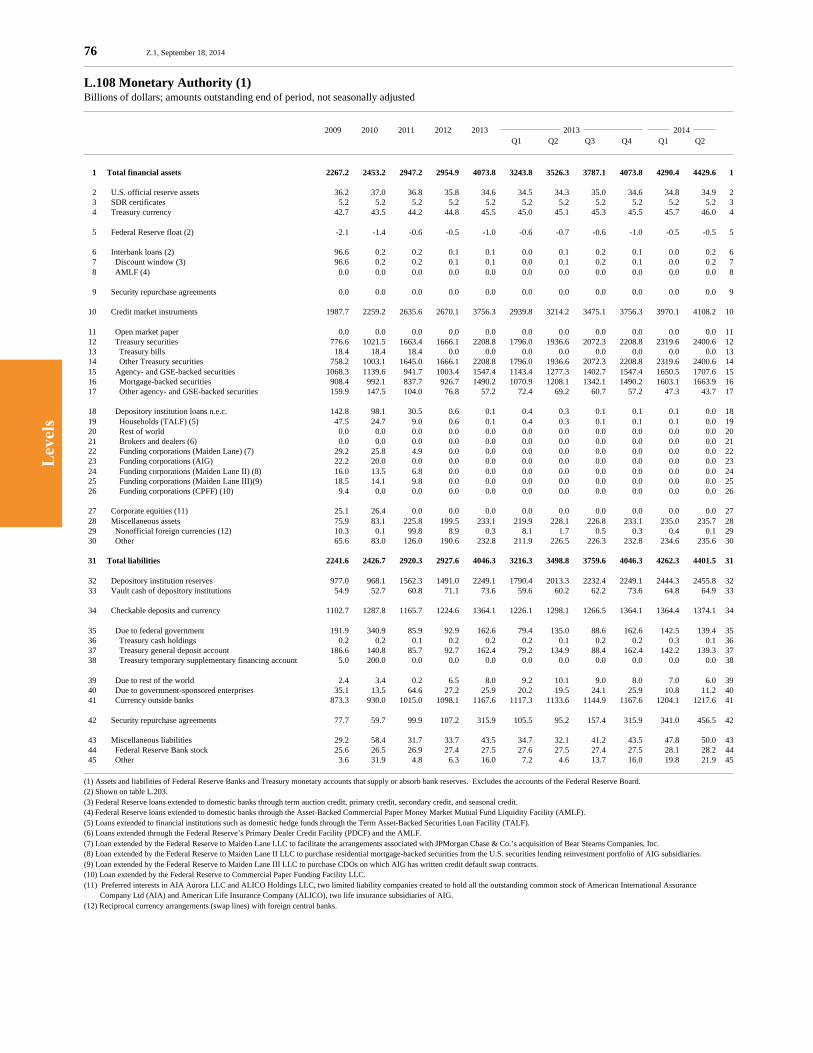
Lev
els
76 Z.1, September 18, 2014
L.108 Monetary Authority (1)Billions of dollars; amounts outstanding end of period, not seasonally adjusted
2009 2010 2011 2012 2013 2013 2014 Q1 Q2 Q3 Q4 Q1 Q2
1 Total financial assets 2267.2 2453.2 2947.2 2954.9 4073.8 3243.8 3526.3 3787.1 4073.8 4290.4 4429.6 1
2 U.S. official reserve assets 36.2 37.0 36.8 35.8 34.6 34.5 34.3 35.0 34.6 34.8 34.9 2 3 SDR certificates 5.2 5.2 5.2 5.2 5.2 5.2 5.2 5.2 5.2 5.2 5.2 3 4 Treasury currency 42.7 43.5 44.2 44.8 45.5 45.0 45.1 45.3 45.5 45.7 46.0 4
5 Federal Reserve float (2) -2.1 -1.4 -0.6 -0.5 -1.0 -0.6 -0.7 -0.6 -1.0 -0.5 -0.5 5
6 Interbank loans (2) 96.6 0.2 0.2 0.1 0.1 0.0 0.1 0.2 0.1 0.0 0.2 6 7 Discount window (3) 96.6 0.2 0.2 0.1 0.1 0.0 0.1 0.2 0.1 0.0 0.2 7 8 AMLF (4) 0.0 0.0 0.0 0.0 0.0 0.0 0.0 0.0 0.0 0.0 0.0 8
9 Security repurchase agreements 0.0 0.0 0.0 0.0 0.0 0.0 0.0 0.0 0.0 0.0 0.0 9
10 Credit market instruments 1987.7 2259.2 2635.6 2670.1 3756.3 2939.8 3214.2 3475.1 3756.3 3970.1 4108.2 10
11 Open market paper 0.0 0.0 0.0 0.0 0.0 0.0 0.0 0.0 0.0 0.0 0.0 11 12 Treasury securities 776.6 1021.5 1663.4 1666.1 2208.8 1796.0 1936.6 2072.3 2208.8 2319.6 2400.6 12 13 Treasury bills 18.4 18.4 18.4 0.0 0.0 0.0 0.0 0.0 0.0 0.0 0.0 13 14 Other Treasury securities 758.2 1003.1 1645.0 1666.1 2208.8 1796.0 1936.6 2072.3 2208.8 2319.6 2400.6 14 15 Agency- and GSE-backed securities 1068.3 1139.6 941.7 1003.4 1547.4 1143.4 1277.3 1402.7 1547.4 1650.5 1707.6 15 16 Mortgage-backed securities 908.4 992.1 837.7 926.7 1490.2 1070.9 1208.1 1342.1 1490.2 1603.1 1663.9 16 17 Other agency- and GSE-backed securities 159.9 147.5 104.0 76.8 57.2 72.4 69.2 60.7 57.2 47.3 43.7 17
18 Depository institution loans n.e.c. 142.8 98.1 30.5 0.6 0.1 0.4 0.3 0.1 0.1 0.1 0.0 18 19 Households (TALF) (5) 47.5 24.7 9.0 0.6 0.1 0.4 0.3 0.1 0.1 0.1 0.0 19 20 Rest of world 0.0 0.0 0.0 0.0 0.0 0.0 0.0 0.0 0.0 0.0 0.0 20 21 Brokers and dealers (6) 0.0 0.0 0.0 0.0 0.0 0.0 0.0 0.0 0.0 0.0 0.0 21 22 Funding corporations (Maiden Lane) (7) 29.2 25.8 4.9 0.0 0.0 0.0 0.0 0.0 0.0 0.0 0.0 22 23 Funding corporations (AIG) 22.2 20.0 0.0 0.0 0.0 0.0 0.0 0.0 0.0 0.0 0.0 23 24 Funding corporations (Maiden Lane II) (8) 16.0 13.5 6.8 0.0 0.0 0.0 0.0 0.0 0.0 0.0 0.0 24 25 Funding corporations (Maiden Lane III)(9) 18.5 14.1 9.8 0.0 0.0 0.0 0.0 0.0 0.0 0.0 0.0 25 26 Funding corporations (CPFF) (10) 9.4 0.0 0.0 0.0 0.0 0.0 0.0 0.0 0.0 0.0 0.0 26
27 Corporate equities (11) 25.1 26.4 0.0 0.0 0.0 0.0 0.0 0.0 0.0 0.0 0.0 27 28 Miscellaneous assets 75.9 83.1 225.8 199.5 233.1 219.9 228.1 226.8 233.1 235.0 235.7 28 29 Nonofficial foreign currencies (12) 10.3 0.1 99.8 8.9 0.3 8.1 1.7 0.5 0.3 0.4 0.1 29 30 Other 65.6 83.0 126.0 190.6 232.8 211.9 226.5 226.3 232.8 234.6 235.6 30
31 Total liabilities 2241.6 2426.7 2920.3 2927.6 4046.3 3216.3 3498.8 3759.6 4046.3 4262.3 4401.5 31
32 Depository institution reserves 977.0 968.1 1562.3 1491.0 2249.1 1790.4 2013.3 2232.4 2249.1 2444.3 2455.8 32 33 Vault cash of depository institutions 54.9 52.7 60.8 71.1 73.6 59.6 60.2 62.2 73.6 64.8 64.9 33
34 Checkable deposits and currency 1102.7 1287.8 1165.7 1224.6 1364.1 1226.1 1298.1 1266.5 1364.1 1364.4 1374.1 34
35 Due to federal government 191.9 340.9 85.9 92.9 162.6 79.4 135.0 88.6 162.6 142.5 139.4 35 36 Treasury cash holdings 0.2 0.2 0.1 0.2 0.2 0.2 0.1 0.2 0.2 0.3 0.1 36 37 Treasury general deposit account 186.6 140.8 85.7 92.7 162.4 79.2 134.9 88.4 162.4 142.2 139.3 37 38 Treasury temporary supplementary financing account 5.0 200.0 0.0 0.0 0.0 0.0 0.0 0.0 0.0 0.0 0.0 38
39 Due to rest of the world 2.4 3.4 0.2 6.5 8.0 9.2 10.1 9.0 8.0 7.0 6.0 39 40 Due to government-sponsored enterprises 35.1 13.5 64.6 27.2 25.9 20.2 19.5 24.1 25.9 10.8 11.2 40 41 Currency outside banks 873.3 930.0 1015.0 1098.1 1167.6 1117.3 1133.6 1144.9 1167.6 1204.1 1217.6 41
42 Security repurchase agreements 77.7 59.7 99.9 107.2 315.9 105.5 95.2 157.4 315.9 341.0 456.5 42
43 Miscellaneous liabilities 29.2 58.4 31.7 33.7 43.5 34.7 32.1 41.2 43.5 47.8 50.0 43 44 Federal Reserve Bank stock 25.6 26.5 26.9 27.4 27.5 27.6 27.5 27.4 27.5 28.1 28.2 44 45 Other 3.6 31.9 4.8 6.3 16.0 7.2 4.6 13.7 16.0 19.8 21.9 45
(1) Assets and liabilities of Federal Reserve Banks and Treasury monetary accounts that supply or absorb bank reserves. Excludes the accounts of the Federal Reserve Board.(2) Shown on table L.203.(3) Federal Reserve loans extended to domestic banks through term auction credit, primary credit, secondary credit, and seasonal credit.(4) Federal Reserve loans extended to domestic banks through the Asset-Backed Commercial Paper Money Market Mutual Fund Liquidity Facility (AMLF).(5) Loans extended to financial institutions such as domestic hedge funds through the Term Asset-Backed Securities Loan Facility (TALF).(6) Loans extended through the Federal Reserve’s Primary Dealer Credit Facility (PDCF) and the AMLF.(7) Loan extended by the Federal Reserve to Maiden Lane LLC to facilitate the arrangements associated with JPMorgan Chase & Co.’s acquisition of Bear Stearns Companies, Inc.(8) Loan extended by the Federal Reserve to Maiden Lane II LLC to purchase residential mortgage-backed securities from the U.S. securities lending reinvestment portfolio of AIG subsidiaries.(9) Loan extended by the Federal Reserve to Maiden Lane III LLC to purchase CDOs on which AIG has written credit default swap contracts.(10) Loan extended by the Federal Reserve to Commercial Paper Funding Facility LLC.(11) Preferred interests in AIA Aurora LLC and ALICO Holdings LLC, two limited liability companies created to hold all the outstanding common stock of American International Assurance Company Ltd (AIA) and American Life Insurance Company (ALICO), two life insurance subsidiaries of AIG.(12) Reciprocal currency arrangements (swap lines) with foreign central banks.
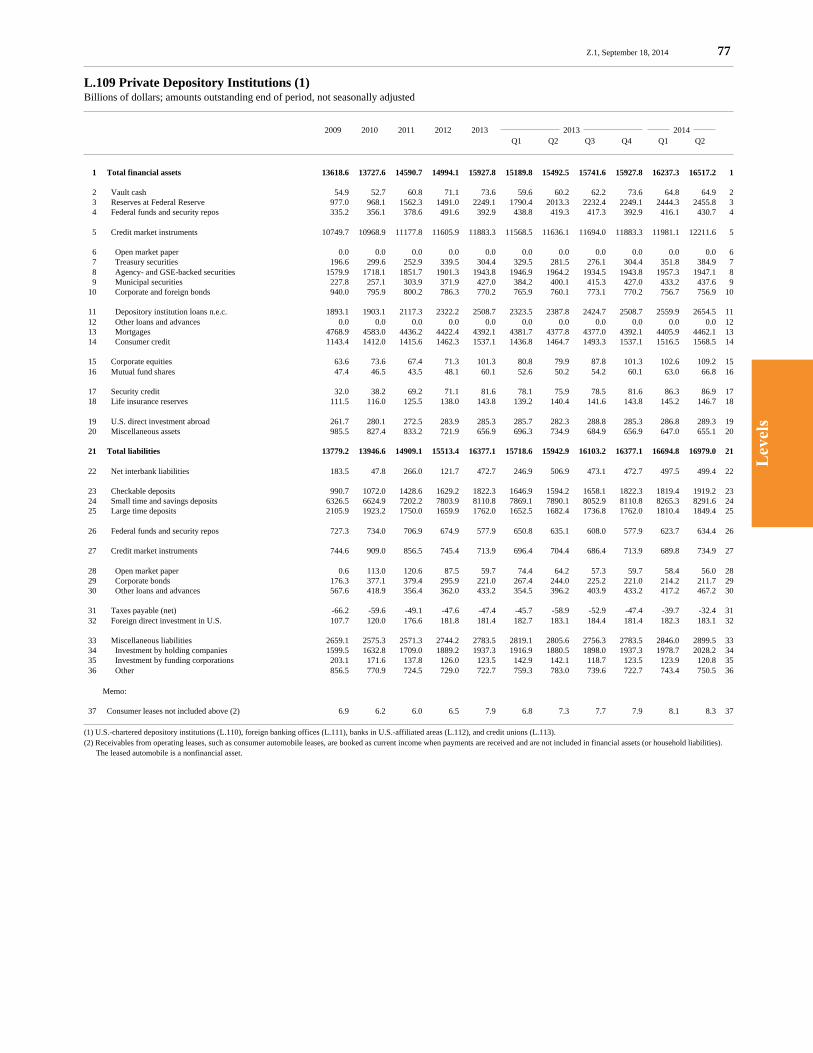
Lev
els
Z.1, September 18, 2014 77
L.109 Private Depository Institutions (1)Billions of dollars; amounts outstanding end of period, not seasonally adjusted
2009 2010 2011 2012 2013 2013 2014 Q1 Q2 Q3 Q4 Q1 Q2
1 Total financial assets 13618.6 13727.6 14590.7 14994.1 15927.8 15189.8 15492.5 15741.6 15927.8 16237.3 16517.2 1
2 Vault cash 54.9 52.7 60.8 71.1 73.6 59.6 60.2 62.2 73.6 64.8 64.9 2 3 Reserves at Federal Reserve 977.0 968.1 1562.3 1491.0 2249.1 1790.4 2013.3 2232.4 2249.1 2444.3 2455.8 3 4 Federal funds and security repos 335.2 356.1 378.6 491.6 392.9 438.8 419.3 417.3 392.9 416.1 430.7 4
5 Credit market instruments 10749.7 10968.9 11177.8 11605.9 11883.3 11568.5 11636.1 11694.0 11883.3 11981.1 12211.6 5
6 Open market paper 0.0 0.0 0.0 0.0 0.0 0.0 0.0 0.0 0.0 0.0 0.0 6 7 Treasury securities 196.6 299.6 252.9 339.5 304.4 329.5 281.5 276.1 304.4 351.8 384.9 7 8 Agency- and GSE-backed securities 1579.9 1718.1 1851.7 1901.3 1943.8 1946.9 1964.2 1934.5 1943.8 1957.3 1947.1 8 9 Municipal securities 227.8 257.1 303.9 371.9 427.0 384.2 400.1 415.3 427.0 433.2 437.6 9 10 Corporate and foreign bonds 940.0 795.9 800.2 786.3 770.2 765.9 760.1 773.1 770.2 756.7 756.9 10
11 Depository institution loans n.e.c. 1893.1 1903.1 2117.3 2322.2 2508.7 2323.5 2387.8 2424.7 2508.7 2559.9 2654.5 11 12 Other loans and advances 0.0 0.0 0.0 0.0 0.0 0.0 0.0 0.0 0.0 0.0 0.0 12 13 Mortgages 4768.9 4583.0 4436.2 4422.4 4392.1 4381.7 4377.8 4377.0 4392.1 4405.9 4462.1 13 14 Consumer credit 1143.4 1412.0 1415.6 1462.3 1537.1 1436.8 1464.7 1493.3 1537.1 1516.5 1568.5 14
15 Corporate equities 63.6 73.6 67.4 71.3 101.3 80.8 79.9 87.8 101.3 102.6 109.2 15 16 Mutual fund shares 47.4 46.5 43.5 48.1 60.1 52.6 50.2 54.2 60.1 63.0 66.8 16
17 Security credit 32.0 38.2 69.2 71.1 81.6 78.1 75.9 78.5 81.6 86.3 86.9 17 18 Life insurance reserves 111.5 116.0 125.5 138.0 143.8 139.2 140.4 141.6 143.8 145.2 146.7 18
19 U.S. direct investment abroad 261.7 280.1 272.5 283.9 285.3 285.7 282.3 288.8 285.3 286.8 289.3 19 20 Miscellaneous assets 985.5 827.4 833.2 721.9 656.9 696.3 734.9 684.9 656.9 647.0 655.1 20
21 Total liabilities 13779.2 13946.6 14909.1 15513.4 16377.1 15718.6 15942.9 16103.2 16377.1 16694.8 16979.0 21
22 Net interbank liabilities 183.5 47.8 266.0 121.7 472.7 246.9 506.9 473.1 472.7 497.5 499.4 22
23 Checkable deposits 990.7 1072.0 1428.6 1629.2 1822.3 1646.9 1594.2 1658.1 1822.3 1819.4 1919.2 23 24 Small time and savings deposits 6326.5 6624.9 7202.2 7803.9 8110.8 7869.1 7890.1 8052.9 8110.8 8265.3 8291.6 24 25 Large time deposits 2105.9 1923.2 1750.0 1659.9 1762.0 1652.5 1682.4 1736.8 1762.0 1810.4 1849.4 25
26 Federal funds and security repos 727.3 734.0 706.9 674.9 577.9 650.8 635.1 608.0 577.9 623.7 634.4 26
27 Credit market instruments 744.6 909.0 856.5 745.4 713.9 696.4 704.4 686.4 713.9 689.8 734.9 27
28 Open market paper 0.6 113.0 120.6 87.5 59.7 74.4 64.2 57.3 59.7 58.4 56.0 28 29 Corporate bonds 176.3 377.1 379.4 295.9 221.0 267.4 244.0 225.2 221.0 214.2 211.7 29 30 Other loans and advances 567.6 418.9 356.4 362.0 433.2 354.5 396.2 403.9 433.2 417.2 467.2 30
31 Taxes payable (net) -66.2 -59.6 -49.1 -47.6 -47.4 -45.7 -58.9 -52.9 -47.4 -39.7 -32.4 31 32 Foreign direct investment in U.S. 107.7 120.0 176.6 181.8 181.4 182.7 183.1 184.4 181.4 182.3 183.1 32
33 Miscellaneous liabilities 2659.1 2575.3 2571.3 2744.2 2783.5 2819.1 2805.6 2756.3 2783.5 2846.0 2899.5 33 34 Investment by holding companies 1599.5 1632.8 1709.0 1889.2 1937.3 1916.9 1880.5 1898.0 1937.3 1978.7 2028.2 34 35 Investment by funding corporations 203.1 171.6 137.8 126.0 123.5 142.9 142.1 118.7 123.5 123.9 120.8 35 36 Other 856.5 770.9 724.5 729.0 722.7 759.3 783.0 739.6 722.7 743.4 750.5 36
Memo:
37 Consumer leases not included above (2) 6.9 6.2 6.0 6.5 7.9 6.8 7.3 7.7 7.9 8.1 8.3 37
(1) U.S.-chartered depository institutions (L.110), foreign banking offices (L.111), banks in U.S.-affiliated areas (L.112), and credit unions (L.113).(2) Receivables from operating leases, such as consumer automobile leases, are booked as current income when payments are received and are not included in financial assets (or household liabilities). The leased automobile is a nonfinancial asset.

Lev
els
78 Z.1, September 18, 2014
L.110 U.S.-Chartered Depository InstitutionsBillions of dollars; amounts outstanding end of period, not seasonally adjusted
2009 2010 2011 2012 2013 2013 2014 Q1 Q2 Q3 Q4 Q1 Q2
1 Total financial assets 11505.4 11503.7 11849.9 12226.9 12802.7 12297.5 12382.0 12596.7 12802.7 12899.5 13138.5 1
2 Vault cash 54.9 52.7 60.8 71.1 73.6 59.6 60.2 62.2 73.6 64.8 64.9 2 3 Reserves at Federal Reserve 661.4 575.8 798.7 798.5 1252.9 981.1 1001.2 1222.5 1252.9 1311.3 1339.8 3 4 Federal funds and security repos 266.9 267.6 242.6 303.7 215.7 259.6 238.0 218.0 215.7 215.7 202.5 4
5 Credit market instruments 9117.4 9356.2 9489.9 9866.3 10101.0 9833.4 9896.3 9925.3 10101.0 10167.7 10367.8 5
6 Open market paper 0.0 0.0 0.0 0.0 0.0 0.0 0.0 0.0 0.0 0.0 0.0 6 7 Treasury securities 124.5 217.5 173.9 243.2 217.1 230.3 194.0 186.6 217.1 263.8 297.7 7 8 Agency- and GSE-backed securities 1417.4 1527.2 1634.1 1669.6 1717.3 1710.5 1725.7 1700.4 1717.3 1731.0 1724.9 8 9 Residential mortgage pass-through securities 837.5 835.3 899.1 912.8 953.5 952.8 967.6 947.9 953.5 959.1 950.9 9 10 Commercial mortgage pass-through securities 3.6 3.3 8.2 21.7 30.3 24.7 28.4 27.9 30.3 32.0 37.6 10 11 Residential CMOs and other structured MBS 264.0 393.4 473.8 454.6 431.0 446.7 435.2 422.8 431.0 442.2 440.7 11 12 Commercial CMOs and other structured MBS 4.0 3.6 13.4 42.9 66.8 47.7 54.6 59.6 66.8 70.0 72.6 12 13 Other 308.4 291.5 239.6 237.7 235.7 238.6 239.8 242.2 235.7 227.7 223.1 13
14 Municipal securities 224.3 254.6 297.3 365.0 418.9 376.2 392.3 406.4 418.9 425.2 429.9 14 15 Corporate and foreign bonds 668.2 550.5 553.0 544.0 559.2 540.5 543.2 555.8 559.2 540.2 540.8 15 16 Priv. residential mortgage pass-through securities 16.2 6.5 3.5 18.7 28.7 19.7 23.1 26.4 28.7 27.8 25.6 16 17 Priv. commercial mortgage pass-through securities 17.8 11.4 8.9 9.3 8.0 9.1 9.6 8.4 8.0 6.4 6.7 17 18 Priv. residential CMOs and other structured MBS 202.9 132.3 110.4 88.4 73.7 83.7 78.7 77.2 73.7 68.9 68.2 18 19 Priv. commercial CMOs and other structured MBS 26.0 24.7 27.4 32.7 37.3 33.8 34.4 35.5 37.3 38.8 39.6 19 20 Other 405.2 375.6 402.9 394.9 411.4 394.3 397.4 408.3 411.4 398.3 400.6 20
21 Depository institution loans n.e.c. 1404.8 1425.9 1589.6 1797.1 1933.5 1794.8 1847.0 1869.5 1933.5 1969.6 2051.3 21 22 Other loans and advances 0.0 0.0 0.0 0.0 0.0 0.0 0.0 0.0 0.0 0.0 0.0 22 23 Mortgages 4371.9 4194.9 4049.6 4028.8 3983.5 3989.8 3982.5 3975.3 3983.5 3991.3 4039.0 23 24 Consumer credit 906.3 1185.5 1192.6 1218.6 1271.6 1191.2 1211.5 1231.4 1271.6 1246.5 1284.2 24
25 Corporate equities 63.6 73.6 67.4 71.3 101.3 80.8 79.9 87.7 101.3 102.6 109.2 25 26 Mutual fund shares 46.1 45.0 41.7 45.8 57.9 50.1 47.9 52.0 57.9 60.8 64.7 26
27 Security credit 20.4 23.6 35.8 45.0 52.9 47.9 51.8 53.9 52.9 58.4 61.0 27 28 Life insurance reserves 111.5 116.0 125.5 138.0 143.8 139.2 140.4 141.6 143.8 145.2 146.7 28
29 U.S. direct investment abroad 261.7 280.1 272.5 283.9 285.3 285.7 282.3 288.8 285.3 286.8 289.3 29 30 Miscellaneous assets 901.5 713.2 715.2 603.3 518.3 560.1 584.2 544.8 518.3 486.3 492.7 30
31 Total liabilities 11622.9 11709.0 12156.0 12719.7 13295.4 12788.8 12790.1 12995.2 13295.4 13434.3 13695.3 31
32 Net interbank liabilities 633.7 428.3 164.9 36.7 227.8 96.6 135.4 191.0 227.8 213.3 221.9 32 33 Federal Reserve float -2.1 -1.4 -0.6 -0.5 -1.0 -0.6 -0.7 -0.6 -1.0 -0.5 -0.5 33 34 Borrowing from Federal Reserve banks 96.6 0.2 0.2 0.1 0.1 0.0 0.1 0.2 0.1 0.0 0.2 34 35 To domestic banks 42.2 21.3 62.1 18.7 57.2 23.8 12.4 33.1 57.2 29.0 26.5 35 36 To foreign banks 496.9 408.2 103.3 18.5 171.4 73.4 123.6 158.3 171.4 184.8 195.8 36
37 Checkable deposits 871.6 941.1 1260.5 1431.7 1579.8 1436.6 1372.9 1429.1 1579.8 1558.5 1649.4 37 38 Federal government 3.8 3.6 1.0 1.3 1.6 1.5 1.3 1.3 1.6 1.7 1.8 38 39 Rest of the world 34.3 30.4 56.1 51.8 50.2 46.3 40.5 49.5 50.2 51.8 55.1 39 40 Private domestic 833.5 907.0 1203.5 1378.5 1528.1 1388.8 1331.0 1378.4 1528.1 1505.0 1592.5 40
41 Small time and savings deposits 5617.0 5888.6 6425.7 6979.2 7236.0 7018.6 7033.2 7183.1 7236.0 7375.8 7397.1 41 42 Large time deposits 1029.9 896.1 882.9 803.0 826.9 777.6 804.4 799.3 826.9 815.4 847.9 42 43 Federal funds and security repos 532.1 484.0 402.5 349.9 265.2 327.3 325.1 301.3 265.2 267.2 267.9 43
44 Credit market instruments 718.1 882.9 832.4 720.3 686.9 674.1 680.9 659.8 686.9 662.4 705.0 44
45 Open market paper 0.6 113.0 120.6 87.5 59.7 74.4 64.2 57.3 59.7 58.4 56.0 45 46 Corporate bonds 176.3 377.1 379.4 295.9 221.0 267.4 244.0 225.2 221.0 214.2 211.7 46 47 Other loans and advances 541.1 392.8 332.3 336.9 406.2 332.3 372.7 377.3 406.2 389.8 437.3 47
48 Taxes payable (net) -66.2 -59.6 -49.1 -47.6 -47.4 -45.7 -58.9 -52.9 -47.4 -39.7 -32.4 48
49 Miscellaneous liabilities 2286.8 2247.6 2236.1 2446.4 2520.4 2503.7 2497.1 2484.5 2520.4 2581.3 2638.7 49 50 Investment by holding companies 1599.5 1632.8 1709.0 1889.2 1937.3 1916.9 1880.5 1898.0 1937.3 1978.7 2028.2 50 51 Other 687.3 614.7 527.1 557.2 583.1 586.8 616.6 586.4 583.1 602.6 610.4 51
Memo:
52 Consumer leases not included above (1) 6.9 6.2 6.0 6.5 7.9 6.8 7.3 7.7 7.9 8.1 8.3 52
(1) Receivables from operating leases, such as consumer automobile leases, are booked as current income when payments are received and are not included in financial assets (or household liabilities). The leased automobile is a nonfinancial asset.
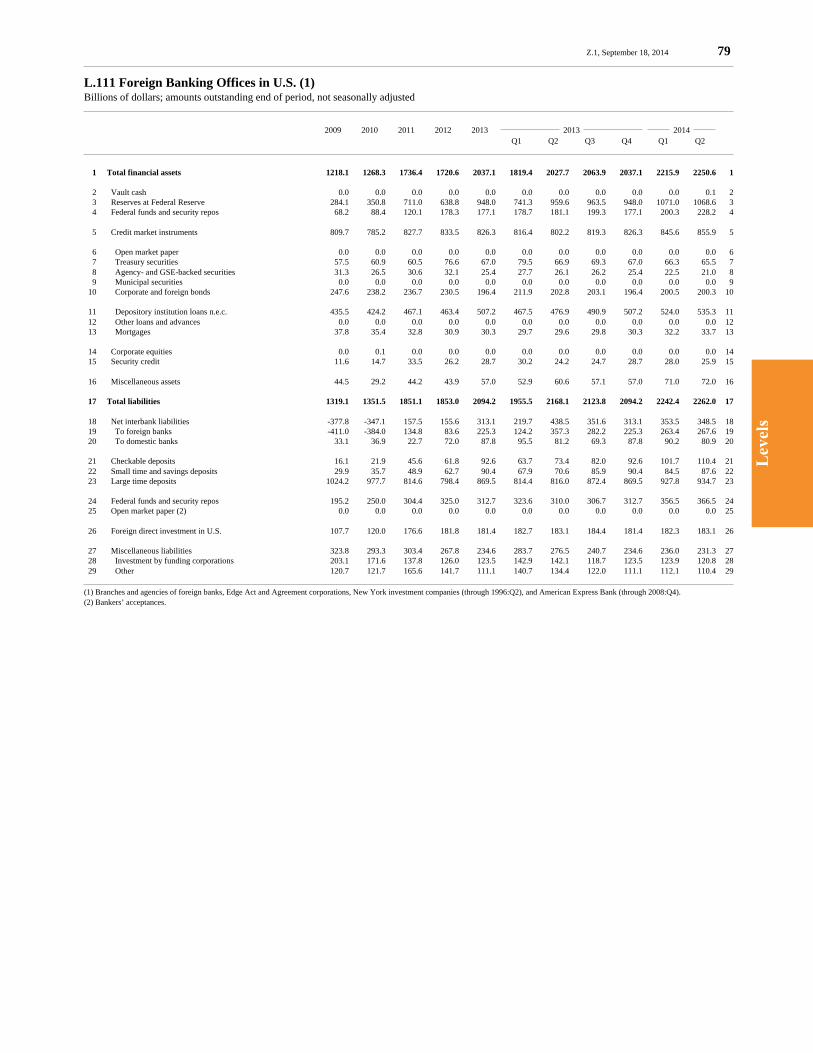
Lev
els
Z.1, September 18, 2014 79
L.111 Foreign Banking Offices in U.S. (1)Billions of dollars; amounts outstanding end of period, not seasonally adjusted
2009 2010 2011 2012 2013 2013 2014 Q1 Q2 Q3 Q4 Q1 Q2
1 Total financial assets 1218.1 1268.3 1736.4 1720.6 2037.1 1819.4 2027.7 2063.9 2037.1 2215.9 2250.6 1
2 Vault cash 0.0 0.0 0.0 0.0 0.0 0.0 0.0 0.0 0.0 0.0 0.1 2 3 Reserves at Federal Reserve 284.1 350.8 711.0 638.8 948.0 741.3 959.6 963.5 948.0 1071.0 1068.6 3 4 Federal funds and security repos 68.2 88.4 120.1 178.3 177.1 178.7 181.1 199.3 177.1 200.3 228.2 4
5 Credit market instruments 809.7 785.2 827.7 833.5 826.3 816.4 802.2 819.3 826.3 845.6 855.9 5
6 Open market paper 0.0 0.0 0.0 0.0 0.0 0.0 0.0 0.0 0.0 0.0 0.0 6 7 Treasury securities 57.5 60.9 60.5 76.6 67.0 79.5 66.9 69.3 67.0 66.3 65.5 7 8 Agency- and GSE-backed securities 31.3 26.5 30.6 32.1 25.4 27.7 26.1 26.2 25.4 22.5 21.0 8 9 Municipal securities 0.0 0.0 0.0 0.0 0.0 0.0 0.0 0.0 0.0 0.0 0.0 9 10 Corporate and foreign bonds 247.6 238.2 236.7 230.5 196.4 211.9 202.8 203.1 196.4 200.5 200.3 10
11 Depository institution loans n.e.c. 435.5 424.2 467.1 463.4 507.2 467.5 476.9 490.9 507.2 524.0 535.3 11 12 Other loans and advances 0.0 0.0 0.0 0.0 0.0 0.0 0.0 0.0 0.0 0.0 0.0 12 13 Mortgages 37.8 35.4 32.8 30.9 30.3 29.7 29.6 29.8 30.3 32.2 33.7 13
14 Corporate equities 0.0 0.1 0.0 0.0 0.0 0.0 0.0 0.0 0.0 0.0 0.0 14 15 Security credit 11.6 14.7 33.5 26.2 28.7 30.2 24.2 24.7 28.7 28.0 25.9 15
16 Miscellaneous assets 44.5 29.2 44.2 43.9 57.0 52.9 60.6 57.1 57.0 71.0 72.0 16
17 Total liabilities 1319.1 1351.5 1851.1 1853.0 2094.2 1955.5 2168.1 2123.8 2094.2 2242.4 2262.0 17
18 Net interbank liabilities -377.8 -347.1 157.5 155.6 313.1 219.7 438.5 351.6 313.1 353.5 348.5 18 19 To foreign banks -411.0 -384.0 134.8 83.6 225.3 124.2 357.3 282.2 225.3 263.4 267.6 19 20 To domestic banks 33.1 36.9 22.7 72.0 87.8 95.5 81.2 69.3 87.8 90.2 80.9 20
21 Checkable deposits 16.1 21.9 45.6 61.8 92.6 63.7 73.4 82.0 92.6 101.7 110.4 21 22 Small time and savings deposits 29.9 35.7 48.9 62.7 90.4 67.9 70.6 85.9 90.4 84.5 87.6 22 23 Large time deposits 1024.2 977.7 814.6 798.4 869.5 814.4 816.0 872.4 869.5 927.8 934.7 23
24 Federal funds and security repos 195.2 250.0 304.4 325.0 312.7 323.6 310.0 306.7 312.7 356.5 366.5 24 25 Open market paper (2) 0.0 0.0 0.0 0.0 0.0 0.0 0.0 0.0 0.0 0.0 0.0 25
26 Foreign direct investment in U.S. 107.7 120.0 176.6 181.8 181.4 182.7 183.1 184.4 181.4 182.3 183.1 26
27 Miscellaneous liabilities 323.8 293.3 303.4 267.8 234.6 283.7 276.5 240.7 234.6 236.0 231.3 27 28 Investment by funding corporations 203.1 171.6 137.8 126.0 123.5 142.9 142.1 118.7 123.5 123.9 120.8 28 29 Other 120.7 121.7 165.6 141.7 111.1 140.7 134.4 122.0 111.1 112.1 110.4 29
(1) Branches and agencies of foreign banks, Edge Act and Agreement corporations, New York investment companies (through 1996:Q2), and American Express Bank (through 2008:Q4).(2) Bankers’ acceptances.
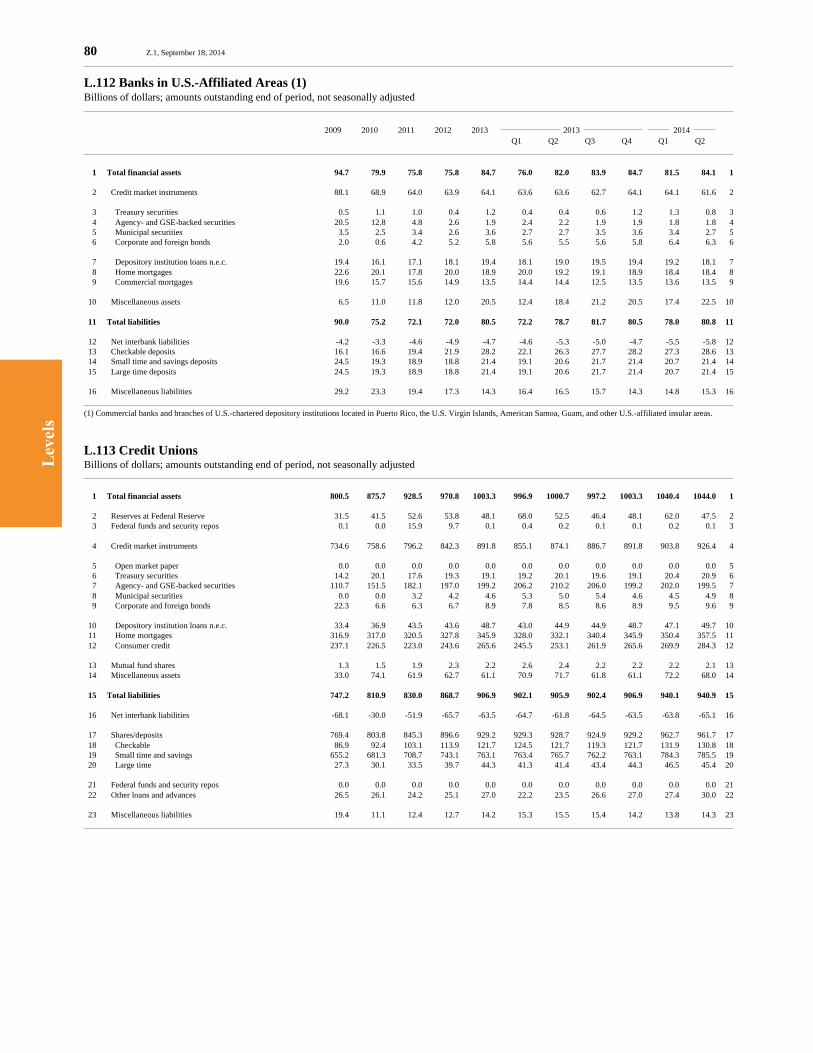
Lev
els
80 Z.1, September 18, 2014
L.112 Banks in U.S.-Affiliated Areas (1)Billions of dollars; amounts outstanding end of period, not seasonally adjusted
2009 2010 2011 2012 2013 2013 2014 Q1 Q2 Q3 Q4 Q1 Q2
1 Total financial assets 94.7 79.9 75.8 75.8 84.7 76.0 82.0 83.9 84.7 81.5 84.1 1
2 Credit market instruments 88.1 68.9 64.0 63.9 64.1 63.6 63.6 62.7 64.1 64.1 61.6 2
3 Treasury securities 0.5 1.1 1.0 0.4 1.2 0.4 0.4 0.6 1.2 1.3 0.8 3 4 Agency- and GSE-backed securities 20.5 12.8 4.8 2.6 1.9 2.4 2.2 1.9 1.9 1.8 1.8 4 5 Municipal securities 3.5 2.5 3.4 2.6 3.6 2.7 2.7 3.5 3.6 3.4 2.7 5 6 Corporate and foreign bonds 2.0 0.6 4.2 5.2 5.8 5.6 5.5 5.6 5.8 6.4 6.3 6
7 Depository institution loans n.e.c. 19.4 16.1 17.1 18.1 19.4 18.1 19.0 19.5 19.4 19.2 18.1 7 8 Home mortgages 22.6 20.1 17.8 20.0 18.9 20.0 19.2 19.1 18.9 18.4 18.4 8 9 Commercial mortgages 19.6 15.7 15.6 14.9 13.5 14.4 14.4 12.5 13.5 13.6 13.5 9
10 Miscellaneous assets 6.5 11.0 11.8 12.0 20.5 12.4 18.4 21.2 20.5 17.4 22.5 10
11 Total liabilities 90.0 75.2 72.1 72.0 80.5 72.2 78.7 81.7 80.5 78.0 80.8 11
12 Net interbank liabilities -4.2 -3.3 -4.6 -4.9 -4.7 -4.6 -5.3 -5.0 -4.7 -5.5 -5.8 12 13 Checkable deposits 16.1 16.6 19.4 21.9 28.2 22.1 26.3 27.7 28.2 27.3 28.6 13 14 Small time and savings deposits 24.5 19.3 18.9 18.8 21.4 19.1 20.6 21.7 21.4 20.7 21.4 14 15 Large time deposits 24.5 19.3 18.9 18.8 21.4 19.1 20.6 21.7 21.4 20.7 21.4 15
16 Miscellaneous liabilities 29.2 23.3 19.4 17.3 14.3 16.4 16.5 15.7 14.3 14.8 15.3 16
(1) Commercial banks and branches of U.S.-chartered depository institutions located in Puerto Rico, the U.S. Virgin Islands, American Samoa, Guam, and other U.S.-affiliated insular areas.
L.113 Credit UnionsBillions of dollars; amounts outstanding end of period, not seasonally adjusted
1 Total financial assets 800.5 875.7 928.5 970.8 1003.3 996.9 1000.7 997.2 1003.3 1040.4 1044.0 1
2 Reserves at Federal Reserve 31.5 41.5 52.6 53.8 48.1 68.0 52.5 46.4 48.1 62.0 47.5 2 3 Federal funds and security repos 0.1 0.0 15.9 9.7 0.1 0.4 0.2 0.1 0.1 0.2 0.1 3
4 Credit market instruments 734.6 758.6 796.2 842.3 891.8 855.1 874.1 886.7 891.8 903.8 926.4 4
5 Open market paper 0.0 0.0 0.0 0.0 0.0 0.0 0.0 0.0 0.0 0.0 0.0 5 6 Treasury securities 14.2 20.1 17.6 19.3 19.1 19.2 20.1 19.6 19.1 20.4 20.9 6 7 Agency- and GSE-backed securities 110.7 151.5 182.1 197.0 199.2 206.2 210.2 206.0 199.2 202.0 199.5 7 8 Municipal securities 0.0 0.0 3.2 4.2 4.6 5.3 5.0 5.4 4.6 4.5 4.9 8 9 Corporate and foreign bonds 22.3 6.6 6.3 6.7 8.9 7.8 8.5 8.6 8.9 9.5 9.6 9
10 Depository institution loans n.e.c. 33.4 36.9 43.5 43.6 48.7 43.0 44.9 44.9 48.7 47.1 49.7 10 11 Home mortgages 316.9 317.0 320.5 327.8 345.9 328.0 332.1 340.4 345.9 350.4 357.5 11 12 Consumer credit 237.1 226.5 223.0 243.6 265.6 245.5 253.1 261.9 265.6 269.9 284.3 12
13 Mutual fund shares 1.3 1.5 1.9 2.3 2.2 2.6 2.4 2.2 2.2 2.2 2.1 13 14 Miscellaneous assets 33.0 74.1 61.9 62.7 61.1 70.9 71.7 61.8 61.1 72.2 68.0 14
15 Total liabilities 747.2 810.9 830.0 868.7 906.9 902.1 905.9 902.4 906.9 940.1 940.9 15
16 Net interbank liabilities -68.1 -30.0 -51.9 -65.7 -63.5 -64.7 -61.8 -64.5 -63.5 -63.8 -65.1 16
17 Shares/deposits 769.4 803.8 845.3 896.6 929.2 929.3 928.7 924.9 929.2 962.7 961.7 17 18 Checkable 86.9 92.4 103.1 113.9 121.7 124.5 121.7 119.3 121.7 131.9 130.8 18 19 Small time and savings 655.2 681.3 708.7 743.1 763.1 763.4 765.7 762.2 763.1 784.3 785.5 19 20 Large time 27.3 30.1 33.5 39.7 44.3 41.3 41.4 43.4 44.3 46.5 45.4 20
21 Federal funds and security repos 0.0 0.0 0.0 0.0 0.0 0.0 0.0 0.0 0.0 0.0 0.0 21 22 Other loans and advances 26.5 26.1 24.2 25.1 27.0 22.2 23.5 26.6 27.0 27.4 30.0 22
23 Miscellaneous liabilities 19.4 11.1 12.4 12.7 14.2 15.3 15.5 15.4 14.2 13.8 14.3 23

Lev
els
Z.1, September 18, 2014 81
L.114 Property-Casualty Insurance CompaniesBillions of dollars; amounts outstanding end of period, not seasonally adjusted
2009 2010 2011 2012 2013 2013 2014 Q1 Q2 Q3 Q4 Q1 Q2
1 Total financial assets 1380.2 1360.5 1380.0 1442.3 1533.7 1464.3 1477.8 1499.4 1533.7 1541.4 1561.6 1
2 Checkable deposits and currency 27.6 32.6 24.1 36.4 29.7 31.7 30.6 30.6 29.7 33.4 34.8 2 3 Money market fund shares 29.6 25.6 20.0 22.3 20.0 21.3 18.1 18.1 20.0 18.2 20.0 3 4 Security repurchase agreements 4.5 3.8 1.7 1.8 1.8 1.7 1.5 1.5 1.8 1.6 1.7 4
5 Credit market instruments 886.7 890.6 926.8 927.8 953.1 933.4 936.7 943.5 953.1 950.5 954.1 5
6 Open market paper 9.8 7.9 8.8 7.4 8.0 7.4 6.6 6.9 8.0 7.3 8.0 6 7 Treasury securities 88.5 91.7 96.4 89.7 95.7 90.5 89.5 91.3 95.7 95.5 97.7 7 8 Agency- and GSE-backed securities 116.2 115.8 122.7 114.3 108.7 113.0 111.6 110.2 108.7 106.7 105.5 8
9 Municipal securities 369.4 348.4 331.0 328.1 325.8 327.8 327.4 326.8 325.8 325.8 325.8 9 10 Corporate and foreign bonds 298.3 322.6 363.1 382.7 406.9 388.9 395.1 401.2 406.9 407.0 408.4 10 11 Commercial mortgages 4.4 4.1 4.9 5.6 7.9 5.8 6.6 7.0 7.9 8.3 8.8 11
12 Corporate equities 215.6 214.8 220.8 252.2 309.7 267.4 272.4 280.5 309.7 312.1 317.9 12 13 Mutual fund shares 9.5 10.2 9.1 11.8 15.5 12.7 13.0 13.8 15.5 16.0 16.8 13
14 Trade receivables 83.0 83.8 87.2 92.0 95.2 94.0 96.6 98.3 95.2 100.1 103.9 14 15 U.S. direct investment abroad 123.7 99.1 90.2 98.0 108.8 102.1 108.9 113.0 108.8 109.6 112.4 15
16 Total liabilities 804.3 823.2 856.1 880.5 898.2 885.3 889.5 895.1 898.2 900.7 908.8 16
17 Security repurchase agreements 0.6 1.5 0.4 0.8 2.2 1.1 1.4 1.8 2.2 2.5 2.8 17 18 Taxes payable (net) -15.8 -10.1 -14.5 -10.8 8.4 -3.2 -5.2 -2.5 8.4 10.2 9.5 18
19 Foreign direct investment in U.S. 64.7 70.7 73.9 77.1 74.5 82.5 82.4 82.6 74.5 74.0 74.0 19
20 Miscellaneous liabilities 754.8 761.2 796.4 813.4 813.1 804.9 810.9 813.3 813.1 814.0 822.6 20 21 Investment by parent companies 0.0 0.0 0.0 11.2 5.2 5.1 5.1 5.3 5.2 4.7 5.1 21 22 Policy payables 754.8 761.2 796.4 802.1 807.8 799.8 805.8 808.0 807.8 809.3 817.4 22

Lev
els
82 Z.1, September 18, 2014
L.115 Life Insurance Companies (1)Billions of dollars; amounts outstanding end of period, not seasonally adjusted
2009 2010 2011 2012 2013 2013 2014 Q1 Q2 Q3 Q4 Q1 Q2
1 Total financial assets 4823.9 5167.8 5340.1 5614.7 5977.3 5738.6 5750.8 5857.1 5977.3 6049.4 6145.0 1
2 Checkable deposits and currency 50.7 51.7 53.7 56.4 47.2 56.3 45.5 53.5 47.2 50.1 48.0 2 3 Money market fund shares 33.7 21.0 28.8 27.5 21.6 20.6 19.1 21.6 21.6 20.2 18.8 3 4 Security repurchase agreements 10.2 10.9 10.1 8.5 8.5 6.8 6.6 8.0 8.5 6.9 6.5 4
5 Credit market instruments 3022.6 3174.2 3299.6 3373.9 3451.3 3384.5 3406.3 3424.4 3451.3 3481.0 3508.5 5
6 Open market paper 49.8 40.9 29.7 43.6 46.7 39.3 39.7 44.4 46.7 46.2 44.6 6 7 Treasury securities 133.5 156.6 175.4 180.9 168.6 176.1 173.1 170.9 168.6 170.1 171.2 7 8 Agency- and GSE-backed securities 371.9 376.0 374.4 360.9 354.1 359.5 358.1 355.4 354.1 351.6 348.8 8 9 Municipal securities 73.1 112.3 121.8 131.5 141.6 134.1 136.8 138.8 141.6 143.9 146.8 9 10 Corporate and foreign bonds 1927.2 2030.2 2117.3 2162.2 2223.0 2181.2 2198.3 2205.5 2223.0 2248.0 2269.7 10 11 Other loans and advances 140.9 140.7 148.6 150.4 153.9 149.6 151.3 152.2 153.9 155.9 157.5 11 12 Mortgages 326.1 317.5 332.5 344.4 363.2 344.6 349.1 357.2 363.2 365.2 369.9 12
13 Corporate equities 1208.5 1402.6 1390.2 1545.1 1794.4 1638.3 1647.5 1712.3 1794.4 1818.3 1868.0 13 14 Mutual fund shares 140.8 155.7 150.1 159.3 184.8 167.6 168.8 175.9 184.8 185.6 189.5 14
15 U.S. direct investment abroad 28.9 46.3 54.2 67.0 65.5 67.0 68.0 67.9 65.5 65.4 64.3 15
16 Miscellaneous assets 328.7 305.6 353.4 377.0 404.1 397.4 388.9 393.5 404.1 421.8 441.4 16 17 Equity in FHLB 2.9 2.9 2.1 2.2 3.2 2.1 2.1 2.3 3.2 3.2 3.4 17 18 Deferred and unpaid life ins. premiums 22.1 24.7 24.3 24.9 27.9 25.9 27.8 26.8 27.9 28.9 30.2 18 19 Other 303.7 278.0 327.0 349.9 373.1 369.4 359.0 364.4 373.1 389.7 407.8 19
20 Total liabilities 4532.3 4844.3 5002.2 5248.8 5602.8 5365.9 5381.2 5481.5 5602.8 5666.4 5753.5 20
21 Security repurchase agreements 12.4 10.3 10.4 13.5 12.7 13.7 13.8 13.4 12.7 12.9 12.8 21 22 Other loans and advances 48.3 45.1 46.8 51.6 59.4 52.9 54.5 53.8 59.4 61.3 63.3 22
23 Life insurance reserves 1194.5 1229.9 1302.3 1309.0 1366.3 1320.1 1328.1 1347.3 1366.3 1384.2 1393.3 23 24 Pension entitlements (2) 2148.2 2343.2 2384.6 2576.6 2816.9 2673.1 2683.5 2743.0 2816.9 2845.8 2894.3 24
25 Taxes payable (net) -31.4 -28.8 -23.6 -28.3 -30.5 -28.4 -30.1 -30.1 -30.5 -29.3 -29.5 25 26 Foreign direct investment in U.S. 69.4 84.3 103.6 106.0 97.7 107.6 110.2 111.9 97.7 99.1 102.4 26
27 Miscellaneous liabilities 1090.8 1160.4 1178.1 1220.3 1280.4 1226.9 1221.2 1242.2 1280.4 1292.3 1316.8 27 28 Investment by parent companies 40.5 62.7 72.0 17.2 10.7 17.4 17.3 17.7 10.7 11.0 11.5 28 29 Other reserves (3) 273.6 290.7 305.5 303.7 304.2 302.3 302.0 305.6 304.2 307.9 311.1 29 30 Unallocated insurance contracts 587.6 619.0 623.3 637.3 682.5 640.3 643.0 660.2 682.5 689.6 703.0 30 31 Other 189.1 187.9 177.2 262.1 283.1 266.9 258.9 258.7 283.1 283.8 291.2 31
(1) Additional detail on the financial assets and liabilities held in life insurer’s general and separate accounts is available on tables L.115.g and L.115.s.(2) Annuity reserves held by life insurance companies, excluding unallocated contracts held by pension funds, which are shown on line 30.(3) Includes reserves for accident and health policies, policy dividend accumulation, and contract claims.

Lev
els
Z.1, September 18, 2014 83
L.116 Private and Public Pension Funds (1)Billions of dollars; amounts outstanding end of period, not seasonally adjusted
2009 2010 2011 2012 2013 2013 2014 Q1 Q2 Q3 Q4 Q1 Q2
1 Total financial assets (2) 13165.8 14545.4 14912.9 15719.6 16891.5 16091.3 16235.2 16526.2 16891.5 17061.2 17332.5 1
2 Checkable deposits and currency 14.0 16.6 22.6 21.2 22.0 21.6 22.6 22.3 22.0 21.8 23.5 2 3 Time and savings deposits 62.3 67.0 71.1 66.5 74.2 68.0 68.4 69.3 74.2 70.8 72.3 3 4 Money market fund shares 187.9 179.9 195.5 174.8 185.9 180.1 180.2 179.8 185.9 180.0 184.0 4 5 Security repurchase agreements 5.9 6.0 6.1 5.7 6.3 5.8 5.8 5.8 6.3 6.0 6.1 5
6 Credit market instruments 1679.3 1833.2 1946.7 2116.7 2238.8 2130.5 2170.8 2088.6 2238.8 2253.8 2284.8 6
7 Open market paper 79.6 82.1 86.6 80.4 85.9 82.9 83.1 82.9 85.9 83.4 84.6 7 8 Treasury securities 457.5 509.5 571.5 647.1 708.9 661.0 670.7 583.3 708.9 720.9 730.6 8 9 Agency- and GSE-backed securities 351.5 359.4 376.8 421.3 448.4 428.0 438.7 443.4 448.4 448.6 453.7 9 10 Corporate and foreign bonds 753.2 841.4 876.5 932.7 966.2 924.8 945.6 947.7 966.2 970.0 983.1 10 11 Mortgages 36.0 38.4 33.7 34.3 28.3 32.9 31.5 30.1 28.3 29.9 31.8 11
12 Corporate equities 3436.8 3920.7 3736.6 4181.2 5082.2 4536.5 4586.8 4791.9 5082.2 5096.2 5240.4 12 13 Mutual fund shares 2226.0 2514.3 2410.9 2658.6 3294.9 2893.5 2947.4 3107.8 3294.9 3346.7 3462.8 13
14 Miscellaneous assets 5553.7 6007.7 6523.4 6494.9 5987.3 6255.4 6253.1 6260.6 5987.3 6085.8 6058.6 14 15 Unallocated insurance contracts (3) 587.6 619.0 623.3 637.3 682.5 640.3 643.0 660.2 682.5 689.6 703.0 15 16 Contributions receivable 75.4 90.8 93.8 81.4 80.9 81.8 81.8 81.6 80.9 80.7 81.1 16 17 Nonmarketable Treasury securities (4) 1077.2 1142.9 1213.7 1254.1 1352.3 1265.5 1178.4 1161.5 1352.3 1339.7 1342.6 17 18 Claims of pension fund on sponsor (5) 3212.0 3523.7 3916.2 3812.0 3127.6 3559.0 3630.4 3622.5 3127.6 3208.5 3141.0 18 19 Other 601.4 631.3 676.4 710.0 744.1 708.7 719.5 734.8 744.1 767.2 791.0 19
20 Pension entitlements (liabilities) (6) 13306.9 14688.5 15060.1 15881.2 17069.2 16257.5 16401.7 16697.8 17069.2 17239.7 17511.7 20
Memo:
Funded status of defined benefit plans: 21 Pension entitlements 9315.4 10175.7 10568.6 10886.7 11129.6 10944.9 11003.4 11064.5 11129.6 11211.5 11293.9 21 22 Funded by assets (7) 6103.4 6652.0 6652.4 7074.7 8002.0 7385.9 7373.0 7543.8 8002.0 8003.0 8152.9 22 23 Unfunded (line 18) 3212.0 3523.7 3916.2 3812.0 3127.6 3559.0 3630.4 3520.8 3127.6 3208.5 3141.0 23
24 Household retirement assets (8) 19404.0 21481.6 21858.5 23384.2 25713.4 24128.4 24336.8 24961.2 25713.4 26005.0 ND 24 25 Defined benefit plans 9174.4 10032.7 10421.4 10725.0 10951.9 10778.7 10837.0 10893.0 10951.9 11033.0 11114.6 25 26 Defined contribution plans 3991.5 4512.7 4491.5 4994.5 5939.6 5312.6 5398.3 5633.2 5939.6 6028.2 6217.8 26 27 Individual retirement plans (IRAs) (9) 4488.0 5029.0 5001.0 5561.0 6521.0 5852.0 5910.0 6193.0 6521.0 6619.0 ND 27 28 Annuities at life insurance companies (10) 1750.2 1907.2 1944.6 2103.6 2300.9 2185.1 2191.5 2242.0 2300.9 2324.8 ND 28
(1) Private pension funds, state and local government employee retirement funds, and federal government retirement funds defined benefit plans and defined contribution plans.(2) Includes claims on sponsor (i.e., unfunded pension entitlements).(3) Assets of pension plans held at life insurance companies; series begins 1985:Q4.(4) Nonmarketable government securities held by the civil service retirement and disability fund, Railroad Retirement Board, judicial retirement fund, military retirement fund, and foreign service retirement and disability fund.(5) Unfunded defined benefit pension entitlements. Negative values indicate overfunding.(6) Actuarial value of accrued pension entitlements in defined benefit plans and assets of defined contribution plans. These liabilities are assets of the household sector.(7) Total defined benefit financial assets plus nonfinancial assets less claims of pension fund on sponsor.(8) Households’ retirement assets in tax-deferred accounts, including employer sponsored pension plans, IRAs, Roth IRAs, and annuities.(9) IRA assets are not included above. See table L.226.i for a sectoral distribution of IRA accounts.(10) Annuities held in IRAs at life insurance companies are excluded. They are included in line 27.
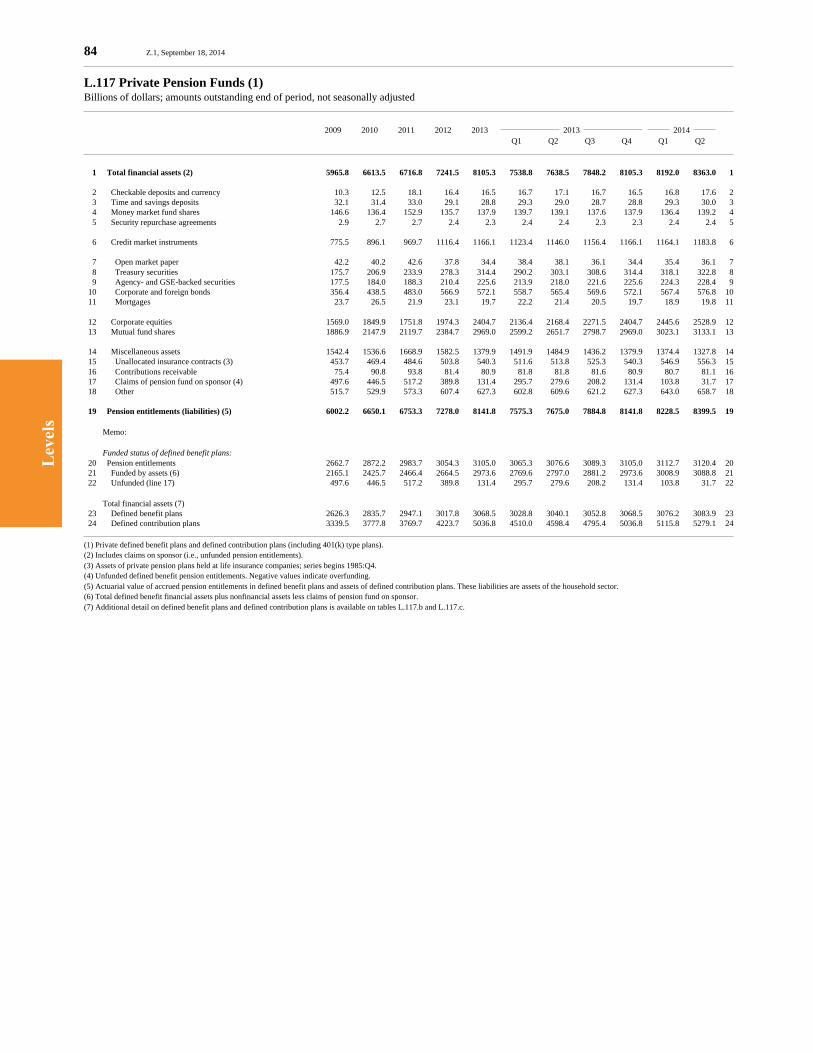
Lev
els
84 Z.1, September 18, 2014
L.117 Private Pension Funds (1)Billions of dollars; amounts outstanding end of period, not seasonally adjusted
2009 2010 2011 2012 2013 2013 2014 Q1 Q2 Q3 Q4 Q1 Q2
1 Total financial assets (2) 5965.8 6613.5 6716.8 7241.5 8105.3 7538.8 7638.5 7848.2 8105.3 8192.0 8363.0 1
2 Checkable deposits and currency 10.3 12.5 18.1 16.4 16.5 16.7 17.1 16.7 16.5 16.8 17.6 2 3 Time and savings deposits 32.1 31.4 33.0 29.1 28.8 29.3 29.0 28.7 28.8 29.3 30.0 3 4 Money market fund shares 146.6 136.4 152.9 135.7 137.9 139.7 139.1 137.6 137.9 136.4 139.2 4 5 Security repurchase agreements 2.9 2.7 2.7 2.4 2.3 2.4 2.4 2.3 2.3 2.4 2.4 5
6 Credit market instruments 775.5 896.1 969.7 1116.4 1166.1 1123.4 1146.0 1156.4 1166.1 1164.1 1183.8 6
7 Open market paper 42.2 40.2 42.6 37.8 34.4 38.4 38.1 36.1 34.4 35.4 36.1 7 8 Treasury securities 175.7 206.9 233.9 278.3 314.4 290.2 303.1 308.6 314.4 318.1 322.8 8 9 Agency- and GSE-backed securities 177.5 184.0 188.3 210.4 225.6 213.9 218.0 221.6 225.6 224.3 228.4 9 10 Corporate and foreign bonds 356.4 438.5 483.0 566.9 572.1 558.7 565.4 569.6 572.1 567.4 576.8 10 11 Mortgages 23.7 26.5 21.9 23.1 19.7 22.2 21.4 20.5 19.7 18.9 19.8 11
12 Corporate equities 1569.0 1849.9 1751.8 1974.3 2404.7 2136.4 2168.4 2271.5 2404.7 2445.6 2528.9 12 13 Mutual fund shares 1886.9 2147.9 2119.7 2384.7 2969.0 2599.2 2651.7 2798.7 2969.0 3023.1 3133.1 13
14 Miscellaneous assets 1542.4 1536.6 1668.9 1582.5 1379.9 1491.9 1484.9 1436.2 1379.9 1374.4 1327.8 14 15 Unallocated insurance contracts (3) 453.7 469.4 484.6 503.8 540.3 511.6 513.8 525.3 540.3 546.9 556.3 15 16 Contributions receivable 75.4 90.8 93.8 81.4 80.9 81.8 81.8 81.6 80.9 80.7 81.1 16 17 Claims of pension fund on sponsor (4) 497.6 446.5 517.2 389.8 131.4 295.7 279.6 208.2 131.4 103.8 31.7 17 18 Other 515.7 529.9 573.3 607.4 627.3 602.8 609.6 621.2 627.3 643.0 658.7 18
19 Pension entitlements (liabilities) (5) 6002.2 6650.1 6753.3 7278.0 8141.8 7575.3 7675.0 7884.8 8141.8 8228.5 8399.5 19
Memo:
Funded status of defined benefit plans: 20 Pension entitlements 2662.7 2872.2 2983.7 3054.3 3105.0 3065.3 3076.6 3089.3 3105.0 3112.7 3120.4 20 21 Funded by assets (6) 2165.1 2425.7 2466.4 2664.5 2973.6 2769.6 2797.0 2881.2 2973.6 3008.9 3088.8 21 22 Unfunded (line 17) 497.6 446.5 517.2 389.8 131.4 295.7 279.6 208.2 131.4 103.8 31.7 22
Total financial assets (7) 23 Defined benefit plans 2626.3 2835.7 2947.1 3017.8 3068.5 3028.8 3040.1 3052.8 3068.5 3076.2 3083.9 23 24 Defined contribution plans 3339.5 3777.8 3769.7 4223.7 5036.8 4510.0 4598.4 4795.4 5036.8 5115.8 5279.1 24
(1) Private defined benefit plans and defined contribution plans (including 401(k) type plans).(2) Includes claims on sponsor (i.e., unfunded pension entitlements).(3) Assets of private pension plans held at life insurance companies; series begins 1985:Q4.(4) Unfunded defined benefit pension entitlements. Negative values indicate overfunding.(5) Actuarial value of accrued pension entitlements in defined benefit plans and assets of defined contribution plans. These liabilities are assets of the household sector.(6) Total defined benefit financial assets plus nonfinancial assets less claims of pension fund on sponsor.(7) Additional detail on defined benefit plans and defined contribution plans is available on tables L.117.b and L.117.c.
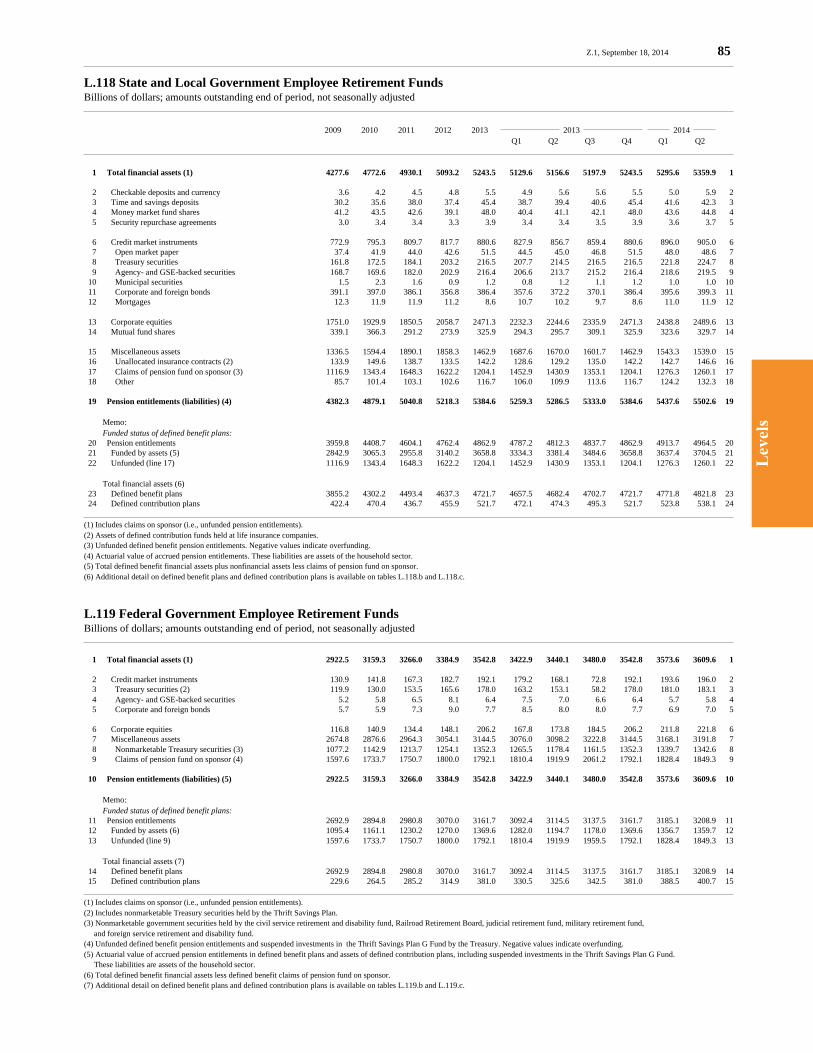
Lev
els
Z.1, September 18, 2014 85
L.118 State and Local Government Employee Retirement FundsBillions of dollars; amounts outstanding end of period, not seasonally adjusted
2009 2010 2011 2012 2013 2013 2014 Q1 Q2 Q3 Q4 Q1 Q2
1 Total financial assets (1) 4277.6 4772.6 4930.1 5093.2 5243.5 5129.6 5156.6 5197.9 5243.5 5295.6 5359.9 1
2 Checkable deposits and currency 3.6 4.2 4.5 4.8 5.5 4.9 5.6 5.6 5.5 5.0 5.9 2 3 Time and savings deposits 30.2 35.6 38.0 37.4 45.4 38.7 39.4 40.6 45.4 41.6 42.3 3 4 Money market fund shares 41.2 43.5 42.6 39.1 48.0 40.4 41.1 42.1 48.0 43.6 44.8 4 5 Security repurchase agreements 3.0 3.4 3.4 3.3 3.9 3.4 3.4 3.5 3.9 3.6 3.7 5
6 Credit market instruments 772.9 795.3 809.7 817.7 880.6 827.9 856.7 859.4 880.6 896.0 905.0 6 7 Open market paper 37.4 41.9 44.0 42.6 51.5 44.5 45.0 46.8 51.5 48.0 48.6 7 8 Treasury securities 161.8 172.5 184.1 203.2 216.5 207.7 214.5 216.5 216.5 221.8 224.7 8 9 Agency- and GSE-backed securities 168.7 169.6 182.0 202.9 216.4 206.6 213.7 215.2 216.4 218.6 219.5 9 10 Municipal securities 1.5 2.3 1.6 0.9 1.2 0.8 1.2 1.1 1.2 1.0 1.0 10 11 Corporate and foreign bonds 391.1 397.0 386.1 356.8 386.4 357.6 372.2 370.1 386.4 395.6 399.3 11 12 Mortgages 12.3 11.9 11.9 11.2 8.6 10.7 10.2 9.7 8.6 11.0 11.9 12
13 Corporate equities 1751.0 1929.9 1850.5 2058.7 2471.3 2232.3 2244.6 2335.9 2471.3 2438.8 2489.6 13 14 Mutual fund shares 339.1 366.3 291.2 273.9 325.9 294.3 295.7 309.1 325.9 323.6 329.7 14
15 Miscellaneous assets 1336.5 1594.4 1890.1 1858.3 1462.9 1687.6 1670.0 1601.7 1462.9 1543.3 1539.0 15 16 Unallocated insurance contracts (2) 133.9 149.6 138.7 133.5 142.2 128.6 129.2 135.0 142.2 142.7 146.6 16 17 Claims of pension fund on sponsor (3) 1116.9 1343.4 1648.3 1622.2 1204.1 1452.9 1430.9 1353.1 1204.1 1276.3 1260.1 17 18 Other 85.7 101.4 103.1 102.6 116.7 106.0 109.9 113.6 116.7 124.2 132.3 18
19 Pension entitlements (liabilities) (4) 4382.3 4879.1 5040.8 5218.3 5384.6 5259.3 5286.5 5333.0 5384.6 5437.6 5502.6 19
Memo: Funded status of defined benefit plans: 20 Pension entitlements 3959.8 4408.7 4604.1 4762.4 4862.9 4787.2 4812.3 4837.7 4862.9 4913.7 4964.5 20 21 Funded by assets (5) 2842.9 3065.3 2955.8 3140.2 3658.8 3334.3 3381.4 3484.6 3658.8 3637.4 3704.5 21 22 Unfunded (line 17) 1116.9 1343.4 1648.3 1622.2 1204.1 1452.9 1430.9 1353.1 1204.1 1276.3 1260.1 22
Total financial assets (6) 23 Defined benefit plans 3855.2 4302.2 4493.4 4637.3 4721.7 4657.5 4682.4 4702.7 4721.7 4771.8 4821.8 23 24 Defined contribution plans 422.4 470.4 436.7 455.9 521.7 472.1 474.3 495.3 521.7 523.8 538.1 24
(1) Includes claims on sponsor (i.e., unfunded pension entitlements).(2) Assets of defined contribution funds held at life insurance companies.(3) Unfunded defined benefit pension entitlements. Negative values indicate overfunding.(4) Actuarial value of accrued pension entitlements. These liabilities are assets of the household sector.(5) Total defined benefit financial assets plus nonfinancial assets less claims of pension fund on sponsor.(6) Additional detail on defined benefit plans and defined contribution plans is available on tables L.118.b and L.118.c.
L.119 Federal Government Employee Retirement FundsBillions of dollars; amounts outstanding end of period, not seasonally adjusted
1 Total financial assets (1) 2922.5 3159.3 3266.0 3384.9 3542.8 3422.9 3440.1 3480.0 3542.8 3573.6 3609.6 1
2 Credit market instruments 130.9 141.8 167.3 182.7 192.1 179.2 168.1 72.8 192.1 193.6 196.0 2 3 Treasury securities (2) 119.9 130.0 153.5 165.6 178.0 163.2 153.1 58.2 178.0 181.0 183.1 3 4 Agency- and GSE-backed securities 5.2 5.8 6.5 8.1 6.4 7.5 7.0 6.6 6.4 5.7 5.8 4 5 Corporate and foreign bonds 5.7 5.9 7.3 9.0 7.7 8.5 8.0 8.0 7.7 6.9 7.0 5
6 Corporate equities 116.8 140.9 134.4 148.1 206.2 167.8 173.8 184.5 206.2 211.8 221.8 6 7 Miscellaneous assets 2674.8 2876.6 2964.3 3054.1 3144.5 3076.0 3098.2 3222.8 3144.5 3168.1 3191.8 7 8 Nonmarketable Treasury securities (3) 1077.2 1142.9 1213.7 1254.1 1352.3 1265.5 1178.4 1161.5 1352.3 1339.7 1342.6 8 9 Claims of pension fund on sponsor (4) 1597.6 1733.7 1750.7 1800.0 1792.1 1810.4 1919.9 2061.2 1792.1 1828.4 1849.3 9
10 Pension entitlements (liabilities) (5) 2922.5 3159.3 3266.0 3384.9 3542.8 3422.9 3440.1 3480.0 3542.8 3573.6 3609.6 10
Memo: Funded status of defined benefit plans: 11 Pension entitlements 2692.9 2894.8 2980.8 3070.0 3161.7 3092.4 3114.5 3137.5 3161.7 3185.1 3208.9 11 12 Funded by assets (6) 1095.4 1161.1 1230.2 1270.0 1369.6 1282.0 1194.7 1178.0 1369.6 1356.7 1359.7 12 13 Unfunded (line 9) 1597.6 1733.7 1750.7 1800.0 1792.1 1810.4 1919.9 1959.5 1792.1 1828.4 1849.3 13
Total financial assets (7) 14 Defined benefit plans 2692.9 2894.8 2980.8 3070.0 3161.7 3092.4 3114.5 3137.5 3161.7 3185.1 3208.9 14 15 Defined contribution plans 229.6 264.5 285.2 314.9 381.0 330.5 325.6 342.5 381.0 388.5 400.7 15
(1) Includes claims on sponsor (i.e., unfunded pension entitlements).(2) Includes nonmarketable Treasury securities held by the Thrift Savings Plan.(3) Nonmarketable government securities held by the civil service retirement and disability fund, Railroad Retirement Board, judicial retirement fund, military retirement fund, and foreign service retirement and disability fund.(4) Unfunded defined benefit pension entitlements and suspended investments in the Thrift Savings Plan G Fund by the Treasury. Negative values indicate overfunding.(5) Actuarial value of accrued pension entitlements in defined benefit plans and assets of defined contribution plans, including suspended investments in the Thrift Savings Plan G Fund. These liabilities are assets of the household sector.(6) Total defined benefit financial assets less defined benefit claims of pension fund on sponsor.(7) Additional detail on defined benefit plans and defined contribution plans is available on tables L.119.b and L.119.c.
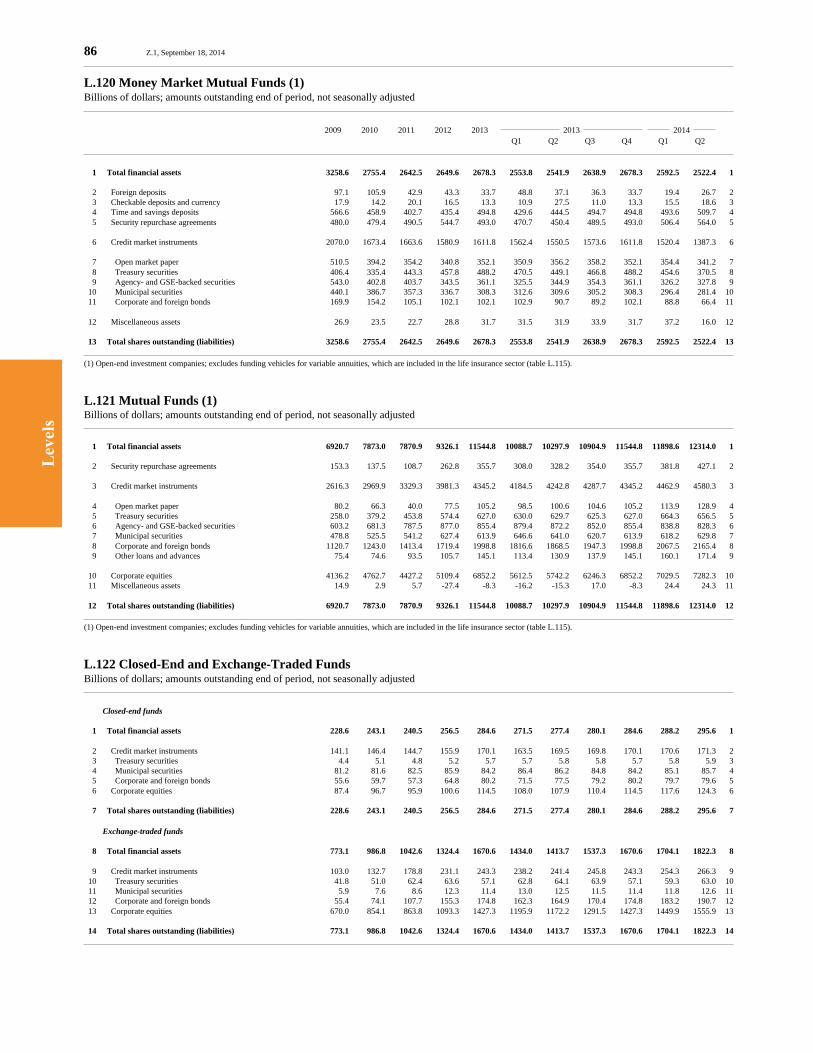
Lev
els
86 Z.1, September 18, 2014
L.120 Money Market Mutual Funds (1)Billions of dollars; amounts outstanding end of period, not seasonally adjusted
2009 2010 2011 2012 2013 2013 2014 Q1 Q2 Q3 Q4 Q1 Q2
1 Total financial assets 3258.6 2755.4 2642.5 2649.6 2678.3 2553.8 2541.9 2638.9 2678.3 2592.5 2522.4 1
2 Foreign deposits 97.1 105.9 42.9 43.3 33.7 48.8 37.1 36.3 33.7 19.4 26.7 2 3 Checkable deposits and currency 17.9 14.2 20.1 16.5 13.3 10.9 27.5 11.0 13.3 15.5 18.6 3 4 Time and savings deposits 566.6 458.9 402.7 435.4 494.8 429.6 444.5 494.7 494.8 493.6 509.7 4 5 Security repurchase agreements 480.0 479.4 490.5 544.7 493.0 470.7 450.4 489.5 493.0 506.4 564.0 5
6 Credit market instruments 2070.0 1673.4 1663.6 1580.9 1611.8 1562.4 1550.5 1573.6 1611.8 1520.4 1387.3 6
7 Open market paper 510.5 394.2 354.2 340.8 352.1 350.9 356.2 358.2 352.1 354.4 341.2 7 8 Treasury securities 406.4 335.4 443.3 457.8 488.2 470.5 449.1 466.8 488.2 454.6 370.5 8 9 Agency- and GSE-backed securities 543.0 402.8 403.7 343.5 361.1 325.5 344.9 354.3 361.1 326.2 327.8 9 10 Municipal securities 440.1 386.7 357.3 336.7 308.3 312.6 309.6 305.2 308.3 296.4 281.4 10 11 Corporate and foreign bonds 169.9 154.2 105.1 102.1 102.1 102.9 90.7 89.2 102.1 88.8 66.4 11
12 Miscellaneous assets 26.9 23.5 22.7 28.8 31.7 31.5 31.9 33.9 31.7 37.2 16.0 12
13 Total shares outstanding (liabilities) 3258.6 2755.4 2642.5 2649.6 2678.3 2553.8 2541.9 2638.9 2678.3 2592.5 2522.4 13
(1) Open-end investment companies; excludes funding vehicles for variable annuities, which are included in the life insurance sector (table L.115).
L.121 Mutual Funds (1)Billions of dollars; amounts outstanding end of period, not seasonally adjusted
1 Total financial assets 6920.7 7873.0 7870.9 9326.1 11544.8 10088.7 10297.9 10904.9 11544.8 11898.6 12314.0 1
2 Security repurchase agreements 153.3 137.5 108.7 262.8 355.7 308.0 328.2 354.0 355.7 381.8 427.1 2
3 Credit market instruments 2616.3 2969.9 3329.3 3981.3 4345.2 4184.5 4242.8 4287.7 4345.2 4462.9 4580.3 3
4 Open market paper 80.2 66.3 40.0 77.5 105.2 98.5 100.6 104.6 105.2 113.9 128.9 4 5 Treasury securities 258.0 379.2 453.8 574.4 627.0 630.0 629.7 625.3 627.0 664.3 656.5 5 6 Agency- and GSE-backed securities 603.2 681.3 787.5 877.0 855.4 879.4 872.2 852.0 855.4 838.8 828.3 6 7 Municipal securities 478.8 525.5 541.2 627.4 613.9 646.6 641.0 620.7 613.9 618.2 629.8 7 8 Corporate and foreign bonds 1120.7 1243.0 1413.4 1719.4 1998.8 1816.6 1868.5 1947.3 1998.8 2067.5 2165.4 8 9 Other loans and advances 75.4 74.6 93.5 105.7 145.1 113.4 130.9 137.9 145.1 160.1 171.4 9
10 Corporate equities 4136.2 4762.7 4427.2 5109.4 6852.2 5612.5 5742.2 6246.3 6852.2 7029.5 7282.3 10 11 Miscellaneous assets 14.9 2.9 5.7 -27.4 -8.3 -16.2 -15.3 17.0 -8.3 24.4 24.3 11
12 Total shares outstanding (liabilities) 6920.7 7873.0 7870.9 9326.1 11544.8 10088.7 10297.9 10904.9 11544.8 11898.6 12314.0 12
(1) Open-end investment companies; excludes funding vehicles for variable annuities, which are included in the life insurance sector (table L.115).
L.122 Closed-End and Exchange-Traded FundsBillions of dollars; amounts outstanding end of period, not seasonally adjusted
Closed-end funds
1 Total financial assets 228.6 243.1 240.5 256.5 284.6 271.5 277.4 280.1 284.6 288.2 295.6 1
2 Credit market instruments 141.1 146.4 144.7 155.9 170.1 163.5 169.5 169.8 170.1 170.6 171.3 2 3 Treasury securities 4.4 5.1 4.8 5.2 5.7 5.7 5.8 5.8 5.7 5.8 5.9 3 4 Municipal securities 81.2 81.6 82.5 85.9 84.2 86.4 86.2 84.8 84.2 85.1 85.7 4 5 Corporate and foreign bonds 55.6 59.7 57.3 64.8 80.2 71.5 77.5 79.2 80.2 79.7 79.6 5 6 Corporate equities 87.4 96.7 95.9 100.6 114.5 108.0 107.9 110.4 114.5 117.6 124.3 6
7 Total shares outstanding (liabilities) 228.6 243.1 240.5 256.5 284.6 271.5 277.4 280.1 284.6 288.2 295.6 7
Exchange-traded funds
8 Total financial assets 773.1 986.8 1042.6 1324.4 1670.6 1434.0 1413.7 1537.3 1670.6 1704.1 1822.3 8
9 Credit market instruments 103.0 132.7 178.8 231.1 243.3 238.2 241.4 245.8 243.3 254.3 266.3 9 10 Treasury securities 41.8 51.0 62.4 63.6 57.1 62.8 64.1 63.9 57.1 59.3 63.0 10 11 Municipal securities 5.9 7.6 8.6 12.3 11.4 13.0 12.5 11.5 11.4 11.8 12.6 11 12 Corporate and foreign bonds 55.4 74.1 107.7 155.3 174.8 162.3 164.9 170.4 174.8 183.2 190.7 12 13 Corporate equities 670.0 854.1 863.8 1093.3 1427.3 1195.9 1172.2 1291.5 1427.3 1449.9 1555.9 13
14 Total shares outstanding (liabilities) 773.1 986.8 1042.6 1324.4 1670.6 1434.0 1413.7 1537.3 1670.6 1704.1 1822.3 14
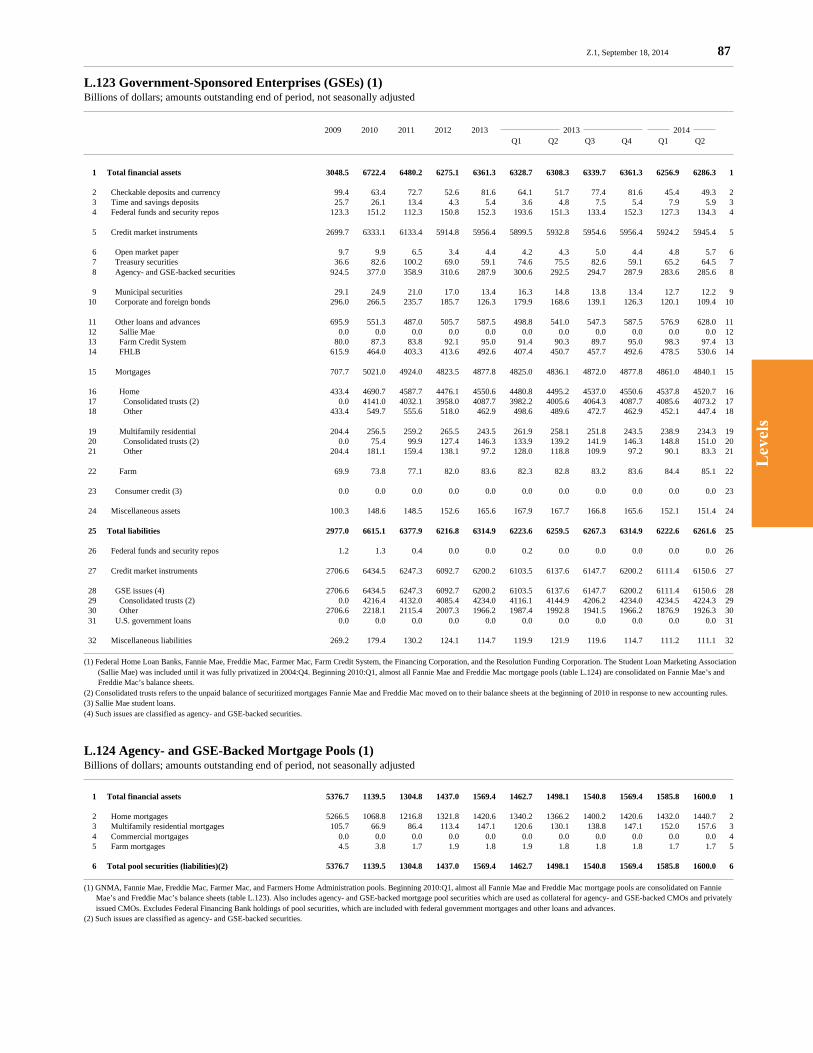
Lev
els
Z.1, September 18, 2014 87
L.123 Government-Sponsored Enterprises (GSEs) (1)Billions of dollars; amounts outstanding end of period, not seasonally adjusted
2009 2010 2011 2012 2013 2013 2014 Q1 Q2 Q3 Q4 Q1 Q2
1 Total financial assets 3048.5 6722.4 6480.2 6275.1 6361.3 6328.7 6308.3 6339.7 6361.3 6256.9 6286.3 1
2 Checkable deposits and currency 99.4 63.4 72.7 52.6 81.6 64.1 51.7 77.4 81.6 45.4 49.3 2 3 Time and savings deposits 25.7 26.1 13.4 4.3 5.4 3.6 4.8 7.5 5.4 7.9 5.9 3 4 Federal funds and security repos 123.3 151.2 112.3 150.8 152.3 193.6 151.3 133.4 152.3 127.3 134.3 4
5 Credit market instruments 2699.7 6333.1 6133.4 5914.8 5956.4 5899.5 5932.8 5954.6 5956.4 5924.2 5945.4 5
6 Open market paper 9.7 9.9 6.5 3.4 4.4 4.2 4.3 5.0 4.4 4.8 5.7 6 7 Treasury securities 36.6 82.6 100.2 69.0 59.1 74.6 75.5 82.6 59.1 65.2 64.5 7 8 Agency- and GSE-backed securities 924.5 377.0 358.9 310.6 287.9 300.6 292.5 294.7 287.9 283.6 285.6 8
9 Municipal securities 29.1 24.9 21.0 17.0 13.4 16.3 14.8 13.8 13.4 12.7 12.2 9 10 Corporate and foreign bonds 296.0 266.5 235.7 185.7 126.3 179.9 168.6 139.1 126.3 120.1 109.4 10
11 Other loans and advances 695.9 551.3 487.0 505.7 587.5 498.8 541.0 547.3 587.5 576.9 628.0 11 12 Sallie Mae 0.0 0.0 0.0 0.0 0.0 0.0 0.0 0.0 0.0 0.0 0.0 12 13 Farm Credit System 80.0 87.3 83.8 92.1 95.0 91.4 90.3 89.7 95.0 98.3 97.4 13 14 FHLB 615.9 464.0 403.3 413.6 492.6 407.4 450.7 457.7 492.6 478.5 530.6 14
15 Mortgages 707.7 5021.0 4924.0 4823.5 4877.8 4825.0 4836.1 4872.0 4877.8 4861.0 4840.1 15
16 Home 433.4 4690.7 4587.7 4476.1 4550.6 4480.8 4495.2 4537.0 4550.6 4537.8 4520.7 16 17 Consolidated trusts (2) 0.0 4141.0 4032.1 3958.0 4087.7 3982.2 4005.6 4064.3 4087.7 4085.6 4073.2 17 18 Other 433.4 549.7 555.6 518.0 462.9 498.6 489.6 472.7 462.9 452.1 447.4 18
19 Multifamily residential 204.4 256.5 259.2 265.5 243.5 261.9 258.1 251.8 243.5 238.9 234.3 19 20 Consolidated trusts (2) 0.0 75.4 99.9 127.4 146.3 133.9 139.2 141.9 146.3 148.8 151.0 20 21 Other 204.4 181.1 159.4 138.1 97.2 128.0 118.8 109.9 97.2 90.1 83.3 21
22 Farm 69.9 73.8 77.1 82.0 83.6 82.3 82.8 83.2 83.6 84.4 85.1 22
23 Consumer credit (3) 0.0 0.0 0.0 0.0 0.0 0.0 0.0 0.0 0.0 0.0 0.0 23
24 Miscellaneous assets 100.3 148.6 148.5 152.6 165.6 167.9 167.7 166.8 165.6 152.1 151.4 24
25 Total liabilities 2977.0 6615.1 6377.9 6216.8 6314.9 6223.6 6259.5 6267.3 6314.9 6222.6 6261.6 25
26 Federal funds and security repos 1.2 1.3 0.4 0.0 0.0 0.2 0.0 0.0 0.0 0.0 0.0 26
27 Credit market instruments 2706.6 6434.5 6247.3 6092.7 6200.2 6103.5 6137.6 6147.7 6200.2 6111.4 6150.6 27
28 GSE issues (4) 2706.6 6434.5 6247.3 6092.7 6200.2 6103.5 6137.6 6147.7 6200.2 6111.4 6150.6 28 29 Consolidated trusts (2) 0.0 4216.4 4132.0 4085.4 4234.0 4116.1 4144.9 4206.2 4234.0 4234.5 4224.3 29 30 Other 2706.6 2218.1 2115.4 2007.3 1966.2 1987.4 1992.8 1941.5 1966.2 1876.9 1926.3 30 31 U.S. government loans 0.0 0.0 0.0 0.0 0.0 0.0 0.0 0.0 0.0 0.0 0.0 31
32 Miscellaneous liabilities 269.2 179.4 130.2 124.1 114.7 119.9 121.9 119.6 114.7 111.2 111.1 32
(1) Federal Home Loan Banks, Fannie Mae, Freddie Mac, Farmer Mac, Farm Credit System, the Financing Corporation, and the Resolution Funding Corporation. The Student Loan Marketing Association (Sallie Mae) was included until it was fully privatized in 2004:Q4. Beginning 2010:Q1, almost all Fannie Mae and Freddie Mac mortgage pools (table L.124) are consolidated on Fannie Mae’s and Freddie Mac’s balance sheets.(2) Consolidated trusts refers to the unpaid balance of securitized mortgages Fannie Mae and Freddie Mac moved on to their balance sheets at the beginning of 2010 in response to new accounting rules.(3) Sallie Mae student loans.(4) Such issues are classified as agency- and GSE-backed securities.
L.124 Agency- and GSE-Backed Mortgage Pools (1)Billions of dollars; amounts outstanding end of period, not seasonally adjusted
1 Total financial assets 5376.7 1139.5 1304.8 1437.0 1569.4 1462.7 1498.1 1540.8 1569.4 1585.8 1600.0 1
2 Home mortgages 5266.5 1068.8 1216.8 1321.8 1420.6 1340.2 1366.2 1400.2 1420.6 1432.0 1440.7 2 3 Multifamily residential mortgages 105.7 66.9 86.4 113.4 147.1 120.6 130.1 138.8 147.1 152.0 157.6 3 4 Commercial mortgages 0.0 0.0 0.0 0.0 0.0 0.0 0.0 0.0 0.0 0.0 0.0 4 5 Farm mortgages 4.5 3.8 1.7 1.9 1.8 1.9 1.8 1.8 1.8 1.7 1.7 5
6 Total pool securities (liabilities)(2) 5376.7 1139.5 1304.8 1437.0 1569.4 1462.7 1498.1 1540.8 1569.4 1585.8 1600.0 6
(1) GNMA, Fannie Mae, Freddie Mac, Farmer Mac, and Farmers Home Administration pools. Beginning 2010:Q1, almost all Fannie Mae and Freddie Mac mortgage pools are consolidated on Fannie Mae’s and Freddie Mac’s balance sheets (table L.123). Also includes agency- and GSE-backed mortgage pool securities which are used as collateral for agency- and GSE-backed CMOs and privately issued CMOs. Excludes Federal Financing Bank holdings of pool securities, which are included with federal government mortgages and other loans and advances.(2) Such issues are classified as agency- and GSE-backed securities.
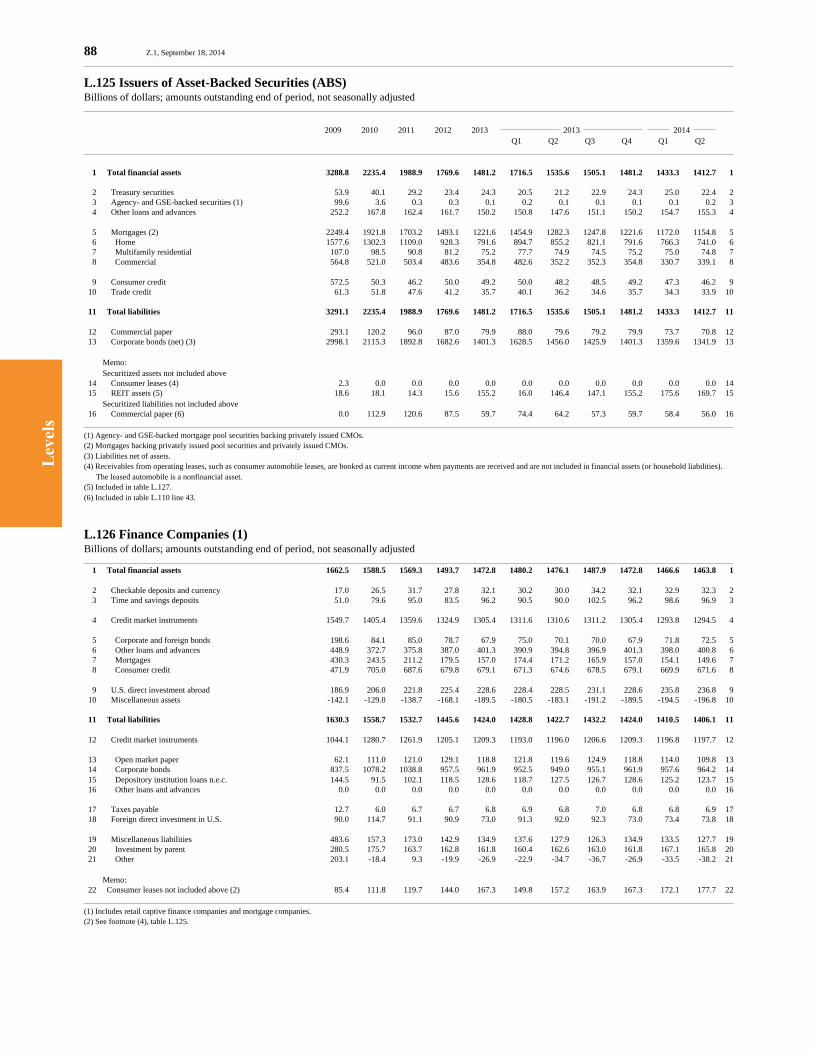
Lev
els
88 Z.1, September 18, 2014
L.125 Issuers of Asset-Backed Securities (ABS)Billions of dollars; amounts outstanding end of period, not seasonally adjusted
2009 2010 2011 2012 2013 2013 2014 Q1 Q2 Q3 Q4 Q1 Q2
1 Total financial assets 3288.8 2235.4 1988.9 1769.6 1481.2 1716.5 1535.6 1505.1 1481.2 1433.3 1412.7 1
2 Treasury securities 53.9 40.1 29.2 23.4 24.3 20.5 21.2 22.9 24.3 25.0 22.4 2 3 Agency- and GSE-backed securities (1) 99.6 3.6 0.3 0.3 0.1 0.2 0.1 0.1 0.1 0.1 0.2 3 4 Other loans and advances 252.2 167.8 162.4 161.7 150.2 150.8 147.6 151.1 150.2 154.7 155.3 4
5 Mortgages (2) 2249.4 1921.8 1703.2 1493.1 1221.6 1454.9 1282.3 1247.8 1221.6 1172.0 1154.8 5 6 Home 1577.6 1302.3 1109.0 928.3 791.6 894.7 855.2 821.1 791.6 766.3 741.0 6 7 Multifamily residential 107.0 98.5 90.8 81.2 75.2 77.7 74.9 74.5 75.2 75.0 74.8 7 8 Commercial 564.8 521.0 503.4 483.6 354.8 482.6 352.2 352.3 354.8 330.7 339.1 8
9 Consumer credit 572.5 50.3 46.2 50.0 49.2 50.0 48.2 48.5 49.2 47.3 46.2 9 10 Trade credit 61.3 51.8 47.6 41.2 35.7 40.1 36.2 34.6 35.7 34.3 33.9 10
11 Total liabilities 3291.1 2235.4 1988.9 1769.6 1481.2 1716.5 1535.6 1505.1 1481.2 1433.3 1412.7 11
12 Commercial paper 293.1 120.2 96.0 87.0 79.9 88.0 79.6 79.2 79.9 73.7 70.8 12 13 Corporate bonds (net) (3) 2998.1 2115.3 1892.8 1682.6 1401.3 1628.5 1456.0 1425.9 1401.3 1359.6 1341.9 13
Memo: Securitized assets not included above 14 Consumer leases (4) 2.3 0.0 0.0 0.0 0.0 0.0 0.0 0.0 0.0 0.0 0.0 14 15 REIT assets (5) 18.6 18.1 14.3 15.6 155.2 16.0 146.4 147.1 155.2 175.6 169.7 15 Securitized liabilities not included above 16 Commercial paper (6) 0.0 112.9 120.6 87.5 59.7 74.4 64.2 57.3 59.7 58.4 56.0 16
(1) Agency- and GSE-backed mortgage pool securities backing privately issued CMOs.(2) Mortgages backing privately issued pool securities and privately issued CMOs.(3) Liabilities net of assets.(4) Receivables from operating leases, such as consumer automobile leases, are booked as current income when payments are received and are not included in financial assets (or household liabilities). The leased automobile is a nonfinancial asset.(5) Included in table L.127.(6) Included in table L.110 line 43.
L.126 Finance Companies (1)Billions of dollars; amounts outstanding end of period, not seasonally adjusted
1 Total financial assets 1662.5 1588.5 1569.3 1493.7 1472.8 1480.2 1476.1 1487.9 1472.8 1466.6 1463.8 1
2 Checkable deposits and currency 17.0 26.5 31.7 27.8 32.1 30.2 30.0 34.2 32.1 32.9 32.3 2 3 Time and savings deposits 51.0 79.6 95.0 83.5 96.2 90.5 90.0 102.5 96.2 98.6 96.9 3
4 Credit market instruments 1549.7 1405.4 1359.6 1324.9 1305.4 1311.6 1310.6 1311.2 1305.4 1293.8 1294.5 4
5 Corporate and foreign bonds 198.6 84.1 85.0 78.7 67.9 75.0 70.1 70.0 67.9 71.8 72.5 5 6 Other loans and advances 448.9 372.7 375.8 387.0 401.3 390.9 394.8 396.9 401.3 398.0 400.8 6 7 Mortgages 430.3 243.5 211.2 179.5 157.0 174.4 171.2 165.9 157.0 154.1 149.6 7 8 Consumer credit 471.9 705.0 687.6 679.8 679.1 671.3 674.6 678.5 679.1 669.9 671.6 8
9 U.S. direct investment abroad 186.9 206.0 221.8 225.4 228.6 228.4 228.5 231.1 228.6 235.8 236.8 9 10 Miscellaneous assets -142.1 -129.0 -138.7 -168.1 -189.5 -180.5 -183.1 -191.2 -189.5 -194.5 -196.8 10
11 Total liabilities 1630.3 1558.7 1532.7 1445.6 1424.0 1428.8 1422.7 1432.2 1424.0 1410.5 1406.1 11
12 Credit market instruments 1044.1 1280.7 1261.9 1205.1 1209.3 1193.0 1196.0 1206.6 1209.3 1196.8 1197.7 12
13 Open market paper 62.1 111.0 121.0 129.1 118.8 121.8 119.6 124.9 118.8 114.0 109.8 13 14 Corporate bonds 837.5 1078.2 1038.8 957.5 961.9 952.5 949.0 955.1 961.9 957.6 964.2 14 15 Depository institution loans n.e.c. 144.5 91.5 102.1 118.5 128.6 118.7 127.5 126.7 128.6 125.2 123.7 15 16 Other loans and advances 0.0 0.0 0.0 0.0 0.0 0.0 0.0 0.0 0.0 0.0 0.0 16
17 Taxes payable 12.7 6.0 6.7 6.7 6.8 6.9 6.8 7.0 6.8 6.8 6.9 17 18 Foreign direct investment in U.S. 90.0 114.7 91.1 90.9 73.0 91.3 92.0 92.3 73.0 73.4 73.8 18
19 Miscellaneous liabilities 483.6 157.3 173.0 142.9 134.9 137.6 127.9 126.3 134.9 133.5 127.7 19 20 Investment by parent 280.5 175.7 163.7 162.8 161.8 160.4 162.6 163.0 161.8 167.1 165.8 20 21 Other 203.1 -18.4 9.3 -19.9 -26.9 -22.9 -34.7 -36.7 -26.9 -33.5 -38.2 21
Memo: 22 Consumer leases not included above (2) 85.4 111.8 119.7 144.0 167.3 149.8 157.2 163.9 167.3 172.1 177.7 22
(1) Includes retail captive finance companies and mortgage companies.(2) See footnote (4), table L.125.

Lev
els
Z.1, September 18, 2014 89
L.127 Real Estate Investment Trusts (REITs) (1)Billions of dollars; amounts outstanding end of period, not seasonally adjusted
2009 2010 2011 2012 2013 2013 2014 Q1 Q2 Q3 Q4 Q1 Q2
1 Total financial assets 262.8 302.4 433.4 594.2 644.2 595.5 719.0 687.9 644.2 669.0 693.7 1
2 Checkable deposits and currency 30.9 25.1 27.6 35.3 34.0 40.9 37.5 39.9 34.0 32.9 37.5 2
3 Credit market instruments 167.2 211.1 331.2 458.5 497.6 448.7 565.9 546.0 497.6 513.7 522.5 3
4 Agency- and GSE-backed securities 105.2 143.4 248.1 357.6 261.9 345.9 327.5 306.9 261.9 253.1 264.1 4 5 Corporate and foreign bonds 16.0 23.2 27.0 36.5 36.3 39.8 39.7 40.0 36.3 37.8 37.2 5
6 Mortgages 46.0 44.6 56.1 64.5 199.3 63.1 198.7 199.1 199.3 222.8 221.3 6 7 Home 8.9 9.0 19.8 26.5 23.1 26.6 31.2 31.1 23.1 25.3 27.0 7 8 Multifamily residential 2.3 2.0 1.7 1.9 2.4 2.1 2.8 2.7 2.4 2.2 2.2 8 9 Commercial 34.8 33.7 34.6 36.1 173.9 34.3 164.7 165.3 173.9 195.3 192.0 9
10 Miscellaneous assets 64.8 66.1 74.7 100.4 112.6 105.9 115.7 102.0 112.6 122.4 133.6 10
11 Total liabilities 489.9 523.9 654.4 817.8 907.9 814.4 942.7 917.4 907.9 936.2 962.2 11
12 Security repurchase agreements 90.5 120.4 218.1 320.6 254.0 322.0 309.8 288.8 254.0 240.6 249.9 12
13 Credit market instruments 339.8 339.9 365.5 401.0 579.4 403.0 540.6 550.2 579.4 614.4 626.8 13
14 Open market paper 0.0 0.0 0.0 0.0 0.0 0.0 0.0 0.0 0.0 0.0 0.0 14 15 Corporate bonds 144.4 145.4 152.9 179.6 353.2 182.4 316.7 325.4 353.2 382.1 395.9 15
16 Depository institution loans n.e.c. 20.2 18.4 23.0 27.0 24.0 21.1 23.2 27.6 24.0 27.0 24.0 16 17 Mortgages 175.3 176.1 189.5 194.4 202.2 199.5 200.7 197.1 202.2 205.3 206.9 17
18 Miscellaneous liabilities 59.6 63.7 70.8 96.3 74.6 89.4 92.3 78.5 74.6 81.1 85.5 18
Memo: 19 Securitized assets included above 18.6 18.1 14.3 15.6 155.2 16.0 146.4 147.1 155.2 175.6 169.7 19 20 Agency- and GSE-backed securities 0.0 0.0 0.0 0.0 0.0 0.0 0.0 0.0 0.0 0.0 0.0 20 21 Home mortgages 6.1 7.2 6.5 10.2 14.2 10.6 12.6 12.8 14.2 14.5 14.2 21 22 Multifamily residential mortgages 0.4 0.4 0.3 0.3 0.3 0.3 0.3 0.3 0.3 0.3 0.3 22 23 Commercial mortgages 12.2 10.6 7.5 5.2 140.7 5.0 133.5 134.0 140.7 160.8 155.2 23
(1) Additional detail on financial assets and liabilities for equity and mortgage REITs is available on tables L.127.e and L.127.m.
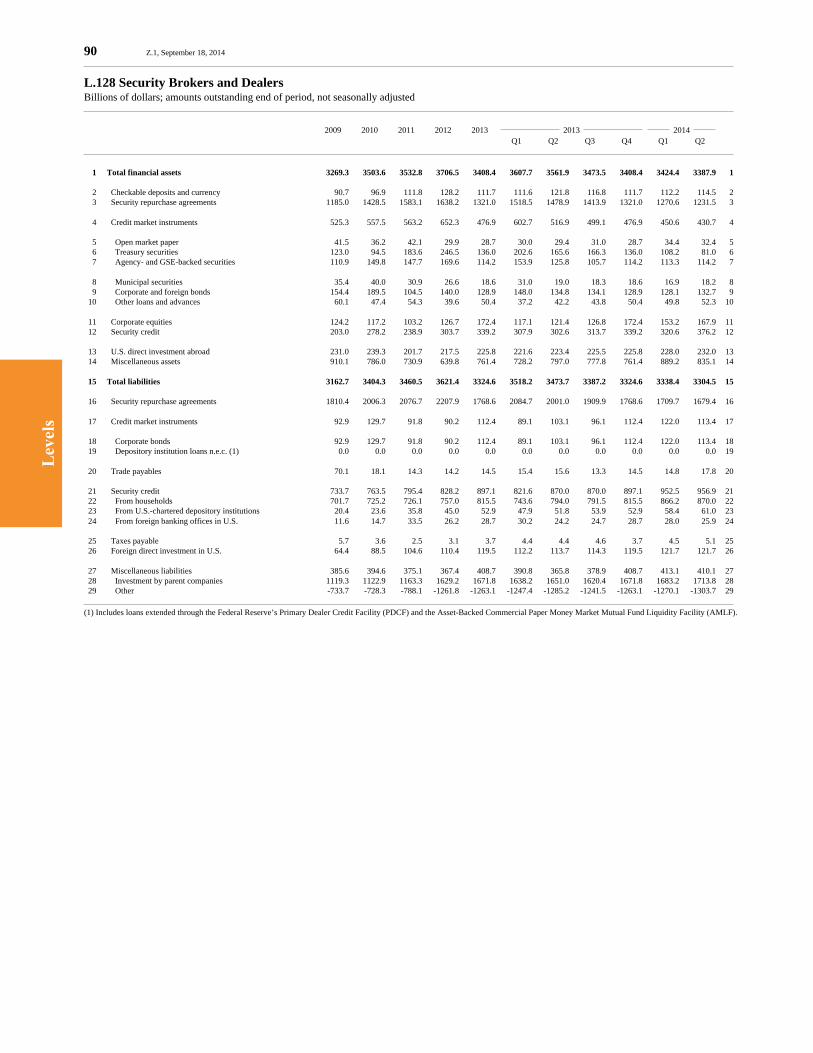
Lev
els
90 Z.1, September 18, 2014
L.128 Security Brokers and DealersBillions of dollars; amounts outstanding end of period, not seasonally adjusted
2009 2010 2011 2012 2013 2013 2014 Q1 Q2 Q3 Q4 Q1 Q2
1 Total financial assets 3269.3 3503.6 3532.8 3706.5 3408.4 3607.7 3561.9 3473.5 3408.4 3424.4 3387.9 1
2 Checkable deposits and currency 90.7 96.9 111.8 128.2 111.7 111.6 121.8 116.8 111.7 112.2 114.5 2 3 Security repurchase agreements 1185.0 1428.5 1583.1 1638.2 1321.0 1518.5 1478.9 1413.9 1321.0 1270.6 1231.5 3
4 Credit market instruments 525.3 557.5 563.2 652.3 476.9 602.7 516.9 499.1 476.9 450.6 430.7 4
5 Open market paper 41.5 36.2 42.1 29.9 28.7 30.0 29.4 31.0 28.7 34.4 32.4 5 6 Treasury securities 123.0 94.5 183.6 246.5 136.0 202.6 165.6 166.3 136.0 108.2 81.0 6 7 Agency- and GSE-backed securities 110.9 149.8 147.7 169.6 114.2 153.9 125.8 105.7 114.2 113.3 114.2 7
8 Municipal securities 35.4 40.0 30.9 26.6 18.6 31.0 19.0 18.3 18.6 16.9 18.2 8 9 Corporate and foreign bonds 154.4 189.5 104.5 140.0 128.9 148.0 134.8 134.1 128.9 128.1 132.7 9 10 Other loans and advances 60.1 47.4 54.3 39.6 50.4 37.2 42.2 43.8 50.4 49.8 52.3 10
11 Corporate equities 124.2 117.2 103.2 126.7 172.4 117.1 121.4 126.8 172.4 153.2 167.9 11 12 Security credit 203.0 278.2 238.9 303.7 339.2 307.9 302.6 313.7 339.2 320.6 376.2 12
13 U.S. direct investment abroad 231.0 239.3 201.7 217.5 225.8 221.6 223.4 225.5 225.8 228.0 232.0 13 14 Miscellaneous assets 910.1 786.0 730.9 639.8 761.4 728.2 797.0 777.8 761.4 889.2 835.1 14
15 Total liabilities 3162.7 3404.3 3460.5 3621.4 3324.6 3518.2 3473.7 3387.2 3324.6 3338.4 3304.5 15
16 Security repurchase agreements 1810.4 2006.3 2076.7 2207.9 1768.6 2084.7 2001.0 1909.9 1768.6 1709.7 1679.4 16
17 Credit market instruments 92.9 129.7 91.8 90.2 112.4 89.1 103.1 96.1 112.4 122.0 113.4 17
18 Corporate bonds 92.9 129.7 91.8 90.2 112.4 89.1 103.1 96.1 112.4 122.0 113.4 18 19 Depository institution loans n.e.c. (1) 0.0 0.0 0.0 0.0 0.0 0.0 0.0 0.0 0.0 0.0 0.0 19
20 Trade payables 70.1 18.1 14.3 14.2 14.5 15.4 15.6 13.3 14.5 14.8 17.8 20
21 Security credit 733.7 763.5 795.4 828.2 897.1 821.6 870.0 870.0 897.1 952.5 956.9 21 22 From households 701.7 725.2 726.1 757.0 815.5 743.6 794.0 791.5 815.5 866.2 870.0 22 23 From U.S.-chartered depository institutions 20.4 23.6 35.8 45.0 52.9 47.9 51.8 53.9 52.9 58.4 61.0 23 24 From foreign banking offices in U.S. 11.6 14.7 33.5 26.2 28.7 30.2 24.2 24.7 28.7 28.0 25.9 24
25 Taxes payable 5.7 3.6 2.5 3.1 3.7 4.4 4.4 4.6 3.7 4.5 5.1 25 26 Foreign direct investment in U.S. 64.4 88.5 104.6 110.4 119.5 112.2 113.7 114.3 119.5 121.7 121.7 26
27 Miscellaneous liabilities 385.6 394.6 375.1 367.4 408.7 390.8 365.8 378.9 408.7 413.1 410.1 27 28 Investment by parent companies 1119.3 1122.9 1163.3 1629.2 1671.8 1638.2 1651.0 1620.4 1671.8 1683.2 1713.8 28 29 Other -733.7 -728.3 -788.1 -1261.8 -1263.1 -1247.4 -1285.2 -1241.5 -1263.1 -1270.1 -1303.7 29
(1) Includes loans extended through the Federal Reserve’s Primary Dealer Credit Facility (PDCF) and the Asset-Backed Commercial Paper Money Market Mutual Fund Liquidity Facility (AMLF).

Lev
els
Z.1, September 18, 2014 91
L.129 Holding Companies (1)Billions of dollars; amounts outstanding end of period, not seasonally adjusted
2009 2010 2011 2012 2013 2013 2014 Q1 Q2 Q3 Q4 Q1 Q2
1 Total financial assets 3317.2 3312.7 3357.3 4284.3 4243.7 4374.2 4330.9 4353.3 4243.7 4287.1 4354.3 1
2 Time and savings deposits 11.2 10.0 12.4 34.4 35.9 30.8 32.7 32.6 35.9 37.5 31.4 2 3 Federal funds and security repos 48.2 50.3 50.5 10.5 7.7 10.1 7.0 9.8 7.7 7.6 9.5 3
4 Credit market instruments 75.8 97.9 101.1 209.2 151.8 213.3 226.1 217.8 151.8 145.5 143.5 4
5 Treasury securities 5.8 19.6 26.8 8.2 16.6 9.5 18.7 17.1 16.6 16.5 21.8 5 6 Agency- and GSE-backed securities 24.3 21.1 33.1 22.9 28.0 26.0 25.0 29.1 28.0 26.1 26.4 6 7 Corporate and foreign bonds 31.1 38.3 18.3 72.7 31.5 71.8 71.7 71.1 31.5 29.8 31.2 7 8 Other loans and advances 14.6 18.9 22.9 105.3 75.7 106.0 110.7 100.5 75.7 73.0 64.1 8
9 Life insurance reserves 21.4 25.1 27.6 34.9 39.9 36.1 36.4 37.5 39.9 41.1 42.4 9
10 Miscellaneous assets 3160.6 3129.4 3165.9 3995.3 4008.3 4083.8 4028.7 4055.6 4008.3 4055.4 4127.4 10 11 Net trans. with depository subs. 1599.5 1632.8 1709.0 1889.2 1937.3 1916.9 1880.5 1898.0 1937.3 1978.7 2028.2 11 12 Net trans. with property-casualty ins. co. subs. 0.0 0.0 0.0 11.2 5.2 5.1 5.1 5.3 5.2 4.7 5.1 12 13 Net trans. with life insurance company subs. 40.5 62.7 72.0 17.2 10.7 17.4 17.3 17.7 10.7 11.0 11.5 13 14 Net trans. with finance company subs. 209.3 115.0 94.6 91.1 75.4 74.7 75.8 75.9 75.4 77.8 77.3 14 15 Net trans. with broker and dealer subs. 596.1 626.6 613.5 1060.5 1087.6 1054.3 1072.5 1032.3 1087.6 1095.8 1110.9 15 16 Net trans. with foreign subs. 125.1 135.6 166.3 114.7 97.8 137.2 100.7 127.3 97.8 95.8 100.7 16 17 Other 590.3 556.7 510.4 811.3 794.3 878.2 876.9 899.0 794.3 791.5 793.7 17
18 Total liabilities 1805.1 1762.7 1706.4 2238.7 2142.1 2294.1 2258.4 2258.0 2142.1 2142.3 2150.8 18
19 Federal funds and security repos 0.6 0.8 1.2 0.0 0.0 0.0 0.0 0.0 0.0 0.0 0.0 19
20 Credit market instruments 1253.7 1237.2 1220.8 1416.4 1402.7 1410.3 1372.9 1363.4 1402.7 1405.9 1406.9 20
21 Commercial paper 60.8 64.7 75.9 116.4 96.6 117.7 110.6 109.4 96.6 89.7 91.3 21 22 Corporate bonds 1028.7 982.2 890.6 1103.2 1095.6 1091.7 1057.1 1071.3 1095.6 1107.6 1129.4 22 23 Depository institution loans n.e.c. 164.2 190.3 254.3 196.8 210.6 200.9 205.2 182.8 210.6 208.6 186.2 23
24 Miscellaneous liabilities 550.9 524.6 484.4 822.3 739.4 883.8 885.5 894.5 739.4 736.4 743.9 24
(1) Parent-only bank holding companies and savings and loan holding companies that file Federal Reserve Board form FR Y-9LP, FR Y-9SP, or FR 2320.
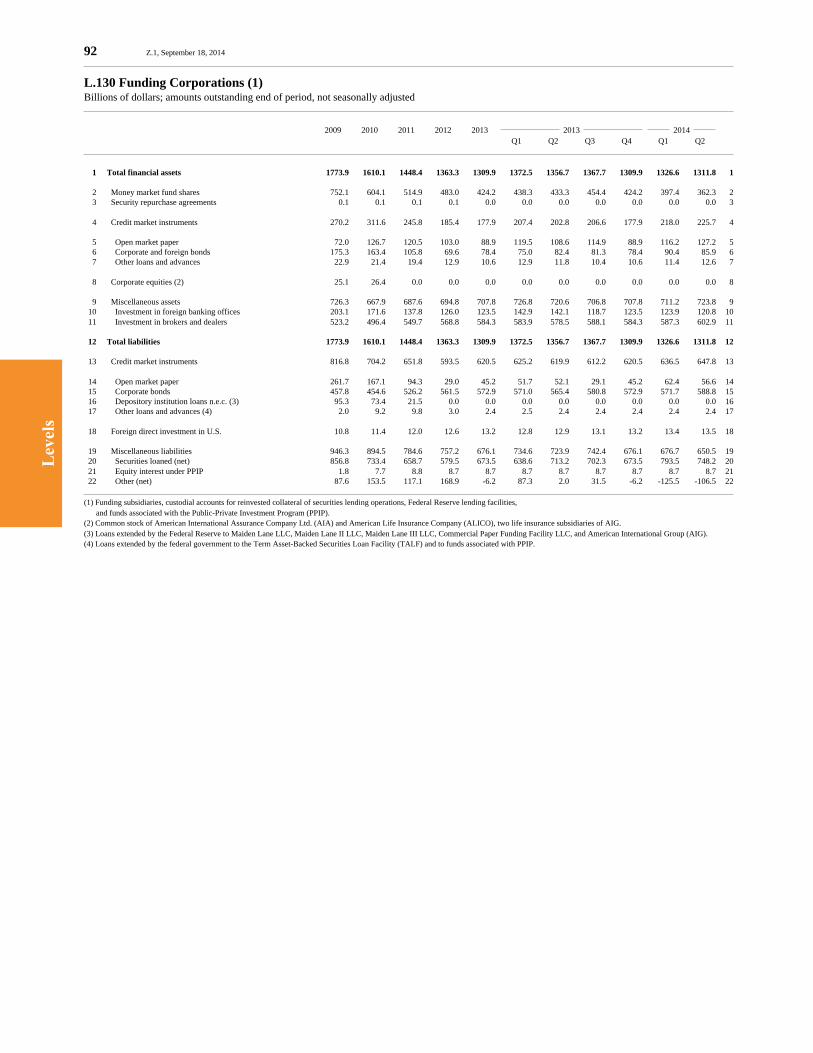
Lev
els
92 Z.1, September 18, 2014
L.130 Funding Corporations (1)Billions of dollars; amounts outstanding end of period, not seasonally adjusted
2009 2010 2011 2012 2013 2013 2014 Q1 Q2 Q3 Q4 Q1 Q2
1 Total financial assets 1773.9 1610.1 1448.4 1363.3 1309.9 1372.5 1356.7 1367.7 1309.9 1326.6 1311.8 1
2 Money market fund shares 752.1 604.1 514.9 483.0 424.2 438.3 433.3 454.4 424.2 397.4 362.3 2 3 Security repurchase agreements 0.1 0.1 0.1 0.1 0.0 0.0 0.0 0.0 0.0 0.0 0.0 3
4 Credit market instruments 270.2 311.6 245.8 185.4 177.9 207.4 202.8 206.6 177.9 218.0 225.7 4
5 Open market paper 72.0 126.7 120.5 103.0 88.9 119.5 108.6 114.9 88.9 116.2 127.2 5 6 Corporate and foreign bonds 175.3 163.4 105.8 69.6 78.4 75.0 82.4 81.3 78.4 90.4 85.9 6 7 Other loans and advances 22.9 21.4 19.4 12.9 10.6 12.9 11.8 10.4 10.6 11.4 12.6 7
8 Corporate equities (2) 25.1 26.4 0.0 0.0 0.0 0.0 0.0 0.0 0.0 0.0 0.0 8
9 Miscellaneous assets 726.3 667.9 687.6 694.8 707.8 726.8 720.6 706.8 707.8 711.2 723.8 9 10 Investment in foreign banking offices 203.1 171.6 137.8 126.0 123.5 142.9 142.1 118.7 123.5 123.9 120.8 10 11 Investment in brokers and dealers 523.2 496.4 549.7 568.8 584.3 583.9 578.5 588.1 584.3 587.3 602.9 11
12 Total liabilities 1773.9 1610.1 1448.4 1363.3 1309.9 1372.5 1356.7 1367.7 1309.9 1326.6 1311.8 12
13 Credit market instruments 816.8 704.2 651.8 593.5 620.5 625.2 619.9 612.2 620.5 636.5 647.8 13
14 Open market paper 261.7 167.1 94.3 29.0 45.2 51.7 52.1 29.1 45.2 62.4 56.6 14 15 Corporate bonds 457.8 454.6 526.2 561.5 572.9 571.0 565.4 580.8 572.9 571.7 588.8 15 16 Depository institution loans n.e.c. (3) 95.3 73.4 21.5 0.0 0.0 0.0 0.0 0.0 0.0 0.0 0.0 16 17 Other loans and advances (4) 2.0 9.2 9.8 3.0 2.4 2.5 2.4 2.4 2.4 2.4 2.4 17
18 Foreign direct investment in U.S. 10.8 11.4 12.0 12.6 13.2 12.8 12.9 13.1 13.2 13.4 13.5 18
19 Miscellaneous liabilities 946.3 894.5 784.6 757.2 676.1 734.6 723.9 742.4 676.1 676.7 650.5 19 20 Securities loaned (net) 856.8 733.4 658.7 579.5 673.5 638.6 713.2 702.3 673.5 793.5 748.2 20 21 Equity interest under PPIP 1.8 7.7 8.8 8.7 8.7 8.7 8.7 8.7 8.7 8.7 8.7 21 22 Other (net) 87.6 153.5 117.1 168.9 -6.2 87.3 2.0 31.5 -6.2 -125.5 -106.5 22
(1) Funding subsidiaries, custodial accounts for reinvested collateral of securities lending operations, Federal Reserve lending facilities, and funds associated with the Public-Private Investment Program (PPIP).(2) Common stock of American International Assurance Company Ltd. (AIA) and American Life Insurance Company (ALICO), two life insurance subsidiaries of AIG.(3) Loans extended by the Federal Reserve to Maiden Lane LLC, Maiden Lane II LLC, Maiden Lane III LLC, Commercial Paper Funding Facility LLC, and American International Group (AIG).(4) Loans extended by the federal government to the Term Asset-Backed Securities Loan Facility (TALF) and to funds associated with PPIP.
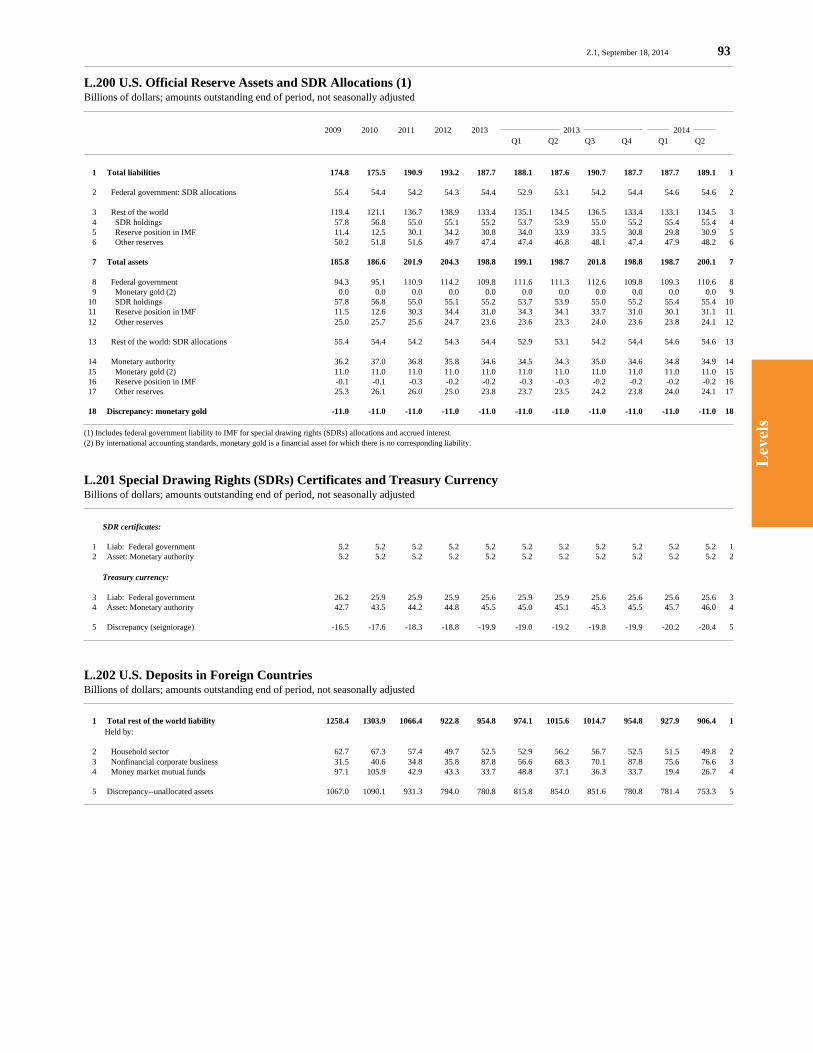
Lev
els
Z.1, September 18, 2014 93
L.200 U.S. Official Reserve Assets and SDR Allocations (1)Billions of dollars; amounts outstanding end of period, not seasonally adjusted
2009 2010 2011 2012 2013 2013 2014 Q1 Q2 Q3 Q4 Q1 Q2
1 Total liabilities 174.8 175.5 190.9 193.2 187.7 188.1 187.6 190.7 187.7 187.7 189.1 1
2 Federal government: SDR allocations 55.4 54.4 54.2 54.3 54.4 52.9 53.1 54.2 54.4 54.6 54.6 2
3 Rest of the world 119.4 121.1 136.7 138.9 133.4 135.1 134.5 136.5 133.4 133.1 134.5 3 4 SDR holdings 57.8 56.8 55.0 55.1 55.2 53.7 53.9 55.0 55.2 55.4 55.4 4 5 Reserve position in IMF 11.4 12.5 30.1 34.2 30.8 34.0 33.9 33.5 30.8 29.8 30.9 5 6 Other reserves 50.2 51.8 51.6 49.7 47.4 47.4 46.8 48.1 47.4 47.9 48.2 6
7 Total assets 185.8 186.6 201.9 204.3 198.8 199.1 198.7 201.8 198.8 198.7 200.1 7
8 Federal government 94.3 95.1 110.9 114.2 109.8 111.6 111.3 112.6 109.8 109.3 110.6 8 9 Monetary gold (2) 0.0 0.0 0.0 0.0 0.0 0.0 0.0 0.0 0.0 0.0 0.0 9 10 SDR holdings 57.8 56.8 55.0 55.1 55.2 53.7 53.9 55.0 55.2 55.4 55.4 10 11 Reserve position in IMF 11.5 12.6 30.3 34.4 31.0 34.3 34.1 33.7 31.0 30.1 31.1 11 12 Other reserves 25.0 25.7 25.6 24.7 23.6 23.6 23.3 24.0 23.6 23.8 24.1 12
13 Rest of the world: SDR allocations 55.4 54.4 54.2 54.3 54.4 52.9 53.1 54.2 54.4 54.6 54.6 13
14 Monetary authority 36.2 37.0 36.8 35.8 34.6 34.5 34.3 35.0 34.6 34.8 34.9 14 15 Monetary gold (2) 11.0 11.0 11.0 11.0 11.0 11.0 11.0 11.0 11.0 11.0 11.0 15 16 Reserve position in IMF -0.1 -0.1 -0.3 -0.2 -0.2 -0.3 -0.3 -0.2 -0.2 -0.2 -0.2 16 17 Other reserves 25.3 26.1 26.0 25.0 23.8 23.7 23.5 24.2 23.8 24.0 24.1 17
18 Discrepancy: monetary gold -11.0 -11.0 -11.0 -11.0 -11.0 -11.0 -11.0 -11.0 -11.0 -11.0 -11.0 18
(1) Includes federal government liability to IMF for special drawing rights (SDRs) allocations and accrued interest.(2) By international accounting standards, monetary gold is a financial asset for which there is no corresponding liability.
L.201 Special Drawing Rights (SDRs) Certificates and Treasury CurrencyBillions of dollars; amounts outstanding end of period, not seasonally adjusted
SDR certificates:
1 Liab: Federal government 5.2 5.2 5.2 5.2 5.2 5.2 5.2 5.2 5.2 5.2 5.2 1 2 Asset: Monetary authority 5.2 5.2 5.2 5.2 5.2 5.2 5.2 5.2 5.2 5.2 5.2 2
Treasury currency:
3 Liab: Federal government 26.2 25.9 25.9 25.9 25.6 25.9 25.9 25.6 25.6 25.6 25.6 3 4 Asset: Monetary authority 42.7 43.5 44.2 44.8 45.5 45.0 45.1 45.3 45.5 45.7 46.0 4
5 Discrepancy (seigniorage) -16.5 -17.6 -18.3 -18.8 -19.9 -19.0 -19.2 -19.8 -19.9 -20.2 -20.4 5
L.202 U.S. Deposits in Foreign CountriesBillions of dollars; amounts outstanding end of period, not seasonally adjusted
1 Total rest of the world liability 1258.4 1303.9 1066.4 922.8 954.8 974.1 1015.6 1014.7 954.8 927.9 906.4 1 Held by:
2 Household sector 62.7 67.3 57.4 49.7 52.5 52.9 56.2 56.7 52.5 51.5 49.8 2 3 Nonfinancial corporate business 31.5 40.6 34.8 35.8 87.8 56.6 68.3 70.1 87.8 75.6 76.6 3 4 Money market mutual funds 97.1 105.9 42.9 43.3 33.7 48.8 37.1 36.3 33.7 19.4 26.7 4
5 Discrepancy--unallocated assets 1067.0 1090.1 931.3 794.0 780.8 815.8 854.0 851.6 780.8 781.4 753.3 5
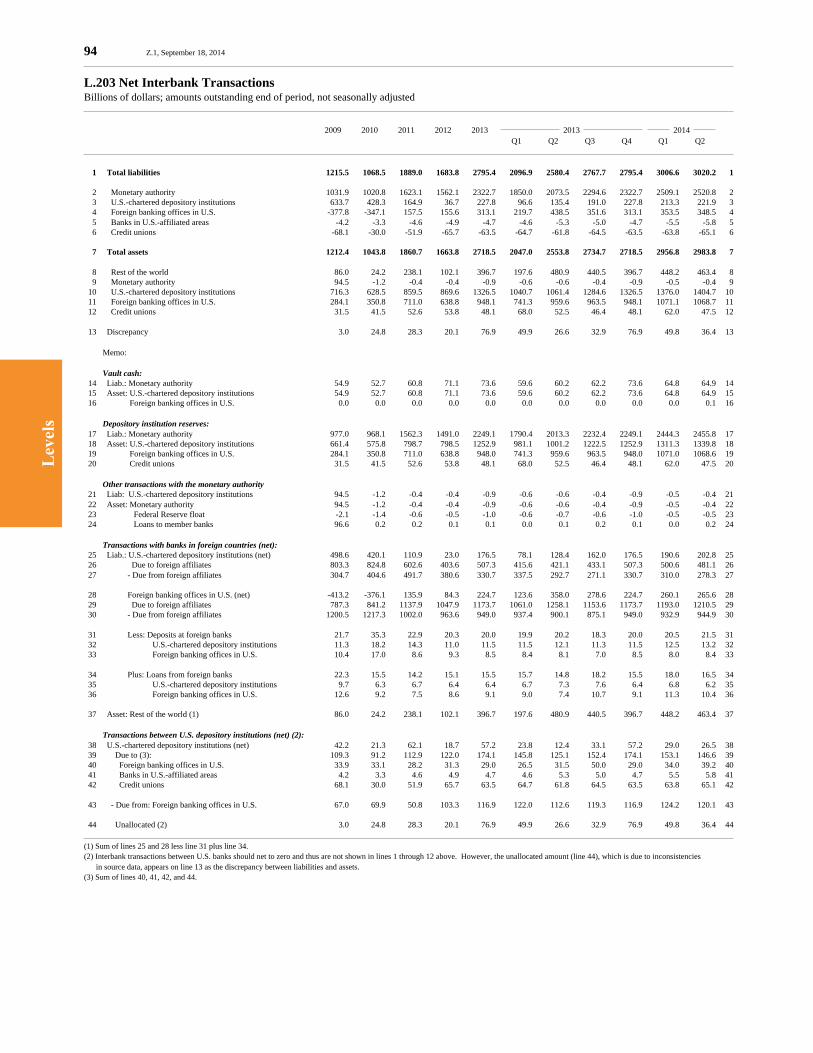
Lev
els
94 Z.1, September 18, 2014
L.203 Net Interbank TransactionsBillions of dollars; amounts outstanding end of period, not seasonally adjusted
2009 2010 2011 2012 2013 2013 2014 Q1 Q2 Q3 Q4 Q1 Q2
1 Total liabilities 1215.5 1068.5 1889.0 1683.8 2795.4 2096.9 2580.4 2767.7 2795.4 3006.6 3020.2 1
2 Monetary authority 1031.9 1020.8 1623.1 1562.1 2322.7 1850.0 2073.5 2294.6 2322.7 2509.1 2520.8 2 3 U.S.-chartered depository institutions 633.7 428.3 164.9 36.7 227.8 96.6 135.4 191.0 227.8 213.3 221.9 3 4 Foreign banking offices in U.S. -377.8 -347.1 157.5 155.6 313.1 219.7 438.5 351.6 313.1 353.5 348.5 4 5 Banks in U.S.-affiliated areas -4.2 -3.3 -4.6 -4.9 -4.7 -4.6 -5.3 -5.0 -4.7 -5.5 -5.8 5 6 Credit unions -68.1 -30.0 -51.9 -65.7 -63.5 -64.7 -61.8 -64.5 -63.5 -63.8 -65.1 6
7 Total assets 1212.4 1043.8 1860.7 1663.8 2718.5 2047.0 2553.8 2734.7 2718.5 2956.8 2983.8 7
8 Rest of the world 86.0 24.2 238.1 102.1 396.7 197.6 480.9 440.5 396.7 448.2 463.4 8 9 Monetary authority 94.5 -1.2 -0.4 -0.4 -0.9 -0.6 -0.6 -0.4 -0.9 -0.5 -0.4 9 10 U.S.-chartered depository institutions 716.3 628.5 859.5 869.6 1326.5 1040.7 1061.4 1284.6 1326.5 1376.0 1404.7 10 11 Foreign banking offices in U.S. 284.1 350.8 711.0 638.8 948.1 741.3 959.6 963.5 948.1 1071.1 1068.7 11 12 Credit unions 31.5 41.5 52.6 53.8 48.1 68.0 52.5 46.4 48.1 62.0 47.5 12
13 Discrepancy 3.0 24.8 28.3 20.1 76.9 49.9 26.6 32.9 76.9 49.8 36.4 13
Memo:
Vault cash: 14 Liab.: Monetary authority 54.9 52.7 60.8 71.1 73.6 59.6 60.2 62.2 73.6 64.8 64.9 14 15 Asset: U.S.-chartered depository institutions 54.9 52.7 60.8 71.1 73.6 59.6 60.2 62.2 73.6 64.8 64.9 15 16 Foreign banking offices in U.S. 0.0 0.0 0.0 0.0 0.0 0.0 0.0 0.0 0.0 0.0 0.1 16
Depository institution reserves: 17 Liab.: Monetary authority 977.0 968.1 1562.3 1491.0 2249.1 1790.4 2013.3 2232.4 2249.1 2444.3 2455.8 17 18 Asset: U.S.-chartered depository institutions 661.4 575.8 798.7 798.5 1252.9 981.1 1001.2 1222.5 1252.9 1311.3 1339.8 18 19 Foreign banking offices in U.S. 284.1 350.8 711.0 638.8 948.0 741.3 959.6 963.5 948.0 1071.0 1068.6 19 20 Credit unions 31.5 41.5 52.6 53.8 48.1 68.0 52.5 46.4 48.1 62.0 47.5 20
Other transactions with the monetary authority 21 Liab: U.S.-chartered depository institutions 94.5 -1.2 -0.4 -0.4 -0.9 -0.6 -0.6 -0.4 -0.9 -0.5 -0.4 21 22 Asset: Monetary authority 94.5 -1.2 -0.4 -0.4 -0.9 -0.6 -0.6 -0.4 -0.9 -0.5 -0.4 22 23 Federal Reserve float -2.1 -1.4 -0.6 -0.5 -1.0 -0.6 -0.7 -0.6 -1.0 -0.5 -0.5 23 24 Loans to member banks 96.6 0.2 0.2 0.1 0.1 0.0 0.1 0.2 0.1 0.0 0.2 24
Transactions with banks in foreign countries (net): 25 Liab.: U.S.-chartered depository institutions (net) 498.6 420.1 110.9 23.0 176.5 78.1 128.4 162.0 176.5 190.6 202.8 25 26 Due to foreign affiliates 803.3 824.8 602.6 403.6 507.3 415.6 421.1 433.1 507.3 500.6 481.1 26 27 - Due from foreign affiliates 304.7 404.6 491.7 380.6 330.7 337.5 292.7 271.1 330.7 310.0 278.3 27
28 Foreign banking offices in U.S. (net) -413.2 -376.1 135.9 84.3 224.7 123.6 358.0 278.6 224.7 260.1 265.6 28 29 Due to foreign affiliates 787.3 841.2 1137.9 1047.9 1173.7 1061.0 1258.1 1153.6 1173.7 1193.0 1210.5 29 30 - Due from foreign affiliates 1200.5 1217.3 1002.0 963.6 949.0 937.4 900.1 875.1 949.0 932.9 944.9 30
31 Less: Deposits at foreign banks 21.7 35.3 22.9 20.3 20.0 19.9 20.2 18.3 20.0 20.5 21.5 31 32 U.S.-chartered depository institutions 11.3 18.2 14.3 11.0 11.5 11.5 12.1 11.3 11.5 12.5 13.2 32 33 Foreign banking offices in U.S. 10.4 17.0 8.6 9.3 8.5 8.4 8.1 7.0 8.5 8.0 8.4 33
34 Plus: Loans from foreign banks 22.3 15.5 14.2 15.1 15.5 15.7 14.8 18.2 15.5 18.0 16.5 34 35 U.S.-chartered depository institutions 9.7 6.3 6.7 6.4 6.4 6.7 7.3 7.6 6.4 6.8 6.2 35 36 Foreign banking offices in U.S. 12.6 9.2 7.5 8.6 9.1 9.0 7.4 10.7 9.1 11.3 10.4 36
37 Asset: Rest of the world (1) 86.0 24.2 238.1 102.1 396.7 197.6 480.9 440.5 396.7 448.2 463.4 37
Transactions between U.S. depository institutions (net) (2): 38 U.S.-chartered depository institutions (net) 42.2 21.3 62.1 18.7 57.2 23.8 12.4 33.1 57.2 29.0 26.5 38 39 Due to (3): 109.3 91.2 112.9 122.0 174.1 145.8 125.1 152.4 174.1 153.1 146.6 39 40 Foreign banking offices in U.S. 33.9 33.1 28.2 31.3 29.0 26.5 31.5 50.0 29.0 34.0 39.2 40 41 Banks in U.S.-affiliated areas 4.2 3.3 4.6 4.9 4.7 4.6 5.3 5.0 4.7 5.5 5.8 41 42 Credit unions 68.1 30.0 51.9 65.7 63.5 64.7 61.8 64.5 63.5 63.8 65.1 42
43 - Due from: Foreign banking offices in U.S. 67.0 69.9 50.8 103.3 116.9 122.0 112.6 119.3 116.9 124.2 120.1 43
44 Unallocated (2) 3.0 24.8 28.3 20.1 76.9 49.9 26.6 32.9 76.9 49.8 36.4 44
(1) Sum of lines 25 and 28 less line 31 plus line 34.(2) Interbank transactions between U.S. banks should net to zero and thus are not shown in lines 1 through 12 above. However, the unallocated amount (line 44), which is due to inconsistencies in source data, appears on line 13 as the discrepancy between liabilities and assets.(3) Sum of lines 40, 41, 42, and 44.

Lev
els
Z.1, September 18, 2014 95
L.204 Checkable Deposits and CurrencyBillions of dollars; amounts outstanding end of period, not seasonally adjusted
2009 2010 2011 2012 2013 2013 2014 Q1 Q2 Q3 Q4 Q1 Q2
1 Total liabilities 2093.4 2359.8 2594.3 2853.8 3186.5 2872.9 2892.3 2924.6 3186.5 3183.8 3293.3 1
2 Monetary authority 1102.7 1287.8 1165.7 1224.6 1364.1 1226.1 1298.1 1266.5 1364.1 1364.4 1374.1 2 3 Federal government cash and deposits 191.9 340.9 85.9 92.9 162.6 79.4 135.0 88.6 162.6 142.5 139.4 3 4 Due to government-sponsored enterprises 35.1 13.5 64.6 27.2 25.9 20.2 19.5 24.1 25.9 10.8 11.2 4 5 Deposits due to foreign 2.4 3.4 0.2 6.5 8.0 9.2 10.1 9.0 8.0 7.0 6.0 5 6 Currency outside banks 873.3 930.0 1015.0 1098.1 1167.6 1117.3 1133.6 1144.9 1167.6 1204.1 1217.6 6
7 U.S.-chartered depository institutions 871.6 941.1 1260.5 1431.7 1579.8 1436.6 1372.9 1429.1 1579.8 1558.5 1649.4 7 8 Federal government deposits 3.8 3.6 1.0 1.3 1.6 1.5 1.3 1.3 1.6 1.7 1.8 8 9 Deposits due to foreign 34.3 30.4 56.1 51.8 50.2 46.3 40.5 49.5 50.2 51.8 55.1 9 10 Private domestic deposits 833.5 907.0 1203.5 1378.5 1528.1 1388.8 1331.0 1378.4 1528.1 1505.0 1592.5 10
11 Foreign banking offices in U.S. 16.1 21.9 45.6 61.8 92.6 63.7 73.4 82.0 92.6 101.7 110.4 11 12 Deposits due to foreign 10.5 14.6 19.0 27.9 40.2 28.5 32.3 34.2 40.2 44.3 52.1 12 13 Private domestic deposits 5.6 7.3 26.6 33.9 52.4 35.1 41.2 47.9 52.4 57.3 58.3 13
14 Banks in U.S.-affiliated areas 16.1 16.6 19.4 21.9 28.2 22.1 26.3 27.7 28.2 27.3 28.6 14
15 Credit unions 86.9 92.4 103.1 113.9 121.7 124.5 121.7 119.3 121.7 131.9 130.8 15
16 Total assets 2093.4 2359.8 2594.3 2853.8 3186.5 2872.9 2892.3 2924.6 3186.5 3183.8 3293.3 16
17 Household sector 396.1 423.7 752.2 899.1 1035.0 925.7 908.3 896.3 1035.0 1082.6 1150.5 17
18 Nonfinancial business 689.3 766.1 793.5 823.6 897.8 837.9 813.8 859.5 897.8 866.8 881.3 18 19 Corporate 154.9 234.5 264.2 279.4 357.3 296.5 272.7 318.9 357.3 323.6 332.2 19 20 Noncorporate 534.4 531.6 529.3 544.2 540.5 541.4 541.1 540.6 540.5 543.2 549.1 20
21 State and local governments 99.0 104.6 121.2 117.2 123.9 114.4 111.2 114.9 123.9 121.3 120.3 21 22 Federal government 193.9 342.3 84.6 92.2 163.0 79.6 135.4 88.6 163.0 142.6 139.5 22
23 Rest of the world 361.0 390.5 472.3 540.4 590.3 543.2 551.5 573.9 590.3 620.2 636.8 23 24 Checkable deposits 47.2 48.4 75.2 86.2 98.4 84.0 82.9 92.6 98.4 103.1 113.1 24 25 Currency 313.8 342.1 397.1 454.2 491.9 459.2 468.7 481.3 491.9 517.1 523.6 25
26 Financial sectors 348.2 327.1 364.3 374.4 371.5 367.4 367.2 385.6 371.5 344.2 358.5 26
27 Property-casualty insurance companies 27.6 32.6 24.1 36.4 29.7 31.7 30.6 30.6 29.7 33.4 34.8 27 28 Life insurance companies 50.7 51.7 53.7 56.4 47.2 56.3 45.5 53.5 47.2 50.1 48.0 28
29 Private pension funds 10.3 12.5 18.1 16.4 16.5 16.7 17.1 16.7 16.5 16.8 17.6 29 30 State and local govt. retirement funds 3.6 4.2 4.5 4.8 5.5 4.9 5.6 5.6 5.5 5.0 5.9 30
31 Money market mutual funds 17.9 14.2 20.1 16.5 13.3 10.9 27.5 11.0 13.3 15.5 18.6 31 32 Government-sponsored enterprises 99.4 63.4 72.7 52.6 81.6 64.1 51.7 77.4 81.6 45.4 49.3 32
33 Finance companies 17.0 26.5 31.7 27.8 32.1 30.2 30.0 34.2 32.1 32.9 32.3 33 34 REITs 30.9 25.1 27.6 35.3 34.0 40.9 37.5 39.9 34.0 32.9 37.5 34 35 Brokers and dealers 90.7 96.9 111.8 128.2 111.7 111.6 121.8 116.8 111.7 112.2 114.5 35
36 Mail float 6.0 5.4 6.3 7.0 4.9 4.6 4.9 5.7 4.9 6.0 6.4 36
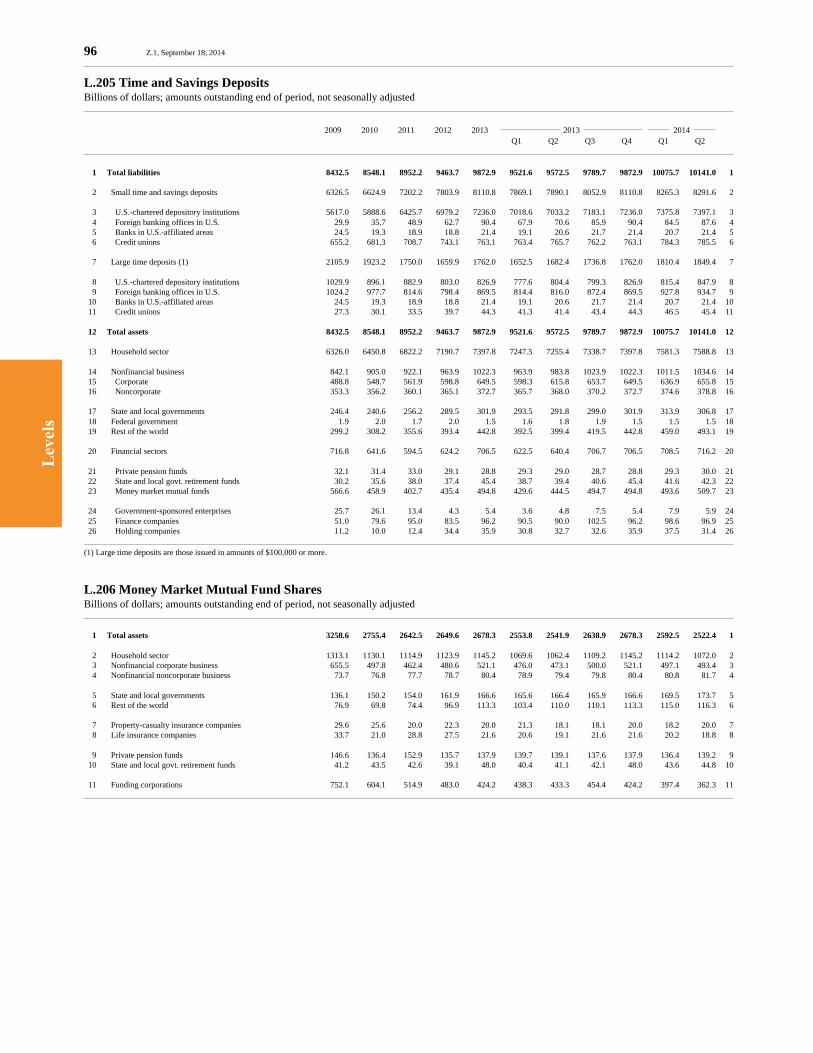
Lev
els
96 Z.1, September 18, 2014
L.205 Time and Savings Deposits Billions of dollars; amounts outstanding end of period, not seasonally adjusted
2009 2010 2011 2012 2013 2013 2014 Q1 Q2 Q3 Q4 Q1 Q2
1 Total liabilities 8432.5 8548.1 8952.2 9463.7 9872.9 9521.6 9572.5 9789.7 9872.9 10075.7 10141.0 1
2 Small time and savings deposits 6326.5 6624.9 7202.2 7803.9 8110.8 7869.1 7890.1 8052.9 8110.8 8265.3 8291.6 2
3 U.S.-chartered depository institutions 5617.0 5888.6 6425.7 6979.2 7236.0 7018.6 7033.2 7183.1 7236.0 7375.8 7397.1 3 4 Foreign banking offices in U.S. 29.9 35.7 48.9 62.7 90.4 67.9 70.6 85.9 90.4 84.5 87.6 4 5 Banks in U.S.-affiliated areas 24.5 19.3 18.9 18.8 21.4 19.1 20.6 21.7 21.4 20.7 21.4 5 6 Credit unions 655.2 681.3 708.7 743.1 763.1 763.4 765.7 762.2 763.1 784.3 785.5 6
7 Large time deposits (1) 2105.9 1923.2 1750.0 1659.9 1762.0 1652.5 1682.4 1736.8 1762.0 1810.4 1849.4 7
8 U.S.-chartered depository institutions 1029.9 896.1 882.9 803.0 826.9 777.6 804.4 799.3 826.9 815.4 847.9 8 9 Foreign banking offices in U.S. 1024.2 977.7 814.6 798.4 869.5 814.4 816.0 872.4 869.5 927.8 934.7 9 10 Banks in U.S.-affiliated areas 24.5 19.3 18.9 18.8 21.4 19.1 20.6 21.7 21.4 20.7 21.4 10 11 Credit unions 27.3 30.1 33.5 39.7 44.3 41.3 41.4 43.4 44.3 46.5 45.4 11
12 Total assets 8432.5 8548.1 8952.2 9463.7 9872.9 9521.6 9572.5 9789.7 9872.9 10075.7 10141.0 12
13 Household sector 6326.0 6450.8 6822.2 7190.7 7397.8 7247.5 7255.4 7338.7 7397.8 7581.3 7588.8 13
14 Nonfinancial business 842.1 905.0 922.1 963.9 1022.3 963.9 983.8 1023.9 1022.3 1011.5 1034.6 14 15 Corporate 488.8 548.7 561.9 598.8 649.5 598.3 615.8 653.7 649.5 636.9 655.8 15 16 Noncorporate 353.3 356.2 360.1 365.1 372.7 365.7 368.0 370.2 372.7 374.6 378.8 16
17 State and local governments 246.4 240.6 256.2 289.5 301.9 293.5 291.8 299.0 301.9 313.9 306.8 17 18 Federal government 1.9 2.0 1.7 2.0 1.5 1.6 1.8 1.9 1.5 1.5 1.5 18 19 Rest of the world 299.2 308.2 355.6 393.4 442.8 392.5 399.4 419.5 442.8 459.0 493.1 19
20 Financial sectors 716.8 641.6 594.5 624.2 706.5 622.5 640.4 706.7 706.5 708.5 716.2 20
21 Private pension funds 32.1 31.4 33.0 29.1 28.8 29.3 29.0 28.7 28.8 29.3 30.0 21 22 State and local govt. retirement funds 30.2 35.6 38.0 37.4 45.4 38.7 39.4 40.6 45.4 41.6 42.3 22 23 Money market mutual funds 566.6 458.9 402.7 435.4 494.8 429.6 444.5 494.7 494.8 493.6 509.7 23
24 Government-sponsored enterprises 25.7 26.1 13.4 4.3 5.4 3.6 4.8 7.5 5.4 7.9 5.9 24 25 Finance companies 51.0 79.6 95.0 83.5 96.2 90.5 90.0 102.5 96.2 98.6 96.9 25 26 Holding companies 11.2 10.0 12.4 34.4 35.9 30.8 32.7 32.6 35.9 37.5 31.4 26
(1) Large time deposits are those issued in amounts of $100,000 or more.
L.206 Money Market Mutual Fund SharesBillions of dollars; amounts outstanding end of period, not seasonally adjusted
1 Total assets 3258.6 2755.4 2642.5 2649.6 2678.3 2553.8 2541.9 2638.9 2678.3 2592.5 2522.4 1
2 Household sector 1313.1 1130.1 1114.9 1123.9 1145.2 1069.6 1062.4 1109.2 1145.2 1114.2 1072.0 2 3 Nonfinancial corporate business 655.5 497.8 462.4 480.6 521.1 476.0 473.1 500.0 521.1 497.1 493.4 3 4 Nonfinancial noncorporate business 73.7 76.8 77.7 78.7 80.4 78.9 79.4 79.8 80.4 80.8 81.7 4
5 State and local governments 136.1 150.2 154.0 161.9 166.6 165.6 166.4 165.9 166.6 169.5 173.7 5 6 Rest of the world 76.9 69.8 74.4 96.9 113.3 103.4 110.0 110.1 113.3 115.0 116.3 6
7 Property-casualty insurance companies 29.6 25.6 20.0 22.3 20.0 21.3 18.1 18.1 20.0 18.2 20.0 7 8 Life insurance companies 33.7 21.0 28.8 27.5 21.6 20.6 19.1 21.6 21.6 20.2 18.8 8
9 Private pension funds 146.6 136.4 152.9 135.7 137.9 139.7 139.1 137.6 137.9 136.4 139.2 9 10 State and local govt. retirement funds 41.2 43.5 42.6 39.1 48.0 40.4 41.1 42.1 48.0 43.6 44.8 10
11 Funding corporations 752.1 604.1 514.9 483.0 424.2 438.3 433.3 454.4 424.2 397.4 362.3 11
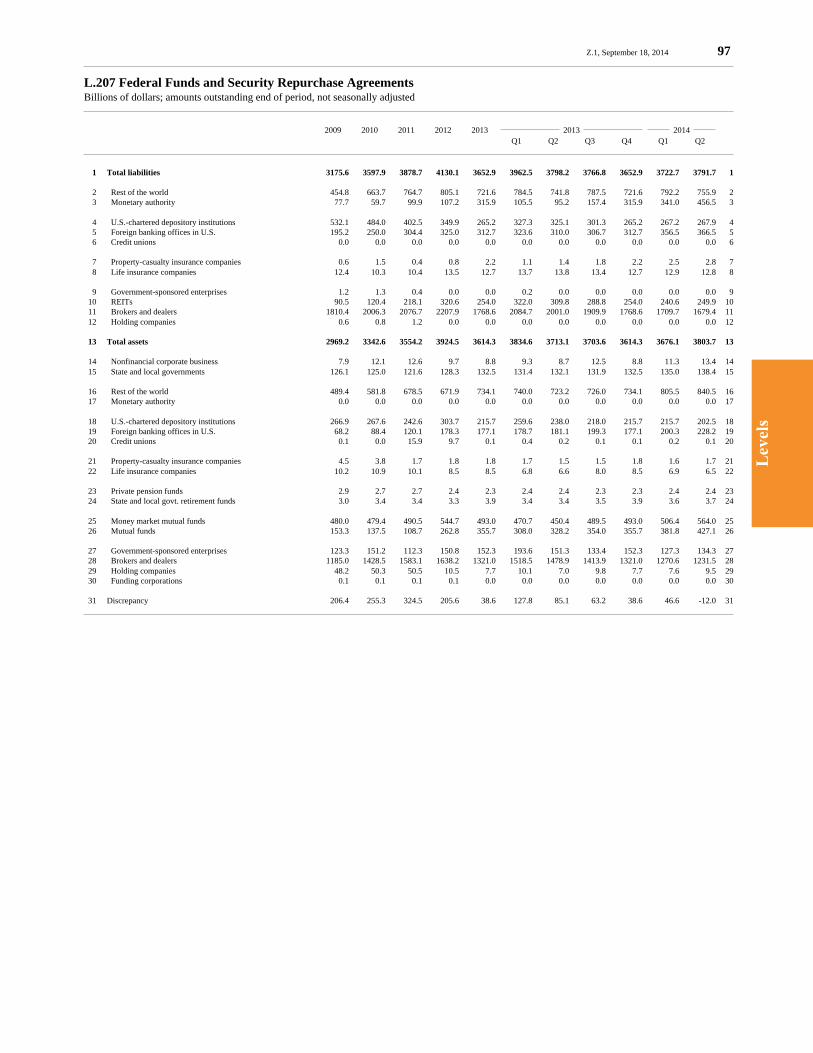
Lev
els
Z.1, September 18, 2014 97
L.207 Federal Funds and Security Repurchase AgreementsBillions of dollars; amounts outstanding end of period, not seasonally adjusted
2009 2010 2011 2012 2013 2013 2014 Q1 Q2 Q3 Q4 Q1 Q2
1 Total liabilities 3175.6 3597.9 3878.7 4130.1 3652.9 3962.5 3798.2 3766.8 3652.9 3722.7 3791.7 1
2 Rest of the world 454.8 663.7 764.7 805.1 721.6 784.5 741.8 787.5 721.6 792.2 755.9 2 3 Monetary authority 77.7 59.7 99.9 107.2 315.9 105.5 95.2 157.4 315.9 341.0 456.5 3
4 U.S.-chartered depository institutions 532.1 484.0 402.5 349.9 265.2 327.3 325.1 301.3 265.2 267.2 267.9 4 5 Foreign banking offices in U.S. 195.2 250.0 304.4 325.0 312.7 323.6 310.0 306.7 312.7 356.5 366.5 5 6 Credit unions 0.0 0.0 0.0 0.0 0.0 0.0 0.0 0.0 0.0 0.0 0.0 6
7 Property-casualty insurance companies 0.6 1.5 0.4 0.8 2.2 1.1 1.4 1.8 2.2 2.5 2.8 7 8 Life insurance companies 12.4 10.3 10.4 13.5 12.7 13.7 13.8 13.4 12.7 12.9 12.8 8
9 Government-sponsored enterprises 1.2 1.3 0.4 0.0 0.0 0.2 0.0 0.0 0.0 0.0 0.0 9 10 REITs 90.5 120.4 218.1 320.6 254.0 322.0 309.8 288.8 254.0 240.6 249.9 10 11 Brokers and dealers 1810.4 2006.3 2076.7 2207.9 1768.6 2084.7 2001.0 1909.9 1768.6 1709.7 1679.4 11 12 Holding companies 0.6 0.8 1.2 0.0 0.0 0.0 0.0 0.0 0.0 0.0 0.0 12
13 Total assets 2969.2 3342.6 3554.2 3924.5 3614.3 3834.6 3713.1 3703.6 3614.3 3676.1 3803.7 13
14 Nonfinancial corporate business 7.9 12.1 12.6 9.7 8.8 9.3 8.7 12.5 8.8 11.3 13.4 14 15 State and local governments 126.1 125.0 121.6 128.3 132.5 131.4 132.1 131.9 132.5 135.0 138.4 15
16 Rest of the world 489.4 581.8 678.5 671.9 734.1 740.0 723.2 726.0 734.1 805.5 840.5 16 17 Monetary authority 0.0 0.0 0.0 0.0 0.0 0.0 0.0 0.0 0.0 0.0 0.0 17
18 U.S.-chartered depository institutions 266.9 267.6 242.6 303.7 215.7 259.6 238.0 218.0 215.7 215.7 202.5 18 19 Foreign banking offices in U.S. 68.2 88.4 120.1 178.3 177.1 178.7 181.1 199.3 177.1 200.3 228.2 19 20 Credit unions 0.1 0.0 15.9 9.7 0.1 0.4 0.2 0.1 0.1 0.2 0.1 20
21 Property-casualty insurance companies 4.5 3.8 1.7 1.8 1.8 1.7 1.5 1.5 1.8 1.6 1.7 21 22 Life insurance companies 10.2 10.9 10.1 8.5 8.5 6.8 6.6 8.0 8.5 6.9 6.5 22
23 Private pension funds 2.9 2.7 2.7 2.4 2.3 2.4 2.4 2.3 2.3 2.4 2.4 23 24 State and local govt. retirement funds 3.0 3.4 3.4 3.3 3.9 3.4 3.4 3.5 3.9 3.6 3.7 24
25 Money market mutual funds 480.0 479.4 490.5 544.7 493.0 470.7 450.4 489.5 493.0 506.4 564.0 25 26 Mutual funds 153.3 137.5 108.7 262.8 355.7 308.0 328.2 354.0 355.7 381.8 427.1 26
27 Government-sponsored enterprises 123.3 151.2 112.3 150.8 152.3 193.6 151.3 133.4 152.3 127.3 134.3 27 28 Brokers and dealers 1185.0 1428.5 1583.1 1638.2 1321.0 1518.5 1478.9 1413.9 1321.0 1270.6 1231.5 28 29 Holding companies 48.2 50.3 50.5 10.5 7.7 10.1 7.0 9.8 7.7 7.6 9.5 29 30 Funding corporations 0.1 0.1 0.1 0.1 0.0 0.0 0.0 0.0 0.0 0.0 0.0 30
31 Discrepancy 206.4 255.3 324.5 205.6 38.6 127.8 85.1 63.2 38.6 46.6 -12.0 31
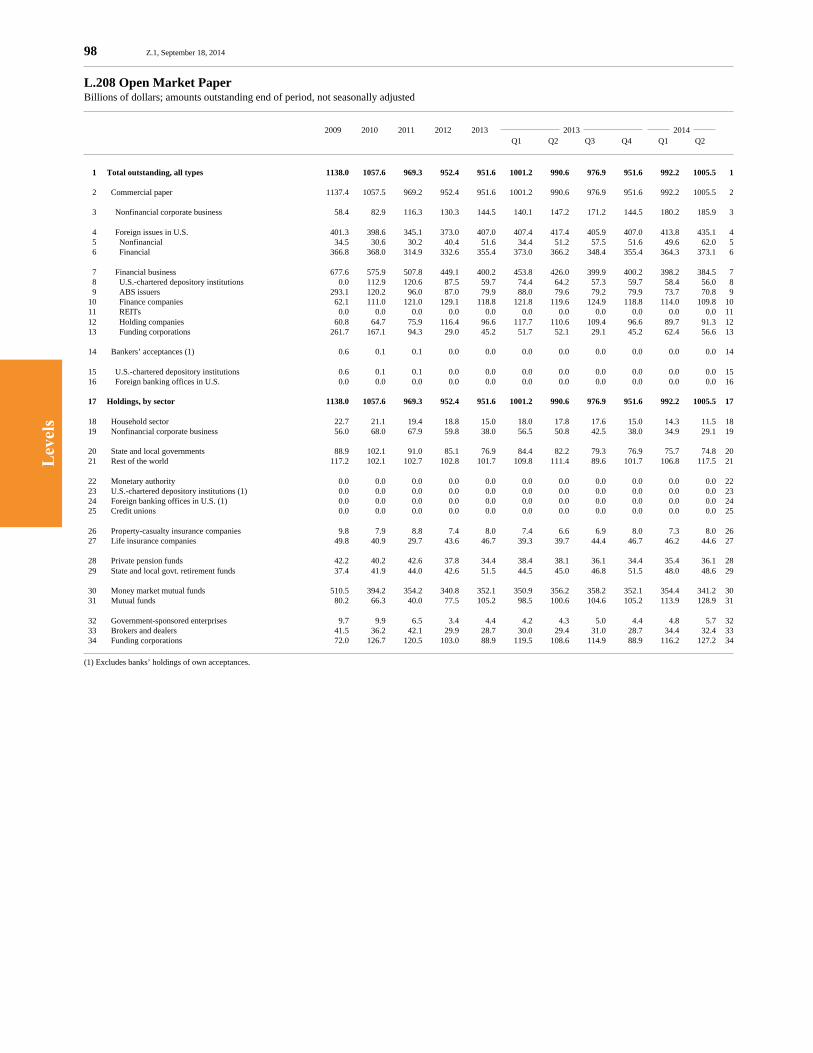
Lev
els
98 Z.1, September 18, 2014
L.208 Open Market PaperBillions of dollars; amounts outstanding end of period, not seasonally adjusted
2009 2010 2011 2012 2013 2013 2014 Q1 Q2 Q3 Q4 Q1 Q2
1 Total outstanding, all types 1138.0 1057.6 969.3 952.4 951.6 1001.2 990.6 976.9 951.6 992.2 1005.5 1
2 Commercial paper 1137.4 1057.5 969.2 952.4 951.6 1001.2 990.6 976.9 951.6 992.2 1005.5 2
3 Nonfinancial corporate business 58.4 82.9 116.3 130.3 144.5 140.1 147.2 171.2 144.5 180.2 185.9 3
4 Foreign issues in U.S. 401.3 398.6 345.1 373.0 407.0 407.4 417.4 405.9 407.0 413.8 435.1 4 5 Nonfinancial 34.5 30.6 30.2 40.4 51.6 34.4 51.2 57.5 51.6 49.6 62.0 5 6 Financial 366.8 368.0 314.9 332.6 355.4 373.0 366.2 348.4 355.4 364.3 373.1 6
7 Financial business 677.6 575.9 507.8 449.1 400.2 453.8 426.0 399.9 400.2 398.2 384.5 7 8 U.S.-chartered depository institutions 0.0 112.9 120.6 87.5 59.7 74.4 64.2 57.3 59.7 58.4 56.0 8 9 ABS issuers 293.1 120.2 96.0 87.0 79.9 88.0 79.6 79.2 79.9 73.7 70.8 9 10 Finance companies 62.1 111.0 121.0 129.1 118.8 121.8 119.6 124.9 118.8 114.0 109.8 10 11 REITs 0.0 0.0 0.0 0.0 0.0 0.0 0.0 0.0 0.0 0.0 0.0 11 12 Holding companies 60.8 64.7 75.9 116.4 96.6 117.7 110.6 109.4 96.6 89.7 91.3 12 13 Funding corporations 261.7 167.1 94.3 29.0 45.2 51.7 52.1 29.1 45.2 62.4 56.6 13
14 Bankers’ acceptances (1) 0.6 0.1 0.1 0.0 0.0 0.0 0.0 0.0 0.0 0.0 0.0 14
15 U.S.-chartered depository institutions 0.6 0.1 0.1 0.0 0.0 0.0 0.0 0.0 0.0 0.0 0.0 15 16 Foreign banking offices in U.S. 0.0 0.0 0.0 0.0 0.0 0.0 0.0 0.0 0.0 0.0 0.0 16
17 Holdings, by sector 1138.0 1057.6 969.3 952.4 951.6 1001.2 990.6 976.9 951.6 992.2 1005.5 17
18 Household sector 22.7 21.1 19.4 18.8 15.0 18.0 17.8 17.6 15.0 14.3 11.5 18 19 Nonfinancial corporate business 56.0 68.0 67.9 59.8 38.0 56.5 50.8 42.5 38.0 34.9 29.1 19
20 State and local governments 88.9 102.1 91.0 85.1 76.9 84.4 82.2 79.3 76.9 75.7 74.8 20 21 Rest of the world 117.2 102.1 102.7 102.8 101.7 109.8 111.4 89.6 101.7 106.8 117.5 21
22 Monetary authority 0.0 0.0 0.0 0.0 0.0 0.0 0.0 0.0 0.0 0.0 0.0 22 23 U.S.-chartered depository institutions (1) 0.0 0.0 0.0 0.0 0.0 0.0 0.0 0.0 0.0 0.0 0.0 23 24 Foreign banking offices in U.S. (1) 0.0 0.0 0.0 0.0 0.0 0.0 0.0 0.0 0.0 0.0 0.0 24 25 Credit unions 0.0 0.0 0.0 0.0 0.0 0.0 0.0 0.0 0.0 0.0 0.0 25
26 Property-casualty insurance companies 9.8 7.9 8.8 7.4 8.0 7.4 6.6 6.9 8.0 7.3 8.0 26 27 Life insurance companies 49.8 40.9 29.7 43.6 46.7 39.3 39.7 44.4 46.7 46.2 44.6 27
28 Private pension funds 42.2 40.2 42.6 37.8 34.4 38.4 38.1 36.1 34.4 35.4 36.1 28 29 State and local govt. retirement funds 37.4 41.9 44.0 42.6 51.5 44.5 45.0 46.8 51.5 48.0 48.6 29
30 Money market mutual funds 510.5 394.2 354.2 340.8 352.1 350.9 356.2 358.2 352.1 354.4 341.2 30 31 Mutual funds 80.2 66.3 40.0 77.5 105.2 98.5 100.6 104.6 105.2 113.9 128.9 31
32 Government-sponsored enterprises 9.7 9.9 6.5 3.4 4.4 4.2 4.3 5.0 4.4 4.8 5.7 32 33 Brokers and dealers 41.5 36.2 42.1 29.9 28.7 30.0 29.4 31.0 28.7 34.4 32.4 33 34 Funding corporations 72.0 126.7 120.5 103.0 88.9 119.5 108.6 114.9 88.9 116.2 127.2 34
(1) Excludes banks’ holdings of own acceptances.
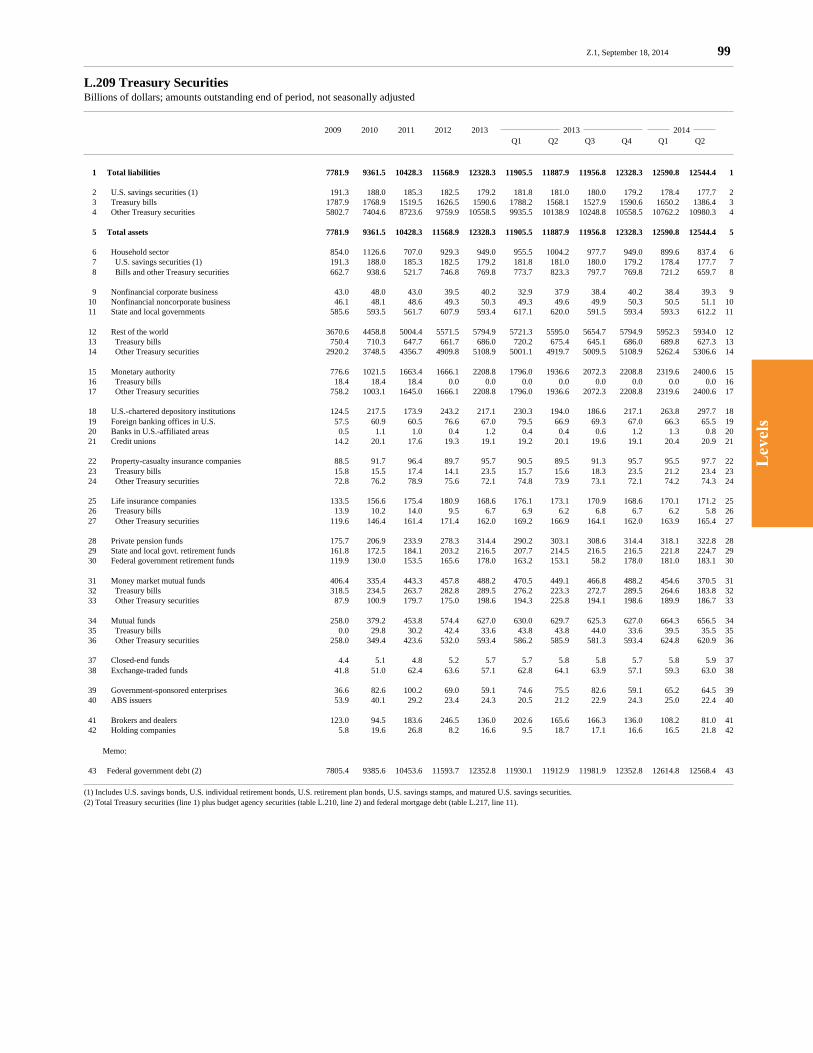
Lev
els
Z.1, September 18, 2014 99
L.209 Treasury SecuritiesBillions of dollars; amounts outstanding end of period, not seasonally adjusted
2009 2010 2011 2012 2013 2013 2014 Q1 Q2 Q3 Q4 Q1 Q2
1 Total liabilities 7781.9 9361.5 10428.3 11568.9 12328.3 11905.5 11887.9 11956.8 12328.3 12590.8 12544.4 1
2 U.S. savings securities (1) 191.3 188.0 185.3 182.5 179.2 181.8 181.0 180.0 179.2 178.4 177.7 2 3 Treasury bills 1787.9 1768.9 1519.5 1626.5 1590.6 1788.2 1568.1 1527.9 1590.6 1650.2 1386.4 3 4 Other Treasury securities 5802.7 7404.6 8723.6 9759.9 10558.5 9935.5 10138.9 10248.8 10558.5 10762.2 10980.3 4
5 Total assets 7781.9 9361.5 10428.3 11568.9 12328.3 11905.5 11887.9 11956.8 12328.3 12590.8 12544.4 5
6 Household sector 854.0 1126.6 707.0 929.3 949.0 955.5 1004.2 977.7 949.0 899.6 837.4 6 7 U.S. savings securities (1) 191.3 188.0 185.3 182.5 179.2 181.8 181.0 180.0 179.2 178.4 177.7 7 8 Bills and other Treasury securities 662.7 938.6 521.7 746.8 769.8 773.7 823.3 797.7 769.8 721.2 659.7 8
9 Nonfinancial corporate business 43.0 48.0 43.0 39.5 40.2 32.9 37.9 38.4 40.2 38.4 39.3 9 10 Nonfinancial noncorporate business 46.1 48.1 48.6 49.3 50.3 49.3 49.6 49.9 50.3 50.5 51.1 10 11 State and local governments 585.6 593.5 561.7 607.9 593.4 617.1 620.0 591.5 593.4 593.3 612.2 11
12 Rest of the world 3670.6 4458.8 5004.4 5571.5 5794.9 5721.3 5595.0 5654.7 5794.9 5952.3 5934.0 12 13 Treasury bills 750.4 710.3 647.7 661.7 686.0 720.2 675.4 645.1 686.0 689.8 627.3 13 14 Other Treasury securities 2920.2 3748.5 4356.7 4909.8 5108.9 5001.1 4919.7 5009.5 5108.9 5262.4 5306.6 14
15 Monetary authority 776.6 1021.5 1663.4 1666.1 2208.8 1796.0 1936.6 2072.3 2208.8 2319.6 2400.6 15 16 Treasury bills 18.4 18.4 18.4 0.0 0.0 0.0 0.0 0.0 0.0 0.0 0.0 16 17 Other Treasury securities 758.2 1003.1 1645.0 1666.1 2208.8 1796.0 1936.6 2072.3 2208.8 2319.6 2400.6 17
18 U.S.-chartered depository institutions 124.5 217.5 173.9 243.2 217.1 230.3 194.0 186.6 217.1 263.8 297.7 18 19 Foreign banking offices in U.S. 57.5 60.9 60.5 76.6 67.0 79.5 66.9 69.3 67.0 66.3 65.5 19 20 Banks in U.S.-affiliated areas 0.5 1.1 1.0 0.4 1.2 0.4 0.4 0.6 1.2 1.3 0.8 20 21 Credit unions 14.2 20.1 17.6 19.3 19.1 19.2 20.1 19.6 19.1 20.4 20.9 21
22 Property-casualty insurance companies 88.5 91.7 96.4 89.7 95.7 90.5 89.5 91.3 95.7 95.5 97.7 22 23 Treasury bills 15.8 15.5 17.4 14.1 23.5 15.7 15.6 18.3 23.5 21.2 23.4 23 24 Other Treasury securities 72.8 76.2 78.9 75.6 72.1 74.8 73.9 73.1 72.1 74.2 74.3 24
25 Life insurance companies 133.5 156.6 175.4 180.9 168.6 176.1 173.1 170.9 168.6 170.1 171.2 25 26 Treasury bills 13.9 10.2 14.0 9.5 6.7 6.9 6.2 6.8 6.7 6.2 5.8 26 27 Other Treasury securities 119.6 146.4 161.4 171.4 162.0 169.2 166.9 164.1 162.0 163.9 165.4 27
28 Private pension funds 175.7 206.9 233.9 278.3 314.4 290.2 303.1 308.6 314.4 318.1 322.8 28 29 State and local govt. retirement funds 161.8 172.5 184.1 203.2 216.5 207.7 214.5 216.5 216.5 221.8 224.7 29 30 Federal government retirement funds 119.9 130.0 153.5 165.6 178.0 163.2 153.1 58.2 178.0 181.0 183.1 30
31 Money market mutual funds 406.4 335.4 443.3 457.8 488.2 470.5 449.1 466.8 488.2 454.6 370.5 31 32 Treasury bills 318.5 234.5 263.7 282.8 289.5 276.2 223.3 272.7 289.5 264.6 183.8 32 33 Other Treasury securities 87.9 100.9 179.7 175.0 198.6 194.3 225.8 194.1 198.6 189.9 186.7 33
34 Mutual funds 258.0 379.2 453.8 574.4 627.0 630.0 629.7 625.3 627.0 664.3 656.5 34 35 Treasury bills 0.0 29.8 30.2 42.4 33.6 43.8 43.8 44.0 33.6 39.5 35.5 35 36 Other Treasury securities 258.0 349.4 423.6 532.0 593.4 586.2 585.9 581.3 593.4 624.8 620.9 36
37 Closed-end funds 4.4 5.1 4.8 5.2 5.7 5.7 5.8 5.8 5.7 5.8 5.9 37 38 Exchange-traded funds 41.8 51.0 62.4 63.6 57.1 62.8 64.1 63.9 57.1 59.3 63.0 38
39 Government-sponsored enterprises 36.6 82.6 100.2 69.0 59.1 74.6 75.5 82.6 59.1 65.2 64.5 39 40 ABS issuers 53.9 40.1 29.2 23.4 24.3 20.5 21.2 22.9 24.3 25.0 22.4 40
41 Brokers and dealers 123.0 94.5 183.6 246.5 136.0 202.6 165.6 166.3 136.0 108.2 81.0 41 42 Holding companies 5.8 19.6 26.8 8.2 16.6 9.5 18.7 17.1 16.6 16.5 21.8 42
Memo:
43 Federal government debt (2) 7805.4 9385.6 10453.6 11593.7 12352.8 11930.1 11912.9 11981.9 12352.8 12614.8 12568.4 43
(1) Includes U.S. savings bonds, U.S. individual retirement bonds, U.S. retirement plan bonds, U.S. savings stamps, and matured U.S. savings securities.(2) Total Treasury securities (line 1) plus budget agency securities (table L.210, line 2) and federal mortgage debt (table L.217, line 11).

Lev
els
100 Z.1, September 18, 2014
L.210 Agency- and GSE-Backed Securities (1)Billions of dollars; amounts outstanding end of period, not seasonally adjusted
2009 2010 2011 2012 2013 2013 2014 Q1 Q2 Q3 Q4 Q1 Q2
1 Total liabilities 8106.8 7598.2 7577.4 7554.6 7794.1 7590.8 7660.7 7713.6 7794.1 7721.1 7774.6 1
2 Budget agencies 23.5 24.2 25.3 24.9 24.5 24.6 25.0 25.1 24.5 24.0 24.0 2 3 Government-sponsored enterprises 2706.6 6434.5 6247.3 6092.7 6200.2 6103.5 6137.6 6147.7 6200.2 6111.4 6150.6 3 4 Agency- and GSE-backed mortgage pools 5376.7 1139.5 1304.8 1437.0 1569.4 1462.7 1498.1 1540.8 1569.4 1585.8 1600.0 4
5 Total assets 8106.8 7598.2 7577.4 7554.6 7794.1 7590.8 7660.7 7713.6 7794.1 7721.1 7774.6 5
6 Household sector 357.4 335.4 300.2 152.7 97.7 95.9 106.3 94.8 97.7 1.2 3.7 6 7 Nonfinancial corporate business 14.3 16.0 14.3 13.2 9.4 6.0 7.6 7.8 9.4 10.8 13.1 7
8 State and local governments 490.2 513.9 507.0 504.7 490.9 509.3 504.7 496.1 490.9 492.6 497.5 8 9 Federal government 196.4 149.2 31.1 0.0 0.0 0.0 0.0 0.0 0.0 0.0 0.0 9
10 Rest of the world 1150.0 1095.8 1078.2 1001.2 885.3 957.3 904.1 926.0 885.3 860.6 851.1 10 11 Monetary authority 1068.3 1139.6 941.7 1003.4 1547.4 1143.4 1277.3 1402.7 1547.4 1650.5 1707.6 11
12 U.S.-chartered depository institutions 1417.4 1527.2 1634.1 1669.6 1717.3 1710.5 1725.7 1700.4 1717.3 1731.0 1724.9 12 13 Foreign banking offices in U.S. 31.3 26.5 30.6 32.1 25.4 27.7 26.1 26.2 25.4 22.5 21.0 13 14 Banks in U.S.-affiliated areas 20.5 12.8 4.8 2.6 1.9 2.4 2.2 1.9 1.9 1.8 1.8 14 15 Credit unions 110.7 151.5 182.1 197.0 199.2 206.2 210.2 206.0 199.2 202.0 199.5 15
16 Property-casualty insurance companies 116.2 115.8 122.7 114.3 108.7 113.0 111.6 110.2 108.7 106.7 105.5 16 17 Life insurance companies 371.9 376.0 374.4 360.9 354.1 359.5 358.1 355.4 354.1 351.6 348.8 17
18 Private pension funds 177.5 184.0 188.3 210.4 225.6 213.9 218.0 221.6 225.6 224.3 228.4 18 19 State and local govt. retirement funds 168.7 169.6 182.0 202.9 216.4 206.6 213.7 215.2 216.4 218.6 219.5 19 20 Federal government retirement funds 5.2 5.8 6.5 8.1 6.4 7.5 7.0 6.6 6.4 5.7 5.8 20
21 Money market mutual funds 543.0 402.8 403.7 343.5 361.1 325.5 344.9 354.3 361.1 326.2 327.8 21 22 Mutual funds 603.2 681.3 787.5 877.0 855.4 879.4 872.2 852.0 855.4 838.8 828.3 22 23 Government-sponsored enterprises 924.5 377.0 358.9 310.6 287.9 300.6 292.5 294.7 287.9 283.6 285.6 23
24 ABS issuers 99.6 3.6 0.3 0.3 0.1 0.2 0.1 0.1 0.1 0.1 0.2 24 25 REITs 105.2 143.4 248.1 357.6 261.9 345.9 327.5 306.9 261.9 253.1 264.1 25
26 Brokers and dealers 110.9 149.8 147.7 169.6 114.2 153.9 125.8 105.7 114.2 113.3 114.2 26 27 Holding companies 24.3 21.1 33.1 22.9 28.0 26.0 25.0 29.1 28.0 26.1 26.4 27
(1) Agency- and GSE-backed securities include: issues of federal budget agencies (line 2) such as those for the TVA; issues of government sponsored enterprises (line 3) such as Fannie Mae and FHLB; and agency- and GSE-backed mortgage pool securities issued by GNMA, Fannie Mae, Freddie Mac, and the Farmers Home Administration (line 4). Only the budget agency issues are considered officially to be part of the total debt of the federal government, which is shown in table L.209, line 43.

Lev
els
Z.1, September 18, 2014 101
L.211 Municipal Securities and LoansBillions of dollars; amounts outstanding end of period, not seasonally adjusted
2009 2010 2011 2012 2013 2013 2014 Q1 Q2 Q3 Q4 Q1 Q2
1 Total liabilities 3672.5 3772.1 3719.4 3714.4 3671.2 3728.6 3721.1 3685.7 3671.2 3660.8 3661.4 1
2 State and local governments 2954.9 3023.6 2970.0 2964.3 2924.9 2978.9 2970.4 2937.0 2924.9 2915.5 2918.0 2 3 Short-term (1) 63.6 63.0 52.3 56.1 45.3 54.5 39.4 46.0 45.3 43.0 33.6 3 4 Long-term 2891.3 2960.6 2917.6 2908.2 2879.6 2924.4 2931.0 2891.0 2879.6 2872.5 2884.4 4
5 Nonprofit organizations (2) 265.4 263.2 255.5 241.0 227.8 239.4 235.7 232.4 227.8 227.6 227.0 5 6 Nonfinancial corporate business 452.2 485.4 493.9 509.1 518.5 510.4 515.0 516.4 518.5 517.7 516.4 6 (industrial revenue bonds)
7 Total assets 3672.5 3772.1 3719.4 3714.4 3671.2 3728.6 3721.1 3685.7 3671.2 3660.8 3661.4 7
8 Household sector 1827.9 1871.5 1805.9 1661.0 1617.7 1669.0 1664.7 1640.2 1617.7 1608.7 1602.4 8 9 Nonfinancial corporate business 27.1 23.9 22.3 24.0 12.1 14.5 14.5 14.6 12.1 10.3 10.1 9 10 Nonfinancial noncorporate business 5.1 5.6 5.7 5.8 5.9 5.8 5.8 5.8 5.9 5.9 6.0 10
11 State and local governments 11.5 12.9 13.2 13.7 13.9 14.0 14.0 13.9 13.9 14.1 14.4 11 12 Rest of the world 58.7 71.7 72.4 71.8 76.1 72.5 73.5 74.9 76.1 76.9 77.4 12
13 U.S.-chartered depository institutions 224.3 254.6 297.3 365.0 418.9 376.2 392.3 406.4 418.9 425.2 429.9 13 14 Foreign banking offices in U.S. 0.0 0.0 0.0 0.0 0.0 0.0 0.0 0.0 0.0 0.0 0.0 14 15 Banks in U.S.-affiliated areas 3.5 2.5 3.4 2.6 3.6 2.7 2.7 3.5 3.6 3.4 2.7 15 16 Credit unions 0.0 0.0 3.2 4.2 4.6 5.3 5.0 5.4 4.6 4.5 4.9 16
17 Property-casualty insurance companies 369.4 348.4 331.0 328.1 325.8 327.8 327.4 326.8 325.8 325.8 325.8 17 18 Life insurance companies 73.1 112.3 121.8 131.5 141.6 134.1 136.8 138.8 141.6 143.9 146.8 18 19 State and local govt. retirement funds 1.5 2.3 1.6 0.9 1.2 0.8 1.2 1.1 1.2 1.0 1.0 19
20 Money market mutual funds 440.1 386.7 357.3 336.7 308.3 312.6 309.6 305.2 308.3 296.4 281.4 20 21 Mutual funds 478.8 525.5 541.2 627.4 613.9 646.6 641.0 620.7 613.9 618.2 629.8 21 22 Closed-end funds 81.2 81.6 82.5 85.9 84.2 86.4 86.2 84.8 84.2 85.1 85.7 22 23 Exchange-traded funds 5.9 7.6 8.6 12.3 11.4 13.0 12.5 11.5 11.4 11.8 12.6 23
24 Government-sponsored enterprises 29.1 24.9 21.0 17.0 13.4 16.3 14.8 13.8 13.4 12.7 12.2 24 25 Brokers and dealers 35.4 40.0 30.9 26.6 18.6 31.0 19.0 18.3 18.6 16.9 18.2 25
(1) Debt with original maturity of 13 months or less.(2) Liability of the households and nonprofit organizations sector (tables F.100 and L.100).
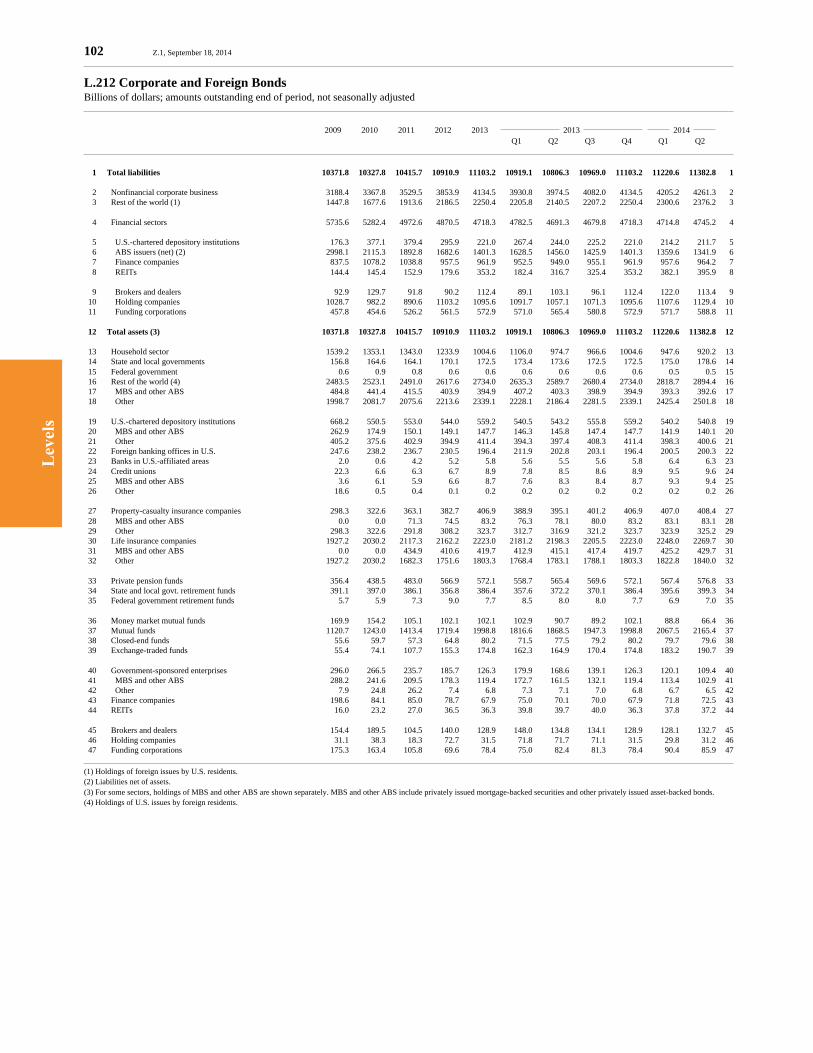
Lev
els
102 Z.1, September 18, 2014
L.212 Corporate and Foreign BondsBillions of dollars; amounts outstanding end of period, not seasonally adjusted
2009 2010 2011 2012 2013 2013 2014 Q1 Q2 Q3 Q4 Q1 Q2
1 Total liabilities 10371.8 10327.8 10415.7 10910.9 11103.2 10919.1 10806.3 10969.0 11103.2 11220.6 11382.8 1
2 Nonfinancial corporate business 3188.4 3367.8 3529.5 3853.9 4134.5 3930.8 3974.5 4082.0 4134.5 4205.2 4261.3 2 3 Rest of the world (1) 1447.8 1677.6 1913.6 2186.5 2250.4 2205.8 2140.5 2207.2 2250.4 2300.6 2376.2 3
4 Financial sectors 5735.6 5282.4 4972.6 4870.5 4718.3 4782.5 4691.3 4679.8 4718.3 4714.8 4745.2 4
5 U.S.-chartered depository institutions 176.3 377.1 379.4 295.9 221.0 267.4 244.0 225.2 221.0 214.2 211.7 5 6 ABS issuers (net) (2) 2998.1 2115.3 1892.8 1682.6 1401.3 1628.5 1456.0 1425.9 1401.3 1359.6 1341.9 6 7 Finance companies 837.5 1078.2 1038.8 957.5 961.9 952.5 949.0 955.1 961.9 957.6 964.2 7 8 REITs 144.4 145.4 152.9 179.6 353.2 182.4 316.7 325.4 353.2 382.1 395.9 8
9 Brokers and dealers 92.9 129.7 91.8 90.2 112.4 89.1 103.1 96.1 112.4 122.0 113.4 9 10 Holding companies 1028.7 982.2 890.6 1103.2 1095.6 1091.7 1057.1 1071.3 1095.6 1107.6 1129.4 10 11 Funding corporations 457.8 454.6 526.2 561.5 572.9 571.0 565.4 580.8 572.9 571.7 588.8 11
12 Total assets (3) 10371.8 10327.8 10415.7 10910.9 11103.2 10919.1 10806.3 10969.0 11103.2 11220.6 11382.8 12
13 Household sector 1539.2 1353.1 1343.0 1233.9 1004.6 1106.0 974.7 966.6 1004.6 947.6 920.2 13 14 State and local governments 156.8 164.6 164.1 170.1 172.5 173.4 173.6 172.5 172.5 175.0 178.6 14 15 Federal government 0.6 0.9 0.8 0.6 0.6 0.6 0.6 0.6 0.6 0.5 0.5 15 16 Rest of the world (4) 2483.5 2523.1 2491.0 2617.6 2734.0 2635.3 2589.7 2680.4 2734.0 2818.7 2894.4 16 17 MBS and other ABS 484.8 441.4 415.5 403.9 394.9 407.2 403.3 398.9 394.9 393.3 392.6 17 18 Other 1998.7 2081.7 2075.6 2213.6 2339.1 2228.1 2186.4 2281.5 2339.1 2425.4 2501.8 18
19 U.S.-chartered depository institutions 668.2 550.5 553.0 544.0 559.2 540.5 543.2 555.8 559.2 540.2 540.8 19 20 MBS and other ABS 262.9 174.9 150.1 149.1 147.7 146.3 145.8 147.4 147.7 141.9 140.1 20 21 Other 405.2 375.6 402.9 394.9 411.4 394.3 397.4 408.3 411.4 398.3 400.6 21 22 Foreign banking offices in U.S. 247.6 238.2 236.7 230.5 196.4 211.9 202.8 203.1 196.4 200.5 200.3 22 23 Banks in U.S.-affiliated areas 2.0 0.6 4.2 5.2 5.8 5.6 5.5 5.6 5.8 6.4 6.3 23 24 Credit unions 22.3 6.6 6.3 6.7 8.9 7.8 8.5 8.6 8.9 9.5 9.6 24 25 MBS and other ABS 3.6 6.1 5.9 6.6 8.7 7.6 8.3 8.4 8.7 9.3 9.4 25 26 Other 18.6 0.5 0.4 0.1 0.2 0.2 0.2 0.2 0.2 0.2 0.2 26
27 Property-casualty insurance companies 298.3 322.6 363.1 382.7 406.9 388.9 395.1 401.2 406.9 407.0 408.4 27 28 MBS and other ABS 0.0 0.0 71.3 74.5 83.2 76.3 78.1 80.0 83.2 83.1 83.1 28 29 Other 298.3 322.6 291.8 308.2 323.7 312.7 316.9 321.2 323.7 323.9 325.2 29 30 Life insurance companies 1927.2 2030.2 2117.3 2162.2 2223.0 2181.2 2198.3 2205.5 2223.0 2248.0 2269.7 30 31 MBS and other ABS 0.0 0.0 434.9 410.6 419.7 412.9 415.1 417.4 419.7 425.2 429.7 31 32 Other 1927.2 2030.2 1682.3 1751.6 1803.3 1768.4 1783.1 1788.1 1803.3 1822.8 1840.0 32
33 Private pension funds 356.4 438.5 483.0 566.9 572.1 558.7 565.4 569.6 572.1 567.4 576.8 33 34 State and local govt. retirement funds 391.1 397.0 386.1 356.8 386.4 357.6 372.2 370.1 386.4 395.6 399.3 34 35 Federal government retirement funds 5.7 5.9 7.3 9.0 7.7 8.5 8.0 8.0 7.7 6.9 7.0 35
36 Money market mutual funds 169.9 154.2 105.1 102.1 102.1 102.9 90.7 89.2 102.1 88.8 66.4 36 37 Mutual funds 1120.7 1243.0 1413.4 1719.4 1998.8 1816.6 1868.5 1947.3 1998.8 2067.5 2165.4 37 38 Closed-end funds 55.6 59.7 57.3 64.8 80.2 71.5 77.5 79.2 80.2 79.7 79.6 38 39 Exchange-traded funds 55.4 74.1 107.7 155.3 174.8 162.3 164.9 170.4 174.8 183.2 190.7 39
40 Government-sponsored enterprises 296.0 266.5 235.7 185.7 126.3 179.9 168.6 139.1 126.3 120.1 109.4 40 41 MBS and other ABS 288.2 241.6 209.5 178.3 119.4 172.7 161.5 132.1 119.4 113.4 102.9 41 42 Other 7.9 24.8 26.2 7.4 6.8 7.3 7.1 7.0 6.8 6.7 6.5 42 43 Finance companies 198.6 84.1 85.0 78.7 67.9 75.0 70.1 70.0 67.9 71.8 72.5 43 44 REITs 16.0 23.2 27.0 36.5 36.3 39.8 39.7 40.0 36.3 37.8 37.2 44
45 Brokers and dealers 154.4 189.5 104.5 140.0 128.9 148.0 134.8 134.1 128.9 128.1 132.7 45 46 Holding companies 31.1 38.3 18.3 72.7 31.5 71.8 71.7 71.1 31.5 29.8 31.2 46 47 Funding corporations 175.3 163.4 105.8 69.6 78.4 75.0 82.4 81.3 78.4 90.4 85.9 47
(1) Holdings of foreign issues by U.S. residents.(2) Liabilities net of assets.(3) For some sectors, holdings of MBS and other ABS are shown separately. MBS and other ABS include privately issued mortgage-backed securities and other privately issued asset-backed bonds.(4) Holdings of U.S. issues by foreign residents.
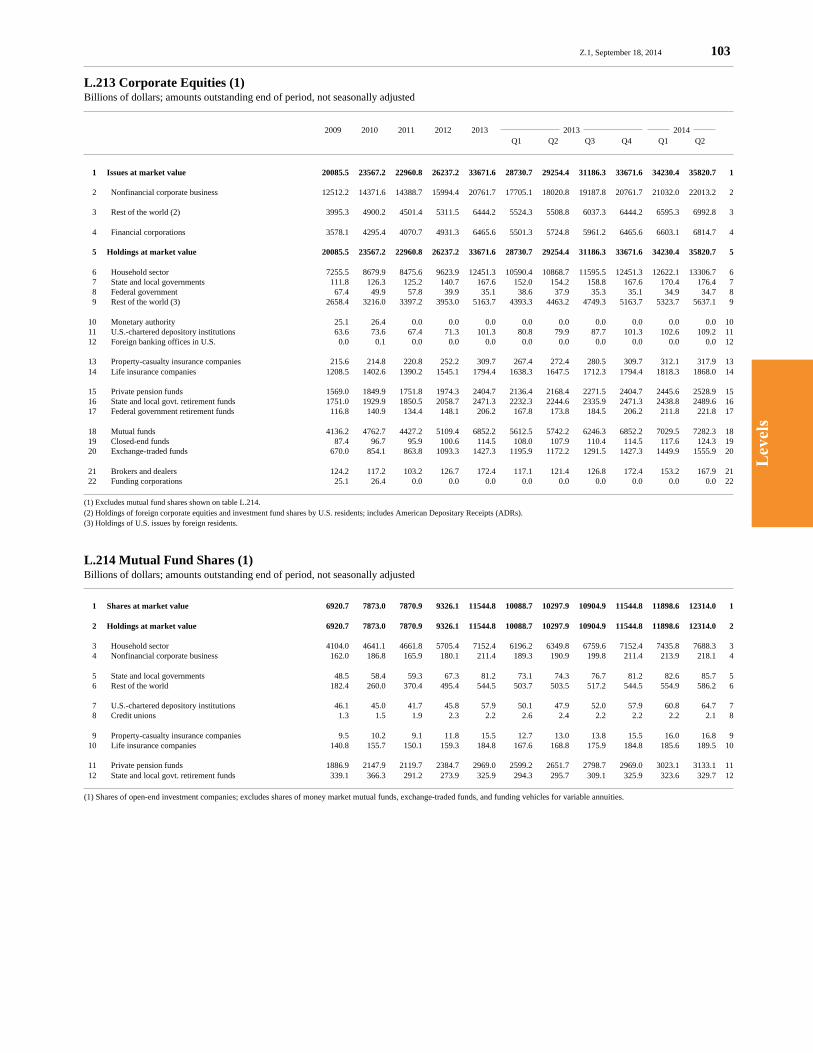
Lev
els
Z.1, September 18, 2014 103
L.213 Corporate Equities (1)Billions of dollars; amounts outstanding end of period, not seasonally adjusted
2009 2010 2011 2012 2013 2013 2014 Q1 Q2 Q3 Q4 Q1 Q2
1 Issues at market value 20085.5 23567.2 22960.8 26237.2 33671.6 28730.7 29254.4 31186.3 33671.6 34230.4 35820.7 1
2 Nonfinancial corporate business 12512.2 14371.6 14388.7 15994.4 20761.7 17705.1 18020.8 19187.8 20761.7 21032.0 22013.2 2
3 Rest of the world (2) 3995.3 4900.2 4501.4 5311.5 6444.2 5524.3 5508.8 6037.3 6444.2 6595.3 6992.8 3
4 Financial corporations 3578.1 4295.4 4070.7 4931.3 6465.6 5501.3 5724.8 5961.2 6465.6 6603.1 6814.7 4
5 Holdings at market value 20085.5 23567.2 22960.8 26237.2 33671.6 28730.7 29254.4 31186.3 33671.6 34230.4 35820.7 5
6 Household sector 7255.5 8679.9 8475.6 9623.9 12451.3 10590.4 10868.7 11595.5 12451.3 12622.1 13306.7 6 7 State and local governments 111.8 126.3 125.2 140.7 167.6 152.0 154.2 158.8 167.6 170.4 176.4 7 8 Federal government 67.4 49.9 57.8 39.9 35.1 38.6 37.9 35.3 35.1 34.9 34.7 8 9 Rest of the world (3) 2658.4 3216.0 3397.2 3953.0 5163.7 4393.3 4463.2 4749.3 5163.7 5323.7 5637.1 9
10 Monetary authority 25.1 26.4 0.0 0.0 0.0 0.0 0.0 0.0 0.0 0.0 0.0 10 11 U.S.-chartered depository institutions 63.6 73.6 67.4 71.3 101.3 80.8 79.9 87.7 101.3 102.6 109.2 11 12 Foreign banking offices in U.S. 0.0 0.1 0.0 0.0 0.0 0.0 0.0 0.0 0.0 0.0 0.0 12
13 Property-casualty insurance companies 215.6 214.8 220.8 252.2 309.7 267.4 272.4 280.5 309.7 312.1 317.9 13 14 Life insurance companies 1208.5 1402.6 1390.2 1545.1 1794.4 1638.3 1647.5 1712.3 1794.4 1818.3 1868.0 14
15 Private pension funds 1569.0 1849.9 1751.8 1974.3 2404.7 2136.4 2168.4 2271.5 2404.7 2445.6 2528.9 15 16 State and local govt. retirement funds 1751.0 1929.9 1850.5 2058.7 2471.3 2232.3 2244.6 2335.9 2471.3 2438.8 2489.6 16 17 Federal government retirement funds 116.8 140.9 134.4 148.1 206.2 167.8 173.8 184.5 206.2 211.8 221.8 17
18 Mutual funds 4136.2 4762.7 4427.2 5109.4 6852.2 5612.5 5742.2 6246.3 6852.2 7029.5 7282.3 18 19 Closed-end funds 87.4 96.7 95.9 100.6 114.5 108.0 107.9 110.4 114.5 117.6 124.3 19 20 Exchange-traded funds 670.0 854.1 863.8 1093.3 1427.3 1195.9 1172.2 1291.5 1427.3 1449.9 1555.9 20
21 Brokers and dealers 124.2 117.2 103.2 126.7 172.4 117.1 121.4 126.8 172.4 153.2 167.9 21 22 Funding corporations 25.1 26.4 0.0 0.0 0.0 0.0 0.0 0.0 0.0 0.0 0.0 22
(1) Excludes mutual fund shares shown on table L.214.(2) Holdings of foreign corporate equities and investment fund shares by U.S. residents; includes American Depositary Receipts (ADRs).(3) Holdings of U.S. issues by foreign residents.
L.214 Mutual Fund Shares (1)Billions of dollars; amounts outstanding end of period, not seasonally adjusted
1 Shares at market value 6920.7 7873.0 7870.9 9326.1 11544.8 10088.7 10297.9 10904.9 11544.8 11898.6 12314.0 1
2 Holdings at market value 6920.7 7873.0 7870.9 9326.1 11544.8 10088.7 10297.9 10904.9 11544.8 11898.6 12314.0 2
3 Household sector 4104.0 4641.1 4661.8 5705.4 7152.4 6196.2 6349.8 6759.6 7152.4 7435.8 7688.3 3 4 Nonfinancial corporate business 162.0 186.8 165.9 180.1 211.4 189.3 190.9 199.8 211.4 213.9 218.1 4
5 State and local governments 48.5 58.4 59.3 67.3 81.2 73.1 74.3 76.7 81.2 82.6 85.7 5 6 Rest of the world 182.4 260.0 370.4 495.4 544.5 503.7 503.5 517.2 544.5 554.9 586.2 6
7 U.S.-chartered depository institutions 46.1 45.0 41.7 45.8 57.9 50.1 47.9 52.0 57.9 60.8 64.7 7 8 Credit unions 1.3 1.5 1.9 2.3 2.2 2.6 2.4 2.2 2.2 2.2 2.1 8
9 Property-casualty insurance companies 9.5 10.2 9.1 11.8 15.5 12.7 13.0 13.8 15.5 16.0 16.8 9 10 Life insurance companies 140.8 155.7 150.1 159.3 184.8 167.6 168.8 175.9 184.8 185.6 189.5 10
11 Private pension funds 1886.9 2147.9 2119.7 2384.7 2969.0 2599.2 2651.7 2798.7 2969.0 3023.1 3133.1 11 12 State and local govt. retirement funds 339.1 366.3 291.2 273.9 325.9 294.3 295.7 309.1 325.9 323.6 329.7 12
(1) Shares of open-end investment companies; excludes shares of money market mutual funds, exchange-traded funds, and funding vehicles for variable annuities.
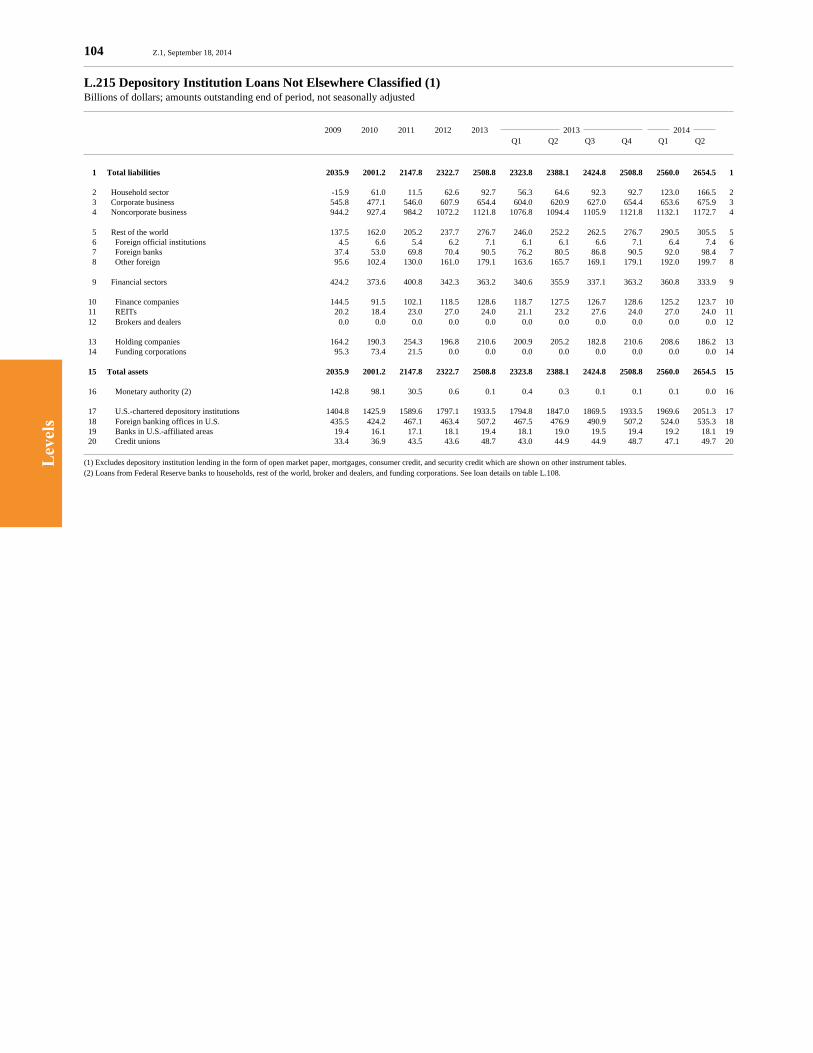
Lev
els
104 Z.1, September 18, 2014
L.215 Depository Institution Loans Not Elsewhere Classified (1)Billions of dollars; amounts outstanding end of period, not seasonally adjusted
2009 2010 2011 2012 2013 2013 2014 Q1 Q2 Q3 Q4 Q1 Q2
1 Total liabilities 2035.9 2001.2 2147.8 2322.7 2508.8 2323.8 2388.1 2424.8 2508.8 2560.0 2654.5 1
2 Household sector -15.9 61.0 11.5 62.6 92.7 56.3 64.6 92.3 92.7 123.0 166.5 2 3 Corporate business 545.8 477.1 546.0 607.9 654.4 604.0 620.9 627.0 654.4 653.6 675.9 3 4 Noncorporate business 944.2 927.4 984.2 1072.2 1121.8 1076.8 1094.4 1105.9 1121.8 1132.1 1172.7 4
5 Rest of the world 137.5 162.0 205.2 237.7 276.7 246.0 252.2 262.5 276.7 290.5 305.5 5 6 Foreign official institutions 4.5 6.6 5.4 6.2 7.1 6.1 6.1 6.6 7.1 6.4 7.4 6 7 Foreign banks 37.4 53.0 69.8 70.4 90.5 76.2 80.5 86.8 90.5 92.0 98.4 7 8 Other foreign 95.6 102.4 130.0 161.0 179.1 163.6 165.7 169.1 179.1 192.0 199.7 8
9 Financial sectors 424.2 373.6 400.8 342.3 363.2 340.6 355.9 337.1 363.2 360.8 333.9 9
10 Finance companies 144.5 91.5 102.1 118.5 128.6 118.7 127.5 126.7 128.6 125.2 123.7 10 11 REITs 20.2 18.4 23.0 27.0 24.0 21.1 23.2 27.6 24.0 27.0 24.0 11 12 Brokers and dealers 0.0 0.0 0.0 0.0 0.0 0.0 0.0 0.0 0.0 0.0 0.0 12
13 Holding companies 164.2 190.3 254.3 196.8 210.6 200.9 205.2 182.8 210.6 208.6 186.2 13 14 Funding corporations 95.3 73.4 21.5 0.0 0.0 0.0 0.0 0.0 0.0 0.0 0.0 14
15 Total assets 2035.9 2001.2 2147.8 2322.7 2508.8 2323.8 2388.1 2424.8 2508.8 2560.0 2654.5 15
16 Monetary authority (2) 142.8 98.1 30.5 0.6 0.1 0.4 0.3 0.1 0.1 0.1 0.0 16
17 U.S.-chartered depository institutions 1404.8 1425.9 1589.6 1797.1 1933.5 1794.8 1847.0 1869.5 1933.5 1969.6 2051.3 17 18 Foreign banking offices in U.S. 435.5 424.2 467.1 463.4 507.2 467.5 476.9 490.9 507.2 524.0 535.3 18 19 Banks in U.S.-affiliated areas 19.4 16.1 17.1 18.1 19.4 18.1 19.0 19.5 19.4 19.2 18.1 19 20 Credit unions 33.4 36.9 43.5 43.6 48.7 43.0 44.9 44.9 48.7 47.1 49.7 20
(1) Excludes depository institution lending in the form of open market paper, mortgages, consumer credit, and security credit which are shown on other instrument tables.(2) Loans from Federal Reserve banks to households, rest of the world, broker and dealers, and funding corporations. See loan details on table L.108.
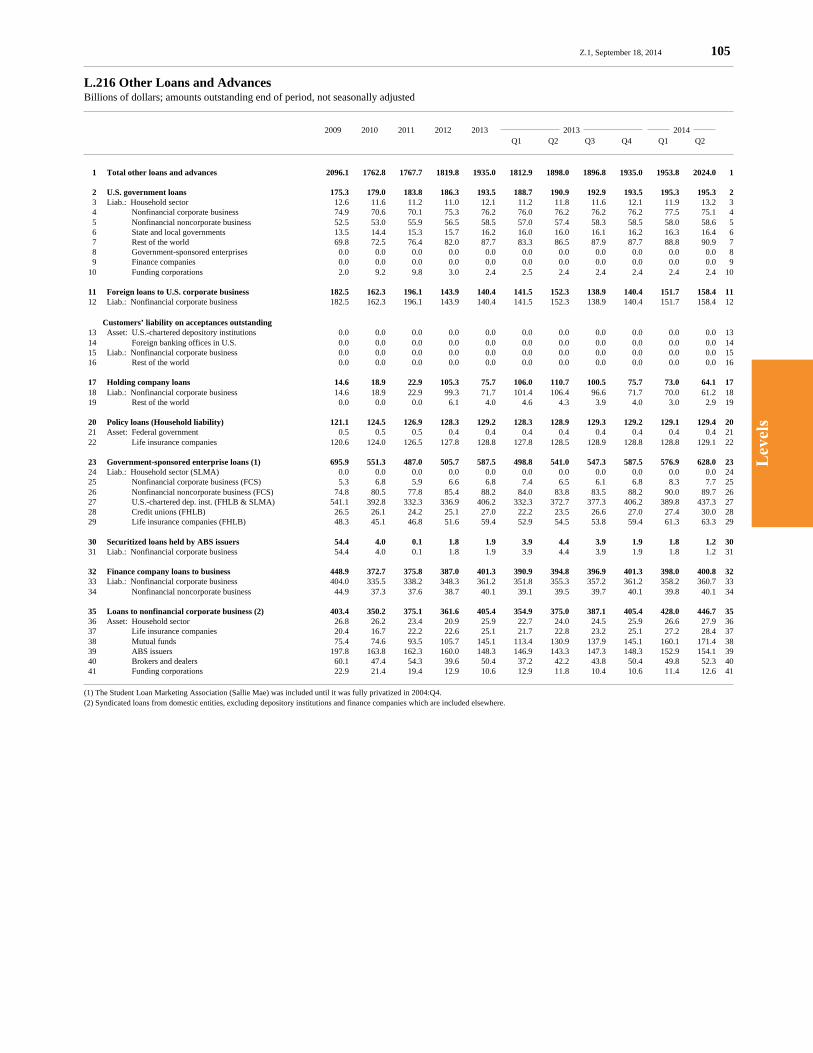
Lev
els
Z.1, September 18, 2014 105
L.216 Other Loans and AdvancesBillions of dollars; amounts outstanding end of period, not seasonally adjusted
2009 2010 2011 2012 2013 2013 2014 Q1 Q2 Q3 Q4 Q1 Q2
1 Total other loans and advances 2096.1 1762.8 1767.7 1819.8 1935.0 1812.9 1898.0 1896.8 1935.0 1953.8 2024.0 1
2 U.S. government loans 175.3 179.0 183.8 186.3 193.5 188.7 190.9 192.9 193.5 195.3 195.3 2 3 Liab.: Household sector 12.6 11.6 11.2 11.0 12.1 11.2 11.8 11.6 12.1 11.9 13.2 3 4 Nonfinancial corporate business 74.9 70.6 70.1 75.3 76.2 76.0 76.2 76.2 76.2 77.5 75.1 4 5 Nonfinancial noncorporate business 52.5 53.0 55.9 56.5 58.5 57.0 57.4 58.3 58.5 58.0 58.6 5 6 State and local governments 13.5 14.4 15.3 15.7 16.2 16.0 16.0 16.1 16.2 16.3 16.4 6 7 Rest of the world 69.8 72.5 76.4 82.0 87.7 83.3 86.5 87.9 87.7 88.8 90.9 7 8 Government-sponsored enterprises 0.0 0.0 0.0 0.0 0.0 0.0 0.0 0.0 0.0 0.0 0.0 8 9 Finance companies 0.0 0.0 0.0 0.0 0.0 0.0 0.0 0.0 0.0 0.0 0.0 9 10 Funding corporations 2.0 9.2 9.8 3.0 2.4 2.5 2.4 2.4 2.4 2.4 2.4 10
11 Foreign loans to U.S. corporate business 182.5 162.3 196.1 143.9 140.4 141.5 152.3 138.9 140.4 151.7 158.4 11 12 Liab.: Nonfinancial corporate business 182.5 162.3 196.1 143.9 140.4 141.5 152.3 138.9 140.4 151.7 158.4 12
Customers’ liability on acceptances outstanding 13 Asset: U.S.-chartered depository institutions 0.0 0.0 0.0 0.0 0.0 0.0 0.0 0.0 0.0 0.0 0.0 13 14 Foreign banking offices in U.S. 0.0 0.0 0.0 0.0 0.0 0.0 0.0 0.0 0.0 0.0 0.0 14 15 Liab.: Nonfinancial corporate business 0.0 0.0 0.0 0.0 0.0 0.0 0.0 0.0 0.0 0.0 0.0 15 16 Rest of the world 0.0 0.0 0.0 0.0 0.0 0.0 0.0 0.0 0.0 0.0 0.0 16
17 Holding company loans 14.6 18.9 22.9 105.3 75.7 106.0 110.7 100.5 75.7 73.0 64.1 17 18 Liab.: Nonfinancial corporate business 14.6 18.9 22.9 99.3 71.7 101.4 106.4 96.6 71.7 70.0 61.2 18 19 Rest of the world 0.0 0.0 0.0 6.1 4.0 4.6 4.3 3.9 4.0 3.0 2.9 19
20 Policy loans (Household liability) 121.1 124.5 126.9 128.3 129.2 128.3 128.9 129.3 129.2 129.1 129.4 20 21 Asset: Federal government 0.5 0.5 0.5 0.4 0.4 0.4 0.4 0.4 0.4 0.4 0.4 21 22 Life insurance companies 120.6 124.0 126.5 127.8 128.8 127.8 128.5 128.9 128.8 128.8 129.1 22
23 Government-sponsored enterprise loans (1) 695.9 551.3 487.0 505.7 587.5 498.8 541.0 547.3 587.5 576.9 628.0 23 24 Liab.: Household sector (SLMA) 0.0 0.0 0.0 0.0 0.0 0.0 0.0 0.0 0.0 0.0 0.0 24 25 Nonfinancial corporate business (FCS) 5.3 6.8 5.9 6.6 6.8 7.4 6.5 6.1 6.8 8.3 7.7 25 26 Nonfinancial noncorporate business (FCS) 74.8 80.5 77.8 85.4 88.2 84.0 83.8 83.5 88.2 90.0 89.7 26 27 U.S.-chartered dep. inst. (FHLB & SLMA) 541.1 392.8 332.3 336.9 406.2 332.3 372.7 377.3 406.2 389.8 437.3 27 28 Credit unions (FHLB) 26.5 26.1 24.2 25.1 27.0 22.2 23.5 26.6 27.0 27.4 30.0 28 29 Life insurance companies (FHLB) 48.3 45.1 46.8 51.6 59.4 52.9 54.5 53.8 59.4 61.3 63.3 29
30 Securitized loans held by ABS issuers 54.4 4.0 0.1 1.8 1.9 3.9 4.4 3.9 1.9 1.8 1.2 30 31 Liab.: Nonfinancial corporate business 54.4 4.0 0.1 1.8 1.9 3.9 4.4 3.9 1.9 1.8 1.2 31
32 Finance company loans to business 448.9 372.7 375.8 387.0 401.3 390.9 394.8 396.9 401.3 398.0 400.8 32 33 Liab.: Nonfinancial corporate business 404.0 335.5 338.2 348.3 361.2 351.8 355.3 357.2 361.2 358.2 360.7 33 34 Nonfinancial noncorporate business 44.9 37.3 37.6 38.7 40.1 39.1 39.5 39.7 40.1 39.8 40.1 34
35 Loans to nonfinancial corporate business (2) 403.4 350.2 375.1 361.6 405.4 354.9 375.0 387.1 405.4 428.0 446.7 35 36 Asset: Household sector 26.8 26.2 23.4 20.9 25.9 22.7 24.0 24.5 25.9 26.6 27.9 36 37 Life insurance companies 20.4 16.7 22.2 22.6 25.1 21.7 22.8 23.2 25.1 27.2 28.4 37 38 Mutual funds 75.4 74.6 93.5 105.7 145.1 113.4 130.9 137.9 145.1 160.1 171.4 38 39 ABS issuers 197.8 163.8 162.3 160.0 148.3 146.9 143.3 147.3 148.3 152.9 154.1 39 40 Brokers and dealers 60.1 47.4 54.3 39.6 50.4 37.2 42.2 43.8 50.4 49.8 52.3 40 41 Funding corporations 22.9 21.4 19.4 12.9 10.6 12.9 11.8 10.4 10.6 11.4 12.6 41
(1) The Student Loan Marketing Association (Sallie Mae) was included until it was fully privatized in 2004:Q4.(2) Syndicated loans from domestic entities, excluding depository institutions and finance companies which are included elsewhere.
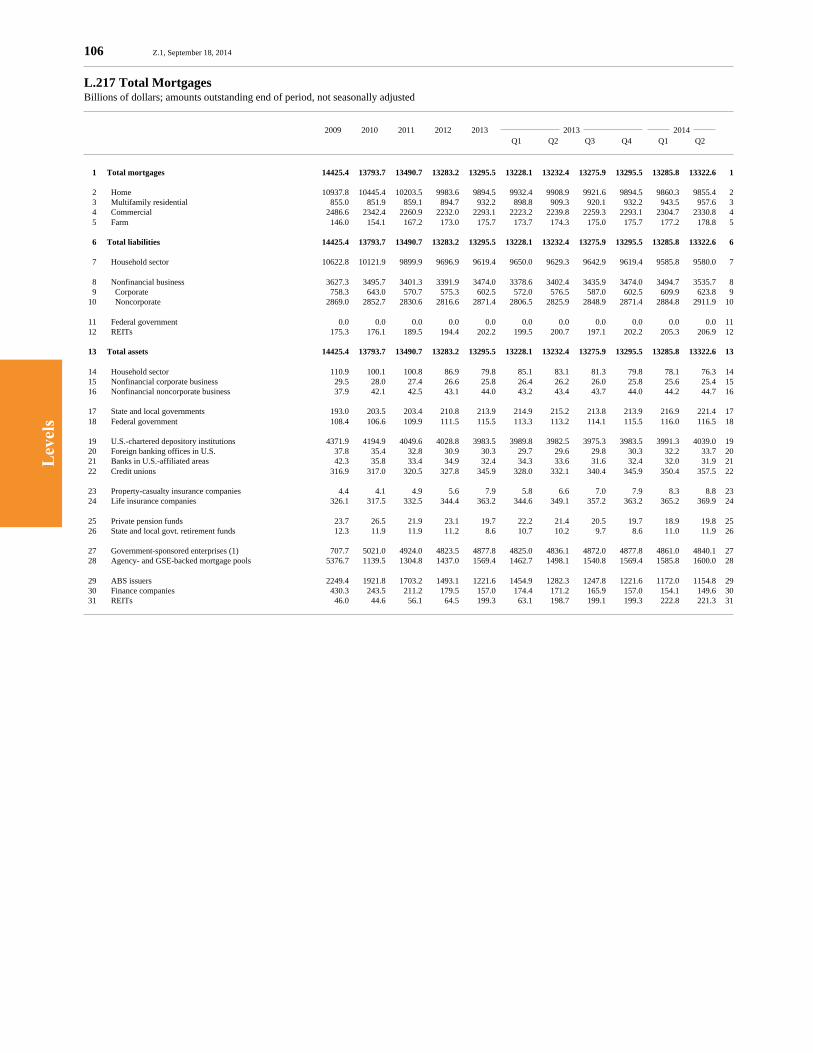
Lev
els
106 Z.1, September 18, 2014
L.217 Total MortgagesBillions of dollars; amounts outstanding end of period, not seasonally adjusted
2009 2010 2011 2012 2013 2013 2014 Q1 Q2 Q3 Q4 Q1 Q2
1 Total mortgages 14425.4 13793.7 13490.7 13283.2 13295.5 13228.1 13232.4 13275.9 13295.5 13285.8 13322.6 1
2 Home 10937.8 10445.4 10203.5 9983.6 9894.5 9932.4 9908.9 9921.6 9894.5 9860.3 9855.4 2 3 Multifamily residential 855.0 851.9 859.1 894.7 932.2 898.8 909.3 920.1 932.2 943.5 957.6 3 4 Commercial 2486.6 2342.4 2260.9 2232.0 2293.1 2223.2 2239.8 2259.3 2293.1 2304.7 2330.8 4 5 Farm 146.0 154.1 167.2 173.0 175.7 173.7 174.3 175.0 175.7 177.2 178.8 5
6 Total liabilities 14425.4 13793.7 13490.7 13283.2 13295.5 13228.1 13232.4 13275.9 13295.5 13285.8 13322.6 6
7 Household sector 10622.8 10121.9 9899.9 9696.9 9619.4 9650.0 9629.3 9642.9 9619.4 9585.8 9580.0 7
8 Nonfinancial business 3627.3 3495.7 3401.3 3391.9 3474.0 3378.6 3402.4 3435.9 3474.0 3494.7 3535.7 8 9 Corporate 758.3 643.0 570.7 575.3 602.5 572.0 576.5 587.0 602.5 609.9 623.8 9 10 Noncorporate 2869.0 2852.7 2830.6 2816.6 2871.4 2806.5 2825.9 2848.9 2871.4 2884.8 2911.9 10
11 Federal government 0.0 0.0 0.0 0.0 0.0 0.0 0.0 0.0 0.0 0.0 0.0 11 12 REITs 175.3 176.1 189.5 194.4 202.2 199.5 200.7 197.1 202.2 205.3 206.9 12
13 Total assets 14425.4 13793.7 13490.7 13283.2 13295.5 13228.1 13232.4 13275.9 13295.5 13285.8 13322.6 13
14 Household sector 110.9 100.1 100.8 86.9 79.8 85.1 83.1 81.3 79.8 78.1 76.3 14 15 Nonfinancial corporate business 29.5 28.0 27.4 26.6 25.8 26.4 26.2 26.0 25.8 25.6 25.4 15 16 Nonfinancial noncorporate business 37.9 42.1 42.5 43.1 44.0 43.2 43.4 43.7 44.0 44.2 44.7 16
17 State and local governments 193.0 203.5 203.4 210.8 213.9 214.9 215.2 213.8 213.9 216.9 221.4 17 18 Federal government 108.4 106.6 109.9 111.5 115.5 113.3 113.2 114.1 115.5 116.0 116.5 18
19 U.S.-chartered depository institutions 4371.9 4194.9 4049.6 4028.8 3983.5 3989.8 3982.5 3975.3 3983.5 3991.3 4039.0 19 20 Foreign banking offices in U.S. 37.8 35.4 32.8 30.9 30.3 29.7 29.6 29.8 30.3 32.2 33.7 20 21 Banks in U.S.-affiliated areas 42.3 35.8 33.4 34.9 32.4 34.3 33.6 31.6 32.4 32.0 31.9 21 22 Credit unions 316.9 317.0 320.5 327.8 345.9 328.0 332.1 340.4 345.9 350.4 357.5 22
23 Property-casualty insurance companies 4.4 4.1 4.9 5.6 7.9 5.8 6.6 7.0 7.9 8.3 8.8 23 24 Life insurance companies 326.1 317.5 332.5 344.4 363.2 344.6 349.1 357.2 363.2 365.2 369.9 24
25 Private pension funds 23.7 26.5 21.9 23.1 19.7 22.2 21.4 20.5 19.7 18.9 19.8 25 26 State and local govt. retirement funds 12.3 11.9 11.9 11.2 8.6 10.7 10.2 9.7 8.6 11.0 11.9 26
27 Government-sponsored enterprises (1) 707.7 5021.0 4924.0 4823.5 4877.8 4825.0 4836.1 4872.0 4877.8 4861.0 4840.1 27 28 Agency- and GSE-backed mortgage pools 5376.7 1139.5 1304.8 1437.0 1569.4 1462.7 1498.1 1540.8 1569.4 1585.8 1600.0 28
29 ABS issuers 2249.4 1921.8 1703.2 1493.1 1221.6 1454.9 1282.3 1247.8 1221.6 1172.0 1154.8 29 30 Finance companies 430.3 243.5 211.2 179.5 157.0 174.4 171.2 165.9 157.0 154.1 149.6 30 31 REITs 46.0 44.6 56.1 64.5 199.3 63.1 198.7 199.1 199.3 222.8 221.3 31
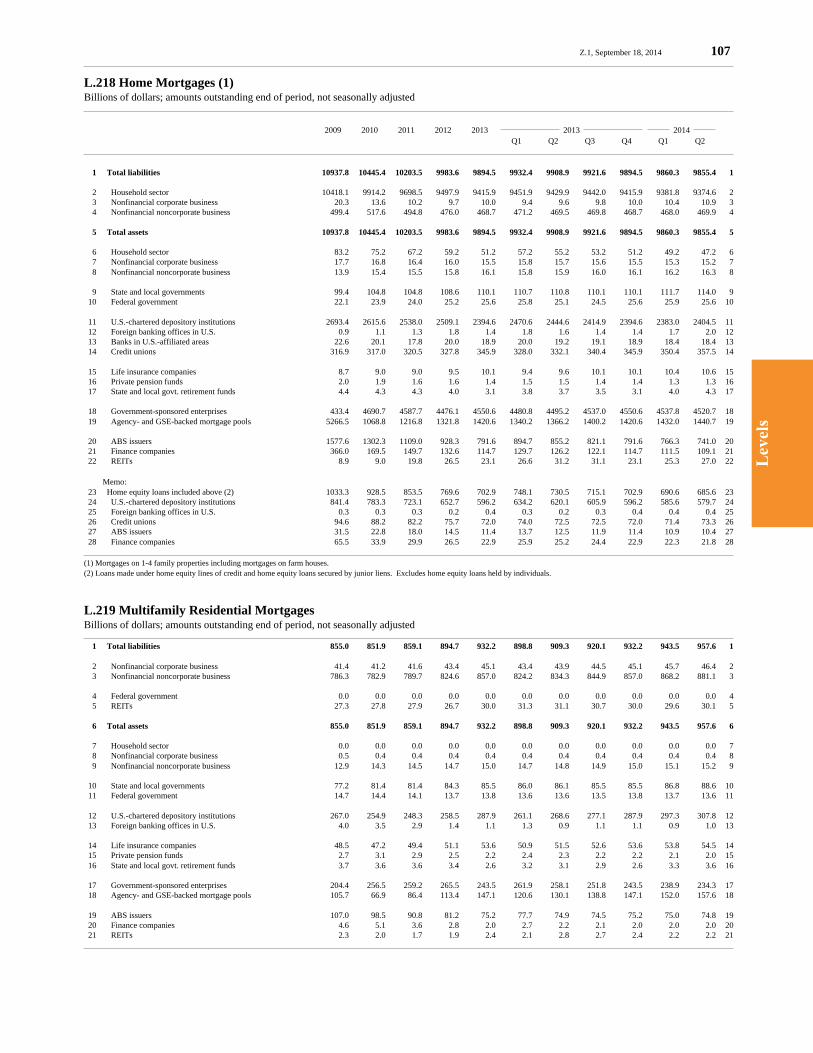
Lev
els
Z.1, September 18, 2014 107
L.218 Home Mortgages (1)Billions of dollars; amounts outstanding end of period, not seasonally adjusted
2009 2010 2011 2012 2013 2013 2014 Q1 Q2 Q3 Q4 Q1 Q2
1 Total liabilities 10937.8 10445.4 10203.5 9983.6 9894.5 9932.4 9908.9 9921.6 9894.5 9860.3 9855.4 1
2 Household sector 10418.1 9914.2 9698.5 9497.9 9415.9 9451.9 9429.9 9442.0 9415.9 9381.8 9374.6 2 3 Nonfinancial corporate business 20.3 13.6 10.2 9.7 10.0 9.4 9.6 9.8 10.0 10.4 10.9 3 4 Nonfinancial noncorporate business 499.4 517.6 494.8 476.0 468.7 471.2 469.5 469.8 468.7 468.0 469.9 4
5 Total assets 10937.8 10445.4 10203.5 9983.6 9894.5 9932.4 9908.9 9921.6 9894.5 9860.3 9855.4 5
6 Household sector 83.2 75.2 67.2 59.2 51.2 57.2 55.2 53.2 51.2 49.2 47.2 6 7 Nonfinancial corporate business 17.7 16.8 16.4 16.0 15.5 15.8 15.7 15.6 15.5 15.3 15.2 7 8 Nonfinancial noncorporate business 13.9 15.4 15.5 15.8 16.1 15.8 15.9 16.0 16.1 16.2 16.3 8
9 State and local governments 99.4 104.8 104.8 108.6 110.1 110.7 110.8 110.1 110.1 111.7 114.0 9 10 Federal government 22.1 23.9 24.0 25.2 25.6 25.8 25.1 24.5 25.6 25.9 25.6 10
11 U.S.-chartered depository institutions 2693.4 2615.6 2538.0 2509.1 2394.6 2470.6 2444.6 2414.9 2394.6 2383.0 2404.5 11 12 Foreign banking offices in U.S. 0.9 1.1 1.3 1.8 1.4 1.8 1.6 1.4 1.4 1.7 2.0 12 13 Banks in U.S.-affiliated areas 22.6 20.1 17.8 20.0 18.9 20.0 19.2 19.1 18.9 18.4 18.4 13 14 Credit unions 316.9 317.0 320.5 327.8 345.9 328.0 332.1 340.4 345.9 350.4 357.5 14
15 Life insurance companies 8.7 9.0 9.0 9.5 10.1 9.4 9.6 10.1 10.1 10.4 10.6 15 16 Private pension funds 2.0 1.9 1.6 1.6 1.4 1.5 1.5 1.4 1.4 1.3 1.3 16 17 State and local govt. retirement funds 4.4 4.3 4.3 4.0 3.1 3.8 3.7 3.5 3.1 4.0 4.3 17
18 Government-sponsored enterprises 433.4 4690.7 4587.7 4476.1 4550.6 4480.8 4495.2 4537.0 4550.6 4537.8 4520.7 18 19 Agency- and GSE-backed mortgage pools 5266.5 1068.8 1216.8 1321.8 1420.6 1340.2 1366.2 1400.2 1420.6 1432.0 1440.7 19
20 ABS issuers 1577.6 1302.3 1109.0 928.3 791.6 894.7 855.2 821.1 791.6 766.3 741.0 20 21 Finance companies 366.0 169.5 149.7 132.6 114.7 129.7 126.2 122.1 114.7 111.5 109.1 21 22 REITs 8.9 9.0 19.8 26.5 23.1 26.6 31.2 31.1 23.1 25.3 27.0 22
Memo: 23 Home equity loans included above (2) 1033.3 928.5 853.5 769.6 702.9 748.1 730.5 715.1 702.9 690.6 685.6 23 24 U.S.-chartered depository institutions 841.4 783.3 723.1 652.7 596.2 634.2 620.1 605.9 596.2 585.6 579.7 24 25 Foreign banking offices in U.S. 0.3 0.3 0.3 0.2 0.4 0.3 0.2 0.3 0.4 0.4 0.4 25 26 Credit unions 94.6 88.2 82.2 75.7 72.0 74.0 72.5 72.5 72.0 71.4 73.3 26 27 ABS issuers 31.5 22.8 18.0 14.5 11.4 13.7 12.5 11.9 11.4 10.9 10.4 27 28 Finance companies 65.5 33.9 29.9 26.5 22.9 25.9 25.2 24.4 22.9 22.3 21.8 28
(1) Mortgages on 1-4 family properties including mortgages on farm houses.(2) Loans made under home equity lines of credit and home equity loans secured by junior liens. Excludes home equity loans held by individuals.
L.219 Multifamily Residential MortgagesBillions of dollars; amounts outstanding end of period, not seasonally adjusted
1 Total liabilities 855.0 851.9 859.1 894.7 932.2 898.8 909.3 920.1 932.2 943.5 957.6 1
2 Nonfinancial corporate business 41.4 41.2 41.6 43.4 45.1 43.4 43.9 44.5 45.1 45.7 46.4 2 3 Nonfinancial noncorporate business 786.3 782.9 789.7 824.6 857.0 824.2 834.3 844.9 857.0 868.2 881.1 3
4 Federal government 0.0 0.0 0.0 0.0 0.0 0.0 0.0 0.0 0.0 0.0 0.0 4 5 REITs 27.3 27.8 27.9 26.7 30.0 31.3 31.1 30.7 30.0 29.6 30.1 5
6 Total assets 855.0 851.9 859.1 894.7 932.2 898.8 909.3 920.1 932.2 943.5 957.6 6
7 Household sector 0.0 0.0 0.0 0.0 0.0 0.0 0.0 0.0 0.0 0.0 0.0 7 8 Nonfinancial corporate business 0.5 0.4 0.4 0.4 0.4 0.4 0.4 0.4 0.4 0.4 0.4 8 9 Nonfinancial noncorporate business 12.9 14.3 14.5 14.7 15.0 14.7 14.8 14.9 15.0 15.1 15.2 9
10 State and local governments 77.2 81.4 81.4 84.3 85.5 86.0 86.1 85.5 85.5 86.8 88.6 10 11 Federal government 14.7 14.4 14.1 13.7 13.8 13.6 13.6 13.5 13.8 13.7 13.6 11
12 U.S.-chartered depository institutions 267.0 254.9 248.3 258.5 287.9 261.1 268.6 277.1 287.9 297.3 307.8 12 13 Foreign banking offices in U.S. 4.0 3.5 2.9 1.4 1.1 1.3 0.9 1.1 1.1 0.9 1.0 13
14 Life insurance companies 48.5 47.2 49.4 51.1 53.6 50.9 51.5 52.6 53.6 53.8 54.5 14 15 Private pension funds 2.7 3.1 2.9 2.5 2.2 2.4 2.3 2.2 2.2 2.1 2.0 15 16 State and local govt. retirement funds 3.7 3.6 3.6 3.4 2.6 3.2 3.1 2.9 2.6 3.3 3.6 16
17 Government-sponsored enterprises 204.4 256.5 259.2 265.5 243.5 261.9 258.1 251.8 243.5 238.9 234.3 17 18 Agency- and GSE-backed mortgage pools 105.7 66.9 86.4 113.4 147.1 120.6 130.1 138.8 147.1 152.0 157.6 18
19 ABS issuers 107.0 98.5 90.8 81.2 75.2 77.7 74.9 74.5 75.2 75.0 74.8 19 20 Finance companies 4.6 5.1 3.6 2.8 2.0 2.7 2.2 2.1 2.0 2.0 2.0 20 21 REITs 2.3 2.0 1.7 1.9 2.4 2.1 2.8 2.7 2.4 2.2 2.2 21
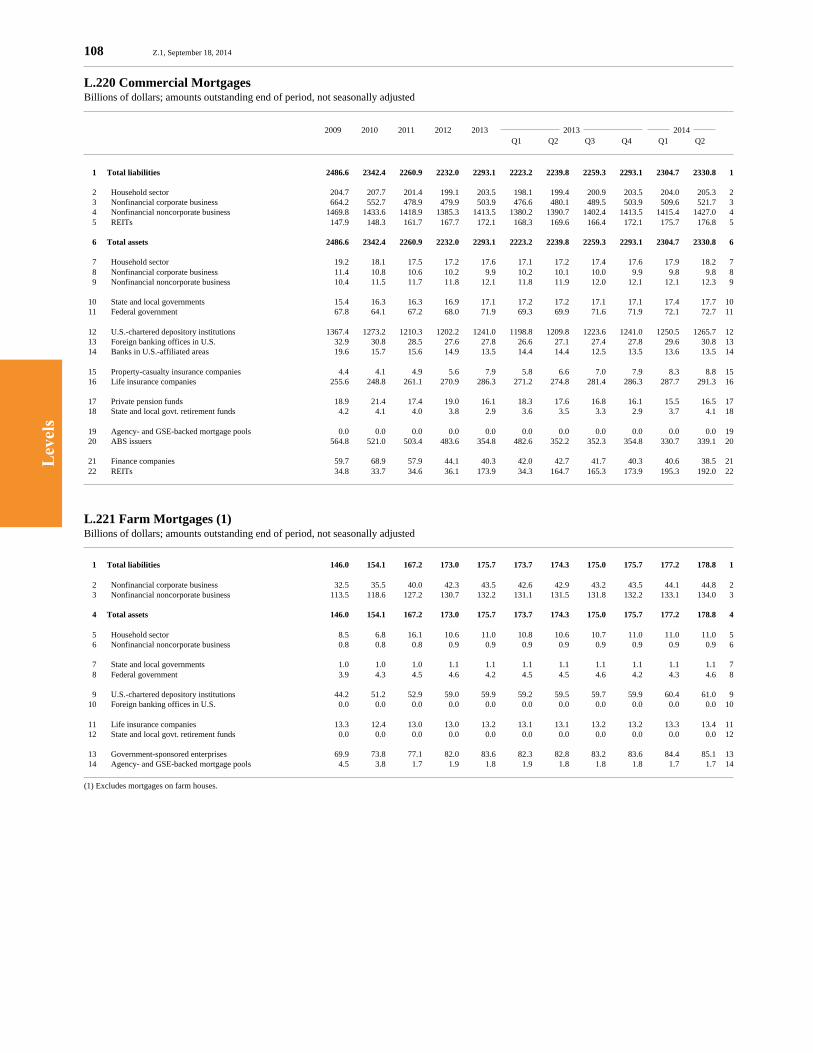
Lev
els
108 Z.1, September 18, 2014
L.220 Commercial MortgagesBillions of dollars; amounts outstanding end of period, not seasonally adjusted
2009 2010 2011 2012 2013 2013 2014 Q1 Q2 Q3 Q4 Q1 Q2
1 Total liabilities 2486.6 2342.4 2260.9 2232.0 2293.1 2223.2 2239.8 2259.3 2293.1 2304.7 2330.8 1
2 Household sector 204.7 207.7 201.4 199.1 203.5 198.1 199.4 200.9 203.5 204.0 205.3 2 3 Nonfinancial corporate business 664.2 552.7 478.9 479.9 503.9 476.6 480.1 489.5 503.9 509.6 521.7 3 4 Nonfinancial noncorporate business 1469.8 1433.6 1418.9 1385.3 1413.5 1380.2 1390.7 1402.4 1413.5 1415.4 1427.0 4 5 REITs 147.9 148.3 161.7 167.7 172.1 168.3 169.6 166.4 172.1 175.7 176.8 5
6 Total assets 2486.6 2342.4 2260.9 2232.0 2293.1 2223.2 2239.8 2259.3 2293.1 2304.7 2330.8 6
7 Household sector 19.2 18.1 17.5 17.2 17.6 17.1 17.2 17.4 17.6 17.9 18.2 7 8 Nonfinancial corporate business 11.4 10.8 10.6 10.2 9.9 10.2 10.1 10.0 9.9 9.8 9.8 8 9 Nonfinancial noncorporate business 10.4 11.5 11.7 11.8 12.1 11.8 11.9 12.0 12.1 12.1 12.3 9
10 State and local governments 15.4 16.3 16.3 16.9 17.1 17.2 17.2 17.1 17.1 17.4 17.7 10 11 Federal government 67.8 64.1 67.2 68.0 71.9 69.3 69.9 71.6 71.9 72.1 72.7 11
12 U.S.-chartered depository institutions 1367.4 1273.2 1210.3 1202.2 1241.0 1198.8 1209.8 1223.6 1241.0 1250.5 1265.7 12 13 Foreign banking offices in U.S. 32.9 30.8 28.5 27.6 27.8 26.6 27.1 27.4 27.8 29.6 30.8 13 14 Banks in U.S.-affiliated areas 19.6 15.7 15.6 14.9 13.5 14.4 14.4 12.5 13.5 13.6 13.5 14
15 Property-casualty insurance companies 4.4 4.1 4.9 5.6 7.9 5.8 6.6 7.0 7.9 8.3 8.8 15 16 Life insurance companies 255.6 248.8 261.1 270.9 286.3 271.2 274.8 281.4 286.3 287.7 291.3 16
17 Private pension funds 18.9 21.4 17.4 19.0 16.1 18.3 17.6 16.8 16.1 15.5 16.5 17 18 State and local govt. retirement funds 4.2 4.1 4.0 3.8 2.9 3.6 3.5 3.3 2.9 3.7 4.1 18
19 Agency- and GSE-backed mortgage pools 0.0 0.0 0.0 0.0 0.0 0.0 0.0 0.0 0.0 0.0 0.0 19 20 ABS issuers 564.8 521.0 503.4 483.6 354.8 482.6 352.2 352.3 354.8 330.7 339.1 20
21 Finance companies 59.7 68.9 57.9 44.1 40.3 42.0 42.7 41.7 40.3 40.6 38.5 21 22 REITs 34.8 33.7 34.6 36.1 173.9 34.3 164.7 165.3 173.9 195.3 192.0 22
L.221 Farm Mortgages (1)Billions of dollars; amounts outstanding end of period, not seasonally adjusted
1 Total liabilities 146.0 154.1 167.2 173.0 175.7 173.7 174.3 175.0 175.7 177.2 178.8 1
2 Nonfinancial corporate business 32.5 35.5 40.0 42.3 43.5 42.6 42.9 43.2 43.5 44.1 44.8 2 3 Nonfinancial noncorporate business 113.5 118.6 127.2 130.7 132.2 131.1 131.5 131.8 132.2 133.1 134.0 3
4 Total assets 146.0 154.1 167.2 173.0 175.7 173.7 174.3 175.0 175.7 177.2 178.8 4
5 Household sector 8.5 6.8 16.1 10.6 11.0 10.8 10.6 10.7 11.0 11.0 11.0 5 6 Nonfinancial noncorporate business 0.8 0.8 0.8 0.9 0.9 0.9 0.9 0.9 0.9 0.9 0.9 6
7 State and local governments 1.0 1.0 1.0 1.1 1.1 1.1 1.1 1.1 1.1 1.1 1.1 7 8 Federal government 3.9 4.3 4.5 4.6 4.2 4.5 4.5 4.6 4.2 4.3 4.6 8
9 U.S.-chartered depository institutions 44.2 51.2 52.9 59.0 59.9 59.2 59.5 59.7 59.9 60.4 61.0 9 10 Foreign banking offices in U.S. 0.0 0.0 0.0 0.0 0.0 0.0 0.0 0.0 0.0 0.0 0.0 10
11 Life insurance companies 13.3 12.4 13.0 13.0 13.2 13.1 13.1 13.2 13.2 13.3 13.4 11 12 State and local govt. retirement funds 0.0 0.0 0.0 0.0 0.0 0.0 0.0 0.0 0.0 0.0 0.0 12
13 Government-sponsored enterprises 69.9 73.8 77.1 82.0 83.6 82.3 82.8 83.2 83.6 84.4 85.1 13 14 Agency- and GSE-backed mortgage pools 4.5 3.8 1.7 1.9 1.8 1.9 1.8 1.8 1.8 1.7 1.7 14
(1) Excludes mortgages on farm houses.
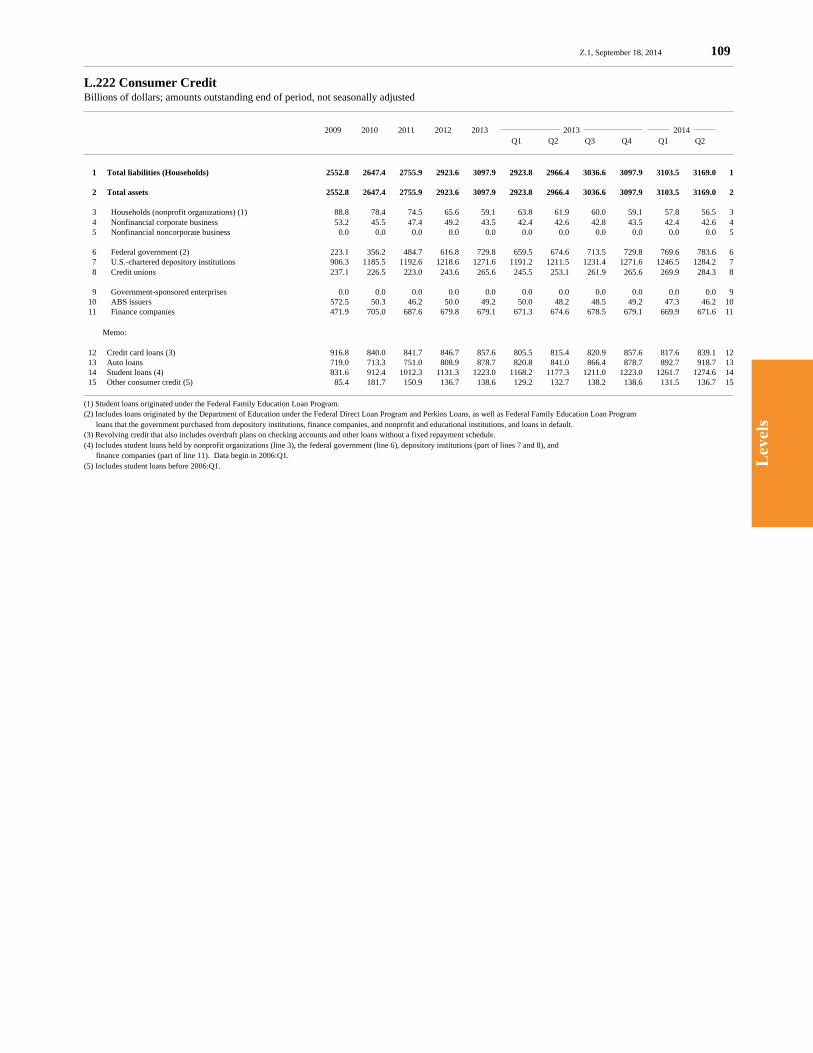
Lev
els
Z.1, September 18, 2014 109
L.222 Consumer CreditBillions of dollars; amounts outstanding end of period, not seasonally adjusted
2009 2010 2011 2012 2013 2013 2014 Q1 Q2 Q3 Q4 Q1 Q2
1 Total liabilities (Households) 2552.8 2647.4 2755.9 2923.6 3097.9 2923.8 2966.4 3036.6 3097.9 3103.5 3169.0 1
2 Total assets 2552.8 2647.4 2755.9 2923.6 3097.9 2923.8 2966.4 3036.6 3097.9 3103.5 3169.0 2
3 Households (nonprofit organizations) (1) 88.8 78.4 74.5 65.6 59.1 63.8 61.9 60.0 59.1 57.8 56.5 3 4 Nonfinancial corporate business 53.2 45.5 47.4 49.2 43.5 42.4 42.6 42.8 43.5 42.4 42.6 4 5 Nonfinancial noncorporate business 0.0 0.0 0.0 0.0 0.0 0.0 0.0 0.0 0.0 0.0 0.0 5
6 Federal government (2) 223.1 356.2 484.7 616.8 729.8 659.5 674.6 713.5 729.8 769.6 783.6 6 7 U.S.-chartered depository institutions 906.3 1185.5 1192.6 1218.6 1271.6 1191.2 1211.5 1231.4 1271.6 1246.5 1284.2 7 8 Credit unions 237.1 226.5 223.0 243.6 265.6 245.5 253.1 261.9 265.6 269.9 284.3 8
9 Government-sponsored enterprises 0.0 0.0 0.0 0.0 0.0 0.0 0.0 0.0 0.0 0.0 0.0 9 10 ABS issuers 572.5 50.3 46.2 50.0 49.2 50.0 48.2 48.5 49.2 47.3 46.2 10 11 Finance companies 471.9 705.0 687.6 679.8 679.1 671.3 674.6 678.5 679.1 669.9 671.6 11
Memo:
12 Credit card loans (3) 916.8 840.0 841.7 846.7 857.6 805.5 815.4 820.9 857.6 817.6 839.1 12 13 Auto loans 719.0 713.3 751.0 808.9 878.7 820.8 841.0 866.4 878.7 892.7 918.7 13 14 Student loans (4) 831.6 912.4 1012.3 1131.3 1223.0 1168.2 1177.3 1211.0 1223.0 1261.7 1274.6 14 15 Other consumer credit (5) 85.4 181.7 150.9 136.7 138.6 129.2 132.7 138.2 138.6 131.5 136.7 15
(1) Student loans originated under the Federal Family Education Loan Program.(2) Includes loans originated by the Department of Education under the Federal Direct Loan Program and Perkins Loans, as well as Federal Family Education Loan Program loans that the government purchased from depository institutions, finance companies, and nonprofit and educational institutions, and loans in default.(3) Revolving credit that also includes overdraft plans on checking accounts and other loans without a fixed repayment schedule.(4) Includes student loans held by nonprofit organizations (line 3), the federal government (line 6), depository institutions (part of lines 7 and 8), and finance companies (part of line 11). Data begin in 2006:Q1.(5) Includes student loans before 2006:Q1.

Lev
els
110 Z.1, September 18, 2014
L.223 Trade CreditBillions of dollars; amounts outstanding end of period, not seasonally adjusted
2009 2010 2011 2012 2013 2013 2014 Q1 Q2 Q3 Q4 Q1 Q2
1 Total trade payables 3216.0 3370.8 3452.5 3593.3 3760.9 3636.9 3703.2 3734.2 3760.9 3779.0 3849.6 1
2 Household sector 278.2 248.8 250.0 254.0 255.0 254.3 254.5 254.8 255.0 256.0 256.9 2
3 Nonfinancial corporate business 1590.1 1746.4 1771.6 1854.8 1968.2 1875.5 1917.1 1949.7 1968.2 1972.9 2015.3 3 4 Nonfinancial noncorporate business 397.6 427.8 435.7 434.5 441.4 438.6 440.3 442.0 441.4 443.3 446.6 4
5 State and local governments 630.5 669.0 707.4 746.2 785.8 755.9 765.8 775.8 785.8 795.8 806.0 5 6 Federal government 204.5 209.7 218.5 233.9 250.7 242.2 250.9 254.7 250.7 259.6 269.2 6
7 Rest of the world 45.1 51.1 55.1 55.7 45.3 54.9 59.1 44.0 45.3 36.5 37.9 7 8 Brokers and dealers 70.1 18.1 14.3 14.2 14.5 15.4 15.6 13.3 14.5 14.8 17.8 8
9 Total trade receivables 2970.9 3132.4 3245.3 3354.9 3520.3 3469.5 3570.8 3592.7 3520.3 3616.4 3714.9 9
10 Nonfinancial corporate business 2054.5 2156.5 2240.3 2324.0 2469.4 2433.3 2521.3 2546.7 2469.4 2541.7 2623.8 10 11 Nonfinancial noncorporate business 496.3 533.4 539.2 546.6 558.0 547.5 550.9 554.3 558.0 560.9 567.1 11
12 State and local governments 139.1 152.2 154.5 160.3 168.7 162.0 165.0 167.4 168.7 169.1 172.3 12 13 Federal government 43.6 42.9 47.7 50.3 48.8 48.7 52.0 50.6 48.8 50.6 50.7 13 14 Rest of the world 93.1 111.8 128.8 140.5 144.4 143.8 148.8 140.7 144.4 159.8 163.3 14
15 Property-casualty insurance companies 83.0 83.8 87.2 92.0 95.2 94.0 96.6 98.3 95.2 100.1 103.9 15 16 ABS issuers 61.3 51.8 47.6 41.2 35.7 40.1 36.2 34.6 35.7 34.3 33.9 16
17 Discrepancy 245.1 238.5 207.2 238.4 240.6 167.4 132.4 141.6 240.6 162.5 134.6 17
L.224 Security CreditBillions of dollars; amounts outstanding end of period, not seasonally adjusted
1 Total liabilities 936.7 1041.7 1034.2 1131.9 1236.2 1129.5 1172.5 1183.8 1236.2 1273.1 1333.1 1
2 Household sector 203.0 278.2 238.9 303.7 339.2 307.9 302.6 313.7 339.2 320.6 376.2 2 3 Brokers and dealers 733.7 763.5 795.4 828.2 897.1 821.6 870.0 870.0 897.1 952.5 956.9 3
4 Total assets 936.7 1041.7 1034.2 1131.9 1236.2 1129.5 1172.5 1183.8 1236.2 1273.1 1333.1 4
5 Household sector 701.7 725.2 726.1 757.0 815.5 743.6 794.0 791.5 815.5 866.2 870.0 5
6 U.S.-chartered depository institutions 20.4 23.6 35.8 45.0 52.9 47.9 51.8 53.9 52.9 58.4 61.0 6 7 Foreign banking offices in U.S. 11.6 14.7 33.5 26.2 28.7 30.2 24.2 24.7 28.7 28.0 25.9 7
8 Brokers and dealers 203.0 278.2 238.9 303.7 339.2 307.9 302.6 313.7 339.2 320.6 376.2 8
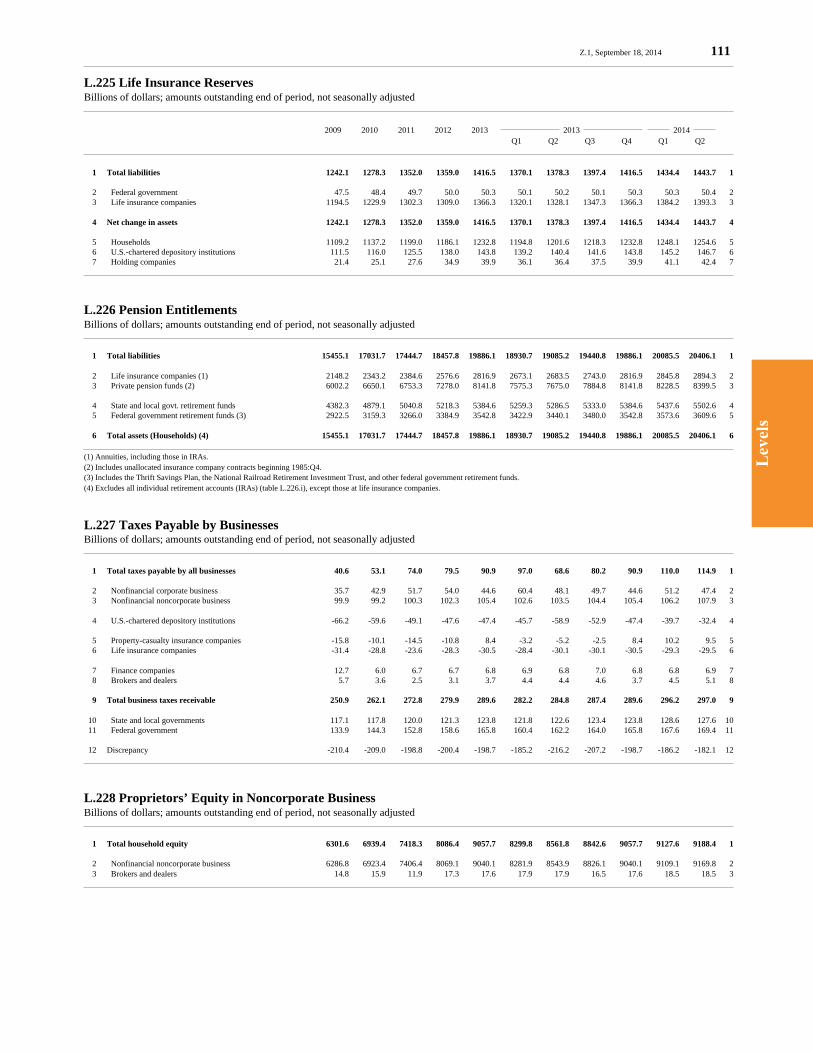
Lev
els
Z.1, September 18, 2014 111
L.225 Life Insurance ReservesBillions of dollars; amounts outstanding end of period, not seasonally adjusted
2009 2010 2011 2012 2013 2013 2014 Q1 Q2 Q3 Q4 Q1 Q2
1 Total liabilities 1242.1 1278.3 1352.0 1359.0 1416.5 1370.1 1378.3 1397.4 1416.5 1434.4 1443.7 1
2 Federal government 47.5 48.4 49.7 50.0 50.3 50.1 50.2 50.1 50.3 50.3 50.4 2 3 Life insurance companies 1194.5 1229.9 1302.3 1309.0 1366.3 1320.1 1328.1 1347.3 1366.3 1384.2 1393.3 3
4 Net change in assets 1242.1 1278.3 1352.0 1359.0 1416.5 1370.1 1378.3 1397.4 1416.5 1434.4 1443.7 4
5 Households 1109.2 1137.2 1199.0 1186.1 1232.8 1194.8 1201.6 1218.3 1232.8 1248.1 1254.6 5 6 U.S.-chartered depository institutions 111.5 116.0 125.5 138.0 143.8 139.2 140.4 141.6 143.8 145.2 146.7 6 7 Holding companies 21.4 25.1 27.6 34.9 39.9 36.1 36.4 37.5 39.9 41.1 42.4 7
L.226 Pension EntitlementsBillions of dollars; amounts outstanding end of period, not seasonally adjusted
1 Total liabilities 15455.1 17031.7 17444.7 18457.8 19886.1 18930.7 19085.2 19440.8 19886.1 20085.5 20406.1 1
2 Life insurance companies (1) 2148.2 2343.2 2384.6 2576.6 2816.9 2673.1 2683.5 2743.0 2816.9 2845.8 2894.3 2 3 Private pension funds (2) 6002.2 6650.1 6753.3 7278.0 8141.8 7575.3 7675.0 7884.8 8141.8 8228.5 8399.5 3
4 State and local govt. retirement funds 4382.3 4879.1 5040.8 5218.3 5384.6 5259.3 5286.5 5333.0 5384.6 5437.6 5502.6 4 5 Federal government retirement funds (3) 2922.5 3159.3 3266.0 3384.9 3542.8 3422.9 3440.1 3480.0 3542.8 3573.6 3609.6 5
6 Total assets (Households) (4) 15455.1 17031.7 17444.7 18457.8 19886.1 18930.7 19085.2 19440.8 19886.1 20085.5 20406.1 6
(1) Annuities, including those in IRAs.(2) Includes unallocated insurance company contracts beginning 1985:Q4.(3) Includes the Thrift Savings Plan, the National Railroad Retirement Investment Trust, and other federal government retirement funds.(4) Excludes all individual retirement accounts (IRAs) (table L.226.i), except those at life insurance companies.
L.227 Taxes Payable by BusinessesBillions of dollars; amounts outstanding end of period, not seasonally adjusted
1 Total taxes payable by all businesses 40.6 53.1 74.0 79.5 90.9 97.0 68.6 80.2 90.9 110.0 114.9 1
2 Nonfinancial corporate business 35.7 42.9 51.7 54.0 44.6 60.4 48.1 49.7 44.6 51.2 47.4 2 3 Nonfinancial noncorporate business 99.9 99.2 100.3 102.3 105.4 102.6 103.5 104.4 105.4 106.2 107.9 3
4 U.S.-chartered depository institutions -66.2 -59.6 -49.1 -47.6 -47.4 -45.7 -58.9 -52.9 -47.4 -39.7 -32.4 4
5 Property-casualty insurance companies -15.8 -10.1 -14.5 -10.8 8.4 -3.2 -5.2 -2.5 8.4 10.2 9.5 5 6 Life insurance companies -31.4 -28.8 -23.6 -28.3 -30.5 -28.4 -30.1 -30.1 -30.5 -29.3 -29.5 6
7 Finance companies 12.7 6.0 6.7 6.7 6.8 6.9 6.8 7.0 6.8 6.8 6.9 7 8 Brokers and dealers 5.7 3.6 2.5 3.1 3.7 4.4 4.4 4.6 3.7 4.5 5.1 8
9 Total business taxes receivable 250.9 262.1 272.8 279.9 289.6 282.2 284.8 287.4 289.6 296.2 297.0 9
10 State and local governments 117.1 117.8 120.0 121.3 123.8 121.8 122.6 123.4 123.8 128.6 127.6 10 11 Federal government 133.9 144.3 152.8 158.6 165.8 160.4 162.2 164.0 165.8 167.6 169.4 11
12 Discrepancy -210.4 -209.0 -198.8 -200.4 -198.7 -185.2 -216.2 -207.2 -198.7 -186.2 -182.1 12
L.228 Proprietors’ Equity in Noncorporate BusinessBillions of dollars; amounts outstanding end of period, not seasonally adjusted
1 Total household equity 6301.6 6939.4 7418.3 8086.4 9057.7 8299.8 8561.8 8842.6 9057.7 9127.6 9188.4 1
2 Nonfinancial noncorporate business 6286.8 6923.4 7406.4 8069.1 9040.1 8281.9 8543.9 8826.1 9040.1 9109.1 9169.8 2 3 Brokers and dealers 14.8 15.9 11.9 17.3 17.6 17.9 17.9 16.5 17.6 18.5 18.5 3

Lev
els
112 Z.1, September 18, 2014
L.229 Direct InvestmentBillions of dollars; amounts outstanding end of period, not seasonally adjusted
2009 2010 2011 2012 2013 2013 2014 Q1 Q2 Q3 Q4 Q1 Q2
U.S. direct investment abroad:
1 Liab.: Rest of the world (1) 4077.4 4273.6 4599.5 4972.9 5284.0 5016.6 5110.4 5237.7 5284.0 5336.3 5425.1 1 2 Equity 3852.4 4084.8 4405.2 4757.4 5078.6 4814.5 4891.6 5028.8 5078.6 5131.8 5224.2 2 3 Intercompany debt (2) 224.9 188.7 194.3 215.5 205.4 202.2 218.8 208.9 205.4 201.2 196.2 3 4 U.S. parents’ claims 572.0 586.9 619.1 644.3 664.3 634.3 660.1 662.6 664.3 664.4 667.4 4 5 Less: U.S. parents’ liabilities 347.1 398.1 424.8 428.8 458.8 432.1 441.3 453.7 458.8 463.0 471.4 5
6 Asset: Nonfinancial corporate business 3245.1 3402.9 3759.2 4081.0 4370.0 4111.8 4199.3 4311.4 4370.0 4410.7 4490.1 6 7 U.S.-chartered depository institutions 261.7 280.1 272.5 283.9 285.3 285.7 282.3 288.8 285.3 286.8 289.3 7 8 Property-casualty insurance companies 123.7 99.1 90.2 98.0 108.8 102.1 108.9 113.0 108.8 109.6 112.4 8 9 Life insurance companies 28.9 46.3 54.2 67.0 65.5 67.0 68.0 67.9 65.5 65.4 64.3 9 10 Finance companies 186.9 206.0 221.8 225.4 228.6 228.4 228.5 231.1 228.6 235.8 236.8 10 11 Brokers and dealers 231.0 239.3 201.7 217.5 225.8 221.6 223.4 225.5 225.8 228.0 232.0 11
Foreign direct investment in U.S.:
12 Liab.: Nonfinancial corporate business 1986.4 2128.7 2230.7 2408.9 2610.3 2441.0 2472.7 2510.1 2610.3 2563.0 2677.3 12 13 Nonfinancial noncorporate business 4.8 5.3 6.1 6.6 7.3 6.5 6.6 7.0 7.3 7.5 7.5 13 14 Foreign banking offices in U.S. 107.7 120.0 176.6 181.8 181.4 182.7 183.1 184.4 181.4 182.3 183.1 14 15 Property-casualty insurance companies 64.7 70.7 73.9 77.1 74.5 82.5 82.4 82.6 74.5 74.0 74.0 15 16 Life insurance companies 69.4 84.3 103.6 106.0 97.7 107.6 110.2 111.9 97.7 99.1 102.4 16 17 Finance companies 90.0 114.7 91.1 90.9 73.0 91.3 92.0 92.3 73.0 73.4 73.8 17 18 Brokers and dealers 64.4 88.5 104.6 110.4 119.5 112.2 113.7 114.3 119.5 121.7 121.7 18 19 Funding corporations 10.8 11.4 12.0 12.6 13.2 12.8 12.9 13.1 13.2 13.4 13.5 19
20 Asset: Rest of the world (1) 2398.2 2623.6 2798.7 2994.3 3176.9 3036.6 3073.7 3115.6 3176.9 3134.4 3253.3 20 21 Equity 1916.7 2129.1 2268.3 2475.2 2652.9 2516.1 2553.0 2596.7 2652.9 2633.4 2769.9 21 22 Intercompany debt 481.6 494.5 530.4 519.2 523.9 520.6 520.6 518.9 523.9 501.0 506.0 22 23 U.S. affiliates’ liabilities 757.7 773.2 806.1 832.2 869.7 833.5 845.0 847.4 869.7 844.9 845.9 23 24 Less: U.S. affiliates’ claims 276.1 278.7 275.7 313.0 345.8 313.0 324.4 328.5 345.8 327.4 328.1 24
Memo:
Direct investment, asset/liability presentation:
25 Direct investment assets 4700.5 4950.4 5300.0 5714.8 6088.7 5761.7 5876.0 6019.9 6088.7 6123.6 6219.7 25 26 Equity (line 2) 3852.4 4084.8 4405.2 4757.4 5078.6 4814.5 4891.6 5028.8 5078.6 5131.8 5224.2 26 27 Intercompany debt 848.1 865.5 894.8 957.3 1010.1 947.3 984.5 991.1 1010.1 991.8 995.5 27 28 U.S. parents’ claims (line 4) 572.0 586.9 619.1 644.3 664.3 634.3 660.1 662.6 664.3 664.4 667.4 28 29 U.S. affiliates’ claims (line 24) 276.1 278.7 275.7 313.0 345.8 313.0 324.4 328.5 345.8 327.4 328.1 29
30 Direct investment liabilities 3021.4 3300.5 3499.2 3736.2 3981.5 3781.7 3839.3 3897.8 3981.5 3941.3 4087.1 30 31 Equity (line 21) 1916.7 2129.1 2268.3 2475.2 2652.9 2516.1 2553.0 2596.7 2652.9 2633.4 2769.9 31 32 Intercompany debt 1104.7 1171.3 1230.9 1261.0 1328.6 1265.7 1286.3 1301.1 1328.6 1307.9 1317.3 32 33 U.S. parents’ liabilities (line 5) 347.1 398.1 424.8 428.8 458.8 432.1 441.3 453.7 458.8 463.0 471.4 33 34 U.S. affiliates’ liabilities (line 23) 757.7 773.2 806.1 832.2 869.7 833.5 845.0 847.4 869.7 844.9 845.9 34
Alternative valuations of direct investment assets:
U.S. direct investment abroad:
35 Market value 4322.1 4809.6 4514.3 5196.5 6275.4 5440.1 5381.0 5907.9 6275.4 6335.8 6422.9 35 36 Equity 4097.2 4620.9 4320.1 4981.0 6070.0 5237.9 5162.2 5699.0 6070.0 6134.6 6226.7 36 37 Intercompany debt 224.9 188.7 194.3 215.5 205.4 202.2 218.8 208.9 205.4 201.2 196.2 37
38 Historical cost 3565.0 3741.9 4050.0 4384.7 4660.9 4419.6 4504.7 4623.3 4660.9 4709.9 4791.6 38 39 Equity 3340.1 3553.2 3855.8 4169.2 4455.5 4217.5 4285.9 4414.4 4455.5 4508.7 4595.4 39 40 Intercompany debt 224.9 188.7 194.3 215.5 205.4 202.2 218.8 208.9 205.4 201.2 196.2 40
Foreign direct investment in U.S.:
41 Market value 2995.5 3422.3 3498.7 3929.1 4985.9 4273.8 4366.1 4560.2 4985.9 4893.8 4972.3 41 42 Equity 2513.9 2927.8 2968.4 3409.9 4462.0 3753.3 3845.4 4041.3 4462.0 4392.8 4466.3 42 43 Intercompany debt 481.6 494.5 530.4 519.2 523.9 520.6 520.6 518.9 523.9 501.0 506.0 43
44 Historical cost 2069.4 2280.0 2433.8 2605.8 2764.0 2642.0 2672.9 2708.8 2764.0 2721.5 2788.4 44 45 Equity 1587.9 1785.5 1903.5 2086.6 2240.0 2121.4 2152.3 2189.9 2240.0 2220.5 2282.4 45 46 Intercompany debt 481.6 494.5 530.4 519.2 523.9 520.6 520.6 518.9 523.9 501.0 506.0 46
(1) Direct investment is valued on a current-cost basis and presented on a directional basis.(2) Through 1992:Q4, U.S. direct investment abroad excludes net inflows from corporate bonds issued by Netherlands Antillean financial subsidiaries.

Lev
els
Z.1, September 18, 2014 113
L.230 Total Miscellaneous Financial ClaimsBillions of dollars; amounts outstanding end of period, not seasonally adjusted
2009 2010 2011 2012 2013 2013 2014 Q1 Q2 Q3 Q4 Q1 Q2
1 Total liabilities 15807.7 15907.9 16567.2 17363.9 17190.4 17454.1 17377.7 17513.4 17190.4 17361.7 17416.2 1
2 Household sector 22.1 24.7 24.3 24.9 27.9 25.9 27.8 26.8 27.9 28.9 30.2 2 3 Nonfinancial corporate business 3149.3 3304.4 3559.6 3875.7 4086.7 3968.7 3989.7 4045.0 4086.7 4079.3 4051.3 3 4 Nonfinancial noncorporate business 1243.3 1192.4 1226.8 1244.2 1249.0 1247.4 1246.0 1249.2 1249.0 1250.2 1249.5 4
5 State and local governments 1116.9 1343.4 1648.3 1622.2 1204.1 1452.9 1430.9 1353.1 1204.1 1276.3 1260.1 5 6 Federal government 2859.2 3083.1 3189.0 3291.6 3393.7 3312.2 3332.0 3456.1 3393.7 3416.5 3442.8 6 7 Rest of the world 187.9 190.6 323.6 183.5 160.2 205.2 164.4 189.9 160.2 158.3 164.6 7
8 Monetary authority 29.2 58.4 31.7 33.7 43.5 34.7 32.1 41.2 43.5 47.8 50.0 8 9 U.S.-chartered depository institutions 2286.8 2247.6 2236.1 2446.4 2520.4 2503.7 2497.1 2484.5 2520.4 2581.3 2638.7 9 10 Foreign banking offices in U.S. 323.8 293.3 303.4 267.8 234.6 283.7 276.5 240.7 234.6 236.0 231.3 10 11 Banks in U.S.-affiliated areas 29.2 23.3 19.4 17.3 14.3 16.4 16.5 15.7 14.3 14.8 15.3 11 12 Credit unions 19.4 11.1 12.4 12.7 14.2 15.3 15.5 15.4 14.2 13.8 14.3 12
13 Property-casualty insurance companies 754.8 761.2 796.4 813.4 813.1 804.9 810.9 813.3 813.1 814.0 822.6 13 14 Life insurance companies 1090.8 1160.4 1178.1 1220.3 1280.4 1226.9 1221.2 1242.2 1280.4 1292.3 1316.8 14
15 Government-sponsored enterprises 269.2 179.4 130.2 124.1 114.7 119.9 121.9 119.6 114.7 111.2 111.1 15 16 Finance companies 483.6 157.3 173.0 142.9 134.9 137.6 127.9 126.3 134.9 133.5 127.7 16 17 REITs 59.6 63.7 70.8 96.3 74.6 89.4 92.3 78.5 74.6 81.1 85.5 17
18 Brokers and dealers 385.6 394.6 375.1 367.4 408.7 390.8 365.8 378.9 408.7 413.1 410.1 18 19 Holding companies 550.9 524.6 484.4 822.3 739.4 883.8 885.5 894.5 739.4 736.4 743.9 19 20 Funding corporations 946.3 894.5 784.6 757.2 676.1 734.6 723.9 742.4 676.1 676.7 650.5 20
21 Total assets 21196.3 21808.8 22677.1 23580.6 23795.0 23744.5 23880.4 23848.9 23795.0 24181.7 24372.9 21
22 Household sector 800.9 808.2 878.8 872.7 924.9 878.2 887.5 901.1 924.9 929.1 938.7 22 23 Nonfinancial corporate business 6294.1 6707.4 6782.0 7063.9 7536.1 7215.0 7285.1 7263.3 7536.1 7586.0 7716.0 23 24 Nonfinancial noncorporate business 2029.5 2134.4 2141.8 2186.2 2202.6 2182.5 2189.0 2195.0 2202.6 2213.7 2237.9 24
25 State and local governments 118.5 96.3 96.2 104.3 110.5 107.5 108.8 109.3 110.5 113.2 116.8 25 26 Federal government 147.8 143.2 145.1 144.0 149.9 144.8 141.9 145.7 149.9 152.7 157.6 26
27 Monetary authority 75.9 83.1 225.8 199.5 233.1 219.9 228.1 226.8 233.1 235.0 235.7 27 28 U.S.-chartered depository institutions 901.5 713.2 715.2 603.3 518.3 560.1 584.2 544.8 518.3 486.3 492.7 28 29 Foreign banking offices in U.S. 44.5 29.2 44.2 43.9 57.0 52.9 60.6 57.1 57.0 71.0 72.0 29 30 Banks in U.S.-affiliated areas 6.5 11.0 11.8 12.0 20.5 12.4 18.4 21.2 20.5 17.4 22.5 30 31 Credit unions 33.0 74.1 61.9 62.7 61.1 70.9 71.7 61.8 61.1 72.2 68.0 31 32 Life insurance companies 328.7 305.6 353.4 377.0 404.1 397.4 388.9 393.5 404.1 421.8 441.4 32
33 Private pension funds 1542.4 1536.6 1668.9 1582.5 1379.9 1491.9 1484.9 1436.2 1379.9 1374.4 1327.8 33 34 State and local govt. retirement funds 1336.5 1594.4 1890.1 1858.3 1462.9 1687.6 1670.0 1601.7 1462.9 1543.3 1539.0 34 35 Federal government retirement funds 2674.8 2876.6 2964.3 3054.1 3144.5 3076.0 3098.2 3222.8 3144.5 3168.1 3191.8 35
36 Money market mutual funds 26.9 23.5 22.7 28.8 31.7 31.5 31.9 33.9 31.7 37.2 16.0 36 37 Mutual funds 14.9 2.9 5.7 -27.4 -8.3 -16.2 -15.3 17.0 -8.3 24.4 24.3 37
38 Government-sponsored enterprises 100.3 148.6 148.5 152.6 165.6 167.9 167.7 166.8 165.6 152.1 151.4 38 39 Finance companies -142.1 -129.0 -138.7 -168.1 -189.5 -180.5 -183.1 -191.2 -189.5 -194.5 -196.8 39 40 REITs 64.8 66.1 74.7 100.4 112.6 105.9 115.7 102.0 112.6 122.4 133.6 40
41 Brokers and dealers 910.1 786.0 730.9 639.8 761.4 728.2 797.0 777.8 761.4 889.2 835.1 41 42 Holding companies 3160.6 3129.4 3165.9 3995.3 4008.3 4083.8 4028.7 4055.6 4008.3 4055.4 4127.4 42 43 Funding corporations 726.3 667.9 687.6 694.8 707.8 726.8 720.6 706.8 707.8 711.2 723.8 43
44 Discrepancy -5388.6 -5900.9 -6109.9 -6216.7 -6604.6 -6290.4 -6502.7 -6335.6 -6604.6 -6820.0 -6956.7 44

Lev
els
114 Z.1, September 18, 2014
L.231 Identified Miscellaneous Financial Claims - Part IBillions of dollars; amounts outstanding end of period, not seasonally adjusted
2009 2010 2011 2012 2013 2013 2014 Q1 Q2 Q3 Q4 Q1 Q2
Federal government equity in IBRD, etc.:
1 Liab.: Rest of the world 50.0 52.3 54.9 57.3 59.5 57.3 59.4 59.4 59.5 59.5 61.2 1 2 Asset: Federal government 50.0 52.3 54.9 57.3 59.5 57.3 59.4 59.4 59.5 59.5 61.2 2
Federal Reserve Bank stock:
3 Liab.: Monetary authority 25.6 26.5 26.9 27.4 27.5 27.6 27.5 27.4 27.5 28.1 28.2 3 4 Asset: U.S.-chartered depository institutions 25.6 26.5 26.9 27.4 27.5 27.6 27.5 27.4 27.5 28.1 28.2 4
Equity in government-sponsored enterprises:
5 Liab.: Government-sponsored enterprises 51.8 49.0 43.1 41.2 41.7 40.4 40.6 40.5 41.7 40.6 42.1 5
6 Asset: Nonfin. corporate business (Fannie Mae and FCS) 0.4 0.6 0.5 0.6 0.6 0.6 0.6 0.6 0.6 0.7 0.7 6 7 Nonfinancial noncorporate (FCS) 6.3 6.7 7.0 7.2 7.8 7.1 7.4 7.6 7.8 8.0 8.1 7 8 Federal government 0.0 0.0 0.0 0.0 0.0 0.0 0.0 0.0 0.0 0.0 0.0 8 9 U.S.-chartered depository institutions (FHLB) 39.7 36.7 30.6 28.4 27.8 27.6 27.6 27.0 27.8 26.2 27.3 9 10 Credit unions (FHLB) 2.4 2.2 2.9 2.9 2.4 3.0 3.0 3.0 2.4 2.4 2.6 10 11 Life insurance companies (FHLB) 2.9 2.9 2.1 2.2 3.2 2.1 2.1 2.3 3.2 3.2 3.4 11
Holding company net transactions with subsidiaries:
12 Liab.: U.S.-chartered depository institutions 1599.5 1632.8 1709.0 1889.2 1937.3 1916.9 1880.5 1898.0 1937.3 1978.7 2028.2 12 13 Property-casualty insurance companies 0.0 0.0 0.0 11.2 5.2 5.1 5.1 5.3 5.2 4.7 5.1 13 14 Life insurance companies 40.5 62.7 72.0 17.2 10.7 17.4 17.3 17.7 10.7 11.0 11.5 14 15 Finance companies 209.3 115.0 94.6 91.1 75.4 74.7 75.8 75.9 75.4 77.8 77.3 15 16 Brokers and dealers 596.1 626.6 613.5 1060.5 1087.6 1054.3 1072.5 1032.3 1087.6 1095.8 1110.9 16 17 Rest of the world 125.1 135.6 166.3 114.7 97.8 137.2 100.7 127.3 97.8 95.8 100.7 17
18 Asset: Holding companies 2570.3 2572.7 2655.4 3184.0 3214.0 3205.6 3151.8 3156.6 3214.0 3263.8 3333.7 18
NFC investment in finance company subsidiaries:
19 Liab.: Finance companies 71.2 60.7 69.1 71.7 86.4 85.7 86.9 87.1 86.4 89.2 88.6 19 20 Asset: Nonfinancial corporate business 71.2 60.7 69.1 71.7 86.4 85.7 86.9 87.1 86.4 89.2 88.6 20
Funding corporations’ investment in subsidiaries:
21 Liab.: Foreign banking offices in U.S. 203.1 171.6 137.8 126.0 123.5 142.9 142.1 118.7 123.5 123.9 120.8 21 22 Brokers and dealers 523.2 496.4 549.7 568.8 584.3 583.9 578.5 588.1 584.3 587.3 602.9 22
23 Asset: Funding corporations 726.3 667.9 687.6 694.8 707.8 726.8 720.6 706.8 707.8 711.2 723.8 23
Equity investment under Public-Private Inv. Program:
24 Liab.: Funding corporations 1.8 7.7 8.8 8.7 8.7 8.7 8.7 8.7 8.7 8.7 8.7 24 25 Asset: Households (1) 0.9 3.8 4.4 4.4 4.4 4.4 4.4 4.4 4.4 4.4 4.4 25 26 Federal government 0.9 3.8 4.4 4.4 4.4 4.4 4.4 4.4 4.4 4.4 4.4 26
(1) Funds invested by financial institutions such as domestic hedge funds through the Public-Private Investment Program (PPIP).
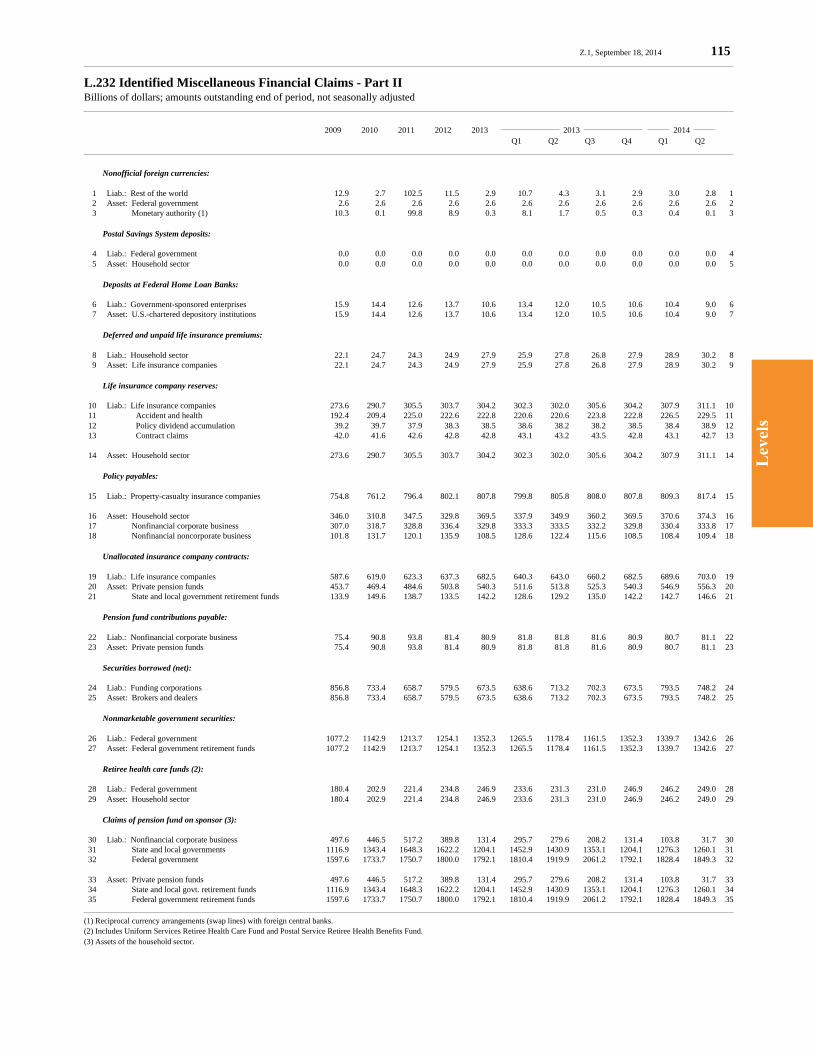
Lev
els
Z.1, September 18, 2014 115
L.232 Identified Miscellaneous Financial Claims - Part IIBillions of dollars; amounts outstanding end of period, not seasonally adjusted
2009 2010 2011 2012 2013 2013 2014 Q1 Q2 Q3 Q4 Q1 Q2
Nonofficial foreign currencies:
1 Liab.: Rest of the world 12.9 2.7 102.5 11.5 2.9 10.7 4.3 3.1 2.9 3.0 2.8 1 2 Asset: Federal government 2.6 2.6 2.6 2.6 2.6 2.6 2.6 2.6 2.6 2.6 2.6 2 3 Monetary authority (1) 10.3 0.1 99.8 8.9 0.3 8.1 1.7 0.5 0.3 0.4 0.1 3
Postal Savings System deposits:
4 Liab.: Federal government 0.0 0.0 0.0 0.0 0.0 0.0 0.0 0.0 0.0 0.0 0.0 4 5 Asset: Household sector 0.0 0.0 0.0 0.0 0.0 0.0 0.0 0.0 0.0 0.0 0.0 5
Deposits at Federal Home Loan Banks:
6 Liab.: Government-sponsored enterprises 15.9 14.4 12.6 13.7 10.6 13.4 12.0 10.5 10.6 10.4 9.0 6 7 Asset: U.S.-chartered depository institutions 15.9 14.4 12.6 13.7 10.6 13.4 12.0 10.5 10.6 10.4 9.0 7
Deferred and unpaid life insurance premiums:
8 Liab.: Household sector 22.1 24.7 24.3 24.9 27.9 25.9 27.8 26.8 27.9 28.9 30.2 8 9 Asset: Life insurance companies 22.1 24.7 24.3 24.9 27.9 25.9 27.8 26.8 27.9 28.9 30.2 9
Life insurance company reserves:
10 Liab.: Life insurance companies 273.6 290.7 305.5 303.7 304.2 302.3 302.0 305.6 304.2 307.9 311.1 10 11 Accident and health 192.4 209.4 225.0 222.6 222.8 220.6 220.6 223.8 222.8 226.5 229.5 11 12 Policy dividend accumulation 39.2 39.7 37.9 38.3 38.5 38.6 38.2 38.2 38.5 38.4 38.9 12 13 Contract claims 42.0 41.6 42.6 42.8 42.8 43.1 43.2 43.5 42.8 43.1 42.7 13
14 Asset: Household sector 273.6 290.7 305.5 303.7 304.2 302.3 302.0 305.6 304.2 307.9 311.1 14
Policy payables:
15 Liab.: Property-casualty insurance companies 754.8 761.2 796.4 802.1 807.8 799.8 805.8 808.0 807.8 809.3 817.4 15
16 Asset: Household sector 346.0 310.8 347.5 329.8 369.5 337.9 349.9 360.2 369.5 370.6 374.3 16 17 Nonfinancial corporate business 307.0 318.7 328.8 336.4 329.8 333.3 333.5 332.2 329.8 330.4 333.8 17 18 Nonfinancial noncorporate business 101.8 131.7 120.1 135.9 108.5 128.6 122.4 115.6 108.5 108.4 109.4 18
Unallocated insurance company contracts:
19 Liab.: Life insurance companies 587.6 619.0 623.3 637.3 682.5 640.3 643.0 660.2 682.5 689.6 703.0 19 20 Asset: Private pension funds 453.7 469.4 484.6 503.8 540.3 511.6 513.8 525.3 540.3 546.9 556.3 20 21 State and local government retirement funds 133.9 149.6 138.7 133.5 142.2 128.6 129.2 135.0 142.2 142.7 146.6 21
Pension fund contributions payable:
22 Liab.: Nonfinancial corporate business 75.4 90.8 93.8 81.4 80.9 81.8 81.8 81.6 80.9 80.7 81.1 22 23 Asset: Private pension funds 75.4 90.8 93.8 81.4 80.9 81.8 81.8 81.6 80.9 80.7 81.1 23
Securities borrowed (net):
24 Liab.: Funding corporations 856.8 733.4 658.7 579.5 673.5 638.6 713.2 702.3 673.5 793.5 748.2 24 25 Asset: Brokers and dealers 856.8 733.4 658.7 579.5 673.5 638.6 713.2 702.3 673.5 793.5 748.2 25
Nonmarketable government securities:
26 Liab.: Federal government 1077.2 1142.9 1213.7 1254.1 1352.3 1265.5 1178.4 1161.5 1352.3 1339.7 1342.6 26 27 Asset: Federal government retirement funds 1077.2 1142.9 1213.7 1254.1 1352.3 1265.5 1178.4 1161.5 1352.3 1339.7 1342.6 27
Retiree health care funds (2):
28 Liab.: Federal government 180.4 202.9 221.4 234.8 246.9 233.6 231.3 231.0 246.9 246.2 249.0 28 29 Asset: Household sector 180.4 202.9 221.4 234.8 246.9 233.6 231.3 231.0 246.9 246.2 249.0 29
Claims of pension fund on sponsor (3):
30 Liab.: Nonfinancial corporate business 497.6 446.5 517.2 389.8 131.4 295.7 279.6 208.2 131.4 103.8 31.7 30 31 State and local governments 1116.9 1343.4 1648.3 1622.2 1204.1 1452.9 1430.9 1353.1 1204.1 1276.3 1260.1 31 32 Federal government 1597.6 1733.7 1750.7 1800.0 1792.1 1810.4 1919.9 2061.2 1792.1 1828.4 1849.3 32
33 Asset: Private pension funds 497.6 446.5 517.2 389.8 131.4 295.7 279.6 208.2 131.4 103.8 31.7 33 34 State and local govt. retirement funds 1116.9 1343.4 1648.3 1622.2 1204.1 1452.9 1430.9 1353.1 1204.1 1276.3 1260.1 34 35 Federal government retirement funds 1597.6 1733.7 1750.7 1800.0 1792.1 1810.4 1919.9 2061.2 1792.1 1828.4 1849.3 35
(1) Reciprocal currency arrangements (swap lines) with foreign central banks.(2) Includes Uniform Services Retiree Health Care Fund and Postal Service Retiree Health Benefits Fund.(3) Assets of the household sector.
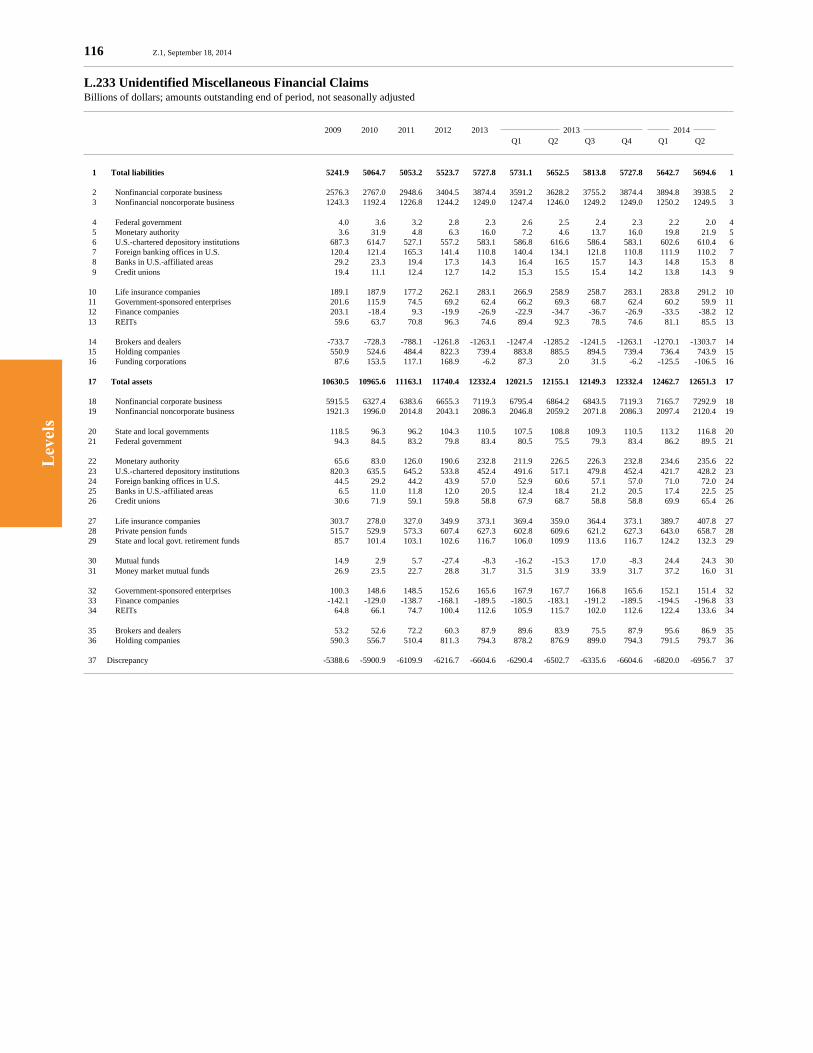
Lev
els
116 Z.1, September 18, 2014
L.233 Unidentified Miscellaneous Financial ClaimsBillions of dollars; amounts outstanding end of period, not seasonally adjusted
2009 2010 2011 2012 2013 2013 2014 Q1 Q2 Q3 Q4 Q1 Q2
1 Total liabilities 5241.9 5064.7 5053.2 5523.7 5727.8 5731.1 5652.5 5813.8 5727.8 5642.7 5694.6 1
2 Nonfinancial corporate business 2576.3 2767.0 2948.6 3404.5 3874.4 3591.2 3628.2 3755.2 3874.4 3894.8 3938.5 2 3 Nonfinancial noncorporate business 1243.3 1192.4 1226.8 1244.2 1249.0 1247.4 1246.0 1249.2 1249.0 1250.2 1249.5 3
4 Federal government 4.0 3.6 3.2 2.8 2.3 2.6 2.5 2.4 2.3 2.2 2.0 4 5 Monetary authority 3.6 31.9 4.8 6.3 16.0 7.2 4.6 13.7 16.0 19.8 21.9 5 6 U.S.-chartered depository institutions 687.3 614.7 527.1 557.2 583.1 586.8 616.6 586.4 583.1 602.6 610.4 6 7 Foreign banking offices in U.S. 120.4 121.4 165.3 141.4 110.8 140.4 134.1 121.8 110.8 111.9 110.2 7 8 Banks in U.S.-affiliated areas 29.2 23.3 19.4 17.3 14.3 16.4 16.5 15.7 14.3 14.8 15.3 8 9 Credit unions 19.4 11.1 12.4 12.7 14.2 15.3 15.5 15.4 14.2 13.8 14.3 9
10 Life insurance companies 189.1 187.9 177.2 262.1 283.1 266.9 258.9 258.7 283.1 283.8 291.2 10 11 Government-sponsored enterprises 201.6 115.9 74.5 69.2 62.4 66.2 69.3 68.7 62.4 60.2 59.9 11 12 Finance companies 203.1 -18.4 9.3 -19.9 -26.9 -22.9 -34.7 -36.7 -26.9 -33.5 -38.2 12 13 REITs 59.6 63.7 70.8 96.3 74.6 89.4 92.3 78.5 74.6 81.1 85.5 13
14 Brokers and dealers -733.7 -728.3 -788.1 -1261.8 -1263.1 -1247.4 -1285.2 -1241.5 -1263.1 -1270.1 -1303.7 14 15 Holding companies 550.9 524.6 484.4 822.3 739.4 883.8 885.5 894.5 739.4 736.4 743.9 15 16 Funding corporations 87.6 153.5 117.1 168.9 -6.2 87.3 2.0 31.5 -6.2 -125.5 -106.5 16
17 Total assets 10630.5 10965.6 11163.1 11740.4 12332.4 12021.5 12155.1 12149.3 12332.4 12462.7 12651.3 17
18 Nonfinancial corporate business 5915.5 6327.4 6383.6 6655.3 7119.3 6795.4 6864.2 6843.5 7119.3 7165.7 7292.9 18 19 Nonfinancial noncorporate business 1921.3 1996.0 2014.8 2043.1 2086.3 2046.8 2059.2 2071.8 2086.3 2097.4 2120.4 19
20 State and local governments 118.5 96.3 96.2 104.3 110.5 107.5 108.8 109.3 110.5 113.2 116.8 20 21 Federal government 94.3 84.5 83.2 79.8 83.4 80.5 75.5 79.3 83.4 86.2 89.5 21
22 Monetary authority 65.6 83.0 126.0 190.6 232.8 211.9 226.5 226.3 232.8 234.6 235.6 22 23 U.S.-chartered depository institutions 820.3 635.5 645.2 533.8 452.4 491.6 517.1 479.8 452.4 421.7 428.2 23 24 Foreign banking offices in U.S. 44.5 29.2 44.2 43.9 57.0 52.9 60.6 57.1 57.0 71.0 72.0 24 25 Banks in U.S.-affiliated areas 6.5 11.0 11.8 12.0 20.5 12.4 18.4 21.2 20.5 17.4 22.5 25 26 Credit unions 30.6 71.9 59.1 59.8 58.8 67.9 68.7 58.8 58.8 69.9 65.4 26
27 Life insurance companies 303.7 278.0 327.0 349.9 373.1 369.4 359.0 364.4 373.1 389.7 407.8 27 28 Private pension funds 515.7 529.9 573.3 607.4 627.3 602.8 609.6 621.2 627.3 643.0 658.7 28 29 State and local govt. retirement funds 85.7 101.4 103.1 102.6 116.7 106.0 109.9 113.6 116.7 124.2 132.3 29
30 Mutual funds 14.9 2.9 5.7 -27.4 -8.3 -16.2 -15.3 17.0 -8.3 24.4 24.3 30 31 Money market mutual funds 26.9 23.5 22.7 28.8 31.7 31.5 31.9 33.9 31.7 37.2 16.0 31
32 Government-sponsored enterprises 100.3 148.6 148.5 152.6 165.6 167.9 167.7 166.8 165.6 152.1 151.4 32 33 Finance companies -142.1 -129.0 -138.7 -168.1 -189.5 -180.5 -183.1 -191.2 -189.5 -194.5 -196.8 33 34 REITs 64.8 66.1 74.7 100.4 112.6 105.9 115.7 102.0 112.6 122.4 133.6 34
35 Brokers and dealers 53.2 52.6 72.2 60.3 87.9 89.6 83.9 75.5 87.9 95.6 86.9 35 36 Holding companies 590.3 556.7 510.4 811.3 794.3 878.2 876.9 899.0 794.3 791.5 793.7 36
37 Discrepancy -5388.6 -5900.9 -6109.9 -6216.7 -6604.6 -6290.4 -6502.7 -6335.6 -6604.6 -6820.0 -6956.7 37
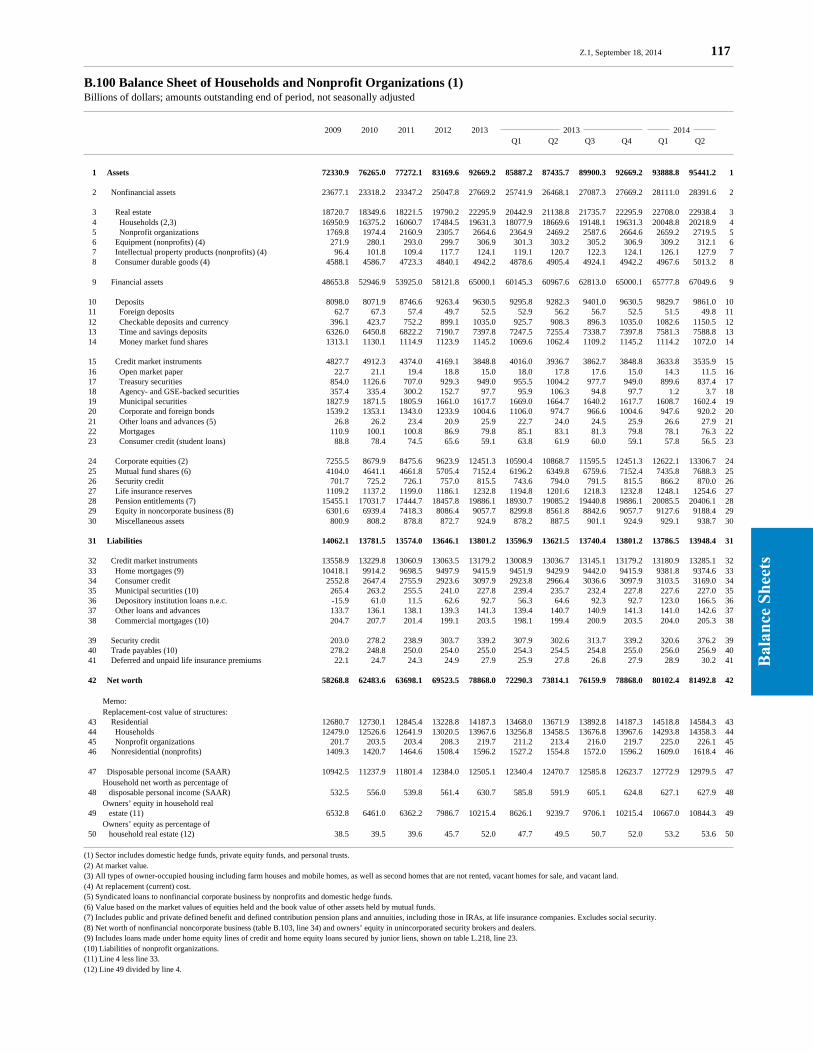
Bal
ance
Sh
eets
Z.1, September 18, 2014 117
B.100 Balance Sheet of Households and Nonprofit Organizations (1)Billions of dollars; amounts outstanding end of period, not seasonally adjusted
2009 2010 2011 2012 2013 2013 2014 Q1 Q2 Q3 Q4 Q1 Q2
1 Assets 72330.9 76265.0 77272.1 83169.6 92669.2 85887.2 87435.7 89900.3 92669.2 93888.8 95441.2 1
2 Nonfinancial assets 23677.1 23318.2 23347.2 25047.8 27669.2 25741.9 26468.1 27087.3 27669.2 28111.0 28391.6 2
3 Real estate 18720.7 18349.6 18221.5 19790.2 22295.9 20442.9 21138.8 21735.7 22295.9 22708.0 22938.4 3 4 Households (2,3) 16950.9 16375.2 16060.7 17484.5 19631.3 18077.9 18669.6 19148.1 19631.3 20048.8 20218.9 4 5 Nonprofit organizations 1769.8 1974.4 2160.9 2305.7 2664.6 2364.9 2469.2 2587.6 2664.6 2659.2 2719.5 5 6 Equipment (nonprofits) (4) 271.9 280.1 293.0 299.7 306.9 301.3 303.2 305.2 306.9 309.2 312.1 6 7 Intellectual property products (nonprofits) (4) 96.4 101.8 109.4 117.7 124.1 119.1 120.7 122.3 124.1 126.1 127.9 7 8 Consumer durable goods (4) 4588.1 4586.7 4723.3 4840.1 4942.2 4878.6 4905.4 4924.1 4942.2 4967.6 5013.2 8
9 Financial assets 48653.8 52946.9 53925.0 58121.8 65000.1 60145.3 60967.6 62813.0 65000.1 65777.8 67049.6 9
10 Deposits 8098.0 8071.9 8746.6 9263.4 9630.5 9295.8 9282.3 9401.0 9630.5 9829.7 9861.0 10 11 Foreign deposits 62.7 67.3 57.4 49.7 52.5 52.9 56.2 56.7 52.5 51.5 49.8 11 12 Checkable deposits and currency 396.1 423.7 752.2 899.1 1035.0 925.7 908.3 896.3 1035.0 1082.6 1150.5 12 13 Time and savings deposits 6326.0 6450.8 6822.2 7190.7 7397.8 7247.5 7255.4 7338.7 7397.8 7581.3 7588.8 13 14 Money market fund shares 1313.1 1130.1 1114.9 1123.9 1145.2 1069.6 1062.4 1109.2 1145.2 1114.2 1072.0 14
15 Credit market instruments 4827.7 4912.3 4374.0 4169.1 3848.8 4016.0 3936.7 3862.7 3848.8 3633.8 3535.9 15 16 Open market paper 22.7 21.1 19.4 18.8 15.0 18.0 17.8 17.6 15.0 14.3 11.5 16 17 Treasury securities 854.0 1126.6 707.0 929.3 949.0 955.5 1004.2 977.7 949.0 899.6 837.4 17 18 Agency- and GSE-backed securities 357.4 335.4 300.2 152.7 97.7 95.9 106.3 94.8 97.7 1.2 3.7 18 19 Municipal securities 1827.9 1871.5 1805.9 1661.0 1617.7 1669.0 1664.7 1640.2 1617.7 1608.7 1602.4 19 20 Corporate and foreign bonds 1539.2 1353.1 1343.0 1233.9 1004.6 1106.0 974.7 966.6 1004.6 947.6 920.2 20 21 Other loans and advances (5) 26.8 26.2 23.4 20.9 25.9 22.7 24.0 24.5 25.9 26.6 27.9 21 22 Mortgages 110.9 100.1 100.8 86.9 79.8 85.1 83.1 81.3 79.8 78.1 76.3 22 23 Consumer credit (student loans) 88.8 78.4 74.5 65.6 59.1 63.8 61.9 60.0 59.1 57.8 56.5 23
24 Corporate equities (2) 7255.5 8679.9 8475.6 9623.9 12451.3 10590.4 10868.7 11595.5 12451.3 12622.1 13306.7 24 25 Mutual fund shares (6) 4104.0 4641.1 4661.8 5705.4 7152.4 6196.2 6349.8 6759.6 7152.4 7435.8 7688.3 25 26 Security credit 701.7 725.2 726.1 757.0 815.5 743.6 794.0 791.5 815.5 866.2 870.0 26 27 Life insurance reserves 1109.2 1137.2 1199.0 1186.1 1232.8 1194.8 1201.6 1218.3 1232.8 1248.1 1254.6 27 28 Pension entitlements (7) 15455.1 17031.7 17444.7 18457.8 19886.1 18930.7 19085.2 19440.8 19886.1 20085.5 20406.1 28 29 Equity in noncorporate business (8) 6301.6 6939.4 7418.3 8086.4 9057.7 8299.8 8561.8 8842.6 9057.7 9127.6 9188.4 29 30 Miscellaneous assets 800.9 808.2 878.8 872.7 924.9 878.2 887.5 901.1 924.9 929.1 938.7 30
31 Liabilities 14062.1 13781.5 13574.0 13646.1 13801.2 13596.9 13621.5 13740.4 13801.2 13786.5 13948.4 31
32 Credit market instruments 13558.9 13229.8 13060.9 13063.5 13179.2 13008.9 13036.7 13145.1 13179.2 13180.9 13285.1 32 33 Home mortgages (9) 10418.1 9914.2 9698.5 9497.9 9415.9 9451.9 9429.9 9442.0 9415.9 9381.8 9374.6 33 34 Consumer credit 2552.8 2647.4 2755.9 2923.6 3097.9 2923.8 2966.4 3036.6 3097.9 3103.5 3169.0 34 35 Municipal securities (10) 265.4 263.2 255.5 241.0 227.8 239.4 235.7 232.4 227.8 227.6 227.0 35 36 Depository institution loans n.e.c. -15.9 61.0 11.5 62.6 92.7 56.3 64.6 92.3 92.7 123.0 166.5 36 37 Other loans and advances 133.7 136.1 138.1 139.3 141.3 139.4 140.7 140.9 141.3 141.0 142.6 37 38 Commercial mortgages (10) 204.7 207.7 201.4 199.1 203.5 198.1 199.4 200.9 203.5 204.0 205.3 38
39 Security credit 203.0 278.2 238.9 303.7 339.2 307.9 302.6 313.7 339.2 320.6 376.2 39 40 Trade payables (10) 278.2 248.8 250.0 254.0 255.0 254.3 254.5 254.8 255.0 256.0 256.9 40 41 Deferred and unpaid life insurance premiums 22.1 24.7 24.3 24.9 27.9 25.9 27.8 26.8 27.9 28.9 30.2 41
42 Net worth 58268.8 62483.6 63698.1 69523.5 78868.0 72290.3 73814.1 76159.9 78868.0 80102.4 81492.8 42
Memo: Replacement-cost value of structures: 43 Residential 12680.7 12730.1 12845.4 13228.8 14187.3 13468.0 13671.9 13892.8 14187.3 14518.8 14584.3 43 44 Households 12479.0 12526.6 12641.9 13020.5 13967.6 13256.8 13458.5 13676.8 13967.6 14293.8 14358.3 44 45 Nonprofit organizations 201.7 203.5 203.4 208.3 219.7 211.2 213.4 216.0 219.7 225.0 226.1 45 46 Nonresidential (nonprofits) 1409.3 1420.7 1464.6 1508.4 1596.2 1527.2 1554.8 1572.0 1596.2 1609.0 1618.4 46
47 Disposable personal income (SAAR) 10942.5 11237.9 11801.4 12384.0 12505.1 12340.4 12470.7 12585.8 12623.7 12772.9 12979.5 47 Household net worth as percentage of 48 disposable personal income (SAAR) 532.5 556.0 539.8 561.4 630.7 585.8 591.9 605.1 624.8 627.1 627.9 48 Owners’ equity in household real 49 estate (11) 6532.8 6461.0 6362.2 7986.7 10215.4 8626.1 9239.7 9706.1 10215.4 10667.0 10844.3 49 Owners’ equity as percentage of 50 household real estate (12) 38.5 39.5 39.6 45.7 52.0 47.7 49.5 50.7 52.0 53.2 53.6 50
(1) Sector includes domestic hedge funds, private equity funds, and personal trusts.(2) At market value.(3) All types of owner-occupied housing including farm houses and mobile homes, as well as second homes that are not rented, vacant homes for sale, and vacant land.(4) At replacement (current) cost.(5) Syndicated loans to nonfinancial corporate business by nonprofits and domestic hedge funds.(6) Value based on the market values of equities held and the book value of other assets held by mutual funds.(7) Includes public and private defined benefit and defined contribution pension plans and annuities, including those in IRAs, at life insurance companies. Excludes social security.(8) Net worth of nonfinancial noncorporate business (table B.103, line 34) and owners’ equity in unincorporated security brokers and dealers.(9) Includes loans made under home equity lines of credit and home equity loans secured by junior liens, shown on table L.218, line 23.(10) Liabilities of nonprofit organizations.(11) Line 4 less line 33.(12) Line 49 divided by line 4.
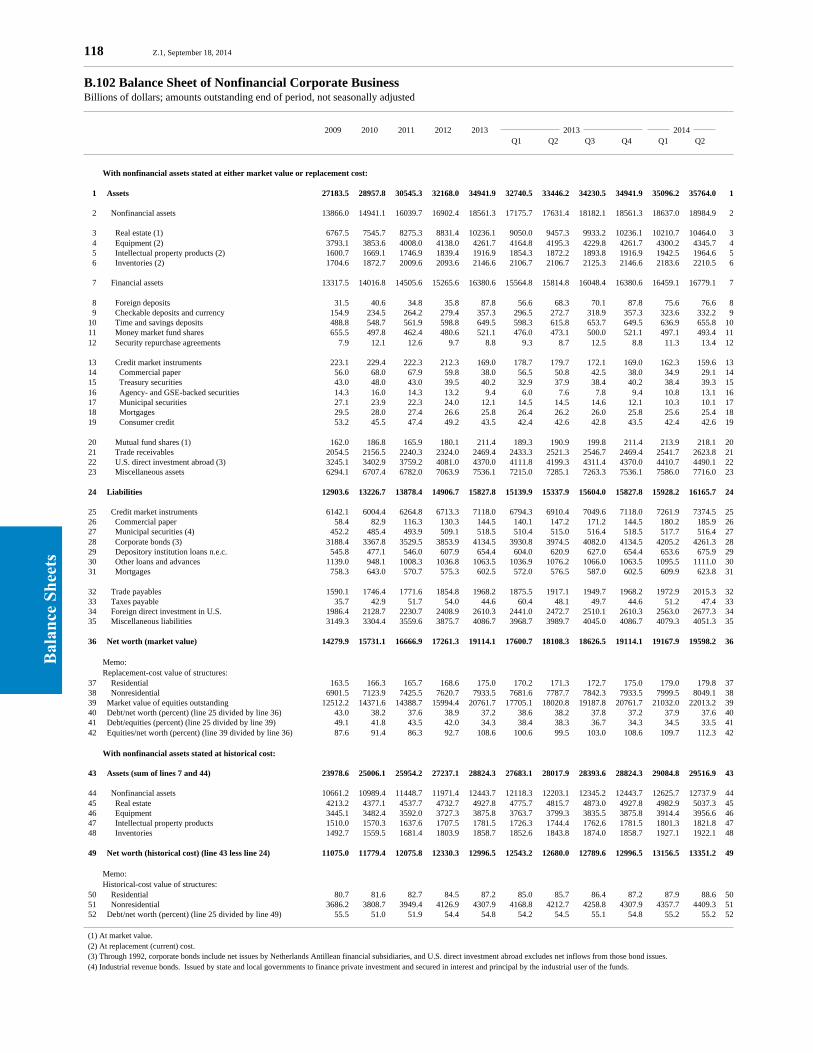
Bal
ance
Sh
eets
118 Z.1, September 18, 2014
B.102 Balance Sheet of Nonfinancial Corporate BusinessBillions of dollars; amounts outstanding end of period, not seasonally adjusted
2009 2010 2011 2012 2013 2013 2014 Q1 Q2 Q3 Q4 Q1 Q2
With nonfinancial assets stated at either market value or replacement cost:
1 Assets 27183.5 28957.8 30545.3 32168.0 34941.9 32740.5 33446.2 34230.5 34941.9 35096.2 35764.0 1
2 Nonfinancial assets 13866.0 14941.1 16039.7 16902.4 18561.3 17175.7 17631.4 18182.1 18561.3 18637.0 18984.9 2
3 Real estate (1) 6767.5 7545.7 8275.3 8831.4 10236.1 9050.0 9457.3 9933.2 10236.1 10210.7 10464.0 3 4 Equipment (2) 3793.1 3853.6 4008.0 4138.0 4261.7 4164.8 4195.3 4229.8 4261.7 4300.2 4345.7 4 5 Intellectual property products (2) 1600.7 1669.1 1746.9 1839.4 1916.9 1854.3 1872.2 1893.8 1916.9 1942.5 1964.6 5 6 Inventories (2) 1704.6 1872.7 2009.6 2093.6 2146.6 2106.7 2106.7 2125.3 2146.6 2183.6 2210.5 6
7 Financial assets 13317.5 14016.8 14505.6 15265.6 16380.6 15564.8 15814.8 16048.4 16380.6 16459.1 16779.1 7
8 Foreign deposits 31.5 40.6 34.8 35.8 87.8 56.6 68.3 70.1 87.8 75.6 76.6 8 9 Checkable deposits and currency 154.9 234.5 264.2 279.4 357.3 296.5 272.7 318.9 357.3 323.6 332.2 9 10 Time and savings deposits 488.8 548.7 561.9 598.8 649.5 598.3 615.8 653.7 649.5 636.9 655.8 10 11 Money market fund shares 655.5 497.8 462.4 480.6 521.1 476.0 473.1 500.0 521.1 497.1 493.4 11 12 Security repurchase agreements 7.9 12.1 12.6 9.7 8.8 9.3 8.7 12.5 8.8 11.3 13.4 12
13 Credit market instruments 223.1 229.4 222.3 212.3 169.0 178.7 179.7 172.1 169.0 162.3 159.6 13 14 Commercial paper 56.0 68.0 67.9 59.8 38.0 56.5 50.8 42.5 38.0 34.9 29.1 14 15 Treasury securities 43.0 48.0 43.0 39.5 40.2 32.9 37.9 38.4 40.2 38.4 39.3 15 16 Agency- and GSE-backed securities 14.3 16.0 14.3 13.2 9.4 6.0 7.6 7.8 9.4 10.8 13.1 16 17 Municipal securities 27.1 23.9 22.3 24.0 12.1 14.5 14.5 14.6 12.1 10.3 10.1 17 18 Mortgages 29.5 28.0 27.4 26.6 25.8 26.4 26.2 26.0 25.8 25.6 25.4 18 19 Consumer credit 53.2 45.5 47.4 49.2 43.5 42.4 42.6 42.8 43.5 42.4 42.6 19
20 Mutual fund shares (1) 162.0 186.8 165.9 180.1 211.4 189.3 190.9 199.8 211.4 213.9 218.1 20 21 Trade receivables 2054.5 2156.5 2240.3 2324.0 2469.4 2433.3 2521.3 2546.7 2469.4 2541.7 2623.8 21 22 U.S. direct investment abroad (3) 3245.1 3402.9 3759.2 4081.0 4370.0 4111.8 4199.3 4311.4 4370.0 4410.7 4490.1 22 23 Miscellaneous assets 6294.1 6707.4 6782.0 7063.9 7536.1 7215.0 7285.1 7263.3 7536.1 7586.0 7716.0 23
24 Liabilities 12903.6 13226.7 13878.4 14906.7 15827.8 15139.9 15337.9 15604.0 15827.8 15928.2 16165.7 24
25 Credit market instruments 6142.1 6004.4 6264.8 6713.3 7118.0 6794.3 6910.4 7049.6 7118.0 7261.9 7374.5 25 26 Commercial paper 58.4 82.9 116.3 130.3 144.5 140.1 147.2 171.2 144.5 180.2 185.9 26 27 Municipal securities (4) 452.2 485.4 493.9 509.1 518.5 510.4 515.0 516.4 518.5 517.7 516.4 27 28 Corporate bonds (3) 3188.4 3367.8 3529.5 3853.9 4134.5 3930.8 3974.5 4082.0 4134.5 4205.2 4261.3 28 29 Depository institution loans n.e.c. 545.8 477.1 546.0 607.9 654.4 604.0 620.9 627.0 654.4 653.6 675.9 29 30 Other loans and advances 1139.0 948.1 1008.3 1036.8 1063.5 1036.9 1076.2 1066.0 1063.5 1095.5 1111.0 30 31 Mortgages 758.3 643.0 570.7 575.3 602.5 572.0 576.5 587.0 602.5 609.9 623.8 31
32 Trade payables 1590.1 1746.4 1771.6 1854.8 1968.2 1875.5 1917.1 1949.7 1968.2 1972.9 2015.3 32 33 Taxes payable 35.7 42.9 51.7 54.0 44.6 60.4 48.1 49.7 44.6 51.2 47.4 33 34 Foreign direct investment in U.S. 1986.4 2128.7 2230.7 2408.9 2610.3 2441.0 2472.7 2510.1 2610.3 2563.0 2677.3 34 35 Miscellaneous liabilities 3149.3 3304.4 3559.6 3875.7 4086.7 3968.7 3989.7 4045.0 4086.7 4079.3 4051.3 35
36 Net worth (market value) 14279.9 15731.1 16666.9 17261.3 19114.1 17600.7 18108.3 18626.5 19114.1 19167.9 19598.2 36
Memo: Replacement-cost value of structures: 37 Residential 163.5 166.3 165.7 168.6 175.0 170.2 171.3 172.7 175.0 179.0 179.8 37 38 Nonresidential 6901.5 7123.9 7425.5 7620.7 7933.5 7681.6 7787.7 7842.3 7933.5 7999.5 8049.1 38 39 Market value of equities outstanding 12512.2 14371.6 14388.7 15994.4 20761.7 17705.1 18020.8 19187.8 20761.7 21032.0 22013.2 39 40 Debt/net worth (percent) (line 25 divided by line 36) 43.0 38.2 37.6 38.9 37.2 38.6 38.2 37.8 37.2 37.9 37.6 40 41 Debt/equities (percent) (line 25 divided by line 39) 49.1 41.8 43.5 42.0 34.3 38.4 38.3 36.7 34.3 34.5 33.5 41 42 Equities/net worth (percent) (line 39 divided by line 36) 87.6 91.4 86.3 92.7 108.6 100.6 99.5 103.0 108.6 109.7 112.3 42
With nonfinancial assets stated at historical cost:
43 Assets (sum of lines 7 and 44) 23978.6 25006.1 25954.2 27237.1 28824.3 27683.1 28017.9 28393.6 28824.3 29084.8 29516.9 43
44 Nonfinancial assets 10661.2 10989.4 11448.7 11971.4 12443.7 12118.3 12203.1 12345.2 12443.7 12625.7 12737.9 44 45 Real estate 4213.2 4377.1 4537.7 4732.7 4927.8 4775.7 4815.7 4873.0 4927.8 4982.9 5037.3 45 46 Equipment 3445.1 3482.4 3592.0 3727.3 3875.8 3763.7 3799.3 3835.5 3875.8 3914.4 3956.6 46 47 Intellectual property products 1510.0 1570.3 1637.6 1707.5 1781.5 1726.3 1744.4 1762.6 1781.5 1801.3 1821.8 47 48 Inventories 1492.7 1559.5 1681.4 1803.9 1858.7 1852.6 1843.8 1874.0 1858.7 1927.1 1922.1 48
49 Net worth (historical cost) (line 43 less line 24) 11075.0 11779.4 12075.8 12330.3 12996.5 12543.2 12680.0 12789.6 12996.5 13156.5 13351.2 49
Memo: Historical-cost value of structures: 50 Residential 80.7 81.6 82.7 84.5 87.2 85.0 85.7 86.4 87.2 87.9 88.6 50 51 Nonresidential 3686.2 3808.7 3949.4 4126.9 4307.9 4168.8 4212.7 4258.8 4307.9 4357.7 4409.3 51 52 Debt/net worth (percent) (line 25 divided by line 49) 55.5 51.0 51.9 54.4 54.8 54.2 54.5 55.1 54.8 55.2 55.2 52
(1) At market value. (2) At replacement (current) cost. (3) Through 1992, corporate bonds include net issues by Netherlands Antillean financial subsidiaries, and U.S. direct investment abroad excludes net inflows from those bond issues. (4) Industrial revenue bonds. Issued by state and local governments to finance private investment and secured in interest and principal by the industrial user of the funds.
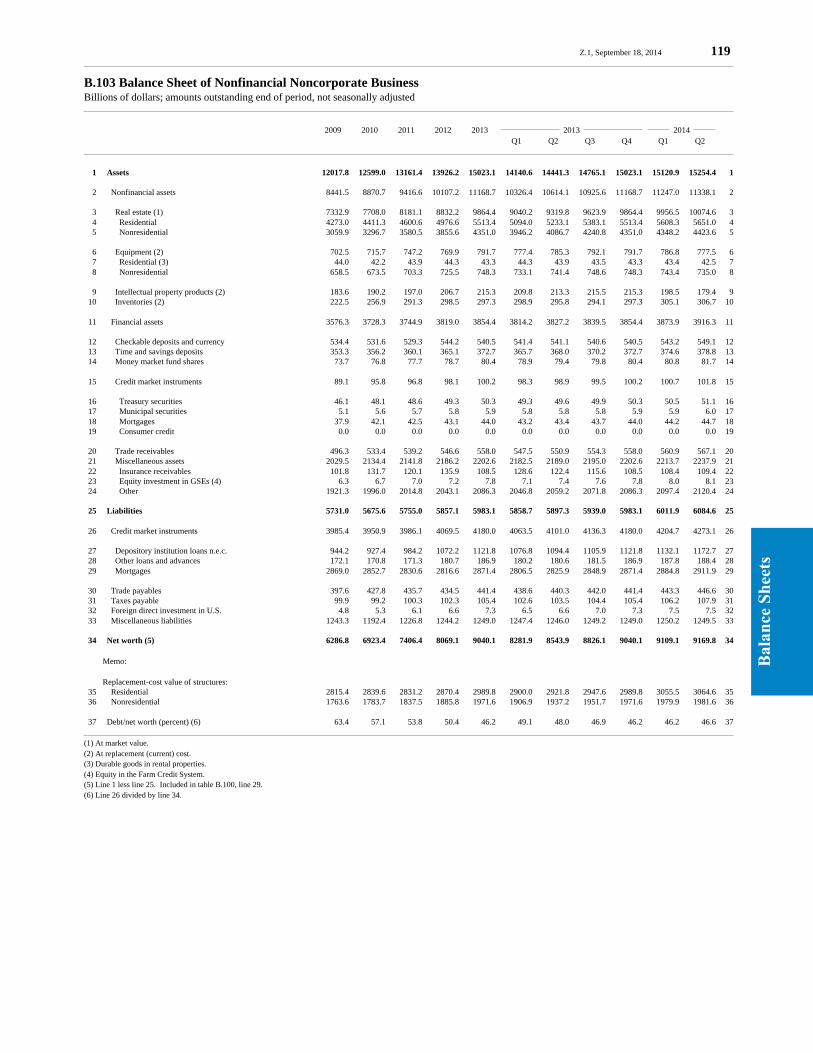
Bal
ance
Sh
eets
Z.1, September 18, 2014 119
B.103 Balance Sheet of Nonfinancial Noncorporate BusinessBillions of dollars; amounts outstanding end of period, not seasonally adjusted
2009 2010 2011 2012 2013 2013 2014 Q1 Q2 Q3 Q4 Q1 Q2
1 Assets 12017.8 12599.0 13161.4 13926.2 15023.1 14140.6 14441.3 14765.1 15023.1 15120.9 15254.4 1
2 Nonfinancial assets 8441.5 8870.7 9416.6 10107.2 11168.7 10326.4 10614.1 10925.6 11168.7 11247.0 11338.1 2
3 Real estate (1) 7332.9 7708.0 8181.1 8832.2 9864.4 9040.2 9319.8 9623.9 9864.4 9956.5 10074.6 3 4 Residential 4273.0 4411.3 4600.6 4976.6 5513.4 5094.0 5233.1 5383.1 5513.4 5608.3 5651.0 4 5 Nonresidential 3059.9 3296.7 3580.5 3855.6 4351.0 3946.2 4086.7 4240.8 4351.0 4348.2 4423.6 5
6 Equipment (2) 702.5 715.7 747.2 769.9 791.7 777.4 785.3 792.1 791.7 786.8 777.5 6 7 Residential (3) 44.0 42.2 43.9 44.3 43.3 44.3 43.9 43.5 43.3 43.4 42.5 7 8 Nonresidential 658.5 673.5 703.3 725.5 748.3 733.1 741.4 748.6 748.3 743.4 735.0 8
9 Intellectual property products (2) 183.6 190.2 197.0 206.7 215.3 209.8 213.3 215.5 215.3 198.5 179.4 9 10 Inventories (2) 222.5 256.9 291.3 298.5 297.3 298.9 295.8 294.1 297.3 305.1 306.7 10
11 Financial assets 3576.3 3728.3 3744.9 3819.0 3854.4 3814.2 3827.2 3839.5 3854.4 3873.9 3916.3 11
12 Checkable deposits and currency 534.4 531.6 529.3 544.2 540.5 541.4 541.1 540.6 540.5 543.2 549.1 12 13 Time and savings deposits 353.3 356.2 360.1 365.1 372.7 365.7 368.0 370.2 372.7 374.6 378.8 13 14 Money market fund shares 73.7 76.8 77.7 78.7 80.4 78.9 79.4 79.8 80.4 80.8 81.7 14
15 Credit market instruments 89.1 95.8 96.8 98.1 100.2 98.3 98.9 99.5 100.2 100.7 101.8 15
16 Treasury securities 46.1 48.1 48.6 49.3 50.3 49.3 49.6 49.9 50.3 50.5 51.1 16 17 Municipal securities 5.1 5.6 5.7 5.8 5.9 5.8 5.8 5.8 5.9 5.9 6.0 17 18 Mortgages 37.9 42.1 42.5 43.1 44.0 43.2 43.4 43.7 44.0 44.2 44.7 18 19 Consumer credit 0.0 0.0 0.0 0.0 0.0 0.0 0.0 0.0 0.0 0.0 0.0 19
20 Trade receivables 496.3 533.4 539.2 546.6 558.0 547.5 550.9 554.3 558.0 560.9 567.1 20 21 Miscellaneous assets 2029.5 2134.4 2141.8 2186.2 2202.6 2182.5 2189.0 2195.0 2202.6 2213.7 2237.9 21 22 Insurance receivables 101.8 131.7 120.1 135.9 108.5 128.6 122.4 115.6 108.5 108.4 109.4 22 23 Equity investment in GSEs (4) 6.3 6.7 7.0 7.2 7.8 7.1 7.4 7.6 7.8 8.0 8.1 23 24 Other 1921.3 1996.0 2014.8 2043.1 2086.3 2046.8 2059.2 2071.8 2086.3 2097.4 2120.4 24
25 Liabilities 5731.0 5675.6 5755.0 5857.1 5983.1 5858.7 5897.3 5939.0 5983.1 6011.9 6084.6 25
26 Credit market instruments 3985.4 3950.9 3986.1 4069.5 4180.0 4063.5 4101.0 4136.3 4180.0 4204.7 4273.1 26
27 Depository institution loans n.e.c. 944.2 927.4 984.2 1072.2 1121.8 1076.8 1094.4 1105.9 1121.8 1132.1 1172.7 27 28 Other loans and advances 172.1 170.8 171.3 180.7 186.9 180.2 180.6 181.5 186.9 187.8 188.4 28 29 Mortgages 2869.0 2852.7 2830.6 2816.6 2871.4 2806.5 2825.9 2848.9 2871.4 2884.8 2911.9 29
30 Trade payables 397.6 427.8 435.7 434.5 441.4 438.6 440.3 442.0 441.4 443.3 446.6 30 31 Taxes payable 99.9 99.2 100.3 102.3 105.4 102.6 103.5 104.4 105.4 106.2 107.9 31 32 Foreign direct investment in U.S. 4.8 5.3 6.1 6.6 7.3 6.5 6.6 7.0 7.3 7.5 7.5 32 33 Miscellaneous liabilities 1243.3 1192.4 1226.8 1244.2 1249.0 1247.4 1246.0 1249.2 1249.0 1250.2 1249.5 33
34 Net worth (5) 6286.8 6923.4 7406.4 8069.1 9040.1 8281.9 8543.9 8826.1 9040.1 9109.1 9169.8 34
Memo:
Replacement-cost value of structures: 35 Residential 2815.4 2839.6 2831.2 2870.4 2989.8 2900.0 2921.8 2947.6 2989.8 3055.5 3064.6 35 36 Nonresidential 1763.6 1783.7 1837.5 1885.8 1971.6 1906.9 1937.2 1951.7 1971.6 1979.9 1981.6 36
37 Debt/net worth (percent) (6) 63.4 57.1 53.8 50.4 46.2 49.1 48.0 46.9 46.2 46.2 46.6 37
(1) At market value.(2) At replacement (current) cost.(3) Durable goods in rental properties.(4) Equity in the Farm Credit System.(5) Line 1 less line 25. Included in table B.100, line 29.(6) Line 26 divided by line 34.
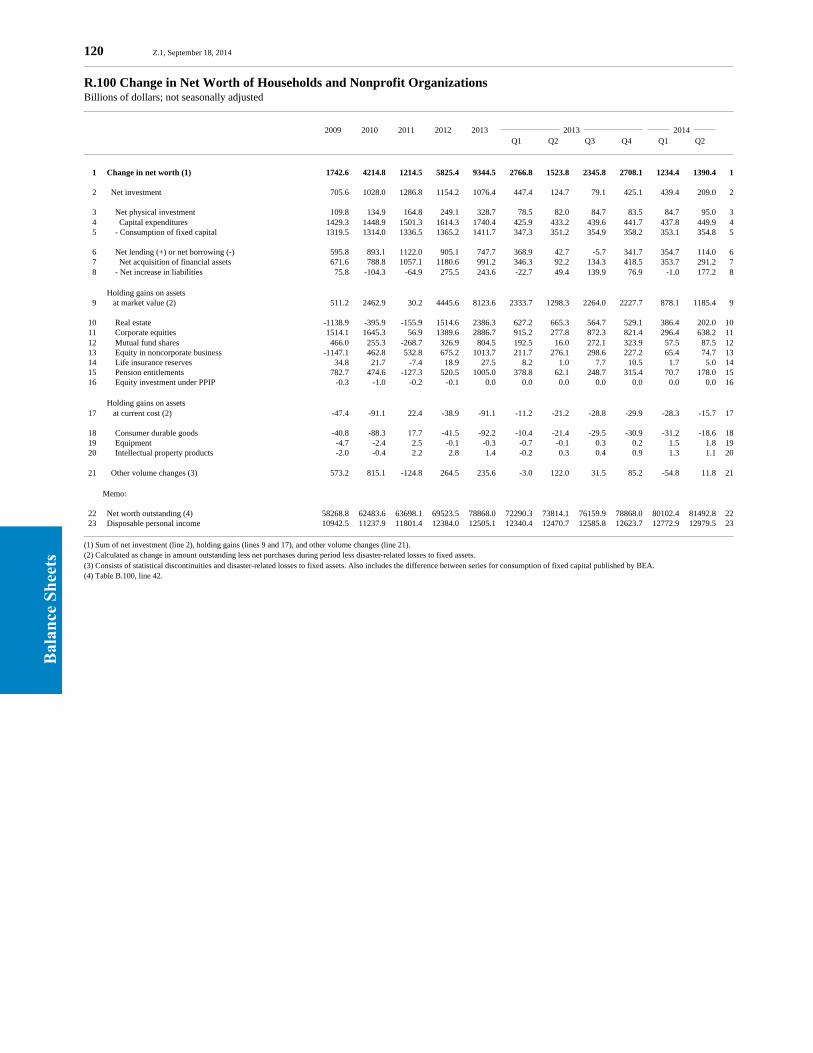
Bal
ance
Sh
eets
120 Z.1, September 18, 2014
R.100 Change in Net Worth of Households and Nonprofit OrganizationsBillions of dollars; not seasonally adjusted
2009 2010 2011 2012 2013 2013 2014 Q1 Q2 Q3 Q4 Q1 Q2
1 Change in net worth (1) 1742.6 4214.8 1214.5 5825.4 9344.5 2766.8 1523.8 2345.8 2708.1 1234.4 1390.4 1
2 Net investment 705.6 1028.0 1286.8 1154.2 1076.4 447.4 124.7 79.1 425.1 439.4 209.0 2
3 Net physical investment 109.8 134.9 164.8 249.1 328.7 78.5 82.0 84.7 83.5 84.7 95.0 3 4 Capital expenditures 1429.3 1448.9 1501.3 1614.3 1740.4 425.9 433.2 439.6 441.7 437.8 449.9 4 5 - Consumption of fixed capital 1319.5 1314.0 1336.5 1365.2 1411.7 347.3 351.2 354.9 358.2 353.1 354.8 5
6 Net lending (+) or net borrowing (-) 595.8 893.1 1122.0 905.1 747.7 368.9 42.7 -5.7 341.7 354.7 114.0 6 7 Net acquisition of financial assets 671.6 788.8 1057.1 1180.6 991.2 346.3 92.2 134.3 418.5 353.7 291.2 7 8 - Net increase in liabilities 75.8 -104.3 -64.9 275.5 243.6 -22.7 49.4 139.9 76.9 -1.0 177.2 8
Holding gains on assets 9 at market value (2) 511.2 2462.9 30.2 4445.6 8123.6 2333.7 1298.3 2264.0 2227.7 878.1 1185.4 9
10 Real estate -1138.9 -395.9 -155.9 1514.6 2386.3 627.2 665.3 564.7 529.1 386.4 202.0 10 11 Corporate equities 1514.1 1645.3 56.9 1389.6 2886.7 915.2 277.8 872.3 821.4 296.4 638.2 11 12 Mutual fund shares 466.0 255.3 -268.7 326.9 804.5 192.5 16.0 272.1 323.9 57.5 87.5 12 13 Equity in noncorporate business -1147.1 462.8 532.8 675.2 1013.7 211.7 276.1 298.6 227.2 65.4 74.7 13 14 Life insurance reserves 34.8 21.7 -7.4 18.9 27.5 8.2 1.0 7.7 10.5 1.7 5.0 14 15 Pension entitlements 782.7 474.6 -127.3 520.5 1005.0 378.8 62.1 248.7 315.4 70.7 178.0 15 16 Equity investment under PPIP -0.3 -1.0 -0.2 -0.1 0.0 0.0 0.0 0.0 0.0 0.0 0.0 16
Holding gains on assets 17 at current cost (2) -47.4 -91.1 22.4 -38.9 -91.1 -11.2 -21.2 -28.8 -29.9 -28.3 -15.7 17
18 Consumer durable goods -40.8 -88.3 17.7 -41.5 -92.2 -10.4 -21.4 -29.5 -30.9 -31.2 -18.6 18 19 Equipment -4.7 -2.4 2.5 -0.1 -0.3 -0.7 -0.1 0.3 0.2 1.5 1.8 19 20 Intellectual property products -2.0 -0.4 2.2 2.8 1.4 -0.2 0.3 0.4 0.9 1.3 1.1 20
21 Other volume changes (3) 573.2 815.1 -124.8 264.5 235.6 -3.0 122.0 31.5 85.2 -54.8 11.8 21
Memo:
22 Net worth outstanding (4) 58268.8 62483.6 63698.1 69523.5 78868.0 72290.3 73814.1 76159.9 78868.0 80102.4 81492.8 22 23 Disposable personal income 10942.5 11237.9 11801.4 12384.0 12505.1 12340.4 12470.7 12585.8 12623.7 12772.9 12979.5 23
(1) Sum of net investment (line 2), holding gains (lines 9 and 17), and other volume changes (line 21).(2) Calculated as change in amount outstanding less net purchases during period less disaster-related losses to fixed assets.(3) Consists of statistical discontinuities and disaster-related losses to fixed assets. Also includes the difference between series for consumption of fixed capital published by BEA.(4) Table B.100, line 42.
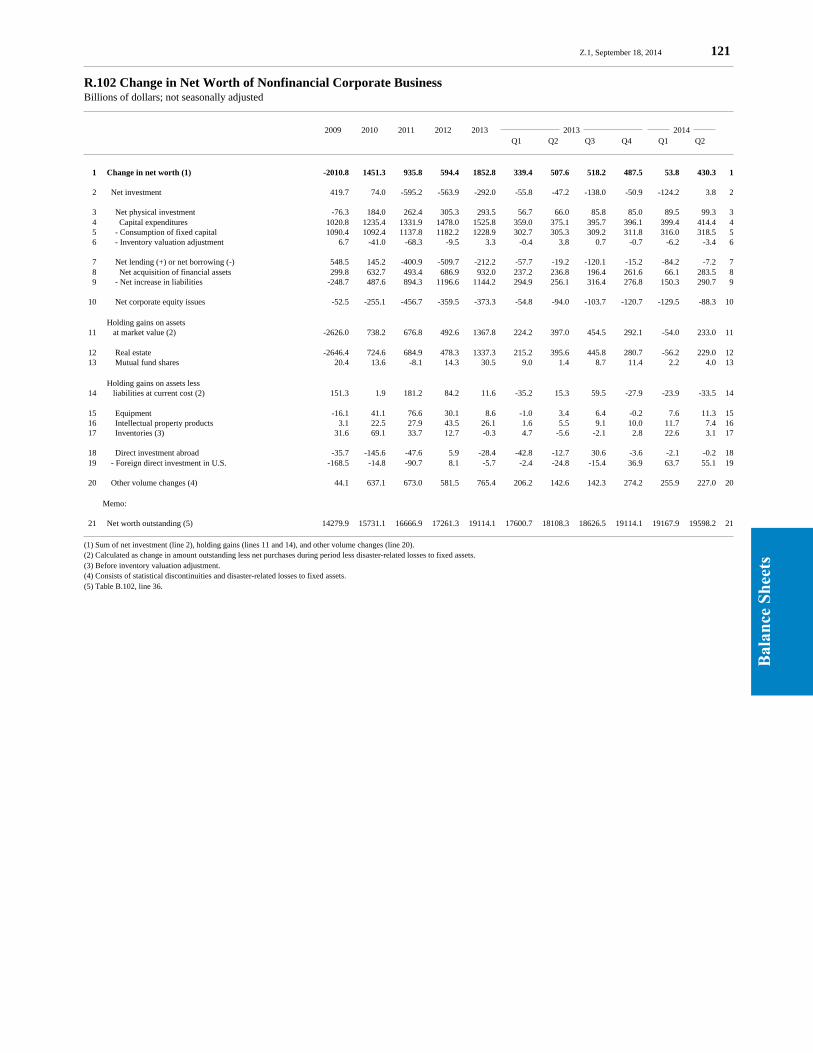
Bal
ance
Sh
eets
Z.1, September 18, 2014 121
R.102 Change in Net Worth of Nonfinancial Corporate BusinessBillions of dollars; not seasonally adjusted
2009 2010 2011 2012 2013 2013 2014 Q1 Q2 Q3 Q4 Q1 Q2
1 Change in net worth (1) -2010.8 1451.3 935.8 594.4 1852.8 339.4 507.6 518.2 487.5 53.8 430.3 1
2 Net investment 419.7 74.0 -595.2 -563.9 -292.0 -55.8 -47.2 -138.0 -50.9 -124.2 3.8 2
3 Net physical investment -76.3 184.0 262.4 305.3 293.5 56.7 66.0 85.8 85.0 89.5 99.3 3 4 Capital expenditures 1020.8 1235.4 1331.9 1478.0 1525.8 359.0 375.1 395.7 396.1 399.4 414.4 4 5 - Consumption of fixed capital 1090.4 1092.4 1137.8 1182.2 1228.9 302.7 305.3 309.2 311.8 316.0 318.5 5 6 - Inventory valuation adjustment 6.7 -41.0 -68.3 -9.5 3.3 -0.4 3.8 0.7 -0.7 -6.2 -3.4 6
7 Net lending (+) or net borrowing (-) 548.5 145.2 -400.9 -509.7 -212.2 -57.7 -19.2 -120.1 -15.2 -84.2 -7.2 7 8 Net acquisition of financial assets 299.8 632.7 493.4 686.9 932.0 237.2 236.8 196.4 261.6 66.1 283.5 8 9 - Net increase in liabilities -248.7 487.6 894.3 1196.6 1144.2 294.9 256.1 316.4 276.8 150.3 290.7 9
10 Net corporate equity issues -52.5 -255.1 -456.7 -359.5 -373.3 -54.8 -94.0 -103.7 -120.7 -129.5 -88.3 10
Holding gains on assets 11 at market value (2) -2626.0 738.2 676.8 492.6 1367.8 224.2 397.0 454.5 292.1 -54.0 233.0 11
12 Real estate -2646.4 724.6 684.9 478.3 1337.3 215.2 395.6 445.8 280.7 -56.2 229.0 12 13 Mutual fund shares 20.4 13.6 -8.1 14.3 30.5 9.0 1.4 8.7 11.4 2.2 4.0 13
Holding gains on assets less 14 liabilities at current cost (2) 151.3 1.9 181.2 84.2 11.6 -35.2 15.3 59.5 -27.9 -23.9 -33.5 14
15 Equipment -16.1 41.1 76.6 30.1 8.6 -1.0 3.4 6.4 -0.2 7.6 11.3 15 16 Intellectual property products 3.1 22.5 27.9 43.5 26.1 1.6 5.5 9.1 10.0 11.7 7.4 16 17 Inventories (3) 31.6 69.1 33.7 12.7 -0.3 4.7 -5.6 -2.1 2.8 22.6 3.1 17
18 Direct investment abroad -35.7 -145.6 -47.6 5.9 -28.4 -42.8 -12.7 30.6 -3.6 -2.1 -0.2 18 19 - Foreign direct investment in U.S. -168.5 -14.8 -90.7 8.1 -5.7 -2.4 -24.8 -15.4 36.9 63.7 55.1 19
20 Other volume changes (4) 44.1 637.1 673.0 581.5 765.4 206.2 142.6 142.3 274.2 255.9 227.0 20
Memo:
21 Net worth outstanding (5) 14279.9 15731.1 16666.9 17261.3 19114.1 17600.7 18108.3 18626.5 19114.1 19167.9 19598.2 21
(1) Sum of net investment (line 2), holding gains (lines 11 and 14), and other volume changes (line 20).(2) Calculated as change in amount outstanding less net purchases during period less disaster-related losses to fixed assets.(3) Before inventory valuation adjustment.(4) Consists of statistical discontinuities and disaster-related losses to fixed assets.(5) Table B.102, line 36.

Bal
ance
Sh
eets
122 Z.1, September 18, 2014
R.103 Change in Net Worth of Nonfinancial Noncorporate BusinessBillions of dollars; not seasonally adjusted
2009 2010 2011 2012 2013 2013 2014 Q1 Q2 Q3 Q4 Q1 Q2
1 Change in net worth (1) -1251.3 636.6 483.0 662.7 971.0 212.7 262.1 282.2 213.9 69.0 60.8 1
2 Net capital transfers paid -6.0 -7.8 -1.6 -4.9 -0.0 -0.0 -0.0 -0.0 -0.0 -0.0 0.0 2
3 Net investment -106.1 166.7 -57.0 -7.2 -43.0 1.7 -15.5 -14.9 -14.1 2.9 -14.4 3
4 Net physical investment -42.7 -25.7 12.6 27.8 51.9 9.4 11.3 15.5 15.7 12.9 16.7 4 5 Capital expenditures 227.9 245.1 281.7 303.7 337.9 79.7 82.4 87.4 88.4 86.7 91.0 5 6 - Consumption of fixed capital 270.7 270.9 269.1 275.9 286.0 70.3 71.1 71.9 72.8 73.8 74.3 6
7 Net lending (+) or net borrowing (-) 48.7 33.5 -11.0 -22.9 -51.9 -9.4 -11.3 -15.5 -15.7 -12.9 -16.7 7 8 Net acquisition of financial assets -117.1 152.0 16.6 74.1 35.4 -4.8 13.0 12.3 14.9 19.5 42.4 8 9 - Net increase in liabilities -165.8 118.5 27.6 97.0 87.3 4.6 24.3 27.8 30.6 32.4 59.1 9
10 Proprietor’s net investment (2) -112.1 158.9 -58.6 -12.2 -43.0 1.7 -15.5 -14.9 -14.1 2.9 -14.4 10
11 Holding gains on real estate (3) -1187.1 390.8 482.6 649.4 1015.5 205.9 275.9 299.1 234.6 85.2 110.9 11
12 Residential -469.3 155.2 203.8 389.6 535.1 118.3 138.9 148.9 129.0 93.1 41.0 12 13 Nonresidential -717.9 235.6 278.8 259.9 480.4 87.6 136.9 150.2 105.6 -7.8 69.9 13
14 Holding gains on assets at current cost (3) 30.4 64.0 49.9 22.2 -6.1 3.8 0.5 -3.0 -7.3 -19.8 -36.5 14
15 Residential equipment -2.7 -2.3 1.0 -0.4 -2.1 -0.3 -0.8 -0.6 -0.4 0.3 -0.8 15 16 Nonresidential equipment 24.3 26.5 17.8 11.7 9.3 4.3 5.1 4.0 -4.1 -8.7 -13.0 16 17 Intellectual property products 10.2 9.3 4.2 6.6 5.4 2.3 2.6 1.5 -1.0 -17.5 -20.0 17 18 Inventories -0.3 30.7 27.6 4.1 -18.5 -2.5 -6.5 -7.9 -1.6 6.0 -2.8 18 19 - Foreign direct investment in U.S. 1.0 0.2 0.8 -0.1 0.2 0.0 0.0 0.0 0.2 0.0 0.0 19
20 Other volume changes (4) 17.5 22.9 9.1 3.3 4.5 1.4 1.3 1.1 0.8 0.7 0.8 20
Memo:
21 Net worth outstanding (5) 6286.8 6923.4 7406.4 8069.1 9040.1 8281.9 8543.9 8826.1 9040.1 9109.1 9169.8 21
(1) Sum of net capital transfers paid (line 2), net investment (line 3), holding gains (lines 11 and 14), and other volume changes (line 20).(2) Shown on table F.103, line 31.(3) Calculated as change in amount outstanding less net investment during period less disaster-related losses to fixed assets.(4) Consists of statistical discontinuities and disaster-related losses to fixed assets.(5) Table B.103, line 34.

Su
pp
lem
ents
Z.1, September 18, 2014 123
B.100.e Balance Sheet of Households and Nonprofit Organizations with Equity DetailBillions of dollars; amounts outstanding end of period, not seasonally adjusted
2009 2010 2011 2012 2013 2013 2014 Q1 Q2 Q3 Q4 Q1 Q2
1 Assets 72330.9 76265.0 77272.1 83169.6 92669.2 85887.2 87435.7 89900.3 92669.2 93888.8 95441.2 1
2 Nonfinancial assets 23677.1 23318.2 23347.2 25047.8 27669.2 25741.9 26468.1 27087.3 27669.2 28111.0 28391.6 2
3 Financial assets 48653.8 52946.9 53925.0 58121.8 65000.1 60145.3 60967.6 62813.0 65000.1 65777.8 67049.6 3
4 Deposits 8098.0 8071.9 8746.6 9263.4 9630.5 9295.8 9282.3 9401.0 9630.5 9829.7 9861.0 4 5 Credit market instruments 4827.7 4912.3 4374.0 4169.1 3848.8 4016.0 3936.7 3862.7 3848.8 3633.8 3535.9 5
6 Equity shares at market value 13134.3 15462.6 14927.6 17048.5 22076.5 18715.7 19197.5 20507.3 22076.5 22478.3 23499.5 6
7 Directly held 7255.5 8679.9 8475.6 9623.9 12451.3 10590.4 10868.7 11595.5 12451.3 12622.1 13306.7 7
8 Indirectly held 5878.8 6782.7 6451.9 7424.6 9625.1 8125.3 8328.8 8911.7 9625.1 9856.2 10192.8 8
9 Life insurance companies 1220.3 1420.5 1395.7 1556.5 1825.5 1654.4 1678.8 1733.8 1825.5 1846.3 1894.0 9 10 Private pension funds (1) 1877.8 2178.5 2088.6 2364.1 3063.1 2607.1 2684.4 2854.6 3063.1 3118.0 3236.1 10 11 State and local govt. retirement funds (1) 222.6 247.5 221.5 239.9 296.4 259.6 261.5 277.3 296.4 298.2 305.4 11 12 Federal govt. retirement funds (1) 105.3 128.5 124.0 138.3 195.0 157.3 163.3 174.2 195.0 200.8 210.5 12 13 Mutual funds 2452.8 2807.6 2622.2 3125.8 4245.2 3447.0 3540.7 3871.8 4245.2 4393.0 4546.7 13
14 Other 22593.8 24500.1 25876.8 27640.8 29444.3 28117.8 28551.1 29042.1 29444.3 29836.1 30153.2 14
15 Liabilities 14062.1 13781.5 13574.0 13646.1 13801.2 13596.9 13621.5 13740.4 13801.2 13786.5 13948.4 15
16 Net worth 58268.8 62483.6 63698.1 69523.5 78868.0 72290.3 73814.1 76159.9 78868.0 80102.4 81492.8 16
Memo:
Equity shares (line 6) as a percent of 17 Total assets (line 1) 18.2 20.3 19.3 20.5 23.8 21.8 22.0 22.8 23.8 23.9 24.6 17 18 Financial assets (line 3) 27.0 29.2 27.7 29.3 34.0 31.1 31.5 32.6 34.0 34.2 35.0 18
(1) Defined contribution plans. Assets held by defined benefit pension funds are not considered assets of the household sector. Defined benefit pension entitlements are included in line 14.

Su
pp
lem
ents
124 Z.1, September 18, 2014
F.100.a Nonprofit Organizations (1)Billions of dollars
1988 1989 1990 1991 1992 1993 1994 1995 1996 1997 1998 1999 2000
1 Net lending (+) or net borrowing (-) 53.5 42.1 21.7 8.8 23.3 11.1 52.5 48.5 83.6 9.2 1.5 -6.0 39.6 1
2 Net acquisition of financial assets 70.9 75.8 53.8 46.4 53.0 45.2 76.5 84.9 120.0 47.4 55.0 28.8 108.1 2
3 Checkable deposits and currency 0.5 -1.0 1.3 4.0 1.2 1.7 -2.5 2.3 8.3 2.9 3.1 2.3 5.1 3 4 Time and savings deposits -0.2 5.4 -6.2 10.4 -2.4 -1.5 0.2 0.2 1.1 0.3 1.1 0.6 0.8 4 5 Money market fund shares -13.1 4.9 -1.2 32.9 4.0 -13.8 1.1 1.2 9.4 -1.8 7.1 3.8 4.5 5 6 Security repurchase agreements (2) 0.4 3.1 -2.2 -1.3 6.0 0.5 0.2 0.2 1.4 0.0 1.3 0.7 0.8 6
7 Credit market instruments 54.9 21.9 22.2 -17.6 10.9 25.5 16.6 38.8 36.7 23.1 36.4 46.7 32.6 7
8 Open market paper 38.2 -5.7 5.8 -35.2 -5.8 12.4 4.7 2.0 4.1 1.3 3.0 4.7 12.4 8 9 Treasury securities 6.4 13.8 4.8 6.1 6.8 5.1 6.4 16.4 13.9 8.9 11.6 17.5 5.4 910 Agency- and GSE-backed securities 4.5 2.6 4.6 3.6 3.1 2.3 2.9 7.6 6.4 4.1 5.4 8.1 2.5 1011 Municipal securities 0.0 0.5 -0.5 0.0 0.2 0.3 0.4 0.1 0.0 -0.1 0.1 0.1 0.0 1112 Corporate and foreign bonds 6.6 9.7 8.2 7.9 5.6 4.5 2.4 11.9 11.7 8.3 15.4 15.4 10.5 1213 Mortgages -0.8 0.9 -0.7 -0.1 0.9 0.9 -0.1 0.9 0.6 0.6 0.9 0.8 1.7 13
14 Corporate equities 5.2 16.1 15.0 -18.6 18.6 8.9 45.1 -10.4 21.0 -30.6 -40.7 -67.4 15.4 1415 Mutual fund shares -1.0 2.6 1.2 -3.3 0.7 -0.7 1.5 1.3 2.4 -1.0 0.4 -3.3 -1.0 15
16 Security credit 2.8 2.8 2.6 2.0 1.1 0.8 2.0 1.5 3.4 3.7 4.6 1.1 4.3 1617 Trade receivables (2) 2.8 2.8 2.6 2.0 1.1 1.8 2.1 1.6 3.5 2.6 4.6 1.1 4.3 17
18 Equity in noncorporate business -0.1 -3.9 -6.0 15.2 10.6 7.0 0.2 10.2 8.4 9.7 12.5 12.0 16.3 1819 Miscellaneous assets (2) 18.6 21.0 24.5 20.5 1.2 15.0 10.1 38.0 24.4 38.3 24.7 31.2 25.0 19
20 Net increase in liabilities 17.3 33.6 32.1 37.6 29.7 34.1 24.0 36.4 36.3 38.2 53.5 34.7 68.5 20
21 Credit market instruments 7.5 11.7 11.8 14.3 10.0 13.8 2.4 -0.6 11.0 10.6 23.4 13.5 19.3 21
22 Municipal securities 1.5 3.2 3.0 3.8 2.4 1.1 3.2 0.2 6.1 7.1 11.8 10.4 5.8 2223 Depository institution loans n.e.c. 1.6 1.4 1.4 1.6 1.2 2.0 -0.2 -0.1 0.8 0.6 1.9 0.5 2.2 2324 Other loans and advances -0.0 -0.0 0.3 0.4 -0.2 0.1 0.1 -0.1 0.0 -0.2 -0.1 0.1 -0.3 2425 Commercial mortgages 4.4 7.2 7.2 8.6 6.6 10.7 -0.8 -0.6 4.1 3.1 9.9 2.5 11.6 25
26 Trade payables 2.4 16.2 9.3 9.4 5.9 6.0 5.2 7.9 8.0 8.9 8.7 4.1 3.8 2627 Miscellaneous liabilities (2) 7.4 5.8 10.9 13.8 13.8 14.3 16.5 29.1 17.3 18.7 21.4 17.0 45.4 27
(1) Does not include religious organizations or organizations with less than $25,000 in gross annual receipts.(2) Not included in table F.100.

Su
pp
lem
ents
Z.1, September 18, 2014 125
L.100.a Nonprofit Organizations (1)Billions of dollars; amounts outstanding end of period, not seasonally adjusted
1988 1989 1990 1991 1992 1993 1994 1995 1996 1997 1998 1999 2000
1 Total financial assets 590.7 710.5 742.1 828.1 890.2 957.1 1025.5 1214.0 1414.1 1607.3 1793.9 1974.7 2003.8 1
2 Checkable deposits and currency 17.0 15.9 17.3 21.3 22.5 24.1 21.6 23.9 32.1 35.0 38.1 40.4 45.5 2 3 Time and savings deposits 1.5 6.8 0.6 11.1 8.7 7.1 7.3 7.5 8.6 8.9 10.0 10.6 11.4 3 4 Money market fund shares 15.9 20.8 19.6 52.5 56.5 42.7 43.8 45.1 54.5 52.7 59.8 63.6 68.1 4 5 Security repurchase agreements (2) 1.7 4.8 2.5 1.3 7.3 7.8 8.0 8.2 9.6 9.6 10.9 11.6 12.5 5
6 Credit market instruments 229.3 251.2 273.4 255.9 266.8 292.3 308.9 347.7 384.4 407.6 443.9 490.6 523.2 6
7 Open market paper 93.6 87.9 93.7 58.5 52.7 65.0 69.7 71.7 75.8 77.1 80.2 84.9 97.3 7 8 Treasury securities 55.7 69.5 74.3 80.3 87.1 92.2 98.5 114.9 128.8 137.6 149.2 166.8 172.2 8 9 Agency- and GSE-backed securities 26.3 28.9 33.5 37.1 40.3 42.6 45.5 53.1 59.5 63.6 69.0 77.1 79.6 910 Municipal securities 0.1 0.6 0.1 0.2 0.4 0.8 1.1 1.2 1.3 1.2 1.3 1.5 1.5 1011 Corporate and foreign bonds 51.1 60.8 69.0 77.0 82.6 87.1 89.5 101.4 113.1 121.4 136.8 152.2 162.6 1112 Mortgages 2.6 3.5 2.8 2.8 3.7 4.6 4.5 5.3 6.0 6.6 7.4 8.3 10.0 12
13 Corporate equities 145.8 203.0 197.5 214.6 241.1 270.2 308.2 397.1 494.7 604.9 692.0 769.3 708.6 1314 Mutual fund shares 10.2 15.8 15.3 15.9 17.7 18.5 19.0 24.6 30.4 34.5 38.7 42.7 38.8 14
15 Security credit 25.7 28.5 31.1 33.1 34.3 35.0 37.1 38.6 42.0 45.8 50.3 51.5 55.8 1516 Trade receivables (2) 25.7 28.5 31.1 33.1 34.3 36.1 38.1 39.7 43.2 45.8 50.3 51.5 55.8 16
17 Equity in noncorporate business 26.1 22.2 16.2 31.4 42.0 49.0 49.2 59.4 67.8 77.5 90.0 102.0 118.3 1718 Miscellaneous assets (2) 92.0 112.9 137.4 158.0 159.2 174.2 184.3 222.2 246.7 285.0 309.7 340.9 365.9 18
19 Liabilities 253.8 287.5 319.5 357.1 386.8 421.0 444.9 481.4 517.7 555.8 609.3 644.1 712.5 19
20 Credit market instruments 154.4 166.1 177.9 192.3 202.3 216.1 218.5 217.9 228.9 239.5 262.9 276.4 295.7 20
21 Municipal securities 79.6 82.7 85.7 89.5 91.9 93.0 96.1 96.4 102.4 109.6 121.3 131.7 137.5 2122 Depository institution loans n.e.c. 11.8 13.1 14.5 16.1 17.3 19.3 19.2 19.1 19.8 20.4 22.3 22.7 24.9 2223 Other loans and advances 0.3 0.3 0.5 0.9 0.7 0.8 0.9 0.8 0.9 0.7 0.6 0.7 0.4 2324 Commercial mortgages 62.7 70.0 77.2 85.8 92.3 103.0 102.2 101.6 105.7 108.8 118.7 121.2 132.8 24
25 Trade payables 41.3 57.4 66.8 76.2 82.1 88.1 93.2 101.1 109.1 118.0 126.8 130.9 134.7 2526 Miscellaneous liabilities (2) 58.2 63.9 74.8 88.6 102.5 116.8 133.3 162.4 179.7 198.4 219.7 236.8 282.1 26
(1) Does not include religious organizations or organizations with less than $25,000 in gross annual receipts.(2) Not included in table L.100.
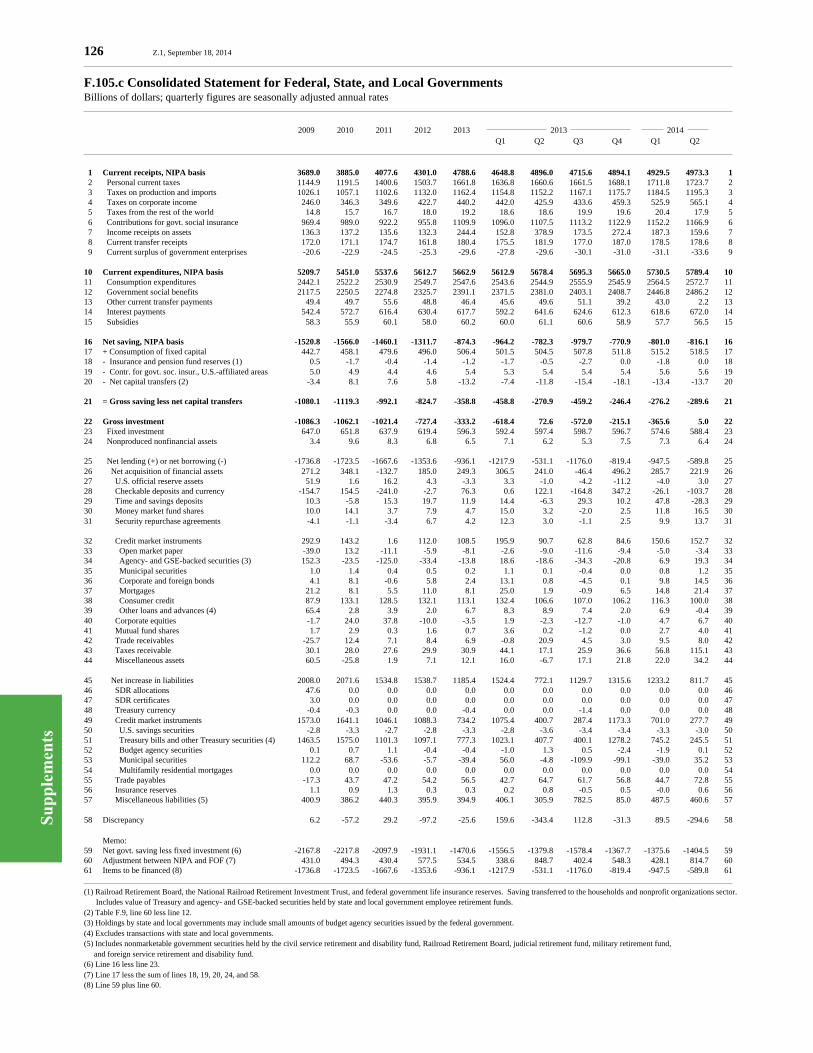
Su
pp
lem
ents
126 Z.1, September 18, 2014
F.105.c Consolidated Statement for Federal, State, and Local GovernmentsBillions of dollars; quarterly figures are seasonally adjusted annual rates
2009 2010 2011 2012 2013 2013 2014 Q1 Q2 Q3 Q4 Q1 Q2
1 Current receipts, NIPA basis 3689.0 3885.0 4077.6 4301.0 4788.6 4648.8 4896.0 4715.6 4894.1 4929.5 4973.3 1 2 Personal current taxes 1144.9 1191.5 1400.6 1503.7 1661.8 1636.8 1660.6 1661.5 1688.1 1711.8 1723.7 2 3 Taxes on production and imports 1026.1 1057.1 1102.6 1132.0 1162.4 1154.8 1152.2 1167.1 1175.7 1184.5 1195.3 3 4 Taxes on corporate income 246.0 346.3 349.6 422.7 440.2 442.0 425.9 433.6 459.3 525.9 565.1 4 5 Taxes from the rest of the world 14.8 15.7 16.7 18.0 19.2 18.6 18.6 19.9 19.6 20.4 17.9 5 6 Contributions for govt. social insurance 969.4 989.0 922.2 955.8 1109.9 1096.0 1107.5 1113.2 1122.9 1152.2 1166.9 6 7 Income receipts on assets 136.3 137.2 135.6 132.3 244.4 152.8 378.9 173.5 272.4 187.3 159.6 7 8 Current transfer receipts 172.0 171.1 174.7 161.8 180.4 175.5 181.9 177.0 187.0 178.5 178.6 8 9 Current surplus of government enterprises -20.6 -22.9 -24.5 -25.3 -29.6 -27.8 -29.6 -30.1 -31.0 -31.1 -33.6 9
10 Current expenditures, NIPA basis 5209.7 5451.0 5537.6 5612.7 5662.9 5612.9 5678.4 5695.3 5665.0 5730.5 5789.4 1011 Consumption expenditures 2442.1 2522.2 2530.9 2549.7 2547.6 2543.6 2544.9 2555.9 2545.9 2564.5 2572.7 1112 Government social benefits 2117.5 2250.5 2274.8 2325.7 2391.1 2371.5 2381.0 2403.1 2408.7 2446.8 2486.2 1213 Other current transfer payments 49.4 49.7 55.6 48.8 46.4 45.6 49.6 51.1 39.2 43.0 2.2 1314 Interest payments 542.4 572.7 616.4 630.4 617.7 592.2 641.6 624.6 612.3 618.6 672.0 1415 Subsidies 58.3 55.9 60.1 58.0 60.2 60.0 61.1 60.6 58.9 57.7 56.5 15
16 Net saving, NIPA basis -1520.8 -1566.0 -1460.1 -1311.7 -874.3 -964.2 -782.3 -979.7 -770.9 -801.0 -816.1 1617 + Consumption of fixed capital 442.7 458.1 479.6 496.0 506.4 501.5 504.5 507.8 511.8 515.2 518.5 1718 - Insurance and pension fund reserves (1) 0.5 -1.7 -0.4 -1.4 -1.2 -1.7 -0.5 -2.7 0.0 -1.8 0.0 1819 - Contr. for govt. soc. insur., U.S.-affiliated areas 5.0 4.9 4.4 4.6 5.4 5.3 5.4 5.4 5.4 5.6 5.6 1920 - Net capital transfers (2) -3.4 8.1 7.6 5.8 -13.2 -7.4 -11.8 -15.4 -18.1 -13.4 -13.7 20
21 = Gross saving less net capital transfers -1080.1 -1119.3 -992.1 -824.7 -358.8 -458.8 -270.9 -459.2 -246.4 -276.2 -289.6 21
22 Gross investment -1086.3 -1062.1 -1021.4 -727.4 -333.2 -618.4 72.6 -572.0 -215.1 -365.6 5.0 2223 Fixed investment 647.0 651.8 637.9 619.4 596.3 592.4 597.4 598.7 596.7 574.6 588.4 2324 Nonproduced nonfinancial assets 3.4 9.6 8.3 6.8 6.5 7.1 6.2 5.3 7.5 7.3 6.4 24
25 Net lending (+) or net borrowing (-) -1736.8 -1723.5 -1667.6 -1353.6 -936.1 -1217.9 -531.1 -1176.0 -819.4 -947.5 -589.8 2526 Net acquisition of financial assets 271.2 348.1 -132.7 185.0 249.3 306.5 241.0 -46.4 496.2 285.7 221.9 2627 U.S. official reserve assets 51.9 1.6 16.2 4.3 -3.3 3.3 -1.0 -4.2 -11.2 -4.0 3.0 2728 Checkable deposits and currency -154.7 154.5 -241.0 -2.7 76.3 0.6 122.1 -164.8 347.2 -26.1 -103.7 2829 Time and savings deposits 10.3 -5.8 15.3 19.7 11.9 14.4 -6.3 29.3 10.2 47.8 -28.3 2930 Money market fund shares 10.0 14.1 3.7 7.9 4.7 15.0 3.2 -2.0 2.5 11.8 16.5 3031 Security repurchase agreements -4.1 -1.1 -3.4 6.7 4.2 12.3 3.0 -1.1 2.5 9.9 13.7 31
32 Credit market instruments 292.9 143.2 1.6 112.0 108.5 195.9 90.7 62.8 84.6 150.6 152.7 3233 Open market paper -39.0 13.2 -11.1 -5.9 -8.1 -2.6 -9.0 -11.6 -9.4 -5.0 -3.4 3334 Agency- and GSE-backed securities (3) 152.3 -23.5 -125.0 -33.4 -13.8 18.6 -18.6 -34.3 -20.8 6.9 19.3 3435 Municipal securities 1.0 1.4 0.4 0.5 0.2 1.1 0.1 -0.4 0.0 0.8 1.2 3536 Corporate and foreign bonds 4.1 8.1 -0.6 5.8 2.4 13.1 0.8 -4.5 0.1 9.8 14.5 3637 Mortgages 21.2 8.1 5.5 11.0 8.1 25.0 1.9 -0.9 6.5 14.8 21.4 3738 Consumer credit 87.9 133.1 128.5 132.1 113.1 132.4 106.6 107.0 106.2 116.3 100.0 3839 Other loans and advances (4) 65.4 2.8 3.9 2.0 6.7 8.3 8.9 7.4 2.0 6.9 -0.4 3940 Corporate equities -1.7 24.0 37.8 -10.0 -3.5 1.9 -2.3 -12.7 -1.0 4.7 6.7 4041 Mutual fund shares 1.7 2.9 0.3 1.6 0.7 3.6 0.2 -1.2 0.0 2.7 4.0 4142 Trade receivables -25.7 12.4 7.1 8.4 6.9 -0.8 20.9 4.5 3.0 9.5 8.0 4243 Taxes receivable 30.1 28.0 27.6 29.9 30.9 44.1 17.1 25.9 36.6 56.8 115.1 4344 Miscellaneous assets 60.5 -25.8 1.9 7.1 12.1 16.0 -6.7 17.1 21.8 22.0 34.2 44
45 Net increase in liabilities 2008.0 2071.6 1534.8 1538.7 1185.4 1524.4 772.1 1129.7 1315.6 1233.2 811.7 4546 SDR allocations 47.6 0.0 0.0 0.0 0.0 0.0 0.0 0.0 0.0 0.0 0.0 4647 SDR certificates 3.0 0.0 0.0 0.0 0.0 0.0 0.0 0.0 0.0 0.0 0.0 4748 Treasury currency -0.4 -0.3 0.0 0.0 -0.4 0.0 0.0 -1.4 0.0 0.0 0.0 4849 Credit market instruments 1573.0 1641.1 1046.1 1088.3 734.2 1075.4 400.7 287.4 1173.3 701.0 277.7 4950 U.S. savings securities -2.8 -3.3 -2.7 -2.8 -3.3 -2.8 -3.6 -3.4 -3.4 -3.3 -3.0 5051 Treasury bills and other Treasury securities (4) 1463.5 1575.0 1101.3 1097.1 777.3 1023.1 407.7 400.1 1278.2 745.2 245.5 5152 Budget agency securities 0.1 0.7 1.1 -0.4 -0.4 -1.0 1.3 0.5 -2.4 -1.9 0.1 5253 Municipal securities 112.2 68.7 -53.6 -5.7 -39.4 56.0 -4.8 -109.9 -99.1 -39.0 35.2 5354 Multifamily residential mortgages 0.0 0.0 0.0 0.0 0.0 0.0 0.0 0.0 0.0 0.0 0.0 5455 Trade payables -17.3 43.7 47.2 54.2 56.5 42.7 64.7 61.7 56.8 44.7 72.8 5556 Insurance reserves 1.1 0.9 1.3 0.3 0.3 0.2 0.8 -0.5 0.5 -0.0 0.6 5657 Miscellaneous liabilities (5) 400.9 386.2 440.3 395.9 394.9 406.1 305.9 782.5 85.0 487.5 460.6 57
58 Discrepancy 6.2 -57.2 29.2 -97.2 -25.6 159.6 -343.4 112.8 -31.3 89.5 -294.6 58
Memo:59 Net govt. saving less fixed investment (6) -2167.8 -2217.8 -2097.9 -1931.1 -1470.6 -1556.5 -1379.8 -1578.4 -1367.7 -1375.6 -1404.5 5960 Adjustment between NIPA and FOF (7) 431.0 494.3 430.4 577.5 534.5 338.6 848.7 402.4 548.3 428.1 814.7 6061 Items to be financed (8) -1736.8 -1723.5 -1667.6 -1353.6 -936.1 -1217.9 -531.1 -1176.0 -819.4 -947.5 -589.8 61
(1) Railroad Retirement Board, the National Railroad Retirement Investment Trust, and federal government life insurance reserves. Saving transferred to the households and nonprofit organizations sector. Includes value of Treasury and agency- and GSE-backed securities held by state and local government employee retirement funds.(2) Table F.9, line 60 less line 12.(3) Holdings by state and local governments may include small amounts of budget agency securities issued by the federal government.(4) Excludes transactions with state and local governments.(5) Includes nonmarketable government securities held by the civil service retirement and disability fund, Railroad Retirement Board, judicial retirement fund, military retirement fund, and foreign service retirement and disability fund.(6) Line 16 less line 23.(7) Line 17 less the sum of lines 18, 19, 20, 24, and 58.(8) Line 59 plus line 60.
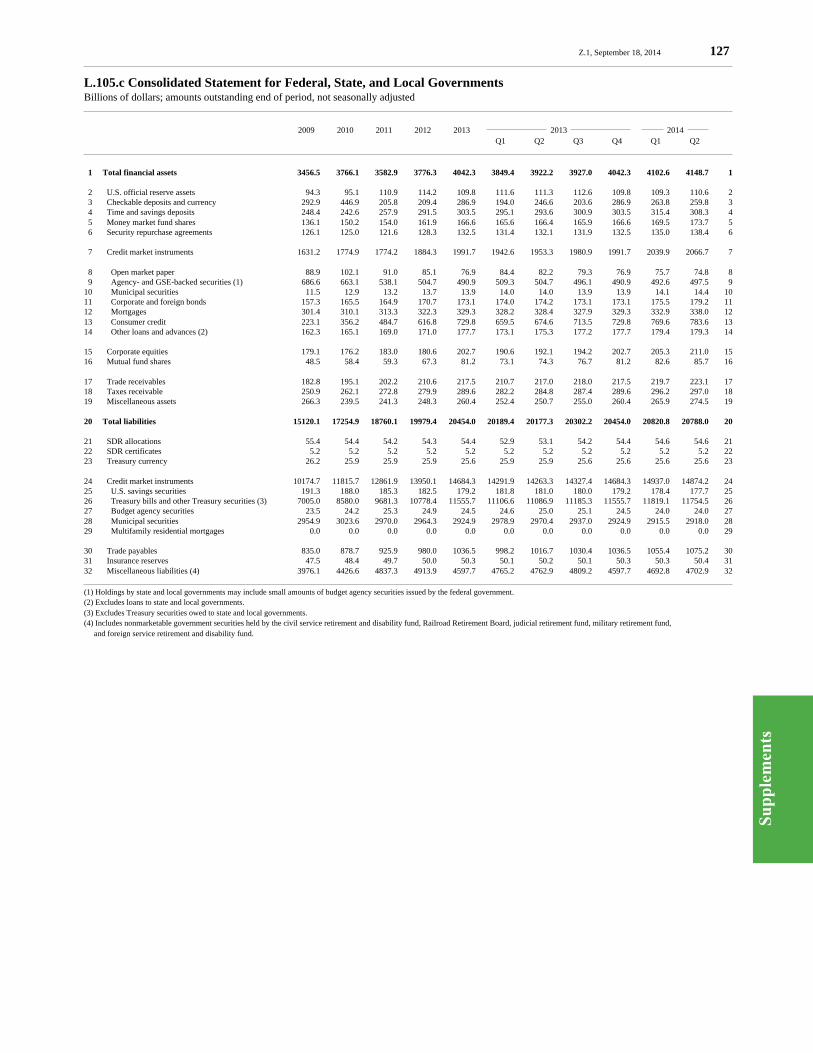
Su
pp
lem
ents
Z.1, September 18, 2014 127
L.105.c Consolidated Statement for Federal, State, and Local GovernmentsBillions of dollars; amounts outstanding end of period, not seasonally adjusted
2009 2010 2011 2012 2013 2013 2014 Q1 Q2 Q3 Q4 Q1 Q2
1 Total financial assets 3456.5 3766.1 3582.9 3776.3 4042.3 3849.4 3922.2 3927.0 4042.3 4102.6 4148.7 1
2 U.S. official reserve assets 94.3 95.1 110.9 114.2 109.8 111.6 111.3 112.6 109.8 109.3 110.6 2 3 Checkable deposits and currency 292.9 446.9 205.8 209.4 286.9 194.0 246.6 203.6 286.9 263.8 259.8 3 4 Time and savings deposits 248.4 242.6 257.9 291.5 303.5 295.1 293.6 300.9 303.5 315.4 308.3 4 5 Money market fund shares 136.1 150.2 154.0 161.9 166.6 165.6 166.4 165.9 166.6 169.5 173.7 5 6 Security repurchase agreements 126.1 125.0 121.6 128.3 132.5 131.4 132.1 131.9 132.5 135.0 138.4 6
7 Credit market instruments 1631.2 1774.9 1774.2 1884.3 1991.7 1942.6 1953.3 1980.9 1991.7 2039.9 2066.7 7
8 Open market paper 88.9 102.1 91.0 85.1 76.9 84.4 82.2 79.3 76.9 75.7 74.8 8 9 Agency- and GSE-backed securities (1) 686.6 663.1 538.1 504.7 490.9 509.3 504.7 496.1 490.9 492.6 497.5 910 Municipal securities 11.5 12.9 13.2 13.7 13.9 14.0 14.0 13.9 13.9 14.1 14.4 1011 Corporate and foreign bonds 157.3 165.5 164.9 170.7 173.1 174.0 174.2 173.1 173.1 175.5 179.2 1112 Mortgages 301.4 310.1 313.3 322.3 329.3 328.2 328.4 327.9 329.3 332.9 338.0 1213 Consumer credit 223.1 356.2 484.7 616.8 729.8 659.5 674.6 713.5 729.8 769.6 783.6 1314 Other loans and advances (2) 162.3 165.1 169.0 171.0 177.7 173.1 175.3 177.2 177.7 179.4 179.3 14
15 Corporate equities 179.1 176.2 183.0 180.6 202.7 190.6 192.1 194.2 202.7 205.3 211.0 1516 Mutual fund shares 48.5 58.4 59.3 67.3 81.2 73.1 74.3 76.7 81.2 82.6 85.7 16
17 Trade receivables 182.8 195.1 202.2 210.6 217.5 210.7 217.0 218.0 217.5 219.7 223.1 1718 Taxes receivable 250.9 262.1 272.8 279.9 289.6 282.2 284.8 287.4 289.6 296.2 297.0 1819 Miscellaneous assets 266.3 239.5 241.3 248.3 260.4 252.4 250.7 255.0 260.4 265.9 274.5 19
20 Total liabilities 15120.1 17254.9 18760.1 19979.4 20454.0 20189.4 20177.3 20302.2 20454.0 20820.8 20788.0 20
21 SDR allocations 55.4 54.4 54.2 54.3 54.4 52.9 53.1 54.2 54.4 54.6 54.6 2122 SDR certificates 5.2 5.2 5.2 5.2 5.2 5.2 5.2 5.2 5.2 5.2 5.2 2223 Treasury currency 26.2 25.9 25.9 25.9 25.6 25.9 25.9 25.6 25.6 25.6 25.6 23
24 Credit market instruments 10174.7 11815.7 12861.9 13950.1 14684.3 14291.9 14263.3 14327.4 14684.3 14937.0 14874.2 2425 U.S. savings securities 191.3 188.0 185.3 182.5 179.2 181.8 181.0 180.0 179.2 178.4 177.7 2526 Treasury bills and other Treasury securities (3) 7005.0 8580.0 9681.3 10778.4 11555.7 11106.6 11086.9 11185.3 11555.7 11819.1 11754.5 2627 Budget agency securities 23.5 24.2 25.3 24.9 24.5 24.6 25.0 25.1 24.5 24.0 24.0 2728 Municipal securities 2954.9 3023.6 2970.0 2964.3 2924.9 2978.9 2970.4 2937.0 2924.9 2915.5 2918.0 2829 Multifamily residential mortgages 0.0 0.0 0.0 0.0 0.0 0.0 0.0 0.0 0.0 0.0 0.0 29
30 Trade payables 835.0 878.7 925.9 980.0 1036.5 998.2 1016.7 1030.4 1036.5 1055.4 1075.2 3031 Insurance reserves 47.5 48.4 49.7 50.0 50.3 50.1 50.2 50.1 50.3 50.3 50.4 3132 Miscellaneous liabilities (4) 3976.1 4426.6 4837.3 4913.9 4597.7 4765.2 4762.9 4809.2 4597.7 4692.8 4702.9 32
(1) Holdings by state and local governments may include small amounts of budget agency securities issued by the federal government.(2) Excludes loans to state and local governments.(3) Excludes Treasury securities owed to state and local governments.(4) Includes nonmarketable government securities held by the civil service retirement and disability fund, Railroad Retirement Board, judicial retirement fund, military retirement fund, and foreign service retirement and disability fund.
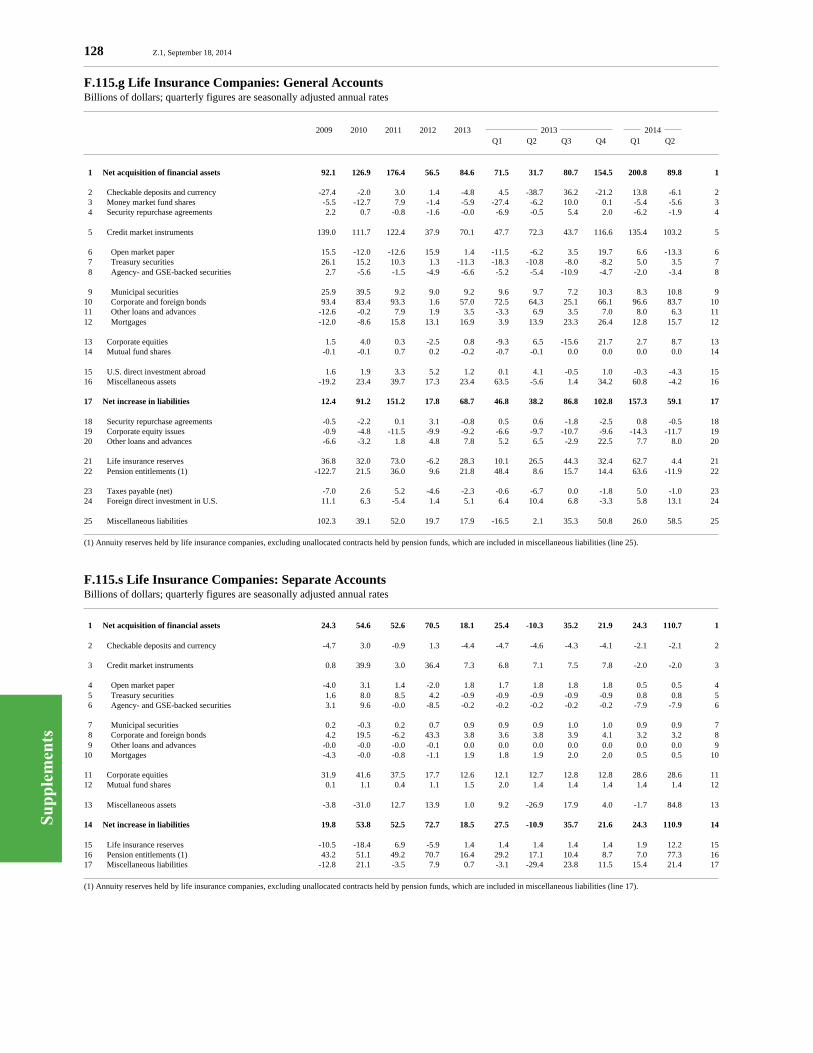
Su
pp
lem
ents
128 Z.1, September 18, 2014
F.115.g Life Insurance Companies: General AccountsBillions of dollars; quarterly figures are seasonally adjusted annual rates
2009 2010 2011 2012 2013 2013 2014 Q1 Q2 Q3 Q4 Q1 Q2
1 Net acquisition of financial assets 92.1 126.9 176.4 56.5 84.6 71.5 31.7 80.7 154.5 200.8 89.8 1
2 Checkable deposits and currency -27.4 -2.0 3.0 1.4 -4.8 4.5 -38.7 36.2 -21.2 13.8 -6.1 2 3 Money market fund shares -5.5 -12.7 7.9 -1.4 -5.9 -27.4 -6.2 10.0 0.1 -5.4 -5.6 3 4 Security repurchase agreements 2.2 0.7 -0.8 -1.6 -0.0 -6.9 -0.5 5.4 2.0 -6.2 -1.9 4
5 Credit market instruments 139.0 111.7 122.4 37.9 70.1 47.7 72.3 43.7 116.6 135.4 103.2 5
6 Open market paper 15.5 -12.0 -12.6 15.9 1.4 -11.5 -6.2 3.5 19.7 6.6 -13.3 6 7 Treasury securities 26.1 15.2 10.3 1.3 -11.3 -18.3 -10.8 -8.0 -8.2 5.0 3.5 7 8 Agency- and GSE-backed securities 2.7 -5.6 -1.5 -4.9 -6.6 -5.2 -5.4 -10.9 -4.7 -2.0 -3.4 8
9 Municipal securities 25.9 39.5 9.2 9.0 9.2 9.6 9.7 7.2 10.3 8.3 10.8 910 Corporate and foreign bonds 93.4 83.4 93.3 1.6 57.0 72.5 64.3 25.1 66.1 96.6 83.7 1011 Other loans and advances -12.6 -0.2 7.9 1.9 3.5 -3.3 6.9 3.5 7.0 8.0 6.3 1112 Mortgages -12.0 -8.6 15.8 13.1 16.9 3.9 13.9 23.3 26.4 12.8 15.7 12
13 Corporate equities 1.5 4.0 0.3 -2.5 0.8 -9.3 6.5 -15.6 21.7 2.7 8.7 1314 Mutual fund shares -0.1 -0.1 0.7 0.2 -0.2 -0.7 -0.1 0.0 0.0 0.0 0.0 14
15 U.S. direct investment abroad 1.6 1.9 3.3 5.2 1.2 0.1 4.1 -0.5 1.0 -0.3 -4.3 1516 Miscellaneous assets -19.2 23.4 39.7 17.3 23.4 63.5 -5.6 1.4 34.2 60.8 -4.2 16
17 Net increase in liabilities 12.4 91.2 151.2 17.8 68.7 46.8 38.2 86.8 102.8 157.3 59.1 17
18 Security repurchase agreements -0.5 -2.2 0.1 3.1 -0.8 0.5 0.6 -1.8 -2.5 0.8 -0.5 1819 Corporate equity issues -0.9 -4.8 -11.5 -9.9 -9.2 -6.6 -9.7 -10.7 -9.6 -14.3 -11.7 1920 Other loans and advances -6.6 -3.2 1.8 4.8 7.8 5.2 6.5 -2.9 22.5 7.7 8.0 20
21 Life insurance reserves 36.8 32.0 73.0 -6.2 28.3 10.1 26.5 44.3 32.4 62.7 4.4 2122 Pension entitlements (1) -122.7 21.5 36.0 9.6 21.8 48.4 8.6 15.7 14.4 63.6 -11.9 22
23 Taxes payable (net) -7.0 2.6 5.2 -4.6 -2.3 -0.6 -6.7 0.0 -1.8 5.0 -1.0 2324 Foreign direct investment in U.S. 11.1 6.3 -5.4 1.4 5.1 6.4 10.4 6.8 -3.3 5.8 13.1 24
25 Miscellaneous liabilities 102.3 39.1 52.0 19.7 17.9 -16.5 2.1 35.3 50.8 26.0 58.5 25
(1) Annuity reserves held by life insurance companies, excluding unallocated contracts held by pension funds, which are included in miscellaneous liabilities (line 25).
F.115.s Life Insurance Companies: Separate AccountsBillions of dollars; quarterly figures are seasonally adjusted annual rates
1 Net acquisition of financial assets 24.3 54.6 52.6 70.5 18.1 25.4 -10.3 35.2 21.9 24.3 110.7 1
2 Checkable deposits and currency -4.7 3.0 -0.9 1.3 -4.4 -4.7 -4.6 -4.3 -4.1 -2.1 -2.1 2
3 Credit market instruments 0.8 39.9 3.0 36.4 7.3 6.8 7.1 7.5 7.8 -2.0 -2.0 3
4 Open market paper -4.0 3.1 1.4 -2.0 1.8 1.7 1.8 1.8 1.8 0.5 0.5 4 5 Treasury securities 1.6 8.0 8.5 4.2 -0.9 -0.9 -0.9 -0.9 -0.9 0.8 0.8 5 6 Agency- and GSE-backed securities 3.1 9.6 -0.0 -8.5 -0.2 -0.2 -0.2 -0.2 -0.2 -7.9 -7.9 6
7 Municipal securities 0.2 -0.3 0.2 0.7 0.9 0.9 0.9 1.0 1.0 0.9 0.9 7 8 Corporate and foreign bonds 4.2 19.5 -6.2 43.3 3.8 3.6 3.8 3.9 4.1 3.2 3.2 8 9 Other loans and advances -0.0 -0.0 -0.0 -0.1 0.0 0.0 0.0 0.0 0.0 0.0 0.0 910 Mortgages -4.3 -0.0 -0.8 -1.1 1.9 1.8 1.9 2.0 2.0 0.5 0.5 10
11 Corporate equities 31.9 41.6 37.5 17.7 12.6 12.1 12.7 12.8 12.8 28.6 28.6 1112 Mutual fund shares 0.1 1.1 0.4 1.1 1.5 2.0 1.4 1.4 1.4 1.4 1.4 12
13 Miscellaneous assets -3.8 -31.0 12.7 13.9 1.0 9.2 -26.9 17.9 4.0 -1.7 84.8 13
14 Net increase in liabilities 19.8 53.8 52.5 72.7 18.5 27.5 -10.9 35.7 21.6 24.3 110.9 14
15 Life insurance reserves -10.5 -18.4 6.9 -5.9 1.4 1.4 1.4 1.4 1.4 1.9 12.2 1516 Pension entitlements (1) 43.2 51.1 49.2 70.7 16.4 29.2 17.1 10.4 8.7 7.0 77.3 1617 Miscellaneous liabilities -12.8 21.1 -3.5 7.9 0.7 -3.1 -29.4 23.8 11.5 15.4 21.4 17
(1) Annuity reserves held by life insurance companies, excluding unallocated contracts held by pension funds, which are included in miscellaneous liabilities (line 17).
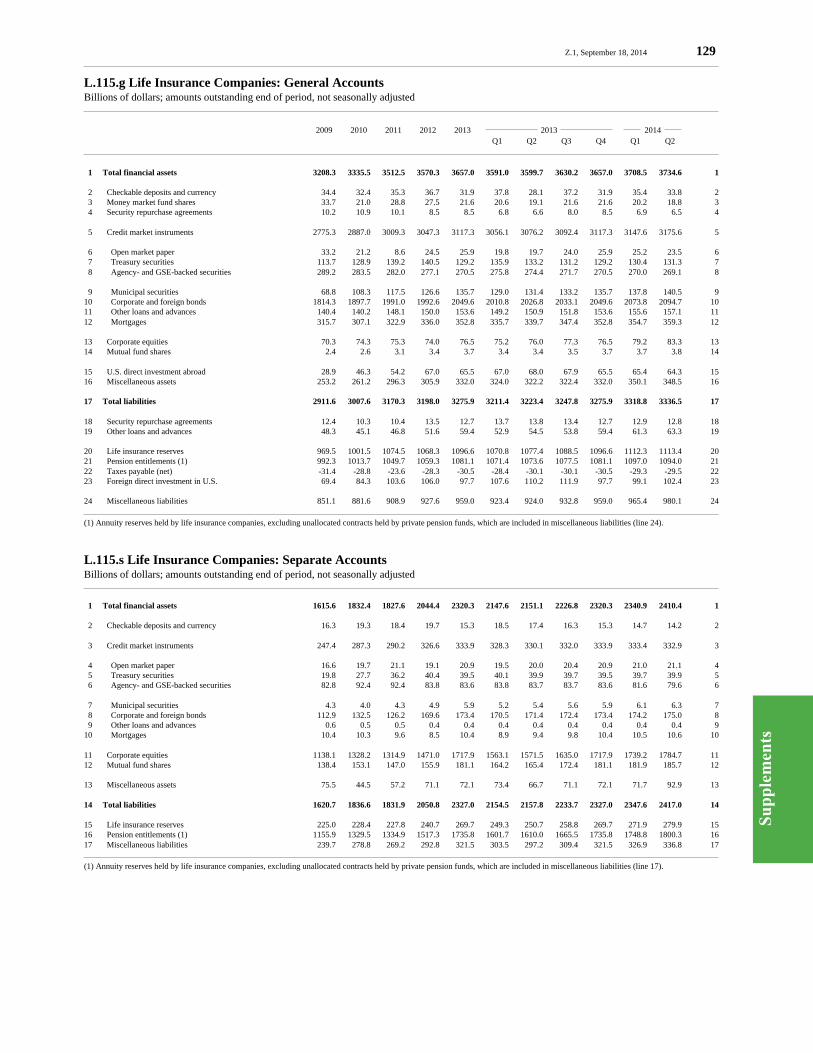
Su
pp
lem
ents
Z.1, September 18, 2014 129
L.115.g Life Insurance Companies: General AccountsBillions of dollars; amounts outstanding end of period, not seasonally adjusted
2009 2010 2011 2012 2013 2013 2014 Q1 Q2 Q3 Q4 Q1 Q2
1 Total financial assets 3208.3 3335.5 3512.5 3570.3 3657.0 3591.0 3599.7 3630.2 3657.0 3708.5 3734.6 1
2 Checkable deposits and currency 34.4 32.4 35.3 36.7 31.9 37.8 28.1 37.2 31.9 35.4 33.8 2 3 Money market fund shares 33.7 21.0 28.8 27.5 21.6 20.6 19.1 21.6 21.6 20.2 18.8 3 4 Security repurchase agreements 10.2 10.9 10.1 8.5 8.5 6.8 6.6 8.0 8.5 6.9 6.5 4
5 Credit market instruments 2775.3 2887.0 3009.3 3047.3 3117.3 3056.1 3076.2 3092.4 3117.3 3147.6 3175.6 5
6 Open market paper 33.2 21.2 8.6 24.5 25.9 19.8 19.7 24.0 25.9 25.2 23.5 6 7 Treasury securities 113.7 128.9 139.2 140.5 129.2 135.9 133.2 131.2 129.2 130.4 131.3 7 8 Agency- and GSE-backed securities 289.2 283.5 282.0 277.1 270.5 275.8 274.4 271.7 270.5 270.0 269.1 8
9 Municipal securities 68.8 108.3 117.5 126.6 135.7 129.0 131.4 133.2 135.7 137.8 140.5 910 Corporate and foreign bonds 1814.3 1897.7 1991.0 1992.6 2049.6 2010.8 2026.8 2033.1 2049.6 2073.8 2094.7 1011 Other loans and advances 140.4 140.2 148.1 150.0 153.6 149.2 150.9 151.8 153.6 155.6 157.1 1112 Mortgages 315.7 307.1 322.9 336.0 352.8 335.7 339.7 347.4 352.8 354.7 359.3 12
13 Corporate equities 70.3 74.3 75.3 74.0 76.5 75.2 76.0 77.3 76.5 79.2 83.3 1314 Mutual fund shares 2.4 2.6 3.1 3.4 3.7 3.4 3.4 3.5 3.7 3.7 3.8 14
15 U.S. direct investment abroad 28.9 46.3 54.2 67.0 65.5 67.0 68.0 67.9 65.5 65.4 64.3 1516 Miscellaneous assets 253.2 261.2 296.3 305.9 332.0 324.0 322.2 322.4 332.0 350.1 348.5 16
17 Total liabilities 2911.6 3007.6 3170.3 3198.0 3275.9 3211.4 3223.4 3247.8 3275.9 3318.8 3336.5 17
18 Security repurchase agreements 12.4 10.3 10.4 13.5 12.7 13.7 13.8 13.4 12.7 12.9 12.8 1819 Other loans and advances 48.3 45.1 46.8 51.6 59.4 52.9 54.5 53.8 59.4 61.3 63.3 19
20 Life insurance reserves 969.5 1001.5 1074.5 1068.3 1096.6 1070.8 1077.4 1088.5 1096.6 1112.3 1113.4 2021 Pension entitlements (1) 992.3 1013.7 1049.7 1059.3 1081.1 1071.4 1073.6 1077.5 1081.1 1097.0 1094.0 2122 Taxes payable (net) -31.4 -28.8 -23.6 -28.3 -30.5 -28.4 -30.1 -30.1 -30.5 -29.3 -29.5 2223 Foreign direct investment in U.S. 69.4 84.3 103.6 106.0 97.7 107.6 110.2 111.9 97.7 99.1 102.4 23
24 Miscellaneous liabilities 851.1 881.6 908.9 927.6 959.0 923.4 924.0 932.8 959.0 965.4 980.1 24
(1) Annuity reserves held by life insurance companies, excluding unallocated contracts held by private pension funds, which are included in miscellaneous liabilities (line 24).
L.115.s Life Insurance Companies: Separate AccountsBillions of dollars; amounts outstanding end of period, not seasonally adjusted
1 Total financial assets 1615.6 1832.4 1827.6 2044.4 2320.3 2147.6 2151.1 2226.8 2320.3 2340.9 2410.4 1
2 Checkable deposits and currency 16.3 19.3 18.4 19.7 15.3 18.5 17.4 16.3 15.3 14.7 14.2 2
3 Credit market instruments 247.4 287.3 290.2 326.6 333.9 328.3 330.1 332.0 333.9 333.4 332.9 3
4 Open market paper 16.6 19.7 21.1 19.1 20.9 19.5 20.0 20.4 20.9 21.0 21.1 4 5 Treasury securities 19.8 27.7 36.2 40.4 39.5 40.1 39.9 39.7 39.5 39.7 39.9 5 6 Agency- and GSE-backed securities 82.8 92.4 92.4 83.8 83.6 83.8 83.7 83.7 83.6 81.6 79.6 6
7 Municipal securities 4.3 4.0 4.3 4.9 5.9 5.2 5.4 5.6 5.9 6.1 6.3 7 8 Corporate and foreign bonds 112.9 132.5 126.2 169.6 173.4 170.5 171.4 172.4 173.4 174.2 175.0 8 9 Other loans and advances 0.6 0.5 0.5 0.4 0.4 0.4 0.4 0.4 0.4 0.4 0.4 910 Mortgages 10.4 10.3 9.6 8.5 10.4 8.9 9.4 9.8 10.4 10.5 10.6 10
11 Corporate equities 1138.1 1328.2 1314.9 1471.0 1717.9 1563.1 1571.5 1635.0 1717.9 1739.2 1784.7 1112 Mutual fund shares 138.4 153.1 147.0 155.9 181.1 164.2 165.4 172.4 181.1 181.9 185.7 12
13 Miscellaneous assets 75.5 44.5 57.2 71.1 72.1 73.4 66.7 71.1 72.1 71.7 92.9 13
14 Total liabilities 1620.7 1836.6 1831.9 2050.8 2327.0 2154.5 2157.8 2233.7 2327.0 2347.6 2417.0 14
15 Life insurance reserves 225.0 228.4 227.8 240.7 269.7 249.3 250.7 258.8 269.7 271.9 279.9 1516 Pension entitlements (1) 1155.9 1329.5 1334.9 1517.3 1735.8 1601.7 1610.0 1665.5 1735.8 1748.8 1800.3 1617 Miscellaneous liabilities 239.7 278.8 269.2 292.8 321.5 303.5 297.2 309.4 321.5 326.9 336.8 17
(1) Annuity reserves held by life insurance companies, excluding unallocated contracts held by private pension funds, which are included in miscellaneous liabilities (line 17).

Su
pp
lem
ents
130 Z.1, September 18, 2014
F.117.b Private Pension Funds: Defined Benefit PlansBillions of dollars; quarterly figures are seasonally adjusted annual rates
2009 2010 2011 2012 2013 2013 2014 Q1 Q2 Q3 Q4 Q1 Q2
1 Net acquisition of financial assets (1) 57.3 47.5 46.6 24.9 18.8 12.2 13.2 19.0 30.8 30.8 30.8 1
2 Checkable deposits and currency -2.6 2.7 1.8 -1.0 -0.2 0.0 -0.4 -0.6 0.1 0.6 0.9 2 3 Time and savings deposits 3.4 -0.2 1.2 -3.3 -0.7 0.1 -1.2 -1.8 0.2 1.8 2.9 3 4 Money market fund shares 0.4 -5.1 -0.3 -4.0 -0.8 0.1 -1.5 -1.9 0.2 -0.7 3.3 4 5 Security repurchase agreements 0.2 -0.2 0.0 -0.3 -0.1 0.0 -0.1 -0.1 0.0 0.2 0.3 5
6 Credit market instruments 4.1 71.7 78.0 83.8 35.2 8.2 37.1 47.3 48.3 -3.7 65.8 6
7 Open market paper 3.2 -1.0 1.1 -3.6 -3.8 0.1 -1.3 -7.4 -6.7 2.2 2.8 7 8 Treasury securities 12.7 7.4 19.3 15.9 24.8 35.7 29.3 18.1 15.9 10.1 14.6 8 9 Agency- and GSE-backed securities -6.6 2.7 14.3 11.0 9.8 9.0 9.3 10.1 10.8 -1.1 12.4 910 Corporate and foreign bonds -3.3 61.4 45.8 60.7 6.9 -34.6 2.3 28.9 30.9 -13.0 33.5 1011 Mortgages -2.0 1.2 -2.4 -0.1 -2.4 -2.1 -2.4 -2.4 -2.6 -1.9 2.6 11
12 Corporate equities -41.8 -4.1 -65.4 -11.0 -21.7 -1.1 -23.2 -25.5 -37.0 -4.8 -22.6 1213 Mutual fund shares -8.0 -10.8 12.5 -46.4 -7.9 14.1 -8.0 -8.8 -28.9 -1.6 -13.3 13
14 Miscellaneous assets 101.8 -6.2 18.8 7.1 14.9 -9.2 10.5 10.4 48.0 39.1 -6.6 1415 Unallocated insurance contracts (2) -2.4 -8.2 12.7 -9.5 -0.3 1.0 -0.5 1.2 -3.0 1.2 4.8 1516 Contributions receivable -5.3 13.4 1.7 -12.4 -0.8 0.9 -0.0 -0.6 -3.5 -0.2 2.1 1617 Claims of pension fund on sponsor (3) 82.8 -20.7 -16.8 8.4 12.1 -5.1 -4.7 7.0 51.2 8.3 -47.1 1718 Other 26.8 9.3 21.2 20.6 4.0 -6.0 15.7 2.8 3.3 29.9 33.6 18
19 Net increase in pension entitlements (liabilities) (4) 57.3 47.5 46.6 24.9 18.8 12.2 13.2 19.0 30.8 30.8 30.8 19
(1) Includes claims on sponsor (i.e., unfunded pension entitlements).(2) Assets of private pension plans held at life insurance companies; series begins 1985:Q4.(3) Unfunded defined benefit pension entitlements. Negative values indicate overfunding.(4) Actuarial value of accrued defined benefit pension entitlements.
F.117.c Private Pension Funds: Defined Contribution Plans (1)Billions of dollars; quarterly figures are seasonally adjusted annual rates
1 Net acquisition of financial assets 96.1 130.0 49.1 89.2 103.1 65.7 118.7 116.0 112.1 86.4 130.9 1
2 Checkable deposits and currency -0.1 -0.5 3.8 -0.7 0.4 1.1 2.0 -0.7 -1.0 0.5 2.4 2 3 Time and savings deposits -0.5 -0.4 0.4 -0.6 0.4 0.6 0.3 0.5 0.3 0.0 0.2 3 4 Money market fund shares -9.9 -5.1 16.8 -13.1 2.9 15.6 -0.9 -4.0 1.0 -5.4 8.0 4 5 Security repurchase agreements 0.0 0.0 0.0 0.0 0.0 0.0 0.0 0.0 0.0 0.0 0.0 5
6 Credit market instruments 5.4 48.9 -4.4 62.8 14.6 20.0 53.4 -5.7 -9.4 -4.4 13.0 6
7 Open market paper -1.4 -1.0 1.4 -1.2 0.5 2.4 0.2 -0.4 -0.4 1.9 -0.1 7 8 Treasury securities 20.0 23.9 7.7 28.4 11.3 11.8 22.6 3.7 7.2 4.8 4.0 8 9 Agency- and GSE-backed securities 0.1 3.8 -10.1 11.2 5.4 5.0 7.3 4.2 5.3 -4.3 3.9 910 Corporate and foreign bonds -12.7 20.7 -1.2 23.2 -1.6 2.2 24.2 -12.0 -20.8 -5.8 4.2 1011 Mortgages -0.5 1.6 -2.2 1.3 -1.0 -1.3 -0.9 -1.1 -0.7 -1.0 0.9 11
12 Corporate equities -49.4 26.9 5.1 -7.6 22.2 23.1 23.9 13.1 28.6 20.8 24.5 1213 Mutual fund shares 59.5 45.5 -4.1 20.2 35.4 29.4 22.9 47.5 41.6 23.2 37.1 13
14 Miscellaneous assets 91.0 14.7 31.4 28.1 27.3 -24.2 17.0 65.2 51.0 51.7 45.6 1415 Unallocated insurance contracts (2) 93.3 7.8 8.0 14.5 11.1 -11.9 4.9 22.3 29.0 19.6 16.7 1516 Contributions receivable -3.3 2.0 1.3 0.1 0.2 0.4 0.4 -0.3 0.5 -0.6 -0.2 1617 Other 1.0 4.9 22.2 13.5 16.0 -12.7 11.8 43.2 21.5 32.7 29.1 17
18 Net increase in pension entitlements (liabilities) 96.1 130.0 49.1 89.2 103.1 65.7 118.7 116.0 112.1 86.4 130.9 18
(1) Includes 401(k) and 403(b) type plans.(2) Assets of private pension plans held at life insurance companies; series begins 1985:Q4.
F.226.i Individual Retirement Accounts (IRAs) (1)Billions of dollars; quarterly figures are seasonally adjusted annual rates
1 Total held at: 136.5 51.8 -26.6 94.2 -136.8 -396.7 -125.1 242.2 -267.8 125.0 ND 1
2 U.S.-chartered depository institutions 30.7 26.6 20.3 24.4 -0.4 -15.4 38.4 2.3 -26.9 -27.0 ND 2 3 Credit unions 8.7 3.0 1.2 1.4 -0.7 0.1 0.1 -0.1 -2.8 -1.2 ND 3 4 Life insurance companies -13.4 19.4 10.2 14.2 8.7 6.0 5.1 9.1 14.5 12.5 ND 4 5 Money market mutual funds -42.0 -24.0 9.0 7.0 10.0 -24.0 56.0 24.0 -16.0 -20.0 ND 5 6 Mutual funds 150.5 124.2 43.1 86.8 102.1 172.8 -25.8 114.3 147.0 123.0 ND 6 7 Other self-directed accounts 1.9 -97.4 -110.4 -39.5 -256.6 -536.2 -198.9 92.5 -383.7 37.8 ND 7
(1) Assets of the household sector (F.100). IRA assets are not included in pension entitlements (table F.226), except for those at life insurance companies. Figures for depositories (lines 2 and 3) include Keogh accounts. Variable annuities in IRAs are in the life insurance sector (line 4) and are excluded from the mutual fund sector (line 6) and from the money market fund sector (line 5).
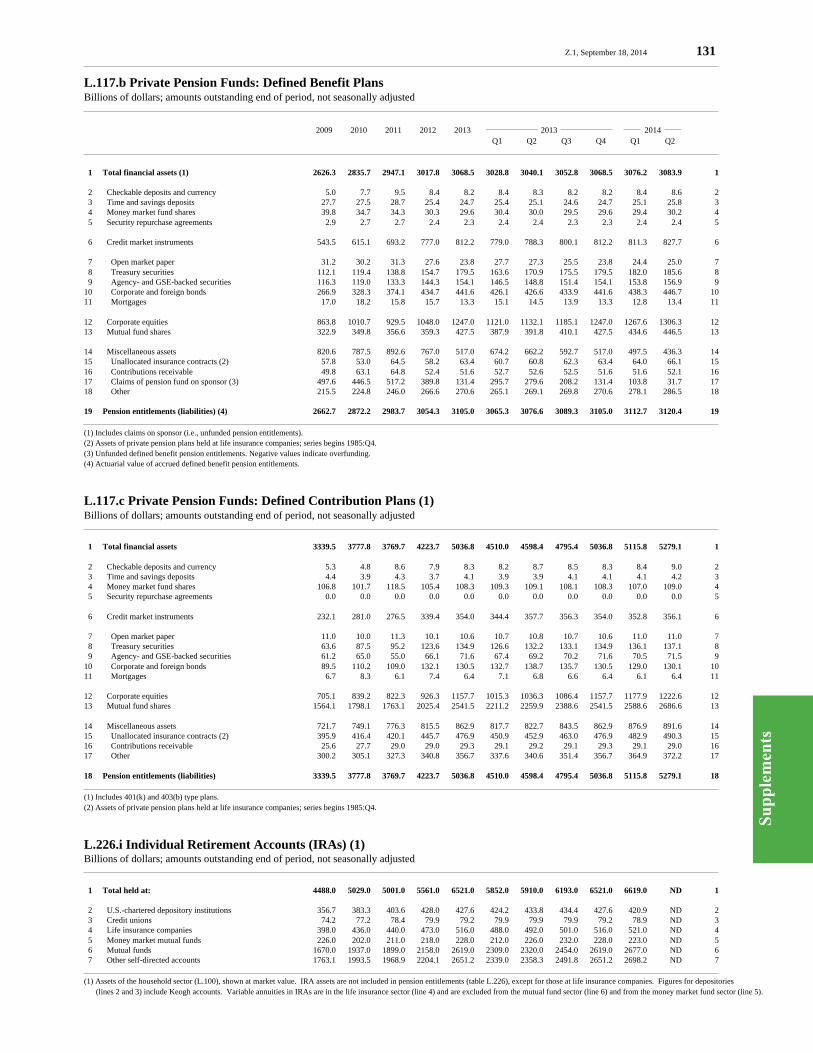
Su
pp
lem
ents
Z.1, September 18, 2014 131
L.117.b Private Pension Funds: Defined Benefit PlansBillions of dollars; amounts outstanding end of period, not seasonally adjusted
2009 2010 2011 2012 2013 2013 2014 Q1 Q2 Q3 Q4 Q1 Q2
1 Total financial assets (1) 2626.3 2835.7 2947.1 3017.8 3068.5 3028.8 3040.1 3052.8 3068.5 3076.2 3083.9 1
2 Checkable deposits and currency 5.0 7.7 9.5 8.4 8.2 8.4 8.3 8.2 8.2 8.4 8.6 2 3 Time and savings deposits 27.7 27.5 28.7 25.4 24.7 25.4 25.1 24.6 24.7 25.1 25.8 3 4 Money market fund shares 39.8 34.7 34.3 30.3 29.6 30.4 30.0 29.5 29.6 29.4 30.2 4 5 Security repurchase agreements 2.9 2.7 2.7 2.4 2.3 2.4 2.4 2.3 2.3 2.4 2.4 5
6 Credit market instruments 543.5 615.1 693.2 777.0 812.2 779.0 788.3 800.1 812.2 811.3 827.7 6
7 Open market paper 31.2 30.2 31.3 27.6 23.8 27.7 27.3 25.5 23.8 24.4 25.0 7 8 Treasury securities 112.1 119.4 138.8 154.7 179.5 163.6 170.9 175.5 179.5 182.0 185.6 8 9 Agency- and GSE-backed securities 116.3 119.0 133.3 144.3 154.1 146.5 148.8 151.4 154.1 153.8 156.9 910 Corporate and foreign bonds 266.9 328.3 374.1 434.7 441.6 426.1 426.6 433.9 441.6 438.3 446.7 1011 Mortgages 17.0 18.2 15.8 15.7 13.3 15.1 14.5 13.9 13.3 12.8 13.4 11
12 Corporate equities 863.8 1010.7 929.5 1048.0 1247.0 1121.0 1132.1 1185.1 1247.0 1267.6 1306.3 1213 Mutual fund shares 322.9 349.8 356.6 359.3 427.5 387.9 391.8 410.1 427.5 434.6 446.5 13
14 Miscellaneous assets 820.6 787.5 892.6 767.0 517.0 674.2 662.2 592.7 517.0 497.5 436.3 1415 Unallocated insurance contracts (2) 57.8 53.0 64.5 58.2 63.4 60.7 60.8 62.3 63.4 64.0 66.1 1516 Contributions receivable 49.8 63.1 64.8 52.4 51.6 52.7 52.6 52.5 51.6 51.6 52.1 1617 Claims of pension fund on sponsor (3) 497.6 446.5 517.2 389.8 131.4 295.7 279.6 208.2 131.4 103.8 31.7 1718 Other 215.5 224.8 246.0 266.6 270.6 265.1 269.1 269.8 270.6 278.1 286.5 18
19 Pension entitlements (liabilities) (4) 2662.7 2872.2 2983.7 3054.3 3105.0 3065.3 3076.6 3089.3 3105.0 3112.7 3120.4 19
(1) Includes claims on sponsor (i.e., unfunded pension entitlements).(2) Assets of private pension plans held at life insurance companies; series begins 1985:Q4.(3) Unfunded defined benefit pension entitlements. Negative values indicate overfunding.(4) Actuarial value of accrued defined benefit pension entitlements.
L.117.c Private Pension Funds: Defined Contribution Plans (1)Billions of dollars; amounts outstanding end of period, not seasonally adjusted
1 Total financial assets 3339.5 3777.8 3769.7 4223.7 5036.8 4510.0 4598.4 4795.4 5036.8 5115.8 5279.1 1
2 Checkable deposits and currency 5.3 4.8 8.6 7.9 8.3 8.2 8.7 8.5 8.3 8.4 9.0 2 3 Time and savings deposits 4.4 3.9 4.3 3.7 4.1 3.9 3.9 4.1 4.1 4.1 4.2 3 4 Money market fund shares 106.8 101.7 118.5 105.4 108.3 109.3 109.1 108.1 108.3 107.0 109.0 4 5 Security repurchase agreements 0.0 0.0 0.0 0.0 0.0 0.0 0.0 0.0 0.0 0.0 0.0 5
6 Credit market instruments 232.1 281.0 276.5 339.4 354.0 344.4 357.7 356.3 354.0 352.8 356.1 6
7 Open market paper 11.0 10.0 11.3 10.1 10.6 10.7 10.8 10.7 10.6 11.0 11.0 7 8 Treasury securities 63.6 87.5 95.2 123.6 134.9 126.6 132.2 133.1 134.9 136.1 137.1 8 9 Agency- and GSE-backed securities 61.2 65.0 55.0 66.1 71.6 67.4 69.2 70.2 71.6 70.5 71.5 910 Corporate and foreign bonds 89.5 110.2 109.0 132.1 130.5 132.7 138.7 135.7 130.5 129.0 130.1 1011 Mortgages 6.7 8.3 6.1 7.4 6.4 7.1 6.8 6.6 6.4 6.1 6.4 11
12 Corporate equities 705.1 839.2 822.3 926.3 1157.7 1015.3 1036.3 1086.4 1157.7 1177.9 1222.6 1213 Mutual fund shares 1564.1 1798.1 1763.1 2025.4 2541.5 2211.2 2259.9 2388.6 2541.5 2588.6 2686.6 13
14 Miscellaneous assets 721.7 749.1 776.3 815.5 862.9 817.7 822.7 843.5 862.9 876.9 891.6 1415 Unallocated insurance contracts (2) 395.9 416.4 420.1 445.7 476.9 450.9 452.9 463.0 476.9 482.9 490.3 1516 Contributions receivable 25.6 27.7 29.0 29.0 29.3 29.1 29.2 29.1 29.3 29.1 29.0 1617 Other 300.2 305.1 327.3 340.8 356.7 337.6 340.6 351.4 356.7 364.9 372.2 17
18 Pension entitlements (liabilities) 3339.5 3777.8 3769.7 4223.7 5036.8 4510.0 4598.4 4795.4 5036.8 5115.8 5279.1 18
(1) Includes 401(k) and 403(b) type plans.(2) Assets of private pension plans held at life insurance companies; series begins 1985:Q4.
L.226.i Individual Retirement Accounts (IRAs) (1)Billions of dollars; amounts outstanding end of period, not seasonally adjusted
1 Total held at: 4488.0 5029.0 5001.0 5561.0 6521.0 5852.0 5910.0 6193.0 6521.0 6619.0 ND 1
2 U.S.-chartered depository institutions 356.7 383.3 403.6 428.0 427.6 424.2 433.8 434.4 427.6 420.9 ND 2 3 Credit unions 74.2 77.2 78.4 79.9 79.2 79.9 79.9 79.9 79.2 78.9 ND 3 4 Life insurance companies 398.0 436.0 440.0 473.0 516.0 488.0 492.0 501.0 516.0 521.0 ND 4 5 Money market mutual funds 226.0 202.0 211.0 218.0 228.0 212.0 226.0 232.0 228.0 223.0 ND 5 6 Mutual funds 1670.0 1937.0 1899.0 2158.0 2619.0 2309.0 2320.0 2454.0 2619.0 2677.0 ND 6 7 Other self-directed accounts 1763.1 1993.5 1968.9 2204.1 2651.2 2339.0 2358.3 2491.8 2651.2 2698.2 ND 7
(1) Assets of the household sector (L.100), shown at market value. IRA assets are not included in pension entitlements (table L.226), except for those at life insurance companies. Figures for depositories (lines 2 and 3) include Keogh accounts. Variable annuities in IRAs are in the life insurance sector (line 4) and are excluded from the mutual fund sector (line 6) and from the money market fund sector (line 5).
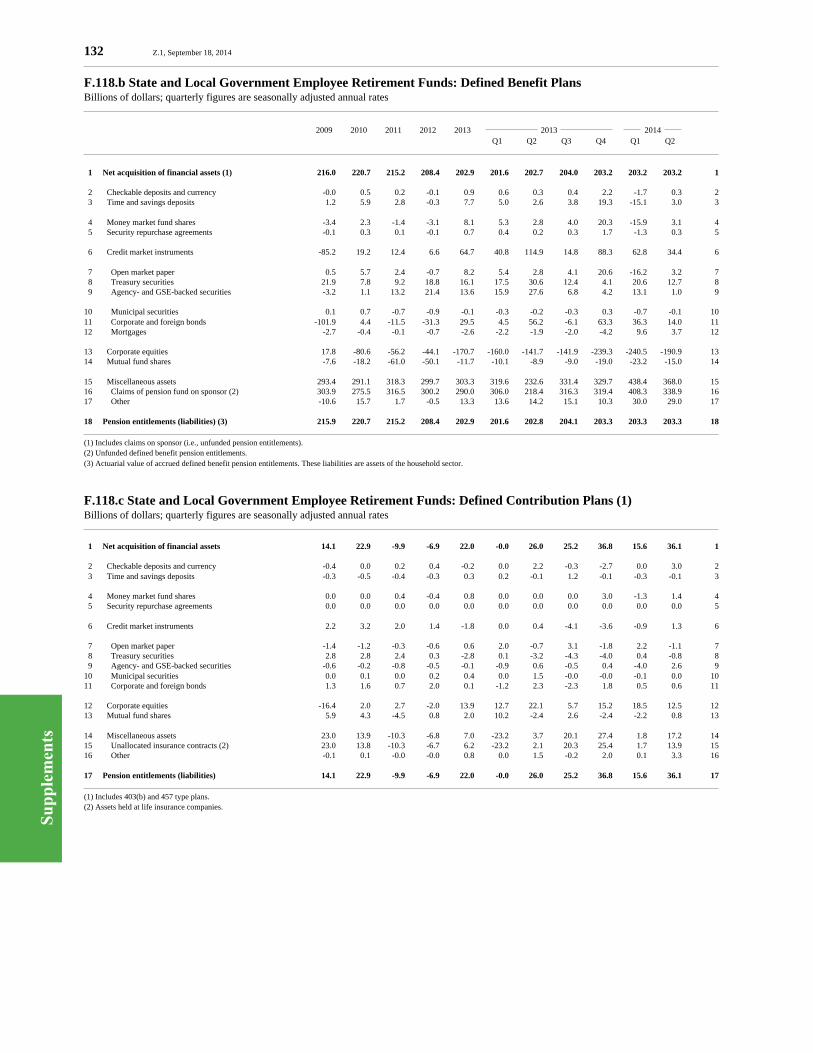
Su
pp
lem
ents
132 Z.1, September 18, 2014
F.118.b State and Local Government Employee Retirement Funds: Defined Benefit PlansBillions of dollars; quarterly figures are seasonally adjusted annual rates
2009 2010 2011 2012 2013 2013 2014 Q1 Q2 Q3 Q4 Q1 Q2
1 Net acquisition of financial assets (1) 216.0 220.7 215.2 208.4 202.9 201.6 202.7 204.0 203.2 203.2 203.2 1
2 Checkable deposits and currency -0.0 0.5 0.2 -0.1 0.9 0.6 0.3 0.4 2.2 -1.7 0.3 2 3 Time and savings deposits 1.2 5.9 2.8 -0.3 7.7 5.0 2.6 3.8 19.3 -15.1 3.0 3
4 Money market fund shares -3.4 2.3 -1.4 -3.1 8.1 5.3 2.8 4.0 20.3 -15.9 3.1 4 5 Security repurchase agreements -0.1 0.3 0.1 -0.1 0.7 0.4 0.2 0.3 1.7 -1.3 0.3 5
6 Credit market instruments -85.2 19.2 12.4 6.6 64.7 40.8 114.9 14.8 88.3 62.8 34.4 6
7 Open market paper 0.5 5.7 2.4 -0.7 8.2 5.4 2.8 4.1 20.6 -16.2 3.2 7 8 Treasury securities 21.9 7.8 9.2 18.8 16.1 17.5 30.6 12.4 4.1 20.6 12.7 8 9 Agency- and GSE-backed securities -3.2 1.1 13.2 21.4 13.6 15.9 27.6 6.8 4.2 13.1 1.0 9
10 Municipal securities 0.1 0.7 -0.7 -0.9 -0.1 -0.3 -0.2 -0.3 0.3 -0.7 -0.1 1011 Corporate and foreign bonds -101.9 4.4 -11.5 -31.3 29.5 4.5 56.2 -6.1 63.3 36.3 14.0 1112 Mortgages -2.7 -0.4 -0.1 -0.7 -2.6 -2.2 -1.9 -2.0 -4.2 9.6 3.7 12
13 Corporate equities 17.8 -80.6 -56.2 -44.1 -170.7 -160.0 -141.7 -141.9 -239.3 -240.5 -190.9 1314 Mutual fund shares -7.6 -18.2 -61.0 -50.1 -11.7 -10.1 -8.9 -9.0 -19.0 -23.2 -15.0 14
15 Miscellaneous assets 293.4 291.1 318.3 299.7 303.3 319.6 232.6 331.4 329.7 438.4 368.0 1516 Claims of pension fund on sponsor (2) 303.9 275.5 316.5 300.2 290.0 306.0 218.4 316.3 319.4 408.3 338.9 1617 Other -10.6 15.7 1.7 -0.5 13.3 13.6 14.2 15.1 10.3 30.0 29.0 17
18 Pension entitlements (liabilities) (3) 215.9 220.7 215.2 208.4 202.9 201.6 202.8 204.1 203.3 203.3 203.3 18
(1) Includes claims on sponsor (i.e., unfunded pension entitlements).(2) Unfunded defined benefit pension entitlements.(3) Actuarial value of accrued defined benefit pension entitlements. These liabilities are assets of the household sector.
F.118.c State and Local Government Employee Retirement Funds: Defined Contribution Plans (1)Billions of dollars; quarterly figures are seasonally adjusted annual rates
1 Net acquisition of financial assets 14.1 22.9 -9.9 -6.9 22.0 -0.0 26.0 25.2 36.8 15.6 36.1 1
2 Checkable deposits and currency -0.4 0.0 0.2 0.4 -0.2 0.0 2.2 -0.3 -2.7 0.0 3.0 2 3 Time and savings deposits -0.3 -0.5 -0.4 -0.3 0.3 0.2 -0.1 1.2 -0.1 -0.3 -0.1 3
4 Money market fund shares 0.0 0.0 0.4 -0.4 0.8 0.0 0.0 0.0 3.0 -1.3 1.4 4 5 Security repurchase agreements 0.0 0.0 0.0 0.0 0.0 0.0 0.0 0.0 0.0 0.0 0.0 5
6 Credit market instruments 2.2 3.2 2.0 1.4 -1.8 0.0 0.4 -4.1 -3.6 -0.9 1.3 6
7 Open market paper -1.4 -1.2 -0.3 -0.6 0.6 2.0 -0.7 3.1 -1.8 2.2 -1.1 7 8 Treasury securities 2.8 2.8 2.4 0.3 -2.8 0.1 -3.2 -4.3 -4.0 0.4 -0.8 8 9 Agency- and GSE-backed securities -0.6 -0.2 -0.8 -0.5 -0.1 -0.9 0.6 -0.5 0.4 -4.0 2.6 910 Municipal securities 0.0 0.1 0.0 0.2 0.4 0.0 1.5 -0.0 -0.0 -0.1 0.0 1011 Corporate and foreign bonds 1.3 1.6 0.7 2.0 0.1 -1.2 2.3 -2.3 1.8 0.5 0.6 11
12 Corporate equities -16.4 2.0 2.7 -2.0 13.9 12.7 22.1 5.7 15.2 18.5 12.5 1213 Mutual fund shares 5.9 4.3 -4.5 0.8 2.0 10.2 -2.4 2.6 -2.4 -2.2 0.8 13
14 Miscellaneous assets 23.0 13.9 -10.3 -6.8 7.0 -23.2 3.7 20.1 27.4 1.8 17.2 1415 Unallocated insurance contracts (2) 23.0 13.8 -10.3 -6.7 6.2 -23.2 2.1 20.3 25.4 1.7 13.9 1516 Other -0.1 0.1 -0.0 -0.0 0.8 0.0 1.5 -0.2 2.0 0.1 3.3 16
17 Pension entitlements (liabilities) 14.1 22.9 -9.9 -6.9 22.0 -0.0 26.0 25.2 36.8 15.6 36.1 17
(1) Includes 403(b) and 457 type plans.(2) Assets held at life insurance companies.
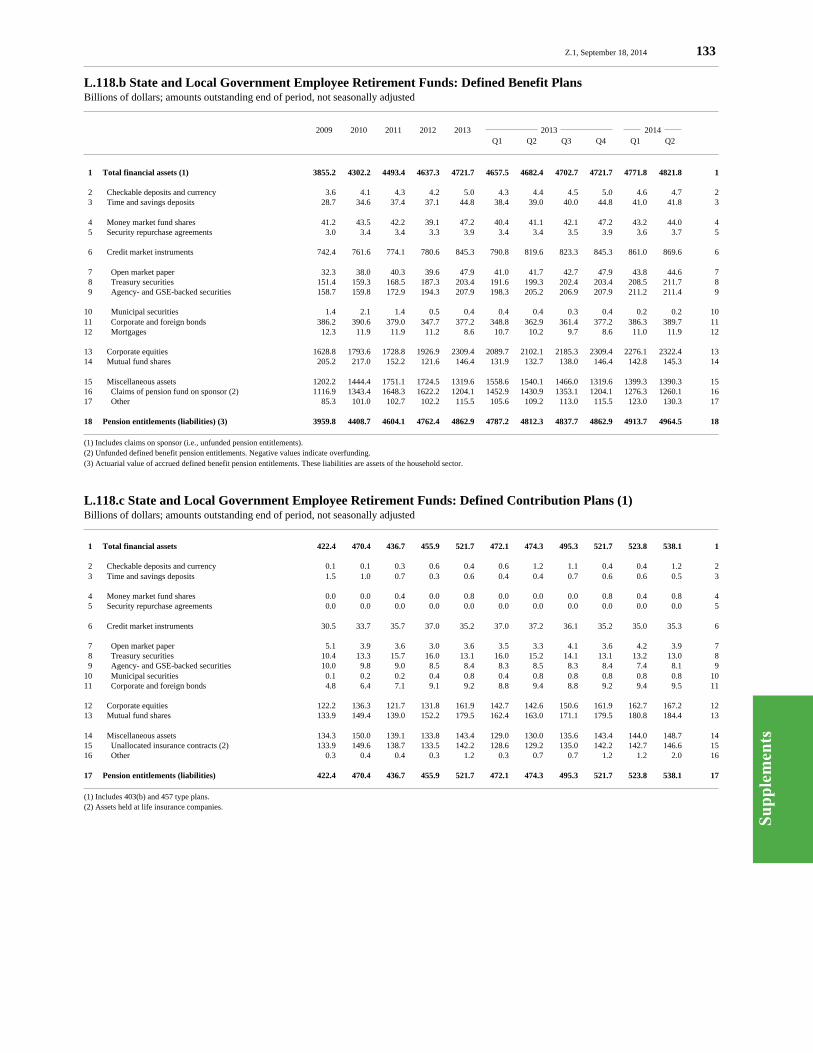
Su
pp
lem
ents
Z.1, September 18, 2014 133
L.118.b State and Local Government Employee Retirement Funds: Defined Benefit PlansBillions of dollars; amounts outstanding end of period, not seasonally adjusted
2009 2010 2011 2012 2013 2013 2014 Q1 Q2 Q3 Q4 Q1 Q2
1 Total financial assets (1) 3855.2 4302.2 4493.4 4637.3 4721.7 4657.5 4682.4 4702.7 4721.7 4771.8 4821.8 1
2 Checkable deposits and currency 3.6 4.1 4.3 4.2 5.0 4.3 4.4 4.5 5.0 4.6 4.7 2 3 Time and savings deposits 28.7 34.6 37.4 37.1 44.8 38.4 39.0 40.0 44.8 41.0 41.8 3
4 Money market fund shares 41.2 43.5 42.2 39.1 47.2 40.4 41.1 42.1 47.2 43.2 44.0 4 5 Security repurchase agreements 3.0 3.4 3.4 3.3 3.9 3.4 3.4 3.5 3.9 3.6 3.7 5
6 Credit market instruments 742.4 761.6 774.1 780.6 845.3 790.8 819.6 823.3 845.3 861.0 869.6 6
7 Open market paper 32.3 38.0 40.3 39.6 47.9 41.0 41.7 42.7 47.9 43.8 44.6 7 8 Treasury securities 151.4 159.3 168.5 187.3 203.4 191.6 199.3 202.4 203.4 208.5 211.7 8 9 Agency- and GSE-backed securities 158.7 159.8 172.9 194.3 207.9 198.3 205.2 206.9 207.9 211.2 211.4 9
10 Municipal securities 1.4 2.1 1.4 0.5 0.4 0.4 0.4 0.3 0.4 0.2 0.2 1011 Corporate and foreign bonds 386.2 390.6 379.0 347.7 377.2 348.8 362.9 361.4 377.2 386.3 389.7 1112 Mortgages 12.3 11.9 11.9 11.2 8.6 10.7 10.2 9.7 8.6 11.0 11.9 12
13 Corporate equities 1628.8 1793.6 1728.8 1926.9 2309.4 2089.7 2102.1 2185.3 2309.4 2276.1 2322.4 1314 Mutual fund shares 205.2 217.0 152.2 121.6 146.4 131.9 132.7 138.0 146.4 142.8 145.3 14
15 Miscellaneous assets 1202.2 1444.4 1751.1 1724.5 1319.6 1558.6 1540.1 1466.0 1319.6 1399.3 1390.3 1516 Claims of pension fund on sponsor (2) 1116.9 1343.4 1648.3 1622.2 1204.1 1452.9 1430.9 1353.1 1204.1 1276.3 1260.1 1617 Other 85.3 101.0 102.7 102.2 115.5 105.6 109.2 113.0 115.5 123.0 130.3 17
18 Pension entitlements (liabilities) (3) 3959.8 4408.7 4604.1 4762.4 4862.9 4787.2 4812.3 4837.7 4862.9 4913.7 4964.5 18
(1) Includes claims on sponsor (i.e., unfunded pension entitlements).(2) Unfunded defined benefit pension entitlements. Negative values indicate overfunding.(3) Actuarial value of accrued defined benefit pension entitlements. These liabilities are assets of the household sector.
L.118.c State and Local Government Employee Retirement Funds: Defined Contribution Plans (1)Billions of dollars; amounts outstanding end of period, not seasonally adjusted
1 Total financial assets 422.4 470.4 436.7 455.9 521.7 472.1 474.3 495.3 521.7 523.8 538.1 1
2 Checkable deposits and currency 0.1 0.1 0.3 0.6 0.4 0.6 1.2 1.1 0.4 0.4 1.2 2 3 Time and savings deposits 1.5 1.0 0.7 0.3 0.6 0.4 0.4 0.7 0.6 0.6 0.5 3
4 Money market fund shares 0.0 0.0 0.4 0.0 0.8 0.0 0.0 0.0 0.8 0.4 0.8 4 5 Security repurchase agreements 0.0 0.0 0.0 0.0 0.0 0.0 0.0 0.0 0.0 0.0 0.0 5
6 Credit market instruments 30.5 33.7 35.7 37.0 35.2 37.0 37.2 36.1 35.2 35.0 35.3 6
7 Open market paper 5.1 3.9 3.6 3.0 3.6 3.5 3.3 4.1 3.6 4.2 3.9 7 8 Treasury securities 10.4 13.3 15.7 16.0 13.1 16.0 15.2 14.1 13.1 13.2 13.0 8 9 Agency- and GSE-backed securities 10.0 9.8 9.0 8.5 8.4 8.3 8.5 8.3 8.4 7.4 8.1 910 Municipal securities 0.1 0.2 0.2 0.4 0.8 0.4 0.8 0.8 0.8 0.8 0.8 1011 Corporate and foreign bonds 4.8 6.4 7.1 9.1 9.2 8.8 9.4 8.8 9.2 9.4 9.5 11
12 Corporate equities 122.2 136.3 121.7 131.8 161.9 142.7 142.6 150.6 161.9 162.7 167.2 1213 Mutual fund shares 133.9 149.4 139.0 152.2 179.5 162.4 163.0 171.1 179.5 180.8 184.4 13
14 Miscellaneous assets 134.3 150.0 139.1 133.8 143.4 129.0 130.0 135.6 143.4 144.0 148.7 1415 Unallocated insurance contracts (2) 133.9 149.6 138.7 133.5 142.2 128.6 129.2 135.0 142.2 142.7 146.6 1516 Other 0.3 0.4 0.4 0.3 1.2 0.3 0.7 0.7 1.2 1.2 2.0 16
17 Pension entitlements (liabilities) 422.4 470.4 436.7 455.9 521.7 472.1 474.3 495.3 521.7 523.8 538.1 17
(1) Includes 403(b) and 457 type plans.(2) Assets held at life insurance companies.
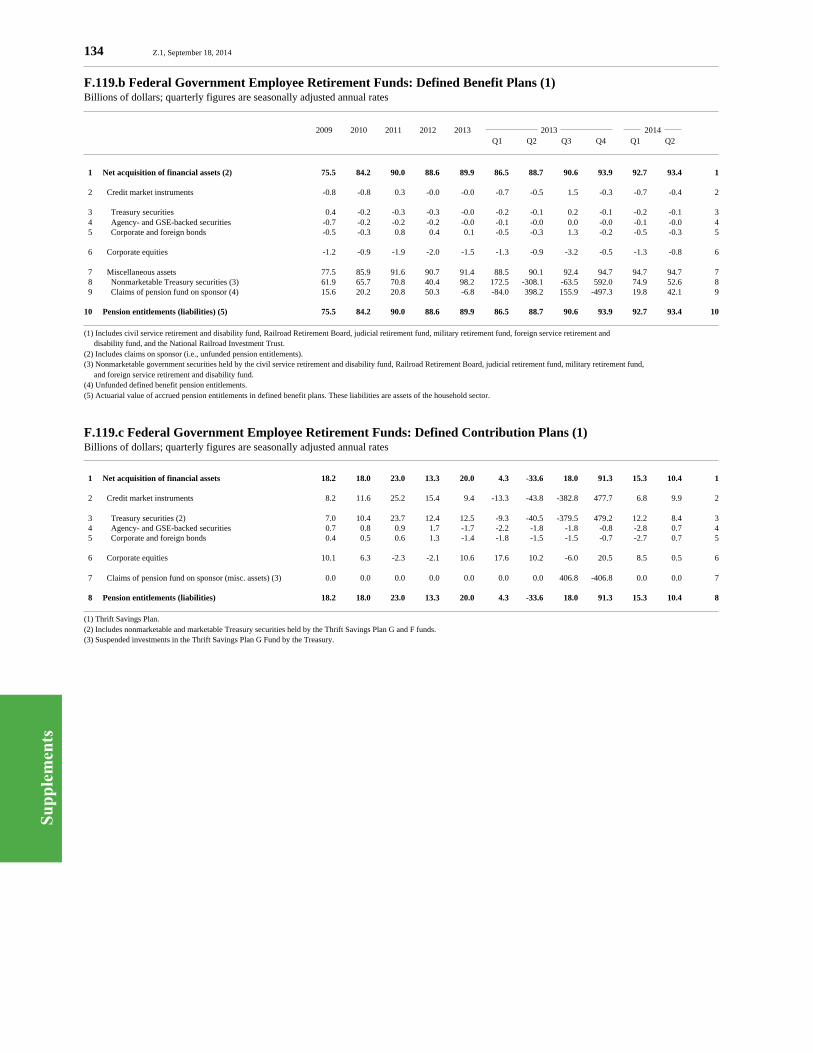
Su
pp
lem
ents
134 Z.1, September 18, 2014
F.119.b Federal Government Employee Retirement Funds: Defined Benefit Plans (1)Billions of dollars; quarterly figures are seasonally adjusted annual rates
2009 2010 2011 2012 2013 2013 2014 Q1 Q2 Q3 Q4 Q1 Q2
1 Net acquisition of financial assets (2) 75.5 84.2 90.0 88.6 89.9 86.5 88.7 90.6 93.9 92.7 93.4 1
2 Credit market instruments -0.8 -0.8 0.3 -0.0 -0.0 -0.7 -0.5 1.5 -0.3 -0.7 -0.4 2
3 Treasury securities 0.4 -0.2 -0.3 -0.3 -0.0 -0.2 -0.1 0.2 -0.1 -0.2 -0.1 3 4 Agency- and GSE-backed securities -0.7 -0.2 -0.2 -0.2 -0.0 -0.1 -0.0 0.0 -0.0 -0.1 -0.0 4 5 Corporate and foreign bonds -0.5 -0.3 0.8 0.4 0.1 -0.5 -0.3 1.3 -0.2 -0.5 -0.3 5
6 Corporate equities -1.2 -0.9 -1.9 -2.0 -1.5 -1.3 -0.9 -3.2 -0.5 -1.3 -0.8 6
7 Miscellaneous assets 77.5 85.9 91.6 90.7 91.4 88.5 90.1 92.4 94.7 94.7 94.7 7 8 Nonmarketable Treasury securities (3) 61.9 65.7 70.8 40.4 98.2 172.5 -308.1 -63.5 592.0 74.9 52.6 8 9 Claims of pension fund on sponsor (4) 15.6 20.2 20.8 50.3 -6.8 -84.0 398.2 155.9 -497.3 19.8 42.1 9
10 Pension entitlements (liabilities) (5) 75.5 84.2 90.0 88.6 89.9 86.5 88.7 90.6 93.9 92.7 93.4 10
(1) Includes civil service retirement and disability fund, Railroad Retirement Board, judicial retirement fund, military retirement fund, foreign service retirement and disability fund, and the National Railroad Investment Trust.(2) Includes claims on sponsor (i.e., unfunded pension entitlements).(3) Nonmarketable government securities held by the civil service retirement and disability fund, Railroad Retirement Board, judicial retirement fund, military retirement fund, and foreign service retirement and disability fund.(4) Unfunded defined benefit pension entitlements.(5) Actuarial value of accrued pension entitlements in defined benefit plans. These liabilities are assets of the household sector.
F.119.c Federal Government Employee Retirement Funds: Defined Contribution Plans (1)Billions of dollars; quarterly figures are seasonally adjusted annual rates
1 Net acquisition of financial assets 18.2 18.0 23.0 13.3 20.0 4.3 -33.6 18.0 91.3 15.3 10.4 1
2 Credit market instruments 8.2 11.6 25.2 15.4 9.4 -13.3 -43.8 -382.8 477.7 6.8 9.9 2
3 Treasury securities (2) 7.0 10.4 23.7 12.4 12.5 -9.3 -40.5 -379.5 479.2 12.2 8.4 3 4 Agency- and GSE-backed securities 0.7 0.8 0.9 1.7 -1.7 -2.2 -1.8 -1.8 -0.8 -2.8 0.7 4 5 Corporate and foreign bonds 0.4 0.5 0.6 1.3 -1.4 -1.8 -1.5 -1.5 -0.7 -2.7 0.7 5
6 Corporate equities 10.1 6.3 -2.3 -2.1 10.6 17.6 10.2 -6.0 20.5 8.5 0.5 6
7 Claims of pension fund on sponsor (misc. assets) (3) 0.0 0.0 0.0 0.0 0.0 0.0 0.0 406.8 -406.8 0.0 0.0 7
8 Pension entitlements (liabilities) 18.2 18.0 23.0 13.3 20.0 4.3 -33.6 18.0 91.3 15.3 10.4 8
(1) Thrift Savings Plan.(2) Includes nonmarketable and marketable Treasury securities held by the Thrift Savings Plan G and F funds.(3) Suspended investments in the Thrift Savings Plan G Fund by the Treasury.
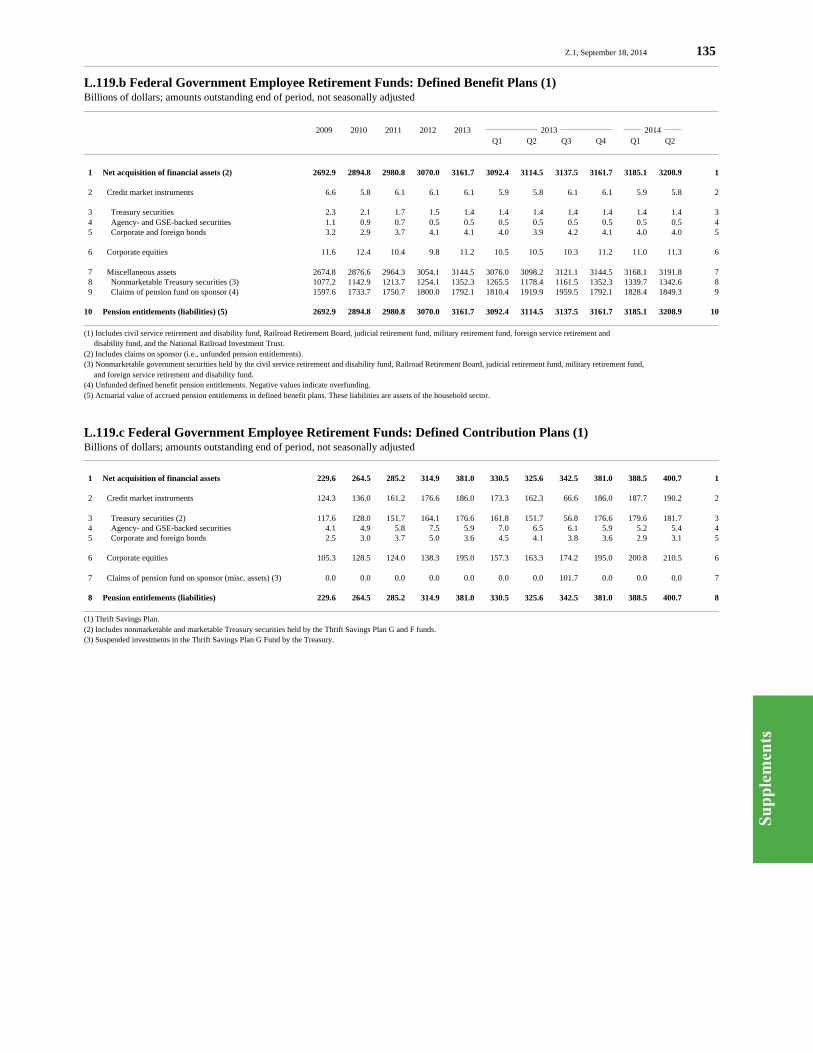
Su
pp
lem
ents
Z.1, September 18, 2014 135
L.119.b Federal Government Employee Retirement Funds: Defined Benefit Plans (1)Billions of dollars; amounts outstanding end of period, not seasonally adjusted
2009 2010 2011 2012 2013 2013 2014 Q1 Q2 Q3 Q4 Q1 Q2
1 Net acquisition of financial assets (2) 2692.9 2894.8 2980.8 3070.0 3161.7 3092.4 3114.5 3137.5 3161.7 3185.1 3208.9 1
2 Credit market instruments 6.6 5.8 6.1 6.1 6.1 5.9 5.8 6.1 6.1 5.9 5.8 2
3 Treasury securities 2.3 2.1 1.7 1.5 1.4 1.4 1.4 1.4 1.4 1.4 1.4 3 4 Agency- and GSE-backed securities 1.1 0.9 0.7 0.5 0.5 0.5 0.5 0.5 0.5 0.5 0.5 4 5 Corporate and foreign bonds 3.2 2.9 3.7 4.1 4.1 4.0 3.9 4.2 4.1 4.0 4.0 5
6 Corporate equities 11.6 12.4 10.4 9.8 11.2 10.5 10.5 10.3 11.2 11.0 11.3 6
7 Miscellaneous assets 2674.8 2876.6 2964.3 3054.1 3144.5 3076.0 3098.2 3121.1 3144.5 3168.1 3191.8 7 8 Nonmarketable Treasury securities (3) 1077.2 1142.9 1213.7 1254.1 1352.3 1265.5 1178.4 1161.5 1352.3 1339.7 1342.6 8 9 Claims of pension fund on sponsor (4) 1597.6 1733.7 1750.7 1800.0 1792.1 1810.4 1919.9 1959.5 1792.1 1828.4 1849.3 9
10 Pension entitlements (liabilities) (5) 2692.9 2894.8 2980.8 3070.0 3161.7 3092.4 3114.5 3137.5 3161.7 3185.1 3208.9 10
(1) Includes civil service retirement and disability fund, Railroad Retirement Board, judicial retirement fund, military retirement fund, foreign service retirement and disability fund, and the National Railroad Investment Trust.(2) Includes claims on sponsor (i.e., unfunded pension entitlements).(3) Nonmarketable government securities held by the civil service retirement and disability fund, Railroad Retirement Board, judicial retirement fund, military retirement fund, and foreign service retirement and disability fund.(4) Unfunded defined benefit pension entitlements. Negative values indicate overfunding.(5) Actuarial value of accrued pension entitlements in defined benefit plans. These liabilities are assets of the household sector.
L.119.c Federal Government Employee Retirement Funds: Defined Contribution Plans (1)Billions of dollars; amounts outstanding end of period, not seasonally adjusted
1 Net acquisition of financial assets 229.6 264.5 285.2 314.9 381.0 330.5 325.6 342.5 381.0 388.5 400.7 1
2 Credit market instruments 124.3 136.0 161.2 176.6 186.0 173.3 162.3 66.6 186.0 187.7 190.2 2
3 Treasury securities (2) 117.6 128.0 151.7 164.1 176.6 161.8 151.7 56.8 176.6 179.6 181.7 3 4 Agency- and GSE-backed securities 4.1 4.9 5.8 7.5 5.9 7.0 6.5 6.1 5.9 5.2 5.4 4 5 Corporate and foreign bonds 2.5 3.0 3.7 5.0 3.6 4.5 4.1 3.8 3.6 2.9 3.1 5
6 Corporate equities 105.3 128.5 124.0 138.3 195.0 157.3 163.3 174.2 195.0 200.8 210.5 6
7 Claims of pension fund on sponsor (misc. assets) (3) 0.0 0.0 0.0 0.0 0.0 0.0 0.0 101.7 0.0 0.0 0.0 7
8 Pension entitlements (liabilities) 229.6 264.5 285.2 314.9 381.0 330.5 325.6 342.5 381.0 388.5 400.7 8
(1) Thrift Savings Plan.(2) Includes nonmarketable and marketable Treasury securities held by the Thrift Savings Plan G and F funds.(3) Suspended investments in the Thrift Savings Plan G Fund by the Treasury.
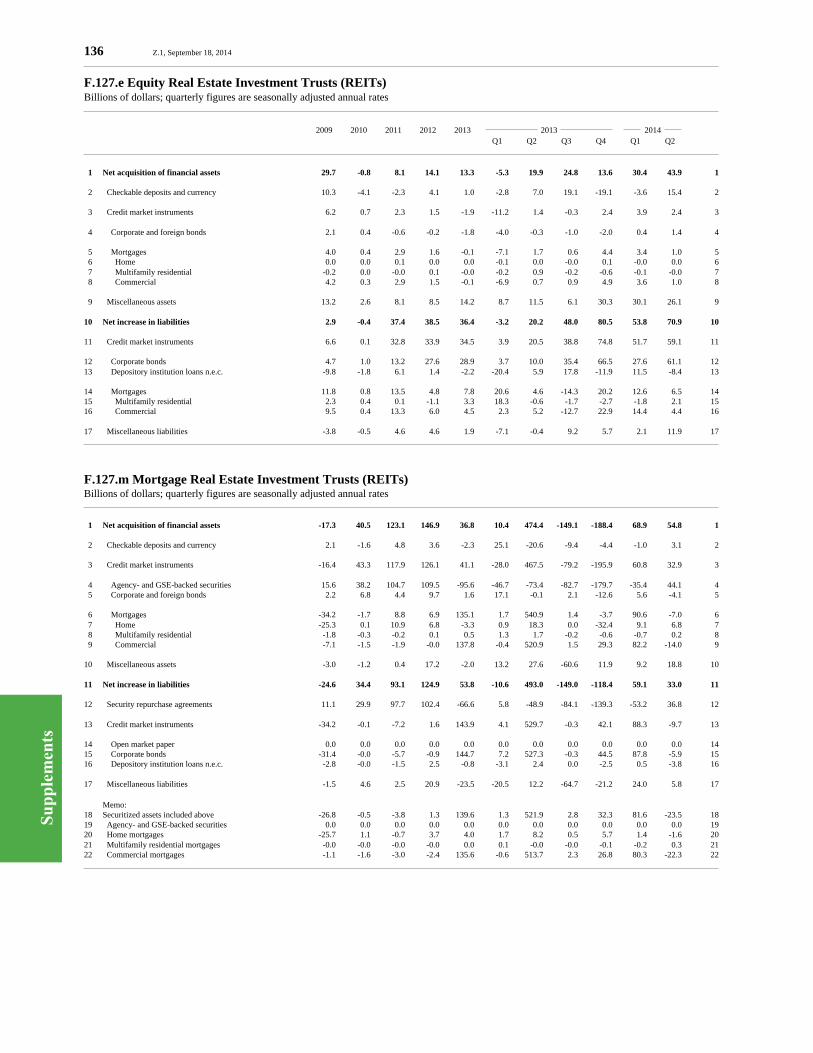
Su
pp
lem
ents
136 Z.1, September 18, 2014
F.127.e Equity Real Estate Investment Trusts (REITs)Billions of dollars; quarterly figures are seasonally adjusted annual rates
2009 2010 2011 2012 2013 2013 2014 Q1 Q2 Q3 Q4 Q1 Q2
1 Net acquisition of financial assets 29.7 -0.8 8.1 14.1 13.3 -5.3 19.9 24.8 13.6 30.4 43.9 1
2 Checkable deposits and currency 10.3 -4.1 -2.3 4.1 1.0 -2.8 7.0 19.1 -19.1 -3.6 15.4 2
3 Credit market instruments 6.2 0.7 2.3 1.5 -1.9 -11.2 1.4 -0.3 2.4 3.9 2.4 3
4 Corporate and foreign bonds 2.1 0.4 -0.6 -0.2 -1.8 -4.0 -0.3 -1.0 -2.0 0.4 1.4 4
5 Mortgages 4.0 0.4 2.9 1.6 -0.1 -7.1 1.7 0.6 4.4 3.4 1.0 5 6 Home 0.0 0.0 0.1 0.0 0.0 -0.1 0.0 -0.0 0.1 -0.0 0.0 6 7 Multifamily residential -0.2 0.0 -0.0 0.1 -0.0 -0.2 0.9 -0.2 -0.6 -0.1 -0.0 7 8 Commercial 4.2 0.3 2.9 1.5 -0.1 -6.9 0.7 0.9 4.9 3.6 1.0 8
9 Miscellaneous assets 13.2 2.6 8.1 8.5 14.2 8.7 11.5 6.1 30.3 30.1 26.1 9
10 Net increase in liabilities 2.9 -0.4 37.4 38.5 36.4 -3.2 20.2 48.0 80.5 53.8 70.9 10
11 Credit market instruments 6.6 0.1 32.8 33.9 34.5 3.9 20.5 38.8 74.8 51.7 59.1 11
12 Corporate bonds 4.7 1.0 13.2 27.6 28.9 3.7 10.0 35.4 66.5 27.6 61.1 1213 Depository institution loans n.e.c. -9.8 -1.8 6.1 1.4 -2.2 -20.4 5.9 17.8 -11.9 11.5 -8.4 13
14 Mortgages 11.8 0.8 13.5 4.8 7.8 20.6 4.6 -14.3 20.2 12.6 6.5 1415 Multifamily residential 2.3 0.4 0.1 -1.1 3.3 18.3 -0.6 -1.7 -2.7 -1.8 2.1 1516 Commercial 9.5 0.4 13.3 6.0 4.5 2.3 5.2 -12.7 22.9 14.4 4.4 16
17 Miscellaneous liabilities -3.8 -0.5 4.6 4.6 1.9 -7.1 -0.4 9.2 5.7 2.1 11.9 17
F.127.m Mortgage Real Estate Investment Trusts (REITs)Billions of dollars; quarterly figures are seasonally adjusted annual rates
1 Net acquisition of financial assets -17.3 40.5 123.1 146.9 36.8 10.4 474.4 -149.1 -188.4 68.9 54.8 1
2 Checkable deposits and currency 2.1 -1.6 4.8 3.6 -2.3 25.1 -20.6 -9.4 -4.4 -1.0 3.1 2
3 Credit market instruments -16.4 43.3 117.9 126.1 41.1 -28.0 467.5 -79.2 -195.9 60.8 32.9 3
4 Agency- and GSE-backed securities 15.6 38.2 104.7 109.5 -95.6 -46.7 -73.4 -82.7 -179.7 -35.4 44.1 4 5 Corporate and foreign bonds 2.2 6.8 4.4 9.7 1.6 17.1 -0.1 2.1 -12.6 5.6 -4.1 5
6 Mortgages -34.2 -1.7 8.8 6.9 135.1 1.7 540.9 1.4 -3.7 90.6 -7.0 6 7 Home -25.3 0.1 10.9 6.8 -3.3 0.9 18.3 0.0 -32.4 9.1 6.8 7 8 Multifamily residential -1.8 -0.3 -0.2 0.1 0.5 1.3 1.7 -0.2 -0.6 -0.7 0.2 8 9 Commercial -7.1 -1.5 -1.9 -0.0 137.8 -0.4 520.9 1.5 29.3 82.2 -14.0 9
10 Miscellaneous assets -3.0 -1.2 0.4 17.2 -2.0 13.2 27.6 -60.6 11.9 9.2 18.8 10
11 Net increase in liabilities -24.6 34.4 93.1 124.9 53.8 -10.6 493.0 -149.0 -118.4 59.1 33.0 11
12 Security repurchase agreements 11.1 29.9 97.7 102.4 -66.6 5.8 -48.9 -84.1 -139.3 -53.2 36.8 12
13 Credit market instruments -34.2 -0.1 -7.2 1.6 143.9 4.1 529.7 -0.3 42.1 88.3 -9.7 13
14 Open market paper 0.0 0.0 0.0 0.0 0.0 0.0 0.0 0.0 0.0 0.0 0.0 1415 Corporate bonds -31.4 -0.0 -5.7 -0.9 144.7 7.2 527.3 -0.3 44.5 87.8 -5.9 1516 Depository institution loans n.e.c. -2.8 -0.0 -1.5 2.5 -0.8 -3.1 2.4 0.0 -2.5 0.5 -3.8 16
17 Miscellaneous liabilities -1.5 4.6 2.5 20.9 -23.5 -20.5 12.2 -64.7 -21.2 24.0 5.8 17
Memo:18 Securitized assets included above -26.8 -0.5 -3.8 1.3 139.6 1.3 521.9 2.8 32.3 81.6 -23.5 1819 Agency- and GSE-backed securities 0.0 0.0 0.0 0.0 0.0 0.0 0.0 0.0 0.0 0.0 0.0 1920 Home mortgages -25.7 1.1 -0.7 3.7 4.0 1.7 8.2 0.5 5.7 1.4 -1.6 2021 Multifamily residential mortgages -0.0 -0.0 -0.0 -0.0 0.0 0.1 -0.0 -0.0 -0.1 -0.2 0.3 2122 Commercial mortgages -1.1 -1.6 -3.0 -2.4 135.6 -0.6 513.7 2.3 26.8 80.3 -22.3 22

Su
pp
lem
ents
Z.1, September 18, 2014 137
L.127.e Equity Real Estate Investment Trusts (REITs)Billions of dollars; amounts outstanding end of period, not seasonally adjusted
2009 2010 2011 2012 2013 2013 2014 Q1 Q2 Q3 Q4 Q1 Q2
1 Total financial assets 95.1 94.3 102.3 116.4 129.7 115.1 120.1 126.3 129.7 137.3 148.3 1
2 Checkable deposits and currency 23.4 19.3 17.0 21.1 22.1 20.4 22.1 26.9 22.1 21.2 25.1 2
3 Credit market instruments 20.6 21.3 23.6 25.0 23.1 22.2 22.6 22.5 23.1 24.0 24.6 3
4 Corporate and foreign bonds 5.0 5.4 4.8 4.6 2.8 3.6 3.5 3.3 2.8 2.9 3.2 4
5 Mortgages 15.5 15.9 18.8 20.4 20.3 18.6 19.0 19.2 20.3 21.2 21.4 5 6 Home 0.1 0.1 0.2 0.2 0.2 0.2 0.2 0.2 0.2 0.2 0.2 6 7 Multifamily residential 0.3 0.3 0.3 0.4 0.3 0.3 0.5 0.5 0.3 0.3 0.3 7 8 Commercial 15.1 15.5 18.3 19.9 19.8 18.1 18.3 18.5 19.8 20.6 20.9 8
9 Miscellaneous assets 51.1 53.7 61.8 70.3 84.5 72.5 75.4 76.9 84.5 92.0 98.5 9
10 Total liabilities 347.2 346.8 384.1 422.6 459.0 421.8 426.9 438.9 459.0 472.5 490.2 10
11 Credit market instruments 300.8 300.9 333.6 367.5 402.0 368.5 373.6 383.3 402.0 415.0 429.7 11
12 Corporate bonds 107.3 108.4 121.6 149.2 178.1 150.2 152.7 161.5 178.1 185.0 200.3 1213 Depository institution loans n.e.c. 18.2 16.4 22.5 23.9 21.7 18.8 20.3 24.7 21.7 24.6 22.5 13
14 Mortgages 175.3 176.1 189.5 194.4 202.2 199.5 200.7 197.1 202.2 205.3 206.9 1415 Multifamily residential 27.3 27.8 27.9 26.7 30.0 31.3 31.1 30.7 30.0 29.6 30.1 1516 Commercial 147.9 148.3 161.7 167.7 172.1 168.3 169.6 166.4 172.1 175.7 176.8 16
17 Miscellaneous liabilities 46.4 45.9 50.5 55.1 57.0 53.3 53.2 55.5 57.0 57.5 60.4 17
L.127.m Mortgage Real Estate Investment Trusts (REITs)Billions of dollars; amounts outstanding end of period, not seasonally adjusted
1 Total financial assets 167.7 208.1 331.1 477.8 514.5 480.4 598.9 561.6 514.5 531.7 545.4 1
2 Checkable deposits and currency 7.4 5.8 10.7 14.2 11.9 20.5 15.3 13.0 11.9 11.6 12.4 2
3 Credit market instruments 146.6 189.9 307.6 433.5 474.5 426.5 543.3 523.5 474.5 489.7 497.9 3
4 Agency- and GSE-backed securities 105.2 143.4 248.1 357.6 261.9 345.9 327.5 306.9 261.9 253.1 264.1 4 5 Corporate and foreign bonds 11.0 17.8 22.2 31.9 33.6 36.2 36.2 36.7 33.6 35.0 33.9 5
6 Mortgages 30.5 28.7 37.3 44.1 179.0 44.4 179.6 179.9 179.0 201.6 199.9 6 7 Home 8.8 8.8 19.6 26.3 22.9 26.4 31.0 31.0 22.9 25.1 26.8 7 8 Multifamily residential 2.0 1.6 1.4 1.5 2.0 1.8 2.2 2.2 2.0 1.9 1.9 8 9 Commercial 19.7 18.2 16.3 16.3 154.1 16.2 146.4 146.8 154.1 174.7 171.2 9
10 Miscellaneous assets 13.7 12.5 12.8 30.1 28.1 33.4 40.3 25.1 28.1 30.4 35.1 10
11 Total liabilities 142.7 177.2 270.3 395.2 448.9 392.5 515.8 478.5 448.9 463.7 472.0 11
12 Security repurchase agreements 90.5 120.4 218.1 320.6 254.0 322.0 309.8 288.8 254.0 240.6 249.9 12
13 Credit market instruments 39.1 39.0 31.9 33.5 177.4 34.5 166.9 166.8 177.4 199.4 197.0 13
14 Open market paper 0.0 0.0 0.0 0.0 0.0 0.0 0.0 0.0 0.0 0.0 0.0 1415 Corporate bonds 37.1 37.0 31.3 30.4 175.1 32.2 164.0 163.9 175.1 197.0 195.6 1516 Depository institution loans n.e.c. 2.0 2.0 0.5 3.1 2.3 2.3 2.9 2.9 2.3 2.4 1.5 16
17 Miscellaneous liabilities 13.2 17.8 20.3 41.2 17.6 36.0 39.1 22.9 17.6 23.6 25.1 17
Memo:18 Securitized assets included above 18.6 18.1 14.3 15.6 155.2 16.0 146.4 147.1 155.2 175.6 169.7 1819 Agency- and GSE-backed securities 0.0 0.0 0.0 0.0 0.0 0.0 0.0 0.0 0.0 0.0 0.0 1920 Home mortgages 6.1 7.2 6.5 10.2 14.2 10.6 12.6 12.8 14.2 14.5 14.2 2021 Multifamily residential mortgages 0.4 0.4 0.3 0.3 0.3 0.3 0.3 0.3 0.3 0.3 0.3 2122 Commercial mortgages 12.2 10.6 7.5 5.2 140.7 5.0 133.5 134.0 140.7 160.8 155.2 22
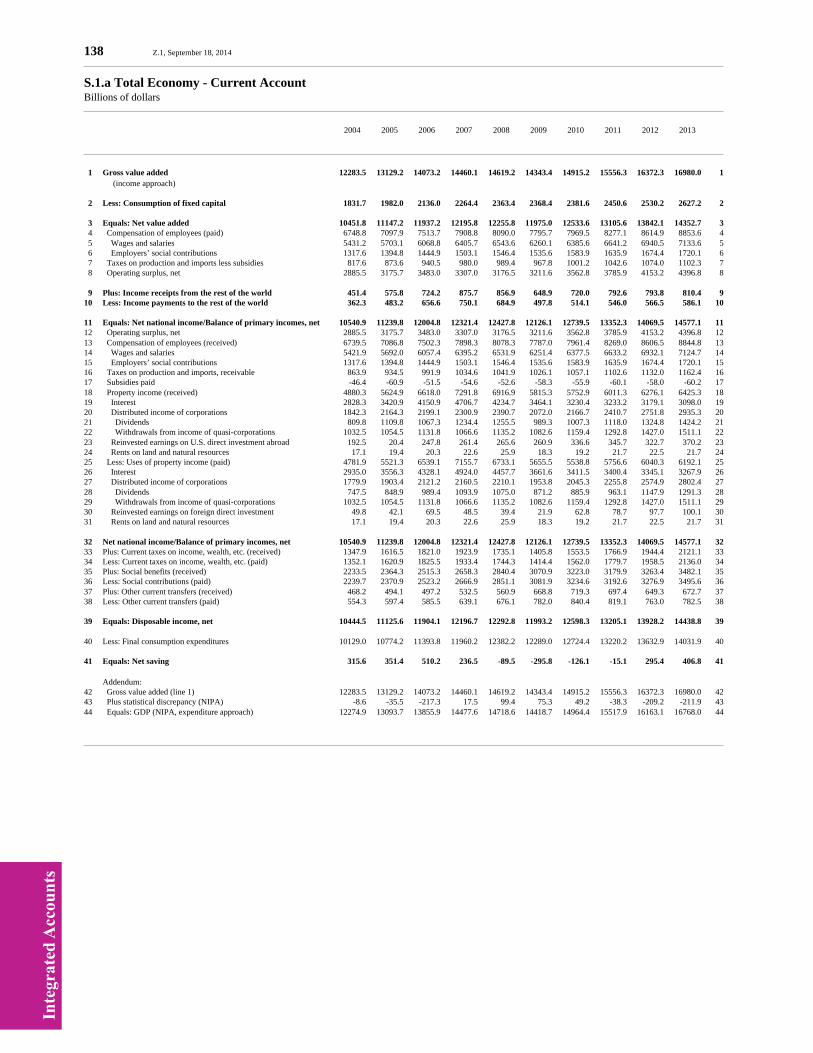
Inte
grat
ed A
ccou
nts
138 Z.1, September 18, 2014
S.1.a Total Economy - Current AccountBillions of dollars
2004 2005 2006 2007 2008 2009 2010 2011 2012 2013
1 Gross value added 12283.5 13129.2 14073.2 14460.1 14619.2 14343.4 14915.2 15556.3 16372.3 16980.0 1 (income approach)
2 Less: Consumption of fixed capital 1831.7 1982.0 2136.0 2264.4 2363.4 2368.4 2381.6 2450.6 2530.2 2627.2 2
3 Equals: Net value added 10451.8 11147.2 11937.2 12195.8 12255.8 11975.0 12533.6 13105.6 13842.1 14352.7 3 4 Compensation of employees (paid) 6748.8 7097.9 7513.7 7908.8 8090.0 7795.7 7969.5 8277.1 8614.9 8853.6 4 5 Wages and salaries 5431.2 5703.1 6068.8 6405.7 6543.6 6260.1 6385.6 6641.2 6940.5 7133.6 5 6 Employers’ social contributions 1317.6 1394.8 1444.9 1503.1 1546.4 1535.6 1583.9 1635.9 1674.4 1720.1 6 7 Taxes on production and imports less subsidies 817.6 873.6 940.5 980.0 989.4 967.8 1001.2 1042.6 1074.0 1102.3 7 8 Operating surplus, net 2885.5 3175.7 3483.0 3307.0 3176.5 3211.6 3562.8 3785.9 4153.2 4396.8 8
9 Plus: Income receipts from the rest of the world 451.4 575.8 724.2 875.7 856.9 648.9 720.0 792.6 793.8 810.4 910 Less: Income payments to the rest of the world 362.3 483.2 656.6 750.1 684.9 497.8 514.1 546.0 566.5 586.1 10
11 Equals: Net national income/Balance of primary incomes, net 10540.9 11239.8 12004.8 12321.4 12427.8 12126.1 12739.5 13352.3 14069.5 14577.1 1112 Operating surplus, net 2885.5 3175.7 3483.0 3307.0 3176.5 3211.6 3562.8 3785.9 4153.2 4396.8 1213 Compensation of employees (received) 6739.5 7086.8 7502.3 7898.3 8078.3 7787.0 7961.4 8269.0 8606.5 8844.8 1314 Wages and salaries 5421.9 5692.0 6057.4 6395.2 6531.9 6251.4 6377.5 6633.2 6932.1 7124.7 1415 Employers’ social contributions 1317.6 1394.8 1444.9 1503.1 1546.4 1535.6 1583.9 1635.9 1674.4 1720.1 1516 Taxes on production and imports, receivable 863.9 934.5 991.9 1034.6 1041.9 1026.1 1057.1 1102.6 1132.0 1162.4 1617 Subsidies paid -46.4 -60.9 -51.5 -54.6 -52.6 -58.3 -55.9 -60.1 -58.0 -60.2 1718 Property income (received) 4880.3 5624.9 6618.0 7291.8 6916.9 5815.3 5752.9 6011.3 6276.1 6425.3 1819 Interest 2828.3 3420.9 4150.9 4706.7 4234.7 3464.1 3230.4 3233.2 3179.1 3098.0 1920 Distributed income of corporations 1842.3 2164.3 2199.1 2300.9 2390.7 2072.0 2166.7 2410.7 2751.8 2935.3 2021 Dividends 809.8 1109.8 1067.3 1234.4 1255.5 989.3 1007.3 1118.0 1324.8 1424.2 2122 Withdrawals from income of quasi-corporations 1032.5 1054.5 1131.8 1066.6 1135.2 1082.6 1159.4 1292.8 1427.0 1511.1 2223 Reinvested earnings on U.S. direct investment abroad 192.5 20.4 247.8 261.4 265.6 260.9 336.6 345.7 322.7 370.2 2324 Rents on land and natural resources 17.1 19.4 20.3 22.6 25.9 18.3 19.2 21.7 22.5 21.7 2425 Less: Uses of property income (paid) 4781.9 5521.3 6539.1 7155.7 6733.1 5655.5 5538.8 5756.6 6040.3 6192.1 2526 Interest 2935.0 3556.3 4328.1 4924.0 4457.7 3661.6 3411.5 3400.4 3345.1 3267.9 2627 Distributed income of corporations 1779.9 1903.4 2121.2 2160.5 2210.1 1953.8 2045.3 2255.8 2574.9 2802.4 2728 Dividends 747.5 848.9 989.4 1093.9 1075.0 871.2 885.9 963.1 1147.9 1291.3 2829 Withdrawals from income of quasi-corporations 1032.5 1054.5 1131.8 1066.6 1135.2 1082.6 1159.4 1292.8 1427.0 1511.1 2930 Reinvested earnings on foreign direct investment 49.8 42.1 69.5 48.5 39.4 21.9 62.8 78.7 97.7 100.1 3031 Rents on land and natural resources 17.1 19.4 20.3 22.6 25.9 18.3 19.2 21.7 22.5 21.7 31
32 Net national income/Balance of primary incomes, net 10540.9 11239.8 12004.8 12321.4 12427.8 12126.1 12739.5 13352.3 14069.5 14577.1 3233 Plus: Current taxes on income, wealth, etc. (received) 1347.9 1616.5 1821.0 1923.9 1735.1 1405.8 1553.5 1766.9 1944.4 2121.1 3334 Less: Current taxes on income, wealth, etc. (paid) 1352.1 1620.9 1825.5 1933.4 1744.3 1414.4 1562.0 1779.7 1958.5 2136.0 3435 Plus: Social benefits (received) 2233.5 2364.3 2515.3 2658.3 2840.4 3070.9 3223.0 3179.9 3263.4 3482.1 3536 Less: Social contributions (paid) 2239.7 2370.9 2523.2 2666.9 2851.1 3081.9 3234.6 3192.6 3276.9 3495.6 3637 Plus: Other current transfers (received) 468.2 494.1 497.2 532.5 560.9 668.8 719.3 697.4 649.3 672.7 3738 Less: Other current transfers (paid) 554.3 597.4 585.5 639.1 676.1 782.0 840.4 819.1 763.0 782.5 38
39 Equals: Disposable income, net 10444.5 11125.6 11904.1 12196.7 12292.8 11993.2 12598.3 13205.1 13928.2 14438.8 39
40 Less: Final consumption expenditures 10129.0 10774.2 11393.8 11960.2 12382.2 12289.0 12724.4 13220.2 13632.9 14031.9 40
41 Equals: Net saving 315.6 351.4 510.2 236.5 -89.5 -295.8 -126.1 -15.1 295.4 406.8 41
Addendum:42 Gross value added (line 1) 12283.5 13129.2 14073.2 14460.1 14619.2 14343.4 14915.2 15556.3 16372.3 16980.0 4243 Plus statistical discrepancy (NIPA) -8.6 -35.5 -217.3 17.5 99.4 75.3 49.2 -38.3 -209.2 -211.9 4344 Equals: GDP (NIPA, expenditure approach) 12274.9 13093.7 13855.9 14477.6 14718.6 14418.7 14964.4 15517.9 16163.1 16768.0 44

Inte
grat
ed A
ccou
nts
Z.1, September 18, 2014 139
S.2.a Selected Aggregates for Total Economy and Sectors Billions of dollars
2004 2005 2006 2007 2008 2009 2010 2011 2012 2013
1 Gross value added 12283.5 13129.2 14073.2 14460.1 14619.2 14343.4 14915.2 15556.3 16372.3 16980.0 1 2 Households and nonprofit institutions serving households 1510.9 1599.5 1689.4 1749.6 1855.3 1913.6 1928.8 1974.4 2023.9 2094.6 2 3 Nonfinancial noncorporate business 2079.1 2218.8 2440.1 2513.9 2632.4 2466.4 2546.2 2751.6 2926.1 3055.2 3 4 Nonfinancial corporate business 6107.9 6532.1 6988.0 7203.9 7256.8 6859.8 7238.7 7592.3 8030.3 8287.0 4 5 Financial business 922.1 1034.3 1127.6 1068.8 851.9 1015.4 1042.8 1045.8 1178.3 1307.1 5 6 Federal government 525.8 552.7 577.6 605.4 637.6 668.8 704.5 720.9 722.7 711.3 6 7 State and local government 1137.7 1191.7 1250.3 1318.5 1385.2 1419.4 1454.2 1471.4 1491.0 1524.8 7
8 Net saving 315.6 351.4 510.2 236.5 -89.5 -295.8 -126.1 -15.1 295.4 406.8 8 9 Households and nonprofit institutions serving households 410.0 237.9 329.5 310.3 542.2 672.0 628.0 711.1 896.2 608.1 910 Nonfinancial corporate business 312.7 411.7 386.5 313.1 296.7 381.0 603.5 584.2 563.7 571.3 1011 Financial business 100.5 73.1 60.7 -48.5 -129.4 171.9 208.4 149.7 147.2 101.7 1112 Federal government -399.2 -304.7 -227.0 -265.6 -634.0 -1248.8 -1328.7 -1244.1 -1079.1 -649.1 1213 State and local government -108.4 -66.6 -39.4 -72.7 -165.1 -271.9 -237.3 -215.9 -232.6 -225.1 13
Net capital transfers14 Households and nonprofit institutions serving households 1.4 -21.9 16.6 6.8 7.7 -28.4 -20.6 2.0 -5.0 19.7 1415 Nonfinancial noncorporate business -5.0 -13.1 0.0 0.0 -3.3 -6.0 -7.8 -1.6 -4.9 -0.0 1516 Nonfinancial corporate business -6.7 -15.5 -0.0 -0.0 -3.7 38.3 20.9 -6.4 -16.7 -5.7 1617 Financial business 16.2 27.7 0.0 0.0 -60.5 -121.9 -41.5 -32.4 9.6 0.0 1718 Federal government 39.3 60.3 43.2 53.0 117.6 186.3 126.3 113.9 84.7 58.4 1819 State and local government -48.0 -50.4 -57.8 -59.3 -63.2 -67.7 -76.7 -73.8 -74.2 -71.6 1920 Rest of the world 2.8 12.8 -2.0 -0.4 5.4 -0.6 -0.7 -1.6 6.5 -0.8 20
21 Gross fixed capital formation 2701.3 2981.2 3166.0 3201.5 3091.4 2672.7 2691.1 2836.0 3033.7 3170.2 2122 Households and nonprofit institutions serving households 765.9 865.0 860.1 736.1 580.4 468.1 452.4 451.9 502.9 569.4 2223 Nonfinancial noncorporate business 260.3 289.2 305.0 313.5 307.5 248.8 243.1 274.8 300.7 320.6 2324 Nonfinancial corporate business 1010.1 1133.4 1259.9 1348.2 1372.7 1141.9 1181.0 1303.9 1420.5 1482.5 2425 Financial business (nonresidential) 176.5 180.0 188.7 211.5 196.2 166.9 162.8 167.5 190.2 201.5 2526 Federal government 211.0 222.9 238.0 251.4 275.8 284.0 300.0 297.4 287.8 268.5 2627 State and local government 277.5 290.8 314.3 340.8 358.8 363.0 351.9 340.5 331.6 327.8 27
28 Consumption of fixed capital 1831.7 1982.0 2136.0 2264.4 2363.4 2368.4 2381.6 2450.6 2530.2 2627.2 2829 Households and nonprofit institutions serving households 323.4 362.1 396.2 413.7 414.6 403.3 400.5 398.2 404.5 427.1 2930 Nonfinancial noncorporate business 196.4 214.4 232.6 245.6 254.5 253.0 251.8 265.0 271.7 281.7 3031 Nonfinancial corporate business 850.2 909.9 979.4 1040.3 1093.9 1092.0 1094.6 1139.2 1183.8 1229.8 3132 Financial business (nonresidential) 139.3 148.9 156.8 165.4 173.9 177.4 176.7 168.6 174.1 182.2 3233 Federal government 178.6 189.4 200.7 212.8 226.3 234.5 245.3 257.4 264.1 268.0 3334 State and local government 143.8 157.3 170.3 186.6 200.2 208.2 212.7 222.2 231.8 238.4 34
35 Change in inventories 63.9 59.6 67.0 34.5 -32.0 -147.6 61.5 41.8 64.9 74.1 3536 Nonfinancial noncorporate business 13.5 7.1 5.3 3.3 -2.3 -16.8 3.6 6.8 3.0 17.4 3637 Nonfinancial corporate business 50.3 52.5 61.7 31.2 -29.7 -130.8 57.9 34.9 61.8 56.7 37
38 Net lending (+) or net borrowing (-) (capital account) -615.1 -694.5 -588.8 -735.0 -780.1 -453.2 -497.8 -443.8 -266.5 -211.1 3839 Households and nonprofit institutions serving households -25.2 -234.0 -140.8 -7.7 379.7 645.2 605.2 663.3 810.5 454.0 3940 Nonfinancial noncorporate business -72.4 -68.8 -77.7 -71.1 -47.5 27.0 12.8 -15.1 -27.1 -56.2 4041 Nonfinancial corporate business 111.0 150.2 30.7 -26.4 33.8 417.2 439.3 391.4 280.9 266.2 4142 Financial business 47.1 14.3 28.8 -94.6 -91.2 304.4 263.8 183.3 121.5 82.5 4243 Federal government -470.1 -396.6 -293.2 -353.9 -780.6 -1475.7 -1508.7 -1397.1 -1185.6 -705.6 4344 State and local government -205.4 -159.7 -136.6 -181.2 -274.3 -371.4 -310.3 -269.6 -266.9 -252.0 44 Addendum:45 Statistical discrepancy (NIPA) -8.6 -35.5 -217.3 17.5 99.4 75.3 49.2 -38.3 -209.2 -211.9 4546 Rest of the world 623.7 730.0 806.1 717.5 680.7 377.8 448.6 482.1 475.7 423.0 46
47 Net lending (+) or net borrowing (-) (financial account) -442.1 -430.0 -626.3 -354.2 -1175.1 -514.2 -678.3 -928.6 -863.8 -290.3 4748 Households and nonprofit institutions serving households 131.1 -298.7 -367.2 238.5 1076.7 595.8 893.1 1122.0 905.1 747.7 4849 Nonfinancial noncorporate business -56.9 -51.4 -61.0 -53.8 -33.4 48.7 33.5 -11.0 -22.9 -51.9 4950 Nonfinancial corporate business 165.0 -20.9 -139.0 -208.2 -947.7 548.5 145.2 -400.9 -509.7 -212.2 5051 Financial business -46.7 341.3 255.5 119.7 -160.3 29.5 -26.5 28.8 117.3 162.2 5152 Federal government -474.1 -422.8 -310.4 -390.6 -789.0 -1298.2 -1414.9 -1352.4 -1119.3 -663.3 5253 State and local government -160.4 22.6 -4.3 -59.8 -321.4 -438.5 -308.6 -315.2 -234.4 -272.8 53 Addendum:54 Rest of the world 452.1 698.5 529.8 151.5 765.2 28.0 268.2 416.7 446.6 350.8 54
Total other volume changes55 Households and nonprofit institutions serving households 1438.9 267.7 493.6 596.0 811.2 578.4 1194.4 452.8 517.5 723.6 5556 Nonfinancial noncorporate business 65.8 -78.7 -1.6 -51.9 -319.1 -100.6 174.1 -51.1 -13.8 -38.5 5657 Nonfinancial corporate business 267.2 288.5 576.9 685.6 -740.1 173.6 383.7 -56.1 -203.2 269.7 5758 Financial business -418.3 36.4 -419.1 -71.4 1232.3 -1062.6 -864.2 -119.7 -430.2 -1003.7 5859 Federal government -28.2 -47.0 30.2 9.7 86.7 121.5 -32.0 46.4 39.2 26.9 5960 State and local government -697.2 215.7 324.2 231.5 -974.6 358.9 36.5 -45.3 359.0 676.8 6061 Rest of the world -179.0 -34.9 -145.3 -537.5 75.3 -335.3 -181.8 -69.6 -34.8 -66.4 61
Holding gains/losses62 Households and nonprofit institutions serving households 5085.3 5378.2 3700.3 -490.1 -11622.2 463.8 2371.7 52.5 4406.7 8032.5 6263 Nonfinancial noncorporate business 1162.9 1191.2 439.9 145.0 -1137.0 -1155.7 455.0 533.2 671.5 1009.6 6364 Nonfinancial corporate business 56.6 87.3 -1389.4 -247.1 4187.9 -5022.7 -1374.4 384.1 -1388.4 -3761.2 6465 Financial business 80.7 104.8 2.8 1313.2 472.0 439.9 122.0 230.8 -22.2 -71.5 6566 Federal government 115.7 115.3 116.8 93.3 1.2 -157.9 18.5 36.4 37.0 59.0 6667 State and local government 516.3 478.9 621.8 466.0 350.4 -71.7 197.3 394.7 246.1 264.2 6768 Rest of the world -363.6 -708.1 -565.2 -761.7 1154.7 -900.5 -192.9 876.2 -288.5 294.6 68
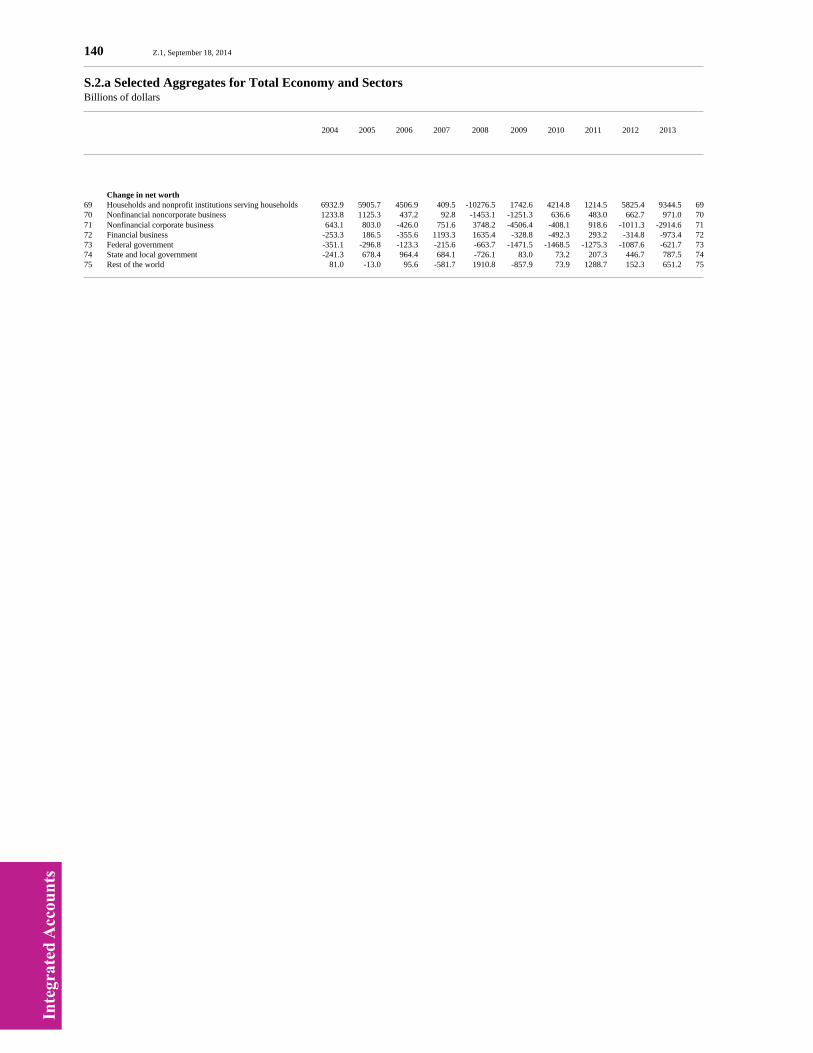
Inte
grat
ed A
ccou
nts
140 Z.1, September 18, 2014
S.2.a Selected Aggregates for Total Economy and Sectors Billions of dollars
2004 2005 2006 2007 2008 2009 2010 2011 2012 2013
Change in net worth69 Households and nonprofit institutions serving households 6932.9 5905.7 4506.9 409.5 -10276.5 1742.6 4214.8 1214.5 5825.4 9344.5 6970 Nonfinancial noncorporate business 1233.8 1125.3 437.2 92.8 -1453.1 -1251.3 636.6 483.0 662.7 971.0 7071 Nonfinancial corporate business 643.1 803.0 -426.0 751.6 3748.2 -4506.4 -408.1 918.6 -1011.3 -2914.6 7172 Financial business -253.3 186.5 -355.6 1193.3 1635.4 -328.8 -492.3 293.2 -314.8 -973.4 7273 Federal government -351.1 -296.8 -123.3 -215.6 -663.7 -1471.5 -1468.5 -1275.3 -1087.6 -621.7 7374 State and local government -241.3 678.4 964.4 684.1 -726.1 83.0 73.2 207.3 446.7 787.5 7475 Rest of the world 81.0 -13.0 95.6 -581.7 1910.8 -857.9 73.9 1288.7 152.3 651.2 75
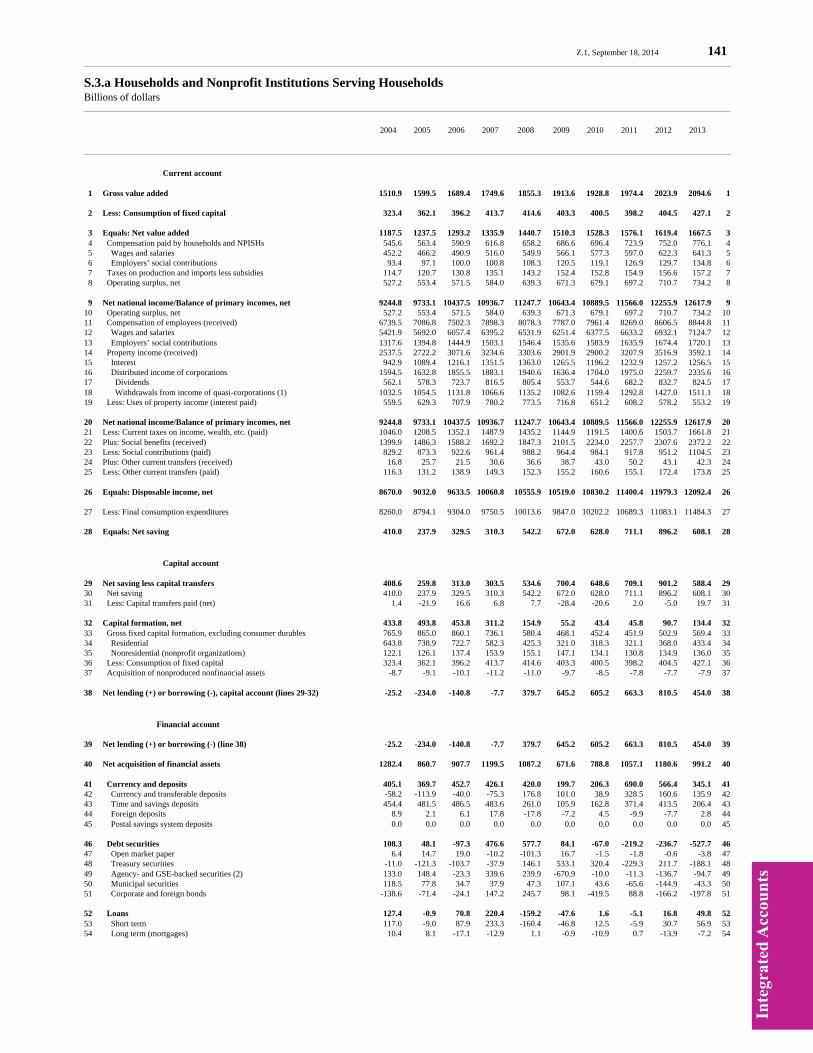
Inte
grat
ed A
ccou
nts
Z.1, September 18, 2014 141
S.3.a Households and Nonprofit Institutions Serving HouseholdsBillions of dollars
2004 2005 2006 2007 2008 2009 2010 2011 2012 2013
Current account
1 Gross value added 1510.9 1599.5 1689.4 1749.6 1855.3 1913.6 1928.8 1974.4 2023.9 2094.6 1
2 Less: Consumption of fixed capital 323.4 362.1 396.2 413.7 414.6 403.3 400.5 398.2 404.5 427.1 2
3 Equals: Net value added 1187.5 1237.5 1293.2 1335.9 1440.7 1510.3 1528.3 1576.1 1619.4 1667.5 3 4 Compensation paid by households and NPISHs 545.6 563.4 590.9 616.8 658.2 686.6 696.4 723.9 752.0 776.1 4 5 Wages and salaries 452.2 466.2 490.9 516.0 549.9 566.1 577.3 597.0 622.3 641.3 5 6 Employers’ social contributions 93.4 97.1 100.0 100.8 108.3 120.5 119.1 126.9 129.7 134.8 6 7 Taxes on production and imports less subsidies 114.7 120.7 130.8 135.1 143.2 152.4 152.8 154.9 156.6 157.2 7 8 Operating surplus, net 527.2 553.4 571.5 584.0 639.3 671.3 679.1 697.2 710.7 734.2 8
9 Net national income/Balance of primary incomes, net 9244.8 9733.1 10437.5 10936.7 11247.7 10643.4 10889.5 11566.0 12255.9 12617.9 910 Operating surplus, net 527.2 553.4 571.5 584.0 639.3 671.3 679.1 697.2 710.7 734.2 1011 Compensation of employees (received) 6739.5 7086.8 7502.3 7898.3 8078.3 7787.0 7961.4 8269.0 8606.5 8844.8 1112 Wages and salaries 5421.9 5692.0 6057.4 6395.2 6531.9 6251.4 6377.5 6633.2 6932.1 7124.7 1213 Employers’ social contributions 1317.6 1394.8 1444.9 1503.1 1546.4 1535.6 1583.9 1635.9 1674.4 1720.1 1314 Property income (received) 2537.5 2722.2 3071.6 3234.6 3303.6 2901.9 2900.2 3207.9 3516.9 3592.1 1415 Interest 942.9 1089.4 1216.1 1351.5 1363.0 1265.5 1196.2 1232.9 1257.2 1256.5 1516 Distributed income of corporations 1594.5 1632.8 1855.5 1883.1 1940.6 1636.4 1704.0 1975.0 2259.7 2335.6 1617 Dividends 562.1 578.3 723.7 816.5 805.4 553.7 544.6 682.2 832.7 824.5 1718 Withdrawals from income of quasi-corporations (1) 1032.5 1054.5 1131.8 1066.6 1135.2 1082.6 1159.4 1292.8 1427.0 1511.1 1819 Less: Uses of property income (interest paid) 559.5 629.3 707.9 780.2 773.5 716.8 651.2 608.2 578.2 553.2 19
20 Net national income/Balance of primary incomes, net 9244.8 9733.1 10437.5 10936.7 11247.7 10643.4 10889.5 11566.0 12255.9 12617.9 2021 Less: Current taxes on income, wealth, etc. (paid) 1046.0 1208.5 1352.1 1487.9 1435.2 1144.9 1191.5 1400.6 1503.7 1661.8 2122 Plus: Social benefits (received) 1399.9 1486.3 1588.2 1692.2 1847.3 2101.5 2234.0 2257.7 2307.6 2372.2 2223 Less: Social contributions (paid) 829.2 873.3 922.6 961.4 988.2 964.4 984.1 917.8 951.2 1104.5 2324 Plus: Other current transfers (received) 16.8 25.7 21.5 30.6 36.6 38.7 43.0 50.2 43.1 42.3 2425 Less: Other current transfers (paid) 116.3 131.2 138.9 149.3 152.3 155.2 160.6 155.1 172.4 173.8 25
26 Equals: Disposable income, net 8670.0 9032.0 9633.5 10060.8 10555.9 10519.0 10830.2 11400.4 11979.3 12092.4 26
27 Less: Final consumption expenditures 8260.0 8794.1 9304.0 9750.5 10013.6 9847.0 10202.2 10689.3 11083.1 11484.3 27
28 Equals: Net saving 410.0 237.9 329.5 310.3 542.2 672.0 628.0 711.1 896.2 608.1 28
Capital account
29 Net saving less capital transfers 408.6 259.8 313.0 303.5 534.6 700.4 648.6 709.1 901.2 588.4 2930 Net saving 410.0 237.9 329.5 310.3 542.2 672.0 628.0 711.1 896.2 608.1 3031 Less: Capital transfers paid (net) 1.4 -21.9 16.6 6.8 7.7 -28.4 -20.6 2.0 -5.0 19.7 31
32 Capital formation, net 433.8 493.8 453.8 311.2 154.9 55.2 43.4 45.8 90.7 134.4 3233 Gross fixed capital formation, excluding consumer durables 765.9 865.0 860.1 736.1 580.4 468.1 452.4 451.9 502.9 569.4 3334 Residential 643.8 738.9 722.7 582.3 425.3 321.0 318.3 321.1 368.0 433.4 3435 Nonresidential (nonprofit organizations) 122.1 126.1 137.4 153.9 155.1 147.1 134.1 130.8 134.9 136.0 3536 Less: Consumption of fixed capital 323.4 362.1 396.2 413.7 414.6 403.3 400.5 398.2 404.5 427.1 3637 Acquisition of nonproduced nonfinancial assets -8.7 -9.1 -10.1 -11.2 -11.0 -9.7 -8.5 -7.8 -7.7 -7.9 37
38 Net lending (+) or borrowing (-), capital account (lines 29-32) -25.2 -234.0 -140.8 -7.7 379.7 645.2 605.2 663.3 810.5 454.0 38
Financial account
39 Net lending (+) or borrowing (-) (line 38) -25.2 -234.0 -140.8 -7.7 379.7 645.2 605.2 663.3 810.5 454.0 39
40 Net acquisition of financial assets 1282.4 860.7 907.7 1199.5 1087.2 671.6 788.8 1057.1 1180.6 991.2 40
41 Currency and deposits 405.1 369.7 452.7 426.1 420.0 199.7 206.3 690.0 566.4 345.1 4142 Currency and transferable deposits -58.2 -113.9 -40.0 -75.3 176.8 101.0 38.9 328.5 160.6 135.9 4243 Time and savings deposits 454.4 481.5 486.5 483.6 261.0 105.9 162.8 371.4 413.5 206.4 4344 Foreign deposits 8.9 2.1 6.1 17.8 -17.8 -7.2 4.5 -9.9 -7.7 2.8 4445 Postal savings system deposits 0.0 0.0 0.0 0.0 0.0 0.0 0.0 0.0 0.0 0.0 45
46 Debt securities 108.3 48.1 -97.3 476.6 577.7 84.1 -67.0 -219.2 -236.7 -527.7 4647 Open market paper 6.4 14.7 19.0 -10.2 -101.3 16.7 -1.5 -1.8 -0.6 -3.8 4748 Treasury securities -11.0 -121.3 -103.7 -37.9 146.1 533.1 320.4 -229.3 211.7 -188.1 4849 Agency- and GSE-backed securities (2) 133.0 148.4 -23.3 339.6 239.9 -670.9 -10.0 -11.3 -136.7 -94.7 4950 Municipal securities 118.5 77.8 34.7 37.9 47.3 107.1 43.6 -65.6 -144.9 -43.3 5051 Corporate and foreign bonds -138.6 -71.4 -24.1 147.2 245.7 98.1 -419.5 88.8 -166.2 -197.8 51
52 Loans 127.4 -0.9 70.8 220.4 -159.2 -47.6 1.6 -5.1 16.8 49.8 5253 Short term 117.0 -9.0 87.9 233.3 -160.4 -46.8 12.5 -5.9 30.7 56.9 5354 Long term (mortgages) 10.4 8.1 -17.1 -12.9 1.1 -0.9 -10.9 0.7 -13.9 -7.2 54
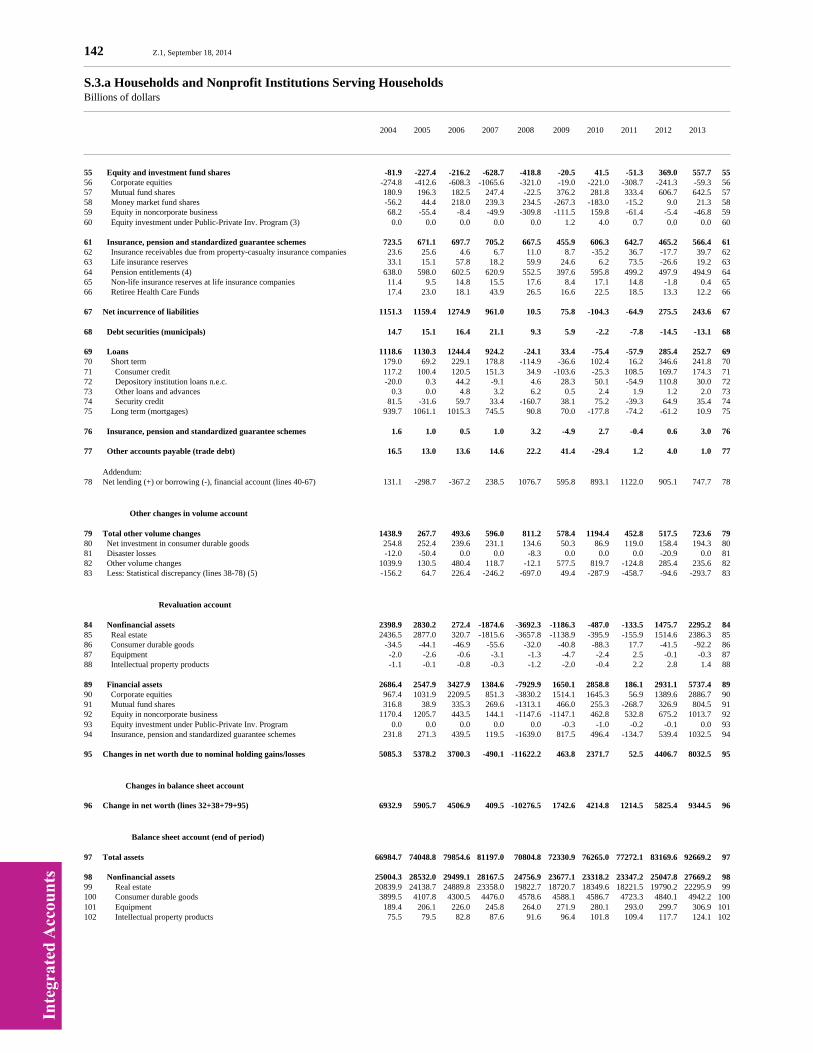
Inte
grat
ed A
ccou
nts
142 Z.1, September 18, 2014
S.3.a Households and Nonprofit Institutions Serving HouseholdsBillions of dollars
2004 2005 2006 2007 2008 2009 2010 2011 2012 2013
55 Equity and investment fund shares -81.9 -227.4 -216.2 -628.7 -418.8 -20.5 41.5 -51.3 369.0 557.7 5556 Corporate equities -274.8 -412.6 -608.3 -1065.6 -321.0 -19.0 -221.0 -308.7 -241.3 -59.3 5657 Mutual fund shares 180.9 196.3 182.5 247.4 -22.5 376.2 281.8 333.4 606.7 642.5 5758 Money market fund shares -56.2 44.4 218.0 239.3 234.5 -267.3 -183.0 -15.2 9.0 21.3 5859 Equity in noncorporate business 68.2 -55.4 -8.4 -49.9 -309.8 -111.5 159.8 -61.4 -5.4 -46.8 5960 Equity investment under Public-Private Inv. Program (3) 0.0 0.0 0.0 0.0 0.0 1.2 4.0 0.7 0.0 0.0 60
61 Insurance, pension and standardized guarantee schemes 723.5 671.1 697.7 705.2 667.5 455.9 606.3 642.7 465.2 566.4 6162 Insurance receivables due from property-casualty insurance companies 23.6 25.6 4.6 6.7 11.0 8.7 -35.2 36.7 -17.7 39.7 6263 Life insurance reserves 33.1 15.1 57.8 18.2 59.9 24.6 6.2 73.5 -26.6 19.2 6364 Pension entitlements (4) 638.0 598.0 602.5 620.9 552.5 397.6 595.8 499.2 497.9 494.9 6465 Non-life insurance reserves at life insurance companies 11.4 9.5 14.8 15.5 17.6 8.4 17.1 14.8 -1.8 0.4 6566 Retiree Health Care Funds 17.4 23.0 18.1 43.9 26.5 16.6 22.5 18.5 13.3 12.2 66
67 Net incurrence of liabilities 1151.3 1159.4 1274.9 961.0 10.5 75.8 -104.3 -64.9 275.5 243.6 67
68 Debt securities (municipals) 14.7 15.1 16.4 21.1 9.3 5.9 -2.2 -7.8 -14.5 -13.1 68
69 Loans 1118.6 1130.3 1244.4 924.2 -24.1 33.4 -75.4 -57.9 285.4 252.7 6970 Short term 179.0 69.2 229.1 178.8 -114.9 -36.6 102.4 16.2 346.6 241.8 7071 Consumer credit 117.2 100.4 120.5 151.3 34.9 -103.6 -25.3 108.5 169.7 174.3 7172 Depository institution loans n.e.c. -20.0 0.3 44.2 -9.1 4.6 28.3 50.1 -54.9 110.8 30.0 7273 Other loans and advances 0.3 0.0 4.8 3.2 6.2 0.5 2.4 1.9 1.2 2.0 7374 Security credit 81.5 -31.6 59.7 33.4 -160.7 38.1 75.2 -39.3 64.9 35.4 7475 Long term (mortgages) 939.7 1061.1 1015.3 745.5 90.8 70.0 -177.8 -74.2 -61.2 10.9 75
76 Insurance, pension and standardized guarantee schemes 1.6 1.0 0.5 1.0 3.2 -4.9 2.7 -0.4 0.6 3.0 76
77 Other accounts payable (trade debt) 16.5 13.0 13.6 14.6 22.2 41.4 -29.4 1.2 4.0 1.0 77
Addendum:78 Net lending (+) or borrowing (-), financial account (lines 40-67) 131.1 -298.7 -367.2 238.5 1076.7 595.8 893.1 1122.0 905.1 747.7 78
Other changes in volume account
79 Total other volume changes 1438.9 267.7 493.6 596.0 811.2 578.4 1194.4 452.8 517.5 723.6 7980 Net investment in consumer durable goods 254.8 252.4 239.6 231.1 134.6 50.3 86.9 119.0 158.4 194.3 8081 Disaster losses -12.0 -50.4 0.0 0.0 -8.3 0.0 0.0 0.0 -20.9 0.0 8182 Other volume changes 1039.9 130.5 480.4 118.7 -12.1 577.5 819.7 -124.8 285.4 235.6 8283 Less: Statistical discrepancy (lines 38-78) (5) -156.2 64.7 226.4 -246.2 -697.0 49.4 -287.9 -458.7 -94.6 -293.7 83
Revaluation account
84 Nonfinancial assets 2398.9 2830.2 272.4 -1874.6 -3692.3 -1186.3 -487.0 -133.5 1475.7 2295.2 8485 Real estate 2436.5 2877.0 320.7 -1815.6 -3657.8 -1138.9 -395.9 -155.9 1514.6 2386.3 8586 Consumer durable goods -34.5 -44.1 -46.9 -55.6 -32.0 -40.8 -88.3 17.7 -41.5 -92.2 8687 Equipment -2.0 -2.6 -0.6 -3.1 -1.3 -4.7 -2.4 2.5 -0.1 -0.3 8788 Intellectual property products -1.1 -0.1 -0.8 -0.3 -1.2 -2.0 -0.4 2.2 2.8 1.4 88
89 Financial assets 2686.4 2547.9 3427.9 1384.6 -7929.9 1650.1 2858.8 186.1 2931.1 5737.4 8990 Corporate equities 967.4 1031.9 2209.5 851.3 -3830.2 1514.1 1645.3 56.9 1389.6 2886.7 9091 Mutual fund shares 316.8 38.9 335.3 269.6 -1313.1 466.0 255.3 -268.7 326.9 804.5 9192 Equity in noncorporate business 1170.4 1205.7 443.5 144.1 -1147.6 -1147.1 462.8 532.8 675.2 1013.7 9293 Equity investment under Public-Private Inv. Program 0.0 0.0 0.0 0.0 0.0 -0.3 -1.0 -0.2 -0.1 0.0 9394 Insurance, pension and standardized guarantee schemes 231.8 271.3 439.5 119.5 -1639.0 817.5 496.4 -134.7 539.4 1032.5 94
95 Changes in net worth due to nominal holding gains/losses 5085.3 5378.2 3700.3 -490.1 -11622.2 463.8 2371.7 52.5 4406.7 8032.5 95
Changes in balance sheet account
96 Change in net worth (lines 32+38+79+95) 6932.9 5905.7 4506.9 409.5 -10276.5 1742.6 4214.8 1214.5 5825.4 9344.5 96
Balance sheet account (end of period)
97 Total assets 66984.7 74048.8 79854.6 81197.0 70804.8 72330.9 76265.0 77272.1 83169.6 92669.2 97
98 Nonfinancial assets 25004.3 28532.0 29499.1 28167.5 24756.9 23677.1 23318.2 23347.2 25047.8 27669.2 9899 Real estate 20839.9 24138.7 24889.8 23358.0 19822.7 18720.7 18349.6 18221.5 19790.2 22295.9 99100 Consumer durable goods 3899.5 4107.8 4300.5 4476.0 4578.6 4588.1 4586.7 4723.3 4840.1 4942.2 100101 Equipment 189.4 206.1 226.0 245.8 264.0 271.9 280.1 293.0 299.7 306.9 101102 Intellectual property products 75.5 79.5 82.8 87.6 91.6 96.4 101.8 109.4 117.7 124.1 102

Inte
grat
ed A
ccou
nts
Z.1, September 18, 2014 143
S.3.a Households and Nonprofit Institutions Serving HouseholdsBillions of dollars
2004 2005 2006 2007 2008 2009 2010 2011 2012 2013
103 Financial assets 41980.4 45516.7 50355.5 53029.5 46047.9 48653.8 52946.9 53925.0 58121.8 65000.1 103
104 Currency and deposits 4944.8 5314.8 5793.7 6214.7 6599.7 6784.8 6941.8 7631.7 8139.5 8485.3 104105 Currency and transferable deposits 399.8 285.9 239.7 153.3 295.2 396.1 423.7 752.2 899.1 1035.0 105106 Foreign deposits 61.8 63.8 69.9 87.7 69.9 62.7 67.3 57.4 49.7 52.5 106107 Time and savings deposits 4483.2 4965.0 5484.1 5973.6 6234.6 6326.0 6450.8 6822.2 7190.7 7397.8 107108 Postal savings system deposits 0.0 0.0 0.0 0.0 0.0 0.0 0.0 0.0 0.0 0.0 108
109 Debt securities 3137.2 3303.4 3248.3 3771.9 4220.4 4601.1 4707.6 4175.4 3995.6 3684.0 109110 Open market paper 83.7 98.4 117.5 107.3 6.0 22.7 21.1 19.4 18.8 15.0 110111 Treasury securities 472.7 425.7 325.8 202.9 184.1 854.0 1126.6 707.0 929.3 949.0 111112 Agency- and GSE-backed securities (2) 443.6 587.4 613.4 873.9 1056.6 357.4 335.4 300.2 152.7 97.7 112113 Municipal securities 1522.9 1600.6 1635.7 1673.5 1720.8 1827.9 1871.5 1805.9 1661.0 1617.7 113114 Corporate and foreign bonds 614.3 591.4 556.0 914.2 1253.0 1539.2 1353.1 1343.0 1233.9 1004.6 114
115 Loans 773.8 772.9 912.5 1132.9 973.6 928.3 929.9 924.7 930.5 980.3 115116 Short term 641.1 632.1 788.9 1022.1 861.8 817.4 829.8 824.0 843.6 900.5 116117 Long term (mortgages) 132.6 140.8 123.6 110.7 111.8 110.9 100.1 100.8 86.9 79.8 117
118 Equity and investment fund shares 18943.3 20968.1 24221.0 24858.9 18151.5 18975.2 21394.3 21675.0 24544.0 29811.0 118119 Corporate equities 7406.1 8025.4 10126.0 9911.7 5760.5 7255.5 8679.9 8475.6 9623.9 12451.3 119120 Mutual fund shares 3291.8 3527.1 4080.3 4597.4 3261.8 4104.0 4641.1 4661.8 5705.4 7152.4 120121 Money market fund shares 898.3 942.7 1106.6 1345.9 1580.5 1313.1 1130.1 1114.9 1123.9 1145.2 121122 Equity in noncorporate business 7347.1 8473.0 8908.1 9003.8 7548.8 6301.6 6939.4 7418.3 8086.4 9057.7 122123 Equity investment under Public-Private Inv. Program (3) 0.0 0.0 0.0 0.0 0.0 0.9 3.8 4.4 4.4 4.4 123
124 Insurance, pension and standardized guarantee schemes 14181.2 15157.5 16180.0 17051.2 16102.7 17364.4 18973.3 19518.2 20512.2 22039.5 124125 Insurance receivables due from property-casualty insurance companies 290.4 316.0 320.5 327.3 337.3 346.0 310.8 347.5 329.8 369.5 125126 Life insurance reserves 1060.4 1082.6 1055.2 1076.8 1049.8 1109.2 1137.2 1199.0 1186.1 1232.8 126127 Pension entitlements (4) 12567.1 13466.3 14478.7 15262.2 14286.6 15455.1 17031.7 17444.7 18457.8 19886.1 127128 Non-life insurance reserves at life insurance companies 211.0 217.3 232.1 247.6 265.2 273.6 290.7 305.5 303.7 304.2 128129 Retiree Health Care Funds 52.4 75.4 93.5 137.3 163.8 180.4 202.9 221.4 234.8 246.9 129
130 Total liabilities and net worth 66984.7 74048.8 79854.6 81197.0 70804.8 72330.9 76265.0 77272.1 83169.6 92669.2 130
131 Liabilities 11004.1 12162.4 13461.4 14394.3 14278.6 14062.1 13781.5 13574.0 13646.1 13801.2 131
132 Debt securities (municipals) 197.6 212.7 229.1 250.2 259.5 265.4 263.2 255.5 241.0 227.8 132
133 Loans 10610.8 11741.1 13009.5 13905.7 13755.4 13496.4 13244.7 13044.3 13126.2 13290.5 133134 Short term 2586.3 2655.5 2908.7 3090.1 2975.1 2873.6 3122.8 3144.4 3429.3 3671.1 134135 Consumer credit 2220.1 2320.6 2461.9 2615.7 2650.6 2552.8 2647.4 2755.9 2923.6 3097.9 135136 Depository institution loans n.e.c. -16.8 -16.5 30.9 21.8 26.4 -15.9 61.0 11.5 62.6 92.7 136137 Other loans and advances 119.0 119.0 123.8 127.0 133.2 133.7 136.1 138.1 139.3 141.3 137138 Security credit 264.0 232.4 292.1 325.5 164.8 203.0 278.2 238.9 303.7 339.2 138139 Long term (mortgages) 8024.5 9085.5 10100.8 10815.7 10780.3 10622.8 10121.9 9899.9 9696.9 9619.4 139
140 Insurance, pension and standardized guarantee schemes 22.5 22.4 22.8 23.9 27.0 22.1 24.7 24.3 24.9 27.9 140
141 Other accounts payable (trade debt) 173.3 186.3 199.9 214.5 236.7 278.2 248.8 250.0 254.0 255.0 141
142 Net worth 55980.6 61886.4 66393.3 66802.7 56526.2 58268.8 62483.6 63698.1 69523.5 78868.0 142
(1) Consists of rental income of tenant-occupied housing and proprietors’ income. Quasi-corporations are unincorporated enterprises that function as if they were corporations;they primarily cover their operating costs through sales, and they keep a complete set of financial records.(2) Government-sponsored enterprises (GSEs) consist of Federal Home Loan Banks, Fannie Mae, Freddie Mac, Federal Agricultural Mortgage Corporation, Farm Credit System,the Financing Corporation, and the Resolution Funding Corporation, and they included the Student Loan Marketing Association until it was fully privatized in the fourth quarter of 2004.(3) Funds invested by financial institutions such as domestic hedge funds through the Public-Private Investment Program (PPIP).(4) Includes variable annuities, including those in IRAs, at life insurance companies.(5) The statistical discrepancy is the difference between net lending or net borrowing derived in the capital account and the same concept derived in the financial account. The discrepancyreflects differences in source data, timing of recorded flows, and other statistical differences between the capital and financial accounts.NPISHs Nonprofit institutions serving householdsn.e.c. Not elsewhere classified
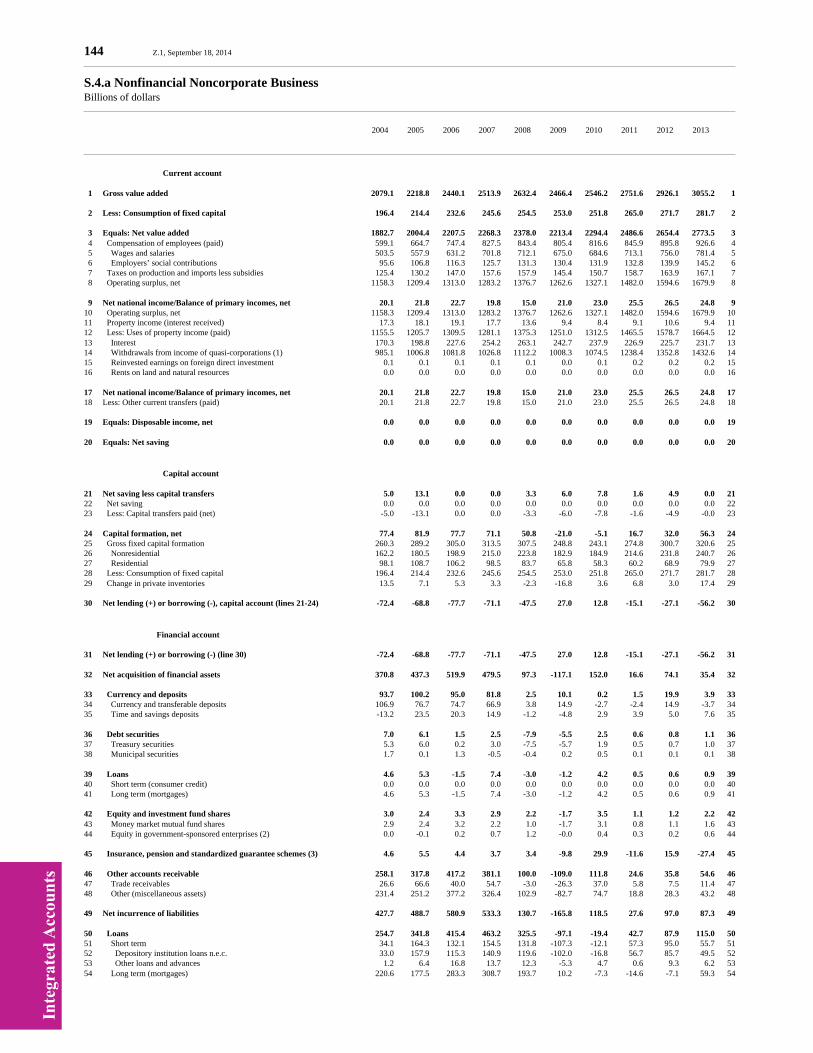
Inte
grat
ed A
ccou
nts
144 Z.1, September 18, 2014
S.4.a Nonfinancial Noncorporate BusinessBillions of dollars
2004 2005 2006 2007 2008 2009 2010 2011 2012 2013
Current account
1 Gross value added 2079.1 2218.8 2440.1 2513.9 2632.4 2466.4 2546.2 2751.6 2926.1 3055.2 1
2 Less: Consumption of fixed capital 196.4 214.4 232.6 245.6 254.5 253.0 251.8 265.0 271.7 281.7 2
3 Equals: Net value added 1882.7 2004.4 2207.5 2268.3 2378.0 2213.4 2294.4 2486.6 2654.4 2773.5 3 4 Compensation of employees (paid) 599.1 664.7 747.4 827.5 843.4 805.4 816.6 845.9 895.8 926.6 4 5 Wages and salaries 503.5 557.9 631.2 701.8 712.1 675.0 684.6 713.1 756.0 781.4 5 6 Employers’ social contributions 95.6 106.8 116.3 125.7 131.3 130.4 131.9 132.8 139.9 145.2 6 7 Taxes on production and imports less subsidies 125.4 130.2 147.0 157.6 157.9 145.4 150.7 158.7 163.9 167.1 7 8 Operating surplus, net 1158.3 1209.4 1313.0 1283.2 1376.7 1262.6 1327.1 1482.0 1594.6 1679.9 8
9 Net national income/Balance of primary incomes, net 20.1 21.8 22.7 19.8 15.0 21.0 23.0 25.5 26.5 24.8 910 Operating surplus, net 1158.3 1209.4 1313.0 1283.2 1376.7 1262.6 1327.1 1482.0 1594.6 1679.9 1011 Property income (interest received) 17.3 18.1 19.1 17.7 13.6 9.4 8.4 9.1 10.6 9.4 1112 Less: Uses of property income (paid) 1155.5 1205.7 1309.5 1281.1 1375.3 1251.0 1312.5 1465.5 1578.7 1664.5 1213 Interest 170.3 198.8 227.6 254.2 263.1 242.7 237.9 226.9 225.7 231.7 1314 Withdrawals from income of quasi-corporations (1) 985.1 1006.8 1081.8 1026.8 1112.2 1008.3 1074.5 1238.4 1352.8 1432.6 1415 Reinvested earnings on foreign direct investment 0.1 0.1 0.1 0.1 0.1 0.0 0.1 0.2 0.2 0.2 1516 Rents on land and natural resources 0.0 0.0 0.0 0.0 0.0 0.0 0.0 0.0 0.0 0.0 16
17 Net national income/Balance of primary incomes, net 20.1 21.8 22.7 19.8 15.0 21.0 23.0 25.5 26.5 24.8 1718 Less: Other current transfers (paid) 20.1 21.8 22.7 19.8 15.0 21.0 23.0 25.5 26.5 24.8 18
19 Equals: Disposable income, net 0.0 0.0 0.0 0.0 0.0 0.0 0.0 0.0 0.0 0.0 19
20 Equals: Net saving 0.0 0.0 0.0 0.0 0.0 0.0 0.0 0.0 0.0 0.0 20
Capital account
21 Net saving less capital transfers 5.0 13.1 0.0 0.0 3.3 6.0 7.8 1.6 4.9 0.0 2122 Net saving 0.0 0.0 0.0 0.0 0.0 0.0 0.0 0.0 0.0 0.0 2223 Less: Capital transfers paid (net) -5.0 -13.1 0.0 0.0 -3.3 -6.0 -7.8 -1.6 -4.9 -0.0 23
24 Capital formation, net 77.4 81.9 77.7 71.1 50.8 -21.0 -5.1 16.7 32.0 56.3 2425 Gross fixed capital formation 260.3 289.2 305.0 313.5 307.5 248.8 243.1 274.8 300.7 320.6 2526 Nonresidential 162.2 180.5 198.9 215.0 223.8 182.9 184.9 214.6 231.8 240.7 2627 Residential 98.1 108.7 106.2 98.5 83.7 65.8 58.3 60.2 68.9 79.9 2728 Less: Consumption of fixed capital 196.4 214.4 232.6 245.6 254.5 253.0 251.8 265.0 271.7 281.7 2829 Change in private inventories 13.5 7.1 5.3 3.3 -2.3 -16.8 3.6 6.8 3.0 17.4 29
30 Net lending (+) or borrowing (-), capital account (lines 21-24) -72.4 -68.8 -77.7 -71.1 -47.5 27.0 12.8 -15.1 -27.1 -56.2 30
Financial account
31 Net lending (+) or borrowing (-) (line 30) -72.4 -68.8 -77.7 -71.1 -47.5 27.0 12.8 -15.1 -27.1 -56.2 31
32 Net acquisition of financial assets 370.8 437.3 519.9 479.5 97.3 -117.1 152.0 16.6 74.1 35.4 32
33 Currency and deposits 93.7 100.2 95.0 81.8 2.5 10.1 0.2 1.5 19.9 3.9 3334 Currency and transferable deposits 106.9 76.7 74.7 66.9 3.8 14.9 -2.7 -2.4 14.9 -3.7 3435 Time and savings deposits -13.2 23.5 20.3 14.9 -1.2 -4.8 2.9 3.9 5.0 7.6 35
36 Debt securities 7.0 6.1 1.5 2.5 -7.9 -5.5 2.5 0.6 0.8 1.1 3637 Treasury securities 5.3 6.0 0.2 3.0 -7.5 -5.7 1.9 0.5 0.7 1.0 3738 Municipal securities 1.7 0.1 1.3 -0.5 -0.4 0.2 0.5 0.1 0.1 0.1 38
39 Loans 4.6 5.3 -1.5 7.4 -3.0 -1.2 4.2 0.5 0.6 0.9 3940 Short term (consumer credit) 0.0 0.0 0.0 0.0 0.0 0.0 0.0 0.0 0.0 0.0 4041 Long term (mortgages) 4.6 5.3 -1.5 7.4 -3.0 -1.2 4.2 0.5 0.6 0.9 41
42 Equity and investment fund shares 3.0 2.4 3.3 2.9 2.2 -1.7 3.5 1.1 1.2 2.2 4243 Money market mutual fund shares 2.9 2.4 3.2 2.2 1.0 -1.7 3.1 0.8 1.1 1.6 4344 Equity in government-sponsored enterprises (2) 0.0 -0.1 0.2 0.7 1.2 -0.0 0.4 0.3 0.2 0.6 44
45 Insurance, pension and standardized guarantee schemes (3) 4.6 5.5 4.4 3.7 3.4 -9.8 29.9 -11.6 15.9 -27.4 45
46 Other accounts receivable 258.1 317.8 417.2 381.1 100.0 -109.0 111.8 24.6 35.8 54.6 4647 Trade receivables 26.6 66.6 40.0 54.7 -3.0 -26.3 37.0 5.8 7.5 11.4 4748 Other (miscellaneous assets) 231.4 251.2 377.2 326.4 102.9 -82.7 74.7 18.8 28.3 43.2 48
49 Net incurrence of liabilities 427.7 488.7 580.9 533.3 130.7 -165.8 118.5 27.6 97.0 87.3 49
50 Loans 254.7 341.8 415.4 463.2 325.5 -97.1 -19.4 42.7 87.9 115.0 5051 Short term 34.1 164.3 132.1 154.5 131.8 -107.3 -12.1 57.3 95.0 55.7 5152 Depository institution loans n.e.c. 33.0 157.9 115.3 140.9 119.6 -102.0 -16.8 56.7 85.7 49.5 5253 Other loans and advances 1.2 6.4 16.8 13.7 12.3 -5.3 4.7 0.6 9.3 6.2 5354 Long term (mortgages) 220.6 177.5 283.3 308.7 193.7 10.2 -7.3 -14.6 -7.1 59.3 54
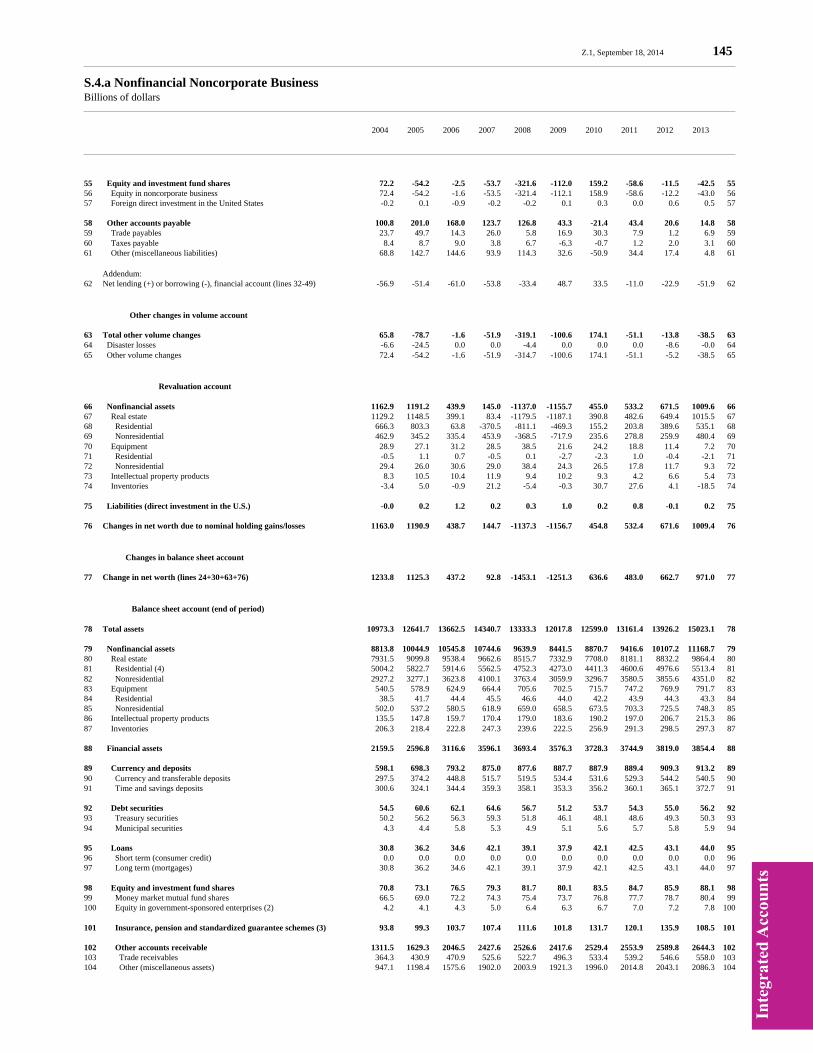
Inte
grat
ed A
ccou
nts
Z.1, September 18, 2014 145
S.4.a Nonfinancial Noncorporate BusinessBillions of dollars
2004 2005 2006 2007 2008 2009 2010 2011 2012 2013
55 Equity and investment fund shares 72.2 -54.2 -2.5 -53.7 -321.6 -112.0 159.2 -58.6 -11.5 -42.5 5556 Equity in noncorporate business 72.4 -54.2 -1.6 -53.5 -321.4 -112.1 158.9 -58.6 -12.2 -43.0 5657 Foreign direct investment in the United States -0.2 0.1 -0.9 -0.2 -0.2 0.1 0.3 0.0 0.6 0.5 57
58 Other accounts payable 100.8 201.0 168.0 123.7 126.8 43.3 -21.4 43.4 20.6 14.8 5859 Trade payables 23.7 49.7 14.3 26.0 5.8 16.9 30.3 7.9 1.2 6.9 5960 Taxes payable 8.4 8.7 9.0 3.8 6.7 -6.3 -0.7 1.2 2.0 3.1 6061 Other (miscellaneous liabilities) 68.8 142.7 144.6 93.9 114.3 32.6 -50.9 34.4 17.4 4.8 61
Addendum:62 Net lending (+) or borrowing (-), financial account (lines 32-49) -56.9 -51.4 -61.0 -53.8 -33.4 48.7 33.5 -11.0 -22.9 -51.9 62
Other changes in volume account
63 Total other volume changes 65.8 -78.7 -1.6 -51.9 -319.1 -100.6 174.1 -51.1 -13.8 -38.5 6364 Disaster losses -6.6 -24.5 0.0 0.0 -4.4 0.0 0.0 0.0 -8.6 -0.0 6465 Other volume changes 72.4 -54.2 -1.6 -51.9 -314.7 -100.6 174.1 -51.1 -5.2 -38.5 65
Revaluation account
66 Nonfinancial assets 1162.9 1191.2 439.9 145.0 -1137.0 -1155.7 455.0 533.2 671.5 1009.6 6667 Real estate 1129.2 1148.5 399.1 83.4 -1179.5 -1187.1 390.8 482.6 649.4 1015.5 6768 Residential 666.3 803.3 63.8 -370.5 -811.1 -469.3 155.2 203.8 389.6 535.1 6869 Nonresidential 462.9 345.2 335.4 453.9 -368.5 -717.9 235.6 278.8 259.9 480.4 6970 Equipment 28.9 27.1 31.2 28.5 38.5 21.6 24.2 18.8 11.4 7.2 7071 Residential -0.5 1.1 0.7 -0.5 0.1 -2.7 -2.3 1.0 -0.4 -2.1 7172 Nonresidential 29.4 26.0 30.6 29.0 38.4 24.3 26.5 17.8 11.7 9.3 7273 Intellectual property products 8.3 10.5 10.4 11.9 9.4 10.2 9.3 4.2 6.6 5.4 7374 Inventories -3.4 5.0 -0.9 21.2 -5.4 -0.3 30.7 27.6 4.1 -18.5 74
75 Liabilities (direct investment in the U.S.) -0.0 0.2 1.2 0.2 0.3 1.0 0.2 0.8 -0.1 0.2 75
76 Changes in net worth due to nominal holding gains/losses 1163.0 1190.9 438.7 144.7 -1137.3 -1156.7 454.8 532.4 671.6 1009.4 76
Changes in balance sheet account
77 Change in net worth (lines 24+30+63+76) 1233.8 1125.3 437.2 92.8 -1453.1 -1251.3 636.6 483.0 662.7 971.0 77
Balance sheet account (end of period)
78 Total assets 10973.3 12641.7 13662.5 14340.7 13333.3 12017.8 12599.0 13161.4 13926.2 15023.1 78
79 Nonfinancial assets 8813.8 10044.9 10545.8 10744.6 9639.9 8441.5 8870.7 9416.6 10107.2 11168.7 7980 Real estate 7931.5 9099.8 9538.4 9662.6 8515.7 7332.9 7708.0 8181.1 8832.2 9864.4 8081 Residential (4) 5004.2 5822.7 5914.6 5562.5 4752.3 4273.0 4411.3 4600.6 4976.6 5513.4 8182 Nonresidential 2927.2 3277.1 3623.8 4100.1 3763.4 3059.9 3296.7 3580.5 3855.6 4351.0 8283 Equipment 540.5 578.9 624.9 664.4 705.6 702.5 715.7 747.2 769.9 791.7 8384 Residential 38.5 41.7 44.4 45.5 46.6 44.0 42.2 43.9 44.3 43.3 8485 Nonresidential 502.0 537.2 580.5 618.9 659.0 658.5 673.5 703.3 725.5 748.3 8586 Intellectual property products 135.5 147.8 159.7 170.4 179.0 183.6 190.2 197.0 206.7 215.3 8687 Inventories 206.3 218.4 222.8 247.3 239.6 222.5 256.9 291.3 298.5 297.3 87
88 Financial assets 2159.5 2596.8 3116.6 3596.1 3693.4 3576.3 3728.3 3744.9 3819.0 3854.4 88
89 Currency and deposits 598.1 698.3 793.2 875.0 877.6 887.7 887.9 889.4 909.3 913.2 8990 Currency and transferable deposits 297.5 374.2 448.8 515.7 519.5 534.4 531.6 529.3 544.2 540.5 9091 Time and savings deposits 300.6 324.1 344.4 359.3 358.1 353.3 356.2 360.1 365.1 372.7 91
92 Debt securities 54.5 60.6 62.1 64.6 56.7 51.2 53.7 54.3 55.0 56.2 9293 Treasury securities 50.2 56.2 56.3 59.3 51.8 46.1 48.1 48.6 49.3 50.3 9394 Municipal securities 4.3 4.4 5.8 5.3 4.9 5.1 5.6 5.7 5.8 5.9 94
95 Loans 30.8 36.2 34.6 42.1 39.1 37.9 42.1 42.5 43.1 44.0 9596 Short term (consumer credit) 0.0 0.0 0.0 0.0 0.0 0.0 0.0 0.0 0.0 0.0 9697 Long term (mortgages) 30.8 36.2 34.6 42.1 39.1 37.9 42.1 42.5 43.1 44.0 97
98 Equity and investment fund shares 70.8 73.1 76.5 79.3 81.7 80.1 83.5 84.7 85.9 88.1 9899 Money market mutual fund shares 66.5 69.0 72.2 74.3 75.4 73.7 76.8 77.7 78.7 80.4 99100 Equity in government-sponsored enterprises (2) 4.2 4.1 4.3 5.0 6.4 6.3 6.7 7.0 7.2 7.8 100
101 Insurance, pension and standardized guarantee schemes (3) 93.8 99.3 103.7 107.4 111.6 101.8 131.7 120.1 135.9 108.5 101
102 Other accounts receivable 1311.5 1629.3 2046.5 2427.6 2526.6 2417.6 2529.4 2553.9 2589.8 2644.3 102103 Trade receivables 364.3 430.9 470.9 525.6 522.7 496.3 533.4 539.2 546.6 558.0 103104 Other (miscellaneous assets) 947.1 1198.4 1575.6 1902.0 2003.9 1921.3 1996.0 2014.8 2043.1 2086.3 104

Inte
grat
ed A
ccou
nts
146 Z.1, September 18, 2014
S.4.a Nonfinancial Noncorporate BusinessBillions of dollars
2004 2005 2006 2007 2008 2009 2010 2011 2012 2013
105 Total liabilities and net worth 10973.3 12641.7 13662.5 14340.7 13333.3 12017.8 12599.0 13161.4 13926.2 15023.1 105
106 Liabilities 3637.4 4180.5 4764.1 5349.5 5795.2 5731.0 5675.6 5755.0 5857.1 5983.1 106
107 Loans 2556.2 2898.0 3313.4 3775.1 4094.0 3985.4 3950.9 3986.1 4069.5 4180.0 107108 Short term 640.9 805.2 937.3 1091.8 1223.7 1116.4 1098.2 1155.5 1252.9 1308.6 108109 Depository institution loans n.e.c. 512.6 670.5 785.8 926.7 1046.2 944.2 927.4 984.2 1072.2 1121.8 109110 Other loans and advances 128.3 134.6 151.5 165.2 177.4 172.1 170.8 171.3 180.7 186.9 110111 Long term (mortgages) 1915.3 2092.9 2376.1 2683.3 2870.3 2869.0 2852.7 2830.6 2816.6 2871.4 111
112 Equity and investment fund shares (direct investment in the U.S.) 3.0 3.3 3.6 3.6 3.7 4.8 5.3 6.1 6.6 7.3 112
113 Other accounts payable 1078.1 1279.1 1447.1 1570.8 1697.6 1740.8 1719.4 1762.9 1781.0 1795.8 113114 Trade payables 284.9 334.5 348.9 374.9 380.7 397.6 427.8 435.7 434.5 441.4 114115 Taxes payable 78.0 86.7 95.7 99.5 106.2 99.9 99.2 100.3 102.3 105.4 115116 Other (miscellaneous liabilities) 715.2 857.9 1002.5 1096.4 1210.7 1243.3 1192.4 1226.8 1244.2 1249.0 116
117 Net worth 7335.9 8461.2 8898.4 8991.2 7538.1 6286.8 6923.4 7406.4 8069.1 9040.1 117
Notes. Nonfinancial noncorporate business includes noncorporate farms that are excluded from the nonfinancial noncorporate business sector in the Financial Accounts of the United States.Estimates for 2000 and earlier periods are based on the 1987 Standard Industrial Classification System; later estimates are based on the North American Classification System.(1) Consists of rental income of tenant-occupied housing and proprietors’ income. Quasi-corporations are unincorporated enterprises that function as if they were corporations;they primarily cover their operating costs through sales, and they keep a complete set of financial records.(2) Government-sponsored enterprises (GSEs) consist of Federal Home Loan Banks, Fannie Mae, Freddie Mac, Federal Agricultural Mortgage Corporation, Farm Credit System,the Financing Corporation, and the Resolution Funding Corporation, and they included the Student Loan Marketing Association until it was fully privatized in the fourth quarter of 2004.(3) Net equity in reserves of property-casualty insurance companies.(4) Farm houses are included in the household sector.n.e.c. Not elsewhere classified
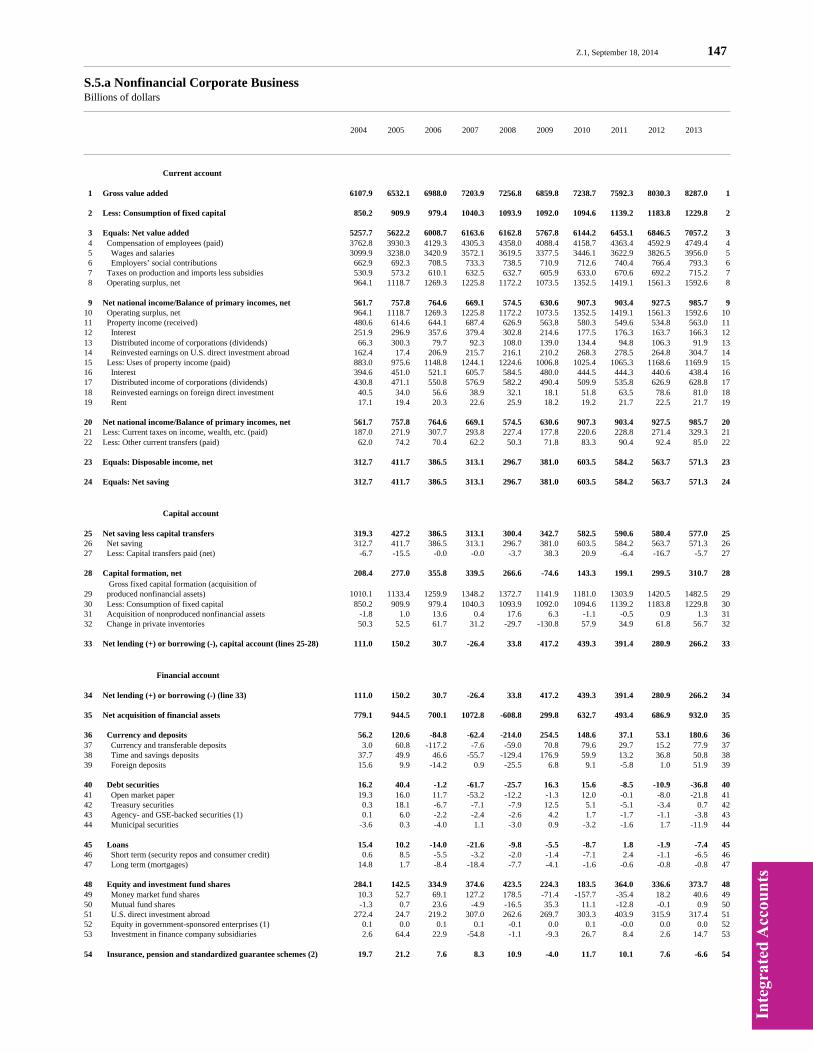
Inte
grat
ed A
ccou
nts
Z.1, September 18, 2014 147
S.5.a Nonfinancial Corporate BusinessBillions of dollars
2004 2005 2006 2007 2008 2009 2010 2011 2012 2013
Current account
1 Gross value added 6107.9 6532.1 6988.0 7203.9 7256.8 6859.8 7238.7 7592.3 8030.3 8287.0 1
2 Less: Consumption of fixed capital 850.2 909.9 979.4 1040.3 1093.9 1092.0 1094.6 1139.2 1183.8 1229.8 2
3 Equals: Net value added 5257.7 5622.2 6008.7 6163.6 6162.8 5767.8 6144.2 6453.1 6846.5 7057.2 3 4 Compensation of employees (paid) 3762.8 3930.3 4129.3 4305.3 4358.0 4088.4 4158.7 4363.4 4592.9 4749.4 4 5 Wages and salaries 3099.9 3238.0 3420.9 3572.1 3619.5 3377.5 3446.1 3622.9 3826.5 3956.0 5 6 Employers’ social contributions 662.9 692.3 708.5 733.3 738.5 710.9 712.6 740.4 766.4 793.3 6 7 Taxes on production and imports less subsidies 530.9 573.2 610.1 632.5 632.7 605.9 633.0 670.6 692.2 715.2 7 8 Operating surplus, net 964.1 1118.7 1269.3 1225.8 1172.2 1073.5 1352.5 1419.1 1561.3 1592.6 8
9 Net national income/Balance of primary incomes, net 561.7 757.8 764.6 669.1 574.5 630.6 907.3 903.4 927.5 985.7 910 Operating surplus, net 964.1 1118.7 1269.3 1225.8 1172.2 1073.5 1352.5 1419.1 1561.3 1592.6 1011 Property income (received) 480.6 614.6 644.1 687.4 626.9 563.8 580.3 549.6 534.8 563.0 1112 Interest 251.9 296.9 357.6 379.4 302.8 214.6 177.5 176.3 163.7 166.3 1213 Distributed income of corporations (dividends) 66.3 300.3 79.7 92.3 108.0 139.0 134.4 94.8 106.3 91.9 1314 Reinvested earnings on U.S. direct investment abroad 162.4 17.4 206.9 215.7 216.1 210.2 268.3 278.5 264.8 304.7 1415 Less: Uses of property income (paid) 883.0 975.6 1148.8 1244.1 1224.6 1006.8 1025.4 1065.3 1168.6 1169.9 1516 Interest 394.6 451.0 521.1 605.7 584.5 480.0 444.5 444.3 440.6 438.4 1617 Distributed income of corporations (dividends) 430.8 471.1 550.8 576.9 582.2 490.4 509.9 535.8 626.9 628.8 1718 Reinvested earnings on foreign direct investment 40.5 34.0 56.6 38.9 32.1 18.1 51.8 63.5 78.6 81.0 1819 Rent 17.1 19.4 20.3 22.6 25.9 18.2 19.2 21.7 22.5 21.7 19
20 Net national income/Balance of primary incomes, net 561.7 757.8 764.6 669.1 574.5 630.6 907.3 903.4 927.5 985.7 2021 Less: Current taxes on income, wealth, etc. (paid) 187.0 271.9 307.7 293.8 227.4 177.8 220.6 228.8 271.4 329.3 2122 Less: Other current transfers (paid) 62.0 74.2 70.4 62.2 50.3 71.8 83.3 90.4 92.4 85.0 22
23 Equals: Disposable income, net 312.7 411.7 386.5 313.1 296.7 381.0 603.5 584.2 563.7 571.3 23
24 Equals: Net saving 312.7 411.7 386.5 313.1 296.7 381.0 603.5 584.2 563.7 571.3 24
Capital account
25 Net saving less capital transfers 319.3 427.2 386.5 313.1 300.4 342.7 582.5 590.6 580.4 577.0 2526 Net saving 312.7 411.7 386.5 313.1 296.7 381.0 603.5 584.2 563.7 571.3 2627 Less: Capital transfers paid (net) -6.7 -15.5 -0.0 -0.0 -3.7 38.3 20.9 -6.4 -16.7 -5.7 27
28 Capital formation, net 208.4 277.0 355.8 339.5 266.6 -74.6 143.3 199.1 299.5 310.7 28 Gross fixed capital formation (acquisition of29 produced nonfinancial assets) 1010.1 1133.4 1259.9 1348.2 1372.7 1141.9 1181.0 1303.9 1420.5 1482.5 2930 Less: Consumption of fixed capital 850.2 909.9 979.4 1040.3 1093.9 1092.0 1094.6 1139.2 1183.8 1229.8 3031 Acquisition of nonproduced nonfinancial assets -1.8 1.0 13.6 0.4 17.6 6.3 -1.1 -0.5 0.9 1.3 3132 Change in private inventories 50.3 52.5 61.7 31.2 -29.7 -130.8 57.9 34.9 61.8 56.7 32
33 Net lending (+) or borrowing (-), capital account (lines 25-28) 111.0 150.2 30.7 -26.4 33.8 417.2 439.3 391.4 280.9 266.2 33
Financial account
34 Net lending (+) or borrowing (-) (line 33) 111.0 150.2 30.7 -26.4 33.8 417.2 439.3 391.4 280.9 266.2 34
35 Net acquisition of financial assets 779.1 944.5 700.1 1072.8 -608.8 299.8 632.7 493.4 686.9 932.0 35
36 Currency and deposits 56.2 120.6 -84.8 -62.4 -214.0 254.5 148.6 37.1 53.1 180.6 3637 Currency and transferable deposits 3.0 60.8 -117.2 -7.6 -59.0 70.8 79.6 29.7 15.2 77.9 3738 Time and savings deposits 37.7 49.9 46.6 -55.7 -129.4 176.9 59.9 13.2 36.8 50.8 3839 Foreign deposits 15.6 9.9 -14.2 0.9 -25.5 6.8 9.1 -5.8 1.0 51.9 39
40 Debt securities 16.2 40.4 -1.2 -61.7 -25.7 16.3 15.6 -8.5 -10.9 -36.8 4041 Open market paper 19.3 16.0 11.7 -53.2 -12.2 -1.3 12.0 -0.1 -8.0 -21.8 4142 Treasury securities 0.3 18.1 -6.7 -7.1 -7.9 12.5 5.1 -5.1 -3.4 0.7 4243 Agency- and GSE-backed securities (1) 0.1 6.0 -2.2 -2.4 -2.6 4.2 1.7 -1.7 -1.1 -3.8 4344 Municipal securities -3.6 0.3 -4.0 1.1 -3.0 0.9 -3.2 -1.6 1.7 -11.9 44
45 Loans 15.4 10.2 -14.0 -21.6 -9.8 -5.5 -8.7 1.8 -1.9 -7.4 4546 Short term (security repos and consumer credit) 0.6 8.5 -5.5 -3.2 -2.0 -1.4 -7.1 2.4 -1.1 -6.5 4647 Long term (mortgages) 14.8 1.7 -8.4 -18.4 -7.7 -4.1 -1.6 -0.6 -0.8 -0.8 47
48 Equity and investment fund shares 284.1 142.5 334.9 374.6 423.5 224.3 183.5 364.0 336.6 373.7 4849 Money market fund shares 10.3 52.7 69.1 127.2 178.5 -71.4 -157.7 -35.4 18.2 40.6 4950 Mutual fund shares -1.3 0.7 23.6 -4.9 -16.5 35.3 11.1 -12.8 -0.1 0.9 5051 U.S. direct investment abroad 272.4 24.7 219.2 307.0 262.6 269.7 303.3 403.9 315.9 317.4 5152 Equity in government-sponsored enterprises (1) 0.1 0.0 0.1 0.1 -0.1 0.0 0.1 -0.0 0.0 0.0 5253 Investment in finance company subsidiaries 2.6 64.4 22.9 -54.8 -1.1 -9.3 26.7 8.4 2.6 14.7 53
54 Insurance, pension and standardized guarantee schemes (2) 19.7 21.2 7.6 8.3 10.9 -4.0 11.7 10.1 7.6 -6.6 54

Inte
grat
ed A
ccou
nts
148 Z.1, September 18, 2014
S.5.a Nonfinancial Corporate BusinessBillions of dollars
2004 2005 2006 2007 2008 2009 2010 2011 2012 2013
55 Other accounts receivable 387.4 609.6 457.6 835.5 -793.8 -185.9 282.0 88.9 302.4 428.5 5556 Trade receivables 128.8 277.6 -13.8 159.8 -169.6 -31.2 105.7 83.8 83.6 145.4 5657 Other (miscellaneous assets) 258.6 332.0 471.4 675.7 -624.3 -154.7 176.3 5.1 218.7 283.1 57
58 Net incurrence of liabilities 614.1 965.4 839.1 1281.0 338.9 -248.7 487.6 894.3 1196.6 1144.2 58
59 Debt securities 13.8 -7.1 150.4 198.5 190.2 179.9 237.1 203.7 353.6 304.2 5960 Open market paper 15.3 -7.7 22.4 11.3 7.7 -73.1 24.5 33.4 14.0 14.2 6061 Municipal securities 10.6 41.9 53.3 68.4 66.0 37.2 33.2 8.5 15.2 9.3 6162 Corporate bonds -12.1 -41.3 74.7 118.8 116.5 215.8 179.4 161.7 324.4 280.6 62
63 Loans 129.8 274.1 237.7 453.0 72.1 -538.5 -308.0 56.8 51.4 127.4 6364 Short term 55.0 83.0 149.9 383.8 132.1 -394.8 -177.5 129.1 46.8 100.2 6465 Depository institution loans n.e.c. 4.0 -27.1 22.0 96.3 64.2 -234.0 -87.0 68.9 80.4 46.6 6566 Other loans and advances 51.1 110.1 127.9 287.5 68.0 -160.8 -90.4 60.2 -33.7 53.6 6667 Long term (mortgages) 74.7 191.1 87.8 69.2 -60.1 -143.7 -130.6 -72.3 4.6 27.2 67
68 Equity and investment fund shares 2.5 -201.5 -304.9 -500.9 -130.1 52.2 -98.1 -264.0 -189.4 -166.3 6869 Corporate equities -93.4 -300.2 -496.9 -713.0 -319.6 -52.5 -255.1 -456.7 -359.5 -373.3 6970 Foreign direct investment in the United States 96.0 98.7 192.0 212.1 189.6 104.6 157.0 192.7 170.1 207.1 70
71 Insurance, pension and standardized guarantee schemes 81.2 91.2 146.5 -0.4 138.2 74.2 -5.3 -13.8 -3.9 11.5 7172 Pension fund contributions payable -3.1 -1.9 -2.0 4.5 14.7 -8.6 15.4 3.0 -12.3 -0.6 7273 Claim of pension fund on sponsor 84.3 93.1 148.4 -4.9 123.4 82.8 -20.7 -16.8 8.4 12.1 73
74 Other accounts payable 386.8 808.7 609.4 1130.8 68.5 -16.5 661.9 911.8 984.9 867.3 7475 Trade payables 97.7 199.0 109.1 85.1 -225.2 -82.6 156.3 25.2 83.3 113.4 7576 Taxes payable 6.8 -1.8 -0.8 -49.6 3.1 -3.3 7.2 8.8 2.3 -9.3 7677 Miscellaneous liabilities 282.3 611.5 501.1 1095.3 290.6 69.4 498.4 877.8 899.4 763.3 77
Addendum:78 Net lending (+) or borrowing (-), financial account (lines 35-58) 165.0 -20.9 -139.0 -208.2 -947.7 548.5 145.2 -400.9 -509.7 -212.2 78
Other changes in volume account
79 Total other volume changes 267.2 288.5 576.9 685.6 -740.1 173.6 383.7 -56.1 -203.2 269.7 7980 Disaster losses -9.2 -22.7 0.0 0.0 -5.8 0.0 0.0 0.0 -6.9 0.0 8081 Other volume changes 182.9 450.2 711.0 827.8 210.2 49.0 636.8 667.9 584.7 751.5 8182 Less: Statistical discrepancy (lines 33-78) (3) -54.0 171.2 169.7 181.7 981.5 -131.2 294.1 792.3 790.6 478.5 8283 Less: Inventory valuation adjustment -39.5 -32.1 -35.7 -39.5 -37.0 6.7 -41.0 -68.3 -9.5 3.3 83
Revaluation account
84 Nonfinancial assets 1316.0 932.0 973.5 1466.6 -1108.2 -2627.9 857.3 823.0 564.7 1371.7 8485 Real estate 1198.8 811.4 872.8 1343.4 -1152.8 -2646.4 724.6 684.9 478.3 1337.3 8586 Equipment 64.9 45.0 70.9 22.6 99.9 -16.1 41.1 76.6 30.1 8.6 8687 Intellectual property products 10.9 27.9 20.5 30.2 13.2 3.1 22.5 27.9 43.5 26.1 8788 Inventories 41.4 47.7 9.2 70.4 -68.4 31.6 69.1 33.7 12.7 -0.3 88
89 Financial assets 89.2 94.5 31.0 154.8 -199.6 -15.3 -131.9 -55.7 20.2 2.1 8990 Mutual fund shares 11.9 8.1 15.2 9.7 -55.2 20.4 13.6 -8.1 14.3 30.5 9091 Direct investment abroad 77.2 86.3 15.9 145.1 -144.4 -35.7 -145.6 -47.6 5.9 -28.4 91
92 Liabilities 1348.6 939.1 2393.9 1868.5 -5495.7 2379.6 2099.7 383.2 1973.3 5135.0 9293 Corporate equity 1336.8 898.2 2412.7 1841.4 -5394.5 2548.1 2114.5 473.9 1965.2 5140.7 9394 Foreign direct investment in the United States 11.8 41.0 -18.8 27.1 -101.2 -168.5 -14.8 -90.7 8.1 -5.7 94
95 Changes in net worth due to nominal holding gains/losses 56.6 87.3 -1389.4 -247.1 4187.9 -5022.7 -1374.4 384.1 -1388.4 -3761.2 95
Changes in balance sheet account
96 Change in net worth (lines 28+33+79+95) (4) 643.1 803.0 -426.0 751.6 3748.2 -4506.4 -408.1 918.6 -1011.3 -2914.6 96
Balance sheet account (end of period)
97 Total assets 23867.5 26068.7 28197.7 31172.1 29515.0 27183.5 28957.8 30545.3 32168.0 34941.9 97
98 Nonfinancial assets (5) 12930.2 14168.0 15538.3 17419.3 16591.8 13866.0 14941.1 16039.7 16902.4 18561.3 9899 Real estate 7051.1 7924.3 8893.0 10381.9 9360.0 6767.5 7545.7 8275.3 8831.4 10236.1 99100 Equipment 3145.4 3297.8 3513.6 3673.4 3857.2 3793.1 3853.6 4008.0 4138.0 4261.7 100101 Intellectual property products 1242.2 1322.0 1401.1 1492.3 1564.1 1600.7 1669.1 1746.9 1839.4 1916.9 101102 Inventories 1491.6 1623.9 1730.5 1871.7 1810.5 1704.6 1872.7 2009.6 2093.6 2146.6 102
103 Financial assets 10937.3 11900.6 12659.5 13752.8 12923.2 13317.5 14016.8 14505.6 15265.6 16380.6 103
104 Currency and deposits 661.3 781.9 697.1 634.7 420.7 675.2 823.8 860.9 914.0 1094.6 104105 Currency and transferable deposits 207.2 268.0 150.7 143.1 84.2 154.9 234.5 264.2 279.4 357.3 105106 Time and savings deposits 400.5 450.4 497.0 441.3 311.9 488.8 548.7 561.9 598.8 649.5 106107 Foreign deposits 53.7 63.6 49.3 50.3 24.7 31.5 40.6 34.8 35.8 87.8 107
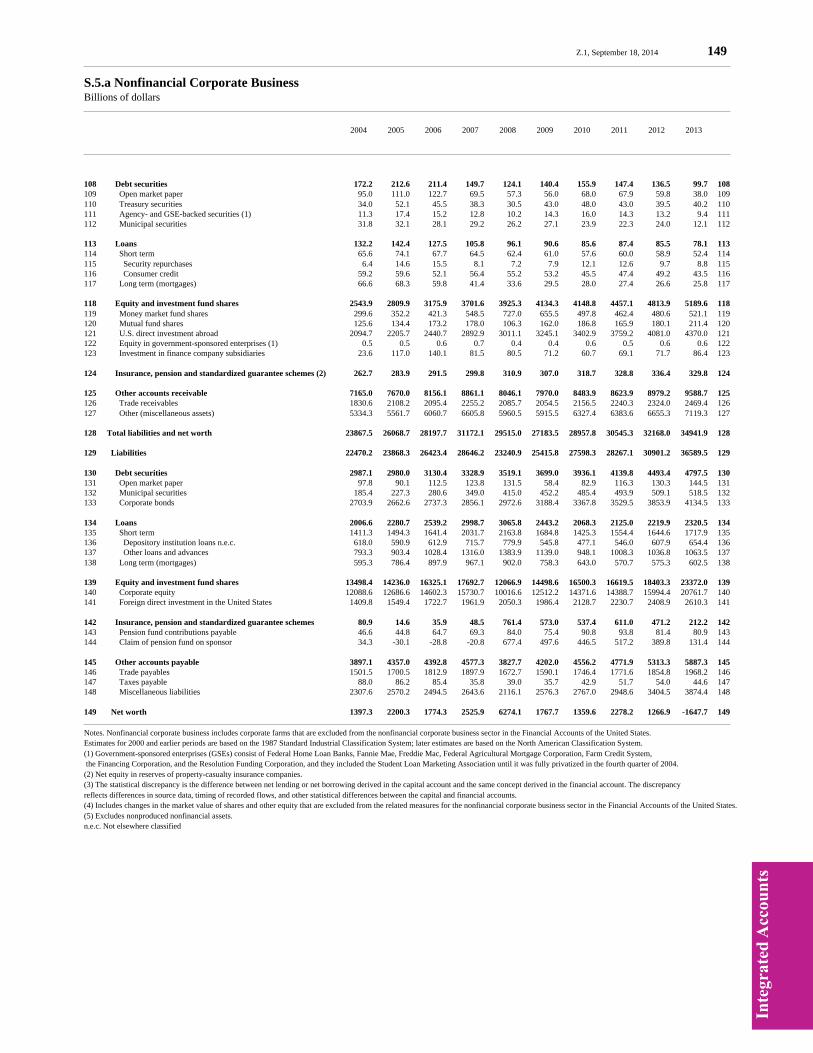
Inte
grat
ed A
ccou
nts
Z.1, September 18, 2014 149
S.5.a Nonfinancial Corporate BusinessBillions of dollars
2004 2005 2006 2007 2008 2009 2010 2011 2012 2013
108 Debt securities 172.2 212.6 211.4 149.7 124.1 140.4 155.9 147.4 136.5 99.7 108109 Open market paper 95.0 111.0 122.7 69.5 57.3 56.0 68.0 67.9 59.8 38.0 109110 Treasury securities 34.0 52.1 45.5 38.3 30.5 43.0 48.0 43.0 39.5 40.2 110111 Agency- and GSE-backed securities (1) 11.3 17.4 15.2 12.8 10.2 14.3 16.0 14.3 13.2 9.4 111112 Municipal securities 31.8 32.1 28.1 29.2 26.2 27.1 23.9 22.3 24.0 12.1 112
113 Loans 132.2 142.4 127.5 105.8 96.1 90.6 85.6 87.4 85.5 78.1 113114 Short term 65.6 74.1 67.7 64.5 62.4 61.0 57.6 60.0 58.9 52.4 114115 Security repurchases 6.4 14.6 15.5 8.1 7.2 7.9 12.1 12.6 9.7 8.8 115116 Consumer credit 59.2 59.6 52.1 56.4 55.2 53.2 45.5 47.4 49.2 43.5 116117 Long term (mortgages) 66.6 68.3 59.8 41.4 33.6 29.5 28.0 27.4 26.6 25.8 117
118 Equity and investment fund shares 2543.9 2809.9 3175.9 3701.6 3925.3 4134.3 4148.8 4457.1 4813.9 5189.6 118119 Money market fund shares 299.6 352.2 421.3 548.5 727.0 655.5 497.8 462.4 480.6 521.1 119120 Mutual fund shares 125.6 134.4 173.2 178.0 106.3 162.0 186.8 165.9 180.1 211.4 120121 U.S. direct investment abroad 2094.7 2205.7 2440.7 2892.9 3011.1 3245.1 3402.9 3759.2 4081.0 4370.0 121122 Equity in government-sponsored enterprises (1) 0.5 0.5 0.6 0.7 0.4 0.4 0.6 0.5 0.6 0.6 122123 Investment in finance company subsidiaries 23.6 117.0 140.1 81.5 80.5 71.2 60.7 69.1 71.7 86.4 123
124 Insurance, pension and standardized guarantee schemes (2) 262.7 283.9 291.5 299.8 310.9 307.0 318.7 328.8 336.4 329.8 124
125 Other accounts receivable 7165.0 7670.0 8156.1 8861.1 8046.1 7970.0 8483.9 8623.9 8979.2 9588.7 125126 Trade receivables 1830.6 2108.2 2095.4 2255.2 2085.7 2054.5 2156.5 2240.3 2324.0 2469.4 126127 Other (miscellaneous assets) 5334.3 5561.7 6060.7 6605.8 5960.5 5915.5 6327.4 6383.6 6655.3 7119.3 127
128 Total liabilities and net worth 23867.5 26068.7 28197.7 31172.1 29515.0 27183.5 28957.8 30545.3 32168.0 34941.9 128
129 Liabilities 22470.2 23868.3 26423.4 28646.2 23240.9 25415.8 27598.3 28267.1 30901.2 36589.5 129
130 Debt securities 2987.1 2980.0 3130.4 3328.9 3519.1 3699.0 3936.1 4139.8 4493.4 4797.5 130131 Open market paper 97.8 90.1 112.5 123.8 131.5 58.4 82.9 116.3 130.3 144.5 131132 Municipal securities 185.4 227.3 280.6 349.0 415.0 452.2 485.4 493.9 509.1 518.5 132133 Corporate bonds 2703.9 2662.6 2737.3 2856.1 2972.6 3188.4 3367.8 3529.5 3853.9 4134.5 133
134 Loans 2006.6 2280.7 2539.2 2998.7 3065.8 2443.2 2068.3 2125.0 2219.9 2320.5 134135 Short term 1411.3 1494.3 1641.4 2031.7 2163.8 1684.8 1425.3 1554.4 1644.6 1717.9 135136 Depository institution loans n.e.c. 618.0 590.9 612.9 715.7 779.9 545.8 477.1 546.0 607.9 654.4 136137 Other loans and advances 793.3 903.4 1028.4 1316.0 1383.9 1139.0 948.1 1008.3 1036.8 1063.5 137138 Long term (mortgages) 595.3 786.4 897.9 967.1 902.0 758.3 643.0 570.7 575.3 602.5 138
139 Equity and investment fund shares 13498.4 14236.0 16325.1 17692.7 12066.9 14498.6 16500.3 16619.5 18403.3 23372.0 139140 Corporate equity 12088.6 12686.6 14602.3 15730.7 10016.6 12512.2 14371.6 14388.7 15994.4 20761.7 140141 Foreign direct investment in the United States 1409.8 1549.4 1722.7 1961.9 2050.3 1986.4 2128.7 2230.7 2408.9 2610.3 141
142 Insurance, pension and standardized guarantee schemes 80.9 14.6 35.9 48.5 761.4 573.0 537.4 611.0 471.2 212.2 142143 Pension fund contributions payable 46.6 44.8 64.7 69.3 84.0 75.4 90.8 93.8 81.4 80.9 143144 Claim of pension fund on sponsor 34.3 -30.1 -28.8 -20.8 677.4 497.6 446.5 517.2 389.8 131.4 144
145 Other accounts payable 3897.1 4357.0 4392.8 4577.3 3827.7 4202.0 4556.2 4771.9 5313.3 5887.3 145146 Trade payables 1501.5 1700.5 1812.9 1897.9 1672.7 1590.1 1746.4 1771.6 1854.8 1968.2 146147 Taxes payable 88.0 86.2 85.4 35.8 39.0 35.7 42.9 51.7 54.0 44.6 147148 Miscellaneous liabilities 2307.6 2570.2 2494.5 2643.6 2116.1 2576.3 2767.0 2948.6 3404.5 3874.4 148
149 Net worth 1397.3 2200.3 1774.3 2525.9 6274.1 1767.7 1359.6 2278.2 1266.9 -1647.7 149
Notes. Nonfinancial corporate business includes corporate farms that are excluded from the nonfinancial corporate business sector in the Financial Accounts of the United States.Estimates for 2000 and earlier periods are based on the 1987 Standard Industrial Classification System; later estimates are based on the North American Classification System.(1) Government-sponsored enterprises (GSEs) consist of Federal Home Loan Banks, Fannie Mae, Freddie Mac, Federal Agricultural Mortgage Corporation, Farm Credit System, the Financing Corporation, and the Resolution Funding Corporation, and they included the Student Loan Marketing Association until it was fully privatized in the fourth quarter of 2004.(2) Net equity in reserves of property-casualty insurance companies.(3) The statistical discrepancy is the difference between net lending or net borrowing derived in the capital account and the same concept derived in the financial account. The discrepancyreflects differences in source data, timing of recorded flows, and other statistical differences between the capital and financial accounts.(4) Includes changes in the market value of shares and other equity that are excluded from the related measures for the nonfinancial corporate business sector in the Financial Accounts of the United States.(5) Excludes nonproduced nonfinancial assets.n.e.c. Not elsewhere classified
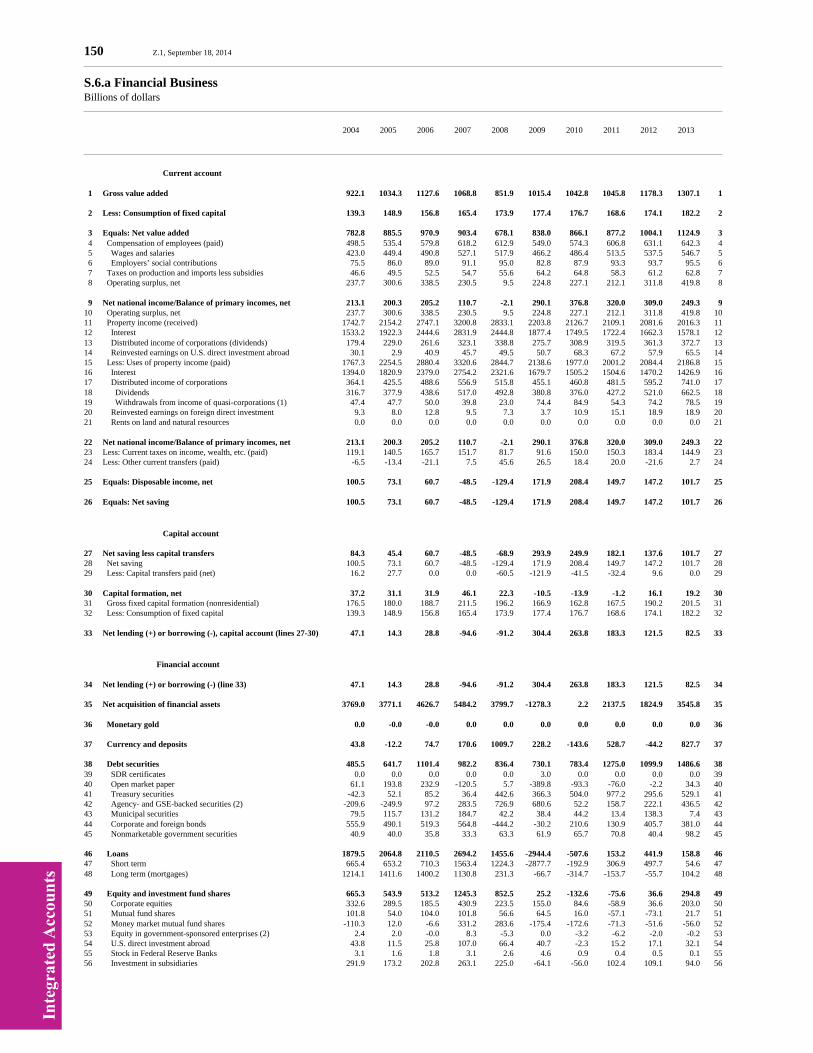
Inte
grat
ed A
ccou
nts
150 Z.1, September 18, 2014
S.6.a Financial BusinessBillions of dollars
2004 2005 2006 2007 2008 2009 2010 2011 2012 2013
Current account
1 Gross value added 922.1 1034.3 1127.6 1068.8 851.9 1015.4 1042.8 1045.8 1178.3 1307.1 1
2 Less: Consumption of fixed capital 139.3 148.9 156.8 165.4 173.9 177.4 176.7 168.6 174.1 182.2 2
3 Equals: Net value added 782.8 885.5 970.9 903.4 678.1 838.0 866.1 877.2 1004.1 1124.9 3 4 Compensation of employees (paid) 498.5 535.4 579.8 618.2 612.9 549.0 574.3 606.8 631.1 642.3 4 5 Wages and salaries 423.0 449.4 490.8 527.1 517.9 466.2 486.4 513.5 537.5 546.7 5 6 Employers’ social contributions 75.5 86.0 89.0 91.1 95.0 82.8 87.9 93.3 93.7 95.5 6 7 Taxes on production and imports less subsidies 46.6 49.5 52.5 54.7 55.6 64.2 64.8 58.3 61.2 62.8 7 8 Operating surplus, net 237.7 300.6 338.5 230.5 9.5 224.8 227.1 212.1 311.8 419.8 8
9 Net national income/Balance of primary incomes, net 213.1 200.3 205.2 110.7 -2.1 290.1 376.8 320.0 309.0 249.3 910 Operating surplus, net 237.7 300.6 338.5 230.5 9.5 224.8 227.1 212.1 311.8 419.8 1011 Property income (received) 1742.7 2154.2 2747.1 3200.8 2833.1 2203.8 2126.7 2109.1 2081.6 2016.3 1112 Interest 1533.2 1922.3 2444.6 2831.9 2444.8 1877.4 1749.5 1722.4 1662.3 1578.1 1213 Distributed income of corporations (dividends) 179.4 229.0 261.6 323.1 338.8 275.7 308.9 319.5 361.3 372.7 1314 Reinvested earnings on U.S. direct investment abroad 30.1 2.9 40.9 45.7 49.5 50.7 68.3 67.2 57.9 65.5 1415 Less: Uses of property income (paid) 1767.3 2254.5 2880.4 3320.6 2844.7 2138.6 1977.0 2001.2 2084.4 2186.8 1516 Interest 1394.0 1820.9 2379.0 2754.2 2321.6 1679.7 1505.2 1504.6 1470.2 1426.9 1617 Distributed income of corporations 364.1 425.5 488.6 556.9 515.8 455.1 460.8 481.5 595.2 741.0 1718 Dividends 316.7 377.9 438.6 517.0 492.8 380.8 376.0 427.2 521.0 662.5 1819 Withdrawals from income of quasi-corporations (1) 47.4 47.7 50.0 39.8 23.0 74.4 84.9 54.3 74.2 78.5 1920 Reinvested earnings on foreign direct investment 9.3 8.0 12.8 9.5 7.3 3.7 10.9 15.1 18.9 18.9 2021 Rents on land and natural resources 0.0 0.0 0.0 0.0 0.0 0.0 0.0 0.0 0.0 0.0 21
22 Net national income/Balance of primary incomes, net 213.1 200.3 205.2 110.7 -2.1 290.1 376.8 320.0 309.0 249.3 2223 Less: Current taxes on income, wealth, etc. (paid) 119.1 140.5 165.7 151.7 81.7 91.6 150.0 150.3 183.4 144.9 2324 Less: Other current transfers (paid) -6.5 -13.4 -21.1 7.5 45.6 26.5 18.4 20.0 -21.6 2.7 24
25 Equals: Disposable income, net 100.5 73.1 60.7 -48.5 -129.4 171.9 208.4 149.7 147.2 101.7 25
26 Equals: Net saving 100.5 73.1 60.7 -48.5 -129.4 171.9 208.4 149.7 147.2 101.7 26
Capital account
27 Net saving less capital transfers 84.3 45.4 60.7 -48.5 -68.9 293.9 249.9 182.1 137.6 101.7 2728 Net saving 100.5 73.1 60.7 -48.5 -129.4 171.9 208.4 149.7 147.2 101.7 2829 Less: Capital transfers paid (net) 16.2 27.7 0.0 0.0 -60.5 -121.9 -41.5 -32.4 9.6 0.0 29
30 Capital formation, net 37.2 31.1 31.9 46.1 22.3 -10.5 -13.9 -1.2 16.1 19.2 3031 Gross fixed capital formation (nonresidential) 176.5 180.0 188.7 211.5 196.2 166.9 162.8 167.5 190.2 201.5 3132 Less: Consumption of fixed capital 139.3 148.9 156.8 165.4 173.9 177.4 176.7 168.6 174.1 182.2 32
33 Net lending (+) or borrowing (-), capital account (lines 27-30) 47.1 14.3 28.8 -94.6 -91.2 304.4 263.8 183.3 121.5 82.5 33
Financial account
34 Net lending (+) or borrowing (-) (line 33) 47.1 14.3 28.8 -94.6 -91.2 304.4 263.8 183.3 121.5 82.5 34
35 Net acquisition of financial assets 3769.0 3771.1 4626.7 5484.2 3799.7 -1278.3 2.2 2137.5 1824.9 3545.8 35
36 Monetary gold 0.0 -0.0 -0.0 0.0 0.0 0.0 0.0 0.0 0.0 0.0 36
37 Currency and deposits 43.8 -12.2 74.7 170.6 1009.7 228.2 -143.6 528.7 -44.2 827.7 37
38 Debt securities 485.5 641.7 1101.4 982.2 836.4 730.1 783.4 1275.0 1099.9 1486.6 3839 SDR certificates 0.0 0.0 0.0 0.0 0.0 3.0 0.0 0.0 0.0 0.0 3940 Open market paper 61.1 193.8 232.9 -120.5 5.7 -389.8 -93.3 -76.0 -2.2 34.3 4041 Treasury securities -42.3 52.1 85.2 36.4 442.6 366.3 504.0 977.2 295.6 529.1 4142 Agency- and GSE-backed securities (2) -209.6 -249.9 97.2 283.5 726.9 680.6 52.2 158.7 222.1 436.5 4243 Municipal securities 79.5 115.7 131.2 184.7 42.2 38.4 44.2 13.4 138.3 7.4 4344 Corporate and foreign bonds 555.9 490.1 519.3 564.8 -444.2 -30.2 210.6 130.9 405.7 381.0 4445 Nonmarketable government securities 40.9 40.0 35.8 33.3 63.3 61.9 65.7 70.8 40.4 98.2 45
46 Loans 1879.5 2064.8 2110.5 2694.2 1455.6 -2944.4 -507.6 153.2 441.9 158.8 4647 Short term 665.4 653.2 710.3 1563.4 1224.3 -2877.7 -192.9 306.9 497.7 54.6 4748 Long term (mortgages) 1214.1 1411.6 1400.2 1130.8 231.3 -66.7 -314.7 -153.7 -55.7 104.2 48
49 Equity and investment fund shares 665.3 543.9 513.2 1245.3 852.5 25.2 -132.6 -75.6 36.6 294.8 4950 Corporate equities 332.6 289.5 185.5 430.9 223.5 155.0 84.6 -58.9 36.6 203.0 5051 Mutual fund shares 101.8 54.0 104.0 101.8 56.6 64.5 16.0 -57.1 -73.1 21.7 5152 Money market mutual fund shares -110.3 12.0 -6.6 331.2 283.6 -175.4 -172.6 -71.3 -51.6 -56.0 5253 Equity in government-sponsored enterprises (2) 2.4 2.0 -0.0 8.3 -5.3 0.0 -3.2 -6.2 -2.0 -0.2 5354 U.S. direct investment abroad 43.8 11.5 25.8 107.0 66.4 40.7 -2.3 15.2 17.1 32.1 5455 Stock in Federal Reserve Banks 3.1 1.6 1.8 3.1 2.6 4.6 0.9 0.4 0.5 0.1 5556 Investment in subsidiaries 291.9 173.2 202.8 263.1 225.0 -64.1 -56.0 102.4 109.1 94.0 56

Inte
grat
ed A
ccou
nts
Z.1, September 18, 2014 151
S.6.a Financial BusinessBillions of dollars
2004 2005 2006 2007 2008 2009 2010 2011 2012 2013
57 Insurance, pension and standardized guarantee schemes 265.6 209.5 276.6 218.0 253.7 505.4 314.6 341.2 360.1 325.5 57
58 Other accounts receivable 429.3 323.4 550.2 173.8 -608.2 177.2 -312.0 -84.9 -69.4 452.4 58
59 Net incurrence of liabilities 3815.8 3429.8 4371.2 5364.4 3960.0 -1307.8 28.7 2108.6 1707.6 3383.6 59
60 Currency and deposits 601.8 608.9 620.6 548.7 2146.1 262.3 334.1 1457.3 595.0 1850.2 60
61 Debt securities 805.8 1039.8 1319.9 1522.4 441.9 -956.5 -693.4 -325.8 -304.7 106.7 6162 Agency- and GSE-backed securities (2) 115.8 80.4 328.2 905.7 768.7 -60.1 -46.9 -21.9 -22.4 239.9 6263 Corporate bonds 668.3 745.2 795.3 728.2 -201.4 -448.4 -544.3 -235.8 -223.5 -84.3 6364 Commercial paper 21.7 214.2 196.4 -111.5 -125.4 -448.1 -102.2 -68.2 -58.8 -48.9 64
65 Loans 609.9 547.3 589.9 882.8 -155.5 -1646.0 -59.6 197.7 130.7 -217.7 6566 Short term 584.4 533.2 583.4 878.1 -162.3 -1657.8 -60.5 184.3 125.8 -225.5 6667 Long term (mortgages) 25.5 14.1 6.6 4.7 6.8 11.8 0.8 13.5 4.8 7.8 67
68 Equity and investment fund shares 649.7 698.0 931.5 1469.0 1717.3 270.5 73.8 506.1 973.5 981.9 6869 Money market mutual fund shares -136.4 125.1 303.1 736.8 724.2 -498.7 -503.2 -112.8 7.1 28.7 6970 Corporate equity issues 118.1 78.4 60.0 179.6 639.2 315.9 191.4 164.1 168.3 163.5 7071 Mutual fund shares 296.3 260.2 336.8 361.5 -9.9 497.1 370.1 338.4 624.9 638.8 7172 Equity in government-sponsored enterprises (2) 2.5 1.9 0.2 9.1 -4.2 0.0 -2.7 -5.9 -1.8 0.5 7273 Foreign direct investment in the United States 50.2 13.9 52.0 9.3 120.7 45.7 48.5 43.4 4.5 28.7 7374 Equity in noncorporate business -4.2 -1.2 -6.8 3.6 11.6 0.6 0.9 -2.9 6.7 -3.9 7475 Investment by parent 320.1 218.1 184.4 166.1 233.0 -94.5 -32.0 81.5 163.3 125.6 7576 Stock in Federal Reserve Banks 3.1 1.6 1.8 3.1 2.6 4.6 0.9 0.4 0.5 0.1 76
77 Insurance, pension and standardized guarantee schemes 747.2 690.1 700.0 725.0 585.4 541.2 646.2 639.4 488.0 547.7 77
78 Other accounts payable 401.4 -154.3 209.1 216.5 -775.3 220.7 -272.3 -366.1 -174.8 114.8 78
Addendum:79 Net lending (+) or borrowing (-), financial account (lines 35-59) -46.7 341.3 255.5 119.7 -160.3 29.5 -26.5 28.8 117.3 162.2 79
Other changes in volume account
80 Total other volume changes -418.3 36.4 -419.1 -71.4 1232.3 -1062.6 -864.2 -119.7 -430.2 -1003.7 8081 Disaster losses -1.7 -1.7 0.0 0.0 -0.6 0.0 0.0 0.0 -2.0 0.0 8182 Other volume changes -322.8 -288.9 -645.8 -285.7 1302.0 -787.7 -573.9 34.7 -423.9 -1083.4 8283 Less: Statistical discrepancy (lines 33-79) (3) 93.8 -327.0 -226.7 -214.3 69.1 274.9 290.3 154.4 4.3 -79.7 83
Revaluation account
84 Nonfinancial assets 51.0 56.6 51.1 13.6 40.1 -64.0 -8.5 34.3 11.9 23.5 8485 Structures (nonresidential) 53.9 63.4 54.9 26.5 45.5 -46.7 -1.4 29.5 12.5 25.7 8586 Equipment 1.6 -3.6 -2.1 -9.2 -0.9 -8.4 -1.4 6.1 1.6 -0.7 8687 Intellectual property products -4.6 -3.1 -1.6 -3.8 -4.6 -8.8 -5.7 -1.4 -2.2 -1.4 87
88 Financial assets 1196.7 938.3 1801.8 769.1 -6082.2 2729.8 1745.6 -632.7 1910.0 3816.8 8889 Corporate equities 1007.1 613.1 1457.9 620.2 -5119.6 2162.3 1418.1 -531.3 1538.1 3171.1 8990 Mutual fund shares 139.0 294.5 308.2 103.2 -973.3 513.3 286.8 -55.9 337.4 655.6 9091 U.S. direct investment abroad 50.6 30.7 35.7 45.8 10.8 54.2 40.7 -45.5 34.5 -10.0 91
92 Liabilities 1167.0 890.2 1850.1 -530.5 -6514.1 2225.9 1615.1 -829.2 1944.1 3911.7 9293 Corporate equity issues 459.1 262.4 716.1 -985.4 -2366.0 386.8 525.9 -388.8 692.3 1370.8 9394 Mutual fund shares 483.8 352.4 682.6 396.0 -2424.7 1035.6 582.2 -340.4 720.2 1579.9 9495 Foreign direct investment in the United States 4.0 9.4 22.5 -56.7 -157.6 17.9 34.1 28.9 12.5 -48.2 9596 Equity in noncorporate business 2.4 1.7 4.8 -0.6 -13.6 3.6 0.3 -1.2 -1.3 4.2 9697 Pension fund reserves 217.7 264.2 424.0 116.1 -1552.2 782.7 474.6 -127.3 520.5 1005.0 9798 Investment by parent 0.0 0.0 0.0 0.0 0.0 -0.6 -2.0 -0.3 -0.1 0.0 98
99 Changes in net worth due to nominal holding gains/losses 80.7 104.8 2.8 1313.2 472.0 439.9 122.0 230.8 -22.2 -71.5 99
Changes in balance sheet account
100 Change in net worth (lines 30+33+80+99) -253.3 186.5 -355.6 1193.3 1635.4 -328.8 -492.3 293.2 -314.8 -973.4 100
Balance sheet account (end of period)
101 Total assets 53012.4 57468.5 63336.5 69523.7 68918.7 69914.1 70997.1 72589.4 76743.1 82657.4 101
102 Nonfinancial assets (4) 1213.4 1306.8 1397.8 1466.3 1538.9 1477.8 1469.8 1507.0 1537.2 1584.2 102103 Structures (nonresidential) 684.4 751.8 813.8 853.5 911.8 869.3 860.5 878.9 881.4 899.2 103104 Equipment 424.7 445.4 468.8 487.9 492.6 464.2 465.4 479.1 498.3 519.0 104105 Intellectual property products 104.3 109.5 115.1 125.0 134.6 144.3 143.9 149.0 157.6 166.1 105
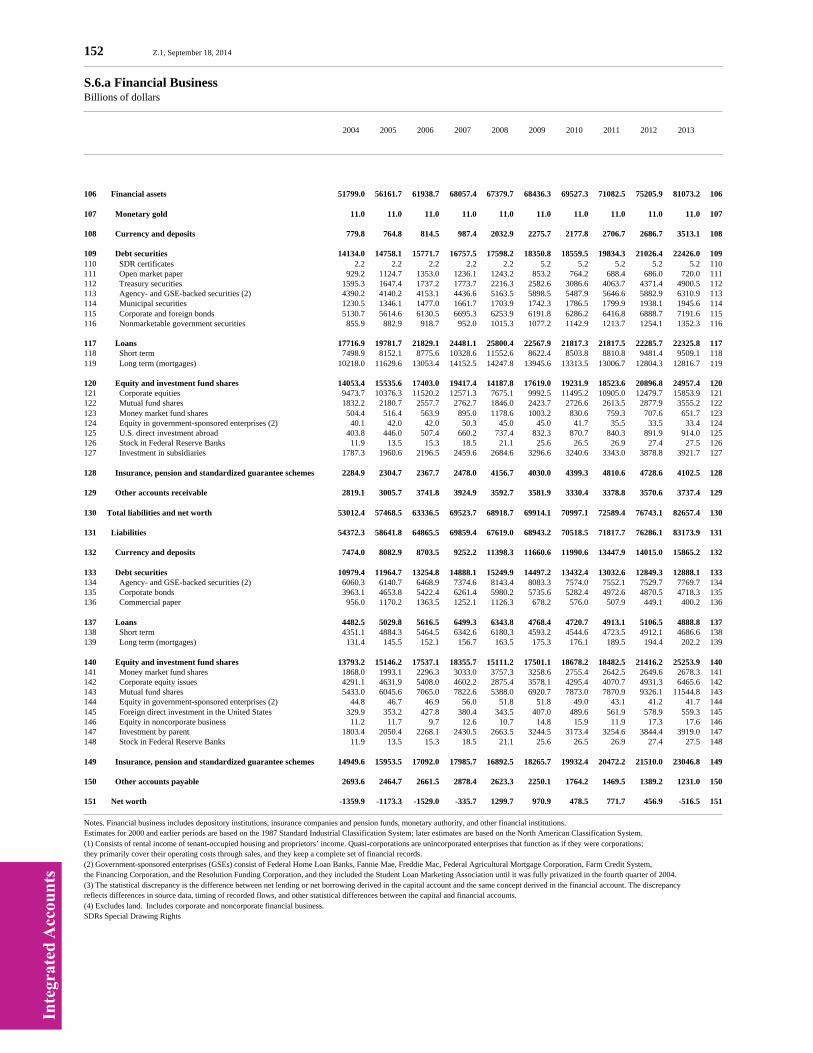
Inte
grat
ed A
ccou
nts
152 Z.1, September 18, 2014
S.6.a Financial BusinessBillions of dollars
2004 2005 2006 2007 2008 2009 2010 2011 2012 2013
106 Financial assets 51799.0 56161.7 61938.7 68057.4 67379.7 68436.3 69527.3 71082.5 75205.9 81073.2 106
107 Monetary gold 11.0 11.0 11.0 11.0 11.0 11.0 11.0 11.0 11.0 11.0 107
108 Currency and deposits 779.8 764.8 814.5 987.4 2032.9 2275.7 2177.8 2706.7 2686.7 3513.1 108
109 Debt securities 14134.0 14758.1 15771.7 16757.5 17598.2 18350.8 18559.5 19834.3 21026.4 22426.0 109110 SDR certificates 2.2 2.2 2.2 2.2 2.2 5.2 5.2 5.2 5.2 5.2 110111 Open market paper 929.2 1124.7 1353.0 1236.1 1243.2 853.2 764.2 688.4 686.0 720.0 111112 Treasury securities 1595.3 1647.4 1737.2 1773.7 2216.3 2582.6 3086.6 4063.7 4371.4 4900.5 112113 Agency- and GSE-backed securities (2) 4390.2 4140.2 4153.1 4436.6 5163.5 5898.5 5487.9 5646.6 5882.9 6310.9 113114 Municipal securities 1230.5 1346.1 1477.0 1661.7 1703.9 1742.3 1786.5 1799.9 1938.1 1945.6 114115 Corporate and foreign bonds 5130.7 5614.6 6130.5 6695.3 6253.9 6191.8 6286.2 6416.8 6888.7 7191.6 115116 Nonmarketable government securities 855.9 882.9 918.7 952.0 1015.3 1077.2 1142.9 1213.7 1254.1 1352.3 116
117 Loans 17716.9 19781.7 21829.1 24481.1 25800.4 22567.9 21817.3 21817.5 22285.7 22325.8 117118 Short term 7498.9 8152.1 8775.6 10328.6 11552.6 8622.4 8503.8 8810.8 9481.4 9509.1 118119 Long term (mortgages) 10218.0 11629.6 13053.4 14152.5 14247.8 13945.6 13313.5 13006.7 12804.3 12816.7 119
120 Equity and investment fund shares 14053.4 15535.6 17403.0 19417.4 14187.8 17619.0 19231.9 18523.6 20896.8 24957.4 120121 Corporate equities 9473.7 10376.3 11520.2 12571.3 7675.1 9992.5 11495.2 10905.0 12479.7 15853.9 121122 Mutual fund shares 1832.2 2180.7 2557.7 2762.7 1846.0 2423.7 2726.6 2613.5 2877.9 3555.2 122123 Money market fund shares 504.4 516.4 563.9 895.0 1178.6 1003.2 830.6 759.3 707.6 651.7 123124 Equity in government-sponsored enterprises (2) 40.1 42.0 42.0 50.3 45.0 45.0 41.7 35.5 33.5 33.4 124125 U.S. direct investment abroad 403.8 446.0 507.4 660.2 737.4 832.3 870.7 840.3 891.9 914.0 125126 Stock in Federal Reserve Banks 11.9 13.5 15.3 18.5 21.1 25.6 26.5 26.9 27.4 27.5 126127 Investment in subsidiaries 1787.3 1960.6 2196.5 2459.6 2684.6 3296.6 3240.6 3343.0 3878.8 3921.7 127
128 Insurance, pension and standardized guarantee schemes 2284.9 2304.7 2367.7 2478.0 4156.7 4030.0 4399.3 4810.6 4728.6 4102.5 128
129 Other accounts receivable 2819.1 3005.7 3741.8 3924.9 3592.7 3581.9 3330.4 3378.8 3570.6 3737.4 129
130 Total liabilities and net worth 53012.4 57468.5 63336.5 69523.7 68918.7 69914.1 70997.1 72589.4 76743.1 82657.4 130
131 Liabilities 54372.3 58641.8 64865.5 69859.4 67619.0 68943.2 70518.5 71817.7 76286.1 83173.9 131
132 Currency and deposits 7474.0 8082.9 8703.5 9252.2 11398.3 11660.6 11990.6 13447.9 14015.0 15865.2 132
133 Debt securities 10979.4 11964.7 13254.8 14888.1 15249.9 14497.2 13432.4 13032.6 12849.3 12888.1 133134 Agency- and GSE-backed securities (2) 6060.3 6140.7 6468.9 7374.6 8143.4 8083.3 7574.0 7552.1 7529.7 7769.7 134135 Corporate bonds 3963.1 4653.8 5422.4 6261.4 5980.2 5735.6 5282.4 4972.6 4870.5 4718.3 135136 Commercial paper 956.0 1170.2 1363.5 1252.1 1126.3 678.2 576.0 507.9 449.1 400.2 136
137 Loans 4482.5 5029.8 5616.5 6499.3 6343.8 4768.4 4720.7 4913.1 5106.5 4888.8 137138 Short term 4351.1 4884.3 5464.5 6342.6 6180.3 4593.2 4544.6 4723.5 4912.1 4686.6 138139 Long term (mortgages) 131.4 145.5 152.1 156.7 163.5 175.3 176.1 189.5 194.4 202.2 139
140 Equity and investment fund shares 13793.2 15146.2 17537.1 18355.7 15111.2 17501.1 18678.2 18482.5 21416.2 25253.9 140141 Money market fund shares 1868.0 1993.1 2296.3 3033.0 3757.3 3258.6 2755.4 2642.5 2649.6 2678.3 141142 Corporate equity issues 4291.1 4631.9 5408.0 4602.2 2875.4 3578.1 4295.4 4070.7 4931.3 6465.6 142143 Mutual fund shares 5433.0 6045.6 7065.0 7822.6 5388.0 6920.7 7873.0 7870.9 9326.1 11544.8 143144 Equity in government-sponsored enterprises (2) 44.8 46.7 46.9 56.0 51.8 51.8 49.0 43.1 41.2 41.7 144145 Foreign direct investment in the United States 329.9 353.2 427.8 380.4 343.5 407.0 489.6 561.9 578.9 559.3 145146 Equity in noncorporate business 11.2 11.7 9.7 12.6 10.7 14.8 15.9 11.9 17.3 17.6 146147 Investment by parent 1803.4 2050.4 2268.1 2430.5 2663.5 3244.5 3173.4 3254.6 3844.4 3919.0 147148 Stock in Federal Reserve Banks 11.9 13.5 15.3 18.5 21.1 25.6 26.5 26.9 27.4 27.5 148
149 Insurance, pension and standardized guarantee schemes 14949.6 15953.5 17092.0 17985.7 16892.5 18265.7 19932.4 20472.2 21510.0 23046.8 149
150 Other accounts payable 2693.6 2464.7 2661.5 2878.4 2623.3 2250.1 1764.2 1469.5 1389.2 1231.0 150
151 Net worth -1359.9 -1173.3 -1529.0 -335.7 1299.7 970.9 478.5 771.7 456.9 -516.5 151
Notes. Financial business includes depository institutions, insurance companies and pension funds, monetary authority, and other financial institutions.Estimates for 2000 and earlier periods are based on the 1987 Standard Industrial Classification System; later estimates are based on the North American Classification System.(1) Consists of rental income of tenant-occupied housing and proprietors’ income. Quasi-corporations are unincorporated enterprises that function as if they were corporations;they primarily cover their operating costs through sales, and they keep a complete set of financial records.(2) Government-sponsored enterprises (GSEs) consist of Federal Home Loan Banks, Fannie Mae, Freddie Mac, Federal Agricultural Mortgage Corporation, Farm Credit System,the Financing Corporation, and the Resolution Funding Corporation, and they included the Student Loan Marketing Association until it was fully privatized in the fourth quarter of 2004.(3) The statistical discrepancy is the difference between net lending or net borrowing derived in the capital account and the same concept derived in the financial account. The discrepancyreflects differences in source data, timing of recorded flows, and other statistical differences between the capital and financial accounts.(4) Excludes land. Includes corporate and noncorporate financial business.SDRs Special Drawing Rights
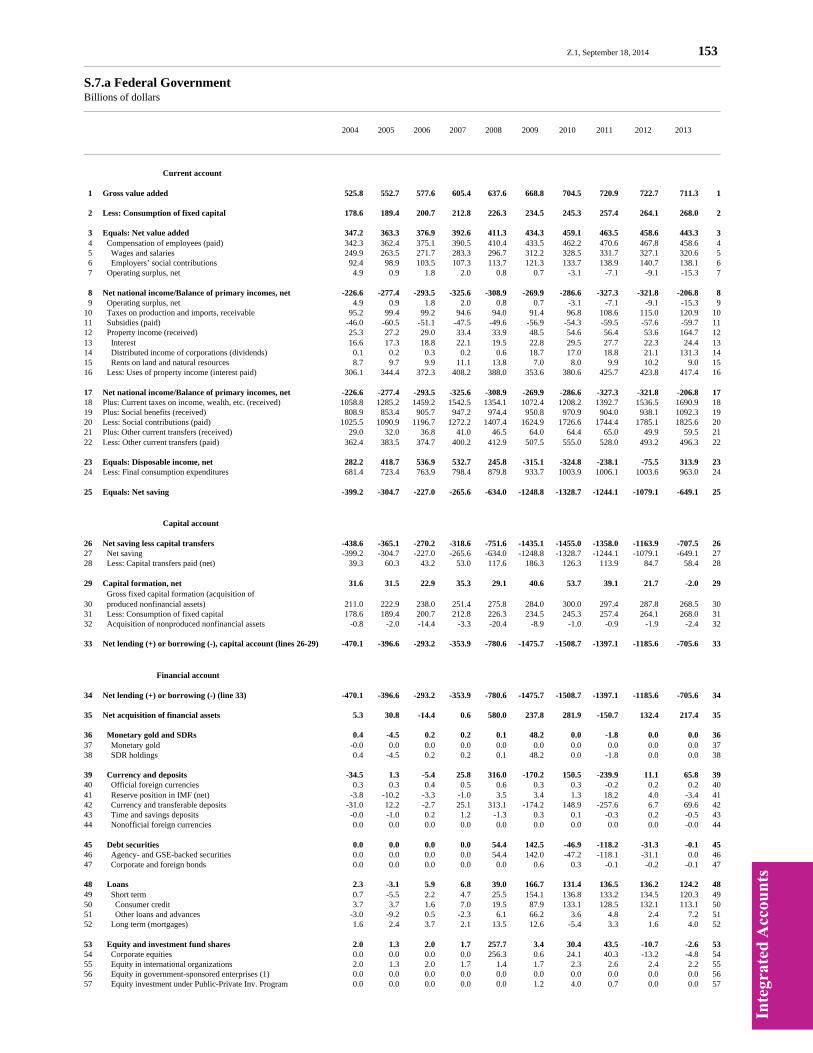
Inte
grat
ed A
ccou
nts
Z.1, September 18, 2014 153
S.7.a Federal GovernmentBillions of dollars
2004 2005 2006 2007 2008 2009 2010 2011 2012 2013
Current account
1 Gross value added 525.8 552.7 577.6 605.4 637.6 668.8 704.5 720.9 722.7 711.3 1
2 Less: Consumption of fixed capital 178.6 189.4 200.7 212.8 226.3 234.5 245.3 257.4 264.1 268.0 2
3 Equals: Net value added 347.2 363.3 376.9 392.6 411.3 434.3 459.1 463.5 458.6 443.3 3 4 Compensation of employees (paid) 342.3 362.4 375.1 390.5 410.4 433.5 462.2 470.6 467.8 458.6 4 5 Wages and salaries 249.9 263.5 271.7 283.3 296.7 312.2 328.5 331.7 327.1 320.6 5 6 Employers’ social contributions 92.4 98.9 103.5 107.3 113.7 121.3 133.7 138.9 140.7 138.1 6 7 Operating surplus, net 4.9 0.9 1.8 2.0 0.8 0.7 -3.1 -7.1 -9.1 -15.3 7
8 Net national income/Balance of primary incomes, net -226.6 -277.4 -293.5 -325.6 -308.9 -269.9 -286.6 -327.3 -321.8 -206.8 8 9 Operating surplus, net 4.9 0.9 1.8 2.0 0.8 0.7 -3.1 -7.1 -9.1 -15.3 910 Taxes on production and imports, receivable 95.2 99.4 99.2 94.6 94.0 91.4 96.8 108.6 115.0 120.9 1011 Subsidies (paid) -46.0 -60.5 -51.1 -47.5 -49.6 -56.9 -54.3 -59.5 -57.6 -59.7 1112 Property income (received) 25.3 27.2 29.0 33.4 33.9 48.5 54.6 56.4 53.6 164.7 1213 Interest 16.6 17.3 18.8 22.1 19.5 22.8 29.5 27.7 22.3 24.4 1314 Distributed income of corporations (dividends) 0.1 0.2 0.3 0.2 0.6 18.7 17.0 18.8 21.1 131.3 1415 Rents on land and natural resources 8.7 9.7 9.9 11.1 13.8 7.0 8.0 9.9 10.2 9.0 1516 Less: Uses of property income (interest paid) 306.1 344.4 372.3 408.2 388.0 353.6 380.6 425.7 423.8 417.4 16
17 Net national income/Balance of primary incomes, net -226.6 -277.4 -293.5 -325.6 -308.9 -269.9 -286.6 -327.3 -321.8 -206.8 1718 Plus: Current taxes on income, wealth, etc. (received) 1058.8 1285.2 1459.2 1542.5 1354.1 1072.4 1208.2 1392.7 1536.5 1690.9 1819 Plus: Social benefits (received) 808.9 853.4 905.7 947.2 974.4 950.8 970.9 904.0 938.1 1092.3 1920 Less: Social contributions (paid) 1025.5 1090.9 1196.7 1272.2 1407.4 1624.9 1726.6 1744.4 1785.1 1825.6 2021 Plus: Other current transfers (received) 29.0 32.0 36.8 41.0 46.5 64.0 64.4 65.0 49.9 59.5 2122 Less: Other current transfers (paid) 362.4 383.5 374.7 400.2 412.9 507.5 555.0 528.0 493.2 496.3 22
23 Equals: Disposable income, net 282.2 418.7 536.9 532.7 245.8 -315.1 -324.8 -238.1 -75.5 313.9 2324 Less: Final consumption expenditures 681.4 723.4 763.9 798.4 879.8 933.7 1003.9 1006.1 1003.6 963.0 24
25 Equals: Net saving -399.2 -304.7 -227.0 -265.6 -634.0 -1248.8 -1328.7 -1244.1 -1079.1 -649.1 25
Capital account
26 Net saving less capital transfers -438.6 -365.1 -270.2 -318.6 -751.6 -1435.1 -1455.0 -1358.0 -1163.9 -707.5 2627 Net saving -399.2 -304.7 -227.0 -265.6 -634.0 -1248.8 -1328.7 -1244.1 -1079.1 -649.1 2728 Less: Capital transfers paid (net) 39.3 60.3 43.2 53.0 117.6 186.3 126.3 113.9 84.7 58.4 28
29 Capital formation, net 31.6 31.5 22.9 35.3 29.1 40.6 53.7 39.1 21.7 -2.0 29 Gross fixed capital formation (acquisition of30 produced nonfinancial assets) 211.0 222.9 238.0 251.4 275.8 284.0 300.0 297.4 287.8 268.5 3031 Less: Consumption of fixed capital 178.6 189.4 200.7 212.8 226.3 234.5 245.3 257.4 264.1 268.0 3132 Acquisition of nonproduced nonfinancial assets -0.8 -2.0 -14.4 -3.3 -20.4 -8.9 -1.0 -0.9 -1.9 -2.4 32
33 Net lending (+) or borrowing (-), capital account (lines 26-29) -470.1 -396.6 -293.2 -353.9 -780.6 -1475.7 -1508.7 -1397.1 -1185.6 -705.6 33
Financial account
34 Net lending (+) or borrowing (-) (line 33) -470.1 -396.6 -293.2 -353.9 -780.6 -1475.7 -1508.7 -1397.1 -1185.6 -705.6 34
35 Net acquisition of financial assets 5.3 30.8 -14.4 0.6 580.0 237.8 281.9 -150.7 132.4 217.4 35
36 Monetary gold and SDRs 0.4 -4.5 0.2 0.2 0.1 48.2 0.0 -1.8 0.0 0.0 3637 Monetary gold -0.0 0.0 0.0 0.0 0.0 0.0 0.0 0.0 0.0 0.0 3738 SDR holdings 0.4 -4.5 0.2 0.2 0.1 48.2 0.0 -1.8 0.0 0.0 38
39 Currency and deposits -34.5 1.3 -5.4 25.8 316.0 -170.2 150.5 -239.9 11.1 65.8 3940 Official foreign currencies 0.3 0.3 0.4 0.5 0.6 0.3 0.3 -0.2 0.2 0.2 4041 Reserve position in IMF (net) -3.8 -10.2 -3.3 -1.0 3.5 3.4 1.3 18.2 4.0 -3.4 4142 Currency and transferable deposits -31.0 12.2 -2.7 25.1 313.1 -174.2 148.9 -257.6 6.7 69.6 4243 Time and savings deposits -0.0 -1.0 0.2 1.2 -1.3 0.3 0.1 -0.3 0.2 -0.5 4344 Nonofficial foreign currencies 0.0 0.0 0.0 0.0 0.0 0.0 0.0 0.0 0.0 -0.0 44
45 Debt securities 0.0 0.0 0.0 0.0 54.4 142.5 -46.9 -118.2 -31.3 -0.1 4546 Agency- and GSE-backed securities 0.0 0.0 0.0 0.0 54.4 142.0 -47.2 -118.1 -31.1 0.0 4647 Corporate and foreign bonds 0.0 0.0 0.0 0.0 0.0 0.6 0.3 -0.1 -0.2 -0.1 47
48 Loans 2.3 -3.1 5.9 6.8 39.0 166.7 131.4 136.5 136.2 124.2 4849 Short term 0.7 -5.5 2.2 4.7 25.5 154.1 136.8 133.2 134.5 120.3 4950 Consumer credit 3.7 3.7 1.6 7.0 19.5 87.9 133.1 128.5 132.1 113.1 5051 Other loans and advances -3.0 -9.2 0.5 -2.3 6.1 66.2 3.6 4.8 2.4 7.2 5152 Long term (mortgages) 1.6 2.4 3.7 2.1 13.5 12.6 -5.4 3.3 1.6 4.0 52
53 Equity and investment fund shares 2.0 1.3 2.0 1.7 257.7 3.4 30.4 43.5 -10.7 -2.6 5354 Corporate equities 0.0 0.0 0.0 0.0 256.3 0.6 24.1 40.3 -13.2 -4.8 5455 Equity in international organizations 2.0 1.3 2.0 1.7 1.4 1.7 2.3 2.6 2.4 2.2 5556 Equity in government-sponsored enterprises (1) 0.0 0.0 0.0 0.0 0.0 0.0 0.0 0.0 0.0 0.0 5657 Equity investment under Public-Private Inv. Program 0.0 0.0 0.0 0.0 0.0 1.2 4.0 0.7 0.0 0.0 57
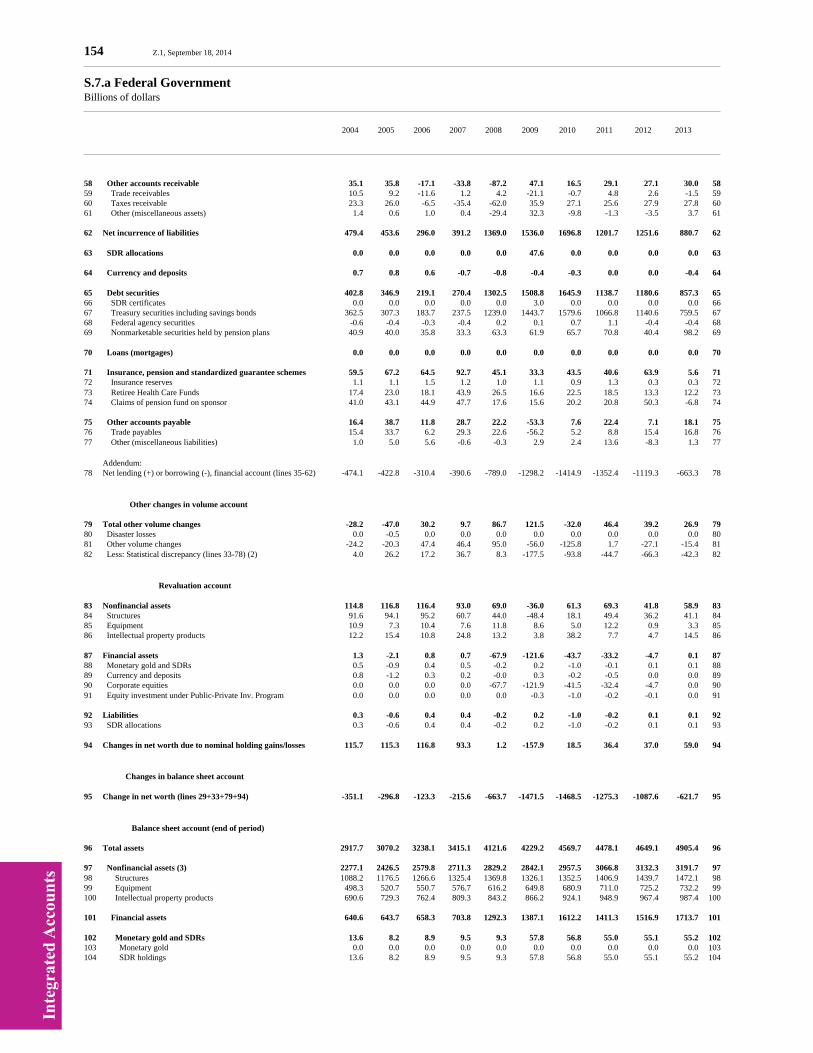
Inte
grat
ed A
ccou
nts
154 Z.1, September 18, 2014
S.7.a Federal GovernmentBillions of dollars
2004 2005 2006 2007 2008 2009 2010 2011 2012 2013
58 Other accounts receivable 35.1 35.8 -17.1 -33.8 -87.2 47.1 16.5 29.1 27.1 30.0 5859 Trade receivables 10.5 9.2 -11.6 1.2 4.2 -21.1 -0.7 4.8 2.6 -1.5 5960 Taxes receivable 23.3 26.0 -6.5 -35.4 -62.0 35.9 27.1 25.6 27.9 27.8 6061 Other (miscellaneous assets) 1.4 0.6 1.0 0.4 -29.4 32.3 -9.8 -1.3 -3.5 3.7 61
62 Net incurrence of liabilities 479.4 453.6 296.0 391.2 1369.0 1536.0 1696.8 1201.7 1251.6 880.7 62
63 SDR allocations 0.0 0.0 0.0 0.0 0.0 47.6 0.0 0.0 0.0 0.0 63
64 Currency and deposits 0.7 0.8 0.6 -0.7 -0.8 -0.4 -0.3 0.0 0.0 -0.4 64
65 Debt securities 402.8 346.9 219.1 270.4 1302.5 1508.8 1645.9 1138.7 1180.6 857.3 6566 SDR certificates 0.0 0.0 0.0 0.0 0.0 3.0 0.0 0.0 0.0 0.0 6667 Treasury securities including savings bonds 362.5 307.3 183.7 237.5 1239.0 1443.7 1579.6 1066.8 1140.6 759.5 6768 Federal agency securities -0.6 -0.4 -0.3 -0.4 0.2 0.1 0.7 1.1 -0.4 -0.4 6869 Nonmarketable securities held by pension plans 40.9 40.0 35.8 33.3 63.3 61.9 65.7 70.8 40.4 98.2 69
70 Loans (mortgages) 0.0 0.0 0.0 0.0 0.0 0.0 0.0 0.0 0.0 0.0 70
71 Insurance, pension and standardized guarantee schemes 59.5 67.2 64.5 92.7 45.1 33.3 43.5 40.6 63.9 5.6 7172 Insurance reserves 1.1 1.1 1.5 1.2 1.0 1.1 0.9 1.3 0.3 0.3 7273 Retiree Health Care Funds 17.4 23.0 18.1 43.9 26.5 16.6 22.5 18.5 13.3 12.2 7374 Claims of pension fund on sponsor 41.0 43.1 44.9 47.7 17.6 15.6 20.2 20.8 50.3 -6.8 74
75 Other accounts payable 16.4 38.7 11.8 28.7 22.2 -53.3 7.6 22.4 7.1 18.1 7576 Trade payables 15.4 33.7 6.2 29.3 22.6 -56.2 5.2 8.8 15.4 16.8 7677 Other (miscellaneous liabilities) 1.0 5.0 5.6 -0.6 -0.3 2.9 2.4 13.6 -8.3 1.3 77
Addendum:78 Net lending (+) or borrowing (-), financial account (lines 35-62) -474.1 -422.8 -310.4 -390.6 -789.0 -1298.2 -1414.9 -1352.4 -1119.3 -663.3 78
Other changes in volume account
79 Total other volume changes -28.2 -47.0 30.2 9.7 86.7 121.5 -32.0 46.4 39.2 26.9 7980 Disaster losses 0.0 -0.5 0.0 0.0 0.0 0.0 0.0 0.0 0.0 0.0 8081 Other volume changes -24.2 -20.3 47.4 46.4 95.0 -56.0 -125.8 1.7 -27.1 -15.4 8182 Less: Statistical discrepancy (lines 33-78) (2) 4.0 26.2 17.2 36.7 8.3 -177.5 -93.8 -44.7 -66.3 -42.3 82
Revaluation account
83 Nonfinancial assets 114.8 116.8 116.4 93.0 69.0 -36.0 61.3 69.3 41.8 58.9 8384 Structures 91.6 94.1 95.2 60.7 44.0 -48.4 18.1 49.4 36.2 41.1 8485 Equipment 10.9 7.3 10.4 7.6 11.8 8.6 5.0 12.2 0.9 3.3 8586 Intellectual property products 12.2 15.4 10.8 24.8 13.2 3.8 38.2 7.7 4.7 14.5 86
87 Financial assets 1.3 -2.1 0.8 0.7 -67.9 -121.6 -43.7 -33.2 -4.7 0.1 8788 Monetary gold and SDRs 0.5 -0.9 0.4 0.5 -0.2 0.2 -1.0 -0.1 0.1 0.1 8889 Currency and deposits 0.8 -1.2 0.3 0.2 -0.0 0.3 -0.2 -0.5 0.0 0.0 8990 Corporate equities 0.0 0.0 0.0 0.0 -67.7 -121.9 -41.5 -32.4 -4.7 0.0 9091 Equity investment under Public-Private Inv. Program 0.0 0.0 0.0 0.0 0.0 -0.3 -1.0 -0.2 -0.1 0.0 91
92 Liabilities 0.3 -0.6 0.4 0.4 -0.2 0.2 -1.0 -0.2 0.1 0.1 9293 SDR allocations 0.3 -0.6 0.4 0.4 -0.2 0.2 -1.0 -0.2 0.1 0.1 93
94 Changes in net worth due to nominal holding gains/losses 115.7 115.3 116.8 93.3 1.2 -157.9 18.5 36.4 37.0 59.0 94
Changes in balance sheet account
95 Change in net worth (lines 29+33+79+94) -351.1 -296.8 -123.3 -215.6 -663.7 -1471.5 -1468.5 -1275.3 -1087.6 -621.7 95
Balance sheet account (end of period)
96 Total assets 2917.7 3070.2 3238.1 3415.1 4121.6 4229.2 4569.7 4478.1 4649.1 4905.4 96
97 Nonfinancial assets (3) 2277.1 2426.5 2579.8 2711.3 2829.2 2842.1 2957.5 3066.8 3132.3 3191.7 9798 Structures 1088.2 1176.5 1266.6 1325.4 1369.8 1326.1 1352.5 1406.9 1439.7 1472.1 9899 Equipment 498.3 520.7 550.7 576.7 616.2 649.8 680.9 711.0 725.2 732.2 99100 Intellectual property products 690.6 729.3 762.4 809.3 843.2 866.2 924.1 948.9 967.4 987.4 100
101 Financial assets 640.6 643.7 658.3 703.8 1292.3 1387.1 1612.2 1411.3 1516.9 1713.7 101
102 Monetary gold and SDRs 13.6 8.2 8.9 9.5 9.3 57.8 56.8 55.0 55.1 55.2 102103 Monetary gold 0.0 0.0 0.0 0.0 0.0 0.0 0.0 0.0 0.0 0.0 103104 SDR holdings 13.6 8.2 8.9 9.5 9.3 57.8 56.8 55.0 55.1 55.2 104
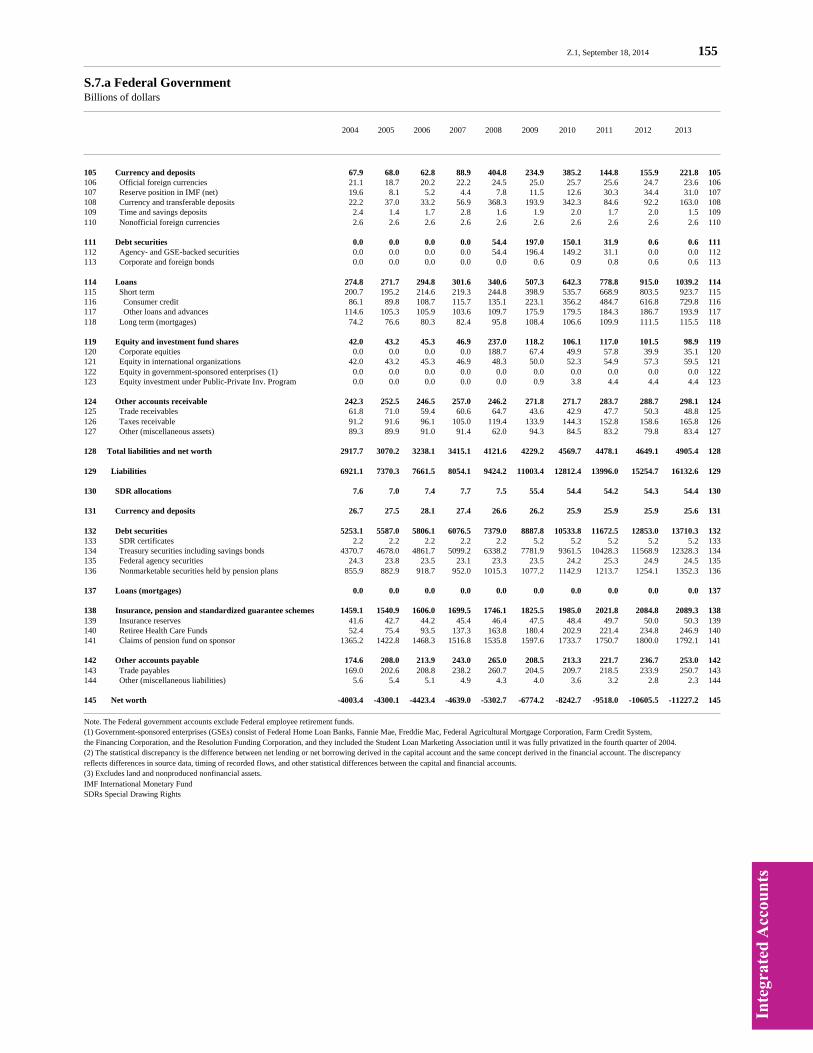
Inte
grat
ed A
ccou
nts
Z.1, September 18, 2014 155
S.7.a Federal GovernmentBillions of dollars
2004 2005 2006 2007 2008 2009 2010 2011 2012 2013
105 Currency and deposits 67.9 68.0 62.8 88.9 404.8 234.9 385.2 144.8 155.9 221.8 105106 Official foreign currencies 21.1 18.7 20.2 22.2 24.5 25.0 25.7 25.6 24.7 23.6 106107 Reserve position in IMF (net) 19.6 8.1 5.2 4.4 7.8 11.5 12.6 30.3 34.4 31.0 107108 Currency and transferable deposits 22.2 37.0 33.2 56.9 368.3 193.9 342.3 84.6 92.2 163.0 108109 Time and savings deposits 2.4 1.4 1.7 2.8 1.6 1.9 2.0 1.7 2.0 1.5 109110 Nonofficial foreign currencies 2.6 2.6 2.6 2.6 2.6 2.6 2.6 2.6 2.6 2.6 110
111 Debt securities 0.0 0.0 0.0 0.0 54.4 197.0 150.1 31.9 0.6 0.6 111112 Agency- and GSE-backed securities 0.0 0.0 0.0 0.0 54.4 196.4 149.2 31.1 0.0 0.0 112113 Corporate and foreign bonds 0.0 0.0 0.0 0.0 0.0 0.6 0.9 0.8 0.6 0.6 113
114 Loans 274.8 271.7 294.8 301.6 340.6 507.3 642.3 778.8 915.0 1039.2 114115 Short term 200.7 195.2 214.6 219.3 244.8 398.9 535.7 668.9 803.5 923.7 115116 Consumer credit 86.1 89.8 108.7 115.7 135.1 223.1 356.2 484.7 616.8 729.8 116117 Other loans and advances 114.6 105.3 105.9 103.6 109.7 175.9 179.5 184.3 186.7 193.9 117118 Long term (mortgages) 74.2 76.6 80.3 82.4 95.8 108.4 106.6 109.9 111.5 115.5 118
119 Equity and investment fund shares 42.0 43.2 45.3 46.9 237.0 118.2 106.1 117.0 101.5 98.9 119120 Corporate equities 0.0 0.0 0.0 0.0 188.7 67.4 49.9 57.8 39.9 35.1 120121 Equity in international organizations 42.0 43.2 45.3 46.9 48.3 50.0 52.3 54.9 57.3 59.5 121122 Equity in government-sponsored enterprises (1) 0.0 0.0 0.0 0.0 0.0 0.0 0.0 0.0 0.0 0.0 122123 Equity investment under Public-Private Inv. Program 0.0 0.0 0.0 0.0 0.0 0.9 3.8 4.4 4.4 4.4 123
124 Other accounts receivable 242.3 252.5 246.5 257.0 246.2 271.8 271.7 283.7 288.7 298.1 124125 Trade receivables 61.8 71.0 59.4 60.6 64.7 43.6 42.9 47.7 50.3 48.8 125126 Taxes receivable 91.2 91.6 96.1 105.0 119.4 133.9 144.3 152.8 158.6 165.8 126127 Other (miscellaneous assets) 89.3 89.9 91.0 91.4 62.0 94.3 84.5 83.2 79.8 83.4 127
128 Total liabilities and net worth 2917.7 3070.2 3238.1 3415.1 4121.6 4229.2 4569.7 4478.1 4649.1 4905.4 128
129 Liabilities 6921.1 7370.3 7661.5 8054.1 9424.2 11003.4 12812.4 13996.0 15254.7 16132.6 129
130 SDR allocations 7.6 7.0 7.4 7.7 7.5 55.4 54.4 54.2 54.3 54.4 130
131 Currency and deposits 26.7 27.5 28.1 27.4 26.6 26.2 25.9 25.9 25.9 25.6 131
132 Debt securities 5253.1 5587.0 5806.1 6076.5 7379.0 8887.8 10533.8 11672.5 12853.0 13710.3 132133 SDR certificates 2.2 2.2 2.2 2.2 2.2 5.2 5.2 5.2 5.2 5.2 133134 Treasury securities including savings bonds 4370.7 4678.0 4861.7 5099.2 6338.2 7781.9 9361.5 10428.3 11568.9 12328.3 134135 Federal agency securities 24.3 23.8 23.5 23.1 23.3 23.5 24.2 25.3 24.9 24.5 135136 Nonmarketable securities held by pension plans 855.9 882.9 918.7 952.0 1015.3 1077.2 1142.9 1213.7 1254.1 1352.3 136
137 Loans (mortgages) 0.0 0.0 0.0 0.0 0.0 0.0 0.0 0.0 0.0 0.0 137
138 Insurance, pension and standardized guarantee schemes 1459.1 1540.9 1606.0 1699.5 1746.1 1825.5 1985.0 2021.8 2084.8 2089.3 138139 Insurance reserves 41.6 42.7 44.2 45.4 46.4 47.5 48.4 49.7 50.0 50.3 139140 Retiree Health Care Funds 52.4 75.4 93.5 137.3 163.8 180.4 202.9 221.4 234.8 246.9 140141 Claims of pension fund on sponsor 1365.2 1422.8 1468.3 1516.8 1535.8 1597.6 1733.7 1750.7 1800.0 1792.1 141
142 Other accounts payable 174.6 208.0 213.9 243.0 265.0 208.5 213.3 221.7 236.7 253.0 142143 Trade payables 169.0 202.6 208.8 238.2 260.7 204.5 209.7 218.5 233.9 250.7 143144 Other (miscellaneous liabilities) 5.6 5.4 5.1 4.9 4.3 4.0 3.6 3.2 2.8 2.3 144
145 Net worth -4003.4 -4300.1 -4423.4 -4639.0 -5302.7 -6774.2 -8242.7 -9518.0 -10605.5 -11227.2 145
Note. The Federal government accounts exclude Federal employee retirement funds.(1) Government-sponsored enterprises (GSEs) consist of Federal Home Loan Banks, Fannie Mae, Freddie Mac, Federal Agricultural Mortgage Corporation, Farm Credit System,the Financing Corporation, and the Resolution Funding Corporation, and they included the Student Loan Marketing Association until it was fully privatized in the fourth quarter of 2004.(2) The statistical discrepancy is the difference between net lending or net borrowing derived in the capital account and the same concept derived in the financial account. The discrepancyreflects differences in source data, timing of recorded flows, and other statistical differences between the capital and financial accounts.(3) Excludes land and nonproduced nonfinancial assets.IMF International Monetary FundSDRs Special Drawing Rights

Inte
grat
ed A
ccou
nts
156 Z.1, September 18, 2014
S.8.a State and Local GovernmentsBillions of dollars
2004 2005 2006 2007 2008 2009 2010 2011 2012 2013
Current account
1 Gross value added 1137.7 1191.7 1250.3 1318.5 1385.2 1419.4 1454.2 1471.4 1491.0 1524.8 1
2 Less: Consumption of fixed capital 143.8 157.3 170.3 186.6 200.2 208.2 212.7 222.2 231.8 238.4 2
3 Equals: Net value added 993.9 1034.4 1080.0 1131.9 1185.0 1211.3 1241.5 1249.2 1259.1 1286.4 3 4 Compensation of employees (paid) 1000.6 1041.8 1091.1 1150.4 1207.1 1232.6 1261.3 1266.5 1275.3 1300.7 4 5 Wages and salaries 702.7 728.0 763.3 805.6 847.4 862.9 862.6 863.1 871.2 887.5 5 6 Employers’ social contributions 297.9 313.7 327.8 344.9 359.7 369.7 398.7 403.5 404.1 413.2 6 7 Operating surplus, net -6.7 -7.3 -11.1 -18.5 -22.0 -21.4 -19.8 -17.4 -16.2 -14.3 7
8 Net national income/Balance of primary incomes, net 728.0 804.2 868.3 910.7 901.6 811.0 829.5 864.6 872.4 906.2 8 9 Operating surplus, net -6.7 -7.3 -11.1 -18.5 -22.0 -21.4 -19.8 -17.4 -16.2 -14.3 910 Taxes on production and imports, receivable 768.7 835.1 892.7 940.0 947.9 934.8 960.4 994.0 1017.0 1041.6 1011 Subsidies (paid) -0.4 -0.4 -0.4 -7.1 -3.0 -1.4 -1.6 -0.5 -0.5 -0.5 1112 Property income (received) 76.8 88.6 107.2 117.9 105.7 87.8 82.6 79.2 78.6 79.7 1213 Interest 66.4 76.8 94.7 104.2 91.0 74.4 69.1 64.8 63.0 63.2 1314 Distributed income of corporations (dividends) 2.0 2.0 2.1 2.2 2.6 2.1 2.3 2.6 3.4 3.7 1415 Rents on land and natural resources 8.5 9.8 10.4 11.5 12.1 11.2 11.2 11.7 12.3 12.7 1516 Less: Uses of property income (interest paid) 110.5 111.8 120.1 121.5 127.0 188.8 192.1 190.7 206.6 200.3 16
17 Net national income/Balance of primary incomes, net 728.0 804.2 868.3 910.7 901.6 811.0 829.5 864.6 872.4 906.2 1718 Plus: Current taxes on income, wealth, etc. (received) 289.2 331.4 361.7 381.4 381.0 333.4 345.3 374.3 407.8 430.2 1819 Plus: Social benefits (received) 24.7 24.6 21.5 18.9 18.7 18.6 18.1 18.2 17.7 17.7 1920 Less: Social contributions (paid) 385.0 406.6 403.9 433.3 455.4 492.6 523.8 530.4 540.6 565.4 2021 Plus: Other current transfers (received) 422.4 436.4 438.9 460.9 477.8 566.1 612.0 582.1 556.2 570.8 21
22 Equals: Disposable income, net 1079.2 1190.0 1286.5 1338.6 1323.7 1236.4 1281.0 1308.9 1313.6 1359.4 22
23 Less: Final consumption expenditures 1187.6 1256.6 1325.9 1411.4 1488.7 1508.4 1518.3 1524.8 1546.1 1584.5 23
24 Equals: Net saving -108.4 -66.6 -39.4 -72.7 -165.1 -271.9 -237.3 -215.9 -232.6 -225.1 24
Capital account
25 Net saving less capital transfers -60.4 -16.2 18.4 -13.4 -101.8 -204.2 -160.6 -142.1 -158.3 -153.5 2526 Net saving -108.4 -66.6 -39.4 -72.7 -165.1 -271.9 -237.3 -215.9 -232.6 -225.1 2627 Less: Capital transfers paid (net) -48.0 -50.4 -57.8 -59.3 -63.2 -67.7 -76.7 -73.8 -74.2 -71.6 27
28 Capital formation, net 145.0 143.5 155.0 167.9 172.5 167.2 149.7 127.6 108.5 98.4 28 Gross fixed capital formation (acquisition of29 produced nonfinancial assets) 277.5 290.8 314.3 340.8 358.8 363.0 351.9 340.5 331.6 327.8 2930 Less: Consumption of fixed capital 143.8 157.3 170.3 186.6 200.2 208.2 212.7 222.2 231.8 238.4 3031 Acquisition of nonproduced nonfinancial assets 11.3 10.0 11.0 13.6 13.8 12.3 10.6 9.2 8.7 9.0 31
32 Net lending (+) or borrowing (-), capital account (lines 25-28) -205.4 -159.7 -136.6 -181.2 -274.3 -371.4 -310.3 -269.6 -266.9 -252.0 32
Financial account
33 Net lending (+) or borrowing (-) (line 32) -205.4 -159.7 -136.6 -181.2 -274.3 -371.4 -310.3 -269.6 -266.9 -252.0 33
34 Net acquisition of financial assets 172.4 253.9 205.8 240.4 -101.2 17.3 74.9 -13.0 99.3 18.0 34
35 Currency and deposits 4.4 18.7 22.5 32.4 26.1 29.5 -0.2 32.2 10.2 19.1 3536 Currency and transferable deposits -3.5 15.8 5.4 -0.4 8.3 19.6 5.7 16.6 -9.4 6.7 3637 Time and savings deposits 7.9 3.0 17.1 32.8 17.8 10.0 -5.9 15.6 19.6 12.4 37
38 Debt securities 96.3 155.7 110.2 137.0 -90.6 -41.1 53.8 -49.8 44.4 -33.8 3839 Open market paper 2.9 -0.1 -1.4 -2.2 -21.9 -39.0 13.2 -11.1 -5.9 -8.1 3940 Treasury securities 43.3 107.3 58.4 77.8 -46.0 -16.9 7.8 -31.8 46.2 -14.5 4041 Agency- and GSE-backed securities (1) 37.1 35.7 39.1 45.1 -17.7 10.3 23.7 -6.8 -2.3 -13.8 4142 Municipal securities 1.1 1.2 1.4 1.7 0.4 1.0 1.4 0.4 0.5 0.2 4243 Corporate and foreign bonds 11.9 11.5 12.7 14.6 -5.4 3.5 7.8 -0.5 6.0 2.5 43
44 Loans 22.2 20.3 21.9 25.4 -15.9 4.5 12.4 -1.2 16.1 8.3 4445 Short term 7.2 5.7 5.7 6.4 -11.9 -4.1 -1.1 -3.4 6.7 4.2 4546 Long term (mortgages) 15.0 14.6 16.1 19.0 -4.0 8.6 13.5 2.2 9.4 4.2 46
47 Equity and investment fund shares 21.6 21.5 23.8 27.6 -5.5 9.4 17.0 1.6 12.7 6.6 4748 Money market fund shares 12.8 13.6 15.4 18.0 2.8 10.0 14.1 3.7 7.9 4.7 4849 Corporate equities 5.4 4.4 4.5 5.1 -7.7 -2.2 -0.0 -2.5 3.2 1.3 4950 Mutual fund shares 3.5 3.5 3.9 4.5 -0.6 1.7 2.9 0.3 1.6 0.7 50
51 Other accounts receivable 27.9 37.7 27.4 18.1 -15.3 14.9 -8.2 4.3 15.9 17.7 5152 Trade receivables 8.5 17.4 8.9 7.8 -15.4 -4.6 13.1 2.3 5.7 8.4 5253 Taxes receivable 12.9 14.3 12.1 3.0 5.2 -5.8 1.0 2.0 2.0 3.1 5354 Other (miscellaneous assets) 6.5 6.0 6.4 7.3 -5.2 25.3 -22.2 -0.1 8.1 6.2 54
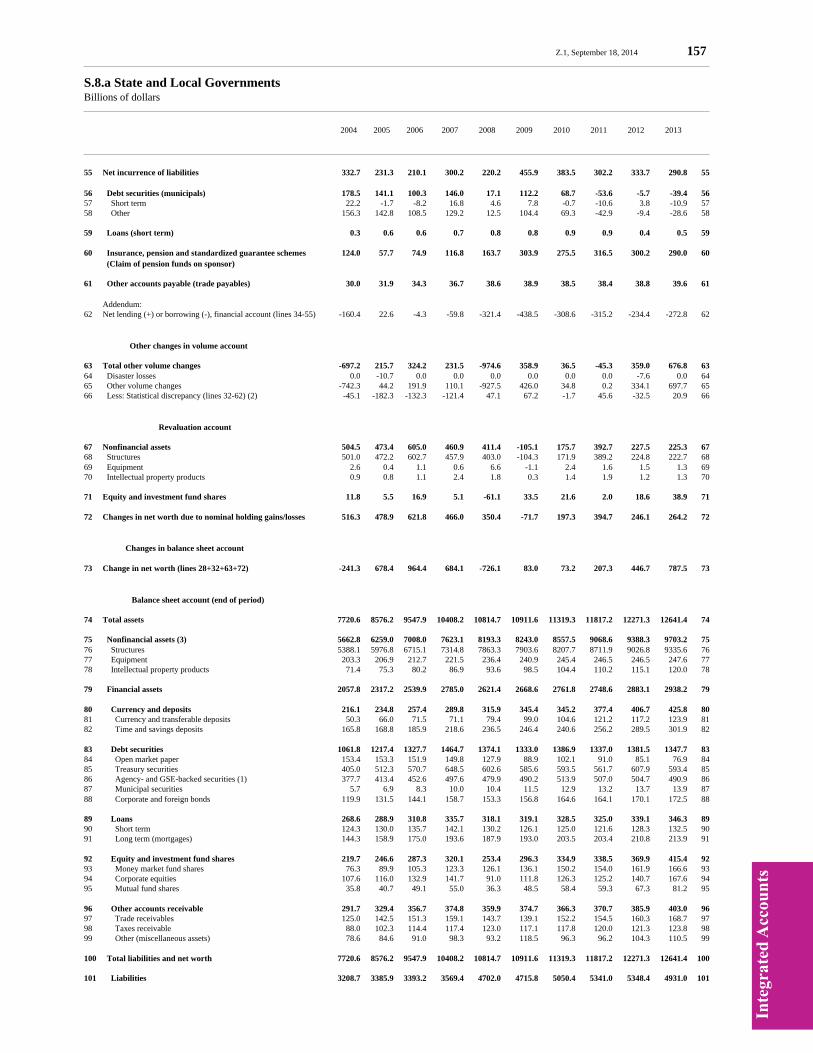
Inte
grat
ed A
ccou
nts
Z.1, September 18, 2014 157
S.8.a State and Local GovernmentsBillions of dollars
2004 2005 2006 2007 2008 2009 2010 2011 2012 2013
55 Net incurrence of liabilities 332.7 231.3 210.1 300.2 220.2 455.9 383.5 302.2 333.7 290.8 55
56 Debt securities (municipals) 178.5 141.1 100.3 146.0 17.1 112.2 68.7 -53.6 -5.7 -39.4 5657 Short term 22.2 -1.7 -8.2 16.8 4.6 7.8 -0.7 -10.6 3.8 -10.9 5758 Other 156.3 142.8 108.5 129.2 12.5 104.4 69.3 -42.9 -9.4 -28.6 58
59 Loans (short term) 0.3 0.6 0.6 0.7 0.8 0.8 0.9 0.9 0.4 0.5 59
60 Insurance, pension and standardized guarantee schemes 124.0 57.7 74.9 116.8 163.7 303.9 275.5 316.5 300.2 290.0 60 (Claim of pension funds on sponsor)
61 Other accounts payable (trade payables) 30.0 31.9 34.3 36.7 38.6 38.9 38.5 38.4 38.8 39.6 61
Addendum:62 Net lending (+) or borrowing (-), financial account (lines 34-55) -160.4 22.6 -4.3 -59.8 -321.4 -438.5 -308.6 -315.2 -234.4 -272.8 62
Other changes in volume account
63 Total other volume changes -697.2 215.7 324.2 231.5 -974.6 358.9 36.5 -45.3 359.0 676.8 6364 Disaster losses 0.0 -10.7 0.0 0.0 0.0 0.0 0.0 0.0 -7.6 0.0 6465 Other volume changes -742.3 44.2 191.9 110.1 -927.5 426.0 34.8 0.2 334.1 697.7 6566 Less: Statistical discrepancy (lines 32-62) (2) -45.1 -182.3 -132.3 -121.4 47.1 67.2 -1.7 45.6 -32.5 20.9 66
Revaluation account
67 Nonfinancial assets 504.5 473.4 605.0 460.9 411.4 -105.1 175.7 392.7 227.5 225.3 6768 Structures 501.0 472.2 602.7 457.9 403.0 -104.3 171.9 389.2 224.8 222.7 6869 Equipment 2.6 0.4 1.1 0.6 6.6 -1.1 2.4 1.6 1.5 1.3 6970 Intellectual property products 0.9 0.8 1.1 2.4 1.8 0.3 1.4 1.9 1.2 1.3 70
71 Equity and investment fund shares 11.8 5.5 16.9 5.1 -61.1 33.5 21.6 2.0 18.6 38.9 71
72 Changes in net worth due to nominal holding gains/losses 516.3 478.9 621.8 466.0 350.4 -71.7 197.3 394.7 246.1 264.2 72
Changes in balance sheet account
73 Change in net worth (lines 28+32+63+72) -241.3 678.4 964.4 684.1 -726.1 83.0 73.2 207.3 446.7 787.5 73
Balance sheet account (end of period)
74 Total assets 7720.6 8576.2 9547.9 10408.2 10814.7 10911.6 11319.3 11817.2 12271.3 12641.4 74
75 Nonfinancial assets (3) 5662.8 6259.0 7008.0 7623.1 8193.3 8243.0 8557.5 9068.6 9388.3 9703.2 7576 Structures 5388.1 5976.8 6715.1 7314.8 7863.3 7903.6 8207.7 8711.9 9026.8 9335.6 7677 Equipment 203.3 206.9 212.7 221.5 236.4 240.9 245.4 246.5 246.5 247.6 7778 Intellectual property products 71.4 75.3 80.2 86.9 93.6 98.5 104.4 110.2 115.1 120.0 78
79 Financial assets 2057.8 2317.2 2539.9 2785.0 2621.4 2668.6 2761.8 2748.6 2883.1 2938.2 79
80 Currency and deposits 216.1 234.8 257.4 289.8 315.9 345.4 345.2 377.4 406.7 425.8 8081 Currency and transferable deposits 50.3 66.0 71.5 71.1 79.4 99.0 104.6 121.2 117.2 123.9 8182 Time and savings deposits 165.8 168.8 185.9 218.6 236.5 246.4 240.6 256.2 289.5 301.9 82
83 Debt securities 1061.8 1217.4 1327.7 1464.7 1374.1 1333.0 1386.9 1337.0 1381.5 1347.7 8384 Open market paper 153.4 153.3 151.9 149.8 127.9 88.9 102.1 91.0 85.1 76.9 8485 Treasury securities 405.0 512.3 570.7 648.5 602.6 585.6 593.5 561.7 607.9 593.4 8586 Agency- and GSE-backed securities (1) 377.7 413.4 452.6 497.6 479.9 490.2 513.9 507.0 504.7 490.9 8687 Municipal securities 5.7 6.9 8.3 10.0 10.4 11.5 12.9 13.2 13.7 13.9 8788 Corporate and foreign bonds 119.9 131.5 144.1 158.7 153.3 156.8 164.6 164.1 170.1 172.5 88
89 Loans 268.6 288.9 310.8 335.7 318.1 319.1 328.5 325.0 339.1 346.3 8990 Short term 124.3 130.0 135.7 142.1 130.2 126.1 125.0 121.6 128.3 132.5 9091 Long term (mortgages) 144.3 158.9 175.0 193.6 187.9 193.0 203.5 203.4 210.8 213.9 91
92 Equity and investment fund shares 219.7 246.6 287.3 320.1 253.4 296.3 334.9 338.5 369.9 415.4 9293 Money market fund shares 76.3 89.9 105.3 123.3 126.1 136.1 150.2 154.0 161.9 166.6 9394 Corporate equities 107.6 116.0 132.9 141.7 91.0 111.8 126.3 125.2 140.7 167.6 9495 Mutual fund shares 35.8 40.7 49.1 55.0 36.3 48.5 58.4 59.3 67.3 81.2 95
96 Other accounts receivable 291.7 329.4 356.7 374.8 359.9 374.7 366.3 370.7 385.9 403.0 9697 Trade receivables 125.0 142.5 151.3 159.1 143.7 139.1 152.2 154.5 160.3 168.7 9798 Taxes receivable 88.0 102.3 114.4 117.4 123.0 117.1 117.8 120.0 121.3 123.8 9899 Other (miscellaneous assets) 78.6 84.6 91.0 98.3 93.2 118.5 96.3 96.2 104.3 110.5 99
100 Total liabilities and net worth 7720.6 8576.2 9547.9 10408.2 10814.7 10911.6 11319.3 11817.2 12271.3 12641.4 100
101 Liabilities 3208.7 3385.9 3393.2 3569.4 4702.0 4715.8 5050.4 5341.0 5348.4 4931.0 101
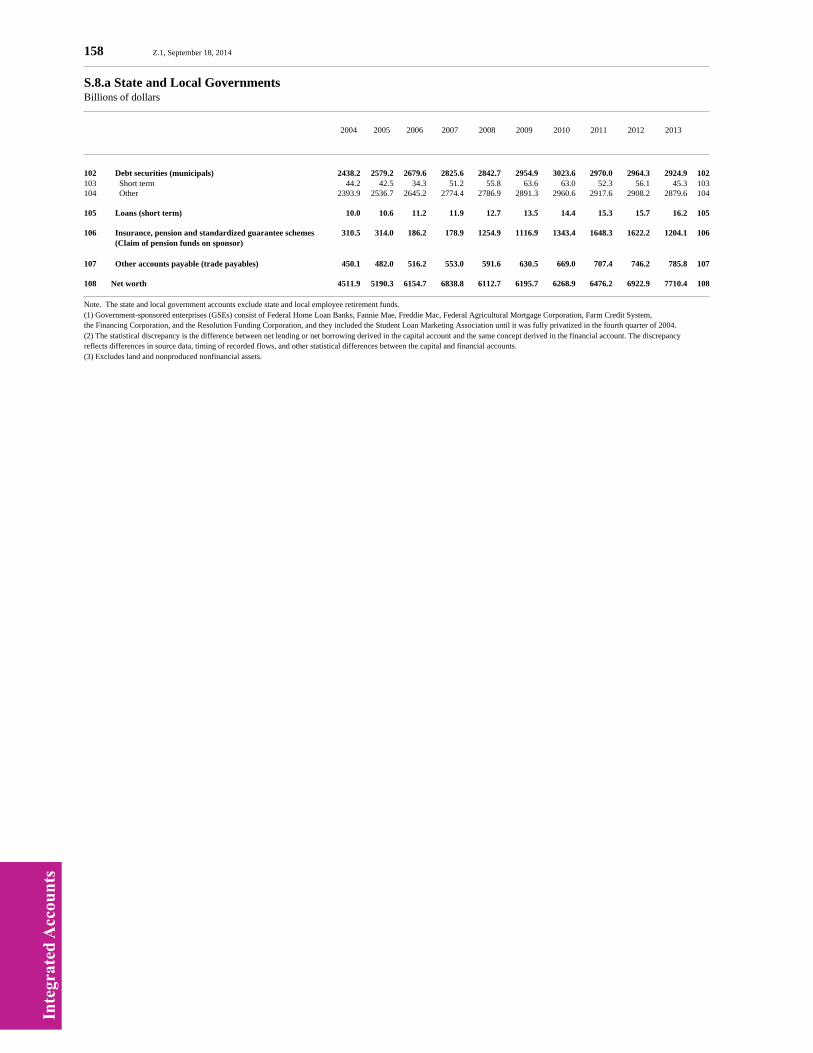
Inte
grat
ed A
ccou
nts
158 Z.1, September 18, 2014
S.8.a State and Local GovernmentsBillions of dollars
2004 2005 2006 2007 2008 2009 2010 2011 2012 2013
102 Debt securities (municipals) 2438.2 2579.2 2679.6 2825.6 2842.7 2954.9 3023.6 2970.0 2964.3 2924.9 102103 Short term 44.2 42.5 34.3 51.2 55.8 63.6 63.0 52.3 56.1 45.3 103104 Other 2393.9 2536.7 2645.2 2774.4 2786.9 2891.3 2960.6 2917.6 2908.2 2879.6 104
105 Loans (short term) 10.0 10.6 11.2 11.9 12.7 13.5 14.4 15.3 15.7 16.2 105
106 Insurance, pension and standardized guarantee schemes 310.5 314.0 186.2 178.9 1254.9 1116.9 1343.4 1648.3 1622.2 1204.1 106 (Claim of pension funds on sponsor)
107 Other accounts payable (trade payables) 450.1 482.0 516.2 553.0 591.6 630.5 669.0 707.4 746.2 785.8 107
108 Net worth 4511.9 5190.3 6154.7 6838.8 6112.7 6195.7 6268.9 6476.2 6922.9 7710.4 108
Note. The state and local government accounts exclude state and local employee retirement funds.(1) Government-sponsored enterprises (GSEs) consist of Federal Home Loan Banks, Fannie Mae, Freddie Mac, Federal Agricultural Mortgage Corporation, Farm Credit System,the Financing Corporation, and the Resolution Funding Corporation, and they included the Student Loan Marketing Association until it was fully privatized in the fourth quarter of 2004.(2) The statistical discrepancy is the difference between net lending or net borrowing derived in the capital account and the same concept derived in the financial account. The discrepancyreflects differences in source data, timing of recorded flows, and other statistical differences between the capital and financial accounts.(3) Excludes land and nonproduced nonfinancial assets.
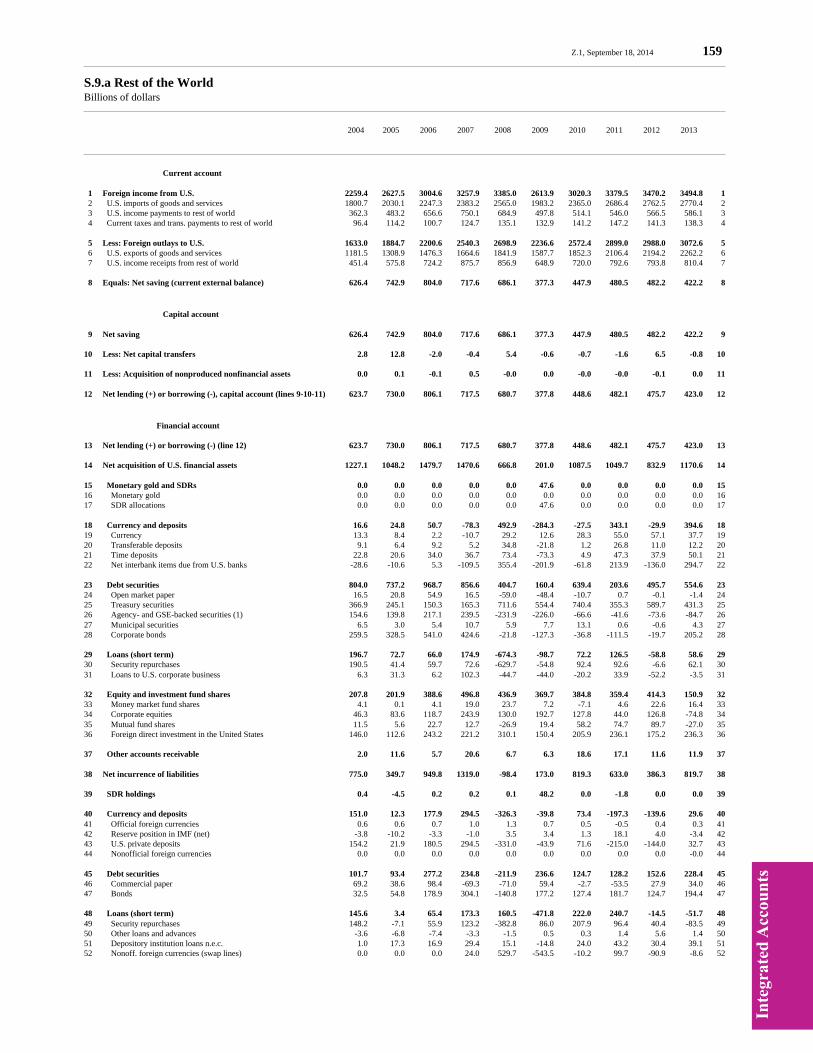
Inte
grat
ed A
ccou
nts
Z.1, September 18, 2014 159
S.9.a Rest of the World Billions of dollars
2004 2005 2006 2007 2008 2009 2010 2011 2012 2013
Current account
1 Foreign income from U.S. 2259.4 2627.5 3004.6 3257.9 3385.0 2613.9 3020.3 3379.5 3470.2 3494.8 1 2 U.S. imports of goods and services 1800.7 2030.1 2247.3 2383.2 2565.0 1983.2 2365.0 2686.4 2762.5 2770.4 2 3 U.S. income payments to rest of world 362.3 483.2 656.6 750.1 684.9 497.8 514.1 546.0 566.5 586.1 3 4 Current taxes and trans. payments to rest of world 96.4 114.2 100.7 124.7 135.1 132.9 141.2 147.2 141.3 138.3 4
5 Less: Foreign outlays to U.S. 1633.0 1884.7 2200.6 2540.3 2698.9 2236.6 2572.4 2899.0 2988.0 3072.6 5 6 U.S. exports of goods and services 1181.5 1308.9 1476.3 1664.6 1841.9 1587.7 1852.3 2106.4 2194.2 2262.2 6 7 U.S. income receipts from rest of world 451.4 575.8 724.2 875.7 856.9 648.9 720.0 792.6 793.8 810.4 7
8 Equals: Net saving (current external balance) 626.4 742.9 804.0 717.6 686.1 377.3 447.9 480.5 482.2 422.2 8
Capital account
9 Net saving 626.4 742.9 804.0 717.6 686.1 377.3 447.9 480.5 482.2 422.2 9
10 Less: Net capital transfers 2.8 12.8 -2.0 -0.4 5.4 -0.6 -0.7 -1.6 6.5 -0.8 10
11 Less: Acquisition of nonproduced nonfinancial assets 0.0 0.1 -0.1 0.5 -0.0 0.0 -0.0 -0.0 -0.1 0.0 11
12 Net lending (+) or borrowing (-), capital account (lines 9-10-11) 623.7 730.0 806.1 717.5 680.7 377.8 448.6 482.1 475.7 423.0 12
Financial account
13 Net lending (+) or borrowing (-) (line 12) 623.7 730.0 806.1 717.5 680.7 377.8 448.6 482.1 475.7 423.0 13
14 Net acquisition of U.S. financial assets 1227.1 1048.2 1479.7 1470.6 666.8 201.0 1087.5 1049.7 832.9 1170.6 14
15 Monetary gold and SDRs 0.0 0.0 0.0 0.0 0.0 47.6 0.0 0.0 0.0 0.0 1516 Monetary gold 0.0 0.0 0.0 0.0 0.0 0.0 0.0 0.0 0.0 0.0 1617 SDR allocations 0.0 0.0 0.0 0.0 0.0 47.6 0.0 0.0 0.0 0.0 17
18 Currency and deposits 16.6 24.8 50.7 -78.3 492.9 -284.3 -27.5 343.1 -29.9 394.6 1819 Currency 13.3 8.4 2.2 -10.7 29.2 12.6 28.3 55.0 57.1 37.7 1920 Transferable deposits 9.1 6.4 9.2 5.2 34.8 -21.8 1.2 26.8 11.0 12.2 2021 Time deposits 22.8 20.6 34.0 36.7 73.4 -73.3 4.9 47.3 37.9 50.1 2122 Net interbank items due from U.S. banks -28.6 -10.6 5.3 -109.5 355.4 -201.9 -61.8 213.9 -136.0 294.7 22
23 Debt securities 804.0 737.2 968.7 856.6 404.7 160.4 639.4 203.6 495.7 554.6 2324 Open market paper 16.5 20.8 54.9 16.5 -59.0 -48.4 -10.7 0.7 -0.1 -1.4 2425 Treasury securities 366.9 245.1 150.3 165.3 711.6 554.4 740.4 355.3 589.7 431.3 2526 Agency- and GSE-backed securities (1) 154.6 139.8 217.1 239.5 -231.9 -226.0 -66.6 -41.6 -73.6 -84.7 2627 Municipal securities 6.5 3.0 5.4 10.7 5.9 7.7 13.1 0.6 -0.6 4.3 2728 Corporate bonds 259.5 328.5 541.0 424.6 -21.8 -127.3 -36.8 -111.5 -19.7 205.2 28
29 Loans (short term) 196.7 72.7 66.0 174.9 -674.3 -98.7 72.2 126.5 -58.8 58.6 2930 Security repurchases 190.5 41.4 59.7 72.6 -629.7 -54.8 92.4 92.6 -6.6 62.1 3031 Loans to U.S. corporate business 6.3 31.3 6.2 102.3 -44.7 -44.0 -20.2 33.9 -52.2 -3.5 31
32 Equity and investment fund shares 207.8 201.9 388.6 496.8 436.9 369.7 384.8 359.4 414.3 150.9 3233 Money market fund shares 4.1 0.1 4.1 19.0 23.7 7.2 -7.1 4.6 22.6 16.4 3334 Corporate equities 46.3 83.6 118.7 243.9 130.0 192.7 127.8 44.0 126.8 -74.8 3435 Mutual fund shares 11.5 5.6 22.7 12.7 -26.9 19.4 58.2 74.7 89.7 -27.0 3536 Foreign direct investment in the United States 146.0 112.6 243.2 221.2 310.1 150.4 205.9 236.1 175.2 236.3 36
37 Other accounts receivable 2.0 11.6 5.7 20.6 6.7 6.3 18.6 17.1 11.6 11.9 37
38 Net incurrence of liabilities 775.0 349.7 949.8 1319.0 -98.4 173.0 819.3 633.0 386.3 819.7 38
39 SDR holdings 0.4 -4.5 0.2 0.2 0.1 48.2 0.0 -1.8 0.0 0.0 39
40 Currency and deposits 151.0 12.3 177.9 294.5 -326.3 -39.8 73.4 -197.3 -139.6 29.6 4041 Official foreign currencies 0.6 0.6 0.7 1.0 1.3 0.7 0.5 -0.5 0.4 0.3 4142 Reserve position in IMF (net) -3.8 -10.2 -3.3 -1.0 3.5 3.4 1.3 18.1 4.0 -3.4 4243 U.S. private deposits 154.2 21.9 180.5 294.5 -331.0 -43.9 71.6 -215.0 -144.0 32.7 4344 Nonofficial foreign currencies 0.0 0.0 0.0 0.0 0.0 0.0 0.0 0.0 0.0 -0.0 44
45 Debt securities 101.7 93.4 277.2 234.8 -211.9 236.6 124.7 128.2 152.6 228.4 4546 Commercial paper 69.2 38.6 98.4 -69.3 -71.0 59.4 -2.7 -53.5 27.9 34.0 4647 Bonds 32.5 54.8 178.9 304.1 -140.8 177.2 127.4 181.7 124.7 194.4 47
48 Loans (short term) 145.6 3.4 65.4 173.3 160.5 -471.8 222.0 240.7 -14.5 -51.7 4849 Security repurchases 148.2 -7.1 55.9 123.2 -382.8 86.0 207.9 96.4 40.4 -83.5 4950 Other loans and advances -3.6 -6.8 -7.4 -3.3 -1.5 0.5 0.3 1.4 5.6 1.4 5051 Depository institution loans n.e.c. 1.0 17.3 16.9 29.4 15.1 -14.8 24.0 43.2 30.4 39.1 5152 Nonoff. foreign currencies (swap lines) 0.0 0.0 0.0 24.0 529.7 -543.5 -10.2 99.7 -90.9 -8.6 52
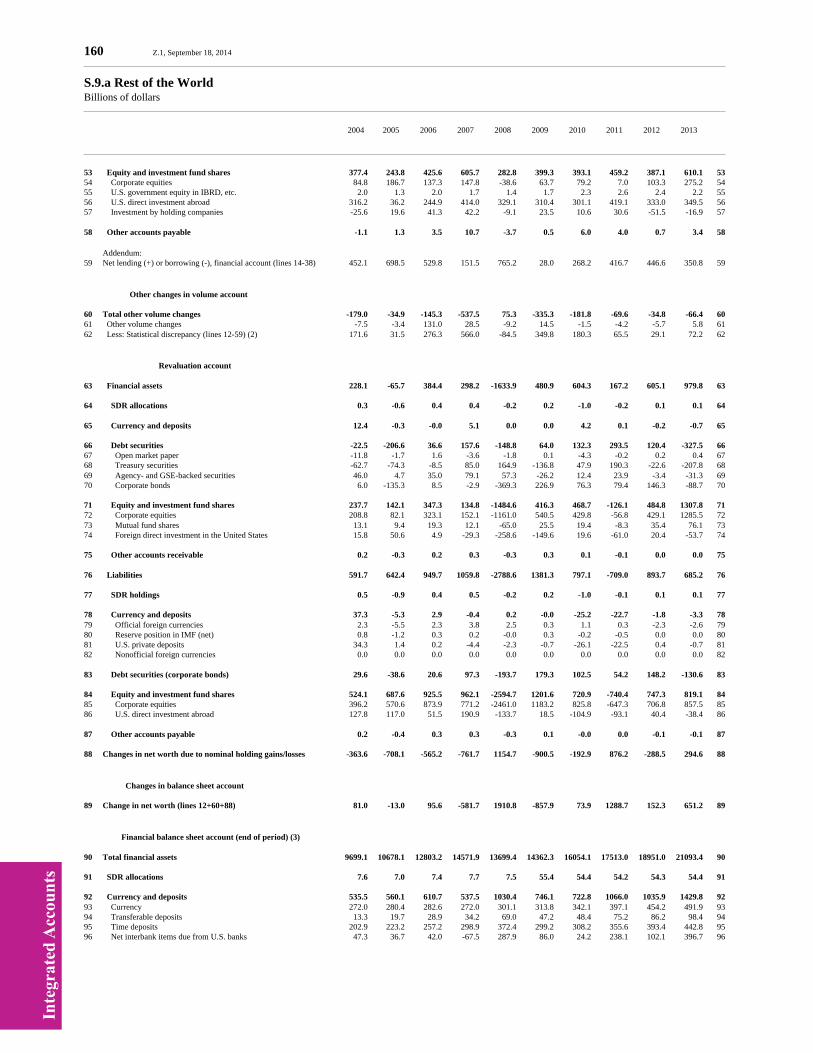
Inte
grat
ed A
ccou
nts
160 Z.1, September 18, 2014
S.9.a Rest of the World Billions of dollars
2004 2005 2006 2007 2008 2009 2010 2011 2012 2013
53 Equity and investment fund shares 377.4 243.8 425.6 605.7 282.8 399.3 393.1 459.2 387.1 610.1 5354 Corporate equities 84.8 186.7 137.3 147.8 -38.6 63.7 79.2 7.0 103.3 275.2 5455 U.S. government equity in IBRD, etc. 2.0 1.3 2.0 1.7 1.4 1.7 2.3 2.6 2.4 2.2 5556 U.S. direct investment abroad 316.2 36.2 244.9 414.0 329.1 310.4 301.1 419.1 333.0 349.5 5657 Investment by holding companies -25.6 19.6 41.3 42.2 -9.1 23.5 10.6 30.6 -51.5 -16.9 57
58 Other accounts payable -1.1 1.3 3.5 10.7 -3.7 0.5 6.0 4.0 0.7 3.4 58
Addendum:59 Net lending (+) or borrowing (-), financial account (lines 14-38) 452.1 698.5 529.8 151.5 765.2 28.0 268.2 416.7 446.6 350.8 59
Other changes in volume account
60 Total other volume changes -179.0 -34.9 -145.3 -537.5 75.3 -335.3 -181.8 -69.6 -34.8 -66.4 6061 Other volume changes -7.5 -3.4 131.0 28.5 -9.2 14.5 -1.5 -4.2 -5.7 5.8 6162 Less: Statistical discrepancy (lines 12-59) (2) 171.6 31.5 276.3 566.0 -84.5 349.8 180.3 65.5 29.1 72.2 62
Revaluation account
63 Financial assets 228.1 -65.7 384.4 298.2 -1633.9 480.9 604.3 167.2 605.1 979.8 63
64 SDR allocations 0.3 -0.6 0.4 0.4 -0.2 0.2 -1.0 -0.2 0.1 0.1 64
65 Currency and deposits 12.4 -0.3 -0.0 5.1 0.0 0.0 4.2 0.1 -0.2 -0.7 65
66 Debt securities -22.5 -206.6 36.6 157.6 -148.8 64.0 132.3 293.5 120.4 -327.5 6667 Open market paper -11.8 -1.7 1.6 -3.6 -1.8 0.1 -4.3 -0.2 0.2 0.4 6768 Treasury securities -62.7 -74.3 -8.5 85.0 164.9 -136.8 47.9 190.3 -22.6 -207.8 6869 Agency- and GSE-backed securities 46.0 4.7 35.0 79.1 57.3 -26.2 12.4 23.9 -3.4 -31.3 6970 Corporate bonds 6.0 -135.3 8.5 -2.9 -369.3 226.9 76.3 79.4 146.3 -88.7 70
71 Equity and investment fund shares 237.7 142.1 347.3 134.8 -1484.6 416.3 468.7 -126.1 484.8 1307.8 7172 Corporate equities 208.8 82.1 323.1 152.1 -1161.0 540.5 429.8 -56.8 429.1 1285.5 7273 Mutual fund shares 13.1 9.4 19.3 12.1 -65.0 25.5 19.4 -8.3 35.4 76.1 7374 Foreign direct investment in the United States 15.8 50.6 4.9 -29.3 -258.6 -149.6 19.6 -61.0 20.4 -53.7 74
75 Other accounts receivable 0.2 -0.3 0.2 0.3 -0.3 0.3 0.1 -0.1 0.0 0.0 75
76 Liabilities 591.7 642.4 949.7 1059.8 -2788.6 1381.3 797.1 -709.0 893.7 685.2 76
77 SDR holdings 0.5 -0.9 0.4 0.5 -0.2 0.2 -1.0 -0.1 0.1 0.1 77
78 Currency and deposits 37.3 -5.3 2.9 -0.4 0.2 -0.0 -25.2 -22.7 -1.8 -3.3 7879 Official foreign currencies 2.3 -5.5 2.3 3.8 2.5 0.3 1.1 0.3 -2.3 -2.6 7980 Reserve position in IMF (net) 0.8 -1.2 0.3 0.2 -0.0 0.3 -0.2 -0.5 0.0 0.0 8081 U.S. private deposits 34.3 1.4 0.2 -4.4 -2.3 -0.7 -26.1 -22.5 0.4 -0.7 8182 Nonofficial foreign currencies 0.0 0.0 0.0 0.0 0.0 0.0 0.0 0.0 0.0 0.0 82
83 Debt securities (corporate bonds) 29.6 -38.6 20.6 97.3 -193.7 179.3 102.5 54.2 148.2 -130.6 83
84 Equity and investment fund shares 524.1 687.6 925.5 962.1 -2594.7 1201.6 720.9 -740.4 747.3 819.1 8485 Corporate equities 396.2 570.6 873.9 771.2 -2461.0 1183.2 825.8 -647.3 706.8 857.5 8586 U.S. direct investment abroad 127.8 117.0 51.5 190.9 -133.7 18.5 -104.9 -93.1 40.4 -38.4 86
87 Other accounts payable 0.2 -0.4 0.3 0.3 -0.3 0.1 -0.0 0.0 -0.1 -0.1 87
88 Changes in net worth due to nominal holding gains/losses -363.6 -708.1 -565.2 -761.7 1154.7 -900.5 -192.9 876.2 -288.5 294.6 88
Changes in balance sheet account
89 Change in net worth (lines 12+60+88) 81.0 -13.0 95.6 -581.7 1910.8 -857.9 73.9 1288.7 152.3 651.2 89
Financial balance sheet account (end of period) (3)
90 Total financial assets 9699.1 10678.1 12803.2 14571.9 13699.4 14362.3 16054.1 17513.0 18951.0 21093.4 90
91 SDR allocations 7.6 7.0 7.4 7.7 7.5 55.4 54.4 54.2 54.3 54.4 91
92 Currency and deposits 535.5 560.1 610.7 537.5 1030.4 746.1 722.8 1066.0 1035.9 1429.8 9293 Currency 272.0 280.4 282.6 272.0 301.1 313.8 342.1 397.1 454.2 491.9 9394 Transferable deposits 13.3 19.7 28.9 34.2 69.0 47.2 48.4 75.2 86.2 98.4 9495 Time deposits 202.9 223.2 257.2 298.9 372.4 299.2 308.2 355.6 393.4 442.8 9596 Net interbank items due from U.S. banks 47.3 36.7 42.0 -67.5 287.9 86.0 24.2 238.1 102.1 396.7 96

Inte
grat
ed A
ccou
nts
Z.1, September 18, 2014 161
S.9.a Rest of the World Billions of dollars
2004 2005 2006 2007 2008 2009 2010 2011 2012 2013
97 Debt securities 4449.6 4980.2 5985.4 6999.6 7255.5 7479.9 8251.6 8748.7 9364.8 9592.0 9798 Open market paper 137.7 156.8 213.3 226.3 165.5 117.2 102.1 102.7 102.8 101.7 9899 Treasury securities 1813.6 1984.4 2126.2 2376.4 3253.0 3670.6 4458.8 5004.4 5571.5 5794.9 99100 Agency- and GSE-backed securities (1) 861.7 1006.1 1258.2 1576.8 1402.2 1150.0 1095.8 1078.2 1001.2 885.3 100101 Municipal securities 26.0 29.0 34.4 45.1 51.0 58.7 71.7 72.4 71.8 76.1 101102 Corporate bonds 1610.6 1803.8 2353.3 2775.0 2383.9 2483.5 2523.1 2491.0 2617.6 2734.0 102
103 Loans (short term) 794.9 867.6 1194.5 1369.5 789.6 671.9 744.0 874.6 815.8 874.4 103104 Security repurchases 663.7 705.0 1025.8 1098.4 563.2 489.4 581.8 678.5 671.9 734.1 104105 Loans to U.S. corporate business 131.2 162.5 168.8 271.1 226.4 182.5 162.3 196.1 143.9 140.4 105
106 Equity and investment fund shares 3866.0 4210.0 4946.0 5577.6 4529.8 5315.9 6169.4 6640.6 7539.7 8998.4 106107 Money market fund shares 22.9 23.0 27.0 46.0 69.7 76.9 69.8 74.4 96.9 113.3 107108 Corporate equities 1952.7 2118.4 2560.2 2956.2 1925.2 2658.4 3216.0 3397.2 3953.0 5163.7 108109 Mutual fund shares 147.7 162.7 204.7 229.5 137.6 182.4 260.0 370.4 495.4 544.5 109110 Foreign direct investment in the United States 1742.7 1906.0 2154.1 2345.9 2397.4 2398.2 2623.6 2798.7 2994.3 3176.9 110
111 Other accounts receivable 45.4 53.3 59.2 80.0 86.5 93.1 111.8 128.8 140.5 144.4 111
112 Total liabilities and net worth 9699.1 10678.1 12803.2 14571.9 13699.4 14362.3 16054.1 17513.0 18951.0 21093.4 112
113 Total liabilities 8035.3 9027.4 11056.9 13407.3 10624.0 12144.8 13762.7 13932.9 15218.6 16709.8 113
114 SDR holdings 13.6 8.2 8.9 9.5 9.3 57.8 56.8 55.0 55.1 55.2 114
115 Currency and deposits 1206.8 1213.8 1394.5 1688.6 1362.5 1322.7 1370.8 1150.8 1009.3 1035.6 115116 Official foreign currencies 42.5 37.6 40.7 45.5 49.3 50.2 51.8 51.6 49.7 47.4 116117 Reserve position in IMF (net) 19.5 8.0 5.0 4.2 7.7 11.4 12.5 30.1 34.2 30.8 117118 U.S. private deposits 1142.2 1165.5 1346.1 1636.2 1302.9 1258.4 1303.9 1066.4 922.8 954.8 118119 Nonofficial foreign currencies 2.6 2.6 2.6 2.6 2.6 2.6 2.6 2.6 2.6 2.6 119
120 Debt securities 1153.9 1208.8 1506.6 1838.7 1433.2 1849.1 2076.3 2258.7 2559.5 2657.3 120121 Commercial paper 345.3 384.0 482.3 413.0 342.0 401.3 398.6 345.1 373.0 407.0 121122 Bonds 808.6 824.8 1024.3 1425.7 1091.2 1447.8 1677.6 1913.6 2186.5 2250.4 122
123 Loans (short term) 519.9 523.3 718.7 863.5 1127.8 622.5 846.0 1091.3 1082.5 1030.8 123124 Security repurchases 388.1 381.0 566.9 681.1 402.3 454.8 663.7 764.7 805.1 721.6 124125 Other loans and advances 38.7 31.9 24.5 21.2 19.4 19.9 20.2 21.5 30.8 32.2 125126 Depository institution loans n.e.c. 93.1 110.4 127.4 137.3 152.4 137.5 162.0 205.2 237.7 276.7 126127 Nonoff. foreign currencies (swap lines) 0.0 0.0 0.0 24.0 553.7 10.3 0.1 99.8 8.9 0.3 127
128 Equity and investment fund shares 5108.4 6039.8 7390.8 8958.6 6646.8 8247.7 9361.7 9322.0 10456.4 11885.6 128129 Corporate equities 2560.4 3317.7 4329.0 5248.0 2748.4 3995.3 4900.2 4501.4 5311.5 6444.2 129130 U.S. government equity in IBRD, etc. 42.0 43.2 45.3 46.9 48.3 50.0 52.3 54.9 57.3 59.5 130131 U.S. direct investment abroad 2498.5 2651.7 2948.2 3553.1 3748.5 4077.4 4273.6 4599.5 4972.9 5284.0 131132 Investment by holding companies 7.5 27.1 68.4 110.6 101.5 125.1 135.6 166.3 114.7 97.8 132
133 Other accounts payable 32.7 33.6 37.4 48.4 44.4 45.1 51.1 55.1 55.7 45.3 133
134 Net worth (external account) 1663.7 1650.7 1746.3 1164.7 3075.4 2217.5 2291.3 3580.1 3732.4 4383.6 134
(1) Government-sponsored enterprises (GSEs) consist of Federal Home Loan Banks, Fannie Mae, Freddie Mac, Federal Agricultural Mortgage Corporation, Farm Credit System,the Financing Corporation, and the Resolution Funding Corporation, and they included the Student Loan Marketing Association until it was fully privatized in the fourth quarter of 2004.(2) The statistical discrepancy is the difference between net lending or net borrowing derived in the capital account and the same concept derived in the financial account. The discrepancyreflects differences in source data, timing of recorded flows, and other statistical differences between the capital and financial accounts.(3) Excludes nonfinancial assets, including nonproduced nonfinancial assets.IBRD International Bank for Reconstruction and DevelopmentIMF International Monetary FundSDRs Special Drawing Rightsn.e.c. Not elsewhere classified