Modelling entomological-climatic interactions of Plasmodium falciparum malaria transmission in two...
30
BioMed Central Page 1 of 30 (page number not for citation purposes) Malaria Journal Open Access Research Modelling entomological-climatic interactions of Plasmodium falciparum malaria transmission in two Colombian endemic-regions: contributions to a National Malaria Early Warning System Daniel Ruiz* 1,2 , Germán Poveda 1 , Iván D Vélez 3 , Martha L Quiñones 3,4 , Guillermo L Rúa 3 , Luz E Velásquez 3 and Juan S Zuluaga 5 Address: 1 Escuela de Geociencias y Medio Ambiente, Facultad de Minas, Universidad Nacional de Colombia Sede Medellín, Medellín, Colombia, 2 Programa Ingeniería Ambiental, Escuela de Ingeniería de Antioquia, Calle 25 Sur No. 42–73, Envigado, Antioquia, Colombia, 3 Programa de Estudio y Control de Enfermedades Tropicales, Sede de Investigación Universitaria, Universidad de Antioquia, Medellín, Colombia, 4 Departamento de Salud Pública, Facultad de Medicina, Universidad Nacional de Colombia Sede Bogotá, Bogotá, Colombia and 5 Corporación para Investigaciones Biológicas, Medellín, Colombia Email: Daniel Ruiz* - [email protected]; Germán Poveda - [email protected]; Iván D Vélez - [email protected]; Martha L Quiñones - [email protected]; Guillermo L Rúa - [email protected]; Luz E Velásquez - [email protected]; Juan S Zuluaga - [email protected] * Corresponding author Abstract Background: Malaria has recently re-emerged as a public health burden in Colombia. Although the problem seems to be climate-driven, there remain significant gaps of knowledge in the understanding of the complexity of malaria transmission, which have motivated attempts to develop a comprehensive model. Methods: The mathematical tool was applied to represent Plasmodium falciparum malaria transmission in two endemic-areas. Entomological exogenous variables were estimated through field campaigns and laboratory experiments. Availability of breeding places was included towards representing fluctuations in vector densities. Diverse scenarios, sensitivity analyses and instabilities cases were considered during experimentation-validation process. Results: Correlation coefficients and mean square errors between observed and modelled incidences reached 0.897–0.668 (P > 0.95) and 0.0002–0.0005, respectively. Temperature became the most relevant climatic parameter driving the final incidence. Accordingly, malaria outbreaks are possible during the favourable epochs following the onset of El Niño warm events. Sporogonic and gonotrophic cycles showed to be the entomological key-variables controlling the transmission potential of mosquitoes' population. Simulation results also showed that seasonality of vector density becomes an important factor towards understanding disease transmission. Conclusion: The model constitutes a promising tool to deepen the understanding of the multiple interactions related to malaria transmission conducive to outbreaks. In the foreseeable future it could be implemented as a tool to diagnose possible dynamical patterns of malaria incidence under several scenarios, as well as a decision- making tool for the early detection and control of outbreaks. The model will be also able to be merged with forecasts of El Niño events to provide a National Malaria Early Warning System. Published: 01 August 2006 Malaria Journal 2006, 5:66 doi:10.1186/1475-2875-5-66 Received: 27 March 2006 Accepted: 01 August 2006 This article is available from: http://www.malariajournal.com/content/5/1/66 © 2006 Ruiz et al; licensee BioMed Central Ltd. This is an Open Access article distributed under the terms of the Creative Commons Attribution License (http://creativecommons.org/licenses/by/2.0 ), which permits unrestricted use, distribution, and reproduction in any medium, provided the original work is properly cited.
Transcript of Modelling entomological-climatic interactions of Plasmodium falciparum malaria transmission in two...
BioMed CentralMalaria Journal
ss
Open AcceResearchModelling entomological-climatic interactions of Plasmodium falciparum malaria transmission in two Colombian endemic-regions: contributions to a National Malaria Early Warning SystemDaniel Ruiz*1,2, Germán Poveda1, Iván D Vélez3, Martha L Quiñones3,4, Guillermo L Rúa3, Luz E Velásquez3 and Juan S Zuluaga5Address: 1Escuela de Geociencias y Medio Ambiente, Facultad de Minas, Universidad Nacional de Colombia Sede Medellín, Medellín, Colombia, 2Programa Ingeniería Ambiental, Escuela de Ingeniería de Antioquia, Calle 25 Sur No. 42–73, Envigado, Antioquia, Colombia, 3Programa de Estudio y Control de Enfermedades Tropicales, Sede de Investigación Universitaria, Universidad de Antioquia, Medellín, Colombia, 4Departamento de Salud Pública, Facultad de Medicina, Universidad Nacional de Colombia Sede Bogotá, Bogotá, Colombia and 5Corporación para Investigaciones Biológicas, Medellín, Colombia
Email: Daniel Ruiz* - [email protected]; Germán Poveda - [email protected]; Iván D Vélez - [email protected]; Martha L Quiñones - [email protected]; Guillermo L Rúa - [email protected]; Luz E Velásquez - [email protected]; Juan S Zuluaga - [email protected]
* Corresponding author
AbstractBackground: Malaria has recently re-emerged as a public health burden in Colombia. Although the problemseems to be climate-driven, there remain significant gaps of knowledge in the understanding of the complexity ofmalaria transmission, which have motivated attempts to develop a comprehensive model.
Methods: The mathematical tool was applied to represent Plasmodium falciparum malaria transmission in twoendemic-areas. Entomological exogenous variables were estimated through field campaigns and laboratoryexperiments. Availability of breeding places was included towards representing fluctuations in vector densities.Diverse scenarios, sensitivity analyses and instabilities cases were considered during experimentation-validationprocess.
Results: Correlation coefficients and mean square errors between observed and modelled incidences reached0.897–0.668 (P > 0.95) and 0.0002–0.0005, respectively. Temperature became the most relevant climaticparameter driving the final incidence. Accordingly, malaria outbreaks are possible during the favourable epochsfollowing the onset of El Niño warm events. Sporogonic and gonotrophic cycles showed to be the entomologicalkey-variables controlling the transmission potential of mosquitoes' population. Simulation results also showed thatseasonality of vector density becomes an important factor towards understanding disease transmission.
Conclusion: The model constitutes a promising tool to deepen the understanding of the multiple interactionsrelated to malaria transmission conducive to outbreaks. In the foreseeable future it could be implemented as atool to diagnose possible dynamical patterns of malaria incidence under several scenarios, as well as a decision-making tool for the early detection and control of outbreaks. The model will be also able to be merged withforecasts of El Niño events to provide a National Malaria Early Warning System.
Published: 01 August 2006
Malaria Journal 2006, 5:66 doi:10.1186/1475-2875-5-66
Received: 27 March 2006Accepted: 01 August 2006
This article is available from: http://www.malariajournal.com/content/5/1/66
© 2006 Ruiz et al; licensee BioMed Central Ltd.This is an Open Access article distributed under the terms of the Creative Commons Attribution License (http://creativecommons.org/licenses/by/2.0), which permits unrestricted use, distribution, and reproduction in any medium, provided the original work is properly cited.
Page 1 of 30(page number not for citation purposes)
Malaria Journal 2006, 5:66 http://www.malariajournal.com/content/5/1/66
BackgroundThe World Health Organization estimates that malariaparasites infect from 200 to 300 million persons and killmore than 1 million people each year, primarily childrenunder the age of five [1]. The efficacy of control measureshas decreased over the past decades because mosquitoesand parasites are becoming more resistant to the com-monly used insecticides and anti-malarial drugs [2]. As aresult, malaria kills more people today than three decadesago. To further complicate matters, the international com-munity suggests that diseases relayed by mosquitoes, suchas malaria, are among those infectious diseases mostlikely to spread dramatically as global temperatures headupward [3,4]. Forecasts from different models suggest thatby the end of the 21st century ongoing warming will haveenlarged the zone of potential malaria transmission froman area containing 45 percent of the world's population toan area containing about 60 percent [4]. Although thisexpansion certainly fits the predictions, the cause of thatgrowth may not be attributed convincingly to globalwarming. Other factors (maybe the dominant contribu-tors) may have been involved as well, for instance: disrup-tion of the environment in ways that favour themosquitoes' proliferation, declines in vector-control andin other public health programs, and rises in drug andinsecticide resistance [4]. To make matters worse, there area number of 'macro-factors' such as economic inequali-ties, continuous human migratory patterns and vegetationpatterns that may increase or decrease vulnerability andexposure to vector-borne infections and play an impor-tant role in regional morbidity and mortality profiles.Clearly, it is impossible to treat climate isolated from theother biological, socioeconomic and demographic con-tributors if the determination of the potential impact ofclimate change on malaria incidence is urgently need tobe made. However, the hypothesis for a climatic contribu-tion becomes stronger: even though malaria is a highlycomplex multi-factorial disease, previous studies haveidentified environmental factors and climate variability asgoing a considerable way in helping to explain the fluctu-ations of disease incidence [5-7].
In Colombia, currently, the population exceeds 44 mil-lion people; more than five million live in endemic-proneregions. Malaria has recently re-emerged as a significantpublic health burden in the country: incidence during epi-demic years (total positive cases for both Plasmodium falci-parum and Plasmodium vivax malaria scaled by the totalpopulation at risk per 1,000 inhabitants) increased fromless than 2.5 in 1963 to 6 in 1983 and almost 10 in 1998.During 1996, disease transmission reached 42 cases per1,000 inhabitants in high-risk areas. In the Chocó Depart-ment, on the Colombian Pacific Coast, more than 80,000cases were reported during 1998, when the population atrisk was 380,000 people [8]. During the year 2000 malaria
cases were reported in 69% of the 125 towns of theDepartment of Antioquia, in the Andean region. Besidesthe aforementioned strongly increasing trend, the AnnualParasite Index also exhibited a significant associationbetween the increase in the number of malaria cases andthe occurrence of the El Niño warm event, which is con-sidered the main forcing mechanism of Colombia'shydroclimatology at inter-annual timescales [8]. There isstrong evidence that the El Niño event intensifies theannual cycle of malaria cases in endemic rural areas as aconsequence of concomitant anomalies in the normalannual cycle of temperature and precipitation. During'normal' years, endemic malaria exhibits a clear-cut 'nor-mal' annual cycle, which is associated with prevalent cli-matic conditions. During El Niño events, characterized byincreasing temperatures and decreasing monthly rainfalls,river flows and soil moistures, malaria outbreaks werefound to be enhanced by climate anomalies. The annualcycle of malaria seems to be affected in its amplitude(increase in the number of cases), although the phase (ortiming) remains unaltered in most malaria prone-regionsof the country [8].
As recent scientific and technological advances have per-mitted much better predictions of the El Niño event, thereis an evident opportunity to incorporate this climate fore-casting capability into programs, campaigns, controlmeasures and mitigation plans to reduce the humanhealth impact of malaria outbreaks in Colombian prone-regions. Nevertheless, there remain significant gaps ofknowledge in the understanding of the interactionsbetween climatic factors and the dynamics of malariatransmission, which have motivated attempts to exploreand develop mathematical comprehensive models.
Detailed dynamic models of malaria epidemiology havebeen developed extensively and have made importantcontributions to understanding the transmission ofmalaria and other diseases [3,9-21]. There are limitations,however. Although these models can provide adequateapproximations to some biological and epidemiologicalcharacteristics, most of them have not been able todescribe the overall transmission dynamics [21]. Eventhough mosquitoes and vertebrate host dynamics are gen-erally included, most models do not include changes inenvironmental and climatic patterns that could affect dis-ease incidence in both spatial and temporal scales, nor dothey include the social, economical and demographicalconditions prevailing in the communities that were stud-ied. In this article experiences in developing and imple-menting a vector-borne disease model, which is based onpreviously proposed differential-equation 'compartment'models, are reported. The aim was to validate the mathe-matical tool by comparing its results under conditions ofintense transmission in two specific malaria prone-
Page 2 of 30(page number not for citation purposes)
Malaria Journal 2006, 5:66 http://www.malariajournal.com/content/5/1/66
regions of Colombia. To do so, malaria prevalencechanges were monitored in these areas and model predic-tions were tested to assess their consistency with fieldobservations.
In developing the mathematical model, three major stepswere followed: (i) First, the parasite transmission cyclewas studied to define those endogenous variables stronglyaffected by climatic conditions. (ii) The vector ecology,behavioural patterns of mosquitoes and entomologicalparameters were analysed in order to determine thoseexogenous variables (and their relationships with climaticanomalies) that might be relevant for representingmalaria transmission. Analyses were focused on the neces-sity to represent the observed fluctuations in vector den-sity. (iii) The vector population dynamics during pre-imago stages was represented, including the availability ofadequate breeding sites and the predator-prey interactionsduring larval stage.
In applying and validating the mathematical tool, fivemajor steps were followed: (a) homogeneity analysis ofhydrological time series, to detect possible changes inmean and variance, as well as significant trends in histor-ical series of both temperature and precipitation. (b)Analysis of total positive malaria cases, to determine thebehaviour of epidemiological time series, to establish theinitial values of state variables, and for fine-tuning theparameters. (c) Correlation analysis, to determine thecontribution of climate factors on the temporal varianceof malaria transmission. (d) Simulation-base scenario, toanalyse the behaviour of the proposed differential-equa-tion model and its preliminary results. And (e) simula-tion-alternate scenarios, to analyse several simulationresults of the set of non-linear differential equations whenperturbations of several exogenous variables, changes incontrol parameters and changing climate scenarios wereconsidered.
The mathematical tool allowed improving the under-standing of the linkages between climate patterns andmalaria outbreaks, mainly during the onset of ENSOwarm events. Experiences suggest that forecasts of futureEl Niño events will be able to be merged with mathemat-ical models to provide a Malaria Early Warning System(MEWS) to enhance disease surveillance, control andresponse to epidemics, and facilitate early, coupled andenvironmentally sound public health interventions [8].
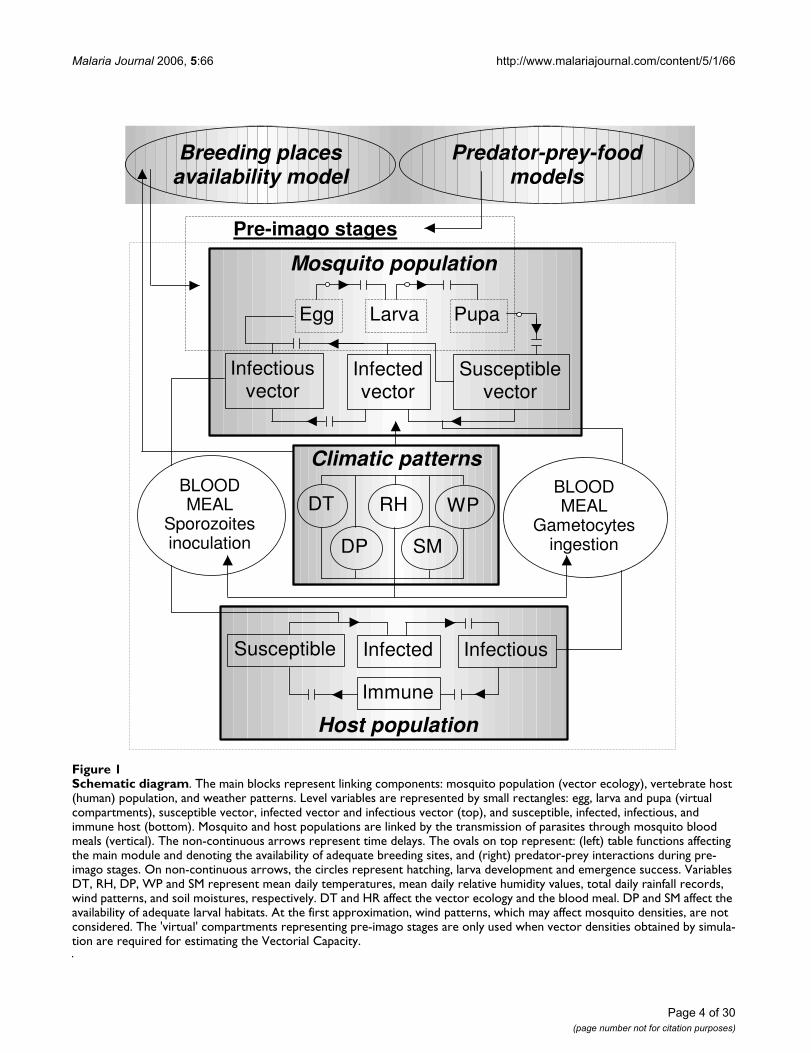
MethodsMain moduleFigure 1 depicts the schematic diagram of the proposedoverall malaria model. The comprehensive tool has threelinking components that can be simulated separately, ifdesired, except in the case of vector-host interactions.
These components are the human host population, themosquito population (vector ecology), and the weatherpatterns. Climate strongly affects the corresponding inter-action between populations during a blood meal, as wellas the vector ecology and the availability of breeding sites.
By ignoring the secondary exo-erythrocytic schizogony, thattakes place in the parenchymal cells of the liver, simula-tion was limited to representing P. falciparum malariatransmission. Based upon the widely known biologicaland epidemiological aspects of malaria transmission, asusceptible person may become a member of the infectedclass if the individual is inoculated with sporozoites dur-ing an adult female Anopheles mosquito infective bite. Theexo-erythrocytic schizogony and the erythrocytic schizogonytake place in the infected vertebrate host. During thisstage, sexually differentiated forms (gametocytes) arepresent in the host's blood circulation and can be taken bya susceptible female mosquito during a new blood meal.Parasites can then be transmitted from this mosquito to asusceptible person in some latter human-vector interac-tion. The progressive increase of parasitaemia in the infec-tious host as a result of multiple erythrocytic cycles may beslowed down by the immune response of the human.Finally, the immune individual loses immunity andreturns to the reservoir of susceptible hosts.
In the vector ecology, a susceptible adult female Anophelesmosquito becomes a member of the infected class when ittakes a blood meal from an infectious host and ingests thegametocytes present in the individual's blood stream. Thevector finally enters the reservoir of infectious mosquitoesafter the completion of the sporogonic cycle.
Since vector density is commonly assumed to be constantby most researchers, this variable has played a minor rolein the construction of their mathematical infectious dis-ease models. It is generally accepted that it is very difficultto arrive at a reliable estimate of the changes in vector den-sity over large areas as a result of changes in temperature,precipitation and humidity. The effort of this research isaimed at fully representing the vector density in human-mosquito interactions, by considering three additionalstages (virtual compartments) in the mosquito ecology:the pre-imago stages eggs, larvae, and pupae. Interestsincluded the analysis of average development periodsfrom eggs to adult mosquitoes, expressed as time delaysand the related survival probabilities, expressed as suc-cesses in hatching, larval development, and adult emer-gence. All these entomological variables seem to bestrongly dependent on the ambient temperature or watertemperature of the breeding site.
Page 3 of 30(page number not for citation purposes)
Malaria Journal 2006, 5:66 http://www.malariajournal.com/content/5/1/66
Page 4 of 30(page number not for citation purposes)
Schematic diagramFigure 1Schematic diagram. The main blocks represent linking components: mosquito population (vector ecology), vertebrate host (human) population, and weather patterns. Level variables are represented by small rectangles: egg, larva and pupa (virtual compartments), susceptible vector, infected vector and infectious vector (top), and susceptible, infected, infectious, and immune host (bottom). Mosquito and host populations are linked by the transmission of parasites through mosquito blood meals (vertical). The non-continuous arrows represent time delays. The ovals on top represent: (left) table functions affecting the main module and denoting the availability of adequate breeding sites, and (right) predator-prey interactions during pre-imago stages. On non-continuous arrows, the circles represent hatching, larva development and emergence success. Variables DT, RH, DP, WP and SM represent mean daily temperatures, mean daily relative humidity values, total daily rainfall records, wind patterns, and soil moistures, respectively. DT and HR affect the vector ecology and the blood meal. DP and SM affect the availability of adequate larval habitats. At the first approximation, wind patterns, which may affect mosquito densities, are not considered. The 'virtual' compartments representing pre-imago stages are only used when vector densities obtained by simula-tion are required for estimating the Vectorial Capacity.
Host population
Climatic patterns
Mosquito population
Egg Larva Pupa
Susceptiblevector
Infectedvector
Infectiousvector
Susceptible Infected Infectious
Immune
BLOODMEAL
Gametocytesingestion
DT
DP
RH
SM
WPBLOODMEAL
Sporozoitesinoculation
Breeding placesavailability model
Predator-prey-foodmodels
Pre-imago stages
Malaria Journal 2006, 5:66 http://www.malariajournal.com/content/5/1/66
Breeding places availability modelThe availability of larval habitats (Figure 1) has beenbased on level fluctuations of the quantity of water inbreeding places of varying capacities. Table functionsaffecting the egg laying (oviposition) of a vector popula-tion -into the main module- have been estimated throughFuzzy Logic. This methodology was used to generalize thediscrete events 'larval habitat completely available-com-pletely full' and 'larval habitat not available-completelydry' to a continuous (fuzzy) form or partial truth. We con-sidered the collections of water as 'reservoirs' rangingfrom 10 to 60 mm in depth opened to observed rainfall,estimated actual evaporation, and assumed constant infil-tration. Daily evapotranspiration was estimated using themodels introduced by: Turc (1945), assuming a homoge-neous distribution of evapotranspiration throughout theyear; Coutagne (1974) using Budyko's equation (1974);Cenicafé (1997), a specific evaporation model suited forColombia; and Thornthwaite (1948), assuming a relationbetween actual and potential evapotranspiration of about0.70 and a homogeneous distribution throughout eachmonth [22].
As ovipositing anopheline females often prefer standingfresh water with low organic contents [23], this modeldetermine the number of successive days that a breedingsite remained between 90 and 100% of its capacity. Thisperiod of time is needed to complete all stages includingegg batching, growth and metamorphosis in aquatic exist-ence, and adult (imago) emergence. A 'favourable' condi-tion is given when this period exceeds 12–15 successivedays [2], and is normally affected by the water tempera-ture of the breeding site. Finally, as anopheline eggs can-not survive prolonged desiccation, we assumed that abreeding site is 'not favourable' for the development ofthe species during pre-imago stages if it remains dry formore than two successive days. For the sake of simplicity,other relevant factors such as exposure to sunlight, emer-gent vegetation, temperature, salinity, and organic con-tent [23], were not included in the model.
Predator-prey interaction modelsThis module allowed us to represent the interactionbetween the pre-imago stages of the mosquito population(mainly during larvae stage) and natural predators (Figure1). As a first effort, the Lotka-Volterra predator-prey typemodel [24-26] has been introduced into the differential-equation system to analyse the dynamics of both the preyand predator populations. Parameters for other types ofmodels that were included in the model, but are not cur-rently used, including Henize predator-prey model [27,9],Kaibab III prey-food model [10], Ecological System withExternal Forcing [9], and Autonomous Ecological System[9], are being calibrated through laboratory experiments.
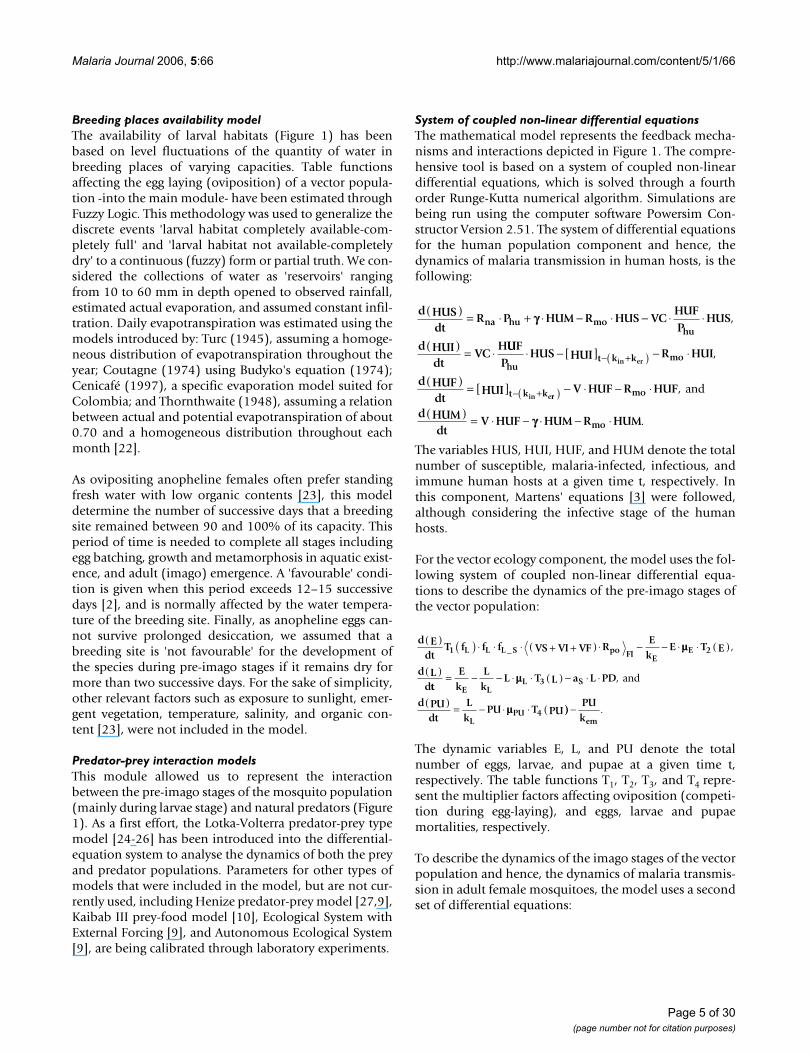
System of coupled non-linear differential equationsThe mathematical model represents the feedback mecha-nisms and interactions depicted in Figure 1. The compre-hensive tool is based on a system of coupled non-lineardifferential equations, which is solved through a fourthorder Runge-Kutta numerical algorithm. Simulations arebeing run using the computer software Powersim Con-structor Version 2.51. The system of differential equationsfor the human population component and hence, thedynamics of malaria transmission in human hosts, is thefollowing:
The variables HUS, HUI, HUF, and HUM denote the totalnumber of susceptible, malaria-infected, infectious, andimmune human hosts at a given time t, respectively. Inthis component, Martens' equations [3] were followed,although considering the infective stage of the humanhosts.
For the vector ecology component, the model uses the fol-lowing system of coupled non-linear differential equa-tions to describe the dynamics of the pre-imago stages ofthe vector population:
The dynamic variables E, L, and PU denote the totalnumber of eggs, larvae, and pupae at a given time t,respectively. The table functions T1, T2, T3, and T4 repre-sent the multiplier factors affecting oviposition (competi-tion during egg-laying), and eggs, larvae and pupaemortalities, respectively.
To describe the dynamics of the imago stages of the vectorpopulation and hence, the dynamics of malaria transmis-sion in adult female mosquitoes, the model uses a secondset of differential equations:
d HUSdt
R P HUM R HUS VCHUFP
HUS
d HUIdt
VCH
na hu mohu
( ) = ⋅ + ⋅ − ⋅ − ⋅ ⋅
( ) = ⋅
γγ ,
UUFP
HUS HUI R HUI
d HUFdt
HUI
hut k k mo
t k k
in er
in e
⋅ − [ ] − ⋅
( ) = [ ]
− +( )
− +
,
rrV HUF R HUF
d HUMdt
V HUF HUM R HUM
mo
mo
( ) − ⋅ − ⋅
( ) = ⋅ − ⋅ − ⋅
,
.
and
γγ
d Edt
T f f f VS VI VF RE
kE T E
d Ld
1 L L L S po FI EE 2
( ) ( ) ⋅ ⋅ ⋅ + +( ) ⋅ − − ⋅ ⋅ ( )
( )
_ ,μμ
ttE
kLk
L T L a L PD
d PUdt
Lk
PU T PU
E LL 3 S
LPU 4
= − − ⋅ ⋅ ( ) − ⋅ ⋅
( ) = − ⋅ ⋅ (
μμ
μμ
, and
)) − PUkem
.
Page 5 of 30(page number not for citation purposes)
Malaria Journal 2006, 5:66 http://www.malariajournal.com/content/5/1/66
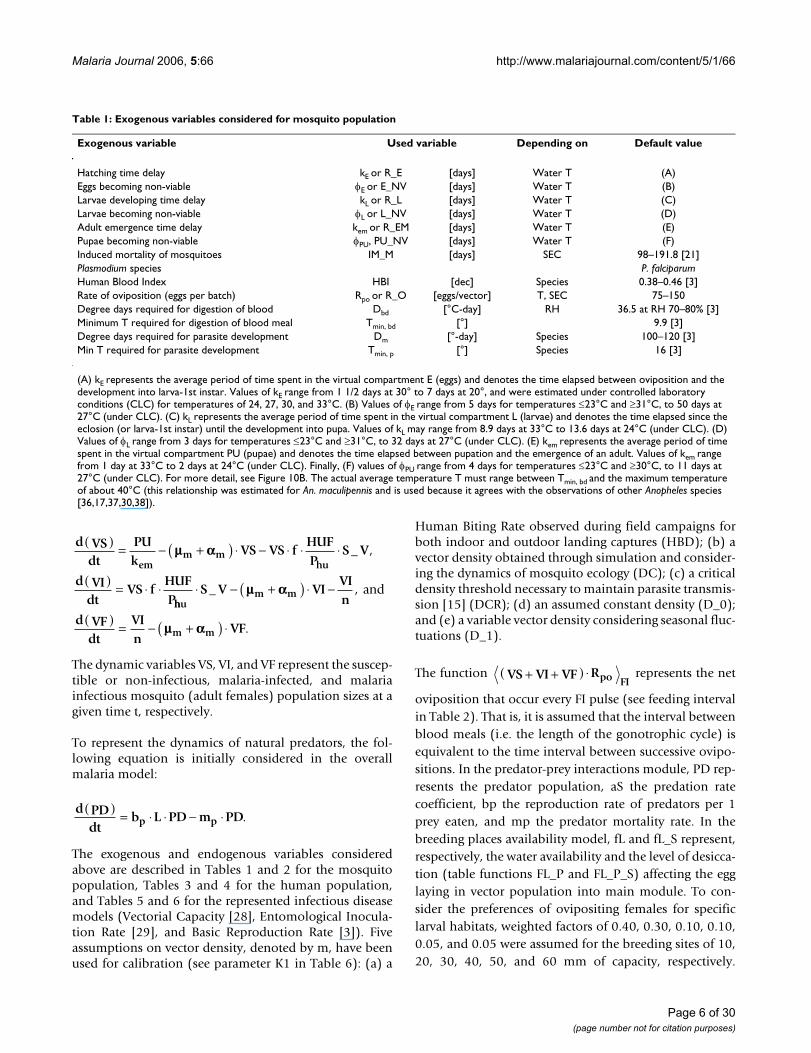
The dynamic variables VS, VI, and VF represent the suscep-tible or non-infectious, malaria-infected, and malariainfectious mosquito (adult females) population sizes at agiven time t, respectively.
To represent the dynamics of natural predators, the fol-lowing equation is initially considered in the overallmalaria model:
The exogenous and endogenous variables consideredabove are described in Tables 1 and 2 for the mosquitopopulation, Tables 3 and 4 for the human population,and Tables 5 and 6 for the represented infectious diseasemodels (Vectorial Capacity [28], Entomological Inocula-tion Rate [29], and Basic Reproduction Rate [3]). Fiveassumptions on vector density, denoted by m, have beenused for calibration (see parameter K1 in Table 6): (a) a
Human Biting Rate observed during field campaigns forboth indoor and outdoor landing captures (HBD); (b) avector density obtained through simulation and consider-ing the dynamics of mosquito ecology (DC); (c) a criticaldensity threshold necessary to maintain parasite transmis-sion [15] (DCR); (d) an assumed constant density (D_0);and (e) a variable vector density considering seasonal fluc-tuations (D_1).
The function represents the net
oviposition that occur every FI pulse (see feeding intervalin Table 2). That is, it is assumed that the interval betweenblood meals (i.e. the length of the gonotrophic cycle) isequivalent to the time interval between successive ovipo-sitions. In the predator-prey interactions module, PD rep-resents the predator population, aS the predation ratecoefficient, bp the reproduction rate of predators per 1prey eaten, and mp the predator mortality rate. In thebreeding places availability model, fL and fL_S represent,respectively, the water availability and the level of desicca-tion (table functions FL_P and FL_P_S) affecting the egglaying in vector population into main module. To con-sider the preferences of ovipositing females for specificlarval habitats, weighted factors of 0.40, 0.30, 0.10, 0.10,0.05, and 0.05 were assumed for the breeding sites of 10,20, 30, 40, 50, and 60 mm of capacity, respectively.
d VSdt
PUk
VS VS fHUFP
S V
d VIdt
VS fHUFP
emm m
hu
( ) = − +( ) ⋅ − ⋅ ⋅ ⋅
( ) = ⋅ ⋅
μμ αα _ ,
hhum m
m m
S V VIVIn
d VFdt
VIn
VF
⋅ − +( ) ⋅ −
( ) = − +( ) ⋅
_ ,
.
μμ αα
μμ αα
and
d PDdt
b L PD m PDp p( ) = ⋅ ⋅ − ⋅ .
VS VI VF Rpo FI+ +( ) ⋅
Table 1: Exogenous variables considered for mosquito population
Exogenous variable Used variable Depending on Default value
Hatching time delay kE or R_E [days] Water T (A)Eggs becoming non-viable φE or E_NV [days] Water T (B)Larvae developing time delay kL or R_L [days] Water T (C)Larvae becoming non-viable φL or L_NV [days] Water T (D)Adult emergence time delay kem or R_EM [days] Water T (E)Pupae becoming non-viable φPU, PU_NV [days] Water T (F)Induced mortality of mosquitoes IM_M [days] SEC 98–191.8 [21]Plasmodium species P. falciparumHuman Blood Index HBI [dec] Species 0.38–0.46 [3]Rate of oviposition (eggs per batch) Rpo or R_O [eggs/vector] T, SEC 75–150Degree days required for digestion of blood Dbd [°C-day] RH 36.5 at RH 70–80% [3]Minimum T required for digestion of blood meal Tmin, bd [°] 9.9 [3]Degree days required for parasite development Dm [°-day] Species 100–120 [3]Min T required for parasite development Tmin, p [°] Species 16 [3]
(A) kE represents the average period of time spent in the virtual compartment E (eggs) and denotes the time elapsed between oviposition and the development into larva-1st instar. Values of kE range from 1 1/2 days at 30° to 7 days at 20°, and were estimated under controlled laboratory conditions (CLC) for temperatures of 24, 27, 30, and 33°C. (B) Values of φE range from 5 days for temperatures ≤23°C and ≥31°C, to 50 days at 27°C (under CLC). (C) kL represents the average period of time spent in the virtual compartment L (larvae) and denotes the time elapsed since the eclosion (or larva-1st instar) until the development into pupa. Values of kL may range from 8.9 days at 33°C to 13.6 days at 24°C (under CLC). (D) Values of φL range from 3 days for temperatures ≤23°C and ≥31°C, to 32 days at 27°C (under CLC). (E) kem represents the average period of time spent in the virtual compartment PU (pupae) and denotes the time elapsed between pupation and the emergence of an adult. Values of kem range from 1 day at 33°C to 2 days at 24°C (under CLC). Finally, (F) values of φPU range from 4 days for temperatures ≤23°C and ≥30°C, to 11 days at 27°C (under CLC). For more detail, see Figure 10B. The actual average temperature T must range between Tmin, bd and the maximum temperature of about 40°C (this relationship was estimated for An. maculipennis and is used because it agrees with the observations of other Anopheles species [36,17,37,30,38]).
Page 6 of 30(page number not for citation purposes)
Malaria Journal 2006, 5:66 http://www.malariajournal.com/content/5/1/66
Finally, the carrying capacity of the mosquito populationwas defined assuming a maximum vector-human ratio of30:1.
Study sites and demographic dataPrevious diagnostic studies of the relationship betweenclimate and malaria in Colombia focused on a nation-wide level at yearly timescales [6-8], and on regional andlocal levels at inter-annual, annual and seasonal times-cales [5]. Previous modelling efforts by the research groupwere applied to understand malaria transmission in anendemic site on the Pacific coast of Colombia (the NuquiRegion) [30-32]. For this application, the simulationperiod of the mentioned study site was extended and anew specific area located in the Department of Antioquia,in north-western Colombia (Figure 2) was chosen. Thisarea, or the so-called 'El Bagre' Region, is located in the'Bajo Cauca' Programmatic Area along the floodplains of
the Cauca and Nechi Rivers (Figure 2C). The current totalpopulations in Nuqui and El Bagre localities reach,according to demographic census, 5,324 and 65,342 indi-viduals, respectively, with 2,565 (48,2%) and 24,470inhabitants (37,4%) living in rural areas. Demographicanalysis indicated that the growth rates for these munici-palities reached -0,72% (decrease) and 3,09% (increase),respectively. In the study sites, several climatic, epidemio-logical and entomological data sets were gathered, andmalaria incidences were simulated under conditions ofintense transmission on a daily timescale.
Climate data, missing periods and homogeneity analysisMean daily temperature values [°C], mean daily relativehumidity values [%], and total daily precipitation records[mm] were registered at two nearby weather stations:Amargal at 05°36'N, 77°30'W and altitude 30 m, in the
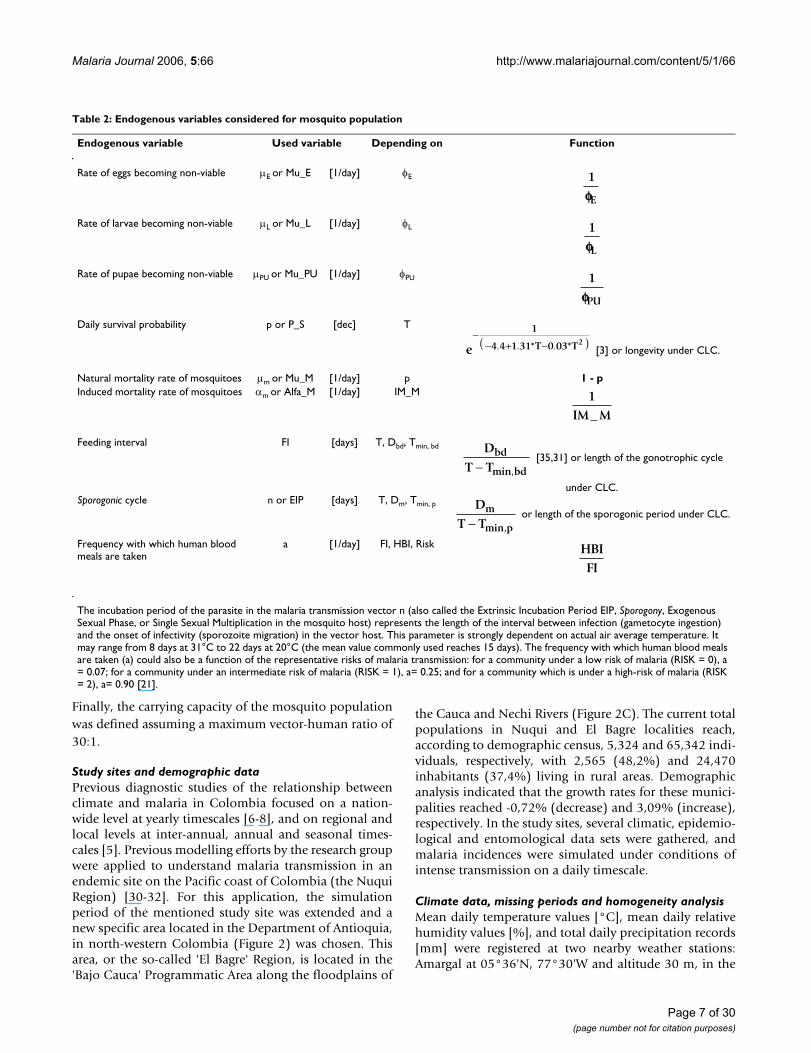
Table 2: Endogenous variables considered for mosquito population
Endogenous variable Used variable Depending on Function
Rate of eggs becoming non-viable μE or Mu_E [1/day] φE
Rate of larvae becoming non-viable μL or Mu_L [1/day] φL
Rate of pupae becoming non-viable μPU or Mu_PU [1/day] φPU
Daily survival probability p or P_S [dec] T
[3] or longevity under CLC.
Natural mortality rate of mosquitoes μm or Mu_M [1/day] p 1 - pInduced mortality rate of mosquitoes αm or Alfa_M [1/day] IM_M
Feeding interval FI [days] T, Dbd, Tmin, bd
[35,31] or length of the gonotrophic cycle
under CLC.Sporogonic cycle n or EIP [days] T, Dm, Tmin, p
or length of the sporogonic period under CLC.
Frequency with which human blood meals are taken
a [1/day] FI, HBI, Risk
The incubation period of the parasite in the malaria transmission vector n (also called the Extrinsic Incubation Period EIP, Sporogony, Exogenous Sexual Phase, or Single Sexual Multiplication in the mosquito host) represents the length of the interval between infection (gametocyte ingestion) and the onset of infectivity (sporozoite migration) in the vector host. This parameter is strongly dependent on actual air average temperature. It may range from 8 days at 31°C to 22 days at 20°C (the mean value commonly used reaches 15 days). The frequency with which human blood meals are taken (a) could also be a function of the representative risks of malaria transmission: for a community under a low risk of malaria (RISK = 0), a = 0.07; for a community under an intermediate risk of malaria (RISK = 1), a= 0.25; and for a community which is under a high-risk of malaria (RISK = 2), a= 0.90 [21].
1
Eφφ
1
Lφφ
1
PUφφ
e
1
4 4 1 31 T 0 03 T2−
− + −( ). . * . *
1IM M_
DT T
bd
min bd− ,
DT T
m
min p− ,
HBIFI
Page 7 of 30(page number not for citation purposes)
Malaria Journal 2006, 5:66 http://www.malariajournal.com/content/5/1/66
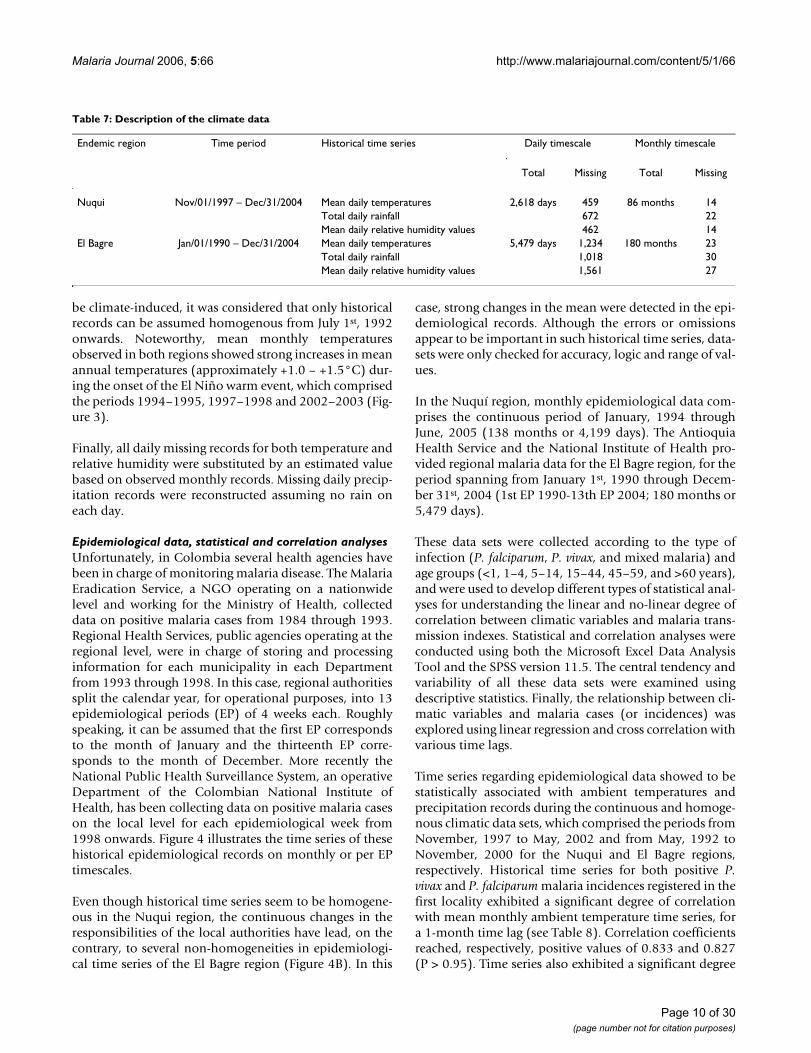
Nuqui Region, and Caseri at 07°49'N, 74°55'W and 400m, in the El Bagre Region. Data pertaining to the periodscomprising from November 1st, 1997 through December31st, 2004 (2,618 days or 86 months) and from January1st, 1990 through December 31st, 2004 (5,479 days or 180months) were obtained for the Nuqui and El Bagreendemic areas, respectively. Figure 3 illustrates the timeseries of these historical hydroclimatic records on amonthly timescale. Detailed information of available andmissing periods for the weather stations is presented inTable 7.
As mentioned above, homogeneity analyses were con-ducted to detect changes in the mean, variance, as well assignificant trends in the climatic data sets. To detect thepoint of change in the mean and/or the variance in eachsingle hydrological time series the Bayesian Analysis (BA)and the Abbe' Criterion for Homogeneity Test were used,both at a 0.05 significance level. The BA allowed deter-
mining the mean and the mode of the strongest point ofchange (NC point) and the mean of the total amount ofchange. The Abbe test allowed determining whether thehypothesis of homogeneity of each historical time seriescould be accepted or rejected.
To detect changes in the variance of each single hydrolog-ical time series (using the point of change estimated bythe BA), the Simple F Test, the Simple F Test with correc-tions of dependence, the Modified F Test using both Chi-square and F distributions, the Ansari-Bradley Test, theBartlett Test, and the Levene Test were conducted, all at a0.05 significance level.
To detect changes in the mean of each single hydrologicaltime series (using the point of change estimated by theBA), the Mann-Whitney/Wilcoxon Rank Sum Test, theSimple T Test assuming change and no change in the var-iance, the Modified T Test assuming change and no
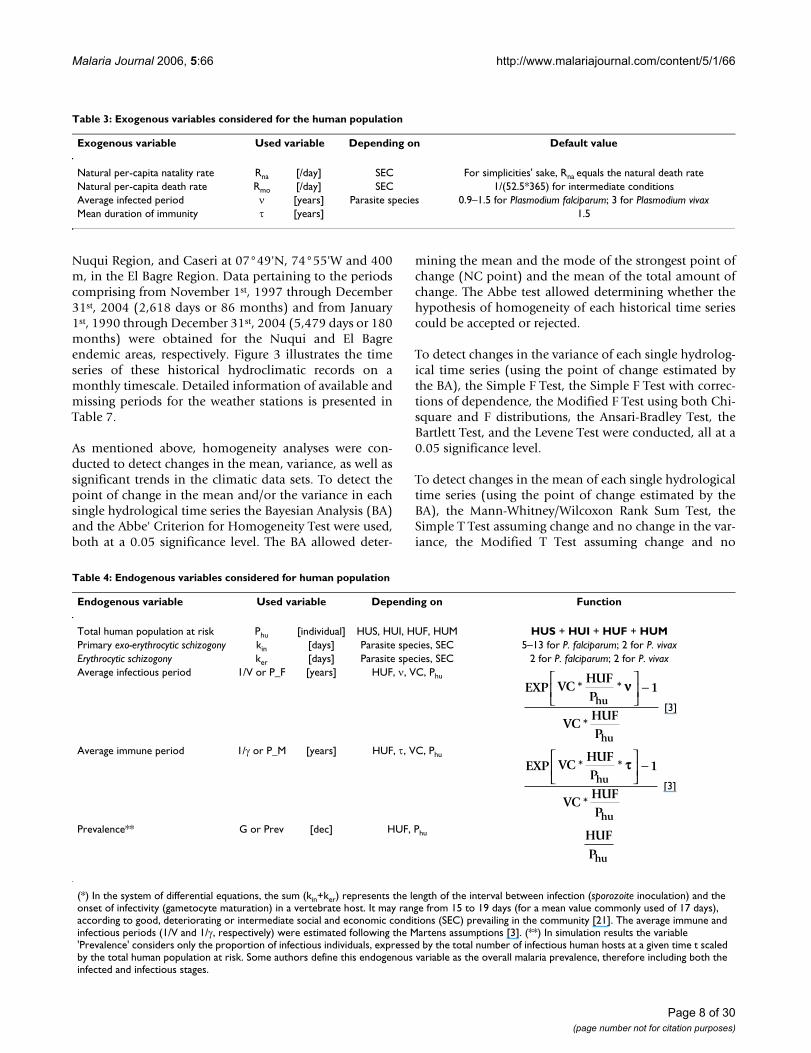
Table 4: Endogenous variables considered for human population
Endogenous variable Used variable Depending on Function
Total human population at risk Phu [individual] HUS, HUI, HUF, HUM HUS + HUI + HUF + HUMPrimary exo-erythrocytic schizogony kin [days] Parasite species, SEC 5–13 for P. falciparum; 2 for P. vivaxErythrocytic schizogony ker [days] Parasite species, SEC 2 for P. falciparum; 2 for P. vivaxAverage infectious period 1/V or P_F [years] HUF, ν, VC, Phu
[3]
Average immune period 1/γ or P_M [years] HUF, τ, VC, Phu
[3]
Prevalence** G or Prev [dec] HUF, Phu
(*) In the system of differential equations, the sum (kin+ker) represents the length of the interval between infection (sporozoite inoculation) and the onset of infectivity (gametocyte maturation) in a vertebrate host. It may range from 15 to 19 days (for a mean value commonly used of 17 days), according to good, deteriorating or intermediate social and economic conditions (SEC) prevailing in the community [21]. The average immune and infectious periods (1/V and 1/γ, respectively) were estimated following the Martens assumptions [3]. (**) In simulation results the variable 'Prevalence' considers only the proportion of infectious individuals, expressed by the total number of infectious human hosts at a given time t scaled by the total human population at risk. Some authors define this endogenous variable as the overall malaria prevalence, therefore including both the infected and infectious stages.
EXP VCHUFP
1
VCHUFP
hu
hu
* *
*
νν⎡⎣⎢
⎤⎦⎥
−
EXP VCHUFP
1
VCHUFP
hu
hu
* *
*
ττ⎡⎣⎢
⎤⎦⎥
−
HUFPhu
Table 3: Exogenous variables considered for the human population
Exogenous variable Used variable Depending on Default value
Natural per-capita natality rate Rna [/day] SEC For simplicities' sake, Rna equals the natural death rateNatural per-capita death rate Rmo [/day] SEC 1/(52.5*365) for intermediate conditionsAverage infected period ν [years] Parasite species 0.9–1.5 for Plasmodium falciparum; 3 for Plasmodium vivaxMean duration of immunity τ [years] 1.5
Page 8 of 30(page number not for citation purposes)
Malaria Journal 2006, 5:66 http://www.malariajournal.com/content/5/1/66
change in the variance, the Simple T Test with correctionsof dependence assuming change and no change in the var-iance, and the Kruskal-Wallis Test were conducted, all at a0.05 significance level.
To detect trends in the historical time series (free of sea-sonality) the T Test for the detection of linear trends, theHotelling-Pabst Test, the Man-Kendall Test, and the SenTest were conducted, all at a 0.05 significance level.
Finally, to detect trends in the seasonal time series the TTest for the detection of linear trends, the Hotelling-PabstTest, the Seasonal Kendall Test, and the Seasonal Homo-geneity of Trends Test were conducted, all at a 0.05 signif-icance level.
All these hypotheses tests were run using the ASH (Analy-sis of Historical Time Series) Software developed by J.D.Salas and R.A. Smith at the Hydrology and WaterResources Program, Colorado State University, andrecently modified at the Water Resources Graduate Pro-gram, National University of Colombia at Medellin.
The hypotheses tests for detecting non-homogeneities intime series recorded in the Nuqui Region showed that thehistorical records are homogeneous for the entire availa-ble period (results not shown). Both time series of meanmonthly temperatures and mean monthly relative humid-ity values registered in the El Bagre region exhibit, on theother hand, strong non-stationarities in the mean and var-iance in May, 1992 (Figure 3B). As the shift showed not to
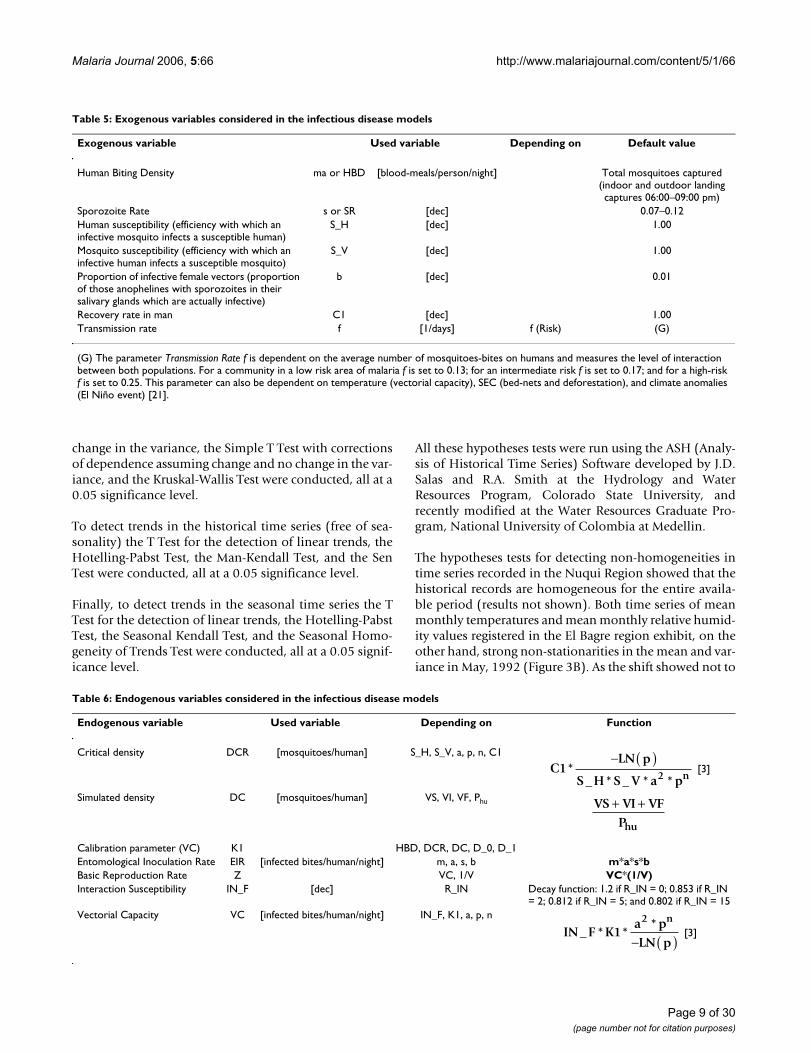
Table 6: Endogenous variables considered in the infectious disease models
Endogenous variable Used variable Depending on Function
Critical density DCR [mosquitoes/human] S_H, S_V, a, p, n, C1
[3]
Simulated density DC [mosquitoes/human] VS, VI, VF, Phu
Calibration parameter (VC) K1 HBD, DCR, DC, D_0, D_1Entomological Inoculation Rate EIR [infected bites/human/night] m, a, s, b m*a*s*bBasic Reproduction Rate Z VC, 1/V VC*(1/V)Interaction Susceptibility IN_F [dec] R_IN Decay function: 1.2 if R_IN = 0; 0.853 if R_IN
= 2; 0.812 if R_IN = 5; and 0.802 if R_IN = 15Vectorial Capacity VC [infected bites/human/night] IN_F, K1, a, p, n
[3]
C1LN p
S H S V a p2 n*
_ * _ * *
− ( )
VS VI VFPhu
+ +
IN F K1a pLN p
2 n_ * *
*− ( )
Table 5: Exogenous variables considered in the infectious disease models
Exogenous variable Used variable Depending on Default value
Human Biting Density ma or HBD [blood-meals/person/night] Total mosquitoes captured (indoor and outdoor landing captures 06:00–09:00 pm)
Sporozoite Rate s or SR [dec] 0.07–0.12Human susceptibility (efficiency with which an infective mosquito infects a susceptible human)
S_H [dec] 1.00
Mosquito susceptibility (efficiency with which an infective human infects a susceptible mosquito)
S_V [dec] 1.00
Proportion of infective female vectors (proportion of those anophelines with sporozoites in their salivary glands which are actually infective)
b [dec] 0.01
Recovery rate in man C1 [dec] 1.00Transmission rate f [1/days] f (Risk) (G)
(G) The parameter Transmission Rate f is dependent on the average number of mosquitoes-bites on humans and measures the level of interaction between both populations. For a community in a low risk area of malaria f is set to 0.13; for an intermediate risk f is set to 0.17; and for a high-risk f is set to 0.25. This parameter can also be dependent on temperature (vectorial capacity), SEC (bed-nets and deforestation), and climate anomalies (El Niño event) [21].
Page 9 of 30(page number not for citation purposes)
Malaria Journal 2006, 5:66 http://www.malariajournal.com/content/5/1/66
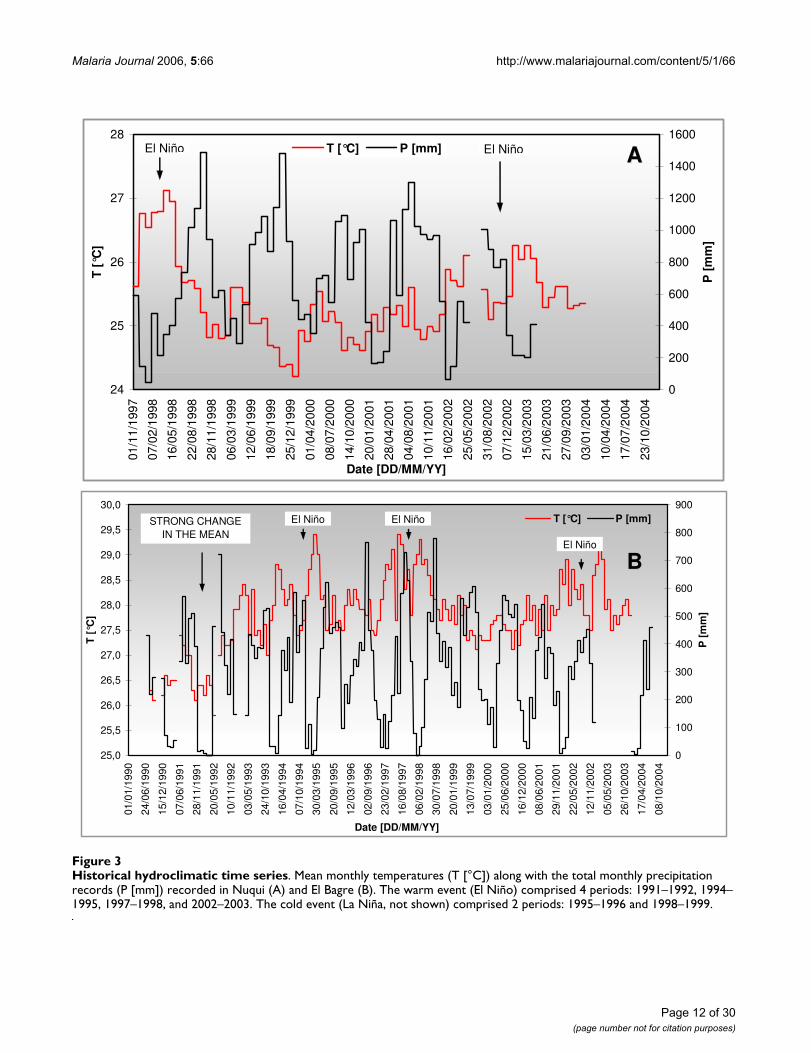
be climate-induced, it was considered that only historicalrecords can be assumed homogenous from July 1st, 1992onwards. Noteworthy, mean monthly temperaturesobserved in both regions showed strong increases in meanannual temperatures (approximately +1.0 – +1.5°C) dur-ing the onset of the El Niño warm event, which comprisedthe periods 1994–1995, 1997–1998 and 2002–2003 (Fig-ure 3).
Finally, all daily missing records for both temperature andrelative humidity were substituted by an estimated valuebased on observed monthly records. Missing daily precip-itation records were reconstructed assuming no rain oneach day.
Epidemiological data, statistical and correlation analysesUnfortunately, in Colombia several health agencies havebeen in charge of monitoring malaria disease. The MalariaEradication Service, a NGO operating on a nationwidelevel and working for the Ministry of Health, collecteddata on positive malaria cases from 1984 through 1993.Regional Health Services, public agencies operating at theregional level, were in charge of storing and processinginformation for each municipality in each Departmentfrom 1993 through 1998. In this case, regional authoritiessplit the calendar year, for operational purposes, into 13epidemiological periods (EP) of 4 weeks each. Roughlyspeaking, it can be assumed that the first EP correspondsto the month of January and the thirteenth EP corre-sponds to the month of December. More recently theNational Public Health Surveillance System, an operativeDepartment of the Colombian National Institute ofHealth, has been collecting data on positive malaria caseson the local level for each epidemiological week from1998 onwards. Figure 4 illustrates the time series of thesehistorical epidemiological records on monthly or per EPtimescales.
Even though historical time series seem to be homogene-ous in the Nuqui region, the continuous changes in theresponsibilities of the local authorities have lead, on thecontrary, to several non-homogeneities in epidemiologi-cal time series of the El Bagre region (Figure 4B). In this
case, strong changes in the mean were detected in the epi-demiological records. Although the errors or omissionsappear to be important in such historical time series, data-sets were only checked for accuracy, logic and range of val-ues.
In the Nuquí region, monthly epidemiological data com-prises the continuous period of January, 1994 throughJune, 2005 (138 months or 4,199 days). The AntioquiaHealth Service and the National Institute of Health pro-vided regional malaria data for the El Bagre region, for theperiod spanning from January 1st, 1990 through Decem-ber 31st, 2004 (1st EP 1990-13th EP 2004; 180 months or5,479 days).
These data sets were collected according to the type ofinfection (P. falciparum, P. vivax, and mixed malaria) andage groups (<1, 1–4, 5–14, 15–44, 45–59, and >60 years),and were used to develop different types of statistical anal-yses for understanding the linear and no-linear degree ofcorrelation between climatic variables and malaria trans-mission indexes. Statistical and correlation analyses wereconducted using both the Microsoft Excel Data AnalysisTool and the SPSS version 11.5. The central tendency andvariability of all these data sets were examined usingdescriptive statistics. Finally, the relationship between cli-matic variables and malaria cases (or incidences) wasexplored using linear regression and cross correlation withvarious time lags.
Time series regarding epidemiological data showed to bestatistically associated with ambient temperatures andprecipitation records during the continuous and homoge-nous climatic data sets, which comprised the periods fromNovember, 1997 to May, 2002 and from May, 1992 toNovember, 2000 for the Nuqui and El Bagre regions,respectively. Historical time series for both positive P.vivax and P. falciparum malaria incidences registered in thefirst locality exhibited a significant degree of correlationwith mean monthly ambient temperature time series, fora 1-month time lag (see Table 8). Correlation coefficientsreached, respectively, positive values of 0.833 and 0.827(P > 0.95). Time series also exhibited a significant degree
Table 7: Description of the climate data
Endemic region Time period Historical time series Daily timescale Monthly timescale
Total Missing Total Missing
Nuqui Nov/01/1997 – Dec/31/2004 Mean daily temperatures 2,618 days 459 86 months 14Total daily rainfall 672 22Mean daily relative humidity values 462 14
El Bagre Jan/01/1990 – Dec/31/2004 Mean daily temperatures 5,479 days 1,234 180 months 23Total daily rainfall 1,018 30Mean daily relative humidity values 1,561 27
Page 10 of 30(page number not for citation purposes)
Malaria Journal 2006, 5:66 http://www.malariajournal.com/content/5/1/66
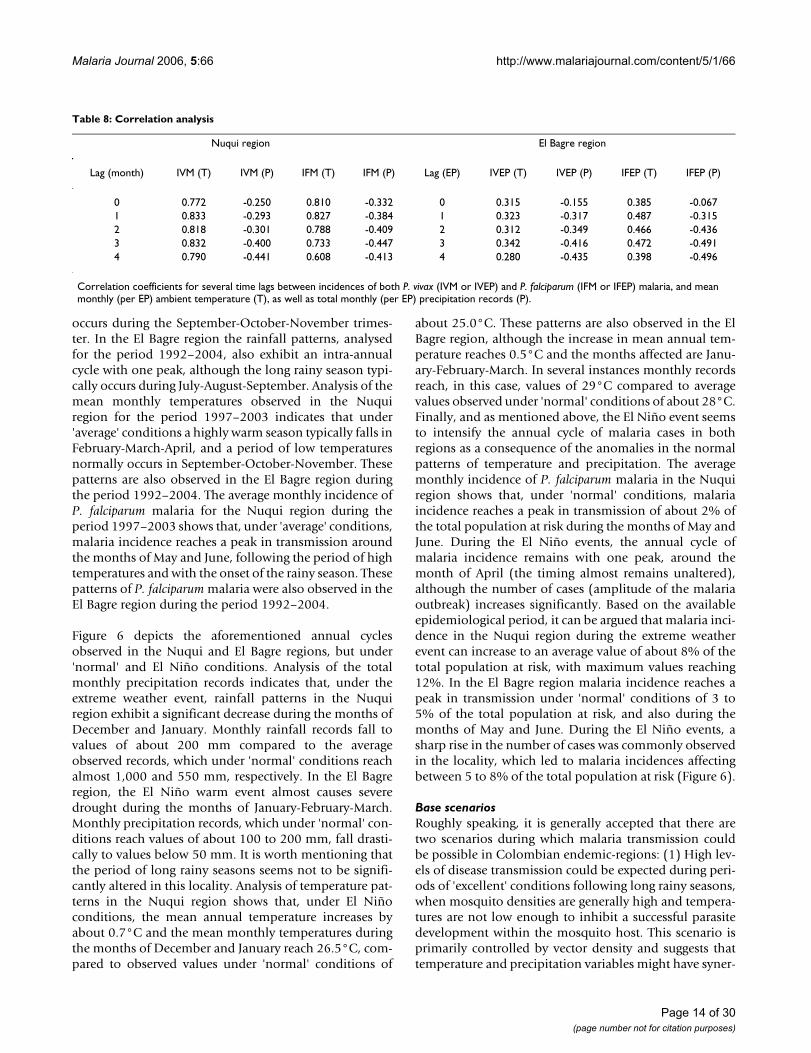
of correlation with total monthly precipitation time seriesfor a 3-months time lag. In this case, correlation coeffi-cients reached, respectively, negative values of -0.400 and-0.447 (P > 0.95). P. vivax and P. falciparum malaria inci-dences observed in the El Bagre region (per epidemiolog-ical period) were positively correlated with meantemperatures (R = 0.323 and R = 0.487, respectively), fora time lag of 1 EP (Table 8). Analyses show that precipita-tion time series has a lag of 4 EP and negative correlationcoefficients of about -0.435 and -0.496 (P > 0.95).
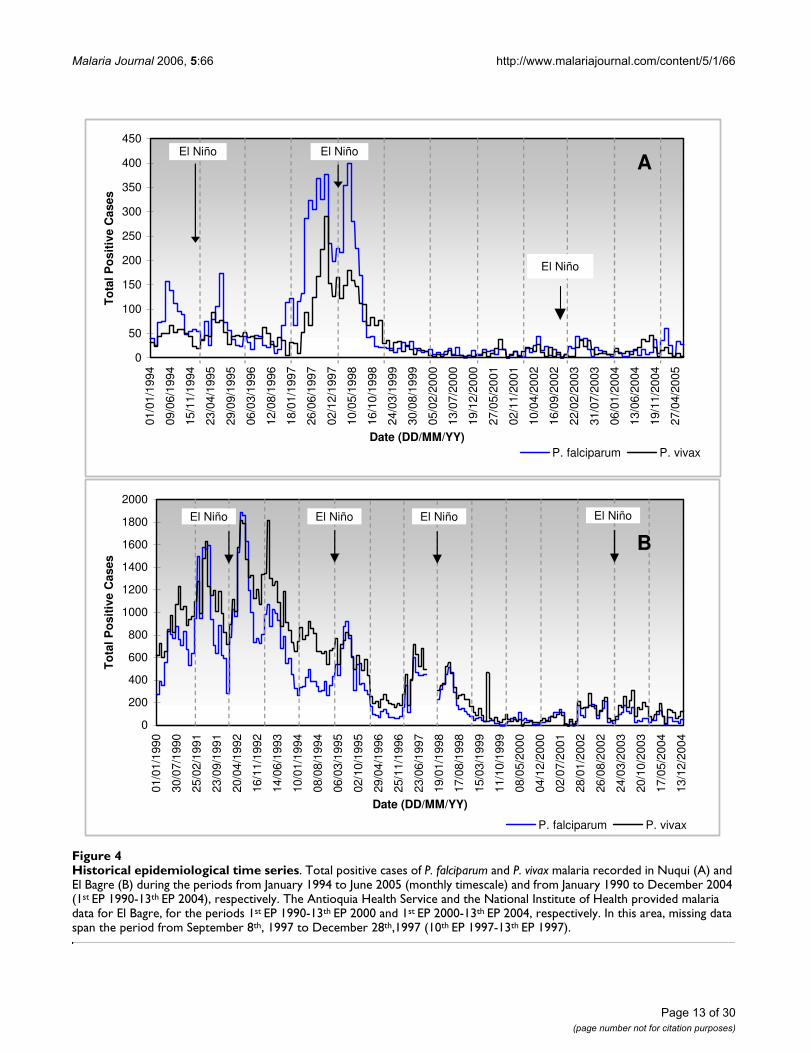
Finally, correlation analyses show that epidemiologicaltime series seem to be strongly associated with mean tem-peratures, particularly during the onset of the El Niño
warm event, as shown in Figure 4. Noteworthy, similarincrements in the number of malaria cases during the ElNiño event have been found throughout Colombia[5,6,33,34].
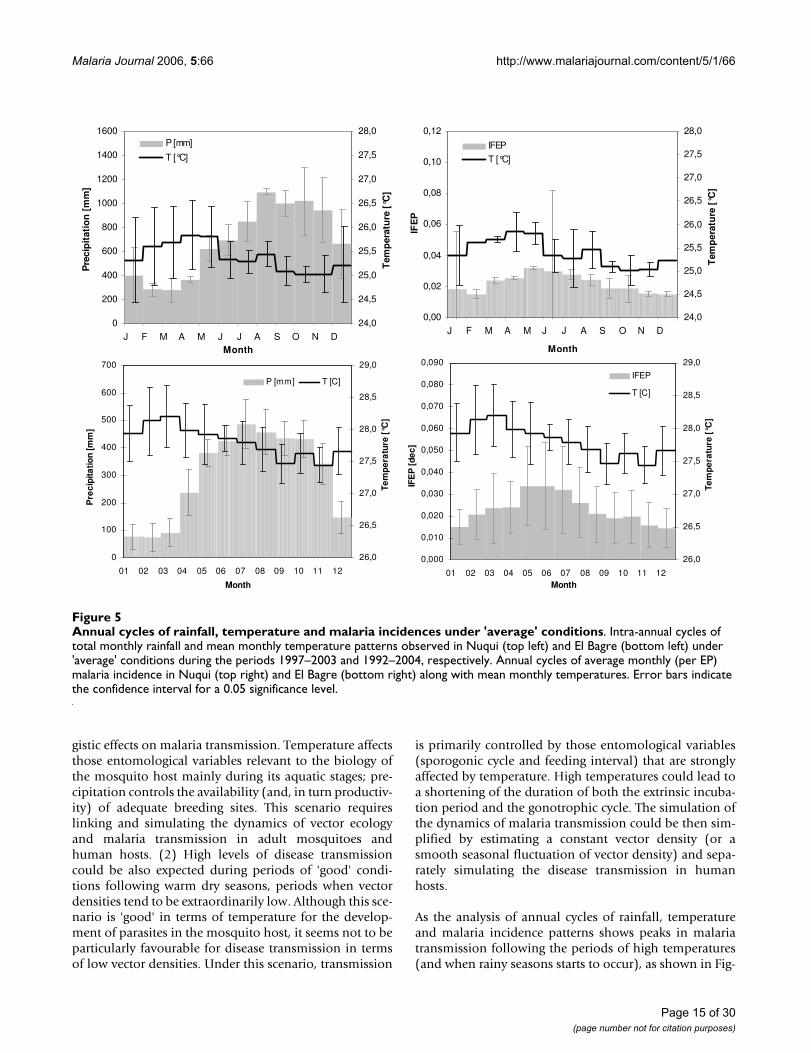
Figure 5 depicts the intra-annual cycles of rainfall andtemperature patterns observed in the Nuqui and El Bagreregions under 'average' conditions, along with the averagemonthly (or per epidemiological period) P. falciparummalaria incidences. Analysis of total monthly precipita-tion records for the period 1997–2003 indicates thatunder 'average' conditions the rainfall patterns in theNuqui region exhibit an intra-annual cycle with one peak,corresponding to the rainy season, which commonly
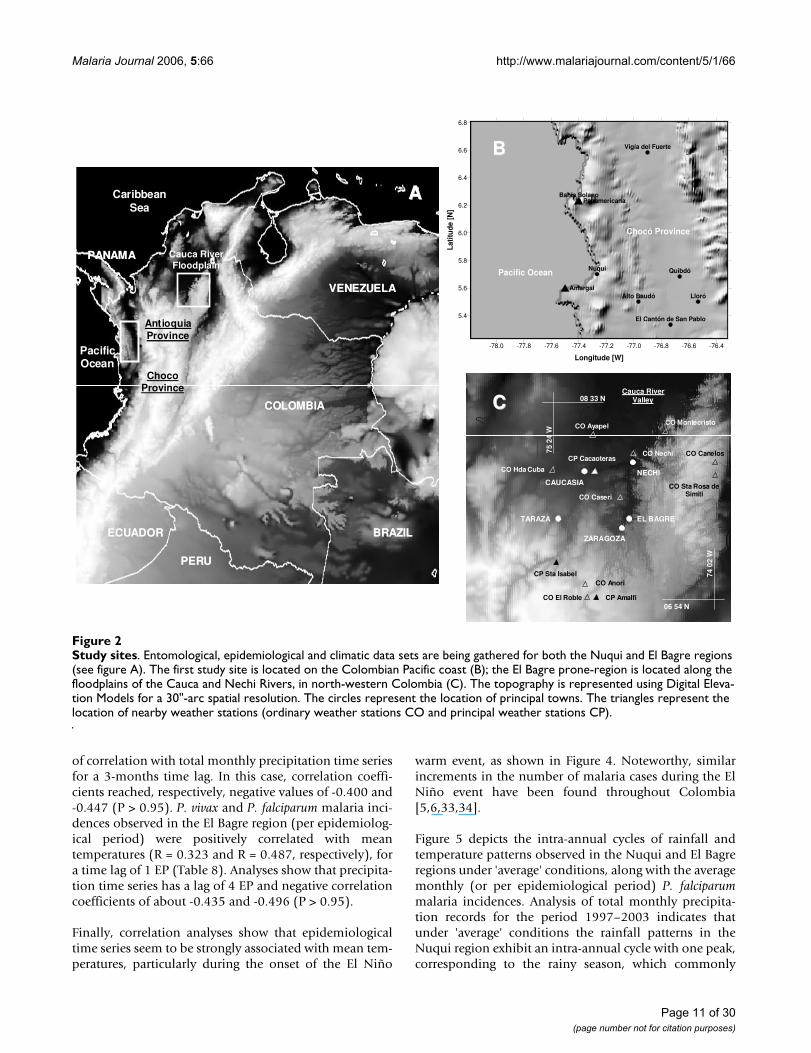
Study sitesFigure 2Study sites. Entomological, epidemiological and climatic data sets are being gathered for both the Nuqui and El Bagre regions (see figure A). The first study site is located on the Colombian Pacific coast (B); the El Bagre prone-region is located along the floodplains of the Cauca and Nechi Rivers, in north-western Colombia (C). The topography is represented using Digital Eleva-tion Models for a 30"-arc spatial resolution. The circles represent the location of principal towns. The triangles represent the location of nearby weather stations (ordinary weather stations CO and principal weather stations CP).
Caribbean Sea
VENEZUELAVENEZUELA
COLOMBIACOLOMBIA
BRAZILBRAZIL
PERUPERU
ECUADORECUADOR
Pacific Ocean
Antioquia Province
PANAMAPANAMA Cauca River Floodplain
Amargal
Panamericana
Vigía del Fuerte
Bahía Solano
Nuquí Quibdó
Alto Baudó Lloró
El Cantón de San Pablo
-78.0 -77.8 -77.6 -77.4 -77.2 -77.0 -76.8 -76.6 -76.4
Longitude [W]
5.4
5.6
5.8
6.0
6.2
6.4
6.6
6.8
Lat
itude
[N]
Pacific Ocean
Chocó Province
NECHICAUCASIA
TARAZA
ZARAGOZA
EL BAGRE
Cauca River Valley
CP Cacaoteras
CP Sta Isabel
CP Amalfi
CO Ayapel CO Montecristo
CO Nechi
CO Hda Cuba
CO Canelos
CO Sta Rosa de SimitiCO Caseri
CO Anori
CO El Roble
74 0
2 W
06 54 N
75 2
4 W
08 33 N
Choco Province
AA
BB
CC
Page 11 of 30(page number not for citation purposes)
Malaria Journal 2006, 5:66 http://www.malariajournal.com/content/5/1/66
Page 12 of 30(page number not for citation purposes)
Historical hydroclimatic time seriesFigure 3Historical hydroclimatic time series. Mean monthly temperatures (T [°C]) along with the total monthly precipitation records (P [mm]) recorded in Nuqui (A) and El Bagre (B). The warm event (El Niño) comprised 4 periods: 1991–1992, 1994–1995, 1997–1998, and 2002–2003. The cold event (La Niña, not shown) comprised 2 periods: 1995–1996 and 1998–1999.
24
25
26
27
2801
/11/
1997
07/0
2/19
98
16/0
5/19
98
22/0
8/19
98
28/1
1/19
98
06/0
3/19
99
12/0
6/19
99
18/0
9/19
99
25/1
2/19
99
01/0
4/20
00
08/0
7/20
00
14/1
0/20
00
20/0
1/20
01
28/0
4/20
01
04/0
8/20
01
10/1
1/20
01
16/0
2/20
02
25/0
5/20
02
31/0
8/20
02
07/1
2/20
02
15/0
3/20
03
21/0
6/20
03
27/0
9/20
03
03/0
1/20
04
10/0
4/20
04
17/0
7/20
04
23/1
0/20
04
Date [DD/MM/YY]
T [
°C]
0
200
400
600
800
1000
1200
1400
1600
P [
mm
]
T [°C] P [mm]El Niño El Niño
25,0
25,5
26,0
26,5
27,0
27,5
28,0
28,5
29,0
29,5
30,0
01/0
1/19
90
24/0
6/19
90
15/1
2/19
90
07/0
6/19
91
28/1
1/19
91
20/0
5/19
92
10/1
1/19
92
03/0
5/19
93
24/1
0/19
93
16/0
4/19
94
07/1
0/19
94
30/0
3/19
95
20/0
9/19
95
12/0
3/19
96
02/0
9/19
96
23/0
2/19
97
16/0
8/19
97
06/0
2/19
98
30/0
7/19
98
20/0
1/19
99
13/0
7/19
99
03/0
1/20
00
25/0
6/20
00
16/1
2/20
00
08/0
6/20
01
29/1
1/20
01
22/0
5/20
02
12/1
1/20
02
05/0
5/20
03
26/1
0/20
03
17/0
4/20
04
08/1
0/20
04
Date [DD/MM/YY]
T [
°C]
0
100
200
300
400
500
600
700
800
900
P [
mm
]
T [°C] P [mm]El Niño El Niño
El Niño
STRONG CHANGE IN THE MEAN
AA
BB
Malaria Journal 2006, 5:66 http://www.malariajournal.com/content/5/1/66
Page 13 of 30(page number not for citation purposes)
Historical epidemiological time seriesFigure 4Historical epidemiological time series. Total positive cases of P. falciparum and P. vivax malaria recorded in Nuqui (A) and El Bagre (B) during the periods from January 1994 to June 2005 (monthly timescale) and from January 1990 to December 2004 (1st EP 1990-13th EP 2004), respectively. The Antioquia Health Service and the National Institute of Health provided malaria data for El Bagre, for the periods 1st EP 1990-13th EP 2000 and 1st EP 2000-13th EP 2004, respectively. In this area, missing data span the period from September 8th, 1997 to December 28th,1997 (10th EP 1997-13th EP 1997).
0
50
100
150
200
250
300
350
400
45001
/01/
1994
09/0
6/19
94
15/1
1/19
94
23/0
4/19
95
29/0
9/19
95
06/0
3/19
96
12/0
8/19
96
18/0
1/19
97
26/0
6/19
97
02/1
2/19
97
10/0
5/19
98
16/1
0/19
98
24/0
3/19
99
30/0
8/19
99
05/0
2/20
00
13/0
7/20
00
19/1
2/20
00
27/0
5/20
01
02/1
1/20
01
10/0
4/20
02
16/0
9/20
02
22/0
2/20
03
31/0
7/20
03
06/0
1/20
04
13/0
6/20
04
19/1
1/20
04
27/0
4/20
05
Date (DD/MM/YY)
To
tal P
osi
tive
Cas
es
P. falciparum P. vivax
El NiñoEl Niño
0
200
400
600
800
1000
1200
1400
1600
1800
2000
01/0
1/19
90
30/0
7/19
90
25/0
2/19
91
23/0
9/19
91
20/0
4/19
92
16/1
1/19
92
14/0
6/19
93
10/0
1/19
94
08/0
8/19
94
06/0
3/19
95
02/1
0/19
95
29/0
4/19
96
25/1
1/19
96
23/0
6/19
97
19/0
1/19
98
17/0
8/19
98
15/0
3/19
99
11/1
0/19
99
08/0
5/20
00
04/1
2/20
00
02/0
7/20
01
28/0
1/20
02
26/0
8/20
02
24/0
3/20
03
20/1
0/20
03
17/0
5/20
04
13/1
2/20
04
Date (DD/MM/YY)
To
tal P
osi
tive
Cas
es
P. falciparum P. vivax
El Niño El Niño El Niño El Niño
AA
BB
El Niño
Malaria Journal 2006, 5:66 http://www.malariajournal.com/content/5/1/66
occurs during the September-October-November trimes-ter. In the El Bagre region the rainfall patterns, analysedfor the period 1992–2004, also exhibit an intra-annualcycle with one peak, although the long rainy season typi-cally occurs during July-August-September. Analysis of themean monthly temperatures observed in the Nuquiregion for the period 1997–2003 indicates that under'average' conditions a highly warm season typically falls inFebruary-March-April, and a period of low temperaturesnormally occurs in September-October-November. Thesepatterns are also observed in the El Bagre region duringthe period 1992–2004. The average monthly incidence ofP. falciparum malaria for the Nuqui region during theperiod 1997–2003 shows that, under 'average' conditions,malaria incidence reaches a peak in transmission aroundthe months of May and June, following the period of hightemperatures and with the onset of the rainy season. Thesepatterns of P. falciparum malaria were also observed in theEl Bagre region during the period 1992–2004.
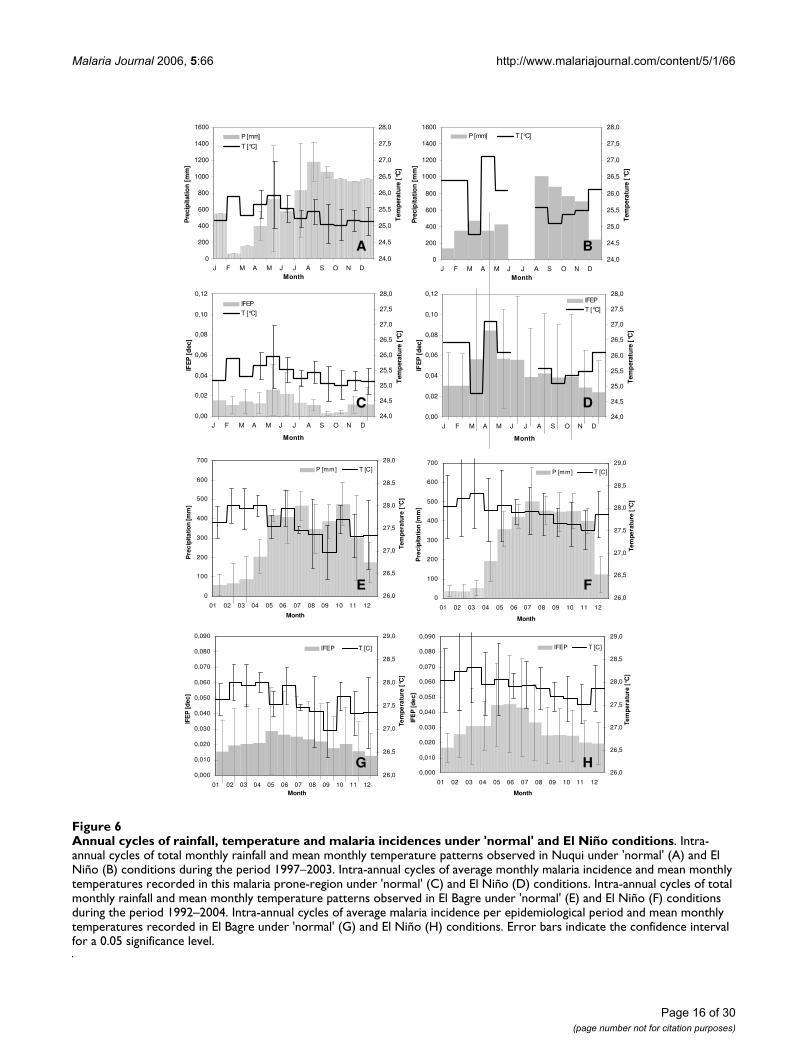
Figure 6 depicts the aforementioned annual cyclesobserved in the Nuqui and El Bagre regions, but under'normal' and El Niño conditions. Analysis of the totalmonthly precipitation records indicates that, under theextreme weather event, rainfall patterns in the Nuquiregion exhibit a significant decrease during the months ofDecember and January. Monthly rainfall records fall tovalues of about 200 mm compared to the averageobserved records, which under 'normal' conditions reachalmost 1,000 and 550 mm, respectively. In the El Bagreregion, the El Niño warm event almost causes severedrought during the months of January-February-March.Monthly precipitation records, which under 'normal' con-ditions reach values of about 100 to 200 mm, fall drasti-cally to values below 50 mm. It is worth mentioning thatthe period of long rainy seasons seems not to be signifi-cantly altered in this locality. Analysis of temperature pat-terns in the Nuqui region shows that, under El Niñoconditions, the mean annual temperature increases byabout 0.7°C and the mean monthly temperatures duringthe months of December and January reach 26.5°C, com-pared to observed values under 'normal' conditions of
about 25.0°C. These patterns are also observed in the ElBagre region, although the increase in mean annual tem-perature reaches 0.5°C and the months affected are Janu-ary-February-March. In several instances monthly recordsreach, in this case, values of 29°C compared to averagevalues observed under 'normal' conditions of about 28°C.Finally, and as mentioned above, the El Niño event seemsto intensify the annual cycle of malaria cases in bothregions as a consequence of the anomalies in the normalpatterns of temperature and precipitation. The averagemonthly incidence of P. falciparum malaria in the Nuquiregion shows that, under 'normal' conditions, malariaincidence reaches a peak in transmission of about 2% ofthe total population at risk during the months of May andJune. During the El Niño events, the annual cycle ofmalaria incidence remains with one peak, around themonth of April (the timing almost remains unaltered),although the number of cases (amplitude of the malariaoutbreak) increases significantly. Based on the availableepidemiological period, it can be argued that malaria inci-dence in the Nuqui region during the extreme weatherevent can increase to an average value of about 8% of thetotal population at risk, with maximum values reaching12%. In the El Bagre region malaria incidence reaches apeak in transmission under 'normal' conditions of 3 to5% of the total population at risk, and also during themonths of May and June. During the El Niño events, asharp rise in the number of cases was commonly observedin the locality, which led to malaria incidences affectingbetween 5 to 8% of the total population at risk (Figure 6).
Base scenariosRoughly speaking, it is generally accepted that there aretwo scenarios during which malaria transmission couldbe possible in Colombian endemic-regions: (1) High lev-els of disease transmission could be expected during peri-ods of 'excellent' conditions following long rainy seasons,when mosquito densities are generally high and tempera-tures are not low enough to inhibit a successful parasitedevelopment within the mosquito host. This scenario isprimarily controlled by vector density and suggests thattemperature and precipitation variables might have syner-
Table 8: Correlation analysis
Nuqui region El Bagre region
Lag (month) IVM (T) IVM (P) IFM (T) IFM (P) Lag (EP) IVEP (T) IVEP (P) IFEP (T) IFEP (P)
0 0.772 -0.250 0.810 -0.332 0 0.315 -0.155 0.385 -0.0671 0.833 -0.293 0.827 -0.384 1 0.323 -0.317 0.487 -0.3152 0.818 -0.301 0.788 -0.409 2 0.312 -0.349 0.466 -0.4363 0.832 -0.400 0.733 -0.447 3 0.342 -0.416 0.472 -0.4914 0.790 -0.441 0.608 -0.413 4 0.280 -0.435 0.398 -0.496
Correlation coefficients for several time lags between incidences of both P. vivax (IVM or IVEP) and P. falciparum (IFM or IFEP) malaria, and mean monthly (per EP) ambient temperature (T), as well as total monthly (per EP) precipitation records (P).
Page 14 of 30(page number not for citation purposes)
Malaria Journal 2006, 5:66 http://www.malariajournal.com/content/5/1/66
gistic effects on malaria transmission. Temperature affectsthose entomological variables relevant to the biology ofthe mosquito host mainly during its aquatic stages; pre-cipitation controls the availability (and, in turn productiv-ity) of adequate breeding sites. This scenario requireslinking and simulating the dynamics of vector ecologyand malaria transmission in adult mosquitoes andhuman hosts. (2) High levels of disease transmissioncould be also expected during periods of 'good' condi-tions following warm dry seasons, periods when vectordensities tend to be extraordinarily low. Although this sce-nario is 'good' in terms of temperature for the develop-ment of parasites in the mosquito host, it seems not to beparticularly favourable for disease transmission in termsof low vector densities. Under this scenario, transmission
is primarily controlled by those entomological variables(sporogonic cycle and feeding interval) that are stronglyaffected by temperature. High temperatures could lead toa shortening of the duration of both the extrinsic incuba-tion period and the gonotrophic cycle. The simulation ofthe dynamics of malaria transmission could be then sim-plified by estimating a constant vector density (or asmooth seasonal fluctuation of vector density) and sepa-rately simulating the disease transmission in humanhosts.
As the analysis of annual cycles of rainfall, temperatureand malaria incidence patterns shows peaks in malariatransmission following the periods of high temperatures(and when rainy seasons starts to occur), as shown in Fig-
Annual cycles of rainfall, temperature and malaria incidences under 'average' conditionsFigure 5Annual cycles of rainfall, temperature and malaria incidences under 'average' conditions. Intra-annual cycles of total monthly rainfall and mean monthly temperature patterns observed in Nuqui (top left) and El Bagre (bottom left) under 'average' conditions during the periods 1997–2003 and 1992–2004, respectively. Annual cycles of average monthly (per EP) malaria incidence in Nuqui (top right) and El Bagre (bottom right) along with mean monthly temperatures. Error bars indicate the confidence interval for a 0.05 significance level.
0
200
400
600
800
1000
1200
1400
1600
J F M A M J J A S O N DMonth
Pre
cip
itat
ion
[m
m]
24,0
24,5
25,0
25,5
26,0
26,5
27,0
27,5
28,0
Tem
per
atu
re [
°C]
P [mm]
T [°C]
0,00
0,02
0,04
0,06
0,08
0,10
0,12
J F M A M J J A S O N D
Month
IFE
P
24,0
24,5
25,0
25,5
26,0
26,5
27,0
27,5
28,0
Tem
per
atu
re [
°C]
IFEP
T [°C]
0
100
200
300
400
500
600
700
01 02 03 04 05 06 07 08 09 10 11 12
Month
Pre
cipi
tatio
n [m
m]
26,0
26,5
27,0
27,5
28,0
28,5
29,0
Tem
per
atu
re [°
C]
P [mm] T [C]
0,000
0,010
0,020
0,030
0,040
0,050
0,060
0,070
0,080
0,090
01 02 03 04 05 06 07 08 09 10 11 12Month
IFE
P [d
ec]
26,0
26,5
27,0
27,5
28,0
28,5
29,0
Tem
pera
ture
[°C
]
IFEP
T [C]
Page 15 of 30(page number not for citation purposes)
Malaria Journal 2006, 5:66 http://www.malariajournal.com/content/5/1/66
Page 16 of 30(page number not for citation purposes)
Annual cycles of rainfall, temperature and malaria incidences under 'normal' and El Niño conditionsFigure 6Annual cycles of rainfall, temperature and malaria incidences under 'normal' and El Niño conditions. Intra-annual cycles of total monthly rainfall and mean monthly temperature patterns observed in Nuqui under 'normal' (A) and El Niño (B) conditions during the period 1997–2003. Intra-annual cycles of average monthly malaria incidence and mean monthly temperatures recorded in this malaria prone-region under 'normal' (C) and El Niño (D) conditions. Intra-annual cycles of total monthly rainfall and mean monthly temperature patterns observed in El Bagre under 'normal' (E) and El Niño (F) conditions during the period 1992–2004. Intra-annual cycles of average malaria incidence per epidemiological period and mean monthly temperatures recorded in El Bagre under 'normal' (G) and El Niño (H) conditions. Error bars indicate the confidence interval for a 0.05 significance level.
0
200
400
600
800
1000
1200
1400
1600
J F M A M J J A S O N DMonth
Pre
cip
itat
ion
[m
m]
24,0
24,5
25,0
25,5
26,0
26,5
27,0
27,5
28,0
Tem
per
atu
re [
°C]
P [mm]
T [°C]
0
200
400
600
800
1000
1200
1400
1600
J F M A M J J A S O N DMonth
Pre
cip
itat
ion
[m
m]
24,0
24,5
25,0
25,5
26,0
26,5
27,0
27,5
28,0
Tem
per
atu
re [
°C]
P [mm] T [°C]
0,00
0,02
0,04
0,06
0,08
0,10
0,12
J F M A M J J A S O N D
Month
IFE
P [
dec
]
24,0
24,5
25,0
25,5
26,0
26,5
27,0
27,5
28,0
Tem
per
atu
re [
°C]
IFEP
T [°C]
0,00
0,02
0,04
0,06
0,08
0,10
0,12
J F M A M J J A S O N D
Month
IFE
P [
dec
]24,0
24,5
25,0
25,5
26,0
26,5
27,0
27,5
28,0
Tem
per
atu
re [
°C]
IFEP
T [°C]
0
100
200
300
400
500
600
700
01 02 03 04 05 06 07 08 09 10 11 12
Month
Pre
cipi
tatio
n [m
m]
26,0
26,5
27,0
27,5
28,0
28,5
29,0
Tem
pera
ture
[°C
]
P [mm] T [C]
0
100
200
300
400
500
600
700
01 02 03 04 05 06 07 08 09 10 11 12
Month
Pre
cipi
tatio
n [m
m]
26,0
26,5
27,0
27,5
28,0
28,5
29,0
Tem
pera
ture
[°C
]
P [mm] T [C]
0,000
0,010
0,020
0,030
0,040
0,050
0,060
0,070
0,080
0,090
01 02 03 04 05 06 07 08 09 10 11 12Month
IFE
P [d
ec]
26,0
26,5
27,0
27,5
28,0
28,5
29,0
Tem
pera
ture
[°C
]
IFEP T [C]
0,000
0,010
0,020
0,030
0,040
0,050
0,060
0,070
0,080
0,090
01 02 03 04 05 06 07 08 09 10 11 12
Month
IFE
P [d
ec]
26,0
26,5
27,0
27,5
28,0
28,5
29,0
Tem
pera
ture
[°C
]
IFEP T [C]
AA BB
CC DD
EE FF
GG HH
Malaria Journal 2006, 5:66 http://www.malariajournal.com/content/5/1/66
ures 5 and 6, it was proposed the second epidemiologicalscenario discussed above for the Nuqui and El Bagreregions. Hence, malaria transmission was simulatedassuming the Vectorial Capacity infectious disease modelfor specific constant mosquito densities, which were esti-mated through the analysis of the availability of larvalhabitats in the selected localities.
In the Nuqui region monthly values of P. falciparummalaria incidence were modelled for the period ofNovember 1st, 1997 to December 31st, 2003. This periodcorresponds to a simulation exercise of about 2,252 daysor 74 months or, approximately, 6 years (Figure 7A). Theinitial total human population at risk was assumed to beequal to 2,835 people, the population of the locality liv-ing in rural areas at the end of 1997. No human migrationwas assumed to have taken place during the simulationperiod. The initial number of total infectious individualsHUF(0) was assumed to be equal to 377 people, equiva-lent to the total number of positive cases reported duringOctober, 1997. The initial number of total infected indi-viduals HUI(0) was assumed to be equal to 234 people,equivalent to the total number of positive cases reportedduring November, 1997. The initial number of totalimmune individuals HUM(0) was assumed to be equal to326 people, equivalent to the total number of positivecases reported during September, 1997. In this case it wasproposed that individuals remained in the infectious stageduring a short period of time (greater, but close to theduration of treatment) and experienced a re-exposure tomalaria parasites. Finally, the initial number of total sus-ceptible individuals HUS(0) was estimated to be the dif-ference between the total population at risk and the totalinitial number of people in the infectious, infective andimmune stages.
Based on the continuous and homogeneous periods ofclimatic and epidemiological data sets available in the ElBagre region, the observed P. falciparum malaria incidencein the study site was modelled for the period from January3rd, 1994 to December 28th, 2002 (first epidemiologicalperiod 1994 – 13th EP 2002). This period corresponds toa simulation exercise of about 3,282 days or 108 months,or 9 years (Figures 7B and 7C). The initial total humanpopulation at risk was assumed to be equal to 15,862 peo-ple, the population of rural areas at the end of 1994. Theinitial number of total infectious, infected and immuneindividuals was assumed to be equal to HUF(0) = 326,HUI(0) = 261, and HUM(0) = 453 people, equivalent tothe total number of positive cases reported during the 13th
EP 1993, 1st EP 1994, and 12th EP 1993, respectively.Accordingly, the total number of susceptible individualsHUS(0) was assumed to be equal to 14,822 individuals.In the endemic area, malaria incidence was simulatedassuming temperature values equal to either mean daily
indoor temperatures or a constant value of 27.7°C, equiv-alent to the mean annual temperature of this malariaprone-region.
The system of coupled differential equations was solvedby using a fourth order Runge-Kutta numerical algorithmfor a 1-day time step at both study sites. Values of exoge-nous variables are shown in Tables 1, 3 and 5.
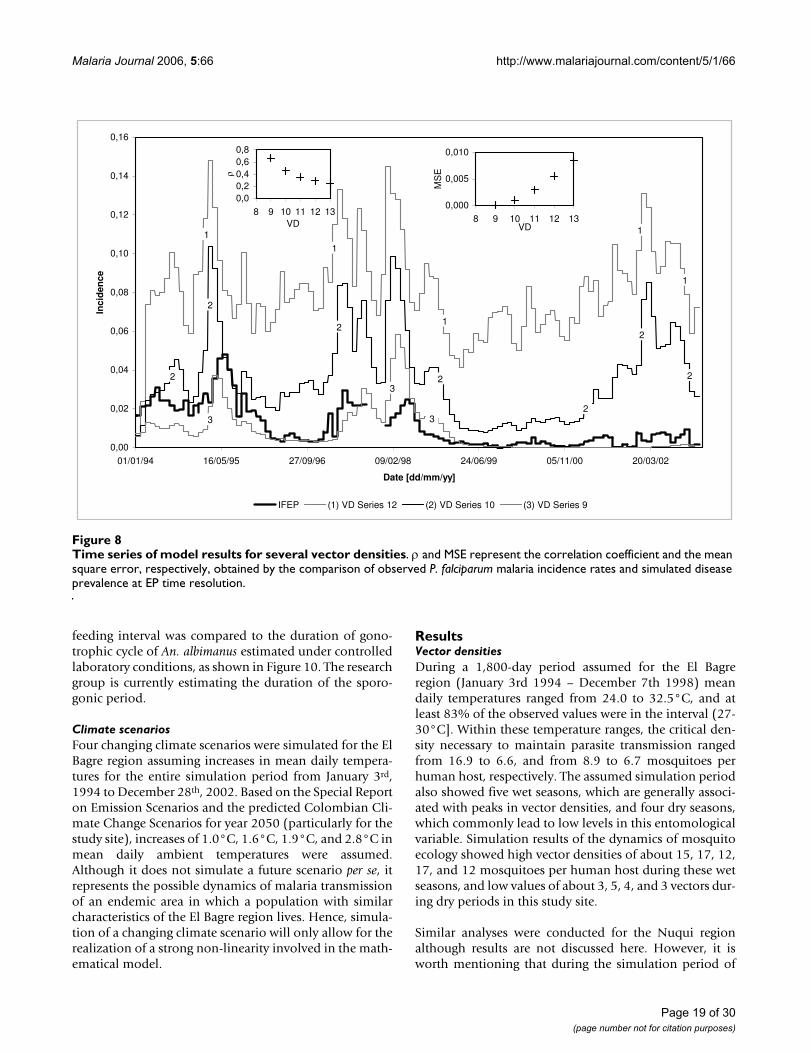
Preliminary analysis of instability casesBased upon the aforementioned scenario and followingthe experimentation-validation processes, small changesin some exogenous variables were assumed in the analysisof instability cases. Simulations included changes in vec-tor density (Figure 8), Human Blood Index, number ofdegree-days required for parasite development, humanaverage infected period, and Primary Exo-erythrocyticSchizogony time delay. Analysis of instability cases wereonly conducted for the 3,282-day simulation period con-sidered for the El Bagre region.
Sensitivity to initial conditionsSeveral parameters that might cause sensitivity to initialconditions in simulation results were also investigated(Figure 9). Only three scenarios were analysed in thesepreliminary simulations: (1) Scenario 1 set the daily sur-vival probability of the mosquito host to a constant valueand considered both the gonotrophic and sporogoniccycles to be functions of mean daily temperatures. (2) Sce-nario 2 set the feeding interval of the mosquito host to aconstant value and considered both the daily survivalprobability and the sporogonic cycle to be functions ofmean daily temperatures. Finally, (3) scenario 3 set thesporogonic cycle to a constant value and considered boththe daily survival probability and the feeding interval tobe functions of mean daily temperatures. Analyses wereonly conducted for the El Bagre region and the 3282-daysimulation period.
To simulate the base scenario and conduct the analysis ofinstability cases and sensitivity to initial conditions, thevalues reported in literature for the daily survival proba-bility (longevity), the sporogonic period and the feedinginterval were compared with either field-based approxi-mations or values estimated under controlled laboratoryconditions (Figure 10). The daily survival probability wascontrasted with the nulliparous-to-parous ratio estimatedfrom collections of adult female mosquitoes capturedthrough the Human Landing method [2]. Field campaignswere conducted during at least three consecutive eveningsper month, both indoors and outdoors around houseslocated at the study sites. Primary vectors of malaria trans-mission captured in these areas were Anopheles albimanuson the Colombian Pacific Coast, and Anopheles darlingi onthe floodplains of Cauca and Nechi rivers. The reported
Page 17 of 30(page number not for citation purposes)
Malaria Journal 2006, 5:66 http://www.malariajournal.com/content/5/1/66
Page 18 of 30(page number not for citation purposes)
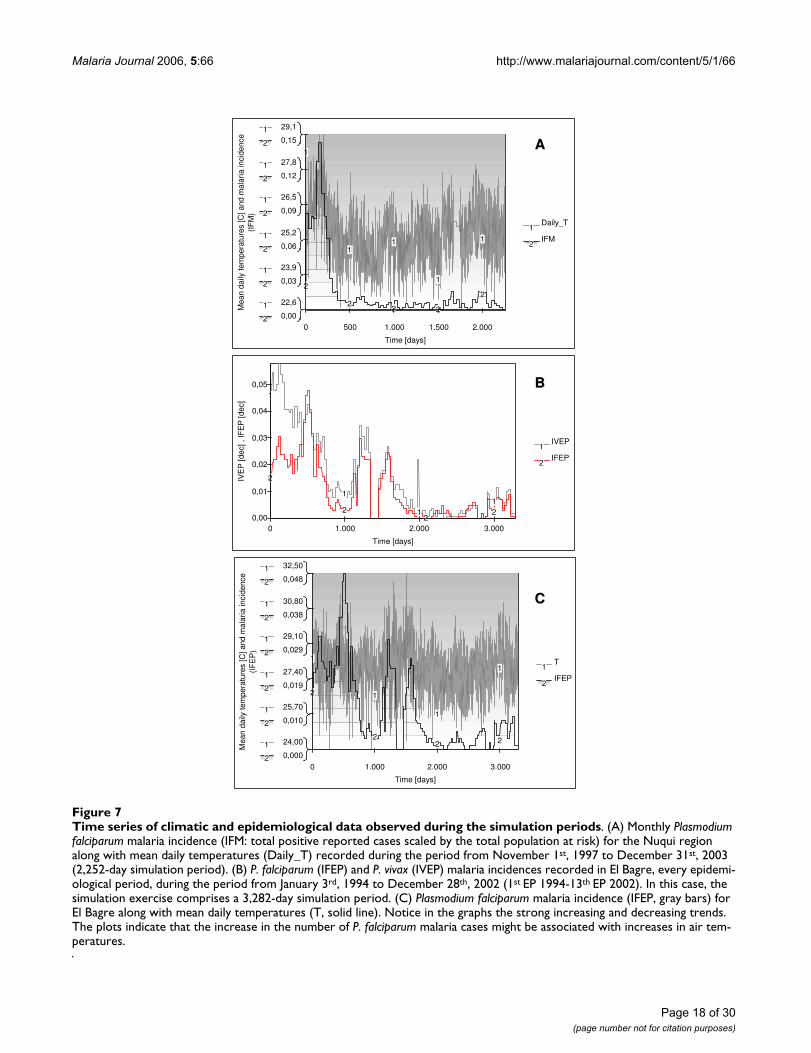
Time series of climatic and epidemiological data observed during the simulation periodsFigure 7Time series of climatic and epidemiological data observed during the simulation periods. (A) Monthly Plasmodium falciparum malaria incidence (IFM: total positive reported cases scaled by the total population at risk) for the Nuqui region along with mean daily temperatures (Daily_T) recorded during the period from November 1st, 1997 to December 31st, 2003 (2,252-day simulation period). (B) P. falciparum (IFEP) and P. vivax (IVEP) malaria incidences recorded in El Bagre, every epidemi-ological period, during the period from January 3rd, 1994 to December 28th, 2002 (1st EP 1994-13th EP 2002). In this case, the simulation exercise comprises a 3,282-day simulation period. (C) Plasmodium falciparum malaria incidence (IFEP, gray bars) for El Bagre along with mean daily temperatures (T, solid line). Notice in the graphs the strong increasing and decreasing trends. The plots indicate that the increase in the number of P. falciparum malaria cases might be associated with increases in air tem-peratures.
Time [days]
Mea
n da
ily te
mpe
ratu
res
[C] a
nd m
alar
ia in
cide
nce
(IF
M)
Daily_T1
IFM2
0 500 1.000 1.500 2.000
1
2
22,6
0,00
1
2
23,9
0,03
1
2
25,2
0,06
1
2
26,5
0,09
1
2
27,8
0,12
1
2
29,1
0,15
1
2
1
2
1
2
1
2
1
2
Time [days]
IVE
P [d
ec] ,
IFE
P [d
ec]
IVEP1
IFEP2
0 1.000 2.000 3.0000,00
0,01
0,02
0,03
0,04
0,051
2
1
2 12
12
Time [days]
Mea
n da
ily te
mpe
ratu
res
[C] a
nd m
alar
ia in
cide
nce
(IF
EP
)
T1
IFEP2
0 1.000 2.000 3.000
1
2
24,00
0,000
1
2
25,70
0,010
1
2
27,40
0,019
1
2
29,10
0,029
1
2
30,80
0,038
1
2
32,50
0,048
1
2 1
2
1
2
1
2
AA
BB
CC
Malaria Journal 2006, 5:66 http://www.malariajournal.com/content/5/1/66
feeding interval was compared to the duration of gono-trophic cycle of An. albimanus estimated under controlledlaboratory conditions, as shown in Figure 10. The researchgroup is currently estimating the duration of the sporo-gonic period.
Climate scenariosFour changing climate scenarios were simulated for the ElBagre region assuming increases in mean daily tempera-tures for the entire simulation period from January 3rd,1994 to December 28th, 2002. Based on the Special Reporton Emission Scenarios and the predicted Colombian Cli-mate Change Scenarios for year 2050 (particularly for thestudy site), increases of 1.0°C, 1.6°C, 1.9°C, and 2.8°C inmean daily ambient temperatures were assumed.Although it does not simulate a future scenario per se, itrepresents the possible dynamics of malaria transmissionof an endemic area in which a population with similarcharacteristics of the El Bagre region lives. Hence, simula-tion of a changing climate scenario will only allow for therealization of a strong non-linearity involved in the math-ematical model.
ResultsVector densitiesDuring a 1,800-day period assumed for the El Bagreregion (January 3rd 1994 – December 7th 1998) meandaily temperatures ranged from 24.0 to 32.5°C, and atleast 83% of the observed values were in the interval (27-30°C]. Within these temperature ranges, the critical den-sity necessary to maintain parasite transmission rangedfrom 16.9 to 6.6, and from 8.9 to 6.7 mosquitoes perhuman host, respectively. The assumed simulation periodalso showed five wet seasons, which are generally associ-ated with peaks in vector densities, and four dry seasons,which commonly lead to low levels in this entomologicalvariable. Simulation results of the dynamics of mosquitoecology showed high vector densities of about 15, 17, 12,17, and 12 mosquitoes per human host during these wetseasons, and low values of about 3, 5, 4, and 3 vectors dur-ing dry periods in this study site.
Similar analyses were conducted for the Nuqui regionalthough results are not discussed here. However, it isworth mentioning that during the simulation period of
Time series of model results for several vector densitiesFigure 8Time series of model results for several vector densities. ρ and MSE represent the correlation coefficient and the mean square error, respectively, obtained by the comparison of observed P. falciparum malaria incidence rates and simulated disease prevalence at EP time resolution.
0,00
0,02
0,04
0,06
0,08
0,10
0,12
0,14
0,16
01/01/94 16/05/95 27/09/96 09/02/98 24/06/99 05/11/00 20/03/02
Date [dd/mm/yy]
Inci
den
ce
IFEP (1) VD Series 12 (2) VD Series 10 (3) VD Series 9
0,00,20,40,60,8
8 9 10 11 12 13VD
ρ
0,000
0,005
0,010
8 9 10 11 12 13VD
MS
E
1
1
1
1
1
2
2
2
2
2
2
2
3
3
3
Page 19 of 30(page number not for citation purposes)
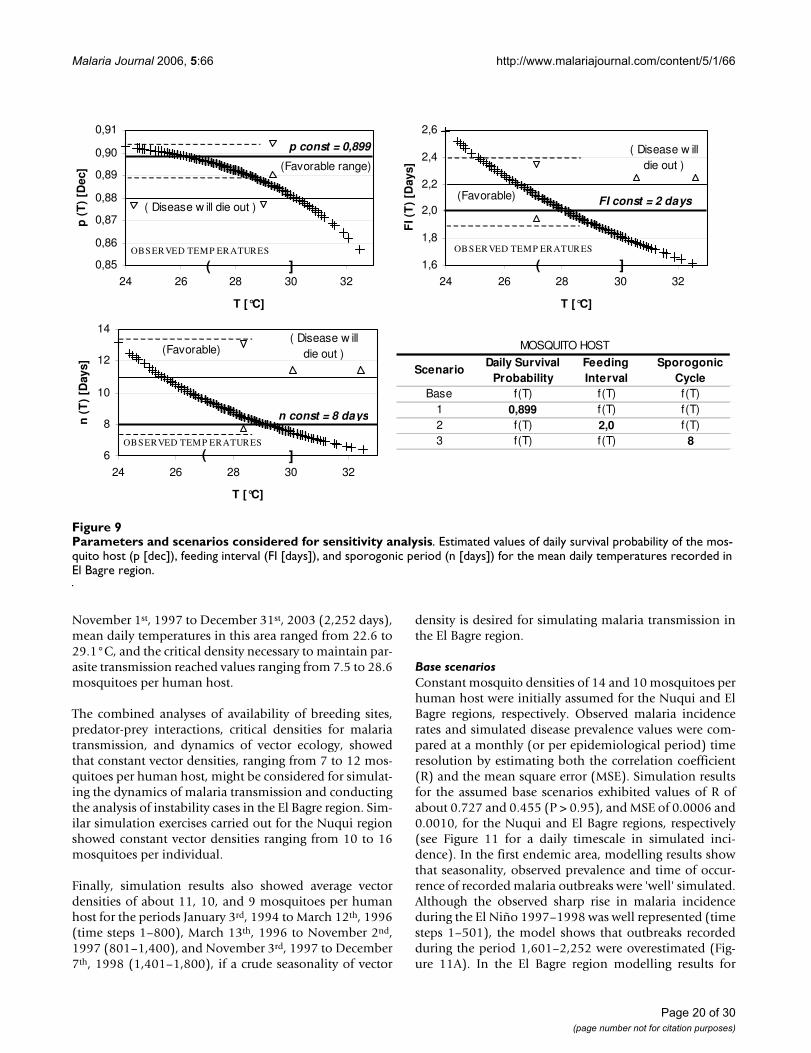
Malaria Journal 2006, 5:66 http://www.malariajournal.com/content/5/1/66
November 1st, 1997 to December 31st, 2003 (2,252 days),mean daily temperatures in this area ranged from 22.6 to29.1°C, and the critical density necessary to maintain par-asite transmission reached values ranging from 7.5 to 28.6mosquitoes per human host.
The combined analyses of availability of breeding sites,predator-prey interactions, critical densities for malariatransmission, and dynamics of vector ecology, showedthat constant vector densities, ranging from 7 to 12 mos-quitoes per human host, might be considered for simulat-ing the dynamics of malaria transmission and conductingthe analysis of instability cases in the El Bagre region. Sim-ilar simulation exercises carried out for the Nuqui regionshowed constant vector densities ranging from 10 to 16mosquitoes per individual.
Finally, simulation results also showed average vectordensities of about 11, 10, and 9 mosquitoes per humanhost for the periods January 3rd, 1994 to March 12th, 1996(time steps 1–800), March 13th, 1996 to November 2nd,1997 (801–1,400), and November 3rd, 1997 to December7th, 1998 (1,401–1,800), if a crude seasonality of vector
density is desired for simulating malaria transmission inthe El Bagre region.
Base scenariosConstant mosquito densities of 14 and 10 mosquitoes perhuman host were initially assumed for the Nuqui and ElBagre regions, respectively. Observed malaria incidencerates and simulated disease prevalence values were com-pared at a monthly (or per epidemiological period) timeresolution by estimating both the correlation coefficient(R) and the mean square error (MSE). Simulation resultsfor the assumed base scenarios exhibited values of R ofabout 0.727 and 0.455 (P > 0.95), and MSE of 0.0006 and0.0010, for the Nuqui and El Bagre regions, respectively(see Figure 11 for a daily timescale in simulated inci-dence). In the first endemic area, modelling results showthat seasonality, observed prevalence and time of occur-rence of recorded malaria outbreaks were 'well' simulated.Although the observed sharp rise in malaria incidenceduring the El Niño 1997–1998 was well represented (timesteps 1–501), the model shows that outbreaks recordedduring the period 1,601–2,252 were overestimated (Fig-ure 11A). In the El Bagre region modelling results for
Parameters and scenarios considered for sensitivity analysisFigure 9Parameters and scenarios considered for sensitivity analysis. Estimated values of daily survival probability of the mos-quito host (p [dec]), feeding interval (FI [days]), and sporogonic period (n [days]) for the mean daily temperatures recorded in El Bagre region.
ScenarioDaily Survival
ProbabilityFeeding Interval
Sporogonic Cycle
Base f(T) f(T) f(T)1 0,899 f(T) f(T)2 f(T) 2,0 f(T)3 f(T) f(T) 8
MOSQUITO HOST
0,85
0,86
0,87
0,88
0,89
0,90
0,91
24 26 28 30 32
T [°C]
p (
T)
[Dec
]
1,6
1,8
2,0
2,2
2,4
2,6
24 26 28 30 32
T [°C]
FI (
T)
[Day
s]
FI const = 2 days
OBSERVED TEMP ERATURES
6
8
10
12
14
24 26 28 30 32
T [°C]
n (
T)
[Day
s]
n const = 8 days
p const = 0,899
OBSERVED TEMP ERATURES
OBSERVED TEMP ERATURES
( Disease w ill die out )
(Favorable range)
( Disease w illdie out )
(Favorable)
( Disease w illdie out )(Favorable)
( ] ( ]
( ]
Page 20 of 30(page number not for citation purposes)
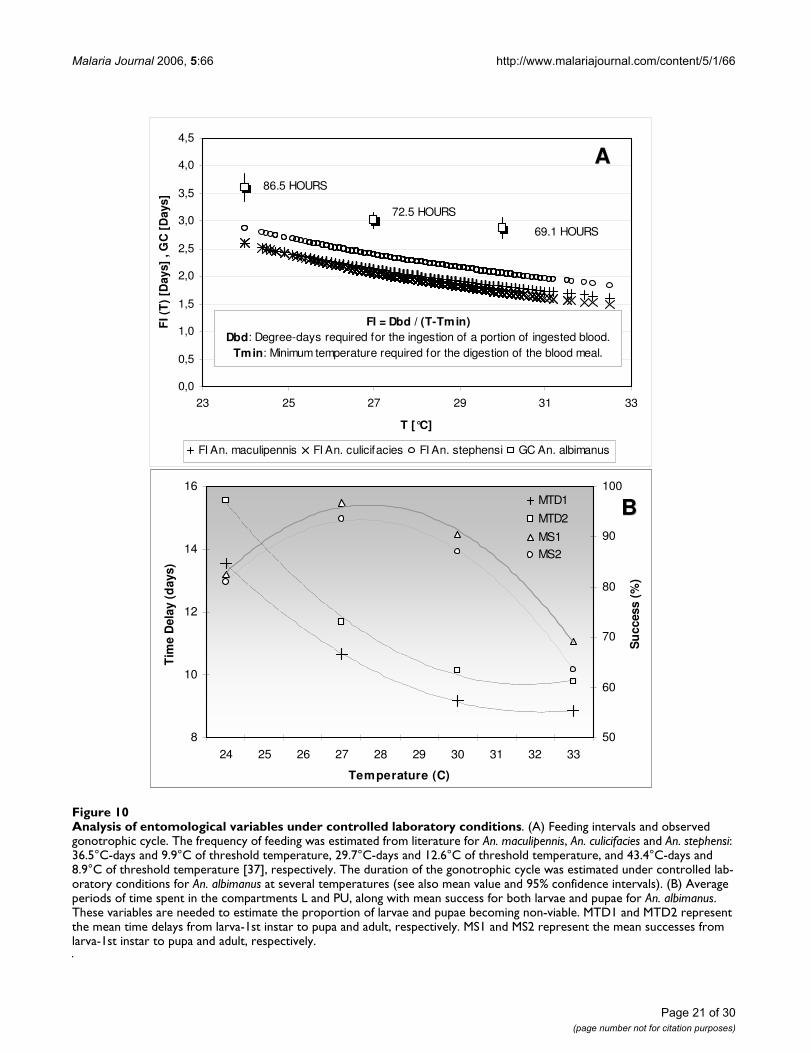
Malaria Journal 2006, 5:66 http://www.malariajournal.com/content/5/1/66
Page 21 of 30(page number not for citation purposes)
Analysis of entomological variables under controlled laboratory conditionsFigure 10Analysis of entomological variables under controlled laboratory conditions. (A) Feeding intervals and observed gonotrophic cycle. The frequency of feeding was estimated from literature for An. maculipennis, An. culicifacies and An. stephensi: 36.5°C-days and 9.9°C of threshold temperature, 29.7°C-days and 12.6°C of threshold temperature, and 43.4°C-days and 8.9°C of threshold temperature [37], respectively. The duration of the gonotrophic cycle was estimated under controlled lab-oratory conditions for An. albimanus at several temperatures (see also mean value and 95% confidence intervals). (B) Average periods of time spent in the compartments L and PU, along with mean success for both larvae and pupae for An. albimanus. These variables are needed to estimate the proportion of larvae and pupae becoming non-viable. MTD1 and MTD2 represent the mean time delays from larva-1st instar to pupa and adult, respectively. MS1 and MS2 represent the mean successes from larva-1st instar to pupa and adult, respectively.
0,0
0,5
1,0
1,5
2,0
2,5
3,0
3,5
4,0
4,5
23 25 27 29 31 33
T [°C]
FI (
T)
[Day
s] ,
GC
[D
ays]
FI An. maculipennis FI An. culicifacies FI An. stephensi GC An. albimanus
FI = Dbd / (T-Tmin)Dbd: Degree-days required for the ingestion of a portion of ingested blood.
Tmin: Minimum temperature required for the digestion of the blood meal.
86.5 HOURS
72.5 HOURS
69.1 HOURS
8
10
12
14
16
24 25 26 27 28 29 30 31 32 33
Temperature (C)
Tim
e D
elay
(d
ays)
50
60
70
80
90
100
Su
cces
s (%
)
MTD1
MTD2
MS1
MS2
AA
BB
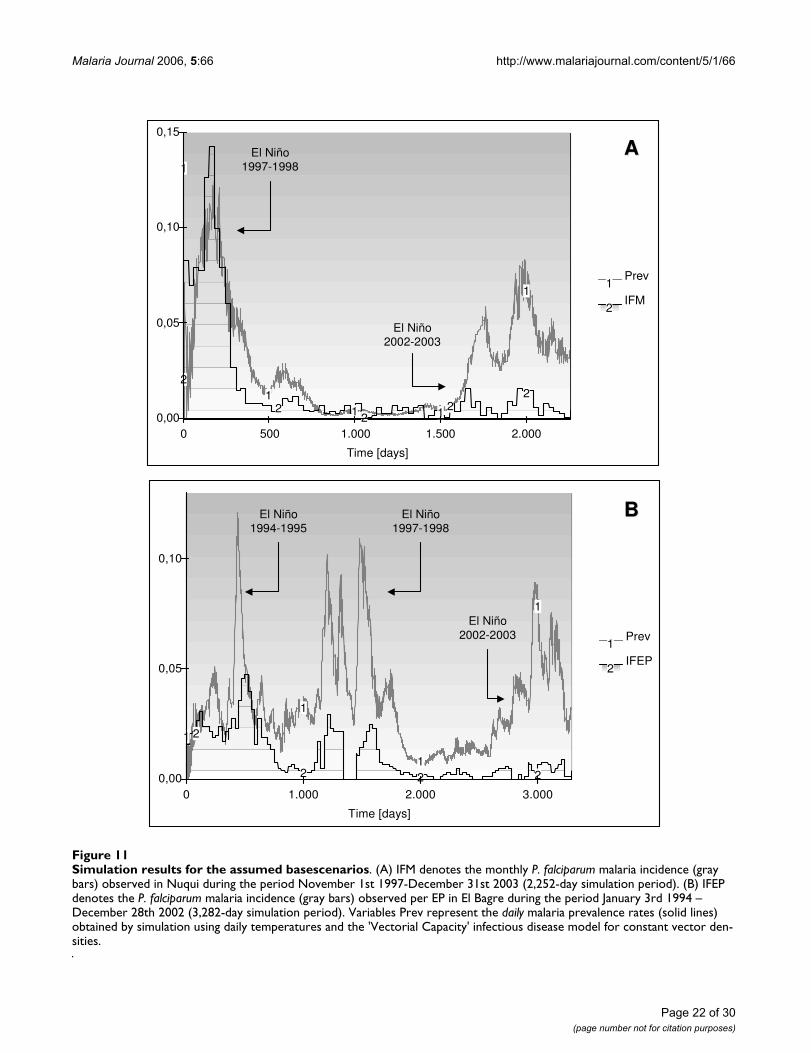
Malaria Journal 2006, 5:66 http://www.malariajournal.com/content/5/1/66
Page 22 of 30(page number not for citation purposes)
Simulation results for the assumed base scenariosFigure 11Simulation results for the assumed basescenarios. (A) IFM denotes the monthly P. falciparum malaria incidence (gray bars) observed in Nuqui during the period November 1st 1997-December 31st 2003 (2,252-day simulation period). (B) IFEP denotes the P. falciparum malaria incidence (gray bars) observed per EP in El Bagre during the period January 3rd 1994 – December 28th 2002 (3,282-day simulation period). Variables Prev represent the daily malaria prevalence rates (solid lines) obtained by simulation using daily temperatures and the 'Vectorial Capacity' infectious disease model for constant vector den-sities.
Time [days]
Prev1
IFM2
0 500 1.000 1.500 2.0000,00
0,05
0,10
0,15
1
21
2 1 2 1 2
1
2
Time [days]
Prev1
IFEP2
0 1.000 2.000 3.0000,00
0,05
0,10
1 2
1
212
1
2
AA
BB
El Niño 1997-1998
El Niño 2002-2003
El Niño 1994-1995
El Niño 1997-1998
El Niño 2002-2003
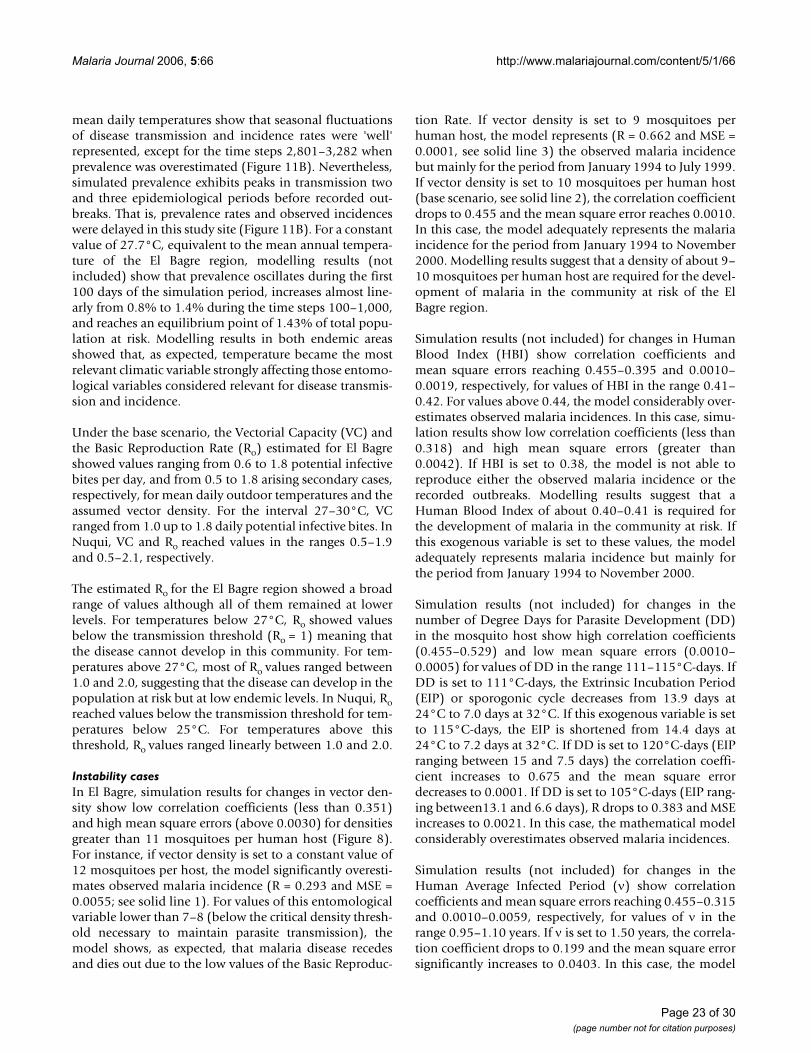
Malaria Journal 2006, 5:66 http://www.malariajournal.com/content/5/1/66
mean daily temperatures show that seasonal fluctuationsof disease transmission and incidence rates were 'well'represented, except for the time steps 2,801–3,282 whenprevalence was overestimated (Figure 11B). Nevertheless,simulated prevalence exhibits peaks in transmission twoand three epidemiological periods before recorded out-breaks. That is, prevalence rates and observed incidenceswere delayed in this study site (Figure 11B). For a constantvalue of 27.7°C, equivalent to the mean annual tempera-ture of the El Bagre region, modelling results (notincluded) show that prevalence oscillates during the first100 days of the simulation period, increases almost line-arly from 0.8% to 1.4% during the time steps 100–1,000,and reaches an equilibrium point of 1.43% of total popu-lation at risk. Modelling results in both endemic areasshowed that, as expected, temperature became the mostrelevant climatic variable strongly affecting those entomo-logical variables considered relevant for disease transmis-sion and incidence.
Under the base scenario, the Vectorial Capacity (VC) andthe Basic Reproduction Rate (Ro) estimated for El Bagreshowed values ranging from 0.6 to 1.8 potential infectivebites per day, and from 0.5 to 1.8 arising secondary cases,respectively, for mean daily outdoor temperatures and theassumed vector density. For the interval 27–30°C, VCranged from 1.0 up to 1.8 daily potential infective bites. InNuqui, VC and Ro reached values in the ranges 0.5–1.9and 0.5–2.1, respectively.
The estimated Ro for the El Bagre region showed a broadrange of values although all of them remained at lowerlevels. For temperatures below 27°C, Ro showed valuesbelow the transmission threshold (Ro = 1) meaning thatthe disease cannot develop in this community. For tem-peratures above 27°C, most of Ro values ranged between1.0 and 2.0, suggesting that the disease can develop in thepopulation at risk but at low endemic levels. In Nuqui, Roreached values below the transmission threshold for tem-peratures below 25°C. For temperatures above thisthreshold, Ro values ranged linearly between 1.0 and 2.0.
Instability casesIn El Bagre, simulation results for changes in vector den-sity show low correlation coefficients (less than 0.351)and high mean square errors (above 0.0030) for densitiesgreater than 11 mosquitoes per human host (Figure 8).For instance, if vector density is set to a constant value of12 mosquitoes per host, the model significantly overesti-mates observed malaria incidence (R = 0.293 and MSE =0.0055; see solid line 1). For values of this entomologicalvariable lower than 7–8 (below the critical density thresh-old necessary to maintain parasite transmission), themodel shows, as expected, that malaria disease recedesand dies out due to the low values of the Basic Reproduc-
tion Rate. If vector density is set to 9 mosquitoes perhuman host, the model represents (R = 0.662 and MSE =0.0001, see solid line 3) the observed malaria incidencebut mainly for the period from January 1994 to July 1999.If vector density is set to 10 mosquitoes per human host(base scenario, see solid line 2), the correlation coefficientdrops to 0.455 and the mean square error reaches 0.0010.In this case, the model adequately represents the malariaincidence for the period from January 1994 to November2000. Modelling results suggest that a density of about 9–10 mosquitoes per human host are required for the devel-opment of malaria in the community at risk of the ElBagre region.
Simulation results (not included) for changes in HumanBlood Index (HBI) show correlation coefficients andmean square errors reaching 0.455–0.395 and 0.0010–0.0019, respectively, for values of HBI in the range 0.41–0.42. For values above 0.44, the model considerably over-estimates observed malaria incidences. In this case, simu-lation results show low correlation coefficients (less than0.318) and high mean square errors (greater than0.0042). If HBI is set to 0.38, the model is not able toreproduce either the observed malaria incidence or therecorded outbreaks. Modelling results suggest that aHuman Blood Index of about 0.40–0.41 is required forthe development of malaria in the community at risk. Ifthis exogenous variable is set to these values, the modeladequately represents malaria incidence but mainly forthe period from January 1994 to November 2000.
Simulation results (not included) for changes in thenumber of Degree Days for Parasite Development (DD)in the mosquito host show high correlation coefficients(0.455–0.529) and low mean square errors (0.0010–0.0005) for values of DD in the range 111–115°C-days. IfDD is set to 111°C-days, the Extrinsic Incubation Period(EIP) or sporogonic cycle decreases from 13.9 days at24°C to 7.0 days at 32°C. If this exogenous variable is setto 115°C-days, the EIP is shortened from 14.4 days at24°C to 7.2 days at 32°C. If DD is set to 120°C-days (EIPranging between 15 and 7.5 days) the correlation coeffi-cient increases to 0.675 and the mean square errordecreases to 0.0001. If DD is set to 105°C-days (EIP rang-ing between13.1 and 6.6 days), R drops to 0.383 and MSEincreases to 0.0021. In this case, the mathematical modelconsiderably overestimates observed malaria incidences.
Simulation results (not included) for changes in theHuman Average Infected Period (ν) show correlationcoefficients and mean square errors reaching 0.455–0.315and 0.0010–0.0059, respectively, for values of ν in therange 0.95–1.10 years. If ν is set to 1.50 years, the correla-tion coefficient drops to 0.199 and the mean square errorsignificantly increases to 0.0403. In this case, the model
Page 23 of 30(page number not for citation purposes)
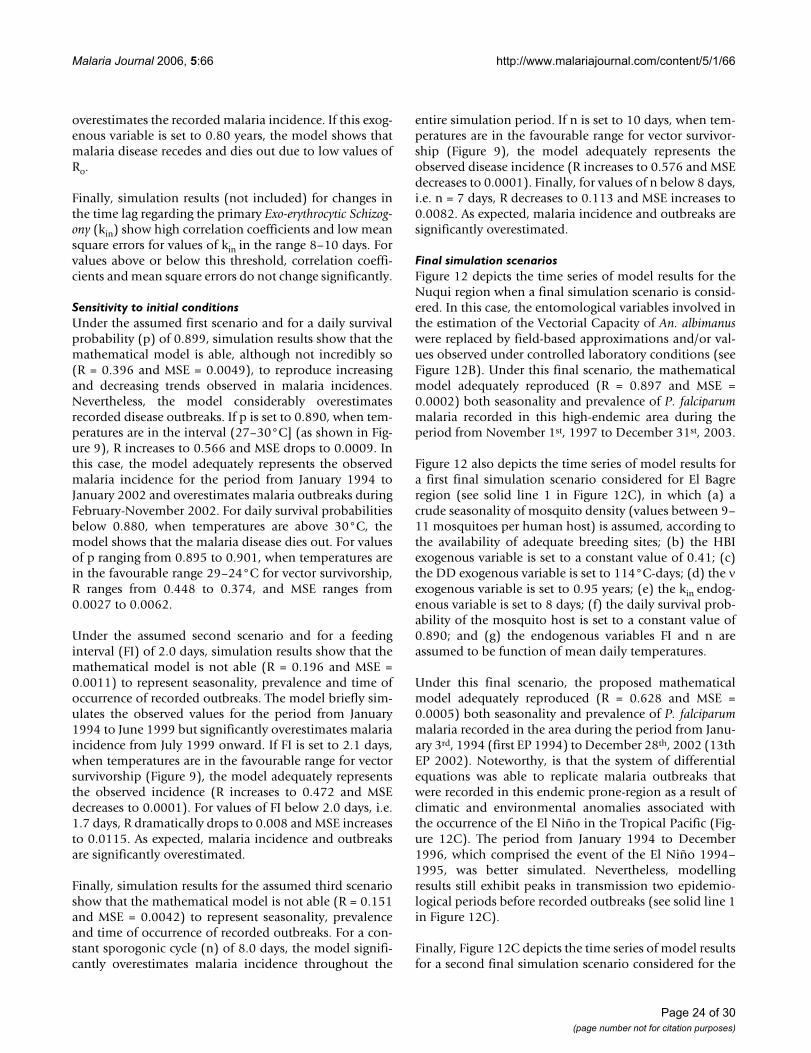
Malaria Journal 2006, 5:66 http://www.malariajournal.com/content/5/1/66
overestimates the recorded malaria incidence. If this exog-enous variable is set to 0.80 years, the model shows thatmalaria disease recedes and dies out due to low values ofRo.
Finally, simulation results (not included) for changes inthe time lag regarding the primary Exo-erythrocytic Schizog-ony (kin) show high correlation coefficients and low meansquare errors for values of kin in the range 8–10 days. Forvalues above or below this threshold, correlation coeffi-cients and mean square errors do not change significantly.
Sensitivity to initial conditionsUnder the assumed first scenario and for a daily survivalprobability (p) of 0.899, simulation results show that themathematical model is able, although not incredibly so(R = 0.396 and MSE = 0.0049), to reproduce increasingand decreasing trends observed in malaria incidences.Nevertheless, the model considerably overestimatesrecorded disease outbreaks. If p is set to 0.890, when tem-peratures are in the interval (27–30°C] (as shown in Fig-ure 9), R increases to 0.566 and MSE drops to 0.0009. Inthis case, the model adequately represents the observedmalaria incidence for the period from January 1994 toJanuary 2002 and overestimates malaria outbreaks duringFebruary-November 2002. For daily survival probabilitiesbelow 0.880, when temperatures are above 30°C, themodel shows that the malaria disease dies out. For valuesof p ranging from 0.895 to 0.901, when temperatures arein the favourable range 29–24°C for vector survivorship,R ranges from 0.448 to 0.374, and MSE ranges from0.0027 to 0.0062.
Under the assumed second scenario and for a feedinginterval (FI) of 2.0 days, simulation results show that themathematical model is not able (R = 0.196 and MSE =0.0011) to represent seasonality, prevalence and time ofoccurrence of recorded outbreaks. The model briefly sim-ulates the observed values for the period from January1994 to June 1999 but significantly overestimates malariaincidence from July 1999 onward. If FI is set to 2.1 days,when temperatures are in the favourable range for vectorsurvivorship (Figure 9), the model adequately representsthe observed incidence (R increases to 0.472 and MSEdecreases to 0.0001). For values of FI below 2.0 days, i.e.1.7 days, R dramatically drops to 0.008 and MSE increasesto 0.0115. As expected, malaria incidence and outbreaksare significantly overestimated.
Finally, simulation results for the assumed third scenarioshow that the mathematical model is not able (R = 0.151and MSE = 0.0042) to represent seasonality, prevalenceand time of occurrence of recorded outbreaks. For a con-stant sporogonic cycle (n) of 8.0 days, the model signifi-cantly overestimates malaria incidence throughout the
entire simulation period. If n is set to 10 days, when tem-peratures are in the favourable range for vector survivor-ship (Figure 9), the model adequately represents theobserved disease incidence (R increases to 0.576 and MSEdecreases to 0.0001). Finally, for values of n below 8 days,i.e. n = 7 days, R decreases to 0.113 and MSE increases to0.0082. As expected, malaria incidence and outbreaks aresignificantly overestimated.
Final simulation scenariosFigure 12 depicts the time series of model results for theNuqui region when a final simulation scenario is consid-ered. In this case, the entomological variables involved inthe estimation of the Vectorial Capacity of An. albimanuswere replaced by field-based approximations and/or val-ues observed under controlled laboratory conditions (seeFigure 12B). Under this final scenario, the mathematicalmodel adequately reproduced (R = 0.897 and MSE =0.0002) both seasonality and prevalence of P. falciparummalaria recorded in this high-endemic area during theperiod from November 1st, 1997 to December 31st, 2003.
Figure 12 also depicts the time series of model results fora first final simulation scenario considered for El Bagreregion (see solid line 1 in Figure 12C), in which (a) acrude seasonality of mosquito density (values between 9–11 mosquitoes per human host) is assumed, according tothe availability of adequate breeding sites; (b) the HBIexogenous variable is set to a constant value of 0.41; (c)the DD exogenous variable is set to 114°C-days; (d) the νexogenous variable is set to 0.95 years; (e) the kin endog-enous variable is set to 8 days; (f) the daily survival prob-ability of the mosquito host is set to a constant value of0.890; and (g) the endogenous variables FI and n areassumed to be function of mean daily temperatures.
Under this final scenario, the proposed mathematicalmodel adequately reproduced (R = 0.628 and MSE =0.0005) both seasonality and prevalence of P. falciparummalaria recorded in the area during the period from Janu-ary 3rd, 1994 (first EP 1994) to December 28th, 2002 (13thEP 2002). Noteworthy, is that the system of differentialequations was able to replicate malaria outbreaks thatwere recorded in this endemic prone-region as a result ofclimatic and environmental anomalies associated withthe occurrence of the El Niño in the Tropical Pacific (Fig-ure 12C). The period from January 1994 to December1996, which comprised the event of the El Niño 1994–1995, was better simulated. Nevertheless, modellingresults still exhibit peaks in transmission two epidemio-logical periods before recorded outbreaks (see solid line 1in Figure 12C).
Finally, Figure 12C depicts the time series of model resultsfor a second final simulation scenario considered for the
Page 24 of 30(page number not for citation purposes)
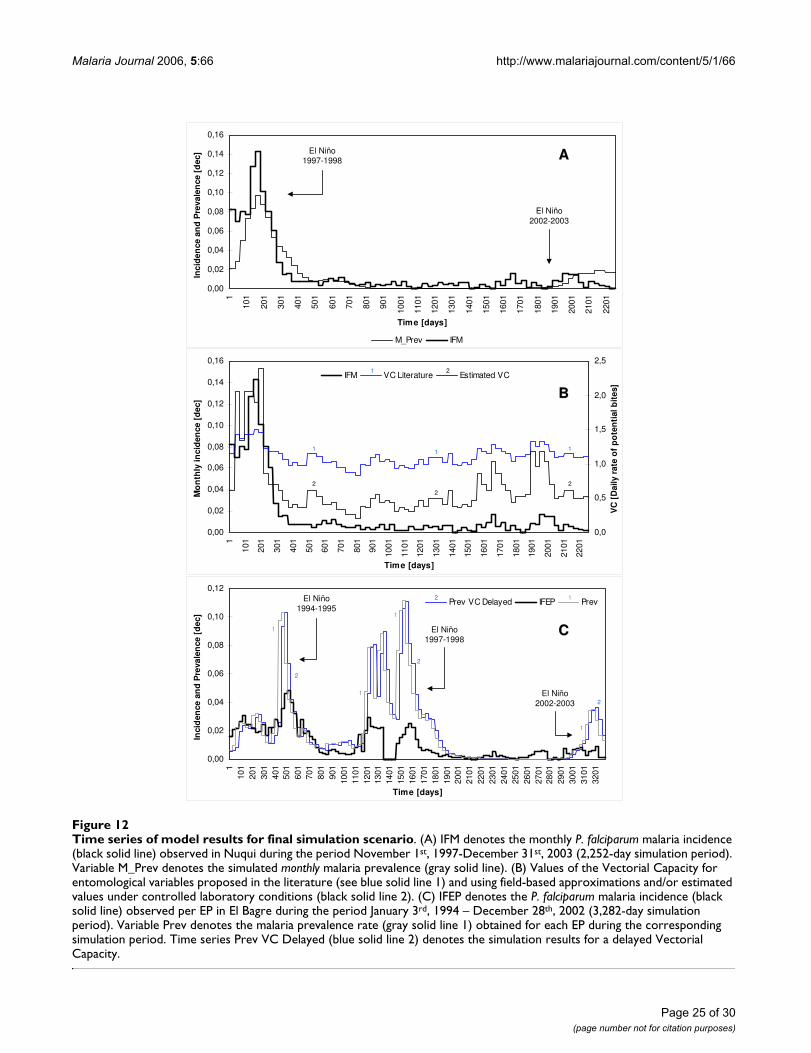
Malaria Journal 2006, 5:66 http://www.malariajournal.com/content/5/1/66
Page 25 of 30(page number not for citation purposes)
Time series of model results for final simulation scenarioFigure 12Time series of model results for final simulation scenario. (A) IFM denotes the monthly P. falciparum malaria incidence (black solid line) observed in Nuqui during the period November 1st, 1997-December 31st, 2003 (2,252-day simulation period). Variable M_Prev denotes the simulated monthly malaria prevalence (gray solid line). (B) Values of the Vectorial Capacity for entomological variables proposed in the literature (see blue solid line 1) and using field-based approximations and/or estimated values under controlled laboratory conditions (black solid line 2). (C) IFEP denotes the P. falciparum malaria incidence (black solid line) observed per EP in El Bagre during the period January 3rd, 1994 – December 28th, 2002 (3,282-day simulation period). Variable Prev denotes the malaria prevalence rate (gray solid line 1) obtained for each EP during the corresponding simulation period. Time series Prev VC Delayed (blue solid line 2) denotes the simulation results for a delayed Vectorial Capacity.
0,00
0,02
0,04
0,06
0,08
0,10
0,12
0,14
0,16
1
101
201
301
401
501
601
701
801
901
1001
1101
1201
1301
1401
1501
1601
1701
1801
1901
2001
2101
2201
Time [days]
Inci
den
ce a
nd
Pre
vale
nce
[d
ec]
M_Prev IFM
0,00
0,02
0,04
0,06
0,08
0,10
0,12
0,14
0,16
1
101
201
301
401
501
601
701
801
901
1001
1101
1201
1301
1401
1501
1601
1701
1801
1901
2001
2101
2201
Time [days]
Mo
nth
ly in
cid
ence
[d
ec]
0,0
0,5
1,0
1,5
2,0
2,5
VC
[D
aily
rat
e o
f p
ote
nti
al b
ites
]
IFM VC Literature Estimated VC
AA
BB
0,00
0,02
0,04
0,06
0,08
0,10
0,12
110
120
130
140
150
160
170
180
190
110
0111
0112
0113
0114
0115
0116
0117
0118
0119
0120
0121
0122
0123
0124
0125
0126
0127
0128
0129
0130
0131
0132
01
Time [days]
Inci
den
ce a
nd
Pre
vale
nce
[d
ec]
Prev VC Delayed IFEP Prev
CC
El Niño 1997-1998
El Niño 2002-2003
1
1 1 1
2
2
2
2
1
1
1
1
1
2
2
El Niño 1994-1995
El Niño 1997-1998
El Niño 2002-2003
2
2
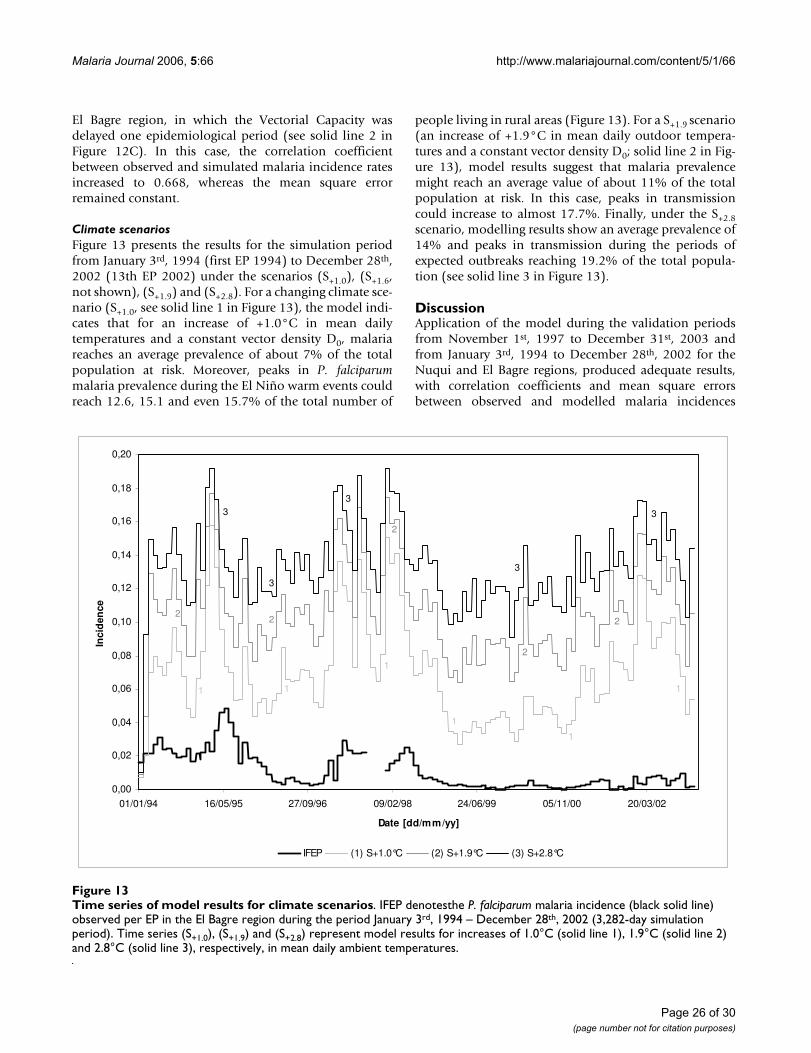
Malaria Journal 2006, 5:66 http://www.malariajournal.com/content/5/1/66
El Bagre region, in which the Vectorial Capacity wasdelayed one epidemiological period (see solid line 2 inFigure 12C). In this case, the correlation coefficientbetween observed and simulated malaria incidence ratesincreased to 0.668, whereas the mean square errorremained constant.
Climate scenariosFigure 13 presents the results for the simulation periodfrom January 3rd, 1994 (first EP 1994) to December 28th,2002 (13th EP 2002) under the scenarios (S+1.0), (S+1.6,not shown), (S+1.9) and (S+2.8). For a changing climate sce-nario (S+1.0, see solid line 1 in Figure 13), the model indi-cates that for an increase of +1.0°C in mean dailytemperatures and a constant vector density D0, malariareaches an average prevalence of about 7% of the totalpopulation at risk. Moreover, peaks in P. falciparummalaria prevalence during the El Niño warm events couldreach 12.6, 15.1 and even 15.7% of the total number of
people living in rural areas (Figure 13). For a S+1.9 scenario(an increase of +1.9°C in mean daily outdoor tempera-tures and a constant vector density D0; solid line 2 in Fig-ure 13), model results suggest that malaria prevalencemight reach an average value of about 11% of the totalpopulation at risk. In this case, peaks in transmissioncould increase to almost 17.7%. Finally, under the S+2.8scenario, modelling results show an average prevalence of14% and peaks in transmission during the periods ofexpected outbreaks reaching 19.2% of the total popula-tion (see solid line 3 in Figure 13).
DiscussionApplication of the model during the validation periodsfrom November 1st, 1997 to December 31st, 2003 andfrom January 3rd, 1994 to December 28th, 2002 for theNuqui and El Bagre regions, produced adequate results,with correlation coefficients and mean square errorsbetween observed and modelled malaria incidences
Time series of model results for climate scenariosFigure 13Time series of model results for climate scenarios. IFEP denotesthe P. falciparum malaria incidence (black solid line) observed per EP in the El Bagre region during the period January 3rd, 1994 – December 28th, 2002 (3,282-day simulation period). Time series (S+1.0), (S+1.9) and (S+2.8) represent model results for increases of 1.0°C (solid line 1), 1.9°C (solid line 2) and 2.8°C (solid line 3), respectively, in mean daily ambient temperatures.
0,00
0,02
0,04
0,06
0,08
0,10
0,12
0,14
0,16
0,18
0,20
01/01/94 16/05/95 27/09/96 09/02/98 24/06/99 05/11/00 20/03/02
Date [dd/mm/yy]
Inci
den
ce
IFEP (1) S+1.0°C (2) S+1.9°C (3) S+2.8°C
1 1
1
1
1
1
22
2
2
2
3
3
3
3
3
Page 26 of 30(page number not for citation purposes)
Malaria Journal 2006, 5:66 http://www.malariajournal.com/content/5/1/66
reaching R = 0.897–0.668 (P > 0.95) and MSE = 0.0002–0.0005, respectively. Under the described epidemiologicalscenarios, modelling results suggest that malaria candevelop in the populations at risk at low endemic levelsand minor efforts can lead to the eradication of the dis-ease.
For the El Bagre region it was found that a constant densityof about 9–10 mosquitoes per human host are requiredfor the development of malaria in the community. Theresults of the analysis of instability cases seem to suggestthat, in order to counteract malaria in the selected region,it is not necessary to eliminate Anopheles mosquitoes fromthere entirely: field campaigns aimed at the control anderadication of the disease must reduce the number of vec-tors to values below 9 mosquitoes per human host. Themodel also suggests that if environmental conditionsfavour the development of the mosquito population (let-ting vector densities reach values above 11 mosquitoes perhuman host), malaria disease will propagate in the com-munity and reach endemic levels of 9% of the total popu-lation at risk. In this case, malaria outbreaks could affectalmost 15% of the total number of people living in thearea.
The results of the analysis of changes in Human BloodIndex seem to suggest that An. darlingi, the common pri-mary vector found in El Bagre, is basically zoophilic in itsfeeding behaviour. It is of interest to note that, if this char-acteristic of the vector population drastically increases to60% of total bites on humans, malaria disease couldpropagate in the community at high endemic levels andreach 20% of the total population at risk.
Based on modelling results it can therefore be argued thatif an infection of P. falciparum lasts for a period of timegreater than 1.1–1.2 years in humans (when leftuntreated), malaria could propagate rapidly in the popu-lation at risk and reach high-endemic levels. If the averageinfected period is shortened to periods below 0.9 years,the model suggests that the disease could be controlledthrough the ecosystems themselves and minor efforts canlead to its eradication. The Human Average InfectedPeriod might be considered one of the critical variables forunderstanding the malaria cycle in the vertebrate host.Under our conditions in the field (research is still ongo-ing), most patients are treated immediately or within onemonth after the detection of malaria parasites in theirblood streams.
Simulation results also suggest, as expected, that changesin the time lag representing the Primary Exo-erythrocyticSchizogony do not appreciably affect malaria transmission.In fact, the duration of the parasite cycle in human hosts
is more dependent on host characteristics than on externalecological factors.
So far, the mathematical model suggests those entomo-logical variables more strongly affected by climatic condi-tions and that in turn finally impact transmissionpotential of mosquito population. These parametersinclude the sporogonic cycle of the malaria parasite, thedaily rate of vector biting, the daily rate of vector natalityand the daily survival probability of the mosquito host.Field research must be undertaken in order to estimatehow changes in microclimatic and environmental condi-tions of breeding and resting sites affect these relevantentomological variables. Other variables such as hatching,larval developing, and adult emerging time delays, whichseem also to be affected by ambient temperatures, must beincluded as well.
However, simulation results show that the degree daysrequired for digestion of a portion of ingested blood andfor parasite development, which in turn influence thefeeding interval and the sporogonic cycle inside vectors,respectively, might be the key variables that cause sensitiv-ity to initial conditions and affect or control malaria trans-mission. According to these results, vector survivorship isNOT the most important element in the Basic Reproduc-tion Rate of malaria. This conclusion is contrary to Mac-donald's statement: 'the formula for the Basic ReproductionRate holds that the influence of vector survivorship is greaterthan the influence of the average number of men bitten by onemosquito in one day or the sporogonic cycle, which are in turngreater than the influence of the proportion of anophelines withsporozoites in their salivary glands which are actually infective,or the proportion of affected people, who have received oneinfective inoculum only, who revert to the unaffected state inone day' [19]. Nevertheless, it has to be said that researchis still ongoing.
According to the model and based on the simulated sce-narios, malaria outbreaks in the selected regions are pos-sible during the favourable periods following the onset ofthe El Niño warm event. This epidemiological scenario isprimarily controlled by the sporogonic cycle and the feed-ing interval, which are strongly affected by ambient tem-peratures. Hence, under the conditions in the field, itappears that temperature becomes the most relevantparameter driving the final malaria incidence and must beconsidered an essential variable for an adequate represen-tation of malaria transmission in the selected endemicareas. It has to be argued that precipitation, which con-trols the availability of adequate breeding sites, is respon-sible for representing observed fluctuations in vectordensity. Even though mosquito's density is not the keyvariable for understanding the patterns of malaria out-breaks in the selected region, the model results show that
Page 27 of 30(page number not for citation purposes)
Malaria Journal 2006, 5:66 http://www.malariajournal.com/content/5/1/66
a crude seasonality of vector density is also needed forunderstanding disease transmission. The model suggeststhat between periods of high temperatures, malaria dis-ease is maintained at low endemic levels due to the role ofvector density. Field research is currently under way inorder to consider possible synergistic effects of tempera-ture and precipitation on malaria transmission.
Simulation results suggest that assessing the impact of cli-mate on malaria transmission not only requires consider-ation of the changes in annual mean temperatures, butalso, and more importantly, the extent of inter-annualvariability in both temperature and rainfall.
Most of the mathematical models used to derive thestandard formulae in malaria epidemiology assume ahomogeneous mosquito population, random and uni-form vector bites on humans, and a constant adult mos-quito population size. Although the first two usefulapproximations were followed, simple differential equa-tions and basic entomological exogenous variables wereincluded for representing seasonal fluctuations of mos-quito density. Thus, the intrinsic differences in mortalityrates, the mosquito biting preferences, and the proximityto larval habitats were deliberately ignored. But thedynamics of vectors during pre-imago stages, the preda-tor-prey-food interactions during larval stage, and therelationships between environmental factors and survi-vorship-behaviour of vectors were purposely included. Infact, the analysis of human biting rates available fromfield campaigns conducted up to this point shows that, asexpected, population densities might be significantlyassociated with observed rainfall patterns. These vectordynamics, following the preliminary analyses, are beingclearly captured by the mathematical model.
New analysis will focus on more detailed examination ofkey variables that control the dynamic response of malariatransmission in the study sites. Particular interests includetesting the model for parsimony and simplicity. A thor-ough dissection of all the components is currently beingconducted in order to capture the most basic interactionsbetween climatic and entomological variables. The math-ematical tool will be improved by the inclusion of newsubroutines for predator-prey interactions, as well as newfield and laboratory data for the entomological parame-ters.
New analysis will focus also on additional stage variables(following Yang's equations [20,21]) that will be used todescribe different levels of protection or anti-malarialimmunity, which are commonly observed among peopleexposed to continuous and intense disease transmission.Migratory patterns and exogenous introduction of
infected individuals at certain times are to be included inthe model.
ConclusionThe observed monthly values of malaria incidence arecharacterized by seasonal oscillations alternating irregu-larly with high incidence periods. Modelling results mustshow at least such fluctuations of disease transmission.Simulations using only mean annual temperatures do notrepresent this characteristic. In contrast, simulations usingmean monthly/daily temperatures adequately representthe seasonality of malaria prevalence. Apparently, resultsseem to suggest that the intra-annual cycle of mean tem-peratures is good enough to represent the seasonal oscil-lations of monthly malaria incidence rates in the selectedstudy sites. However, simulation results show that season-ality of vector density also becomes an important factortowards understanding disease transmission, thus sug-gesting that seasonal and inter-annual variability of bothtemperature and rainfall are required to assess the impactof climate on malaria dynamics.
In the applied model described here, attempts were madeto include the seasonality of vector density. The modulerepresenting the availability of breeding sites was inten-tionally used to estimate the seasonal fluctuations of suchan important entomological variable. Modelling the pre-imago cohorts for different larval habitats resulted in anestimation of the availability of reservoirs. The BPAMmodel simulations suggested that (a) oviposition and thedevelopment of mosquitoes during pre-imago stages aresignificantly slower during dry periods, and (b) egg-layingby the mosquito population is appreciably enhanced dur-ing periods of notable availability of adequate larval hab-itats. The system of differential equations also includedthe simulation of vector dynamics in the field on a dailytime scale. In addition to climate data, biological informa-tion was required to incorporate species-specific values foreach of the parameters of the mathematical model. As aresult, seasonal fluctuations in vector density were pre-dicted, with values in the range of the estimated criticaldensities necessary to maintain parasite transmission.
Malaria is a complex disease that cannot be studied in auni-disciplinary and exclusively qualitative-descriptivemanner. The research project has used an interdisciplinaryapproach for understanding malaria epidemiology bystudying, concurrently, the mosquito vector ecology, themalaria parasite, the human population dynamics, andthe characteristics of our heterogeneous environment.Thus, this effort summarizes the joint work of diverse dis-ciplines including Mathematics, Hydrology, Climatology,Entomology, Epidemiology, Field Study and PublicHealth Medicine.
Page 28 of 30(page number not for citation purposes)
Malaria Journal 2006, 5:66 http://www.malariajournal.com/content/5/1/66
The mathematical model and the proposed simulationprocess constitute promising tools to deepen the under-standing of the entomological, epidemiological, and cli-matic interactions related to malaria transmissionconducive to disease outbreaks. Mathematical modelscould help in comprehending how climatic (and non-cli-matic) factors affect the dynamics of malaria transmissionin order to evaluate its spatial and temporal risks in eachendemic area. A profound understanding of all these link-ages is required for basic research, and for important prac-tical mitigation and human health control interventions.In this context, biological models are significantly neces-sary to have a quantitative understanding of malaria trans-mission. As this model is still in its early stages ofdevelopment, so far it has not been used for operationalpurposes. However, in the foreseeable future, biological/eco-epidemiological models could be implemented aspowerful tools to diagnose possible dynamic patterns ofmalaria incidence under several entomological, demo-graphic and climatic scenarios, as well as decision-makingtools, for the early detection and control of disease out-breaks.
Transmission models could permit (a) to estimate thetime of occurrence of unexpected malaria outbreaks; (b)to evaluate the possible magnitude of the concomitantsharp rises in the incidence of the disease; and (c) to poseand answer "what if" questions for remote areas poten-tially vulnerable to changing scenarios, for which data iscommonly sparse. Mathematical models could also iden-tify those elements or appropriate components of thecomplex eco-epidemiological systems for which thereexist proven and effective interventions, particularly in theareas of mosquito control, education in environmentalhealth, and treatment. That is, comprehensive modelscould provide quantitative goals for effective interven-tions adapted to the specific ecological circumstances ofeach endemic area. Then, mathematical models will beable to determine the most appropriate preventativeactions that have to be taken in order to reduce the vulner-ability of populations to climate-induced epidemics andto prevent outbreaks before they begin. Finally, they arealso able to identify 'when' these interventions need to beimplemented in each area.
Although malaria is a highly complex multi-factorial dis-ease related to diverse socio-economic and demographicfactors, it has been demonstrated here that environmentalfactors and climate variability go a considerable way inexplaining fluctuations of disease incidence in these par-ticular endemic areas. Forecasts of relevant climatic varia-bles (future ENSO events) can be merged with selectedmathematical tools (statistical and biological/eco-epide-miological models), creating a Malaria Early Warning Sys-
tem (MEWS) to facilitate early, coupled andenvironmentally sound public health interventions [8].
A complete MEWS framework will permit a continuousevaluation of the local risk of malaria transmission in theface of multiple changing scenarios. The MEWS couldthen be combined with several public health strategies inorder to develop Integrated Malaria Surveillance and Con-trol Systems. Other components should be included, suchas: (a) epidemiological surveillance and control activities,(b) early diagnosis and treatment of primary cases, and (c)entomological surveillance and control activities.
Authors' contributionsDR developed and implemented the mathematicalmodel, analysed malaria prevalence in the El Bagre region,processed the epidemiological and hydrological timeseries, carried out the homogeneity analysis, performedthe correlation analysis, carried out the experimentation-validation analysis, and drafted the manuscript. GP con-ceived the first modelling study and participated in itsdesign and coordination. GP, IDV, MLQ, and GLR partic-ipated in the validation-analysis process and helped todraft the document. IDV, MLQ, GLR, LEV, and JSZ moni-tored malaria incidence in the Nuqui region and carriedout the entomological analysis. All the authors read andapproved the final manuscript.
AcknowledgementsD. Ruiz thanks G. Yan from the Department of Biological Sciences (State University of New York at Buffalo, USA), C. Berberich from the Kumasi Centre for Collaborative Research in Tropical Medicine (Kumasi, Ghana), and S. Masaaki from the Research Centre for Tropical Infectious Diseases (Institute of Tropical Medicine, Nagasaki University, Japan) for their valua-ble comments. D. Ruiz also thanks Vivian Rojas Quintero for her patience and support. The research group thank 'Mineros de Antioquia' for their assistance in collecting and storing climate data, the Instituto de Hidrologia, Meteorologia y Estudios Ambientales-Colombia for providing climate data, Direccion Seccional de Salud de Antioquia and Instituto Nacional de Salud for providing epidemiological data and support.
The group also thank The Inter-American Institute for Global Change Research (Collaborative Research Network "Diagnostics and Prediction of Climate Variability and Human Health Impacts in the Tropical Americas") and COLCIENCIAS-Colombia for funding and supporting activities during the period 2000–2002. G. Poveda's research was partially supported by CIRES (University of Colorado, Boulder) through a Visiting Fellowship dur-ing 2001–2002. D. Ruiz was partially supported by the project 'PDF-B Inte-grated National Adaptation Pilot: High Mountain Ecosystems, Colombia's Caribbean Insular Areas, and Human Health/sub-activity Biological Model-ling, activity Risk Assessment, sub-component Early Warning System, com-ponent Human Health', funded by The Global Environment Facility (GEF)/World Bank and Conservation International during Nov-Dec 2005. Cur-rent modelling activities are being supported by Programa Ingeniería Ambi-ental, Escuela de Ingeniería de Antioquia.
References1. World Health Organization: World malaria situation in Part I.
Wkly Epidemiol Rec 1994, 72:269-274.
Page 29 of 30(page number not for citation purposes)
Malaria Journal 2006, 5:66 http://www.malariajournal.com/content/5/1/66
Publish with BioMed Central and every scientist can read your work free of charge
"BioMed Central will be the most significant development for disseminating the results of biomedical research in our lifetime."
Sir Paul Nurse, Cancer Research UK
Your research papers will be:
available free of charge to the entire biomedical community
peer reviewed and published immediately upon acceptance
cited in PubMed and archived on PubMed Central
yours — you keep the copyright
Submit your manuscript here:http://www.biomedcentral.com/info/publishing_adv.asp
BioMedcentral
2. Gilles HM, Warrell DA: Bruce Chwatt's Essential Malariology London:William Heinemann Medical Books Ltd; 1993.
3. Martens WJM: Health impacts of climate change and ozone depletion. Aneco-epidemiological modelling approach The Netherlands: MaastrichtUniversity Press; 1997.
4. Epstein PR: Is global warming harmful to health? Scientific Amer-ican 2000.
5. Poveda G, Graham NE, Epstein PR, Rojas W, Quinones ML, Velez ID,Martens WJM: Climate and ENSO Variability Associated withVector-Borne Diseases in Colombia. In El Niño and the SouthernOscillation, Multiscale Variability and Global and Regional Impacts 1st edi-tion. Edited by: Diaz HF and Markgraf V. Cambridge University Press;2000:183-204.
6. Bouma M, Poveda G, Rojas W, Quinones ML, Cox J, Patz J: Predict-ing high-risk years for malaria in Colombia using parametersof El Niño-Southern Oscillation. Trop Med Int Health 1997,2:1122-1127.
7. Poveda G, Rojas W: Evidencias de la asociación entre brotesepidémicos de malaria en Colombia y el fenómeno El Niño-Oscilación del Sur. Revista de la Academia Colombiana de Ciencia1997, 21:421-429.
8. Poveda G, Rojas W, Quinones ML, Velez ID, Mantilla RI, Ruiz D, Zul-uaga JS, Rua GL: Coupling between annual and ENSO times-cales in the malaria-climate association in Colombia. EnvironHealth Perspect 2001, 109:489-493.
9. Toro M, Aracil J: Qualitative analysis of system dynamics eco-logical models. System Dynamics Review 1988, 4:56-80.
10. Aracil J, Toro M: Métodos cualitativos en Dinámica de Sistemas Sevilla:Secretariado de Publicaciones de la Universidad de Sevilla; 1993.
11. Aron J, May RM: The population dynamics of malaria. In Thepopulation dynamics of infectious diseases: theory and applications Editedby: Anderson RM. London: Chapman and Hall; 1982:139-179.
12. Blower SM, Small PM, Hopewell PC: Control strategies for tuber-culosis epidemics: new models for old problems. Science 1996,273:497-500.
13. Blower SM, Porco TC, Darby G: Predicting and preventing theemergence of antiviral drug resistance in HSV-2. Nat Med1998, 4:673-678.
14. Blower SM, Gerberding JL: Understanding, predicting and con-trolling the emergence of drug-resistant tuberculosis: a the-oretical framework. J Mol Med 1998, 76:624-636.
15. Dietz K: Mathematical models for transmission and control ofmalaria. In Malaria: principles and practice of malariology Volume 2.Edited by: Wernsdorfer WH, McGregor I. Churchill Livingstone, NewCork; 1988:1091-1133.
16. Dyner I: Dinámica de sistemas y simulación continua en el proceso de plan-ificación. Primera edición Medellín: Publicación Universidad Nacional deColombia; 1993.
17. Haile DG: Computer simulation of the effects of changes inweather patterns on vector-borne disease transmission. InThe potential effects of global climate change in the United States Editedby: Smith JB, Tirpak DA. Document No. 230-05-89-057, Appendix G.Washington, D.C. U.S. Environmental Protection Agency; 1989.
18. Mckenzie FE, Wong RC, Bossert WH: Discrete-event simulationmodels of Plasmodium falciparum malaria. Simulation 1998,71:213-217.
19. Macdonald G: The epidemiology and control of malaria London UK:Oxford University Press; 1957.
20. Yang H: Malaria transmission model for different levels ofacquired immunity and temperature-dependent parame-ters (vector). Rev. Saúde Pública 2000, 34:223-231.
21. Yang H, Ferreira M: Assessing the effects of global warming andlocal social and economic conditions on the malaria trans-mission. Rev. Saúde Pública 2000, 34:214-22.
22. De Bruin HAR: Evapotranspiration in humid tropical regions.In Hydrology of Humid Tropical Regions with Particular Reference to theHydrological Effects of Agriculture and Forestry Practice. Proceedings of theHamburg Symposium Volume 140. IAHS Publ; 1983.
23. Gabinaud A: Ecologie de deux Aedes halophiles du LittoralMediterraneen Français: Aedes caspius (Pallas, 1771), Aedesdetritus (Haliday, 1833). Utilisation de la végétation commeindicateur biotique pour l'établissement d'une carteécologique. Aplication en dynamique des populations. In PhDthesis Universitte des Sciences et Techniques du Languedoc, CentreUniversitaire de Perpignan; 1975.
24. Lotka A: Elements of physical biology Baltimore: Williams&Wilkins Co;1925.
25. Volterra V: Variazioni e fluttuazioni del numero d'individui inspecie animali conviventi. Mem R Accad Naz dei Lincei Ser 1926,2:31-113.
26. Sharov A: Quantitative population ecology. 1996 [http://www.ento.vt.edu/~sharov/PopEcol/popecol.html]. On-line lectures,Department of Entomology, Virginia Tech, Blacksburg, VA
27. Henize J: Course materials for principles of Dynamic Systems MIT; 1971. 28. Garrett-Jones C, Shidrawi GR: Malaria vectorial capacity of a
population of Anopheles gambiae . Bull World Health Organ 1969,40:531-545.
29. Service MW: A guide to medical entomology London: The MacmillanPress Ltd; 1980.
30. Ruiz D, Poveda G, Quiñones ML, Velez ID, Rua G, Rojas W, ZuluagaJS: Modelación sistémica para el diagnóstico de la interacciónclima-malaria en Colombia. Aplicación durante El Niño1997–1998 y La Niña 1998–2000. Meteorologia Colombiana 2002,5:41-48.
31. Ruiz D, Poveda G, Quiñones ML, Vélez ID, Rúa G, Rojas W, ZuluagaJS: Modeling entomological-climatic interaction of malariatransmission at Nuquí (Colombian Pacific Coast). Case ofstudy: El Niño 1997–1998 and La Niña 1998–2000. In Confer-ence Climate Variability and Change and their Health Effects in the Carib-bean: Information for Climate Variability and Change Adaptation Planningin the Health Sector PAHO/WHO. Bridgetown, Barbados; 2002.
32. Ruiz D, Poveda G, Mantilla RI, Quiñones ML, Vélez ID, Rúa G, RojasW, Zuluaga JS: Modelación de la interacción entomológica-climática de la transmisión de la malaria mediante Dinámicade Sistemas. Revista Colombiana de Entomología 2003, 29:191-201.
33. Poveda G, Rojas W: Evidencias de la asociación entre epi-demias de malaria en Colombia y el fenómeno El Niño/Oscilación del Sur. Revista Academia Colombiana de Ciencias 1997,21:421-429.
34. Poveda G, Rojas W, Quiñones ML: Relación entre brotesepidémicos de malaria en Colombia y el Niño-Oscilación delSur. Informe COLCIENCIAS. Medellín, Colombia; 1999.
35. Detinova TS, Beklemishev WN, Bertram DS: Age-grouping meth-ods in diptera of medical importance. Volume 47. Geneva:WHO Monograph; 1962.
36. Boyd MF: Epidemiology: factors related to the definitive host.In Malariology Volume 1. Edited by: Boyd MF. Philadelphia and London:WB Saunders Company; 1949:608-697.
37. Gillies MT, De Meillon B: The anophelinae of Africa south of the Sahara(Ethiopian zoogeographical region) 2nd edition. South African Instituteof Medical Research, Publication No. 54; 1968.
38. White GB: Malaria vector ecology and genetics. Brit Med Bull1982, 38:207-212.
39. Molineaux L: The epidemiology of human malaria as an expla-nation of its distribution, including some implications for itscontrol. In Malaria: principles and practice of malariology Volume 2.Edited by: Wernsdorfer WH, McGregor I. New York USA: ChurchillLivingstone; 1988:913-998.
Page 30 of 30(page number not for citation purposes)
http://www.ncbi.nlm.nih.gov/entrez/query.fcgi?cmd=Retrieve&db=PubMed&dopt=Abstract&list_uids=9438466
http://www.ncbi.nlm.nih.gov/entrez/query.fcgi?cmd=Retrieve&db=PubMed&dopt=Abstract&list_uids=9438466
http://www.ncbi.nlm.nih.gov/entrez/query.fcgi?cmd=Retrieve&db=PubMed&dopt=Abstract&list_uids=9438466
http://www.ncbi.nlm.nih.gov/entrez/query.fcgi?cmd=Retrieve&db=PubMed&dopt=Abstract&list_uids=8662538
http://www.ncbi.nlm.nih.gov/entrez/query.fcgi?cmd=Retrieve&db=PubMed&dopt=Abstract&list_uids=8662538
http://www.ncbi.nlm.nih.gov/entrez/query.fcgi?cmd=Retrieve&db=PubMed&dopt=Abstract&list_uids=9623975
http://www.ncbi.nlm.nih.gov/entrez/query.fcgi?cmd=Retrieve&db=PubMed&dopt=Abstract&list_uids=9623975
http://www.ncbi.nlm.nih.gov/entrez/query.fcgi?cmd=Retrieve&db=PubMed&dopt=Abstract&list_uids=9725765
http://www.ncbi.nlm.nih.gov/entrez/query.fcgi?cmd=Retrieve&db=PubMed&dopt=Abstract&list_uids=9725765
http://www.ncbi.nlm.nih.gov/entrez/query.fcgi?cmd=Retrieve&db=PubMed&dopt=Abstract&list_uids=9725765
http://www.ncbi.nlm.nih.gov/entrez/query.fcgi?cmd=Retrieve&db=PubMed&dopt=Abstract&list_uids=5306719