Competitiveness of Colombian Departments observed from an Economic geography Perspective
49
ISSN 1692-2611 Borradores Departamento de Economía Medellín - Colombia _______________________________________________________________________________________ La serie Borradores Departamento de Economía está conformada por documentos de carácter provisional en los que se presentan avances de proyectos y actividades de investigación, con miras a su publicación posterior en revistas o libros nacionales o internacionales. El contenido de los Borradores es responsabilidad de los autores y no compromete a la institución. N°28 Abril de 2009 Competitiveness of Colombian Departments observed from an Economic geography Perspective Elaborado por: Jorge Lotero Contreras Héctor Mauricio Posada Duque Daniel Valderrama Este Borrador es derivado de un proyecto de investigación de mediana cuantía, financiado por el Comité para el Desarrollo de la Investigación -CODI- de la Universidad de Antioquia
-
Upload
independent -
Category
Documents
-
view
0 -
download
0
Transcript of Competitiveness of Colombian Departments observed from an Economic geography Perspective

Borradores Departamento de Economía no. 28
1
ISSN 1692-2611
Borradores Departamento de Economía
Medellín - Colombia
_______________________________________________________________________________________
La serie Borradores Departamento de Economía está conformada por documentos de carácter provisional
en los que se presentan avances de proyectos y actividades de investigación, con miras a su publicación
posterior en revistas o libros nacionales o internacionales. El contenido de los Borradores es responsabilidad
de los autores y no compromete a la institución.
N°28 Abril de 2009
Competitiveness of Colombian Departments observed from an Economic
geography Perspective
Elaborado por:
Jorge Lotero Contreras
Héctor Mauricio Posada Duque
Daniel Valderrama
Este Borrador es derivado de un proyecto de investigación de mediana cuantía,
financiado por el Comité para el Desarrollo de la Investigación -CODI- de la
Universidad de Antioquia
Competitiveness of Colombian Departments observed from an Economic geography
Perspective
Jorge Lotero Contreras
Héctor Mauricio Posada Duque
Daniel Valderrama*
Introduction: I. The Ambiguities of the Concept of Competitiveness:
an alternative conceptual framework. II. Competitiveness
Measurement Problems: critical review of literature in Colombia.
III. An alternative Proposal for Measuring Regional
Competitiveness. – Conclusions. – Bibliography.
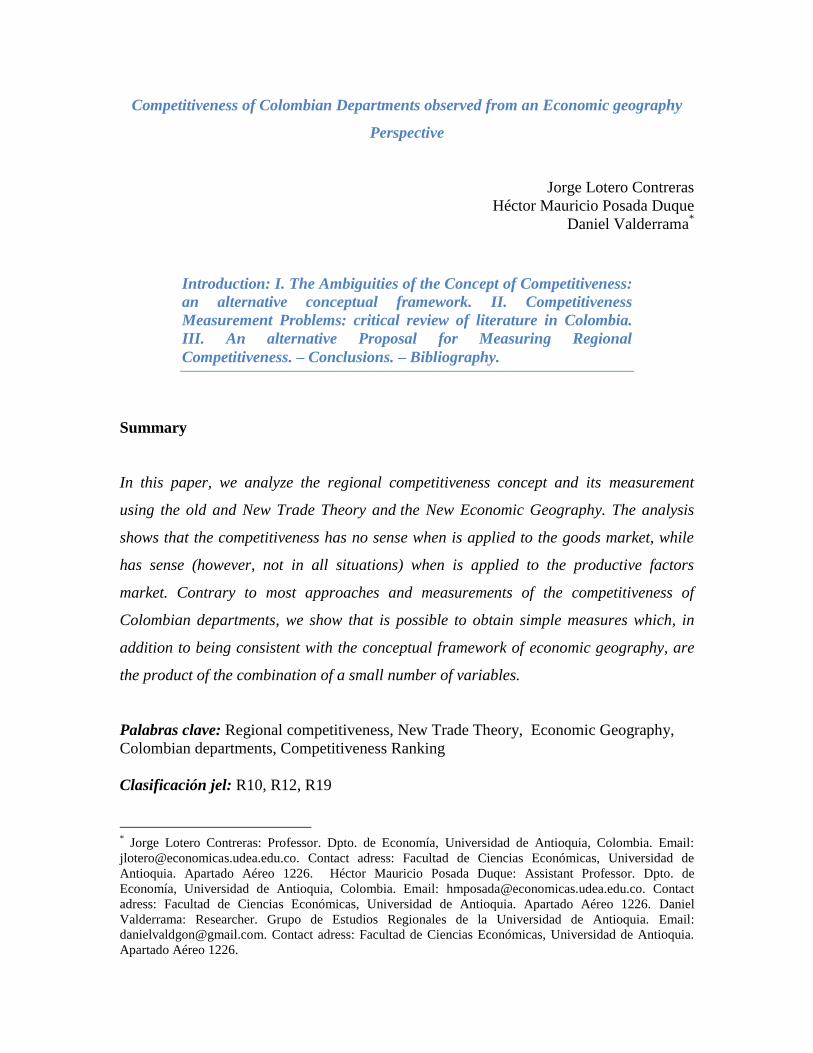
Summary
In this paper, we analyze the regional competitiveness concept and its measurement
using the old and New Trade Theory and the New Economic Geography. The analysis
shows that the competitiveness has no sense when is applied to the goods market, while
has sense (however, not in all situations) when is applied to the productive factors
market. Contrary to most approaches and measurements of the competitiveness of
Colombian departments, we show that is possible to obtain simple measures which, in
addition to being consistent with the conceptual framework of economic geography, are
the product of the combination of a small number of variables.
Palabras clave: Regional competitiveness, New Trade Theory, Economic Geography,
Colombian departments, Competitiveness Ranking
Clasificación jel: R10, R12, R19
* Jorge Lotero Contreras: Professor. Dpto. de Economía, Universidad de Antioquia, Colombia. Email:
[email protected]. Contact adress: Facultad de Ciencias Económicas, Universidad de
Antioquia. Apartado Aéreo 1226. Héctor Mauricio Posada Duque: Assistant Professor. Dpto. de
Economía, Universidad de Antioquia, Colombia. Email: [email protected]. Contact
adress: Facultad de Ciencias Económicas, Universidad de Antioquia. Apartado Aéreo 1226. Daniel
Valderrama: Researcher. Grupo de Estudios Regionales de la Universidad de Antioquia. Email:
[email protected]. Contact adress: Facultad de Ciencias Económicas, Universidad de Antioquia.
Apartado Aéreo 1226.

Borradores Departamento de Economía no. 28
1
Introduction
The topic of competitiveness is new for economic development analysis and public
policies. In Colombia, as well as in most Latin American countries, its origin goes back
to the second half of the 1990s when international insertion and economic aperture
programs were adopted (Peres, 1997).
In its beginnings, the topic was limited to business spheres and national government
officials but in recent years it has gained importance at sub-national levels, becoming in
something like a mantra that is invoked during the analysis, and the practice, of economic
development (Moncayo, 2003), or a creed or an “industry” (Lall, 2001), or in a
dangerous obsession (Krugman, 1995). In a manner, this has lead to thinking that any
reflection about globalization, economic development, or public policies, must
necessarily mention competitiveness.
As a matter of fact, competitiveness in Colombia has become a fundamental element in
public policy agendas in national and regional settings, and also the topic of studies by
prestigious national and international academic institutions. Several of the studies
concerning the competitiveness of Colombian departments (CEPAL, 2002 and 2007;
CRECE, 2002; CID, 2002), have centered on measurement, because this is considered of
vital importance for taking decisions in public and private fields. These studies use
conceptions and methodologies similar to those by the World Economic Forum, WEF,
and the International Institute for Management Development, IMD. Despite the
importance of measurement for the purposes indicated, in Colombia such studies have
not received sufficient attention concerning the discussion of the theoretic validity of the
concepts used, or the pertinence of the methodologies adopted.
The results of some of these studies pose several questions. The first deals with the idea
that regions compete with each other for markets of goods, showing no differences from
the behavior of firms. An identical association has been made between firms and
countries, which has been the object of many critiques and questionings (Lall, 2001;
Borradores Departamento de Economía no. 28
2
Krugman, 1995). Besides, independently from the adopted conception of
competitiveness, in such studies neither the sense of the confrontation, nor its causes or
explaining factors, are specified. The second, related to the latter, is that measurement
appears as an end in itself, without clearly establishing its relationship with the adopted
notion of competitiveness, nor with its determinants, conducing to errors concerning the
design and adoption of public policies (Kitson et al. 2004; Lall, 2001). On this regard, the
measurement that has dominated has been based on the so called “growth
competitiveness,” which has also been criticized for its conceptual and empirical
inconsistencies from the theory of growth itself (Lall, 2001).
This article analyzes these questions with arguments from the economic theory,
particularly that of economic geography, emphasizing the mobility of productive factors
and the paradigm of increasing returns. The article shows some of the problems and
inconsistencies presented in the measurement of competitiveness of departments in
Colombia, and proposes an alternative conceptual and methodological approach based on
economic geography. Likewise, it proposes a competitiveness measurement that, besides
being compatible with the previous approach, is not significantly different from the
ranking results obtained in other studies and with the advantage that is calculated with a
smaller number of variables and factors.
The article is divided into three sections. In the first one, the debate is centered around the
notion of regional competitiveness, presenting a conceptual framework that is based on
trade theories, geography and an evaluation of multinationals. In the second part, the
most relevant studies about regional competitiveness in Colombia are revised, presenting
a methodological framework that, in our judgment, is consistent with our
conceptualization. In the third part, a measurement of competitiveness is obtained
through the use of the principal components and the hierarchical clusters analysis.
Finally, conclusions and final observations are presented.

Borradores Departamento de Economía no. 28
3
I. The Ambiguities of the Concept of Competitiveness: an Alternative Conceptual
Framework.
The ambiguity of the notion of competitiveness arises in the difficulties to precisely
identify its actors or agents, the scenarios of the „confrontation,” and its causes.
Although there is no agreement among specialist concerning the topic1, our inquiries
about the numerous definitions of competitiveness at a country, a regional, or a firm,
level, indicate that the starting point has been trade and its relationship with well-being
and economic success. In this sense, it is associated with the capacity of an economy to
produce goods and services that pass the international markets tests and, simultaneously,
keep high growth rates and high population well-being levels (Storper cited by Kitson et
al. 2004). According to such definition, a region becomes more competitive when
increase its capacity to participate in the market (displacing other regions completely or
partially) , and as a consequence increase the income of its inhabitants.
This definition, commonly used for the analysis of national economies, has also extended
into the regional setting by associating directly with the notion of export-base and
limiting itself to the field of trade. In this manner, besides not distinguishing between
regions and countries and evading the problem of resource mobility, such notion
implicitly accepts that nations, as well as regions, behave as firms and when they
confront each other in goods markets, trade is a zero-sum game. As rightly indicated by
Krugman and other economists, such conception is incorrect from the perspective of
economic theory: countries do not behave as firms, and states, or territorial levels, do not
have as an objective to compete among each other, but try to create opportunities for all
economic agents2.
1 There is a numerous set of definitions from different perspectives: trade, macro-economy, micro-
economy, business, structuralist, and systemic. In our judgment, this is a sign of the concept‟s ambiguity.
On this regard, see Bougrine (2001).
2 We remark that different from public goods, private goods suppose exclusion. Likewise, we remark that
the first type of goods are provided by national or local governments, while the second are the result of the
firms‟ activities. This is an aspect that shall no be ignored when differentiating the behavior of firms,
nations and regions.

Borradores Departamento de Economía no. 28
4
These ideas come from the belief that the notion of competitiveness accepted in business
and administration literature, can be extended into sub-national and national levels. In a
strict sense, firms compete for increasing their participation in the market in such a
manner that, when a firm wins, it does it at the expense of the others. Therefore, for the
notion of competitiveness previously developed to have complete sense for a region, the
region must define itself and behave in a manner that is analog to a firm, and should also
place itself in the same scenario of the latter, in a particular market. In other words,
besides being specialized in the production of one good, it should also confront other
regions that also produce the same good. However it‟s apparently, that this is not a good
description of the regions.
A. Regional Competitiveness and Trade
Consider a scenario where regions in a country relate with each other through flows of
inter- and intra-industry trade. This reflects, precisely, the reality of sub-regional and
international trade.
The first flow implies that regions trade complementary goods and, therefore, each is
partially or completely specialized in the production of a different good. The second type
implies that regions trade similar goods but each one specializes in a particular variety or
in certain quality of the good.
Then, under both types of flows, we move away from the required conditions for the
usual definition of competitiveness to be applicable at regional or at country levels. In
this way, the notion of complementarity, as a mechanism to reach higher levels of real
income, gains importance. In the next lines, we will emphasize on the latter.
When inter-industry trade is considered, the natural reference frameworks are the
Ricardian and Heckscher-Ohlin models. From either one of the models, it is possible to
explain the way how countries (and in an analog way regions) can benefit from
complementarity. In these settings, firms find themselves in a perfect competition
Borradores Departamento de Economía no. 28
5
scenario, producing goods with a with low degree of substituibility in terms of
consumption (for instance manufactured goods and food) using labor and/or capital,
which in turn are scarce resources. In this type of situation, opportunity costs create the
possibility for regions to specialize in just one of the goods, and take advantage of the
mutual benefits of trade. In other words, they improve their income (measured by their
capacity to buy) through specialization and trade. In this type of scenario the notion of
competitiveness is neither relevant nor suitable, unlike the notion of complementarity.
If in the previous scenario, regional authorities consider to adopt competitiveness
policies, with the objective of expanding markets for all goods (in this case manufactured
goods and food), they will increase production of the good in which don‟t have
comparative advantage, sacrificing, therefore, production of the good in which has
comparative advantege. In this type of situation, compared with a specialization situation,
the regions loses as they obtain a smaller real income. Authors like Krugman and Lall, in
the texts cited above, showed this but only at a national level. Now, as regions are much
more open to trade at the interior of countries, the previous analysis can be extended to
this level.
Differently from the previous scenario, intra-industry trade considers simultaneous
purchases and sales of similar goods among regions. The differences among the goods
can be based in secondary characteristics such as packaging, colors, design, etc, or can be
based in the quality, existing high and low quality varieties. At a country level. Balassa
(1966), Grubel (1967), and Grubel and Lloyd (1975), showed the importance of this type
of trading, while Greenway and Milner (1983), and Hine and Milner (1995) observed the
existence of secondary differences and quality differences in intra-industry trade.
In the case of the first type of differences, goods are produced under scale economies in
an imperfect competition scenario. Krugman in his works of 1979, 1980 and 1981 under
monopolistic competition assumption, shows that the producers‟ rationality brings a
situation of specialization in the production of a limited number of varieties in each
country. This in turn produces the gains associated with scale economies when firms
confront a larger market (the market of the integrated economy). This creates the
Borradores Departamento de Economía no. 28
6
possibility for a mutually beneficial exchange as the inhabitants of both countries
increase their real income and enjoy a larger variety of consumption goods. Naturally,
this analysis can be extended at a regional level, which shows that under this type of
intra-industry trade, the gains for the regions come, again, from complementarity and not
from competitiveness.
If we consider quality differentiation, the principle of comparative advantage rules again,
creating a situation in which the regions benefit from specializing production of a
determined quality (Falvey et al. 1987).
To summarize, in a situation of inter-industry or intra-industry trade based on quality
differences, free trade conduces to an equalization of factor remuneration and, therefore,
to an efficient assignation of resources through comparative advantages mechanism (Lall
2001). Meanwhile, in a situation of intra-industry trade based on secondary differences,
efficiency increases through scale economies mechanism. Therefore complementarity,
not competitiveness, explains the relationships established by regions in international and
inter-regional trade, and implies that trade is possibly not the most relevant scenario of
the “confrontation” among regions in a country.
Porter, whose works (Porter 1991, 1998) have inspired approaches concerning regional
competitiveness in Colombia, has question the validity of the theory of competitive
advantages, trying to make competitiveness an alternative concept for specialization and
complementarity in trade. For this author, firms are the players in competitiveness.
However, nations, and therefore regions, are not only the spaces of their location but also
actors that can contribute with their actions to the competitiveness of firms. This makes
room for a new concept of competitiveness associated with the business on one side, and
the “environment,” in which firms operate, on the other. From this notion, it is implicitly
stated that regional levels are important for competitiveness because that is where firms
gets inputs and resources (human capital for instance) , establish horizontal and vertical
relationships with other firms and industries, takes the the institutional environment, and
Borradores Departamento de Economía no. 28
7
create chains, and clusters or firm groupings. Under this perspective, one can deduce that
in addition to firms, firms “environments” also confront each other in the markets.
On another front, once competitiveness becomes independent from the theory of
comparative advantages, and as a result from the factor endowment of regions, the trade
success of firms, regions and countries falls upon the competitive advantages, dynamic or
created, (Haque, 1995.)3 This, in our judgment, is another way of referring to factors with
increasing returns, externalities and complementarities. Firms‟ competitiveness, and as
result national and regional economies competitiveness, reflect the strategies of firms and
of different government levels to improve the environment where they are located,
independently of the resources they may have.
Nevertheless, this last notion is not free of ambiguities because the scenario and the
motives for competition are still imprecise. Furthermore, regions are not differentiate
from nations4, the relationship between competitiveness and the economic resources are
not clarified, and their allocation, are not clearly established. In our judgment, not
recognizing specialization according to the availability of resources, implies stating that
firms have an intrinsic capacity to “confront” in any market, without an explanation for
the origin of the resources used in production.
B. Regional Competitiveness, Agglomeration and Resources Mobility
Until now, we have omitted productive resources mobility, a crucial aspect to understand
competitiveness and its importance from a regional perspective. The problem consists on
understanding regional competitiveness as an increase of the income, that is due to the
attraction of resources associated with the agglomeration of economic activity; a logical
3 Identifying the success of firms in markets and the prosperity of countries and regions with their
productivity, is not a novelty. In this sense, competitivity becomes just an alternative expression to refer to
productivity. From the perspective of growth and development economy theories, this angel may be
considered unnecessary and useless. 4 In our judgment, Porter‟s approach , although useful, does not clearly establish differences between levels
of government or between territorial scales due to its functional character and because he considers territory
as a factor that is part of the firms strategies or a “container” where they set up. On this matter, see Conti
(1995).
Borradores Departamento de Economía no. 28
8
argument in terms of spatial and geographical economy and in terms of economic
structural change5.
Next, we will examine the manner on how resources mobility associated with the process
of agglomeration, which also affects productivity, intervenes in regional competitiveness.
Agglomeration, from an economics perspective, results from the interaction between
transportation costs and increasing returns. In the following lines we will examine the
pertinence of the concept of competitiveness based on the attraction of resources, inside
and outside regions‟ countries.
1. Agglomeration and Mobility of Resources in the National Territory
If we start with a perfect competition situation with constant returns of scale and
decreasing marginal products of the factors, mobility produces a result, , that is identical
to the one based in the inter-industry and intra-industry trade generated on the quality
differences of the goods6: an equalization of factor returns and an efficient assignation of
resources. In the case of a country without restrictions to mobility, regions attract
resources that are scarce and put out those that are abundant, and achieve well-being
gains, converging to a same level of per-capita income. In this type of situation gains are
obtained by complementarity in the use of resources, and not by their accumulation7.
The case is different when regions are conceived not just from a perspective of
specialization and resource endowments, but also as an agglomeration of firms and
population. This assumes the existence of scale economies, externalities, clusters,
cumulative learning and transportation costs. In this type of case, competition for scarce
resources, although limited, does not lose its sense, which leads us to consider region
competitiveness as a matter of spatial and economic geography.
5 Despite natural resources being considered, from the perspective of economic development, as an
“exogenous” condition of productivity, due to their non-mobility, they have not been taken into account
when examining competitivity (Rodrik, 2003, Gallup, 1998.) 6 Regions of a country are considered as completely open economies without restrictions on the trade and
mobility of resources among them. 7 Mobility acts as a perfect substitute for trade as it affects factor prices in a similar way, and according to
Porto (2003) becomes a fundamental theoretical piece demonstrated by Mundell in 1957.

Borradores Departamento de Economía no. 28
9
Spatial economy, under the light of the New Economic Geography and also the modern
theory of growth, has demonstrated that in a scenario as the one previously described,
mobility and trade give way to processes of “cumulative causation” and economic
polarization with territorial manifestations (Fujita el al. 1999). Under the light of these
perspectives, the existence of increasing returns and transportation costs originate
processes of agglomeration of the economic activity, in which some regions attract
resources while others drive them out8. This explains how regions evolve, creating
cumulative and dynamic advantages, associated with the supply of resources such as
technology and innovation, physical capital, infrastructure and human capital (Stiglitz
1989). In a certain manner, this are the principal factors that intervene in a productivity
increase, all associated with growth and agglomeration.
Lets take a moment to see a part of the mechanism. It`s known that scale economies
generate important incentives for a given level of demand be covered by an only plant. If
there were no transportation costs, firms would be indifferent regarding the placement of
this plant, so agglomeration processes would not occur. Nevertheless, when these are
considered, firms design strategies to reduce them. One such strategy is to move to the
areas where the biggest markets are. If this behavior is followed by all firms, the small
initial differences in the distribution of economic activities become big.
Therefore, it makes sense that some regions gain at the expense of others, and that they
remain able to keep a sustainable growth by attracting resources, giving meaning to
competitiveness. For a certain level of demand, and under a full employment situation,
the result of this process is of zero sum. The previous statement means that the most
successful regions would be those with high growth rates that are due to an increase of
accumulation rates, and due to the efficient assignation of resources towards the activities
with the highest production levels, and/or to the activities with a significant weight on
externalities, clusters, complementarities and factors with increasing returns: human
8 The approaches about cumulative causation, and the uneven character of the economic and regional
development process are found among the old ideas of Myrdal, Perroux and others.

Borradores Departamento de Economía no. 28
10
capital, innovation, public capital, etc. Frequently, these regions are the ones with the
highest levels in the competitiveness rankings for Colombia and other countries.
However, this is a result that in the first stages is natural to economic functioning and not
to firms‟, or regions‟, strategies, nor to public policies, even if they somehow can
contribute to agglomeration.
Nevertheless, in advanced development phases, in regions with advantages in terms of
the availability of factors with increasing returns and of capital and quality institutions,
dispersion forces begin to operate: high prices for non-mobile factors, negative external
economies related with the congestion and contamination. In such circumstances there is
an expulsion of the economic activity that generates the competition among other regions
in a country. However, the geographical proximity of some regions to the center is a
factor that can limit inter-regional competition for resources, and can contribute to
increasing the capacity of the central regions to attract them. This is basically explained
by the interaction between the market potential of the central regions, pecuniary and
technological externalities, and geographical proximity. The previous is the support of
the famous “concentrated deconcentration,” in which firms that come out of the center
relocate near it, as they value proximity, more than the possibility of completely avoiding
the centrifuge forces, and limit their power as a result. For this reason, regions nearer the
center are expected to be the most competitive and, differently from Porter‟s approach,
the behavior and strategies of firms are not independent from the advantages of market
access and resource availability, and in particular of geographical factors, and
infrastructure and telecommunication factors.
It is necessary to mention that, in the case of a major reduction of transportation costs due
to improvements to road infrastructure and services, and only in the case that some of the
periphery locations have the previously mentioned favorable conditions concerning
physical and human capital and institutions, resources will abandon the central locations
attracted to this type of regions. As a conclusion, the message is clear: Regional
competitiveness is not general phenomena, but a limited one where it gains logic as a
matter closely related to firms‟ spatial strategies, and articulated with regional

Borradores Departamento de Economía no. 28
11
governments‟ public policy actions concerning the improvement of the supply and the
quality of productive factors.
2. External Resources Mobility
Because of globalization and economic openness, flows of trade and investment have
intensified and regions have inserted themselves in the international scenario. For this
reason, some observations, regarding the problem of competition in relation to foreign
investment, are necessary.
An important part of the flow of productive resources among countries and regions is due
to direct foreign investment under two basic modalities: vertical and horizontal (Navaretti
et al. 2004). The first modality is linked to the fragmentation of production processes of a
multinational firms9. The second is linked with the replication of its production processes
in other countries. Now, if a multinational firm wants to invest in a country, a situation in
which all its regions can receive this productive resources emerges. When a region
receives these resources, the others perceive an opportunity cost and, in this manner, one
of the regions increases its level of income in comparison with the remaining regions.
Then, the key question is: Given the types of direct foreign investment, which factors
determine that a multinational firms invests in a particular region and not in another?
It is obvious that for foreign investment dedicated to the production of primary goods,
agricultural or mining, there aren‟t alternatives for localization. The former is
fundamentally determined by physical geography and, particularly, by the channels
through which productivity is transmitted: soil quality, topography, climate, and access to
markets. All, but the last factor which can be affected by supply and infrastructure
quality, are considered exogenous factors and, therefore, are far away from being
controlled (Rodrik, 2003, Gallup, 1998). As a consequence, the notion of regional
competitiveness loses meaning in this case.
9 Nearly one third of all the exports of the United States, and 42% of all its imports, are sales from one
multinational firms division to another.

Borradores Departamento de Economía no. 28
12
On the contrary, multinational firms with manufacturing vocations which spatially
fragment their processes, (in other words, which integrate their investment vertically),
locate their production phases according to the intensity in the use of the resources, and
the endowments in the different regions. For instance, multinationals look to minimize
their labor costs in developing countries, locating processes that are labor intensive.
However, fragmentation implies assuming the costs of transporting the goods between
different countries as they go through the different production phases. This forces firms
to carefully consider their location to minimize transportation costs. Therefore, we have
that the regions offering advantages in these terms, will also be the most competitive.
These type of advantages results from the interaction between the physical geography,
and the transportation and telecommunications infrastructure. In this type of situation,
competitiveness policies make sense if they center on strengthening infrastructure.
Through the horizontal foreign direct investment (HFDI), multinational firms supply
given demand levels in a foreign country. Under the presence of scale economies and
transport costs of merchandises between regions, assumptions extensively used in HFDI
literature (Navaretti et al. 2004), firms would locate themselves in regions with the
biggest markets, duet to the reasons previously presented in the framework of resource
mobility at an inter-regional level.
Finally, it is important to recognize the role of the physical geography and of institutions
to increase the capacity of regions to attract resources. First, we remark the fact that those
regions with extreme conditions for the human life have low probabilities of attracting
resources. On this regard, Nuñez and Sanchez (2000) suggest that geography affects the
economic activity of municipalities in Colombia via: soil productivity, natural resource
availability and tropical diseases. Second, the successful development of any type of
economic activity depends on the institutional framework in which it happens and,
therefore, institutional quality is a determinant factor for investment to settle in a region.
Borradores Departamento de Economía no. 28
13
II. Competitiveness Measurement Problems: Critical Literature Review
The validity and the strength of a competitiveness measure, at a regional scale in this
case, depends of the consistency of the analytical framework supporting its construction,
of the measurements‟ coherence with the analytical framework, and of the adopted
methodology (Lall, 2001).
The pertinence of the analytical framework depends of a clear and precise definition of
the scenario in which regions compete, and also of the market failures that imply
economic conflicts among the regions; otherwise, one would simply be presenting a
regional growth analysis (Lall 2001). In addition, the theoretical rigor of the framework
depends that the scenarios and the failures being considered and evaluated under the
light of the economic theory.
The coherence between the measure and the framework depends on selecting a set of
variables that are consistent with the framework. Finally, methodological strength
depends on the use of proper statistical techniques that eliminate, or reduce, the possible
biases.
Paper‟s such as Lall‟s (2001), indicate some of the problems and inconsistencies
presented by the measurements, for a numerous and diverse set of countries, done by the
World Economic Forum (WEF) , and the International Institute for Management
Development (IMD). The principal papers about the competitiveness of Colombia
departments -CRECE (2002), CID (2002), CIE-UdeA (2006), and CEPAL (2007) – have
adopted procedures that, to our judgment, are similar to those of the questioned studies.
For instance, Lall shows that the WEF‟s notion and measurement of competitiveness
have problems due to the absence of a framework that identifies market failures that
imply economic conflicts among countries. In another paper, Krugman (1995) shows
how the most accepted definition of competitiveness, at country level, is nothing but a
“fun” way to denominate productivity, and in this manner questions the construction of
indexes at this level. On another front, the measurement made by the IMD also has
Borradores Departamento de Economía no. 28
14
problems as it does not keep a close relationship with the chosen conceptualization,
which in turn is based on the four forces of competitiveness argued by Porter.
Studies in Colombia, in line with those of the IMD and WEF, consider a numerous and
diverse set of variables and factors. Among the most representative factors are those of:
infrastructure and information technologies, government and institutions. Also considered
are: internationalization, business management, finances, human resources, science and
technology, the environment, and the economy‟s strength. In our judgment, some of these
can be considered expressions of the agglomeration degree of the economic activity as,
the dense labor markets with the highest qualification levels, the most dynamic and
profound financial systems, and the research centers, tend to concentrate in the cities and
regions with the highest degrees of economic activity. The internationalization factor has
to do with commercial aspects which, according to the argument in the previous section,
reflect the specialization of Colombian regions and, therefore, do not imply inter-regional
competition. Finally, aspects such as business management do not seem to have a solid
justification from the economic theory to explain competitiveness.
Only the studies of the CID, and of the CIE-UdeA, include variables and factors of a
spatial and geographic nature, as do the papers of Houvari (2001) and Kronthaler (2003),
for Finland and Germany, as one of the particular elements that differentiates regions
from countries. This is an conceptually and methodologically advance because imply the
adoption of an economic geography approach that identifies the factors which are a
source of increasing returns, or that are closely linked with agglomeration, pecuniary and
technological externalities, market potential, human and public capital, etc.
We have, therefore, that rankings in Colombia have been constructed with redundant
factors, and factors are themselves composed of a large number of variables. This,
according to Kitson et al. (2004) results in problems of over-prescription of policies.
Furthermore, there is no compatibility between the aggregation levels of variables with
those of a cluster, which correspond with a modality of organization conceptualization
that is not always associated with a particular region. On this regard, we need to remark

Borradores Departamento de Economía no. 28
15
that neither regions nor countries are identified with clusters. Finally, we observed that
these indexes, more than the competitiveness of similar regions, reflect the persistence of
forces towards concentration and a pattern of spatial specialization in agreement with
factor endowment which also explains territorial imbalances.
Another interesting point deals with the calculation of the weights associated with the
factors and variables that compose the competitiveness measurements. Most rankings
found in literature for Colombia and other countries – IMD (2006), WEF (2008), CRECE
(2002), CEPAL (2002), CEPAL (2007), Regional Studies Group (2006), and CID (2002)
– have been obtained by weighting a determined number of factors, or variables, deemed
relevant to the competitiveness of a region. Theses studies may differ according to the
factors used but, with regards to the calculation of weights, most adopt the Principal
Component Analysis (PCA), and occasionally complement it with the hierarchical
clusters analysis.10
However, there are papers that do not use this methodologies. For
instance, the CID‟s paper assumes subjective criteria about the weighting of variables and
factors, without significant differences in the final results from those obtained by the
CEPAL and the CRECE.
Naturally, the PCA option offers a clear advantage as the information contained in the
statistics series, is the information that determines the degree of importance of a variable
inside the index. Despite having advantages over the ad hoc weighting, due to its
objectivity, as it is based on statistics and mathematical criteria, it presents some
disadvantages that need to be mentioned. First, contrary to methods such as factor
analysis, it requires of the ad hoc grouping of variables and factors according to
economic intuition, empiric evidence, or the researcher‟s experience. Second, it can
produce factor indicators that behave in an opposite manner, and contrary, to the
predictions or intuitions of the economic theory. Then, for instance, one might have a
situation with a ranking in which the regions with the highest levels of economic activity
agglomeration, are also the ones with the worst institutional conditions. If this happens,
the method necessarily assigns a weigth with a negative sign to one of these two factors,
10
There is a short presentation of both methods in Appendix 1.

Borradores Departamento de Economía no. 28
16
in such a manner that an improvement in said factor represents a worsening in the
competitiveness index. For instance, this happens in the CEPAL‟s paper. Third,
competitiveness rankings can be very unstable in relation with the introduction of factor
or variable indicators. This means that the inclusion or exclusion of a variable in a factor,
can produce a result that is completely different from that expected for the factor. Then,
for instance, the exclusion of an indicator can result in a factor losing its statistical
significance, or having an incidence on competitiveness contrary to the one predicted by
theory or empiric evidence.
We conclude from this critical literature review that the attempts to improve
competitiveness indicators, by increasing the number of variables and factors, are vane
and expensive as they do not improve our knowledge of the topic, nor do they provide
additional information to raise the quality of policies on this subject. Now, as
competitiveness is associated with a relative measurement, indicators that reflect the
situation of a political-administrative entity as a matter of factors with increasing returns
must be built.
III An Alternative Proposal: Methodology and Results.
A. Methodological Proposal
Below, we present an alternative proposal to measure the competitiveness of Colombian
departments which, in addition to being consistent with the conceptual framework
developed in the first section and using less information than the measurements of other
studies, produces results which are compatible with the predictions of economic theory
and of empiric evidence about regional development in Colombia.
According to our judgment, a competitiveness indicator of this kind must be built from
the following factors: a) the economic activity agglomeration degree which indicates the
regions‟ strength or potential to attract productive resources, whether national or
foreigner, and includes market failures such as scale economies and transportation costs;

Borradores Departamento de Economía no. 28
17
b) access to markets, and road and transportation infrastructure, conditions which
influence the cost of transporting goods abroad, keeping in mind market failures related
to the costs of transporting a good from one country to another; c) the quality level of
institutions that regulate property rights and private activities are conditions for the
structural transformation of regions, and facilitate collective actions and the use of
externalities and economies of agglomeration; d) the physical geographic conditions
which affect human activities, particularly productivity and population well-being; and e)
human capital as a factor of well-being, of productivity and innovation, and of technical
change.
Considering the Colombian departments as the regions inside the country, and using a
data base for 23 departments,11
a competitiveness index was developed and clusters or
conglomerates were established. The techniques used were principal components and
hierarchical cluster analysis. Keeping in mind the theoretical elements discussed
concerning competitiveness, five factors related to the concept were defined:
Agglomeration and demand potential, transportation and communications infrastructure,
physical geography, institutions and human capital. For each one of these factors a set of
variables12
was gathered and, using the technique of principal components, reduced in its
dimensionality in a manner that only one variable is obtained at the end. This is the index
providing information about the factor. A global competitiveness index was obtained by
applying the same technique on the set of indexes calculated in the previous step, except
on the one for institutions as it behaves contrarily to the other indexes considered13
. The
cluster analysis was applied to the complete set of variables. Bellow are the principal
results.
11
The departments considered were those that offered complete information about the variables used in the
study. They were: Antioquia, Atlántico, Bogotá-Cundimarca, Bolívar, Boyacá, Caldas, Caquetá, Cauca,
Cesar, Chocó, Córdoba, Guajira, Huila, Magdalena, Meta, Narino, Norte de Santander, Quindío,
Risaralda, Santander, Sucre, Tolima and Valle del Cauca. 12
The variables correspond to 2005. For more details about the variables and indicators contemplated for
the measurement of different factors, see Appendix 3. 13
This, as previously explained in the previous section, creates serious problems in its interpretation in the
global index (an index that includes this factor suggests that the lower the institutional quality is in a
department, indicates a signal of higher competitivity.)
Borradores Departamento de Economía no. 28
18
B. Results: Competitiveness Index and Cluster Analysis for Colombian Departments
1. Agglomeration Factor
Probably the most significant fact observed in the ranking developed from the
agglomeration index (see graph 1), is that Bogotá-Cundinamarca sits on the first place,
very far from all the other regions. This observation is coherent with the results of the
most recent studies related with the distribution of economic activity inside the country
that shows how the Bogotá-Cundinamarca region has been gaining relative weight14
.
According to our discussion, this is the region that generates the most strong inertia to
attract national firms (under the dynamic of spatial economy), and multinational firms
(under the dynamic of HFDI). By agglomerating the larger part of the country‟s
economic activity, it is also the region that offers the largest market potential for the non-
tradable sectors. This implies that it has the largest number of hotels, shopping centers,
store chains, etc., and the largest possibility for these activities to increase.
This region is followed by Antioquia and Valle, with a small advantage of the first
department over the second. According to Moncayo (2007), both of these departments
have lost relative weight, which clearly indicates a tendency towards the strengthening of
Bogotá-Cundinamarca. It is important to point out that Valle has traditionally been a
more dynamic region, in terms of the reception of foreign direct investment (FDI), than
Antioquia and it also has some advantages over Antioquia because of its geographical
location and for its Port of Buenaventura.
Positions 4th
, 5th
and 6th
on the ranking of this factor are occupied by Atlantico, Bolivar
and Santander, three departments that do not show big differences among themselves.
Santander makes part of the “Trapecio Andino15
,” which represented 60% of the
country‟s Gross Domestic Product in 2000 (Moncayo 2007). Additionally, although
Atlantico has lost weight, gained by Bolivar, on the economic development of the
14
Baron (2003), Bonet and Meisel (2006), and Lotero (2007.) 15
With Valle, Antioquia and Bogotá-Cundinamarca

Borradores Departamento de Economía no. 28
19
country it remains as the fourth economic and population agglomeration. The middle
positions are occupied by a large number of departments with no-major differences
among each other: Magdalena, Córdoba, Huila, Sucre, Caldas, Risaralda, Tolima, Cesar
and Boyacá.. In the lasts places we have Quindío, Meta, Cauca, Chocó Guajira Nariño
and Caquetá wich conform the group of economies of small economic and population
agglomeration.
Source: Own calculations

Borradores Departamento de Economía no. 28
20
2. Transportation and Telecommunications Infrastructure Factor
As with the previous factor, a clear superiority of Bogotá-Cundinamarca over the rest of
the regions-departments is observed (see Graph 2). The following seven positions
corresponds to the departments of Valle, Risaralda, Caldas, Quindio, Antioquia,
Santander and Atlantico. Of the latter seven, Valle, Antioquia, Atlántico, Caldas and
Santander, are also among the seven positions following Bogotá-Cundinamarca, in the
agglomeration factor. This indicates a close relationship between the two factors.
The importance of the “Eje Cafetero” needs to be remarked. This importance is explained
by its geo-strategic localization as a communication node among the commercial flows of
the three most important economies in the country (Bogotá-Cundinamarca, Antioquia and
Valle) that allowed a development of his road infrastructure along the primary roads of
the national road network. An additional advantage lies on the fact that these departments
are small, which implies a stronger impact of said network than in other departments16
.
A high correlation (0.83) between this factor and the agglomeration factor is also
observed. This can be explained by the fact that the most dense and economically
dynamic markets require a bigger road and telecommunications infrastructure in their
interior. The correlation between the factors is not higher as, in addition to road
infrastructure serving the region‟s interior, the infrastructure that connects the region to
other regions and to the world is also considered.
16
This is contrary to departments such as Antioquia, whose territorial extension minimizes the importance
of the primary roads of the national network and the development of secondary roads along it, creating in
this manner the low indicator levels concerning road infrastructure coverage.

Borradores Departamento de Economía no. 28
21
Source: Own calculations
3. Human Capital
The Bogotá-Cundinamarca region occupies the first place in this factor (see Graph 3)
quite far from the other departments. This is the only region that comes close to the idea
of innovation poles with intensive production processes of human capital and
technological innovation. This region is followed by Antioquia, Santander, Caldas,
Atlantico and Valle. Caldas comes in fourth place as it is a region where a good number
of universities and research centers have established as a result of departmental and
municipal (Municipality of Manizales) policies for consolidation of higher education. A
third group above the national average is formed by Risaralda, Quindio, Boyaca and

Borradores Departamento de Economía no. 28
22
Norte de Santander. Finally, we must remark that the last places are occupied by the
departments on the Caribbean Coast, as said macro-region faces a big challenge with
regards to its human capital and innovation.
Source: Own calculations
4 Physical Geography
This factor is made up by the variables of malaria, leishmaniaisis, rain precipitations and
tropical forests. This means that having a high value in this index implies having a high
value on these variables and, therefore, less capacity of attraction of economic activities
that are not intensive on natural resources. As observed (see Graph 4), the regions with
the highest extensions of tropical forests (Choco, Narino, Caqueta) show a higher index
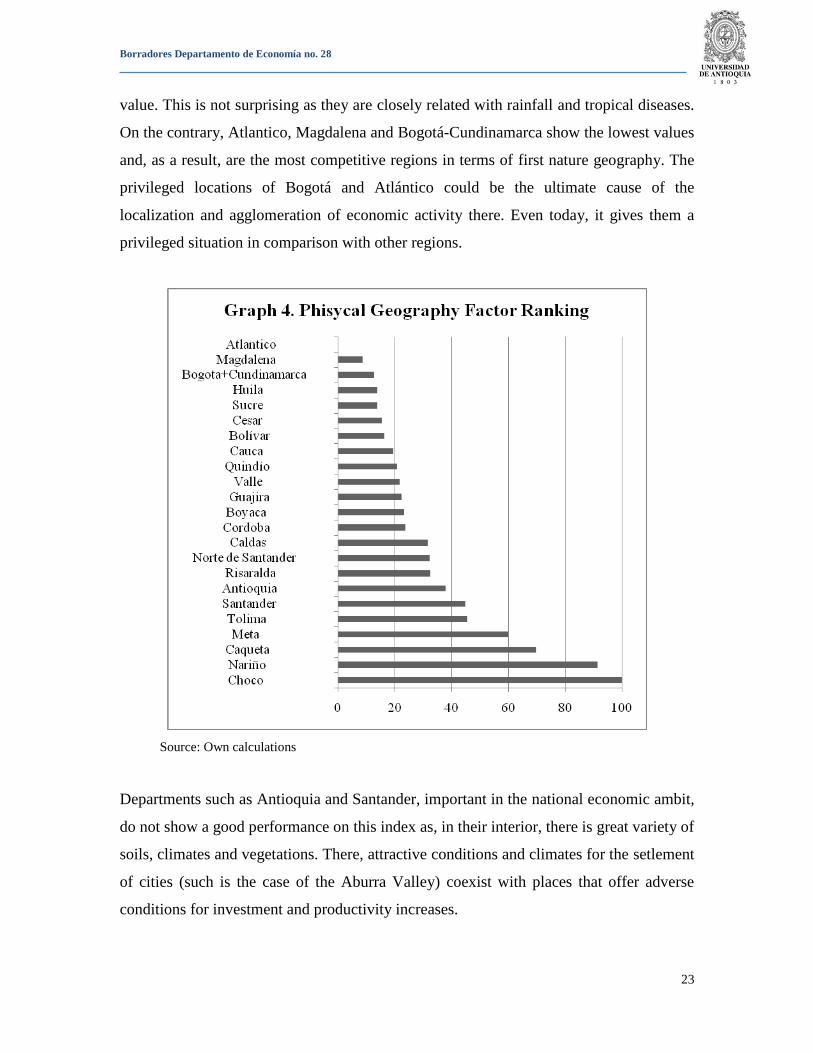
Borradores Departamento de Economía no. 28
23
value. This is not surprising as they are closely related with rainfall and tropical diseases.
On the contrary, Atlantico, Magdalena and Bogotá-Cundinamarca show the lowest values
and, as a result, are the most competitive regions in terms of first nature geography. The
privileged locations of Bogotá and Atlántico could be the ultimate cause of the
localization and agglomeration of economic activity there. Even today, it gives them a
privileged situation in comparison with other regions.
Source: Own calculations
Departments such as Antioquia and Santander, important in the national economic ambit,
do not show a good performance on this index as, in their interior, there is great variety of
soils, climates and vegetations. There, attractive conditions and climates for the setlement
of cities (such is the case of the Aburra Valley) coexist with places that offer adverse
conditions for investment and productivity increases.

Borradores Departamento de Economía no. 28
24
5 Regional Competitiveness Global Index
Just as observed in the rankings of agglomeration, infrastructure, and human capital, the
superiority of the Bogotá-Cundinamarca region, over the rest of the departments (see
Graph 5), is clear. The great capacity that this region has to attract productive resources
through the inertias generated by the agglomeration, by the advantages provided by its
infrastructure, and by the suitability of its physical geography, is confirmed. Following
Bogotá-Cundinamarca are, once again, Valle and Antioquia, with a small lead for Valle
which has a higher infrastructure index. Next, on the 4th
, 5th
, 6th
, and 7th
positions are
Atlantico, Caldas, Risaralda and Santander, respectively. These last four departments do
not show significant differences among themselves. As expected, the most competitive
departments sit on the highest places of the indexes of agglomeration and infrastructure,
as these are the factors with the biggest weight on the global index (see Table 1).
The results of our index show that the center regions, those with a higher degree of
economic activities agglomeration, are the ones that attract the most resources and,
therefore, the most competitive. This coincides with the studies made by CEPAL, CID
and CRECE (see Table 2). However, differently from those developed in these studies,
our index uses few factors and few variables (see Appendix 3), which are closely relate
with our conceptual framework centered upon the New Economic Geography. This
reinforces the idea that the other indexes use redundant factors and variables. This means
nothing but the expression of a lack of conceptual, theoretical, and methodological
precision regarding the topic of competitiveness, which we relate to the ability that a
region has to attract resources. We conclude, therefore, that the attempts to improve
competitiveness indicators by increasing the number of variables and factors, are vane
and expensive as they do not improve our knowledge about the problem, nor do they
provide additional information to raise the quality of policies on this subject.

Borradores Departamento de Economía no. 28
25
Source: Own calculations
Table1. Factors and weights of the competitiveness global index
Source: Own calculations
Factor Weight
AGGLOMERATION 0.387334964
INFRASTRUCTURE 0.348313541
HUMAN CAPITAL 0.331003432
PHYSICAL GEOGRAPHY -0.184225158

Borradores Departamento de Economía no. 28
26
Table2. Competitiveness Rankings for Colombia
Departamentos CEPAL 2007 CID 2002 CRECE 2000 GER 2008
Antioquia 2 2 2 3
Atlántico 7 4 5 4
Bogotá na. 1 1 na.
Bogotá-Cundinamarca 1 n.a. n.a. 1
Bolívar 12 7 13 12
Boyacá 9 16 16 9
Caldas 5 12 6 5
Caquetá n.a. 24 n.a. 22
Cauca 13 17 20 15
Cesar 18 14 19 18
Chocó 22 23 23 23
Córdoba 21 18 22 20
Cundinamarca n.a. 9 9 n.a.
Guajira 16 10 14 19
Huila 11 20 15 10
Magdalena 17 15 18 14
Meta 14 6 10 16
Nariño 20 22 17 21
Norte Santander 15 13 12 11
Quindío 8 11 7 8
Risaralda 6 8 8 6
Santander 4 5 4 7
Sucre 19 21 21 17
Tolima 10 19 11 13
Valle 3 3 3 2
Source: CEPAL, CID, CRECE y Own calculations
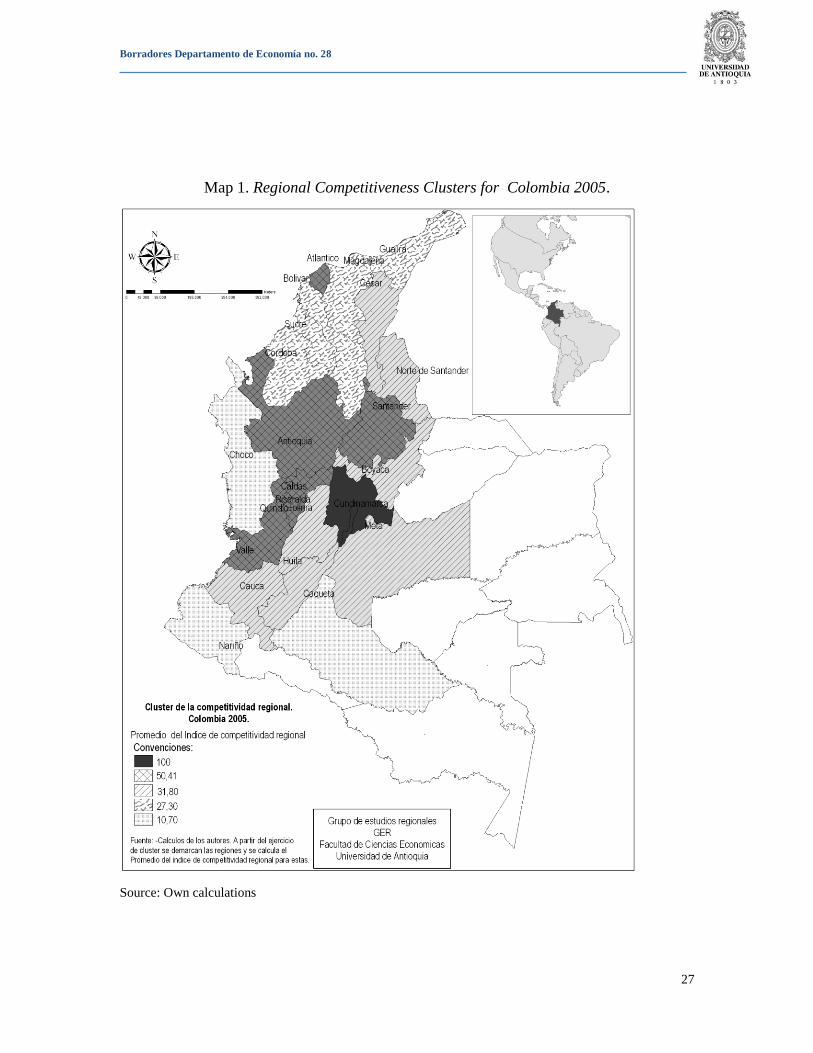
6. Clusters’ Analysis
A cluster‟s analysis apply to all the variables that compose our regional competitiveness
index, enables us to identify five department clusters, or typologies, in the national
territory17
. The spatial distribution of the five clusters can be observed in Map 1, which
permits recognizing a center periphery figure in Colombia‟s regional competitiveness.
17
See appendix 2 for the dendogram of the groups and other specifications of the cluster‟s process.
Borradores Departamento de Economía no. 28
27
Map 1. Regional Competitiveness Clusters for Colombia 2005.
Source: Own calculations

Borradores Departamento de Economía no. 28
28
Table 3 shows the characteristics of each group or cluster according to the regional
competitiveness factors and to the global ranking18
. The differences between regions can
be identified through this characterization.
Table 3. Clusters Characterization Based on Factors
Cluster Agglomeration
Human
Capital
Physical
Geography Infrastructure Competitiveness
I. Bogotá 100 100 12,76 100 100 II. Antioquia, Atlántico,
Valle, Caldas, Santander,
Risaralda y Quindío. 17,63 55,12 27,04 62,14 50,41
III. Norte de Santander,
Cauca, Tolima, Boyacá,
Huila, Cesar, Meta. 3,93 35,99 29,96 32,91 31,8
IV. Guajira, Magdalena,
Bolívar, Córdoba y Sucre. 4,18 20,42 17,02 27,58 27,3
V. Nariño, Choco, Caqueta. 1,17 13,63 87,08 12,62 10,07
Source: Own calculations
The first group is conformed exclusively by the Bogotá-Cundinamarca region. As
previously stated, this region occupies the first place in all the rankings except in the
physical geography factor (which affects competitiveness negatively). This leadership
over the other places is pronounced and places the Bogotá-Cundinamarca region in a
unique position in the country, far of a situation of competition with the other regions.
The second group is composed by traditional economy regions such as Antioquia, Valle
and Atlántico, and also by the emerging regions located inside the “trapecio andino”:
Risaralda, Caldas, Quindio and Santander. These regions have the highest levels of
infrastructure (62.14), human capital (55.12), and agglomeration (17.63), after the
18
For each one of the different factor scores estimated in the document, an index, with values for each
department oscillating between 0-100, was developed. Then, from the index matrix, the average of the
departments that make up each region was calculated in order to obtain an index for each of them.
Borradores Departamento de Economía no. 28
29
Bogotá-Cundinamarca region19
. We must point out that, in terms of agglomeration, the
difference between this group and the others is of four times. A gap that defines the
disparity of the accumulation causation processes between the first two groups and the
others.
The third cluster groups the departments that have common limits with traditional
economies, and also have an institutional development which has brought upon better
levels of human capital (35.9) and infrastructure (32.91), when compared with the latest
two groups. This group is conformed, from south to north, by: Cauca, Tolima, Huila,
Boyaca, Meta, Norte de Santander and Cesar.
The fourth group is conformed by the Caribbean Coast economies of: Bolivar, Sucre,
Cordoba, Guajira and Magdalena. Atlántico is the exception as it is placed in cluster II.
The geographical continuity of these departments groups them around the paradox of
high levels of port infrastructure and low levels of road infrastructure, producing a low
infrastructure result (27.52). On the other hand, their levels of human capital (20.42) and
of agglomeration (4.18) are quite precarious to promote the levels of competitiveness.
The fifth cluster is conformed by Choco, Caqueta and Narino, the last three regions in the
global ranking, characterized for having the lowest levels of agglomeration (1.17), of
human capital (13.69), and of infrastructure (12.62). Furthermore, this group is
conditioned, in an exogenous manner, by its first nature geography, as it sits on the first
places of the geography ranking (87.08) and this implies that territorial conditions there
are adverse to the development of economic activities. Therefore, these departments seem
19
Observing the dendogram (see appendix 2), one can deduct a difference in this macro-region in which
Antioquia and Valle maintain a certain distance from the other group members. Said difference is
evidenced in the agglomeration and infrastructure factors. In terms of the agglomeration ranking index,
there is an enormous gap between Antioquia and Valle‟s average, 40.48, and the average of Santander,
Risaralda, Quindio, Caldas and Atlantico, 8.49. In terms of the infrastructure ranking index, there are also
some, not so large, differences. Here, the average of the traditional economies is 58.8 while the average for
the other departments in the macro-region is 47.02. According to the cluster exercise, such disparity is
statistically unjustifiable for the creation of another conglomerate. This means that said distance is minimal
with regards to the distances between groups defined in the exercise. However, we want to emphasize this
fact with the objective of not creating the erroneous conclusion that the semi-leader economies, such as
Antioquia‟s and Valle‟s, have been completely caught up by the other emerging economies such as
Quindio, Risaralda, Caldas, Atlantico and Santander.

Borradores Departamento de Economía no. 28
30
to be destined to be weak economies without expectations of improving their
competitiveness levels.
Conclusions
The concept and measurement of regional competitiveness are analyzed in this article
under the light of the old and the new trade theory and of the New Economic Geography.
The analysis shows that competitiveness loses meaning when it is applied to the goods
market, as regions interrelate through flows of inter-industry or intra-industry trade wich
implies the use of complementarities which in turn lead to the gains typical of this type of
trade.
When the market for production factors is considered, and the existence of scale
economies, externalities, clusters, cumulative learning and transportation costs are
assumed, the regions‟ competitiveness for scarce resources, although limited, does not
lose its meaning. The New Economic Geography has shown that, in a scenario as the one
previously described, mobility and trade give way to processes of “cumulative causation”
and economic polarization with territorial manifestations (Fujita el al. 1999), where some
regions attract resources while others drive them out.
In order to establish a competitiveness ranking of the Colombian departments, four
factors were defined and built for: agglomeration, infrastructure, human capital and
physical geography; and the analysis techniques of principal components and hierarchical
clusters, were employed. The results of our index show that the center regions, those
with a higher degree of economic activities agglomeration, are the ones that attract the
most resources and, therefore, the most competitive. This coincides with the studies made
by CEPAL, CID and CRECE. However, differently from those developed in these
studies, our index uses few factors and few variables, which are closely relate with our
conceptual framework centered upon the New Economic Geography. This reinforces the
idea that the other indexes use redundant factors and variables. This means nothing but
the expression of a lack of conceptual, theoretical, and methodological precision
Borradores Departamento de Economía no. 28
31
regarding the topic of competitiveness, which we relate to the ability that a region has to
attract resources. We conclude, therefore, that the attempts to improve competitiveness
indicators by increasing the number of variables and factors, are vane and expensive as
they do not improve our knowledge about the problem, nor do they provide additional
information to raise the quality of policies on this subject.
The previously stated facts reinforce the idea that thinking about general competitiveness
policies may be incorrect. This is because agglomeration, as the principal resource
drawing force, is the result of spontaneous economic processes which are quite difficult
to change.
Finally, the cluster analysis suggests two aspects: One is the center periphery figure in
Colombia‟s competitiveness, and the second is that competitiveness can become more
relevant, among departments, inside small groups. This suggests that this concept is
applied in a very restricted form. In this manner, growth and regional development
policies (which usually include improvements to infrastructure, to human capital and to
innovation processes) gain relevance.
BIBLIOGRAPHY
BALASSA, Bela (1966). “Tariff Reductions and Trade in Manufactures among the
Industrial Countries”, American Economic Review, Vol. 56, No.3, pp. 466-73.
BARÓN, Juan David (2003). “¿Qué sucedió con las disparidades económicas regionales
en Colombia entre 1980 y el 2000?”, Documentos de trabajo sobre economía regional,
Banco de la República, Cartagena.
BONET, Jaime y MEISEL, Adolfo (2006). “Polarización del ingreso per cápita
departamental en Colombia, 1975 – 2000”, Documentos de trabajo sobre economía
regional, Banco de la República, Cartagena.
BOUGRINE, Hassan (2001). “Competitividad y comercio exterior”, Revista Comercio
Exterior, Vol. 51, No. 9. Sept.

Borradores Departamento de Economía no. 28
32
CEPAL (2007). Escalafón de la competitividad de los departamentos colombianos,
disponible en: http://www.cepal.org/publicaciones/xml/3/29973/LCL.2684-P.pdf.
CEPAL (2002). “Escalafón de la competitividad de los departamentos colombianos”.
Informe final, diciembre.
CID (2002). Sistema de indicadores de competitividad departamental SICD, Informe
Final al Ministerio de Comercio Exterior, Bogotá.
CONTI, Sergio (1995). Four paradigms of the enterprise system, en Sergio Conti; Edward
Malecki y Oinas, Päivi. (comp) “The industrial enterprise and its environment: spatial
perspectives”, Hong Kong, Singapore, Sydney. Avebury.
CRECE (2002). “Ranking de competitividad de los departamentos colombianos”,
Observatorio de la Competitividad de Caldas, disponible en:
http://www.recintodelpensamiento.com/crece/public.asp.
CUERVO, Luis y GONZÁLEZ, Josefina (1997). “Industria y ciudades en la era de la
mundialización. Un enfoque socio espacial”, Tercer Mundo Editores, Bogotá.
FALVEY, Rodney y KIERZKOWSKI, Henryk (1987). Product Quality, Intra-Industry Trade
and (Im)perfect Competition, in Henry Kierzkowski, ed., “Protection and Competition in
International Trade”, Oxford: Basil Backwell.
FESER, Edward; KOO, Kyojun; RENSKI, Henry y SWEENEY, Stewart (2001).
“Incorporating Spatial Analysis in Applied Industry Cluster Studies”. Prepared for the
Economic Development Quaterly, University of North Carolina.
FUJITA, Masahisa; KRUGMAN, Paul and,VENABLES, Anthony (1999). The spatial
economy: Cities, regions and international trade. MIT Press, Cambridge MA

Borradores Departamento de Economía no. 28
33
GALLUP, John L. (1998). Geography and economic development en Boris Pleskovic,
Joseph Stiglitz ed., “Annual World Bank Conference on Development economics.
Washington”, World Bank.
GER (2006). Indicadores de Competitividad de Antioquia y sus Regiones. Medellín,
Centro de Investigaciones Económicas (CIE).
GREENAWAY, David; HINE, Robert y MILNER Chris (1995). “Vertical and Horizontal
Intra-Industry Trade: A Cross Industry Analisys for the United Kingdom”, The Economic
Journal, Vol. 105, No. 433, Nov1995, pp. 1505-1518.
GREENAWAY, David y MILNER Chris (1983). “On the Measurement of Intra-industry
Trade”, The Economic Journal, No. 372, Dec 1983, pp.900-908.
GRUBEL, Herbert (1967). “Intra-Industry Specialization and the Pattern of Trade”, The
Canadian Journal of Economics and Political Science, Vol. 33, No. 3, pp. 374-388.
GRUBEL Herbert y LLOYD Peter (1975). Intra-Industry Trade: the Theory and
Measurement of Intra-Industry Trade in Differentiated Products, London: The
Macmillan Press Ltd.
HAQUE, Irfan (1995). “Trade, Technology and International Competitiveness”, The
World Bank, Washington, D.C.
HOUVARI, Janne; KANGASHARJU, Aki y ALANEN, Aku (2001). “Constructing an Index
for Regional Competitiveness”, Pellervo Economic Research Institute Working Papers,
No: 44, Helsinki. June 2001.
HOUVARI, Janne; KANGASHARJU, Aki y ALANEN, Aku (2000). “Regional
Competitiveness in Finland”, ERSA 40th European Congress, August – September.
Borradores Departamento de Economía no. 28
34
INTERNATIONAL INSTITUTE FOR MANAGEMENT DEVELOPMENT (2006). The World
Competitiveness Yearbook. Switzerland. IMD.
KITSON, Michael; MARTIN, Ron and TYLER, Peter (2004). “Regional Competitiveness:
An Elusive yet Key Concept?”, Regional Studies, Vol. 38.9, pp. 991-999, December
2004.
KRONTHALER, FRANZ (2003). “A study of the competitiveness of regions based on cluster
analysis, the example of East Germany”, Halle Institute for Economic Research, Halle.
KRUGMAN, Paul (1979). “Increasing Returns, Monopolistic Competition and
International Trade”, Journal of International Economics, Vol. 9, No. 4, pp. 469-480.
KRUGMAN, Paul (1981). “Intraindustry Specialization and the Gains from Trade”,
Journal of Political Economy, Vol. 89, No. 5, Oct 1981, pp. 959-973.
KRUGMAN, Paul (1980). “Scale Economies, Product Differentiation, and the Pattern of
Trade”, American Economic Review, Vol. 70, No. 5, Dec. 1980, pp. 950-959.
KRUGMAN, Paul y Obstfeld, Maurice (2002). Economía Internacional: teoría y política,
5 edición. Editorial Espana : Addison-Wesley, 2002.
KRUGMAN, Paul (1998). Desarrollo, geografía y teoría económica. Barcelona. Editorial
Antoni Bosch.
KRUGMAN, Paul (1995). Geografía y Comercio. Barcelona. Editorial Antoni Bosch.
KRUGMAN, Paul (1995). “Competitividad una Peligrosa Obsesión” en: Internacionalismo
Pop. Bogotá. Editorial Norma.

Borradores Departamento de Economía no. 28
35
LALL, Sanjaya (2001). “Comparing National Competitive Performance: An Economic
Analysis of World Economic Forum Competitiveness Index”, QEH Working Paper –
QEHWPS6, No. 61.
LOTERO, Jorge (2005). “Ajustes productivos y espaciales de la industria colombiana en
el marco de la apertura comercial: una aproximación desde la geografía económica”,
Lecturas de Economía, No 66.
LOTERO, Jorge; MORENO, Ana y VALENCIA, Mauricio (2005). “La competitividad:
aproximación conceptual desde la teoría del crecimiento y la geografía económica”,
Borradores del CIE, No 13, Medellín.
LOTERO, Jorge (2007). “Desarrollo y Competitividad Industrial en las Regiones y
Departamentos Colombianos durante la Integración de los 90”, Mimeo, Universidad de
Antioquia, Medellín.
MONCAYO, Edgar (2003). “Nuevas teorías y enfoques conceptuales sobre el desarrollo
regional: ¿hacia un nuevo paradigma?”, Revista de Economía Institucional, No. 8, pp. 32-
65.
MONCAYO, Edgar. (2008). Dinámicas regionales de la industrialización. Análisis
comparativo de Cundinamarca y Bogota DC, Centro de investigaciones y estudios
universidad central (CIES), abril.
MORENO, Ana (2006). “Diferencias cuantitativas y cualitativas en el proceso de inserción
internacional de la industria de las regiones colombianas”, Capítulo de libro por publicar.
MORENO, Ana y POSADA Héctor (2007). “Evolución del Comercio Intraindustrial entre
las regiones colombianas y la Comunidad Andina, 1990-2004: un análisis comparativo”,
Lecturas de Economía, No 66 (enero-junio), pp. 83-118.

Borradores Departamento de Economía no. 28
36
MUNDELL, R.A. (1957). “International trade and factor mobility”, American Economic
Review, No. 47.
NAVARETTI, Giorgio y VENABLES, Anthony (2004). Multinational Firms in the World
Economy. Princeton University Press. Princeton and Oxford.
NORTH, Douglas (1990). Instituciones, cambio institucional y desempeño económico,
México, Editorial Fondo de Cultura Económica.
NUÑEZ, Jairo y SANCHEZ Fabio (2000). “Geography and Economic Development
in Colombia: A Municipal Approach”, Research Network Working Paper, #R-408. Inter-
American Development Bank.
PARRA, Juan Carlos (2008). “Hechos Estilizados de la Economía Colombiana:
Fundamentos Empíricos para la Construcción y Evaluación de un Modelo DSGE”,
Borradores de Economía, No. 509.
PERES, Wilson (Coordinador) (1997). Políticas de competitividad industrial: América
Latina y el Caribe en los años noventa, Ed. México : Siglo XXI.
PORTER, Michael (1991). “La ventaja competitiva de las naciones”. Vergara, Buenos
Aires.
PORTER, Michael (1998). “Competitive Advantage: Creating and Sustaining Superior
Performance”, Simon & Schuster/Free Press.
PORTO, Natalia (2003). “Libre comercio, igualación del precio de los factores y
turismo”, Borrador, Departamento de Economía, Universidad Nacional de la Plata
POSADA, Héctor; RAMÍREZ, Margarita y RUIZ, Dora (2005). “Comercio intraindustrial
entre Colombia y Estados Unidos, 1998-2002”, Revista Oikos, No. 19, pp. 2-29.
Borradores Departamento de Economía no. 28
37
PRESIDENT´S COMMISSION ON INDUSTRIAL COMPETITIVENESS (1985). Commission on
Industrial Competitiveness Report. Washington D.C.
RODRIK, Dani (2003). In search of prosperity: Introduction, Princeton University Press,
WORLD ECONOMIC FORUM AND HARVARD UNIVERSITY (2008). “The global
competitiveness report”. En; http://www.gcr.weforum.org/
Appendix
Appendix 1. Analysis of Principal Components and Hierarchical Cluster Analysis
1. Analysis of Principal Components
Starting from a set of P variables 1 2 PX x x x the analysis of principal
components creates a new set of variables such that: the first variable (first principal
component) explains, as much as possible, the variability of the set of original data. The
following variables (the following components) explain as much as possible the
remaining variability, and finally, these new variables are uncorrelated. Generally, this
type of analysis is used with the purpose of reducing the dimensionality of data, using the
fact that the first components drawn by the method recuperate a large proportion of the
original data variability.
Let be the matrix of correlations of 1 2 Px x x . Assuming that the variables
are standardized, the first principal component has the following form: 1 1y Xa , where
X is of the order n p and 1a is of the order 1p . 1a is selected in such a manner that
1y retains the most part of the variance of the original data, subject to 1 1 1a a . The
previous occurs when 1a is the eingenvector associated to 1 , which is the largest
eingenvalue of . Similarly defined is 2 2y Xa (second component) with a maximum
variance 2 , second biggest eingenvalue of , and 2a eingenvector associated to 2 .

Borradores Departamento de Economía no. 28
38
The component jy is built in the same manner. At the end, all the components obtained
are uncorrelated among each other. The method‟s applicability depends on the existence
of an adequate correlation structure among the variables, and there are various methods to
detect this structure. Among the most important and used are: KMO Test, Barlett‟s test of
sphericity, correlation matrix inspection, correlation matrix determinant inspection and
Anti-image matrix inspection.
2. Hierarchical Cluster Analysis
Hierarchical Cluster Analysis (HCA) is a method that establishes groups of observations
(conglomerates or clusters) inside a sample. In our cases, it allows us to establish a group
of departments from the variables that characterize them. The criteria used for the
grouping is distance. In this manner, observations that are near each other belong to the
same group, and observations that are far from each other are placed in different groups.
The construction of clusters can be made from the different distance measures and the
different grouping methods. For instance, the measurement of Euclidian distance - that
was used in this study - is calculated as a straight line between two groups, interval
measures assume that variables are measured in scale, and counting measures assume
they are discrete numbers. The formula for distance is given for:
t
k
jkikij XXd1
2)(
where k are the different variables that measures the competitiveness.
After calculating the distances between two clusters, some grouping methods associate
considering the pair of objects that is the closest between the clusters, or the pair of
objects that is the farthest, or a hybrid between these methods. Ward`s method was used
for the clustering.
Borradores Departamento de Economía no. 28
39
Appendix 2. Dendogram and Related Statistics
The dendogram is the result of a cluster analysis through a hierarchical agglomerative
algorithm20
, in which each department starts as a set in itself, meaning 23 groups, and one
by one begin to fuse until forming a single set. Then, depending on the distance between
the groups, different groups can result. A minimum distance would produce 23 groups
and a maximum distance would produce only one group. On this matter, the question of
which the optimum number of cluster is, arises. The statistical analysis of the distance
between the groups21
, indicated that the optimum number is five conglomerates. This
number maximizes the trade off presented by the analysis, where the less Euclidian
distance between groups, the more homogeneity in the set. Nevertheless, this results in
less synthesis capacity for the exercise as it produces many groups with few elements.
The five conglomerates mentioned in the article are identified upon reading the
dendogram. Also observed, when reading from right to left, is the ramification of the
dendogram. These are grouped into two basic region typologies: those with relatively
high levels of regional competitiveness (conglomerates I and II,) and the regions left
behind in the development of factors that define competitiveness and/or doomed because
of their geography (conglomerates III, IV and V).
20
A dendogram is the graphic representation of the cluster process. Departments are nodes which begin
separated from each other and, according to the Euclidian distance between themselves, begin to form
groups with each other. In this manner, the branches of the dendogram show the fusions given in the
cluster, step by step, and the length of the branches indicates the minimal distances or differences that must
be accepted for said fusion to occur. Therefore, a good cluster exercise must have groups with small
branches so that the groupings show homogeneity among its members. 21
Agglomerated distance between clusters is the simplest test to determine the optimum number of clusters.
This is calculated by the SPSS, and is defined as the distance between two groups that fused together plus
the distance of the previous algorithms. A basic principle of cluster analysis is that a significant change in
the series of agglomerated distances, indicates that the difference between the fused sets is relatively
significant and, therefore, that it is time to stop the fusion in search for group homogeneity. See
http://biplot.usal.es/DOCTORADO/3CICLO/BIENIO-06-08/MetodosClasicos/exposicCluster.pdf
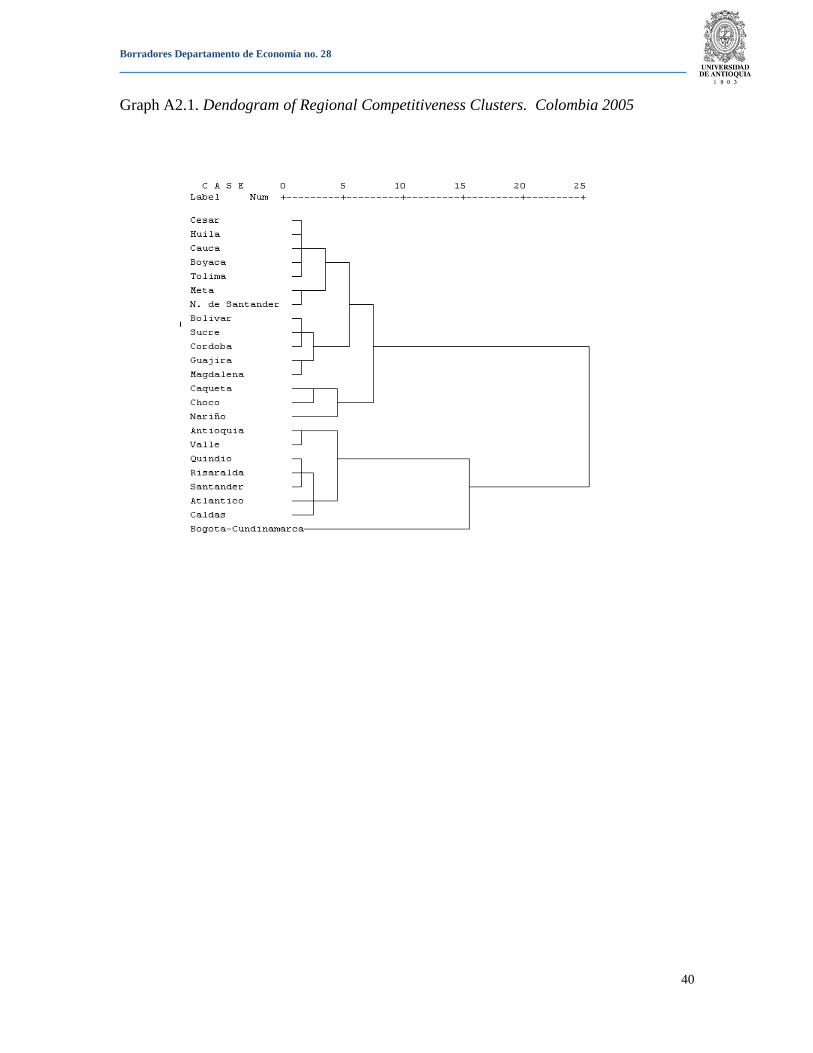
Borradores Departamento de Economía no. 28
40
Graph A2.1. Dendogram of Regional Competitiveness Clusters. Colombia 2005

Borradores Departamento de Economía no. 28
41
Appendix 3. Variables, factor and subfactors, of the competitiveness indexes for
Colombia.
Table A3.1. Variables, factor and subfactors, of the competitiveness indexes for
Colombia.
INSTITUTION FACTOR SUBFACTOR VARIABLES
CEPAL 2007
Fortaleza económica
Estructura
económica
▪PIB per cápita departamental
▪Participación del PIB departamental en el PIB nacional ▪Índice de especialización industrial ▪Densidad empresarial.
Comercio
internacional de
bienes
▪Coeficiente de internacionalización ▪Diversificación de mercados de exportación ▪Tasa de orientación exportadora no tradicional ▪Diversificación de las exportaciones
Servicios
financieros
▪Establecimientos financieros per cápita
▪Cartera per cápita ▪Captaciones per cápita ▪Cajeros
electrónicos per cápita ▪Cobertura de seguros (primas per cápita).
Social
▪Índice de pobreza
▪distribución del ingreso (Gini) ▪población urbana sobre población total.
Infraestructura
Infraestructura
básica
▪Cobertura de telefonía
▪Cobertura de energía ▪Cobertura de alcantarillado ▪Cobertura de acueducto
Infraestructura de
transporte
▪Red vial pavimentada por departamento
▪Cubrimiento de vías pavimentadas departamentales
Infraestructura de
las
comunicaciones
▪Penetración de internet
Capital humano
Educación
▪Colegios de nivel alto superior y muy superior
según el examen de estado como porcentaje del total
▪Índice de logro educativo
Salud ▪Personas afiliadas al régimen de salud por 100
habitantes
Ciencia y tecnología
Ambiente
científico y
tecnológico
▪Docentes doctores por habitante
▪Personal en I&D por habitante ▪Centros de investigación por habitante ▪Productos de C&T por habitante
Finanzas públicas Índices de
desempeño fiscal
▪Indicador sintético de desempeño fiscal de los
departamentos
▪Indicador sintético de desempeño fiscal de las capitales de los departamentos

Borradores Departamento de Economía no. 28
42
Medio ambiente
Recurso
hidrológico
▪Índice de oferta hidrológica
▪Porcentaje de población en las cabeceras municipales con alto índice de escasez de agua ▪Porcentaje de población en las cabeceras municipales vulnerables por disponibilidad de agua
Actividades
antropicos
▪Residuos sólidos por 10.000 hab
▪Promedio municipal de demanda bioquímica de oxigeno (DBO) en las masas de agua ▪Emisiones atmosféricas del sector industrial de Sox
Nox CO
▪PTS por habitante ▪Cambio multitemporal de los agrosistemas (1986-1996) ▪Porcentaje de la mortalidad por causas respiratorias
Institucionalidad
ambiental
▪Gasto ambiental por habitante
CID 2002
Infraestructura/Localización
▪Densidad vial
▪Densidad puerto marítimo ▪Densidad aeropuerto internacional ▪Distancia mercado interior ▪Líneas telefónicas/hab. ▪Usuarios internet/hab. ▪Costo energía ▪Eficiencia uso energía ▪Cobertura servicio agua ▪Cobertura servicio alcantarillado
Recursos naturales
▪Superficie cultivada
▪Superficie forestal ▪Producción minera ▪Longitud de costa ▪Escasez de agua
Capital humano y empleo
▪Población analfabeta
▪Escolaridad superior ▪Calidad de la educación
▪Escolaridad población ocupada ▪Productividad laboral ▪Tasa de desempleo
Empresas
▪Grandes empresas
▪Empresarismo ▪Activos empresariales ▪Sector financiero/PIB ▪Inversión privada/PIB ▪Depósitos sistema financiero ▪Productividad agrícola ▪Cartera sistema financiero
Innovación y tecnología
▪Inversión publica I&D
▪Horas capacitación ▪Trabajadores horas asesoráis de empresas ▪Docentes doctores

Borradores Departamento de Economía no. 28
43
Instituciones
▪Delitos contra la vida y seguridad
▪Delitos contra la libertad individual
▪Delitos contra patrimonio
Gestión del gobierno
▪Ingresos/1000hab ▪Inversión publica ▪Infraestructura ▪Inversión social ▪Indicador de desempeño fiscal dpto ▪Indicador de desempeño fiscal mpio
Inserción en la economía
mundial
▪Grado de apertura exportadora
▪Grado de apertura total ▪Exportaciones industriales/hab
CRECE 2000
Ciencia y tecnología
▪Productos de ciencia y tecnología
▪Personal vinculado a I+D por cada 10 mil hab.
▪Docentes con doctorado ▪Números de centros de investigación ▪Capacidad de oferta para desarrollo tecnológico ▪Inversión en I+D en la industria ▪Inversión en aseguramiento de la calidad ▪Gasto publico en C&T por cada 10 mil habitantes
Finanzas
▪Cartera per cápita
▪Cobertura de seguros ▪Cajeros electrónicos ▪Profundización financiera ▪Establecimientos financieros ▪Margen de utilidad empresarial por departamento ▪Razón corriente empresarial ▪Nivel de endeudamiento empresarial
Fortaleza económica
▪Población urbana sobre población total
▪PIB per cápita departamental ▪Índice de entrada de empresas ▪Distribución del ingreso ▪Índice de pobreza ▪Participación del PIB departamental en el PIB nacional ▪Indice de especialización industrial ▪Crecimiento del PIB per cápita
Administración
▪Productividad total de factores
▪Dinámica de la productividad total ▪Eficiencia de los procesos empresariales ▪Prestaciones laborales en la industria
▪Productividad laboral ▪Remuneración en la industria al trabajo ▪Dinámica de la productividad laboral
Gobierno e instituciones
▪Fortaleza tributaria
▪Dependencia de transferencias ▪Ingresos tributarios per cápita departamental ▪Cubrimiento de seguridad privada ▪Ingresos no tributarios per cápita departamental
▪Carga de la deuda ▪Transferencias por situado fiscal per cápita ▪Gasto en educación ▪Ingresos corrientes/gastos corrientes

Borradores Departamento de Economía no. 28
44
▪Gasto en salud ▪Gasto en funcionamiento ▪Delitos contra la vida y la integridad personal
▪Numero de veedurías ▪Gasto público total como porcentaje del PIB ▪Seguridad publica ▪Delitos contra la libertad individual y otras garantías
▪Gasto en infraestructura ▪Número de acuerdos de reestructuración de deuda ▪Regalías sobre ingresos totales
Infraestructura
▪Cobertura de telefonía
▪Computadores con internet por cada 100 mil habitantes ▪Cubrimiento de vías pavimentadas departamentales
▪Red vial pavimentada por departamento ▪Cobertura de alcantarillado ▪Cobertura de acueducto ▪Conexiones RDSI por cada 100 mil habitantes
▪Cobertura de energía ▪Numero de camas por 10000 habitantes ▪Carga aérea por cada 10 mil habitantes ▪Proveedores de servicios de internet por cada 100 mil hab. ▪Inversión en tecnologías de la información y comunicaciones ▪Tarifa media de energía industrial
Internacionalización
▪Tasa de penetración de importaciones
▪Tasa de orientación exportadora no tradicional ▪Diversificación de las exportaciones ▪Coeficiente de internacionalización
▪Diversificación de mercados ▪Tasa de orientación exportadora total ▪Balanza comercial departamental/PIB departamental ▪Dinámica de las exportaciones ▪Crecimiento de las importaciones
Medio Ambiente
▪Delitos contra los recursos naturales y el medio
ambiente
▪Demanda de agua ▪Residuos sólidos
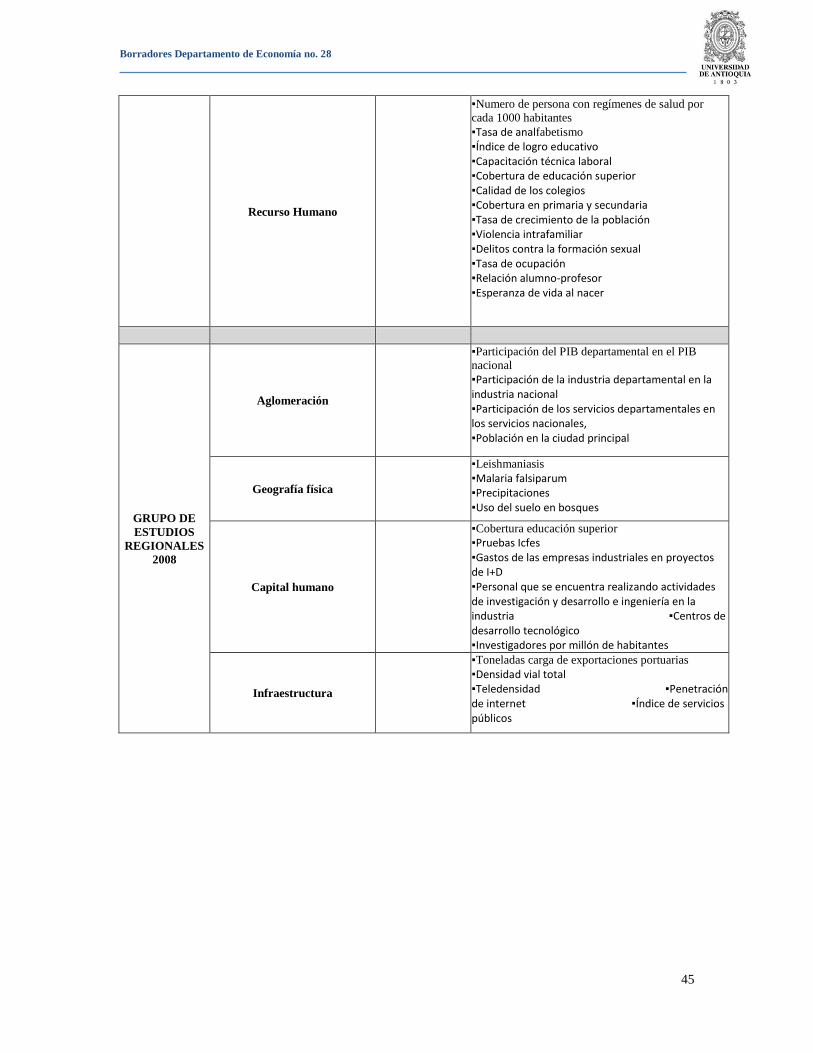
Borradores Departamento de Economía no. 28
45
Recurso Humano
▪Numero de persona con regímenes de salud por
cada 1000 habitantes
▪Tasa de analfabetismo
▪Índice de logro educativo ▪Capacitación técnica laboral ▪Cobertura de educación superior ▪Calidad de los colegios ▪Cobertura en primaria y secundaria ▪Tasa de crecimiento de la población ▪Violencia intrafamiliar ▪Delitos contra la formación sexual ▪Tasa de ocupación ▪Relación alumno-profesor ▪Esperanza de vida al nacer
GRUPO DE
ESTUDIOS
REGIONALES
2008
Aglomeración
▪Participación del PIB departamental en el PIB
nacional
▪Participación de la industria departamental en la industria nacional ▪Participación de los servicios departamentales en los servicios nacionales, ▪Población en la ciudad principal
Geografía física
▪Leishmaniasis
▪Malaria falsiparum ▪Precipitaciones ▪Uso del suelo en bosques
Capital humano
▪Cobertura educación superior
▪Pruebas Icfes ▪Gastos de las empresas industriales en proyectos de I+D ▪Personal que se encuentra realizando actividades de investigación y desarrollo e ingeniería en la industria ▪Centros de desarrollo tecnológico ▪Investigadores por millón de habitantes
Infraestructura
▪Toneladas carga de exportaciones portuarias
▪Densidad vial total ▪Teledensidad ▪Penetración de internet ▪Índice de servicios públicos
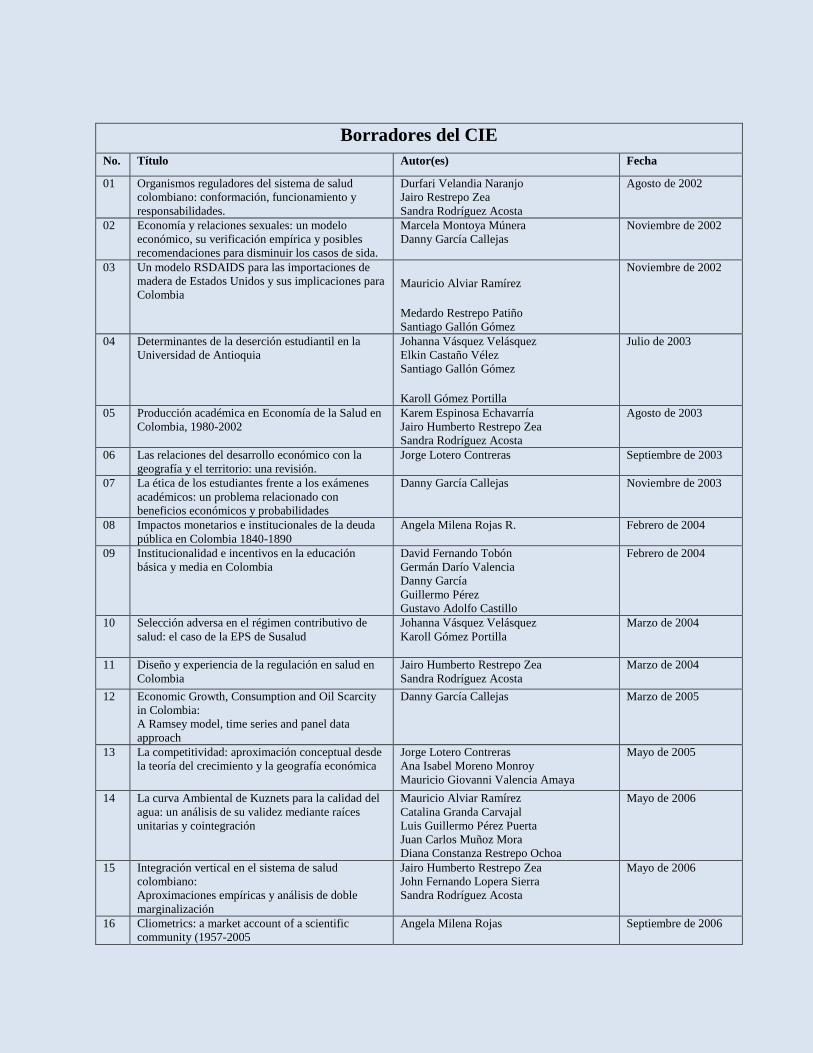
Borradores Departamento de Economía no. 28
46
Borradores del CIE
No. Título Autor(es) Fecha
01 Organismos reguladores del sistema de salud
colombiano: conformación, funcionamiento y
responsabilidades.
Durfari Velandia Naranjo
Jairo Restrepo Zea
Sandra Rodríguez Acosta
Agosto de 2002
02 Economía y relaciones sexuales: un modelo
económico, su verificación empírica y posibles
recomendaciones para disminuir los casos de sida.
Marcela Montoya Múnera
Danny García Callejas
Noviembre de 2002
03 Un modelo RSDAIDS para las importaciones de
madera de Estados Unidos y sus implicaciones para
Colombia Mauricio Alviar Ramírez
Medardo Restrepo Patiño
Santiago Gallón Gómez
Noviembre de 2002
04 Determinantes de la deserción estudiantil en la
Universidad de Antioquia
Johanna Vásquez Velásquez
Elkin Castaño Vélez
Santiago Gallón Gómez
Karoll Gómez Portilla
Julio de 2003
05 Producción académica en Economía de la Salud en
Colombia, 1980-2002
Karem Espinosa Echavarría
Jairo Humberto Restrepo Zea
Sandra Rodríguez Acosta
Agosto de 2003
06 Las relaciones del desarrollo económico con la
geografía y el territorio: una revisión.
Jorge Lotero Contreras Septiembre de 2003
07 La ética de los estudiantes frente a los exámenes
académicos: un problema relacionado con
beneficios económicos y probabilidades
Danny García Callejas
Noviembre de 2003
08 Impactos monetarios e institucionales de la deuda
pública en Colombia 1840-1890
Angela Milena Rojas R. Febrero de 2004
09 Institucionalidad e incentivos en la educación
básica y media en Colombia
David Fernando Tobón
Germán Darío Valencia
Danny García
Guillermo Pérez
Gustavo Adolfo Castillo
Febrero de 2004
10 Selección adversa en el régimen contributivo de
salud: el caso de la EPS de Susalud
Johanna Vásquez Velásquez
Karoll Gómez Portilla
Marzo de 2004
11 Diseño y experiencia de la regulación en salud en
Colombia
Jairo Humberto Restrepo Zea
Sandra Rodríguez Acosta
Marzo de 2004
12 Economic Growth, Consumption and Oil Scarcity
in Colombia:
A Ramsey model, time series and panel data
approach
Danny García Callejas Marzo de 2005
13 La competitividad: aproximación conceptual desde
la teoría del crecimiento y la geografía económica
Jorge Lotero Contreras
Ana Isabel Moreno Monroy
Mauricio Giovanni Valencia Amaya
Mayo de 2005
14 La curva Ambiental de Kuznets para la calidad del
agua: un análisis de su validez mediante raíces
unitarias y cointegración
Mauricio Alviar Ramírez
Catalina Granda Carvajal
Luis Guillermo Pérez Puerta
Juan Carlos Muñoz Mora
Diana Constanza Restrepo Ochoa
Mayo de 2006
15 Integración vertical en el sistema de salud
colombiano:
Aproximaciones empíricas y análisis de doble
marginalización
Jairo Humberto Restrepo Zea
John Fernando Lopera Sierra
Sandra Rodríguez Acosta
Mayo de 2006
16 Cliometrics: a market account of a scientific
community (1957-2005
Angela Milena Rojas Septiembre de 2006

Borradores Departamento de Economía no. 28
47
17 Regulación ambiental sobre la contaminación
vehicular en Colombia: ¿hacia donde vamos?
David Tobón Orozco
Andrés Felipe Sánchez Gandur
Maria Victoria Cárdenas Londoño
Septiembre de 2006
18 Biology and Economics: Metaphors that
Economists usually take from Biology
Danny García Callejas Septiembre de 2006
19 Perspectiva Económica sobre la demanda de
combustibles en Antioquia
Elizeth Ramos Oyola
Maria Victoria Cárdenas Londoño
David Tobón Orozco
Septiembre de 2006
20 Caracterización económica del deporte en
Antioquia y Colombia: 1998-2001
Ramón Javier Mesa Callejas
Rodrigo Arboleda Sierra
Ana Milena Olarte Cadavid
Carlos Mario Londoño Toro
Juan David Gómez
Gonzalo Valderrama
Octubre de 2006
21 Impacto Económico de los Juegos Deportivos
Departamentales 2004: el caso de Santa Fe De
Antioquia
Ramón Javier Mesa Callejas
Ana Milena Olarte Cadavid
Nini Johana Marín Rodríguez
Mauricio A. Hernández Monsalve
Rodrigo Arboleda Sierra
Octubre de 2006
22 Diagnóstico del sector deporte, la recreación y la
educación física en Antioquia
Ramón Javier Mesa Callejas
Rodrigo Arboleda Sierra
Juan Francisco Gutiérrez Betancur
Mauricio López González
Nini Johana Marín Rodríguez
Nelson Alveiro Gaviria García
Octubre de 2006
23 Formulación de una política pública para el sector
del deporte, la recreación y la educación física en
Antioquia
Ramón Javier Mesa Callejas
Rodrigo Arboleda Sierra
Juan Francisco Gutiérrez Betancur
Mauricio López González
Nini Johana Marín Rodríguez
Nelson Alveiro Gaviria García
Octubre de 2006
24 El efecto de las intervenciones cambiarias: la
experiencia colombiana 2004-2006
Mauricio A. Hernández Monsalve
Ramón Javier Mesa Callejas
Octubre de 2006
25 Economic policy and institutional change: a
contex-specific model for explaining the economic
reforms failure in 1970‟s Colombia
Angela Milena Rojas Noviembre de 2006
26 Definición teórica y medición del Comercio
Intraindustrial
Ana Isabel Moreno M.
Héctor Mauricio Posada D
Noviembre de 2006
Borradores Departamento de Economía 27 Aportes teóricos al debate de la agricultura desde la
economía
Marleny Cardona Acevedo
Yady Marcela Barrero Amortegui
Carlos Felipe Gaviria Garcés
Ever Humberto Álvarez Sánchez
Juan Carlos Muñoz Mora
Septiembre de 2007
28 Competitiveness of Colombian Departments
observed from an Economic geography Perspective
Jorge Lotero Contreras
Héctor Mauricio Posada Duque
Daniel Valderrama
Abril de 2009