
Modeling the print-scan process for resilient data hiding
12
Modeling the Print-Scan Process for Resilient Data Hiding Kaushal Solanki ∗ , Upamanyu Madhow, Banglore S. Manjunath, and Shiv Chandrasekaran Department of Electrical and Computer Engineering University of California at Santa Barbara, Santa Barbara, CA 93106 Abstract Print-scan resilient data hiding finds important applications in document security, and image copyright protec- tion. In this paper, we build upon our previous work on print-scan resilient data hiding with the goal of providing a simple mathematical characterization for guiding the design of more sophisticated methods allowing higher volume of embedded data, or achieving more robustness. A model for print-scan process is proposed, which has three main components: a) effects due to mild cropping, b) colored high-frequency noise, and c) non-linear effects. It can be shown that cropping introduces unknown phase shift in the image spectrum. A new hiding method called Differential Quantization Index Modulation (DQIM) is proposed in which, information is hidden in the phase spectrum of images by quantizing the difference in phase of adjacent frequency locations. The unknown phase shift would get cancelled when the difference is taken. Using the proposed DQIM hiding in phase, we are able to survive the print-scan process with several hundred information bits hidden into the images. Keywords: copyright protection, data-hiding, digital watermarking, document authentication, print-scan modeling. 1. INTRODUCTION Growing concerns over security in the past few years make it necessary to develop strong deterrents against forgery of important documents such as passports, driving licences, and identification documents. Print-scan resilient data hiding provides a viable solution to this problem: security information (such as fingerprints, signature, or passport number) can be imperceptibly embedded into a picture in the document. Only specific devices, which have access to a secret key, can decode and authenticate the hidden information. Forgery of such documents become extremely difficult because the embedded data is inseparable from the picture. The availability of new affordable devices (e.g., printers, scanners, and compact disc burners) and powerful software (e.g., image processing, and video editing software) have made it extremely easy for consumers to access, create, manipulate, copy, or exchange multimedia data. This has created an urgent need for protecting intellectual property in the digital media. Multimedia data hiding, defined as imperceptible embedding of information into a multimedia host, offers a potential solution, though with many challenges. Digital watermarking is a technology being developed, in which, copyright information is embedded into the host in a way that is robust to a variety of intentional or unintentional attacks. The ease with which images can be converted from print to digital form and vice versa makes it necessary that the embedded digital watermark is resilient to the print and scan operation. Many pictures appear on magazines and newspapers everyday. With availability of inexpensive high resolution scanners, the image can be conveniently converted into a digital form and the ownership of the image may be claimed by someone else. To counter this, information can be hidden into these images before they are printed and the ownership can be verified in the digital format. A visible watermark would not be helpful in this case because it can be easily removed using any image processing software. With the availability of affordable digital cameras, more and more images are created in a digital form. The potential of e-commerce for digital images cannot be realized unless a system for owner identification is in place. In this scenario, it is desirable that the hidden ownership information does not get destroyed if the image is printed. While it is very important for the embedded data to survive the print and scan process, it is a very complex and challenging problem. There has been a growing interest among researchers in this area, but little progress has been made because of the complex nature of the problem. One of the first approaches was by Lin and Chang, 1 ∗ Send correspondence to K. Solanki: [email protected] Security, Steganography, and Watermarking of Multimedia Contents VII, edited by Edward J. Delp III, Ping Wah Wong, Proc. of SPIE-IS&T Electronic Imaging, SPIE Vol. 5681 © 2005 SPIE and IS&T · 0277-786X/05/$15 418
Transcript of Modeling the print-scan process for resilient data hiding

Modeling the Print-Scan Process for Resilient Data Hiding
Kaushal Solanki∗, Upamanyu Madhow, Banglore S. Manjunath, and Shiv ChandrasekaranDepartment of Electrical and Computer Engineering
University of California at Santa Barbara,Santa Barbara, CA 93106
Abstract
Print-scan resilient data hiding finds important applications in document security, and image copyright protec-tion. In this paper, we build upon our previous work on print-scan resilient data hiding with the goal of providinga simple mathematical characterization for guiding the design of more sophisticated methods allowing highervolume of embedded data, or achieving more robustness. A model for print-scan process is proposed, which hasthree main components: a) effects due to mild cropping, b) colored high-frequency noise, and c) non-linear effects.It can be shown that cropping introduces unknown phase shift in the image spectrum. A new hiding methodcalled Differential Quantization Index Modulation (DQIM) is proposed in which, information is hidden in thephase spectrum of images by quantizing the difference in phase of adjacent frequency locations. The unknownphase shift would get cancelled when the difference is taken. Using the proposed DQIM hiding in phase, we areable to survive the print-scan process with several hundred information bits hidden into the images.
Keywords: copyright protection, data-hiding, digital watermarking, document authentication, print-scanmodeling.
1. INTRODUCTION
Growing concerns over security in the past few years make it necessary to develop strong deterrents against forgeryof important documents such as passports, driving licences, and identification documents. Print-scan resilientdata hiding provides a viable solution to this problem: security information (such as fingerprints, signature, orpassport number) can be imperceptibly embedded into a picture in the document. Only specific devices, whichhave access to a secret key, can decode and authenticate the hidden information. Forgery of such documentsbecome extremely difficult because the embedded data is inseparable from the picture.
The availability of new affordable devices (e.g., printers, scanners, and compact disc burners) and powerfulsoftware (e.g., image processing, and video editing software) have made it extremely easy for consumers to access,create, manipulate, copy, or exchange multimedia data. This has created an urgent need for protecting intellectualproperty in the digital media. Multimedia data hiding, defined as imperceptible embedding of information into amultimedia host, offers a potential solution, though with many challenges. Digital watermarking is a technologybeing developed, in which, copyright information is embedded into the host in a way that is robust to a variety ofintentional or unintentional attacks. The ease with which images can be converted from print to digital form andvice versa makes it necessary that the embedded digital watermark is resilient to the print and scan operation.
Many pictures appear on magazines and newspapers everyday. With availability of inexpensive high resolutionscanners, the image can be conveniently converted into a digital form and the ownership of the image may beclaimed by someone else. To counter this, information can be hidden into these images before they are printedand the ownership can be verified in the digital format. A visible watermark would not be helpful in this casebecause it can be easily removed using any image processing software. With the availability of affordable digitalcameras, more and more images are created in a digital form. The potential of e-commerce for digital imagescannot be realized unless a system for owner identification is in place. In this scenario, it is desirable that thehidden ownership information does not get destroyed if the image is printed.
While it is very important for the embedded data to survive the print and scan process, it is a very complexand challenging problem. There has been a growing interest among researchers in this area, but little progress hasbeen made because of the complex nature of the problem. One of the first approaches was by Lin and Chang,1
∗Send correspondence to K. Solanki: [email protected]
Security, Steganography, and Watermarking of Multimedia Contents VII, edited byEdward J. Delp III, Ping Wah Wong, Proc. of SPIE-IS&T Electronic Imaging,
SPIE Vol. 5681 © 2005 SPIE and IS&T · 0277-786X/05/$15
418

who model the print-scan process by considering the pixel value and geometric distortions separately. Thereare some watermarking methods2–4 that were not specifically designed for the print-scan attack, but they doreport robustness against the print-scan operation under specified experimental setup. A few approaches focuson hiding in halftone images,5, 6 wherein, the halftone cells of the host image are shifted based on the data to behidden, and a composite halftone image is given out directly. More recent related works include Voloshynovskiyet al,7 Mikkilineni et al,8 Picard et al,9 and Mahmoud et al,10 all of which deal with document security ingeneral rather than specifically considering printing and scanning of digital images.
Most of the above methods embed only a single bit (or a few bits) of information, as they assume theavailability of the watermark sequence at the decoder. In our recent work on print-scan resilient hiding,11, 12 animprovement over these methods is achieved in terms of volume of embedding. We are able to hide several hundredbits into 512×512 images against the print-scan attack with blind decoding (i.e., not assuming availability oforiginal image at the decoder). The hidden images also survive several other attacks such as those includedin Stirmark,13 e.g., Gaussian or median filtering, scaling or aspect ratio change, heavy JPEG compression,rows and/or columns removal, and to a lesser extent, random bending. The proposed method, called selectiveembedding in low frequencies (SELF), is an image-adaptive technique based on experimental modeling of theprint-scan process. A new method to estimate and undo rotation is also proposed, which specifically exploitsthe fact that laser printers use an ordered digital halftoning algorithm for printing.
In this paper, we build upon the above work with a view of gaining a better understanding of the print-scanprocess via a more refined mathematical model. With a better understanding of the channel, we hope to embedhigher volumes of data using more sophisticated embedding strategies. We also aim to survive attacks such ascropping and scaling that may happen during the print-scan process. There are many printing and scanningtechnologies available, and their effect on the image would vary a lot. It may not be possible to construct aunified model for whole spectrum of printing and scanning devices available in the marketplace. Hence, in thispaper, we focus only on laser printers and flatbed scanners.
Our print-scan model has three main components: mild cropping, correlated high-frequency noise, and non-linear effects. At the time of scanning, the image part must be cropped out from the background, either manuallyor automatically. At this point, some mild cropping of the image is inevitable. Empirical evidence indicates thateven very mild cropping affects the image spectrum a lot, including the low frequency coefficients that we areinterested in. High-frequency noise gets added to the image as a result of the digital halftoning and the printingprocess. This affects the high frequency spectrum of the image, so that the high frequency coefficients cannotbe used for data embedding. Both printing and scanning processes introduce non-linearity, which includes thegamma correction that happens at the time of scanning.
We are more interested in the affect of the components of our models on the low frequency coefficients sinceour current SELF embedding scheme hides in these low frequency bands. We observe that cropping affects thelow frequency coefficients the most, and hence, we consider it in more detail. A new method to survive croppingis proposed, whose design is guided by our analysis on the effect of cropping.
We show that mild cropping causes a phase shift in the frequency coefficients which is approximately samefor neighboring frequencies. Based on this observation, a new hiding method is proposed in which, informationis hidden in the phase spectrum of images by quantizing the difference in phase of adjacent frequency locations.The unknown phase shift caused due to cropping would get cancelled when the difference is taken. The idea ofhiding in difference of adjacent locations is analogous to ‘differential phase shift keying’ (DPSK), used to combatthe effect of unknown channel phase shifts in wireless communication. We employ similar nomenclature, andterm the proposed method differential quantization index modulation (DQIM). Using the DQIM hiding in phase,we are able to survive the print-scan process with several hundred bits hidden into the images.
The rest of the paper is organized as follows. A brief background of the printing and scanning processes isprovided in Section 2. Section 3 provides an overview of our previous work on print-scan resilient data hiding.In Section 4, we discuss our mathematical model, and a strategy to survive cropping in the context of print-scanresilient hiding is discussed in Section 5. A new embedding method to survive print-scan, the phase DQIMhiding, is described in Section 6. Finally, we present results in Section 7, and concluding remarks in Section 8.
SPIE-IS&T/ Vol. 5681 419

2. BACKGROUND
In this section, we provide a brief background of the printing and scanning processes. An understanding of theseprocesses would give us some insights on construction of an underlying model.
2.1. The Printing Process
When an image is printed, it undergoes a continuous-tone to bilevel conversion, known as digital halftoning.Digital halftoning is required because almost all printers are bilevel devices †. Several algorithms have evolvedfor digital halftoning over last decades. Readers are referred to14 for an extensive discussion on halftoningmethods.
The printer resolution, specified in dots per inch (dpi), need not be equal to the number of pixels per inch tobe printed for an image. One can specify the number of pixels per inch for an image, which eventually determinesthe number of dots that will be printed for every pixel of the image. For example, if we set the image to beprinted at 60 pixels per inch, and set the printer resolution at 600 dpi, then a square of 10×10 dots will bededicated to a pixel of the printed image. The quality of the printed image depends on the type and age of theprinter, as well as the status of the toner.
2.2. The Scanning Process
In a scanner, the picture to be scanned is illuminated and the reflected intensity is then converted into electricalsignal by a sensor, which is then digitized. The scanning procedure involves putting the picture to be scannedon the scanner flatbed. The picture may undergo a mild rotation if it is not placed well on the flatbed. Thisrotation is generally limited to a few degrees (3 degrees or less) since the corner of the picture to be scannedcan be aligned with the corner of the flatbed with a good accuracy. The scanning software allows one to set theresolution at which the picture is to be scanned. This resolution may vary from 75 dpi to 1200 dpi or more. Theresolution determines the number of pixels scanned per inch of the document.
Another significant process that happens during the scanning is the gamma correction. Images are scannedinto a computer for display on a monitor and for storage in digital media. Every computer monitor has anintensity to voltage response curve which is a power function with parameter γ. This means that if we send acomputer monitor a message that a certain pixel should have intensity equal to x ∈ (0, 1), it will actually displaya pixel which has intensity equal to xγ . Most monitors have a gamma of roughly 2.2, which means that theintensity value displayed will be less than what we wanted it to be. In order that the scanned image is correctlydisplayed on a monitor, the image data generated at the scanner is ‘gamma corrected’ (ie raised to a power 1/γ).The scanner software allows users to set the gamma correction that is to be applied for an image (the defaultbeing 2.2).
3. PRINT-SCAN RESILIENT DATA HIDING
In this section, we provide an overview of our previous work on print-scan resilient data hiding (see11 for details).This method is based on experimental modeling of the print-scan process, as described below. Focussing onlaser printers, a method to estimate and undo rotation that might happen during the scanning process is alsoproposed.
3.1. Experiments and Observations
We printed and scanned several grayscale images using commercially available printer and scanner. Variousparameters, such as printer and scanner resolutions, scanner gamma correction, and print image size were variedand its effect on the image features were studied in order to find features that are invariant to the print-scanoperation. Note that explicit registration of the scanned and original image features is not performed since it isassumed that the original image is not available at the decoder. Some interesting trends in the DFT coefficientmagnitudes were discovered, as listed below.
†Some modern printers allow for more levels, but still require halftoning. Such printers are not used in our experimentsand hence not considered here.
420 SPIE-IS&T/ Vol. 5681
1. The low and mid frequency coefficients are preserved much better than the high frequency ones. In general,the lower the frequency, the better its chances of surviving the print-scan process.
2. In the low and mid frequency bands, the coefficients with low magnitudes see a much higher noise thantheir neighbors with high magnitudes.
3. Coefficients with higher magnitudes (which do not get severely corrupted) see a gain of roughly unity(with the default gamma correction applied at the scanner). Roughly speaking, if the print-scan operationis approximated as a linear filter (for large enough coefficients and low enough frequencies), then themagnitude gain is unity after application of gamma correction. One possible explanation is that theprinting operation in itself does not cause blurring, since several dots are dedicated to each pixel of aprinted image.
4. Slight modifications to the selected high magnitude low frequency coefficients does not cause significantperceptual distortion to the image.
The observations made above form the basis of the embedding scheme described in the following section.These observations will be later explained in terms of the mathematical model proposed in Section 4.
3.2. Selective Embedding in Low Frequencies
Based on the experimental modeling described in the previous section, we propose a new image-adaptive hidingmethod that achieves robustness against the print-scan operation. Information is hidden only in dynamicallyselected low frequency coefficients whose magnitude is greater than a predefined threshold. Hence the name:selective embedding in low frequencies (SELF).
The method proposed above is an image-adaptive technique, in which, the encoder dynamically selects thecoefficients to embed. The decoder does not have explicit knowledge of the locations where data is hidden, butemploys the same criteria as the encoder to guess these locations. The distortion due to attacks may now leadto insertion errors (the decoder guessing that a coefficient has embedded data, when it actually does not) anddeletion errors (the decoder guessing that a coefficient does not have embedded data, when it actually does).An elegant solution based on erasures and errors correcting codes is provided to deal with the synchronizationproblem caused by the use of local adaptive criteria. This coding framework was first employed in our previouswork on robust image-adaptive data hiding.15 The bit stream to be hidden is coded, using a low rate code,assuming that all host coefficients that lie in the candidate embedding band will actually be employed for hiding.A code symbol is erased at the encoder if the local adaptive criterion (i.e., the threshold criterion) for thecoefficient is not met.
3.3. Estimating and Undoing Rotation
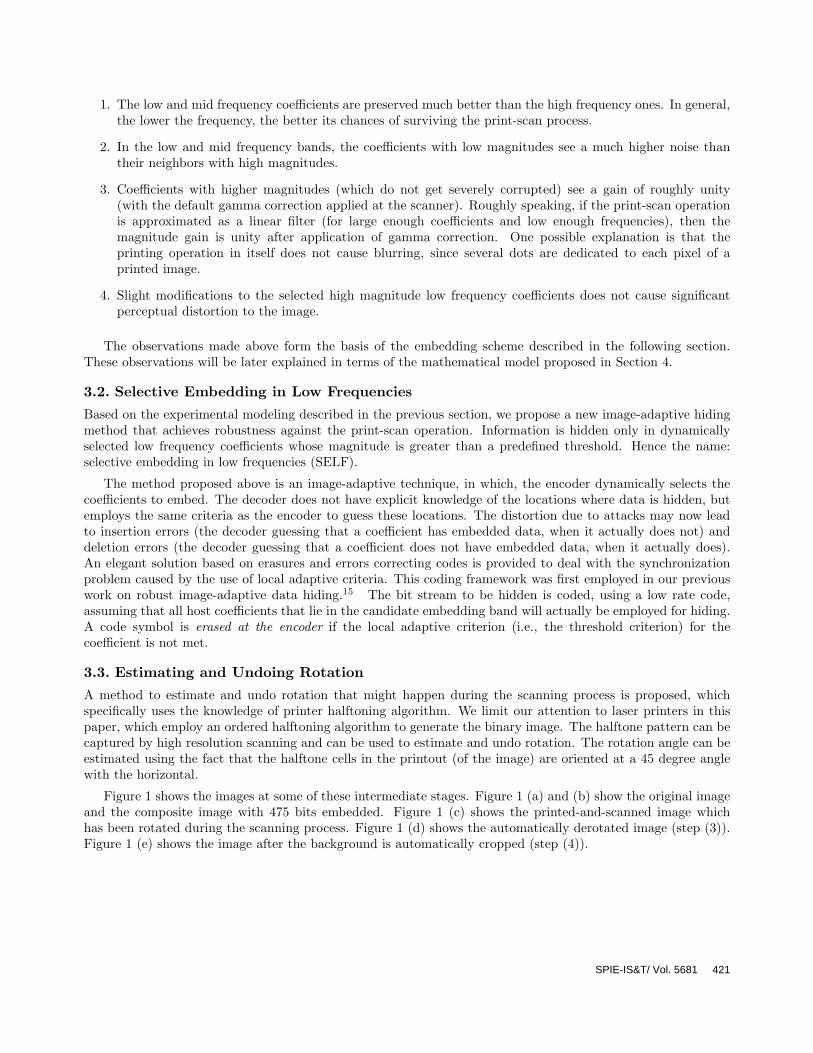
A method to estimate and undo rotation that might happen during the scanning process is proposed, whichspecifically uses the knowledge of printer halftoning algorithm. We limit our attention to laser printers in thispaper, which employ an ordered halftoning algorithm to generate the binary image. The halftone pattern can becaptured by high resolution scanning and can be used to estimate and undo rotation. The rotation angle can beestimated using the fact that the halftone cells in the printout (of the image) are oriented at a 45 degree anglewith the horizontal.
Figure 1 shows the images at some of these intermediate stages. Figure 1 (a) and (b) show the original imageand the composite image with 475 bits embedded. Figure 1 (c) shows the printed-and-scanned image whichhas been rotated during the scanning process. Figure 1 (d) shows the automatically derotated image (step (3)).Figure 1 (e) shows the image after the background is automatically cropped (step (4)).
SPIE-IS&T/ Vol. 5681 421

(a) Origi-nal 512×512Baboon image
(b) Image with475 bits hidden
(c) Printed andscanned image
(d) Automati-cally derotatedimage
(e) The dero-tated imagecropped auto-matically
Figure 1. Images at various stages of embedding, attack, and decoding.
8 9 10 11 12 13 14 158
9
10
11
12
13
14
15Image Scanned at Default Gamma Correction (2.2)
Scanned Image Coefficients
Orig
inal
Imag
e C
oeffi
cien
ts
(a) Image scanned with agamma correction of 2.2.
8 9 10 11 12 13 14 158
9
10
11
12
13
14
15Image Scanned with Overcorrected gamma (5.0)
Scanned Image Coefficients
Orig
inal
Imag
e C
oeffi
cien
ts
(b) Image scanned with agamma correction of 5.0 (over-correction).
8 9 10 11 12 13 14 158
9
10
11
12
13
14
15Scaled Coefficients of Overcorrected Image
Scanned Image Coefficients
Orig
inal
Imag
e C
oeffi
cien
ts
(c) The coefficients of the over-corrected scanned image of (b)are scaled by 1.023.
Figure 2. Effect of gamma correction: Logarithm of low frequency DFT coefficient magnitudes of original 512×512peppers image are plotted against those of the same image after printing and scanning. 1/N2 scaling has not been appliedin computing the DFT. It can be seen that the plot is spread around the x=y line for the gamma correction of (a). Ifthe image is overcorrected at the scanner (b), the response shifts. However, a plot spread around x=y can be achievedby scaling of the coefficients (c).
3.4. Undoing Incorrect Gamma Correction
When the printout of an image is scanned, it undergoes gamma-correction, as discussed in Section 2.2. Differentcomputer systems may have different system gamma (e.g., Macintosh computers use a gamma of 1.8, while thegamma for PCs vary from 2.2 to 2.5) and it is important to apply the right gamma correction at the receiver. Weexperimented with various gamma correction values at the scanner in order to find a way to deal with incorrectgamma correction. As in all previous experiments, we study the logarithm of DFT coefficient magnitudes here.
In the experiments, we observed that when the gamma correction is varied at the scanner, the logarithm ofDFT coefficient magnitudes of the scanned image are scaled by a constant factor. Figure 2 plots the original andscanned image DFT coefficients (or the input/output characteristics) for the default gamma correction (monitorgamma = 2.2) and for overcorrection (monitor gamma = 5.0). Figure 2 (c) shows the same plot when thescanned image DFT coefficient magnitudes are scaled. It can be seen that the plot in (c) is quite close to theunity gain line. The gamma correction applied, in general, depends on the system gamma. Thus, we can dealwith incorrect gamma correction that may happen during scanning simply by scaling the log DFT coefficientmagnitudes.
422 SPIE-IS&T/ Vol. 5681

4. MODELING THE PRINT-SCAN CHANNEL
Printing followed by scanning involves conversion of from digital to analog, and back to digital form. This isinherently a very complex process. The problem is compounded by the fact that a variety of printing and scanningdevices are available in the market, which work on one of many existing technologies. Obviously, constructing aunified model will be extremely difficult, if not impossible. Hence, we limit ourselves to laser printers and flatbedscanners.
Even when only laser printers and flatbed scanners are considered, constructing a complete or near completemodel would require so many parameters that the resulting model will no longer remain very useful practically.Hence, we focus on constructing a model which is quite simple, yet more refined than a completely empiricalmodel stated in Section 3. We use the observations made in Section 3.1 to guide the construction of the proposedmodel. More experiments have been carried out to validate the model and also learn the parameters involved.
As stated in Section 1, there are three components of our print-scan model, namely, mild cropping, high-frequency noise, and non-linear effects. All these components are actually quite broad in their definition, andcan be thought of as sub-processes that constitutes the print-and-scan process as a whole. We now describethe individual components of our model in more detail (Sections 4.1 - 4.3). After describing the individualcomponents, we shall discuss some issues regarding the model in Section 4.4.
4.1. Mild Cropping
Some mild cropping is inevitable during the scanning process, when the image is cropped from the backgroundeither manually or automatically. As a result, the effects due to cropping cannot be ignored in the design of aprint-scan resilient hiding method.
Consider an image f(n1, n2) with N1 rows and N2 columns, so that it is defined over the domain Ω =0, 1, 2, ..., N1 − 1 × 0, 1, 2, ..., N2 − 1. Cropping of the image can be thought of as a multiplication with amasking window. Assuming that the image is cropped to new dimensions of M1 × M2 (with M1 ≤ N1, andM2 ≤ N2), the masking window r(n1, n2), also defined over Ω, can be written as,
r(n1, n2) =
1 if M1a ≤ n1 < M1b, and M2a ≤ n2 < M2b,0 otherwise.
Note that M1a and M1b define the top and bottom cropping locations respectively, so that M1 = M1b − M1a.Likewise, M2 = M2b − M2a. We can now define the cropped image c(n1, n2) as,
c(n1, n2) = f(n1, n2) × r(n1, n2) ∀n1, n2 ∈ Ω
This product is equivalent to circular convolution in the DFT domain. Defining F (k1, k2), R(k1, k2), and C(k1, k2)as the 2D DFT of f(n1, n2), r(n1, n2), and c(n1, n2) respectively, the circular convolution can be written as,
C(k1, k2) =N1−1∑l1=0
N2−1∑l2=0
F (l1, l2) · R(〈k1 − l1〉N1 , 〈k2 − l2〉N2)
Here, 〈·〉N denotes the modulo N operator. The DFT of the masking window r(n1, n2) would be a sinc-likefunction‡, with its shape being a function of M1 and M2, and a phase shift that depends on the location of themasking window, i.e., M1a and M2a. When the cropping is mild, N1 − M1 and N2 − M2 are small, and thesinc-like function would be quite narrow. For mild cropping, most of the energy of R(k1, k2) is concentrated onthe 0, 0 coefficient, along with low frequency part of the first row and first column. Thus, the blurring of theoriginal image spectrum will be mild for those DFT coefficients whose magnitude is high or of the same order asits neighbors. However, for coefficients whose magnitude is significantly lower than its neighbors, the blurringwill cause its magnitude to increase. This will affect low magnitude coefficients in all the frequency bands -
‡Note that R(k1, k2) is a discrete function, which does not strictly follow the sinc definition. It still has a shape similarto the sinc function, and hence we call it sinc-like.
SPIE-IS&T/ Vol. 5681 423

high, mid, or low. This inference is also validated by empirical observations listed in Section 3.1. Specifically,this explains the observation 2, which states that the low magnitude coefficients see a higher noise than the highmagnitude ones. In Section 5, we consider the possible strategies to survive cropping.
4.2. Colored High Frequency Noise
Before an image is printed, it is converted into a digital halftone, as stated in Section 2.1. Digital halftoningalgorithms tend to put the quantization noise in high frequencies14 since the human visual system is not verysensitive to high-frequency noise. This introduces high-frequency noise into the image. Another source of colorednoise is the printing process itself. Uncertainties during the printing operation adds correlated noise which variesevery time a printout is taken.
Addition of the high-frequency noise heavily affects the high frequency DFT coefficients. Due to this reason,the high-frequency coefficients are not appropriate for embedding data. This is consistent with the observation1 made in Section 3.1, which says that low and mid frequency coefficients are preserved much better than thehigh frequency ones. The affect of this component of our model is mostly limited to high and mid frequencycoefficients. It is observed that in the mid, or sometimes low frequency bands, the noise specifically affects thelow magnitude coefficients. Since we are more interested in the affects on low frequency bands, we do not analyzethis component in more detail here. Such an analysis would be an interesting avenue for the future work.
4.3. Non-linear Effects
Images are scanned into a computer for display on a monitor and for storage in digital media. Every computermonitor has an intensity to voltage response curve which is a power function with parameter γ. As described inSection 2.2, in order that the scanned image is correctly displayed on a monitor, the image data generated at thescanner is ‘gamma corrected’ (ie raised to a power 1/γ). When considering an end-to-end system, this processinvariably introduces non-linear transformation.
Note that in their model, Lin and Chang1 propose a responsivity function to take into account the AC,DC and gamma adjustments. The proposed function has four independent parameters and a pixel dependentnoise term. The complexity of this model would not make it useful in the current context. The main thrustof the present work is to come up with a simple model for the print-scan process that would enable us to hideinformation into images resilient to the print-scan operation. As before, we are interested in the low frequencyDFT coefficients. We observe that these non-linear transformation effects the mid and high-frequency coefficientsas well as the low magnitude coefficients in the low frequency bands. This is again consistent with observation 2made in Section 3.1, which states that low magnitude coefficients see a much higher noise then their neighborswith higher magnitude.
4.4. Discussion
An interesting point to note is that out of all above components, only cropping contributes to distortion in all thefrequency bands equally. The other two components tend to affect mid and high frequency coefficients more thanthe low frequency ones. Since we are more interested in data hiding in the low frequency bands, effect of croppingbecomes more significant. In their model, Lin and Chang1 also consider cropping to be an important factor.They view it as an additional source of noise. Moulin and Briassouli16 consider cropping as well, although notin the context of print-scan. Similar to our observation, they view cropping as causing blurring in the frequencydomain.
Note that cropping is not a “natural” process that happens during the printing and scanning operation,since, neither the printer nor the scanner actually causes cropping. Hence, including it in a print-scan modelmight be arguable to some readers. Our reason for including cropping in the model is that it can never becompletely separated from the print-scan process, at least for blind decoding. Analyzing cropping in the contextof print-scan becomes more important because it is the biggest contributor of distortion in the low frequencybands. One more point to note is that, in general, it is very difficult to achieve perfect registration betweenthe original and the attacked image due to presence of cropping, however mild. When the images are analyzed,this imperfect registration might be the reason for observation of higher noise near the edges within the image.
424 SPIE-IS&T/ Vol. 5681

Instead of specifically modeling this noise, we find it more appropriate to consider mild cropping separately, andnot worry about the registration issue.
In the print-scan model proposed by Lin and Chang,1 blurring of the image has been considered via a coupleof point spread functions. Voloshynovskiy et al7 also view the printing process as causing blurring of the image.The main reason for these authors to consider image blurring is that digital halftoning introduces low passfiltering of the image as understood in the inverse halftoning literature (see17 for a survey of inverse halftoning).However, we have not incorporated image blurring in the current proposal of the print-scan model. There aretwo main reasons. First, in the printing scenario we consider, the images were printed at high resolution. Severaldots are dedicated to one pixel, e.g., when a 512×512 image is printed (at 600 dpi printer resolution) on anletter paper with 72 pixels per inch, the size of the image on the paper is 7.11"×7.11". In this case, it turns outthat on an average, a block of 8.33×8.33 dots is used for every pixel of the image. At this resolution, the imagedoes not get blurred during the printing process. The second reason is that we are using laser printers in ourexperiments. The image blurring is often observed with inkjet printers at lower resolutions, as reported in.1
5. SURVIVING CROPPING
Cropping appears to be the most significant impairment for the low frequency coefficients that we hide data in.Hence, we consider it in more detail here. Usually, the amount of cropping performed as well as the locationof the cropping window is not known to the decoder. Following the notation of Section 4.1, while M1 and M2
define the size of the masking window r(n1, n2), the location of the masking rectangle is determined by M1a andM2a.
Let us first consider the scenario where the percentage of cropping is known (i.e., M1 and M2 are known), butits location in the original image is not known (i.e., M1a and M2a are not known). In this case, the rectangularmask has known dimension, but there is an unknown offset. In the frequency domain, the 2D DFT, R(k1, k2) willbe a two dimensional sinc-like function which has known magnitude spectrum (or the “shape”), but unknownphase. As stated previously, for mild cropping, the rectangular mask is large, so that this sinc-like function isquite narrow. This causes mild blurring of the spectrum, which can be ignored for high magnitude coefficients.When the cropping is not very mild, we must explicitly or implicitly take the blurring of the image spectruminto account.
We now construct a simple hiding strategy that can potentially survive a predetermined maximum level ofcropping. The idea is to take into account the affect of cropping at the encoder, so as to modify a specificDFT coefficient of the host image in such a manner that after cropping, this coefficient would be closer toreconstruction point of either the ‘0’, or the ‘1’ quantizer depending on the bit hidden.
Consider an image f(n1, n2), whose DFT is given by F (k1, k2). Now, let us crop the image to the maximumlevel (i.e., minimum permissible M1 and M2), at any location using the rectangular window r(n1, n2) whoseDFT is given by R(k1, k2). Let us denote this cropped image by c(n1, n2) and its DFT by C(k1, k2). Notethat this C(k1, k2) is one particular instance of the blurring of F (k1, k2) due to cropping. When the croppingis not very severe (e.g., more that 50% by area), we assume that the blurring causes similar overall effect tothe coefficients. There will be additional noise due to the variation of actual location of the cropping window.We try to estimate this overall effect using this one particular instance and then use this knowledge to embedinformation. In practice, we observed that this estimate is good only for those coefficients, whose magnitude ishigher than its neighbors.
Let us choose a particular coefficient Fi = F (x, y) in the low frequency band to embed binary information.Likewise, the same coefficient C(x, y) is denoted by Ci for simplicity. Also, denote the DC coefficient of thespectrum of the masking window by Rdc = R(0, 0). Since the spectrum C(k1, k2) can be given by the circularconvolution of F (k1, k2) and R(k1, k2), we have,
Ci = RdcFi + other terms
Since we know Ci, Rdc and Fi, we can compute an estimate of the sum of all other terms as Ci − RdcFi. Now,in order to hide a bit b ∈ 0, 1, we want that the new cropped image coefficient Co to be a quantized version of
SPIE-IS&T/ Vol. 5681 425

Ci. That is, we want that Co = Qb(Ci) by modifying Fi to Fo. Here we get,
Co = RdcFo + Ci − RdcFi
After some simplifications, we get,
Fo = Fi +Co − Ci
Rdc
Note that Rdc is always less than 1, and hence, the above equation indicates that the change we have to maketo the host image coefficient is a factor of 1/Rdc more than the change we observe in the same coefficient in thecropped image. The Fo we would observe after actual cropping may vary from the one projected here becausethe location of the masking window in actual attack may vary from the one used here. As stated before, theassumption that the affect would be similar for different crop window locations is valid only when the magnitudeof the coefficient under consideration is high. Hence, we modify the embedding strategy to make sure thatthe magnitude of the modified coefficient is always higher than the original one (i.e, Fo > Fi). This is doneby choosing only those quantizer reconstruction points which are greater than the present value (though thismight cause a larger distortion). Also, note that, as in the rest of the paper, we modify the logarithm of themagnitude of the coefficients. We present the preliminary results of this embedding strategy in Section 7. Asin the formulation above, we embed only a single bit of information in the image. Some potential strategies toenable us to hide larger number of bits are currently under investigation.
It should be noted that the proposed crop-resilient embedding scheme is still limited by the fact that thedecoder must know the amount of cropping, i.e., the variables M1 and M2. We concede that this would be amajor limitation in case of cropping that happens digitally. However, in case of print-scan resilient hiding, thereis a simple way to compute the amount of cropping at the decoder. Here, we can use the printer halftone patternto estimate the number of original pixels contained in the received image. Note that we have used the printerhalftoning algorithm to estimate and undo rotation that might happen during the scanning process (See Section3.3). A similar approach to estimate the amount of cropping after scanning is currently under investigation. Wenow turn our attention to a new hiding method for the phase spectrum, as described in the following section.
6. DIFFERENTIAL QUANTIZATION INDEX MODULATION
Quantization index modulation (QIM), proposed by Chen and Wornell,18 are a class of information hidingmethods, in which data is embedded into the host sample by the choice of quantizer. We propose an extensionto this method with the goal of surviving the cropping and the print-scan processes. Instead of just quantizingthe host signal, we embed data by quantizing the difference of two adjacent host samples. The idea of hidingin difference of adjacent locations is analogous to ‘differential phase shift keying’ (DPSK), used to combat theeffect of unknown channel phase shifts in wireless communication. We employ similar nomenclature, and termthe proposed method differential quantization index modulation (DQIM).
We use DQIM to embed information in the phase spectrum of the images to counter unknown phase shiftinduced due to mild cropping. As discussed in Section 4.1, cropping is equivalent to circular convolution ofthe image spectrum with a narrow sinc-like function. Let us focus only on mild cropping, where the sinc-likefunction, R(k1, k2), is quite narrow. If we look only at low frequency coefficients, and assume that the particularDFT coefficient under consideration does not have significantly low magnitude compared to its neighbors, wehave only two dominant terms in the convolution expression,
C(k1, k2) = R(0, 0) · F (k1, k2) + R(k1, k2) · F (0, 0) + other terms
In the above expression, while the first term would not cause a phase shift, the second term would. This woulddepend on the phase of R(k1, k2) itself. Since the phase of the sinc-like R(k1, k2) varies slowly, the phase spectrumof C(k1, k2) would have a slowly varying phase shift with respect to F (k1, k2). Note that the phase of R(k1, k2)varies slowly except for the zeros of the sinc where the variation in phase is larger. However, for mild cropping,the number of such zeros would be very few.
In the actual implementation, we scan the image phase spectrum row-wise. Note that only those coefficientsthat lie in a predefined band are used for embedding information. Let us denote the row-wise scanned original
426 SPIE-IS&T/ Vol. 5681

image phase values by φn, where n is the index (n ∈ 0, 1, 2, ..., Nmax), and the quantized values by θn. Then,the embedding function is,
θn = 〈Qb(φn − θn−1)〉2π∀n ∈ 1, 2, ..., NmaxNote that since we are dealing with phase, we must output the modulo-2π values after the quantization Qb(·)of the difference is done. Also note that we use the quantized values θn to compute the phase difference for thenext coefficient. This is done to maintain consistency for the decoder, which just finds these differences, anddetermines which of the two quantizers was used.
As discussed before, the assumption of slowly varying phase shift is not valid for those coefficients whosemagnitude is significantly lower than it neighbors. Hence, we avoid hiding in these locations, and use turbolikerepeat-accumulate (RA) codes to counter the synchronization problem caused due to adaptive hiding.11, 15 Theuse of coding framework to counter insertions/deletions problem has also been discussed briefly in Section 3.2.
7. RESULTS
In order to verify the validity of the proposed model, we construct an example where, a dummy printed andscanned image is constructed using a simulated attack. We compare this with the same image after actual print-and-scan operation. Figure 3 (a) and (b) shows the simulated and actual images respectively. The images lookvery similar perceptually, although the finer details may not be visible in the displayed images. The similarityis maintained in the transform domain as well. Figure 3 (c) and (d) show the low frequency DFT magnitudespectra of the two images. The coefficients are quite close to each other, with few notable exceptions. Thoughonly one specific example is presented here, similar observations have been made for all the test images.
We believe that a visual examination, like the one presented above, is necessary to show the goodness ofthe presented model. However, by itself, this is not sufficient to validate the model. More experimental andmathematical analysis would be required to make concrete claims. We present this example just to show thatthe proposed coarse modeling may be a good starting point to guide the design of simple print-scan resilienthiding methods.
We evaluated the performance of the embedding scheme of Section 5, which is designed to survive cropping.In the preliminary results presented here, we embed one bit of information in a single DFT coefficient of thehost image. As an example, we choose the (6, 6) coefficient of the 512×512 ‘fishing boat’ image to embed thebit. The maximum cropping is a design parameter, which is set to 100 rows/columns in both directions (i.e.,M1 = M2 = 412), which amounts to cropping more than a third of the image by area. The hidden bit isrecovered from the composite image after it has been cropped severely, up to the design maximum. No errorswere observed in a number of runs that were carried out with varying locations of the cropping window.
For our DQIM hiding in phase method, we are able to embed several bits against the print-scan attack. Thevolume of embedding depends on the host image. When compared to the SELF hiding scheme for hiding inmagnitudes, the volume of embedding is slightly less. As an example, we can embed 125 bits into 512×512peppers image using the DQIM hiding with perfect recovery after the print-scan attack. The 125 bits to beembedded are coded using rate 1/5 RA code, so as to get a stream of 625 bits. These bits are embedded into thelow frequency DFT coefficients of the host image. In this example, the low frequency band spans 576 coefficients.Data is hidden into a coefficient in this band only if its magnitude is greater than a predefined threshold, andthe corresponding code symbol is erased at the encoder. Since we are using DQIM, if a coefficient does not passthe threshold test, the next one is also skipped.
8. CONCLUSION
In this paper, we propose a mathematical characterization of the print-scan process by dividing it into three subprocesses. Our main focus here is to create a simple and practical model that can be used to guide design of datahiding schemes that survive the print-scan process. The model does inspire construction of two new embeddingstrategies proposed in this paper: a technique to survive cropping by estimating its effect beforehand, and amethod to survive the print-scan process by DQIM embedding in the phase spectrum. While the proposedmodel does sound promising, much more work needs to be done to completely validate it.
SPIE-IS&T/ Vol. 5681 427

(a) Simulated attack (b) Actual print-scan attack
(c) Low-frequency magnitude spectrum ofsimulated image
(d) Low-frequency magnitude spectrum ofactual attacked image
Figure 3. Image with simulated print-scan attack as compared to actually printed and scanned image.
Acknowledgement
This research is supported in part by a grant from ONR # N00014-01-1-0380.
REFERENCES1. C. Y. Lin and S. F. Chang, “Distortion modeling and invariant extraction for digital image print-and-scan
process,” in Intl. Symp. on Multimedia Information Processing, Dec. 1999.2. J. K. O. Ruanaidh and T. Pun, “Rotation, scale and translation invariant spread spectrum digital image
watermarking,” Signal Processing 66, pp. 303–317, May 1998.3. V. Solachidis and I. Pitas, “Circularly symmetric watermark embedding in 2-D DFT domain,” IEEE Trans.
on Image Processing 10, pp. 1741–1753, Nov. 2001.4. P. Bas, J.-M. Chassery, and B. Macq, “Geometrically invariant watermarking using feature points,” IEEE
Trans. on Image Processing 11, pp. 1014–1028, Sept. 2002.5. J. Rosen and B. Javidi, “Hidden images in halftone pictures,” Applied Optics 40(20), pp. 3346–3353, 2001.
428 SPIE-IS&T/ Vol. 5681

6. M. S. Fu and O. C. Au, “Data hiding watermarking in halftone images,” IEEE Trans. on Image Processing11, pp. 477–484, Apr. 2002.
7. S. V. Voloshynovskiy, O. Koval, F. Deguillaume, and T. Pun, “Visual communications with side informa-tion via distributed printing channels: extended multimedia and security perspectives,” in Proc. of SPIE:Security, Steganography, and Watermarking of Multimedia Contents VI, pp. 428–445, (San Jose, CA, USA),Jan. 2004.
8. A. K. Mikkilineni, G. N. Ali, P.-J. Chiang, G. T. C. Chiu, J. P. Allebach, and E. J. Delp, “Signature-embedding in printed documents for security and forensic applications,” in Proc. of SPIE: Security, Steganog-raphy, and Watermarking of Multimedia Contents VI, pp. 455–466, (San Jose, CA, USA), Jan. 2004.
9. J. Picard, C. Vielhauer, and N. Thorwirth, “Towards fraud-proof ID documents using multiple data hidingtechnologies and biometrics,” in Proc. of SPIE: Security, Steganography, and Watermarking of MultimediaContents VI, pp. 416–427, (San Jose, CA, USA), Jan. 2004.
10. K. W. Mahmoud, J. M. Blackledge, S. Datta, and J. A. Flint, “Print protection using high-frequencyfractal noise,” in Proc. of SPIE: Security, Steganography, and Watermarking of Multimedia Contents VI,pp. 446–454, (San Jose, CA, USA), Jan. 2004.
11. K. Solanki, U. Madhow, B. S. Manjunath, and S. Chandrasekaran, “Estimating and undoing rotation forprint-scan resilient data hiding,” in Proc. ICIP, (Singapore), Oct. 2004.
12. K. Solanki, O. Dabeer, U. Madhow, B. S. Manjunath, and S. Chandrasekaran, “Robust image-adaptive datahiding: Modeling, source coding and channel coding,” in 42ed Annual Allerton Conf. on Communications,Control, and Computing, Oct. 2003.
13. F. A. P. Petitcolas, R. J. Anderson, and M. G. Kuhn, “Attacks on copyright marking systems,” in Proc.Workshop Information Hiding, IH’98, LNCS 1525, Springer-Verlag, pp. 219–239, 1998.
14. R. Ulichney, Digital Halftoning, The MIT Press, 1987.15. K. Solanki, N. Jacobsen, U. Madhow, B. S. Manjunath, and S. Chandrasekaran, “Robust image-adaptive
data hiding based on erasure and error correction,” IEEE Trans. on Image Processing 13, pp. 1627 –1639,Dec 2004.
16. P. Moulin and A. Briassouli, “A stochastic QIM algorithm for robust, undetectable image watermarking,”in Proc. ICIP, (Singapore), Oct. 2004.
17. M. Mese and P. P. Vaidyanathan, “Recent advances in digital halftoning and inverse halftoning methods,”IEEE Trans. on Circuits and Systems I: Fundamental Theory and Applications 49, pp. 790–805, June 2002.
18. B. Chen and G. W. Wornell, “Quantization index modulation: A class of provably good methods for digitalwatermarking and information embedding,” IEEE Trans. on Info. Theory 47, pp. 1423–1443, May 2001.
SPIE-IS&T/ Vol. 5681 429