Caries progression in primary molars: 24-month results from a ...
Upload
independentCategory
view
2download
0
Modeling the Long-Term Cost-Effectiveness of the CariesManagement System in an Australian Populationvhe_759 750..760
Emma Warren, MA(Econ),1 Christine Pollicino, B(Econ), M(MedStat),2 Bradley Curtis, BDS, MPH, FICD,3
Wendell Evans, BDS, MDS, DDSc,3 Alexandra Sbaraini, BDS, MDSc,3 Eli Schwarz, DDS, MPH, PhD3
1Health Economist, HERA Consulting Australia, Balmain, NSW,Australia; 2Health Services Analyst, University of Sydney, Sydney, NSW,Australia; 3Faculty of Dentistry, University of Sydney, Sydney, NSW,Australia
ABSTRACT
Objectives: The Monitor Practice Program demonstrated that regularmonitoring and noninvasive management of dental caries is effective inreducing the incremental DMFT (decayed, missing, and filled teeth) inpatients, within the construct of a 3-year randomized clinical trial. Thisanalysis evaluates the long-term cost-effectiveness of the preventiveapproach underpinning the Caries Management System, used in thegeneral practice setting and modeled to the Australian population.Methods: An individual patient-simulation Markov model was developedto compare the long-term costs and outcomes of the Caries ManagementSystem versus standard dental care in a hypothetical sample representativeof the Australian population. Eight Markov submodels were developed,representing eight molar teeth (excluding wisdom teeth), each consisting of11 health states simulating the incidence and progression of dental caries,
and future interventions such as fillings and crowns. Transition probabili-ties and costs assigned to health states were based on claims data from thesecond largest private health insurer in Australia. The economic evaluationwas performed from the Australian private dental practitioner perspective.The incremental cost per DMFT avoided was calculated at three timepoints: 2 years, 3 years, and lifetime. Univariate sensitivity analysis wasconducted to test the robustness of the results.Results: The incremental cost per DMFT avoided at 2 years, 3 years,and lifetime was estimated to be $1287.07, $1148.91, and $1795.06,respectively.Conclusion: The analysis suggests that the Caries Management System ismost cost-effective in patients with a high risk of dental caries.Keywords: cost-effectiveness, dental caries, economic analysis, prevention.
Introduction
The concept and practice of evidence-based care is well accepted,and within the medical profession has become standard practice.Historically, the dental profession has been slower to fully adoptthe practice of evidence-based care [1,2]; however, in the pastdecade, the dental profession has experienced a period of intenseinterest in this concept. The American Dental Association inparticular has relied on credible scientific evidence in settingdental policy, and in communication with dentists and thegeneral public [3].
The prevention of caries has been, and still is, a major goal forthe dental profession. Although several groups have performedresearch designed to optimize the prevention of dental caries[4–6], there are still evident disparities between the researchevidence into effective diagnosis and preventive interventions andclinical practice [7]. Interest in how best to promote the uptake ofresearch findings has been fuelled by these evident disparities.
A systematic literature review identified 17 cost-effectivenessanalyses of preventive dental programs published since 1980[8–24]. Despite the growing number of economic analyses ofpreventive dental programs, it is unclear whether this growingliterature has impacted either public policy or the implementationof evidence-based dentistry. A key criticism to date has been thelack of generalizability as the vast majority of cost-effectivenessresearch continues to be undertaken within public institutions;whereas, 83% of dental services in Australia are provided withinprivate practice [25]. The majority of economic analyses of pre-ventive dental programs report cost-effectiveness in terms of
incremental cost per DMFS (decayed, missing, and filled surfaces)or DMFT (decayed, missing, and filled teeth) avoided [11–13,15–19], given that the composite measures, DMFS and DMFT are thestandard measures of dental caries [26]. However, few modeledeconomic analyses of preventive dental programs extrapolate thecosts and outcomes beyond the duration of the clinical trial onwhich the efficacy results are based.
The structured preventive program under review, the CariesManagement System (CMS), involves a noninvasive strategydesigned to arrest and remineralize noncavitated lesions. Bothdental caries risk and dental caries treatment are managedaccording to a set of protocols which include the following:
1. A case history and review of exposure to potential cariesrisk factors such as:• sucrose intake (including a 24-h diet assessment),• fluoride use and history of fluoride exposure• assessment of dental plaque control including oral
hygiene instruction and characterization of dentalplaque distribution
2. Clinical examination including assessment of toothmorphology—smooth surfaces and fissures are dried andexplored with sharp eyes and a blunt probe to reveal incipi-ent lesions and enamel breaks. These are recorded on stan-dard dental charts. Unless frank cavitation is evident, thediagnosis of dentine caries is via a radiographic bitewingsurvey.
3. Bitewing radiographic survey—radiolucencies are scoredaccording to a five-category system proposed by Mejareet al. [27]. These results are entered on a form that allowsfor multiple dated entries and serial review of radiographicchange.
4. Assessment of the patient’s caries risk status—following theclinical examination and bitewing survey, the caries risk
Address correspondence to: Emma Warren, HERA ConsultingAustralia, 21 Stephen Street, Balmain, NSW 2041, Australia. E-mail:[email protected]
10.1111/j.1524-4733.2010.00759.x
Volume 13 • Number 6 • 2010V A L U E I N H E A L T H
750 © 2010, International Society for Pharmacoeconomics and Outcomes Research (ISPOR) 1098-3015/10/750 750–760

status of the patient is determined pragmatically. Risk ofcaries, according to the CMS, is determined at the first visitsolely according to the clinical presentation of the dentitionand at later follow-up appointments according to the inci-dence rate of new lesions.
5. The status of each lesion—for lesions that do not extendbeyond the outer third of dentine, therapy entails profes-sional 3-monthly fluoride varnish applications in additionto twice-daily toothbrushing with fluoride toothpaste.Deeper lesions are restored. The goal of this intensive inter-vention is to reduce caries risk status which is assessed onthe basis of lesion behavior and rate of new lesion incidenceas determined via clinical inspection and bitewings at sixmonthly intervals. More detailed review of the CMS hasbeen described by Evans et al. [28].
The effectiveness of the CMS has been assessed within thecontext of a cluster randomized, controlled clinical trial in theAustralian private practice setting (The Monitor PracticeProgram) [29]. The design of that clinical trial has been reportedin detail elsewhere [30]. In all, 902 patients were recruited within22 dental practices (12 intervention and 10 control) betweenMay 2005 and February 2006 in an equal distribution of fluo-ridated and nonfluoridated localities in New South Wales and theAustralian Capital Territory. Sixteen male and six female dentistswere recruited with a median practice experience of 21 years(range 10–51 years). The baseline characteristics of the trialparticipants and efficacy results are presented in Table 1 andTable 2, respectively.
In the clinical trial, standard care was defined as the usualcare provided to patients of a given practice, and should bedistinguished from standardization of technique or standard ofcare. The standard care provided by the dentists involved in thetrial was categorized following a time-in-motion study at eachparticipating practice. A total of 426 dental procedures wereobserved over a period of 5 months in the 22 recruited practicesby one researcher (BC). In all, 194 procedures in the control and232 procedures in the intervention practices were observed. Theservice delivery pattern of intervention and control practices wasnot statistically significant overall [30].
The results suggest that, at both two and three years, theCMS significantly reduces the incremental number of decayed,missing, and filled teeth (DMFT score) in the study group, whoreceived preventive dental care (29 and Table 2). Efficacy wasindependent of age, gender, medical concerns, fluoride history, orprevious history of dental caries.
The aims of the present article are 1) assess the cost-effectiveness of the CMS based on the incidence of dental cariesand incremental efficacy data taken directly from the clinicaltrial; 2) to broaden currently available research on the cost-effectiveness of preventive dental programs by describing indetail a decision analytic model constructed to assess the cost-effectiveness of the CMS clinical trial at two and three years afteradjusting the baseline incidence of caries to that of the Australianpopulation; 3) to present the results of modeling the results of theCMS to an Australian population over a longer time horizon;and 4) to extrapolate the costs and benefits beyond the durationof the trial on which efficacy results were based, rarely seen in thepublished literature.
Methods
The decision analytic model was constructed using Data 4.0(TreeAge Software, Williamstown, MA).
Model DescriptionA patient-level simulation decision analytic model has been con-structed to assess the long-term cost-effectiveness of the CMScompared with standard dental care after adjusting the baseline
Table 1 Baseline characteristics of randomized patients
CharacteristicControl
standard careIntervention CariesManagement System
Number of patients 450 452Age (years)
Mean 45.8 43.9SD 19.9 19.5Minimum 5 6Median 48 45Maximum 89 88 P = 0.14
GenderFemale 210 (47%) 277 (61%)Male 240 (53%) 175 (39%) P < 0.001
Risk status (baseline)Low 299 (67%) 290 (64%)Medium 33 (7%) 48 (11%)High 118 (26%) 114 (25%) P = 0.23
Decayed, missing, andfilled surfaces (baseline)
Mean 24.6 24.3SD 25.6 24.4Minimum 0 0Median 14 17Maximum 124 112 P = 0.83
P-values are for comparisons between the treatment groups. Independent t-tests and analysisof variance were used for continuous variables and the Fisher’s exact test for categoricalvariables.SD, standard deviation.
Table 2 Caries Management System RCT efficacy results at two andthree years
Standardcare
CariesManagement
System P-value
Number of patientsrandomized
450 452
Baseline Mean (SD) Mean (SD)Decayed 2.6 (2.6) 2.9 (2.5) 0.2Missing 1.4 (1.8) 1.4 (1.6) 0.9Filled 4.3 (5.2) 4.3 (4.7) 0.8DMFT 8.4 (8.6) 8.5 (8.2) 0.8
2-year incrementDecayed 0.7 (1.3) 0.4 (0.1) <0.001*Missing 0.1 (0.5) 0.1 (0.4) 0.3Filled 1.3 (1.7) 0.8 (1.4) <0.001*DMFT 2.1 (2.8) 1.3 (2.1) <0.001*
2-year endpointDecayed 3.3 (3.2) 3.3 (2.7) 0.9Missing 1.6 (1.9) 1.5 (1.6) 0.7Filled 5.6 (6.1) 5.0 (5.3) 0.1DMFT 10.5 (10.2) 9.8 (8.9) 0.3
3-year incrementDecayed 1.1 (1.6) 0.76 (1.2) 0.002*Missing 0.3 (0.6) 0.2 (0.5) 0.1Filled 2.8 (2.9) 2.2 (2.3) <0.001*DMFT 4.2 (4.5) 3.3 (3.3) <0.001*
3-year endpointDecayed 3.7 (3.7) 3.6 (3.2) 0.8Missing 1.8 (2.1) 1.7 (1.8) 0.6Filled 7.2 (7.6) 6.5 (6.6) 0.1DMFT 12.6 (12.3) 11.8 (10.8) 0.2
*Significant at 0.05.P-values are for comparisons between the treatment groups. Independent t-tests and analysisof variance were used for continuous variables and the Fisher’s exact test for categoricalvariables.DMFT, decayed, missing, and filled teeth; SD, standard deviation.
The Caries Management System 751

incidence of caries to that of the Australian population at threetime points; two years, three years and over a patient’s lifetime.The model assesses the cost-effectiveness of the CMS in amodeled cohort representative of the Australian population. Theequation used to calculate the incremental cost-effectiveness ratiois as follows:
Incremental cost per DMFT avoidedCost of CMS Cost of SC
DM= −
FFT increment for CMS DMFT increment for SC−(1)
Although the majority of modeled economic evaluations usecohort models, there is an increase in use of patient-level simu-lation models (also known as micro-simulation) [31]. Simula-tions in the model occur at the patient level (randomly sampledfrom a cohort of 10,000 patients with an age distribution similarto that of the Australian population based on data from theAustralian Bureau of Statistics). Caries incidence, progression,and resulting dental treatment, is based on eight independentMarkov submodels representing the impact of the CMS on theeight molar teeth separately (Federation Dentaire International(FDI) numbers 16, 17, 26, 27, 36, 37, 46 and 47). This allowsmore sensitivity than a model constructed at the patient level asit allows for the possibility that a patient may have experiencedtooth decay and/or dental intervention on several teeth duringhis/her lifetime. The model simulates the natural history of dentalcaries and associated dental intervention on each of the eightmolars over the sampled patient’s lifetime, for both the standardcare arm and the CMS.
Each independent Markov submodel has the following elevenhealth states; No disease, Enamel caries, Dentine caries, Filling,Repeat filling, Root canal, Crown, Extraction, Bridge, Implantand Death (an absorbing health state). In each cycle (6 months),patients can either remain in the health state they are in, or moveto another health state as depicted by the arrows in Figure 1. Theauthors acknowledge that, in reality, patients can move from onestate to another state (i.e., patients can move directly fromdentine decay to extraction). However, given the extensive datarequirements needed to populate a model that allows all possibletransitions, the authors have identified the key transitions (asshown in Fig. 1) and have modelled the impact of the CMS onthese transitions. Although not shown in Figure 1, patients canmove into the Death health state from any of the other healthstates.
As reported in Curtis et al. [29], the clinical trial measuredefficacy in terms of incremental Decayed, Missing, and FilledSurfaces (DMFS). Because the economic model is stratified intoeight molars, the analysis assesses the cost-effectiveness in termsof cost per DMFT avoided. The DMFS score has been convertedto DMFT and Table 2 reports the two and three year efficacyresults of the trial in terms of incremental DMFT. For eachhypothetical patient that progresses through the model, theDMFT is assessed at three time points: 2 years, 3 years, and endof life. As patients simulate through the Markov process, theirDMFT increment increases by one each time they enter any of thefollowing four health states: enamel caries, filling, repeat fillingand tooth extraction. Transitioning into the other health statesdoes not impact a patient’s DMFT score. The eight Markovsubmodels run independently. Therefore if a patient receives afilling on one tooth and a filling on another tooth, the patient’sDMFT increment will increase by two.
Starting Distribution among Markov StatesThe age distribution of the 10,000 patients entering the model isbased on population data from the Australian Bureau of Statis-
tics [32]. Although there are 11 health states in each Markovsubmodel, when patients first enter the Markov process, it isassumed that they enter in one of 6 health states; No decay,enamel caries, dentine caries, filling, extraction or implant. Datafrom the Australian Institute of Health and Welfare (AIHW) [33]has been used to determine the distribution of patients amongthese six states in each of the eight Markov submodels (Table 3).Although the AIHW data are available to inform the probabilityof entering the Markov model with dental caries, no informationwas available on the split between enamel and dentine caries.Arrow [34] reports the incidence of enamel and dentine caries in157 school children in Western Australia over a 5-year period. Inthat article, the incidence of enamel caries was 117 lesions per100-tooth surface years while the incidence of dentine caries was13.8 lesions per 100 tooth surface years. Thus the proportion ofpatients with decay is divided between the two health states(enamel decay and dentine decay) at a ratio of 8.5:1. The authorsacknowledge that ratio of enamel to dentine decay will beincreased in certain age groups, because until 12–24 months posteruption the enamel surface is not fully matured. This moreporous enamel surface is likely to result in a higher rate ofprogression to dentine decay. However, in the model it is assumedthat the ratio of 8.5:1 is applicable for all age groups.
Transition ProbabilitiesThe six monthly probability of developing enamel caries wastaken directly from the 2-year results of the control arm in theclinical trial (0.154 probability of developing enamel caries)while the relationship between enamel and dentine caries hasbeen estimated from Arrow [34], resulting in 0.084 probabilityof enamel caries progressing to dentine caries in any 6-monthMarkov cycle. The 6-month probability of developing cariesassumed in the model is similar to the rate of caries assumed forlow-risk patients in Bader et al. [35]. Sensitivity analyses deter-mine the impact of increasing the probability of developingdental caries to be comparable with the medium- and high-riskpatients in Bader et al. [35]. Consistent with other economicanalyses of preventive dental programs [21,22]) and AIHWdental statistics [36], the model assumes a constant relationshipbetween the incidence of dental caries and age. However, giventhat permanent molar teeth have not erupted in young children,the model assumes that the probability of dental caries is zero inchildren under the age of 5 for tooth ID numbers 16, 26, 36, and46 and zero under the age of 10 for tooth ID numbers 17, 27, 37,and 47.
The six-month probability of progressing from enamel anddentine caries to a filling was taken directly from the two-yearresults of the control arm in the clinical trial. The six-monthprobability of progressing from enamel caries to a filling was0.199 for the control group for a patient with mean age 45. Thesix-monthly probability of progressing from dentine caries to afilling was 0.149. Consistent with other economic analyses ofpreventive programs [21], the model assumes a linear relation-ship between the incidence of fillings and age (Table 4).
Transition probabilities between future dental interventions(e.g., filling to root canal) were based on claims data from thesecond largest private health insurer in Australia, Medical BenefitsFund (MBF). In 2007, 1.5 million persons had dental cover withMBF. Utilization and cost (charge was used as a proxy) data werebased on all dental claims received and paid by MBF for servicesincurred in 2007. These data were reported by the AustralianDental Association (ADA) service item codes, routinely collectedby MBF. Four years of dental claims data were analyzed to derivethe transition probabilities between dental treatments (e.g.,
752 Warren et al.

Fig
ure
1Ill
ustr
atio
nof
the
mod
el.O
nth
ele
ftha
ndsi
de,t
hede
cisi
ontr
ee.O
nth
eri
ght
hand
side
,the
stru
ctur
eof
each
ofth
eei
ght
inde
pend
ent
Mar
kov
subm
odel
s.
The Caries Management System 753

transition from filling to root canal). This analysis was based onmembers who had experienced at least two events of interest whilea member with the fund. The transition probabilities betweenevents was assumed to be constant with age i.e., the probabilitiesof a repeat filling is dependant on occurrence of the first filling andnot the patient’s age. For each paired event (e.g., filling to repeatfilling), the 6-month transition probability between the two eventswas estimated based on the risk of the second event occurring andthe duration of time since the first event occurred (Table 5).
Data from the Australian Bureau of Statistics have been usedto populate the model with respect to age-specific death rates[37].
Comparative Effectiveness of the CMSTable 2 reports the effectiveness of the clinical trial in terms ofDMFT increment at 2 and 3 years. The 2-year results from therandomized controlled trial (RCT) have been used to model theincremental effectiveness of the CMS and the 3-year results havebeen used to validate the results generated at year 3 in the model.The composite measure of DMFT was divided into individualcomponents in order to ascertain whether the number of decayed(D), missing (M), or filled (F) teeth was a major contributor toany differences between the groups. As shown in Table 2, imple-mentation of the CMS within the clinical trial resulted in astatistically significant reduction in the incidence of decay, thenumber of first-time fillings from enamel caries, and the numberof repeat fillings over the 2-year period. When compared with thecontrol arm, the CMS resulted in a 40.3% reduction in theincidence of decay (represented by D on Fig. 1), a 46.3% reduc-tion in the number of first-time fillings from enamel caries (rep-resented by F on Fig. 1), and a 54.2% reduction in the number ofrepeat fillings (represented by RF on Fig. 1) at 2 years. However,the number of extractions was not significantly reduced. Thus,
the analysis assumes that the rate of extraction is the samebetween the two groups (represented by M on Fig. 1).
One of the main areas of uncertainty in the model relates to theassumed duration of the incremental benefit of the CMS overstandard care. The long-term impact of other preventive dentalprograms has been used to inform this assumption. The effective-ness of the preventive program assessed by Axelsson [38] wasmaintained for 30 years. In patients who remained in the program,the mean number of decayed surfaces was between 1.7 and 2.1after 30 years, representing nearly complete effectiveness at pre-venting caries and tooth loss [38]. These long-term results aretestament to what can be achieved if adherence to the program’smonitoring protocol is high. However, the Axelsson study wasconducted in one dental practice only, making it easier to establishand maintain adherence to the monitoring protocol. This raisesthe question as to the generalizability and external validity of thesefindings. An example of a preventive program that by its naturecreates a high level of adherence (and hence, the benefit of theprogram has been maintained over time) is that of water fluori-dation. The DMFT reductions of 50–60% observed in the 1950swhen fluoridation programs were first implemented have beensustained until today [39]. However, results from other preventiveprograms, such as sealant application without follow-up do notdemonstrate similar long-term efficacy because upon sealant loss,nonprotected susceptible surfaces soon decayed [40].
Within the clinical trial, the CMS was not completely effectiveat preventing caries (i.e., the change from baseline in DMFT scorefor the CMS group was greater than zero), so, for the purposes ofthe modeling analysis, we assumed adherence to the CMS proto-col to be less than perfect. However, the 2- and 3-year results of thetrial suggest that the incremental benefit of the CMS comparedwith standard dental care is maintained over that 3-year perioddespite less than complete adherence to the monitoring protocol(Table 2). This suggests that the level of (less than perfect) adher-ence does appear to be maintained over the duration of the study.Assuming that this level of adherence is maintained in the longerterm, it is reasonable to assume that the increment benefit of theCMS over standard care would be maintained in longer term.Thus, the model assumes that the incremental benefit of the CMSobserved in the trial is maintained for as long as the costs associ-ated with the CMS protocol are incurred. A sensitivity analysisdetermines the impact of varying this assumption.
Ongoing Costs Associated with MonitoringDental CariesThe schedule for monitoring caries activity in the CMS arm ofthe model is derived from Evans et al. (2008) [28] and is shown
Table 3 Starting distribution of the population among the health states in each of the eight submodels
Age (years) No decay Enamel decay Dentine decay Filled Missing Implants
0–4 1 0 0 0 0 05 0.9636 0.024426 0.002874 0.0091 0 06 0.9804 0.0136 0.0016 0.0022 0.0022 07 0.9675 0.019774 0.002326 0.0081 0.0023 08 0.9616 0.020758 0.002442 0.0125 0.0027 09 0.9588 0.019774 0.002326 0.0176 0.0015 0
10 0.9593 0.017089 0.002011 0.0185 0.0031 011 0.9634 0.016553 0.001947 0.0171 0.001 012 0.9577 0.017805 0.002095 0.0207 0.0017 013 0.9483 0.020758 0.002442 0.0266 0.0019 014 0.9369 0.024068 0.002832 0.0336 0.0026 015–34 0.826875 0.025164 0.002961 0.035625 0.109375 035–54 0.635 0.025164 0.002961 0.1525 0.165625 0.0187555–74 0.33375 0.016776 0.001974 0.21625 0.31875 0.112575 0.131875 0.01398 0.001645 0.19 0.440625 0.221875
Table 4 Six-monthly transition probabilities by age
AgeEnamel decay
to fillingDentine decay
to filling
0 0.004337 0.0032611 0.008673 0.0065212 0.01301 0.0097823 0.017347 0.013042
45 0.199485 0.149984100 0.438 0.329312
In any given Markov cycle, a 45-year old patient in the Enamel decay health state will progressto the Filling health state. This does not equate to a 0.199 probability that a 45-year oldpatient will receive a filling within 6 months of the onset of enamel decay.
754 Warren et al.

in Table 6, resulting in a cost of $275.03 per visit. Units costsincluded in this analysis are based on average charge data forthese services on dental claims paid by MBF for services incurredin 2007. Thus, the unit cost is the charge by the dental practi-tioner for the service, part or all of which may be reimburseddirectly to the dental practitioner by the health insurer (MBF)where the patient has the appropriate level of private healthinsurance cover. The remainder will be borne by the patient as amember out of pocket expense.
Although the protocol for the CMS suggests more frequentvisits than currently performed in standard practice, the 2-year[29] and 3-year results of the clinical trial suggest that the meannumber of visits was similar between groups (Table 2). In the2-year results of the CMS clinical trial, the mean number of visitswas 0.82 per 6-month period [29]. Thus, the 6-monthly cost ofmonitoring caries activity in the CMS arm was estimated to be$226.88 per patient. In the model, the cost of monitoring cariesactivity in the CMS arm is assumed to be the same as thestandard care arm after 20 years (40 6-monthly cycles). In thestandard care arm, it was assumed that patients receive oneplaque assessment and fluoride application per visit, and onedouble bitewing radiographic survey per year (Table 6). Thesix-monthly cost of monitoring caries activity in the standardcare arm was estimated to be $106.00 per patient.
One-Off Costs Associated with OperativeDental InterventionsMBF claims data from 2007 was also used to determine theaverage unit cost of different dental interventions (such as fillings,
root canals, etc.). The average unit cost of each treatment wasestimated as a weighted average of the charge for each ADA codeand the number of events of that ADA code that occurred(Table 7).
Both costs and outcomes accrued after year 1, have beendiscounted at 5%, and all costs are presented in Australiandollars (AUD$ 2007, AUD$1 = USD$0.80). The perspective ofthis analysis is from the private dental practitioner view, and assuch, no indirect or societal costs have been incorporated in themodel at this time.
Cost-Effectiveness ResultsThe trial-based economic evaluation assessed the cost-effectiveness of the CMS versus standard care based on theincidence of dental caries and incremental efficacy data takendirectly from the clinical trial. At 2 years, the incremental costper DMFT avoided is estimated to be $539.17, increasing to$694.47 at 3 years (Table 8).
The modeled analysis estimates the cost-effectiveness of theCMS versus standard care after adjusting the baseline incidence ofcaries to that of the Australian population. Over the 2-year period,the discounted change in DMFT generated in the model was 2.64in the CMS group and 2.92 in the standard care group (Table 8).This increased to 3.65 in the CMS group and 4.12 in the standardcare group over the 3-year period. Over the 2-year period, thediscounted cost per patient was estimated to be $836.83 in theCMS group and $476.45 in the standard care group. Thus, overthe 2-year period, the additional cost per DMFT avoided is
Table 5 Six-monthly transition probability stratified by tooth ID number
16 17 26 27 36 37 46 47
Probability of repeat filling 0.013147 0.009632 0.013002 0.011034 0.014103 0.009117 0.013248 0.008902Probability of root canal 0.006943 0.003061 0.008066 0.003717 0.006601 0.004929 0.006201 0.004893Probability of crown 0.002688 0.002949 0.003886 0.001624 0.003751 0.002457 0.004600 0.002785Probability of extraction from repeat filling 0.000344 0.000429 0.000389 0.000420 0.000323 0.000309 0.000250 0.000333Probability of extraction from root canal 0.002045 0.005065 0.003911 0.001991 0.000971 0.001089 0.017509 0.003816Probability of extraction from crown 0.000311 0.000811 0.009022 0.002532 0.000508 0.001328 0.000433 0.000483Probability of bridge 0.000169 0.0000154 0.0001159 0.0000240 0.0003660 0.0000459 0.0001684 0.0000878Probability of implant 0.000058 0.000013 0.000102 0.000013 0.000107 0.000040 0.000103 0.000031
Australian Dental Association codes used to represent treatment: Filling/repeat filling: 511, 512, 513, 514, 515, 521, 522, 523, 524, 525, 531, 532, 533, 534, 535, 551, 552, 553, 554, 555. Root Canal:415, 416, 417, 418. Crown: 613, 615, 618. Bridge: 642, 643. Extraction: 311, 314, 322. Implant: 661.
Table 6 Per visit cost of monitoring caries activity (in 2007 Australian Dollars)
Numberper visit
ADAcode
AverageMBF charge
Total costper visit
Total cost per visit for patients in the CMS armDiet assessment 1 131 $16.61 $16.61Plaque assessment 1 141 $21.54 $21.54Bitewing radiographic survey 2 022 $32.66 $65.32Caries risk assessment 1 047 $25.85 $25.85Oral hygiene coaching 1 111 $43.72 $43.72Professional fluoride application 1 121 $25.82 $25.82Home fluoride application 1 122 $34.63 $34.63Periodic oral examination 1 012 $41.54 $41.54
$275.03Total cost per visit for patients in the standard care arm
Plaque assessment 1 141 $21.54 $21.54Bitewing radiographic survey 1.2* 022 $32.66 $39.59Professional fluoride application 1 121 $25.82 $25.82Periodic oral examination 1 012 $41.54 $41.54
$128.49
*Assumes one double bitewing radiographic survey per year.ADA,Australian Dental Association; CMS, Caries Management System; MBF, Medical Benefits Fund.
The Caries Management System 755

estimated to be $1287.07. The additional cost per DMFT avoideddecreased to $1148.91 over the 3-year period.
Over the lifetime period, the discounted change in DMFTscore generated in the model was 8.74 in the CMS group and9.62 in the standard care group and the discounted cost perpatient was estimated to be $6479.51 in the CMS group and$4899.86 in the standard care group. Thus, the cost-effectivenessof the CMS decreases when the time horizon of the model isextended to the lifetime of the patient to $1795.06.
Figure 2 illustrates the cost-effectiveness scatter plot over thelifetime horizon, showing the individual cost and effectivenesspairs for each of the 10,000 patients simulated in the model. Thevast majority (97.3%) of the 10,000 simulations generate anincremental cost and effectiveness pair in the north east quad-rant, representing a situation in which the CMS is both morecostly and more effective (at avoiding an increment in DMFT)than the standard care group. In addition, 2.4% of the simulatedpatients generate a cost and effectiveness pair in the south eastquadrant, representing a situation in which the CMS is less costlybut more effective than standard care. However, it should benoted that 0.02% of the simulated patients fall in the north westquadrant, representing a situation in which the CMS is morecostly but less effective than standard care.
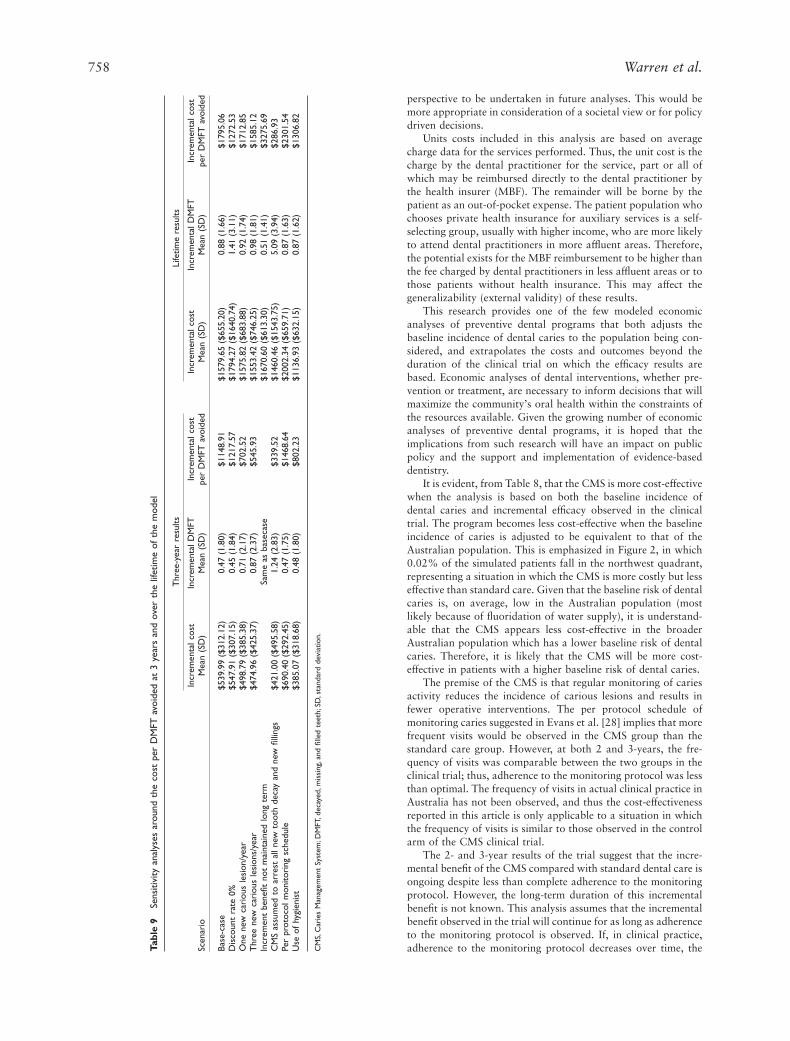
Sensitivity AnalysesThe results of one-way sensitivity analyses are shown in Table 9.In the base-case analysis reported in Table 8, the underlying risk
of dental caries is low (assuming 0.33 new lesions per year). Themodeled rate of caries is similar to that assumed in Bader et al.[35] for low-risk patients. The risk assessment proposed by Badercategorizes medium risk as development of at least one newcarious lesion per year while patients categorized as high riskwould develop at least three new carious lesions per year. Assum-ing the risk of caries is increased to represent one new cariouslesion per year, the incremental cost per DMFT avoided decreasesto $702.52 over the 3-year period and $1712.85 over the lifetimeperiod. If the risk of new caries is increased further to threelesions per year, the incremental cost per DMFT avoideddecreases to $545.93 and $1585.12 over the lifetime period.
The results of the trial suggest that the incremental benefit ofthe CMS compared with standard dental care is maintained overthat trial period despite less than complete adherence to themonitoring protocol. However, no data exists to validatewhether the increment benefit is maintained long-term. A sensi-tivity analysis assumes that the level of adherence and thus theincremental effectiveness of the CMS decrease over time. In theanalysis, the incremental effectiveness of the CMS as observed inthe trial is maintained for 5 years. After that time, the incremen-tal effectiveness is assumed to decrease linearly such that there isno additional benefit over the control arm at year 20 (i.e., after20 years, the incidence of caries and operative interventions forpatients in the CMS will be the same as that of the standard caregroup). This scenario will not affect the 2- and 3-year cost-effectiveness results; only the lifetime results will be affected. Inthis situation, the incremental cost per DMFT avoided increasesto $3275.69 over the lifetime horizon.
Axelsson [38] showed that the effectiveness of the preventiveprogram can be maintained indefinitely if adherence to the pro-gram’s monitoring protocol is high. The results presented byAxelsson suggest that it is possible to fully arrest the developmentof new lesions if high adherence to the program is achieved. Asensitivity analysis assumes that the CMS is able to fully arrestthe development of new lesions and new fillings for as long as thecosts associated with the CMS protocol are incurred. In thisoptimistic scenario, the incremental cost-effectiveness ratiodecreases to $339.52 per DMFT avoided over the 3-year periodand $286.93 over the lifetime period.
The protocol for the CMS suggests more frequent visits thancurrently performed in standard practice. However, the 2-yearand 3-year results of the clinical trial suggest that the meannumber of visits was similar between groups ([29] and Table 2).
Table 7 Unit cost of dental interventions applied as patient enter thehealth state (in 2007 Australian dollars)
Intervention ADA codes included in weighted cost Unit cost*
Filling (and repeatfilling)
511, 512, 513, 514, 515, 521, 522, 523,524, 525, 531, 532, 533, 534, 535, 551,552, 553, 554, 555
$150.51
Root canal 415, 416, 417, 418 and 022 ¥ 2 $743.31Crown 613, 615, 618 $1253.91Bridge† 642, 643 and 613, 615, 618 $2203.93Extraction 311, 314, 322 $136.96Implant 661 and 671 and 679 and 688 $4403.82
*Weighted MBF charge based on respective utilization of individual ADA codes.†Assumes one crown.ADA,Australian Dental Association; MBF, Medical Benefits Funds.
Table 8 Discounted cost per DMFT avoided (trial-based and modeled)
SC CMSIncremental(SC—CMS)
Incremental costper DMFT avoided
Trial-based 2-year resultCost $615.15 $1024.92 $409.77DMFT increment from baseline 1.9 1.2 0.7 $539.17
Trial-based 3-year resultCost $1061.94 $1693.91 $631.96DMFT increment from baseline 3.9 3.0 0.9 $694.47
Modeled 2-year resultCost $476.45 $836.83 $360.38DMFT increment from baseline 2.92 2.64 0.28 $1287.07
Modeled 3-year resultCost $758.97 $1298.96 $539.99DMFT increment from baseline 4.12 3.65 0.47 $1148.91
Modeled lifetime resultCost $4899.86 $6479.51 $1579.65DMFT increment from baseline 9.62 8.74 0.88 $1795.06
Incremental cost per DMFT avoided = incremental cost/incremental DMFT score.CMS, Caries Management System; DMFT, decayed, missing, and filled teeth; SC, standard care.
756 Warren et al.

Thus, in the base-case, it was assumed that the mean number ofvisits was similar between groups. A sensitivity analysis assumesthat the monitoring schedule in the CMS group is the same aswas reported in the protocol [28]. At baseline, 65%, 9%, and26% of the patients in the CMS clinical trial were classified aslow, medium, and high risk [29]. In the analysis, it is assumedthat the frequency of visits for low risk, medium-risk and high-risk patients is every 18, 6, and 3 months, respectively. In thisscenario, the incremental cost-effectiveness ratio increases to$1468.64 per DMFT avoided over the 3-year period and$2301.54 over the lifetime period.
When estimating the cost associated with monitoring cariesactivity in the base-case analysis, it is assumed that all services areperformed by a dentist. In some circumstances, these servicescould perhaps be performed by a dental hygienist or therapist.Accordingly, the cost of monitoring caries activity would belower in both the CMS and control groups. However, the costs ofdental interventions such as fillings remain the same as in thebase-case, as these events would most likely be performed by adentist. Given the relatively low cost associated with monitoringdental caries compared with the high cost of restorative dentaltreatment, it is reasonable that the cost-effectiveness of a preven-tive dental program would be sensitive to this variable. Assumingthe hourly labor cost of a hygienist to be 0.75 times that of adentist (a conservative figure), the 6-monthly cost of monitoringcaries activity in the CMS and control arms decreases to $170.16and $79.50 per patient, respectively. In this scenario, the incre-mental cost-effectiveness ratio decreases to $802.23 per DMFTavoided over the 3-year period and $1306.82 over the lifetimeperiod.
Probabilistic sensitivity analysis is required to address theuncertainty in cost-effectiveness models. In cohort models, thecomputational requirements associated with probabilistic sensi-tivity analysis are manageable (between 1000–10,000 runs usingMonte Carlo sampling methods to allow the uncertain param-eters to vary across their plausible ranges). However, in patient-level simulation models, at least 10,000 patients are modeled inorder to obtain a reasonable estimate of the mean value of theincremental cost-effectiveness ratio. Therefore, in order to gen-erate a cost-effectiveness acceptability curve, a total of at least10,000,000 individual simulations are required in a model suchas reported here. Given the extensive number of transitionsallowed in this model within the eight independent Markov
subgroups, the computational requirements have prevented theviability of performing probabilistic sensitivity analysis.
Model ValidityThe model was externally validated by comparing the 3-yearresults generated in the model with the 3-year results observed inthe CMS clinical trial. Over the 3-year period, the discountedincremental DMFT generated from the model was 3.65 in theCMS arm and 4.12 in the standard care arm (Table 8). Theseestimates of the DMFT increment at 3 years are similar to thoseobserved in the CMS clinical trial (3.26 in the CMS arm vs. 4.22in the control arm, Table 2). The model is reasonably accurate atpredicting the DMFT increment in the standard care group (4.12in the model vs. 4.22 observed at 3 years in the trial). However,the model is overestimating the change in DMFT from baselinefor the CMS group at 3 years (3.65 in the model vs. 3.26observed at 3 years in the trial). When reporting the 3-yearDMFT increment for both groups, the results presented inTable 2 included the extraction component (represented by M) inthe analysis. However, because the observed difference in extrac-tions between the two groups was not statistically significantover the 3-year period of the trial, the model assumed that therate of extractions is similar between the two groups. This mod-eling assumption leads to an underestimation of the incrementalbenefit of the CMS when compared with standard care.
Discussion
A key consideration in any economic analysis is the perspectivefrom which the study is undertaken. We constructed a decision tomodel the results of the CMS within private dental practicebecause this is the predominant mode of providing dental ser-vices in Australia. This should improve the generalizability of ourfindings. Although the results are generalizable, it is not knownwhether the findings of this research will impact dental practicein Australia. It could be argued that many treatment decisionsundertaken within private dental practice are more likely to bebased on a patient’s willingness to pay than on cost-effectiveness,given that a private dental practice is in effect a small business.Further work is planned to capture some of the indirect costsassociated with dental treatment, perhaps allowing a societal
Figure 2 Incremental cost-effectiveness scatterplot over the lifetime of the patient.DMFT,decayed,missing, and filled teeth.
The Caries Management System 757
perspective to be undertaken in future analyses. This would bemore appropriate in consideration of a societal view or for policydriven decisions.
Units costs included in this analysis are based on averagecharge data for the services performed. Thus, the unit cost is thecharge by the dental practitioner for the service, part or all ofwhich may be reimbursed directly to the dental practitioner bythe health insurer (MBF). The remainder will be borne by thepatient as an out-of-pocket expense. The patient population whochooses private health insurance for auxiliary services is a self-selecting group, usually with higher income, who are more likelyto attend dental practitioners in more affluent areas. Therefore,the potential exists for the MBF reimbursement to be higher thanthe fee charged by dental practitioners in less affluent areas or tothose patients without health insurance. This may affect thegeneralizability (external validity) of these results.
This research provides one of the few modeled economicanalyses of preventive dental programs that both adjusts thebaseline incidence of dental caries to the population being con-sidered, and extrapolates the costs and outcomes beyond theduration of the clinical trial on which the efficacy results arebased. Economic analyses of dental interventions, whether pre-vention or treatment, are necessary to inform decisions that willmaximize the community’s oral health within the constraints ofthe resources available. Given the growing number of economicanalyses of preventive dental programs, it is hoped that theimplications from such research will have an impact on publicpolicy and the support and implementation of evidence-baseddentistry.
It is evident, from Table 8, that the CMS is more cost-effectivewhen the analysis is based on both the baseline incidence ofdental caries and incremental efficacy observed in the clinicaltrial. The program becomes less cost-effective when the baselineincidence of caries is adjusted to be equivalent to that of theAustralian population. This is emphasized in Figure 2, in which0.02% of the simulated patients fall in the northwest quadrant,representing a situation in which the CMS is more costly but lesseffective than standard care. Given that the baseline risk of dentalcaries is, on average, low in the Australian population (mostlikely because of fluoridation of water supply), it is understand-able that the CMS appears less cost-effective in the broaderAustralian population which has a lower baseline risk of dentalcaries. Therefore, it is likely that the CMS will be more cost-effective in patients with a higher baseline risk of dental caries.
The premise of the CMS is that regular monitoring of cariesactivity reduces the incidence of carious lesions and results infewer operative interventions. The per protocol schedule ofmonitoring caries suggested in Evans et al. [28] implies that morefrequent visits would be observed in the CMS group than thestandard care group. However, at both 2 and 3-years, the fre-quency of visits was comparable between the two groups in theclinical trial; thus, adherence to the monitoring protocol was lessthan optimal. The frequency of visits in actual clinical practice inAustralia has not been observed, and thus the cost-effectivenessreported in this article is only applicable to a situation in whichthe frequency of visits is similar to those observed in the controlarm of the CMS clinical trial.
The 2- and 3-year results of the trial suggest that the incre-mental benefit of the CMS compared with standard dental care isongoing despite less than complete adherence to the monitoringprotocol. However, the long-term duration of this incrementalbenefit is not known. This analysis assumes that the incrementalbenefit observed in the trial will continue for as long as adherenceto the monitoring protocol is observed. If, in clinical practice,adherence to the monitoring protocol decreases over time, theTa
ble
9Se
nsiti
vity
anal
yses
arou
ndth
eco
stpe
rD
MFT
avoi
ded
at3
year
san
dov
erth
elif
etim
eof
the
mod
el
Scen
ario
Thr
ee-y
ear
resu
ltsLi
fetim
ere
sults
Incr
emen
talc
ost
Incr
emen
talD
MFT
Incr
emen
talc
ost
per
DM
FTav
oide
dIn
crem
enta
lcos
tIn
crem
enta
lDM
FTIn
crem
enta
lcos
tpe
rD
MFT
avoi
ded
Mea
n(S
D)
Mea
n(S
D)
Mea
n(S
D)
Mea
n(S
D)
Base
-cas
e$5
39.9
9($
312.
12)
0.47
(1.8
0)$1
148.
91$1
579.
65($
655.
20)
0.88
(1.6
6)$1
795.
06D
isco
unt
rate
0%$5
47.9
1($
307.
15)
0.45
(1.8
4)$1
217.
57$1
794.
27($
1640
.74)
1.41
(3.1
1)$1
272.
53O
nene
wca
riou
sle
sion
/yea
r$4
98.7
9($
385.
38)
0.71
(2.1
7)$7
02.5
2$1
575.
82($
683.
88)
0.92
(1.7
4)$1
712.
85T
hree
new
cari
ous
lesi
ons/
year
$474
.96
($42
5.37
)0.
87(2
.37)
$545
.93
$155
3.42
($74
6.25
)0.
98(1
.81)
$158
5.12
Incr
emen
tbe
nefit
not
mai
ntai
ned
long
term
Sam
eas
base
case
$167
0.60
($61
3.30
)0.
51(1
.41)
$327
5.69
CM
Sas
sum
edto
arre
stal
lnew
toot
hde
cay
and
new
fillin
gs$4
21.0
0($
495.
58)
1.24
(2.8
3)$3
39.5
2$1
460.
46($
1543
.75)
5.09
(3.9
4)$2
86.9
3Pe
rpr
otoc
olm
onito
ring
sche
dule
$690
.40
($29
2.45
)0.
47(1
.75)
$146
8.64
$200
2.34
($65
9.71
)0.
87(1
.63)
$230
1.54
Use
ofhy
gien
ist
$385
.07
($31
8.68
)0.
48(1
.80)
$802
.23
$113
6.93
($63
2.15
)0.
87(1
.62)
$130
6.82
CM
S,C
arie
sM
anag
emen
tSy
stem
;DM
FT,d
ecay
ed,m
issi
ng,a
ndfil
led
teet
h;SD
,sta
ndar
dde
viat
ion.
758 Warren et al.
model will overestimate the long-term cost-effectiveness of theCMS compared with standard dental care, although the 2 and3-year cost-effectiveness ratios will not be affected. Only longer-term follow-up will determine the validity of this assumption.
The main limitation of this research is that only specifictransitions are allowed in the model; whereas, in reality, patientscan move from one health state to any other health state.However, given the extensive data requirements needed to popu-late a model that allows all possible transitions, the authors havelimited the model to the key transitions that are most likely to beaffected by the implementation of the CMS.
Each of the eight molars was modeled independently as asemi-Markov process. However, there is likely to be high corre-lation between the eight models given that it is not likely that onetooth will have dentine decay and the other seven will have “nodisease.” Moreover, the benefits of the CMS are likely to affect allteeth equally. Therefore, a simpler modeling approach would beto assume perfect correlation between the eight molars andreduce the model to one Markov process that models the costsand outcomes for all eight molars. However, published evidence(confirmed by MBF data in Table 5) suggests that lower molarsare more susceptible to decay than upper molars, and patients aremore effective at brushing one side of their mouth [41,42]. Thus,the authors thought it would be appropriate to model each of theeight molars independently to reflect this concept, even thoughthis additional complexity inhibits the ability to perform proba-bilistic sensitivity analysis without using a Gaussian process.
The other key limitation of the analysis relates to the use ofthe composite outcome (DMFT) as the measure of effectiveness.The DMFT is a standard composite measure when assessingdental interventions. However, one limitation of this compositemeasure is that each individual event is valued equally (i.e., thedevelopment of a one-surface lesion has the same impact on thetotal DMFT score as a missing tooth). The authors acknowledgethat an alternative approach would be to use the more sensitiveDMFS score in which a missing tooth counts as an increase of 5points (compared with, for example, dentine decay which mightcount as an increase of 2 points in the DMFS score). However, alldata relating to costs and transition probabilities are at the toothlevel rather than the surface level.
There are no comparable analyses with which to compare ourcost-effectiveness results as previous work has concentrated onchild populations within the school or public care setting. Theanalysis most similar to that reported here is that of Crowleyet al. [11] which assessed cost per DMFS. However, the study byCrowley et al. assessed the cost-effectiveness of a school-basedprevention program in nonfluoridated areas of Australia, and didnot include all costs associated with monitoring dental caries inprivate practice. It is likely that patients in nonfluoridated areashave a higher risk of developing dental caries, thus rendering anyeconomic evaluation performed on that population more cost-effective than an analysis performed on the entire Australianpopulation. Two other economic analyses [20,21] report cost-effectiveness in terms of incremental cost per cavity-free month.Meaningful comparisons between published economic analysesof dental interventions are difficult, suggesting that dentistry isundertaking a range of interventions without considering thecost-effectiveness of these interventions. However, it is possible toperform a comparison of the clinical benefits to the differentdental programs. In the study by Morgan et al. [17], the 3-yearDMFS increment was 2.35 in the control group and 1.12 in theintervention group (Table 3 [17]), resulting in a difference inDMFS increment of 1.23. In comparison, the 2-year DMFSgroup increments in this study were 5.4 in the standard caregroup and 3.2 in the CMS group, resulting in differential DMFS
of 2.3 in favor of the CMS [29]. Note that our incremental groupscores are higher, as we treated repeat fillings as incremental tothe DMFT score.
Whether or not the incremental cost-effectiveness ratios pro-duced are acceptable or not is beyond the scope of this work.However, unlike economic analyses of health-care interventionswhich are guided by informal cost per quality-adjusted life year(QALY) thresholds representing acceptable cost-effectiveness(approximately £30,000 and $50,000 per QALY gained in theUK and Australia, respectively), no such thresholds exist in theassessment of dental programs or treatments. The authorsacknowledge that it is difficult to compare the relative value formoney of dental interventions (which are assessed in terms ofcost per DMFT avoided) with other health-care interventionsthat use the standard cost per QALY measure. Such an issue willmost likely only be addressed via a willingness-to-pay study todetermine the utility associated with fewer dental caries andfewer resulting dental interventions. However, Anderson [43]estimated that the lifetime economic impact of a probably avoid-able filling was AUD$3300 in 2008 (converted from USD$1800in 1997). If we accept such a threshold, it appears from ouranalysis that the CMS is marginally cost-effective for low riskpatients and probably cost-effective for patients who present onaverage with greater than one new lesion per year.
Conclusions
The cost effectiveness of the CMS is highly dependant on baselinerisk of caries (and the projected event rate as a result). Whencompared with standard dental practice in Australia, the CMS ismost cost-effective in patients who have a high underlying inci-dence of developing dental caries. The CMS is unlikely to becost-effective in patients with a low risk of developing dentalcaries unless the costs associated with the program can be con-strained (for example, by assuming that the monitoring of cariesactivity is performed by a dental hygienist rather than a dentist).
The model appears to be reasonably accurate at predictingoutcomes (i.e., the incremental DMFT at 3 years generated in themodel is similar to that observed in the trial). Given that adher-ence to the protocol was less than optimal in the CMS clinicaltrial, the CMS was not completely effective at preventing anyincrement in DMFT score. However, any actions to improveadherence to the monitoring protocol would increase the incre-mental benefit of the CMS and thus the render the program morecost-effective.
Acknowledgments
This research has received funding from the Oral Health Foun-dation, NHMRC (project grant 402466), The Dental Board ofNSW, and the Australian Dental Research Foundation. Thesupport of the Australian Dental Association (NSW), Colgate,Australian Healthcare Management, GC (Australia), and MBF(Australia) is gratefully acknowledged.
Source of financial support: This research has received funding from theOral Health Foundation, NHMRC (project grant 402466), The DentalBoard of NSW, and the Australian Dental Research Foundation.
References
1 Rindal DB, Rush WA, Boyle RG. Clinical inertia in dentistry: areview of the phenomenon. J Contemp Dent Pract 2008;1:113–21.
The Caries Management System 759

2 Bader J, Shugars D. The evidence supporting alternative manage-ment strategies for early occlusal caries and suspected occlusaldentinal caries. J Evid Based Dent Pract 2006;1:91–100.
3 Ismail AI, Bader JD. Evidence-based dentistry in clinical practice.J Am Dent Assoc 2004;135:78–83.
4 Tan PL, Evans RW, Morgan MV. Caries, bitewings, and treat-ment decisions. Aust Dent J 2002;47:138–41.
5 Grondahl HG, Andersson B, Tortensson T. Caries increment andprogression in teenagers when using a prevention-rather thanrestoration-oriented treatment strategy. Swed Dent J 1984;8:237–42.
6 Brennan DS, Spencer AJ. Factors influencing choice of dentaltreatment by private general practitioners. Int J Behav Med2002;9:94–110.
7 Fejerskov O. Concepts of dental caries and the consequences forunderstanding the disease. Community Dent Oral Epidemiol1997;25:5–12.
8 Arrow P. Cost minimisation analysis of two occlusal caries pre-ventive programmes. Community Dent Oral Epidemiol 2000;17:85–91.
9 Bhuridej P, Kuthy RA, Flach SD, et al. Four-year cost-utilityanalyses of sealed and non-sealed first permanent molars in IowaMedicaid-enrolled children. J Public Health Dent 2007;67:191–8.
10 Birch S. The relative cost effectiveness of water fluoridation acrosscommunities: analysis of variations according to underlying carieslevels. Community Dent Health 1990;7:3–10.
11 Crowley SJ, Campain AC, Morgan MV. An economic evaluationof a publicly funded dental prevention programme in regional andrural Victoria: an extrapolated analysis. Community Dent Health2000;17:145–51.
12 Davies GM, Worthington HV, Ellwood RP, et al. An assessmentof the cost effectiveness of a postal toothpaste programme toprevent caries among five-year-old children in the North West ofEngland. Community Dent Health 2003;20:207–10.
13 Donaldson C, Forbes JF, Smalls M, et al. Preventive dentistry in ahealth centre: effectiveness and cost. Soc Sci Med 1986;23:861–8.
14 Kelly PG, Smales RJ. Long-term cost-effectiveness of single indi-rect restorations in selected dental practices. Br Dent J2004;196:639–943.
15 Manau C, Cuenca E, Martinez-Carretero J, Salleras L. Economicevaluation of community programs for the prevention of dentalcaries in Catalonia, Spain. Community Dent Oral Epidemiol1987;15:297–300.
16 Marino R, Morgan M, Weitz A, Villa A. The cost-effectiveness ofadding fluorides to milk-products distributed by the NationalFood Supplement Programme (PNAC) in rural areas of Chile.Community Dent Health 2007;24:75–81.
17 Morgan MV, Crowley SJ, Wright C. Economic evaluation of a pitand fissure dental sealant and fluoride mouthrinsing program intwo non-fluoridated regions of Victoria, Australia. J PublicHealth Dent 1998;58:19–27.
18 Morgan MV, Campain AC, Crowley SJ, Wright FA. An evalua-tion of a primary preventive dental programme in non-fluoridatedareas of Victoria, Australia. Aust Dent J 1997;42:381–8.
19 Oscarson N, Kallestal C, Fjelddahl A, Lindholm L. Cost-effectiveness of different caries preventive measures in a high-riskpopulation of Swedish adolescents. Community Dent Oral Epi-demiol 2003;31:169–78.
20 Quinonez RB, Downs SM, Shugars D, et al. Assessing cost-effectiveness of sealant placement in children. J Public HealthDent 2005;65:82–9.
21 Quinonez RB, Stearns SC, Talekar BS, et al. Simulating cost-effectiveness of fluoride varnish during well-child visits forMedicaid-enrolled children. Arch Pediatr Adolesc Med 2006;160:164–70.
22 Ramos-Gomez FJ, Shepard DS. Cost-effectiveness model for pre-vention of early childhood caries. J Calif Dent Assoc 1999;27:539–44.
23 Splieth CH, Fleba S. Modelling lifelong costs of caries with andwithout fluoride use. Eur J Oral Sci 2008;116:164–9.
24 Widenheim J, Birkhed D. Caries-preventive effect on primary andpermanent teeth and cost-effectiveness of an NaF tablet preschoolprogram. Community Dent Oral Epidemiol 1991;19:88–92.
25 Australian Institute of Health and Welfare. Australia’s DentalGenerations. AIHW Cat No. DEN 165. Canberra: AIHW, 2007.
26 Burt BA, Eklund SA. Dentistry, Dental Practice, and the Commu-nity (5th ed.). Philadelphia: WB Saunders Company, 1999.
27 Mejare I, Kallestal C, Stenlund H, Johansson H. Caries develop-ment from 11 to 22 years of age: a prospective radiographicstudy. Caries Res 1998;32:10–16.
28 Evans RW, Pakdaman A, Dennison PJ, Howe ELC. The cariesmanagement system—an evidence-based preventive strategy fordental practitioners. Application for adults. Aust Dent J 2008;53:83–92.
29 Curtis BH, Evans RW, Sbaraini A, Schwarz E. The MonitorPractice Program: is non-invasive management of dental caries inprivate practice effective? Aust Dent J 2008;53:306–13.
30 Curtis BH, Evans RW, Sbaraini A, Schwarz E. Recruitment andstandardization of a group of Australian dentists for a multiprac-tice study on dental caries prevention. Aust Dent J 2007;52:106–11.
31 Briggs A, Sculpher M, Claxton K. Decision Modelling forHealth Economic Evaluation. Oxford: Oxford University Press,2006.
32 Australian Bureau of Statistics Website. Population by age andsex. Available from: http://www.abs.gov.au/ausstats/[email protected]/mf/3201.0 [Accessed November 19, 2009].
33 AIHW (Australian Institute of Health and Welfare). Australia’sdental generations, The National Survey of Adult Oral Health2004–06. 2007.
34 Arrow P. Incidence and progression of approximal carious lesionsamong school children in Western Australia. Aust Dent J2007;52:216–26.
35 Bader JD, Perrin NA, Maupomé G, et al. Validation of a simpleapproach to caries risk assessment. J Public Health Dent2005;65:76–81.
36 AIHW (Australian Institute of Health and Welfare). Dental Sta-tistics and Research Unit, Oral Health of Adult Public DentalPatients, DSUR Research Report no 36. 2008.
37 Australian Bureau of Statistics Website. Life tables by age and sex.Available from: http://www.abs.gov.au/AUSSTATS/[email protected]/Lookup/3302.0.55.001Main+Features12005–2007 [AccessedNovember 19, 2009].
38 Axelsson P, Nystrom B, Lindhe J. The long-term effect of a plaquecontrol program on tooth mortality, caries, and periodontaldisease in adults. Results after 30 years of maintenance. J ClinPeriodontol 2004;31:749–57.
39 Evans RW, Hsiau ACY, Dennison PJ, Jalaludin B. Water fluori-dation in the Blue Mountains reduces risk of tooth decay. AustDent J 2009;54:368–73.
40 Simonsen RJ. Retention and effectiveness of dental sealants after15 years. J Am Dent Assoc 1991;22:34–42.
41 Hujoel PP, Lamont RJ, DeRouen TA, et al. Within-subjectcoronal caries distribution patterns: an evaluation of randomnesswith respect to the midline. J Dent Res 1994;73:1575–80.
42 Burnside G, Pine CM, Williamson PR. The application of multi-level modeling to dental carries data. Stat Med 2007;26:4139–49.
43 Anderson MH. Current concepts of dental caries and its preven-tion. Oper Dent Suppl 2001;6:11–18.
760 Warren et al.
Copyright © 2022 FDOKUMEN