Modeling spatial decisions with graph theory: logging roads and forest fragmentation in the...
16
Ecological Applications, 23(1), 2013, pp. 239–254 Ó 2013 by the Ecological Society of America Modeling spatial decisions with graph theory: logging roads and forest fragmentation in the Brazilian Amazon ROBERT WALKER, 1,2,8 EUGENIO ARIMA, 3 JOE MESSINA, 1 BRITALDO SOARES-FILHO, 4 STEPHEN PERZ, 5 DANTE VERGARA, 6 MARCIO SALES, 7 RITAUMARIA PEREIRA, 1 AND WILLIAMS CASTRO 1 1 Department of Geography, Michigan State University, 116 Geography Building, East Lansing, Michigan 48823 USA 2 Nu ´cleo de Meio Ambiente, Univesidade Federal do Para ´, Rua Augusto Corr ˆ ea, 01–Cidade Universita ´ria, Bairro Guama ´, CEP66075-900, Bele ´m, Brazil 3 Department of Geography and the Environment, University of Texas, GRG 334, Mailcode A3100, Austin, Texas 78712 USA 4 Centro de Sensoriamento Remoto, Avenida Ant ˆ onio Carlos, 6627, Belo Horizonte, MG, CEP 31270 900 Brazil 5 Department of Sociology and Criminology and Law, University of Florida, 3219 Turlington Hall, P.O. Box 117330, Gainesville, Florida 32611-7330 USA 6 School of Environmental Science and Management, University of the Philippines Los Ba ˜ nos College, Laguna 4031 Philippines 7 Instituto do Homem e Meio Ambiente da Amaz ˆ onia (IMAZON), Rua Domingos Marreiros, 2020–Fa ´tima, Bele ´m, Para ´, CEP 66.060-160 Brazil Abstract. This article addresses the spatial decision-making of loggers and implications for forest fragmentation in the Amazon basin. It provides a behavioral explanation for fragmentation by modeling how loggers build road networks, typically abandoned upon removal of hardwoods. Logging road networks provide access to land, and the settlers who take advantage of them clear fields and pastures that accentuate their spatial signatures. In shaping agricultural activities, these networks organize emergent patterns of forest fragmentation, even though the loggers move elsewhere. The goal of the article is to explicate how loggers shape their road networks, in order to theoretically explain an important type of forest fragmentation found in the Amazon basin, particularly in Brazil. This is accomplished by adapting graph theory to represent the spatial decision-making of loggers, and by implementing computational algorithms that build graphs interpretable as logging road networks. The economic behavior of loggers is conceptualized as a profit maximization problem, and translated into spatial decision-making by establishing a formal correspondence between mathematical graphs and road networks. New computational approaches, adapted from operations research, are used to construct graphs and simulate spatial decision-making as a function of discount rates, land tenure, and topographic constraints. The algorithms employed bracket a range of behavioral settings appropriate for areas of terras devolutas, public lands that have not been set aside for environmental protection, indigenous peoples, or colonization. The simulation target sites are located in or near so-called Terra do Meio, once a major logging frontier in the lower Amazon Basin. Simulation networks are compared to empirical ones identified by remote sensing and then used to draw inferences about factors influencing the spatial behavior of loggers. Results overall suggest that Amazonia’s logging road networks induce more fragmentation than necessary to access fixed quantities of wood. The paper concludes by considering implications of the approach and findings for Brazil’s move to a system of concession logging. Key words: Amazonia; forest fragmentation; graph theory; logging. INTRODUCTION Forest fragmentation has emerged as an important environmental issue in Amazonia, given the spatial pattern of deforestation can compromise ecological processes (e.g., Ferreira and Laurance 1997, Aldrich and Hamrick 1998, Laurance et al. 2000, Cochrane 2001). Despite substantial research addressing such consequences, less is known about fragmentation’s underlying drivers, although land change science has begun addressing the issue (e.g., Nagendra et al. 2004, Pan et al. 2004, Soares-Filho et al. 2004, Walsh et al. 2002, 2003). The present article contributes to our knowledge in this regard by gaining insights into the spatial decision-making of loggers with respect to the design and implementation of logging road networks. Such networks provide access to land, and the settlers who follow clear fields and pastures that consolidate the spatial signature of the roads. In this manner, logging roads organize the local pattern of forest fragments, even as loggers move on to new areas (Fig. 1). Research has linked roads to deforestation (e.g., Nelson and Hellerstein 1997, Soares-Filho et al. 2004, Manuscript received 6 October 2011; revised 13 July 2012; accepted 20 August 2012. Corresponding Editor: V. C. Radeloff. 8 E-mail: [email protected] 239
Transcript of Modeling spatial decisions with graph theory: logging roads and forest fragmentation in the...

Ecological Applications, 23(1), 2013, pp. 239–254� 2013 by the Ecological Society of America
Modeling spatial decisions with graph theory: logging roads andforest fragmentation in the Brazilian Amazon
ROBERT WALKER,1,2,8 EUGENIO ARIMA,3 JOE MESSINA,1 BRITALDO SOARES-FILHO,4 STEPHEN PERZ,5 DANTE VERGARA,6
MARCIO SALES,7 RITAUMARIA PEREIRA,1 AND WILLIAMS CASTRO1
1Department of Geography, Michigan State University, 116 Geography Building, East Lansing, Michigan 48823 USA2Nucleo de Meio Ambiente, Univesidade Federal do Para, Rua Augusto Correa, 01–Cidade Universitaria, Bairro Guama,
CEP66075-900, Belem, Brazil3Department of Geography and the Environment, University of Texas, GRG 334, Mailcode A3100, Austin, Texas 78712 USA
4Centro de Sensoriamento Remoto, Avenida Antonio Carlos, 6627, Belo Horizonte, MG, CEP 31270 900 Brazil5Department of Sociology and Criminology and Law, University of Florida, 3219 Turlington Hall, P.O. Box 117330,
Gainesville, Florida 32611-7330 USA6School of Environmental Science and Management, University of the Philippines Los Banos College, Laguna 4031 Philippines
7Instituto do Homem e Meio Ambiente da Amazonia (IMAZON), Rua Domingos Marreiros, 2020–Fatima, Belem, Para,CEP 66.060-160 Brazil
Abstract. This article addresses the spatial decision-making of loggers and implicationsfor forest fragmentation in the Amazon basin. It provides a behavioral explanation forfragmentation by modeling how loggers build road networks, typically abandoned uponremoval of hardwoods. Logging road networks provide access to land, and the settlers whotake advantage of them clear fields and pastures that accentuate their spatial signatures. Inshaping agricultural activities, these networks organize emergent patterns of forestfragmentation, even though the loggers move elsewhere. The goal of the article is to explicatehow loggers shape their road networks, in order to theoretically explain an important type offorest fragmentation found in the Amazon basin, particularly in Brazil. This is accomplishedby adapting graph theory to represent the spatial decision-making of loggers, and byimplementing computational algorithms that build graphs interpretable as logging roadnetworks. The economic behavior of loggers is conceptualized as a profit maximizationproblem, and translated into spatial decision-making by establishing a formal correspondencebetween mathematical graphs and road networks. New computational approaches, adaptedfrom operations research, are used to construct graphs and simulate spatial decision-makingas a function of discount rates, land tenure, and topographic constraints. The algorithmsemployed bracket a range of behavioral settings appropriate for areas of terras devolutas,public lands that have not been set aside for environmental protection, indigenous peoples, orcolonization. The simulation target sites are located in or near so-called Terra do Meio, once amajor logging frontier in the lower Amazon Basin. Simulation networks are compared toempirical ones identified by remote sensing and then used to draw inferences about factorsinfluencing the spatial behavior of loggers. Results overall suggest that Amazonia’s loggingroad networks induce more fragmentation than necessary to access fixed quantities of wood.The paper concludes by considering implications of the approach and findings for Brazil’smove to a system of concession logging.
Key words: Amazonia; forest fragmentation; graph theory; logging.
INTRODUCTION
Forest fragmentation has emerged as an important
environmental issue in Amazonia, given the spatial
pattern of deforestation can compromise ecological
processes (e.g., Ferreira and Laurance 1997, Aldrich
and Hamrick 1998, Laurance et al. 2000, Cochrane
2001). Despite substantial research addressing such
consequences, less is known about fragmentation’s
underlying drivers, although land change science has
begun addressing the issue (e.g., Nagendra et al. 2004,
Pan et al. 2004, Soares-Filho et al. 2004, Walsh et al.
2002, 2003). The present article contributes to our
knowledge in this regard by gaining insights into the
spatial decision-making of loggers with respect to the
design and implementation of logging road networks.
Such networks provide access to land, and the settlers
who follow clear fields and pastures that consolidate the
spatial signature of the roads. In this manner, logging
roads organize the local pattern of forest fragments,
even as loggers move on to new areas (Fig. 1).
Research has linked roads to deforestation (e.g.,
Nelson and Hellerstein 1997, Soares-Filho et al. 2004,
Manuscript received 6 October 2011; revised 13 July 2012;accepted 20 August 2012. Corresponding Editor: V. C.Radeloff.
8 E-mail: [email protected]
239

2006, Walker 2004), but the interest here resides in how
they structure landscapes, a critical aspect of their roadecology (Forman et al. 2002, Freitas et al. 2010). In
pursuing this interest, the article presents a computa-tional approach that simulates road network formationby translating the economic behavior of loggers into
spatial outcomes. The simulation of road networks hasoften focused on the minimization of road building costs
(e.g., Tomlin 1990, Soares-Filho et al. 2004, 2009, Jiang2007). Arima et al. (2005, 2008) build on this literature
for the Amazonian case by addressing harvest revenuesin addition to costs. Merry et al. (2009) also contributeto understanding Amazonian fragmentation processes
by modeling the formation of new logging centers,which are sensitive to revenues and created as a function
of proximity to older but defunct centers as well ascommercial wood.The present article moves beyond these recent
advances in three substantial ways. First, it provides aformal, graph theoretic statement of the economic
decisions that loggers make when they build roadnetworks to access tropical hardwoods. Second, it
develops a new computational approach to simulatingnetworks, which it uses together with existing spatialsoftware to study road building in an important
Amazonian frontier. Third, it subjects simulation resultsto performance assessment via inference. This enables
identification of a ‘‘best’’ model configuration, which isthen interpreted in light of the theoretical formulation togain insight into the human drivers of forest fragmen-
tation associated with the spatial behavior of loggers.Thus, the article provides a modeling approach with the
potential for management applications, as Brazil moves
to the concession system in harvesting its national
forests. Knowing how loggers design road networks isessential to finding policy levers that can minimize forest
fragmentation. Although simulation results are inter-preted in light of a formal statement of the behavior ofan economic agent, namely the logger, the computa-
tional approach is not ‘‘agent-based’’ as the modelingcommunity has come to understand the term (Parker et
al. 2003). Nor does it rely strictly on the identification ofleast-cost pathways, a functionality available in current
GIS software (Tomlin 1990, Jiang 2007). Rather, thesoftware builds on classical optimization algorithms inoperations research designed to identify networks that
achieve explicit goals, like profit maximization (Merry etal. 2009). By definition, profit maximization considers
revenues in addition to costs, which complicates botheconomic decision-making and simulation.The graph theory and computational algorithms
address logging road networks that produce ‘‘dendriticfragmentation,’’ so named for its visual similarity to the
trellis structure of stream hierarchies (Chorley andHaggett 1967, Arima et al. 2005). Dendritic fragmenta-
tion, quite similar in form to the independent settlementpattern of spontaneous colonization (Oliveira Filho andMetzger 2006), is observed in poorly monitored
indigenous areas and in terras devolutas, public landsthat have not been designated for specific uses or subject
to colonization programs (Treccani 2001). Dendriticlandscapes provide a sharp contrast with fishbonefragmentation, a pattern found in official settlements
(Oliveira Filho and Metzger 2006). Although loggerscollaborate with small-holders in extending the frontiers
of fishbone colonization (Perz et al. 2007), this orderly
FIG. 1. Road network as initial fragmentation template. Logging road networks provide access to land, and the settlers whofollow clear fields and pastures that consolidate the spatial signature of the roads.
ROBERT WALKER ET AL.240 Ecological ApplicationsVol. 23, No. 1

pattern is not likely to maximize profits given road
segments are constrained to be linear and they do not
necessarily lead to high revenue harvest sites (Arima et
al. 2005). Thus, the spatial outcome differs significantly
when loggers operate in isolation, or in advance of the
agricultural frontier. Then, their spatial decision-making
leads to dendritic fragmentation.
Dendritic fragmentation has impacted large parts of
the Amazon basin, such as the study area in so-called
Terra do Meio, an informal designation for a region of
;80 000 km2 in central Para State, Brazil (Pinto 2005;
Fig. 2). By way of comparison, the Altamira Polygon,
appropriated for colonization in the 1970s, and which
displays the lion’s share of the lower basin’s fishbone
fragmentation, covers 64 000 km2. Evidently, dendritic
and fishbone patterns of forest fragmentation occupy
similar extents across the reaches of the basin. Once a
major logging frontier, the Brazilian government placed
FIG. 2. Terra do Meio study area in Para State in the Brazilian Amazon Basin. The bottom panel shows the simulation sitesused in this study.
January 2013 241GRAPH THEORY AND SPATIAL DECISIONS
much of Terra do Meio under protection in 2004,
motivating the sector to migrate west (Merry et al.
2009). Prior to that, grileiros (land grabbers), loggers,
miners, and ranchers viewed the terras devolutas of
Terra do Meio as theirs for the taking (Pinto 2005).
Amerindians have long considered the region home,
particularly those belonging to Ge-speaking tribes, and
along the Xingu River over 30 000 km2 of indigenous
reserves have been demarcated for several groupings of
the Kayapo peoples (Robert 2010; see Plate 1). Terra do
Meio reveals a patchwork of vegetative covers including
open and closed tropical forest, and cerrado woodlands.
High concentrations of mahogany sustained a predatory
logging sector, with several (approximately five) large
companies dominating production from the mid 1980s
until ;2000, when they abandoned the region to smaller
operations ( personal communications, forest engineer in
Novo Progresso, 2009 and colonist in Sao Felix do
Xingu, 2011; Pinto [2005]). These include Maginco,
Perrachi, IMPAR, Pelegrino, Pau D’Arco, and Angelim
(Pinto 2005). The simulations to be presented address
road networks associated with large, well-capitalized
companies because they possess sufficient capital to
build roads.
GRAPH THEORY
Before proceeding to the methods and results sections,
it is necessary to discuss the article’s adaptation of graph
theory, which enables us to formally represent the
economics of spatial decision-making. Mathematical
graph theory possesses considerable potential for
ecological applications, given its explicit representation
of spatial phenomena such as connectivity (e.g., Rayfield
et al. 2011). For the present case, graphs function as the
conceptual link between economic behavior and spatial
outcomes. As indicated, a prime contribution of the
article resides in adapting mathematical graphs to reflect
both economic decisions and the empirics of wood
exploitation, within a spatial context. What mathema-
ticians call a complete graph may be represented as G(N,
E), with N ¼ n nodes and number of edges, E,
accounting for all possible combinations of n nodes
taken two at a time, or n!/2!(n� 2)! combinations (West
1996). A logging road network becomes a graph by
defining roads as edges and logging sites as nodes.
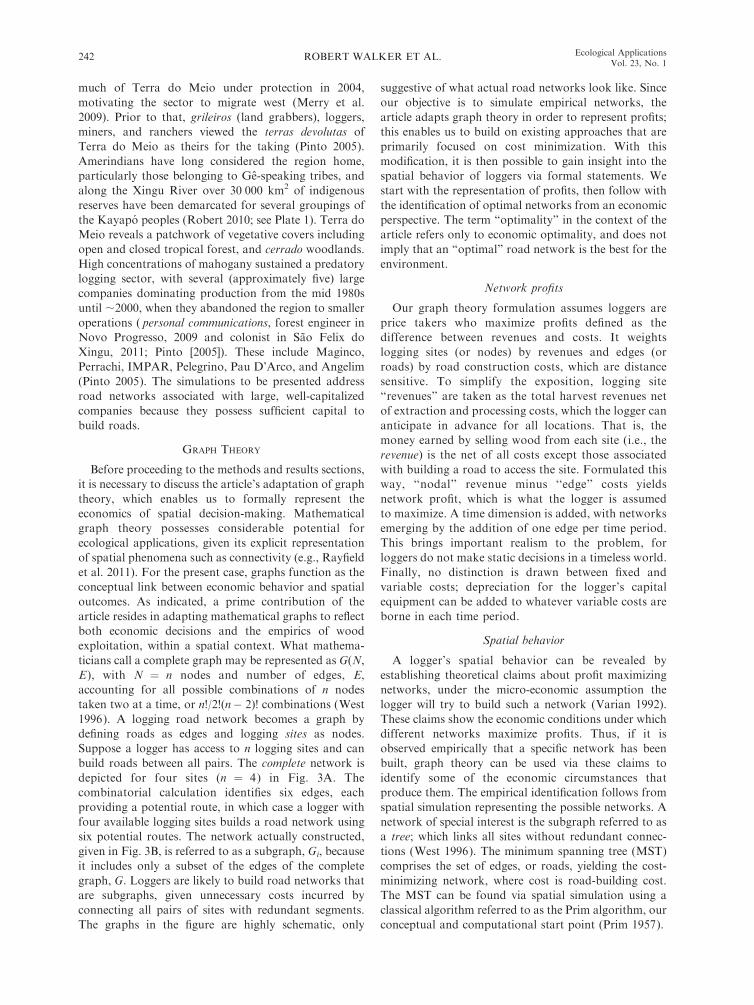
Suppose a logger has access to n logging sites and can
build roads between all pairs. The complete network is
depicted for four sites (n ¼ 4) in Fig. 3A. The
combinatorial calculation identifies six edges, each
providing a potential route, in which case a logger with
four available logging sites builds a road network using
six potential routes. The network actually constructed,
given in Fig. 3B, is referred to as a subgraph, Gi, because
it includes only a subset of the edges of the complete
graph, G. Loggers are likely to build road networks that
are subgraphs, given unnecessary costs incurred by
connecting all pairs of sites with redundant segments.
The graphs in the figure are highly schematic, only
suggestive of what actual road networks look like. Since
our objective is to simulate empirical networks, the
article adapts graph theory in order to represent profits;
this enables us to build on existing approaches that are
primarily focused on cost minimization. With this
modification, it is then possible to gain insight into the
spatial behavior of loggers via formal statements. We
start with the representation of profits, then follow with
the identification of optimal networks from an economic
perspective. The term ‘‘optimality’’ in the context of the
article refers only to economic optimality, and does not
imply that an ‘‘optimal’’ road network is the best for the
environment.
Network profits
Our graph theory formulation assumes loggers are
price takers who maximize profits defined as the
difference between revenues and costs. It weights
logging sites (or nodes) by revenues and edges (or
roads) by road construction costs, which are distance
sensitive. To simplify the exposition, logging site
‘‘revenues’’ are taken as the total harvest revenues net
of extraction and processing costs, which the logger can
anticipate in advance for all locations. That is, the
money earned by selling wood from each site (i.e., the
revenue) is the net of all costs except those associated
with building a road to access the site. Formulated this
way, ‘‘nodal’’ revenue minus ‘‘edge’’ costs yields
network profit, which is what the logger is assumed
to maximize. A time dimension is added, with networks
emerging by the addition of one edge per time period.
This brings important realism to the problem, for
loggers do not make static decisions in a timeless world.
Finally, no distinction is drawn between fixed and
variable costs; depreciation for the logger’s capital
equipment can be added to whatever variable costs are
borne in each time period.
Spatial behavior
A logger’s spatial behavior can be revealed by
establishing theoretical claims about profit maximizing
networks, under the micro-economic assumption the
logger will try to build such a network (Varian 1992).
These claims show the economic conditions under which
different networks maximize profits. Thus, if it is
observed empirically that a specific network has been
built, graph theory can be used via these claims to
identify some of the economic circumstances that
produce them. The empirical identification follows from
spatial simulation representing the possible networks. A
network of special interest is the subgraph referred to as
a tree; which links all sites without redundant connec-
tions (West 1996). The minimum spanning tree (MST)
comprises the set of edges, or roads, yielding the cost-
minimizing network, where cost is road-building cost.
The MST can be found via spatial simulation using a
classical algorithm referred to as the Prim algorithm, our
conceptual and computational start point (Prim 1957).
ROBERT WALKER ET AL.242 Ecological ApplicationsVol. 23, No. 1
Economic interpretation of the simulated networks is
based on four claims involving identification of the
optimal network (Table 1). Claim 1 establishes that
profit-maximizing networks are always trees. Claim 2
shows that the MST maximizes profits when a logger
draws little distinction between today’s and tomorrow’s
rewards, or when the logger has a very low discount rate,
possibly equal to zero (Baumol 1968, Hirshleifer 1970).
The computational implication is that empirical net-
works should be similar to networks generated by Prim’s
algorithm. Claim 3 states that the MST may not produce
the profit-maximizing network when discount rates are
high, in which case the Prim algorithm no longer
effectively simulates observed networks. Claim 4 dem-
onstrates that insecure property rights can have the same
effect as high discount rates in leading to the construc-
tion of profit-maximizing networks different from the
MST. An important contribution of the article is to
accommodate the implications of Claims 3 and 4 by
implementing an algorithm that generates a profit
maximizing network alternative to the MST. This is
the ordered tree (OT).
Claim 1.—Let a logging road network graph be G(V,
E), where V is the set of nodes (i.e., logging sites), and
E is the set of edges (i.e., potential road segments); p(A)
is profit for some arbitrary graph, A, composed by the
difference of revenues and costs. Revenues net of
harvesting costs are obtained at the individual nodes
(logging sites), while distance-sensitive costs are in-
curred in road construction. Assume that G is not a
tree, which implies it possesses at least one ‘‘cycle,’’ or
redundant connecting segment between two nodes
(West 1996). Without loss of generality, consider the
case of only one. By implication, there exists some
segment (i.e., edge) that adds only road construction
costs without adding revenue; call this segment e. If
removed, the new graph minus the edge, or graph G –
e, remains ‘‘connected’’ in the sense that all the nodes
(or sites) can be visited and revenues taken. Thus, p(G� e) � p(G), given road construction costs are less. But
this contradicts the assumption of optimality, which
establishes the claim.
Claim 2.—Assume a fixed point of origin, o, for
accessing K logging sites. In each time period starting at
t ¼ 0, the logger builds a road to one of the sites to
extract wood, continuing until all K sites have been
visited. Thus, the logger chooses from K ! temporal
sequences, each of which produces a unique tree graph.
Write the kth graph as Gk, and the revenue (net of wood
harvesting costs at the site) it generates at time t as rtk. As
defined, t also identifies a specific logging site in an
ordered sequence, namely the site to be visited at time t.
TABLE 1. Graph theory claims about road networks.
Number Claim
1 Profit-maximizing road networks are always treenetworks.
2 The minimum spanning tree (MST) is always theprofit-maximizing road network in the absence oftime discounting.
3 The MST may not be the profit-maximizing roadnetwork with high discount rates.
4 The MST may not be the profit-maximizing roadnetwork in the case of open access resources.
FIG. 3. Linking mathematical graphs to road networks: (A) a complete set of potential routes (complete graph, G), and (B) areduced set for minimizing cost (subgraph, Gi ).
January 2013 243GRAPH THEORY AND SPATIAL DECISIONS

The present value for the revenues of Gk, or the sum of
yearly revenues discounted by time, is
Rk ¼XK�1
t¼0
1
ð1þ dÞtrt
k
where d is the discount rate (Hirshleifer 1970). If road
building costs are ct�1,t (for the segment built between
time t � 1 and t), then the present value of profit given
multiple time periods is
p ¼XK�1
t¼0
1
ð1þ dÞtrt
k � ct�1;t
� �:
Here, c�1,0 is the cost of building to the first harvestable
site in the initial period, which is not discounted. In the
case of a zero discount rate (d¼ 0), the quotient term in
the summation is 1, and the present value of revenue is
Rk ¼XK�1
t¼0
rtk:
But this sum is identical for all logging site sequences, in
which case the MST maximizes the present value of
profits since it minimizes the present value of road-
building costs; by definition, the MST has the shortest
sum of road (edge) lengths. An implication is that the
Prim algorithm identifies the optimizing road network; it
does so by selecting in each period the nearest site (node)
from those that remain.
Claim 3.—When discount rates are high, the MST
may not yield the maximum present value of profits, in
which case networks generated by Prim’s algorithm will
diverge from empirical networks, under the assumption
that loggers are profit maximizers. In the extreme case (d
! ‘), as is likely in a high-risk frontier environment, the
logger is best off scanning opportunities in a time-
myopic fashion, building roads in each period that
maximize profits only for that period. This may be seen
by considering a simple case involving two logging sites
subscripted as v and w, with path o! v! w generating
the MST. As the discount rate grows increasingly large,
the present value of MST profits is pMST ! rv – c0,v,
since 1/(1þ d )frw – cv,wg ! 0. If profits from exploiting
site w are greater in the initial period (po,w . pMST), then
the optimal path prescribes an initial visit to a site that
would be visited later in constructing a road network by
the guidelines of the MST.
Claim 4.—Insecure property rights can have the effect
of high discount rates. Again, for the MST sequence o
! v ! w, the logger may question the likelihood of
being able to exploit site w, which is more distant than v.
The expected present value of MST profit is then pMST¼rv – c0,v, if the logger thinks it possible that a competitor
(or government) will close access to w by the second
period. On the other hand, if the logger builds first to the
more distant location, w, in order to preemptively
exploit it, the present value of profit is p0,w ¼ rw – c0,wþ 1/(1þ d )frv – cw,vg. The discounted term on the right-
hand side reflects an assumption that the logger thinks a
second period harvest close to the point of origin, o, is
feasible. The logger pursues this course when
rw � c0;w þ1
ð1þ dÞ rv � cw;v
� �. rv � c0;v:
Claims 3 and 4 demonstrate conditions under which
the MST may not maximize the present value of profits.
In such a situation, empirical networks differ from those
generated by Prim’s algorithm. This is illustrated in Fig.
4, with the MST given in Fig. 4A. Fig. 4B shows the case
when a logger seeks the big pay-off first, and conse-
quently builds a network different from the MST. This
carries significant implications for our computational
FIG. 4. Two types of road networks for connecting an original site o with a nearer, less resource-rich, site v and a more distant,more resource-rich, site w. (A) The minimum spanning tree (MST) comprises the set of edges, or roads, yielding the cost-minimizing network, where cost is road-building cost. (B) The ordered tree (OT) results when road-builders seek out sitesgenerating the most revenue at each step (profit-maximizing network).
ROBERT WALKER ET AL.244 Ecological ApplicationsVol. 23, No. 1

application, by necessitating an algorithm that can
mimic spatial behavior when discount rates are high,
or when property rights are insecure. The algorithm,
referred to as the ordered tree (OT), seeks out sites
generating the most revenue at each step. The OT
maximizes the present value of profits when revenues are
large relative to road-building costs, a reasonable
assumption for the study area. Most of the logging for
the period under investigation involved mahogany, the
most valuable of Amazonia’s hardwoods ( personal
communications, Kayapo Chief in Sao Felix do Xingu,
2010 and colonist in Sao Felix do Xingu, 2011).
Claims 3 and 4 also possess implications for the
broader discussion about forest fragmentation in the
Amazon Basin. In particular, they identify conditions
under which logging generates more fragmentation than
necessary to harvest a fixed quantity of wood. Since the
MST always reflects the minimum length network to
exploit a set of logging sites, any other network
possesses additional kilometers of roadway. Thus, if
Amazonian loggers build networks more consistent with
an OT than with an MST, it can be concluded that the
incentives they face have generated ‘‘excess’’ fragmenta-
tion.
METHODS
The methodologies implemented by the research are
primarily computational. However, a prime objective is
to reflect actual decision-making behavior, in which case
model structures and assumptions are based, when
possible, on field work using social-science research
methodology. The social-science data comprises infor-
mation gleaned from three field campaigns conducted in
Para State in 2009, 2010, and 2011. All major logging
centers were visited along BR-163 and BR-230; also
visited was Sao Felix do Xingu, gateway to Terro do
Meio from the east. An attempt was made to apply a
scientific survey to sawmill managers, but the sector was
in crisis from the global recession and from environ-
mental law enforcement operations and many mills had
closed. The teams resorted to key informant interviews
of knowledgeable individuals, including, but not limited
to, sawmill managers; these interviews were aimed
primarily at obtaining information on road-building
costs, and at the way in which loggers spatially organize
their productive activities. Such ethnographic informa-
tion does not possess the statistical properties of a
scientific sample, but it is used here to justify model
assumptions that might otherwise appear arbitrary. It is
also used to shed light on results.
The primary analytical method involves simulations
of road networks, followed by comparisons to the actual
networks they attempt to reproduce. A raster data
structure is used, with grid cell sizes of 90 m, and extents
on the order of 100�1000 km2. Interactive Date
Language (IDL) was coded to build two-dimensional
road networks, issuing from an origin and reaching a
series of logging sites, taken as target destinations. The
origin points were identified by visual inspection of the
actual road networks, observable on satellite images; the
logging sites were defined computationally. The software
expands on existing approaches in operations research,
starting with Prim’s algorithm (Prim 1957). Specifically,
two software codes are implemented to identify net-
works conforming to the MST and OT. Simulation
outputs following model implementation are compared
to actual road networks, and the parameterization and
code structure that yield the closest approximation are
discussed with respect to implicated economic behaviors
and likely consequences for forest fragmentation. We
now consider three computational adaptations necessary
to reflect real world networks. This is followed by
consideration of the data and discussion of the site
selection process.
From theoretical to computational graphs
Our graph theory formulation and associated claims
establish that the classical MST solution may not be
optimal. To bracket the extreme cases of high discount-
ing and/or insecure land tenure, we developed an
alternative configuration referred to as the OT. To
simulate both the MST and the OT, we adapt our
computational algorithms in order to transform abstract
mathematical graphs into ones with empirical features
(Table 2). These adaptations involve the representation
of edges (road routes) and nodes (logging sites and
branch points).
Edge weights.—The computational models weight
edges by construction costs. This adaptation replaces
the straight edges of theoretical graphs with routes that
are cheaper to build (Fig. 5). Computational identifica-
tion of least-cost paths stems from a well-known GIS
problem solved by Dijkstra with the algorithm that
bears his name (Dijkstra 1959). In our case, distance-
sensitive costs involve only road construction, as
transportation expenditures to and from the sawmill
are negligible by comparison ( personal communication,
logger in Novo Progresso and Itaituba, 2009). This
empirical circumstance allows us to consider only road-
building as important to the emergence of the network,
on the cost side. On a homogenous landscape, such costs
are proportional to straight-line, Euclidean distance.
Topographic relief compromises the equivalence be-
tween minimum cost and minimum distance. Thus, a
real-world, profit-maximizing graph possesses edges like
the meandering pathways of Fig. 5A.
TABLE 2. Graph theory adaptations to reflect empiricalnetworks.
Number Adaptation
1 Edge weights are based on least-cost pathways, notEuclidean distances (Dijkstra algorithm).
2 Nodes are weighted, in addition to edges.3 Nodes can branch from edges (Steiner rectilinear
problem).
January 2013 245GRAPH THEORY AND SPATIAL DECISIONS
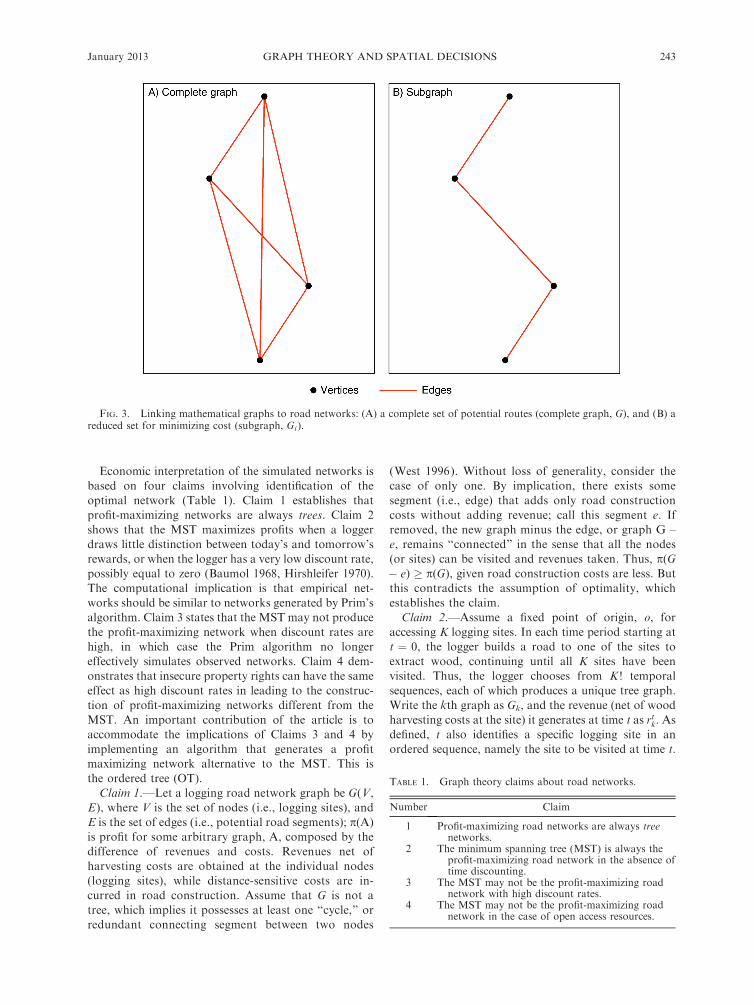
Defining nodes.—A second computational adaptation
produces logging site revenues, in effect weighting the
nodes to be accessed for logging. Together with edge
weights, this enables the identification of profit-maxi-
mizing networks. Nodal weighting involves data inten-
sive calculations which are discussed in the subsection
Wood revenues. The third adaptation allows new roads to
branch from previously constructed ones, and not just
logging sites. Graph theory assumes that all nodes are
given in advance, as per graph theory symbolism, G(V,
E). The present application also assumes preexisting
nodes, namely those identified as sites the logger intends
to access for wood extraction. However, new ones may
arise when it proves less costly to build from an existing
road segment. In such a situation, the new road’s point of
origin provides an ex post network node not given in the
original V set, as indicated in Fig. 5B. Here, if it is less
costly to access logging site c from the segment, ab, than
from node b, a new node appears in the network at node
b*. Such a theoretical adaptation necessitates adjusting
our software to approximate solutions to the so-called
Steiner rectilinear problem (Garey et al. 1977, Ivanov
and Tuzhilin 1994, Dean 1997, Promel and Steger 2002).
Data used in the analysis
Our computational approach requires two types of
data input, as well as classified satellite images for
evaluating model performance. The inputs include
elevation maps for representing road-building costs,
and geo-coded biomass density for producing surrogate
measures of wood revenue. The classified satellite images
yields maps of logging roads against which the
simulations can be compared.
Road building costs.—Road building costs are taken
as weight functions reflecting elevation differences
between neighboring grid cells (Arima et al. 2005,
2008). Features such as streams and rivers are given
higher weights because bridging a river is more costly
than opening a road. Since little is known about how
loggers actually evaluate road-building costs, we model
them using different functions, as discussed in Results.
Elevations are produced by a digital elevation model
(DEM), whose resolution derives from the 90-m posting
resolution of the Shuttle Radar Topography Mission
(SRTM). Although some behaviorally meaningful ele-
vation gradients may be missed, the data allow for broad
geographic coverage, necessary for the application.
Wood revenues.—Revenues are taken to be propor-
tional to wood density, a proxy for harvest volume.
Thus, logging sites are weighted for revenues using data
from the RADAM project, which conducted extensive
forest inventories for 2328 Amazonian locations (Oli-
veira 1999). For use here, the RADAM data are
spatially allocated across the basin to provide grid
coverage of wood density, using kriging with an external
drift. This predicts wood biomass density for unsampled
locations by using the information at sampled RADAM
sites, together with variables likely to affect density such
as soil type, forest type, and elevation (Goovaerts 1997,
Sales et al. 2007). To identify logging sites, or nodes, we
applied a neighborhood function over the density
surface raster using a moving window kernel of 16 3
16 cells and weights equal to one. This function assigns
the sum of the 16 3 16 neighbors to each cell and
essentially identifies continuous regions with high
density. We then divided the resulting raster into equal
interval isopleths and delineated the polygons around
the largest intervals, which were taken as the logging
areas. Large polygons therefore indicate a large contin-
uous concentration of high timber volume, and presum-
ably more revenue. Finally, the centroid of each area
was located to serve as a road network destination (i.e.,
node) in the simulations.
Remote sensing of road networks.—We compare our
simulated networks to maps compiled in an existing
digital library maintained by Instituto do Homem e
Meio Ambiente da Amazonia, or IMAZON (Brandao
and Souza 2006). The library contains maps of
Amazonian logging roads identified by visual interpre-
tation of bands 3 and 5 (scale 1:50 000) using LandSat
imagery as early as 1985 and as recently as 2002,
covering most of Para State (Fig. 2). Such roads can be
ephemeral, disappearing then reappearing at a later
date; they can also manifest gaps on satellite imagery
given their modest size. The visual interpretation
appears to work well when remotely sensed roads are
compared to known ones (Greenpeace 2001, Brandao
and Souza 2006). For the study region in Terra do Meio,
attributes in the IMAZON map library indicate road
segments had all been identified by 2001, but there is no
way of knowing at what point in time they first became
visible. We obtained a 1996 Landsat Image PATH/
ROW 225/65 for ourselves to gain insight into network
FIG. 5. (A) In the real world, topography may make theleast-cost pathway from the origin to a point one thatmeanders. (B) New nodes may arise when it proves less costlyto build from an existing road segment. Here, if it is less costlyto access logging site c from the segment, ab, than from node b,a new node appears in the network at node b*.
ROBERT WALKER ET AL.246 Ecological ApplicationsVol. 23, No. 1

emergence and dynamics. Earlier scenes had a large
percentage of cloud cover and were deemed inappropri-
ate for road identification. The path/row combination
covers the simulation sites, which are now discussed.
Simulation sites
The spatial simulations were conducted to replicate
two logging road networks found in or near Terra do
Meio; one of these was previously considered by Arima
et al. (2008). The two simulation sites are found
upstream, on the left and right banks of the Xingu
River (LBX and RBX; Fig. 2). Our field work implicates
a single enterprise, which was able to gain exclusive
access to the indigenous territories of the Kayapo tribe.
The point of origin for simulating roads in the RBX site
was taken as the network intersection with the Xingu,
the likely point of transshipment to sawmills down-
stream (in Sao Felix do Xingu); the network is isolated
and Mahogany floats. For LBX, the origin is taken as
the closest point of the network to a north-south road
connecting to the Xingu River. This is the only apparent
outlet to Sao Felix do Xingu. The sites were determined
by visual inspection of the IMAZON digital map library
(see Fig. 2). The selection process sought dendritic
networks that appeared autonomous, so that we could
reasonably attribute them to individual logging opera-
tions. We also searched for networks with large extents
in order to capture the spatial activity of enterprises
sufficiently capitalized to vertically integrate down to
harvest and road-building activities. A multi-product
facility processing ;80 000 m3/yr (Verıssimo et al. 2002,
Lentini et al. 2005) requires on the order of 3200
hectares a year, assuming 25 m3/ha of marketable timber
( personal communications, loggers in Novo Progresso
and Uruara, 2009). On a decadal time cycle, which
approximates the mahogany boom in Terra do Meio
(1985–2000; Pinto 2005), the land required is ;30 000
ha, yielding a territorial domain approaching 20 3 20
km, probably an underestimate given patchy distribu-
tions of mahogany. These calculated areas are in order-
of-magnitude agreement with the size of the networks
used as simulation sites. Although large, such holdings
are common in the region (Almeida 1995, Fernandes
1999). Modeling with large extents has the added
advantage of mitigating any measurement issues asso-
ciated with the ‘‘poor’’ resolution of the RADAM and
SRTM DEM data sets.
In practice, it may be difficult to separate one logger’s
roads from another’s in the map library, given the
possibility of simultaneous activity. Another difficulty
arises from the nature of the data. Although the
IMAZON archive uses satellite imagery that spans a
significant time period (1985–2002), the attributes for
the individual road segments only give an entry of one
year, in which case it is not possible to fully record the
dynamics of road construction. This impacts our ability
to observe the actual emergence of networks in the study
region. To mitigate this lack of information, we
examined a 1996 Landsat image to see how much, if
any, of the road networks selected for simulation existed
then. The image shows that none of the network
segments had been built at that time. This is consistent
with the region’s history, where logging began in ;1985
with the opening of Estrada Canopus, which traversed
Terra do Meio west, from the left bank of the Xingu
(across from Sao Felix do Xingu) to a cassiterite mine
near the Iriri River (Pinto 2005). It presumably took
time for logging to diffuse south to the selected logging
sites. An exploitation start date of 1996 or shortly
thereafter suggests a rapid rate of construction. In that
roads through primary forest are built at 5–10 km per
week (20–40 km per month), a five-year period (e.g.,
1996–2001) gives more than enough time to exploit the
areas in question, given network lengths do not exceed
150 km. These estimates come from surveys conducted
in 2003 and 2004 of 113 individuals along the Trans-
amazon Highway, who provided estimates of extension
lengths and construction times for 23 unofficial roads, or
travess~oes. For 78 observations on extensions equal to or
greater than 10 km, the average construction rate is 5.67
km per week. These include all road-building agents
(colonists, fazendeiros, municipal government, Instituto
de Colonizacao e Reforma Agraria [INCRA], and
loggers). In a few cases of loggers building long
extensions (40 to 100 km), the rate reaches 10 km per
week. The logging firm associated with the selected sites
operated in the vicinity of Sao Felix do Xingu, as did
other large interests ( personal communications, Kayapo
Chief in Sao Felix do Xingu, 2010, colonists in Vila
Clariano and Ramal Xada, 2010, and colonist in Sao
Felix do Xingu, 2011). Terra do Meio has experienced
land conflicts, but large logging operations, mainly
responsible for the local road networks, can be assumed
to have controlled their territorial domains, despite lack
of land titles and little-to-no law enforcement ( personal
communication, colonist in Sao Felix do Xingu, 2011;
Pinto 2005). Thus, fragmentation in Terra do Meio
received an important initial push from just a handful of
logging firms, despite the larger number of smaller
operations found in and around Sao Felix do Xingu
(;20) into the first millennial decade ( personal commu-
nication, colonist in Sao Felix do Xingu 2011; see also
Pereira et al. [2010]).
RESULTS
To summarize, the MST and OT algorithms produce
networks bracketing a range of behavioral settings
affecting the spatial decision-making of loggers. The
MST has been previously implemented (Arima et al.
2008), while the OT is new. We implement these models
for two sites in central Para State, with three possible
functions reflecting road-building costs, including linear
(i.e., constant), increasing, and decreasing marginal
costs in gradient (let hi and hj be the elevation at two
adjacent cells in a grid; the linear cost of traversing those
cells is jhi � hjj, jhi � hjj2 for the increasing case and
January 2013 247GRAPH THEORY AND SPATIAL DECISIONS

jhi� hjj1/2 for the decreasing case). Crossing three cost
functions with two behavioral settings (MST and OT)
yields six possible models for simulation. We compare
the results for these six models to real road networks
using the IMAZON archive, and assess performance to
see which of them works ‘‘best.’’ On the basis of the best
model, we draw conclusions about the spatial behavior
of loggers, and implications for forest fragmentation.
Our performance assessment expands on the method
suggested by Goodchild and Hunter (1997) and Arima
et al. (2008), which is designed for linear features as
opposed to two-dimensional maps with categoric spaces
(see also Tveite and Langaas 1999). The method we use,
described in another manuscript currently under review,
is based on computational inference. In essence, it
determines the probability of observing a simulated
network under the null hypothesis of a random
generation process. If extremely unlikely, we conclude
that the simulation has explanatory power. The like-
liness or unlikeliness is determined by reference to a
probability histogram for randomized networks pro-
duced computationally, as depicted in Fig. 6 for the site
on the left bank of the Xingu (LBX). The measure
implemented to operationalize the procedure is the
percentage of the network falling within some buffer of
the empirical network being modeled. The rationale for
the buffer length, elaborated in the manuscript under
review, evolves from the principle of ensuring model
accuracy, measured by the percentage of the simulated
network found near the empirical network. For the
histogram presented in Fig. 6, it was determined to be
1026 m. In comparing more than one simulation, we
select the ‘‘best’’ model (or parameter setting) by viewing
the percentage of network found within the buffer,
together with significance probabilities. Higher percent-
ages are taken to reflect greater accuracy and better
performance; a low-significance probability (or a) means
the model has explanatory power. This approach is
analogous to the examination of regression coefficients
and their levels of significance in regression modeling.
The results, presented in Table 3, show that the OT
algorithm performs best across the two sites, with a 75%
within buffer given for both cases, and uniformly high
significance levels (low a probabilities). This can be
visually confirmed for the LBX site by reference to Fig.
6, where it can be seen that the value 0.75 falls far to the
right, in the upper tail of the probability histogram.
Accuracies for the simulations using the MST algorithm
tend to drop considerably, down to 56% for the site on
the right bank of the Xingu (RBX), and 58% for LBX.
Although the superiority of the OT algorithm is robust
across the sites, the road-building cost shows a variable
performance. For LBX, a linear function (constant
marginal cost in gradient) proves most effective, while
one with increasing marginal costs (in gradient) per-
forms best for RBX. Sample simulation results are given
in Fig. 7 for the LBX site, where the wood inventory
TABLE 3. Model results for the proportion of simulationnetworks within buffer and significance (P values are inparentheses).
Algorithm andcost structure
Sites
RBX LBX
Ordered tree
Constant 0.740 (0.100) 0.750 (,0.001)Increasing 0.750 (0.007) 0.694 (,0.001)Decreasing 0.655 (0.030) 0.737 (,0.001)
Spanning tree
Constant 0.668 (0.027) 0.583 (0.003)Increasing 0.592 (0.130) 0.635 (,0.001)Decreasing 0.563 (0.343) 0.586 (0.003)
FIG. 6. The null distribution for hypothesis testing of simulation results (LBX site).
ROBERT WALKER ET AL.248 Ecological ApplicationsVol. 23, No. 1

data identified eight target nodes for modeling; as the
figure shows, segments of the OT tend to locate closer
than the MST. By coincidence, eight nodes were also
determined for the RBX site. Given the time period
involved, roads were built to more than one node in
some of the years. This is not a problem empirically, as
extraction and road-building crews may function
independently (Verıssimo et al. 1995). The theoretical
development could be adapted for such empirical
specificities, although without producing much new
insight.
DISCUSSION
The results indicate that loggers prefer the architec-
ture of ordered tree (OT) networks. This has implica-
tions for the extent of forest fragmentation, in that the
OT requires more roads to be built than the MST in
accessing a fixed quantity of wood. For the simulation
results, this ranges from 1% to 8%, depending on the site
and the cost function assumption. Thus, logging in the
Amazon basin may have produced an excessive amount
of forest fragmentation. The secondary effects of
excessive road building probably aggravate the immedi-
FIG. 7. A map showing simulated road networks vs. actual roads (LBX site).
January 2013 249GRAPH THEORY AND SPATIAL DECISIONS
ate impacts on biodiversity and ecosystem function
brought by the physical disturbance of the road. In
implementing an OT architecture, loggers are more
likely to build long segments early in the exploitation
cycle than they would in constructing an MST. We are
aware of a road extension of about 100 km built in the
mid-1980s in order to gain access to mahogany in Terra
do Meio. This road allowed the occupation of lands
outside the federal government’s original plan, and
intensified conflict between farmers and indigenous
peoples. Its construction may never have occurred had
loggers pursued a different spatial strategy. Although we
can assert that loggers maximize profits, they do so on
the basis of economic and institutional factors that lead
to different spatial outcomes. As our theoretical claims
suggest, either discount rates or the strength of property
rights can tip the balance one way or the other (Table 1).
For the results in question, the conclusion is that OT
networks indicate either high discount rates, weak
property rights, or some combination. Despite this
ambiguity, we can interpret based on empirical context.
Since the patterns were largely observed prior to 2000 in
what was a remote logging frontier, the architecture of
the road networks observed probably reflects high
discount rates. Our personal experience in the region is
that loggers had little to fear from government
enforcement of any kind until after 2000. Thus, there
was no incentive to make deep penetrations of public
lands to avoid the opportunity cost of a forfeited harvest
due to possible government intervention. As for
competitive and pre-emptive logging by rivals, it also
appears that the larger interests acted cooperatively to
lay out general logging areas, in order to avoid conflicts
among themselves ( personal communication, colonist in
Sao Felix do Xingu, 2011).
The discount rate is not the only behavioral factor
that underlies Amazonian fragmentation patterns asso-
ciated with loggers. Very recently, strong incentives have
emerged to access one of the few remaining areas of
Terras Devolutas in central Para State. This has led to
long penetrations north from the Transamazon High-
way, and produced a conflict referred to as the Guerra
de Macapuxi, or the War of Macapuxi (Diario do Para
2009). Loggers in the region are very much aware of the
Brazilian government’s new willingness to enforce
environmental law, and are fearful that it will continue
to put formerly accessible lands under protected status.
One large interest operating recently along the Trans-
amazon Highway stored logs at the sawmill several years
in advance of processing, presumably to avoid restric-
tions on future access to land ( personal communication,
colonists in Uruara, 2009) This is consistent with the
preemptive behavior implicit in Claim 4 and Fig. 4. The
maintenance of large stocks of unsawn wood adds
considerably to inventory costs in the form of degraded
raw material inputs (Kamien and Schwartz 1981). This
is a waste of valuable hardwood that need not have
occurred, and it adds to the ledger of environmental
costs associated with OT networks.
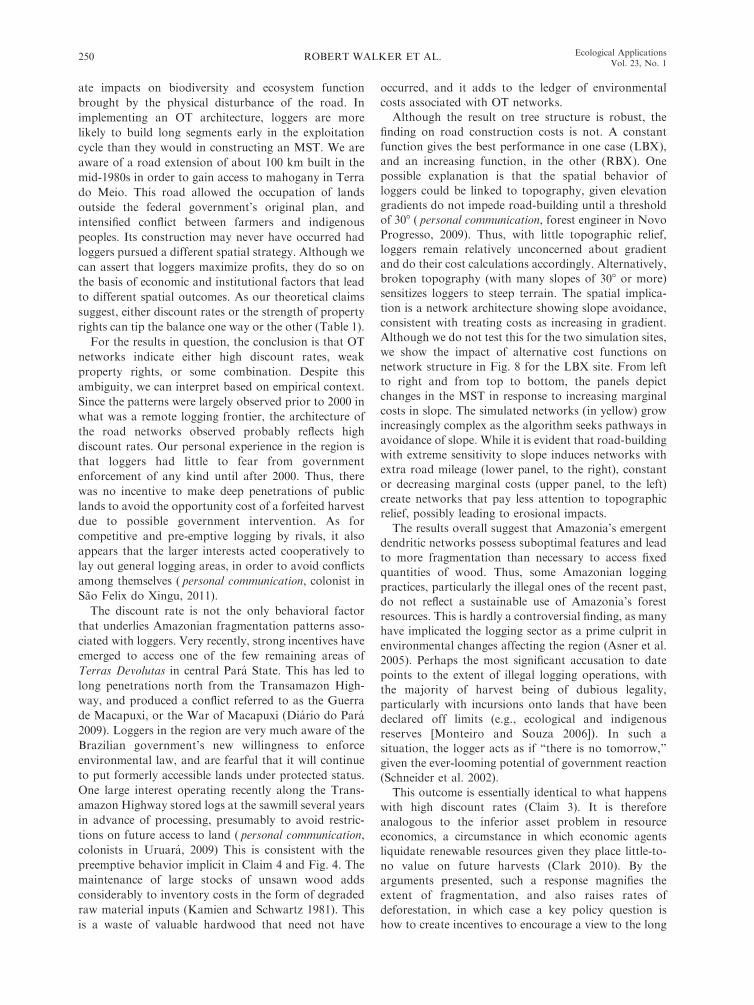
Although the result on tree structure is robust, the
finding on road construction costs is not. A constant
function gives the best performance in one case (LBX),
and an increasing function, in the other (RBX). One
possible explanation is that the spatial behavior of
loggers could be linked to topography, given elevation
gradients do not impede road-building until a threshold
of 308 ( personal communication, forest engineer in Novo
Progresso, 2009). Thus, with little topographic relief,
loggers remain relatively unconcerned about gradient
and do their cost calculations accordingly. Alternatively,
broken topography (with many slopes of 308 or more)
sensitizes loggers to steep terrain. The spatial implica-
tion is a network architecture showing slope avoidance,
consistent with treating costs as increasing in gradient.
Although we do not test this for the two simulation sites,
we show the impact of alternative cost functions on
network structure in Fig. 8 for the LBX site. From left
to right and from top to bottom, the panels depict
changes in the MST in response to increasing marginal
costs in slope. The simulated networks (in yellow) grow
increasingly complex as the algorithm seeks pathways in
avoidance of slope. While it is evident that road-building
with extreme sensitivity to slope induces networks with
extra road mileage (lower panel, to the right), constant
or decreasing marginal costs (upper panel, to the left)
create networks that pay less attention to topographic
relief, possibly leading to erosional impacts.
The results overall suggest that Amazonia’s emergent
dendritic networks possess suboptimal features and lead
to more fragmentation than necessary to access fixed
quantities of wood. Thus, some Amazonian logging
practices, particularly the illegal ones of the recent past,
do not reflect a sustainable use of Amazonia’s forest
resources. This is hardly a controversial finding, as many
have implicated the logging sector as a prime culprit in
environmental changes affecting the region (Asner et al.
2005). Perhaps the most significant accusation to date
points to the extent of illegal logging operations, with
the majority of harvest being of dubious legality,
particularly with incursions onto lands that have been
declared off limits (e.g., ecological and indigenous
reserves [Monteiro and Souza 2006]). In such a
situation, the logger acts as if ‘‘there is no tomorrow,’’
given the ever-looming potential of government reaction
(Schneider et al. 2002).
This outcome is essentially identical to what happens
with high discount rates (Claim 3). It is therefore
analogous to the inferior asset problem in resource
economics, a circumstance in which economic agents
liquidate renewable resources given they place little-to-
no value on future harvests (Clark 2010). By the
arguments presented, such a response magnifies the
extent of fragmentation, and also raises rates of
deforestation, in which case a key policy question is
how to create incentives to encourage a view to the long
ROBERT WALKER ET AL.250 Ecological ApplicationsVol. 23, No. 1

run on the part of the logging sector. In other words,
how can loggers be encouraged to make spatial decisions
in accord with the social rate of discount, which would
be both forest conserving and fragmentation reducing
(Baumol 1968). Brazil’s prohibition of mahogany
exploitation in 2005 has no doubt reduced the intensity
of forest fragmentation processes, as has coverage by the
Convention on International Trade in Endangered
Species of Wild Fauna and Flora (CITES), as of 2003.
Stricter enforcement of environmental laws has proba-
bly contributed to recent declines in rates of deforesta-
tion, as well (Nepstad et al. 2009). These various actions
may ultimately encourage loggers to stretch their time
horizons, and thereby improve their spatial decision-
making.
Although the theoretical results explain how specific
landscape patterns emerge, two caveats are in order. The
first is that our analysis is restricted to one type of
fragmentation, and does not apply to fishbone or large-
property patterns found in Amazonia (Oliveira Filho
and Metzger 2006). Those patterns reflect different
economic behaviors, and different actors or combina-
tions of actors. Hence, more theoretical work is
necessary to fully account for the various ways in which
the Amazonian forest is fragmenting. Our second caveat
is that the contribution as it stands remains partial given
human behavior is embedded in social realities that both
FIG. 8. The impact of increasing road building costs on network architecture (LBX site). From left to right and from top tobottom, the panels depict changes in the MST in response to increasing marginal costs in slope. The simulated networks are shownin yellow; actual roads are shown in red.
January 2013 251GRAPH THEORY AND SPATIAL DECISIONS

enable and constrain it, such as the distribution of
economic resources and the extent of prior government
investments in infrastructure. Full treatment of the
forces driving fragmentation, in dendritic landscapes or
any other, must also address the broader social
processes that bring factors of production, especially
capital but also labor, to bear on the tropical forest
landscapes of Amazonia.
For the dendritic case, such a treatment must
ultimately tie logging to the behavioral, social, and
political circumstances impacting the sector. These
circumstances include the intensity of time discounting,
which influences the results considerably and is linked to
interest rates (Baumol 1968). Also important is the
constitutional codification of Brazilian property institu-
tions, which has enabled loggers to exploit terras
devolutas, given general societal acceptance of the
creation of rights in land by posse, or physical
occupation. Although such lands have historically been
exploited with little fanfare, current uncertainty of
government response has probably encouraged and
intensified interest in the ‘‘here and now,’’ at the expense
of tomorrow. Market signals have no doubt intensified
this interest. The premium placed on high-value
hardwoods, especially mahogany (Swietenia macrophyl-
la), has encouraged the emergence of wide-reaching
dendritic networks that would have been spatially
concentrated under lower price regimes. This draws
attention to the impact of the demand side on
Amazonia. Forest fragmentation here stems from the
deployment of factors of production, but such factors
would hardly find their way to forest frontiers without
market pressures.
CONCLUSIONS
The analytical and computational approaches provide
tools of potential use to forest managers, given Brazil’s
move to a system of concession logging (Rohter 2007).
Those tasked with concession oversight should stay on
the lookout for OT networks, with long segments and
PLATE 1. The research for this article involved social-science survey methods and key informant interviews. An important partof the modeling exercise was to gain direct insight into how loggers make spatial decisions, and in particular how they collaborateamong each other to territorialize their operations so as to avoid conflicts. Initial information indicated that one large logginginterest had gained nearly exclusive access to the upper Xingu Valley in the lands of the Kayapo Indians. About 9000 Kayapo livein small settlements scattered across 30 000 square kilometers of indigenous homelands, in southern Para State. Some arecompletely isolated and refuse contact with Brazilian society. This photo was taken when authors Robert Walker (kneeling) andEugenio Arima (standing) visited the Kayapo Indians in Sao Felix do Xingu in order to interview several caciques (chiefs) abouttheir experience with the logging company in question. The Kayapo no longer allow loggers onto their territories. Photo credit:Tarcisio Feitosa.
ROBERT WALKER ET AL.252 Ecological ApplicationsVol. 23, No. 1

excessive length overall. Modeling can help them
collaborate with loggers to identify and implement
compact networks more in line with the MST. The
increased sectoral capacity likely to result with industry
rationalization will probably intensify incursions into
terras devolutas over the short run, particularly as such
lands become increasingly scarce. Thus, the Brazilian
government should also continue with its admirable
effort to extend its protected areas program (Soares-
Filho et al. 2009).
Our application of mathematical graph theory
provides insight into an important type of Amazonian
fragmentation associated with logging road networks.
The behavioral formulation identifies conditions under
which ‘‘excessive’’ fragmentation occurs, high discount
rates and uncertain property rights; these lead to the
overexploitation of renewable resources more generally
(Gordon 1954, Clark 2010). Thus, the article establish-
es a correspondence between spatial and aspatial
modes of resource degradation. The simulations shed
light on a disturbance regime that has affected very
large parts of Amazonia, and suggests that excessive
fragmentation has occurred. The impact of logging on
the forest, as bad as it had been, is worse than it had to
be.
As both the theoretical formulation and the simula-
tion results make clear, the spatial behavior of loggers
expresses economic objectives. Consequently, the proper
combination of carrots and sticks, that is, of economic
incentives, can encourage them to treat concession areas
as properties to be managed, not exhausted (Schmithu-
sen 1980, Walker and Smith 1993). Logging is an
important part of Amazonia’s economic base. Helping
loggers place long-run value on the resources that have
enriched them is one way to keep Amazonian jobs afloat
without adding unacceptable environmental costs to
society’s bottom line.
ACKNOWLEDGMENTS
We acknowledge support from the National Science Foun-dation under two research grants: Territorializing ExploitationSpace and the Fragmentation of the Amazon Forest (NSF-GSS-0822597) and Socio-spatial Processes of Road Extensionsand Forest Fragmentation in the Brazilian Amazon (NSF-GSS-0243102). We also thank the National Geographic Society forsupport under the grant Expedition on the Iriri (#7219-02). Ourmanuscript benefited greatly from Tarcısio Feitosa whoprovided us with useful documents and information, as wellas his penetrating insights. Finally, we are indebted to ThaısBarbosa Morais for help in conducting interviews with loggersand other individuals knowledgeable about the sector.
LITERATURE CITED
Aldrich, P. R., and J. L. Hamrick. 1998. Reproductivedominance of pasture trees in a fragmented tropical forestmosaic. Science 281:103–105.
Almeida, A. W. B. 1995. Carajas: a guerra dos mapas.Falangola, Belem, Brazil.
Arima, E., R. Walker, S. Perz, and M. Caldas. 2005. Loggersand forest fragmentation: behavioral models of road buildingin the Amazon basin. Annals of the Association of AmericanGeographers 95(3):525–541.
Arima, E. Y., R. Walker, M. Sales, C. Souza, Jr., and S. G.Perz. 2008. Emergent road networks and the fragmentationof space in the Amazon Basin. Photogrammetric Engineeringand Remote Sensing 74(6):699–709.
Asner, G. P., D. E. Knapp, E. N. Broadbent, P. J. C. Oliveira,M. Keller, and J. N. Silva. 2005. Selective logging in theBrazilian Amazon. Science 310:480–482.
Baumol, W. J. 1968. On the social rate of discount. AmericanEconomic Review 58(4):788–802.
Brandao, A., and C. Souza, Jr. 2006. Mapping unofficial roadswith Landsat images: a new tool to improve the monitoringof the Brazilian Amazon rainforest. International Journal ofRemote Sensing 27(1):177–189.
Chorley, R. L., and P. Haggett. 1967. Models in geography,Madingley lecture 2. Methuen, London, UK.
Clark, C. W. 2010. Mathematical bioeconomics. Third edition.Wiley and Sons, New York, New York, USA.
Cochrane, M. A. 2001. Synergistic interactions between habitatfragmentation and fire in evergreen tropical forests. Conser-vation Biology 15(6):1515–1521.
Dean, D. J. 1997. Finding optimal routes for networks ofharvest site access roads using GIS-based techniques.Canadian Journal of Forest Research 27 (1):11–22.
Diario do Para. 2009. Madeira: Minc participa de apreensaohistorica. Diaro do Para 27 June 2009. http://www.diariodopara.com.br/N-49560-MADEIRAþþMINCþPARTICIPAþDEþAPREENSAOþHISTORICA.html
Dijkstra, E. W. 1959. A note on two problems in connectionwith graphs. Numerische Mathematik 1:269–271.
Fernandes, M. 1999. Donos de Terra: Trajetorias da UniaoDemocratica Ruralista—UDR. Universidade Federal doPara/Nucleo de Altos Estudos Amazonicos, Belem, Brazil.
Ferreira, L. V., and W. F. Laurance. 1997. Effects of forestfragmentation on mortality and damage of selected trees incentral Amazonia. Conservation Biology 11:797–801.
Forman, R. T., et al. 2002. Road ecology: science and solutions.Island Press, Washington, D.C., USA.
Freitas, S., and 2010. Effects of roads, topography, and landuse on forest cover dynamics in the Brazilian Atlantic Forest.Forest Ecology and Management 259:410–417.
Garey, M. R., R. L. Graham, and D. S. Johnson. 1977. Thecomplexity of computing Steiner minimal trees. SIAMJournal of Applied Mathematics 32:835–859.
Goodchild, M. F., and G. J. Hunter. 1997. A simple positionalaccuracy measure for linear features. International Journal ofGeographical Information Science 11(3):299–306.
Goovaerts, P. 1997. Geostatistics for natural resources evalu-ation. Oxford University Press, New York, New York, USA.
Gordon, S. H. 1954. The economic theory of a commonproperty resource. Journal of Political Economy 62(2):124–142.
Greenpeace. 2001. Partners in mahogany crime. GreenpeaceInternational, Amsterdam, The Netherlands. http://www.greenpeace.org/raw/content/international/press/reports/partners-in-mahogany-crime.pdf
Hirshleifer, J. 1970. Investment, interest, and capital. PrenticeHall, Englewood Cliffs, New Jersey, USA.
Ivanov, A. O., and A. A. Tuzhilin. 1994. Minimal networks: theSteiner problem and its generalizations. CRC Press, BocaRaton, Florida, USA.
Jiang, Z. 2007. The road extension model in the land changemodeler for ecological sustainability of IDRISI. Pages 1–8 inH. Samet and C. Shahabi, editors. Proceedings of the 15thInternational Symposium on Advances in GeographicInformation Systems, ACM GIS 2007, Seattle, 7–9 Novem-ber 2007. Association for Computing Machinery (ACM),New York, New York, USA.
Kamien, M. I., and N. L. Schwartz. 1981. Dynamic optimiza-tion: the calculus of variations and optimal control ineconomics and management. Elsevier, New York, NewYork, USA.
January 2013 253GRAPH THEORY AND SPATIAL DECISIONS
Laurance, W. F., P. Delamonica, S. G. Laurance, H. L.Vasconcelos, and T. E. Lovejoy. 2000. Rainforest fragmen-tation kills big trees. Nature 404:836.
Lentini, M., D. Pereira, D. Celentano, and R. Pereira. 2005.Fatos florestais da Amazonia 2005. Imazon, Belem, Brazil.
Merry, F., B. Soares-Filho, D. Nepstad, G. Amacher, and H.Rodrigues. 2009. Balancing conservation and economicsustainability: the future of the Amazon timber industry.Environmental Conservation 44:395–497.
Monteiro, A., and C. Souza, Jr. 2006. Imagens de satelite paraavaliar planos de manejo florestal. Imazon, Belem, Para,Brazil. http://www.imazon.org.br/publicacoes/o-estado-da-amazonia/imagens-de-satelite-para-avaliar-planos-de-manejo
Nagendra, H., D. K. Munroe, and J. Southworth. 2004. Frompattern to process: landscape fragmentation and the analysisof land use/land cover change. Agriculture, Ecosystems andEnvironment 101:111–115.
Nelson, G. C., and D. Hellerstein. 1997. Do roads causedeforestation? Using satellite images in econometric analysisof land use. American Journal of Agricultural Economics79:80–8.
Nepstad, D., et al. 2009. The end of deforestation in theBrazilian Amazon. Science 326:1350–1351.
Oliveira, A. A. B. 1999. Projeto Radam Brasil, Rio de Janeiro,Brazil. Brazilian Institute of Geography and Statistics(IBGE), Rio de Janiero, Brazil. www.projeto.radam.nom.br/ingles/history.html
Oliveira Filho, B., and J. P. Metzger. 2006. Thresholds inlandscape structure for three common deforestation patternsin the Brazilian Amazon. Landscape Ecology 21:1061–1073.
Pan, W. K. Y., S. J. Walsh, R. E. Bilsborrow, B. Frizzelle,C. M. Erlien, and F. Baquero. 2004. Farm-level models ofspatial patterns of land use and land cover dynamics in theEcuadorian Amazon. Agriculture, Ecosystems and Environ-ment 101:117–134.
Parker, D. C., S. M. Manson, and M. Janssen et al. 2003.Multi-agent systems for the simulation of land use and landcover change: a review. Annals of the Association ofAmerican Geographers 93(2):314–337.
Pereira, D., D. Santos, M. Vedoveto, J. Guimaraes and A.Verıssimo. 2010. Fatos florestais da Amazonia 2010. Imazon,Belem, Brazil.
Perz, S., C. Overdevest, M. Caldas, R. Walker, and E. Y.Arima. 2007. Unofficial Road Building in the BrazilianAmazon: Dilemmas and Models for Road Governance.Environmental Conservation 32(2):1–10.
Pinto, J. N. A. 2005. Terra do Meio: estudo de caso na novafronteira amazonica. Thesis. Universidade Federal do Para,Para, Brazil.
Prim, R. C. 1957. Shortest connection networks and somegeneralizations. Bell System Technical Journal 36:1389–1401.
Promel, H. J., and A. Steger. 2002. The Steiner tree problem: atour through graphs, algorithms, and complexity. Advancedlectures in mathematics. Vieweg, Braunschweig, Germany.
Rayfield, B., M.-J. Fortin, and A. Fall. 2011. Connectivity forconservation: a framework to classify network measures.Ecology 92:847–858.
Robert, P. 2010. Conflitos, aliancas e recomposic~oes territoriaisem projetos de desenvolvimento sustentavel: experiencias daterra Indıgena Kayapo (Sul do Para). Pages 333–351 in R.Araujo and P. Lena, editors. Desenvolvimento sustentavel esociedades na Amazonia. Museu Paraense Emilio Goeldi,Belem, Brazil.
Rohter, L. 2007. Brazil gambles on monitoring as loggersadvance in Amazon. New York Times, 14 January 2007.
Sales, M., C. Souza, Jr., P. C. Kyriakidis, D. Roberts, and E.Vidal. 2007. Improving spatial distribution estimation offorest biomass with geostatistics: a case study of Rondonia,Brasil. Ecological Modelling 205:221–230.
Schmithusen, F. 1980. Forest utilization contracts—a key issuein forest policy and in the development of the tropicalhardwoods sector. FAO Paper 5. FAO, Pattaya, Thailand.
Schneider, R., E. Y. Arima, A. Verissimo, C. Souza, Jr., and P.Barreto. 2002. Sustainable Amazon: limitations and oppor-tunities for rural development. World Bank, Washington,D.C., USA.
Soares-Filho, B., A. Alencar, D. Nepstad, G. Cerqueira, D. C.Vera Diaz, S. Rivero, L. Solorzano, and E. Voll. 2004.Simulating the response of land-cover changes to road pavingand governance along a major Amazon highway: theSantarem-Cuiaba corridor. Global Change Biology 10:745–764.
Soares-Filho, B. S., D. C. Nepstad, L. M. Curran, G. C.Cerqueira, R. A. Garcia, C. A. Ramos, E. Voll, A.McDonald, P. Lefebvre, and P. Schlesinger. 2006. Modellingconservation in the Amazon basin. Nature 440:520–523.
Soares-Filho, B. S., H. Rodrigues, and W. Costa. 2009.Modeling environmental dynamics with Dinamica EGO.Universidade federal de Minas Gerais, Belo Horizonte,Brazil. http://www.csr.ufmg.br/dinamica/tutorial/Dinamica_EGO_guidebook.pdf
Tomlin, D. C. 1990. Geographic information systems andcartographic modeling. Prentice Hall, Englewood Cliffs, NewJersey, USA.
Treccani, G. D. 2001. Violencia e grilagem: instrumentos deaquisicao da propriedade da terra no Para. UniversidadeFederal do Para, Belem, Brazil.
Tveite, H., and S. Langaas. 1999. An accuracy assessmentmethod for geographical line data sets based on buffering.International Journal of Geographical Information Science13(1):27–47.
Varian, H. R. 1992. Microeconomic analysis. Third edition.Norton, New York, New York, USA.
Verıssimo, A., P. Barreto, R. Tarifa, and C. Uhl. 1995.Extraction of a high-value natural resource in Amazonia:the case of mahogany. Forest Ecology and Management72:39–60.
Verıssimo, A., M. A. Cochrane, C. Souza, Jr., and R. Salomao.2002. Priority areas for establishing national forests in theBrazilian Amazon. Conservation Ecology 6(1):4.
Walker, R. 2003. Evaluating the performance of spatiallyexplicit models. Photogrammetric Engineering and RemoteSensing 69(11):1271–1278.
Walker, R. 2004. Theorizing land cover and land use change:the case of tropical deforestation. International RegionalScience Review 27:247–270.
Walker, R., and T. E. Smith. 1993. Tropical deforestation andforest management under the system of concession logging: adecision-theoretic analysis. Journal of Regional Science33(3):387–419.
Walsh, S. J., R. E. Bilsborrow, J. J. McGregor, B. Frizzelle,J. P. Messina, W. K. Pan, K. A. Crews-Meyer, G. N. Taff,and F. Baquero. 2003. Integration of longitudinal surveys,remotes sensing time series, and spatial analysis. Pages 91–130 in J. Fox, R. R. Rindfuss, S. J. Walsh, and V. Mishra,editors. People and the environment: approaches for linkinghousehold and community surveys to remote sensing andGIS. Kluwer Academic Publishers, Boston, Massachusetts,USA.
Walsh, S. J., J. Messina, K. A. Crews-Meyer, R. E. Bilsborrow,and W. K. Pan. 2002. Characterizing and modeling patternsof deforestation and agricultural extensification in theEcuadorian Amazon. Pages 187–214 in S. J. Walsh andK. A. Crews-Meyer, editors. Linking people, place, andpolicy: a GIScience approach. Kluwer Academic Publishers,Boston, Massachusetts, USA.
West, D. B. 1996. Introduction to Graph Theory. Prentice-Hall,New Jersey.
ROBERT WALKER ET AL.254 Ecological ApplicationsVol. 23, No. 1