Modeling reactive sputter deposition of titanium nitride in a triode magnetron sputtering system
7
This article appeared in a journal published by Elsevier. The attached copy is furnished to the author for internal non-commercial research and education use, including for instruction at the authors institution and sharing with colleagues. Other uses, including reproduction and distribution, or selling or licensing copies, or posting to personal, institutional or third party websites are prohibited. In most cases authors are permitted to post their version of the article (e.g. in Word or Tex form) to their personal website or institutional repository. Authors requiring further information regarding Elsevier’s archiving and manuscript policies are encouraged to visit: http://www.elsevier.com/copyright
-
Upload
independent -
Category
Documents
-
view
6 -
download
0
Transcript of Modeling reactive sputter deposition of titanium nitride in a triode magnetron sputtering system

This article appeared in a journal published by Elsevier. The attachedcopy is furnished to the author for internal non-commercial researchand education use, including for instruction at the authors institution
and sharing with colleagues.
Other uses, including reproduction and distribution, or selling orlicensing copies, or posting to personal, institutional or third party
websites are prohibited.
In most cases authors are permitted to post their version of thearticle (e.g. in Word or Tex form) to their personal website orinstitutional repository. Authors requiring further information
regarding Elsevier’s archiving and manuscript policies areencouraged to visit:
http://www.elsevier.com/copyright

Author's personal copy
Modeling reactive sputter deposition of titanium nitride in a triode magnetronsputtering system
J.C. Sagás a,⁎, D.A. Duarte a, D.R. Irala a,b, L.C. Fontana b, T.R. Rosa a
a Technological Institute of Aeronautics, Plasmas & Processes Laboratory, 12228-900, S. J. dos Campos, Brazilb Santa Catarina State University, Plasma Physics Laboratory, 89223-100, Joinville, Brazil
a b s t r a c ta r t i c l e i n f o
Available online 18 July 2011
Keywords:Berg's modelMagnetron sputteringTitanium nitride
In this paper, the so-called Berg's model was successfully employed in order to model the reactive sputterdeposition of titanium nitride (TiN) by a triode magnetron sputtering (TMS) system. Such system consists of agrounded grid introduced between the target and the substrate. The grid acts as the anode, and the glowdischarge is formed between the target and grid. The qualitative model was compared to experimental data.In addition, results from a conventional MS system were also compared to the ones from the modified TMSsystem. It was possible to observe that (a) the width of the hysteresis region is narrower for TMS for allmodeled conditions; (b) the hysteresis width increases as a function of grid-to-target distance.
© 2011 Elsevier B.V. All rights reserved.
1. Introduction
Reactive magnetron sputtering deposition is a well knowntechnique for thin film deposition, and it has a wide range ofapplications [1–3]. Despite the advantages of this method regardingthe control of film properties and structure [4], reactive deposition hassome drawbacks related to the phenomenon of target poisoning.When the reactive gas is added to the chamber, it reacts not only onfilm surface but also onmetal target surface. The compound formationon the metal target reduces significantly the deposition rate, and theaddition of the reactive gas to the process causes the hysteresis effect.Initially, the addedgas is consumeddue to the reactionswith the targetand with the metal deposited on the chamber walls and substratesurface. Therefore, the partial pressure of the reactive gas remains at avery low level until the surfaces become almost completely covered bythe compound, which leads to an abrupt reduction in gas consump-tion, and, consequently, in an abrupt increase in pressure. After this,reducing the reactive gas flow rate leads first to a small decrease inpartial pressure, and second to an abrupt drop in pressure. Thisbehavior results in a hysteresis loop which can be observed through agraph showing the reactive gas partial pressure as a function of thetotal reactive gas flow rate. The hysteresis loop leads to instabilitieswhen the process is controlled by the reactive gas flow [5].
To avoid these problems, it is important to understand all thephenomena that occur during reactive sputter deposition. To do this,it is essential to formulate a reliable model for reactive (magnetron)sputtering. Berg et al. proposed a qualitative model to describe the
reactive sputter deposition at a steady-state [5–7], this model can bereliably used to describe the general features of the process, that is,the hysteresis loop and how the deposition parameters (geometrical,physical or chemical) affect the width of the hysteresis region.
Berg's model assumes that the target current is constant, and italso hypothesizes that the reactions between gas molecules andsurfaces only occur by chemisorption. Although more recent papers[8,9] have shown that the ion implantation plays an important role inreactive sputtering, chemisorption seems to be the predominantreactive mechanism, especially when the reactive gas and the metalpresent a high chemical reactivity [10].
Berg's model is based on the balance equations for compoundformation at a steady state on the target area (At) and collecting area(Ac), where the latter includes the substrate and chamberwalls. Whenthe reactive gas is added, amolecular flux F towards all surfaces occursaccording to Eq. (1):
F =p!!!!!!!!!!!!!!!
2!mkTp !1"
where p is the reactive gas pressure, m the mass of the reactive gasmolecule, k the Boltzmann constant and T the gas temperature.
On the target surface, compound formation occurs due to reactionsbetween gas and metal, while compound removal occurs due tosputtering. Thus, the balance equation on the target can be written as:
JqYc"t = 2#F 1!"t! " !2"
where J is the ion current density, q is the ion charge, Yc is thecompound sputtering yield, # is the sticking coefficient and "t is the
Surface & Coatings Technology 206 (2011) 1765–1770
⁎ Corresponding author. Tel.: +55 12 3947 5942.E-mail address: [email protected] (J.C. Sagás).
0257-8972/$ – see front matter © 2011 Elsevier B.V. All rights reserved.doi:10.1016/j.surfcoat.2011.07.013
Contents lists available at ScienceDirect
Surface & Coatings Technology
j ourna l homepage: www.e lsev ie r.com/ locate /sur fcoat
Diego Alexandre Duarte
Author's personal copy
fraction of the target area covered by compound. The number ofsputtered particles per second of metal and compound is given by
Fc =JqYc"tAt !3"
Fm =JqYm 1!"t! "At !4"
where Fc and Fm are the compound and metal flow rates, respectively,and the total sputtering erosion rate is given by the sum of Fc and Fm.Ym is the sputtering yield of the metal. On collecting area, thecompound formation balance is due to reactions with the reactive gasand to the compound and metal deposition sputtered from the target.Thus, the collecting area balance equation is:
2Q c + Fc 1!"c! " = Fm"c !5"
where "c is the fraction of the collecting area covered by compoundand Qc is the reactive gas consumed on the collecting area. The factor“2” is valid only for diatomic gasses that lead to the formation of twocompound molecules (e.g., 2Ti+N2!2TiN). The gas consumed onthe collecting and target surfaces, respectively, are described by thefollowing equations:
Q c = #F 1!"c! "Ac !6"
Q t = #F 1!"t! "At !7"
and the total gas flow rate is:
Q total = Q t + Q c + Q p !8"
where Qp is the remaining part of the reactive gas that escapes fromthe processing chamber through the pumping system. Now, with thisset of equations it is possible to model the reactive sputter deposition.For a detailed description see Ref. [5].
It is important to keep in mind that Berg's model is a first orderapproximation; still, it can adequately describe the general features ofthe reactive sputter deposition. The Berg's model has been improved:these improvements include effects such as ion implantation [10], thevariation of the sticking coefficient [11], the variation of the secondaryelectron yield [12], the role of the sputtering yield [5,13], a non-uniform distribution of the current on the target surface [14], plasmachemistry [15,16], co-sputtering processes [17] and the depositionwith two reactive gasses [18]. From other related papers, based on theBerg's model and experimental results, it is possible to observe thatthe hysteresis loop can be decreased, and sometimes extinguishedthrough (1) increasing the pumping speed, (2) decreasing the targetarea and/or the collecting area [5], (3) using reactive gas pulsing [19],(4) the HiPIMS technique [20], and (5) the “baffled target” reactivesputtering [21].
Fontana and Muzart developed another approach to the “hyster-esis problem”. That is, they proposed the so-called triode magnetronsputtering (TMS) system [22,23]. According to this configuration, agrid is inserted between the target and the substrate. When the grid iskept grounded, it becomes the discharge anode. A variation in thegrid-to-target distance (dg–t) modifies the plasma volume andconductivity. This system has been used in film deposition of differentcompounds [24–26]. It is noteworthy that regarding the TMS, themost interesting phenomenon, is the hysteresis control for thereactive deposition of TiN films [23]. Another important characteristicof this system is that the plasma is more stable than the one of thetraditional magnetron sputtering [22,23]. However, the hysteresiscontrol mechanisms of a TMS system have not been well explained
yet. Thus, in order to investigate this TMS characteristic, the presentwork has adapted Berg's model to the TMS system. More specifically,Berg's model has been modified so as to model the reactive sputterdeposition of TiN by the TMS system. The theoretical framework wasqualitatively compared and correlated to experimental data.
2. Berg's model applied to the triode magnetron sputtering (TMS)system
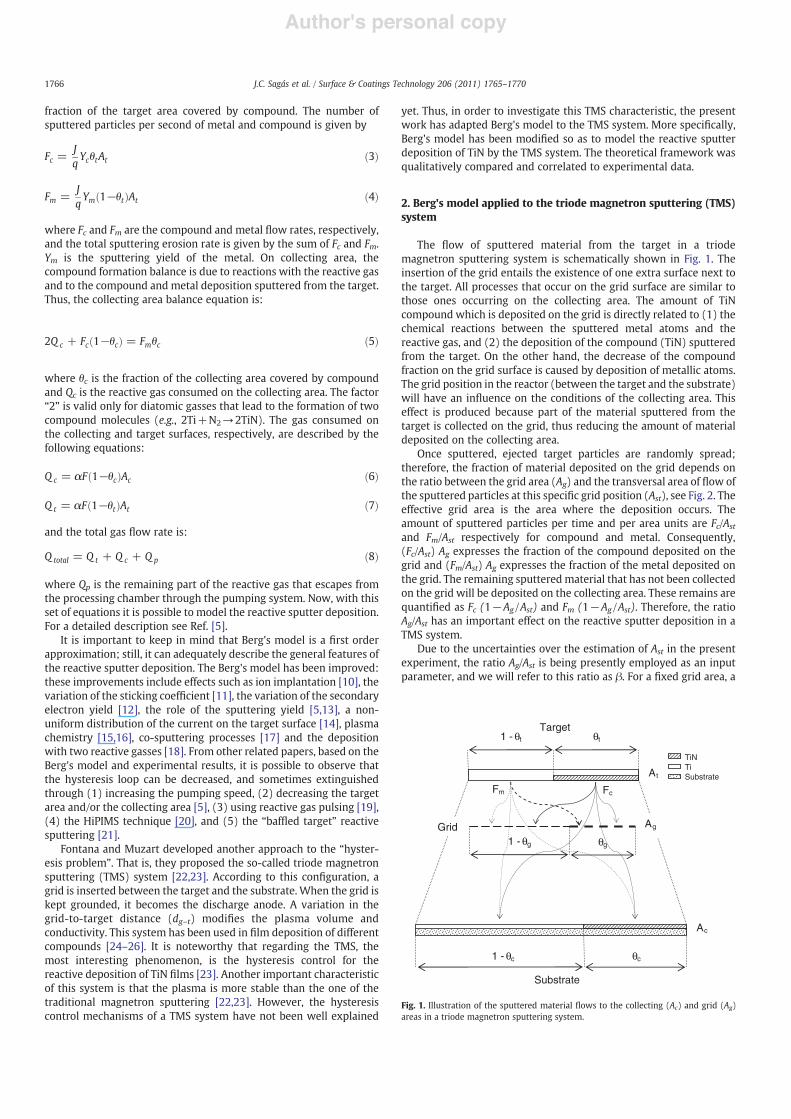
The flow of sputtered material from the target in a triodemagnetron sputtering system is schematically shown in Fig. 1. Theinsertion of the grid entails the existence of one extra surface next tothe target. All processes that occur on the grid surface are similar tothose ones occurring on the collecting area. The amount of TiNcompound which is deposited on the grid is directly related to (1) thechemical reactions between the sputtered metal atoms and thereactive gas, and (2) the deposition of the compound (TiN) sputteredfrom the target. On the other hand, the decrease of the compoundfraction on the grid surface is caused by deposition of metallic atoms.The grid position in the reactor (between the target and the substrate)will have an influence on the conditions of the collecting area. Thiseffect is produced because part of the material sputtered from thetarget is collected on the grid, thus reducing the amount of materialdeposited on the collecting area.
Once sputtered, ejected target particles are randomly spread;therefore, the fraction of material deposited on the grid depends onthe ratio between the grid area (Ag) and the transversal area of flow ofthe sputtered particles at this specific grid position (Ast), see Fig. 2. Theeffective grid area is the area where the deposition occurs. Theamount of sputtered particles per time and per area units are Fc/Ast
and Fm/Ast respectively for compound and metal. Consequently,(Fc/Ast) Ag expresses the fraction of the compound deposited on thegrid and (Fm/Ast) Ag expresses the fraction of the metal deposited onthe grid. The remaining sputtered material that has not been collectedon the grid will be deposited on the collecting area. These remains arequantified as Fc (1!Ag /Ast) and Fm (1!Ag /Ast). Therefore, the ratioAg/Ast has an important effect on the reactive sputter deposition in aTMS system.
Due to the uncertainties over the estimation of Ast in the presentexperiment, the ratio Ag/Ast is being presently employed as an inputparameter, and we will refer to this ratio as $. For a fixed grid area, a
1 - !t !t
1 - !c !c
Substrate
Target
At
Ac
TiNTi Substrate
!g1 - !g
AgGrid
Fm Fc
Fig. 1. Illustration of the sputtered material flows to the collecting (Ac) and grid (Ag)areas in a triode magnetron sputtering system.
1766 J.C. Sagás et al. / Surface & Coatings Technology 206 (2011) 1765–1770

Author's personal copy
high value of $ entails a grid closer to the target (smaller Ast). Thus,the balance equation for the compound on the grid is:
2Q g + Fc 1!"g" #
$ = Fm"g$ !9"
where Qg is the gas consumed on the grid surface and "g is the fractionof the grid area covered by the compound. Then, the gas consumed onthe grid can be written as:
Q g = #F 1!"g" #
Ag !10"
The flow rates of the compound and of the metal on the collectionarea are reduced by the factor (1!$) because the grid is next to thetarget. So, the balance equation for the collecting area is
2Q c + Fc 1!"c! " 1!$! " = Fm"c 1!$! " !11"
and the total reactive gas flow rate is now given by:
Q total = Q t + Q c + Q g + Qp !12"
Then, Eqs. (1) to (4) and (9) to (12) together with Eqs. (6) and (7)make it possible for us to model the reactive sputter deposition in aTMS system. For Ag=0, the equations aremade equal to the equationsof the conventional magnetron sputtering system.
The equations just above are similar to the equations of the so-called “baffled target” reactive sputtering [21]. In the “baffledsputtering”, the metal target is enclosed within a box which containsa window in front of the target erosion area. This system is employedso as to prevent the reactive gas from reaching the target. As a result,there is a difference in reactive gas pressure between the box and themain chamber. Similarly to the TMS system, part of the sputteredmaterial is “trapped” so that it cannot reach the collecting area.However, the TMS does not employ the grid to enclose the target; thegrid is used as an obstacle between the target and the substrate. Thus,in the model for the TMS system, there is not a difference in pressurebetween the area surrounding the target and the rest of the chamber.
3. Experimental setup
Experimental hysteresis curves were obtained through a Ti target(99.9%) sputtering in an atmosphere of Ar (99.99%) and N2 (99.99%).The experiments were carried out in a stainless steel chamber(%=30 cm and h=25 cm, see Fig. 1). Before the experiments, thechamber was evacuated to a background pressure of approximately1.3 mPa. The rectangular target had dimensions of 132!100 mmwithan erosion zone of 70 cm2. In the experiments, no substrate orsubstrate holder was used. The gas pressure inside the chamber was
monitored by capacitive (Baratron) and Penning gages. The argonpressure was fixed at 0.4 Pa, and the flow rate was 5.4 sccm. Thenitrogen flow rate varied from 0.0 to 3.0 sccm, which led to amaximumnitrogen partial pressure of 0.3 Pa, varying according to thegrid-to-target distance. The grid wasmade of austenitic stainless steel,and it was kept grounded in all experiments. The grid-to-targetdistance varied between 15 and 30 mm. The maximum input powerwas 475 W. During the experiments, the discharge current was set upat 0.8 A.
4. Theoretical model input data
TiN reactive sputter deposition was modeled for both MS and TMSsystems. The sticking coefficient for N on Ti was overestimated and setto a unity. A lower sticking coefficient reduces the hysteresis effectbecause the probability of compound formation decreases. However,as the objective of this work is to clarify the effect of the grid, thisoverestimation does not affect the qualitative comparisons. Thesputtering yields for Ti (Ym) and TiN (Yc) were taken as 0.63 and0.43, respectively, for Ar+ at 500 eV [27]. At higher partial pressure ofthe reactive gas, both the ions N+ and N2
+ will contribute to the targetsputtering. However, this is not taken into account in the presentmodel. Neither is the discharge voltage variation as a function of gascomposition being considered. The introduction of these effects in themodel is expected to increase the accuracy of the results. We note thatthe present work keeps the model as simple as possible so as to focuson the grid effect. The pumping speed was adjusted to 25 l.s!1
Ast
Ag
Substrate
Target
Ast
Substrate
Target
I
I I
Ag
Fig. 2. Influence of the grid-to-target distance in the value of $. In the case I, a low grid-to-target distance implies in a high $. In the case II, $ decreases with increased grid-to-targetdistance due to the increase in the transversal area of the sputtered particles flow (Ast).
Fig. 3. The nitrogen partial pressure (p) as a function of the total nitrogen flow rate(Qtotal) for MS and TMS systems.
1767J.C. Sagás et al. / Surface & Coatings Technology 206 (2011) 1765–1770
Author's personal copy
(0.025 m3.s!1) and the target and collecting areas were estimated as70 cm2 and 1580 cm2, respectively. The target area was estimated asthe target erosion zone. The collecting area was estimated throughmeasuring the area where the deposition is visually perceptiblewithout taking into account the non-uniform deposition on thechamber walls. The ion current on the target was set as 0.80 A. It canbe pointed out that, during the experiments, oscillations on thedischarge current were observed. For the TMS system, three gridswith different areas were modeled, i.e. 10, 15 and 20 cm2. Fivedifferent values of $ were used to evaluate the effect of the grid-to-target distance (0.05, 0.10, 0.15, 0.20 and 0.25). The highest valid $value for each grid area is determined by the condition AstNAt.
5. Results and discussion
Comparing the modeling results for MS and TMS, it is possible toobserve that the width of the hysteresis region is narrower for TMS forall modeled conditions, as shown in Fig. 3. The S-shaped behaviordefines a hysteresis region where one value for Qtotal may be satisfiedby three different values of p, "t and "c [5]. It is noticed that byincreasing $, the hysteresis width is reduced; in addition, for $N0.15,
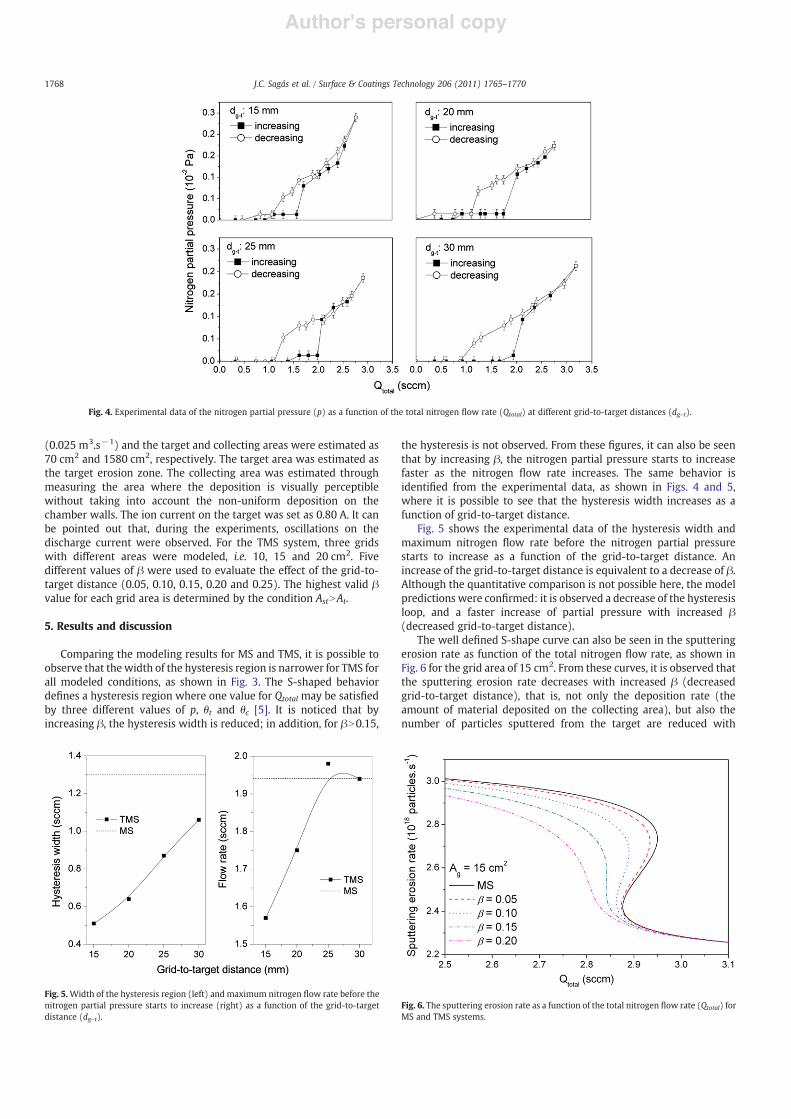
the hysteresis is not observed. From these figures, it can also be seenthat by increasing $, the nitrogen partial pressure starts to increasefaster as the nitrogen flow rate increases. The same behavior isidentified from the experimental data, as shown in Figs. 4 and 5,where it is possible to see that the hysteresis width increases as afunction of grid-to-target distance.
Fig. 5 shows the experimental data of the hysteresis width andmaximum nitrogen flow rate before the nitrogen partial pressurestarts to increase as a function of the grid-to-target distance. Anincrease of the grid-to-target distance is equivalent to a decrease of $.Although the quantitative comparison is not possible here, the modelpredictions were confirmed: it is observed a decrease of the hysteresisloop, and a faster increase of partial pressure with increased $(decreased grid-to-target distance).
The well defined S-shape curve can also be seen in the sputteringerosion rate as function of the total nitrogen flow rate, as shown inFig. 6 for the grid area of 15 cm2. From these curves, it is observed thatthe sputtering erosion rate decreases with increased $ (decreasedgrid-to-target distance), that is, not only the deposition rate (theamount of material deposited on the collecting area), but also thenumber of particles sputtered from the target are reduced with
Fig. 5.Width of the hysteresis region (left) and maximum nitrogen flow rate before thenitrogen partial pressure starts to increase (right) as a function of the grid-to-targetdistance (dg–t).
Fig. 6. The sputtering erosion rate as a function of the total nitrogen flow rate (Qtotal) forMS and TMS systems.
Fig. 4. Experimental data of the nitrogen partial pressure (p) as a function of the total nitrogen flow rate (Qtotal) at different grid-to-target distances (dg–t).
1768 J.C. Sagás et al. / Surface & Coatings Technology 206 (2011) 1765–1770
Author's personal copy
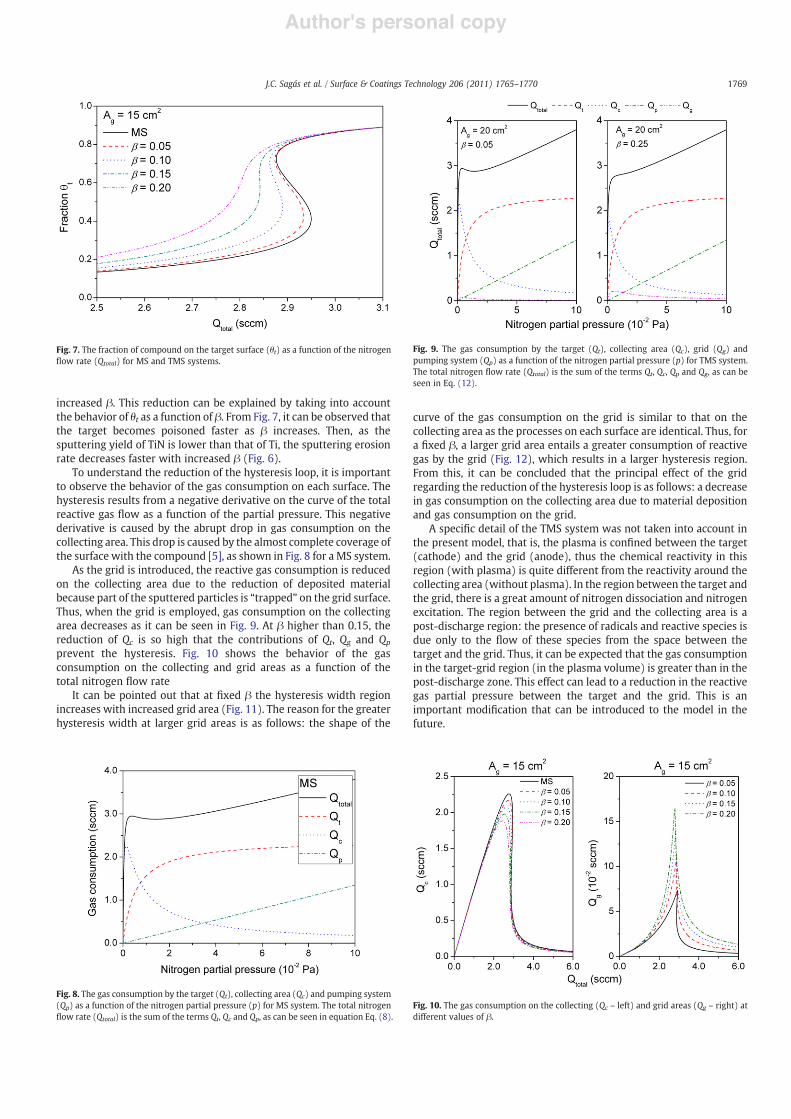
increased $. This reduction can be explained by taking into accountthe behavior of "t as a function of $. From Fig. 7, it can be observed thatthe target becomes poisoned faster as $ increases. Then, as thesputtering yield of TiN is lower than that of Ti, the sputtering erosionrate decreases faster with increased $ (Fig. 6).
To understand the reduction of the hysteresis loop, it is importantto observe the behavior of the gas consumption on each surface. Thehysteresis results from a negative derivative on the curve of the totalreactive gas flow as a function of the partial pressure. This negativederivative is caused by the abrupt drop in gas consumption on thecollecting area. This drop is caused by the almost complete coverage ofthe surface with the compound [5], as shown in Fig. 8 for a MS system.
As the grid is introduced, the reactive gas consumption is reducedon the collecting area due to the reduction of deposited materialbecause part of the sputtered particles is “trapped” on the grid surface.Thus, when the grid is employed, gas consumption on the collectingarea decreases as it can be seen in Fig. 9. At $ higher than 0.15, thereduction of Qc is so high that the contributions of Qt, Qg and Qp
prevent the hysteresis. Fig. 10 shows the behavior of the gasconsumption on the collecting and grid areas as a function of thetotal nitrogen flow rate
It can be pointed out that at fixed $ the hysteresis width regionincreases with increased grid area (Fig. 11). The reason for the greaterhysteresis width at larger grid areas is as follows: the shape of the
curve of the gas consumption on the grid is similar to that on thecollecting area as the processes on each surface are identical. Thus, fora fixed $, a larger grid area entails a greater consumption of reactivegas by the grid (Fig. 12), which results in a larger hysteresis region.From this, it can be concluded that the principal effect of the gridregarding the reduction of the hysteresis loop is as follows: a decreasein gas consumption on the collecting area due to material depositionand gas consumption on the grid.
A specific detail of the TMS system was not taken into account inthe present model, that is, the plasma is confined between the target(cathode) and the grid (anode), thus the chemical reactivity in thisregion (with plasma) is quite different from the reactivity around thecollecting area (without plasma). In the region between the target andthe grid, there is a great amount of nitrogen dissociation and nitrogenexcitation. The region between the grid and the collecting area is apost-discharge region: the presence of radicals and reactive species isdue only to the flow of these species from the space between thetarget and the grid. Thus, it can be expected that the gas consumptionin the target-grid region (in the plasma volume) is greater than in thepost-discharge zone. This effect can lead to a reduction in the reactivegas partial pressure between the target and the grid. This is animportant modification that can be introduced to the model in thefuture.
Fig. 9. The gas consumption by the target (Qt), collecting area (Qc), grid (Qg) andpumping system (Qp) as a function of the nitrogen partial pressure (p) for TMS system.The total nitrogen flow rate (Qtotal) is the sum of the terms Qt, Qc, Qp and Qg, as can beseen in Eq. (12).
Fig. 10. The gas consumption on the collecting (Qc – left) and grid areas (Qg – right) atdifferent values of $.
Fig. 8. The gas consumption by the target (Qt), collecting area (Qc) and pumping system(Qp) as a function of the nitrogen partial pressure (p) for MS system. The total nitrogenflow rate (Qtotal) is the sum of the terms Qt, Qc and Qp, as can be seen in equation Eq. (8).
Fig. 7. The fraction of compound on the target surface ("t) as a function of the nitrogenflow rate (Qtotal) for MS and TMS systems.
1769J.C. Sagás et al. / Surface & Coatings Technology 206 (2011) 1765–1770

Author's personal copy
6. Conclusions
The present paper has successfully employed Berg's model to atriode magnetron sputtering system. The main goal was to investigatethe influence of the grid-to-target distance on the hysteresis loop.Results indicate that as the grid-to-target distance decreases, thehysteresis loop will also decrease. This reduction occurs because theintroduction of the grid reduces gas consumption on the collectingarea (Ac); as a result, the grid will “effectively” reduce Ac. Then, with alower amount of compound and metal deposited on the collectingarea, the gas consumption Qc will decrease and Qg will notcompensate this reduction in Qc. Thus, the nitrogen partial pressurewill increase faster for lower nitrogen flow rates, reducing thehysteresis loop.
Acknowledgments
Authors would like to thank CAPES, FAPESP and the NationalNetwork for Cooperation in Plasma Engineering (RECONPLASMA) bytheir financial support.
References
[1] N. Hellgren, M.P. Johansson, E. Broitman, L. Hultman, J.E. Sundgren, Phys. Rev. B 59(1999) 5162.
[2] V. Stranak, M. Quaas, R. Bogdanowicz, H. Steffen, H.Wulff, Z. Hubicka, M. Tichy, R.J.Hippler, Phys. D: Appl. Phys. 43 (2010) 285203.
[3] S. Mahieu, D. Depla, J. Phys. D: Appl. Phys. 42 (2009) 053002.
[4] S.E. Rodil, J.J. Olaya, J. Phys. Condens. Matter 18 (2006) S1703.[5] S. Berg, T. Nyberg, Thin Solid Films 476 (2005) 215.[6] S. Berg, H.-O. Blom, T. Larsson, C. Nender, J. Vac. Sci. Technol. A 5 (2) (1987) 202.[7] S. Berg, H.-O. Blom, M. Moradi, C. Nender, T. Larsson, J. Vac. Sci. Technol. A 7 (3)
(1989) 1225.[8] D. Depla, G. Buyle, J. Haemers, R. De Gryse, Surf. Coat. Technol. 200 (2006) 4329.[9] D. Depla, S. Mahieu, R. De Gryse, Thin Solid Films 517 (2009) 2825.
[10] D. Depla, S. Heirwegh, S. Mahieu, R. De Gryse, J. Phys. D: Appl. Phys. 40 (2007)1957.
[11] Chuan Li, J.H. Hsieh, J. Phys. D: Appl. Phys. 37 (2004) 1065.[12] Y. Matsuda, K. Otomo, H. Fujiyama, Thin Solid Films 390 (2001) 59.[13] T. Kubart, T. Nyberg, A. Pflug, M. Siemers, M. Augsten, D. Koehl, M. Wuttig, S. Berg,
Surf. Coat. Technol. 204 (2010) 3882.[14] P. Vasina, T. Hytková, M. Eliás, Plasma Sources Sci. Technol. 18 (2009) 025011.[15] A. Ershov, L. Pekker, Thin Solid Films 289 (1996) 140.[16] Chuan Li, J.H. Hsieh, W.M. Huang, Surf. Coat. Technol. 198 (2005) 372.[17] M. Moradi, C. Nender, S. Berg, H.-O. Blom, A. Belkind, Z.J. Orban, J. Vac. Sci. Technol.
A 9 (3) (1991) 619.[18] C. Rousselot, N. Martin, Surf. Coat. Technol. 142–4 (2001) 206.[19] W.D. Sproul, Surf. Coat. Technol. 33 (1987) 73.[20] E. Wallin, U. Helmersson, Thin Solid Films 516 (2008) 6398.[21] F. Engelmark, J. Westlinder, T. Nyberg, S. Berg, J. Vac. Sci. Technol. A 21 (6) (2003)
1981.[22] L.C. Fontana, J.R.L. Muzart, Surf. Coat. Technol. 107 (1998) 24.[23] L.C. Fontana, J.R.L. Muzart, Surf. Coat. Technol. 114 (1999) 7.[24] A.A.C. Recco, D. López, A.F. Bevilacqua, F. Silva, A.P. Tschiptschin, Surf. Coat.
Technol. 202 (2007) 993.[25] A.A.C. Recco, I.C. Oliveira, M. Massi, H.S. Maciel, A.P. Tschiptschin, Surf. Coat.
Technol. 202 (2007) 1078.[26] A.A.C. Recco, C.C. Viáfara, A. Sinatora, A.P. Tschiptschin, Wear 267 (2009) 1146.[27] R. Ranjan, J.P. Allain, M.R. Hendricks, D.N. Ruzic, J. Vac. Sci, Technol. A 19 (3)
(2001) 1004.
Fig. 12. The gas consumption on the collecting (Qc – left) and grid areas (Qg – right) atdifferent grid areas (Ag) for $=0.1.
Fig. 11. The nitrogen partial pressure (p) as a function of the total nitrogen flow rate(Qtotal) at different grid areas (Ag) for $=0.1.
1770 J.C. Sagás et al. / Surface & Coatings Technology 206 (2011) 1765–1770