Modeling of the internal damage of saturated cement paste due to ice crystallization pressure during...
10
Modeling of the internal damage of saturated cement paste due to ice crystallization pressure during freezing Lin Liu a,b,⇑ , Guang Ye b,1 , Erik Schlangen b,2 , Huisu Chen a,3 , Zhiwei Qian b,4 , Wei Sun a,5 , Klaas van Breugel b,6 a Jiangsu Key Laboratory of Construction Materials, School of Material Science and Engineering, Southeast University, Nanjing 211189, China b Microlab, Faculty of Civil Engineering and Geosciences, Delft University of Technology, 2628CN Delft, The Netherlands article info Article history: Received 3 July 2010 Received in revised form 1 March 2011 Accepted 3 March 2011 Available online 9 March 2011 Keywords: Frost action Internal damage model 3D lattice fracture Micro-cracks Microstructure Saturated cement paste abstract In order to quantify the internal damage of saturated cement paste caused by frost action, a damage model is proposed based on the thermodynamics of ice growth and fracturing of hydrated cement paste. According to the pore structure of cement paste from the HYMOSTRUC3D model, the penetration of crys- tals of ice through the pore network is simulated and stresses on the pore walls caused by the crystalli- zation pressure of ice are first calculated. Then, the stresses in the solid skeleton of the microstructure of cement paste are calculated with the help of a three-dimensional (3D) lattice fracture model. Local dam- age, expressed as micro-cracks, is created if the local damage criterion is satisfied. The creation of micro- cracks in saturated cement paste during freezing is illustrated in this paper. The simulated results show that the number of micro-cracks in the microstructure of cement paste increases with decreasing temper- ature and the volume of cement paste increases with decreasing temperature when the temperature is below zero. To validate the model, strains of cement paste during freezing by simulations in this study are further compared with those by experiment. The reliability of the pore size distribution of cement paste by HYMOSTRUC3D simulation is also discussed. Ó 2011 Elsevier Ltd. All rights reserved. 1. Introduction Deterioration of concrete caused by frost action (freezing and thawing cycles) is an important issue with regard to the service life of concrete structures in cold climates. The mechanism of frost damage has been investigated for several decades [1–5]. Powers indicated that harmful stresses could result from hydraulic pres- sure created by the volume increase when water transforms into ice [1]. Scherer argued that the primary source of stresses during freezing should be the crystallization pressure of ice, and not hydraulic pressure [3]. He gave evidence for the importance of crystallization pressure, for a case where hydraulic pressure would not be created, namely the experimental results from Beaudoin and MacInnis [5]. In their experiments, the length change of con- crete during freezing was measured after the pore water had been exchanged with benzene. The fact is that the concrete still expanded, even through the volume of benzene decreases during freezing, and consequently no hydraulic pressure is created in this situation. Based on the mechanism of frost damage, there are many com- peting theories to model cement-based materials exposed to freez- ing temperatures [4,6–8]. Nevertheless, only a few models provide a quantification of internal damage. Regarding the internal freezing damage of cement paste, there are still issues left unaddressed, such as how ice crystals form in the complex pore structure of cement paste, where and how the micro-cracks are created in the microstructure of cement paste, and how the microstructure of cement paste responds to the decreasing temperature. These questions are important for the analysis of freezing damage of cement-based materials, multi-scale modeling of concrete deterio- ration, and service life prediction. The aim of this study is to explore these issues. In this paper, from a virtual microstructure of cement paste ob- tained from HYMOSTRUC3D [9–11], the ice growth process is cap- tured as the temperature decreases. Stresses on the pore walls, locally exerted by crystals of ice, are calculated from the thermody- namics of ice growth and the geometric characteristics of the pores. The stresses in the solid skeleton of the microstructure can 0958-9465/$ - see front matter Ó 2011 Elsevier Ltd. All rights reserved. doi:10.1016/j.cemconcomp.2011.03.001 ⇑ Corresponding author at: Jiangsu Key Laboratory of Construction Materials, School of Material Science and Engineering, Southeast University, Nanjing 211189, China. Tel.: +86 25 52090645; fax: +86 25 52090667. E-mail addresses: [email protected] (L. Liu), [email protected] (G. Ye), [email protected] (E. Schlangen), [email protected] (H. Chen), Z.Qian@- tudelft.nl (Z. Qian), [email protected] (W. Sun), [email protected] (K. van Breugel). 1 Tel.: +31 15 2784001; fax: +31 15 2786383. 2 Tel.: +31 15 2786535; fax: +31 15 2786383. 3 Tel.: +86 25 52090645; fax: +86 25 52090667. 4 Tel.: +31 15 2789342; fax: +31 15 2786383. 5 Tel.: +86 25 83795374; fax: +86 25 52090667. 6 Tel.: +31 15 2784954; fax: +31 15 2786383. Cement & Concrete Composites 33 (2011) 562–571 Contents lists available at ScienceDirect Cement & Concrete Composites journal homepage: www.elsevier.com/locate/cemconcomp
-
Upload
independent -
Category
Documents
-
view
0 -
download
0
Transcript of Modeling of the internal damage of saturated cement paste due to ice crystallization pressure during...
Cement & Concrete Composites 33 (2011) 562–571
Contents lists available at ScienceDirect
Cement & Concrete Composites
journal homepage: www.elsevier .com/locate /cemconcomp
Modeling of the internal damage of saturated cement paste due to icecrystallization pressure during freezing
Lin Liu a,b,⇑, Guang Ye b,1, Erik Schlangen b,2, Huisu Chen a,3, Zhiwei Qian b,4, Wei Sun a,5, Klaas van Breugel b,6
a Jiangsu Key Laboratory of Construction Materials, School of Material Science and Engineering, Southeast University, Nanjing 211189, Chinab Microlab, Faculty of Civil Engineering and Geosciences, Delft University of Technology, 2628CN Delft, The Netherlands
a r t i c l e i n f o
Article history:Received 3 July 2010Received in revised form 1 March 2011Accepted 3 March 2011Available online 9 March 2011
Keywords:Frost actionInternal damage model3D lattice fractureMicro-cracksMicrostructureSaturated cement paste
0958-9465/$ - see front matter � 2011 Elsevier Ltd. Adoi:10.1016/j.cemconcomp.2011.03.001
⇑ Corresponding author at: Jiangsu Key LaboratorSchool of Material Science and Engineering, SoutheasChina. Tel.: +86 25 52090645; fax: +86 25 52090667.
E-mail addresses: [email protected] (L. [email protected] (E. Schlangen), [email protected] (Z. Qian), [email protected] (W. Sun), k.vBreugel).
1 Tel.: +31 15 2784001; fax: +31 15 2786383.2 Tel.: +31 15 2786535; fax: +31 15 2786383.3 Tel.: +86 25 52090645; fax: +86 25 52090667.4 Tel.: +31 15 2789342; fax: +31 15 2786383.5 Tel.: +86 25 83795374; fax: +86 25 52090667.6 Tel.: +31 15 2784954; fax: +31 15 2786383.
a b s t r a c t
In order to quantify the internal damage of saturated cement paste caused by frost action, a damagemodel is proposed based on the thermodynamics of ice growth and fracturing of hydrated cement paste.According to the pore structure of cement paste from the HYMOSTRUC3D model, the penetration of crys-tals of ice through the pore network is simulated and stresses on the pore walls caused by the crystalli-zation pressure of ice are first calculated. Then, the stresses in the solid skeleton of the microstructure ofcement paste are calculated with the help of a three-dimensional (3D) lattice fracture model. Local dam-age, expressed as micro-cracks, is created if the local damage criterion is satisfied. The creation of micro-cracks in saturated cement paste during freezing is illustrated in this paper. The simulated results showthat the number of micro-cracks in the microstructure of cement paste increases with decreasing temper-ature and the volume of cement paste increases with decreasing temperature when the temperature isbelow zero. To validate the model, strains of cement paste during freezing by simulations in this studyare further compared with those by experiment. The reliability of the pore size distribution of cementpaste by HYMOSTRUC3D simulation is also discussed.
� 2011 Elsevier Ltd. All rights reserved.
1. Introduction
Deterioration of concrete caused by frost action (freezing andthawing cycles) is an important issue with regard to the service lifeof concrete structures in cold climates. The mechanism of frostdamage has been investigated for several decades [1–5]. Powersindicated that harmful stresses could result from hydraulic pres-sure created by the volume increase when water transforms intoice [1]. Scherer argued that the primary source of stresses duringfreezing should be the crystallization pressure of ice, and nothydraulic pressure [3]. He gave evidence for the importance ofcrystallization pressure, for a case where hydraulic pressure wouldnot be created, namely the experimental results from Beaudoin
ll rights reserved.
y of Construction Materials,t University, Nanjing 211189,
iu), [email protected] (G. Ye),eu.edu.cn (H. Chen), Z.Qian@[email protected] (K. van
and MacInnis [5]. In their experiments, the length change of con-crete during freezing was measured after the pore water had beenexchanged with benzene. The fact is that the concrete stillexpanded, even through the volume of benzene decreases duringfreezing, and consequently no hydraulic pressure is created in thissituation.
Based on the mechanism of frost damage, there are many com-peting theories to model cement-based materials exposed to freez-ing temperatures [4,6–8]. Nevertheless, only a few models providea quantification of internal damage. Regarding the internal freezingdamage of cement paste, there are still issues left unaddressed,such as how ice crystals form in the complex pore structure ofcement paste, where and how the micro-cracks are created inthe microstructure of cement paste, and how the microstructureof cement paste responds to the decreasing temperature. Thesequestions are important for the analysis of freezing damage ofcement-based materials, multi-scale modeling of concrete deterio-ration, and service life prediction. The aim of this study is toexplore these issues.
In this paper, from a virtual microstructure of cement paste ob-tained from HYMOSTRUC3D [9–11], the ice growth process is cap-tured as the temperature decreases. Stresses on the pore walls,locally exerted by crystals of ice, are calculated from the thermody-namics of ice growth and the geometric characteristics of thepores. The stresses in the solid skeleton of the microstructure can
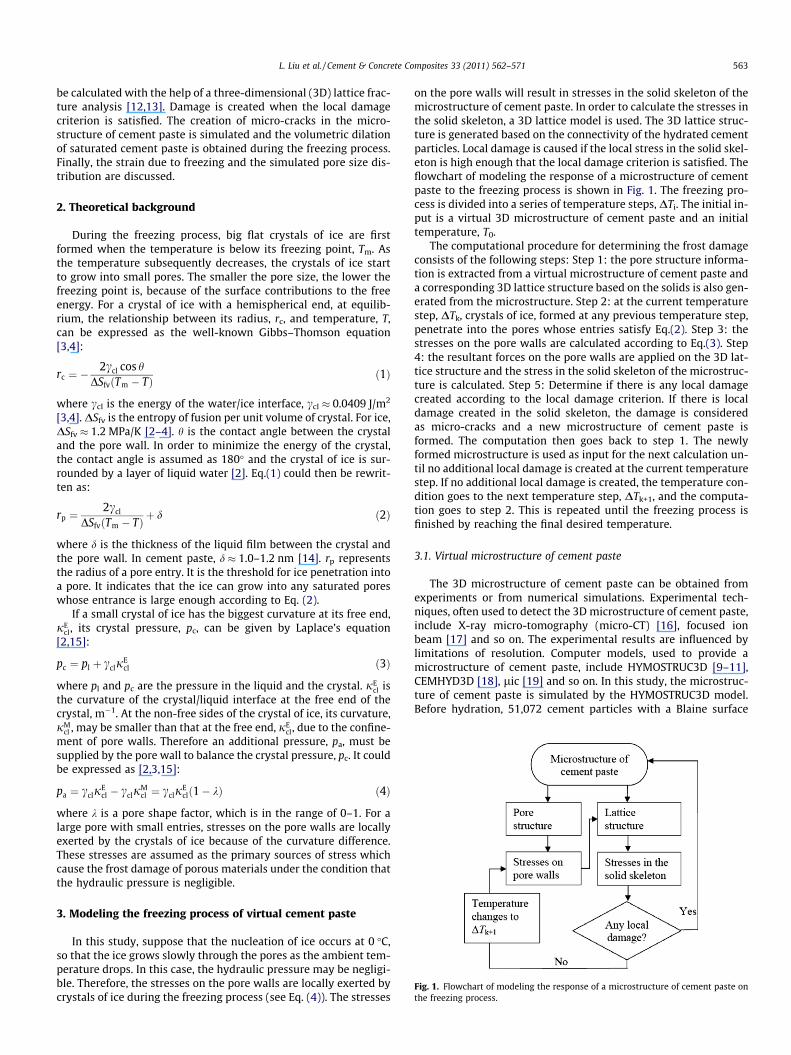
Fig. 1. Flowchart of modeling the response of a microstructure of cement paste onthe freezing process.
L. Liu et al. / Cement & Concrete Composites 33 (2011) 562–571 563
be calculated with the help of a three-dimensional (3D) lattice frac-ture analysis [12,13]. Damage is created when the local damagecriterion is satisfied. The creation of micro-cracks in the micro-structure of cement paste is simulated and the volumetric dilationof saturated cement paste is obtained during the freezing process.Finally, the strain due to freezing and the simulated pore size dis-tribution are discussed.
2. Theoretical background
During the freezing process, big flat crystals of ice are firstformed when the temperature is below its freezing point, Tm. Asthe temperature subsequently decreases, the crystals of ice startto grow into small pores. The smaller the pore size, the lower thefreezing point is, because of the surface contributions to the freeenergy. For a crystal of ice with a hemispherical end, at equilib-rium, the relationship between its radius, rc, and temperature, T,can be expressed as the well-known Gibbs–Thomson equation[3,4]:
rc ¼ �2ccl cos h
DSfvðTm � TÞ ð1Þ
where ccl is the energy of the water/ice interface, ccl � 0.0409 J/m2
[3,4]. DSfv is the entropy of fusion per unit volume of crystal. For ice,DSfv � 1.2 MPa/K [2–4]. h is the contact angle between the crystaland the pore wall. In order to minimize the energy of the crystal,the contact angle is assumed as 180� and the crystal of ice is sur-rounded by a layer of liquid water [2]. Eq.(1) could then be rewrit-ten as:
rp ¼2ccl
DSfvðTm � TÞ þ d ð2Þ
where d is the thickness of the liquid film between the crystal andthe pore wall. In cement paste, d � 1.0–1.2 nm [14]. rp representsthe radius of a pore entry. It is the threshold for ice penetration intoa pore. It indicates that the ice can grow into any saturated poreswhose entrance is large enough according to Eq. (2).
If a small crystal of ice has the biggest curvature at its free end,jE
cl, its crystal pressure, pc, can be given by Laplace’s equation[2,15]:
pc ¼ pl þ ccljEcl ð3Þ
where pl and pc are the pressure in the liquid and the crystal. jEcl is
the curvature of the crystal/liquid interface at the free end of thecrystal, m�1. At the non-free sides of the crystal of ice, its curvature,jM
cl , may be smaller than that at the free end, jEcl, due to the confine-
ment of pore walls. Therefore an additional pressure, pa, must besupplied by the pore wall to balance the crystal pressure, pc. It couldbe expressed as [2,3,15]:
pa ¼ ccljEcl � cclj
Mcl ¼ cclj
Eclð1� kÞ ð4Þ
where k is a pore shape factor, which is in the range of 0–1. For alarge pore with small entries, stresses on the pore walls are locallyexerted by the crystals of ice because of the curvature difference.These stresses are assumed as the primary sources of stress whichcause the frost damage of porous materials under the condition thatthe hydraulic pressure is negligible.
3. Modeling the freezing process of virtual cement paste
In this study, suppose that the nucleation of ice occurs at 0 �C,so that the ice grows slowly through the pores as the ambient tem-perature drops. In this case, the hydraulic pressure may be negligi-ble. Therefore, the stresses on the pore walls are locally exerted bycrystals of ice during the freezing process (see Eq. (4)). The stresses
on the pore walls will result in stresses in the solid skeleton of themicrostructure of cement paste. In order to calculate the stresses inthe solid skeleton, a 3D lattice model is used. The 3D lattice struc-ture is generated based on the connectivity of the hydrated cementparticles. Local damage is caused if the local stress in the solid skel-eton is high enough that the local damage criterion is satisfied. Theflowchart of modeling the response of a microstructure of cementpaste to the freezing process is shown in Fig. 1. The freezing pro-cess is divided into a series of temperature steps, DTi. The initial in-put is a virtual 3D microstructure of cement paste and an initialtemperature, T0.
The computational procedure for determining the frost damageconsists of the following steps: Step 1: the pore structure informa-tion is extracted from a virtual microstructure of cement paste anda corresponding 3D lattice structure based on the solids is also gen-erated from the microstructure. Step 2: at the current temperaturestep, DTk, crystals of ice, formed at any previous temperature step,penetrate into the pores whose entries satisfy Eq.(2). Step 3: thestresses on the pore walls are calculated according to Eq.(3). Step4: the resultant forces on the pore walls are applied on the 3D lat-tice structure and the stress in the solid skeleton of the microstruc-ture is calculated. Step 5: Determine if there is any local damagecreated according to the local damage criterion. If there is localdamage created in the solid skeleton, the damage is consideredas micro-cracks and a new microstructure of cement paste isformed. The computation then goes back to step 1. The newlyformed microstructure is used as input for the next calculation un-til no additional local damage is created at the current temperaturestep. If no additional local damage is created, the temperature con-dition goes to the next temperature step, DTk+1, and the computa-tion goes to step 2. This is repeated until the freezing process isfinished by reaching the final desired temperature.
3.1. Virtual microstructure of cement paste
The 3D microstructure of cement paste can be obtained fromexperiments or from numerical simulations. Experimental tech-niques, often used to detect the 3D microstructure of cement paste,include X-ray micro-tomography (micro-CT) [16], focused ionbeam [17] and so on. The experimental results are influenced bylimitations of resolution. Computer models, used to provide amicrostructure of cement paste, include HYMOSTRUC3D [9–11],CEMHYD3D [18], lic [19] and so on. In this study, the microstruc-ture of cement paste is simulated by the HYMOSTRUC3D model.Before hydration, 51,072 cement particles with a Blaine surface
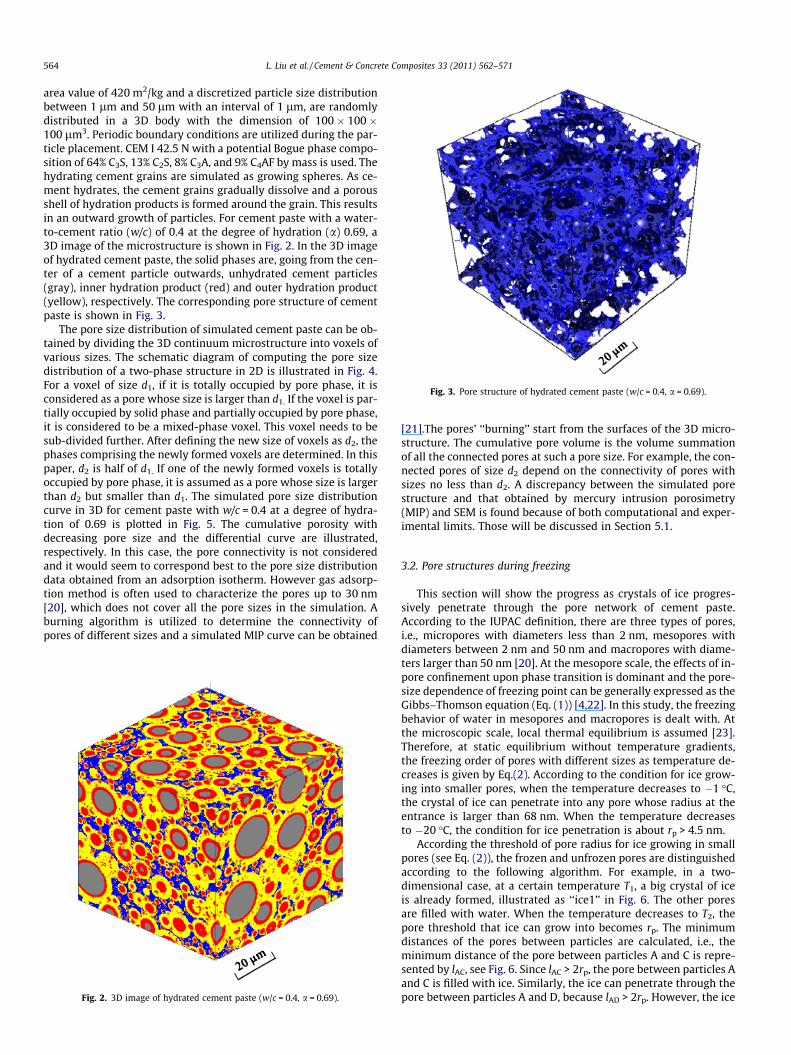
Fig. 3. Pore structure of hydrated cement paste (w/c = 0.4, a = 0.69).
564 L. Liu et al. / Cement & Concrete Composites 33 (2011) 562–571
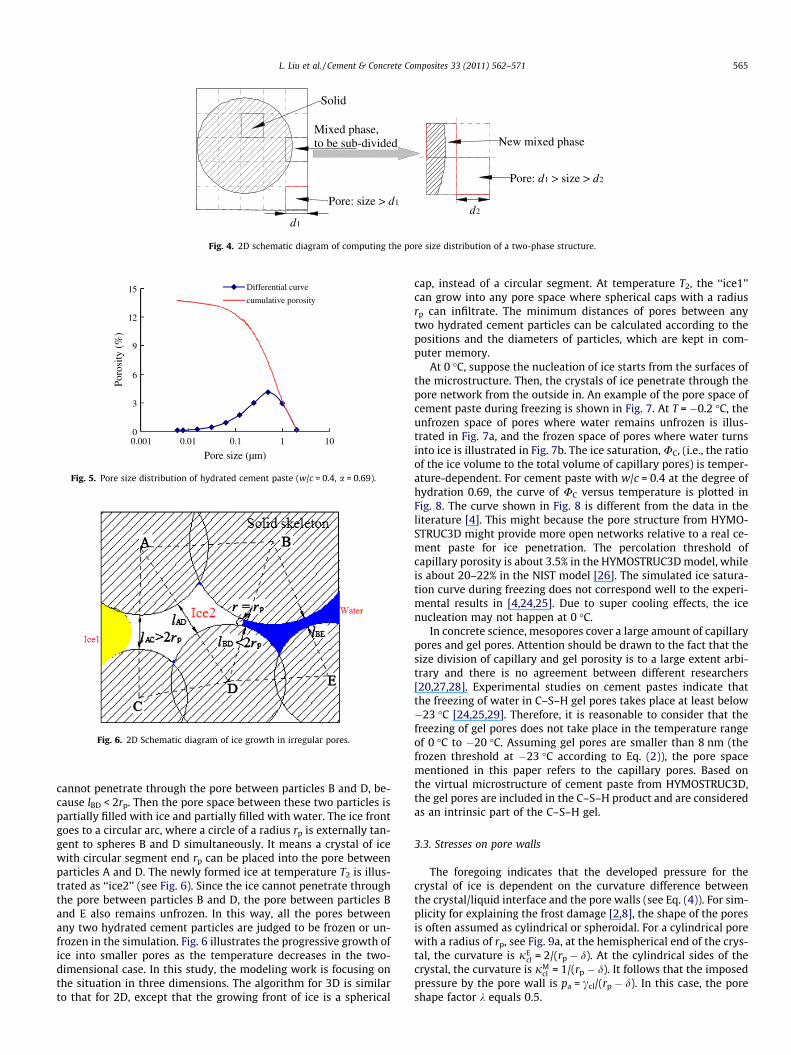
area value of 420 m2/kg and a discretized particle size distributionbetween 1 lm and 50 lm with an interval of 1 lm, are randomlydistributed in a 3D body with the dimension of 100 � 100 �100 lm3. Periodic boundary conditions are utilized during the par-ticle placement. CEM I 42.5 N with a potential Bogue phase compo-sition of 64% C3S, 13% C2S, 8% C3A, and 9% C4AF by mass is used. Thehydrating cement grains are simulated as growing spheres. As ce-ment hydrates, the cement grains gradually dissolve and a porousshell of hydration products is formed around the grain. This resultsin an outward growth of particles. For cement paste with a water-to-cement ratio (w/c) of 0.4 at the degree of hydration (a) 0.69, a3D image of the microstructure is shown in Fig. 2. In the 3D imageof hydrated cement paste, the solid phases are, going from the cen-ter of a cement particle outwards, unhydrated cement particles(gray), inner hydration product (red) and outer hydration product(yellow), respectively. The corresponding pore structure of cementpaste is shown in Fig. 3.
The pore size distribution of simulated cement paste can be ob-tained by dividing the 3D continuum microstructure into voxels ofvarious sizes. The schematic diagram of computing the pore sizedistribution of a two-phase structure in 2D is illustrated in Fig. 4.For a voxel of size d1, if it is totally occupied by pore phase, it isconsidered as a pore whose size is larger than d1. If the voxel is par-tially occupied by solid phase and partially occupied by pore phase,it is considered to be a mixed-phase voxel. This voxel needs to besub-divided further. After defining the new size of voxels as d2, thephases comprising the newly formed voxels are determined. In thispaper, d2 is half of d1. If one of the newly formed voxels is totallyoccupied by pore phase, it is assumed as a pore whose size is largerthan d2 but smaller than d1. The simulated pore size distributioncurve in 3D for cement paste with w/c = 0.4 at a degree of hydra-tion of 0.69 is plotted in Fig. 5. The cumulative porosity withdecreasing pore size and the differential curve are illustrated,respectively. In this case, the pore connectivity is not consideredand it would seem to correspond best to the pore size distributiondata obtained from an adsorption isotherm. However gas adsorp-tion method is often used to characterize the pores up to 30 nm[20], which does not cover all the pore sizes in the simulation. Aburning algorithm is utilized to determine the connectivity ofpores of different sizes and a simulated MIP curve can be obtained
Fig. 2. 3D image of hydrated cement paste (w/c = 0.4, a = 0.69).
[21].The pores’ ‘‘burning’’ start from the surfaces of the 3D micro-structure. The cumulative pore volume is the volume summationof all the connected pores at such a pore size. For example, the con-nected pores of size d2 depend on the connectivity of pores withsizes no less than d2. A discrepancy between the simulated porestructure and that obtained by mercury intrusion porosimetry(MIP) and SEM is found because of both computational and exper-imental limits. Those will be discussed in Section 5.1.
3.2. Pore structures during freezing
This section will show the progress as crystals of ice progres-sively penetrate through the pore network of cement paste.According to the IUPAC definition, there are three types of pores,i.e., micropores with diameters less than 2 nm, mesopores withdiameters between 2 nm and 50 nm and macropores with diame-ters larger than 50 nm [20]. At the mesopore scale, the effects of in-pore confinement upon phase transition is dominant and the pore-size dependence of freezing point can be generally expressed as theGibbs–Thomson equation (Eq. (1)) [4,22]. In this study, the freezingbehavior of water in mesopores and macropores is dealt with. Atthe microscopic scale, local thermal equilibrium is assumed [23].Therefore, at static equilibrium without temperature gradients,the freezing order of pores with different sizes as temperature de-creases is given by Eq.(2). According to the condition for ice grow-ing into smaller pores, when the temperature decreases to �1 �C,the crystal of ice can penetrate into any pore whose radius at theentrance is larger than 68 nm. When the temperature decreasesto �20 �C, the condition for ice penetration is about rp > 4.5 nm.
According the threshold of pore radius for ice growing in smallpores (see Eq. (2)), the frozen and unfrozen pores are distinguishedaccording to the following algorithm. For example, in a two-dimensional case, at a certain temperature T1, a big crystal of iceis already formed, illustrated as ‘‘ice1’’ in Fig. 6. The other poresare filled with water. When the temperature decreases to T2, thepore threshold that ice can grow into becomes rp. The minimumdistances of the pores between particles are calculated, i.e., theminimum distance of the pore between particles A and C is repre-sented by lAC, see Fig. 6. Since lAC > 2rp, the pore between particles Aand C is filled with ice. Similarly, the ice can penetrate through thepore between particles A and D, because lAD > 2rp. However, the ice
Solid
Pore: size > d1
d1
Mixed phase,to be sub-divided
Pore: d1 > size > d2
New mixed phase
d2
Fig. 4. 2D schematic diagram of computing the pore size distribution of a two-phase structure.
0
3
6
9
12
15
0.001 0.01 0.1 1 10
Pore size (µm)
Poro
sity
(%
)
Differential curve
cumulative porosity
Fig. 5. Pore size distribution of hydrated cement paste (w/c = 0.4, a = 0.69).
Fig. 6. 2D Schematic diagram of ice growth in irregular pores.
L. Liu et al. / Cement & Concrete Composites 33 (2011) 562–571 565
cannot penetrate through the pore between particles B and D, be-cause lBD < 2rp. Then the pore space between these two particles ispartially filled with ice and partially filled with water. The ice frontgoes to a circular arc, where a circle of a radius rp is externally tan-gent to spheres B and D simultaneously. It means a crystal of icewith circular segment end rp can be placed into the pore betweenparticles A and D. The newly formed ice at temperature T2 is illus-trated as ‘‘ice2’’ (see Fig. 6). Since the ice cannot penetrate throughthe pore between particles B and D, the pore between particles Band E also remains unfrozen. In this way, all the pores betweenany two hydrated cement particles are judged to be frozen or un-frozen in the simulation. Fig. 6 illustrates the progressive growth ofice into smaller pores as the temperature decreases in the two-dimensional case. In this study, the modeling work is focusing onthe situation in three dimensions. The algorithm for 3D is similarto that for 2D, except that the growing front of ice is a spherical
cap, instead of a circular segment. At temperature T2, the ‘‘ice1’’can grow into any pore space where spherical caps with a radiusrp can infiltrate. The minimum distances of pores between anytwo hydrated cement particles can be calculated according to thepositions and the diameters of particles, which are kept in com-puter memory.
At 0 �C, suppose the nucleation of ice starts from the surfaces ofthe microstructure. Then, the crystals of ice penetrate through thepore network from the outside in. An example of the pore space ofcement paste during freezing is shown in Fig. 7. At T = �0.2 �C, theunfrozen space of pores where water remains unfrozen is illus-trated in Fig. 7a, and the frozen space of pores where water turnsinto ice is illustrated in Fig. 7b. The ice saturation, UC, (i.e., the ratioof the ice volume to the total volume of capillary pores) is temper-ature-dependent. For cement paste with w/c = 0.4 at the degree ofhydration 0.69, the curve of UC versus temperature is plotted inFig. 8. The curve shown in Fig. 8 is different from the data in theliterature [4]. This might because the pore structure from HYMO-STRUC3D might provide more open networks relative to a real ce-ment paste for ice penetration. The percolation threshold ofcapillary porosity is about 3.5% in the HYMOSTRUC3D model, whileis about 20–22% in the NIST model [26]. The simulated ice satura-tion curve during freezing does not correspond well to the experi-mental results in [4,24,25]. Due to super cooling effects, the icenucleation may not happen at 0 �C.
In concrete science, mesopores cover a large amount of capillarypores and gel pores. Attention should be drawn to the fact that thesize division of capillary and gel porosity is to a large extent arbi-trary and there is no agreement between different researchers[20,27,28]. Experimental studies on cement pastes indicate thatthe freezing of water in C–S–H gel pores takes place at least below�23 �C [24,25,29]. Therefore, it is reasonable to consider that thefreezing of gel pores does not take place in the temperature rangeof 0 �C to �20 �C. Assuming gel pores are smaller than 8 nm (thefrozen threshold at �23 �C according to Eq. (2)), the pore spacementioned in this paper refers to the capillary pores. Based onthe virtual microstructure of cement paste from HYMOSTRUC3D,the gel pores are included in the C–S–H product and are consideredas an intrinsic part of the C–S–H gel.
3.3. Stresses on pore walls
The foregoing indicates that the developed pressure for thecrystal of ice is dependent on the curvature difference betweenthe crystal/liquid interface and the pore walls (see Eq. (4)). For sim-plicity for explaining the frost damage [2,8], the shape of the poresis often assumed as cylindrical or spheroidal. For a cylindrical porewith a radius of rp, see Fig. 9a, at the hemispherical end of the crys-tal, the curvature is jE
cl = 2/(rp � d). At the cylindrical sides of thecrystal, the curvature is jM
cl = 1/(rp � d). It follows that the imposedpressure by the pore wall is pa = ccl/(rp � d). In this case, the poreshape factor k equals 0.5.
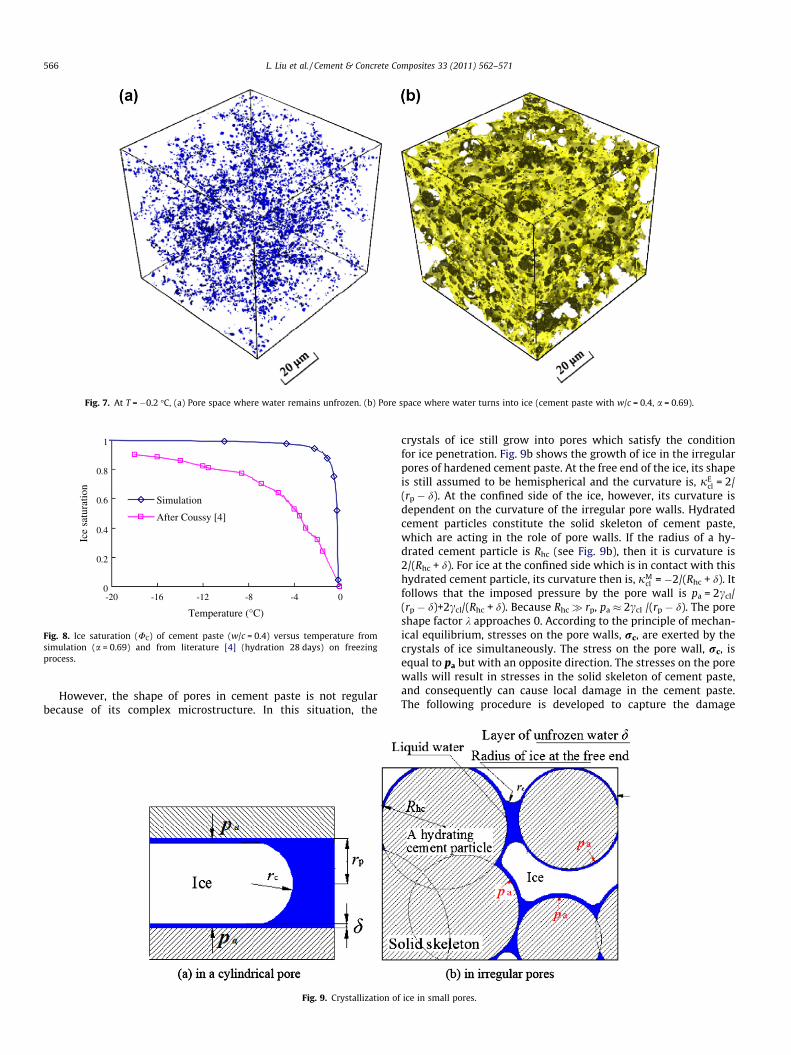
Fig. 7. At T = �0.2 �C, (a) Pore space where water remains unfrozen. (b) Pore space where water turns into ice (cement paste with w/c = 0.4, a = 0.69).
0
0.2
0.4
0.6
0.8
1
-20 -16 -12 -8 -4 0
Temperature (°C)
Ice
satu
ratio
n
Simulation
After Coussy [4]
Fig. 8. Ice saturation (UC) of cement paste (w/c = 0.4) versus temperature fromsimulation (a = 0.69) and from literature [4] (hydration 28 days) on freezingprocess.
566 L. Liu et al. / Cement & Concrete Composites 33 (2011) 562–571
However, the shape of pores in cement paste is not regularbecause of its complex microstructure. In this situation, the
Fig. 9. Crystallization of
crystals of ice still grow into pores which satisfy the conditionfor ice penetration. Fig. 9b shows the growth of ice in the irregularpores of hardened cement paste. At the free end of the ice, its shapeis still assumed to be hemispherical and the curvature is, jE
cl = 2/(rp � d). At the confined side of the ice, however, its curvature isdependent on the curvature of the irregular pore walls. Hydratedcement particles constitute the solid skeleton of cement paste,which are acting in the role of pore walls. If the radius of a hy-drated cement particle is Rhc (see Fig. 9b), then it is curvature is2/(Rhc + d). For ice at the confined side which is in contact with thishydrated cement particle, its curvature then is, jM
cl = �2/(Rhc + d). Itfollows that the imposed pressure by the pore wall is pa = 2ccl/(rp � d)+2ccl/(Rhc + d). Because Rhc� rp, pa � 2ccl /(rp � d). The poreshape factor k approaches 0. According to the principle of mechan-ical equilibrium, stresses on the pore walls, rc, are exerted by thecrystals of ice simultaneously. The stress on the pore wall, rc, isequal to pa but with an opposite direction. The stresses on the porewalls will result in stresses in the solid skeleton of cement paste,and consequently can cause local damage in the cement paste.The following procedure is developed to capture the damage
ice in small pores.
Fig. 11. Schematic of generation of one beam element [13,30].
Fig. 12. 3D lattice mesh of hydrated cement paste (w/c = 0.4, a = 0.69).
L. Liu et al. / Cement & Concrete Composites 33 (2011) 562–571 567
locally created in the microstructure of cement paste during thefreezing process.
3.4. Resultant forces caused by frost action
The resultant force on each hydrated cement particle is an inte-gration of the stress generated on the pore wall rc on the surfaces¶Oc. ¶Oc represents the surfaces of the hydrated cement particlethat is in contact with ice. It can be written as:
fi ¼Z
›Xc
rc � ›X ð5Þ
where fi is a tensor, representing the external force on the ith hy-drated cement particle. rc represents the stress generated on thepore wall and can be obtained according to Section 3.3. As shownin Fig. 10, for the hydrated cement particle A, the surfaces thatare in contact with ice, are represented by ¶Oc1 and ¶Oc2, respec-tively. The stresses on the surface ¶Oc1 and ¶Oc2 are rc1 and rc2,respectively. The resultant force on hydrated cement particle A, fA,is:
fA ¼Z
›Xc1
rc1 � ›XþZ
›Xc2
rc2 � ›X ð6Þ
Then the resultant force, fA, is imposed at the center of particle A,see Fig. 10. Similarly, the resultant force on hydrated cement parti-cle B, fB, can be calculated and imposed at the center of particle B. Inthis way, all the resultant forces on each hydrated cement particlecan be established in the 3D microstructure of the hydrated cementpaste.
3.5. Fracturing of the lattice structure of cement paste
To obtain the stress in the solid skeleton of the microstructure, a3D lattice structure of cement paste is first generated according tothe following principles:
Every hydrated cement particle is considered as a node and everytwo connected hydrated cement particles are considered as onebeam element. The geometry parameter of a beam element (l andh) is determined by the distance between the two nodes and thediameter of the contact area with which two hydrated cement par-ticles are connected (see Fig. 11). The Young’s modulus and shearmodulus (En, Gn) of a node are the weighted averages of those ofits component solid phases, and the Young’s modulus and shearmodulus (E, G) of an element are the weighted averages of those ofits two component nodes [13,30]. A lattice structure of cement pastewith w/c = 0.4 at 0.69 degree of hydration is shown in Fig. 12.
The next step is to define the boundary conditions for the latticestructure and to apply the forces caused by ice crystallization on
Fig. 10. 2D Schematic diagram of imposing resultant forces in the microstructure ofcement paste.
each node. Here, free expansion of the sample is assumed. Theforces caused by ice crystallization are obtained and imposed oneach node according to Section 3.4 and then a stress analysis isconducted. The stress analysis, in principle, is a sequence of elasticstress calculations for the lattice structure. A detailed descriptionof the lattice analyses of cement paste can be found in the litera-ture [31]. It is assumed that when the tensile stress is larger thanthe tensile strength of a beam element, the beam element frac-tures. This is the local damage criterion. The tensile strength ofan element is determined based on its weakest zone by weightedaveraging. As shown in Fig. 11, the weakest zone is on plane AB,and the tensile strength of the element, ft, is:
ft ¼R2
i
R2o
fi þR2
o � R2i
R2o
fo ð7Þ
where Ri and Ro represent the radii of inner product and outer prod-uct for the cross-section, respectively. fi and fo represents the tensilestrength of inner product and outer product, respectively. The val-ues of elastic properties and tensile strength of solid phases arelisted in Table 1 [32–34]. Research is ongoing to determine the truerelationship between tensile stress analyzed with the model andtensile strength of the local material. This might lead to correctionsin a later stage, because of model parameters and size effects onstrength.
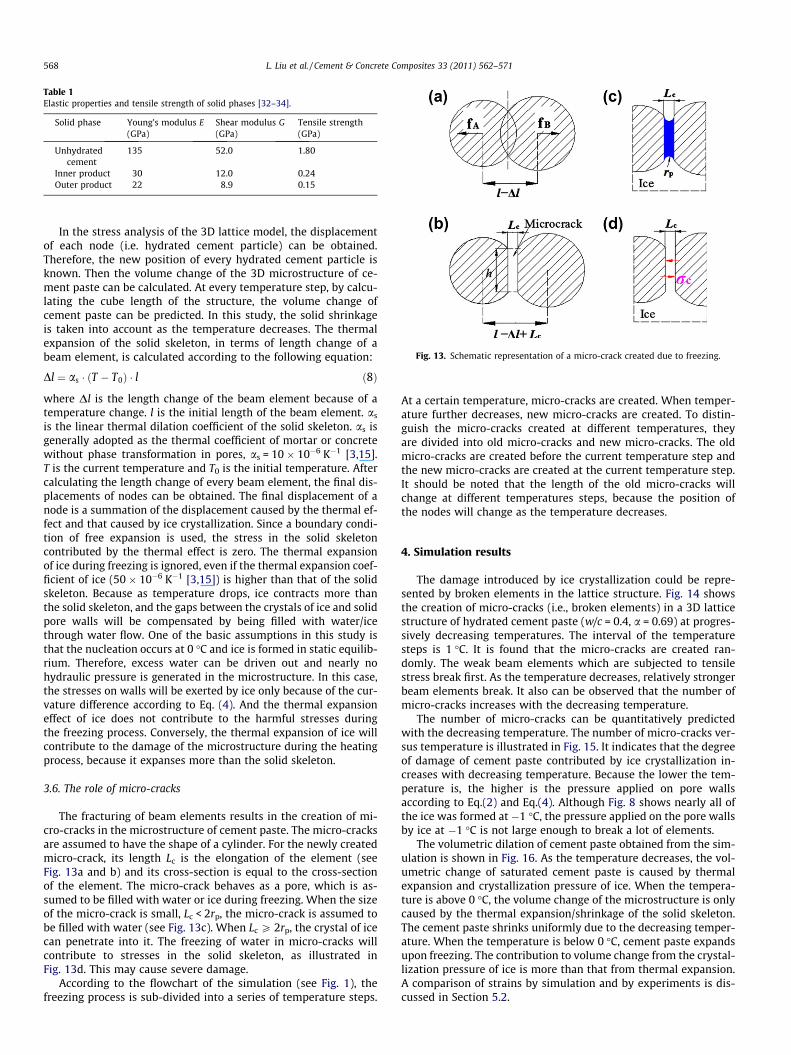
Table 1Elastic properties and tensile strength of solid phases [32–34].
Solid phase Young’s modulus E(GPa)
Shear modulus G(GPa)
Tensile strength(GPa)
Unhydratedcement
135 52.0 1.80
Inner product 30 12.0 0.24Outer product 22 8.9 0.15
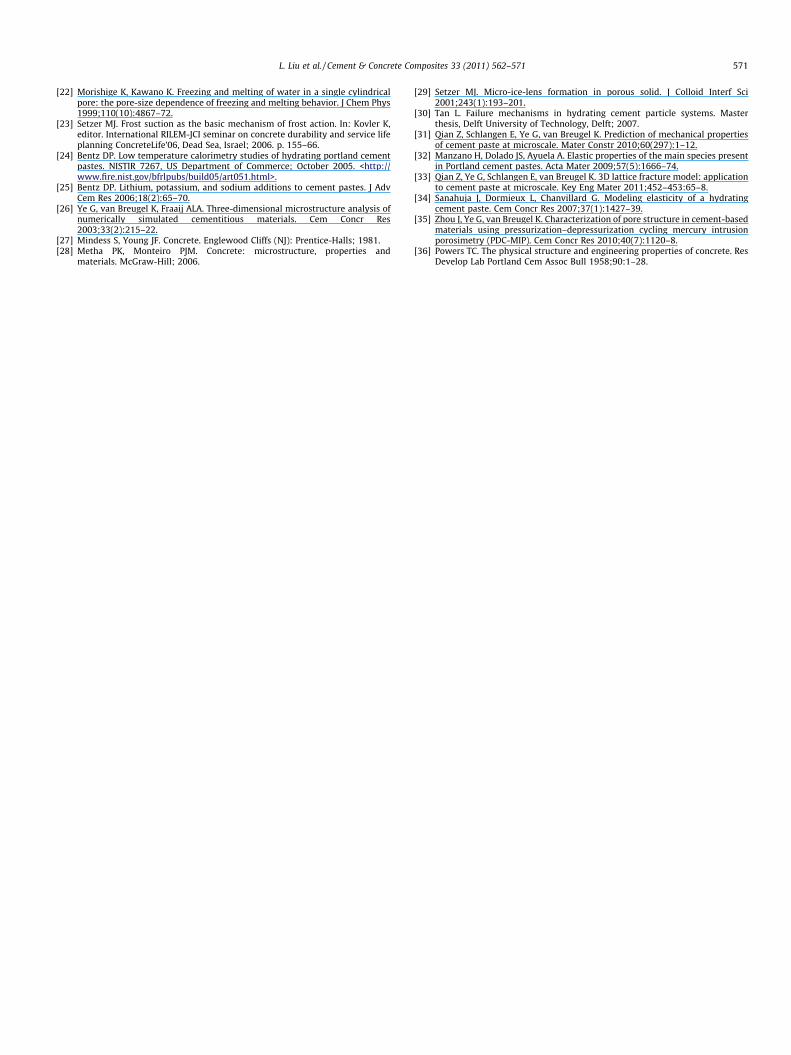
Fig. 13. Schematic representation of a micro-crack created due to freezing.
568 L. Liu et al. / Cement & Concrete Composites 33 (2011) 562–571
In the stress analysis of the 3D lattice model, the displacementof each node (i.e. hydrated cement particle) can be obtained.Therefore, the new position of every hydrated cement particle isknown. Then the volume change of the 3D microstructure of ce-ment paste can be calculated. At every temperature step, by calcu-lating the cube length of the structure, the volume change ofcement paste can be predicted. In this study, the solid shrinkageis taken into account as the temperature decreases. The thermalexpansion of the solid skeleton, in terms of length change of abeam element, is calculated according to the following equation:
Dl ¼ as � ðT � T0Þ � l ð8Þ
where Dl is the length change of the beam element because of atemperature change. l is the initial length of the beam element. as
is the linear thermal dilation coefficient of the solid skeleton. as isgenerally adopted as the thermal coefficient of mortar or concretewithout phase transformation in pores, as = 10 � 10�6 K�1 [3,15].T is the current temperature and T0 is the initial temperature. Aftercalculating the length change of every beam element, the final dis-placements of nodes can be obtained. The final displacement of anode is a summation of the displacement caused by the thermal ef-fect and that caused by ice crystallization. Since a boundary condi-tion of free expansion is used, the stress in the solid skeletoncontributed by the thermal effect is zero. The thermal expansionof ice during freezing is ignored, even if the thermal expansion coef-ficient of ice (50 � 10�6 K�1 [3,15]) is higher than that of the solidskeleton. Because as temperature drops, ice contracts more thanthe solid skeleton, and the gaps between the crystals of ice and solidpore walls will be compensated by being filled with water/icethrough water flow. One of the basic assumptions in this study isthat the nucleation occurs at 0 �C and ice is formed in static equilib-rium. Therefore, excess water can be driven out and nearly nohydraulic pressure is generated in the microstructure. In this case,the stresses on walls will be exerted by ice only because of the cur-vature difference according to Eq. (4). And the thermal expansioneffect of ice does not contribute to the harmful stresses duringthe freezing process. Conversely, the thermal expansion of ice willcontribute to the damage of the microstructure during the heatingprocess, because it expanses more than the solid skeleton.
3.6. The role of micro-cracks
The fracturing of beam elements results in the creation of mi-cro-cracks in the microstructure of cement paste. The micro-cracksare assumed to have the shape of a cylinder. For the newly createdmicro-crack, its length Lc is the elongation of the element (seeFig. 13a and b) and its cross-section is equal to the cross-sectionof the element. The micro-crack behaves as a pore, which is as-sumed to be filled with water or ice during freezing. When the sizeof the micro-crack is small, Lc < 2rp, the micro-crack is assumed tobe filled with water (see Fig. 13c). When Lc P 2rp, the crystal of icecan penetrate into it. The freezing of water in micro-cracks willcontribute to stresses in the solid skeleton, as illustrated inFig. 13d. This may cause severe damage.
According to the flowchart of the simulation (see Fig. 1), thefreezing process is sub-divided into a series of temperature steps.
At a certain temperature, micro-cracks are created. When temper-ature further decreases, new micro-cracks are created. To distin-guish the micro-cracks created at different temperatures, theyare divided into old micro-cracks and new micro-cracks. The oldmicro-cracks are created before the current temperature step andthe new micro-cracks are created at the current temperature step.It should be noted that the length of the old micro-cracks willchange at different temperatures steps, because the position ofthe nodes will change as the temperature decreases.
4. Simulation results
The damage introduced by ice crystallization could be repre-sented by broken elements in the lattice structure. Fig. 14 showsthe creation of micro-cracks (i.e., broken elements) in a 3D latticestructure of hydrated cement paste (w/c = 0.4, a = 0.69) at progres-sively decreasing temperatures. The interval of the temperaturesteps is 1 �C. It is found that the micro-cracks are created ran-domly. The weak beam elements which are subjected to tensilestress break first. As the temperature decreases, relatively strongerbeam elements break. It also can be observed that the number ofmicro-cracks increases with the decreasing temperature.
The number of micro-cracks can be quantitatively predictedwith the decreasing temperature. The number of micro-cracks ver-sus temperature is illustrated in Fig. 15. It indicates that the degreeof damage of cement paste contributed by ice crystallization in-creases with decreasing temperature. Because the lower the tem-perature is, the higher is the pressure applied on pore wallsaccording to Eq.(2) and Eq.(4). Although Fig. 8 shows nearly all ofthe ice was formed at �1 �C, the pressure applied on the pore wallsby ice at �1 �C is not large enough to break a lot of elements.
The volumetric dilation of cement paste obtained from the sim-ulation is shown in Fig. 16. As the temperature decreases, the vol-umetric change of saturated cement paste is caused by thermalexpansion and crystallization pressure of ice. When the tempera-ture is above 0 �C, the volume change of the microstructure is onlycaused by the thermal expansion/shrinkage of the solid skeleton.The cement paste shrinks uniformly due to the decreasing temper-ature. When the temperature is below 0 �C, cement paste expandsupon freezing. The contribution to volume change from the crystal-lization pressure of ice is more than that from thermal expansion.A comparison of strains by simulation and by experiments is dis-cussed in Section 5.2.

0
50
100
150
200
250
300
-20 -15 -10 -5 0
Temperature (°C)
Num
ber
of m
icro
crac
ks
Fig. 15. The number of micro-cracks in the microstructure of cement paste withdecreasing temperature (w/c = 0.4, a = 0.69, cube length = 100 lm).
T= −20 °C = −6 °CT T= −12 °C
Fig. 14. Micro-cracks created in cement paste at different temperatures (w/c = 0.4, a = 0.69).
L. Liu et al. / Cement & Concrete Composites 33 (2011) 562–571 569
5. Discussion
5.1. Comparison of pore size distributions by simulation and byexperimental techniques
As indicated in Section 3.2, the pore structure of cement paste isimportant for analyzing the freezing behavior of cement paste.Therefore the reliability of the simulated pore structures (i.e., pore
-0.10
-0.05
0.00
0.05
0.10
0.15
0.20
0.25
0.30
-20 -15 -10 -5 0 5 10
Temperature (°C)
Vol
umet
ric
dila
tion
(%)
total
thermal effect
crystallization
Fig. 16. Contributions to the volumetric dilation of cement paste (w/c = 0.4,a = 0.69) with decreasing temperature.
size distribution) of cement paste by HYMOSTRUC3D simulation isdiscussed in the current study. By use of a burning algorithm onthe 3D microstructure, a MIP pore size distribution is simulated.The pore size distribution by simulation is compared with thosemeasured by standard MIP test [11], pressurization-depressuriza-tion cycling (PDC) MIP test [35] and BSE images analysis [11], seeFig. 17. The specimens used by those experiments are ordinaryPortland cement pastes (CEMI 42.5 N, w/c 0.4) with 28 days hydra-tion. According to the cement hydration model HYMOSTRUC3D,the degree of hydration of cement paste (CEMI 42.5 N, w/c = 0.4)is about 0.69 after hydration for 28 days.
By comparing to experiments, it is observed that the shape ofthe simulated pore size distribution curve is similar to those ob-tained by processing BSE images of cement paste and the PDC-MIP test. ‘‘An ‘accessible effect’’’ can be obviously observed whenthe pore size is no less than 1 lm and disappears at 0.5 lm inthe simulation, because pore percolation occurs at 0.5 lm poresize. Discrepancies of the pore size distribution between simula-tion and experimental tests shown in Fig. 17 might result fromsome basic assumptions in cement paste simulation from theHYMOSTRUC3D model. The pores with sizes larger than 2 lm arenot seen in the simulation, while they exist in the experimental re-sults. This may be related to the real world flocculation of cementparticles, which is not included in the HYMOSTRUC3D simulation.Because of computational limitations, the minimum diameter of
0
0.05
0.1
0.15
0.2
0.25
0.001 0.01 0.1 1 10 100
Pore size (µm)
Cum
ulat
ive
poro
sity
PDC-MIP
SEM
standard MIP
Simulation =0.69
Fig. 17. Pore size distributions of cement paste by HYMOSTRUC3D simulation,standard MIP test [11], PDC-MIP test [35] and BSE image analysis [11] (CEMI 42.5 N,w/c 0.4, age 28 days).
0
500
1000
1500
2000
2500
3000
3500
4000
-20 -15 -10 -5 0 5 10Temperature (°C)
Lin
ear
stra
in (
×10
--6 )
Experiment from Powers
Simulation =0.81
Fig. 18. Linear strains of saturated cement paste during freezing obtained bysimulation and by experiments (after Powers [36]).
570 L. Liu et al. / Cement & Concrete Composites 33 (2011) 562–571
cement particles is assumed to be 1 lm in this study. However, realcements have a certain number of particles with sizes smaller than1 lm. Additionally, HYMOSTRUC3D models hydration as theexpansion of concentric shells around the original cement particlesand does not include precipitation of products such as calciumhydroxide within the pore spaces between particles. A detailed dis-cussion about the pore structure characteristics with the HYMO-STRUC3D model can be found in literature [26].
5.2. Comparison of strains by simulations and by experiments
The simulated linear strain of cement paste during freezing iscompared with the experimental result from Powers [36], seeFig. 18. For cement paste with w/c of 0.6, the discrepancy betweenthe measured and simulated strains is significant. A delayed nucle-ation is observed from the experiment. Crystals of ice nucleate at atemperature of about �5 �C. This might be the reason that, in thetemperature range of �1 �C to �7 �C, the experimental result islower than the simulated one, which assumes that nucleation oc-curs at 0 �C. The simulated strain is higher than that by experi-ments when the temperature is lower than �12 �C. This mightresult from the experimental conditions. Experimental resultsmay be influenced by the temperature decreasing rate, the speci-men size, the saturation degree of specimens and so on. In addi-tion, the microstructure of cement paste from HYMOSTRUC3Dmodel has a high connectivity of capillary pores [26]. As a conse-quence, the ice propagation through the pore network might befaster than that in real cement paste specimens (see Fig. 8).
6. Conclusion
Based on the assumption that the primary source of stress dur-ing freezing is the crystallization pressure of ice, the internal dam-age of saturated cement paste exposed to low temperatures issimulated at a microscopic scale. On the basis of a virtual micro-structure of cement paste obtained from HYMOSTRUC3D, the for-mation of ice in the pore structure of cement paste is simulated.The microstructural change of cement paste is analyzed and thecreation of micro-cracks in the microstructure of saturated cementpaste is predicted quantitatively. The simulated results show thatthe number of micro-cracks increases with the decreasing temper-ature and the volumetric dilation of cement paste increases withdecreasing temperature when the temperature is below zero. Bycomparing to experimental results, it is found that the overall highconnectivity of the HYMOSTRUC3D pore structure with its statedpercolation threshold of 3.5% is considered as a major contributionto the differences between experimental and model results in Figs.8, 17 and 18.
This study focused on assessing the internal damage of cementpaste caused by the crystallization pressure of ice during the freez-ing process. The influence of liquid pressure is not considered un-der a drained condition at the microscopic scale. The assessment ofthe internal damage caused by hydraulic pressure and a compari-son with the internal damage caused by ice crystallization will bestudied in future research. In addition to the internal damage ofsaturated cement paste, this model will be extended to considerthe effects of air voids and the cryo-suction action during the freez-ing process in the future.
The damaged microstructure of cement paste provides informa-tion for predicting mechanical and transport properties of cementpaste through its life and can be used as an input for multi-scalemodeling of concrete or mortar properties. A future study will bedevoted to a systematic comparison of the numerical results withexperimental data.
Acknowledgements
The financial support of the National Basic Research Program(973 Program) of China via Grant No. 2009CB623203 and NationalNatural Science Foundation of China via Grant No. 50708018, isgreatly acknowledged. The financial support of China ScholarshipCouncil is also greatly acknowledged.
References
[1] Powers TC. The air requirement of frost-resistant concrete. Proc Highway ResBoard 1949;29:184–211.
[2] Scherer GW. Crystallization in pores. Cem Concr Res 1999;29(8):1347–58.[3] Scherer GW, Valenza JJ. In: Young F, Skalny J, editors. Mechanisms of frost
damage, materials science of concrete VII. American Ceramic Society; 2005.[4] Coussy O, Monteiro P. Poroelastic model for concrete exposed to freezing
temperatures. Cem Concr Res 2008;38(1):40–8.[5] Beaudoin JJ, MacInnis C. The mechanism of frost damage in hardened cement
paste. Cem Concr Res 1974;4(2):139–47.[6] Bazant ZP, Chern J-C. Mathematical model for freeze-thaw durability of
concrete. J Am Ceram Soc 1988;71(9):776–83.[7] Hain M, Wriggers P. Computational homogenization of micro-structural
damage due to frost in hardened cement paste. Finite Elem Anal Des2008;44(5):233–44.
[8] Zuber B, Marchand J. Modeling the deterioration of hydrated cement systemsexposed to frost action Part I: description of the mathematical model. CemConcr Res 2000;30(12):1929–39.
[9] van Breugel K. Simulation of hydration and formation of structure in hardeningcement-based materials. PhD thesis, Delft University of Technology, Delft;1991. <http://Microlab.citg.tudelft.nl>.
[10] Koenders E. Simulation of volume changes in hardening cement-basedmaterials. PhD thesis, Delft University of Technology, Delft; 1997. <http://Microlab.citg.tudelft.nl>.
[11] Ye G. Experimental study and numerical simulation of the development of themicrostructure and permeability of cementitious materials. PhD thesis, DelftUniversity of Technology, Delft; 2003. <http://Microlab.citg.tudelft.nl>.
[12] Schlangen E. Experimental and numerical analysis of fracture processes inconcrete. PhD thesis, Delft University of Technology, Delft; 1993. <http://Microlab.citg.tudelft.nl>.
[13] Qian Z. 3D lattice analysis of cement paste. Master thesis, Delft University ofTechnology, Delft; 2008.
[14] Sun Z, Scherer GW. Pore size and shape in mortar by thermoporometry. CemConcr Res 2010;40(5):740–51.
[15] Sun Z, Scherer GW. Effect of air voids on salt scaling and internal freezing. CemConcr Res 2010;40(2):260–70.
[16] Promentilla MAB, Sugiyama T, Hitomi T, Takeda N. Quantification of tortuosityin hardened cement pastes using synchrotron-based X-ray computedmicrotomography. Cem Concr Res 2009;39(6):548–57.
[17] Trtik P, Münch B, Lura P. A critical examination of statistical nanoindentationon model materials and hardened cement pastes based on virtual experiments.Cem Concr Compos 2009;31(10):705–14.
[18] Bentz DP, Garboczi EJ. Percolation of phases in a three-dimensional cementpaste microstructure model. Cem Concr Res 1991;21(2–3):325–44.
[19] Bishnoi S, Schrivener KL. lic: a new platform for modeling the hydration ofcements. Cem Concr Res 2009;39(4):266–74.
[20] Aligizaki KK. Pore structure of cement-based materials: testing, interpretationand requirements. Taylor and Francis; 2006.
[21] Stauffer D. Introduction to percolation theory. London: Taylor and Francis;1985.
L. Liu et al. / Cement & Concrete Composites 33 (2011) 562–571 571
[22] Morishige K, Kawano K. Freezing and melting of water in a single cylindricalpore: the pore-size dependence of freezing and melting behavior. J Chem Phys1999;110(10):4867–72.
[23] Setzer MJ. Frost suction as the basic mechanism of frost action. In: Kovler K,editor. International RILEM-JCI seminar on concrete durability and service lifeplanning ConcreteLife’06, Dead Sea, Israel; 2006. p. 155–66.
[24] Bentz DP. Low temperature calorimetry studies of hydrating portland cementpastes. NISTIR 7267, US Department of Commerce; October 2005. <http://www.fire.nist.gov/bfrlpubs/build05/art051.html>.
[25] Bentz DP. Lithium, potassium, and sodium additions to cement pastes. J AdvCem Res 2006;18(2):65–70.
[26] Ye G, van Breugel K, Fraaij ALA. Three-dimensional microstructure analysis ofnumerically simulated cementitious materials. Cem Concr Res2003;33(2):215–22.
[27] Mindess S, Young JF. Concrete. Englewood Cliffs (NJ): Prentice-Halls; 1981.[28] Metha PK, Monteiro PJM. Concrete: microstructure, properties and
materials. McGraw-Hill; 2006.
[29] Setzer MJ. Micro-ice-lens formation in porous solid. J Colloid Interf Sci2001;243(1):193–201.
[30] Tan L. Failure mechanisms in hydrating cement particle systems. Masterthesis, Delft University of Technology, Delft; 2007.
[31] Qian Z, Schlangen E, Ye G, van Breugel K. Prediction of mechanical propertiesof cement paste at microscale. Mater Constr 2010;60(297):1–12.
[32] Manzano H, Dolado JS, Ayuela A. Elastic properties of the main species presentin Portland cement pastes. Acta Mater 2009;57(5):1666–74.
[33] Qian Z, Ye G, Schlangen E, van Breugel K. 3D lattice fracture model: applicationto cement paste at microscale. Key Eng Mater 2011;452–453:65–8.
[34] Sanahuja J, Dormieux L, Chanvillard G. Modeling elasticity of a hydratingcement paste. Cem Concr Res 2007;37(1):1427–39.
[35] Zhou J, Ye G, van Breugel K. Characterization of pore structure in cement-basedmaterials using pressurization–depressurization cycling mercury intrusionporosimetry (PDC-MIP). Cem Concr Res 2010;40(7):1120–8.
[36] Powers TC. The physical structure and engineering properties of concrete. ResDevelop Lab Portland Cem Assoc Bull 1958;90:1–28.