Optimum design of shell structures with random geometric, material and thickness imperfections
Upload
thorntontomasettiCategory
view
4download
0
This article appeared in a journal published by Elsevier. The attachedcopy is furnished to the author for internal non-commercial researchand education use, including for instruction at the authors institution
and sharing with colleagues.
Other uses, including reproduction and distribution, or selling orlicensing copies, or posting to personal, institutional or third party
websites are prohibited.
In most cases authors are permitted to post their version of thearticle (e.g. in Word or Tex form) to their personal website orinstitutional repository. Authors requiring further information
regarding Elsevier’s archiving and manuscript policies areencouraged to visit:
http://www.elsevier.com/copyright
Author's personal copy
Modeling fracture in large scale shell structures
Pawel B. Woelke n, Najib N. Abboud
Weidlinger Associates, Inc. 40 Wall Street, New York, NY 10005-1304, USA
a r t i c l e i n f o
Article history:
Received 8 August 2011
Received in revised form
14 February 2012
Accepted 4 July 2012Available online 25 July 2012
Keywords:
Ductile fracture modeling
Phenomenological damage model
Large scale plasticity
Shell mechanics
Stress triaxiality
Objectivity and regularization
a b s t r a c t
We consider a problem of modeling fracture and failure preceded by large scale yielding
of ductile shells from the point of view of large-scale structural analysis. We place a
special emphasis on the computational efficiency of the constitutive formulation. In this
context, we seek the formulation embedded in the shell mechanics framework, which is
both theoretically sound and easily implementable into a large-scale explicit dynamic
finite element code without precluding vectorization or parallelization. This is achieved
through the elasto-plastic damage constitutive model for finite-element analysis of
plates and shells. The proposed damage model is purely phenomenological with a scalar
damage parameter, which has no physical interpretation, except that it represents on a
global scale the micromechanical changes the material undergoes during the process of
necking and fracture. The localization leading to softening and fracture is represented
by the damage calibration function with exponential damage growth after the onset of
necking. The proposed phenomenological damage model uses a general plasticity and
shell mechanics frameworks which makes it general and easily implementable into
existing finite element codes. The proposed formulation has been implemented into the
explicit dynamic finite element software code EPSA (Atkatsh et al., 1980, 1983).
& 2012 Elsevier Ltd. All rights reserved.
1. Introduction
Localization of deformation and fracture of metals is a complicated process and requires detailed investigation of themicrostructure of the material. A ductile metal is capable of large inelastic deformations, which eventually localize into asmall zone of very high concentrated plastic strains. Large plastic strains can induce irreversible thermodynamic changesof the material’s microstructure, leading to progressive degradation of the material properties and softening. Experimentalinvestigations (Fisher, 1980; Giovanola, 1988; Hickey et al., 2010) show that the material softening triggered by inelasticstrains is due mainly to the nucleation, growth, and coalescence of microvoids (thermal effects are also sometimespronounced). The voids typically form around 2nd phase particles in the material (e.g., alloying elements) andsubsequently grow and coalesce into cracks. High-magnification images of fractured AISI 1020 steel tensile specimenare shown in Fig. 1 (ASM, 2007). The approximate width of the grains visible in Fig. 1 is �15 mm. The spacing of the secondphase particles, which typically give rise to growth of voids, is approximately 1–2 grain widths. Constitutive modelsexplicitly accounting for the process of void growth and coalescence, e.g., Gurson (1977), (1975), Perzyna (2005) (1984),require that the formulation and the scale of the analyzed problem is consistent with the grain size and/or spacing ofsecond phase particles or voids. This requirement leads to the element size being of the order of the grain size, or voidspacing (�10–20 mm) which has a profound consequence on the scale of the problem that can be realistically analyzed.
Contents lists available at SciVerse ScienceDirect
journal homepage: www.elsevier.com/locate/jmps
Journal of the Mechanics and Physics of Solids
0022-5096/$ - see front matter & 2012 Elsevier Ltd. All rights reserved.
http://dx.doi.org/10.1016/j.jmps.2012.07.001
n Corresponding author. Tel.: þ1 212 367 2983; fax: þ1 212 497 2483.
E-mail address: [email protected] (P.B. Woelke).
Journal of the Mechanics and Physics of Solids 60 (2012) 2044–2063

Author's personal copy
Fig. 2 shows the details of the fracture surface of the tensile round bar, where the transition from the tensile to shearfracture with the characteristic cup-cone shape of the fracture surface is clearly visible. Xue et al. (2010) conductedextensive numerical study of the fracture surface of the DH36 round bar using the modified Gurson model. The Gursonmodel modification was introduced by Nahshon and Hutchinson (2008) to improve the predicative capability of the modelfor shear dominated fracture. This was achieved by accounting for the effect of void deformation and reorientation in pureshear and introducing the parameter ko which controls the rate of growth of damage in pure shear stress states. Part ofnumerical study conducted by Xue et al., involved assessing the capability of the modified Gurson model to predict thetransition from tensile to shear fracture. Fig. 3 shows the numerically predicted fracture surface as a function of the shear
Fig. 1. AISI 1020 steel tensile specimen—grain size and orientation (ASM, 2007).
Fig. 2. Fracture surface of DH36 tensile bar: (a) cup-cone failure mode; (b) and (c) equi-axed dimples caused by void growth and coalescence in the
central region; and (c) and (d) elongated dimples formed by void coalescence during shear lip formation—Xue et al. (2010).
P.B. Woelke, N.N. Abboud / J. Mech. Phys. Solids 60 (2012) 2044–2063 2045

Author's personal copy
parameter kw and the size of the finite element. The study concluded that a well-defined cup-cone fracture mode can bepredicted with the shear modification of the Gurson model in place, but the required element size to achieve that goal is40 mm�6 mm.
Detailed modeling of the fracture process and mode transition is very important for the overall understanding of thefracture of ductile metals. Using the methodology described above to represent global behavior of large-scale structures ishowever prohibitive, considering current software and hardware capabilities. Modeling fracture and failure of large-scalestructures requires bridging the length scales between the detailed three-dimensional analysis of the material micro-structure, and realistic structural models. One of the methods developed to achieve this goal is using hierarchical multi-scale modeling, which in many cases is very effective, (Belytschko et al., 2008; Feyel, 2003; Fish and Shek, 2000;Kouznetsova et al., 2002). Multi-scale modeling is however difficult to automate which makes it cumbersome for fast‘‘production type’’ analyses of structural shells. Simplified fracture simulation methodologies based on a cohesive zoneapproach have also been proposed by many authors, including (Goangseup Zi and Belytschko, 2003; Cirak et al., 2005;Scheider and Brocks, 2006). The cohesive zone approach was also used in multiple crack simulations conducted by theauthors, as described by Shields et al. (2011) More comprehensive description of the cohesive zone model and comparativestudy of the current damage model and cohesive zone-based approach is currently under preparation.
In the current work, we propose a phenomenological damage model, developed specifically for fast, large-scalecomputations of shell structures. The interpretation of the damage parameter used here differs significantly from thedamage used in Gurson or even shear modified Gurson model. The original Gurson model addresses material softeningwith evolving porosity function, which corresponds to void volume fraction of the material. Although including the voiddistortion and reorientation in the Gurson model results in the relationship between the void density and model damagevariable to be less clearly defined, that relationship still exist, at least in the limiting case where ko¼0. In the currentformulation, the scalar damage variable introduced into the yield function is purely phenomenological and does not haveany physical interpretation, i.e., it is not measurable. The damage variable itself, along with the material parameters usedin the evolution equation, are calibration parameters and represent on a global scale, the micromechanical changes thematerial undergoes during the process of necking, loss of stiffness and eventually fracture.
We consider large shell structures particularly of interest to naval, petroleum, aerospace and automotive industries, andthus limit ourselves to using shell elements with the characteristic length (square root of the element area) of at least thethickness of the structural shells (typical thickness ranges approximately from 2.5 mm to 25 mm). Only rate independentbehavior is considered in the current work.
The paper is divided into eight Sections. After the introduction, we further discuss the experimentally observed fracturebehavior of metals and the effect of stress triaxiality on the level of strain at fracture. In Section 3, we give the basicgoverning plasticity constitutive equations as well as the shell mechanics equations. Calibration and regularizationprocedures are discussed in Sections 4 and 5, respectively, followed by the tube-crushing problem used for furthercalibration and validation, given in Section 6. Conclusions are discussed in Section 7 and references provided in thereference list.
2. Fracture strain and stress triaxiality
Most of the yield functions commonly applied to describe inelastic behavior of metals (e.g., Huber–Mises–Hencky,Tresca) do not account for any dependence of the material deformation of the mean stress (where mean stress is sm¼
skk/3). It is well known that the yield stress and inelastic deformation of metals occurring between the yield and the onsetin instability, are not strongly dependent on the mean stress. The necking, which begins at the onset of instability, results
Fig. 3. Effects of initial element size and the shear correction factor on the crack trajectory in an initially un-notched round tensile bar—Xue et al. (2010).
P.B. Woelke, N.N. Abboud / J. Mech. Phys. Solids 60 (2012) 2044–20632046

Author's personal copy
in change of the geometry of the deforming material, leading to non-uniform deformation. This gives rise to the pressure(or mean stress) dependence of the deformation of the material, after the onset of instability. This was recognized by earlyformulations developed on the basis of mechanics of voids and the dependence of their growth on the mean stress(McClintock, 1968; Rice and Tracey, 1969; Gurson, 1975; Fleck and Hutchinson, 1986; Hutchinson and Tvergaard, 1989;Seweryn and Mroz, 1998; Tvergaard and Hutchinson, 2002). The influence of the stress triaxiality (where stress triaxialityis defined as: sm=sef ;sef ¼
ffiffiffiffiffiffiffi3J2
p; J2 is a 2nd invariant of the deviatoric stress tensor) on the ductility of the material was
recognized by Johnson and Cook (1985), who postulated a smooth functional dependence of the strain at failure and stresstriaxiality. Bao and Wierzbicki (2004) improved the characterization of fracture in metals, and showed that sheardominated fracture is associated with significantly lower ductility than uniaxial stress state. This is illustrated in Fig. 4. Wenote that in the axisymmetric stress range, the results by Bao and Wierzbicki agree well with Johnson-Cook (JC) (alsoHancock and Mackenzie (1976)) characterization of the fracture locus for metals, but in the range of triaxialities between�0.4 and 0.4 the curves diverge. According to Johnson-Cook characterization, the ductility continues to rise withdecreasing triaxiality, even after the uniaxial stress limit, while Bao and Wierzbicki reported significant ductility reductionfor shear dominated fractures. In both cases, the data shows that at high negative triaxialities (below �0.4) i.e., incompression, failure does not occur. Bao and Wierzbicki’s test results confirmed previous findings of McClintock, (1968)(1971), who reported multiple cases of shear localization at low ductility levels. The shear-dominated fracture is importantfor some applications, e.g., penetration problems. In the current work, we emphasize fracture dominated by tensileloading, i.e., with triaxialities above 0.4. The modification of the model to account for shear-dominated failure is currentlyunder development.
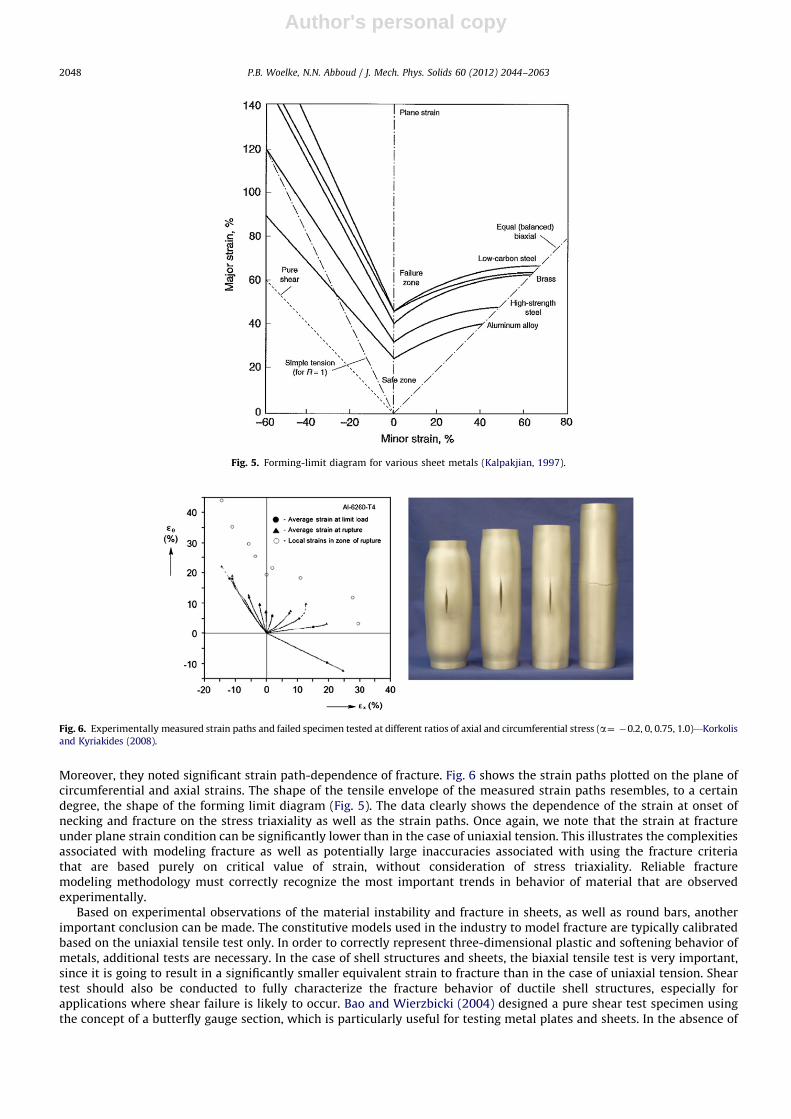
In addition to the experimental test results discussed above, investigations of the sheet forming processes resulting indevelopment of the forming limit diagrams, also offer very useful information about the influence of stress triaxiality.Marciniak and Kuczynski (1967) analyzed the onset of instability during the sheet metal forming process to determine thestrain limiting value, which should not be exceeded during biaxial tension associated with sheet forming, in order to avoidfracture of the sheet. This work resulted in development of the so-called M–K limit and later forming limit diagrams forsheets (FLD). Although, the forming limits are based on the analysis of instability (i.e., onset of necking as opposed tofracture) of thin sheets in plane stress, they provide useful information about the behavior of metals under biaxial state ofstress. The plane stress condition of the thin sheets is particularly relevant to shells, which are inherently assumed to be ina plane stress condition. An example of the forming limit diagram developed based on the experimental tests specificallydesigned to target ranges of biaxial stress of interest, is shown is Fig. 5 (Kalpakjian, 1997). We note that the results plottedin the form of the diagram given in Fig. 5, lead to similar conclusions, as those drawn by Bao and Wierzbicki, regarding theinfluence of stress triaxiality. Biaxial tension is associated with significantly lower strain corresponding to the onset ofnecking than observed in the case of uniaxial tension. Earlier neck development leads to lower failure strain, which is inagreement with the fracture locus developed by Bao and Wierzbicki. The plane strain condition corresponds to a minimumlevel of limiting major strain at which the instability begins, as shown in Fig. 5. In plane–strain condition, the strain atfracture can be as low as 40–50% of the strain at fracture determined based in the uniaxial tension test.
Korkolis and Kyriakides (2008), (2009) recently investigated the dependence of the onset of necking and strain atfracture on the stress-triaxiality and strain paths, based on the experimental observations of inflation and burst ofaluminum tubes. Similarly to previously discussed data, Korkolis and Kyriakides observed strong dependence of the onsetof necking and strain at failure on the ratio of circumferential to axial strain in the internally pressurized aluminum tubes.
Fig. 4. Equivalent strain to fracture as a function of stress triaxiality—Al2024-T351 (Data from Bao & Wierzbicki (2004), Figure from Hutchinson (2010).
P.B. Woelke, N.N. Abboud / J. Mech. Phys. Solids 60 (2012) 2044–2063 2047
Author's personal copy
Moreover, they noted significant strain path-dependence of fracture. Fig. 6 shows the strain paths plotted on the plane ofcircumferential and axial strains. The shape of the tensile envelope of the measured strain paths resembles, to a certaindegree, the shape of the forming limit diagram (Fig. 5). The data clearly shows the dependence of the strain at onset ofnecking and fracture on the stress triaxiality as well as the strain paths. Once again, we note that the strain at fractureunder plane strain condition can be significantly lower than in the case of uniaxial tension. This illustrates the complexitiesassociated with modeling fracture as well as potentially large inaccuracies associated with using the fracture criteriathat are based purely on critical value of strain, without consideration of stress triaxiality. Reliable fracturemodeling methodology must correctly recognize the most important trends in behavior of material that are observedexperimentally.
Based on experimental observations of the material instability and fracture in sheets, as well as round bars, anotherimportant conclusion can be made. The constitutive models used in the industry to model fracture are typically calibratedbased on the uniaxial tensile test only. In order to correctly represent three-dimensional plastic and softening behavior ofmetals, additional tests are necessary. In the case of shell structures and sheets, the biaxial tensile test is very important,since it is going to result in a significantly smaller equivalent strain to fracture than in the case of uniaxial tension. Sheartest should also be conducted to fully characterize the fracture behavior of ductile shell structures, especially forapplications where shear failure is likely to occur. Bao and Wierzbicki (2004) designed a pure shear test specimen usingthe concept of a butterfly gauge section, which is particularly useful for testing metal plates and sheets. In the absence of
Fig. 5. Forming-limit diagram for various sheet metals (Kalpakjian, 1997).
Fig. 6. Experimentally measured strain paths and failed specimen tested at different ratios of axial and circumferential stress (a¼ �0.2, 0, 0.75, 1.0)—Korkolis
and Kyriakides (2008).
P.B. Woelke, N.N. Abboud / J. Mech. Phys. Solids 60 (2012) 2044–20632048

Author's personal copy
the three dimensional test data, initial calibration can be performed on the basis of the uniaxial tensile test, as long as thebasic dependence of the equivalent strain to fracture, on the stress triaxiality is recognized. The calibration the proposedphenomenological damage model is discussed in the following sections of the paper.
3. Governing equations
The basic elasto-plastic shell constitutive equations are presented here. We separately discuss implementation of thedamage model into layered and non-layered shell framework. One of the advantages of the layered approach is that it doesnot require specific considerations of the shell equations, which makes implementation of advanced material modelsrelatively simple. Since multiple evaluations of the plasticity equations through the thickness of the shell are necessary inthe layered approach, it is computationally more expensive than the non-layered approach. In the current work, we focusour attention on the non-layered shell formulation. The equations governing the damage model are however presented forboth cases (layered and non-layered) for completeness.
Only the matters directly related to the development of the proposed phenomenological damage model are discussed indetail. As previously mentioned, we consider a rate independent response of the material and moderate strains (o30%engineering strain) in the current work. The Updated Lagrangian formulation is used, with the element coordinates anddimensions continuously updated during the deformation. This allows accounting for large rigid translations and rotationsof the elements, as well as moderately large strains, without employing the finite strain constitutive relationships based onthe multiplicative split of the strain tensor. More comprehensive description of the methods used was provided byVoyiadjis and Woelke (2008).
3.1. Constitutive equations for layered shell
The constitutive equations provided below can be used with any standard shell element that uses multiple integrationpoints through the thickness of the shell, e.g., Belytschko-Tsai (1983). We note that in the zero-transverse normal stresscondition must be explicitly enforced and for the case of thin shell analysis, a full plane stress condition. The plane stresscondition yields:
s33 ¼ s13 ¼ s23 ¼ e13 ¼ e23 ¼ 0; e33 ¼�n
1�ne11þe22ð Þ ð1Þ
The plastic potential function proposed by Perzyna (1984) can be expressed in the temperature-independent form asfollows:
f ¼
ffiffiffiffiffiffiffiffiffiffiffiffiffiffiffiffiffiffiffiffiJ2þnxI1
2q
ð2Þ
where J2 is a 2nd invariant of the deviatoric stress tensor; n is a material parameter; x is the damage variable and I1 is thefirst invariant of the stress tensor. We note the dependence of the plastic potential function on the hydrostatic pressure,which is very important for accurate prediction of fracture, as already discussed in Section 2. The damage parameter ispurely phenomenological and does not have any physical interpretation, i.e., it is not measurable. It is rather a scalarvariable controlling the softening behavior of the material after the onset of necking. The evolution of damage variable isdependent on the expansive, volumetric plastic strain, and given by:
dx¼ Kdekkpþ ð3Þ
where K is a slowly varying model calibration function which controls the rate of damage growth and allows for materialstiffness reduction leading to accurate, global representation of the experimentally observed material behavior. Thesuperscript ‘þ ’ indicates that damage only grows in tension. The damage evolution given by Eq. (3) requires assumption ofthe initial damage value x0, which exists in the material before the loading is applied. The calibration procedure and thecalibration function K will be discussed in detail in the following section of the paper. We note that Eqs. (2) and (3)describe a dilatational plasticity model where the customary assumption of incompressibility of the plastic flow (n¼0.5)no longer holds.
Yielding occurs if the following equation is satisfied:
F ¼f
k�1¼ 0 ð4Þ
where k is the isotropic hardening function dependent on the deviatoric plastic work given by:
k¼ k0þk1
Zsijdeij
dev,p ¼ k0þk1
ZsT dedev,p ð5Þ
k0 is the yield stress in shear, i.e., k0 ¼ sy=ffiffiffi3p
; where sy is the yield stress of the material; eijdev,p ¼ edev,p is the deviatoric
plastic strain. The plastic potential given by Eq. (2) can be written as follows:
f ¼
ffiffiffiffiffiffiffiffiffiffiffiffiffiffiffiffiffiffiffiffiffiffiffiffiffiffiffiffiffiffiffi1
2SijSijþnxsii
2
rð6Þ
P.B. Woelke, N.N. Abboud / J. Mech. Phys. Solids 60 (2012) 2044–2063 2049

Author's personal copy
where Sij is the deviatoric stress tensor given by:
Sij ¼ sij�1
3skkdij ð7Þ
sij is the stress tensor and dij is the Kronecker delta.Assuming the additive decomposition of the strain tensor into elastic and plastic part, the following elastic law is
adopted (in matrix notation):
dr¼ E de�dep� �
; where de¼ deeþdep ð8Þ
The plastic strain increments are defined using an associated flow rule:
dep ¼ dl@F
@rð9Þ
where dl is a plastic multiplier, determined using the consistency condition:
dF ¼@F
@r
� �T
drþ@F
@k
� �T
dkþ@F
@x
� �T
dx¼ 0 ð10Þ
Substituting Eqs. (3), (5), (8) and (9) into Eq. (10) and solving for dl, we obtain:
dl¼@F@r
� �TEde
@F@r
� �TE @F@r�
@F@k
� �Tk1sT @F
@s�@F@x
� �TK @F@I1
ð11Þ
Substituting Eq. (11) into Eq. (8), gives:
ds¼Dde ð12Þ
where D is the elasto-plastic stiffness, given by:
D¼ E I�@F@r
� �TE @F@r
@F@r
� �TE @F@r�
@F@k
� �Tk1sT @F
@s�@F@x
� �TK @F@I1
264
375 ð13Þ
The above plasticity equations were derived in a stress space and can be easily implemented into any layered shellmodel. In layered approach, the shell is divided into multiple layers and the stresses and plasticity equations are calculatedat the center of each layer separately. The membrane forces and bending moments are obtained by integration of stressesthrough the thickness of the plate.
3.2. Constitutive equations for non-layered shell
In the non-layered approach, the plasticity equations are expressed in terms of stress resultants and stress couples(forces and moments) and they do not need to be solved at multiple through-the-thickness integration points. Theproposed damage model is implemented into the explicit dynamic finite element code EPSA (Atkatsh et al., 1980, 1983;Woelke et al., 2006d, 2006c, 2006d) which features a single integration point shell elements. The plasticity equations arethus only solved once in every element (per timestep) and integration through the thickness is not necessary. As a result,the non-layered approach offers significant reduction of the computational cost associated with use of advancedconstitutive models for fracture prediction in ductile shells. Implementation of the proposed damage model into thenon-layered shell formulation requires consideration of the shell equations providing the elastic stiffness for the shellelement. The basic assumptions of the thick shell theory used in the current work, were described in detail by Atkatsh et al.(1980), as well as Bieniek and Funaro (1976) and Woelke et. al. (2006b). At any point of the shell, the membrane strainsand curvatures in a rectangular coordinate system (x,y,z) are given, in engineering notation, by the following equations:
ex ¼@u0
@xð14Þ
ey ¼@v0
@yð15Þ
exy ¼1
2
@u0
@yþ@v0
@x
� �ð16Þ
kx ¼@jx
@x¼
@
@x�@w
@xþgxz
� �ð17Þ
ky ¼@jy
@y¼
@
@y
@w
@y�gyz
� �ð18Þ
P.B. Woelke, N.N. Abboud / J. Mech. Phys. Solids 60 (2012) 2044–20632050

Author's personal copy
kxy ¼1
2
@fx
@yþ@fy
@x
� �ð19Þ
The transverse shear strains are calculated using the following equations:
gxz ¼@w
@xþfx ð20Þ
gyz ¼@w
@y�fy ð21Þ
where 2exz¼gxz ;2eyz¼gyz; ex,ey are membrane strains; exy is in-plane shear strain; and kx,ky,kxy are curvatures at the mid-surface in planes parallel to the xz,yz, and xy planes, respectively; u,v,w are the displacements along x,y,z axes, respectively;gxz,gyz are transverse shear strains in xz and yz planes; fx,fy are angles of rotation of the cross-sections that were normal tothe mid-surface of the undeformed shell. The total normal strains due to both: membrane and bending deformation in x, y
directions, respectively, as well as the zero-transverse normal stress condition, can be written as follows:
ex ¼ exþzkx; ey ¼ eyþzky and ez ¼�n
1�n exþey
� �ð22Þ
The stress resultants and couples Mx,My,Mxy,Nx,Ny,Nxy,Qx,Qyshown in Fig. 7 can be expressed in terms of the strains givenabove:
Mx ¼D kxþnky
ð23Þ
My ¼D kyþnkx
ð24Þ
Mxy ¼D 1�nð Þkxy ð25Þ
Nx ¼ S ½exþney� ð26Þ
Ny ¼ S ½eyþnex� ð27Þ
Nxy ¼1
2S 1�nð Þgxy ð28Þ
Nxz ¼ Tgxz ð29Þ
Nyz ¼ Tgyz ð30Þ
where
D¼Eh3
12 1�n2� � , S¼
Eh
1�n2� � , T ¼
5
12
Eh
1þnð Þð31Þ
and E is Young’s Modulus, h is thickness of the shell, and n is Poisson’s ratio. The positive directions of the stress resultantsgiven by Eqs. (23)–(30) are shown in Fig. 7:
The above constitutive equations are universal for both plates and shells and they reduce to those given by Flugge(1960) for thin shell theory, i.e., when the shear deformation is neglected.
The stress resultants and strain components of the shell can be represented in indicial notation by the 6�1 column matrices:
sT ¼ N11,N22,N12,N13,N23,M11,M22,M12f g
eT ¼ e11,e22,2e12,2e13,2e23,k11,k22,2k12f g ð32Þ
My
Nyx
Mxy
Nx
MxNxy
Qx Ny
Myx
Qyz
x
y
Fig. 7. Stress resultants on plate/shell element.
P.B. Woelke, N.N. Abboud / J. Mech. Phys. Solids 60 (2012) 2044–2063 2051

Author's personal copy
where s, e are stress resultant and strain column matrices, respectively. The shell constitutive equations can be written as follows:
s¼ Ee ð33Þ
where E is the elastic stiffness of the shell given by:
E¼
S nS 0 0 0 0 0 0
nS S 0 0 0 0 0 0
0 0 12 Sð1�nÞ 0 0 0 0 0
0 0 0 T 0 0 0 0
0 0 0 0 T 0 0 0
0 0 0 0 0 D nD 0
0 0 0 0 0 nD D 0
0 0 0 0 0 0 0 0
266666666666664
377777777777775
ð34Þ
The components of the stress tensor at the top and bottom surfaces of the shell can be expressed in terms of stress-resultants as follows:
sij ¼Nij
h7
6Mij
h2ð35Þ
where Nij are normal forces, Mij are bending moments; the plus and minus sign applying to the top and bottom surfaces ofthe shell, respectively. Substituting Eq. (35) into Eq. (4) results in the yield surface defined in the stress-resultant space,given by Voyiadjis and Woelke (2005); Woelke et al. (2006a):
Fo ¼ INþ IMþ2 INMj j�YðWpÞ
s2y
ð36Þ
where:
IN ¼1
No2
1þ1
2nx
� �N11
2þN22
2� �
� 1�nxð ÞN11N22þ3 N122þN13
2þN23
2� �� �
IM ¼1
Mo2
1þ1
2nx
� �M11
2þM22
2� �
� 1�nxð ÞM11M22þ3M122
� �
INM ¼1
NoMo1þ
1
2nx
� �N11M11þN22M22ð Þ�
1
21�nxð Þ N11M22�N22M11ð Þþ3N12M12
� �
No ¼ syh and Mo ¼syh2
6ð37Þ
The above equations give the initial yield surface, which correctly recognizes first yield of the top and/or bottom fibersof the shell. As the loading on the shell increases beyond the initial yield, in addition to membrane plastic strains (constantthrough the thickness), the plastic curvatures are progressively developing through the thickness of the plate. The limitingcase corresponds to fully plastic cross section and the limiting yield surface was given by Iliushin (1956):
FL ¼ INþMo
2
ML2
IMþ1ffiffiffi3p
Mo
MLINM�
YðWpÞ
s2y
ML ¼syh2
4ð38Þ
The derivation of the limiting yield surface with the damage variable included in the formulation was given by Woelkeet al. (2006a).
The intermediate surfaces that allow capturing the progressive plastification of the cross section can be obtained byusing the plastic curvature parameter proposed by Crisfield (1981). Atkatsh et al. (1983) proposed a variable yield surface,which describes the evolution of plastic curvatures through the thickness of the shell. The variable yield surface is of theform:
F ¼ INþ IN2�IN
3þ InMþ0:8 INMj j�
YðWpÞ
s2y
ð39Þ
where:
IMn¼ 1
Mo2 1þ 1
2 nx� �
M11�Mn
11
� �2þ M22�Mn
22
� �2h ih
� 1�nxð Þ M11�Mn
11
� �M22�Mn
22
� �þ3 M12�Mn
12
� �2þ3 M12�Mn
12
� �2i
ð40Þ
The residual bending moments Mn
ij represent the hardening parameters that are defined as follows:
IF F ¼ 1 and@F
@NijdNijþ
@F
@MijdMij40 ) dMn
ij ¼ bMo
kodkp
ij
P.B. Woelke, N.N. Abboud / J. Mech. Phys. Solids 60 (2012) 2044–20632052

Author's personal copy
IF Fo0 or@F
@NijdNijþ
@F
@MijdMijr0 ) dMn
ij ¼ 0 ð41Þ
b is the hardening calibration parameter; ko is the curvature at yield and dkpij is the increment of plastic curvature.
In addition to tracking progressive development of the plastic curvatures, the residual bending moments (hardeningparameters) allow for representation of the Bauschinger effect. Extending the hardening rule by addition of the residualforces into the formulation allows for definition of a full kinematic hardening rule. The stress-resultant based kinematichardening rule based on the evolution of backstress proposed by Armstrong and Frederick (1966) was provided by Woelkeet al. (2006a). In the current work, the full definition on the kinematic hardening rule was not used, and only the residualbending moments were employed.
To derive the incremental stiffness of the element, we use the same procedure provided for the layered shellformulation. The matrices of stress resultants and strain components are given by Eq. (32). Similarly, the matrix of residualbending moments is given by:
sn� �T
¼ 0,0,0,0,0,Mn
11,Mn
22,Mn
12
�ð42Þ
We rewrite the elastic law given by Eq. (33) in the incremental form, as follows:
ds¼ E de�dep� �
: where de¼ deeþdep ð43Þ
The hardening function Y, is given by:
Y ¼ Y0þY1
ZsT dep ð44Þ
The plastic strain increments are defined using an associated flow rule:
dep ¼ dl@F
@sð45Þ
Using Eq. (41), the increment of the residual stress resultant (hardening parameters) vector can be written as:
dsn ¼ Adl@F
@s0where A¼ b
Mo
koand s0 ¼ 0,0,0,0,0,M11,M22,M12f g ð46Þ
The evolution of damage given by Eq. (3) is expressed in terms or shell strains as follows:
dx¼ K dep11þdep
22þh
2dkp
11þdkp22
� �� �þ¼ Kdl
@F
@N11þ
@F
@N22þ
h
2
@F
@M11þ
@F
@M11
� �� �þð47Þ
where the superscript ‘þ ’ indicates that damage only grows in tension. The above equation can be rewritten as follows:
dx¼ KdlHðBÞB ð48Þ
where:
B¼@F
@N11þ
@F
@N22þ
h
2
@F
@M11þ
@F
@M11
� �� �ð49Þ
and H(x) is a Heaviside step function given by:
HðxÞ ¼0, if xo0
1, if xZ0
(ð50Þ
We note that e33 was not included in the damage evolution equation. Its incorporation would lead to additionalconstant(1�2n)/(1�n)in Eqs. (47) and (48). This constant was implicitly accounted for in the calibration function K whichcontrols the rate of damage growth and allows for approximation of the shell thinning and necking effects (globally, in anaveraged sense). The calibration procedure and the calibration function K will be discussed in detail in the followingsection of the paper. The most significant contribution to damage due to bending was considered in Eqs. (47)–(49), byusing the maximum bending strains at the top (or bottom) surface of the shell. This damage contribution could of coursebe modified based on experimentally observed mixed-mode fracture under combined bending and tension. Based oncurrently available data for aluminum, using maximum bending strains (at the top or bottom of the shell) results in correctapproximation of experimentally observed fracture, as will be shown in the following section of the paper.
As in the case of the layered shell, the plastic multiplier is determined using the consistency condition:
dF ¼@F
@s
� �T
dsþ@F
@sn
� �T
dsnþ@F
@Y
� �T
dYþ@F
@x
� �T
dx¼ 0 ð51Þ
Substituting Eqs. (44)–(49) into Eq. (51) and solving for dl, we obtain:
dl¼@F@s
� �TEde
@F@s
� �TE @F@s�
@F@sn� �T
A @F@s0 �
@F@Y
� �TY1sT @F
@s�@F@x
� �TKHðBÞB
ð52Þ
P.B. Woelke, N.N. Abboud / J. Mech. Phys. Solids 60 (2012) 2044–2063 2053

Author's personal copy
Substituting the above equation into Eq. (43), gives:
ds¼Dde ð53Þ
where D is the elasto-plastic stiffness, given by:
D¼ E I�@F@s
� �TE @F@s
@F@s
� �TE @F@s�
@F@sn
� �TA @F@s0 �
@F@Y
� �TY1sT @F
@s�@F@x
� �TKHðBÞB
264
375 ð54Þ
The stress-resultant plasticity equations are universal and not dependent on any specific shell theory (for non-layered shells).As previously mentioned, both sets of equations governing the damage model for layered and non-layered shells were
implemented into non-linear, explicit finite element code EPSA (Atkatsh et al., 1980, 1983; Woelke et al., 2006a, 2006b).The equations of motion, solution procedure and details of the finite element discretization were discussed in detail byAtkatsh et al. (1980), (1983) and will not be repeated here.
4. Model calibration
As previously discussed, the current approach is meant for fracture and failure analyses of large-scale structures usingshell elements. We are particularly interested in the component level analyses of naval vessels, which can range in sizefrom several to several hundred meters. The scale of such problems imposes certain restrictions on the size of the finiteelement used in the analyses. The typical finite element size used for structural analyses ranges from 0.5 cm to 20 cm. Inaddition to restrictions related to the scale of the investigated problem, use of shell elements is the most effective andaccurate if the element size is at least as large as the thickness of the plate. This allows for assuming the plane stresscondition, which is inherently associated with shell mechanics. We therefore consider the elements, which are similar insize to the typical gauge length over which the strain is measured in a uniaxial tensile test. Fig. 8 shows a comparison ofthe scales of the typical tensile specimen, with gauge length and the size of the finite element of interest.
The strains near the neck rise very sharply and reach levels that are typically an order of magnitude higher near thecenter of the neck, than away from it. The gauge length represents a characteristic length of measurement of the strain inthe specimen. The engineering stress–strain response of the specimen, including failure, which manifests itself by theprecipitous drop of the stress at the onset of shear localization, is defined in conjunction with chosen gauge length. If thegauge length is reduced, its ends are closer to the center of the neck, where the strains are the highest. This results in largervalue of measured critical failure strain. If the strain for Al6061-T6 specimen is measured by the reduction of the grainwidth, that dimension becomes the gauge length, and the critical strain at fracture is likely to reach the order of 100%(Hickey et al., 2010). If on the other hand, the strain is measured over typical gauge length of 5 cm, the strain at fracture forthe same specimen of Al6061-T6 ranges from 10% to 15%. This illustrates the importance of consideration of the gaugelength in conjunction with the stress–strain curve used to calibrate the model. The importance of gauge length will bediscussed further in the following section of the paper.
Fig. 8(b) shows the necking in the aluminum sheet subjected to uniaxial tension. Following the discussion provided inthe Introduction, the microstructural changes that the material undergoes during the process of localization and fracture
Fig. 8. Comparison of the scale of the tensile specimens, neck and typical structural level finite element; (a) axisymmetric tensile specimen; (b) sheet
metal tensile specimen.
P.B. Woelke, N.N. Abboud / J. Mech. Phys. Solids 60 (2012) 2044–20632054

Author's personal copy
are occurring on a very small scale (several mm) and investigation of these changes requires higher order analysis, which isbeyond the scope of the current work. The objective of the current methodology is to represent the effects of necking andfracture with a single element of length similar to typical gauge length (�5 cm). The most important features of theuniaxial stress–strain curve obtained experimentally, with specific gauge length (or by means of detailed 3D calculationsusing e.g., Gurson model) must be well represented by a single shell element in uniaxial tension. To demonstrate thecapability of the proposed damage model for shell elements we consider a large scale mode I fracture test of the 10 mmthick, aluminum (Al5083-H116) plate conducted by Simonsen and Tornqvist (2004) (Fig. 9 (a)).
The sequential failure mode observed during the test was analyzed in detail be Nielsen and Hutchinson (2011) whoperformed detailed 2D plane strain analyses of the necking observed in the plate by means of the Gurson model, modifiedby Nahshon and Hutchinson (2008) to account for shear dominated failure. As a result of these investigations, thenormalized load-deflection curve has been determined, which was then used to extract a traction-separation law andcohesive fracture energy. The length of the simulated 2D strip was 3 times the thickness of the plate, i.e., 3.1 cm. We notethat the localization of the deformation in the neck is captured in detail in the higher-order analyses conducted by Nielsenand Hutchinson (Fig. 9b). After localization, the region of the specimen outside the neck unloads elastically, and since theload and displacements are measured outside of the neck, the results are independent of the gauge length. In the context ofthe proposed phenomenological damage model, the normalized load-deflection curve, determined based on the detailednecking analysis (with the elements size of �15 mm), must be represented, in a global sense, by a single shell element thatis larger than the plate thickness. The element size chosen for calibration is equal to the length of the specimen analyzedby Nielsen and Hutchinson, i.e., 3.1 cm. The load–deflection curve obtained by Nielsen and Hutchinson (2011), as well asthe deformed finite element mesh used in the simulation are shown in Fig. 9b. We note that there is a significant stressreduction between the onset of necking and onset of shear localization, which is associated with the reduction of thicknessof the plate as the neck develops. Accurate representation of the geometry of the neck including thinning is impossiblewith a single finite element. The goal of the proposed methodology is therefore not to reproduce exactly the resultsobtained by Nielsen and Hutchinson with a detailed 3D model, but to represent the global force-displacement response.Capturing the aforementioned stress reduction between the onset of necking and shear localization requires accounting forthe increased rate of damage growth occurring due to localization of deformation. This is accomplished by means of thecalibration function K, (see Eq. (3), which is defined as follows:
K ¼ k1 � exp k2eeq
p
N
!; where eeq
p ¼
ffiffiffiffiffiffiffiffiffiffiffiffiffi2
3eijeij
rð55Þ
where k1 and k2 calibration constants and N is the hardening exponent. At the onset of necking, based on the Considerecondition, the strain is equal to the hardening exponent. When the equivalent plastic strain is smaller than the hardeningexponent the rate of damage growth is very small, which is consistent with experimental observations for most ductilematerials. After the onset of necking, (the equivalent plastic strain is approximately equal to the hardening exponent) the rateof damage growth increases exponentially. The calibration constants k1and k2allow for accurate representation of theobserved uniaxial tensile behavior of most ductile metals, including the ones characterized by significant stress reductionbetween the onset of necking and shear localization. The calibration function K is used in the current model in the form givenby Eq. (55). The load–deflection curve obtained by Nielsen and Hutchinson, which serves as a reference curve, is cross-plottedagainst the corresponding curve obtained with the current damage model (simulation of the single shell element in tension) inFig. 10.
Fig. 9. A 10 mm thick, notched Al5083-H116 plate subjected to mode I tension; (a) fractured plate—test by Simonsen and Tornqvist (2004); (b) Plane-
strain detailed necking analysis of the plate—Nielsen and Hutchinson (2011).
P.B. Woelke, N.N. Abboud / J. Mech. Phys. Solids 60 (2012) 2044–2063 2055

Author's personal copy
The detailed finite element mesh used to determine the normalized force-deflection curve, as well as the single shellelement with the current damage model are also shown in Fig. 10. The results were obtained with the calibrationparameters: k1¼2.3;k2¼1.05. A fracture criterion based on the critical damage level (xcrit¼0.7) was also used. Althoughthe proposed phenomenological damage model can correctly represent the softening behavior of the material, the elementstress follows an exponential decay with elements retaining a small amount of stress for a certain range of strain, followingthe initial precipitous softening. This prevents formation of the traction-free crack surface, until a relatively large strainlevel is attained (�0.4). The current analysis methodology is formulated specifically for large-scale structures with largeshell elements, in which case the stress needs to be set to zero following the initiation of the precipitous softening, toenforce a traction-free crack surface development. This is achieved by using a fracture criterion, based on the critical levelof damage parameter. Determination of the critical damage level for fracture (formation of the traction-free surface) is partof the calibration process.
In the above example, the model parameters were calibrated against the result of detailed investigation, which in thiscase, served as a virtual test. The simplified representation with the current damage model and large-scale shell elementcould also be calibrated directly against the Simonsen & Tornqvist experimental test. In this case, however, only globalbehavior of the plate could be captured and the details of neck developments and shear band formation would be lost. Theobjective of the current methodology is to provide the global representation of fracture on a structural scale, as opposed todetailed investigation of localization, which requires higher order discretization motivated by explicit representation ofmicromechanical changes in the material, as shown by Nielsen and Hutchinson (2011). Calibration of the current damagemodel to capture a large strain gradient within a single element is challenging its capabilities to represent (globally, in anaveraged sense) the process of necking and fracture. The correlation between the reference and calibrated curve isexcellent, showing that the normalized force-displacement response is well represented by the current methodology.
In addition to accurate representation of the uniaxial tensile behavior, the dependence of the fracture strain on thestress triaxiality must also be correctly recognized by the phenomenological damage model, as discussed in Section 2. Weuse the results of the uniaxial tensile test conducted by Kyriakides and Ravi-Chandar (2008) on Al6061-T6 sheet specimenas a reference curve for calibration of the uniaxial tensile behavior obtained using a single element in tension (with thecurrent damage model). The cross-plot of the test and analysis results are given in Fig. 11.
The gauge length used to measure the strain was not known, so the length of 5 cm was assumed for initial calibration ofthe uniaxial tensile response. The results were obtained with the calibration parameters: k1¼3.0 ; k2¼1.2 ; xcrit¼0.6.As shown in Fig. 11, the correlation between measured and calculated response is excellent. The calculated responses inplane strain tension and compression are of equal importance. Based on the discussion in Section 2, the onset of necking(and correspondingly, failure strain) is significantly lower in plane strain than in uniaxial tension. This is supported by boththe data obtained by Bao and Wierzbicki (2004) as well as the independent consideration of the necking onset resulting indevelopment of the forming limit diagram (Marciniak and Kuczynski, 1967). The optimal way to calibrate the presentmodel is to use both uniaxial test and plane strain or equi-biaxial tensile test. In absence of the biaxial tensile data, weaimed to recognize the general trend suggested by the FLD that onset of necking in plane strain occurs at is approximately40–50% lower strain than in the case of uniaxial tension. This is very well represented in the current model, as shown inFig. 11. Based on the Bao and Wierzbicki’s fracture locus, compression should not cause failure of the material, which onceagain is correctly predicted in the current model. The calibrated material model (based on the uniaxial tensile test) will beused as a base for analysis of the tube crushing problem discussed in the following section of the paper.
Fig. 10. Normalized force-deflection curve obtained using detailed simulation of mode I fracture of the Al5083-H116 plate (Nielsen and Hutchinson,
2011) & corresponding result of a single element analysis.
P.B. Woelke, N.N. Abboud / J. Mech. Phys. Solids 60 (2012) 2044–20632056

Author's personal copy
5. Element size sensitivity and regularization
It is well known that finite element analysis of fracture is associated with lack of objectivity of the solution.The objective solution of the differential equations, as defined by Hadamard (1923), is the solution that is not sensitive tominor variation of the initial and boundary conditions. In the case of finite element analysis of fracture, the lack ofobjectivity stems from mesh-dependence of the solution. The problems of objectivity and well posedness of the dynamicfinite element solutions were also extensively discussed by Sandler and Wright (1984), who showed that the rate-independent formulation cannot objectively address the strain softening. Since the focus of the current work is on thequasi-static, rate independent problems, a separate reliable regularization procedure is necessary to reduce the mesh-dependence and allow a reliable and objective solution. We note that the effectiveness of the current regularizationmethodology will be significantly improved once the constitutive equation provided here are further extended to includethe time-dependent strain component, through viscoplastic formulation. This is currently under development.
Fracture of ductile metals is preceded by necking and localization of deformation into a small region of very highstrains. The strains outside of the neck are relatively small comparing to those in the center of the neck, which leads tovery high strain gradients over relatively short spans. These strain gradients cannot be resolved by large, structural scalefinite elements. In addition, the critical strain to failure of individual elements is dependent on their size. The smaller theelement, the shorter the length over which the strains are averaged and smaller strain gradient. In other words, 0.25 cmelement used to model fracture in the sheet of thickness t¼0.25 cm is going to span the length over which the averagestrain can be on the order of �30%. For the same metal sheet, 2.5 cm element is going to span significantly larger length,with high gradients, and the average strain over that spanning length will be significantly lower than in the case of 0.25 cmelement (e.g., �15%). Variation of the critical failure strain as a function of the element size is related to gauge lengthvariation. As discussed in the previous section, the failure strain determined based on the uniaxial tensile test is valid for aspecific gauge length. Model calibration (against the uniaxial tensile test) should be performed with the size of the elementapproximately equal to the gauge length used in the test. If the elements used in the large-scale component analysis aresmaller than the gauge length, their critical strain and cohesive energy (energy between the onset of necking and shearlocalization) needs to be increased. If on the other hand, the elements used in the large-scale component analysis are largerthan the gauge length, their critical failure strain needs to be reduced (comparing to the critical strain associated with thespecific gauge length). Regularization procedure, which introduces the size of the element as well as the gauge length intothe formulation, is therefore necessary. This can be accomplished by treating the cohesive energy of the element as avariable and function of its size, as originally proposed by Hillerborg et al. (1976). In the current formulation, we used asimple functional dependence of the cohesive energy on the ratio of gauge length and the characteristic element size:
G¼G0Lgage
Lelement, where Lelement ¼
ffiffiffiAp
ð56Þ
A is the current element area, which is updated during the calculation at every time step to account for the meshdeformation. G0 is the cohesive energy for the element size equal to the gauge length and used to calibrate the finiteelement response to the uniaxial tensile response. A series of uniaxial tensile analyses performed using a single elementwith varying size is shown in Fig. 12.
Fig. 11. AL6061-T6 Uniaxial tensile test result (Kyriakides and Ravi-Chandar, 2008) and corresponding results of a single element analysis.
P.B. Woelke, N.N. Abboud / J. Mech. Phys. Solids 60 (2012) 2044–2063 2057

Author's personal copy
We note that the desired trend of increased cohesive energy for elements smaller than the gauge length, and reducedcohesive energy for elements larger than the gauge length. The procedure described above provides effective regulariza-tion and significantly reduces the mesh-dependence of the solution.
Multiple mesh convergence studies were conducted to test the effectiveness of the regularization procedure.The results of these studies showed that the regularization procedure outlined here can be effectively applied if elementsize variation is within the same order of magnitude. For very large discrepancies between the largest and smallestelements used in the mesh (higher than the factor of 10), the regularization procedure loses its efficiency.
6. Tube-crushing test—validation
A series of the tube crushing tests was recently conducted by Giagmouris et al. (2010) at University of Texas at Austin.These tests provide extremely useful information about the development of necking and fracture in cylindrical aluminumshell structures subjected to combined bending and tension. One of the tests will serve as the validation case for thephenomenological damage model described here.
The tube-crushing test considered here (TR17) involves the Al6061-T6-I5 cylindrical shell bonded to the solidend-plugs, pinched by the rigid punches. The test set-up, as well as the crushed tube are shown in Fig. 13.
The details of the experimental set-up are discussed in by Giagmouris et al. (2010). The test was specifically designed toprovide validation data for the simulation of fracture in shell structures. The deformation of the center portion of the shellis dominated by bending, and no fractures were observed in the center (crushed) portion of the cylinder. The deformationis symmetric about the vertical center plane parallel to the axial direction of the tube. This causes both bending andmultiaxial tension at the shell-plug interface, with the material at the center (of the shell-plug interface, on either side ofthe punch) being in nearly plane–strain condition. Consequently, fracture occurred at the shell-plug interface, in allreported cases. The photographs of the tested specimen are shown in Fig. 14. The test is particularly challenging for anyfracture modeling methodology given the fracture mode interaction as well as significant variation of the stress triaxialityin the shell.
The current phenomenological damage model was used in the simulations of the tube crushing. The plugs as well as thepunch were assumed rigid in the simulations, and any friction between the punches and the shell was neglected. The 1/8thsymmetry finite element model was built with the total number of shell elements of approximately 8000 (including thepunch and the plug—Fig. 15).
The deformed shape of the crushed cylinder with the contours of the equivalent plastic strains and damage are given inFig. 16. Fracture criterion based on the critical value of the damage parameter was used for both crack initiation andpropagation. Element erosion was used for the visualization purposes. Only minor recalibration of the material parametersdetermined based on the uniaxial tensile test (Section 4 and Fig. 11) was required. The final values of the modelparameters were: k1¼3.0 ; k2¼1.25 ; xcrit¼0.55. The predicted final deformed shape of the crushed tube and the fracturepattern agree very well with the experimental observations. We also note that the level of equivalent plastic strain in themid-section of the cylinder (crushed portion) is similar to the equivalent strain level at the plug-shell interface, while thedamage levels are significantly different. This shows that using the fracture criterion based on the equivalent plastic strain,independent of stress triaxiality would lead to incorrect predictions of the fracture pattern. Damage evolution used hereexplicitly accounts for experimentally observed (Section 2) variation of the strain at fracture as a function of stresstriaxiality, which allows for accurate fracture predictions of structural shells.
Lelement
LgageΓ = Γ0
Fig. 12. Mesh regularization – single element of varying size in tension (5.0 cm element calibrated against the AL6061-T6 uniaxial tensile test) –
(Kyriakides and Ravi-Chandar, 2008).
P.B. Woelke, N.N. Abboud / J. Mech. Phys. Solids 60 (2012) 2044–20632058

Author's personal copy
Comparison of the predicted and observed deformed shape and fracture pattern are shown in Fig. 17. Although, thephotograph of deformed TR17 test specimen was not available, the deformation and fracture pattern was similar in allcases of the tested tubes and other tubes can be used for comparison purposes.
The comparison of the predicted and measured force-displacement response of the crushed tube is given in Fig. 18.Significant sensitivity of the calculated response to initial geometric imperfections was observed. The analysis that producedthe closest correlation to the experimental result (Fig. 18) was obtained with the finite element model that accounted for theinitial geometrical imperfections of the tube, measured before the test was conducted. We note excellent agreementbetween the observed and predicted behavior, which effectively validates the formulation presented in this paper.
7. Summary and conclusions
The phenomenological damage model for modeling large-scale ductile fracture in structural shells was developed andpresented in the current paper. The formulation was embedded in a shell mechanics framework, which allows formodeling large structural components accurately and efficiently. The proposed damage model is based in the dilatational
Exp. No.
TubeNo.
Dmm
tmm
Lmm
Do
mm g
mm r max
(%)Exp
TR17 I5 25.35 0.52 81.28 24.17 0.076 -27.73
Fig. 13. Experimental set-up for lateral crushing of shells and a crushed specimen (dimensions in mm)—(Giagmouris et al. (2010)).
Fig. 14. Specimen configurations at different stages of crushing showing fracture at the shell-plug interface (Giagmouris et al., 2010).
P.B. Woelke, N.N. Abboud / J. Mech. Phys. Solids 60 (2012) 2044–2063 2059

Author's personal copy
plasticity theory with a phenomenological scalar damage parameter, which has no physical interpretation, except that itrepresents on a global scale the micromechanical changes the material undergoes during the process of necking, leading toloss of stiffness and eventually fracture. The formulation was developed for shell elements and large-scale computationsand is not meant to replace detailed three-dimensional fracture analyses aimed at prediction of the evolution of voids inthe microstructure of the material. The current approach is meant to represent globally the effects of fracture on thestructural behavior, without explicitly addressing the details of the micromechanical changes of the material during theprocess of necking and fracture.
The proposed approach uses a general plasticity and shell mechanics frameworks which makes it general and easilyimplementable into existing finite element codes. It has been successfully implemented into the explicit dynamic finiteelement software codes EPSA.
Fig. 15. Finite element model of the tube-crushing test (TR17).
Fig. 16. Equivalent plastic strain and damage contours of the crushed cylinder—tube-crushing test (TR17).
P.B. Woelke, N.N. Abboud / J. Mech. Phys. Solids 60 (2012) 2044–20632060

Author's personal copy
The model calibration procedure requires the uniaxial tensile as well as the plane–strain or equi-biaxial tensile test data. Inabsence of the biaxial tensile data, analytical solutions based on the forming limit diagrams for sheets can be used. Additionally,large scale test leading to fracture can also be used for calibration and validation, as presented in the current paper. The fractureenergy regularization ensures low sensitivity of the solution to the element size, as well as variation of the initial conditions.
The validation of the proposed fracture evaluation methodology has been conducted based on the tube-crushing test,which was specifically designed to provide validation data for the simulation of fracture in shell structures. Excellentagreement was observed between the analyses and experimental results, both qualitatively, (deformed shape and fracturepattern) and quantitatively (force-displacement response).
The model calibration procedure for specific ductile materials will be further generalized into a consistent frameworkas detailed material test data become available. In addition, future work plans include extension of the model to accountfor shear-dominated fracture as well as rate dependent behavior of shell structures (Kleiber and Kollmann, 1993). Thefracture criterion based on the critical damage level will also be coupled with the extended finite element method(Belytschko et al., 2003) for fracture propagation modeling.
Acknowledgement
The support of the Office of Naval Research: Dr. Luise Couchman and Dr. Steven Turner (Contract No. N00014-08-C-0242) and Dr. Paul Hess and Dr. Ken Nahshon (Contract No. N00014-10-M-0252) is gratefully acknowledged. The authorsalso gratefully acknowledge valuable insights generously offered by Prof. John Hutchinson of Harvard University, Prof.Stelios Kyriakides and Prof. K. Ravi-Chandar of the University of Texas at Austin, as well as Dr. Ivan Sandler of WeidlingerAssociates.
Fig. 17. Predicted and observed deformed shape and fracture pattern of the crushed tube—Test data: (Giagmouris et al., 2010).
Fig. 18. Finite element model representation of the tube-crushing test (TR17).
P.B. Woelke, N.N. Abboud / J. Mech. Phys. Solids 60 (2012) 2044–2063 2061

Author's personal copy
References
Armstrong P.J. and Frederick, C.O. A mathematical representation of the multiaxial Bauschinger effect [Report]/ Berkeley Laboratories. Berkeley, CA: CEGBReport RD/B/N/731, R&D Department, 1966.
ASM International Fractography ASM Handbook vol. 12 [Book]. [s.l.]: ASM International, 2007.Atkatsh, R.S., Baron, M.L., Bieniek, M.P.A, 1980. Finite difference variational method for bending of plates [Journal]. Comput. Struct. 11, 573–577.Atkatsh, R.S., Bieniek, M.P., Baron, M.L., 1983. Dynamic elasto-plastic response of shells in an acoustic medium—EPSA code [Journal]. Int. J. Numer.
Methods Eng. 19 (6), 811–824.Bao, Y., Wierzbicki, T., 2004. On fracture locus in the equivalent strain and stress triaxiality space [Journal]. Int. J. Mech. Sci. 46 (81), 81–98.Belytschko, T., Tsay, C.S., 1983. A stabilization procedure for the quadrilateral plate element with one-point quadrature [Journal]. Int. J. Numer. Methods
Eng. Vol. 19, 405–419.Belytschko, T., Chen, H., Xu, J., Zi, G., 2003. Dynamic crack propagation based on loss of hyperbolicity and a new discontinuous enrichment [Article].
Int. J. Numer. Methods Eng. 58, 1873–1905.Belytschko, T., Loehnert, S., Song, J.H., 2008. Multiscale aggregating discontinuities: a method for circumventing loss of material stability [Journal].
Int. J. Numer. Methods Eng. 73, 869–894.Bieniek M.P. and Funaro, J.R. Elasto-Plastic Behavior of Plates and Shells [Report]: Technical Report DNA 3584A. New York: Weidlinger Associates, Inc.,
1976.Cirak, F., Ortiz, M., Pandolfi, A., 2005. A cohesive approach to thin-shell fracture and fragmentation [Journal]. Comput. Meth. Appl. Mech. Eng. 194,
2604–2618.Crisfield, M.A., 1981. Finite element analysis for combined material and geometric nonlinearities [Journal]. In: Wunderlich, et al. (Eds.), In Nonlinear
Finite Element Analysis in Structural Mechanics. Springer-Verlag, New York, pp. 325–338.Feyel, F., 2003. A multilevel finite element method (FE2) to describe the response of highly non-linear structures using generalized continua [Journal].
Comput. Meth. Appl. Mech. Eng. 192, 3233–3244.Fish, Shek, K, 2000. Multiscale analysis of large-scale nonlinear structures and materials [Journal]. Int. J. Comput. Civ. Struct. Eng. 1 (1), 79–90.Fisher J. R. Void Nucleation in Spheroidized Steels During Tensile Deformation [Report]: Ph.D. Thesis. [s.l.]: Brown University, 1980.Fleck, Hutchinson, J.W, 1986. Void growth in shear [Journal]. Proc. R. Soc. London A407, 435–458.Flugge, W., 1960. Stresses in shells [Book]. Springer, New York.Giagmouris, T., 2010. [et al.] On the localization and failure in aluminum shells due to crushing induced bending and tension [Journal]. Int. J. Solids Struct.
47, 2680–2692.Giovanola, J.H., 1988. Adiabatic shear banding under pure shear loading [Journal]. Mech. Mater. 7, 59–87.Goangseup, Zi, Belytschko, T, 2003. New crack-tip elements for XFEM and applications to cohesive cracks [Journal]. Int. J. Numer. Methods Eng. 57,
2221–224015 57, 2221–2240.Gurson, A.L., 1977. Continuum theory of ductile rapture by void nucleation and growth – Part I – Yield criteria and flow rules for porous ductile media
[Journal]. J. Eng. Mater. Technol. 99, 2–15.Gurson A.L. Plastic Flow and Fracture Behavior of Ductile Materials Incorporating Void Nucleation, Growth and Interaction [Report]: Ph.D. Thesis. [s.l.]:
Brown University, 1975.Hadamard J. Lectures on Cauchy’s Problem in Linear Partial Differential Equations [Book]. [s.l.]: Dover Publications, ISBN-10: 0486495493, 1923.Hancock, Mackenzie, A.C, 1976. On the mechanisms of ductile fracture in high-strength steels subject to multi-axial stress-states [Journal]. J. Mech. Phys.
Solids 24, 147–160.Hickey W.F., Ghahremaninezhad A. and Ravi-Chandar K. Characterization of Ductile Failure [Report]. Arlington, VA: ONR—MURI/FNC Review, 2010.Hillerborg, A., Modeer, M., Peterson, P., 1976. Analysis of crack formation and crack growth in concrete by means of fracture mechanics and finite
elements [Journal]. Cem. Concr. Res. 6, 773–782.Hutchinson and Tvergaard V. Softening Due to Void Nucleation in Metals [Book Section], Fracture Mechanics: Perspectives and Directions (20th
Symposium)/ book auth. Gangloff R. P. Wei and R. P.. [s.l.]: ASTM STP 1020, 1989.Hutchinson J.W. Private Communications. 2010.Iliushin, A.A., 1956. Plastichnost [Book]. Gostekhizdat, Moscow.Johnson, G.R, Cook, W.H., 1985. Fracture characteristics of three metals subjected to various strains, strain rates, temperatures and pressures [Journal].
Eng. Fract. Mech. 21 (1), 31–48.Kalpakjian, S., 1997. Manufacturing Processes for Engineering Materials, third ed. Addison-Wesley [Book]. [s.l.].Kleiber, Kollmann, F.G, 1993. A theory of viscoplastic shells including damage [Journal]. Arch. Mech. 45 (4), 423–437.Korkolis, Y.P., Kyriakides, S., 2008. Inflation and burst of aluminum tubes for hydroforming applications [Journal]. Int. J. Plast. 24, 509–543.Korkolis, Y.P., Kyriakides, S., 2009. Path-dependent failure of inflated aluminum tubes [Journal]. Int. J. Plast.. 25, 2059–2080.Kouznetsova, V., Geers, M.G.D., Brekelmans, W.A.M., 2002. Multi-scale constitutive modelling of heterogeneous materials with a gradient-enhanced
computational homogenization scheme [Journal]. Int. J. Numer. Methods Eng. 54, 1235–1260.Kyriakides and Ravi-Chandar K. Material Constitutive Relations and Failure Modeling [Report]: Future Naval Capabilities Program Review. Washington,
DC: [s.n.], 2008.Marciniak, Kuczynski, K, 1967. Limit strains in the processes of stretch-forming sheet metal [Journal]. Int. J. Mech. Sci. 9 (9), 609–612.McClintock, F.A., 1968. A criterion of ductile fracture by the growth of holes [Journal]. J. Appl. Mech. 35, 363–371.McClintock F.A. Plasticity Aspects of Fracture [Book Section], Fracture, vol. 3/ Book Auth. Leibowitz H. (Ed.). [s.l.]: Academic Press, 1971.Nahshon, Hutchinson, J.W, 2008. Modification of the Gurson Model for shear failure [Journal]. Eur. J. Mech. A. Solids 27, 1–17.Nielsen and Hutchinson J.W. Cohesive Traction-Separation Laws for Tearing of Ductile Metal Plates [Journal], Accepted to J. of Impact Engineering. 2011.Perzyna, P., 1984. Constitutive modeling of dissipative solids for postcritical behaviour and fracture [Journal],. ASME J. Eng. Mater. Technol. Vol. 106,
410–419.Perzyna, P., 2005. The thermodynamical theory of elasto-viscoplasticity [Journal]. Eng. Trans. 53 (3), 235–316.Rice, Tracey, D.M, 1969. On the ductile enlargement of voids in triaxial stress fields [Journal]. J. Mech. Phys. Solids 17, 201–217.Sandler and Wright J. Summary of Strain-Softening [Book Section], Theoretical Foundations for Large-Scale Computations of Nonlinear Material Behavior/
book auth. Nemat-Nasser S., Asaro R. and Hegemier G. [s.l.]: Martinus Nijhoff, Netherlands, 1984.Scheider, Brocks, W, 2006. Cohesive elements for thin-walled structures [Journal]. Comput. Mater. Sci. 37, 101–109.Seweryn, Mroz, Z, 1998. On the criterion of damage evolution for variable multiaxial stress states [Journal]. Int. J. Solids Struct. 35, 1589–1616.Shields M.D. [et al.] Modeling Large Scale Ductile Fracture in Welded Aluminum Structures Using a Cohesive Zone [Conference], Engineering Mechanics
Institute Conference (EMI2011). 2011.Simonsen, B.C., Tornqvist, R., 2004. Experimental and numerical modeling of ductile crack propagation in large-scale shell structures [Journal]. Mar.
struct. 17, 1–27.Tvergaard, Hutchinson, J.W, 2002. Two mechanisms of ductile fracture: void by void growth versus multiple void interaction [Journal]. Int. J. Solids Struct.
39, 3581–3597.Voyiadjis, Woelke, P, 2008. Elasto-Plastic and Damage Analysis of Plates and Shells [Book]. [s.l.]. Springer-Verlag.Voyiadjis, Woelke, P, 2005. General non-linear finite element analysis of thick plates and shells [Journal]. Int. J. Solids Struct. 43 (7-8), 2209–2242.Woelke P. [et al.] Stress Resultant Based Elasto-Viscoplastic Thick Shell Model [Conference], 77th Shock and Vibration Symposium Proceedings.
Monterrey, CA: [s.n.], 2006a.
P.B. Woelke, N.N. Abboud / J. Mech. Phys. Solids 60 (2012) 2044–20632062

Author's personal copy
Woelke P., Chan, K.K., Abboud, N., Daddazio, R., Hapij, A., and Voyiadjis, G.Z Damage Model For Analysis of Isotripic Shells Using EPSA [Conference], 77thShock and Vibration Symposium Proceedings. Monterrey, CA: [s.n.], 2006b.
Woelke, P., Voyiadjis, G.Z., Perzyna, P., 2006c. Elasto-plastic finite element analysis of shells with damage due to microvoids [Journal]. Int. J. Numer.Methods Eng. 68 (3), 338–380.
Woelke, P., Voyiadjis, G.Z., Perzyna, P., 2006d. Elasto-plastic finite element analysis of shells with damage due to microvoids [Article]. Int. J. Numer.Methods Eng. 68 (3), 338–380.
Xue, Z., Pontin, M.G., Zok, F.W., Hutchinson, J.W., 2010. Calibration procedures for a computational model of ductile fracture [Journal]. Eng. Fract. Mech.77, 338–380.
P.B. Woelke, N.N. Abboud / J. Mech. Phys. Solids 60 (2012) 2044–2063 2063
Copyright © 2022 FDOKUMEN