Three dimeric anthracene derivatives from the fruits of Bulbine abyssinica
Upload
greifswaldCategory
view
2download
0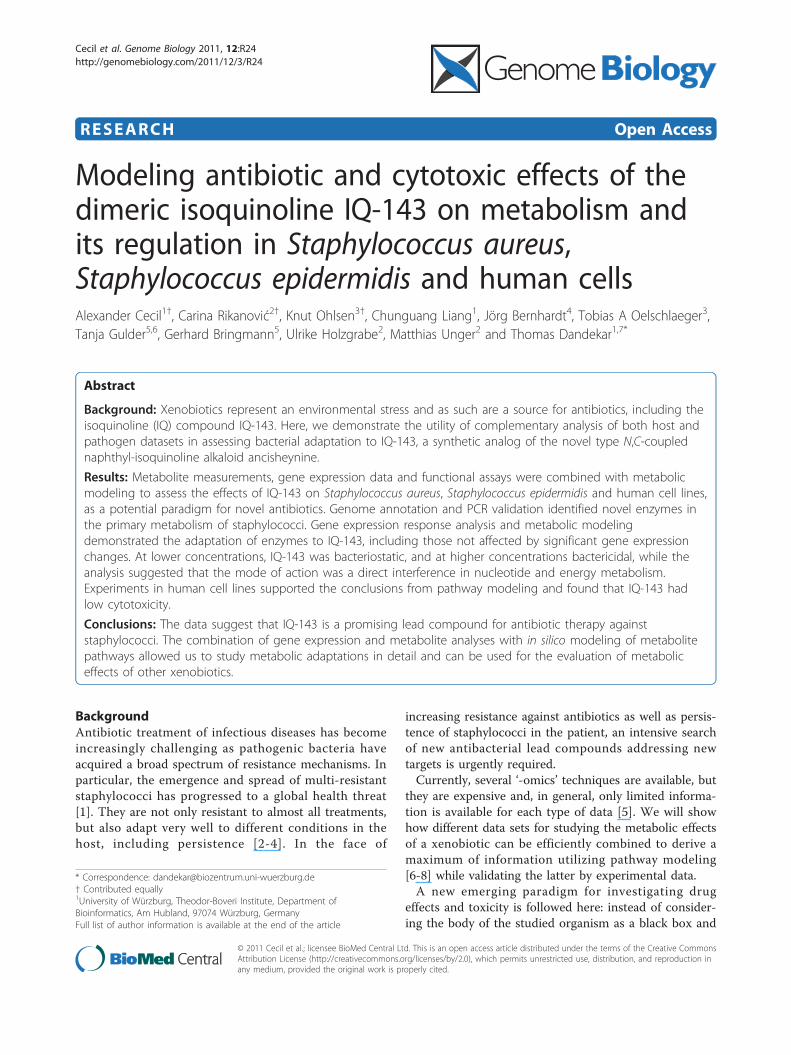
RESEARCH Open Access
Modeling antibiotic and cytotoxic effects of thedimeric isoquinoline IQ-143 on metabolism andits regulation in Staphylococcus aureus,Staphylococcus epidermidis and human cellsAlexander Cecil1†, Carina Rikanović2†, Knut Ohlsen3†, Chunguang Liang1, Jörg Bernhardt4, Tobias A Oelschlaeger3,Tanja Gulder5,6, Gerhard Bringmann5, Ulrike Holzgrabe2, Matthias Unger2 and Thomas Dandekar1,7*
Abstract
Background: Xenobiotics represent an environmental stress and as such are a source for antibiotics, including theisoquinoline (IQ) compound IQ-143. Here, we demonstrate the utility of complementary analysis of both host andpathogen datasets in assessing bacterial adaptation to IQ-143, a synthetic analog of the novel type N,C-couplednaphthyl-isoquinoline alkaloid ancisheynine.
Results: Metabolite measurements, gene expression data and functional assays were combined with metabolicmodeling to assess the effects of IQ-143 on Staphylococcus aureus, Staphylococcus epidermidis and human cell lines,as a potential paradigm for novel antibiotics. Genome annotation and PCR validation identified novel enzymes inthe primary metabolism of staphylococci. Gene expression response analysis and metabolic modelingdemonstrated the adaptation of enzymes to IQ-143, including those not affected by significant gene expressionchanges. At lower concentrations, IQ-143 was bacteriostatic, and at higher concentrations bactericidal, while theanalysis suggested that the mode of action was a direct interference in nucleotide and energy metabolism.Experiments in human cell lines supported the conclusions from pathway modeling and found that IQ-143 hadlow cytotoxicity.
Conclusions: The data suggest that IQ-143 is a promising lead compound for antibiotic therapy againststaphylococci. The combination of gene expression and metabolite analyses with in silico modeling of metabolitepathways allowed us to study metabolic adaptations in detail and can be used for the evaluation of metaboliceffects of other xenobiotics.
BackgroundAntibiotic treatment of infectious diseases has becomeincreasingly challenging as pathogenic bacteria haveacquired a broad spectrum of resistance mechanisms. Inparticular, the emergence and spread of multi-resistantstaphylococci has progressed to a global health threat[1]. They are not only resistant to almost all treatments,but also adapt very well to different conditions in thehost, including persistence [2-4]. In the face of
increasing resistance against antibiotics as well as persis-tence of staphylococci in the patient, an intensive searchof new antibacterial lead compounds addressing newtargets is urgently required.Currently, several ‘-omics’ techniques are available, but
they are expensive and, in general, only limited informa-tion is available for each type of data [5]. We will showhow different data sets for studying the metabolic effectsof a xenobiotic can be efficiently combined to derive amaximum of information utilizing pathway modeling[6-8] while validating the latter by experimental data.A new emerging paradigm for investigating drug
effects and toxicity is followed here: instead of consider-ing the body of the studied organism as a black box and
* Correspondence: [email protected]† Contributed equally1University of Würzburg, Theodor-Boveri Institute, Department ofBioinformatics, Am Hubland, 97074 Würzburg, GermanyFull list of author information is available at the end of the article
Cecil et al. Genome Biology 2011, 12:R24http://genomebiology.com/2011/12/3/R24
© 2011 Cecil et al.; licensee BioMed Central Ltd. This is an open access article distributed under the terms of the Creative CommonsAttribution License (http://creativecommons.org/licenses/by/2.0), which permits unrestricted use, distribution, and reproduction inany medium, provided the original work is properly cited.
just identifying toxic or antibiotic concentrations, geno-mics and post-genomics strategies are used to revealaffected pathways. This combination enables a morerapid understanding of metabolic effects and at thesame time also reveals side effects in unprecedenteddetail, leading to a network paradigm: a substance is notjust toxic or nontoxic but has, in general, stronger orweaker and concentration-dependent network effects.In our studies we observed a drastic change in meta-
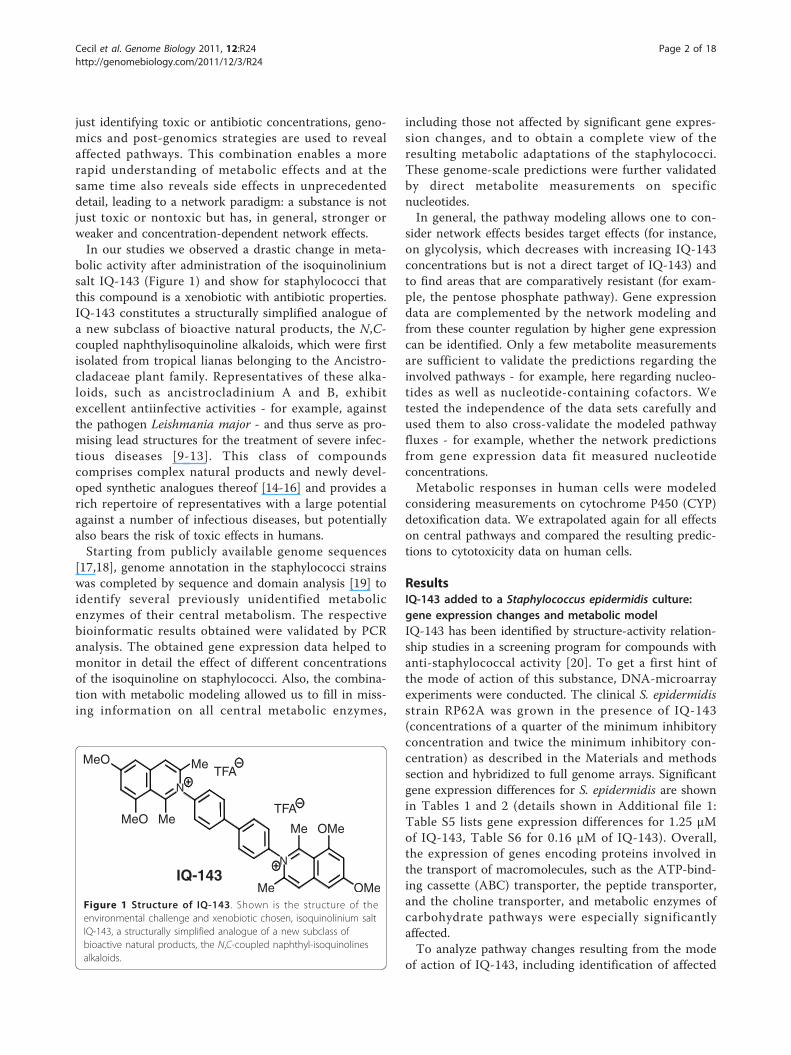
bolic activity after administration of the isoquinoliniumsalt IQ-143 (Figure 1) and show for staphylococci thatthis compound is a xenobiotic with antibiotic properties.IQ-143 constitutes a structurally simplified analogue ofa new subclass of bioactive natural products, the N,C-coupled naphthylisoquinoline alkaloids, which were firstisolated from tropical lianas belonging to the Ancistro-cladaceae plant family. Representatives of these alka-loids, such as ancistrocladinium A and B, exhibitexcellent antiinfective activities - for example, againstthe pathogen Leishmania major - and thus serve as pro-mising lead structures for the treatment of severe infec-tious diseases [9-13]. This class of compoundscomprises complex natural products and newly devel-oped synthetic analogues thereof [14-16] and provides arich repertoire of representatives with a large potentialagainst a number of infectious diseases, but potentiallyalso bears the risk of toxic effects in humans.Starting from publicly available genome sequences
[17,18], genome annotation in the staphylococci strainswas completed by sequence and domain analysis [19] toidentify several previously unidentified metabolicenzymes of their central metabolism. The respectivebioinformatic results obtained were validated by PCRanalysis. The obtained gene expression data helped tomonitor in detail the effect of different concentrationsof the isoquinoline on staphylococci. Also, the combina-tion with metabolic modeling allowed us to fill in miss-ing information on all central metabolic enzymes,
including those not affected by significant gene expres-sion changes, and to obtain a complete view of theresulting metabolic adaptations of the staphylococci.These genome-scale predictions were further validatedby direct metabolite measurements on specificnucleotides.In general, the pathway modeling allows one to con-
sider network effects besides target effects (for instance,on glycolysis, which decreases with increasing IQ-143concentrations but is not a direct target of IQ-143) andto find areas that are comparatively resistant (for exam-ple, the pentose phosphate pathway). Gene expressiondata are complemented by the network modeling andfrom these counter regulation by higher gene expressioncan be identified. Only a few metabolite measurementsare sufficient to validate the predictions regarding theinvolved pathways - for example, here regarding nucleo-tides as well as nucleotide-containing cofactors. Wetested the independence of the data sets carefully andused them to also cross-validate the modeled pathwayfluxes - for example, whether the network predictionsfrom gene expression data fit measured nucleotideconcentrations.Metabolic responses in human cells were modeled
considering measurements on cytochrome P450 (CYP)detoxification data. We extrapolated again for all effectson central pathways and compared the resulting predic-tions to cytotoxicity data on human cells.
ResultsIQ-143 added to a Staphylococcus epidermidis culture:gene expression changes and metabolic modelIQ-143 has been identified by structure-activity relation-ship studies in a screening program for compounds withanti-staphylococcal activity [20]. To get a first hint ofthe mode of action of this substance, DNA-microarrayexperiments were conducted. The clinical S. epidermidisstrain RP62A was grown in the presence of IQ-143(concentrations of a quarter of the minimum inhibitoryconcentration and twice the minimum inhibitory con-centration) as described in the Materials and methodssection and hybridized to full genome arrays. Significantgene expression differences for S. epidermidis are shownin Tables 1 and 2 (details shown in Additional file 1:Table S5 lists gene expression differences for 1.25 μMof IQ-143, Table S6 for 0.16 μM of IQ-143). Overall,the expression of genes encoding proteins involved inthe transport of macromolecules, such as the ATP-bind-ing cassette (ABC) transporter, the peptide transporter,and the choline transporter, and metabolic enzymes ofcarbohydrate pathways were especially significantlyaffected.To analyze pathway changes resulting from the mode
of action of IQ-143, including identification of affected
MeO
MeO Me
Me
N
TFA
TFA
Me
Me
N
OMe
OMeIQ-143
Figure 1 Structure of IQ-143. Shown is the structure of theenvironmental challenge and xenobiotic chosen, isoquinolinium saltIQ-143, a structurally simplified analogue of a new subclass ofbioactive natural products, the N,C-coupled naphthyl-isoquinolinesalkaloids.
Cecil et al. Genome Biology 2011, 12:R24http://genomebiology.com/2011/12/3/R24
Page 2 of 18
enzymes that are not already apparent from the tran-scriptome data, we applied YANAsquare [21,22] and acustom-made routine written in R [23] for calculatingmetabolic-flux changes after administration of IQ-143(Figures 2 and 3).The calculation of the pathway changes started from
the metabolic model of S. epidermidis (details in TableS3 in Additional file 1) and applied the gene expressiondata with significant expression changes (Table 1) as
flux constraints (Tables S10, S11 and S12 in Additionalfile 1; detailed changes in Tables S16 and S17 in Addi-tional file 1).We first prepared a stoichiometric matrix in which the
rows and columns correspond to all the enzymes (forannotation and collection see next chapter in resultsand Materials and methods) in the network as well asthe internal metabolites of the network. The ‘internal’metabolites inside the network have to be balanced:
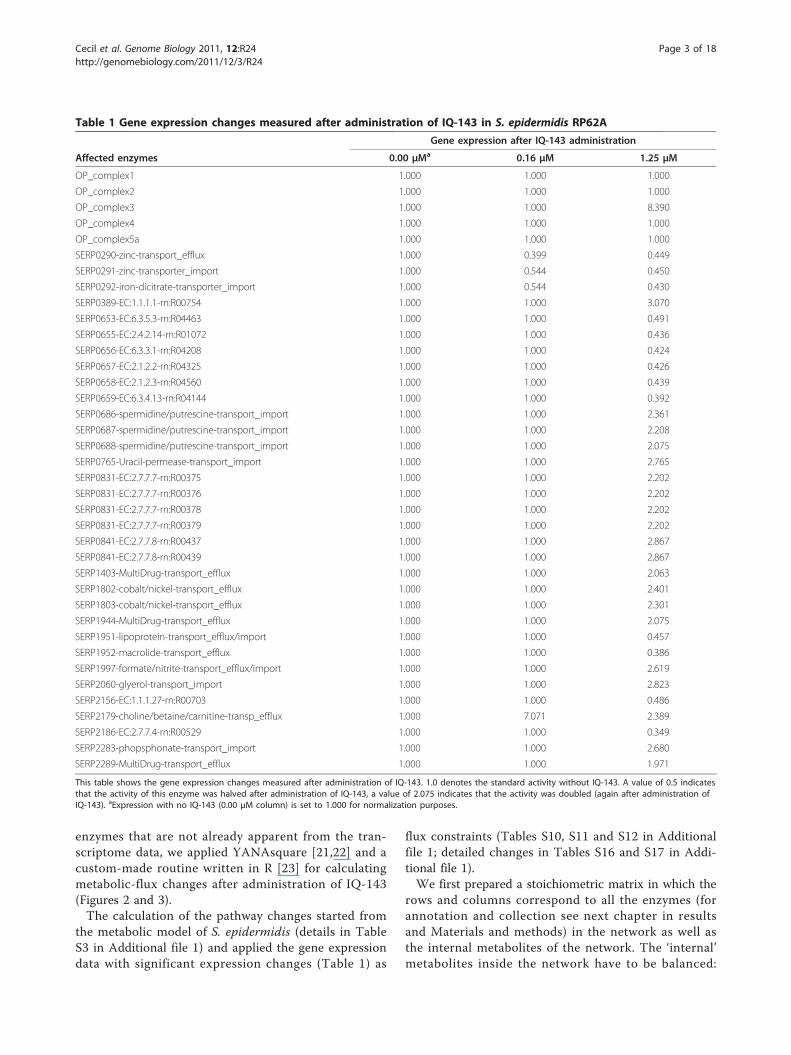
Table 1 Gene expression changes measured after administration of IQ-143 in S. epidermidis RP62A
Gene expression after IQ-143 administration
Affected enzymes 0.00 μMa 0.16 μM 1.25 μM
OP_complex1 1.000 1.000 1.000
OP_complex2 1.000 1.000 1.000
OP_complex3 1.000 1.000 8.390
OP_complex4 1.000 1.000 1.000
OP_complex5a 1.000 1.000 1.000
SERP0290-zinc-transport_efflux 1.000 0.399 0.449
SERP0291-zinc-transporter_import 1.000 0.544 0.450
SERP0292-iron-dicitrate-transporter_import 1.000 0.544 0.430
SERP0389-EC:1.1.1.1-rn:R00754 1.000 1.000 3.070
SERP0653-EC:6.3.5.3-rn:R04463 1.000 1.000 0.491
SERP0655-EC:2.4.2.14-rn:R01072 1.000 1.000 0.436
SERP0656-EC:6.3.3.1-rn:R04208 1.000 1.000 0.424
SERP0657-EC:2.1.2.2-rn:R04325 1.000 1.000 0.426
SERP0658-EC:2.1.2.3-rn:R04560 1.000 1.000 0.439
SERP0659-EC:6.3.4.13-rn:R04144 1.000 1.000 0.392
SERP0686-spermidine/putrescine-transport_import 1.000 1.000 2.361
SERP0687-spermidine/putrescine-transport_import 1.000 1.000 2.208
SERP0688-spermidine/putrescine-transport_import 1.000 1.000 2.075
SERP0765-Uracil-permease-transport_import 1.000 1.000 2.765
SERP0831-EC:2.7.7.7-rn:R00375 1.000 1.000 2.202
SERP0831-EC:2.7.7.7-rn:R00376 1.000 1.000 2.202
SERP0831-EC:2.7.7.7-rn:R00378 1.000 1.000 2.202
SERP0831-EC:2.7.7.7-rn:R00379 1.000 1.000 2.202
SERP0841-EC:2.7.7.8-rn:R00437 1.000 1.000 2.867
SERP0841-EC:2.7.7.8-rn:R00439 1.000 1.000 2.867
SERP1403-MultiDrug-transport_efflux 1.000 1.000 2.063
SERP1802-cobalt/nickel-transport_efflux 1.000 1.000 2.401
SERP1803-cobalt/nickel-transport_efflux 1.000 1.000 2.301
SERP1944-MultiDrug-transport_efflux 1.000 1.000 2.075
SERP1951-lipoprotein-transport_efflux/import 1.000 1.000 0.457
SERP1952-macrolide-transport_efflux 1.000 1.000 0.386
SERP1997-formate/nitrite-transport_efflux/import 1.000 1.000 2.619
SERP2060-glyerol-transport_import 1.000 1.000 2.823
SERP2156-EC:1.1.1.27-rn:R00703 1.000 1.000 0.486
SERP2179-choline/betaine/carnitine-transp_efflux 1.000 7.071 2.389
SERP2186-EC:2.7.7.4-rn:R00529 1.000 1.000 0.349
SERP2283-phopsphonate-transport_import 1.000 1.000 2.680
SERP2289-MultiDrug-transport_efflux 1.000 1.000 1.971
This table shows the gene expression changes measured after administration of IQ-143. 1.0 denotes the standard activity without IQ-143. A value of 0.5 indicatesthat the activity of this enzyme was halved after administration of IQ-143, a value of 2.075 indicates that the activity was doubled (again after administration ofIQ-143). aExpression with no IQ-143 (0.00 μM column) is set to 1.000 for normalization purposes.
Cecil et al. Genome Biology 2011, 12:R24http://genomebiology.com/2011/12/3/R24
Page 3 of 18
tshould neither accumulate nor be lost over time. Thiscondition permits calculation of all enzyme combina-tions that balance their metabolites inside the network.This yields a list of all metabolic pathways possible forthis network [24]. In real situations, such as growth withor without IQ-143, these possible pathways are usedquite differently. Next, we calculated the actual flux dis-tribution with a specific program; to do this, directexperimental data are required. The significantly
differentially expressed enzymes provide such data andconstraints on the flux distribution. This is, of course, asimplification as enzyme activity is modulated allosteri-cally and further factors are involved, such as stability ofmRNA and translational regulation. However, the com-bined errors are strongly reduced by the high number ofconstraints introduced by the gene expression data. Forthe complete system of enzymes with significant geneexpression changes, the squared deviation between the
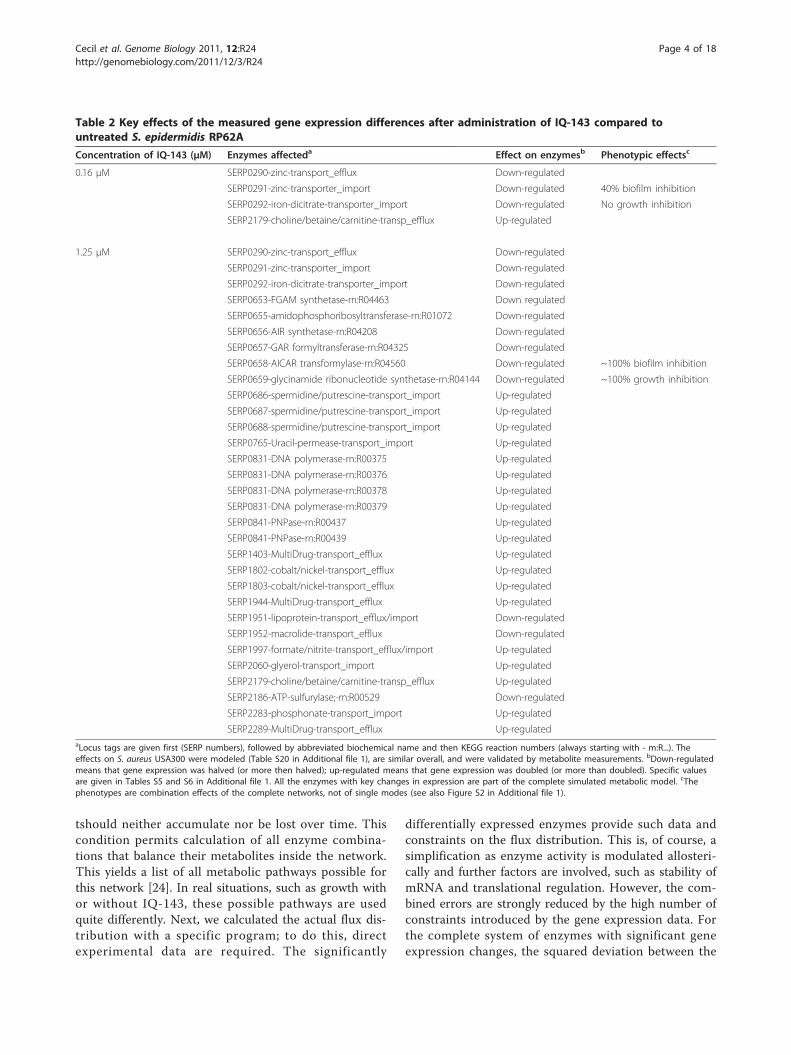
Table 2 Key effects of the measured gene expression differences after administration of IQ-143 compared tountreated S. epidermidis RP62A
Concentration of IQ-143 (μM) Enzymes affecteda Effect on enzymesb Phenotypic effectsc
0.16 μM SERP0290-zinc-transport_efflux Down-regulated
SERP0291-zinc-transporter_import Down-regulated 40% biofilm inhibition
SERP0292-iron-dicitrate-transporter_import Down-regulated No growth inhibition
SERP2179-choline/betaine/carnitine-transp_efflux Up-regulated
1.25 μM SERP0290-zinc-transport_efflux Down-regulated
SERP0291-zinc-transporter_import Down-regulated
SERP0292-iron-dicitrate-transporter_import Down-regulated
SERP0653-FGAM synthetase-rn:R04463 Down regulated
SERP0655-amidophosphoribosyltransferase-rn:R01072 Down-regulated
SERP0656-AIR synthetase-rn:R04208 Down-regulated
SERP0657-GAR formyltransferase-rn:R04325 Down-regulated
SERP0658-AICAR transformylase-rn:R04560 Down-regulated ~100% biofilm inhibition
SERP0659-glycinamide ribonucleotide synthetase-rn:R04144 Down-regulated ~100% growth inhibition
SERP0686-spermidine/putrescine-transport_import Up-regulated
SERP0687-spermidine/putrescine-transport_import Up-regulated
SERP0688-spermidine/putrescine-transport_import Up-regulated
SERP0765-Uracil-permease-transport_import Up-regulated
SERP0831-DNA polymerase-rn:R00375 Up-regulated
SERP0831-DNA polymerase-rn:R00376 Up-regulated
SERP0831-DNA polymerase-rn:R00378 Up-regulated
SERP0831-DNA polymerase-rn:R00379 Up-regulated
SERP0841-PNPase-rn:R00437 Up-regulated
SERP0841-PNPase-rn:R00439 Up-regulated
SERP1403-MultiDrug-transport_efflux Up-regulated
SERP1802-cobalt/nickel-transport_efflux Up-regulated
SERP1803-cobalt/nickel-transport_efflux Up-regulated
SERP1944-MultiDrug-transport_efflux Up-regulated
SERP1951-lipoprotein-transport_efflux/import Down-regulated
SERP1952-macrolide-transport_efflux Down-regulated
SERP1997-formate/nitrite-transport_efflux/import Up-regulated
SERP2060-glyerol-transport_import Up-regulated
SERP2179-choline/betaine/carnitine-transp_efflux Up-regulated
SERP2186-ATP-sulfurylase;-rn:R00529 Down-regulated
SERP2283-phosphonate-transport_import Up-regulated
SERP2289-MultiDrug-transport_efflux Up-regulatedaLocus tags are given first (SERP numbers), followed by abbreviated biochemical name and then KEGG reaction numbers (always starting with - m:R...). Theeffects on S. aureus USA300 were modeled (Table S20 in Additional file 1), are similar overall, and were validated by metabolite measurements. bDown-regulatedmeans that gene expression was halved (or more then halved); up-regulated means that gene expression was doubled (or more than doubled). Specific valuesare given in Tables S5 and S6 in Additional file 1. All the enzymes with key changes in expression are part of the complete simulated metabolic model. cThephenotypes are combination effects of the complete networks, not of single modes (see also Figure S2 in Additional file 1).
Cecil et al. Genome Biology 2011, 12:R24http://genomebiology.com/2011/12/3/R24
Page 4 of 18
predicted enzyme activity according to the estimatedflux distribution and the observed enzyme activity wasminimized (least-square minimization combining thegenetic algorithm of YANAsquare with a custom writtenR routine; see Materials and methods).From the complete set of flux calculations, several
enzyme changes that were not detected by the transcrip-tome data became apparent (Table 1). Certainly, theseare only predictions taking the network effects intoaccount. However, they were subsequently re-checkedusing metabolite measurements (see below). Numerousrepetitions of the transcriptome measurements may alsohave detected them, as more subtle differences thenbecome significant. On the other hand, the amount ofenzyme and activity is likely to be different from subtletranscriptional changes. As an example, combinedeffects on nucleotide and energy metabolism aredescribed in several extreme pathway modes (Table 1;see, for example, modes 127 and 161 in Tables S7, S8,S9, S10, S11, and S12 in Additional file 1). These fluxchanges pertain to the enzymes (with EC numbers inparentheses) PNPase (2.4.2.1), glucokinase (2.7.1.2),deoxycytidine kinase (2.7.1.74), DNA-directed RNApolymerase (2.7.7.6), deoxycytidine deaminase (3.5.4.14),
alpha-D-Glucose-1-epimerase (5.1.3.3), and glucose-6-phosphate isomerase (5.3.1.9). Furthermore, changes inamino acid metabolism became apparent from the fluxchanges for modes 35 and 154. Enzymes involved inenergy and amino acid metabolism change their activityafter administration of IQ-143. This included citricsynthase (2.3.3.1), aconitate hydratase (4.2.1.3) andacetyl-CoA synthetase (6.2.1.1) as well as enzymesinvolved in the conversion of acetyl-CoA to L-valineand the conversion of serine to cysteine.
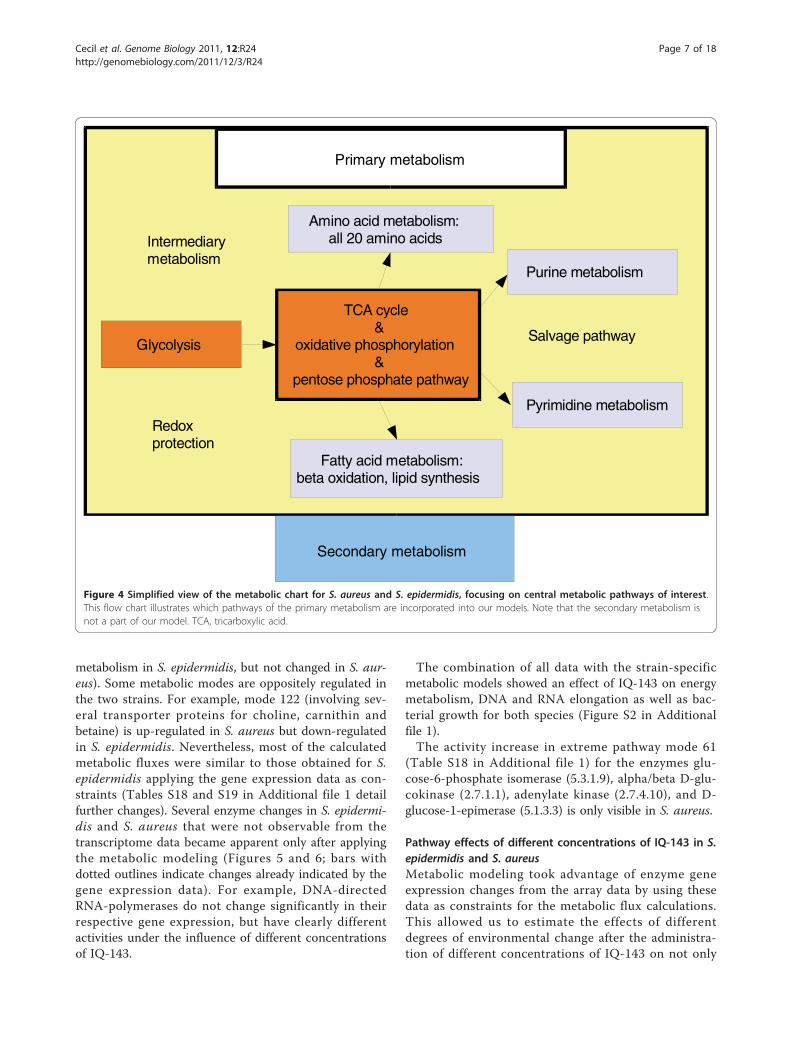
Annotation of metabolic enzymes and flux balancemetabolic model for S. epidermidis and StaphylococcusaureusTo establish an accurate model of the enzymes involvedin the response of staphylococci to IQ-143, we startedfrom the available genome sequences for S. epidermidis[Genbank:CP000029, Genbank:CP000028] [17] and S.aureus USA300 [Genbank:CP000730 and Genbank:CP000255] [18] and applied biochemical data on staphy-lococci according to the KEGG database [25]. We con-sidered all pathways of primary metabolism: amino acid,carbohydrate, lipid, and nucleotide synthesis and degrada-tion, salvage pathways and energy metabolism (Figure 4).
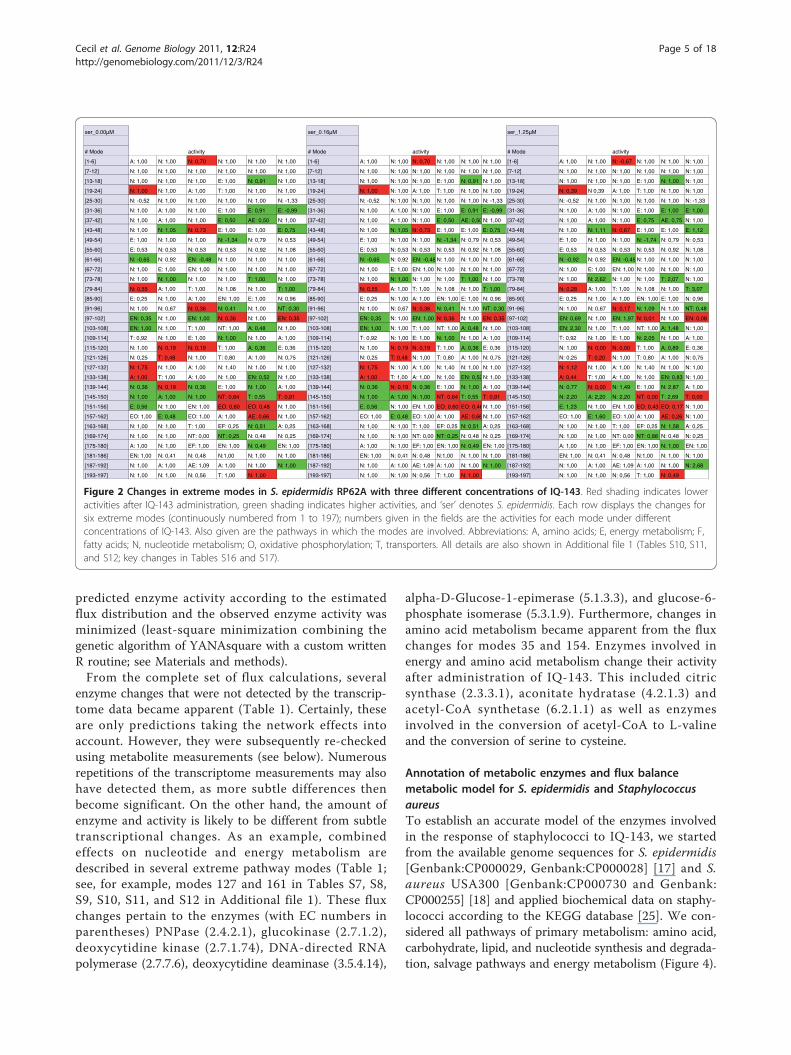
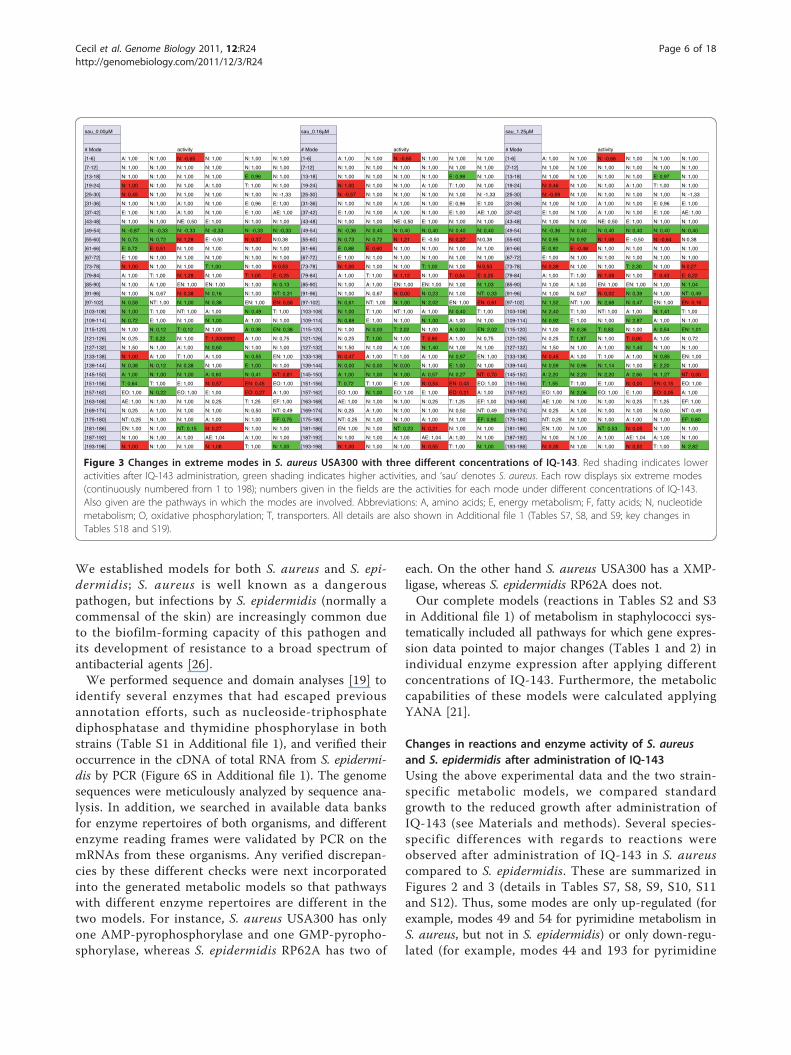
ser_0.00μM ser_0.16μM ser_1.25μM
# Mode activity # Mode activity # Mode activity
[1-6] A: 1,00 N: 1,00 N: 0,70 N: 1,00 N: 1,00 N: 1,00 [1-6] A: 1,00 N: 1,00 N: 0,70 N: 1,00 N: 1,00 N: 1,00 [1-6] A: 1,00 N: 1,00 N: -0,67 N: 1,00 N: 1,00 N: 1,00
[7-12] N: 1,00 N: 1,00 N: 1,00 N: 1,00 N: 1,00 N: 1,00 [7-12] N: 1,00 N: 1,00 N: 1,00 N: 1,00 N: 1,00 N: 1,00 [7-12] N: 1,00 N: 1,00 N: 1,00 N: 1,00 N: 1,00 N: 1,00
[13-18] N: 1,00 N: 1,00 N: 1,00 E: 1,00 N: 0,91 N: 1,00 [13-18] N: 1,00 N: 1,00 N: 1,00 E: 1,00 N: 0,91 N: 1,00 [13-18] N: 1,00 N: 1,00 N: 1,00 E: 1,00 N: 1,00 N: 1,00
[19-24] N: 1,00 N: 1,00 A: 1,00 T: 1,00 N: 1,00 N: 1,00 [19-24] N: 1,00 N: 1,00 A: 1,00 T: 1,00 N: 1,00 N: 1,00 [19-24] N: 0,39 N 0,39 A: 1,00 T: 1,00 N: 1,00 N: 1,00
[25-30] N: -0,52 N: 1,00 N: 1,00 N: 1,00 N: 1,00 N: -1,33 [25-30] N: -0,52 N: 1,00 N: 1,00 N: 1,00 N: 1,00 N: -1,33 [25-30] N: -0,52 N: 1,00 N: 1,00 N: 1,00 N: 1,00 N: -1,33
[31-36] N: 1,00 A: 1,00 N: 1,00 E: 1,00 E: 0,91 E: -0,99 [31-36] N: 1,00 A: 1,00 N: 1,00 E: 1,00 E: 0,91 E: -0,99 [31-36] N: 1,00 A: 1,00 N: 1,00 E: 1,00 E: 1,00 E: 1,00
[37-42] N: 1,00 A: 1,00 N: 1,00 E: 0,50 AE: 0,50 N: 1,00 [37-42] N: 1,00 A: 1,00 N: 1,00 E: 0,50 AE: 0,50N: 1,00 [37-42] N: 1,00 A: 1,00 N: 1,00 E: 0,75 AE: 0,75 N: 1,00
[43-48] N: 1,00 N: 1,05 N: 0,73 E: 1,00 E: 1,00 E: 0,75 [43-48] N: 1,00 N: 1,05 N: 0,73 E: 1,00 E: 1,00 E: 0,75 [43-48] N: 1,00 N: 1,11 N: 0,67 E: 1,00 E: 1,00 E: 1,12
[49-54] E: 1,00 N: 1,00 N: 1,00 N: -1,34 N: 0,79 N: 0,53 [49-54] E: 1,00 N: 1,00 N: 1,00 N: -1,34 N: 0,79 N: 0,53 [49-54] E: 1,00 N: 1,00 N: 1,00 N: -1,74 N: 0,79 N: 0,53
[55-60] E: 0,53 N: 0,53 N: 0,53 N: 0,53 N: 0,92 N: 1,08 [55-60] E: 0,53 N: 0,53 N: 0,53 N: 0,53 N: 0,92 N: 1,08 [55-60] E: 0,53 N: 0,53 N: 0,53 N: 0,53 N: 0,92 N: 1,08
[61-66] N: -0,65 N: 0,92 EN: -0,48 N: 1,00 N: 1,00 N: 1,00 [61-66] N: -0,65 N: 0,92 EN: -0,48 N: 1,00 N: 1,00 N: 1,00 [61-66] N: -0,92 N: 0,92 EN: -0,45 N: 1,00 N: 1,00 N: 1,00
[67-72] N: 1,00 E: 1,00 EN: 1,00 N: 1,00 N: 1,00 N: 1,00 [67-72] N: 1,00 E: 1,00 EN: 1,00 N: 1,00 N: 1,00 N: 1,00 [67-72] N: 1,00 E: 1,00 EN: 1,00 N: 1,00 N: 1,00 N: 1,00
[73-78] N: 1,00 N: 1,00 N: 1,00 N: 1,00 T: 1,00 N: 1,00 [73-78] N: 1,00 N: 1,00 N: 1,00 N: 1,00 T: 1,00 N: 1,00 [73-78] N: 1,00 N: 2,62 N: 1,00 N: 1,00 T: 2,07 N: 1,00
[79-84] N: 0,55 A: 1,00 T: 1,00 N: 1,08 N: 1,00 T: 1,00 [79-84] N: 0,55 A: 1,00 T: 1,00 N: 1,08 N: 1,00 T: 1,00 [79-84] N: 0,28 A: 1,00 T: 1,00 N: 1,08 N: 1,00 T: 3,07
[85-90] E: 0,25 N: 1,00 A: 1,00 EN: 1,00 E: 1,00 N: 0,96 [85-90] E: 0,25 N: 1,00 A: 1,00 EN: 1,00 E: 1,00 N: 0,96 [85-90] E: 0,25 N: 1,00 A: 1,00 EN: 1,00 E: 1,00 N: 0,96
[91-96] N: 1,00 N: 0,67 N: 0,36 N: 0,41 N: 1,00 NT: 0,30 [91-96] N: 1,00 N: 0,67 N: 0,36 N: 0,41 N: 1,00 NT: 0,30 [91-96] N: 1,00 N: 0,67 N: 0,17 N: 1,09 N: 1,00 NT: 0,48
[97-102] EN: 0,35 N: 1,00 EN: 1,00 N: 0,36 N: 1,00 EN: 0,35 [97-102] EN: 0,35 N: 1,00 EN: 1,00 N: 0,36 N: 1,00 EN: 0,35 [97-102] EN: 0,69 N: 1,00 EN: 1,97 N: 0,01 N: 1,00 EN: 0,08
[103-108] EN: 1,00 N: 1,00 T: 1,00 NT: 1,00 A: 0,48 N: 1,00 [103-108] EN: 1,00 N: 1,00 T: 1,00 NT: 1,00 A: 0,48 N: 1,00 [103-108] EN: 2,30 N: 1,00 T: 1,00 NT: 1,00 A: 1,48 N: 1,00
[109-114] T: 0,92 N: 1,00 E: 1,00 N: 1,00 N: 1,00 A: 1,00 [109-114] T: 0,92 N: 1,00 E: 1,00 N: 1,00 N: 1,00 A: 1,00 [109-114] T: 0,92 N: 1,00 E: 1,00 N: 2,05 N: 1,00 A: 1,00
[115-120] N: 1,00 N: 0,19 N: 0,19 T: 1,00 A: 0,36 E: 0,36 [115-120] N: 1,00 N: 0,19 N: 0,19 T: 1,00 A: 0,36 E: 0,36 [115-120] N: 1,00 N: 0,00 N: 0,00 T: 1,00 A: 0,89 E: 0,36
[121-126] N: 0,25 T: 0,48 N: 1,00 T: 0,80 A: 1,00 N: 0,75 [121-126] N: 0,25 T: 0,48 N: 1,00 T: 0,80 A: 1,00 N: 0,75 [121-126] N: 0,25 T: 0,20 N: 1,00 T: 0,80 A: 1,00 N: 0,75
[127-132] N: 1,75 N: 1,00 A: 1,00 N: 1,40 N: 1,00 N: 1,00 [127-132] N: 1,75 N: 1,00 A: 1,00 N: 1,40 N: 1,00 N: 1,00 [127-132] N: 1,12 N: 1,00 A: 1,00 N: 1,40 N: 1,00 N: 1,00
[133-138] A: 1,00 T: 1,00 A: 1,00 N: 1,00 EN: 0,52 N: 1,00 [133-138] A: 1,00 T: 1,00 A: 1,00 N: 1,00 EN: 0,52N: 1,00 [133-138] A: 0,44 T: 1,00 A: 1,00 N: 1,00 EN: 0,83 N: 1,00
[139-144] N: 0,36 N: 0,19 N: 0,36 E: 1,00 N: 1,00 A: 1,00 [139-144] N: 0,36 N: 0,19 N: 0,36 E: 1,00 N: 1,00 A: 1,00 [139-144] N: 0,77 N: 0,00 N: 1,49 E: 1,00 N: 2,87 A: 1,00
[145-150] N: 1,00 A: 1,00 N: 1,00 NT: 0,64 T: 0,55 T: 0,91 [145-150] N: 1,00 A: 1,00 N: 1,00 NT: 0,64 T: 0,55 T: 0,91 [145-150] N: 2,20 A: 2,20 N: 2,20 NT: 0,00 T: 2,69 T: 0,00
[151-156] E: 0,56 N: 1,00 EN: 1,00 EO: 0,60 EO: 0,48 N: 1,00 [151-156] E: 0,56 N: 1,00 EN: 1,00 EO: 0,60 EO: 0,48N: 1,00 [151-156] E: 1,23 N: 1,00 EN: 1,00 EO: 0,43 EO: 0,17 N: 1,00
[157-162] EO: 1,00 E: 0,48 EO: 1,00 A: 1,00 AE: 0,66 N: 1,00 [157-162] EO: 1,00 E: 0,48 EO: 1,00 A: 1,00 AE: 0,66N: 1,00 [157-162] EO: 1,00 E: 1,60 EO: 1,00 A: 1,00 AE: 0,26 N: 1,00
[163-168] N: 1,00 N: 1,00 T: 1,00 EF: 0,25 N: 0,51 A: 0,25 [163-168] N: 1,00 N: 1,00 T: 1,00 EF: 0,25 N: 0,51 A: 0,25 [163-168] N: 1,00 N: 1,00 T: 1,00 EF: 0,25 N: 1,58 A: 0,25
[169-174] N: 1,00 N: 1,00 NT: 0,00 NT: 0,25 N: 0,48 N: 0,25 [169-174] N: 1,00 N: 1,00 NT: 0,00 NT: 0,25 N: 0,48 N: 0,25 [169-174] N: 1,00 N: 1,00 NT: 0,00 NT: 0,88 N: 0,48 N: 0,25
[175-180] A: 1,00 N: 1,00 EF: 1,00 EN: 1,00 N: 0,49 EN: 1,00 [175-180] A: 1,00 N: 1,00 EF: 1,00 EN: 1,00 N: 0,49 EN: 1,00 [175-180] A: 1,00 N: 1,00 EF: 1,00 EN: 1,00 N: 1,00 EN: 1,00
[181-186] EN: 1,00 N: 0,41 N: 0,48 N:1,00 N: 1,00 N: 1,00 [181-186] EN: 1,00 N: 0,41 N: 0,48 N:1,00 N: 1,00 N: 1,00 [181-186] EN: 1,00 N: 0,41 N: 0,48 N:1,00 N: 1,00 N: 1,00
[187-192] N: 1,00 A: 1,00 AE: 1,09 A: 1,00 N: 1,00 N: 1,00 [187-192] N: 1,00 A: 1,00 AE: 1,09 A: 1,00 N: 1,00 N: 1,00 [187-192] N: 1,00 A: 1,00 AE: 1,09 A: 1,00 N: 1,00 N: 2,68
[193-197] N: 1,00 N: 1,00 N: 0,56 T: 1,00 N: 1,00 [193-197] N: 1,00 N: 1,00 N: 0,56 T: 1,00 N: 1,00 [193-197] N: 1,00 N: 1,00 N: 0,56 T: 1,00 N: 0,49
Figure 2 Changes in extreme modes in S. epidermidis RP62A with three different concentrations of IQ-143. Red shading indicates loweractivities after IQ-143 administration, green shading indicates higher activities, and ‘ser’ denotes S. epidermidis. Each row displays the changes forsix extreme modes (continuously numbered from 1 to 197); numbers given in the fields are the activities for each mode under differentconcentrations of IQ-143. Also given are the pathways in which the modes are involved. Abbreviations: A, amino acids; E, energy metabolism; F,fatty acids; N, nucleotide metabolism; O, oxidative phosphorylation; T, transporters. All details are also shown in Additional file 1 (Tables S10, S11,and S12; key changes in Tables S16 and S17).
Cecil et al. Genome Biology 2011, 12:R24http://genomebiology.com/2011/12/3/R24
Page 5 of 18
We established models for both S. aureus and S. epi-dermidis; S. aureus is well known as a dangerouspathogen, but infections by S. epidermidis (normally acommensal of the skin) are increasingly common dueto the biofilm-forming capacity of this pathogen andits development of resistance to a broad spectrum ofantibacterial agents [26].We performed sequence and domain analyses [19] to
identify several enzymes that had escaped previousannotation efforts, such as nucleoside-triphosphatediphosphatase and thymidine phosphorylase in bothstrains (Table S1 in Additional file 1), and verified theiroccurrence in the cDNA of total RNA from S. epidermi-dis by PCR (Figure 6S in Additional file 1). The genomesequences were meticulously analyzed by sequence ana-lysis. In addition, we searched in available data banksfor enzyme repertoires of both organisms, and differentenzyme reading frames were validated by PCR on themRNAs from these organisms. Any verified discrepan-cies by these different checks were next incorporatedinto the generated metabolic models so that pathwayswith different enzyme repertoires are different in thetwo models. For instance, S. aureus USA300 has onlyone AMP-pyrophosphorylase and one GMP-pyropho-sphorylase, whereas S. epidermidis RP62A has two of
each. On the other hand S. aureus USA300 has a XMP-ligase, whereas S. epidermidis RP62A does not.Our complete models (reactions in Tables S2 and S3
in Additional file 1) of metabolism in staphylococci sys-tematically included all pathways for which gene expres-sion data pointed to major changes (Tables 1 and 2) inindividual enzyme expression after applying differentconcentrations of IQ-143. Furthermore, the metaboliccapabilities of these models were calculated applyingYANA [21].
Changes in reactions and enzyme activity of S. aureusand S. epidermidis after administration of IQ-143Using the above experimental data and the two strain-specific metabolic models, we compared standardgrowth to the reduced growth after administration ofIQ-143 (see Materials and methods). Several species-specific differences with regards to reactions wereobserved after administration of IQ-143 in S. aureuscompared to S. epidermidis. These are summarized inFigures 2 and 3 (details in Tables S7, S8, S9, S10, S11and S12). Thus, some modes are only up-regulated (forexample, modes 49 and 54 for pyrimidine metabolism inS. aureus, but not in S. epidermidis) or only down-regu-lated (for example, modes 44 and 193 for pyrimidine
sau_0.00μM sau_0.16μM sau_1.25μM
# Mode activity # Mode activity # Mode activity
[1-6] A: 1,00 N: 1,00 N: -0,65 N: 1,00 N: 1,00 N: 1,00 [1-6] A: 1,00 N: 1,00 N: -0,65 N: 1,00 N: 1,00 N: 1,00 [1-6] A: 1,00 N: 1,00 N: -0,66 N: 1,00 N: 1,00 N: 1,00
[7-12] N: 1,00 N: 1,00 N: 1,00 N: 1,00 N: 1,00 N: 1,00 [7-12] N: 1,00 N: 1,00 N: 1,00 N: 1,00 N: 1,00 N: 1,00 [7-12] N: 1,00 N: 1,00 N: 1,00 N: 1,00 N: 1,00 N: 1,00
[13-18] N: 1,00 N: 1,00 N: 1,00 N: 1,00 E: 0,96 N: 1,00 [13-18] N: 1,00 N: 1,00 N: 1,00 N: 1,00 E: 0,98 N: 1,00 [13-18] N: 1,00 N: 1,00 N: 1,00 N: 1,00 E: 0,97 N: 1,00
[19-24] N: 1,00 N: 1,00 N: 1,00 A: 1,00 T: 1,00 N: 1,00 [19-24] N: 1,00 N: 1,00 N: 1,00 A: 1,00 T: 1,00 N: 1,00 [19-24] N: 0,46 N: 1,00 N: 1,00 A: 1,00 T: 1,00 N: 1,00
[25-30] N: 0,45 N: 1,00 N: 1,00 N: 1,00 N: 1,00 N: -1,33 [25-30] N: -0,57 N: 1,00 N: 1,00 N: 1,00 N: 1,00 N: -1,33 [25-30] N: -0,59 N: 1,00 N: 1,00 N: 1,00 N: 1,00 N: -1,33
[31-36] N: 1,00 N: 1,00 A: 1,00 N: 1,00 E: 0,96 E: 1,00 [31-36] N: 1,00 N: 1,00 A: 1,00 N: 1,00 E: 0,96 E: 1,00 [31-36] N: 1,00 N: 1,00 A: 1,00 N: 1,00 E: 0,96 E: 1,00
[37-42] E: 1,00 N: 1,00 A: 1,00 N: 1,00 E: 1,00 AE: 1,00 [37-42] E: 1,00 N: 1,00 A: 1,00 N: 1,00 E: 1,00 AE: 1,00 [37-42] E: 1,00 N: 1,00 A: 1,00 N: 1,00 E: 1,00 AE: 1,00
[43-48] N: 1,00 N: 1,00 NE: 0,50 E: 1,00 N: 1,00 N: 1,00 [43-48] N: 1,00 N: 1,00 NE: 0,50 E: 1,00 N: 1,00 N: 1,00 [43-48] N: 1,00 N: 1,00 NE: 0,50 E: 1,00 N: 1,00 N: 1,00
[49-54] N: -0,87 N: -0,33 N: -0,33 N: -0,33 N: -0,33 N: -0,33 [49-54] N: -0,36 N: 0,40 N: 0,40 N: 0,40 N: 0,40 N: 0,40 [49-54] N: -0,36 N: 0,40 N: 0,40 N: 0,40 N: 0,40 N: 0,40
[55-60] N: 0,73 N: 0,72 N: 1,28 E: -0,50 N: 0,37 N:0,38 [55-60] N: 0,73 N: 0,72 N: 1,21 E: -0,50 N: 0,37 N:0,38 [55-60] N: 0,95 N: 0,92 N: 1,08 E: -0,50 N: -0,64 N:0,38
[61-66] E: 0,72 E: 0,51 N: 1,00 N: 1,00 N: 1,00 N: 1,00 [61-66] E: 0,88 E: 0,60 N: 1,00 N: 1,00 N: 1,00 N: 1,00 [61-66] E: 0,92 E: -0,48 N: 1,00 N: 1,00 N: 1,00 N: 1,00
[67-72] E: 1,00 N: 1,00 N: 1,00 N: 1,00 N: 1,00 N: 1,00 [67-72] E: 1,00 N: 1,00 N: 1,00 N: 1,00 N: 1,00 N: 1,00 [67-72] E: 1,00 N: 1,00 N: 1,00 N: 1,00 N: 1,00 N: 1,00
[73-78] N: 1,00 N: 1,00 N: 1,00 T: 1,00 N: 1,00 N 0,53 [73-78] N: 1,00 N: 1,00 N: 1,00 T: 1,00 N: 1,00 N 0,53 [73-78] N: 0,39 N: 1,00 N: 1,00 T: 2,30 N: 1,00 N 0,27
[79-84] A: 1,00 T: 1,00 N: 1,28 N: 1,00 T: 1,00 E: 0,25 [79-84] A: 1,00 T: 1,00 N: 1,12 N: 1,00 T: 0,54 E: 0,25 [79-84] A: 1,00 T: 1,00 N: 1,08 N: 1,00 T: 0,43 E: 0,22
[85-90] N: 1,00 A: 1,00 EN: 1,00 EN: 1,00 N: 1,00 N: 0,13 [85-90] N: 1,00 A: 1,00 EN: 1,00 EN: 1,00 N: 1,00 N: 1,03 [85-90] N: 1,00 A: 1,00 EN: 1,00 EN: 1,00 N: 1,00 N: 1,04
[91-96] N: 1,00 N. 0,67 N: 0,38 N: 0,16 N: 1,00 NT: 0,31 [91-96] N: 1,00 N. 0,67 N: 0,00 N: 0,23 N: 1,00 NT: 0,33 [91-96] N: 1,00 N. 0,67 N: 0,02 N: 0,39 N: 1,00 NT: 0,49
[97-102] N: 0,58 NT: 1,00 N: 1,00 N: 0,38 EN: 1,00 EN: 0,58 [97-102] N: 0,61 NT: 1,00 N: 1,00 N: 2,02 EN: 1,00 EN: 0,61 [97-102] N: 1,52 NT: 1,00 N: 2,68 N: 0,47 EN: 1,00 EN: 0,16
[103-108] N: 1,00 T: 1,00 NT: 1,00 A: 1,00 N: 0,49 T: 1,00 [103-108] N: 1,00 T: 1,00 NT: 1,00 A: 1,00 N: 0,40 T: 1,00 [103-108] N: 2,40 T: 1,00 NT: 1,00 A: 1,00 N: 1,41 T: 1,00
[109-114] N: 0,72 E: 1,00 N: 1,00 N: 1,00 A: 1,00 N: 1,00 [109-114] N: 0,88 E: 1,00 N: 1,00 N: 1,00 A: 1,00 N: 1,00 [109-114] N: 0,92 E: 1,00 N: 1,00 N: 2,87 A: 1,00 N: 1,00
[115-120] N: 1,00 N: 0,12 T: 0,12 N: 1,00 A: 0,38 EN: 0,38 [115-120] N: 1,00 N: 0,00 T: 2,02 N: 1,00 A: 0,00 EN: 2,02 [115-120] N: 1,00 N: 0,36 T: 0,83 N: 1,00 A: 0,54 EN: 1,01
[121-126] N: 0,25 T: 0,22 N: 1,00 T: 1,2000092 A: 1,00 N: 0,75 [121-126] N: 0,25 T: 1,00 N: 1,00 T: 0,80 A: 1,00 N: 0,75 [121-126] N: 0,25 T: 1,97 N: 1,00 T: 0,80 A: 1,00 N: 0,72
[127-132] N: 1,50 N: 1,00 A: 1,00 N: 0,60 N: 1,00 N: 1,00 [127-132] N: 1,50 N: 1,00 A: 1,00 N: 1,40 N: 1,00 N: 1,00 [127-132] N: 1,50 N: 1,00 A: 1,00 N: 1,40 N: 1,00 N: 1,00
[133-138] N: 1,00 A: 1,00 T: 1,00 A: 1,00 N: 0,55 EN: 1,00 [133-138] N: 0,47 A: 1,00 T: 1,00 A: 1,00 N: 0,57 EN: 1,00 [133-138] N: 0,45 A: 1,00 T: 1,00 A: 1,00 N: 0,85 EN: 1,00
[139-144] N: 0,38 N: 0,12 N: 0,38 N: 1,00 E: 1,00 N: 1,00 [139-144] N: 0,00 N: 0,00 N: 0,00 N: 1,00 E: 1,00 N: 1,00 [139-144] N: 0,59 N: 0,96 N: 1,14 N: 1,00 E: 2,20 N: 1,00
[145-150] A: 1,00 N: 1,00 N: 1,00 A: 0,60 N: 0,41 NT: 0,81 [145-150] A: 1,00 N: 1,00 N: 1,00 A: 0,57 N: 0,27 NT: 0,70 [145-150] A: 2,20 N: 2,20 N: 2,20 A: 2,66 N: 1,27 NT: 0,00
[151-156] T: 0,64 T: 1,00 E: 1,00 N: 0,57 EN: 0,45 EO: 1,00 [151-156] T: 0,72 T: 1,00 E: 1,00 N: 0,54 EN: 0,43 EO: 1,00 [151-156] T: 1,55 T: 1,00 E: 1,00 N: 0,00 EN: 0,15 EO: 1,00
[157-162] EO: 1,00 N: 0,22 EO: 1,00 E: 1,00 EO: 0,27 A: 1,00 [157-162] EO: 1,00 N: 1,00 EO: 1,00 E: 1,00 EO: 0,21 A: 1,00 [157-162] EO: 1,00 N: 2,06 EO: 1,00 E: 1,00 EO: 0,05 A: 1,00
[163-168] AE: 1,00 N: 1,00 N: 1,00 N: 0,25 T: 1,25 EF: 1,00 [163-168] AE: 1,00 N: 1,00 N: 1,00 N: 0,25 T: 1,25 EF: 1,00 [163-168] AE: 1,00 N: 1,00 N: 1,00 N: 0,25 T: 1,25 EF: 1,00
[169-174] N: 0,25 A: 1,00 N: 1,00 N: 1,00 N: 0,50 NT: 0,49 [169-174] N: 0,25 A: 1,00 N: 1,00 N: 1,00 N: 0,50 NT: 0,49 [169-174] N: 0,25 A: 1,00 N: 1,00 N: 1,00 N: 0,50 NT: 0,49
[175-180] NT: 0,25 N: 1,00 N: 1,00 A: 1,00 N: 1,00 EF: 0,75 [175-180] NT: 0,25 N: 1,00 N: 1,00 A: 1,00 N: 1,00 EF: 0,90 [175-180] NT: 0,25 N: 1,00 N: 1,00 A: 1,00 N: 1,00 EF: 0,80
[181-186] EN: 1,00 N: 1,00 NT: 0,15 N: 0,27 N: 1,00 N: 1,00 [181-186] EN: 1,00 N: 1,00 NT: 0,23 N: 0,21 N: 1,00 N: 1,00 [181-186] EN: 1,00 N: 1,00 NT: 0,53 N: 0,05 N: 1,00 N: 1,00
[187-192] N: 1,00 N: 1,00 A: 1,00 AE: 1,04 A: 1,00 N: 1,00 [187-192] N: 1,00 N: 1,00 A: 1,00 AE: 1,04 A: 1,00 N: 1,00 [187-192] N: 1,00 N: 1,00 A: 1,00 AE: 1,04 A: 1,00 N: 1,00
[193-198] N: 1,00 N: 1,00 N: 1,00 N: 1,08 T: 1,00 N: 1,00 [193-198] N: 1,00 N: 1,00 N: 1,00 N: 0,55 T: 1,00 N: 1,00 [193-198] N: 0,35 N: 1,00 N: 1,00 N: 0,52 T: 1,00 N: 2,82
Figure 3 Changes in extreme modes in S. aureus USA300 with three different concentrations of IQ-143. Red shading indicates loweractivities after IQ-143 administration, green shading indicates higher activities, and ‘sau’ denotes S. aureus. Each row displays six extreme modes(continuously numbered from 1 to 198); numbers given in the fields are the activities for each mode under different concentrations of IQ-143.Also given are the pathways in which the modes are involved. Abbreviations: A, amino acids; E, energy metabolism; F, fatty acids; N, nucleotidemetabolism; O, oxidative phosphorylation; T, transporters. All details are also shown in Additional file 1 (Tables S7, S8, and S9; key changes inTables S18 and S19).
Cecil et al. Genome Biology 2011, 12:R24http://genomebiology.com/2011/12/3/R24
Page 6 of 18
metabolism in S. epidermidis, but not changed in S. aur-eus). Some metabolic modes are oppositely regulated inthe two strains. For example, mode 122 (involving sev-eral transporter proteins for choline, carnithin andbetaine) is up-regulated in S. aureus but down-regulatedin S. epidermidis. Nevertheless, most of the calculatedmetabolic fluxes were similar to those obtained for S.epidermidis applying the gene expression data as con-straints (Tables S18 and S19 in Additional file 1 detailfurther changes). Several enzyme changes in S. epidermi-dis and S. aureus that were not observable from thetranscriptome data became apparent only after applyingthe metabolic modeling (Figures 5 and 6; bars withdotted outlines indicate changes already indicated by thegene expression data). For example, DNA-directedRNA-polymerases do not change significantly in theirrespective gene expression, but have clearly differentactivities under the influence of different concentrationsof IQ-143.
The combination of all data with the strain-specificmetabolic models showed an effect of IQ-143 on energymetabolism, DNA and RNA elongation as well as bac-terial growth for both species (Figure S2 in Additionalfile 1).The activity increase in extreme pathway mode 61
(Table S18 in Additional file 1) for the enzymes glu-cose-6-phosphate isomerase (5.3.1.9), alpha/beta D-glu-cokinase (2.7.1.1), adenylate kinase (2.7.4.10), and D-glucose-1-epimerase (5.1.3.3) is only visible in S. aureus.
Pathway effects of different concentrations of IQ-143 in S.epidermidis and S. aureusMetabolic modeling took advantage of enzyme geneexpression changes from the array data by using thesedata as constraints for the metabolic flux calculations.This allowed us to estimate the effects of differentdegrees of environmental change after the administra-tion of different concentrations of IQ-143 on not only
Primary metabolism
TCA cycle
&
oxidative phosphorylation
&
pentose phosphate pathway
Glycolysis
Amino acid metabolism:
all 20 amino acids
Fatty acid metabolism:
beta oxidation, lipid synthesis
Purine metabolism
Pyrimidine metabolism
Intermediary
metabolism
Redox
protection
Salvage pathway
Secondary metabolism
Figure 4 Simplified view of the metabolic chart for S. aureus and S. epidermidis, focusing on central metabolic pathways of interest.This flow chart illustrates which pathways of the primary metabolism are incorporated into our models. Note that the secondary metabolism isnot a part of our model. TCA, tricarboxylic acid.
Cecil et al. Genome Biology 2011, 12:R24http://genomebiology.com/2011/12/3/R24
Page 7 of 18

the metabolism of individual enzymes but also on entirepathways. Using the gene expression changes as con-straints in a metabolite flux model to estimate thechanges in individual metabolic fluxes after administra-tion of IQ-143, YANAsquare allowed us to calculate theresulting change for each flux and all enzymes in thenetwork [22]. The constraints on the gene expression ofseveral enzymes are of course only a simple first-orderestimate of enzyme activity. However, it turned out thatthe given number (31) of constraints in the model,which were estimated according to significant geneexpression changes as well as the tight connectionsbetween different pathways in the metabolic network,are sufficient for optimized flux estimates. In particular,the estimated fluxes are in accordance with the mea-sured experimental metabolite concentrations and theirchanges (see below).One could expect a general stress response from the
administered IQ-143. In fact, we identified stressresponse mechanisms of S. epidermidis RP62A againstIQ-143 (Table 3). However, we found significant up-reg-ulation of stress response genes only for two genes after
looking at all genes that were up-regulated: SERP2244and SERP1998. SERP2244 encodes a bacterial capsulesynthesis protein (PGA_cap), which may help the bac-teria to resist high salt concentrations and may also beinvolved in virulence [27,28]. SERP1998 is a putativeactivator of the Hsp90 ATPase homolog 1-like protein.Up-regulation of Hsp90 results in higher survival underconditions of increased stress [29,30]. However, genesbelonging to the sigmaB-dependent stress regulon arenot affected by IQ-143. Furthermore, the transcriptomedata show that several ABC transporters are up-regu-lated by IQ-143. ABC transporters are often involved inmulti-drug resistance as they function as trans-mem-brane efflux pumps for active transport of several xeno-biotics, including anti-infective substances [31]. Instaphylococci, several ABC transporters, such as MsrA(conferring resistance to macrolides, lincosamides, strep-togramins), TetK (conferring resistance to tetracycline),NorA (conferring resistance to fluoroquinolones),VgaAB (conferring resistance to streptogramins), andFusB (conferring resistance to fusidic acid), have beenshown to be involved in antibiotic resistance [32].
S. aureus USA300
0,0000
0,0500
0,1000
0,1500
0,2000
0,2500
0,00 μM 0,16 μM 1,25 μM
concentration [μM]
en
zym
e a
ctivity [a
rbitra
ry u
nits] OP_complex1
OP_complex2
[OP_complex3]
OP_complex4
OP_complex5
PurM_DNA-directed-RNA-polyermase_ATP
PurM_DNA-directed-RNA-polyermase_CTP
PurM_DNA-directed-RNA-polyermase_GTP
PurM_DNA-directed-RNA-polyermase_UTP
[PurM_DNA-directed-DNA-polymerase_dATP]
[PurM_DNA-directed-DNA-polymerase_dCTP]
[PurM_DNA-directed-DNA-polymerase_dGTP]
[PurM_DNA-directed-DNA-polymerase_dTTP]
[PurM_PNPase_ADP]
[PurM_PNPase_GDP]
Glyc_glyceraldehyde-3-P-dehydrogenase_NAD+
Glyc_glyceraldehyde-3-P-dehydrogenase_NADP+
TCA_pyruvate_dehydrogenase
Figure 5 Effects of IQ-143 on metabolic enzymes of S. aureus. Detailed data are given in Table 4. The insert shows the different enzymecolor codes. Many differences are apparent after applying metabolic modeling; bars with dotted outlines and brackets around the enzyme namehighlight those enzymes in which the different gene expression values already indicate a significant change after administration of IQ-143.
Cecil et al. Genome Biology 2011, 12:R24http://genomebiology.com/2011/12/3/R24
Page 8 of 18

However, the ABC transporters deregulated by IQ-143in this study have not been documented to be involvedin resistance to xenobiotics yet. Further studies areneeded to clarify the exact role of these transporters inresistance.Gene expression differences (Table 1) and detailed
modeling of metabolism suggest that key changes arenot located in just one particular subnetwork: DNA andRNA elongation is up-regulated (two-fold), and oxida-tive phosphorylation complex 3 is up-regulated (eight-fold). By contrast, glycolysis as well as lactate dehydro-genase (1.1.1.27) are down-regulated (by 50%).
In particular, enzymes of the oxidative phosphoryla-tion and purine pathways are primarily affected uponapplication of IQ-143 (Table 4). In purine metabolism,the enzymes utilizing inosine monophosphate (IMP) areimpeded as well as complex 1 and 3 (Figures 5 and 6)of oxidative phosphorylation. Also, there is a drop inactivity of some DNA and RNA polymerases. Figures 2and 3 provide detailed information on the completemetabolic effects calculated from the data usingYANAsquare [22].The changes in complexes 1 and 3 are of particular
interest. These significant changes in activity suggest
Table 3 Identification of stress response mechanisms in S. epidermidis RP62A11
Hit
Query Family Description Entry type Clan Bit score E-value
SERP2244 PGA_cap Bacterial capsule synthesis protein PGA_cap Domain CL0163 233.2 2.3e-69
SERP1998 AHSA1 Activator of Hsp90 ATPase homolog 1-like protein Family CL0209 67.8 6.9e-19
This table provides BLAST [48] results of the two putative stress response mechanisms of S. epidermidis RP62A we detected by iterative sequence search.PGA_cap encodes a poly-gamma-glutamate capsule, which could improve the survivability under salt stress. AHSA1 encodes an activator of the Hsp90 ATPasehomolog 1-like protein, which results in an increase of efficiency of the Hsp90 function and thus leads to higher survivability under stress conditions.
S. epidermidis RP62A
0,0000
0,0100
0,0200
0,0300
0,0400
0,0500
0,0600
0,0700
0,0800
0,0900
0,00 μM 0,16 μM 1,25 μM
concentration [μM]
en
zym
e a
ctivity [a
rbitra
ry u
nits]
OP_complex1
OP_complex2
[OP_complex3]
OP_complex4
OP_complex5
PurM_DNA-directed-RNA-polyermase_ATP
PurM_DNA-directed-RNA-polyermase_CTP
PurM_DNA-directed-RNA-polyermase_GTP
PurM_DNA-directed-RNA-polyermase_UTP
[PurM_DNA-directed-DNA-polymerase_dATP]
[PurM_DNA-directed-DNA-polymerase_dCTP]
[PurM_DNA-directed-DNA-polymerase_dGTP]
[PurM_DNA-directed-DNA-polymerase_dTTP]
[PurM_PNPase_ADP]
[PurM_PNPase_GDP]
Glyc_glyceraldehyde-3-P-dehydrogenase_NAD+
Glyc_glyceraldehyde-3-P-dehydrogenase_NADP+
TCA_pyruvate_dehydrogenase
Figure 6 Effects of IQ-143 on metabolic enzymes of S. epidermidis. Detailed data are given in Table 4. The insert shows the differentenzyme color codes. Many differences are apparent after applying metabolic modeling; bars with dotted outlines and brackets around theenzyme name highlight those enzymes in which the different gene expression values already indicate a significant change after administrationof IQ-143.
Cecil et al. Genome Biology 2011, 12:R24http://genomebiology.com/2011/12/3/R24
Page 9 of 18
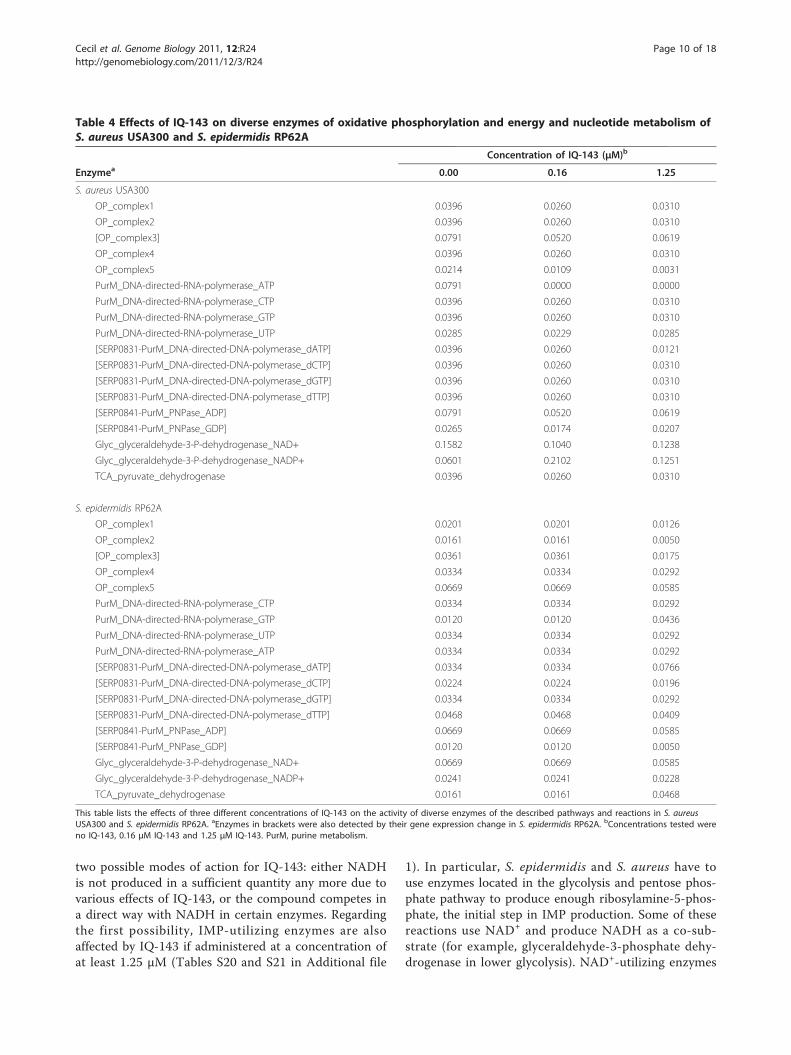
two possible modes of action for IQ-143: either NADHis not produced in a sufficient quantity any more due tovarious effects of IQ-143, or the compound competes ina direct way with NADH in certain enzymes. Regardingthe first possibility, IMP-utilizing enzymes are alsoaffected by IQ-143 if administered at a concentration ofat least 1.25 μM (Tables S20 and S21 in Additional file
1). In particular, S. epidermidis and S. aureus have touse enzymes located in the glycolysis and pentose phos-phate pathway to produce enough ribosylamine-5-phos-phate, the initial step in IMP production. Some of thesereactions use NAD+ and produce NADH as a co-sub-strate (for example, glyceraldehyde-3-phosphate dehy-drogenase in lower glycolysis). NAD+-utilizing enzymes
Table 4 Effects of IQ-143 on diverse enzymes of oxidative phosphorylation and energy and nucleotide metabolism ofS. aureus USA300 and S. epidermidis RP62A
Concentration of IQ-143 (μM)b
Enzymea 0.00 0.16 1.25
S. aureus USA300
OP_complex1 0.0396 0.0260 0.0310
OP_complex2 0.0396 0.0260 0.0310
[OP_complex3] 0.0791 0.0520 0.0619
OP_complex4 0.0396 0.0260 0.0310
OP_complex5 0.0214 0.0109 0.0031
PurM_DNA-directed-RNA-polymerase_ATP 0.0791 0.0000 0.0000
PurM_DNA-directed-RNA-polymerase_CTP 0.0396 0.0260 0.0310
PurM_DNA-directed-RNA-polymerase_GTP 0.0396 0.0260 0.0310
PurM_DNA-directed-RNA-polymerase_UTP 0.0285 0.0229 0.0285
[SERP0831-PurM_DNA-directed-DNA-polymerase_dATP] 0.0396 0.0260 0.0121
[SERP0831-PurM_DNA-directed-DNA-polymerase_dCTP] 0.0396 0.0260 0.0310
[SERP0831-PurM_DNA-directed-DNA-polymerase_dGTP] 0.0396 0.0260 0.0310
[SERP0831-PurM_DNA-directed-DNA-polymerase_dTTP] 0.0396 0.0260 0.0310
[SERP0841-PurM_PNPase_ADP] 0.0791 0.0520 0.0619
[SERP0841-PurM_PNPase_GDP] 0.0265 0.0174 0.0207
Glyc_glyceraldehyde-3-P-dehydrogenase_NAD+ 0.1582 0.1040 0.1238
Glyc_glyceraldehyde-3-P-dehydrogenase_NADP+ 0.0601 0.2102 0.1251
TCA_pyruvate_dehydrogenase 0.0396 0.0260 0.0310
S. epidermidis RP62A
OP_complex1 0.0201 0.0201 0.0126
OP_complex2 0.0161 0.0161 0.0050
[OP_complex3] 0.0361 0.0361 0.0175
OP_complex4 0.0334 0.0334 0.0292
OP_complex5 0.0669 0.0669 0.0585
PurM_DNA-directed-RNA-polymerase_CTP 0.0334 0.0334 0.0292
PurM_DNA-directed-RNA-polymerase_GTP 0.0120 0.0120 0.0436
PurM_DNA-directed-RNA-polymerase_UTP 0.0334 0.0334 0.0292
PurM_DNA-directed-RNA-polymerase_ATP 0.0334 0.0334 0.0292
[SERP0831-PurM_DNA-directed-DNA-polymerase_dATP] 0.0334 0.0334 0.0766
[SERP0831-PurM_DNA-directed-DNA-polymerase_dCTP] 0.0224 0.0224 0.0196
[SERP0831-PurM_DNA-directed-DNA-polymerase_dGTP] 0.0334 0.0334 0.0292
[SERP0831-PurM_DNA-directed-DNA-polymerase_dTTP] 0.0468 0.0468 0.0409
[SERP0841-PurM_PNPase_ADP] 0.0669 0.0669 0.0585
[SERP0841-PurM_PNPase_GDP] 0.0120 0.0120 0.0050
Glyc_glyceraldehyde-3-P-dehydrogenase_NAD+ 0.0669 0.0669 0.0585
Glyc_glyceraldehyde-3-P-dehydrogenase_NADP+ 0.0241 0.0241 0.0228
TCA_pyruvate_dehydrogenase 0.0161 0.0161 0.0468
This table lists the effects of three different concentrations of IQ-143 on the activity of diverse enzymes of the described pathways and reactions in S. aureusUSA300 and S. epidermidis RP62A. aEnzymes in brackets were also detected by their gene expression change in S. epidermidis RP62A. bConcentrations tested wereno IQ-143, 0.16 μM IQ-143 and 1.25 μM IQ-143. PurM, purine metabolism.
Cecil et al. Genome Biology 2011, 12:R24http://genomebiology.com/2011/12/3/R24
Page 10 of 18
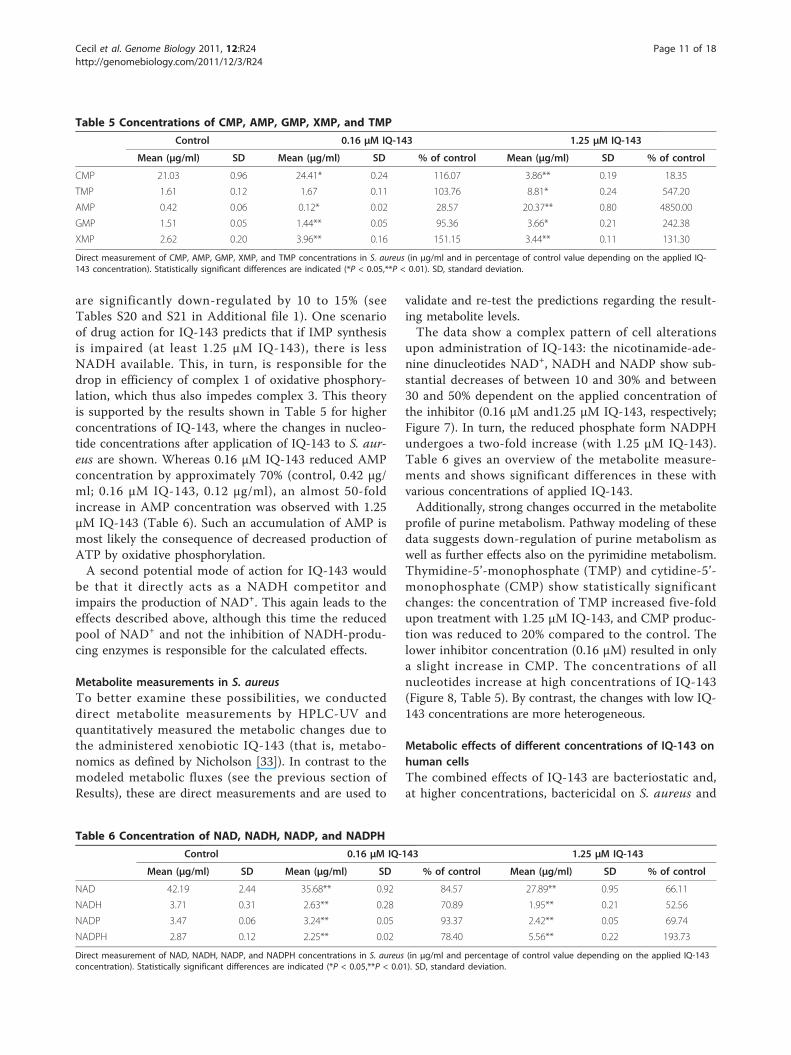
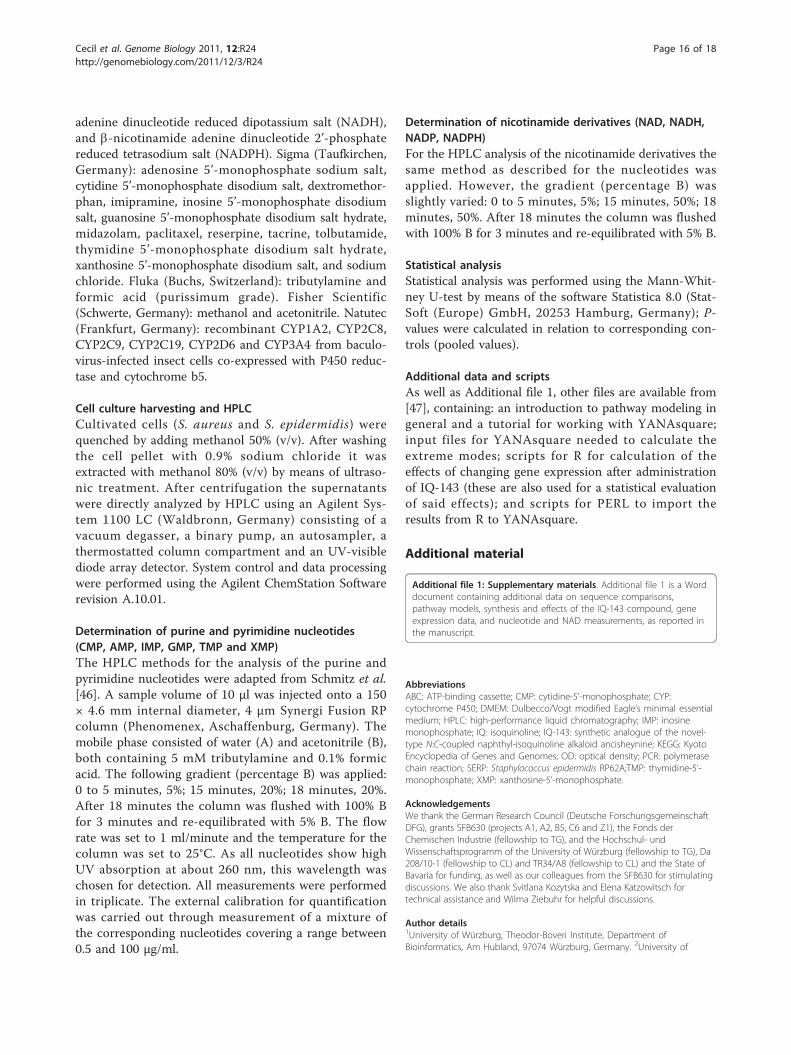
are significantly down-regulated by 10 to 15% (seeTables S20 and S21 in Additional file 1). One scenarioof drug action for IQ-143 predicts that if IMP synthesisis impaired (at least 1.25 μM IQ-143), there is lessNADH available. This, in turn, is responsible for thedrop in efficiency of complex 1 of oxidative phosphory-lation, which thus also impedes complex 3. This theoryis supported by the results shown in Table 5 for higherconcentrations of IQ-143, where the changes in nucleo-tide concentrations after application of IQ-143 to S. aur-eus are shown. Whereas 0.16 μM IQ-143 reduced AMPconcentration by approximately 70% (control, 0.42 μg/ml; 0.16 μM IQ-143, 0.12 μg/ml), an almost 50-foldincrease in AMP concentration was observed with 1.25μM IQ-143 (Table 6). Such an accumulation of AMP ismost likely the consequence of decreased production ofATP by oxidative phosphorylation.A second potential mode of action for IQ-143 would
be that it directly acts as a NADH competitor andimpairs the production of NAD+. This again leads to theeffects described above, although this time the reducedpool of NAD+ and not the inhibition of NADH-produ-cing enzymes is responsible for the calculated effects.
Metabolite measurements in S. aureusTo better examine these possibilities, we conducteddirect metabolite measurements by HPLC-UV andquantitatively measured the metabolic changes due tothe administered xenobiotic IQ-143 (that is, metabo-nomics as defined by Nicholson [33]). In contrast to themodeled metabolic fluxes (see the previous section ofResults), these are direct measurements and are used to
validate and re-test the predictions regarding the result-ing metabolite levels.The data show a complex pattern of cell alterations
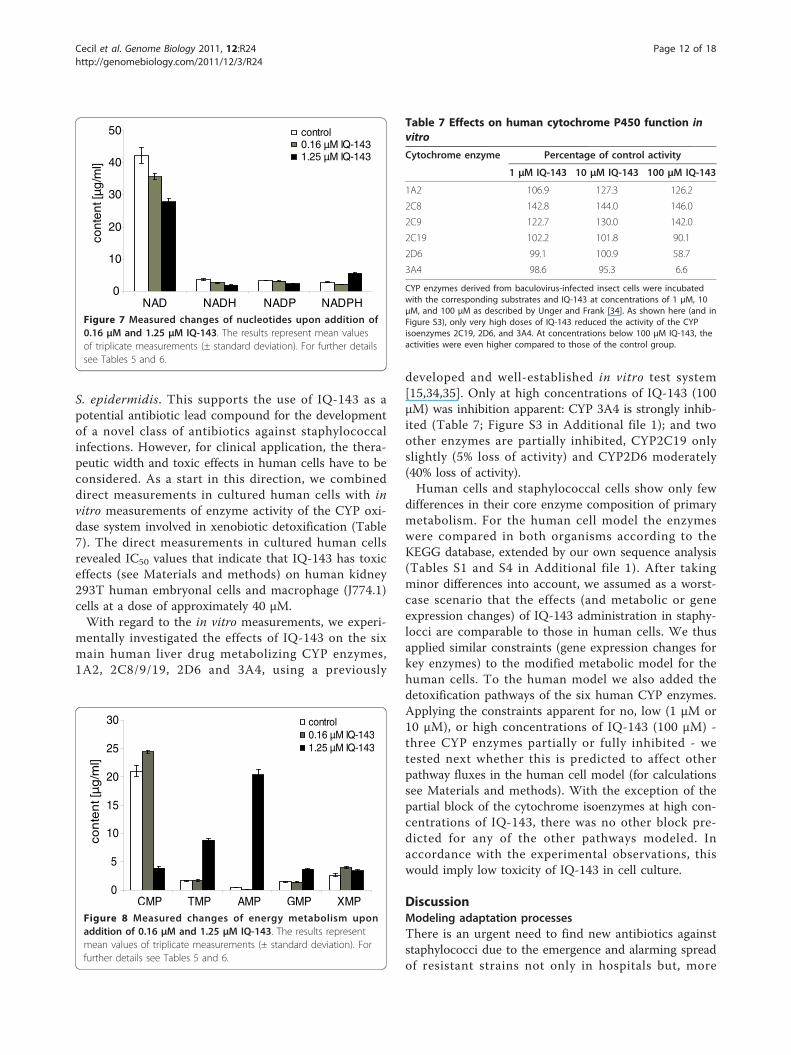
upon administration of IQ-143: the nicotinamide-ade-nine dinucleotides NAD+, NADH and NADP show sub-stantial decreases of between 10 and 30% and between30 and 50% dependent on the applied concentration ofthe inhibitor (0.16 μM and1.25 μM IQ-143, respectively;Figure 7). In turn, the reduced phosphate form NADPHundergoes a two-fold increase (with 1.25 μM IQ-143).Table 6 gives an overview of the metabolite measure-ments and shows significant differences in these withvarious concentrations of applied IQ-143.Additionally, strong changes occurred in the metabolite
profile of purine metabolism. Pathway modeling of thesedata suggests down-regulation of purine metabolism aswell as further effects also on the pyrimidine metabolism.Thymidine-5’-monophosphate (TMP) and cytidine-5’-monophosphate (CMP) show statistically significantchanges: the concentration of TMP increased five-foldupon treatment with 1.25 μM IQ-143, and CMP produc-tion was reduced to 20% compared to the control. Thelower inhibitor concentration (0.16 μM) resulted in onlya slight increase in CMP. The concentrations of allnucleotides increase at high concentrations of IQ-143(Figure 8, Table 5). By contrast, the changes with low IQ-143 concentrations are more heterogeneous.
Metabolic effects of different concentrations of IQ-143 onhuman cellsThe combined effects of IQ-143 are bacteriostatic and,at higher concentrations, bactericidal on S. aureus and
Table 5 Concentrations of CMP, AMP, GMP, XMP, and TMP
Control 0.16 μM IQ-143 1.25 μM IQ-143
Mean (μg/ml) SD Mean (μg/ml) SD % of control Mean (μg/ml) SD % of control
CMP 21.03 0.96 24.41* 0.24 116.07 3.86** 0.19 18.35
TMP 1.61 0.12 1.67 0.11 103.76 8.81* 0.24 547.20
AMP 0.42 0.06 0.12* 0.02 28.57 20.37** 0.80 4850.00
GMP 1.51 0.05 1.44** 0.05 95.36 3.66* 0.21 242.38
XMP 2.62 0.20 3.96** 0.16 151.15 3.44** 0.11 131.30
Direct measurement of CMP, AMP, GMP, XMP, and TMP concentrations in S. aureus (in μg/ml and in percentage of control value depending on the applied IQ-143 concentration). Statistically significant differences are indicated (*P < 0.05,**P < 0.01). SD, standard deviation.
Table 6 Concentration of NAD, NADH, NADP, and NADPH
Control 0.16 μM IQ-143 1.25 μM IQ-143
Mean (μg/ml) SD Mean (μg/ml) SD % of control Mean (μg/ml) SD % of control
NAD 42.19 2.44 35.68** 0.92 84.57 27.89** 0.95 66.11
NADH 3.71 0.31 2.63** 0.28 70.89 1.95** 0.21 52.56
NADP 3.47 0.06 3.24** 0.05 93.37 2.42** 0.05 69.74
NADPH 2.87 0.12 2.25** 0.02 78.40 5.56** 0.22 193.73
Direct measurement of NAD, NADH, NADP, and NADPH concentrations in S. aureus (in μg/ml and percentage of control value depending on the applied IQ-143concentration). Statistically significant differences are indicated (*P < 0.05,**P < 0.01). SD, standard deviation.
Cecil et al. Genome Biology 2011, 12:R24http://genomebiology.com/2011/12/3/R24
Page 11 of 18
S. epidermidis. This supports the use of IQ-143 as apotential antibiotic lead compound for the developmentof a novel class of antibiotics against staphylococcalinfections. However, for clinical application, the thera-peutic width and toxic effects in human cells have to beconsidered. As a start in this direction, we combineddirect measurements in cultured human cells with invitro measurements of enzyme activity of the CYP oxi-dase system involved in xenobiotic detoxification (Table7). The direct measurements in cultured human cellsrevealed IC50 values that indicate that IQ-143 has toxiceffects (see Materials and methods) on human kidney293T human embryonal cells and macrophage (J774.1)cells at a dose of approximately 40 μM.With regard to the in vitro measurements, we experi-
mentally investigated the effects of IQ-143 on the sixmain human liver drug metabolizing CYP enzymes,1A2, 2C8/9/19, 2D6 and 3A4, using a previously
developed and well-established in vitro test system[15,34,35]. Only at high concentrations of IQ-143 (100μM) was inhibition apparent: CYP 3A4 is strongly inhib-ited (Table 7; Figure S3 in Additional file 1); and twoother enzymes are partially inhibited, CYP2C19 onlyslightly (5% loss of activity) and CYP2D6 moderately(40% loss of activity).Human cells and staphylococcal cells show only few
differences in their core enzyme composition of primarymetabolism. For the human cell model the enzymeswere compared in both organisms according to theKEGG database, extended by our own sequence analysis(Tables S1 and S4 in Additional file 1). After takingminor differences into account, we assumed as a worst-case scenario that the effects (and metabolic or geneexpression changes) of IQ-143 administration in staphy-locci are comparable to those in human cells. We thusapplied similar constraints (gene expression changes forkey enzymes) to the modified metabolic model for thehuman cells. To the human model we also added thedetoxification pathways of the six human CYP enzymes.Applying the constraints apparent for no, low (1 μM or10 μM), or high concentrations of IQ-143 (100 μM) -three CYP enzymes partially or fully inhibited - wetested next whether this is predicted to affect otherpathway fluxes in the human cell model (for calculationssee Materials and methods). With the exception of thepartial block of the cytochrome isoenzymes at high con-centrations of IQ-143, there was no other block pre-dicted for any of the other pathways modeled. Inaccordance with the experimental observations, thiswould imply low toxicity of IQ-143 in cell culture.
DiscussionModeling adaptation processesThere is an urgent need to find new antibiotics againststaphylococci due to the emergence and alarming spreadof resistant strains not only in hospitals but, more
0
10
20
30
40
50
NAD NADH NADP NADPH
co
nte
nt [μ
g/m
l]
control
0.16 μM IQ-143
1.25 μM IQ-143
Figure 7 Measured changes of nucleotides upon addition of0.16 μM and 1.25 μM IQ-143. The results represent mean valuesof triplicate measurements (± standard deviation). For further detailssee Tables 5 and 6.
0
5
10
15
20
25
30
CMP TMP AMP GMP XMP
co
nte
nt [μ
g/m
l]
control
0.16 μM IQ-143
1.25 μM IQ-143
Figure 8 Measured changes of energy metabolism uponaddition of 0.16 μM and 1.25 μM IQ-143. The results representmean values of triplicate measurements (± standard deviation). Forfurther details see Tables 5 and 6.
Table 7 Effects on human cytochrome P450 function invitro
Cytochrome enzyme Percentage of control activity
1 μM IQ-143 10 μM IQ-143 100 μM IQ-143
1A2 106.9 127.3 126.2
2C8 142.8 144.0 146.0
2C9 122.7 130.0 142.0
2C19 102.2 101.8 90.1
2D6 99.1 100.9 58.7
3A4 98.6 95.3 6.6
CYP enzymes derived from baculovirus-infected insect cells were incubatedwith the corresponding substrates and IQ-143 at concentrations of 1 μM, 10μM, and 100 μM as described by Unger and Frank [34]. As shown here (and inFigure S3), only very high doses of IQ-143 reduced the activity of the CYPisoenzymes 2C19, 2D6, and 3A4. At concentrations below 100 μM IQ-143, theactivities were even higher compared to those of the control group.
Cecil et al. Genome Biology 2011, 12:R24http://genomebiology.com/2011/12/3/R24
Page 12 of 18

recently, also in the community. In particular, drugsbelonging to novel chemical classes are of broad interestas it is assumed that resistance development againstsuch substances will be minimized. In addition, theidentification of novel targets may accelerate the findingof new lead substances combating multi-drug-resistantpathogens [36]. The compound IQ-143 has no cytotoxiceffects at low concentrations in human cells comparedto other isoquinoline compounds. In this study, we haveincluded systems-wide approaches coupled with bioin-formatic modeling and host-detoxification enzymeeffects to elucidate the mode of action of the antimicro-bial compound IQ-143 in different staphylococci; itshows direct application of systems biology in antibioticresearch [37].Our combination of theoretical modeling, analysis of
enzyme activity, measurement of metabolite concentra-tions as well as the incorporation of gene expressiondata allowed us to describe in large-scale models thediverse effects of the antibiotic compound IQ-143 onthe metabolism of both pathogens (S. aureus and S. epi-dermidis) and human host cells. These approaches arecomplementary to each other: direct toxicity data wereonly partially available and metabolite measurementscovered only a range of nucleotides, including NAD(P)(H). Our work demonstrates how metabolic modelingcan help to fill in missing information and how thisallows predictions on the enzyme activities of the com-plete network, which subsequently can be verified bythe experimental measurements. As a requirement forthe modeling, the genome sequences were partly re-annotated.Such a combined approach is of general use in meta-
bonomics [33] to model, for instance, the effects of var-ious different isoquinolines and other drugs, the effectsof genetic mutations, or even more complex interactionsbetween hosts and pathogens (for example, the metabo-lism of S. aureus under persistence in the host).Our results suggest that IQ-143 targets the energy
metabolism of S. epidermidis and S. aureus (Table 4)and we observed severely limited growth of S. epidermi-dis and S. aureus when IQ-143 was applied. On theother hand (as shown by array data here), gene expres-sion for DNA and RNA polymerases was not down-regulated by IQ-143, but was instead up-regulated (upto two-fold). Our modeling can explain both findings.IQ-143 does not affect the DNA and RNA polymerasechain as initially suspected (Table 2), but rather inter-feres with the energy metabolism.An example is mode 102, which consists of a pyru-
vate-phosphotransferase and a PEP-carboxylase. Theactivity of this particular mode is reduced by one-halfafter administration of IQ-143 in both staphylococcistrains. In general, the metabolism of sugars and
alcohols is reduced by IQ-143 and the investigatedpathogens counteract this effect by expressing moreDNA and RNA polymerases (and other enzymes) inorder to maintain appropriate turnover in thesepathways.The general stress response is not strongly activated in
S. epidermidis after administration of IQ-143 (only twogenes are turned on). Several ABC transporter genes,which probably encode multiple drug efflux pumps, areturned on in the presence of IQ-143. These are typicalresponses of S. epidermidis against toxic agents [38].However, for IQ-143 the specific pathway effects aremore important and stronger.
Metabolic implicationsBy analyzing CYP enzyme activity, this study enables theinhibitory potential of IQ-143 towards the major humandrug metabolizing CYP enzymes to be assessed. In con-trast to several previously tested naphthylisoquinolinealkaloids [15], which showed extraordinarily strong andselective inhibition of CYP2D6, IQ-143 did not show aremarkable inhibition of CYP2D6 or other tested isoen-zymes at the relevant concentrations of 1 and 10 μM.Owing to the low inhibitory activity of the compound,the possibility of drug-drug interactions is very small.Even for CYP3A4, the major human CYP isoenzyme inthe gut and liver, inhibition is unlikely because its activ-ity is significantly reduced only at a concentration of100 μM, which will not be achieved in the human body.This also reveals that certain structural characteristicsmight be avoided when developing new drugs from IQ-143 in order to minimize toxic effects occurring throughprotein inhibition.The two investigated Staphylococcus species use NAD
(H) as an energy source for oxidative phosphorylation.In accordance with this, the results of metabolite mea-surements show lower concentrations of NAD+ andNADH. However, NADPH levels increased at the high-est concentrations of IQ-143. Therefore, we believe thatNADPH-producing enzymes (for example, of the pen-tose-phosphate pathway) and NADH-producingenzymes (including glyceraldehyde-3P-dehydrogenase,which can use both NADH as well as NADPH) areprobably not the primary targets of the inhibition.Instead, IQ-143 has to directly affect NADH consump-tion. By inhibiting complex 1 of oxidative phosphoryla-tion, NADH consumption is severely affected even atlow concentrations of IQ-143; NADH is consumed at asignificantly reduced rate, which leads to a smallerquantity of available NAD+. Glyceraldehyde-3P-dehydro-genase, however, is not affected by this, and nor are theNADPH-using enzymes. As modeling shows, this leadsto much higher production of NADPH since less andless NAD+ is available.
Cecil et al. Genome Biology 2011, 12:R24http://genomebiology.com/2011/12/3/R24
Page 13 of 18

Our theory is supported by experimental findings (see‘Results: Pathway effects of different concentrations ofIQ-143 in S. epidermidis and S. aureus’ as well as Tables5 and 6) and data from the literature. Aromatic sub-stances with a quaternary nitrogen, such as the quinoli-nium-derived drug dequalinium chloride, tend toaccumulate in mitochondria [39,40]. Also, the interfer-ence of the mitochondrial respiratory chain, especiallycomplex I, by quaternary isoquinoline derivatives suchas N-methylisoquinolinium ions or N-methyl-1,2,3,4-tet-rahydroisoquinoline is well known [41,42]. Since IQ-143is structurally related to dequalinium chloride, interac-tion of this newly identified antimicrobial compoundwith the mitochondrial respiratory chain is possible.Additionally, our findings are supported by the resultsin Table 5, which lists the changes in nucleotide con-centrations after application of IQ-143 to S. aureus.Whereas 0.16 μM IQ-143 reduced the AMP concentra-tion by approximately 70% (control, 0.42 μg/ml;0.16 μM IQ-143, 0.12 μg/ml), an almost 50-foldincrease in AMP concentration was observed using aconcentration of 1.25 μM IQ-143 (Table 5). IncreasedAMP concentration due to a breakdown of the labileATP molecule can be excluded because the controlincubation was processed in the same way as the sam-ples treated with IQ-143. Presumably, the accumula-tion of AMP points to direct inhibition of NADHoxidation by complex I of the respiratory chainbecause blocking electron transport leads directly tothe breakdown of the chemoosmotic potential and,subsequently, oxidative phosphorylation.The effects of secondary metabolites of the compound,
host-pathogen interactions and more complex systemeffects have not been investigated in this work. How-ever, since the first mouse experiments suggested thatIQ-143 is toxic, this substance should currently only beconsidered as a lead structure for future drug develop-ment based on the promising results regarding antibiosisin staphylococci and to negate toxic effects in the host.Certainly this theoretical suggestion requires furtherexperimental tests.
ConclusionsUtilizing our model, the apparent bacteriostatic and, athigher concentrations, bactericidal effects of IQ-143 inS. aureus and S. epidermidis can now be described indetail according to its effects on the activity of specificenzymes and pathways in these organisms, in particularon energy metabolism and DNA/RNA elongation. IQ-143 administration affects oxidative phosphorylation butalso has an impact on purine metabolism, includingdirect effects on purine metabolism and other nucleo-tide-producing enzymes at higher concentrations as wellas pathway effects observable, for example, in glycolysis.
These effects can be explained by the drug interferingwith the NAD(H) pool and the multi-enzyme complexesof oxidative phosphorylation. The network effects canonly be seen through modeling since measurements ofmetabolites are able to show only a small part of thewhole metabolome. The metabolic effects are also notobservable in the gene expression data either unlessthey lead to significant changes in gene expression. Byapplying data gathered from the metabolite measure-ments, the models can be fitted and thus made moreaccurate than when based on gene expression dataalone.This permits improvement of the lead substance (for
example, pro-drug or testing of further modifications).Our combination of modeling and experimental data isgenerally suited to elucidate organism-wide metabolicadaptations to xenobiotics in a comparative way. Futureextensions will include further data sets, such as addi-tional data on toxicity and enzyme kinetics.
Materials and methodsMicroarray analysisTotal RNA was isolated from S. epidermidis strainRP62A grown in the presence of 0.16 μM (one-quarterof the minimal inhibitory concentration) and 1.25 μM(twice the minimal inhibitory concentration) IQ-143 andwithout the drug. For the analysis of gene expressionwith subinhibitory concentrations of IQ-143, an over-night culture of S. epidermidis RP62A was diluted to anoptical density OD600nm of 0.05 in a 50 ml flask. To thisculture 0.16 μM IQ-143 was added and the culture wasgrown with agitation (200 rpm) until OD600nm reached1.0. To analyzing the impact of inhibitory concentra-tions of IQ-143, 1.25 μM of the substance was added tothe cultures in the exponential growth phase (OD600nm
of 1.0) and the cultures were grown for an additional 10minutes. Bacteria were harvested with the addition ofRNA Protect (QIAGEN, Hilden, Germany) according tothe manufacturer’s instructions. Prior to RNA isolation,bacteria were lysed using glass beads in a Fast Prep sha-ker (Qbiogene, Heidelberg, Germany) for 45 s at a speedof 6.5 units. RNA was isolated using a QIAGEN RNeasykit according to the standard QIAGEN RNeasy protocol.S. epidermidis RP62A full genome microarrays con-
taining PCR products of 2,282 genes/open readingframes were used for microarray analysis (Scienion, Ber-lin, Germany). DNA expression data have been depos-ited in the public databank repository Protecs [43,44](accession [PROTECS:IQ-143]).Total RNA (10 μg) for DNA microarray analysis iso-
lated from cultures in the exponential growth phase wasused for reverse transcription and fluorescent labelingreactions using random primers and Superscript IIIreverse transcriptase (Invitrogen, Darmstadt, Germany).
Cecil et al. Genome Biology 2011, 12:R24http://genomebiology.com/2011/12/3/R24
Page 14 of 18

cDNA was concomitantly labeled using the dyes Cy3and Cy5 according to the manufacturer’s instructions(Scienion, Dortmund, Germany). RNA obtained fromtwelve (0.16 μM) and six (1.25 μM) different biologicalexperiments was utilized, and a reverse labeling (dyeswitch) experiment was performed to minimize bias dueto differential dye bleaching or incorporation of the Cy3and Cy5 dyes during the reverse transcription reaction.Microarray hybridization (16 h at 50°C) and washing ofthe slides were performed according to the manufac-turer’s instructions. Hybridized slides were scannedusing a Genepix 4000B laser scanner (Axon InstrumentsInc., Union City, CA, USA). Bioinformatic analyses onthe slide hybridization results of each single experimentwere performed using Genepix Pro3.0 (Axon Instru-ments Inc.). Data for each image were normalized to themean ratio of means of all features.
Reconstruction of metabolic networksTo model involved metabolic pathways, we used theKEGG database [24]. Additional genome annotation ofmissing enzyme activities for the central pathways wasdetermined using iterative sequence and domain analysismethods [19]. Subsequent experimental verification byPCR complemented this (Tables S1, S2, S3, and S4, andFigure S6 in Additional file 1). The model of centralmetabolism included lipid, amino acid, and central car-bohydrate metabolism as well as nucleotide and salvagepathways.
Metabolic flux modelingExtreme pathways possible in the annotated enzymenetwork were calculated first [24]. To identify actualflux strengths, we used YANAsquare [21,22] and a cus-tom written program in R [23]. We modeled fluxstrengths in the metabolic webs of S. aureus USA300and S. epidermidis RP62A according to gene expressiondata obtained for the purpose (Tables S5 and S6 inAdditional file 1). A least square fit used first YANAs-quare and next the improved R routine to calculateoptimal pathway fluxes that best matched the con-straints for key enzyme activities as estimated accordingto significant elevated or lowered enzyme expression inthe above data sets (Table 1; Tables S5 and S6 in Addi-tional file 1). Additional metabolite measurements (Fig-ures 7 and 8) probed whether the metaboliteconcentrations were correctly predicted. Measured CYPactivity data were considered next in the model to testwhether inhibition of CYP enzymes affected other path-ways in their fluxes.Detailed input files for the pathway models are pro-
vided in Additional file 1 (for S. aureus USA300 inTable S2; for S. epidermidis RP62A inTable S3). Thecalculated activities of the different extreme pathway
modes for no IQ-143 and two different concentrationsof it are listed in Tables S7, S8, and S9 (S. aureus), S10,S11, and S12 (S. epidermidis), and S12, S13, S14, andS15 (human).
Cell cultureCells of S. aureus USA300 and S. epidermidis RP62Awere cultured in Luria-Bertani-Medium at 30°C andshaken at 170 rpm. After 2 hours, IQ-143 was added:0.8 μl of a 20 mM stock solution of IQ-143 in dimethylsulfoxide was added per 100 ml cell culture to attain aconcentration of 0.16 μM. For a concentration of 1.25μM, 6.25 μl per 100 ml cell culture were added. Thecells were harvested when an OD of 1.0 was reachedand the metabolites were extracted. Toxicity assays inhuman cells were conducted according to [15]. Concen-trations tested included 0.16 μM and 1.25 μM IQ-143,and a control with no antibiotic added.
In vitro inhibitory activity of IQ-143 on CYP enzymesTo test the inhibitory activity of IQ-143 on the six mainhuman drug-metabolizing CYP enzymes, we applied themethod described by Unger and Frank [34]. Theenzymes CYP1A2, 2C8/2C9/2C19, 2D6 and 3A4 werederived from baculovirus-infected insect cells and wereincubated with different concentrations of IQ-143 (1,10, and 100 μM).
IC50 determination for human cellsJ774.1 macrophages were cultured in complete medium(RPMI with NaHCO3, 10% fetal calf serum, 2 mM gluta-mine, 10 mM Hepes pH 7.2, 100 U/ml penicillin, 50 μg/ml gentamicin, 50 μM 2-mercaptoethanol) without phe-nol red in the absence or presence of increasing concen-trations of the compounds at a cell density of 1 × 10⁵
cells/ml (200 μl) for 24 h at 37°C, 5% CO2 and 95%humidity. Following the addition of 20 μl of AlamarBlue, the plates were incubated and the ODs measuredat 24 h, 48 h, and 72 h. The standard Alamar blue assaywas performed as previously described [45].Kidney epithelial 293T cells (2 × 10⁴ cells/ml) were
tested in the same manner as the macrophages exceptthat complete DMEM medium was used: 4.5 g/l solu-tion of DMEM high D-glucose solution with sodiumpyruvate but without L-glutamine, fetal bovine serumsuperior at a final concentration of 20%, 200 mM L-glu-tamine 100x.
Commercial sources of standards for the metabolitemeasurementsThe standards were obtained from the following suppliers.AppliChem (Darmstadt, Germany): b-nicotinamide ade-nine dinucleotide (NAD), b-nicotinamide adenine dinu-cleotide phosphate sodium salt (NADP), b-nicotinamide
Cecil et al. Genome Biology 2011, 12:R24http://genomebiology.com/2011/12/3/R24
Page 15 of 18
adenine dinucleotide reduced dipotassium salt (NADH),and b-nicotinamide adenine dinucleotide 2’-phosphatereduced tetrasodium salt (NADPH). Sigma (Taufkirchen,Germany): adenosine 5’-monophosphate sodium salt,cytidine 5’-monophosphate disodium salt, dextromethor-phan, imipramine, inosine 5’-monophosphate disodiumsalt, guanosine 5’-monophosphate disodium salt hydrate,midazolam, paclitaxel, reserpine, tacrine, tolbutamide,thymidine 5’-monophosphate disodium salt hydrate,xanthosine 5’-monophosphate disodium salt, and sodiumchloride. Fluka (Buchs, Switzerland): tributylamine andformic acid (purissimum grade). Fisher Scientific(Schwerte, Germany): methanol and acetonitrile. Natutec(Frankfurt, Germany): recombinant CYP1A2, CYP2C8,CYP2C9, CYP2C19, CYP2D6 and CYP3A4 from baculo-virus-infected insect cells co-expressed with P450 reduc-tase and cytochrome b5.
Cell culture harvesting and HPLCCultivated cells (S. aureus and S. epidermidis) werequenched by adding methanol 50% (v/v). After washingthe cell pellet with 0.9% sodium chloride it wasextracted with methanol 80% (v/v) by means of ultraso-nic treatment. After centrifugation the supernatantswere directly analyzed by HPLC using an Agilent Sys-tem 1100 LC (Waldbronn, Germany) consisting of avacuum degasser, a binary pump, an autosampler, athermostatted column compartment and an UV-visiblediode array detector. System control and data processingwere performed using the Agilent ChemStation Softwarerevision A.10.01.
Determination of purine and pyrimidine nucleotides(CMP, AMP, IMP, GMP, TMP and XMP)The HPLC methods for the analysis of the purine andpyrimidine nucleotides were adapted from Schmitz et al.[46]. A sample volume of 10 μl was injected onto a 150× 4.6 mm internal diameter, 4 μm Synergi Fusion RPcolumn (Phenomenex, Aschaffenburg, Germany). Themobile phase consisted of water (A) and acetonitrile (B),both containing 5 mM tributylamine and 0.1% formicacid. The following gradient (percentage B) was applied:0 to 5 minutes, 5%; 15 minutes, 20%; 18 minutes, 20%.After 18 minutes the column was flushed with 100% Bfor 3 minutes and re-equilibrated with 5% B. The flowrate was set to 1 ml/minute and the temperature for thecolumn was set to 25°C. As all nucleotides show highUV absorption at about 260 nm, this wavelength waschosen for detection. All measurements were performedin triplicate. The external calibration for quantificationwas carried out through measurement of a mixture ofthe corresponding nucleotides covering a range between0.5 and 100 μg/ml.
Determination of nicotinamide derivatives (NAD, NADH,NADP, NADPH)For the HPLC analysis of the nicotinamide derivatives thesame method as described for the nucleotides wasapplied. However, the gradient (percentage B) wasslightly varied: 0 to 5 minutes, 5%; 15 minutes, 50%; 18minutes, 50%. After 18 minutes the column was flushedwith 100% B for 3 minutes and re-equilibrated with 5% B.
Statistical analysisStatistical analysis was performed using the Mann-Whit-ney U-test by means of the software Statistica 8.0 (Stat-Soft (Europe) GmbH, 20253 Hamburg, Germany); P-values were calculated in relation to corresponding con-trols (pooled values).
Additional data and scriptsAs well as Additional file 1, other files are available from[47], containing: an introduction to pathway modeling ingeneral and a tutorial for working with YANAsquare;input files for YANAsquare needed to calculate theextreme modes; scripts for R for calculation of theeffects of changing gene expression after administrationof IQ-143 (these are also used for a statistical evaluationof said effects); and scripts for PERL to import theresults from R to YANAsquare.
Additional material
Additional file 1: Supplementary materials. Additional file 1 is a Worddocument containing additional data on sequence comparisons,pathway models, synthesis and effects of the IQ-143 compound, geneexpression data, and nucleotide and NAD measurements, as reported inthe manuscript.
AbbreviationsABC: ATP-binding cassette; CMP: cytidine-5’-monophosphate; CYP:cytochrome P450; DMEM: Dulbecco/Vogt modified Eagle’s minimal essentialmedium; HPLC: high-performance liquid chromatography; IMP: inosinemonophosphate; IQ: isoquinoline; IQ-143: synthetic analogue of the novel-type N:C-coupled naphthyl-isoquinoline alkaloid ancisheynine; KEGG: KyotoEncyclopedia of Genes and Genomes; OD: optical density; PCR: polymerasechain reaction; SERP: Staphylococcus epidermidis RP62A;TMP: thymidine-5’-monophosphate; XMP: xanthosine-5’-monophosphate.
AcknowledgementsWe thank the German Research Council (Deutsche ForschungsgemeinschaftDFG), grants SFB630 (projects A1, A2, B5, C6 and Z1), the Fonds derChemischen Industrie (fellowship to TG), and the Hochschul- undWissenschaftsprogramm of the University of Würzburg (fellowship to TG), Da208/10-1 (fellowship to CL) and TR34/A8 (fellowship to CL) and the State ofBavaria for funding, as well as our colleagues from the SFB630 for stimulatingdiscussions. We also thank Svitlana Kozytska and Elena Katzowitsch fortechnical assistance and Wilma Ziebuhr for helpful discussions.
Author details1University of Würzburg, Theodor-Boveri Institute, Department ofBioinformatics, Am Hubland, 97074 Würzburg, Germany. 2University of
Cecil et al. Genome Biology 2011, 12:R24http://genomebiology.com/2011/12/3/R24
Page 16 of 18

Würzburg, Institute for Pharmacy and Food Chemistry, Am Hubland, 97074Würzburg, Germany. 3University of Würzburg, Institute for Molecular InfectionBiology, Josef-Schneider-Straße 2, 97080 Würzburg, Germany. 4Ernst-Moritz-Arndt University, Institute for Microbiology, Greifswald, Friedrich- Ludwig-Jahn- Straße 15, 17487 Greifswald, Germany. 5University of Würzburg,Institute for Organic Chemistry, Am Hubland, 97074 Würzburg, Germany.6Present address: RWTH Aachen, Institute of Organic Chemistry, Landoltweg1, 52074 Aachen, Germany. 7EMBL Heidelberg, BioComputing Unit,Meyerhofstraße 1, 69117 Heidelberg, Germany.
Authors’ contributionsAC did the genome re-annotation, the set up and calculation of thedifferent metabolic models, culturing and harvesting of cells and wasinvolved in data analysis of all data sets. CR conducted all metabolitemeasurements and cytochrome assays, and was involved in data analysis. CLwas involved in programming tasks (PERL/R) and JB in databasemanagement (Protecs). KO did all gene expression analysis experiments andprovided infection biology expertise. TAO did all cell toxicity tests. TG andGB selected and synthesized IQs and provided chemical expertise. UH andMU supervised CR and provided pharmaceutical expertise. In addition, MUwas involved in the cytochrome assays and led and guided the metabolitemeasurements. TD led and guided the study, supervised AC, and wasinvolved in the data analysis of all data sets. All authors participated in thewriting of the manuscript and approved its final version.
Competing interestsThe authors declare that they have no competing interests.
Received: 17 November 2010 Revised: 14 March 2011Accepted: 21 March 2011 Published: 21 March 2011
References1. Grundmann H, Aanensen DM, van den Wijngaard CC, Spratt BG,
Harmsen D, Friedrich AW, the European Staphylococcal ReferenceLaboratory Working Group: Geographic distribution of Staphylococcusaureus causing invasive infections in Europe: a molecular-epidemiological analysis. PLoS Med 2010, 7:e1000215.
2. Wright JA, Nair SP: Interaction of staphylococci with bone. Int J MedMicrobiol 2010, 300:193-204.
3. Cheng AG, Kim HK, Burts ML, Krausz T, Schneewind O, Missiakas DM:Genetic requirements for Staphylococcus aureus abscess formation andpersistence in host tissues. FASEB J 2009, 23:3393-3404.
4. Mattner F, Biertz F, Ziesing S, Gastmeier P, Chaberny IF: Long-termpersistence of MRSA in re-admitted patients. Infection 2010, 38:363-371.
5. Coen M: A metabonomic approach for mechanistic exploration of pre-clinical toxicology. Toxicology 2010, 278:326-340.
6. Papin JA, Stelling J, Price ND, Klamt S, Schuster S, Palsson BO: Comparisonof network based pathway analysis methods. Trends Biotechnol 2004,22:400-405.
7. Vinga S, Neves AR, Santos H, Brandt BW, Kooijman SA: Subcellularmetabolic organization in the context of dynamic energy budget andbiochemical systems theories. Philos Trans R Soc Lond B Biol Sci 2010,365:3429-3442.
8. Bartl M, Li P, Schuster S: Modelling the optimal timing in metabolicpathway activation-use of Pontryagin’s Maximum Principle and role ofthe Golden section. Biosystems 2010, 101:67-77.
9. Bringmann G, Gulder T, Reichert M, Meyer F: Ancisheynine, the first N,C-coupled naphthylisoquinoline alkaloid: Total synthesis andstereochemical analysis. Org Lett 2006, 8:1037-1040.
10. Bringmann G, Kajahn I, Reichert M, Pedersen SHE, Faber JH, Gulder T,Brun R, Christensen SB, Ponte-Sucre A, Moll H, Heubl G, Mudogo V:Ancistrocladinium A and B, the first N,C-couplednaphthyldihydroisoquinoline alkaloids, from a Congolese ancistrocladusspecies. J Org Chem 2006, 71:9348-9356.
11. Bringmann G, Gulder T, Hertlein B, Hemberger Y, Meyer F: Total synthesisof the N,C-coupled naphthylisoquinoline alkaloids ancistrocladinium Aand B and related analogues. J Am Chem Soc 2010, 132:1151-1158.
12. Bringmann G, Hertlein-Amslinger B, Kajahn I, Dreyer M, Brun R, Moll H,Stich A, Ndjoko Ioset K, Schmitz W, Hoang Ngoc L: Phenolic analogs ofthe N,C-coupled naphthylisoquinoline alkaloid ancistrocladinium A, from
Ancistrocladus cochinchinensis (Ancistrocladaceae), with improvedantiprotozoal activities. Phytochemistry 2011, 72:89-93.
13. Yang LK, Glover RP, Yoganathan K, Sarnaik JP, Godbole AJ, Soejarto DD,Buss AD, Butler MS: Ancisheynine, a novel naphthylisoquinoliniumalkaloid from Ancistrocladus heyneanus. Tetrahedron Lett 2003,44:5827-5829.
14. Ponte-Sucre A, Faber JH, Gulder T, Kajahn I, Pedersen SEH, Schultheis M,Bringmann G, Moll H: Activities of naphthylisoquinoline alkaloids andsynthetic analogs against Leishmania major. Antimicrob Agents Chemother2007, 51:188-194.
15. Ponte-Sucre A, Gulder T, Wegehaupt A, Albert C, Rikanovic C, Schaeflein L,Frank A, Schultheis M, Unger M, Holzgrabe U, Bringmann G, Moll H:Structure-activity relationship and studies on the molecular mechanismof leishmanicidal N,C-coupled arylisoquinolinium salts. J Med Chem 2009,52:626-636.
16. Ponte-Sucre A, Gulder T, Gulder AM, Vollmers G, Bringmann G, Moll H:Alterations on the structure of Leishmania major induced by N-arylisoquinolines correlate with compound accumulation anddisposition. J Med Microbiol 2010, 59:69-75.
17. Gill SR, Fouts DE, Archer GL, Mongodin EF, Deboy RT, Ravel J, Paulsen IT,Kolonay JF, Brinkac L, Beanan M, Dodson RJ, Daugherty SC, Madupu R,Angiuoli SV, Durkin AS, Haft DH, Vamathevan J, Khouri H, Utterback T,Lee C, Dimitrov G, Jiang L, Qin H, Weidman J, Tran K, Kang K, Hance IR,Nelson KE, Fraser CM: Insights on evolution of virulence and resistancefrom the complete genome analysis of an early methicillin-resistantStaphylococcus aureus strain and a biofilm-producing methicillin-resistant Staphylococcus epidermidis strain. J Bacteriol 2005, 187:2426-2438.
18. Diep BA, Gill SR, Chang RF, Phan TH, Chen JH, Davidson MG, Lin F, Lin J,Carleton HA, Mongodin EF, Sensabaugh GF, Perdreau-Remington F:Complete genome sequence of USA300, an epidemic clone ofcommunity-acquired methicillin-resistant Staphylococcus aureus. Lancet2006, 367:731-739.
19. Gaudermann P, Vogl I, Zientz E, Silva FJ, Moya A, Gross R, Dandekar T:Analysis of and function predictions for previously conservedhypothetical or putative proteins in Blochmannia floridanus. BMCMicrobiol 2006, 6:1.
20. Bringmann G, Gulder T, Hentschel U, Meyer F, Moll H, Morschhäuser J,Ponte-Sucre De Vanegas A, Ziebuhr W, Stich A, Brun R, Müller WEG,Mudogo V: Preparation of isoquinolines as antibacterial coatingmaterials. 2007, PCT/EP2007/008440;.
21. Schwarz R, Musch P, von Kamp A, Engels B, Schirmer H, Schuster S,Dandekar T: YANA - a software tool for analyzing flux modes, gene-expression and enzyme activities. BMC Bioinformatics 2005, 6:135.
22. Schwarz R, Liang C, Kaleta C, Kühnel M, Hoffmann E, Kuznetsov S, Hecker M,Griffiths G, Schuster S, Dandekar T: Integrated network reconstruction,visualization and analysis using YANAsquare. BMC Bioinformatics 2007,8:313.
23. Gentleman RC, Ihaka R: R: A Language for data analysis and graphics. JComp Graph Stat 1996, 5:299-314.
24. Schuster S, Fell DA, Dandekar T: A general definition of metabolicpathways useful for systematic organization and analysis of complexmetabolic networks. Nat Biotech 2000, 18:326-332.
25. Kanehisa M, Araki M, Goto S, Hattori M, Hirakawa M, Itoh M, Katayama T,Kawashima S, Okuda S, Tokimatsu T, Yamanishi Y: KEGG for linkinggenomes to life and the environment. Nucleic Acids Res 2008, 36:D480-D484.
26. Otto M: Staphylococcus epidermidis - the accidental pathogen. Nat RevMicrobiol 2009, 8:555-567.
27. Candela T, Fouet A: Poly-gamma-glutamate in bacteria. Mol Microbiol2006, 60:1091-1098.
28. Kocianova S, Vuong C, Yao Y, Voyich JM, Fischer ER, DeLeo FR, Otto M: Keyrole of poly gamma-DL-glutamic acid in immune evasion and virulenceof Staphylococcus epidermidis. J Clin Invest 2005, 115:688-694.
29. Lotz GP, Lin H, Harst A, Obermann WM: Aha1 binds to the middle domainof Hsp90, contributes to client protein activation and stimulates theATPase activity of the molecular chaperone. J Biol Chem 2003,278:17228-17235.
30. Panaretou B, Siligardi G, Meyer P, Maloney A, Sullivan JK, Singh S,Millson SH, Clarke PA, Naaby-Hansen S, Stein R, Cramer R, Mollapour M,Workman P, Piper PW, Pearl LH, Prodromou C: Activation of the ATPase
Cecil et al. Genome Biology 2011, 12:R24http://genomebiology.com/2011/12/3/R24
Page 17 of 18
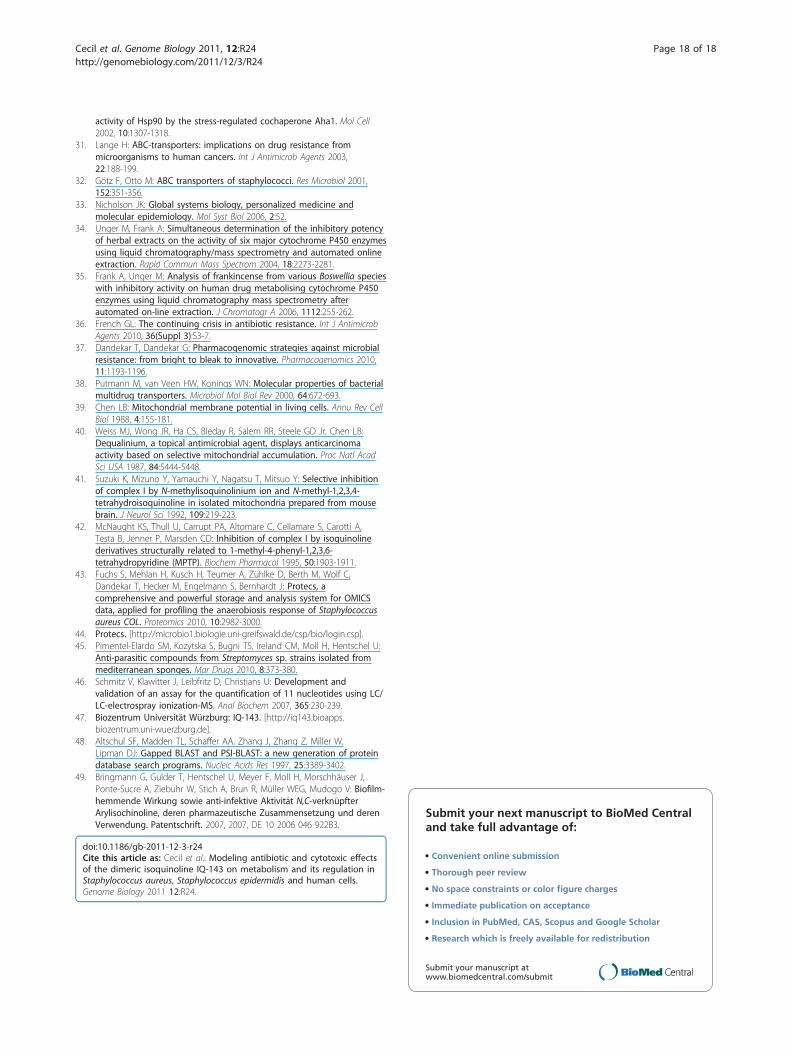
activity of Hsp90 by the stress-regulated cochaperone Aha1. Mol Cell2002, 10:1307-1318.
31. Lange H: ABC-transporters: implications on drug resistance frommicroorganisms to human cancers. Int J Antimicrob Agents 2003,22:188-199.
32. Götz F, Otto M: ABC transporters of staphylococci. Res Microbiol 2001,152:351-356.
33. Nicholson JK: Global systems biology, personalized medicine andmolecular epidemiology. Mol Syst Biol 2006, 2:52.
34. Unger M, Frank A: Simultaneous determination of the inhibitory potencyof herbal extracts on the activity of six major cytochrome P450 enzymesusing liquid chromatography/mass spectrometry and automated onlineextraction. Rapid Commun Mass Spectrom 2004, 18:2273-2281.
35. Frank A, Unger M: Analysis of frankincense from various Boswellia specieswith inhibitory activity on human drug metabolising cytochrome P450enzymes using liquid chromatography mass spectrometry afterautomated on-line extraction. J Chromatogr A 2006, 1112:255-262.
36. French GL: The continuing crisis in antibiotic resistance. Int J AntimicrobAgents 2010, 36(Suppl 3):S3-7.
37. Dandekar T, Dandekar G: Pharmacogenomic strategies against microbialresistance: from bright to bleak to innovative. Pharmacogenomics 2010,11:1193-1196.
38. Putmann M, van Veen HW, Konings WN: Molecular properties of bacterialmultidrug transporters. Microbiol Mol Biol Rev 2000, 64:672-693.
39. Chen LB: Mitochondrial membrane potential in living cells. Annu Rev CellBiol 1988, 4:155-181.
40. Weiss MJ, Wong JR, Ha CS, Bleday R, Salem RR, Steele GD Jr, Chen LB:Dequalinium, a topical antimicrobial agent, displays anticarcinomaactivity based on selective mitochondrial accumulation. Proc Natl AcadSci USA 1987, 84:5444-5448.
41. Suzuki K, Mizuno Y, Yamauchi Y, Nagatsu T, Mitsuo Y: Selective inhibitionof complex I by N-methylisoquinolinium ion and N-methyl-1,2,3,4-tetrahydroisoquinoline in isolated mitochondria prepared from mousebrain. J Neurol Sci 1992, 109:219-223.
42. McNaught KS, Thull U, Carrupt PA, Altomare C, Cellamare S, Carotti A,Testa B, Jenner P, Marsden CD: Inhibition of complex I by isoquinolinederivatives structurally related to 1-methyl-4-phenyl-1,2,3,6-tetrahydropyridine (MPTP). Biochem Pharmacol 1995, 50:1903-1911.
43. Fuchs S, Mehlan H, Kusch H, Teumer A, Zühlke D, Berth M, Wolf C,Dandekar T, Hecker M, Engelmann S, Bernhardt J: Protecs, acomprehensive and powerful storage and analysis system for OMICSdata, applied for profiling the anaerobiosis response of Staphylococcusaureus COL. Proteomics 2010, 10:2982-3000.
44. Protecs. [http://microbio1.biologie.uni-greifswald.de/csp/bio/login.csp].45. Pimentel-Elardo SM, Kozytska S, Bugni TS, Ireland CM, Moll H, Hentschel U:
Anti-parasitic compounds from Streptomyces sp. strains isolated frommediterranean sponges. Mar Drugs 2010, 8:373-380.
46. Schmitz V, Klawitter J, Leibfritz D, Christians U: Development andvalidation of an assay for the quantification of 11 nucleotides using LC/LC-electrospray ionization-MS. Anal Biochem 2007, 365:230-239.
47. Biozentrum Universität Würzburg: IQ-143. [http://iq143.bioapps.biozentrum.uni-wuerzburg.de].
48. Altschul SF, Madden TL, Schaffer AA, Zhang J, Zhang Z, Miller W,Lipman DJ: Gapped BLAST and PSI-BLAST: a new generation of proteindatabase search programs. Nucleic Acids Res 1997, 25:3389-3402.
49. Bringmann G, Gulder T, Hentschel U, Meyer F, Moll H, Morschhäuser J,Ponte-Sucre A, Ziebuhr W, Stich A, Brun R, Müller WEG, Mudogo V: Biofilm-hemmende Wirkung sowie anti-infektive Aktivität N,C-verknüpfterArylisochinoline, deren pharmazeutische Zusammensetzung und derenVerwendung. Patentschrift. 2007, 2007, DE 10 2006 046 922B3.
doi:10.1186/gb-2011-12-3-r24Cite this article as: Cecil et al.: Modeling antibiotic and cytotoxic effectsof the dimeric isoquinoline IQ-143 on metabolism and its regulation inStaphylococcus aureus, Staphylococcus epidermidis and human cells.Genome Biology 2011 12:R24.
Submit your next manuscript to BioMed Centraland take full advantage of:
• Convenient online submission
• Thorough peer review
• No space constraints or color figure charges
• Immediate publication on acceptance
• Inclusion in PubMed, CAS, Scopus and Google Scholar
• Research which is freely available for redistribution
Submit your manuscript at www.biomedcentral.com/submit
Cecil et al. Genome Biology 2011, 12:R24http://genomebiology.com/2011/12/3/R24
Page 18 of 18
Copyright © 2022 FDOKUMEN