
MODELING AND SIMULATION OF THE SWITCHED ...
100
i MODELING AND SIMULATION OF THE SWITCHED RELUCTANCE MOTOR by RAHEEL AHMED SHAIKH Progress Report submitted in partial fulfilment of the requirements for the Bachelor of Engineering (Hons) (Electrical & Electronics Engineering) MAY 2011 Universiti Teknologi PETRONAS Bandar Seri Iskandar 31750 Tronoh Perak Darul Ridzuan Copyright 2011 by Raheel Ahmed Shaikh
-
Upload
khangminh22 -
Category
Documents
-
view
0 -
download
0
Transcript of MODELING AND SIMULATION OF THE SWITCHED ...

i
MODELING AND SIMULATION OF THE SWITCHED
RELUCTANCE MOTOR
by
RAHEEL AHMED SHAIKH
Progress Report submitted in partial fulfilment of
the requirements for the
Bachelor of Engineering (Hons)
(Electrical & Electronics Engineering)
MAY 2011
Universiti Teknologi PETRONAS
Bandar Seri Iskandar
31750 Tronoh
Perak Darul Ridzuan
Copyright 2011
by
Raheel Ahmed Shaikh

ii
CERTIFICATION OF APPROVAL
MODELING AND SIMULATION OF THE SWITCHED
RELUCTANCE MOTOR
by
Raheel Ahmed Shaikh
A project dissertation submitted to the
Electrical & Electronics Engineering Programme
Universiti Teknologi PETRONAS
in partial fulfilment of the requirement for the
Bachelor of Engineering (Hons)
(Electrical & Electronics Engineering)
Approved:
__________________
Dr. Irraivan Elamvazuthi
Project supervisor
UNIVERSITI TEKNOLOGI PETRONAS
TRONOH, PERAK
MAY 2011

iii
CERTIFICATION OF ORIGINALITY
This project is to certify that I am responsible for the work submitted in this project, that the
original work is my own except as specified in the reference and acknowledgments, and that
the original work contained herein have not been undertaken or done by un specified sources
or persons.
_____________
Raheel Ahmed Shaikh

iv
ABSTRACT
This Paper summarizes the study conducted on the techniques used and implemented
to minimize the torque ripple of the Switched reluctance Motors. These motors although
offering the advantages of higher speeds, reliability and phase independence, have the
limitations of the torque ripple and non-linearity in the magnetic characteristics. Thus in
order to have the good understanding of the Motor, it is simulated in the
MATLAB/SIMULINK environment. This paper describes details on modeling of two
different configurations of Switched Reluctance Motor concentrating only on the linear
model by obeying all of its characteristics. The two configurations of motors are applied with
two different control techniques and the results are calculated and tabulated. Load and No
load analysis are also performed to understand the behavior of motor with load. Through out
the analysis, various values of turn-on and turn-off angles are selected and finally the
optimum values are calculated based on the performance parameters of Average torque,
speed and torque ripple. All simulations are documented through this paper including its
block models and initializations performed. Finally a control technique is recommended
which produces the best results with smallest torque ripple.

v
ACKNOWLEDGEMENT
First of all, I would like to thank the almighty god, who gave me the
discipline and courage to finish this project. Without his blessings, the project might
not have been completed. I would also like to thank both my parents for their
encouragements and prayers. Without their support it would have been difficult to
finish this project
Next, I would like to convey my deepest appreciation towards my final year
project supervisor, Dr. Irraivan Elamvazuthi, who has persistently and determinedly
assisted me during the project. It would have been very arduous to complete this
project without the passionate supports and guidance encouragement and advices
given by him.
Thirdly, I would like to thank to Universiti Teknologi PETRONAS (UTP) and
Electrical Engineering for providing us theoretical knowledge which can be applied
in our Final Year Project.
Lastly, I would love to thank the people that have been giving me morale
support all the way through the time I was doing the project. Thank you.

vi
TABLE OF CONTENTS
ABSTRACT…………………………………………………………………………… iv
ACKNOWLEDGEMENT …………………………………………………………… v
LIST OF FIGURES…………………………………………………………………… viii
LIST OF TABLE………………………………………………………………………. x
NOMENCLATURE & ACRONYMS …….………………………………………… xi
CHAPTER 1: INTRODUCTION
1.1 Background of Study………………............................. 1
1.2 Stepping Motors …......………………………………. 3
1.3 Types of Stepping Motors…………………………..... 4
1.3.1 Variable Reluctance Motor……….………. 4
1.3.2 Permanent Magnet Motor...……………… 5
1.3.3 Hybrid Motor...…………………………... 5
1.4 Problem Statement…...………………………………. 7
1.5 Objectives of the Study……………………………..... 7
1.6 Scope of Study...……………………………………... 8
CHAPTER 2: LITERATURE REVIEW
2.1 Previous Work Done…..…………………………….. 9
2.1.1 Techniques &Algorithms Applied……….. 10
2.2 Variable Reluctance Motor...………………………… 11
2.2.1 Advantages & Disadvantages..……….…. 11
2.2.2 Construction...…………………………… 12
2.2.3 Operation...……………………………… 12
2.2.4 Energy Conversion Principles of SRM….. 13
2.2.5 Basic Control Circuit……………………. 16
2.4.6 Torque Speed Characteristics ...………… 17

vii
CHAPTER 3: METHODOLOGY
3.1 Project Flow…………………………… 19
3.1.1 Phases Involved in Project Completion…. 20
3.2 Tools & Software Required ………………………. 21
3.3 Insight into SRM ..…………………………………. 22
3.3.1 SRM energizing strategies …..……….…. 27
3.3.2 Two quadrant chopping convertor.…...…. 27
3.3.3 Selection of Stator and Rotor Pole arcs…. 29
3.3.4 SRM modelling equations …………...…. 30
3.3.5 Application Example…………….…...…. 32
CHAPTER 4: RESULTS & DISCUSSION
4.1 Simulation of 6/4 SRM …………………………. 39
4.1.1 Voltage Pulse technique with no load …. 45
4.1.2 Simulations with varied on and off… 49
4.1.3 Voltage Pulse with variable load ………. 52
4.1.4 Simulation of motor with sr ……. 55
4.1.5 Varied on and off for sr ……. 57
4.1.6 Comparison between sr & sr 61
4.1.7 Hysteresis Control with no load …….... 62
4.2 Simulation of 8/6 SRM …………………………. 70
4.2.1 Voltage Pulse technique with no load …. 72
4.2.2 Varied on and off for variable load .. 76
CHAPTER 5: CONCLUSION & RECOMMENDATIONS
5.1 Conclusion ……………… …………………………. 79
5.2 Recommendations …….… …………………………. 80
REFERENCES ………………………………................................................... 81
APPENDIX I: PROJECT GANTT CHART……….………………………….
APPENDIX I: SIMULATION INITALIZATIONS…..……………………….

viii
LIST OF FIGURES
Figure 1: Classification of Motors……………………………………………. 2
Figure 2: Cross section of a Variable Reluctance Motor…………………….. 4
Figure 3: Components of Permanent Magnet Stepper Motor………………… 5
Figure 4: Hybrid Stepping Motor…………………………………………….. 6
Figure 5: Variable Reluctance Stepper Motor………………………………... 12
Figure 6: Aligned Position of SRM ………………………………………….. 14
Figure 7: Un-aligned Position of SRM …………………………………….. 14
Figure 8: Rotor Switching Sequence of VRM………………………………... 15
Figure 9: VRM Control Circuit……………………………………………….. 17
Figure 10: SRM torque speed characteristics…………………………………. 17
Figure 11: Variation of Inductance and Torque of one phase………………… 23
Figure 12: Two quadrant Chopping Convertor………………………………. 27
Figure 13: Switching of the Two quadrants Chopping Convertor…………. 28
Figure 14: Results produced as a result of two quadrant Chopping Convertor. 29
Figure 15: Model of SRM available in MATLAB……………………………. 32
Figure 16: MATLAB blocks for the SRM simulation ……………………….. 35
Figure 17: Converter Block …………………………………………………... 35
Figure 18: Sub-converter Block ……………………………………………… 35
Figure 19: Output of the SRM………………………………………………… 36
Figure 20: Output of the SRM at low speeds…………………………………. 37
Figure 21: Mechanical equation block diagram via SIMULINK………………. 38
Figure 22: Complete Simulation Model of 6/4 SRM …………………………. 39
Figure 23: Phase Model of SRM……………………………………………….. 40
Figure 24: Modulo pi/2 Model…………………………………………………. 41
Figure 25: Switch Model……………………………………………………….. 41
Figure 26: Inductance Model…………………………………………………. 42
Figure 27: Torque Model……………………………………………………….. 43

ix
Figure 28: Different configurations implemented on 6/4 SRM…………. 43
Figure 29: Output of Total Torque, Speed and rotation of 6/4 Motor at
No load……………………………………………………
45
Figure 30: (a) Individual Torques generated from each phase, (b)
Expanded view of Individual Torques generated …………..
46
Figure 31: (a) Inductance profile of all the three phases, (b) voltage
Pulses applied to three phases, (c) Current output of Phase A .
47
Figure 32: (a) Total Torque, Speed and rotation with on=7 and off = 33,
(b) Expanded view of the results simulated in (a)…………………
50
Figure 33: Simulation of Voltage Pulses and current of Phase A……………… 51
Figure 34: (a) Voltage Pulses applied to three phases, (b) Current output of
Phase A……………………………………………………………..
55
Figure 35: Inductance profile of all the three phases……………………….…. 56
Figure 36: (a) Total Torque, Speed and rotation with on=10 and off = 35,
(b) Expanded view of the results simulated in (a)…………………
58
Figure 37: Voltage Pulses to individual phases and current of Phase A……… 59
Figure 38: Inductance profile of each phase and Current produced in each
phase………………………………………………………………..
59
Figure 39: Inductance, Current and Torque of Phase A………………………… 60
Figure 40: (a) Torque Produced, Speed and Rotation (b) Expanded view of
Torque and Speed……………………………………………………
63
Figure 41: (a) Expanded view of Voltage Pulses applied and Current Produced
in Phase A, (b) Voltage pulses applied to all the phases, inductance
of all phases and current produced…………………………………
64
Figure 42: Complete Simulation Model of 8/6 SRM………………………….. 70
Figure 43: Output of Total Torque, Speed and rotation of 8/6 Motor with little
load…………………………………………………………………
72
Figure 44: (a) Expaned view of Individual Torques generated from each phase,
(b) Individual Phase Inductances …………………………….……
73
Figure 45: (a) Expanded view of Indivudal Voltage Pulses Applied, (b)
Voltage Pulses, Phase Inductances and Phase Currents produced…..
74
Figure 46: Hysteresis control of SRM………………………………… 78

x
LIST OF TABLES
Table 1: Switching Sequence of SRM ………………...…………………………… 16
Table 2: Important parameter values for design of SRM…………………………. 25
Table 3: Signals to be selected as an output ………………………………………. 33
Table 4: Turn on and Turn off angle Analysis with no load………………………… 49
Table 5: Turn on and Turn off angle Analysis with TL= 1Nm……………………. 52
Table 6: Turn on and Turn off angle Analysis with TL = 5Nm……………………. 52
Table 7: Turn on and Turn off angle Analysis with TL = 10Nm…………….......... 53
Table 8: Turn on and Turn off angle Analysis with TL = 15Nm……………......... 53
Table 9: Turn on and Turn off angle Analysis with no load……………………….. 57
Table 10: Theta on and theta-off analysis for Hysteresis control with no load……. 66
Table 11: Theta on and theta-off analysis for Hysteresis control with Tl=1Nm…… 67
Table 12: Theta on and theta-off analysis for Hysteresis control with Tl=5Nm…… 67
Table 13: Theta on and theta-off analysis for Hysteresis control with Tl=10……… 68
Table 14: Comparison of two control techniques for Tl=10Nm……………………. 68
Table 15: Turn on and Turn off angle Analysis with load Tl= 1Nm……………….. 76
Table 16: Turn on and Turn off angle Analysis with load Tl= 5Nm……………….... 76
Table 17: Hysteresis control technique………………………………………………. 77

xi
NOMENCLATURE
q Number of Phases in Motor
LT Load Torque
eT Electrical Torque
),(iT Generated Phase Torque
Position of Rotor
Angular Velocity
J Moment of Inertia
B Viscous Friction Coefficient
n Flux Linkage of Phase n
ni Phase Current of nth phase
nV Phase Voltage of nth phase
R Resistance of Motor Phases
sN Number of Stator Poles
rN Number of Rotor Poles
nV Terminal voltage
nI Phase current
r , r Rotor pole arc and Pitch
s Stator pole Arc
on Turn on angle
off Turn off angle
jL Inductance of phase j
aL Phase inductance at aligned position
uL Phase inductance at un-aligned position

xii
ACRONYMS
SRM Switched Reluctance Motor
BFA Bacterial Foraging Algorithm
VRM Variable Reluctance Motor
DC Direct Current
AC Alternating Current
EMF Electro magnetic force
MMF Magneto motive force
ANN Artificial Neural Network
VA Volt- Ampere
1
CHAPTER 1
INTRODUCTION
This chapter introduces and explains the project topic ―Modelling and Simulation of
Switched Reluctance Motors‖. A background study on this topic is highlighted
followed by the problem statement, objectives and finally the scope of study.
1.1 Background of Study
In today‘s world, it can not be imagined to have any industry or
manufacturing yard without an Electric Motor. They are used in applications like
industrial fans, blowers and pumps, house hold appliances, power and other machine
tools. Basically an electric motor is a machine that converts the electric energy to
produce mechanical energy by the interaction of magnetic fields and current –
carrying windings. The motors are either operated on Alternating Current (AC) or
Direct Current (DC) and they can be further classified into many groups as is shown
in figure 1. DC motors are classed as Series, Shunt and Compound motors, while AC
motors are generally classified into two classes i.e. Asynchronous Motors and
Synchronous Motors. The first class of motor requires a slip between rotating
magnetic fields and windings as to induce current by mutual inductance, the
synchronous motors however does not require any slip for the current production.

2
Figure 1: Classification of Motors
While selecting the motor for any application, various factors are to be
considered like Power source, torque requirements, RPM requirements, physical size,
controls, operating conditions, speed requirements and most importantly cost of
operation. After considering all those, the requirements are matched with the motor
and then those with the most matches are selected as appropriate for any application.
One of the many types of motors is the Stepper Motor, which is widely used for many
applications, where precise turning is required. Stepper motors may not only be AC
motors but there is DC Stepper motors as well, used in industries utilizing robots or
other equipments. In this project, one of the type of stepper motor i.e. Variable
reluctance Motor is studied and simulated in order to improve its performance in
terms of torque ripple.
Classification
of Motors
Alternating
Current (AC)
Asynchronous
Synchronous
Stepper
Brushless
Single Phase
3-Phase
Direct Current
(DC)
Shunt
Series
Compound
Variable
Reluctance
Hybrid Permanent
Magnet

3
1.2 Stepping Motors
A stepper motor is an electromechanical device which converts electrical
pulses into discrete mechanical movements. The shaft or spindle of a stepper motor
rotates in discrete step increments when electrical command pulses are applied to it in
the proper sequence [8]. A step is defined as the angular rotation produced by the
output shaft each time the motor receives a step pulse. Each step causes the shaft to
rotate a certain number of degrees. A step angle represents the rotation of the output
shaft caused by each step, measured in degrees The motors rotation has direct
relationship to these applied input pulses, where in the pulses sequence determines
the direction of motor shafts rotation. The speed of the motor shafts rotation is
directly related to the frequency of the input pulses and the length of rotation is
directly related to the number of input pulses applied.
Stepping motors fill a unique niche in the motor control world. These motors
are commonly used in measurement and control applications. Sample applications
include ink jet printers, CNC machines and volumetric pumps. Several features
common to all stepper motors make them ideally suited for these types of
applications [9]. Some of these features are:
Brushless – Stepper motors are brushless. The commutator and brushes of
conventional motors are some of the most failure-prone components, and they create
electrical arcs that are undesirable or dangerous in some environments.
Load Independent – Stepper motors will turn at a set speed regardless of
load as long as the load does not exceed the torque rating for the motor.
Open Loop Positioning – Stepper motors move in quantified increments or
steps, thus the position of the shaft is known at all times without the need for a
feedback mechanism.
Holding Torque – Stepper motors are able to hold the shaft stationary.

4
1.3 Types of Stepping Motors [9]
There are three basic types of stepping motors: permanent magnet, variable
reluctance and hybrid. Permanent magnet motors have a magnetized rotor, while
variable reluctance motors have toothed soft-iron rotors. Hybrid stepping motors
combine aspects of both permanent magnet and variable reluctance technology. The
stator or stationary part of the stepping motor holds multiple windings. The
arrangement of these windings is the primary factor that distinguishes different types
of stepping motors from an electrical point of view. From the electrical and control
system perspective, variable reluctance motors are distant from the other types. Both
permanent magnet and hybrid motors may be wound using either unipolar windings,
bipolar windings or bifilar windings.
1.3.1 Variable Reluctance Motor
This type of stepper motor is probably the easiest to understand from
structural point of view and probably the complicated one from the operation point of
view. This type of motor consists of a soft iron multi-toothed rotor and a wound
stator. Since it doesn‘t have any windings on the armature, rotor is easy to
manufacture. When the stator windings are energized with DC current the poles
become magnetized. Rotation occurs when the rotor teeth are attracted to the
energized stator poles. Figure 1 shows a cross section of a typical V.R. stepper motor
[9].
Figure 2: Cross section of a Variable Reluctance Motor [9]

5
1.3.2 Permanent Magnet Motor
The Permanent motor operates on the reaction between a permanent-magnet
rotor and an electromagnetic field. As shown in Figure 2, the stator and rotor consists
of teeth, while the rotor has a permanent magnet mounted at each end. The teeth on
the rotor surface and the stator pole faces are offset so that there will be only a limited
number of rotor teeth aligning themselves with an energized stator pole. When a PM
stepper motor has a steady DC signal applied to one stator winding, the rotor will
overcome the residual torque and line up with that stator field. The continuous supply
of the winding currents in a particular sequence can make the armature rotate in
particular direction. Permanent Magnets motors are further classified into Unipolar,
Bipolar and Bifilar Motor, based on the configuration and operation of the windings.
Figure 3: Components of Permanent Magnet Stepper Motor [9]
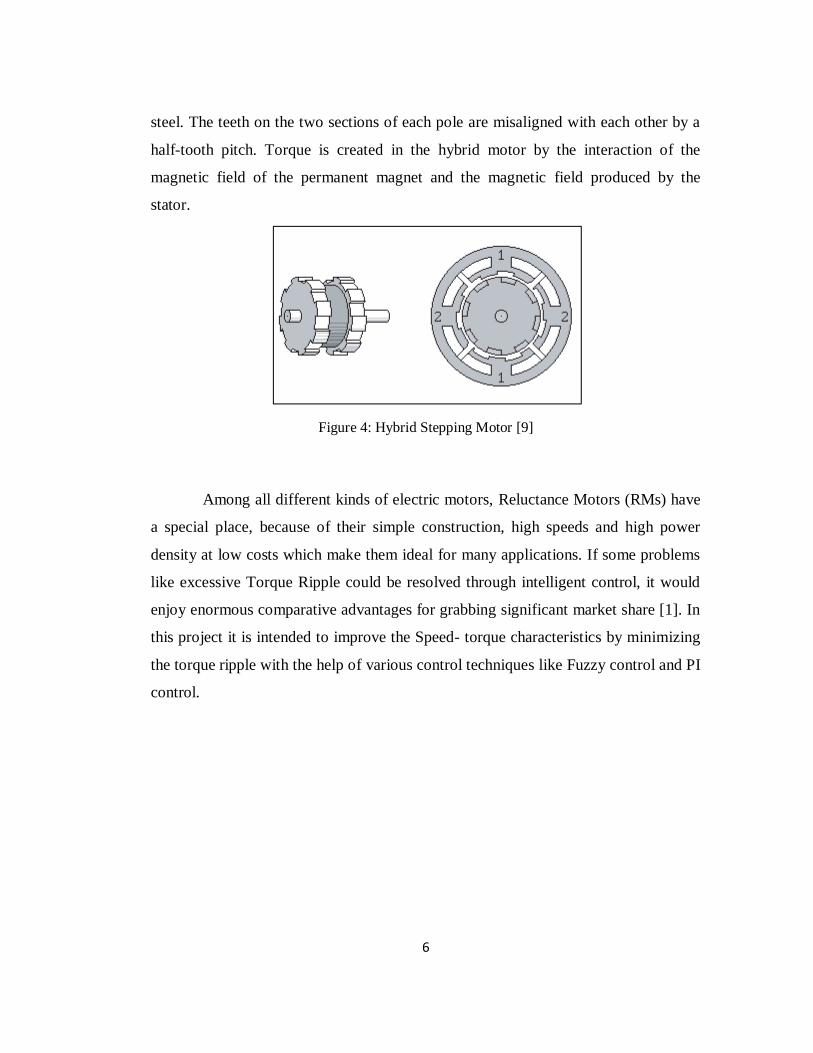
1.3.3 Hybrid Motor
Hybrid motors share the operating principles of both permanent magnet and
variable reluctance stepping motors. The rotor for a hybrid stepping motor is multi-
toothed, like the variable reluctance motor, and contains an axially magnetized
concentric magnet around its shaft (see Figure 5). The teeth on the rotor provide a
path which helps guide the magnetic flux to preferred locations in the air gap [9].
Each pole of a hybrid motor is covered with uniformly spaced teeth made of soft
6
steel. The teeth on the two sections of each pole are misaligned with each other by a
half-tooth pitch. Torque is created in the hybrid motor by the interaction of the
magnetic field of the permanent magnet and the magnetic field produced by the
stator.
Figure 4: Hybrid Stepping Motor [9]
Among all different kinds of electric motors, Reluctance Motors (RMs) have
a special place, because of their simple construction, high speeds and high power
density at low costs which make them ideal for many applications. If some problems
like excessive Torque Ripple could be resolved through intelligent control, it would
enjoy enormous comparative advantages for grabbing significant market share [1]. In
this project it is intended to improve the Speed- torque characteristics by minimizing
the torque ripple with the help of various control techniques like Fuzzy control and PI
control.
7
1.4 Problem Statement
The most complex characteristics of the Switched Reluctance Motors (SRMs)
are their nonlinear Angular Positioning parameters and nonlinear Magnetic
characteristics. The first group contains winding inductance, produced torque and
Back EMF, which depend on the rotor angle. On the other hand magnetic saturation
causes the nonlinear magnetic characteristics [1]. Torque ripple and Speed Control
are the major concerns in SRM. Recently a lot of research is being conducted to
improve the characteristics and optimize the performance of the motor, and different
extent of improvements has been achieved. In this project, SRM is implemented with
the most fundamental of control techniques and their effect is studied, calculated and
tabulated. With this attempt a lot of generalizations and understanding can be
obtained.
1.5 Objectives of the study
To determine the practicability and limitations of the various techniques used
for the SRMs‘ performance optimization.
To study the operations of SRM and to implement the Model in MATLAB
To simulate Linear Model of SRM with two different configurations
To implement two different control techniques with both of the configurations
To do load and no-load analysis on the SRM
To observe, calculate and analyze the performance of the motor with various
operating conditions
To select optimal operating conditions for the SRM controller in order to
produce the highest mean torque and least torque ripple

8
1.6 Scope of the study
The scope includes the study on the Switched Reluctance Motor, its operation
and the various controller topologies used to control the SRM. The motor model is
simulated with the help of software to have complete idea about the working and
performance of Motor. Two control techniques along with the controllers are applied
to optimize the performance of the Motor. Finally Analysis on various parameters of
the Motor is done and the results are compared. The suggested method of Simulations
can be used to model and study the Real-time SRM design.

9
CHAPTER 2
LITERATURE REVIEW
2.1 Previous Work Done
Before I could start with the project, I had to understand about the problems
involved with the motor as well as the research and studies that have been done to
improve the motor performance and ultimately solve the problem. For this purpose I
went through reviewing different literature which includes Research Paper,
Magazines and Journal. The characteristics of motor, which most of the researchers
tried to improve are Torque Ripple, Speed Regulation, Vibration and Acoustics.
In [1] the author has used a biologically motivated technique called Context
Based Brain Emotional Learning (CBBEL) to Switched Reluctance Motor. The
author has encompassed the problems like Torque ripple and speed regulation and has
achieved to reduce the Steady state error and torque ripple, but the technique requires
an algorithm for Optimum tuning of CBBEL controller and the optimization is on
trial and error basis for correct emotional Cue.
The authors in [2] have used the Adaptive Intelligent Control and proposed
controller has the Speed and Torque controller inside. The author has been successful
to reject the disturbances & uncertainties in the parameters of Motor using fuzzy &
adaptive Controllers, but since system has Neural, Fuzzy and Adaptive control
altogether, it makes the controller design quite expensive and complicated. The
problem of acoustics and vibration is also not considered in it.

10
In [3], authors have tried to do the structural modifications in the motor
instead of proposing any controller. They had been successful in reducing the torque
ripple, vibration as well as getting speed regulation to some extent. But the design
proposed is quite difficult and make the motor more expensive. While in [4], author
has attempted to adopt completely different approach by using the Phase current
modulation. This technique is very simple and requires no modifications or digital
calculations but it only covers the torque ripple minimization. Inductance versus
angle variation of motor is assumed linear in the positive torque production period.
2.1.1 Techniques &Algorithms Applied
The advent of power electronics and fast digital hardware, together with improved
nonlinear and adaptive control methods, enables a reevaluation of the issues related to
switched reluctance motors. The objective is to reduce the nonlinearities and torque
ripple by optimizing the motor performance. Through the literature, I came across
different control techniques that have been applied to improve the motor
performance. The motor indeed has pros and cons with itself. Some of the other
techniques that have been applied are:
Spline Function Modeling using adaptive rules
Continuous sliding mode control technique
Adaptive fuzzy logic controller using least-means-square algorithm
All of the above techniques have been applied to minimize the ripple to some
extent, obtain speed regulation and improve the current profile of the motor. Thus In
this project, I will try to improve the similar performance parameters by first
modeling the motor in SIMULINK MATLAB and later applying some control
strategies with particular controller.

11
2.2 Variable Reluctance Motor
The switched or variable reluctance motor (SRM) is a synchronous
machine. It has wound field coils as in a DC motor for the stator windings. The rotor
however has no magnets or coils attached [5]. Motion is produced as a result of the
variable reluctance in the air gap between the rotor and the stator. When a stator
winding is energized, producing a single magnetic field, reluctance torque is
produced by the tendency of the rotor to move to its minimum reluctance position.
This phenomenon is analogous to the force that attracts iron or steel to permanent
magnets. In those cases, reluctance is minimized when the magnet and metal come
into physical contact [6]. In order to achieve a full rotation of the motor, the windings
must be energized in the correct sequence.
2.2.1 Advantages and Disadvantages
Switched Reluctance Motors offer some advantages along with potential low
cost, for example, they can be very reliable machines since each phase of the SRM is
largely independent physically, magnetically, and electrically from the other motor
phases. Also, because of the lack of conductors or magnets on the rotor, very high
speeds can be achieved, relative to comparable motors. Disadvantages often cited for
the SRM; that they are difficult to control, that they require a shaft position sensor to
operate, they tend to be noisy, and they have more torque ripple than other types of
motors; have generally been overcome through a better understanding of SRM
mechanical design and the development of algorithms that can compensate for these
problems [6].
With all motors, torque falls with increased motor speed, but the drop in
torque with speed is less pronounced with variable reluctance motors. With
appropriate motor design, speeds in excess of 10,000 steps per second are feasible
with variable reluctance motors, while few permanent magnet and hybrid motors
offer useful torque at 5000 steps per second and most are confined to speeds below

12
1000 steps per second. The low torque drop-off with speed of variable reluctance
motors allows use of these motors, without gearboxes, in applications where other
motors require gearing [9].
2.2.2 Construction
In construction, the SRM is the simplest of all electrical machines. The stator
has the windings while rotor contains no conductors or permanent magnets and
consists simply of steel laminations stacked onto a shaft. It is because of this simple
mechanical construction that SRMs carry the promise of low cost. The stator houses
concentric windings on its poles and diametrically opposite stator pole windings are
connected in series to form one phase. Generally VR Motors have three to five
windings connected to a common terminal. Figure 4 shows the cross section of a
three winding, 30 degree per step variable reluctance motor. The rotor in this motor
has four teeth and the stator has six poles, with each winding wrapped around
opposing poles. [9]
Figure 5: Variable Reluctance Stepper Motor
2.2.3 Operation
The rotor teeth marked X (Figure 4) are attracted to winding 1 when it is
energized. This attraction is caused by the magnetic flux path generated around the
coil and the rotor. The rotor experiences a torque and moves the rotor in line with the

13
energized coils, minimizing the flux path. The motor moves clockwise when winding
1 is turned off and winding 2 in energized. The rotor teeth marked Y are attracted to
winding 2. This results in 30 degrees of clockwise motion as Y lines up with
winding2. Continuous clockwise motion is achieved by sequentially energizing and
de-energizing windings around the stator.
The following control sequence will spin the motor depicted in Figure 4 clockwise
for 12 steps or one revolution.
Winding 1: 1001001001001
Winding 2: 0100100100100
Winding 3: 0010010010010
The relationship among step angle, rotor teeth, and stator teeth is expressed using the
following equation:
0360rs
rs
NN
NN
where = step angle in degrees, sN = Number of teeth on stator core and
rN = Number of teeth on rotor core
2.2.4 Energy Conversion Principles of Switched Reluctance Motor
The energy conversion principles of the switched reluctance motor are view in
aspects of its magnetization curves which include the analysis of the 3 most important
positions analyzed in SRM which are aligned position, unaligned position and
intermediate rotor position. Instantaneous torque and average torque are also other
two of the important aspects that should be understood.

14
Aligned Position
The aligned position as shown in figure 5 shows a pair of rotor, exactly in line with a
pair of stator. During this position, there is no torque because rotor is at the position
of maximum inductance. Maximum inductance phenomena happen because the
magnetic reluctance of the flux path is at its lowest when the current flow. However
when the rotor moves in either direction, it will produce a restoring torque that tries to
maintain the position to achieve maximum inductance.
Figure 6: Aligned Position of SRM
Unaligned Position
The unaligned position is as shown in figure 6. The rotor poles are not in line with the
stator poles and minimum phase inductance exists because magnetic reluctance of the
flux path is at its highest. There is no torque during this position unless the rotor is
moved in either direction, attracting it to the second phase being excited.
Figure 7: Unaligned Position of SRM

15
Intermediate Position
The position of rotor poles is between the position of aligned and unaligned.
To understand the relationship between number of teeth and the degrees of step,
consider the Figure 7. In this circuit, the stator has six teeth and the rotor has four
teeth. According to Equation mentioned, the rotor will turn 30° each time a pulse is
applied. Figure 7 (a) shows the position of the rotor when phase A is energized. As
long as phase A is energized, the rotor will be held stationary. When phase A is
switched off and phase B is energized, the rotor will turn 30° until two poles of the
rotor are aligned under the north and south poles established by phase B. The effect
of turning off phase B and energizing phase C is shown in Figure 7 (c). In this circuit,
the rotor has again moved 30° and is now aligned under the north and south poles
created by phase C. After the rotor has been displaced by 60° from its starting point,
the step sequence has completed one cycle.
(a) (b) (c)
Figure 8: Rotor Switching Sequence of VRM
The Switching Sequence to complete a full 360 degrees of rotations for a
variable reluctance motor with six stator poles and four rotor poles is shown in Table
1. By repeating this pattern, the motor will rotate in a clockwise direction. The
direction of the motor is changed by reversing the pattern of turning ON and OFF
each phase.

16
Table 1: Switching Sequence of the SRM
Cycle Phase
A B C
Position
1 ON OFF OFF 0 degrees
OFF ON OFF 30 degrees
OFF OFF ON 60 degrees
2 ON OFF OFF 90 degrees
OFF ON OFF 120 degrees
OFF OFF ON 150 degrees
3 ON OFF OFF 180 degrees
OFF ON OFF 210 degrees
OFF OFF ON 240 degrees
4 ON OFF OFF 270 degrees
OFF ON OFF 300 degrees
OFF OFF ON 330 degrees
5 ON OFF OFF 330 degrees
2.2.5 Basic Control Circuit
Variable reluctance motors have multiple windings, typically three to five,
which are all tied together at one end. The windings are turned on one at a time in a
particular sequence to turn the motor. Figure 8 shows the basic circuit for driving a
variable reluctance motor. Note the diodes across the windings.
As with all inductive loads, as voltage is switched on across a winding, the
current in the winding begins ramping up. When the switching MOSFET for the
winding is turned off a voltage spike is produced that can damage the transistor. The
diode protects the MOSFET from the voltage spike assuming the diode is adequately
sized [9].

17
Figure 9: SRM Control Circuit
2.2.6 Torque- Speed Characteristics
The torque-speed operating point of a SRM is essentially programmable and
determined almost entirely by the control. This is one of the features that make the
SRM an attractive solution. The envelope of operating possibilities, of course, is
limited by physical constraints such as the supply voltage and the allowable
temperature rise of the motor under increasing load. In general, this envelope is
described by Figure 9.
Figure 10: SRM torque speed characteristics [6]

18
Like other motors, torque is limited by maximum allowed current, and speed
by the available bus voltage. With increasing shaft speed, a current limit region
persists until the rotor reaches a speed where the back-EMF of the motor is such that,
given the DC bus voltage limitation we can get no more current in the winding—thus
no more torque from the motor. At this point, called the base speed, and beyond, the
shaft output power remains constant, and at it‘s maximum. At still higher speeds, the
back-EMF increases and the shaft output power begins to drop. This region is
characterized by the product of torque and the square of speed remaining constant [6].

19
CHAPTER 3
METHODOLOGY
3.1 Project FLow
END
Implementation of the Technique
Start
Problem Identification
Literature Review
Literature Review
Literature Review
Technique Selection to Apply
Understand Techniques Used
Literature Review Understand the Motor Operation
Current Profile Simulations
Thesis/Documentation
Simulations & Results

20
3.1.1 Phases Involved in Project Completion
Phase 1 : Problem Statement
Identify the problem encountered with the motor selected for the project.
Phase 2 : Literature Review
Identify various techniques that have been used to mitigate the problem involved with
the motor and knowing the advantages, disadvantages and limitations of each
technique applied.
Phase 3 : Technique Selection to apply
The technique is selected named Bacterial Foraging Algorithm in order to apply on
the motor in order to improve its performance and solve the problems.
Phase 4 : Understanding the motor operation
During this phase the construction, operation and control of motor is studied in detail
to understand its working behavior and problems
Phase 5 : Current Profile Simulation using SIMULINK
The motor performance is simulated in order to achieve the output of Current,
Voltage, speed and Torque at different conditions.
Phase 6 : Implementation of the technique selected
In this phase the programming is done in MATLAB to construct an algorithm
through which the Motor performance can be improved.
Phase 8 : Simulation and Results
Phase 9 : Thesis/documentation

21
3.2 Tools and Software Required
For this project I will be using simulations and computations hence I have
chosen following software for the purpose of my project:
MATLAB
MATLAB is a numerical computing environment and fourth generation
programming language. Developed by The MathWorks, MATLAB allows matrix
manipulation, plotting of functions and data, implementation of algorithms, creation
of user interfaces, and interfacing with programs in other languages.
To use MATLAB, it is important to understand its main icons and functions.
The Command Window is a tool that is used to enter data, run MATLAB functions,
run M-files, and display results. It is the main menu for MATLAB. All the
simulations and programming are done in M-files. M-files implements functions, or
program routines, that accept input arguments and return output arguments. They
operate on variables in their own workspace, separate from the MATLAB command
prompt workspace.
SIMULINK
Simulink is an environment for multidomain simulation and Model-Based
Design for dynamic and embedded systems. It provides an interactive graphical
environment and a customizable set of block libraries that let you design, simulate,
implement, and test a variety of time-varying systems, including communications,
controls, signal processing, video processing, and image processing.

22
3.3 Insight into Switched Reluctance Motor
In order to control a SRM, it is very necessary to have some control using fast
switching power converters. The one of the example used to control has been
identified in the Basic Control Circuit part of Introduction.
Electromechanical energy conversion may be considered as consecutive
transformation of electrical energy into magnetic energy and of magnetic energy into
mechanical energy. The transformation of electrical energy into magnetic energy is
described by the differential equation
4,...,1, jRivdt
djj
j
The coenergy (Wj) of the magnetic field is obtained as an integral at constant rotor
position θ, where magnetic energy does not convert into mechanical energy:
j
i
jjjj idiiWj
0),(),(
Transformation of magnetic co-energy into mechanical energy without exchange
between the winding and the electrical supply at constant current generates torque
and is determined by differentiating the co-energy function Wj with respect to θ at
constant current, i.e.,
j
jj
WiT ),( 4,...,1j
The torque generation can also be explained by the tendency of the magnetic circuit
of the motor to a minimum configuration of reluctance, i.e. determining the rotor
poles to move into alignment with the energized stator poles, while the inductance of
the excited phase is maximized. Sustainable rotational motion is achieved by
successively feeding the different phases, depending on the position of the rotor as
the rotor turns. If the energized phase is not driven into saturation, the flux linkage be
expressed as follows:

23
)()(),( jjj iLi
which is the product of phase current and the phase inductance. Thus, by using the
above equations, the expression for torque can be derived and is given by
d
dLiiT
j
jjj
2
2
1),(
From above equation, it is immediately understood that the generated torque is
independent of the direction of current flow. Hence, unidirectional currents are
generally used, thereby, greatly simplifying the design of the power converter. A
better understanding of the relationship between the phase inductance profile and the
torque profile can be obtained from figure 10 where the top figure shows the
inductance variations of one typical phase and the corresponding torque profile at
constant current is shown in the bottom figure. The description of the various angular
positions is explained below [13].
Figure 11: Variation of Inductance and Torque of one phase [10]

24
At θ0, the leading edges of the rotor poles meet the edges of the stator poles and
the inductance starts a linear increase with rotation, continuing until the poles are
fully overlapped at θ1, when the inductance reaches its maximum value La.
Ideally, θ1 − θ0 = βs (stator pole arc).
From θ1 to θ2, the inductance remains constant at La through the region of
complete overlap. Ideally, θ2 − θ0 = βr (rotor pole arc).
From θ2 to θ3, the inductance decreases linearly to the minimum value Lu.
Hence, θ3 − θ0 = βs + βr.
From θ3 to θ4, the stator and rotor poles are not overlapped and the inductance
remains constant at Lu. So, the rotor pole pitch r = θ4 − θ0.
From above figure and rotor position analysis, we can conclude to following results.
i) If 0d
dL, then T > 0. It is a case of motoring torque production.
ii) If 0d
dL, then T < 0. It is a case of generating torque production.
It is clear that for the motor to be able to start in one direction (forward) from any
initial rotor position, the pole arcs must be chosen such that at least one of the phase
windings is in a region of increasing inductance (or decreasing inductance for rotation
in the reverse direction). Further, in order to produce a unidirectional forward
motoring torque, the stator phase windings have to be sequentially energized such
that the current pulse for a phase must coincide with the angular interval where the
d
dL for that phase is positive. Similarly, a braking torque (generating mode) or
reverse rotation (motoring in the reverse direction) is obtained when the current

25
pulses coincide with the angular intervals where the respective d
dL is negative.
Therefore, a rotor position sensor is obviously required to start and stop the
conduction of various phases. When this motor is operated without feedback control
and the phase currents are switched on and off in sequence, the rotor will advance in
steps of angle (called as Step angle) φ. For a three-phase SR motor with four rotor
poles, φ = 30.
Assuming that rotor pole arcs r is equal to stator pole arcs , the relation between
angles can be obtained as follows:
r
r
xN
r
yN
All the values of the parameters for designing a motor in SIMULINK are given in
following table and all the initializations are given in Appendix II
Table 2: Important parameter values for design of SRM
PARAMETER SYMBOL VALUE
Moment of Inertia J 0.0013
Viscous Friction Coefficient B 0.0183
Resistance of Motor Phases R 1.3 ohms
Number of Stator Poles sN 6
Number of Rotor Poles rN 4
Terminal voltage nV 150 V
Rotor pole arc r 030
Stator pole Arc s 030
Phase inductance at aligned positio aL 60mH
Phase inductance at un-aligned position uL 8mH

26
In terms of the Faraday‘s law, the flux-linkage and voltage Vs for one phase
during fluxing process can be expressed with:
dRiVs )(1
d
idLi
d
diiLRiVs
),(),(
Where R represents the phase resistance, which increases with the rotor speed;
L (θ, i) indicates the instant inductance value. In second equation above, the three
terms on the right hand side represent the resistive, inductive and back EMF terms,
respectively. If the phase resistance R is small, the flux-linkage will increases linearly
with the rotor position. In terms of the inductance profile due to constant inductance
around the unaligned position, the current increases linearly at first. However, when
the rotor pole overlaps with the stator pole, the inductance increases with the rotor
position θ and the back EMF starts to build up. As a result, the current rising rate is
decreased. When the back EMF is larger than the input voltage Vs, the current starts
to decrease. During ―de-fluxing‖ period, the supply voltage reverses and the phase
current drop to zero very quickly.
Torque Equation is given by:
d
idLiTe
),(
2
1 2
In terms of the above equation it is obvious that the torque produced in the SRM
depends on the phase current and rotor position. When the rotor is around the
unaligned or aligned position, no torque is produced. If the phase current is constant,
the torque is constant during the rotor is in the overlapped or intermediate position.
Furthermore, positive torque is produced when the phase winding is excited during
the rising inductance, and negative torque is produced during the falling inductance.
Because the torque changes with the rotor position and current, although the current

27
flows to phase windings continually from the power supply, there is still a dip in the
torque waveform at the commutation instant from one phase to the next one. There
are two reasons for this. One is that each phase current always starts from zero;
another one is that the change of the inductance with rotor position is small at the
commutation instant. Thus Torque ripple is the major disadvantage of the SRM
3.3.1 SRM Energizing Strategies
There are several possible configurations to energize an SRM from a converter. The
different energizing structures distinguish themselves by their number of
semiconductors and passive components. They also depend on the number of phases
and the way the stator coils are connected. Some of the famous energizing strategies
are:
Voltage Control Single Pulse Technique
Current Control with Hysteresis Technique
PI Contol
3.3.2 Two quadrant Chopping Convertor
Figure 12: Two quadrant Chopping Convertor
Figure 11 shows the Two-Quadrant-chopping converter for the SRM. As mentioned
before, in order to increase the reliability and realize certain control strategies, more
than one switch per leg is used. This converter is similar to the conventional dc- ac
converter, except that the motor winding is in series with the phase switches. Also,

28
the switches have voltage and current ratings that are similar to those of an equivalent
AC converter drive.
This converter provides highest efficiency, reliability and control flexibility. The
upper and lower switches can be controlled independently to realize different control
schemes. For example, when the upper and lower switches are switched
simultaneously, the two diodes on each leg provide the freewheeling path for ―de-
fluxing‖. This control scheme is called hard chopping with which the negative
voltage Vdc is provided during the ―de-fluxing‖ process. If the lower switch conducts
all the time, only the upper switch is switched, then the zero voltage is provided
during the ―de-fluxing‖ process, which is called the soft chopping. When the upper
switch is turned off, the upper switch and the upper diode provides the freewheeling
path for ―de-fluxing‖.
In addition, this converter can provide maximum regenerative braking capability and
equal performance in forward and reverse directions. Also, there is no protection
circuit needed to prevent shoot-through faults because the switches on each phase
conduct simultaneously. All these advantages make the Two-Quadrant-chopping
converter popular in SRM application.
Figure 13: Switching of the Two quadrant Chopping Convertor

29
Figure 14: Results produced as a result of two quadrants Chopping Convertor
3.3.3 Selection of Stator and Rotor Pole arcs
When the rotor pole arc is greater than that of the stator pole arc then there is no
benefit in terms of torque production if ideal current turn-off (i.e. zero time for
current to go from an operating value) is assumed. But in practical SRM, ideal current
turn off is impossible as they have inductances to cater for. Thus it becomes
necessary to turn off the currents even before they reach the completely aligned
position. Hence to utilize the torque-producing positive inductance slope region
completely, it is important that the current be maintained in the region. If the current
continues beyond the positive slop region, then a negative torque is produced since
with equal pole arcs, there is no zero slop inductance regions.
In order to best utilize the positive slope of inductance for torque production, the
current fall angle is calculated and is used to know the turnoff angle exactly. But it
should be clear that, when advanced turnoff is achieved, the average torque is
reduced. Thus considering all this, some of the practical motors are designed with
rotor arc greater than that of stator pole arc.

30
Following observations are achieved with this configuration.
Negative torque generation can be avoided entirely with a dead zone given by
sr , where no torque is produced even when there is current, thus increasing the
average torque contribution of a phase.
Precise calculation of current call angles is not required for every operating
condition.
Elimination of negative torque generation reduced the torque ripples and hence the
audible noise generation. The increase in the average torque as well as other
advantages in both steady stae and transient operating conditions is achieved.
3.3.4 Summary of SRM Modeling Equations
The mechanical part of the motor equations is derived using Newton's law, which
states that the inertial load J times the derivative of angular rate equals the sum of all
the torques about the motor shaft. The result is this equation which is the relation
between the electrical and mechanical parts of SR motor; it can be stated as:
idt
dJ
BTiTdt
dJ L),(
BTiTJdt
dL),(
1 ………………… (1)
where LT is the Load Torque, ),(iT is the generated phase torque (motor torque),
is the angular position of the rotor, J is the moment of inertia and B is the viscous
friction coefficient.

31
The instantaneous voltage across the terminals of a single phase of an SR motor
winding is related to the flux linked in the winding by Faraday‘s law,
dt
dRIV n
nn (n=1,2,3…)
nnn VRI
dt
d …………………………(2)
where nV is the terminal voltage, nI is the phase current, R is the phase resistance and
n is the flux linkage of the Phase
Angular Velocity of Motor dt
d…………………………(3)
Instantaneous Torque of phase
),(' iWd
dTn (n=1,2,3,…)
diid
dT
i
nnn0
),(
d
dLiT nnn
)(
2
1 2 ………………………………(4)
where ),(' iW is the magnetic field co-energy and nL is the phase inductance of nth
phase.
The Equation (4) suggests that positive (or motoring) torque is produced when the
motor inductance is rising as the shaft angle is increasing 0d
dL. Thus, the desired
operation is to have current in the SRM winding during this period of time. Similarly,
a negative (or braking) torque is produced by supplying the SRM winding with
current while 0d
dL

32
Torque Ripple of phase ang
instMininstMax
T
TTTR ……………………(5)
Average Torque T
avg dtTinstTT0
./1 ……………………….(6)
Operating Thetas
Nr
s
sr
s
sr
Nr
2
)(
2
145
34
23
12
1
3.3.5 Application Example
Before the SRM is simulated in MATLAB/SIMULINK with all the design
parameters, the author managed to obtain an application example which was
simulated using the SRM model available in SIMULINK library. By using this
example, better understanding of the controller‘s operation and motor performance is
obtained.
Figure 15: Model of SRM available in MATLAB
Configurations available for Simulations

33
The Switched Reluctance Motor (SRM) block represents three most common
switched reluctance motors: three-phase 6/4 SRM, four-phase 8/6 SRM as well as
five-phase 10/8 SRM. For simulation purpose two models can be selected, a generic
model or a specific model. The generic model is characterized by the aligned and
unaligned inductances, the saturated aligned inductance, the maximum current and
the maximum flux linkage, while the specific model is characterized by the
magnetization characteristics given as a table of flux linkage in function of the rotor
position and the stator current.
Inputs and Outputs
TL: The block input is the mechanical load torque (in N.m). TL is positive in
motor operation and negative in generator operation.
m: The block output ‗m‘ is a vector containing several signals. We may de-
multiplex these signals by using the Bus Selector block from Simulink library.
Table 3: Signals to be selected as an output
Signal Definition Units
V Stator voltages V
Flux Flux linkage V.s
I Stator currents A
Te Electromagnetic torque N.m
W Rotor speed rad/s
Teta Rotor position rad
Converter Used

34
The SRM is fed by a three-phase power converter having three bridge converters,
each of which consists of two IGBTs and two free-wheeling diodes as shown in
Figure. During conduction periods, the active IGBTs apply positive source voltage to
the stator windings to drive positive currents into the phase windings. During free-
wheeling periods, negative voltage is applied to the windings and the stored energy is
returned to the power DC source through the diodes. The fall time of the currents in
motor windings can be thus reduced.
To develop positive torque, the currents in the phases of a SRM must be
synchronized to the rotor position. Turn-on and turn-off angles refer to the rotor
position where the converter's power switch is turned on and turned off, respectively.
By using a position sensor attached to the rotor, the turn-on and turn-off angles of the
motor phases can be accurately imposed. These switching angles can be used to
control the developed torque waveforms.
Simulation of SRM drive
The example available in the library is run and simulated in order to have a view
on the Motor output parameters. Three phase 6/4 SRM is chosen in the example
considering the simplicity of the controller. A DC supply voltage of 240 V is used.
The converter turn-on and turn-off angles are kept constant at 45 deg and 75 deg,
respectively, over the speed-range.
The SRM is started by applying the step reference to the regulator input. The
acceleration rate depends on the load characteristics. Since only the currents are
controlled, the motor speed will increase according to the mechanical dynamics of the
system. The SRM drive waveforms (phase voltages, magnetic flux, windings
currents, motor torque, and motor speed) are displayed on the scope.

35
Figure 16: MATLAB blocks for the SRM simulation
Figure 17: Converter Block
Figure 18: Sub-Converter Block

36
Output of the Simulation
The simulation results are observed at the Scope of the Motor, where in we have
selected the output of Flux Linkage, Phase Current, Electrical Torque and the Speed.
The four parameters are compared with each other for the time of simulations.
Figure 19: Output of the SRM

37
Output at Low Speeds
Figure 20: Output of the SRM at low speeds
After simulating the application example, we are aware of the performance
parameters as well as output expected with them. The simulation helped a lot in
understanding the working of Convertor. The Simulations show, that there is a lot of
torque ripple experienced because of the transitions of the supply to phases.
Hysteresis Control technique is implemented for lower speeds and for higher speeds
voltage pulse control is used. After this simulation, we will try to implement the SRM
having similar results to these.

38
CHAPTER 4
RESULTS & DISCUSSIONS
In this project, an attempt is made to do the performance analysis of two
configurations of the motor, i.e. motor with three phases 6/4 and motor with four
phases 8/6. The purpose of analyzing two motor‘s configurations is to understand the
complexity involved in simulating the two motors as well as differentiating them on
the basis of outputs like Total Torque and Produced Speed.
For each kind of motor, simulation is done using two control techniques i.e.
Voltage control and Current Control and the results are recorded and analyzed. Load
analysis is also performed on each kind of motor with each control technique applied,
where in maximum load and nominal loads are calculated for each strategy.
Initially in order to model the Motor, its dynamic equations have to be
modeled in SIMULINK. The motor‘s torque equation given in (1) is modeled with
following block configurations.
Figure 21: Mechanical equation block diagram via SIMULINK
39
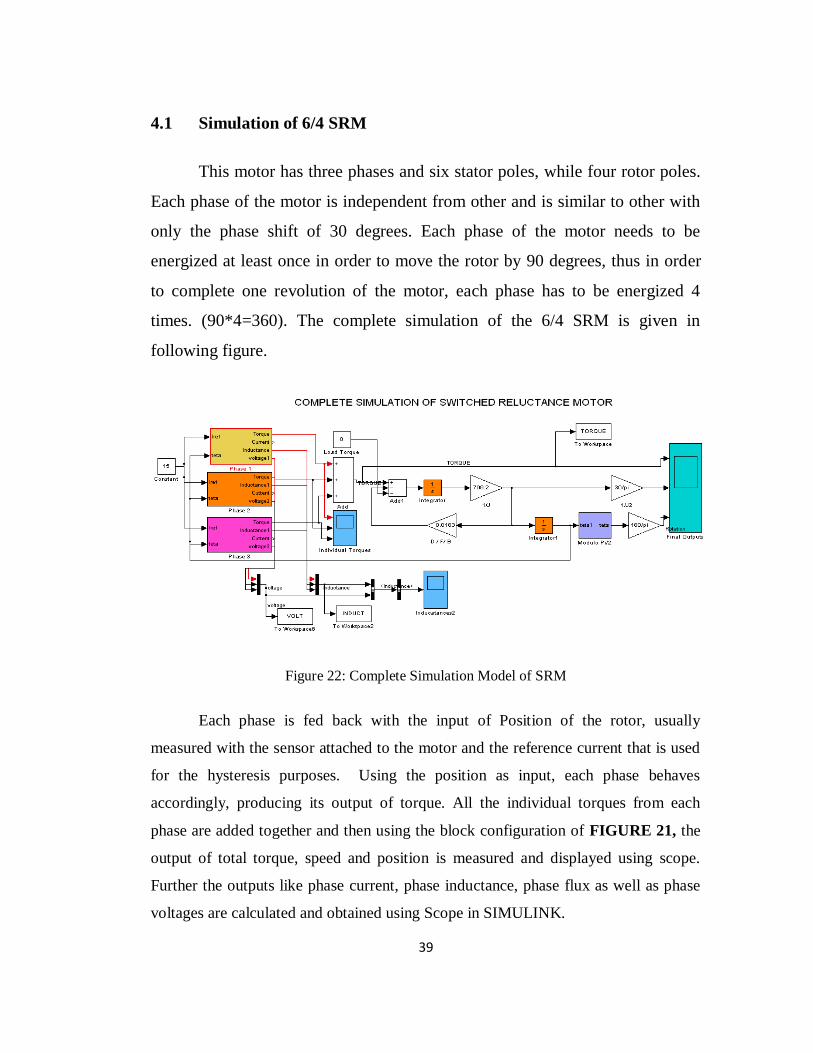
4.1 Simulation of 6/4 SRM
This motor has three phases and six stator poles, while four rotor poles.
Each phase of the motor is independent from other and is similar to other with
only the phase shift of 30 degrees. Each phase of the motor needs to be
energized at least once in order to move the rotor by 90 degrees, thus in order
to complete one revolution of the motor, each phase has to be energized 4
times. (90*4=360). The complete simulation of the 6/4 SRM is given in
following figure.
Figure 22: Complete Simulation Model of SRM
Each phase is fed back with the input of Position of the rotor, usually
measured with the sensor attached to the motor and the reference current that is used
for the hysteresis purposes. Using the position as input, each phase behaves
accordingly, producing its output of torque. All the individual torques from each
phase are added together and then using the block configuration of FIGURE 21, the
output of total torque, speed and position is measured and displayed using scope.
Further the outputs like phase current, phase inductance, phase flux as well as phase
voltages are calculated and obtained using Scope in SIMULINK.

40
The following figure gives further insight of each phase of SRM; since all the phases
are alike, only one phase (phase A) is shown here.
Figure 23: Phase Model of SRM
In above figure, equation (2) is simulated using the sub-block VOLTAGE,
while equation (4) is simulated using the sub-block of TORQUE. Similarly the sub-
block of INDUCTANCE is used to simulate the equation of inductance. The inputs
are the position of the rotor and the reference current, while the outputs of current,
flux and voltage are viewed through scope. Thus in order to simulate different
equations and models, sub-block approach is used for clarification and better
understanding. Different sub-blocks used in above figure are further explained and
illustrated below:
Modulo pi/2: Each phase inductance has a periodicity of rN
2degrees. Therefore, it is
appropriate to transform the rotor position angle coming from the mechanical
equation so that it is modulorN
2. In figure below, block modulo pi=2 achieves this

41
function. In the figure 24 phase shift of phase B is illustrated; the phase is 30 degrees
displaced from the phase A.
Figure 24: Modulo pi/2 Model
Voltage Sub-Block: Voltage sub-block is one of the most important sub-blocks for
the SRM phase simulation. With the help of this sub-block, the Power converter
discussed in the methodology is implemented using the blocks available in
SIMULINK library such as if else block. Voltage sub-block permits to assure the
power converter commutations at angles on, off, and d, it is to assure the
applications of single pulse operation is maintained.
Figure 25: Voltage Model

42
Inductance Sub-Block: This sub-block computes the current and phase inductance
according to rotor position and phase flux . Therefore, one gets phase current I as
its output signal, which is used for the calculation of Phase Torque, the block is
shown in FIGURE 26
Figure 26: Inductance Model
The inductance sub-block produces the output of Inductance and current. The inductance
produced keeps on varying depending on the position of rotor. It increases from the minimum
inductance of Lu at unaligned position to maximum of inductance La at aligned position,
which can be further understood from the chapter 3 discussed above The calculation of the
various switching thetas is repeated here:
Nr
s
sr
s
sr
Nr
2
)(
2
145
34
23
12
1
…………………..(A)

43
Torque Sub-Block: It is used to compute the torque produced in each phase
according to the rotor position and the current I. This block helps to implement the
equation (4), where in it produces positive torque if the phase is supplied with current
during positive slope of inductance, where as it produces negative torque if the phase
is supplied with current during negative slope of inductance.
Figure 27: Torque Model
In order to analyze the performance of 6/4 SRM, different control strategies
have been implemented and results are calculated in order to have complete insight of
the motor. The summary of the different strategies applied for 6/4 SRM are given in
following figure:
Figure 28: Summary of the different configurations implemented on 6/4 SRM
6/4 Motor
Voltage
Control
Current
Control
No load
Full load
Br=Bs
Br~=B
sss

44
Thus firstly, we will apply the voltage control technique on 6/4 motor and
analyze the performance with no load and variable load, after that we will change the
stator arc/rotor arc ratio and then simulate again to find any improvements in the
results. After that we will follow the same procedure for the Current Control
Technique. Throughout the experiment, the motor is simulated with different set of
on, off, and d. The theta value that produces negative torque will be discarded and
hence will not be considered for any further calculations. In this way through trial and
error, we will manage to select the best values of on, off, and d.
45
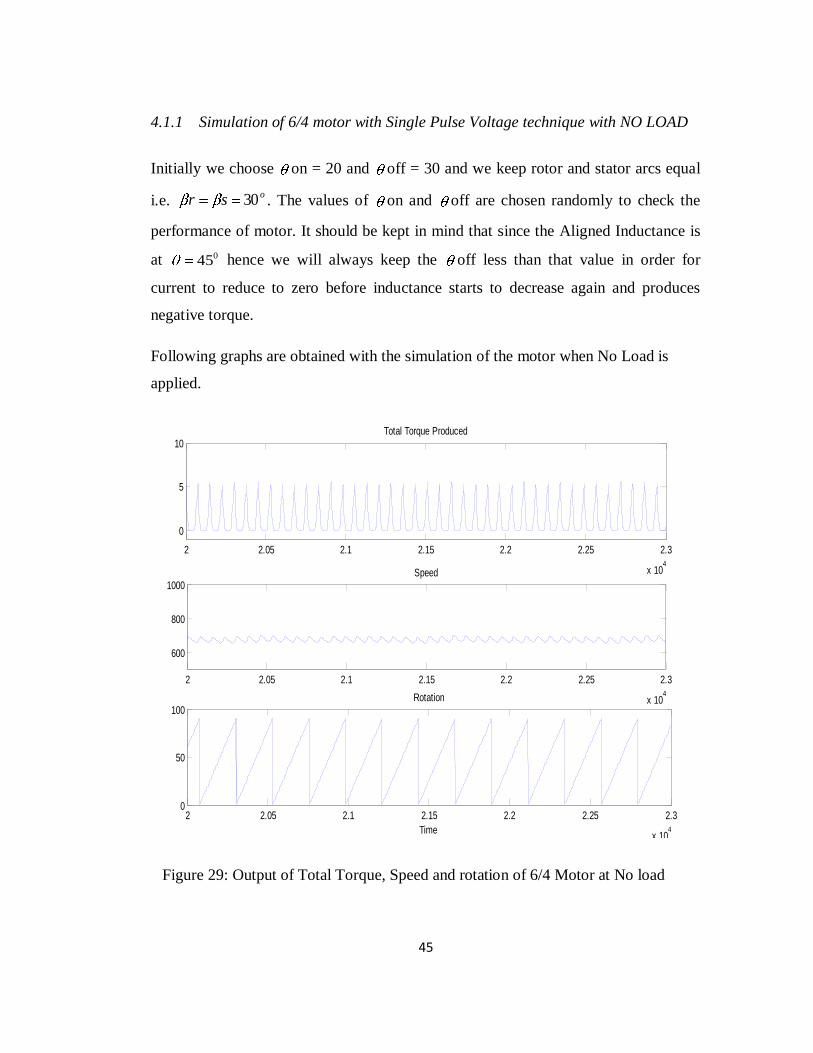
4.1.1 Simulation of 6/4 motor with Single Pulse Voltage technique with NO LOAD
Initially we choose on = 20 and off = 30 and we keep rotor and stator arcs equal
i.e. osr 30 . The values of on and off are chosen randomly to check the
performance of motor. It should be kept in mind that since the Aligned Inductance is
at 045 hence we will always keep the off less than that value in order for
current to reduce to zero before inductance starts to decrease again and produces
negative torque.
Following graphs are obtained with the simulation of the motor when No Load is
applied.
Figure 29: Output of Total Torque, Speed and rotation of 6/4 Motor at No load
2 2.05 2.1 2.15 2.2 2.25 2.3
x 104
0
5
10Total Torque Produced
2 2.05 2.1 2.15 2.2 2.25 2.3
x 104
600
800
1000Speed
2 2.05 2.1 2.15 2.2 2.25 2.3
x 104
0
50
100
Time
Rotation
46
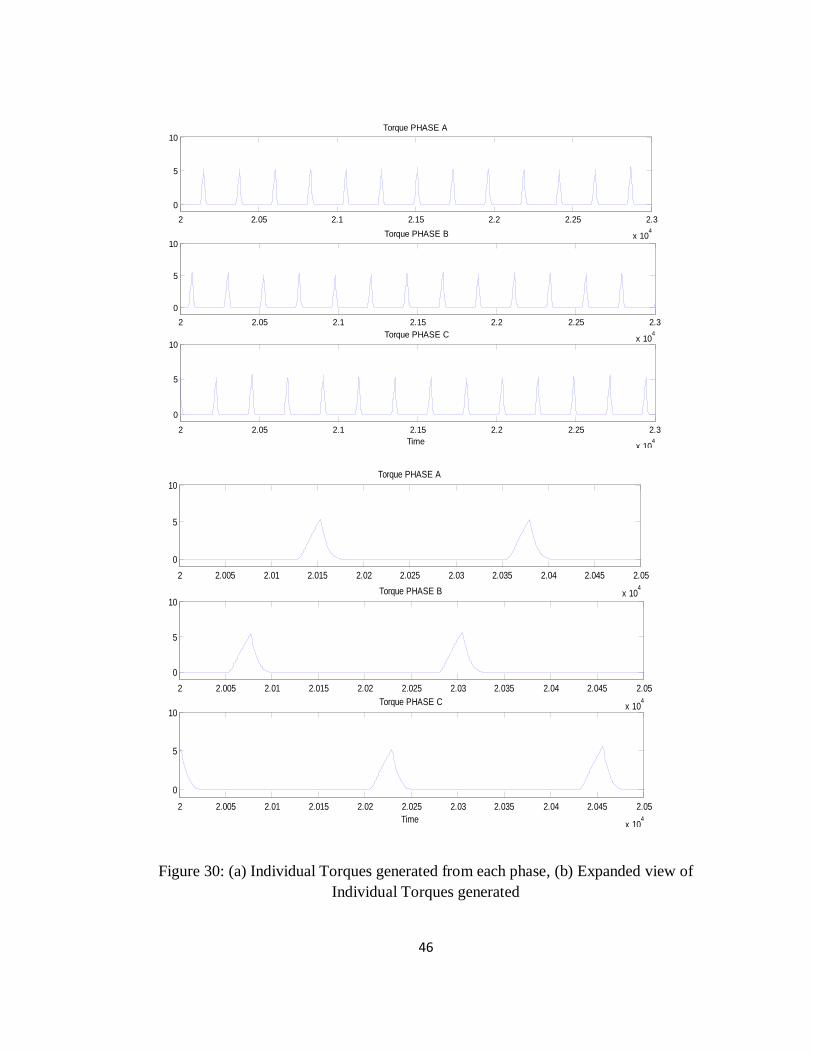
Figure 30: (a) Individual Torques generated from each phase, (b) Expanded view of
Individual Torques generated
2 2.05 2.1 2.15 2.2 2.25 2.3
x 104
0
5
10Torque PHASE A
2 2.05 2.1 2.15 2.2 2.25 2.3
x 104
0
5
10Torque PHASE B
2 2.05 2.1 2.15 2.2 2.25 2.3
x 104
0
5
10
Time
Torque PHASE C
2 2.005 2.01 2.015 2.02 2.025 2.03 2.035 2.04 2.045 2.05
x 104
0
5
10Torque PHASE A
2 2.005 2.01 2.015 2.02 2.025 2.03 2.035 2.04 2.045 2.05
x 104
0
5
10Torque PHASE B
2 2.005 2.01 2.015 2.02 2.025 2.03 2.035 2.04 2.045 2.05
x 104
0
5
10
Time
Torque PHASE C

47
Figure 31: (a) Inductance profile of all the three phases, (b) voltage Pulses applied to
three phases, (c) Current output of Phase A.
2 2.01 2.02 2.03 2.04 2.05 2.06 2.07 2.08 2.09 2.1
x 104
0
5
10
15
Time
Am
plitu
de
Current of Phase A
2 2.005 2.01 2.015 2.02 2.025 2.03 2.035 2.04 2.045 2.05
x 104
0
0.01
0.02
0.03
0.04
0.05
0.06
Time
Individual Inductances
L2
L1 L3
Lu
La
2 2.005 2.01 2.015 2.02 2.025 2.03 2.035 2.04 2.045 2.05
x 104
-150
-100
-50
0
50
100
150
Time
Am
plitu
de
Individual Voltage Pulses to Phases
phase cphase a phase b

48
Interpretation of Graphs
In figure 29, it is demonstrated that Maximum torque of 5 N.m and Mean torque of
1.2767 N.m is produced with No load. In ideal case there should not be any torque
produced with no load conditions, but the reason of torque in our case is the
compensation of Intertia and Frictional Losses. Thus all the torque produced is
utlized against the restrictions, as found in practical motors. The motor as simulated
operates at the speed of 700 rev/min. The startup torque and Speed were found to be
28Nm and 880 rev/min respectively.
In figure 30, the torques of individual phases are plotted, where it can be seen that
each torque pulse is displaced 30 degrees from other due to the mechanical
displacement in the three phases. Inductance profile of each phase is plotted in
Figure 31, where the phase shift is also clear to be 30 degrees from each other. The
inductance starts from the minimum inductance of Lu and increases to maximum
inductance of La. For osr 30 , the values for different thetas are given below:
151 452 453 754 905
In figure 31, the voltage pulses are also shown. These pulses are the output of the
converter, implemented with the help of ‗if else‘ blocks in SIMULINK. As can be
seen, the converter supplies V=150 for the dwell angle of 10 degrees, and then
V= -150 for the angle of 30 degrees and finally zero for the other time. The values
chosen for the on and off are good enough since no negative torque is produced.
Finally the current of Phase A is plotted to show the maximum current of motor
which is almost 10 A.
As can be noted, the SRM torque has a very high torque ripple component which is
due to the transitions of the currents from one phase to the following one. This torque
ripple is a particular characteristic of the SRM and it depends mainly on the
converter‘s turn-on and turn-off angles.

49
4.1.2 Simulations with varied on and off
In this section, different values of theta-on and theta-off are selected and the motor is
simulated with no load. The values for the average torque, maximum starting torque,
operating speed, and torque ripple are calculated and tabulated in the table. The
torque ripple is calculated using equations (5) and (6). The purpose of doing this
analysis is to find out the optimum theta-on and theta-off, producing most desirable
results. The motor also produces negative torque for some of the values of theta,
which are also mentioned in the table.
Table 4: Turn on and Turn off angle Analysis with no load
Average
torque
(Nm)
Max
starting
torque(Nm)
Normal
speed
(rev/min)
Torque
Ripple
(%)
Negative
Torque
Ton = 20 Toff = 30 1.3164 28.5 660 415.6 No
Ton = 10 Toff = 30 3.008 600 1470 147.34 No
Ton = 0 Toff= 30 4.4719 660 2200 368.6 No
Ton = 20 Toff = 33 1.7968 25 880 261.5 Yes
Ton =20 Toff = 33 1.6118 25 770 309 No
Ton = 10 Toff = 33 3.1320 28 1550 119 No
Ton = 0 Toff = 33 5.1184 300 2500 453 Yes
Ton = 7 Toff = 33 3.73 65 1770 190 No
From the table, it is obvious that for the thetas highlighted Red, negative torque is
produced and hence from now on we will discard these values of thetas. The one
highlighted in Green have the most favorable results, one producing the torque ripple
of 119% and other with that of 181%. For the second value, even the ripple is quite
high; we manage to get high average torque and high speed. Thus for now, we will
consider both of the values as our optimum results.

50
The graphs for on=7 and off = 33 are plotted in the following figures.
Figure 32: (a) Total Torque, Speed and rotation with on=7 and off = 33, (b)
Expanded view of the results simulated in (a)
51
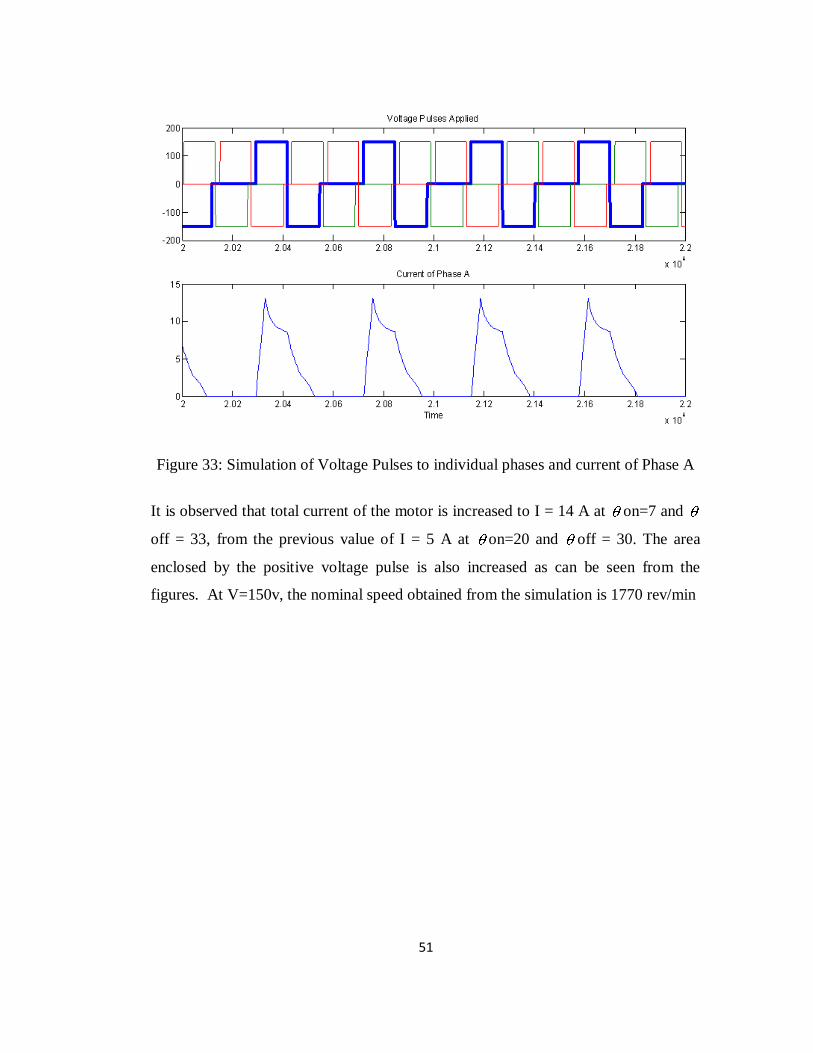
Figure 33: Simulation of Voltage Pulses to individual phases and current of Phase A
It is observed that total current of the motor is increased to I = 14 A at on=7 and
off = 33, from the previous value of I = 5 A at on=20 and off = 30. The area
enclosed by the positive voltage pulse is also increased as can be seen from the
figures. At V=150v, the nominal speed obtained from the simulation is 1770 rev/min

52
4.1.3 Simulation of 6/4 motor with Single Pulse Voltage with Variable Load
In this section, the motor is simulated with variable loads and thus the outputs of
average total torque, maximum starting torque and produced speed are calculated and
tabulated for different values of on and off. The purpose of this analysis is to
calculate the best values of on and off as well as to calculate the nominal rated
load as well as maximum operating load of the simulated Motor. In our analysis we
will apply load on the motor in steps of 5Nm, starting from Tl= 1Nm.
Table 5: Turn on and Turn off angle Analysis with TL= 1Nm
Average torque (Nm)
Max starting torque (Nm)
Normal speed
(rev/min)
Torque Ripple
(%)
Negative torque
Ton = 20 Toff = 30 2.1166 22 550 408.8 N
Ton = 10 Toff = 30 3.7558 75 1280 152.5 N
Ton = 0 Toff= 30 5.1895 650 2000 334.5 N
Ton =20 Toff = 33 2.3636 25 670 315.5 Y
*Ton = 10 Toff = 33 3.8469 30 1380 135.2 N
Ton = 7 Toff = 33 4.3163 70 1600 200 N
Table 6: Turn on and Turn off angle Analysis with TL = 5Nm
Average torque (Nm)
Max starting
torque (Nm)
Normal speed
(rev/min)
Torque Ripple
(%)
Negative torque
Ton = 20 Toff = 30 - - - - -
Ton = 10 Toff = 30 6.9956 50 900 160 N
Ton = 0 Toff= 30 8.3655 650 1500 365 N
Ton = 10 Toff = 33 7.0737 37 960 132 N
Ton = 7 Toff = 33 7.4347 100 1100 260.3 N

53
Table 7: Turn on and Turn off angle Analysis with TL = 10Nm
Average torque (Nm)
Max starting
torque (Nm)
Normal speed
(rev/min)
Torque Ripple
(%)
Negative torque
Ton = 10 Toff = 30 11.9497 40 700 175.5 N
Ton = 0 Toff= 30 12.6948 750 1150 390.34 N
Ton = 10 Toff = 33 11.4639 55 *760 137.4 N
Ton = 7 Toff = 33 11.8276 100 *860 217.34 N
Table 8: Turn on and Turn off angle Analysis with TL = 15Nm
Average torque (Nm)
Max starting
torque (Nm)
Normal speed
(rev/min)
Torque Ripple
(%)
Negative torque
Ton = 10 Toff = 30 15.9857 70 *650 372.37 N
Ton = 0 Toff= 30 17.3408 720 900 412.43 N
Ton = 10 Toff = 33 16.1975 70 *600 153.8 N
Ton = 7 Toff = 33 16.5229 120 *700 242.6 N
In table 5, we can see that there is one value of on and off, which produces
negative torque, and thus we discard it from our further calculations. We can also
observe that since for on = 10, off = 30 and on = 10, off = 33, produces the
best results in terms of average torque and minimum torque ripple. Those two values
are highlighted green and are considered optimum values for further calculations.
In table 6, it can be seen that motor could not be operated for the values of on = 20
and off = 30 with load of Tl=5Nm. So we will not consider these values anymore.
In similar way, the table 7 for load torque Tl = 10Nm and table 8 for load torque of
Tl=15 Nm is obtained with the values of maximum speed, average torque and torque
ripple produced.

54
If the torque ripple of all the tables is compared, it would be found out that torque
ripple only changes with the values of on and off, but doesn‘t depend on the
Load. The values for the Nominal speed having asterisk sign (*) in table 7 and
table 8 indicates that the speed variation is quite high, where in the average value of
speed is noted in the table. This high variation is due to the increase in the Load by
keeping the applied voltage constant to V= 150 v.
After doing the Load Analysis, we can conclude the following things.
1. The motor can be operated at the maximum load of Tl = 20 Nm with a lot of
variations and fluctuations in speed, but however the rated torque for the
motor would be Tl = 15 Nm.
2. Considering the torque ripple, we can say that, for the values of on = 10,
off = 30 and on = 10, off = 33, the best torque is produced with the
minimum of the torque ripple. We has considered on = 7 and off = 33 as
one of the optimum values, but after the torque ripple analysis and load
analysis we can say that it is not as optimum as the other two values.
.

55
4.1.4 Implementation of SRM with sr (no load) and its Effect
This section focuses on the improvements that are achieved by changing the arc
angles of the rotor and stator. In practical motors, the Rotor Arc angle is always
greater than that of Stator Arc angle in order for motor to commutate better, hence
considering that we have simulated the motor with new values of s and r ( sr )
We initially start with on = 20 and off = 30 and later will do the turn on and turn
off angle analysis. We also choose stator arc to be 024s and rotor arc to be
or 36 . It should be kept in mind that since the Aligned Inductance is at 051
hence we will always keep the off less than that value in order for current to reduce
to zero before inductance starts to decrease again and produces negative torque.
With the initial values of on = 20 and off = 30, the torque and speed output for
sr is same as that of sr . Thus only the outputs of individual inductances,
current of Phase A and voltage pulses applied are shown in following figures:
Figure 34: (a) Voltage Pulses applied to three phases, (b) Current output of Phase A

56
Figure 35: Inductance profile of all the three phases
In figure 35, the inductance of each phase is plotted which seems to have the phase
shift of 30 degree. The inductance starts from the minimum inductance of Lu and
increases to maximum inductance of La. The inductance starts to rise at 1 until it
reaches 2 , where it continues to stay at the maximum inductance until 3 and finally
it reduces to minimum inductance at 4 .For024s and
or 36 , the values for
different thetas are given below:
151 392 513 754 905
In figure 34, the voltage pulses applied to the individual phases and phase current are
plotted, which are similar to previous graphs.
One of the advantages achieved with variable arcs is that while operating the motor,
the turn off angle can be increased without experiencing negative torque, since
current will have more time to decrease to zero. This will be further discussed and
understood in the theta-on and theta-off analysis.

57
4.1.5 Simulations with varied on and off for sr
In this section, different values of theta-on and theta-off are selected and the motor is
simulated with no load. The values for the average torque, maximum starting torque,
operating speed, and torque ripple are calculated and tabulated in the table. The
purpose of doing this analysis is to find out the optimum theta-on and theta-off,
producing most desirable results with sr . The motor also produces negative
torque for some of the values of theta, which are also mentioned in the table.
Table 9: Turn on and Turn off angle Analysis with no load
Average
torque
(Nm)
Max
starting
torque(Nm)
Normal
speed
(rev/min)
Torque
Ripple
(%)
Negative
Torque
Ton = 20 Toff = 30 1.2314 28.5 650 415.6 No
Ton = 20 Toff = 40 1.6419 25 810 368.6 Yes
Ton = 20 Toff = 35 1.5791 25 800 298.5 No
Ton = 10 Toff = 30 2.9354 800 1400 196.2 No
Ton = 10 Toff= 35 3.0149 27 1500 175.23 No
Ton = 0 Toff = 30 4.7768 800 2100 374.7 No
Ton =0 Toff = 35 5.8247 400 2200 168.6 Yes
From the table, it is obvious that for the thetas highlighted Red, negative torque is
produced and hence from now on we will discard these values of thetas. The one
highlighted in Green has the most favorable results, producing the torque ripple of
175%, thus we will consider it as our optimum result. It should be observed that,
having rotor and stator arcs equal, the maximum theta-off that could be achieved was
33 degrees but now by increasing the rotor arc, we managed to increase the duty
cycle for the torque production.

58
The graphs for on=10 and off = 35 are plotted in the following figures.
Figure 36: (a) Total Torque, Speed and rotation with on=10 and off = 35, (b)
Expanded view of the results simulated in (a)

59
Figure 37: Voltage Pulses to individual phases and current of Phase A
Figure 38: Inductance profile of each phase and Current produced in each phase

60
Figure 39: Inductance, Current and Torque of Phase A
Similar to sr , the LOAD ANALYSIS was done on the motor having unequal stator and
rotor pole arcs and thus the outputs of average total torque, maximum starting torque
and produced speed were calculated for different values of on and off. In the
experiment, it was found that the values of Theta on equal to 10 degrees and theta off
equal to 35 degrees produced the least torque ripple and positive torque. The Normal
Rated torque was calculated to be 15 Nm, while the maximum torque was found to be
18 Nm for the optimum theta-on and theta-off, but however the motor failed to
operate properly for some of the values of theta

61
4.1.6 Comparison between motors operated with sr and sr
The reason of implementing the motor with unequal pole arcs was to obtain better
performance results than that of equal pole arcs. The following observations are done
after the comparison of two motors:
For Unequal pole arcs, the graphs are plotted for on=10 and off = 35 which
produce the least torque ripple as was calculated in provided table. These values
are selected as optimum values of theta-on and theta-off for the sr , while for
sr , the best values were on=10 and off = 33.
Usually if the fall angle of current is small, then unequal pole arcs help to
improve the average torque and reduce the torque ripples, but in our case, the
current took longer time to decrease and hence, only 2 degrees increase (i.e. off
increased from 33 to 35) in the operating conditions was obtained, considering the
fact that greater values produce negative torque.
Most of the results obtained for different values of theta-on and theta-off for both
cases of equal and unequal pole arcs, produced similar results.
In figure 39, where the torque, inductance and current of phase A is plotted, it can
be observed that, the torque is produced for the complete positive slope of
inductance and is zero for the dead zone, making torque similar to square pulse.
This cannot be achieved from motor with equal pole arcs; where in the current
commutation is advanced to some degrees. The action of advanced turn-off
reduces the average torque, but in our case, since the total angle of positive slope
also decreased, hence there are no observable changes in the average torque with
unequal pole arcs.

62
4.1.7 Simulation of 6/4 motor with Hysteresis Control technique with NO LOAD
To implement hysteresis control or current control, we take produced current as
feedback and use it to compare with the reference current. The error produced will
trigger the convertor to produce either the positive supply of V= 150v or negative
supply of V= -150v for each phase. In order to implement the hysteresis in
MATLAB, we have used the relay block from library of SIMULINK
One of the important parameter for hysteresis control is the Hysteresis band denoted
by e, by which the relay turns on the convertor if the error signal increases above
the 2/e value, and turns off the convertor if the error signal decreases below the -
2/e value, while keeping the output constant during the transition. The operation of
the hysteresis control can be formulated as below:
22
21
20
)(
)(
ee
eu
ee
ee
u
tt
t
The value of e is chosen wisely, because smaller the value, greater will be the
switching frequency of the controller and greater will be the cost of operation. Hence
for our simulations we have chosen the value of e=0.5.
Using hysteresis control, the reference current has to be manipulated; in our
simulations, we have varied the reference current in order to obtain the better
performance of the motor.
Initially we choose the turn-on and turn-off angles to be the same as that obtained in
last simulations, which were found to be the optimum results. Thus by simulating the
motor with on = 10 and off = 33 and keeping rotor and stator arcs equal i.e.
osr 30 , we obtained following results:

63
(a)
(b)
Figure 40: (a) Torque Produced, Speed and Rotation (b) Expanded view of Torque and Speed

64
(a)
(b)
Figure 41: (a) Expanded view of Voltage Pulses applied and Current Produced in Phase A, (b)
Voltage pulses applied to all the phases, inductance of all phases and current produced
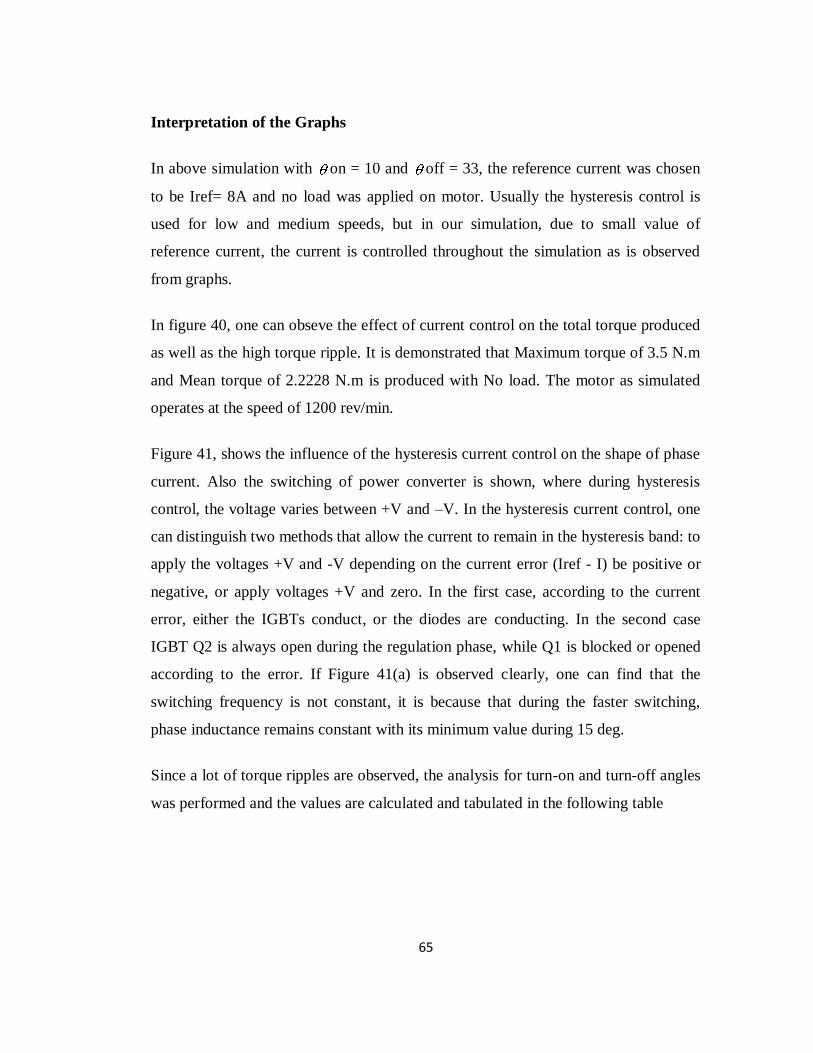
65
Interpretation of the Graphs
In above simulation with on = 10 and off = 33, the reference current was chosen
to be Iref= 8A and no load was applied on motor. Usually the hysteresis control is
used for low and medium speeds, but in our simulation, due to small value of
reference current, the current is controlled throughout the simulation as is observed
from graphs.
In figure 40, one can obseve the effect of current control on the total torque produced
as well as the high torque ripple. It is demonstrated that Maximum torque of 3.5 N.m
and Mean torque of 2.2228 N.m is produced with No load. The motor as simulated
operates at the speed of 1200 rev/min.
Figure 41, shows the influence of the hysteresis current control on the shape of phase
current. Also the switching of power converter is shown, where during hysteresis
control, the voltage varies between +V and –V. In the hysteresis current control, one
can distinguish two methods that allow the current to remain in the hysteresis band: to
apply the voltages +V and -V depending on the current error (Iref - I) be positive or
negative, or apply voltages +V and zero. In the first case, according to the current
error, either the IGBTs conduct, or the diodes are conducting. In the second case
IGBT Q2 is always open during the regulation phase, while Q1 is blocked or opened
according to the error. If Figure 41(a) is observed clearly, one can find that the
switching frequency is not constant, it is because that during the faster switching,
phase inductance remains constant with its minimum value during 15 deg.
Since a lot of torque ripples are observed, the analysis for turn-on and turn-off angles
was performed and the values are calculated and tabulated in the following table

66
Table 10: Theta on and theta-off analysis for Hysteresis control with no load
Average
torque
(Nm)
Ref.
Current (A)
Normal
speed
(rev/min)
Torque
Ripple
(%)
Negative
Torque
Ton = 10 Toff = 33 2.2228 8 1200 147.62 No
Ton = 10 Toff = 33 2.8363 9 1500 127.30 No
Ton = 10 Toff= 33 3.1075 10 1550 116 No
Ton = 10 Toff = 38 3.0053 10 1550 120 Yes
Ton =10 Toff = 37 3.2043 10 1530 112.46 No
Ton = 0 Toff = 37 3.0537 10 1600 118 No
From above table, it is obvious that the value of on = 10 and off = 37 produce the
best results and thus are the optimum values for our simulation. Initially we chose
on = 10, off = 33 and Iref =8 A, later it is observed that, with the increase in
reference current, the mean torque increases. At Iref= 10 A, the maximum average
torque and minimum torque ripple are produced. Thus we changed the operating
conditions to on = 10 and off = 37 and observed that these values produce the
highest average torque of 3.2043 Nm and lowest torque ripple of 112.46. For the
values of on = 10 and off = 38, negative torque is experienced thus we neglect
these values.
At Iref = 10 A, the motor is operated with hysteresis control for low and medium
speeds while it is operated with Single Pulse Voltage for higher speeds. If we reduce
the reference current, Motor is operated with hysteresis control throughout the
simulation. As described earlier, since Hysteresis control is best for medium speeds,
we will choose the Iref =10 A as our reference current for Simulation.

67
In order to do the Load Analysis, we will only consider two values of theta-on and
theta off i.e. on = 10 off = 37 and on = 0 off = 37. It should also be noted that
since the Motor needs higher current for producing higher torque, reference current
should be increased with the increase in load.
Table 11: Theta on and theta-off analysis for Hysteresis control with Tl=1Nm
Average
torque
(Nm)
Ref.
Current
(A)
Normal
speed
(rev/min)
Torque
Ripple
(%)
Negative
Torque
Ton = 10 Toff = 37 3.7090 10 1400 93.13 No
Ton = 10 Toff = 37 4.1404 14 1500 132.7 No
Ton = 0 Toff= 37 3.6239 10 1400 115.9 No
Ton = 0 Toff= 37 3.8971 12 1500 107.8 No
Table 12: Theta on and theta-off analysis for Hysteresis control with Tl=5Nm
Average
torque
(Nm)
Ref.
Current
(A)
Normal
speed
(rev/min)
Torque
Ripple
(%)
Negative
Torque
Ton = 10 Toff = 37 7.0308 14 1000 89.6 No
Ton = 10 Toff = 37 7.2549 17 1000 88.2 No
Ton = 0 Toff= 37 6.6059 14 1000 97.05 No
Ton = 0 Toff= 37 6.8065 17 1100 163.4 No

68
Table 13: Theta on and theta-off analysis for Hysteresis control with Tl=10Nm
Average
torque
(Nm)
Ref.
Current
(A)
Normal
speed
(rev/min)
Torque
Ripple
(%)
Negative
Torque
Ton = 10 Toff = 37 11.6345 20 800 90.31 No
Ton = 10 Toff = 37 11.6427 23 800 91.2 No
Ton = 0 Toff= 37 10.6699 20 800 122 No
Ton = 0 Toff= 37 10.7658 21 800 145 Yes
After the Load analysis, following things can be concluded:
With Hysteresis control, Less Torque ripple is Possible.
Increase in reference current increases the torque ripple but also increase the
mean torque.
The rated nominal torque for simulated motor is Tl=15 Nm at the reference
current of Iref= 25 A. However the motor can be operated up to the maximum
load torque of Tl=20Nm at Iref= 28 A.
For the comparison of motor values for the Voltage control and Current Control,
refer to the table below
Table 14: Comparison of two control techniques for Tl=10Nm
Optimum values of Theta-on
and theta-off
Mean
torque
Speed Torque Ripple
Ton = 10 Toff = 33 11.4639 760 137.4
Ton = 10 Toff = 37 11.6427 800 91.2

69
After all the analysis done with the 6/4 SRM, it is concluded that, the motor can be
controlled with either Single Pulse Voltage Technique or Current Control Technique.
Various calculations were performed in order to obtain the optimum values for theta-
on and theta-off with and without Load. The motor was implemented with equal as
well as unequal pole arcs.
After all these simulations and analysis, it can be declared that the dwell angle can be
increased with unequal pole arcs and hence the mean torque can be increased. Dwell
angle can also be further increased with implementation of Hysteresis and Voltage
pulse technique together, which ultimately produces the higher mean torque and
lower torque ripple. From Table 14, it can be seen that, for the Load of Tl= 10 Nm
and sr , dwell angle for Voltage control technique is smaller than that of
Hysteresis control and as a result, mean torque produced is small.
With regard to the turn-on angle, it is recommended to anticipate its value to the
moment where phase inductance begins to increase, to be able to take advantage of a
high di/dt. However, it is proper to notice that if one applies the turn-on angle too
early, we will be in a region where the inductance change in relation to the rotor
position is small, thus the produced torque will be small as well as the current will be
high, increasing the power losses. Hence, it is necessary to choose an appropriate
value to μon if one wants to optimize the motor efficiency. It is also observed that
with voltage control the speed starts to oscillate with Load, but however such effect is
very rare in Hysteresis control. Torque ripple produced by Hysteresis control is the
minimum among all the calculations for Voltage Pulse.

70
4.2 Simulation of 8/6 SRM
This motor has four phases and eight stator poles, while six rotor poles. The
phases are independent from each and are similar to other but are only
mechanically shifted from each other for an angle called Step angle or
transition angle given by:
sr
SNN
112
The Step angle was calculated to be 15 degrees. Each phase of the motor needs to
be energized at least once in order to move the rotor by 60 degrees, thus in
order to complete one revolution of the motor, each phase has to be energized
6 times. (60*6=360). The complete simulation of the 8/6 SRM is given in
following figure.
Figure 42: Complete Simulation Model of 8/6 SRM

71
As can be observed, the simulation is similar to 6/4 SRM, with the addition of one
more phase. Each phase is fed back with the input of Position of the rotor and the
reference current that is used for the hysteresis purposes. Each phase produces torque
pulse, which are added together to make total torque of motor. The output of total
torque, speed and position is measured and displayed using scope. Further the outputs
like phase current, phase inductance, phase flux as well as phase voltages are
calculated and obtained using Scope in SIMULINK.
In order to have insight of the phases of 8/6 SRM, one can refer to simulation of 6/4
SRM, since phases are simulated with similar methods. However there are some
changes in the simulation which are discussed below:
Modulo block in each phase is no longer Modulo Pi/2, instead since the
phases have to be energized after every 60 degrees, thus it is modulo pi/3
block now.
For each phase shift we will use the following equation. In order to implement
the phase shifts we have modified the Modulo block of each phase.
sinshift )1( Where n=Nr =4 and i = 1,2,3,4
Thus For
I=1 Phase shift = s2
I =2 phase shift = s
I=3 phase shift = ,
I =4 phase shift = s
Also the inductance profile will be different for 8/6 motor, since the thetas ( 1
2 3 4 and 5 ) would be different from that of 6/4 Motor. The details of
which could be found in Appendix II

72
4.2.1 Simulation of 8/6 motor with Single Pulse Voltage technique with little LOAD
Initially we choose on = 5 and off = 18 and we keep rotor and stator arcs equal
i.e. osr 15 . The values of on and off are chosen randomly to check the
performance of motor. It should be kept in mind that since the Aligned Inductance is
at 030 hence we will always keep the off less than that value in order for
current to reduce to zero before inductance starts to decrease again and produces
negative torque.
Following graphs are obtained with the simulation of the motor when Load Tl= 1Nm
is applied.
Figure 43: Output of Total Torque, Speed and rotation of 8/6 Motor with little load
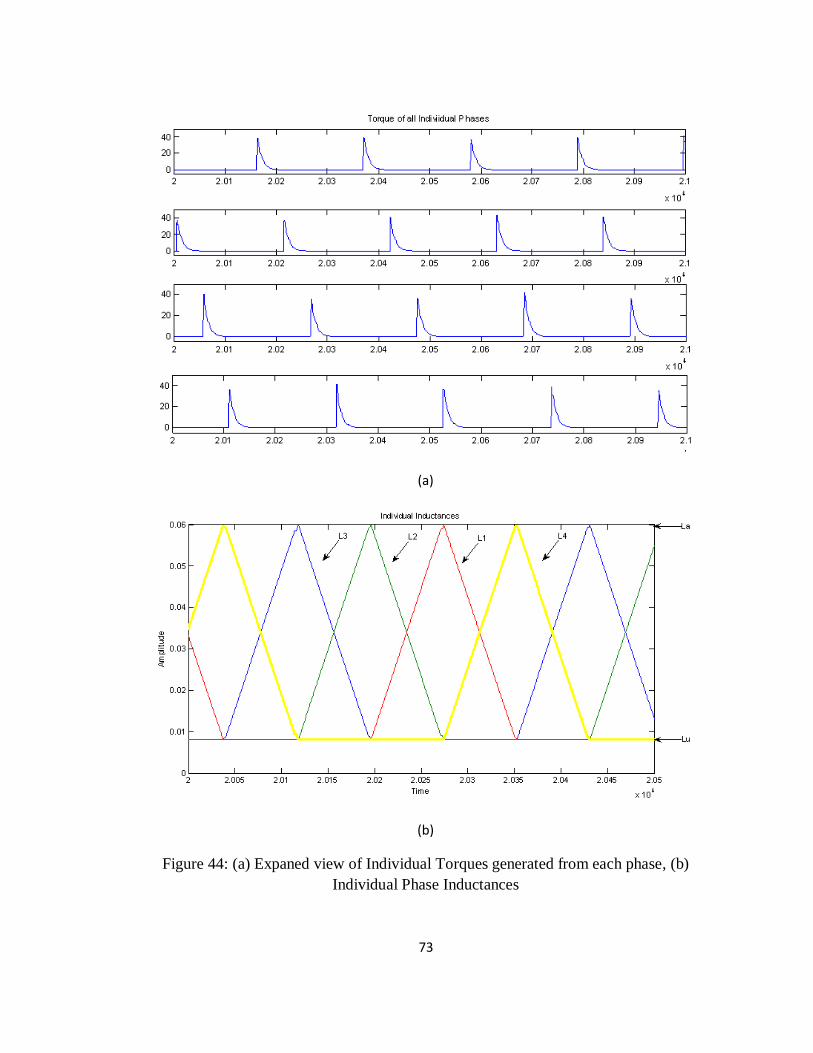
73
(a)
(b)
Figure 44: (a) Expaned view of Individual Torques generated from each phase, (b)
Individual Phase Inductances

74
(a)
(b)
Figure 45: (a) Expanded view of Indivudal Voltage Pulses Applied, (b) Voltage
Pulses, Phase Inductances and Phase Currents produced

75
Interpretation of Graphs
In figure 43, it is demonstrated that Maximum torque of 40 N.m, Mean torque of
7.2128 N.m and speed of 2630 rev/min is produced with load of Tl= 1Nm. The SRM
simulation using its linear model needs to consider the initial rotor position. If the
rotor is at the region where inducatance has the constant value, then no torque will be
produced. Hence if the load torque is zero, machine will be halted for all the time. In
our simulation, we have not assigned any initial rotor position, however we have
given the load of Tl = 1Nm, through which machine starts to rotate.
In figure 44 (a), the torques of individual phases are plotted, where it can be seen that
each torque pulse is displaced 15 degrees from other due to the mechanical
displacement in the three phases. Inductance profile of each phase is plotted in figure
44 (b), where the phase shift is also clear to be 15 degrees from each other. The
inductance starts from the minimum inductance of Lu and increases to maximum
inductance of La. For osr 15 , the values for different thetas are given below:
151 302 303 454 605
In figure 45(a), the voltage pulses are shown. These pulses are the output of the
converter, implemented with the help of ‗if else‘ blocks in SIMULINK. As can be
seen, the converter supplies V=280 for the dwell angle of 13 degrees, and then
V= -280 for the angle of 22 degrees and finally zero for the other time. The values
chosen for the on and off are good enough since no negative torque is produced.
Finally the current of all the phases is plotted in figure 45(b) to show the maximum
current of motor which is almost 20 A.

76
4.2.2 Simulations with varied on and off and variable Load
In this section, different values of theta-on and theta-off are selected and the motor is
simulated with load of 1Nm. The values for the average torque, maximum starting
torque, operating speed, and torque ripple are calculated and tabulated in the table.
The purpose of doing this analysis is to find out the optimum theta-on and theta-off,
producing most desirable results. The motor also produces negative torque for some
of the values of theta, which are also mentioned in the table.
Table 15: Turn on and Turn off angle Analysis with load Tl= 1Nm
Average
torque
(Nm)
Normal
speed
(rev/min)
Torque
Ripple (%)
Negative
Torque
Ton = 5 Toff = 18 7.2128 2630 593.47 No
Ton = 10 Toff = 20 5.0185 1920 473.5 No
Ton =10 Toff= 25 5.5761 2200 228.25 No
Ton = 0 Toff = 25 Unstable Unstable Unstable Yes
Ton =5 Toff = 25 ---- 3700 ---- Yes
Table 16: Turn on and Turn off angle Analysis with load Tl= 5Nm
Average
torque
(Nm)
Normal
speed
(rev/min)
Torque
Ripple (%)
Negative
Torque
Ton = 5 Toff = 18 10.4103 2100 558.06 No
Ton = 10 Toff = 20 7.9437 1500 420.58 No
Ton =10 Toff= 25 8.8106 1700 240.87 No
Through these simulations we have found out that, at on =10 and off =25 degrees
produce the best result in terms of mean torque and torque ripple with no negative
torque. The rated nominal torque of the motor is calculated to be 35 Nm.
If these calculations are compared with that of 6/4 motor, we will find that, we have
managed to achieve higher mean torque, higher speeds and low oscillations as well as
higher rated torque with almost equal torque ripples.
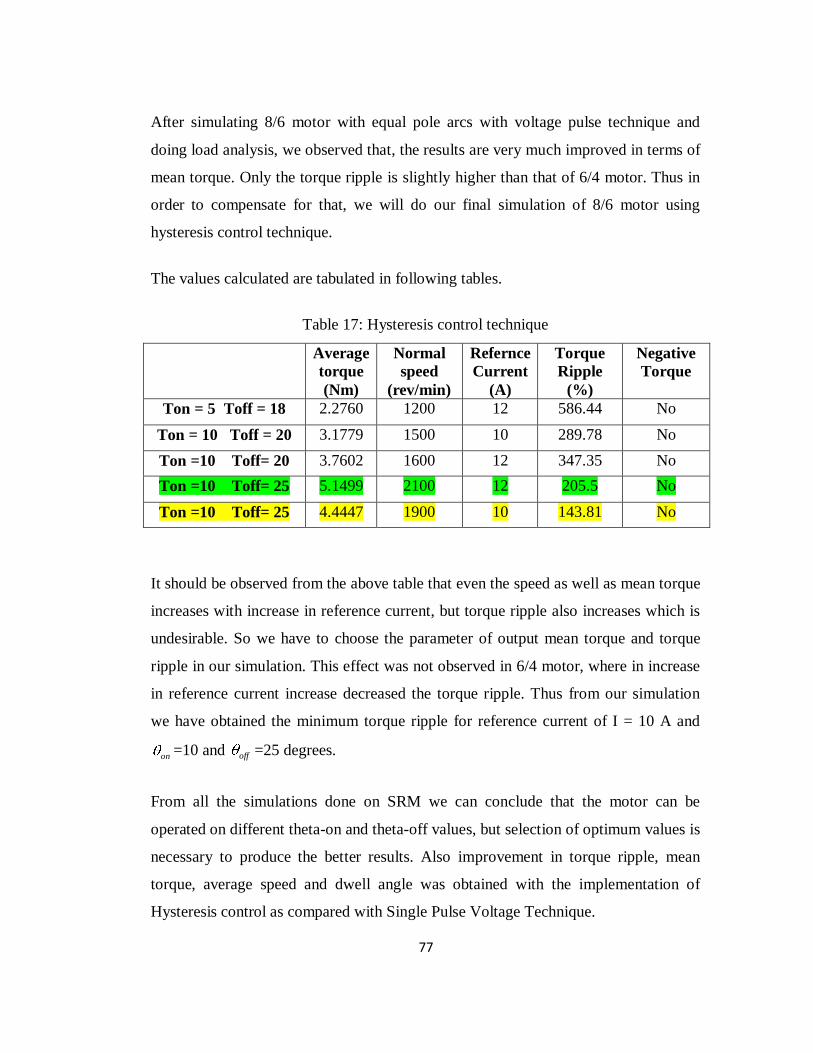
77
After simulating 8/6 motor with equal pole arcs with voltage pulse technique and
doing load analysis, we observed that, the results are very much improved in terms of
mean torque. Only the torque ripple is slightly higher than that of 6/4 motor. Thus in
order to compensate for that, we will do our final simulation of 8/6 motor using
hysteresis control technique.
The values calculated are tabulated in following tables.
Table 17: Hysteresis control technique
Average
torque
(Nm)
Normal
speed
(rev/min)
Refernce
Current
(A)
Torque
Ripple
(%)
Negative
Torque
Ton = 5 Toff = 18 2.2760 1200 12 586.44 No
Ton = 10 Toff = 20 3.1779 1500 10 289.78 No
Ton =10 Toff= 20 3.7602 1600 12 347.35 No
Ton =10 Toff= 25 5.1499 2100 12 205.5 No
Ton =10 Toff= 25 4.4447 1900 10 143.81 No
It should be observed from the above table that even the speed as well as mean torque
increases with increase in reference current, but torque ripple also increases which is
undesirable. So we have to choose the parameter of output mean torque and torque
ripple in our simulation. This effect was not observed in 6/4 motor, where in increase
in reference current increase decreased the torque ripple. Thus from our simulation
we have obtained the minimum torque ripple for reference current of I = 10 A and
on =10 and off =25 degrees.
From all the simulations done on SRM we can conclude that the motor can be
operated on different theta-on and theta-off values, but selection of optimum values is
necessary to produce the better results. Also improvement in torque ripple, mean
torque, average speed and dwell angle was obtained with the implementation of
Hysteresis control as compared with Single Pulse Voltage Technique.

78
Some of the results for Hysteresis control for 8/6 SRM are plotted here:
Figure 46: Hysteresis control of SRM

79
CHAPTER 5
CONCLUSION AND RECOMMENDATIONS
5.1 Conclusion
In this project the author went through organized set of stages to reach his
desired results starting from literature review and study of various techniques that
have been used for the improvement of the performance of the Switched Reluctance
Motor. SRM offer some advantages along with potential low cost, for example, they
can be very reliable machines since each phase of the SRM is largely independent
physically, magnetically, and electrically from the other motor phases. Also, because
of the lack of conductors or magnets on the rotor, very high speeds can be achieved,
relative to comparable motors. SRM have some disadvantages like they are difficult
to control, they are noisy and they have more torque ripple than other types of
motors. But the performance can be improved with better understanding of SRM
mechanical design and the development of algorithms that can compensate for these
problems.
SRM is simulated and observed using the Library model available in
MATLAB to produce the torque and speed. It was observed that the Torque Produced
has many ripples and they degrade the performance of Motor.
Later Switched Reluctance Motor was simulated in SIMULINK with two
different configuration i.e. 6/4 and 8/6. The control techniques of Single Pulse and
Hysteresis control were implemented on motor and parameters like Mean torque,
operating speed and torque ripple were calculated and plotted.

80
Finally, optimum values of turn-on and turn-off thetas were calculated with load and
without load and the best results with highest mean torque and lowest torque ripple
were obtained. Torque Ripple was decreased considerably after the implementation of
Hysteresis Control, also there was increase in mean torque, speed and dwell angle for
the SRM
5.2 Recommendations
This project and thesis can help to understand the working of the Switched
Reluctance Motor and understand its various configurations. It also covers the control
modeling of SRM using Simulink, which could be understood and implemented. The
control techniques have improved the torque ripple considerably, but in order to
further improve the performance, other techniques like Bacteria Foraging Algorithm
can be applied. BFA is a genetic algorithm, which have been used widely to optimize
the performance of different processes.

81
REFERENCES
[1] Mehran Rashidi, Farzan Rashidi, Mohammad Hossein Aghdaei, & Hamid
Monavar “Speed Control and Torque Ripple Minimization in Switch
Reluctance Motors using Context based Brain Emotional learning” M.G h.
Negoita et al. (Eds.): KES 2004, LNAI 3215, pp. 278–284, 2004.
[2] Majid Hajatipour a, Mohammad Farrokhi a,b,* “Adaptive intelligent speed
control of switched reluctance motors with torque ripple reduction” accepted
29 September 2007 by Energy Conversion and Management.
[3] Aras Sheikhi, Hashem Oraee, Shahriyar Kaboli, Mohammadreza Dorkhah, “A
new configuration of Switched Reluctance Motor for reducing the torque
ripple”.
[4] Nihat Inanc “Phase current modulation of switched reluctance motor to
minimize torque ripple” accepted 16 October 2001 by Electric Power Systems
Research.
[5] Michael T. DiRenzo “Switched Reluctance Motor Control – Basic Operation
And Example Using The Tms320f240” Application Report SPRA420A -
February 2000, published by Texas Instruments
[6] T. Datta and I. S. Misra , B. B. Mangaraj, S. Imtiaj “Improved Adaptive
Bacteria Foraging Algorithm In Optimization Of Antenna Array For Faster
Convergence” Progress In Electromagnetics Research C, Vol. 1, 143–157,
2008
[7] A.Anuradha ―Analysis of Dynamic Charactersistics of Switched Reluctance
Motor based on MATLAB/SIMULINK‖
[8] Reston Condit (Microchip Technology Inc.), Dr. Douglas W. Jones (University
of Iowa) ―Stepping Motor Fundamentals‖, 2004 Microchip Technology Inc.
[9] Kevin M. Passino “Biomimicry of Bacterial Foraging for Distributed
Optimization and Control” IEEE Control Systems Magazine, June 2002
[10] H. Berg, “Motile behavior of bacteria,” Phys. Today, pp. 24-29, Jan. 2000.
82
[11] Vikas S. Wadnerkar, Dr. G. TulasiRam Das, Dr. A.D. Rajkumar, ―Performance
analysis of Switched Reluctance Motor; Design, modeling and simulation of
8/6 SRM‖ Journal of Theoretical and Applied Information Technology, 2005 -
2008 JATIT.
[12] P. J. Lawrenson, J. M. Stephenson, P. T. Blenkinsop, J. Corda and N. N.Fulton,
―Variable-speed switched reluctance motors,‖ IEE Proceedings Part-B, Vol.
127, No. 4, July 1980, pp. 253-265.
[13] F. Soares P. J. Costa Branco Instituto Superior T´ecnico Portugal ―Simulation
of a 6/4 Switched Reluctance Motor based on MATLAB/SIMULINK
environment‖
[14] Implementation of a Current Controlled Switched Reluctance motor using
TMS320F240, application report: SPRA 282.
[15] N.J. Nagel and R.D. Lorenz ‖ Modeling of a Saturated Switched Reluctance
Motor Using an Operating Point Analysis and the Unsaturated Torque
Equation‖, In Proc. Of IEEE, IAS Annual Conf., Oct. 3-7, 1999, Phoenix, pp.
2219-2226.
[16] Shoujun Song & Weiguo Liu School of Automation, Northwestern
Polytechnical University ―A Comparative Study on Modeling Methods for
Switched Reluctance Machines‖ Vol. 3, No. 2; May 2010.
[17] Ercument Karakas1,∗ and SONER VARDARBASI2 ―Speed control of SR
motor by self-tuning fuzzy PI controller with artificial neural network‖
S¯adhan¯a Vol. 32, Part 5, October 2007, pp. 587–596. © Printed in India
[18] P. Brandstetter, R. Hrbac, M. Polak, L. Stepanec ―Application Of Fuzzy Logic
In Control Of Switched Reluctance Motor‖ Advances in Electrical and
Electronic Engineering
[19] X. D. Xue, K. W. E. Cheng, J. K. Lin, Z. Zhang,K. F. Luk, T. W. Ng, and N.
C. Cheung ―Optimal Control Method of Motoring Operation for SRM Drives
in Electric Vehicles‖ IEEE Transactions on vehicular technology, vol. 59, no.
3, march 2010

83
APPENDIX I
Project Gantt Chart
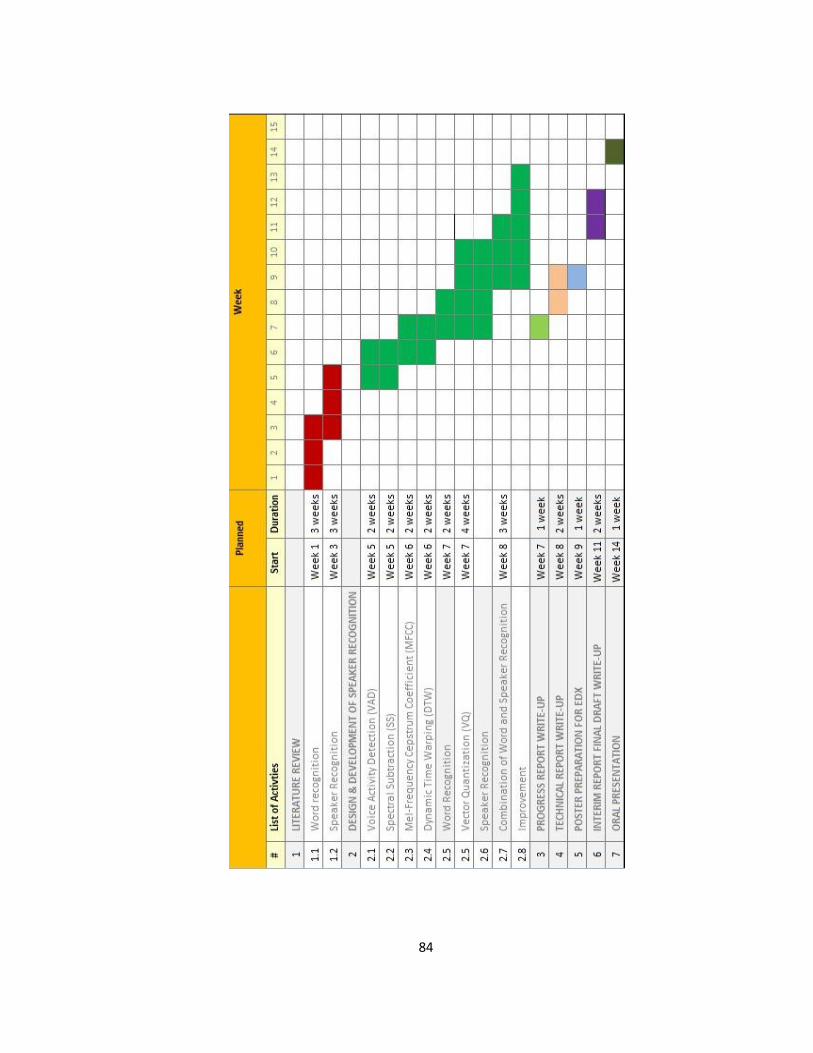
84

85
APPENDIX II
Simulation Initializations

86
Initialization for 6/4 motor with equal betas
NS=6 ; %No. of Stator Poles NR=4 ; %No. of Rotor Poles P=3;
BETAS = 30*(pi/180); % angle of the arc of stator BETAR = 30*(pi/180); %angle of the arc of rotor TETAS = (2*pi)*((1/NR)-(1/NS)); % Step angle per transition %%%%%%%%%%%%%%%%%%%%%%%%%%%%%%%%%%%%%%%%%%%%%%%% TETAX = (pi/NR)-((BETAR+BETAS)/2); % tetax = 15 degrees TETAY = (pi/NR)-((BETAR-BETAS)/2); % tetay = 45 degrees TETAZ = (BETAR-BETAS)/2; TETAXY=(TETAY+TETAZ+TETAS); %%%%%%%%%%%%%%%%%%%%%%%%%%%% TETA1= 15*(pi/180); TETA2= 45*(pi/180); TETA3= 45*(pi/180); TETA4= 75*(pi/180); TETA5= 90*(pi/180); %%%%%%%%%%%%%%%%%%%%%%%%%%%%%% TETAON = 10* (pi/180); TETAOFF = 37* (pi/180); TETAQ = 60* (pi/180); %%%%%%%%%%%%%%%%%%%%%%%%%%%%%% TETAIN = 20.1* (pi/180); %Initial Rotor Position V=150; %applied voltage R=1.30; %Resistance of motor J=0.0013; %Moment of Inertia F=0.0183; %Frictional Coefficient DELTAI = 0.5; % change in current LMIN = 8e-3; %Minimum Inducatance LMAX = 60e-3; %Maximum Inducatance
G= (inv([TETAX 1;TETAY 1]))*([LMIN;LMAX]); AUP= G(1); BUP =G(2);
H=(inv([(TETAY+TETAZ) 1; TETAXY 1]))*([LMAX;LMIN]); ADOWN=H(1); BDOWN=H(2);
DL=AUP;
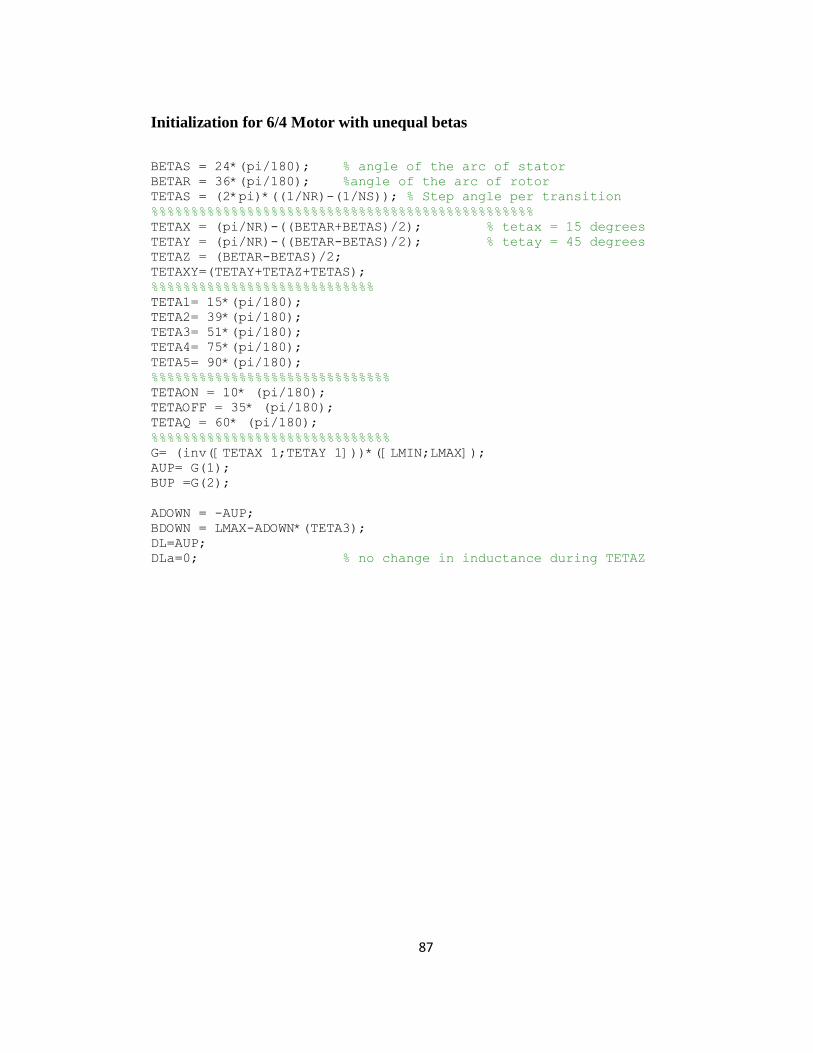
87
Initialization for 6/4 Motor with unequal betas
BETAS = 24*(pi/180); % angle of the arc of stator BETAR = 36*(pi/180); %angle of the arc of rotor
TETAS = (2*pi)*((1/NR)-(1/NS)); % Step angle per transition %%%%%%%%%%%%%%%%%%%%%%%%%%%%%%%%%%%%%%%%%%%%%%%% TETAX = (pi/NR)-((BETAR+BETAS)/2); % tetax = 15 degrees TETAY = (pi/NR)-((BETAR-BETAS)/2); % tetay = 45 degrees TETAZ = (BETAR-BETAS)/2; TETAXY=(TETAY+TETAZ+TETAS); %%%%%%%%%%%%%%%%%%%%%%%%%%%% TETA1= 15*(pi/180); TETA2= 39*(pi/180); TETA3= 51*(pi/180); TETA4= 75*(pi/180); TETA5= 90*(pi/180); %%%%%%%%%%%%%%%%%%%%%%%%%%%%%% TETAON = 10* (pi/180); TETAOFF = 35* (pi/180); TETAQ = 60* (pi/180); %%%%%%%%%%%%%%%%%%%%%%%%%%%%%% G= (inv([TETAX 1;TETAY 1]))*([LMIN;LMAX]); AUP= G(1); BUP =G(2);
ADOWN = -AUP; BDOWN = LMAX-ADOWN*(TETA3); DL=AUP; DLa=0; % no change in inductance during TETAZ

88
Initialization for 8/6 Motor with equal betas
NS=8; %No. of Stator Poles NR=6; %No. of Rotor Poles P=4;
TETAX = (pi/NR)-((BETAR+BETAS)/2) ;% tetax = 15 degrees TETAY = (pi/NR)-((BETAR-BETAS)/2); % tetay = 45 degrees TETAZ = (BETAR-BETAS)/2; %TETAXY=(TETAY+TETAS) ; TETAXY=(TETAY+TETAZ+TETAS); %%%%%%%%%%%%%%%%%%%%%%%%%%%% BETAS = 15*(pi/180); % angle of the arc of stator
BETAR = 15*(pi/180); %angle of the arc of rotor
TETAS = (2*pi)*((1/NR)-(1/NS)); % Step angle per transition
%%%%%%%%%%%%%%%%%%%%%%%%%%%%% TETA1= 15*(pi/180); TETA2= 30*(pi/180); TETA3= 30*(pi/180); TETA4= 45*(pi/180); TETA5= 60*(pi/180); %%%%%%%%%%%%%%%%%%%%%%%%%%%%%% TETAON = 5* (pi/180); TETAOFF = 18* (pi/180); TETAQ = 40* (pi/180); %%%%%%%%%%%%%%%%%%%%%%%%%%%%%% TETAIN = 20.1* (pi/180); %Initial Rotor Position V=280; ;%applied voltage R=1.30; %Resistance of motor J=0.0013; %Moment of Inertia F=0.0183; %Frictional Coefficient LMIN = 8e-3; %Minimum Inducatance LMAX = 60e-3; %Maximum Inducatance
G= (inv([TETAX 1;TETAY 1]))*([LMIN;LMAX]); AUP= G(1); %Slope furing Uprising of inductance BUP =G(2); H=(inv([(TETAY+TETAZ) 1; TETAXY 1]))*([LMAX;LMIN]); ADOWN=H(1); %Slope during decline of Inductance BDOWN=H(2); DL=AUP;