Effect of Cyclosporine on Left Ventricular Remodeling After Reperfused Myocardial Infarction
Upload
independentCategory
view
1download
0
Modeling and simulation of speed selection on left ventricularassist devices
Alexandros T. Tzallas a,b, Nikolaos S. Katertsidis a,b, Evaggelos C. Karvounis a,b,Markos G. Tsipouras a,b, George Rigas a,b, Yorgos Goletsis a,c, Krzysztof Zielinski d,Libera Fresiello d,e,f, Arianna Di Molfetta e,f, Gianfranco Ferrari e,f, John V. Terrovitis g,Maria Giovanna Trivella e,f, Dimitrios I. Fotiadis a,b,n
a Biomedical Research Institute-FORTH, GR 45110 Ioannina, Greeceb Unit of Medical Technology and Intelligent Information Systems, Dept. of Material Science and Engineering, University of Ioannina, PO Box 1186, GR 45110Ioannina, Greecec Department of Economics, University of Ioannina, GR 45110 Ioannina, Greeced Nalecz Institute of Biocybernetics and Biomedical Engineering, PAS, Ks. Trojdena 4, 02109 Warsaw, Polande Institute of Clinical Physiology, Section of Pisa, CNR, Via Moruzzi 1 Area di Ricerca San Cataldo, 56124 Pisa, Italyf Institute of Clinical Physiology, Section of Rome, CNR, Via San Martino della Battaglia 44, 00185 Rome, Italyg 3rd Cardiology Department, School of Medicine, University of Athens, Athens, Greece
a r t i c l e i n f o
Article history:Received 13 January 2014Accepted 16 April 2014
Keywords:Heart failureVentricular assist deviceSpeed selectionSuction detectionGaussian mixture model
a b s t r a c t
The control problem for LVADs is to set pump speed such that cardiac output and pressure perfusion arewithin acceptable physiological ranges. However, current technology of LVADs cannot provide for aclosed-loop control scheme that can make adjustments based on the patient’s level of activity. In thiscontext, the SensorART Speed Selection Module (SSM) integrates various hardware and softwarecomponents in order to improve the quality of the patients’ treatment and the workflow of thespecialists. It enables specialists to better understand the patient–device interactions, and improve theirknowledge. The SensorART SSM includes two tools of the Specialist Decision Support System (SDSS);namely the Suction Detection Tool and the Speed Selection Tool. A VAD Heart Simulation Platform(VHSP) is also part of the system. The VHSP enables specialists to simulate the behavior of a patient'scirculatory system, using different LVAD types and functional parameters. The SDSS is a web-basedapplication that offers specialists with a plethora of tools for monitoring, designing the best therapyplan, analyzing data, extracting new knowledge and making informative decisions. In this paper, two ofthese tools, the Suction Detection Tool and Speed Selection Tool are presented. The former allows theanalysis of the simulations sessions from the VHSP and the identification of issues related to suctionphenomenon with high accuracy 93%. The latter provides the specialists with a powerful support in theirattempt to effectively plan the treatment strategy. It allows them to draw conclusions about the mostappropriate pump speed settings. Preliminary assessments connecting the Suction Detection Tool to theVHSP are presented in this paper.
& 2014 Elsevier Ltd. All rights reserved.
1. Introduction
Heart failure (HF) is affecting millions of people in WesternCountries every year, and is characterized by impaired ventricularperformance, exercise intolerance, and shortened life expectancy.Despite significant advancements in drug therapy, mortality of the
disease remains excessively high, as heart transplantation is theonly accepted method to treat severe cases. Unfortunately, hearttransplantation is limited by the number of donor organs, andtherefore Left Ventricular Assist Device (LVAD) support is nowa-days considered an alternative for many cases of end-stage heartfailure [1]. In addition, two other roles have recently appeared:“bridge to recovery” and “destination therapy”which guarantee anacceptable quality of life.
As the patient recovers and his level of activity increases, thebody’s demand for cardiac output increases. The control problemfor LVADs is to set the pump speed such that cardiac output (pump
Contents lists available at ScienceDirect
journal homepage: www.elsevier.com/locate/cbm
Computers in Biology and Medicine
http://dx.doi.org/10.1016/j.compbiomed.2014.04.0130010-4825/& 2014 Elsevier Ltd. All rights reserved.
n Corresponding author at: Unit of Medical Technology and Intelligent Informa-tion Systems, Dept. of Material Science and Engineering, University of Ioannina,GR 45110 Ioannina, Greece. Tel.: þ30 26510 08803; fax: þ30 26510 07092.
E-mail address: [email protected] (D.I. Fotiadis).
Computers in Biology and Medicine 51 (2014) 128–139

flow) and pressure perfusion are within acceptable physiologicalranges. Care must be taken to ensure that the speed is not set toohigh or too low. A speed that is too high can create negativepressure in the ventricle, i.e. suction. If the speed is too slow, theunloading of the left ventricle may be insufficient. Left Ventricular(LV) filling pressure and pulmonary artery pressure will remainhigh, cardiac output could be too low, and the patient willprobably experience persistent heart failure symptoms. Becauseof the limited available information, specific methods have beendeveloped for determining an optimal pump speed based on thecharacteristics of the pump motor (e.g. current, voltage, andspeed) [2–5]. In addition, similar methods try to infer the hemo-dynamic and circulatory parameters of a patient and consequentlythe pump speed without the use of implantable sensors [6–8].However, these estimations and methods are reliable only in arelatively narrow range of pump parameters. In addition, a solu-tion to maximize cardiac output while operating the pump at asafe speed is to operate the pump at a speed just below suction.The drawback to this solution is that a pump speed that does notcause suction may still have adverse effects on other physiologicalparameters [2].
Furthermore, other approaches have been developed thatprovide control of the pump speed based on a safe or optimalrange of a certain systemic vascular resistance (SVR) [6–10].However, these may cause suction phenomena, if the SVR variesdue to changes in the physiological state of the patient. In addition,other parameters such as the heart rate have been employed ascontrol input. As one part of the circulation regulatory system, theheart rate is an indicator of blood flow demand of the body.However, heart failure patients may suffer from brady- or tachyarrhythmias, their heart rate (HR) may be induced by permanentpacing, and the majority of them are taking beta-adrenergicreceptor blockers [11]. All these factors make the relationshipbetween changes in HR and changes in cardiac output require-ments for adaptation to exercise, less predictable and consistent.In the provided experiment, the controller adjusted the pumpspeed in response to increasing or decreasing heart rate in a linearrelationship. However, this method does not take into account thechange in SVR. From rest to exercise, there is a dramatic decreasein SVR accompanying the increase in heart rate. For the case ofheart failure where the heart is not pumping effectively, thechange in SVR is a major mechanism to generate the desiredcardiac output. In addition, an improved method was presented in[12] that incorporates the HR and the SVR, and responds to thephysiological changes of the body instantaneously based on thebaroreflex, the built in cardiovascular regulation system. The HRwas inferred from pump current and the systemic vascularresistance was estimated from blood flow and blood pressure. In[13] the constraints on cardiac output, left atrial pressure, andarterial pressure are presented. A penalty function is assigned toeach hemodynamic variable, and a mathematical model of theLVAD and cardiovascular system is used to map the penaltyfunctions as functions of the hemodynamic parameters, to penaltyfunctions as functions of the pump speed. Forming a weightedsum, the penalties for the different variables are combined andthe best set of pump speeds is determined by minimizing thecombined penalty functions using different sets of weights. Theresulting set of best pump speeds forms the Non-Inferior Set (NIS).
In this context, the SensorART Speed Selection Module (SSM)provides a set of valuable tools to the specialists in order toinvestigate important hemodynamic variables and dynamicallychanging circulatory parameters that impose particular difficultiesin the control problem of LVADs and the determination of anoptimal operation. In a critical care setting, the desired operatingpoint of the LVAD may be determined by a specialist or technicalpersonnel and is adjusted to provide more or less cardiac output
depending on the status of the patient. However, when the patientleaves the critical care setting a clinician is no longer readilyavailable, and the device must provide adequate cardiac output tosustain the patient's level of activity without clinical supervision.Particular care has to be taken to ensure that the speed is not settoo high (creating suction) or too low (causing blood to flow backinto the pump). Thus, the SensorART SSM incorporates differenthardware and software components in order to enable specialiststo better understand the patient–device interactions, and safelyexplore new knowledge. The VAD Heart Simulation Platform(VHSP) allows specialists to create different simulation sessionsbased on a patient's hemodynamic condition to be reproduced.The main novelty of the proposed study is the development of anew integrated solution consisting of hardware and software toolsfor building up and processing circulatory models according to theneeds of patient who suffer from heart failure. It is a first attemptto gain insight into heart assist problems in order to improve thequality of the patients’ treatment and the workflow of thespecialists. It will be eventually enable specialists to better under-stand the patient–device interactions, and improve their knowl-edge about this process. The suction schema is based on hybridand numerical simulator with main focus on Circulite pump.Certainly, the validation of the suction detection module is notcomplete and does not cover all the possibilities of suction ingeneral, but the present study is a first attempt in evaluating thesuction detection module in specific condition and then to test theoverall behavior of it in the speed selection tool.
2. Materials and methods
The SensorART SSM consists of an integrated hardware and soft-ware solution for building up and processing circulatory modelsaccording to the user needs-specially when heart assist simulationproblems are concerned. It consists of three components (Fig. 1):
� the VAD Heart Simulation Platform,� the Speed Selection Tool and� the Suction Detection Tool.
2.1. VAD heart simulation platform
The VAD Heart Simulation Platform (VHSP) is a representation ofthe cardiovascular system. It can be both a computational standalonesimulator, or a hybrid (numerical-hydraulic) simulator. The computa-tional simulator is made by a cardiovascular model plus a numericalrepresentation of the VAD. It is a tool devoted to clinical environment,therefore it can be run on a laptop with a low execution time.
The hybrid simulator is an extended and more powerful version ofthe computational simulator. It shares the same cardiovascular modelbut in addition it includes also an hydraulic module. In comparison tothe computational simulator, the hybrid simulator permits the user tophysically connect and test a real VAD in real time.
2.1.1. Computational simulatorThe computational simulator is based on a lumped parameter
model providing the representation of the following circulatorybranches: ascending and descending aorta, systemic circulation (splitinto upper body, kidneys, abdomen and lower limbs), superior andinferior vena cava and pulmonary circulation [14,15]. Left and rightatria are reproduced by two compliances, left and right ventricles arerepresented according to the time varying elastance model [16–18].The numerical simulator has some additional modules that can beactivated if needed: baroreflex control, liquid infusion module,interventricular septum representation, ECG activity, etc.
A.T. Tzallas et al. / Computers in Biology and Medicine 51 (2014) 128–139 129

A dedicated module was developed for the simulation ofdifferent pathologies that usually affect patients assisted by aleft ventricular assist device as: ischemic/dilated/hypertrophiccardiomyopathy, right heart failure, interventricular septum fail-ure, aortic regurgitation, aortic stenosis, atherosclerosis, systemichypertension, pulmonary hypertension. Each of these pathologies(or a combination of them) as well as a level of severity can beselected on demand on the simulator by means of a dedicated userinterface. The hemodynamics resulting from the selected physio-pathological condition, in terms of pressure, flow and volumewaveforms can be plotted and saved for further processing.
In addition, a separate module is devoted to the representationof LVAD as CircuLite’s Synergy Micropump, HeartWare [19] andHeartMate II. For the present application the CircuLite's SynergyMicropump was used. The pump model provides the representa-tion of the relationship between pressure drop across the pumpand the flow provided for different rotational speeds (from 20,000to 30,000 rpm). The pump model is connected to the cardiovas-cular simulator by means of an inflow and an outflow cannula(represented as RLC circuits), one placed in the left atrium and theother in the ascending aorta.
A specific effort was devoted to the reproduction of suction eventsoccurring at the inflow cannula. If pressure in the left atrium drops,because of a low venous return or because of an excessive pump blooddrainage, suction may occur between the inflow cannula and the atrialwall. To reproduce such phenomenon the left atriumwas representedas follows: for positive values of transmural pressure the left atriumbehaves as a passive compliance, for negative values of transmuralpressure, the pressure–volume relationship of the atrium is describedby an asymptotic curve. If the left atrial pressure drops, the inflowcannula resistance progressively increases to simulate the adhesion ofthe tip to the atrial wall. As a consequence, the pressure drop acrossthe pump increases and the blood provided by the assist device isreduced. The validation of the computational model was previouslyconducted using clinical data as reported in [17–19].
2.1.2. Hybrid simulatorThe hybrid simulator includes the computational model described
above with the exception of the pump models as in this case the realpump can be connected directly to the simulator itself. The hybridsimulator is composed of four impedance transformers as illustratedin Fig. 2. Each impedance transformer is devoted to the real timeconnection between the computational and the hydraulic parts, infour different sites of the cardiovascular model. Four gear pumps areassembled with servomotors and tacho-generators, rigidly fixed to thestiff rod being part of the set-up rack. On the same rack two hydraulicblocks are elastically suspended: a fluid tank and a four-chamberhydraulic section devoted to four impedance transformers. Pressuresensors are mounted in the middle of the bottom of each chamber.A system of chamber openings makes possible connecting the physicalLVADs and hydro-pneumatic capacitors as well [18–20]. As in thispaper the Circulite Synergy Micropump was studied, two of the fourimpedance transformers were used, one for the real time connectionwith the left atrium and one for the real time connection with theascending aorta [14].The connection between the hydraulic and thecomputational parts was arranged by two computer modules: a “real-time” module governing time critical functionalities (for acquisition,control and equation solving operations), and a “host” computerplaying the role of the User Interface (data presentations, setting thecirculatory model parameters, etc.). The validation of the hybridsimulator was performed using experimental data as reported in [14].
2.2. Speed selection tool
The Speed Selection Tool is a web-based component of theSensorART SDSS, and part of the SensorART SSM. It is availablethrough a standard web browser, and proposes adjustments topump speed settings, according to the required cardiac output andpressure perfusion.
Setting the pump speed of the VAD is an important parameter inorder to ensure the patient’s quality of life. The Speed Selection Tool
Fig. 1. The Architecture of SensorART Speed Selection Module (SSM) which consists of two main modules: the VAD Heart Simulation Platform (VHSP) and two tools of theSpecialist Decision Support System (SDSS): the Speed Selection Tool and the Suction Detection Tool.
A.T. Tzallas et al. / Computers in Biology and Medicine 51 (2014) 128–139130

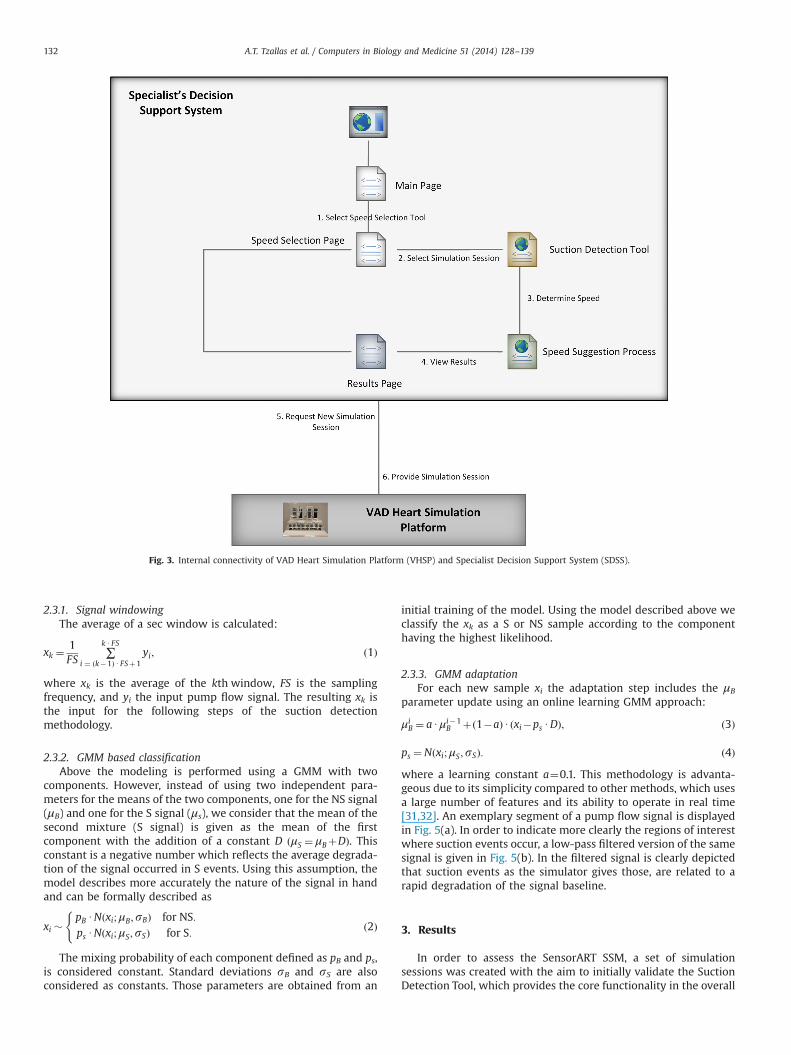
allows for the submission of simulation parameters to the VHSP, theinvestigation of the potential effect on important hemodynamicvariables (such as cardiac output and arterial pressure), and theprocessing of the resulting simulation sessions (Fig. 3). Througha set of web services, the availability of the VHSP is established, andrequests for simulation sessions can be submitted. Each request isspecified through a set of predefined variables. The dataset iscomposed of cardiac and circulatory variables, and other parameterswhich are important to obtain the specific object’s patho-physio-logical condition (Table 1).
The output data (simulation data produced by VHSP) which arealso continuously recorded with rate 500 samples/s rate andduration up to half an hour, are as follows:
� Left atrial pressure (PCWP) (mmHg).� Left ventricular pressure (mmHg).� Aortic pressure (BP) (mmHg).� VAD flow (l/min) – measured by an external flow meter or by
the VHSP.� Heart rate (l/min).� Total cardiac output (l/min).� Pump speed in RPM.
The speed selection process is based on the flow chart given inFig. 4 which has been introduced by specialists. It depends on thesuccessful determination of suction events, and the calculation ofan optimal speed based on the optimal cardiac output.
2.3. Suction detection tool
The Suction Detection Tool is the main component of theSensorART SSM. An important challenge facing the increased use ofLVADs is the efficient adjustment of the pump flow by regulating thepump speed in order to meet the body requirements for cardiacoutput and mean arterial pressure. One important limitation is the
need to insure that the pump is rotated at a speed below a thresholdbeyond which the pump attempts to draw more blood from the leftventricle than available causing a suction phenomenon. It may causecollapse of the ventricle, it is dangerous and needs to be detected andcorrected by lowering the pump speed. Hence, suction detection is avery important issue in the control of LVADs. To achieve this, acommon task is to design a suction detection algorithm extractingsome features from available related signals such as pump flow,pump speed, or pump current signals. One major issue whendesigning a suction detection algorithm is the determination of thepump states. The specialists usually define pump states (or suctionstates). The use of two states, Suction (S) and Non Suction (NS) is acommon approach adopted in the literature [20–22]. However,several approaches that have used three or five suction states arealso reported [20,23,24]. The suction detection problem can besimply transferred to the detection of the presence of suction eventsin the available related signals such as pump flow or pump currentsignals with high sensitivity and specificity. Numerous approacheshave been proposed to address this issue [5,20–29] following twocommon stages: (i) feature extraction (based on time-domain[20,22–24], frequency-domain [22–24] and time-frequency domainfeatures [22–24]) and (ii) classification (using regression trees [21],discriminant analysis [23], artificial neural networks [28] and supportvector machines [24,30]).
However, in our case, the study of simulation signals revealedno differences in frequency and time domain characteristics of thesignal for two pump (S and NS) states. The only significantdifference was in the baseline of the pump flow signal, which isreduced in suction states. For this reason, we applied a novelsuction detector that is based on the recognition of the suddendecreases in signal’s baseline [31,32]. This methodology is basedon online estimation of a Gaussian Mixture Model (GMM) withtwo mixtures corresponding to NS and S classes and it consists ofthree steps: (i) Signal windowing, (ii) GMM based classification,and (iii) GMM parameter adaptation [31].
Fig. 2. Block diagram of the cardiovascular simulator and its connection with the hydraulic part. The picture in the left upper corner evidences the hydraulic structure of theimpedance transformer and its connection with the Circulite Synergy Micropump.
A.T. Tzallas et al. / Computers in Biology and Medicine 51 (2014) 128–139 131
2.3.1. Signal windowingThe average of a sec window is calculated:
xk ¼1FS
∑k U FS
i ¼ ðk�1Þ UFSþ1yi; ð1Þ
where xk is the average of the kth window, FS is the samplingfrequency, and yi the input pump flow signal. The resulting xk isthe input for the following steps of the suction detectionmethodology.
2.3.2. GMM based classificationAbove the modeling is performed using a GMM with two
components. However, instead of using two independent para-meters for the means of the two components, one for the NS signal(μB) and one for the S signal (μs), we consider that the mean of thesecond mixture (S signal) is given as the mean of the firstcomponent with the addition of a constant D ðμS ¼ μBþDÞ. Thisconstant is a negative number which reflects the average degrada-tion of the signal occurred in S events. Using this assumption, themodel describes more accurately the nature of the signal in handand can be formally described as
xi �pB UNðxi;μB;sBÞ for NS:ps UNðxi;μS;sSÞ for S:
(ð2Þ
The mixing probability of each component defined as pB and ps,is considered constant. Standard deviations sB and sS are alsoconsidered as constants. Those parameters are obtained from an
initial training of the model. Using the model described above weclassify the xk as a S or NS sample according to the componenthaving the highest likelihood.
2.3.3. GMM adaptationFor each new sample xi the adaptation step includes the μB
parameter update using an online learning GMM approach:
μiB ¼ aUμi�1
B þð1�aÞU ðxi�ps UDÞ; ð3Þ
ps ¼Nðxi;μS;sSÞ: ð4Þ
where a learning constant a¼0.1. This methodology is advanta-geous due to its simplicity compared to other methods, which usesa large number of features and its ability to operate in real time[31,32]. An exemplary segment of a pump flow signal is displayedin Fig. 5(a). In order to indicate more clearly the regions of interestwhere suction events occur, a low-pass filtered version of the samesignal is given in Fig. 5(b). In the filtered signal is clearly depictedthat suction events as the simulator gives those, are related to arapid degradation of the signal baseline.
3. Results
In order to assess the SensorART SSM, a set of simulationsessions was created with the aim to initially validate the SuctionDetection Tool, which provides the core functionality in the overall
Fig. 3. Internal connectivity of VAD Heart Simulation Platform (VHSP) and Specialist Decision Support System (SDSS).
A.T. Tzallas et al. / Computers in Biology and Medicine 51 (2014) 128–139132

speed selection process (Fig. 4). Through the VAD Heart Simula-tion, two different datasets were employed:
� Dataset I: 10 pump flow signals with suction events ofapproximately 46 min in total duration were created from
hybrid cardiovascular simulator which enables the specialiststo simulate the behavior of a patient’s circulatory system withconnected a real assist device (e.g. non-pulsatile blood pump).
� Dataset II: in this case the computational cardiovascular simu-lator was used. The simulator was set in order to reproduce a largenumber of medical realistic cases defined and determined byspecialists (see Fig. 6 for more details). In each of these cases thepumpwas activated and the speed was progressively increased tillsuction appeared. A total of 26 pump flow signals of approxi-mately 20 h were produced, in different medical cases and withdifferent predefined pathologies.
In the GMM model only one time varying parameter wasselected, the mean of the non-suction mixture. Reducing thedegrees of freedom in the model ensures higher reliability [31].For learning the initially GMM parameters we build an initialdataset with the following steps:
� For the NS signal we calculate the average M.� The average, M, is removed from the whole signal.� A window processing is applied on the new signal, calculating
the average over a 1-s window in the case of pump flow signalsfrom the Dataset I and over a 0.1-s window in the case of pumpflow signals from the Dataset II.
Table 1The list of parameters which are obtained for a specific object patho-physiologicalcondition.
Web serviceparameter name
Range Unit Description
username n/a n/a Name of SDSS user(login/nickname)
id 40 n/a Timestampdescribe n/a n/a Some description for VHSP
if necessaryweight 40 kg Patient’s weightbsa 40 n/a Body surface arearpm 0-30000 rpm Pump SPEEDpump n/a n/a Type of the pumpdiameter 40 mm End diastolic ventricular diametercannula 0–1 n/a Cannulation type: 0-atrial, 1-apicalhr 0–200 1/min Heart rateco 0–8 l/min Cardiac outputbpm 0–250 mmHg Mean blood pressurebpm ax 0–250 mmHg Max blood pressurebpm in 0–250 mmHg Min blood pressurepcwpm 0–50 mmHg Wedge pressure (mean)papm 0–50 mmHg Mean pulmonary arterial pressurecvpm 0–30 mmHg Mean Central Venous Pressurepq 50–240 ms ECG-PQ durationqrs 60–200 ms ECG-QRS durationqt 250–550 ms ECG-QT durationmv 0–4 n/a Mitral valve regurgitation severityav 0–4 n/a Aortic valve regurgitation severityavsten 10–200 mmHg Aortic valve stenosis-gradient of
mmHgtv 0–4 n/a Tricuspid valve regurgitation severitylvesv 0–400 ml Left ventricular end systolic volumelvedv 0–350 ml Left ventricular end diastolic volumedisease n/a n/a Diseasedur 0–30 min Duration of simulation
Fig. 4. The flowchart of the Speed Selection Process.
Fig. 5. (a) Segment of original measured pump flow, and (b) filtered version ofsignal where suction events are highlighted [29].
A.T. Tzallas et al. / Computers in Biology and Medicine 51 (2014) 128–139 133

From the dataset obtained, the initial GMM parameters areestimated (Table 2) [30]. Segments of the signal with higherprobability on the second mixture are considered as S (Fig. 7).The parameter D for the GMM model is initially estimated using
the pump flow simulation dataset. For each signal, the signalsegments with the same baseline are manually extracted. Then foreach segment the average of the suction and non-suction signalwas calculated. The difference of those averages provided an
Fig. 6. A screenshot of the VHSP along with realistic patients’ pathologies for 26 different cases as they were defined by the specialists. Hypertrophic Cardiomyopathy: HC,Ischemic Cardiomiopathy: IC, Dilated Cardiomiopathy: DC, Right Ventricular Failure: RVF, Interventricualr Septum Failure: ISF, Aortic Regurgitation: AR, Aortic Stenosys: AS,Aterosclerosis: AT, Systemic Hypertension: SH, pulmonary hypertension: PH.
A.T. Tzallas et al. / Computers in Biology and Medicine 51 (2014) 128–139134

estimation of D. The estimation of D using the two datasets was�0.5. Then for each of the 36 signals in the two datasets themethodology was applied. The first five seconds of the signalswere used for the estimation of an initial mean μB and thestandard deviation sB. Then for each 1-s window (in the case ofpump flow signals from Dataset I) and 0.1-s window (in the case ofpump flow signals from Dataset II) the classification and adapta-tion steps were applied. In the classification based step eachsegment is categorized as NS or S based on the probabilities.
In order to quantify the performance of our methodology theROC curves for the detection of suction in the 10 signals of thedataset I are given in Fig. 8(a). The area under curve (AUC) was0.97. In addition, the ROC curve for the detection of suction in the26 signals of the Dataset II is given in Fig. 8(b). The confusionmatrices, sensitivities, specificities and the total accuracy are given
in Tables 3 and 4 for the two datasets, respectively. Signalwindows were classified as suction events when the GMMcomponent corresponding to suction had probability larger thanthe 0.5; otherwise they were classified as no suction.
4. Discussion
In this study, the SensorART SSM is described in detail. It is anovel set of tools assisting specialists in effectively assessing andexploiting simulated patient data, in order to design the besttreatment strategy for their patients before and after LVADimplantation, analyze acquired datasets, extract new knowledge,and make informative decisions. The nature of the tools impliesthat a wide variety of specialists are expected to utilize thissystem, as indicated by our usability testing in three different usergroups such as cardiac and vascular surgeons, cardiologists andgeneral clinicians as well as biologists and researchers. Further-more, the SensorART SSM will be potentially used to transfer thesuccess and deductions of the most experienced cardiosurgerycenters to those less established. In general, LVAD therapy entailsprocessing complex, uncertain, and incomplete data, which aredynamically evolving. As a consequence, the centers with a largerpatient volume are at an advantage compared with those thattreat only a few LVAD patients per year. The introduction of theSensorART SSM will enable the potential to translate valuable
Table 2GMM Parameter estimation.
Parameter Value (VAD heartsimulation platform)
Value(numerical simulator)
μΒ �0.01 �0.01D �0.46 �12sΒ 0.08 3.8sS 0.25 6
Fig. 7. Online GMM Parameter Estimation [31].
A.T. Tzallas et al. / Computers in Biology and Medicine 51 (2014) 128–139 135

expert knowledge into standardized, personalized, and optimizedLVAD therapy.
This study focused on the preliminarily evaluation of theSensorART SSM and especially the Suction Detection Tool through
a set of representative simulation sessions. As the SensorARTplatform is mainly focused on Circulite pump, implanted inatrio-aortic connection, this study focus on suction detection inthe left atrium. Certainly, the validation of the suction detectionmodule is not complete and does not cover all the possibilities ofsuction in general, but the present study is a first attempt inevaluating the suction detection module in specific conditions. Theliterature presents various methods applied for suction detectionin LVADs. As it is already mentioned, the majority of the relatedworks addressed mainly the feature extraction from the pumpflow signals and the use of pattern recognition techniques toclassify the signal into different states and detect suction events. Acomparison of the suction detection methodology with otherdetection techniques given in the literature is quite difficult. Thereason behind this is that these studies consider different rotaryblood pumps and make use of nonstandard and different data-bases, some of them not available in public. Although a directcomparison is not feasible, in Table 5, a comparison of themethods reported in the literature is presented. Additional proces-sing of patient data in real life LVAD applications may be of crucialimportance in suction detection and speed selection. Namely,during practical usage such as animal trials, sampled data maynot be as clean as in the model simulations. The artefact in signalsmay produce similar thresholds as the ones that we defined in thisstudy. This essentially increases the probability of false positives,events that trigger LVAD controller action to prevent suction whensuction is not actually taking place. Thus, data integration(smoothing) and cubing may be a good method of improvingrobustness.
Future development of the SMM will include the option ofpredicting or anticipating the suction phenomenon from thechange of the slope of the pump flow signal. This will also allowthe development of a closed control algorithm for LVAD whichincorporates physiological parameters as inputs. The changes inthese parameters are strongly related to the physiological condi-tion of the patient and his exercise intensity. By including thisinformation as control input, the controller relates the pumpspeed to these changes and can improve the pump support forthe patients with changing physiological state.
5. Conclusions
In this study, the SensorART Speed Selection Module is pre-sented which mainly consists of two SDSS tools and the VHSP.
In general, the SDSS is a web-based application that offersspecialists with a plethora of tools for monitoring patients,designing the best therapy plan, analyzing data, discoveringnew knowledge, making informative decisions and selectingthe optimal pump speed. In this context, the SensorART SSM(Suction Detection and Speed Selection Tool) provides an impor-tant functionality that is directly related to the optimal use ofthe LVAD system (appropriate speed) and consequently thewellness of the patient. It allows specialists to safely evaluatedifferent sets of parameters, identify the patient–device interac-tions, and determine suitable treatment strategies through virtualtrial and error of specific pathologies. Future developmentswill include a closed-loop operation of a sensorized LVAD througha set of implantable/wearable sensors and a minute to minuteassessment.
Conflict of interest statement
The authors declare that they have no competing interests.
1.0
False positive rate
0.0
0.2
0.4
0.6
0.8
1.0
True
pos
itive
rate
1.0
0.0 0.2 0.4 0.6 0.8
0.0 0.2 0.4 0.6 0.8
False positive rate
0.0
0.2
0.4
0.6
0.8
1.0
True
pos
itive
rate
Fig. 8. (a) ROC curve for the GMM classification (AUC¼0.97) for Dataset I. (b) ROCcurve for the GMM classification (AUC¼0.9657) for Dataset II.
Table 3The above results are from 10 signals with approximately 46 minduration, where GMM online estimation was applied (Dataset I).
GMM no suction GMM suction
No-suction 1904 71Suction 117 510Sensitivity 96% 81%Specificity 94% 88%Accuracy 93%
Table 4The results are from 26 signals with approximately 20 h duration,where GMM online estimation was applied (Dataset II).
GMM no suction GMM suction
No-suction 63,547 1568Suction 3480 4555Sensitivity 98% 57%Specificity 95% 74%Accuracy 93%
A.T. Tzallas et al. / Computers in Biology and Medicine 51 (2014) 128–139136

Table 5Suction detection methods presented in the literature.
Author(s) Year Suction detection methods Pump orsuction states
Results
Feature extraction Classification
Ferreira et al. [22] 2006 Time-domain analysis Thresholding function I. NSII. SS
For SS detectionSensitivity:88%● Zero-crossings
Frequency-domain analysis Specificity:95%� Harmonic index� Subharmonic index
Time-frequency analysis● Instantaneous frequency
Ferreira et al. [23] 2006 Time-domain analysis Discriminant analysis I. NSII. MSIII. SS
Total Accuracy: 73.8%� Asymmetry index� Max, Min Pump Flow envelopes� Max, Min dQ/dt envelopes
NS Accuracy: 69.9%MS Accuracy: 84%SS Accuracy: 85.8%
Frequency-domain analysis� Harmonic index� Subharmonic index
Time-frequency analysis● Instantaneous frequency
Vollkron et al. [20] 2006 Time-domain analysis Thresholding function I. NSII. MSIII. MPSIV. SSV. U
False positive rate:0.42%� Asymmetry criterion� Plateau criterion� Slow rate criterion� Low flow criterion� Mean-Min-Max criterion� Saddle-Neg criterion� Saddle-Pos criterion
False negative rate: 1.5%
Karantonis et al. [21] 2007 7 Features from the pump speed signal Classification and regressiontree (CART)
I. NSII. SS
For SS detectionSensitivity: 99.11%Specificity: 98.76%
Karantonis et al. [28] 2008 9 Features from the pump speed signal Artificial Neural Networks(ANN)
I. NSII. SS
For SS detectionSensitivity: 98.54%Specificity: 99.26%
Wang et al. [24] 2011 Time-domain analysis Lagrangian Support VectorMachines (LSVMs)
I. NSII. MSIII. SS
Total Accuracy: 93.2%● Mean, minimum, and maximumvalues of the pump flow signal
NS Accuracy: 92.9%MS Accuracy: 93.3%
Frequency-domain analysis SS Accuracy: 94.6%● Harmonic and subharnomic energycontent of pump flow signalTime-frequency analysis● Standard deviation ofInstantaneous Frequency
Wang et al.[30] 2013 Time-domain analysis Lagrangian Support VectorMachines (LSVMs)
Dataset I: Dataset I:(3-state) For SS detection
● Mean, minimum, and maximumvalues of the pump flow signal
I. NSII. MSIII. SS
(3-state):Sensitivity: 98.6%Specificity: 99.6%Total Accuracy: 99.4%For SS detection(2-state):Sensitivity: 98.7%Specificity: 99.6%Total Accuracy: 99.4%
(2-state) Dataset II:Frequency-domain analysis For SS detection
(3-state):Sensitivity: 95%
I. NSII. SS
Specificity: 99.1%● Harmonic and subharnomic energycontent of pump flow signal Total Accuracy: 98.8%
For SS detection (2-state):Sensitivity: 95%Specificity: 99.1%Total Accuracy: 98.8%Dataset II:
(3-state)I. NSII. MSIII. SS
Time-frequency analysis● Standard deviation ofInstantaneous Frequency
A.T. Tzallas et al. / Computers in Biology and Medicine 51 (2014) 128–139 137

Acknowledgments
This work is part funded by the European Commission (Sensor-ART project: “A remote controlled Sensorized ARTificial heartenabling patients empowerment and new therapy approaches”,FP7-248763).
References
[1] K. Dickstein, A. Cohen-Solal, G. Filippatos, J.J. McMurray, P. Ponikowski,P.A. Poole-Wilson, A. Stromberg, D.J. van Veldhuisen, D. Atar, A.W. Hoes,A. Keren, A. Mebazaa, M. Nieminen, S.G. Priori, K. Swedberg, ESC guidelines forthe diagnosis and treatment of acute and chronic heart failure 2008: the TaskForce for the diagnosis and treatment of acute and chronic heart failure 2008of the European Society of Cardiology. Developed in collaboration with theHeart Failure Association of the ESC (HFA) and endorsed by the EuropeanSociety of Intensive Care Medicine (ESICM), Eur. J. Heart Fail. 10 (2008)933–989.
[2] J.R. Boston, J.F. Antaki, M.A. Simaan, Hierarchical control of heart-assistdevices, IEEE Robot. Autom. Mag. 10 (2003) 54–64.
[3] Antaki J.F., Choi S., Amin D.V., Boston J.R., Yu Y.C., Kerrigan J.P., Konishi H.,Litwak P., Borovetz H.S., and Griffith B.P., In search of chronic speed control forrotary pumps, in: Proceedings of the Waseda International Congress ofModeling and Simulation Technology for Artificial Organs, Japan, 1996.
[4] Antaki J.F., Choi S., Boston J.R., Butler K.C., Thomas D.C., and Amin D.V., Speedcontrol system for implanted blood pumps, US Patent 6,066,086: Nimbus Inc,2000.
[5] H. Konishi, J.F. Antaki, D.V. Amin, J.R. Boston, J.P. Kerrigan, W.A. Mandarino,P. Litwak, K. Yamazaki, M. Macha, K.C. Butler, H.S. Borovetz, R.L. Kormos,Controller for an axial flow blood pump, Artif. Organs 20 (6) (1996) 618–620.
[6] T. Waters, P. Allaire, G. Tao, M. Adams, G. Bearnson, N. Wei, E. Hilton, M. Baloh,D. Olsen, P. Khanwilkar, Motor feedback physiological control for a continuousflow ventricular assist device, Artif. Organs 23 (6) (1999) 480–486.
[7] G.A. Giridharan, M. Skliar, Physiological control of blood pumps withoutimplantable sensors, Proc. Am Control Conf. 1 (2003) 471–476.
[8] M. Oshikawa, K. Araki, K. Nakamura, H. Anai, T. Onitsuka, Detection of totalassist and sucking points based on the pulsatility of a continuous flow artificialheart: in vivo evaluation, ASAIO J 44 (5) (1998) 704–707.
[9] G.A. Giridharan, M. Skliar, Nonlinear controller for ventricular assist devices,Artif. Organs 26 (11) (2002) 980–984.
[10] G.A. Giridharan, M. Skliar, D.B. Olsen, G.M. Pantalos, Modeling and control of abrushless DC axial flow ventricular assist device, ASAIO J. 48 (3) (2002)272–289.
[11] S.M. Parnis, J.L. Conger, J.M. Fuqua Jr., R.K. Jarvik, R.W. Inman, D. Tamez,M.P. Macris, S. Moore, G. Jacobs, M.J. Sweeney, O.H. Frazier, Progress in thedevelopment of a transcutaneously powered axial flow blood pump ventri-cular assist system, ASAIO J 43 (5) (1997) 576–580.
[12] Chen S.H., Baroreflex-based physiological control of a left ventricular assistdevice (Thesis), The School of Engineering, University of Pittsburgh, 2006.
[13] McConahy D.C., Application of multiobjective optimization to determining anoptimal left ventricular assist device (LVAD) pump speed. (Thesis), The Schoolof Engineering, University of Pittsburgh, 2007.
[14] L. Fresiello, K. Zieliński, S. Jacobs, A. Di Molfetta, K.J. Pałko, F. Bernini,M. Martin, P. Claus, G. Ferrari, M.G. Trivella, K. Górczyńska, M. Darowski,
B. Meyns, M. Kozarski, Reproduction of continuous flow left ventricular assistdevice experimental data by means of a hybrid cardiovascular model withbaroreflex control, Artif. Organs (2013), http://dx.doi.org/10.1111/aor.12178(Oct 1).
[15] A. Di Molfetta, S. Jacobs, L. Fresiello, T. Verbelen, M.G. Trivella, B. Meyns,G. Ferrari, Simulation of apical and atrio-aortic VAD in patients with transpo-sition or congenitally corrected transposition of the great arteries, Int. J. Artif.Organs 1 (37) (2014) 58–70 (Jan 30), http://dx.doi.org/10.5301/ijao.5000264.
[16] G. Ferrari, M. Kozarski, K. Zielinski, L. Fresiello, A. Di Molfetta, K. Gorczynska, K.J. Palko, M. Darowski, A modular computational circulatory model applicableto VAD testing and training, J. Artif. Organs 15 (1) (2012) 32–43.
[17] M. Kozarski, G. Ferrari, K. Zieliński, K. Górczyńska, K.J. Pałko, L. Fresiello, A. DiMolfetta, M. Darowski, A hybrid (hydro-numerical) cardiovascular modelapplication to investigate continuous-flow pump assistance effect, Biocybern.Biomed. Eng. 32 (4) (2012) 77–91.
[18] B. Meyns, A. Simon, S. Klotz, T. Wittwer, C. Schlensak, F. Rega, D. Burkhoff,Clinical benefits of partial circulatory support in New York Heart AssociationClass IIIb and Early Class IV patients, Eur. J. Cardio-thorac. Surg. 39 (2011)693–698;A. Di Molfetta, S. Jacobs, L. Fresiello, T. Verbelen, M.G. Trivella, B. Meyns,G. Ferrari, Simulation of apical and atrio-aortic VAD in patients with transpo-sition or congenitally corrected transposition of the great arteries, Int. J. Artif.Organs 1 (37) (2014) 58–70 (Jan 30).
[19] M. Darowski, M. Kozarski, G. Ferrari, K. Zieliñski, K. Górczyñska,A. Szczepanowski, K.J. Palko, L. Fresiello, A. Di Molfetta, A new hybrid(hydro-numerical) model of the circulatory system, Bull. Pol. Acad. Sci. – Tech.Sci. 61 (4) (2013) 993–1003, http://dx.doi.org/10.2478/bpasts-2013-0107.
[20] M. Vollkron, H. Schima, L. Huber, R. Benkowski, G. Morello, G. Wieselthaler,Advanced suction detection system for an axial blood pumps, Artif. Organs 30(9) (2006) 665–670.
[21] D.M. Karantonis, N.H. Lovell, P.J. Ayre, D.G. Mason, S.L. Cloherty, Identificationand classification of physiologically significant pumping states in an implan-table rotary blood pump, Artif. Organs 30 (9) (2006) 671–679.
[22] Ferreira A., A rule-based controller based on suction detection for rotary bloodpumps (Thesis), The School of Engineering, University of Pittsburgh, 2007.
[23] Ferreira A., Chen S., Simaan M.A., Boston J.R., Antaki J.F., A discriminantanalysis-based suction detection system for rotary blood pumps, in: Proc.IEEE EMBC, 2006 pp. 5382–5385.
[24] Wang Y., Faragallah G., Divo E., and Simaan M.A., Detection of VentricularSuction in an Implantable Rotary Blood Pumps Using Support VectorMachines, in: Proc. 2011 IEEE Engineering in Medicine and Biology Con-ference, Boston, MA, August 30 – September 3, 2011, pp. 3318–3321.
[25] A. Yuhki, E. Nogawa, M. Miura, Y. Shimazaki, S. Takatani, Detection of suctionand regurgitation of the implantable centrifugal pump based on the motorcurrent waveform analysis and its application to optimization of pump flow,Artif. Organs 23 (6) (1999) 532–537.
[26] Liu D., Boston J.R., Lin H., Antaki J.F., Simaan M.A., Wu J., Monitoring thedevelopment of suction in an LVAD, in: Proc. BMES-EMBS 1st Joint Conf., 1999,pp. 240.
[27] Μ Oshikawa, Κ Araki, G. Endo, H. Anai, M. Sato, Sensor less controllingmethod for a continuous flow left ventricular assist device,, Artif. Organs 24(8) (2000) 600–605.
[28] D.M. Karantonis, S.L. Cloherty, N.H. Lovell, D.G. Mason, R.F. Salamonsen,P.J. Ayre, Noninvasive detection of suction in animplantable rotary bloodpump using neural networks,, Int. J. Comput. Intell. Appl. 7 (3) (2008)237–247.
Table 5 (continued )
Author(s) Year Suction detection methods Pump orsuction states
Results
Feature extraction Classification
(2-state)I. NSII. SS
The proposed Suction DetectionMethodology [31]
2013 Gaussian Mixture Model (GMM) Gaussian Mixture Model(GMM)
I. NSII. SS
Dataset I:For SS detection: Sensitivity: 81%� Signal windowing
� GMM based classification� GMM parameter adaptation
Specificity: 88%Total Accuracy: 93%Dataset II:For SS detection: Sensitivity: 57%Specificity: 74%Total Accuracy: 93%
No suction (NS), Moderate suction (MS), Most probably suction (MPS), Severe suction (SS), Not classified/posterior analysis (ND), Not useful (NU), Undecided (U).
A.T. Tzallas et al. / Computers in Biology and Medicine 51 (2014) 128–139138

[29] Morello, Gino F., Blood pump system and method of operation, US Patent:0215050, 2004.
[30] M.A. Yu Wang, Simaan, A suction detection system for rotary blood pumps basedon the lagrangian support vector machine algorithm, IEEE J. Biomed. Health Inf.17 (3) (2013) 654–663, http://dx.doi.org/10.1109/TITB.2012.2228877.
[31] Tzallas A.T., Rigas G., Karvounis E.C., Tsipouras M.G., Goletsis Y., Zielinski K.,Fresiello L., Fotiadis D.I., and Trivella M.G., A Gaussian mixture model to detect
suction events in rotary blood pumps, in: IEEE Twelfth International Con-ference on BioInformatics and BioEngineering-BIBE 2012.
[32] G. Rigas, Y. Goletsis, D.I. Fotiadis, Real-time driver's stress event detection,,Intell. Transp. Syst. IEEE Trans. 13 (1) (2012) 221–234.
A.T. Tzallas et al. / Computers in Biology and Medicine 51 (2014) 128–139 139
Copyright © 2022 FDOKUMEN