Elastance control of a mock circulatory system for ventricular assist device test
6
Elastance Control of a Mock Circulatory System for Ventricular Assist Device Test Yih-Choung Yu and Sriram Gopalakrishnan Department of Electrical and Computer Engineering, Lafayette College, Easton, PA 18042, USA Abstract – A state-feedback controller was designed to simulate the Starling response of the heart in a mock circulatory system (MCS). The controller drives a voice coil actuator (VCA) to follow a reference volume, and thus generate the desired chamber pressure, by using position and speed feedbacks. The reference volume was adjusted according to the maximum ventricular elastance (E max ), end-systolic ventricular pressure, and left atrial pressure to respond to load variation in the MCS. The controller was tested in computer simulation by changing the load conditions and E max of the MCS. The MCS along with the controller was able to reproduce human heart function from healthy to sick conditions. A rotary ventricular assist device (VAD) was then introduced in the simulation to test the MCS. The MCS was able to produce a consistent cardiac function even with the presence of the VAD. These results suggest that the new MCS control system is able to simulate the cardiac function for VAD test. I. Introduction As heart disease remains a considerable health problem around the world, the development of both equipment and methodologies for its treatment are of great interest and priority. While the heart transplant is the most widely accepted method for dealing with severe cases of the disease, demand for these transplants exceeds the supply available. Thus, ventricular assist devices (VADs) are being developed as alternatives. Indeed, as the reliability and performance of VADs improves, they are becoming increasingly viable for long-term implants in addition to their traditional role as a bridge to native heart transplantation. There are other encouraging signs for the future of VADs – recently several successful rehabilitations of patients using VADs have been reported Error! Reference source not found., implying that the use of such devices is not limited to long-term implantation or as bridge-to-transplant, but also as bridge-to-recovery. Promising as their future may be, however, there remain many challenges in the development, in particular the performance evaluation of VADs. Testing of the device and its control strategy is usually performed via animal experimentation or the use of mechanical mock circulation loops. There are several disadvantages associated with both methods – animal testing is costly and time-consuming, while most mock circulation loops available to date have limitations in simulating the native heart in response to the load changes due to VAD intervention. This hemodynamic response is very important in assessing VAD performance under various cardiovascular functions, in particular for evaluating the controller of such devices. The limitations described above originate from the fixed-stroke nature of traditional mock loops, which does not reflect the consistency of the contractual state of the native heart in response to its load changes. Although ventricular elastance, E v (t), defined by E v (t ) = P v (t )/[V v (t ) - V 0 ], (1) where P v (t) and V v (t) are the ventricular pressure and volume and V 0 is the un-stressed volume, is consistent regardless of the load changes to the ventricle [2] and the maximum of E v (t) (E max ) is an appropriate index of the contractile state of the ventricle, controlling the MCS to follow a pre-defined E v (t) trajectory is limited to a small range of load variation [3,4]. Baloa et al [5] designed a pressure controller that controlled the mock ventricular chamber pressure to track a reference pressure signal, calculated from (1) using the instantaneous volume measurement, V v (t), while obtaining E v (t) from a lookup table. However, it was found that preload (the venous pressure) of the MCS was dependent on its afterload (systemic resistance) [6], which was not physiologically meaningful. It was also determined that the robustness of the controller to pressure disturbances, such as introducing a VAD into the MCS, also needed improvement [6]. This paper presents a state feedback position controller to track the chamber volume reference. Unlike a traditional MCS, which was driven to follow a fixed reference either pressure or volume, the reference signal in this MCS was adjusted based on changes in heart rate, E max , end-systolic chamber pressure, and left atrial pressure (as the preload of the MCS). Therefore, this new MCS can better simulate the cardiac hemodynamics in response to load changes. The MCS model, proposed by Baloa et al [5], was adopted with the addition of right atrial compliance and a venous return pumping mechanism for controller design and testing. Performance of the controller was evaluated by changing E max , preload, and afterload. A rotary VAD model [7] was introduced into the MCS to test the robustness of the 2009 American Control Conference Hyatt Regency Riverfront, St. Louis, MO, USA June 10-12, 2009 WeB10.3 978-1-4244-4524-0/09/$25.00 ©2009 AACC 1009
Transcript of Elastance control of a mock circulatory system for ventricular assist device test

Elastance Control of a Mock Circulatory System for Ventricular Assist Device Test
Yih-Choung Yu and Sriram Gopalakrishnan
Department of Electrical and Computer Engineering, Lafayette College, Easton, PA 18042, USA Abstract – A state-feedback controller was designed to simulate the Starling response of the heart in a mock circulatory system (MCS). The controller drives a voice coil actuator (VCA) to follow a reference volume, and thus generate the desired chamber pressure, by using position and speed feedbacks. The reference volume was adjusted according to the maximum ventricular elastance (Emax), end-systolic ventricular pressure, and left atrial pressure to respond to load variation in the MCS. The controller was tested in computer simulation by changing the load conditions and Emax of the MCS. The MCS along with the controller was able to reproduce human heart function from healthy to sick conditions. A rotary ventricular assist device (VAD) was then introduced in the simulation to test the MCS. The MCS was able to produce a consistent cardiac function even with the presence of the VAD. These results suggest that the new MCS control system is able to simulate the cardiac function for VAD test.
I. Introduction
As heart disease remains a considerable health problem around the world, the development of both equipment and methodologies for its treatment are of great interest and priority. While the heart transplant is the most widely accepted method for dealing with severe cases of the disease, demand for these transplants exceeds the supply available. Thus, ventricular assist devices (VADs) are being developed as alternatives. Indeed, as the reliability and performance of VADs improves, they are becoming increasingly viable for long-term implants in addition to their traditional role as a bridge to native heart transplantation. There are other encouraging signs for the future of VADs – recently several successful rehabilitations of patients using VADs have been reported Error! Reference source not found., implying that the use of such devices is not limited to long-term implantation or as bridge-to-transplant, but also as bridge-to-recovery.
Promising as their future may be, however, there remain many challenges in the development, in particular the performance evaluation of VADs. Testing of the device and its control strategy is usually performed via animal experimentation or the use of mechanical mock circulation loops. There are several disadvantages associated with both methods – animal testing is costly and time-consuming, while most mock circulation loops available to date have
limitations in simulating the native heart in response to the load changes due to VAD intervention. This hemodynamic response is very important in assessing VAD performance under various cardiovascular functions, in particular for evaluating the controller of such devices.
The limitations described above originate from the fixed-stroke nature of traditional mock loops, which does not reflect the consistency of the contractual state of the native heart in response to its load changes. Although ventricular elastance, Ev(t), defined by
Ev (t) = Pv (t) / [Vv (t) - V0 ] , (1)
where Pv(t) and Vv(t) are the ventricular pressure and volume and V0 is the un-stressed volume, is consistent regardless of the load changes to the ventricle [2] and the maximum of Ev(t) (Emax) is an appropriate index of the contractile state of the ventricle, controlling the MCS to follow a pre-defined Ev(t) trajectory is limited to a small range of load variation [3,4]. Baloa et al [5] designed a pressure controller that controlled the mock ventricular chamber pressure to track a reference pressure signal, calculated from (1) using the instantaneous volume measurement, Vv(t), while obtaining Ev(t) from a lookup table. However, it was found that preload (the venous pressure) of the MCS was dependent on its afterload (systemic resistance) [6], which was not physiologically meaningful. It was also determined that the robustness of the controller to pressure disturbances, such as introducing a VAD into the MCS, also needed improvement [6].
This paper presents a state feedback position controller to track the chamber volume reference. Unlike a traditional MCS, which was driven to follow a fixed reference either pressure or volume, the reference signal in this MCS was adjusted based on changes in heart rate, Emax, end-systolic chamber pressure, and left atrial pressure (as the preload of the MCS). Therefore, this new MCS can better simulate the cardiac hemodynamics in response to load changes. The MCS model, proposed by Baloa et al [5], was adopted with the addition of right atrial compliance and a venous return pumping mechanism for controller design and testing. Performance of the controller was evaluated by changing Emax, preload, and afterload. A rotary VAD model [7] was introduced into the MCS to test the robustness of the
2009 American Control ConferenceHyatt Regency Riverfront, St. Louis, MO, USAJune 10-12, 2009
WeB10.3
978-1-4244-4524-0/09/$25.00 ©2009 AACC 1009
controller in response to the VAD intervention. The resulting Emax, produced by the MCS with the controller, was consistent regardless of the load changes. This implies that the controller and the MCS should be suitable for use as a VAD test platform.
II. Mock Circulatory System Model
An electrical analogue of the MCS is shown in Fig. 1, where blood pressure, flow, and volume are analogical to voltage, current, and electric charge, respectively. This model was adopted from Baloa et al [5] with the addition of the right atrial compliance (Cra) and the pressure dependent flow (Qra). The governing equations of the model are listed in (2) to (10). Qra represents the venous return flow, which is determined by the right atrial pressure in (8) [8]. Cra and Qra represent a simplified model of the pulmonary circulation in the MCS. These two elements improve the independence of the preload (Ppv) from the afterload (Rl), and thus the modified MCS model is a more realistic approximation of the cardiovascular system. Qra can be implemented in the MCS by regulating the speed of a peristaltic pump to achieve the desired flow rate as determined by (8). The variable x in (4) is the displacement of the voice coil actuator. Table 1 provides the physical meanings and the values of the model parameters. Equation (9) represents the dynamic model of a rotary VAD, where ω p and Qp are the rotational speed and blood flow of the VAD, respectively. The values of the VAD model parameters can be found in [7].
Fig. 1, Electrical analogue of the MCS model with a VAD
PAO = Qout +QP − (PAO − PRA ) / Rl[ ]/ CA (2)
PPV = QRA −Qin( )/ CP (3)
[ ] /ch in out P chP Q Ax Q Q C= + − − (4)
[ ]( ) / /RA AO RA l RA RAP P P R Q C= − − (5)
Qout =(Pch − PAO ) / Rval , Pch ≥ PAO
0 , Pch < PAO
⎧⎨⎪
⎩⎪ (6)
Qin =(PPV − Pch ) / Rmit , PPV ≥ Pch
0 , PPV < Pch
⎧⎨⎪
⎩⎪ (7)
QRA = 240 ⋅[1− exp(- PRA + 0.5( )/ 3)] (8)
Qp = kω
p
2 − RpQp − PAO − Pch( )⎡⎣
⎤⎦ Lp (9)
Table 1, Model parameters
Symble Value (unit) Description
A 60 (cm2) Cross-sectional area of pump-head
fB 40 (N⋅s/m) Frictional coefficient
C2 100 (cm/m) Conversion factor
C1 0.013332
(Pa⋅cm2/mmHg⋅m2) Conversion factor
CA 1.37 (mL / mmHg) Aortic compliance
Cch 0.1832
(mL/mmHg) Chamber
compliance
Cp 6.74 (mL/mmHg) Pulmonary
venous/Atrial compliance
Kf 27 (N/A) Current-force factor
Ksp 29348 (N/m) Spring constant M 0.7533 (kg) Pump-head mass Rl 1 (mmHg⋅s/mL) Systemic resistance
Rmit 0.005
(mmHg⋅s/mL) Mitral valve resistance
Rval 0.005
(mmHg⋅s/mL) Aortic valve
resistance
V0 10 (mL) Residual chamber volume
Vbias 315 (mL) Maximum chamber volume
III. Controller Design
The control algorithm was designed to produce the reference chamber volume, Vref(t), and drive the voice coil actuator (VCA) to track it. Vref(t) was determined by
)v(tSVSV)(V(t)V nedref ⋅+−= , (10)
where SV is the stroke volume of the chamber, Ved is the end-diastolic chamber volume, and v(tn) is a normalized
1010

volume waveform. The normalized time, tn (defined between 0 and 1), is described by
tn = tS0 ⋅ (t/tS ), 0 ≤ t < tS tS0 + (1-tS0 ) ⋅[(t-tS ) / (tC -tS )], tS ≤ t < tC
⎧⎨⎪
⎩⎪(11)
where tS0 is the time point at which v(tn) reaches 0, tS is the systolic time interval determined by [9]
tS=0.14+0.2⋅tC, (12)
and tC is the cardiac period calculated by tC = 60 / HR. Ved was determined by means of a lookup table from mean left atrial pressure ( PVP ), produced by [10]
]Vexp[-0.062 ]Vexp[0.0530.01 P ededPV ⋅⋅−⋅⋅= (13)
Since EV(t) reaches its maximum value Emax near the end of systole [2], the end-systolic chamber volume Ves can be derived from (1) as
Ves = Pes/Emax + V0, (14)
where Pes is the end-systolic chamber pressure. By definition, Ves is the difference between the end-diastolic volume, Ved, and the SV, (14) can be written as
SV = Ved − Pes Emax − V0 . (15)
Since SV in (15) depends on the preload (Ved), afterload (Pes) and ventricular contractility (Emax), the reference chamber volume obtained from (10) implicitly included the ventricular function in (1).
The mock ventricle was driven by a voice coil actuator. A state-feedback controller, as shown in Fig. 2, was designed to control the VCA to track the reference position signal converted from Vref(t),
R(t) = [Vbias – Vref(t)] / (A*C2), (16)
where Vbias is the maximum chamber volume and C2 is a unit conversion factor. The dynamics of the VCA can be represented by [5]
-f sp B lMv K i K x f v F= ⋅ − ⋅ − ⋅ (17)
where Kf is the current-force constant and i is the current input to the VCA. Ksp is the spring constant, x is the position of the pump-head, fB is the frictional coefficient
and v is the velocity of the pump head. Fl is the load the VCA produced by the chamber pressure Pch,
Fl = A⋅C1⋅Pch, (18)
where A is the area of the pump head and C1 is a unit conversion factor. Fl is non-linear, and can be compensated by adding additional current to the current command sent to the VCA. F1 can therefore be ignored, and the state vector T
21 ] x x[ X = can be defined, where 1x x= and
2x v x= = , (17) can be written in a state-space form,
X A X B uy x C X= ⋅ + ⋅= = ⋅
(19)
where A =0 1
−Ksp / M − fB / M
⎡
⎣
⎢⎢
⎤
⎦
⎥⎥
, ⎥⎦
⎤⎢⎣
⎡=
M / K0
Bf
,
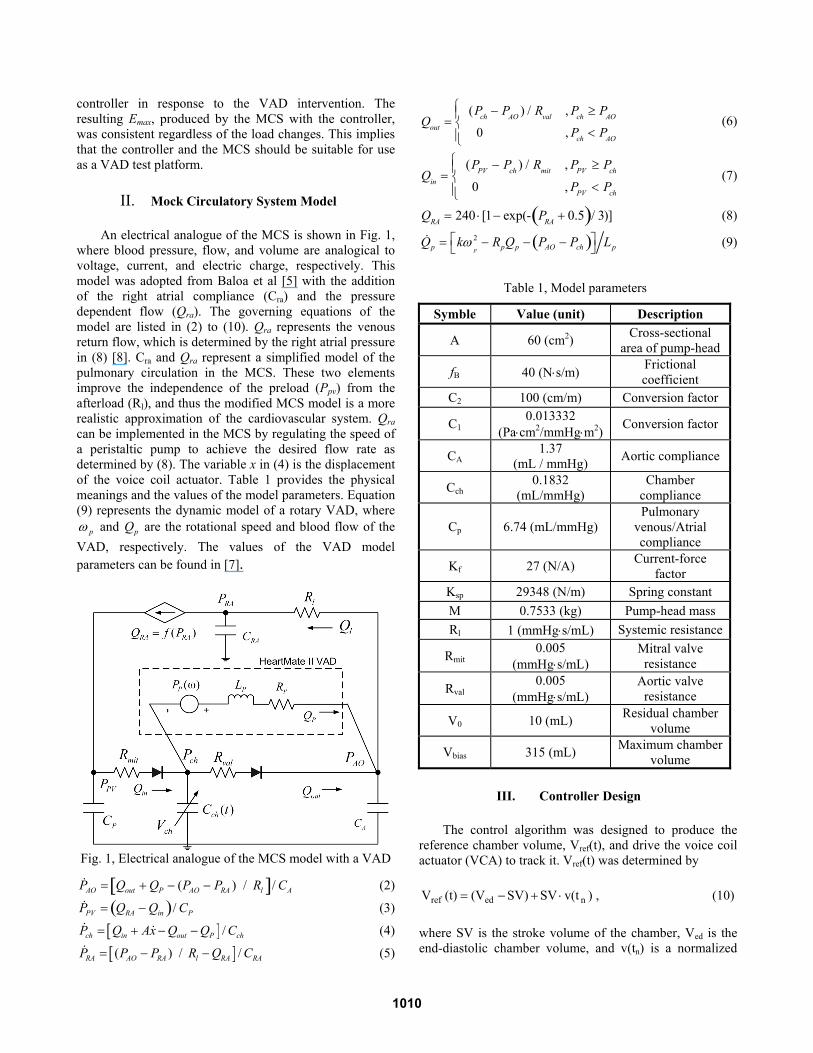
[ ]01C = , and u = i. The pole placement method [11] was used to determine the control gains, K=[k1 k2] and ke. Integral control was introduced to improve the steady-state error. Since the VCA velocity v was not measurable, an observer [11] in Fig. 2 was designed to estimate v using the input and output signals.
Assuming that the state estimate X̂ , is equal to the actual state X , from the block diagram in Figure 2,
*
NN
X 0XA R
x 1x⎡ ⎤ ⎡ ⎤ ⎡ ⎤
= +⎢ ⎥ ⎢ ⎥ ⎢ ⎥⎣ ⎦⎣ ⎦⎣ ⎦
, (20)
where A* =
0 1 0
−Ksp − Kfk1
M− fB − Kfk2
MKfKe
M
−1 0 0
⎡
⎣
⎢⎢⎢⎢⎢⎢⎢⎢
⎤
⎦
⎥⎥⎥⎥⎥⎥⎥⎥
. By
choosing the desired closed-loop poles at
P1,2= 2nn 1j - ζ−⋅ω⋅±ω⋅ζ and P3=-10⋅ζ⋅ωn [11], where ζ
and ωn are the desired damping ratio and natural frequency of the closed-loop system, the resulting dominator of the closed-loop transfer function is
det[sI − A* ] = s3 +fB + Kfk2
Ms2 +
Ksp + Kfk1
Ms + KfKe
M≡ s3 + (12ζω n )s2 + (20ζ 2 +1)ωn
2s + (10ζωn3 )
(21)
1011
B C
A
K
- +++
s1
•
X XR
B C
A
+
+s1
•∧
X∧
X
L
+
- +∧
y
yus1 Ke-
+ NxfK
MCA ⋅⋅ 1
+ + *u
lFchP
-+
FLfKM
B C
A
K
- +++
s1
•
X XR
B C
A
+
+s1
•∧
X∧
X
L
+
- +∧
y
yus1 Ke-
+ NxfK
MCA ⋅⋅ 1
+ + *u
lFchP
-+
FLfKM
Fig. 2, State space block diagram with observer and correction for steady-state error
The control gains, k1, k2, and Ke can be determined by comparing with coefficients in (21) with the settling time and percent overshoot (thus, ζ and ωn) for the closed-loop system. A 0.02 second settling time and 10% overshoot were chosen in the design so that the phase difference between the reference and actual volume was insignificant over the frequency range of 0.83 to 2.5 Hz, as heart rate of 50 to 150 beats per minute. The resulting control gains are k1=23010.31, k2=65.47851, and Ke=3554600.
The chamber pressure, Pch, presents a disturbance, in terms of force Fl, against the VCA pump head. Fl is nonlinear due to the opening and closing of the inlet and outlet valves in the pump chamber. Since the chamber pressure is measurable, additional current can be added to the VCA to compensate Fl. Therefore, the actual current sent into the VCA was
U* = [Ke ⋅ (R − y) ⋅dt∫ ]- K ⋅ X̂ + MKf
A ⋅C1 ⋅Pch . (22)
Designing the observer entails the choice of an appropriate gain vector, L=[l1 l2]T, such that the state estimate X̂ approaches the actual state X in a finite time. By choosing the percent overshoot and the settling time for the observer and comparing them with the coefficients in (23) [11],
det[sI − (A − LC)] ≡ s2 + 2ζ ⋅ωn ⋅ s +ω n2
= s2 + (l1 +fB
M) ⋅ s + (l1 ⋅
fB
M+ l2 +
Ksp
M)
. (23)
The settling time for the observer was 0.001 and the overshoot was 5%. The resulting observer gains are l1=7946.9 and l2=25019721.
IV. Controller Testing
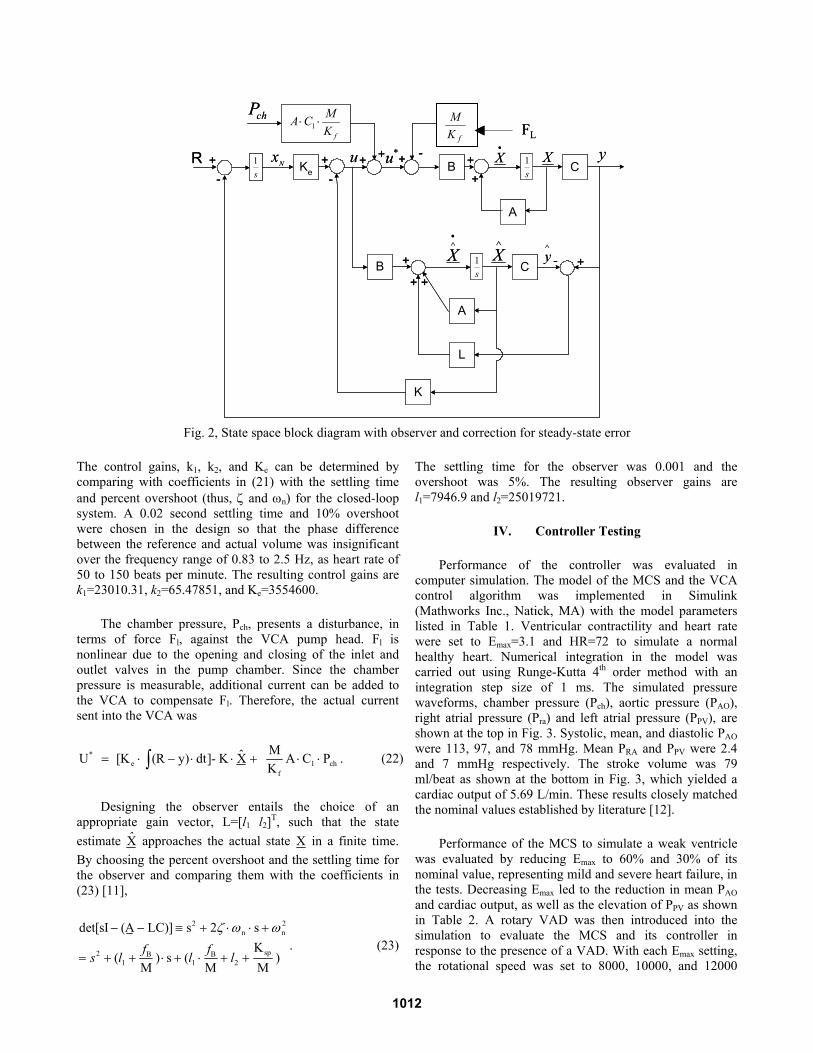
Performance of the controller was evaluated in computer simulation. The model of the MCS and the VCA control algorithm was implemented in Simulink (Mathworks Inc., Natick, MA) with the model parameters listed in Table 1. Ventricular contractility and heart rate were set to Emax=3.1 and HR=72 to simulate a normal healthy heart. Numerical integration in the model was carried out using Runge-Kutta 4th order method with an integration step size of 1 ms. The simulated pressure waveforms, chamber pressure (Pch), aortic pressure (PAO), right atrial pressure (Pra) and left atrial pressure (PPV), are shown at the top in Fig. 3. Systolic, mean, and diastolic PAO were 113, 97, and 78 mmHg. Mean PRA and PPV were 2.4 and 7 mmHg respectively. The stroke volume was 79 ml/beat as shown at the bottom in Fig. 3, which yielded a cardiac output of 5.69 L/min. These results closely matched the nominal values established by literature [12].
Performance of the MCS to simulate a weak ventricle was evaluated by reducing Emax to 60% and 30% of its nominal value, representing mild and severe heart failure, in the tests. Decreasing Emax led to the reduction in mean PAO and cardiac output, as well as the elevation of PPV as shown in Table 2. A rotary VAD was then introduced into the simulation to evaluate the MCS and its controller in response to the presence of a VAD. With each Emax setting, the rotational speed was set to 8000, 10000, and 12000
1012
revolution per second (rpm). When the simulation reached steady state, mean PAO, mean PPV, cardiac output, and pump flow QP were recorded and compared with the clinical data. It can be seen in Table 2 that increasing the VAD speed elevated the mean PAO and reduced the mean PPV. Cardiac output was also increased, boosted by the pump flow QP. These results agree with the clinical observations in literature [13].
Table 2, Summary of Hemodynamic Variables from MCS Simulation
Emax VAD speed
PAO mean
PPV mean
Cardiac Output QP
3.1 - 97 7.04 5.69 - 3.1 8000 100 6.59 5.88 2.57 3.1 10000 117 3.62 6.84 4.44 3.1 12000 137 0.91 8.00 6.89
1.86 - 85 9.07 4.99 - 1.86 8000 92 7,41 5.43 2.71 1.86 10000 114 4.00 6.66 4.49 1.86 12000 137 0.92 7.99 6.90 0.93 - 64 12.68 3.76 - 0.93 8000 84 8.99 4.92 2.83 0.93 10000 109 4.64 6.35 4.59 0.93 12000 136 0.96 7.94 6.93
Fig. 3, Pressure and chamber volume waveforms obtained from the simulation of the MCS with the controller (Pch: green line; PAO: blue line; Pla: red line)
V. Validation
The aim of the validation testing was to evaluate the ability of the MCS controller to produce physiologically meaningful waveforms, such as pressure, volume, and flow, in various states of cardiac function ranging from sick to healthy, as well as the presence of VAD. It has been shown experimentally that the cardiac contractility, represented by Emax, should be consistent regardless of the load variations
presented to the heart [2]. Emax is usually obtained from curve fitting using end-systolic pressure and volume data measured by changing the load conditions of the ventricle [5]. This can be explained by (14). Subtracting V0 and then multiplying Emax on both sides of (14) leads to
Pes = Emax⋅(Ves –V0). (24)
End-systolic pressure (Pes) and volume (Ves) can be changed by varying the load conditions. The slope, obtained from regression using Pes and Ves data, is the corresponding estimate of Emax. The consistency of Emax to changing load conditions can be determined statistically by R2.
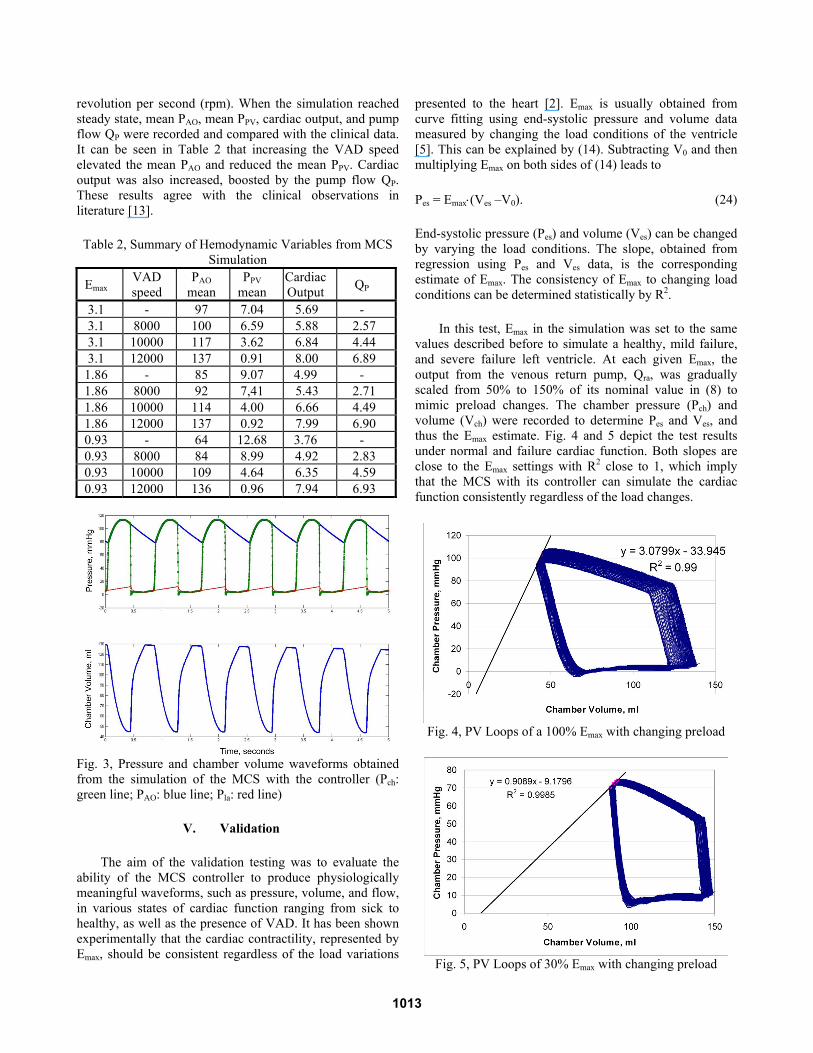
In this test, Emax in the simulation was set to the same values described before to simulate a healthy, mild failure, and severe failure left ventricle. At each given Emax, the output from the venous return pump, Qra, was gradually scaled from 50% to 150% of its nominal value in (8) to mimic preload changes. The chamber pressure (Pch) and volume (Vch) were recorded to determine Pes and Ves, and thus the Emax estimate. Fig. 4 and 5 depict the test results under normal and failure cardiac function. Both slopes are close to the Emax settings with R2 close to 1, which imply that the MCS with its controller can simulate the cardiac function consistently regardless of the load changes.
Fig. 4, PV Loops of a 100% Emax with changing preload
Fig. 5, PV Loops of 30% Emax with changing preload
1013

The validation tests with the failure heart were repeated with the presence of VAD support. With each cardiac function setup, the pump was operated at 8000 and 12000 rpm. The test results are summarized in Table 3. The Emax estimates (Slope) were still close to the set values with R2 close to 1. Fig. 6 illustrates the pressure-volume loops of a mild failure heart with VAD operated at 8000 rpm.
Table 3, Summary of the validation tests No VAD Support
Emax Setting
Pump Speed Slope Error R2
3.1 - 3.08 -0.6% 0.99 1.86 - 1.94 4.3% 0.99 0.93 - 0.91 -2.2% 0.99
With VAD Support 1.86 8000 1.71 -8.1% 0.99 1.86 12000 2.08 11.8% 0.99 0.93 8000 0.90 -3.2% 0.99 0.93 12000 0.96 3.2% 0.99
Fig. 6, PV Loops of 60% Emax under VAD support at 8000
rpm with changing preload
VI. Conclusions
A state feedback controller was designed to control a mock circulatory system to produce physiologically meaningful pressure, volume, and flow waveforms based on the contractile state of the left ventricle. A volume reference was generated based on the load conditions (Ved and Pes) and contractility (Emax) of the mock ventricle. This reference was successfully used to drive a VCA. Performance of the design was evaluated by computer simulation. The MCS was able to generate the key hemodynmic waveforms of healthy and failure cardiac functions. When a VAD model was incorporated with the MCS in simulation, the changes in the hemodynamic variables agreed with those from clinical observations. A series of validation tests showed that the system could produce a consistent Emax (R2≈1) for both healthy and failure heart conditions regardless of load
changes as well as the presence of the VAD. This system remains to be tested when a physical realization becomes available.
References
[1] D. J. Ferrar et al., “Long-term follow-up of thoratec ventricular assist device bridge-to-recovery patients successfully removed from support after recovery of ventricular function,” J. Heart Lung Transplant, vol. 21, no. 5, pp. 516–521, May 2002.
[2] Klabunde, R. Cardiovascular Physiology Concepts, Lippincott Williams & Wilkins, Philadelphia, 2005.
[3] Woodard, J.C.; Rock, S.M.; and Portner, P.M. “A sophisticated electromechanical ventricular simulator for ventricular assist system testing,” ASAIO Trans., 1991, pp. 210-11.
[4] Williams, J.L.; Antaki, J.F.; Boston J.R.; Williams, S.L.; Woodard, J.C.; Miller, P.J.; and Kormos, R.L. “Load sensitive mock circulatory system for ventricular assist device controller evaluation and development,” Proc. of the 16th Annual Intern. Conf. of the IEEE EMB Society, 1994, pp. 89-90.
[5] Baloa, L.A.; Boston, J.R.; and Antaki, J.F. “Elastance-based Control of a Mock Circulatory System,” Annals of Biomedical Engineering, v. 29. 2001. pp. 244 – 251
[6] Loh, Matthew. Modeling and Simulation of a Mock Circulatory System. Proceedings of the National Conference on Undergraduate Research. 2003.
[7] Choi, S., et al., “Modeling and identification of an axial flow blood pump,” Proceedings of the American Control Conference, 1997, pp 3714-3715.
[8] Cavalcanti, S. and Di Marco, L. “Numerical Simulation of the Hemodynamic Response to Hemodialysis-Induced Hypovolemia,” Artificial Organs, 1999, pp. 1065 – 67.
[9] Rideout, V. Mathematical Modeling and Computer Simulation of Physiological Systems, Prentice Hall, Inc., 1991.
[10] Ferrari, G.; De Lazzari, C.; Mimmo, R.; Tosti, G; and Ambrosi, D. “A modular numerical model of the Cardiovascular System for Studying and Training in the Field of Cardiovascular Physiology,” J. of Biomed. Eng., 1992, pp. 91-107.
[11] Nise, N.S. Control System Engineering, 5th Ed., John Wiley & Sons, Inc. 2008.
[12] Guyton, A.C. and Hall, J.E. Textbook of Medical Technology, 11th Ed., W. B. Saunders Company, 2005.
[13] Xu, L., et al., ”Computer Modeling of Interactions of an Electric Motor, Circulatory System, and Rotary Blood Pump,” ASAIO Journal, 2000, pp. 604-611.
1014