
Modeling and Simulation of Lipid Membranes - MDPI
176
Edited by Modeling and Simulation of Lipid Membranes Jordi Marti and Carles Calero Printed Edition of the Special Issue Published in Membranes www.mdpi.com/journal/membranes
-
Upload
khangminh22 -
Category
Documents
-
view
1 -
download
0
Transcript of Modeling and Simulation of Lipid Membranes - MDPI
Edited by
Modeling and Simulation of Lipid Membranes
Jordi Marti and Carles CaleroPrinted Edition of the Special Issue Published in Membranes
www.mdpi.com/journal/membranes

Modeling and Simulation of LipidMembranes

Modeling and Simulation of LipidMembranes
Editors
Jordi Martı
Carles Calero
MDPI • Basel • Beijing • Wuhan • Barcelona • Belgrade • Manchester • Tokyo • Cluj • Tianjin
Editors
Jordi Martı
Technical University of
Catalonia-Barcelona Tech
Spain
Carles Calero
University of Barcelona
Spain
Editorial Office
MDPI
St. Alban-Anlage 66
4052 Basel, Switzerland
This is a reprint of articles from the Special Issue published online in the open access journal
Membranes (ISSN 2077-0375) (available at: https://www.mdpi.com/journal/membranes/special
issues/Model Simulation Lipid Membranes).
For citation purposes, cite each article independently as indicated on the article page online and as
indicated below:
LastName, A.A.; LastName, B.B.; LastName, C.C. Article Title. Journal Name Year, Volume Number,
Page Range.
ISBN 978-3-0365-4937-8 (Hbk)
ISBN 978-3-0365-4938-5 (PDF)
© 2022 by the authors. Articles in this book are Open Access and distributed under the Creative
Commons Attribution (CC BY) license, which allows users to download, copy and build upon
published articles, as long as the author and publisher are properly credited, which ensures maximum
dissemination and a wider impact of our publications.
The book as a whole is distributed by MDPI under the terms and conditions of the Creative Commons
license CC BY-NC-ND.
Contents
About the Editors . . . . . . . . . . . . . . . . . . . . . . . . . . . . . . . . . . . . . . . . . . . . . . vii
Preface to ”Modeling and Simulation of Lipid Membranes” . . . . . . . . . . . . . . . . . . . . ix
Jordi Martı and Carles Calero
Modeling and Simulation of Lipid MembranesReprinted from: Membranes 2022, 12, 549, doi:10.3390/membranes12060549 . . . . . . . . . . . . 1
Nebojsa Zec, Gaetano Mangiapia, Alex Hendry, Robert Barker, Alexandros Koutsioubas,
Henrich Frielinghaus, Mario Campana, Jose Luis Ortega-Roldan, Sebastian Busch and
Jean-Francois Moulin
Mutually Beneficial Combination of Molecular Dynamics Computer Simulations and ScatteringExperimentsReprinted from: Membranes 2021, 11, 507, doi:10.3390/membranes11070507 . . . . . . . . . . . . 5
Lucia Sessa, Simona Concilio, Peter Walde, Tom Robinson, Petra S. Dittrich, Amalia Porta,
Barbara Panunzi, Ugo Caruso and Stefano Piotto
Study of the Interaction of a Novel Semi-Synthetic Peptide with Model Lipid MembranesReprinted from: Membranes 2020, 10, 294, doi:10.3390/membranes10100294 . . . . . . . . . . . . 33
Huixia Lu and Jordi Martı
Influence of Cholesterol on the Orientation of the Farnesylated GTP-Bound KRas-4B Bindingwith Anionic Model MembranesReprinted from: Membranes 2020, 10, 364, doi:10.3390/membranes10110364 . . . . . . . . . . . . 49
Alberto Aragon-Muriel, Yamil Liscano, David Morales-Morales, Dorian Polo-Ceron and Jose
Onate-Garzon
A Study of the Interaction of a New Benzimidazole Schiff Base with Synthetic and SimulatedMembrane Models of Bacterial and Mammalian MembranesReprinted from: Membranes 2021, 11, 449, doi:10.3390/membranes11060449 . . . . . . . . . . . . 69
Navaneethan Radhakrishnan, Sunil C. Kaul, Renu Wadhwa and Durai Sundar
Phosphatidylserine Exposed Lipid Bilayer Models for Understanding Cancer Cell Selectivity ofNatural Compounds: A Molecular Dynamics Simulation StudyReprinted from: Membranes 2022, 12, 64, doi:10.3390/membranes12010064 . . . . . . . . . . . . . 83
Claudia Trejo-Soto, Guillermo R. Lazaro, Ignacio Pagonabarraga and Aurora
Hernandez-Machado
Microfluidics Approach to the Mechanical Properties of Red Blood Cell Membrane and TheirEffect on Blood RheologyReprinted from: Membranes 2022, 12, 217, doi:10.3390/membranes12020217 . . . . . . . . . . . . 99
Zheyao Hu and Jordi Marti
In Silico Drug Design of Benzothiadiazine Derivatives Interacting with Phospholipid CellMembranesReprinted from: Membranes 2022, 12, 331, doi:10.3390/membranes12030331 . . . . . . . . . . . . 127
Isaac K. Asare, Alberto Perez Galende, Andres Bastidas Garcia, Mateo Fernandez Cruz, Anna
Clara Miranda Moura, Conner C. Campbell, Matthew Scheyer, John Paul Alao, Steve Alston,
Andrea N. Kravats, Charles R. Sanders, Gary A. Lorigan and Indra D. Sahu
Investigating Structural Dynamics of KCNE3 in Different Membrane Environments UsingMolecular Dynamics SimulationsReprinted from: Membranes 2022, 12, 469, doi:10.3390/membranes12050469 . . . . . . . . . . . . 145
v

About the Editors
Jordi Martı
Jordi Martı is an Associate Professor of Physics at the Department of Physics of the Polytechnic
University of Catalonia-Barcelona Tech (UPC). He got his Ph.D. degree in Physics at the University
of Barcelona and has been a visiting professor at the University of California-Berkeley, the Lawrence
Berkeley National Laboratory, the Atomic Energy Commission of Argentina and the Atomic Energy
Research Institute of the Hungarian Academy of Sciences, among others. He is a scientific coordinator
of the research group on “Computer Simulation in Condensed Matter” at UPC.
He has made significant contributions to the study of microscopic dynamics of water, especially
on the interpretation of molecular vibrations and has authored pioneering works on single and
collective dynamics of hydrogen-bonded liquids. His present research interests include structure
and dynamics of aqueous and ionic systems, intermolecular proton transfer in confined liquids,
nucleation of helium in liquid metals and the molecular modeling and simulation of biomembranes,
with especial attention paid to the interaction of oncogenic proteins with cell membranes and
to the design of suitable new drugs for tumor treatment. He has published 90 scientific articles
in international peer-reviewed journals with about 4000 citations and has presented around 60
communications in international conferences and workshops (h-index 38). He is a member of the
editorial board of journals: MDPI Materials (Soft Matter section), Frontiers in Nanotechnology and
Graphene.
Carles Calero
Dr. Calero earned his Ph.D. in Physics at the City University of New York (CUNY, USA)
under the supervision of Dist. Prof. E. M. Chudnovsky. He held post-doctoral appointments at
the Instituto de Ciencia de Materiales de Barcelona (was awarded a JAE-doc fellowship), at the
Universitat Politecnica de Catalunya and at Boston University in the group of H. E. Stanley. Since
2016 he works in the Condensed Matter Physics Department of the University of Barcelona.
His main research line addresses the theoretical description of colloidal systems, focusing on
the dynamics of aggregation of colloids and the interfacial phenomena which determine the stability
conditions of colloidal suspensions. For his research, Dr. Calero employs tools based on statistical
mechanics and a range of computer simulation techniques. His research has an interdisciplinary
character, with publications in physics, materials science, physical chemistry and biophysics journals.
vii

Preface to ”Modeling and Simulation of Lipid
Membranes”
This Special Issue of Membranes on “Modeling and Simulation of Lipid Membranes” discusses
recent progress in the study of membrane systems by means of computational or experimental
tools, paying special attention to the interplay between the two main techniques. It contains eight
research articles and one editorial. This book is addressed to all scientists who are interested in new
insights into the knowledge of physiological function of lipid cell membranes and their relationship
with other components of cells such as proteins, vesicles and organelles. We express our grateful
acknowledgment to all authors, reviewers and MDPI editorial staff for their excellent contributions
and continuous support.
This publication has been supported by funds from the I+D+i project Reference
PID2021-124297NB-C32, founded by MCIN/ AEI/10.13039/501100011033/ and “FEDER Una
manera de hacer Europa”.
Jordi Martı and Carles Calero
Editors
ix


Citation: Martí, J.; Calero, C.
Modeling and Simulation of Lipid
Membranes. Membranes 2022, 12, 549.
https://doi.org/10.3390/
membranes12060549
Received: 18 May 2022
Accepted: 23 May 2022
Published: 25 May 2022
Publisher’s Note: MDPI stays neutral
with regard to jurisdictional claims in
published maps and institutional affil-
iations.
Copyright: © 2022 by the authors.
Licensee MDPI, Basel, Switzerland.
This article is an open access article
distributed under the terms and
conditions of the Creative Commons
Attribution (CC BY) license (https://
creativecommons.org/licenses/by/
4.0/).
membranes
Editorial
Modeling and Simulation of Lipid Membranes
Jordi Martí 1,† and Carles Calero 2,*,†
1 Department of Physics, Polytechnic University of Catalonia-Barcelona Tech, B5-209 Northern Campus UPC,08034 Barcelona, Spain; [email protected]
2 Department of Condensed Matter Physics, University of Barcelona, Carrer de Martí i Franquès, 1,08028 Barcelona, Spain
* Correspondence: [email protected]; Tel.: +34-93403-9212† These authors contributed equally to this work.
Cell membranes separate the interior of cells and the exterior environment, providingprotection, controlling the passage of substances, and governing the interaction withother biomolecules and signalling processes. They are complex structures that, mainlydriven by the hydrophobic effect [1], are based upon phospholipid bilayer assembliescontaining sterols, glycolipids, and a wide variety of proteins located both at the exteriorsurface and spanning the membrane [2,3]. There exist a large number of different types ofphospholipids, each with a given function, although we understand only a small fraction ofthem [4]. Recently, studies of the physical and biochemical characteristics of lipid moleculesas been referred to as lipidomics [5] in recognition of their fundamental importance for theunderstanding of cell biology.
Over the years, a great variety of experimental techniques have been developed to in-vestigate the structure, dynamics and function of phospholipid membranes. These includenuclear magnetic resonance [6], X-ray scattering [7], small angle and quasi-elastic neutronscattering spectroscopy [8], scanning tunneling microscopy [9], and more recently newtechniques to probe previously unaccessible length- and time-scales, such as stimulatedemission depletion microscopy-fluorescence correlation spectroscopy [10], terahertz time-domain spectroscopy [11], or microfluidic techniques [12], to mention just a few. In parallel,in recent decades the increase of computer power and the development of new modelingand simulation techniques have allowed a significant improvement in the theoretical de-scription of lipid membranes. As a consequence, plenty of papers have been devoted to themodeling and simulation of cell membranes, from pioneering works at the atomic level ofdescription [13–15] to a multiplicity of coarse-grained approaches [16], the latter allowingto run for long simulations over larger and larger time and distance scales and to studyprocesses such as lipid rafts [17] or full membrane dynamics [18]. Indeed, computer simu-lations provide relevant information on the structure and dynamics of lipid membranes,and can be used to complement and interpret the experimental data, which is limited bythe length and time resolution of the experiment.
This Special Issue of Membranes discusses recent progress in the study of membranesystems mainly using computational (usually molecular dynamics) or mixed methodolo-gies. It contains eight research articles. The complete description of each study and themain results are presented in more detail in the full manuscript, which the reader is invitedto read. A brief summary of the articles is presented as follows.
Sessa et al. [19] investigate with a combination of permeability experiments andmolecular dynamics simulations the crucial issue of the interaction between proteins andphospholipid membranes. The authors compare the effects on a model lipid bilayer ofa natural peptide and an analog synthetic peptide which contains a highly hydrophobicazobenzene group. Their computer simulations suggest that the affinity of the peptideis significantly enhanced by the inclusion of such residue. In addition, simulations andexperiments on the entrapment capacity of large vesicles show that the modified peptideinduces a larger perturbance on the structure of the lipid bilayer, increasing its permeability.
Membranes 2022, 12, 549. https://doi.org/10.3390/membranes12060549 https://www.mdpi.com/journal/membranes1

Membranes 2022, 12, 549
Understanding this effect may be important for the design of new peptides with specificfunctionalities with potential therapeutic applications.
The article by Lu and Marti [20] highlights the influence of cholesterol in the orienta-tions and structural conformations of the oncogene KRas-4B. This protein is well knownfor its extended presence in a wide variety of cancers and because of its undruggabil-ity. The authors have performed microsecond molecular dynamics simulations using theCHARMM36 force field to observe that high cholesterol contents in the cell membranefavor a given orientation with the protein exposing its effector-binding loop for signal trans-duction and helping KRas-4B mutant species to remain in its active state. This suggeststhat high cholesterol intake will increase mortality of some cancer patients.
The next contribution was due to Aragon-Muriel et al. [21] and it reports a studyof a newly designed Schiff base derivative from 2-(m-aminophenyl)benzimidazole and2,4-dihydroxybenzaldehyde interacting with two synthetic membrane models preparedwith pure 1,2-dimyristoyl-sn-glycero-3-phosphocholine and a 3:1 mixture of this lipid with1,2-dimyristoyl-sn-glycero-3-phosphoglycerol, in order to mimic eukaryotic and prokary-otic membranes. The study was performed by means of a combined in vivo-in silicostudy using differential scanning calorimetry, spectroscopic and spectrometric techniquesand molecular dynamics simulations. The main results indicate that the Schiff deriva-tive induces higher fluidity at the mixed membrane. As a second part of their study,the authors modeled an erythrocyte membrane model formed by 1-palmitoyl-2-oleoyl-sn-glycero-3-phosphoethanolamine, N-(15Z-tetracosenoyl)-sphing-4-enine-1-phosphocholineand 1-palmitoyl-2-oleoyl-sn-glycero-3-phosphocholine and observed that the Schiff deriva-tive showed high affinity to the different membranes due to hydrophobic interactions orhydrogen bonds.
The interplay between scattering experiments and molecular dynamics simulationsto obtain information on the structure of model phospholipid membranes is discussed inthe article [22]. Zec and co-workers provide a detailed comparison between the resultsof scattering experiments (neutron and X-ray reflectometry and small angle scatteringmeasurements) and calculated values obtained from standard all-atom MD simulations ofbilayers composed of popular phospholipids (1,2-dimyristoyl-sn-glycero-3-phosphocholine(DMPC) and 1,2-dilinoleoyl-sn-glycero-3-phosphocholine. The authors show that MD sim-ulations can be used to interpret from a nanoscopic perspective the results from scatteringexperiments, which prove larger length and time scales. Their analysis also identifies theuncertainties and sources of error from scattering experiments and simulations, which needto be considered in order to draw significant conclusions from their comparison.
In the paper by Radhakrishnan et al. [23] the authors used molecular dynamicstechniques in order to study the permeation of membranes by several relevant solutes, suchas Withaferin A, Withanone, Caffeic Acid Phenethyl Ester and Artepillin C when they are atthe interface of a cell membrane model formed by phosphatidylserine lipids. Their resultsindicated that exposure of phosphatidylserine can favor the permeation of Withaferin A,Withanone and of Caffeic Acid Phenethyl Ester through a cancer cell membrane whencompared to a normal membrane. The authors showed the ability of phosphatidylserineexposure-based models for analyzing how cancer cells are able to perform drug selectivity.
In Reference [24], Trejo and co-workers review the main properties of red blood cells’(RBC) membranes and their effect on blood rheology. The authors describe the mechan-ical properties of RBC membranes and the mesoscopic theory to model their relevantelastic features, as well as the resulting membrane dynamics. They also discuss the in-teraction of RBCs with the constituents of blood plasma through the membrane, of greatimportance to understand RBCs mutual interactions and the formation of RBCs aggre-gates. The consequences of RBCs properties on fluid dynamics of blood in the circulatorysystem (hemodynamics) are also reviewed, giving an account of recent advancements innumerical and experimental techniques which have provided new information on thesubject. In particular, Trejo et al. review in detail the use of recent microfluidic techniquesto obtain information on the properties of single RBCs as well as on collective effects which
2
Membranes 2022, 12, 549
determine the rheological properties of blood (hemorheology). Finally, a review of thedisorders which alter the hemodynamics and rheological properties of blood is provided,and an account is given of the microfluidic techniques developed for their diagnostic.
In the work of Hu and Marti [25], the authors reported a molecular dynamics study onthe atomic interactions of a lipid bilayer membrane formed by dioleoylphosphatidylcholine,1,2-dioleoyl-sn-glycero-3-phosphoserine and cholesterol with a series of derivatives of thedrug benzothiadiazine, designed in silico, all within a potassium chloride aqueous solution.The benzothiadiazine derivatives were obtained by single-hydrogen site substitution andit has been revealed that all them have strong affinity to remain at the cell membraneinterface, with variable residence times in the range 10-70 ns. The authors observed thatbenzothiadiazine derivatives can bind lipids and cholesterol chains with single and doublehydrogen-bonds of rather short characteristic lengths.
The influence of the membrane on the properties of transmembrane proteins is investi-gated by Asare and co-workers using numerical simulations [26]. The authors perform MDsimulations of KCNE3, a transmembrane protein associated with several potassium chan-nels, inserted in different phospholipid bilayers: DMPC, 1-palmitoyl-2-oleoyl-sn-glycero-3-phosphocholine (POPC), and a mixture of POPC and POPG (1-Palmitoyl-2-oleoyl-sn-glycero-3-phosphatidylglycerol) in a 3:1 proportion, to study how such environmentsdetermine its structural and dynamical properties. Their simulations indicate that thecentral part of the protein immersed in the membrane, the transmembrane domain, ismore rigid and stable than the two ends of the protein which are surrounded by the elec-trolyte. The results reported by Asare and co-workers can help complement the informationextracted from experiment on KCNE3’s function in its native membrane environment.
Despite studies of model lipid membranes have been carried out for long time, thereare still many aspects and theoretical findings that have not been yet verified experimentallyand for which the existing results are incomplete or inconsistent. Conversely, there are alsoexperimental results which still lack of appropriate microscopical interpretation. Therefore,the main objective of this Special Issue was to collect a sample of recent scientific workson the modeling and simulation lipid membranes, with special aim in the interactions ofthe two principal techniques (theory-simulation vs. experiments) and their mutual benefit.The techniques presented here, from purely computational to the mixture of simulationand experimental methods in some cases, have helped us to understand essential physicalproperties as the structure and dynamics of specific lipid membranes and solutes. Thesestudies will provide new insights into the fundamental principles underlying physiologicalfunctions of cell membranes and their relationship with other components of cells andtissues. We believe that this objective has been successfully achieved, for which we expressour heartfelt appreciation to all authors and reviewers for their excellent contributions.
Author Contributions: Writing—original draft preparation, review and editing, J.M. and C.C. Allauthors have read and agreed to the published version of the manuscript.
Funding: This contribution received no external funding.
Institutional Review Board Statement: Not applicable.
Informed Consent Statement: Not applicable.
Data Availability Statement: Not applicable.
Acknowledgments: We thank all authors and reviewers who contributed to this Special Issue fortheir excellent works and accurate revisions.
Conflicts of Interest: The authors declare no conflict of interest.
3
Membranes 2022, 12, 549
References
1. Nagle, J.F.; Tristram-Nagle, S. Structure of lipid bilayers. Biochim. Biophys. Acta (BBA)-Rev. Biomembr. 2000, 1469, 159–195.[CrossRef]
2. Tien, H.T.; Ottova-Leitmannova, A. Membrane Biophysics: As Viewed from Experimental Bilayer Lipid Membranes; Elsevier: Amster-dam, The Netherlands, 2000.
3. Mouritsen, O.G. Life-As a Matter of Fat; Springer: Berlin/Heidelberg, Germany, 2005.4. Van Meer, G.; Voelker, D.R.; Feigenson, G.W. Membrane lipids: Where they are and how they behave. Nat. Rev. Mol. Cell Biol.
2008, 9, 112–124. [CrossRef] [PubMed]5. Shevchenko, A.; Simons, K. Lipidomics: Coming to grips with lipid diversity. Nat. Rev. Mol. Cell Biol. 2010, 11, 593–598.
[CrossRef]6. Stockton, G.W.; Smith, I.C. A deuterium nuclear magnetic resonance study of the condensing effect of cholesterol on egg
phosphatidylcholine bilayer membranes. I. Perdeuterated fatty acid probes. Chem. Phys. Lipids 1976, 17, 251–263. [CrossRef]7. Pan, J.; Tristram-Nagle, S.; Nagle, J.F. Effect of cholesterol on structural and mechanical properties of membranes depends on
lipid chain saturation. Phys. Rev. E 2009, 80, 021931. [CrossRef] [PubMed]8. Pabst, G.; Kucerka, N.; Nieh, M.P.; Rheinstädter, M.; Katsaras, J. Applications of neutron and X-ray scattering to the study of
biologically relevant model membranes. Chem. Phys. Lipids 2010, 163, 460–479. [CrossRef] [PubMed]9. Woodward IV, J.; Zasadzinski, J. High-resolution scanning tunneling microscopy of fully hydrated ripple-phase bilayers. Biophys.
J. 1997, 72, 964–976. [CrossRef]10. Hedde, P.N.; Dörlich, R.M.; Blomley, R.; Gradl, D.; Oppong, E.; Cato, A.C.; Nienhaus, G.U. Stimulated emission depletion-based
raster image correlation spectroscopy reveals biomolecular dynamics in live cells. Nat. Commun. 2013, 4, 1–8. [CrossRef][PubMed]
11. Tielrooij, K.; Paparo, D.; Piatkowski, L.; Bakker, H.; Bonn, M. Dielectric relaxation dynamics of water in model membranes probedby terahertz spectroscopy. Biophys. J. 2009, 97, 2484–2492. [CrossRef]
12. Trejo-Soto, C.; Costa-Miracle, E.; Rodríguez-Villarreal, I.; Cid, J.; Alarcón, T.; Hernández-Machado, A. Capillary filling at themicroscale: Control of fluid front using geometry. PLoS ONE 2016, 11, e0153559.
13. Bassolino-Klimas, D.; Alper, H.E.; Stouch, T.R. Mechanism of solute diffusion through lipid bilayer membranes by moleculardynamics simulation. J. Am. Chem. Soc. 1995, 117, 4118–4129. [CrossRef]
14. Feller, S.E. Molecular dynamics simulations of lipid bilayers. Curr. Opin. Colloid Interface Sci. 2000, 5, 217–223. [CrossRef]15. Berkowitz, M.L.; Bostick, D.L.; Pandit, S. Aqueous solutions next to phospholipid membrane surfaces: Insights from simulations.
Chem. Rev. 2006, 106, 1527–1539. [CrossRef] [PubMed]16. Orsi, M.; Haubertin, D.Y.; Sanderson, W.E.; Essex, J.W. A quantitative coarse-grain model for lipid bilayers. J. Phys. Chem. B 2008,
112, 802–815. [CrossRef] [PubMed]17. Simons, K.; Toomre, D. Lipid rafts and signal transduction. Nat. Rev. Mol. Cell Biol. 2000, 1, 31–39. [CrossRef] [PubMed]18. Giacomello, M.; Pyakurel, A.; Glytsou, C.; Scorrano, L. The cell biology of mitochondrial membrane dynamics. Nat. Rev. Mol.
Cell Biol. 2020, 21, 204–224. [CrossRef]19. Sessa, L.; Concilio, S.; Walde, P.; Robinson, T.; Dittrich, P.S.; Porta, A.; Panunzi, B.; Caruso, U.; Piotto, S. Study of the interaction of
a novel semi-synthetic peptide with model lipid membranes. Membranes 2020, 10, 294. [CrossRef]20. Lu, H.; Martí, J. Influence of cholesterol on the orientation of the farnesylated GTP-bound KRas-4B binding with anionic model
membranes. Membranes 2020, 10, 364. [CrossRef]21. Aragón-Muriel, A.; Liscano, Y.; Morales-Morales, D.; Polo-Cerón, D.; Oñate-Garzón, J. A study of the interaction of a new
benzimidazole schiff base with synthetic and simulated membrane models of bacterial and mammalian membranes. Membranes2021, 11, 449. [CrossRef]
22. Zec, N.; Mangiapia, G.; Hendry, A.C.; Barker, R.; Koutsioubas, A.; Frielinghaus, H.; Campana, M.; Ortega-Roldan, J.L.; Busch,S.; Moulin, J.F. Mutually beneficial combination of molecular dynamics computer simulations and scattering experiments.Membranes 2021, 11, 507. [CrossRef]
23. Radhakrishnan, N.; Kaul, S.C.; Wadhwa, R.; Sundar, D. Phosphatidylserine Exposed Lipid Bilayer Models for UnderstandingCancer Cell Selectivity of Natural Compounds: A Molecular Dynamics Simulation Study. Membranes 2022, 12, 64. [CrossRef][PubMed]
24. Trejo-Soto, C.; Lázaro, G.R.; Pagonabarraga, I.; Hernández-Machado, A. Microfluidics approach to the mechanical properties ofred blood cell membrane and their effect on blood rheology. Membranes 2022, 12, 217. [CrossRef] [PubMed]
25. Hu, Z.; Marti, J. In silico drug design of benzothiadiazine derivatives interacting with phospholipid cell membranes. Membranes2022, 12, 331. [CrossRef] [PubMed]
26. Asare, I.K.; Galende, A.P.; Garcia, A.B.; Cruz, M.F.; Moura, A.C.M.; Campbell, C.C.; Scheyer, M.; Alao, J.P.; Alston, S.; Kravats,A.N.; et al. Investigating Structural Dynamics of KCNE3 in Different Membrane Environments Using Molecular DynamicsSimulations. Membranes 2022, 12, 469. [CrossRef]
4

membranes
Article
Mutually Beneficial Combination of Molecular DynamicsComputer Simulations and Scattering Experiments
Nebojša Zec 1, Gaetano Mangiapia 1, Alex C. Hendry 2, Robert Barker 3, Alexandros Koutsioubas 4,
Henrich Frielinghaus 4, Mario Campana 5, José Luis Ortega-Roldan 2, Sebastian Busch 1,*
and Jean-François Moulin 1,*
Citation: Zec, N.; Mangiapia, G.;
Hendry, A.C.; Barker, R.; Koutsioubas,
A.; Frielinghaus, H.; Campana, M.;
Ortega-Roldan, J.L.; Busch, S.;
Moulin, J.-F. Mutually Beneficial
Combination of Molecular Dynamics
Computer Simulations and Scattering
Experiments. Membranes 2021, 11, 507.
https://doi.org/10.3390/membranes
11070507
Academic Editors: Jordi Marti and
Carles Calero
Received: 2 June 2021
Accepted: 29 June 2021
Published: 5 July 2021
Publisher’s Note: MDPI stays neutral
with regard to jurisdictional claims in
published maps and institutional affil-
iations.
Copyright: © 2021 by the authors.
Licensee MDPI, Basel, Switzerland.
This article is an open access article
distributed under the terms and
conditions of the Creative Commons
Attribution (CC BY) license (https://
creativecommons.org/licenses/by/
4.0/).
1 German Engineering Materials Science Centre (GEMS) at Heinz Maier-Leibnitz Zentrum (MLZ),Helmholtz-Zentrum Hereon, Lichtenbergstr. 1, 85748 Garching bei München, Germany;[email protected] (N.Z.); [email protected] (G.M.)
2 School of Biosciences, University of Kent, Canterbury CT2 7NJ, UK; [email protected] (A.C.H.);[email protected] (J.L.O.-R.)
3 School of Physical Sciences, University of Kent, Canterbury CT2 7NH, UK; [email protected] Jülich Centre for Neutron Science (JCNS) at Heinz Maier-Leibnitz Zentrum (MLZ), Forschungszentrum Jülich,
Lichtenbergstr. 1, 85748 Garching bei München, Germany; [email protected] (A.K.);[email protected] (H.F.)
5 ISIS Neutron and Muon Facility, Rutherford Appleton Laboratory, Science & Technology Facilities Council,Didcot OX11 0QX, UK; [email protected]
* Correspondence: [email protected] (S.B.); [email protected] (J.-F.M.);Tel.: +49-89-158860-764 (S.B.); +49-89-158860-762 (J.-F.M.)
Abstract: We showcase the combination of experimental neutron scattering data and moleculardynamics (MD) simulations for exemplary phospholipid membrane systems. Neutron and X-rayreflectometry and small-angle scattering measurements are determined by the scattering lengthdensity profile in real space, but it is not usually possible to retrieve this profile unambiguously fromthe data alone. MD simulations predict these density profiles, but they require experimental control.Both issues can be addressed simultaneously by cross-validating scattering data and MD results. Thestrengths and weaknesses of each technique are discussed in detail with the aim of optimizing theopportunities provided by this combination.
Keywords: neutron reflectometry; X-ray reflectometry; small-angle neutron scattering; small-angleX-ray scattering; molecular dynamics simulations; scattering length density profile; phospholipidmembrane
1. Introduction
Phospholipid-based bilayers are the main components of biological membranes andrepresent their basic structural elements [1]. The main role of the cell membrane is to protectthe cell from its surroundings, allowing it to have a well-defined environment and accomplishits vital functions [2]. Given the importance of the membrane, structural details for the cellbiology, several characterization methods have been used to investigate the structure underdifferent conditions (microscopy [3,4], spectroscopy [5,6], scattering methods [7–10] andsimulations [11–14]). Of special interest in this paper are the scattering methods that giveaccess to the structure and dynamics of the system under investigation. These methodsare non-invasive, non-destructive over the duration of the data collection and probe a largesample volume, thus providing statistically relevant information [15]. The typical membranelength scales are relatively large compared to atomic dimensions, hence the focus of thiswork is on scattering by large-scale structures which can be investigated by reflectometryand small-angle scattering methods.
Fundamentally, two main types of probe can be used for these scattering experiments:X-rays and neutrons. Laboratory X-ray sources provide the possibility of performing
Membranes 2021, 11, 507. https://doi.org/10.3390/membranes11070507 https://www.mdpi.com/journal/membranes5
Membranes 2021, 11, 507
many useful experiments and high-flux synchrotron sources make very fast and extremelysensitive measurements feasible. Neutron scattering experiments can only be performedat large-scale facilities, but they nevertheless play a fundamental role in the landscape ofmembrane characterization methods [16–19]. In contrast to X-rays, neutrons interact in anon-destructive fashion with the material under examination. Due to their weak interactionwith matter, neutrons have a large penetration depth for most materials, allowing for anelaborate sample environment. Being scattered by the nuclei, and not by the electronsas in the case of X-rays, neutrons offer the possibility to add isotopic sensitivity to themeasurements. As a great opportunity for biological systems, the neutron scattering powerof hydrogen and deuterium differs widely and neutrons are thus extremely sensitive to thedistribution of hydrogen in the sample. The most obvious strategy for taking advantageof this property is to perform measurements on membranes prepared in light or heavywater, but more complex (and more costly) isotopic substitution methods targeting specificmolecular sites can also be utilized.
All scattering methods provide a description in reciprocal space, which can be un-derstood as the Fourier transform of the structure of the sample. The data thus tell aboutperiodicity and spatial correlation in the sample [20,21]. The interpretation of such data isby no means intuitive and the eventual aim of all measurements is to describe the actualposition of all atoms or molecules in the sample. In the process of inverting the informationcontained in scattering data from reciprocal to real space, problems arise (in particular, thephase problem [21]), which usually hinders finding an unequivocal solution. To tackle thisissue, independent information must be found in order to put constraints on the inversionproblem. Unfortunately, there is no available experimental method offering the neededspatial resolution over the required length scales. Nevertheless, computer simulations inthe framework of Molecular Dynamics (MD) provide invaluable insights in the real spacestructure of these complex systems.
MD simulations applied to phospholipid membranes provide an atomic-level de-scription of the system. The positions of individual atoms are followed by numericallysolving classical equations of motion. Therefore, MD simulations provide atomic resolutionunavailable to the experiments presented here. Combining MD simulations and scatteringexperiments is beneficial for studying phospholipid membranes but can also be used forthe structural analysis of completely unrelated systems [22].
MD and the experimental methods described here (SAS and reflectometry) probe thesample’s structure over a limited range of length scales. Those ranges overlap, and, hence,cross-validation is only possible over this restricted domain [23]. Another important aspectto consider is the fact that an MD simulation typically only describes a very brief timeinterval while the integration times used for data acquisition in NR and SANS are orders ofmagnitude longer (from seconds to hours). Similarly, simulations typically cover some cubenanometers, while experiments tend to average over cube millimeters. Precautions mustthus be taken to ensure that MD simulations do not merely describe transient structureswhich would be averaged out in the measurements. Conversely, simulations give access tothe Ångström scale, which is not directly probed by these experimental techniques.
In classical MD simulations, the interaction potential energy is described in the formof a force field, based on both empirical and quantum chemical data. Validation of theforce-field parameters is a tedious and challenging task, so online topology and force-fieldparameter builders have become popular as a simple solution [24–26]. One has to bevery critical of the parameters obtained in this way and ensure that the theoretical modeland applied methodology describe the molecule of interest “reasonably well”. On theother hand, besides lower spatial resolution compared to the MD and the phase problem,small-angle scattering and reflectometry experiments have additional experimental uncer-tainties related to the sample and instrumentation. It is therefore theoretically possible thatinaccurate experimental data match an incorrect MD simulation perfectly.
To successfully combine these techniques, a certain level of understanding of bothscattering experiments and computer simulations is essential in order to fully understand
6
Membranes 2021, 11, 507
the advantages and limitations of both methods and avoid putting too much (or too little)confidence in the results extracted from one of these methods alone. One can use MDsimulation trajectories to extract neutron scattering length density profiles, directly calculatethe corresponding reflectivity or small-angle scattering pattern and plan an experiment inorder to optimize the use of beam-time at large-scale facilities. One can see the effect ofchanging different parameters such as instrumental resolution, get a hint as to whetherthe effect can be experimentally observed and plan an experiment in an effective andefficient manner.
In this article, the study of a single bilayer of DMPC (1,2-dimyristoyl-sn-glycero-3-phosphocholine) and multilamellar SoyPC (mainly composed of 1,2-dilinoleoyl-sn-glycero-3-phosphocholine) is used to showcase the joint use and cross-validation of MD simulationand scattering experiments. DMPC is a double-saturated phospholipid composed oftwo myristoyl chains, used in many biophysical studies [27,28] and as an excipient inpharmaceutical formulations [29]. SoyPC is a mixture of phospholipids found in soy andused as a model bilayer in some studies aimed at investigating the interaction of cellmembranes and active ingredients [30,31]. The aim of this work is not so much to discussthe properties of the selected phospholipids as to describe the methodology of combiningsimulation and experiment and the challenges behind it. Since there are many things thatcan go wrong in both, it is important to establish the methodology and find sources ofpotential errors before focusing on more complex systems.
The approach to combine simulations with scattering experiments is not new; it wasfor example used to study peptide self-organization into switchable films at an air–waterinterface by Xue et al. [32] and by Vanegas et al. [33] to study the insertion of the denguevirus envelope protein into phospholipid bilayers. These techniques were also applied toinvestigate the contact angles and adsorption energies of nanoparticles at the air-liquidinterface [34]. Back in 2005, Benz et al. [23] developed a protocol for comparing MDsimulations with X-ray (XRR) and neutron reflectivity (NR) and showed that neither theunited-atom GROMACS nor the CHARMM22/27 force fields could reproduce experimen-tal data. More recently, a method for producing continuous scattering length density (SLD)profiles from MD simulations has been presented for interpreting reflectivity data fromphospholipid bilayers [35]. Koutsioubas [36] performed coarse-grained MD simulationswith the standard MARTINI force field and obtained quantitative and semi-quantitativeagreement with neutron reflectivity data for DPPC membranes in the liquid and gel phase,respectively. On the other hand, McCluskey et al. [37] observed that the MARTINI poten-tial model did not accurately describe the 1,2-distearoyl-sn-phosphatidylcholine (DSPC)monolayer, while the Berger and Slipid potential models showed better agreement.
Several computer programs for reading MD simulation trajectories, calculating thescattering length density profile and neutron reflectivity, and making direct comparisonwith the experiment have been developed over the years. SIMtoEXP [38] and Neutron-RefTools (as a VMD plug-in) [39] were developed particularly for phospholipid membraneresearch. The high number of citations shows that these solutions have been accepted andregularly used by the scientific community. Being completely aware of their existence, weemploy here a self-written software solution that will be published soon.
In the following, we describe the different techniques, show two examples of phospho-lipid molecules in two different morphologies and discuss the robustness of experimentalfeatures and their constraints on real space structure.
2. Background
In order to provide the tools needed in the discussion, this section introduces somefundamentals of scattering theory and puts them in the context of the present problem.Keeping in mind the typical expectations of the computer simulation community, thestrong points as well as the pitfalls of the scattering methods are stressed along the way.Momentum transfer �Q, the natural variable against which scattering intensity is measuredin an actual experiment, is introduced first. This variable takes the radiation characteristics
7
Membranes 2021, 11, 507
(wavelength) and the geometrical details of the experiment into account. The SLD, whichdescribes how strongly a given medium will scatter as a function of its composition, is thenintroduced and used to express the index of refraction, which in turn is used to predict thepropagation of neutrons or photons (both considered as waves) in matter and eventuallyanalyze reflectometry and small-angle experiments.
Neutron and X-ray scattering experiments measure the number of scattered neu-trons/photons as a function of the vector �Q, which describes the momentum transfer thewave undergoes upon scattering. �Q is a function of the experiment geometry, which wesymbolically represent here by θ, and of the wavelength of the radiation used, λ:
�Q(θ, λ) = �k f − �ki (1)
where �ki and �k f are the wave vectors of the incident and scattered radiation, respectively.
∣∣∣�Q∣∣∣ = Q ∝2π
l(2)
signifies that the modulus of each Q vector in reciprocal space is associated with an inter-distance l in direct (real) space, which is characteristic of the size of the scattering structurein the corresponding direction.
The practical problem is to compute the real space sample structure which is compat-ible with the scattering intensity distribution, measured in the reciprocal or Q space. Intackling this task, which is central to the whole crystallography field, the most fundamentalobstacle is the phase problem. What the detectors actually measure is the intensity, i.e.,square of the amplitude of the scattered waves. Consequently, all information relative to thephase of those waves is irremediably lost. From the measurement, it is therefore impossibleto unequivocally deduce the positions of the scattering particles in an absolute way and agiven experimental dataset can correspond to a multitude of real-space structures.
There are several ways to work around this ambiguity: First, one can gain additionalexperimental data by performing measurements for specifically adjusted scattering con-trast of the different constituents without affecting the sample’s structure [40]. How thisis practically achieved is discussed in detail in the next sections. While this reduces thenumber of possible real-space structures considerably, a usually unachievable n(n + 1)/2contrasts would have to be measured to be able to solve the real-space structure of n compo-nents from the data analytically—and even if that many measurements can be performed,experimental imperfections and limited counting statistics limit their usefulness [41].
A second method is to form periodic structures in the system. In the case of mem-branes, this can for example be achieved by using stacks of bilayers (multilayers) that areperiodic in the direction of the membrane normal. This leads to the formation of Braggpeaks in the scattered intensity at values of Q where the phase is either 0◦ or 180◦. In atraditional approach, one would then use only the scattered intensity at the Bragg peakpositions where the phase can be determined [42]. Although this approach leaves thewhole information contained in the rest of the scattering pattern unused, the SLD profilecan be reconstructed precisely if many Bragg peaks are measured. In reality, however, it isonly possible to measure ∼2–5 Bragg peaks due to the disorder inherent in the system andexperimental limitations, severely limiting the precision of the extracted information. It isalso possible to take the whole scattering pattern into consideration (see [43] and referencestherein), but the presence of Bragg peaks makes the precise measurement of the specularreflectivity between the Bragg peaks somewhat unreliable, as discussed below.
Complementary to these experimental approaches, one can use a theoretical approachin which a real-space model of the system is built with as many external constraintsas possible. The MD method is here the instrument of choice. As shown elsewhere,although one needs to take care of several practical details [22,35,38,39], it is relativelystraightforward to compute the scattering pattern corresponding to an MD simulatedstructure and compare it to the experimental data. This goes beyond the normal fitting
8
Membranes 2021, 11, 507
procedure in which a set of parameters describing the structure is optimized in order toreproduce the data. While this method cannot prove the accuracy of a given model, it can,however, falsify many models, which must not be underestimated.
2.1. Scattering Length Density
In the following, we briefly describe the scattering processes and introduce the fun-damental concept of scattering length density and its influence on the transmission andrefraction of the waves in a medium. At the end of this section, the practical possibilityof taking advantage of probe type and isotopic composition to control scattering contrastis apparent.
The treatment for X-rays and neutrons is very similar and differs only in the interactionof the corresponding radiation with matter. Neutrons interact with the nuclei (we leaveaside the magnetic interactions with electrons, which is generally less relevant for the studyof biological materials) while X-rays, being an electromagnetic wave, interact with theelectron cloud. We thus here use the general wording “wave” and show probe-specificexpressions only where relevant.
The interaction between a wave and a medium is described in quantum mechanicalterms by the average potential V
V =2πh2
mρ (3)
where m is the neutron mass, h the Planck constant divided by 2π, and
ρ =1
volume ∑j
bj (4)
is the so-called scattering length density of the medium (which we also denote by SLD)and is the result of the superposition of all contributions bj (scattering lengths) describingthe interaction strength of each individual scatterer j.
A general solution of the Schrödinger equation which satisfies the potential V anddescribes the propagation of a wave at every point�r in the medium is
Ψ(�r) = A exp(
in�k0 ·�r)
(5)
where n is the complex index of refraction relating k0, the wave momentum in vacuum,and k, the momentum it would have in a material medium,
n =kk0
. (6)
The real part of n describes the wave phase velocity in the medium, while the imagi-nary part describes the absorption phenomena by damping the wave intensity, which isthe square of the modulus of Ψ. In the neutron case, the absorption is usually negligiblysmall and n is a real number.
Similar to what we experience in everyday life while looking at things, scatteringmethods give us the ability to distinguish different parts of the samples from each otheronly if their indices of refraction differ, irrespective of their chemical nature.
For X-rays, the scattering length is proportional to the product of the atomic numberZ and the classical electron radius or Thomson scattering length r0 ≈ 2.82 fm. The energydependence of the scattering length, which varies abruptly around absorption edges, isdescribed by semi-empirical atomic scattering factors f1 and f2, leading to the followingexpression for the refraction index where N denotes the number concentration of thegiven atom:
nX = 1 − 12π
Nr0λ2( f1 + i f2) (7)
9
Membranes 2021, 11, 507
For neutrons, the energy-independent nuclear scattering length b substitutes theelectron radius in the previous expression and one gets
nn0 = 1 − 12π
λ2ρ . (8)
As can be intuitively expected from the nature of their interaction, in the case ofneutrons the scattering lengths of different isotopes of the same element differ from eachother. This isotopic dependency of b is seemingly random [44], but it is very interesting toobserve that, in the case of hydrogen and deuterium, the difference is very large, bH being−3.74 fm for hydrogen and bD = 6.67 fm for deuterium.
From those observations, it is clear that X-rays and neutrons will experience a differentindex of refraction between the components of the sample, thereby introducing a contrastbetween those regions. As hinted in the Introduction, one can thus obtain additionalindependent information about the system under investigation by: (a) combining X-rayand neutron measurements; and/or (b) varying the isotopic composition of the sampleused for neutron scattering while keeping its chemical composition and structural detailsessentially unchanged. In the context of molecular biology, it is clear that advantage can betaken of this method by tuning the isotopic composition of the ubiquitous water molecules.By simply mixing H2O and D2O, one can adjust the contrast with precision [45,46]. Morecomplex isotopic substitution schemes, for instance at specific molecular sites, can also beused to achieve more targeted control [47,48].
2.2. Reflectometry
Reflectometry takes advantage of the variation of the index of refraction across planarinterfaces in order to investigate structural and compositional profiles.
When a wave impinges on a flat and smooth horizontal surface separating two media(denoted 1 and 2), it can be reflected back into the original medium (reflection into 1) orrefracted into medium 2. Since the ideal interface we describe is an SLD fluctuation alongthe vertical direction only, it cannot affect the in-plane components of the incident wave’smomentum. The reflection is purely specular and happens under the same angle as theangle of incidence.
The convenient variable to describe this problem is again the momentum transfervector �Q, which is here strictly vertical:
�Q = �k f − �ki =∣∣∣�Q∣∣∣ · �nz = Qz · �nz , (9)
where �nz is the unit vector along the vertical direction, z.Since we are only considering elastic scattering, the norm of the momentum of the
wave is conserved and
Qz =4π sin(θ)
λ(10)
where θ is the angle of incidence on the surface.Regarding the refracted wave, since the index of refraction differs in the two media
k1/k2 = n2/n1, (11)
and, following the above argument that the in-plane components of k cannot change, we get
n1 cos(θ1) = n2 cos(θ2) (12)
where θ1 is the angle of incidence and θ2 is the refraction angle, both measured betweenthe surface and the corresponding propagation vector. The above relationship is no otherthan Snell’s law of optics, which also holds for neutrons and X-rays.
10

Membranes 2021, 11, 507
From this relation, if the index of refraction is smaller than 1 (often the case forneutrons and X-rays), there exists a critical Q below which θ2 will be zero, i.e., below whichthe incident wave will undergo total reflection by the interface:
Qc = 4√
π(ρ1 − ρ0) (13)
The amplitude reflectivity (r) and amplitude transmitivity (t) of the surface are givenby the Fresnel relationships, which can be derived from continuity conditions. Applyingthe small-angle approximation, which holds in the case of reflectometry measurements,leads to [49]
r =AreflectedAincident
=θincident − θrefractedθincident + θrefracted
and (14)
t =ArefractedAincident
=2θincident
θincident + θrefracted, (15)
where A represents the respective amplitudes.In the case of stratified media on a semi-infinitely thick substrate, a valid description
of practical experiments one might perform to study supported thin films, the impingingwave can undergo reflection or refraction at each interface. The wave emerging from thesurface is the superposition of all the waves which have traveled paths through the samplethat do not end up being transmitted into the semi-infinite substrate.
Similar to the simple case of a single interface, one can express the amplitude re-flectivity and the amplitude transmitivity via the Fresnel equations. Starting from thesemi-infinite substrate where no multiple reflections are to be considered, one can then re-cursively reconstruct the reflectivity at the topmost surface. This method, which leads to anexact result, was introduced by Parratt [50]. A computationally convenient method basedon the formalism of optical transfer matrices was independently proposed by Abelès [51,52]and leads to the same exact result.
If the interface between regions of different SLD is diffuse rather than sharp as as-sumed above, two approaches can be used for the evaluation of the reflectivity. Thefirst approximation was proposed by Névot and Croce [53]. It introduces an interfacialroughness factor which damps the reflected waves and which is expressed in a similarway as the Debye–Waller factor describing, in crystallography, the effect of the thermalmotion blurring the atomic positions and thereby lowering the diffracted intensities. Inthis model, the position of the interface is described as normally distributed around itsnominal position with a given standard deviation σ. The corresponding SLD profile isa smooth transition from one SLD to the next in a sigmoidal step described by the errorfunction associated to the standard deviation. This approach has the obvious advantage ofdescribing the diffuse interface by a single number. However, it has to be stressed that thisapproximation is only valid if the roughness is much smaller than the layer thickness.
The second method used to deal with diffuse interfaces, while more computationallydemanding, makes it possible to describe arbitrary SLD profiles. In this second approach,the SLD profile is simply discretized into bins thin enough to ensure that they can beconsidered to be of constant SLD. The reflectivity computation can then follow withoutfurther approximation by means of either the Paratt or the Abeles algorithm. Althoughthis approach is potentially able to better “follow” the actual SLD profile and can deal withdiffuse areas too broad to be safely described by a Nevot–Croce roughness parameter, itlacks the ability to condense structural information in simple and clear parameters suchas layer thickness, width of a transition region, etc. Such a convenient description can ofcourse nevertheless be obtained a posteriori by adjusting an analytical model to the binnedSLD profile used for the simulations.
It should be kept in mind that, whatever the chosen approach used to describe diffuseSLD transition regions, different lateral distributions of matter could lead to the same SLDprofile along the vertical. The in-plane fluctuations, which have been averaged out here,
11

Membranes 2021, 11, 507
would be the cause of the off-specular scattering. The two types of reflections—specularand off-specular—can be easily understood with the help of an everyday-life analogy: thespecular (literally, mirror-like) behavior is what we observe when we contemplate thesunset reflection on the surface of a perfectly still lake, on a windless evening. This imageof an undeformed sun tells us that the surface of the water is perfectly flat (and reflective).If we repeat this contemplation while a strong wind is blowing, we will only be able tosee a blurry image of the sun on the water surface: the lateral structures on the surface,its roughness, will reflect the light away from the expected ideal trajectory, hence in anoff-specular or non-specular way. A detailed analysis of the blurred image could lead to anunderstanding of the details of the wavy surface. Practical implications of the presence ofoff-specular scattering are discussed briefly when dealing with actual measurements.
The description of the specular reflectivity evaluation for a given SLD profile givenabove is exact and can be used for numerical evaluations. It is, however, interesting to keepthe results obtained in the framework of the first Born approximation in mind, i.e., in thelimit of weak scattering. In this case, one gets the “master-equation of reflectivity” [49]:
R = RFresnel
∣∣∣∣∫ dρ
dzexp(iQz)dz
∣∣∣∣2
(16)
which relates the reflectivity of an interface with arbitrary interfaces to the reflectivity of amultilayer with sharp interfaces (RFresnel) and the spatial rate of change of the SLD, ρ.
The Born approximation clearly does not hold for small values of Q, for which manyreflections or even total reflection take place, but it can be used to gain intuition aboutthe reflectivity observed at large Q. This expression of scattering as a Fourier transformof real space makes it clear that the reflectivity curve of a layer of thickness l will displayoscillations as a function of Q having a period given by 2π/l. In the case of periodicstructures such as those encountered, for instance, in multilayered phospholipids, intensitywill build up at specific locations in Q space and appear as the Bragg peaks known indiffraction. Moreover, it is clear from this expression that only regions which display an SLDcontrast (i.e., where the derivative of the SLD is not zero) will contribute to the reflectivity.Last but not least, this Fourier-transform approach also helps understand the origins ofthe spatial resolution limits of the scattering methods: the maximal observed Q value willdetermine the size of the smallest object which can be resolved by a scattering experiment.
Reflectometry is the method of choice when focusing on planar surfaces or buriedinterfaces. The sample consists of ∼10 cm2 substrate covered with a sample layer, resultingin very low amounts of sample required for an experiment. The measurement geometrymeans that one is exclusively sensitive to the direction along the interface normal inspecular scattering and can get separate information about in-plane correlations throughoff-specular scattering.
2.3. Small-Angle Scattering
Differently from reflectometry, which probes the characteristics of planar interfaces,in a small-angle scattering (SAS) experiment, the characteristics of scattering objects (gels,polymer blends, porous structures, micelle aggregates, etc.) are measured in bulk [54]. InSAS geometry, a collimated beam hits a sample, such as an aqueous solution or a solid,and is (elastically) scattered. As the name indicates, only scattering at low angles (≤30 deg)is recorded by a detector. For isotropic samples, the scattering pattern has no azimuthaldependence and depends uniquely on the modulus of the vector �Q, Q = 4π sin(2θ/2)/λ,where 2θ is the scattering angle. From reduction of the experimental data, an importantquantity, namely the scattering cross section dΣ/dΩ, is obtained as a function of �Q. Thisquantity represents the ratio between the number of particles (photons or neutrons) that inthe unit of time are scattered in a certain direction reaching a solid angle element dΩ andthe product between the flux of the incident particles on the sample and the value of thesolid angle element itself. dΣ/dΩ provides important information about the shape of thescattering structures inside the sample, as well as on the inter-particle interactions [55].
12

Membranes 2021, 11, 507
In contrast to reflectometry, the first-order Born approximation is used for the evaluationof SAS data over the whole Q range since multiple scattering effects can usually be neglected.This simplifies data evaluation since, under this approximation, dΣ/dΩ may be expressed asthe square modulus of the Fourier transform of the SLD profile ρ(�r) [56]:
dΣdΩ
=∣∣∣ρ(�r) exp
(i�Q�r
)d3�r
∣∣∣2 (17)
For the case of scattering from objects with spherical symmetry, integration may becarried out in spherical coordinates and Equation (17) may be simplified to:
dΣdΩ
=
∣∣∣∣4π∫
ρ(r)r2 sin(Qr)Qr
dr∣∣∣∣2
(18)
which can be used to simulate the cross section starting from the knowledge of the SLDprofile obtained from MD.
Compared to reflectometry, where the surface to be probed is suitably prepared on anoptically smooth surface, SAS experiments are performed in bulk. The sample is thereforecertainly not perturbed by the addition of a substrate. The absence of a substrate alsomeans that it does not have to be described in the model to evaluate the data. Last but notleast, the sample preparation is typically easier than the preparation of samples used inreflectometry, where many experimental efforts must be provided to deposit a layer onthe substrate.
2.4. Molecular Dynamics Simulations
There are several ways to perform atomistic or coarse-grained computer simulationsof phospholipid membranes, in particular using Monte-Carlo (MC) or Molecular Dynamics(MD) approaches. In both cases, the interaction potentials between all atoms in the systemhave to be defined in a force field. There are two parts to a force field: the functional formsof the potentials (e.g., exponential or polynomial) and the parameters in these functions.The choice of the appropriate force field (all-atom, united-atom or coarse grained) andits parameters is the crucial step in every MD simulation. Among many available forcefields (AMBER, GROMOS, OPLS, CHARMM, etc.) and their variations, the one validatedagainst the reliable experimental data for the molecules of interest has to be used [57]. Ifthere is no reliable force-field validation data in the literature or if the simulation doesnot reproduce experimental data, non-trivial force-field parameterization is required. Forgenerating multi-component lipid membrane configurations for MD simulations, there arethe MemGen web server [58] and Packmol package [59].
The simulations necessarily simplify the system enormously; a striking example is thecontraction of the atoms’ electron clouds into usually fixed point-like partial charges, herebyremoving, inter alia, polarizability effects. The simulations can therefore not be expected toreproduce all the properties of the membrane at the same time. The art of creating a forcefield is therefore to tune the functions and parameters such that the quantities of interestare reproduced while others can be incorrect.
MD simulations produce trajectories depicting the motions of atoms over a specifiedsimulation time, usually on the nanosecond to microsecond timescale—depending on theforce-field complexity and available computational resources. Some of the most impor-tant analyses, technical challenges and existing protocols that can be performed on MDtrajectories of the phospholipid membrane were reviewed by Moradi et al. [60]. However,biological processes related to phospholipid membranes are complex and usually challeng-ing either from an experimental or computational aspect. This comprises membrane poreformation, membrane fusion, stalks, domains and curvatures [11,12,61].
13

Membranes 2021, 11, 507
3. Materials and Methods
3.1. Materials
For the experiments on a single supported bilayer of DMPC (1,2-dimyristoyl-sn-glycero-3-phosphocholine, Avanti polar lipids), lipids were dissolved in chloroform fol-lowed by solvent evaporation under a stream of nitrogen gas. The lipids were subsequentlydissolved in 50 mM HEPES, 50 mM NaCl pH 7.3 buffer followed by sonication to producevesicles, before being pumped across the reflectivity cell to form a continuous bilayer in50 mM HEPES, 50 mM NaCl pH 7.3 buffer.
The substrate for the DMPC bilayer consisted of a highly polished silicon blockcoated with a natural silicon oxide layer. The reflectivity cell was connected to a sys-tem where a HPLC pump was used to run the buffers through the sample. Four buffercontrasts were used in these experiments: H2O with SLD = −0.56 × 10⁻⁶ Å−2, D2O(SLD = 6.35 × 10⁻⁶ Å−2), silicon matched water (SiMW) composed of 38% D2O and 62%H2O (SLD = 2.07 × 10⁻⁶ Å−2) and 4-matched water (4 MW) composed of 66% D2O and34% H2O, (SLD = 4.00 × 10⁻⁶ Å−2). The mass of DMPC in the neutron beam during thereflectometry experiment was on the order of 1μg.
The experimental procedures used to prepare multilayers of SoyPC have been dis-cussed elsewhere [31] together with the chemicals used. Briefly, the phospholipid mixturewas dissolved in pure isopropanol and the resulting solution was poured on top of anultra-polished silicon mirror. The solvent was then removed by keeping the mirror at firstat reduced pressure and then under vacuum for a few hours. The mirror was then mountedinto a custom-made sample cell and filled with heavy water. In order to visually inspectthe SoyPC layer and check for eventual air bubbles formed after injection of D2O, the cellwas equipped with a glass cover. Samples used for SANS investigations were preparedstarting from a stock solution, dissolving a suitable amount of SoyPC in pure chloroform.The dissolution was favored by a slight warming (40 ◦C) and a very short sonicationtreatment (≈5 min). A thin film was subsequently obtained through slow evaporationof the chloroform in a stream of argon, in order to prevent phospholipid oxidation. Thephospholipid film was hydrated with D2O, and the resulting suspension was vortexed andthen gently sonicated (≈30 min). An aliquot was then repeatedly extruded through a poly-carbonate membrane of 100 nm pore size 11 times. The concentration of the hydrogenatedSoyPC in D2O was 5.0 mmol/kg. The mass of SoyPC in the neutron beam during theSANS experiment was on the order of 1 mg. During the SANS experiment, the sample wascontained in a closed Hellma 404-QX quartz cell that had a thickness of 2 mm, to preventsolvent evaporation.
3.2. Reflectometry
The neutron reflectivity measurements on DMPC were taken at the ISIS and MuonSource at the Rutherford Appleton Laboratory, Harwell Science and Innovation Centre,using the time-of-flight SURF instrument [62]. The neutron wavelength ranges from 0.5to 7 Å, a Q range between ∼0.01 and 0.3 Å −1 was obtained by measuring three differentangles θincident = 0.35◦, 0.65◦ and 1.5◦. The slits were chosen to ensure a footprint of 30 mmby 60 mm at the sample stage with an angular resolution of dQ/Q = 3.5%. Vertical slitswere scaled linearly with angle. The time-of-flight spectra were recorded with a 3He pointdetector [63].
Specular and off-specular reflectivities of the SoyPC multilayer were measured at thevertical reflectometer MARIA [64,65] at Heinz Maier-Leibnitz Zentrum (MLZ) in Garch-ing, Germany, as detailed elsewhere [31]. A neutron beam with an average wavelengthλ = 10.0 Å and a wavelength spread of Δλ/λ = 0.10 was used. A 4.1 m collimation lengthwith entrance and exit openings of 1.0 mm was used to collimate the incident beam. Thesample was mounted on a goniometer and aligned. Reflectivities were measured byvarying the incident angle and recording the pattern of the scattered neutrons with atwo-dimensional 3He position sensitive detector positioned at 1.9 m from the sample. Theexperiments were carried out at room temperature.
14
Membranes 2021, 11, 507
3.3. Small-Angle Scattering
A SANS measurement on SoyPC liposomes was carried out at the KWS-1 diffrac-tometer [66] installed at the Heinz Maier-Leibnitz Zentrum (MLZ) in Garching, Germany.As detailed elsewhere [31], neutrons with average wavelengths of λ = 5.0 Å and a wave-length spread Δλ/λ = 0.10 were used, by means of a mechanical velocity selector. Atwo-dimensional 128 × 128 array 6Li scintillation position sensitive detector measured neu-trons scattered from the sample. Three collimation (C)/sample-to-detector (D) distances(namely, C8/D2, C8/D8 and C20/D20, with all distances in meters) allowed collection ofdata in the scattering vector modulus Q = 4π sin(2θ/2 )/λ ranging between 0.0012 and0.43 Å−1, with 2θ being the scattering angle. The investigated sample was kept undermeasurement for a period so as to have ≈2 million counts of neutrons. The obtainedraw data were corrected for background and empty cell scattering and were then radiallyaveraged. Detector efficiency corrections and transformation to absolute scattering crosssections were executed using a secondary plexiglass standard [67].
3.4. Molecular Dynamics Simulations
MD simulations were carried out using GROMACS 2018.1 package [68]. Initial config-urations were generated using Packmol [59].
1,2-dilinoleoyl-sn-glycero-3-phosphocholine simulations were carried out in a fullyflexible simulation cell containing two phospholipid bilayers consisting of 128 moleculesper bilayer (64 molecules per sheet) and 3000 SPC water molecules between the layerswas simulated at NPT conditions using Parrinello–Rahman pressure coupling and Nosé–Hoover temperature coupling. The pressure was set to 1 atm through a semi-isotropiccoupling with the x/y isothermal compressibility set to 4.5 × 10⁻⁵ bar−1, while the phos-pholipids and water were independently coupled to thermal baths at 300 K with a couplingconstant of 0.1 ps. The simulations were run for 100 ns with a time step of 1 fs. The equa-tions of motion were integrated using the Verlet leap-frog algorithm. The long-rangeelectrostatic interactions after a cut-off distance at 0.8 nm were accounted for by the particle-mesh Ewald (PME) algorithm [69]. The 12-6 Lennard–Jones interactions were treated bythe conventional shifted force technique with a switch region between 1.2 and 1.4 nm.Cross-interactions between different atom types were derived using the standard Lorentz–Berthelot combination rules. United-atom GROMOS 54A7 force-field parameters wereused. The model includes 63 atoms (as opposed to to 134 atoms for the all-atom model)since the hydrogen atoms are integrated into the heavy atoms. Periodic boundary con-ditions (PBC) were applied in all dimensions. The first step of the simulation was anequilibration process for 5 ns. After that, 100 ns of NPT simulation were performed, savingcoordinates every 2 ps for analysis.
DMPC (1,2-dimyristoyl-sn-glycero-3-phosphocholine) simulations of 128 DMPC phos-pholipids and 3655 SPC water molecules were performed with the Berger parameters [70],with the coordinate, force-field and topology files distributed by D. Peter Tieleman(http://wcm.ucalgary.ca/tieleman/downloads, accessed on 1 June 2021). Twenty nanosec-onds of NPT simulation were performed with 1 fs time steps, saving coordinates every 2 ps.The resulting area per phospholipid was found to be 60 Å2, which is the same value as theone obtained by Darré et al. [39] with the CHARMM36 force field and TIP3P water model.
Snapshots were rendered in VMD [71]. The trajectories were either analyzed us-ing TRAVIS-1.14.0 [72,73] and Python scripts written in-house or a new Python programdedicated to this purpose, Made2Reflect. This approach allows automatizing analysis ofvery large trajectories (20–100 ns, i.e., ∼20–30 GB in .pdb format), consequently improv-ing statistics and the calculation of scattering length density profiles on the 10–30 mintimescale. Using Python makes the script flexible and easy to adjust to the specific needsof monolayers, multilayers, substrates, etc. In Travis, the density profile function (DProf)was used to calculate the number density distribution of particles along the z axis, i.e., thedirection perpendicular to the phospholipid membrane. The result is a histogram thatgives the particle density of a selected particle type (either in nm−3 or relative to uniform
15
Membranes 2021, 11, 507
density) in thin slices of the system perpendicular to the chosen vector. The distribution iscalculated for every molecule and each atom type. In the next step, the number distributionwas multiplied by the atomic scattering length obtaining a scattering length density profile.Since the number distribution is calculated for each atom, it allows for a selective deutera-tion, i.e., selective isotopic substitution, simply by multiplying the number distribution ofselected atoms by the scattering length of D instead of H.
4. Results
4.1. Single Bilayer Neutron Reflectivity of a DMPC Bilayer
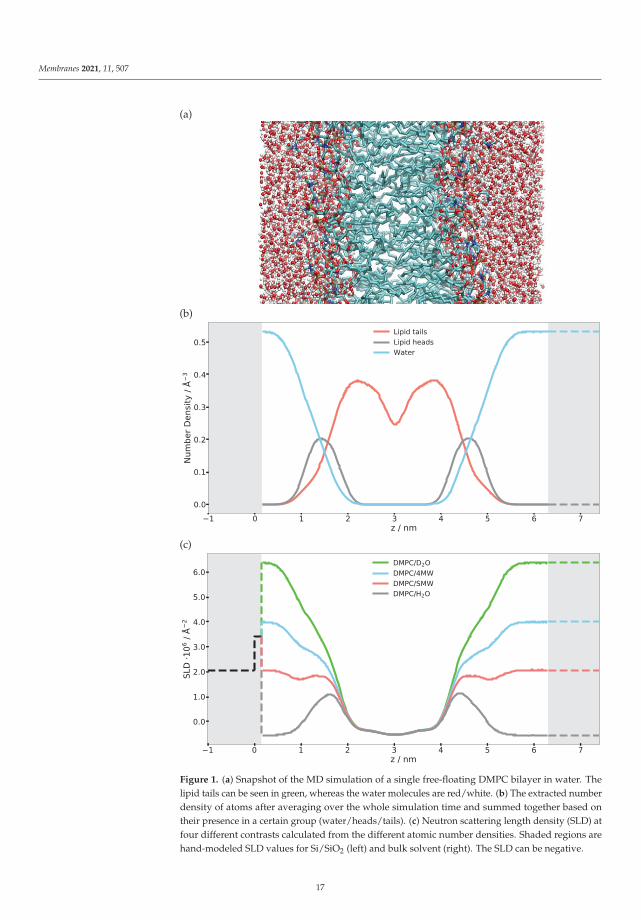
To model the scattering of a single DMPC bilayer, a scattering length density profilehas to be constructed in real space. This can be achieved either by using an analyticapproach where the number densities of different atom types are approximated, e.g., by aGaussian, or using a numerical approach such as the discretized number density generatedfrom MD simulations. We use here the discretized number density profile of each atomtype calculated from the MD simulation so that one can plot and visualize the distributionof the single atom type, specific molecule or its parts. Figure 1 shows the number densitiesof different elements extracted from an MD simulation, summed up for phospholipidheads and tails separately as an example. Many snapshots along the trajectory were slicedinto fine bins (with 0.13 Å thickness) along the z axis, the membrane normal, and thedifferent elements/isotopes were histogrammed in these bins. The time average (using thefull length of the trajectory) was taken and the number densities of each atom type weremultiplied with their respective neutron scattering lengths. The sum of all contributions,i.e., the total scattering length density profile, is also shown in this figure for differentH/D substitutions of the water, i.e., contrast variation—H2O, D2O, water with a scatteringlength density matched to the one of silicon (SiMW, 2.07 × 10⁻⁶ Å−2) and water with ascattering length density matched to be 4 × 10⁻⁶ Å−2 (4 MW).
The first validation step of the calculated SLD profile is to compare the numerical H2O,D2O, SiMW and 4MW SLD values with the theoretical bulk SLD values given as dashedlines on the right-hand side of Figure 1. If these were mismatched, either the densityobtained from the simulation or the SLD calculation would be incorrect. The next stepis to model a semi-infinite silicon substrate with a native SiO2 layer. The SLD, thicknessand roughness of this layer must be obtained through NR measurements and subsequentmodeling of Si/SiO2/D2O and Si/SiO2/H2O. The very same characterized silicon waferis then used for measuring the NR of the phospholipid bilayer. The modeled substrate isgiven with dashed lines on the left-hand side of the SLD profile (Figure 1). Merging thesimulation SLD with the solid substrate SLD has to be performed with caution since onecan produce unwanted artefacts in the reflectivity curve [35]. Particular attention has to begiven to the treatment of the substrate roughness, as shown below.
Figure 2 shows the comparison between the measured NR of a single DMPC bilayerand reflectivity calculated directly from an MD simulation. Very good agreement can beobserved since the MD curves match all four measured contrasts simultaneously. As thesimulations were run without a solid support and the silicon was added by hand whilebuilding the SLD profile, the water layer between the substrate and phospholipid headgroups also has to be adjusted to fit the experimental data [36]. The layer being about 1 nmthick is in agreement with the literature [74]. The effect of changing this thickness on NR isalso shown in Figure 2 (dashed lines). The 5 Å thinner water layer considerably flattensthe bump in the reflectivity. As shown below, the influence of this water layer on NR iscomparatively minor for multilamellar phospholipid systems.
16
Membranes 2021, 11, 507
(a)
(b)
(c)
Figure 1. (a) Snapshot of the MD simulation of a single free-floating DMPC bilayer in water. Thelipid tails can be seen in green, whereas the water molecules are red/white. (b) The extracted numberdensity of atoms after averaging over the whole simulation time and summed together based ontheir presence in a certain group (water/heads/tails). (c) Neutron scattering length density (SLD) atfour different contrasts calculated from the different atomic number densities. Shaded regions arehand-modeled SLD values for Si/SiO2 (left) and bulk solvent (right). The SLD can be negative.
17

Membranes 2021, 11, 507
Figure 2. Neutron reflectivity of a DMPC bilayer on a silicon substrate in water for four different H/Dcontrasts. Points represent experimental data and lines are neutron reflectivity calculated directlyfrom the MD simulations. The curves are shifted along the y axis by a factor 10 each for clarity; theyall extrapolate to R(Q = 0) = 1. Dashed lines show the effect of reducing the water layer thicknessbetween the substrate and phospholipid head groups from 10 to 5 Å.
There are several parameters related to the experimental setup that have to be takeninto consideration when calculating reflectivities from an MD simulation, such as theinstrumental resolution, background scattering and substrate roughness. It can also beseen that only two contrasts (D2O and 4 MW) exhibit a critical edge and that only the D2Omeasurement covers it with data points. This means that, for all but the D2O measurement,one has to rely on the scaling of the measured intensities to absolute values.
4.2. Neutron Reflectivity of a SoyPC Multilayer
The experimented presented in Section 4.1 demonstrated the methodology used ona single phospholipid bilayer. When simulating membrane fusion or stalk formation, ofcourse at least two membranes are required, but, given the low density of stalks, experi-mentally multilayers (some tens to thousands of bilayers) have to be measured in orderto obtain a detectable signal. MD simulations of this many bilayers are neither practicallyfeasible nor useful, since the multilayer can be constructed by repeating the SLD profile ofa single bilayer a suitable number of times. This section focuses on the main new featuresobserved and the data evaluation challenges encountered during the study of a multilayervia reflectometry. As an exemplary system, multilamellar SoyPC was chosen since it washypothesized that, for this phospholipid mixture, the presence of a drug promotes stalksformation [31], and, before MD and scattering methods can be used to look into the detailsof this question, a good description of the pure and unperturbed system is needed. SoyPCis a mixture of five major lipid components; only the most abundant polyunsaturated 1,2-dilinoleoyl-sn-glycero-3-phosphocholine (which we indicate in the following with DLPC, tonot be confused with saturated 1,2-dilauroyl-sn-glycero-3-phosphocholine) was simulatedby MD.
As in the previous case of DMPC, two DLPC bilayers separated by a water layer weresimulated and the obtained SLD is presented in Figure 3 for two different contrasts. Once
18

Membranes 2021, 11, 507
the SLD profile of a single bilayer is extracted from the MD, a multilayer is straightforwardlybuilt by simply repeating the SLD profile n times in z direction. In the case of DLPC, 36phospholipid bilayer repetitions were used. When applying such a perfect periodicity, thismanual merging of two repetitions (usually in the water region) must be performed withcaution so that the thickness of each water layer stays the same. Otherwise, an artificialrupture of symmetry can be introduced and the lattice constant would then be doubled.This would introduce a new peak in the calculated NR, at a Q position correspondingto half that of the first Bragg (demonstrated in Figure 4 as a dashed red peak). It is,however, also easily possible to introduce a certain degree of disorder in this step byadding randomness to the water layer thicknesses. In order to simulate the reflectivity inthis case, one has to produce a large number of such structures and average the simulations.Such an incoherent addition is valid here since it is expected that the lamellar fluctuationsand the corresponding interlamellar distances should be uncorrelated [75].
(a)
(b)
Figure 3. Cont.
19

Membranes 2021, 11, 507
(c)
Figure 3. (a) MD simulation snapshot of the double phospholipid bilayer. (b) SLD profile of the first contrast,H2O/bilayer/H2O/bilayer/H2O. Note that there are negative SLD values. The dash-dotted line indicates the SLDof pure H2O. (c) SLD profile of the second contrast, D2O/bilayer/D2O/bilayer/D2O. The dash-dotted line indicates theSLD of pure D2O.
The SLD profile obtained for multilamellar DLPC in D2O was then used to calculatethe reflectometry curve. The comparison with the experimental data is given in Figure 4. Itis obvious that the simulated reflectivity (blue line) reproduces the first Bragg peak and fitsthe data well up to ≈0.1 Å−1. Between 0.1 and 0.2 Å−1, a discrepancy can be observed.
Figure 4. Experimental neutron reflectivity of SoyPC multilayer in D2O compared with differentmodels. Green line, analytical model published by Mangiapia et al. [31]; blue line, neutron reflectivitycalculated directly from the MD simulation. The dashed vertical line marks the theoretical Qc ofSi/D2O. The dashed red peak reveals the artificial asymmetry in the repartition of the water layerthicknesses (details in the text). The blue line in the inset shows an adjusted MD model (details inthe text).
The measurements of SoyPC were in the past evaluated with an analytical modelconsisting of water, a head group region and a tail group region [31]. The different regions
20

Membranes 2021, 11, 507
were represented by Gaussian density distributions and repeated without disorder. Thealgorithm then varied the flexible parameters of the model, e.g., layer thicknesses, etc.The data could be fitted well (green line in Figure 4) and the parameter results were veryreproducible and independent of the starting parameters: The phospholipid tail regionwas fitted to be only 11 Å thick—a surprisingly small value. The water layer was 42 Åthick. The size of the unit cell (the repeat distance of the bilayers) is very well constrained(66 Å) by the positions of the Bragg peaks in the data. The unit cell size was thereforekept constant by the fit, proportionally enlarging the water layer between bilayers whenreducing the bilayer thickness.
By comparing the MD SLD profile in Figure 3 with the analytical model publishedin [31], it is apparent that the analytic fit of the data proposes a smaller membrane thicknessthan the MD simulation. The water layer thickness in the simulation must be defineda priori by the number of water molecules between the adjacent lipid bilayers in thesimulation box. However, this part of the SLD profile can (and must) be adjusted duringthe SLD profile modeling. Taking the MD model as a starting structure and adjusting thelayer thicknesses, it was possible to reproduce the experimental data (see inset in Figure 4).This suggests that the force field and simulation parameters have to be adjusted to increasethe density and reduce the thickness of the hydrophobic region. It might also mean thatthe MD simulation of a pure DLPC system is structurally still different from the mixturepresent in SoyPC.
Another feature worth noting is shown in Figure 5, which includes a zoom on thecritical edge region. The exact position of the critical edge for total reflection is a functionof the SLD difference between the semi-infinite medium on which the beam is reflectedand the semi-infinite surroundings from which the beam comes. In our case, the beamcomes through the side of a thick silicon wafer and is reflected at the interface with D2O.The exact shape of the reflectivity decay is obviously influenced by the additional layers,but the value of Qc below which the beam is totally reflected must remain the one ofthe material combination Si–D2O. A deviation of the critical edge from the theoreticalposition leads to the suspicion of a possible contamination of the D2O by hydrogenatedmolecules. Two possibilities of hydrogenated molecules come to mind: normal water(H2O) or phospholipids detached from the multilayer whose hydrogenated tails wouldsignificantly lower the overall SLD. In the case of H2O contamination, one would expect itto be homogeneously distributed across all hydrated parts of the sample. In the case ofthe phospholipid contamination, however, the contamination would be confined to thebulk water. Figure 5 shows the effect of both scenarios on the NR starting from the MDsimulated SLD.
The blue reflectivity curve is obtained by scaling the bulk SLD of D2O by a factorof 0.8 on account of detached phospholipids with hydrogen-rich tails diffusing to thebulk. In this case, the SLD of D2O between the bilayers was not scaled. The red dashedcurve is obtained by scaling the SLD of all D2O molecules by a factor of 0.8, simulatingD2O contamination with H2O during the experiments. Since these corrections did notaffect the interlamellar distance, the position of the Bragg peaks is not affected by thischange in contrast. Scaling down the D2O SLD moves Qc close to the observed value.Adjusting the water SLD inside the lamellar structure, as in the hypothesis of light watercontamination, has the effect of reducing the overall contrast of the lamellae and affects theBragg peak intensity and reflectivity in the 0.1–0.15 Å−1 region. One could hope to be ableto discriminate two solvent contamination origins on this basis. However, as shown by thegreen dashed curve in Figure 5, tuning the water SLD has a similar effect on the reflectivityas reducing the number of bilayers in the multilayer.
21
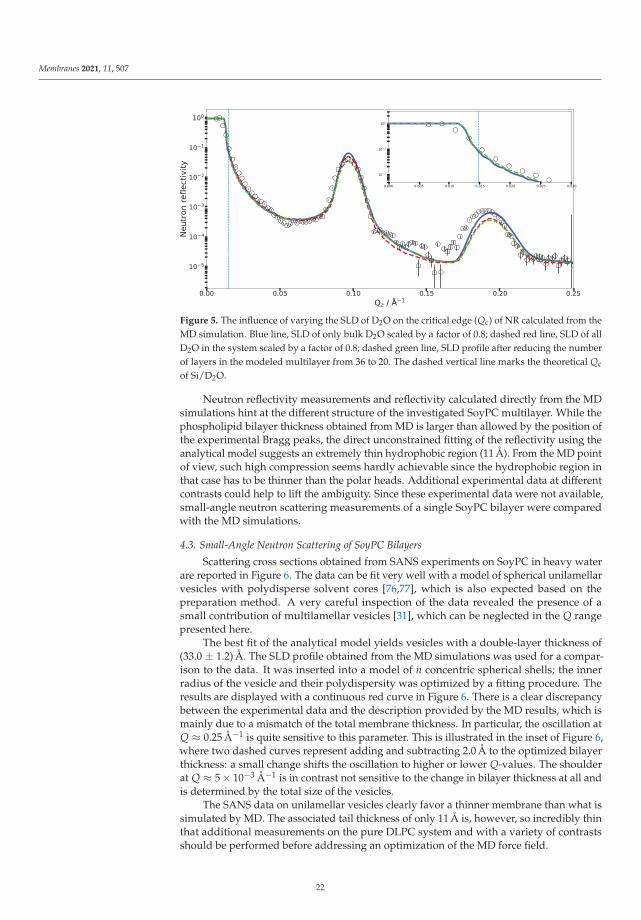
Membranes 2021, 11, 507
Figure 5. The influence of varying the SLD of D2O on the critical edge (Qc) of NR calculated from theMD simulation. Blue line, SLD of only bulk D2O scaled by a factor of 0.8; dashed red line, SLD of allD2O in the system scaled by a factor of 0.8; dashed green line, SLD profile after reducing the numberof layers in the modeled multilayer from 36 to 20. The dashed vertical line marks the theoretical Qc
of Si/D2O.
Neutron reflectivity measurements and reflectivity calculated directly from the MDsimulations hint at the different structure of the investigated SoyPC multilayer. While thephospholipid bilayer thickness obtained from MD is larger than allowed by the position ofthe experimental Bragg peaks, the direct unconstrained fitting of the reflectivity using theanalytical model suggests an extremely thin hydrophobic region (11 Å). From the MD pointof view, such high compression seems hardly achievable since the hydrophobic region inthat case has to be thinner than the polar heads. Additional experimental data at differentcontrasts could help to lift the ambiguity. Since these experimental data were not available,small-angle neutron scattering measurements of a single SoyPC bilayer were comparedwith the MD simulations.
4.3. Small-Angle Neutron Scattering of SoyPC Bilayers
Scattering cross sections obtained from SANS experiments on SoyPC in heavy waterare reported in Figure 6. The data can be fit very well with a model of spherical unilamellarvesicles with polydisperse solvent cores [76,77], which is also expected based on thepreparation method. A very careful inspection of the data revealed the presence of asmall contribution of multilamellar vesicles [31], which can be neglected in the Q rangepresented here.
The best fit of the analytical model yields vesicles with a double-layer thickness of(33.0 ± 1.2) Å. The SLD profile obtained from the MD simulations was used for a compar-ison to the data. It was inserted into a model of n concentric spherical shells; the innerradius of the vesicle and their polydispersity was optimized by a fitting procedure. Theresults are displayed with a continuous red curve in Figure 6. There is a clear discrepancybetween the experimental data and the description provided by the MD results, which ismainly due to a mismatch of the total membrane thickness. In particular, the oscillation atQ ≈ 0.25 Å−1 is quite sensitive to this parameter. This is illustrated in the inset of Figure 6,where two dashed curves represent adding and subtracting 2.0 Å to the optimized bilayerthickness: a small change shifts the oscillation to higher or lower Q-values. The shoulderat Q ≈ 5 × 10⁻³ Å−1 is in contrast not sensitive to the change in bilayer thickness at all andis determined by the total size of the vesicles.
The SANS data on unilamellar vesicles clearly favor a thinner membrane than what issimulated by MD. The associated tail thickness of only 11 Å is, however, so incredibly thinthat additional measurements on the pure DLPC system and with a variety of contrastsshould be performed before addressing an optimization of the MD force field.
22
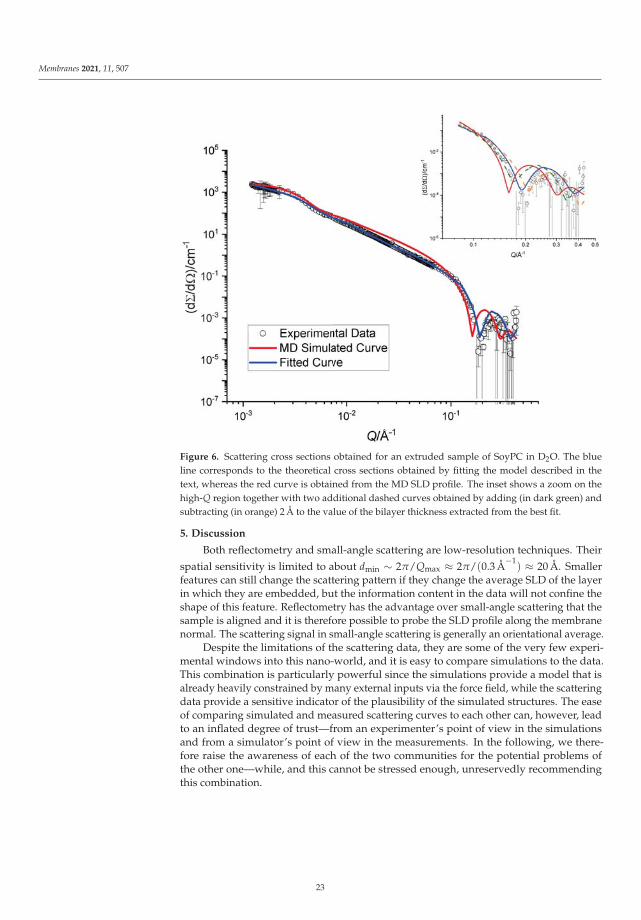
Membranes 2021, 11, 507
Figure 6. Scattering cross sections obtained for an extruded sample of SoyPC in D2O. The blueline corresponds to the theoretical cross sections obtained by fitting the model described in thetext, whereas the red curve is obtained from the MD SLD profile. The inset shows a zoom on thehigh-Q region together with two additional dashed curves obtained by adding (in dark green) andsubtracting (in orange) 2 Å to the value of the bilayer thickness extracted from the best fit.
5. Discussion
Both reflectometry and small-angle scattering are low-resolution techniques. Their
spatial sensitivity is limited to about dmin ∼ 2π/Qmax ≈ 2π/(0.3 Å−1
) ≈ 20 Å. Smallerfeatures can still change the scattering pattern if they change the average SLD of the layerin which they are embedded, but the information content in the data will not confine theshape of this feature. Reflectometry has the advantage over small-angle scattering that thesample is aligned and it is therefore possible to probe the SLD profile along the membranenormal. The scattering signal in small-angle scattering is generally an orientational average.
Despite the limitations of the scattering data, they are some of the very few experi-mental windows into this nano-world, and it is easy to compare simulations to the data.This combination is particularly powerful since the simulations provide a model that isalready heavily constrained by many external inputs via the force field, while the scatteringdata provide a sensitive indicator of the plausibility of the simulated structures. The easeof comparing simulated and measured scattering curves to each other can, however, leadto an inflated degree of trust—from an experimenter’s point of view in the simulationsand from a simulator’s point of view in the measurements. In the following, we there-fore raise the awareness of each of the two communities for the potential problems ofthe other one—while, and this cannot be stressed enough, unreservedly recommendingthis combination.
23

Membranes 2021, 11, 507
5.1. Reflectometry
For the comparison of the reflectivity curves calculated from analytical or numericalSLD profiles to measured data, one has to take into account instrumental and samplenon-idealities.
Effects caused by the instrument vary between different instrument types (e.g.,monochromatic or time-of-flight) and even between different instruments of the sametype. A non-exhaustive list is given in the following.
• Every instrument will have sources of background which contaminate the intensitywith a more or less random noise. These can be independent of the experiment (e.g.,the perfectly random detection of cosmic particles) or instrument setting related (e.g.,scattering of the probing particles on air or windows in the beam—also random andscattering on slits—a usually more or less strongly peaked effect).
• When the sample is illuminated under a very shallow angle, it might happen thatonly a fraction of the beam actually illuminates the sample. This geometric effectwill be a function of the incident angle and the real intensity distribution in the beam(usually treated as Gaussian). In some configurations, this function could be stronglywavelength dependent, due to the ballistic effect: on their way to the sample, longwavelength neutrons, being slower, fall more than the short wavelength ones underthe action of gravitation. They will thus impinge on the sample at a different spot andslightly different incident angle (an effect which also has to be taken into account toproperly evaluate Q).
• Both aforementioned effects contribute to a normalization issue: since R is a relativemeasurement, one must ascertain that the full incident intensity is accurately mea-sured. This can cause practical problems since the primary beam intensity is alwaysorders of magnitude more intense than the reflected one. Gross errors in this step canbe detected if enough data points have been taken in the regime of total reflection, butmore subtle effects such as the above-mentioned over-illumination are much moredifficult to detect if they affect the region where reflectivity intrinsically varies. Itshould be stressed that it is quite easy to overlook significant systematic errors sincethe R value is usually plotted on a logarithmic scale with 5–6 orders of magnitude.
• The measured intensity can be described by the convolution of the ideal signal withthe instrumental resolution function. This convolution smears the measured curveand limits the possibility to resolve adjacent features (oscillations, peaks) in Q space.In real space, this translates to an upper limit for the measurable layer thickness andsensitivity to long-range correlations. Typically, the instrumental resolution of neutronreflectometers ranges about 1–10% ΔQ/Q and consists of contributions of the oftendominant wavelength uncertainty and the beam divergence.
• A very careful treatment of error propagation during data reduction of the countedintensities is needed in order to preserve the possibility to evaluate the statisticalagreement between a simulation and experimental data. Obviously, the error barvalidity issue is paramount when dealing with fitting methods, and this is even moreso when the fitted data vary over several orders of magnitude, as is the case for bothreflectivity and SANS [78].
The sample itself also contributes features to the scattering data that are not reproducedby the computation of the reflectivity from the SLD profile:
• The sample membrane in a reflectometry measurement has to be supported by asubstrate, either solid or liquid. This substrate can have an influence on the mem-brane properties, such as its rigidity. Studies looking at embedding larger proteinsinto the membrane might even experience collisions between the proteins and thesubstrate [46]. Further, the surface of the substrate can be ill-defined. While a reason-ably thin silicon oxide layer usually does not influence the scattering data too much,the surface roughness of the substrate has an immediate effect on the data and canrender the data useless if the roughness is not controlled to be below ∼5 Å. Besides
24

Membranes 2021, 11, 507
influencing the quality of the data, it is clear that large surface irregularities will alsoaffect the membrane morphology. The other half-infinite side also adds possibilitiesfor imperfections that might not be mapped into the simulation: the solvent (espe-cially when deuterated) might be contaminated with another isotope—either fromthe experimental setup of channels leading to the sample chamber or by hydrogen orhydrogen-containing groups escaping from the sample layer. This might have hap-pened in the DLPC multilayer presented here where an amount of bilayers could havedetached from the multilayer and float in some form through the solvent, loweringits SLD.
• A more subtle point concerns the water contrast variation. In order to make use of thedifferent contrasts that can be achieved by isotopic substitution, one has to assumethat the exchange between hydrogen and deuterium changes only the scatteringlengths and not the actual structure. This is generally a justifiable approximation. Thedensity [79,80] and many of the molecular interactions do change between H2O andD2O [80,81], but mostly very slightly. These—usually small—changes that happen inthe real sample will of course not be reproduced by only one simulation where theisotopic exchange is performed a posteriori by assigning different scattering lengthsto the atoms.
• The sample layer itself can also deviate from the modeled version in several aspects:concerning the SLD, it is basically impossible for an experimenter to ascertain thedeuteration degree of the purchased phospholipids. Further, the deposition of phos-pholipids on the substrate might not have produced the structure that was intended(e.g., a single bilayer)—either on the complete sample or as inhomogeneities withinthe membrane plane. Neutron reflectometry measurements probe a surface on theorder of 10–100 cm2: it is rather unrealistic that a phospholipid layer would coat sucha large area homogeneously. Last, inhomogeneities can of course also occur in thedirection of the membrane normal, such as a disorder of the water layer thicknessbetween neighboring membranes in a multilayer.
• The sample will not only scatter neutrons/X-rays into the specular spot, but willalso itself contribute an isotropic background which will add up to the extrinsicbackground sources discussed above. In the case of neutron scattering, this sample-related background level is dominated by the incoherent scattering from hydrogenatoms in the sample and will therefore vary between different contrasts of a givensystem. In the case of X-rays, the diffuse background is generated by the inelasticCompton scattering. It is measured and subtracted from the signal together with theoff-specular scattering (see below). A remaining Q-independent background has tobe accounted for in the modeling.
• Most importantly, in reflectometry, the sample will also generate off-specular scattering.This scattering intensity is caused by fluctuations of the SLD profile parallel to themembrane due, for instance, to membrane fluctuations. In the current context, thisadditional intensity overlaps the purely specular signal and needs to be subtractedfrom the experimental values before R can be evaluated. The length scale of thefluctuations responsible for off-specular scattering is up to the micrometer regime [20],which renders, as hinted above, an evaluation from the computer simulations im-possible. The usual approach is therefore to measure the scattered intensity on bothsides of the specular condition near to it in order to then interpolate the backgroundintensity. On modern instruments using bidimensional detectors, one does not needto perform any additional experiment since a whole range of reflected angles is beingcovered around the specular direction. Figure 7 shows the intensity distribution as afunction of incident angle (θincident) and reflection angle (θreflected). The specular lineis seen along the main diagonal (θincident = θreflected), and it shows the total reflec-tion region at the smallest angles. Along this line, the intensity maxima correspondto the Bragg peaks. The most prominent feature of this intensity map is, however,the broad off-specular band which follows the condition θincident + θreflected = θBragg,
25

Membranes 2021, 11, 507
which in Q space translates to Qz = QBragg. As hinted above, this intensity band isthus characteristic of the in-plane correlations of the structures responsible for theBragg peak. The broad width of the Bragg peak in the reciprocal space shows that thebilayers are only coherent over very small length scales. Subtraction of the underlyingoff-specular signal is clearly a challenging task, especially in regions where the overallreflectivity is low, leading to poor statistics. One needs to be aware of the risk ofintroducing systematic deviations from the true specular reflectivity during this datareduction step.
Figure 7. Off-specular reflectivity map (log scale) of the multilayer sample as a function of the angleof incidence (θincident) and of the reflection angle (θreflected). The specular reflected beam contributesonly at θincident = θreflected. The width of the recorded band around the specular line is defined bythe detector size.
5.2. Small-Angle Scattering
While there is no substrate in small-angle scattering experiments, the other issuesmentioned for reflectometry also exist for this technique. For example, unilamellar vesiclesmight be neither as spherical nor as homogeneously unilamellar as assumed. If they wereproduced by extensive sonication, the phospholipid molecules might even have beendamaged and lyso-phospholipids can be present in the sample [82].
Factors that do not play a role for the samples used in reflectometry but have tobe considered in SAS include the vesicle size polydispersity, which is basically alwaysmodeled with rather simple assumptions, such as a the Schulz–Zimm distribution. It isabsolutely possible that the real size distribution is far more complex and does not smearthe features in the scattering curve in exactly the way that is modeled. In addition, thepositioning of different vesicles with respect to each other has an—often subtle—influenceon the scattering data. If the interaction between the vesicles is known, it can (and should)be taken into consideration in the model.
The effects of an isotropic background and instrumental resolution are very similarto those observed in reflectometry. The background due to the sample itself is usually
26
Membranes 2021, 11, 507
accounted for in the modeling, while all other background contributions are subtractedfrom the data using measurements of the empty sample container and the intrinsic noise ofthe detector. The instrumental resolution has to be taken into consideration much in thesame way as for reflectometry.
Instrumental challenges that are more specific to small-angle scattering than reflectom-etry are related to the calibration of the detector efficiency [83], especially when attemptingto obtain absolute units for the data in order to measure concentrations. Additionally,a full small-angle scattering curve is often measured in several steps with varying colli-mation lengths and the individual curves have to be stitched together before modeling,mostly manually.
As discussed in the Introduction, the theoretical treatment of SANS curves relies onthe applicability of the first Born approximation. Care must be taken to avoid multiplescattering as this is not incorporated in the theoretical evaluation of the data—unfortunately,the absence or presence of multiple scattering is usually not apparent in the data. A practicalrule of thumb is to lower the concentration until the sample transmits at least roughly 85%of the beam without interaction.
5.3. Molecular Dynamics Simulations
As in the case of the experiments, there are several aspects of computer simulationsthat might not be immediately clear to the non specialist, which might lead to misinter-pretation of the results. In contrast to the DMPC phospholipid, containing saturated fattyacid chains, where simulations match experimental data very well, there is a disagreementin the case of polyunsaturated DLPC (the main component of SoyPC). The DLPC lipidbilayer thickness and area per lipid obtained in the MD simulation are not in agreementwith the NR and SANS measurements. The experiments suggest a larger area per lipid(75 Å2) than the MD simulations (60 Å2) using the GROMOS 54A7 force field. The sameproblem was observed for polyunsaturated 1-stearoyl-2-docosahexaenoyl-sn-glycerco-3-phosphocholine (SDPC) bilayers [84] where high-level quantum mechanical calculationsare used to improve the force fields’ (CHARMM36) dihedral potential of neighboringdouble bonds. An approach was proposed by Marquardt et al. [8] constraining the averagearea per lipid while allowing the z axis to expand and contract. This issue, including theforce field reparameterization, is out of the scope of this article and will be addressed inour future work on SoyPC, including the measurements and comparison of pure mono-and multilamellar DLPC with the simulations.
It is important to say that simulated SLD profiles cannot be used “as received” andseveral adjustments have to be made. A first crucial point is related to the thickness ofwater layers: since the number of water molecules is fixed at the start of the simulation,the water layer thickness will also be artificially defined by the MD simulation. However,this issue can easily be solved and the water layer thickness can be adjusted as a parameterduring the SLD profile calculation while keeping all the other parameters untouched. Thereare other practical reasons why the simulated system does not perfectly describe the actualsample used during the neutron/X-ray experiments. The MD simulation will not includethe substrate and even less its interface imperfections. Due to limited computation power,the simulated volume usually represents a small fraction of the actual sample and cannotreproduce large-scale features such as the radius of curvature or fluctuations. The sameargument justifies why the simplest subelements of quasi-periodic systems are simulatedand then artificially reproduced, as for instance a bilayer is simulated in details rather thana true multilayer system.
There are some more obvious reasons a simulation might not be a true representationof reality: in a complex lipid mixture, the composition of the system under study has tobe drastically simplified. In the current example of SoyPC, it was approximated by themost abundant phospholipid. In addition, the effects of pH are hard to reproduce: whilethe pH clearly plays a major role in reality, a simulation box will contain only very fewOH−/H3O+ ions if they are included at all—and the most common force fields will not
27
Membranes 2021, 11, 507
allow the phospholipids to change their protonation state. Besides these factors that limitthe realism of the simulations, two more craftsmanship-related issues have to be consideredsince MD is nothing more than a means of sampling the phase space. First, the simulationhas to be equilibrated for a long enough time. Second, the production run has to cover along enough time for the system to sample the configurations in the vicinity of the energyminimum with accurate statistics. Transitions over energy barriers or phase transitions canpose significant obstacles against sufficient sampling. Further, there are severe limitationsin simulations when it comes to temperature and pressure: both of these can typically notbe expected to have a 1:1 relation to the real physical quantities. Just to name one example,the freezing point of commonly used water models varies between 213 and 271 K [85]. Thelast, even more general comment is that all available force fields represent only a part of theinteractions that happen in reality. Moreover, even for the interactions taken into account,the force fields are always not more than mere simplifying parameterization. One might betempted to discard classical MD and make use of a priori more realistic methods based onfirst principles. Apart from the fact that computing power severely limits the applicabilityof those methods to a smaller number of atoms, it should be noted that even the ab initiomolecular dynamics simulations, which explicitly deal with many more effects than theclassical simulations, still contain a number of adjustable parameters that have to be chosenby the simulation operator.
One aspect which has only been discussed briefly here and deserves some morecomments is related to lateral correlations in the plane of the sample (such as lamellarfluctuations, undulations and fusion sites, e.g., stalks). We mention this point in thediscussion of data reduction and specifically of background subtraction. Obviously, thisscattering transports very important information about the exact nature of the in-planestructure and treating it as mere background is wasting information. However, giventhe very large length scales involved, atomic MD cannot produce relevant data and othermethods, such as coarse-grained simulations, need to be used. Once a model of thestructure has been constructed, however, well-documented software packages already existwhich could be used to compute the corresponding off-specular scattering patterns fromthe reconstructed SLD distribution [86].
6. Conclusions
In this study, we showed, on the basis of a set of actual examples, how the structuresobtained from MD simulations can be used to compute the corresponding scatteringpatterns in SANS and NR. It appeared along the way that several oversimplifications andassumptions have to be carefully dealt with, notably in producing a reliable descriptionof the sample involving some “details” which are not simulated by MD (the substrate inreflectometry, the multilayer, D2O/H2O contamination, substrate roughness, etc.).
Clearly, potential imperfections and intrinsic limitations of all the techniques have to bekept in mind and overconfidence in a single observation to draw conclusions is at best risky.In our experience, however, confronting the experiment to the simulation and vice versa is abeneficial process for both sides as it opens opportunities for further understanding of thesystems under study and, on a more mundane level, it helps to detect and/or understandinconsistencies (such as solvent contamination, the importance of fluctuations, etc.).
The complementarity of scattering methods and MD simulations is striking, not onlybecause it bridges the divide between direct and reciprocal space and helps to solve theage old phase problem, but also because each method sheds light in the blind spot of theother, for instance in terms of accessible length scales and timescales.
Apart from suggesting new experiments to be performed on this very system (e.g.,monolayers and increasingly thick multilayer systems, more contrasts and eventuallymoving to more complex/interesting systems such as those including drugs), this workhints at possible methodological developments such as the systematic use of MD modelsfor the preparation and analysis of scattering experiments.
28
Membranes 2021, 11, 507
The calculation of expected, reasonable scattering patterns can assist in the preparationand the optimization of experiments to be performed at large-scale facilities. Subtleinstrumental effects could be simulated in the framework of virtual experiments such asthose performed using Monte-Carlo simulation packages [87]. Knowing where to expectimportant features or how these would differ between competing models would allowmeasurements to be tailored to concentrate on these regions.
One can further imagine a range of tools that would allow the investigator to alter theMD simulation to optimize the agreement between calculated scattering curves and experi-mental data: first, one could tweak the SLD profile without touching the simulation itself,simply using it as a suitable starting point. Second, the deviation between calculated andmeasured scattering curves can be employed as an additional contribution to the potential,driving the simulation into a compatible configuration [88]. Third, it might be possibleto adjust individual parameters in the force field, possibly via big data/machine learningapproaches. Scattering methods are possibly the only class of experiments that probedirectly the very thing MD simulates, giving a unique angle in this ambitious endeavor.
To facilitate these ideas, a new software for calculating neutron and X-ray small-anglescattering and reflectivity patterns directly from the MD simulation trajectory, Made2Reflect,will be published soon. This standalone Python program allows the fast and simple analysisof large trajectories and is applicable not only for phospholipid membranes but also forelectrochemistry, corrosion and batteries, i.e., solid–liquid and liquid–liquid interfacesin general.
Author Contributions: Conceptualization, S.B. and J.-F.M.; methodology, N.Z. and G.M.; software,N.Z., G.M. and J.-F.M.; validation, N.Z. and G.M.; formal analysis, N.Z. and G.M.; investigation,N.Z., G.M., A.C.H., R.B. and J.L.O.-R.; resources, A.K., H.F. and M.C.; data curation, N.Z. and G.M.;writing—original draft preparation, N.Z., G.M., S.B. and J.-F.M.; writing—review and editing, N.Z.,G.M., A.C.H., A.K., H.F., M.C., J.L.O.-R., S.B. and J.-F.M.; visualization, N.Z., G.M. and J.-F.M.; super-vision, S.B. and J.-F.M.; project administration, S.B. and J.-F.M.; and funding acquisition, J.L.O.-R., S.B.and J.-F.M. All authors have read and agreed to the published version of the manuscript.
Funding: This research was partially funded by the Wellcome Trust [207743/Z/17/Z]; the RoyalSociety [RGS\R1\191414].
Data Availability Statement: The data presented in this study are openly available: DMPC spec-ular reflectivity (10.5286/ISIS.E.RB1820565 and 10.5281/zenodo.4882721). SoyPC specular andoff-specular neutron reflectivity, SoyPC SANS data, DLPC force field parameters (Gromos54a7) andDLPC.pdb structure (10.5281/zenodo.4882721). Publicly available DMPC force field parameterswere used in this study. This data can be found here: http://wcm.ucalgary.ca/tieleman/downloads,accessed on 1 June 2021.
Acknowledgments: This work was based on experiments performed at the MARIA and KWS-1instruments operated by JCNS at the Heinz Maier-Leibnitz Zentrum (MLZ), Garching, Germany. Wegratefully acknowledge the Science and Technology Facilities Council (STFC) for access to neutronbeam time at ISIS and the instrument SURF.
Conflicts of Interest: The authors declare no conflict of interest. The funders had no role in the designof the study; in the collection, analyses, or interpretation of data; in the writing of the manuscript, orin the decision to publish the results.
References
1. Cooper, G. The Cell: A Molecular Approach; Sinauer Associates, Inc.: Sunderland, MA, USA, 2016.2. Alberts, B.; Johnson, A.; Lewis, J.; Morgan, D.; Raff, M.; Roberts, K.; Walter, P. Molecular Biology of the Cell; Garland Science, Taylor
and Francis Group: New York, NY, USA, 2015.3. Stone, M.B.; Shelby, S.A.; Veatch, S.L. Super-Resolution Microscopy: Shedding Light on the Cellular Plasma Membrane. Chem.
Rev. 2017, 117, 7457–7477. [CrossRef]4. Connell, S.D.; Smith, D.A. The atomic force microscope as a tool for studying phase separation in lipid membranes (Review).
Mol. Membr. Biol. 2006, 23, 17–28. [CrossRef] [PubMed]5. Machán, R.; Hof, M. Recent Developments in Fluorescence Correlation Spectroscopy for Diffusion Measurements in Planar Lipid
Membranes. Int. J. Mol. Sci. 2010, 11, 427–457. [CrossRef]
29

Membranes 2021, 11, 507
6. Binder, H. The Molecular Architecture of Lipid Membranes—New Insights from Hydration-Tuning Infrared Linear DichroismSpectroscopy. Appl. Spectrosc. Rev. 2003, 38, 15–69. [CrossRef]
7. Salditt, T.; Münster, C.; Mennicke, U.; Ollinger, C.; Fragneto, G. Thermal Fluctuations of Oriented Lipid Membranes byNonspecular Neutron Reflectometry. Langmuir 2003, 19, 7703–7711. [CrossRef]
8. Marquardt, D.; Heberle, F.A.; Pan, J.; Cheng, X.; Pabst, G.; Harroun, T.A.; Kucerka, N.; Katsaras, J. The structures of polyunsatu-rated lipid bilayers by joint refinement of neutron and X-ray scattering data. Chem. Phys. Lipids 2020, 229, 104892. [CrossRef][PubMed]
9. Mills, T.T.; Toombes, G.E.; Tristram-Nagle, S.; Smilgies, D.M.; Feigenson, G.W.; Nagle, J.F. Order Parameters and Areas inFluid-Phase Oriented Lipid Membranes Using Wide Angle X-Ray Scattering. Biophys. J. 2008, 95, 669–681. [CrossRef] [PubMed]
10. Kucerka, N.; Nagle, J.F.; Sachs, J.N.; Feller, S.E.; Pencer, J.; Jackson, A.; Katsaras, J. Lipid Bilayer Structure Determined by theSimultaneous Analysis of Neutron and X-Ray Scattering Data. Biophys. J. 2008, 95, 2356–2367. [CrossRef] [PubMed]
11. Marrink, S.J.; de Vries, A.H.; Tieleman, D.P. Lipids on the move: Simulations of membrane pores, domains, stalks and curves.Biochim. Biophys. Acta BBA Biomembr. 2009, 1788, 149–168. [CrossRef] [PubMed]
12. Kirsch, S.A.; Böckmann, R.A. Membrane pore formation in atomistic and coarse-grained simulations. Biochim. Biophys. Acta BBABiomembr. 2016, 1858, 2266–2277. [CrossRef] [PubMed]
13. Yang, J.; Martí, J.; Calero, C. Pair interactions among ternary DPPC/POPC/cholesterol mixtures in liquid-ordered and liquid-disordered phases. Soft Matter 2016, 12, 4557–4561. [CrossRef] [PubMed]
14. Yang, J.; Calero, C.; Martí, J. Diffusion and spectroscopy of water and lipids in fully hydrated dimyristoylphosphatidylcholinebilayer membranes. J. Chem. Phys. 2014, 140, 104901. [CrossRef] [PubMed]
15. Harroun, T.A.; Wignall, G.D.; Katsaras, J. Neutron Scattering for Biology. In Neutron Scattering in Biology: Techniques andApplications; Springer: Berlin/Heidelberg, Germany, 2006; pp. 1–18.
16. Krueger, S.; Meuse, C.W.; Majkrzak, C.F.; Dura, J.A.; Berk, N.F.; Tarek, M.; Plant, A.L. Investigation of Hybrid Bilayer Membraneswith Neutron Reflectometry: Probing the Interactions of Melittin. Langmuir 2001, 17, 511–521. [CrossRef]
17. Fragneto, G. Neutrons and model membranes. Eur. Phys. J. Spec. Top. 2012, 213, 327–342. [CrossRef]18. Campbell, R.A. Recent advances in resolving kinetic and dynamic processes at the air/water interface using specular neutron
reflectometry. Curr. Opin. Colloid Interface Sci. 2018, 37, 49–60. [CrossRef]19. Luchini, A.; Gerelli, Y.; Fragneto, G.; Nylander, T.; Pálsson, G.K.; Appavou, M.S.; Paduano, L. Neutron Reflectometry reveals
the interaction between functionalized SPIONs and the surface of lipid bilayers. Colloids Surf. B Biointerfaces 2017, 151, 76–87.[CrossRef]
20. Pynn, R.; Baker, S.M.; Smith, G.; Fitzsimmons, M. Off-specular scattering in neutron reflectometry. J. Neutron Res. 1999, 7, 139–158.[CrossRef]
21. Sivia, D.S. Elementary Scattering Theory: For X-ray and Neutron Users; Oxford University Press: Oxford, UK; New York, NY,USA, 2011.
22. Zec, N.; Mangiapia, G.; Zheludkevich, M.L.; Busch, S.; Moulin, J.F. Revealing the interfacial nanostructure of a deep eutecticsolvent at a solid electrode. Phys. Chem. Chem. Phys. 2020, 22, 12104–12112. [CrossRef]
23. Benz, R.W.; Castro-Roman, F.; Tobias, D.J.; White, S.H. Experimental validation of molecular dynamics simulations of lipidbilayers: A new approach. Biophys. J. 2005, 88, 805–817. [CrossRef]
24. Dodda, L.S.; de Vaca, I.C.; Tirado-Rives, J.; Jorgensen, W.L. LigParGen web server: An automatic OPLS-AA parameter generatorfor organic ligands. Nucleic Acids Res. 2017, 45, W331–W336. [CrossRef]
25. Malde, A.K.; Zuo, L.; Breeze, M.; Stroet, M.; Poger, D.; Nair, P.C.; Oostenbrink, C.; Mark, A.E. An Automated Force Field TopologyBuilder (ATB) and Repository: Version 1.0. J. Chem. Theory Comput. 2011, 7, 4026–4037. [CrossRef] [PubMed]
26. Zoete, V.; Cuendet, M.A.; Grosdidier, A.; Michielin, O. SwissParam: A fast force field generation tool for small organic molecules.J. Comput. Chem. 2011, 32, 2359–2368. [CrossRef]
27. Siligardi, G.; Hussain, R.; Patching, S.G.; Phillips-Jones, M.K. Ligand- and drug-binding studies of membrane proteins revealedthrough circular dichroism spectroscopy. Biochim. Biophys. Acta BBA Biomembr. 2014, 1838, 34–42. [CrossRef] [PubMed]
28. Upert, G.; Luther, A.; Obrecht, D.; Ermert, P. Emerging peptide antibiotics with therapeutic potential. Med. Drug Discov. 2021, 9,100078. [CrossRef]
29. van Hoogevest, P.; Wendel, A. The use of natural and synthetic phospholipids as pharmaceutical excipients. Eur. J. Lipid Sci.Technol. 2014, 116, 1088–1107. [CrossRef]
30. Jaksch, S.; Lipfert, F.; Koutsioubas, A.; Mattauch, S.; Holderer, O.; Ivanova, O.; Frielinghaus, H.; Hertrich, S.; Fischer, S.F.; Nickel,B. Influence of ibuprofen on phospholipid membranes. Phys. Rev. E 2015, 91, 022716. [CrossRef] [PubMed]
31. Mangiapia, G.; Gvaramia, M.; Kuhrts, L.; Teixeira, J.; Koutsioubas, A.; Soltwedel, O.; Frielinghaus, H. Effect of benzocaine andpropranolol on phospholipid-based bilayers. Phys. Chem. Chem. Phys. 2017, 19, 32057–32071. [CrossRef]
32. Xue, Y.; He, L.; Middelberg, A.P.J.; Mark, A.E.; Poger, D. Determining the Structure of Interfacial Peptide Films: ComparingNeutron Reflectometry and Molecular Dynamics Simulations. Langmuir 2014, 30, 10080–10089. [CrossRef]
33. Vanegas, J.M.; Heinrich, F.; Rogers, D.M.; Carson, B.D.; La Bauve, S.; Vernon, B.C.; Akgun, B.; Satija, S.; Zheng, A.; Kielian, M.;et al. Insertion of Dengue E into lipid bilayers studied by neutron reflectivity and molecular dynamics simulations. Biochim.Biophys. Acta BBA Biomembr. 2018, 1860, 1216–1230. [CrossRef]
30

Membranes 2021, 11, 507
34. Reguera, J.; Ponomarev, E.; Geue, T.; Stellacci, F.; Bresme, F.; Moglianetti, M. Contact angle and adsorption energies ofnanoparticles at the air–liquid interface determined by neutron reflectivity and molecular dynamics. Nanoscale 2015, 7, 5665–5673.[CrossRef]
35. Hughes, A.V.; Ciesielski, F.; Kalli, A.C.; Clifton, L.A.; Charlton, T.R.; Sansom, M.S.P.; Webster, J.R.P. On the interpretation ofreflectivity data from lipid bilayers in terms of molecular-dynamics models. Acta Crystallogr. Sect. Struct. Biol. 2016, 72, 1227–1240.[CrossRef]
36. Koutsioubas, A. Combined Coarse-Grained Molecular Dynamics and Neutron Reflectivity Characterization of Supported LipidMembranes. J. Phys. Chem. B 2016, 120, 11474–11483. [CrossRef]
37. McCluskey, A.R.; Grant, J.; Smith, A.J.; Rawle, J.L.; Barlow, D.J.; Lawrence, M.J.; Parker, S.C.; Edler, K.J. Assessing molecularsimulation for the analysis of lipid monolayer reflectometry. J. Phys. Commun. 2019, 3, 075001. [CrossRef]
38. Kucerka, N.; Katsaras, J.; Nagle, J.F. Comparing Membrane Simulations to Scattering Experiments: Introducing the SIMtoEXPSoftware. J. Membr. Biol. 2010, 235, 43–50. [CrossRef] [PubMed]
39. Darré, L.; Iglesias-Fernandez, J.; Kohlmeyer, A.; Wacklin, H.; Domene, C. Molecular Dynamics Simulations and NeutronReflectivity as an Effective Approach To Characterize Biological Membranes and Related Macromolecular Assemblies. J. Chem.Theory Comput. 2015, 11, 4875–4884. [CrossRef]
40. Grillo, I. Small-Angle Neutron Scattering and Applications in Soft Condensed Matter. In Soft Matter Characterization; Springer:Dordrecht, The Netherlands , 2008; pp. 723–782.
41. Fischer, H.E.; Barnes, A.C.; Salmon, P.S. Neutron and X-ray diffraction studies of liquids and glasses. Rep. Prog. Phys. 2005, 69,233–299. [CrossRef]
42. Tristram-Nagle, S.; Liu, Y.; Legleiter, J.; Nagle, J.F. Structure of Gel Phase DMPC Determined by X-ray Diffraction. Biophys. J.2002, 83, 3324–3335. [CrossRef]
43. Salditt, T.; Li, C.; Spaar, A.; Mennicke, U. X-ray reflectivity of solid-supported, multilamellar membranes. Eur. Phys. J. E 2002, 7,105–116. [CrossRef]
44. Sears, V.F. Neutron scattering lengths and cross sections. Neutron News 1992, 3, 26–37. [CrossRef]45. Heinrich, F.; Kienzle, P.A.; Hoogerheide, D.P.; Lösche, M. Information gain from isotopic contrast variation in neutron reflectome-
try on protein–membrane complex structures. J. Appl. Crystallogr. 2020, 53, 800–810. [CrossRef]46. Böhm, P.; Koutsioubas, A.; Moulin, J.F.; Rädler, J.O.; Sackmann, E.; Nickel, B. Probing the Interface Structure of Adhering Cells by
Contrast Variation Neutron Reflectometry. Langmuir 2018, 35, 513–521. [CrossRef]47. Junghans, A.; Watkins, E.B.; Barker, R.D.; Singh, S.; Waltman, M.J.; Smith, H.L.; Pocivavsek, L.; Majewski, J. Analysis of
biosurfaces by neutron reflectometry: From simple to complex interfaces. Biointerphases 2015, 10, 019014. [CrossRef] [PubMed]48. Mushtaq, A.U.; Ådén, J.; Clifton, L.A.; Wacklin-Knecht, H.; Campana, M.; Dingeldein, A.P.G.; Persson, C.; Sparrman, T.; Gröbner,
G. Neutron reflectometry and NMR spectroscopy of full-length Bcl-2 protein reveal its membrane localization and conformation.Commun. Biol. 2021, 4, 507. [CrossRef]
49. Nielsen, J. Elements of Modern X-ray Physics; Wiley: Hoboken, NJ, USA, 2011.50. Parratt, L.G. Surface Studies of Solids by Total Reflection of X-Rays. Phys. Rev. 1954, 95, 359–369. [CrossRef]51. Abelès, F. La théorie générale des couches minces. J. Phys. Radium 1950, 11, 307–309. [CrossRef]52. Born, M. Principles of Optics: Electromagnetic Theory of Propagation, Interference, and Diffraction of Light; Cambridge University Press:
Cambridge, UK, 2019.53. Névot, L.; Croce, P. Caractérisation des surfaces par réflexion rasante de rayons X. Application à l'étude du polissage de quelques
verres silicates. Rev. Phys. Appl. 1980, 15, 761–779. [CrossRef]54. Penfold, J.; Thomas, R.K. Neutron reflectivity and small angle neutron scattering: An introduction and perspective on recent
progress. Curr. Opin. Colloid Interface Sci. 2014, 19, 198–206. [CrossRef]55. Brumberger, H. (Ed.) Modern Aspects of Small-Angle Scattering; Springer: Dordrecht, The Netherlands , 1995.56. Svergun, D.I. Structure Analysis by Small-Angle X-ray and Neutron Scattering; Plenum Press: New York, NY, USA, 1987.57. Poger, D.; Caron, B.; Mark, A.E. Validating lipid force fields against experimental data: Progress, challenges and perspectives.
Biochim. Biophys. Acta BBA Biomembr. 2016, 1858, 1556–1565. [CrossRef]58. Knight, C.J.; Hub, J.S. MemGen: A general web server for the setup of lipid membrane simulation systems: Fig. 1. Bioinformatics
2015, 31, 2897–2899. [CrossRef] [PubMed]59. Martínez, L.; Andrade, R.; Birgin, E.G.; Martínez, J.M. PACKMOL: A package for building initial configurations for molecular
dynamics simulations. J. Comput. Chem. 2009, 30, 2157–2164. [CrossRef]60. Moradi, S.; Nowroozi, A.; Shahlaei, M. Shedding light on the structural properties of lipid bilayers using molecular dynamics
simulation: A review study. RSC Adv. 2019, 9, 4644–4658. [CrossRef]61. Khattari, Z.; Köhler, S.; Xu, Y.; Aeffner, S.; Salditt, T. Stalk formation as a function of lipid composition studied by X-ray reflectivity.
Biochim. Biophys. Acta BBA Biomembr. 2015, 1848, 41–50. [CrossRef] [PubMed]62. Penfold, J.; Richardson, R.M.; Zarbakhsh, A.; Webster, J.R.P.; Bucknall, D.G.; Rennie, A.R.; Jones, R.A.L.; Cosgrove, T.; Thomas,
R.K.; Higgins, J.S.; et al. Recent advances in the study of chemical surfaces and interfaces by specular neutron reflection. J. Chem.Soc. Faraday Trans. 1997, 93, 3899–3917. [CrossRef]
31

Membranes 2021, 11, 507
63. Roldan, J.L.O.; Campana, M.; Barker, R.; Yoldi, I.; Hendry, A. Elucidating the Membrane Interaction Mechanism of Chloride IntracellularChannel Proteins; STFC ISIS Neutron and Muon Source: 2018. Available online: https://doi.org/10.5286/ISIS.E.RB1820565(accessed on 1 June 2021).
64. Mattauch, S.; Koutsioubas, A.; Pütter, S. MARIA: Magnetic reflectometer with high incident angle. J. Large Scale Res. Facil. 2015,1, 8. [CrossRef]
65. Mattauch, S.; Koutsioubas, A.; Rücker, U.; Korolkov, D.; Fracassi, V.; Daemen, J.; Schmitz, R.; Bussmann, K.; Suxdorf, F.; Wagener,M.; et al. The high-intensity reflectometer of the Jülich Centre for Neutron Science: MARIA. J. Appl. Crystallogr. 2018, 51, 646–654.[CrossRef] [PubMed]
66. Frielinghaus, H.; Feoktystov, A.; Berts, I.; Mangiapia, G. KWS-1: Small-angle scattering diffractometer. J. Large Scale Res. Facil.JLSRF 2015, 1, 28. [CrossRef]
67. Wignall, G.D.; Bates, F.S. Absolute calibration of small-angle neutron scattering data. J. Appl. Crystallogr. 1987, 20, 28–40.[CrossRef]
68. Hess, B.; Kutzner, C.; van der Spoel, D.; Lindahl, E. GROMACS 4: Algorithms for Highly Efficient, Load-Balanced, and ScalableMolecular Simulation. J. Chem. Theory Comput. 2008, 4, 435–447. [CrossRef]
69. Darden, T.; York, D.; Pedersen, L. Particle mesh Ewald: An N · log(N) method for Ewald sums in large systems. J. Chem. Phys.1993, 98, 10089–10092. [CrossRef]
70. Berger, O.; Edholm, O.; Jähnig, F. Molecular dynamics simulations of a fluid bilayer of dipalmitoylphosphatidylcholine at fullhydration, constant pressure, and constant temperature. Biophys. J. 1997, 72, 2002–2013. [CrossRef]
71. Humphrey, W.; Dalke, A.; Schulten, K. VMD: Visual molecular dynamics. J. Mol. Graph. 1996, 14, 33–38. [CrossRef]72. Brehm, M.; Thomas, M.; Gehrke, S.; Kirchner, B. TRAVIS—A free analyzer for trajectories from molecular simulation. J. Chem.
Phys. 2020, 152, 164105. [CrossRef]73. Brehm, M.; Kirchner, B. TRAVIS—A Free Analyzer and Visualizer for Monte Carlo and Molecular Dynamics Trajectories. J. Chem.
Inf. Model. 2011, 51, 2007–2023. [CrossRef]74. Krueger, S.; Koenig, B.W.; Orts, W.J.; Berk, N.F.; Majkrzak, C.F.; Gawrisch, K. Neutron Reflectivity Studies of Single Lipid Bilayers
Supported on Planar Substrates. In Neutrons in Biology; Springer: Boston, MA, USA, 1996; pp. 205–213.75. Nouhi, S.; Koutsioubas, A.; Kapaklis, V.; Rennie, A.R. Distortion of surfactant lamellar phases induced by surface roughness. Eur.
Phys. J. Spec. Top. 2020, 229, 2807–2823. [CrossRef]76. Degiorgio, V. Physics of Amphiphiles—Micelles, Vesicles, and Microemulsions: Varenna on Lake Como, Villa Monastero, 19–29 July 1983;
Elsevier Science Publishers: New York, NY, USA, 1983.77. Kotlarchyk, M.; Chen, S.H. Analysis of small angle neutron scattering spectra from polydisperse interacting colloids. J. Chem.
Phys. 1983, 79, 2461–2469. [CrossRef]78. Pardo, L.C.; Rovira-Esteva, M.; Busch, S.; Moulin, J.F.; Tamarit, J.L. Fitting in a complex χ2 landscape using an optimized
hypersurface sampling. Phys. Rev. E 2011, 84, 046711. [CrossRef] [PubMed]79. Soper, A.K. The Radial Distribution Functions of Water as Derived from Radiation Total Scattering Experiments: Is There
Anything We Can Say for Sure? ISRN Phys. Chem. 2013, 2013, 1–67. [CrossRef]80. Jancsó, G. Isotope Effects. In Handbook of Nuclear Chemistry; Springer: Boston, MA, USA, 2011; pp. 699–725.81. Jelinska-Kazimierczuk, M.; Szydłowski, J. Isotope effect on the solubility of amino acids in water. J. Solut. Chem. 1996, 25,
1175–1184. [CrossRef]82. Silva, R.; Ferreira, H.; Cavaco-Paulo, A. Sonoproduction of Liposomes and Protein Particles as Templates for Delivery Purposes.
Biomacromolecules 2011, 12, 3353–3368. [CrossRef]83. Karge, L.; Gilles, R.; Busch, S. Calibrating SANS data for instrument geometry and pixel sensitivity effects: Access to an
extendedQrange. J. Appl. Crystallogr. 2017, 50, 1382–1394. [CrossRef]84. Klauda, J.B.; Monje, V.; Kim, T.; Im, W. Improving the CHARMM Force Field for Polyunsaturated Fatty Acid Chains. J. Phys.
Chem. B 2012, 116, 9424–9431. [CrossRef] [PubMed]85. Fernández, R.G.; Abascal, J.L.F.; Vega, C. The melting point of ice Ih for common water models calculated from direct coexistence
of the solid-liquid interface. J. Chem. Phys. 2006, 124, 144506. [CrossRef] [PubMed]86. Pospelov, G.; Van Herck, W.; Burle, J.; Carmona Loaiza, J.M.; Durniak, C.; Fisher, J.M.; Ganeva, M.; Yurov, D.; Wuttke, J. BornAgain:
Software for simulating and fitting grazing-incidence small-angle scattering. J. Appl. Crystallogr. 2020, 53, 262–276. [CrossRef]87. Udby, L.; Willendrup, P.; Knudsen, E.; Niedermayer, C.; Filges, U.; Christensen, N.; Farhi, E.; Wells, B.; Lefmann, K. Analysing
neutron scattering data using McStas virtual experiments. Nucl. Instrum. Methods Phys. Res. Sect. A Accel. Spectrom. Detect. Assoc.Equip. 2011, 634, S138–S143. [CrossRef]
88. Chen, P.C.; Shevchuk, R.; Strnad, F.M.; Lorenz, C.; Karge, L.; Gilles, R.; Stadler, A.M.; Hennig, J.; Hub, J.S. Combined Small-AngleX-ray and Neutron Scattering Restraints in Molecular Dynamics Simulations. J. Chem. Theory Comput. 2019, 15, 4687–4698.[CrossRef] [PubMed]
32
membranes
Article
Study of the Interaction of a Novel Semi-SyntheticPeptide with Model Lipid Membranes
Lucia Sessa 1,2,*, Simona Concilio 1,2,*, Peter Walde 3, Tom Robinson 4, Petra S. Dittrich 5,
Amalia Porta 1,2, Barbara Panunzi 6, Ugo Caruso 7 and Stefano Piotto 1,2
1 Department of Pharmacy, University of Salerno, 84084 Fisciano (SA), Italy; [email protected] (A.P.);[email protected] (S.P.)
2 Research Centre for Biomaterials BIONAM, University of Salerno, Via Giovanni Paolo II 132,84084 Fisciano (SA), Italy
3 Department of Materials, ETH Zürich, 8093 Zürich, Switzerland; [email protected] Department of Theory and Bio-Systems, Max Planck Institute of Colloids and Interfaces,
D-14424 Potsdam, Germany; [email protected] Department of Biosystems Science and Engineering, ETH Zurich, 4058 Basel, Switzerland;
[email protected] Department of Agriculture, University of Napoli Federico II, 80055 Portici (NA), Italy;
[email protected] Department of Chemical Sciences, University of Napoli Federico II, 80126 Napoli, Italy; [email protected]* Correspondence: [email protected] (L.S.); [email protected] (S.C.)
Received: 30 September 2020; Accepted: 16 October 2020; Published: 19 October 2020
Abstract: Most linear peptides directly interact with membranes, but the mechanisms of interactionare far from being completely understood. Here, we present an investigation of the membraneinteractions of a designed peptide containing a non-natural, synthetic amino acid. We selected anonapeptide that is reported to interact with phospholipid membranes, ALYLAIRKR, abbreviated asALY. We designed a modified peptide (azoALY) by substituting the tyrosine residue of ALY withan antimicrobial azobenzene-bearing amino acid. Both of the peptides were examined for theirability to interact with model membranes, assessing the penetration of phospholipid monolayers,and leakage across the bilayer of large unilamellar vesicles (LUVs) and giant unilamellar vesicles(GUVs). The latter was performed in a microfluidic device in order to study the kinetics of leakage ofentrapped calcein from the vesicles at the single vesicle level. Both types of vesicles were preparedfrom a 9:1 (mol/mol) mixture of POPC (1-palmitoyl-2-oleoyl-sn-glycero-3-phosphocholine) and POPG(1-palmitoyl-2-oleoyl-sn-glycero-3-phospho(1′-rac-glycerol). Calcein leakage from the vesicles wasmore pronounced at a low concentration in the case of azoALY than for ALY. Increased vesiclemembrane disturbance in the presence of azoALY was also evident from an enzymatic assay withLUVs and entrapped horseradish peroxidase. Molecular dynamics simulations of ALY and azoALYin an anionic POPC/POPG model bilayer showed that ALY peptide only interacts with the lipidhead groups. In contrast, azoALY penetrates the hydrophobic core of the bilayers causing a strongermembrane perturbation as compared to ALY, in qualitative agreement with the experimental resultsfrom the leakage assays.
Keywords: peptide; MD; GUV; LUV; azo-amino acid
1. Introduction
Membrane interacting peptides are an exciting topic of research, because they cover differentclasses of peptides with several biological activities. The interactions between peptides and lipidmembranes are involved in many critical biological processes [1,2]. Depending on their structural
Membranes 2020, 10, 294; doi:10.3390/membranes10100294 www.mdpi.com/journal/membranes
33
Membranes 2020, 10, 294
characteristics, different peptides employ different mechanisms of interaction with the membrane,causing membrane alteration or permeation [3,4]. Moreover, during their interactions, peptides andmembranes may undergo a sequence of structural changes. Even for short and linear peptides, themolecular details of the process are often not completely understood. Numerous studies have beencarried out to clarify the interactions of peptides with lipid bilayers, when considering the position,orientation, structure, and the effects on the surrounding lipids [5–10]. A better understanding ofpeptide-membrane interactions at a molecular level is not only essential in the study of variousbiological processes, but it could also help in designing peptides with specific functionalities that maybe exploited for therapeutic applications. We performed theoretical and experimental studies usingmodel lipid membranes to develop a novel semi-synthetic peptide with a direct effect on membraneperturbation [11]. Here, we report the results of such investigations highlighting the interactionsof a designed peptide with lipid membranes. We selected a membrane interacting nonapeptide,ALYLAIRKR (abbreviated as ALY) [12], after a screening of peptides in the database YADAMP [13].This peptide is known to interact with liposomal membranes and cause an increase in membranepermeability proportional to the peptide concentration. It is known that linear peptides and membraneproteins affect membrane structure [14–17], but little is known regarding peptides with azo-modifiedamino acids.
We used this peptide as a reference peptide to develop a novel modified peptide (azoALY)replacing the tyrosine (“Y”) in the ALY sequence with an unnatural amino acid bearing an azo group,which may affect the membrane permeability and the antimicrobial activity. We chose to modify thetyrosine residue of ALY by replacing one of the hydrogen atoms of the phenyl ring in the side chainwith an azobenzene group (via a diazo coupling reaction).
The novel azo-amino acid (azoTyr) was then employed in order to synthesize the peptide chainwithout further modifications. The choice of azobenzene in the peptide chain was determined by itshydrophobicity and intrinsic antimicrobial properties. In our previous works [18,19], we have alreadystudied the antibacterial and antifungal activity of the azobenzene group. Therefore, a modifiedpeptide might have antimicrobial activity due to the presence of azobenzene, and it might act as aprodrug, releasing the antimicrobial azo compound in vivo. However, this work is not focused onthe antimicrobial aspects, rather on the membrane perturbation effect. With this purpose, moleculardynamics (MD) simulations are a useful method for studying peptide-membrane interactions. Theyprovide a detailed description of the processes at a molecular level, in which all of the components canbe studied, as well as being able to visualize their organization and dynamics [20].
In the first part of the work, we used MD simulations to understand the different modes ofinteractions between the two peptides (ALY and azoALY) and a model bilayer. We employed a mixtureof POPC/POPG at a molar ratio of 9:1 to study the interaction of the peptides with the surface of lipidbilayers, according to previous studies [21,22]. POPC/POPG lipids are frequently used to build a modelof bacterial membranes (see, e.g., [23–25]). It is relevant to evidence that, although POPC is widelyused in both molecular dynamics simulations and vesicle preparations, it is not common to find it inbacterial membranes. Still, the preparation of POPC/POPG membranes offers two essential advantages.First, the results can be easily compared with similar settings in the scientific literature. This kind ofvesicle is prepared in a standard and easy way due to low phase transition temperature of the lipids.Second, it allows for the building of a negatively charged membrane without introducing curvaturestress. The MD trajectories allowed for us to analyse the dynamics of the peptides in the lipid bilayerand their effects on the lipid molecules. Membrane-active peptides can induce an immediate andcomplete release of entrapped solutes from the aqueous interior of lipid vesicles (liposomes) into thebulk solution by forming membrane pores [26,27]. In the second part of the work, we prepared vesicleswith the same composition (POPC/POPG, 9:1) to assess the amount of membrane perturbation that iscaused by the interaction with the peptides. Two different approaches were used. First, we estimatedthe release of entrapped calcein that is induced by the two peptides from giant unilamellar vesicles
34
Membranes 2020, 10, 294
(GUVs). Secondly, we performed measurements of the leakage of entrapped horseradish peroxidaseisoenzyme C enzyme (HRPC) from large unilamellar vesicles (LUVs) after peptide addition.
2. Materials and Methods
2.1. Selection of the Reference Peptide ALY
The database YADAMP was used to select a membrane-interacting peptide [13]. The criteria forthe selection were: (i) a tyrosine in the amino acid sequence; (ii) a sequence length of ≤10 residues; (iii)a helicity value higher than 4.5; and, (iv) a cell-penetrating potential value higher than 0.5.
The helicity value is estimated on a scale range between 0 and 9, whereby the value 9 correspondsto the highest probability of α-helix secondary structure formation [28]. The cell-penetrating value isestimated on a scale range between 0 and 1, whereby 1 corresponds to the highest probability of apeptide in order to penetrate a membrane and 0 indicates the impossibility to enter a membrane [29].
We selected the peptide ALYLAIRKR (H-Ala-Leu-Tyr-Leu-Ala-Ile-Arg-Lys-Arg-NH2) [12]. Thepeptide is abbreviated as ALY, whereas the modified peptide was named azoALY.
2.2. Molecular Dynamics (MD) Simulations
The three-dimensional structures of the peptides were built by MD simulations. In MD simulations,Newton’s equations of motion are solved at each step of the atom movement, which is probably themost reliable method for investigating protein interactions. MD simulations were performed whileusing the script protein_folding_by_MD.js, accessible in the Abalone software 2.1.4.2 Version [30],setting the AMBER94 force field, the temperature to 350 K, and the implicit water model (continuumsolvent). After force field assigning, we performed structure optimization to avoid overlapping. Thesimulation time of 10 ns was enough to reach the native protein conformation. The interactions ofpeptides with membranes were evaluated on the model membrane of POPC/POPG. The membranewas generated while using the web tool CHARMM-GUI Membrane Builder [31] using a relativecomposition POPC/POPG of 9 to 1. Each monolayer of the membrane was made of 110 lipids. Aperiodic simulation cell (X = 85.58 Å, Y = 100.00 Å, Z = 84.44 Å) was built around the entire complex.The charges were assigned at physiological conditions (pH 7.4). The MD simulations were performedusing the software YASARA Structure 17.3.30 [32]. We used AMBER14 as a force field with long-rangedPME potential and a cutoff of 8.0 Å. The simulation box was filled with TIP3P water, choosing a densityof 0.997 g/mL. The system was neutralized with NaCl at a concentration of 0.9%. The membranes wereequilibrated during 200 ps. After equilibration, both peptides ALY and azoALY were embedded inthe membrane, placing the transmembrane regions of the peptides perpendicular to the membrane.Short energy minimization was performed in order to optimize the membrane geometry and fillthe membrane pores. The simulation was then initiated at 298 K and integration time steps forintramolecular forces every 1.25 fs. The simulation snapshots were saved at regular time intervals of100 ps. The total simulation time was 50 ns.
The bilayer thickness is defined as the average distance between the lipid phosphorus atoms ofthe opposing leaflets. It was calculated averaging the 50 snapshots of the last 5 ns of simulations. Inaddition, in order to provide an overview of the local membrane deformation along with the simulation,we used MembPlugIn in VMD [33] to interpolate the lipid head’s positions and compute a 2D thicknessmap. The fluidity was indirectly measured by calculating the deuterium order parameter (SCD) withthe VMD MembPlugin software version 1.1.
The mass density profile indicates the atom distribution of the membrane component along thebilayer. This analysis offers useful information regarding the structural changes in membranes [11].Profiles are determined by dividing the simulation box along the perpendicular to the z-axis (normalto the bilayer) into several thin portions 1 Å thick, and by finding the mass density of the atoms thatare positioned in each portion [34].
35

Membranes 2020, 10, 294
2.3. Synthesis of Azobenzene-Modified Tyr (azoTyr) and the Peptides ALY and azoALY
All of the reagents and solvents were purchased from Sigma–Aldrich (Milan, Italy) and usedwithout further purification. The 1H NMR spectra were recorded with a Bruker DRX/400 spectrometer(Bruker, Billerica, MA, USA). Chemical shifts are reported relative to the residual solvent peak(dimethylsulfoxide-d6: δ = 2.50 ppm). Mass spectrometry measurements were performed while usinga Q-TOF premier instrument (Waters, Milford, MA, USA) that was equipped with an electrospray ionsource and hybrid quadrupole-time of flight analyser. The mass spectra were acquired in positive ionmode, in 50% CH3CN solution, over the 200–800 m/z range. Instrument mass calibration was achievedby a separate injection of 1 mM NaI in 50% CH3CN. The data were processed using MassLynx software(Waters, Milford, MA, USA).
The azo-amino acid 3-(p-tolyldiazenyl)-N-Fmoc-L-tyrosine was synthesized according to a diazocoupling reaction, as illustrated in the following Scheme 1:
Scheme 1. Synthetic path of amino acid azoTyr.
0.011 mol of p-toluidine were suspended in a solution containing 19.2 mL of water and 4.8 mL ofHCl 37% (w/w). The solution was cooled at 0–5 ◦C and a solution of 0.85 g of sodium nitrite (0.012 mol)dissolved in 2.4 mL of water was added dropwise, obtaining a suspension of the diazonium salt(suspension A). Separately, a solution containing 0.018 g of NaOH and 0.068 g of NaHCO3 in 20 mL ofwater with 2.00 g of Fmoc-L-tyrosine (0.00496 mol) was prepared (solution B). Suspension A was addeddropwise to solution B, under stirring at 15 ◦C, adjusting the pH at 9–10, with the addition of NaOH, ifnecessary. The system was left reacting for 20 min. A reddish precipitate of the azo compound formed.The crude precipitate was filtered, dried under vacuum, and then crystallized from chloroform. Theproduct was recovered as a dark red microcrystalline powder, with a final yield of 85%. 1H NMR(DMSO-d6): (δ, ppm) = 11.25 (s, OH); 7.87 (d, 2H); 7.80 (d, 2H); 7.63 (dd, 2H); 7.60 (d, 2H); 7.38 (m, 1H);7.34 (m, 2H); 7.28 (m, 2H); 7.19 (d, 1H); 6.89 (d, 1H); 4.34 (m, 1H); 4.18 (m, 2H); 3.10, 2.98 (m, 2H); and,2.40 (s, 3H). HRMS (ESI): m/z: 522.20 [M+H+].
Peptides ALY (ALYLAIRKR; Mw = 1103.361 g mol−1) and azoALY (ALXLAIRKR;Mw = 1221.497 g mol−1) were synthesized by Zhejiang Ontores Biotechnologies Co., Ltd (Shanghai,China). Purity for ALY peptide was 96.44% and for azoALY peptide was 96.27%.
A stock solution of ALY was prepared by dissolving a few μg of the peptide in 1 mL of MilliporeQwater. The exact peptide concentration was calculated from the absorbance at 275 nm while usingε275 = 1400 M−1 cm−1 for the single tyrosine chromophore [35,36]. The solution was filtered through a0.22 μm pore size syringe filter.
Similarly, a stock solution of azoALY was prepared and the concentration was calculated from theabsorbance at 334 nm using ε334 = 36805 M−1 cm−1 for the single modified tyrosine amino acid. Themolar extinction coefficient was determined by measuring the UV-Vis spectrum of a solution of azoTyrat a determined concentration. The solution was filtered through a 0.22 μm pore size syringe filter.
36

Membranes 2020, 10, 294
2.4. Permeability Tests with POPC/POPG (9:1) Vesicles
2.4.1. Materials
POPC (1-palmitoyl-2-oleoyl-sn-glycero-3-phosphocholine) and POPG (1-palmitoyl-2-oleoyl-sn-glycero-3-phospho-(1′-rac-glycerol) (sodium salt)) (≥99%) were from Sigma–Aldrich Chemie GmbH(Buchs, Switzerland). The membrane indocarbocyanine dye DiI and phosphate-buffered saline (PBS,pH = 7.2) were obtained from Invitrogen Thermo Fisher Scientific (Thermo-Fisher, Waltham, MA,USA)). Calcein was purchased from Fisher Scientific AG (Wohlen, Switzerland). HRPC (Horseradishperoxidase isoenzyme C, EC 1.11.1.7, RZ A403/A280 > 3.1) was from Toyobo Enzymes (Osaka, Japan).The diammonium salt of ABTS2− (2,2′-azinobis(3-ethylbenzothiazoline-6-sulfonate)) and Triton X-100were purchased from Sigma–Aldrich Chemie GmbH (Buchs, Switzerland). Hydrogen peroxide (H2O2,30%) was from Acros Organics Fisher Scientific AG (Wohlen, Switzerland), 4-morpholineethanesulfonicacid (MES ≥ 99%) was purchased from Fluka Fisher Scientific AG (Reinach, Switzerland). Sepharose 4Band chloroform (stabilized with ethanol, 99.8%) were purchased from Sigma–Aldrich Chemie GmbH(Buchs, Switzerland).
2.4.2. Calcein Release Test with Giant Unilamellar Vesicles (GUVs)
Wide-field microscopy was performed with an inverted microscope (IX70, Olympus America,Melville, NY, USA) equipped with a mercury lamp and a 40×/0.65 NA air objective lens. The imageswere recorded with an EMCCD camera (iXon DV887, Andor Technology, South Windsor, CT)). Thefluorescence intensity of the calcein within three separate vesicles was monitored while using a confocallaser-scanning microscope (Axiovert 200 M, Zeiss, Oberkochen, Germany), and an appropriate opticalfilter sets for DiI and calcein. The GUVs were prepared by electroformation following the procedurethat was originally described by Angelova et al. [37], but conducted in a modified chamber [38]. Briefly,the setup used for the preparation of the vesicles consisted of two conductive indium tin oxide (ITO)coated glasses separated by a 1.5 mm thick silicone rubber spacer to maximize the yield of vesicles.POPC/POPG lipids (9:1 mol/mol) were dissolved in chloroform/methanol (9:1 v/v) at a concentration of1 mM. The orange-red fluorescent dye DiI was added at a concentration of 1 μM. A drop of 2.5 μLof the mixture was deposited on one of the conductively coated glasses, and this was repeated in12 locations. The lipid film was then dried under vacuum overnight and hydrated with MilliQ watercontaining 10 μM calcein. The chambers were sealed by a second ITO slide and held at 60 ◦C within acustom-built heating device. GUVs were formed by applying 0.7 V at a frequency of 10 Hz for 4 hwhile using a function generator. After applying 1 V at 4 Hz for 30 min. to detach the vesicles from thesurface, harvesting was achieved by careful pipetting. GUVs were stored at room temperature andused within 48 h. For the analysis of calcein release from the GUVs, we used a microfluidic platformthat was able to trap single GUVs in an array of chambers [39] (see Figure S1 in Supp. Mat.). Byexchanging the solution inside the chip and subsequently opening the valves, it is possible to performfast kinetic studies from the seconds to minutes timescale. GUVs containing fluorescent calcein weretrapped in order to investigate the membrane perturbation and subsequent leakage of calcein acrossthe membrane. Because of the hydrophilic nature of calcein, it does not permeate the membrane andremains encapsulated. Once trapped, the GUVs remain stable for long times (at least 12 h), and nosignificant deformation or rupture of the vesicles was observed. The solution was then exchanged withMilliQ water while using a syringe-pump (neMESYS, Cetoni, Germany) until only calcein fluorescenceinside GUV was visible and no more calcein was detected in the surrounding solution (See FigureS2 in Supp. Mat.). The same pump was used to exchange the aqueous solution outside the donutswith an aqueous solution of the peptide, with a total flow rate of 5 μL min−1. The release measuredin the absence of the peptide was used as the control, and the amount of calcein within the GUVremained constant, indicating that photobleaching did not occur. The error bars were calculated fromthe standard error, estimated by population standard deviation divided by the square root of thesample number. The number of individual experiments at a given peptide concentration was n = 3.
37
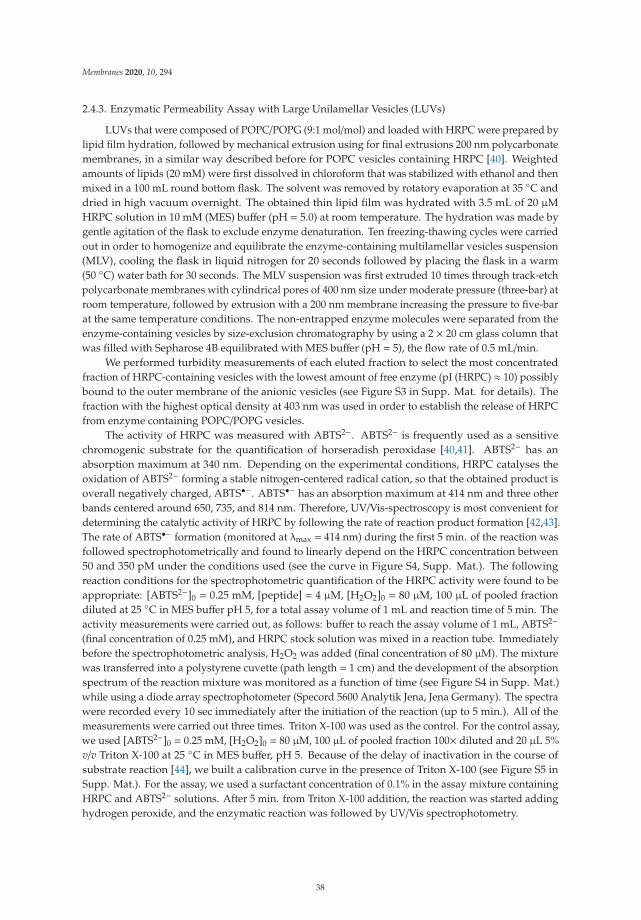
Membranes 2020, 10, 294
2.4.3. Enzymatic Permeability Assay with Large Unilamellar Vesicles (LUVs)
LUVs that were composed of POPC/POPG (9:1 mol/mol) and loaded with HRPC were prepared bylipid film hydration, followed by mechanical extrusion using for final extrusions 200 nm polycarbonatemembranes, in a similar way described before for POPC vesicles containing HRPC [40]. Weightedamounts of lipids (20 mM) were first dissolved in chloroform that was stabilized with ethanol and thenmixed in a 100 mL round bottom flask. The solvent was removed by rotatory evaporation at 35 ◦C anddried in high vacuum overnight. The obtained thin lipid film was hydrated with 3.5 mL of 20 μMHRPC solution in 10 mM (MES) buffer (pH = 5.0) at room temperature. The hydration was made bygentle agitation of the flask to exclude enzyme denaturation. Ten freezing-thawing cycles were carriedout in order to homogenize and equilibrate the enzyme-containing multilamellar vesicles suspension(MLV), cooling the flask in liquid nitrogen for 20 seconds followed by placing the flask in a warm(50 ◦C) water bath for 30 seconds. The MLV suspension was first extruded 10 times through track-etchpolycarbonate membranes with cylindrical pores of 400 nm size under moderate pressure (three-bar) atroom temperature, followed by extrusion with a 200 nm membrane increasing the pressure to five-barat the same temperature conditions. The non-entrapped enzyme molecules were separated from theenzyme-containing vesicles by size-exclusion chromatography by using a 2 × 20 cm glass column thatwas filled with Sepharose 4B equilibrated with MES buffer (pH = 5), the flow rate of 0.5 mL/min.
We performed turbidity measurements of each eluted fraction to select the most concentratedfraction of HRPC-containing vesicles with the lowest amount of free enzyme (pI (HRPC) ≈ 10) possiblybound to the outer membrane of the anionic vesicles (see Figure S3 in Supp. Mat. for details). Thefraction with the highest optical density at 403 nm was used in order to establish the release of HRPCfrom enzyme containing POPC/POPG vesicles.
The activity of HRPC was measured with ABTS2−. ABTS2− is frequently used as a sensitivechromogenic substrate for the quantification of horseradish peroxidase [40,41]. ABTS2− has anabsorption maximum at 340 nm. Depending on the experimental conditions, HRPC catalyses theoxidation of ABTS2− forming a stable nitrogen-centered radical cation, so that the obtained product isoverall negatively charged, ABTS•−. ABTS•− has an absorption maximum at 414 nm and three otherbands centered around 650, 735, and 814 nm. Therefore, UV/Vis-spectroscopy is most convenient fordetermining the catalytic activity of HRPC by following the rate of reaction product formation [42,43].The rate of ABTS•− formation (monitored at λmax = 414 nm) during the first 5 min. of the reaction wasfollowed spectrophotometrically and found to linearly depend on the HRPC concentration between50 and 350 pM under the conditions used (see the curve in Figure S4, Supp. Mat.). The followingreaction conditions for the spectrophotometric quantification of the HRPC activity were found to beappropriate: [ABTS2−]0 = 0.25 mM, [peptide] = 4 μM, [H2O2]0 = 80 μM, 100 μL of pooled fractiondiluted at 25 ◦C in MES buffer pH 5, for a total assay volume of 1 mL and reaction time of 5 min. Theactivity measurements were carried out, as follows: buffer to reach the assay volume of 1 mL, ABTS2−(final concentration of 0.25 mM), and HRPC stock solution was mixed in a reaction tube. Immediatelybefore the spectrophotometric analysis, H2O2 was added (final concentration of 80 μM). The mixturewas transferred into a polystyrene cuvette (path length = 1 cm) and the development of the absorptionspectrum of the reaction mixture was monitored as a function of time (see Figure S4 in Supp. Mat.)while using a diode array spectrophotometer (Specord 5600 Analytik Jena, Jena Germany). The spectrawere recorded every 10 sec immediately after the initiation of the reaction (up to 5 min.). All of themeasurements were carried out three times. Triton X-100 was used as the control. For the control assay,we used [ABTS2−]0 = 0.25 mM, [H2O2]0 = 80 μM, 100 μL of pooled fraction 100× diluted and 20 μL 5%v/v Triton X-100 at 25 ◦C in MES buffer, pH 5. Because of the delay of inactivation in the course ofsubstrate reaction [44], we built a calibration curve in the presence of Triton X-100 (see Figure S5 inSupp. Mat.). For the assay, we used a surfactant concentration of 0.1% in the assay mixture containingHRPC and ABTS2− solutions. After 5 min. from Triton X-100 addition, the reaction was started addinghydrogen peroxide, and the enzymatic reaction was followed by UV/Vis spectrophotometry.
38

Membranes 2020, 10, 294
3. Results and Discussion
3.1. Peptide Localization within Lipid Bilayers: a MD Simulation Analysis
In this study, we analysed two peptides, a natural peptide, named ALY, and a modified peptide,azoALY. They both have a short sequence of nine amino acids that fold into an alpha helix structure.The azo amino acid slightly deforms the helix structure adopted by azoALY. In the MD simulations, thehydrophobic regions of the peptides ALY and azoALY were embedded perpendicularly to the membranebilayer of POPC/POPG (9:1) at the starting point. We used an online tool to predict the positionof membrane proteins (https://opm.phar.umich.edu). The model suggested the insertion for bothpeptides in membrane with a tilt angle of 48◦ and with the hydrophobic portion (Ala-Leu-Tyr-Leu-Ala)immersed in the core membrane. The charged portion of the peptide (Arg-Lys-Arg) is external to themembrane for both peptides (see Figure S6 in Supp. Mat.). After the first 200 ps of the simulation, theALY peptide comes out of the bilayer and it is located between the head groups and the water phase inthe outer part of the membrane. In contrast, the azoALY peptide is anchored to the membrane for thewhole simulation time (see Figure S6 in Supp. Mat.). The density profile indicates the position of thedifferent atoms of the system along the normal phospholipid bilayer in the last 5 ns of a simulation of50 ns. In Figures 1 and 2, the density profiles of ALY and azoALY (normalized to 1 by water mass) inthe POPC/POPG membrane is reported. The cyan line represents the water continuum; it is outsidethe bilayer, ensuring membrane hardness. The phosphorus and nitrogen atoms (continuous blue anddashed blue line. respectively) represent the head group of the phospholipids; the dashed black lineindicates the carbon chains of the phospholipid, while the black line represents the terminal carbons.After a simulation time of 45 ns, the ALY peptide (red line in Figure 1) is placed below the phosphorusatoms between the head group and the water phase, as seen in Figure 1. In contrast, the peptideazoALY (red line in Figure 2) is anchored to the core membrane for the same simulation time (from 45to 50 ns).
Figure 1. Density profile of the system ALY-POPC/POPG (9:1) after 45 ns of molecular dynamic (MD)simulation. Cyan line: water molecules; blue line: phosphorous atoms; dashed blue line: nitrogenatoms; dashed black line: carbon chains of the phospholipid, black line: terminal carbons of thephospholipid; red line ALY peptide.
39

Membranes 2020, 10, 294
Figure 2. Density profile of the system azoALY-POPC/POPG (9:1) after 45 ns of MD simulation. Cyanline: water molecules; blue line: phosphorous atoms; dashed blue line: nitrogen atoms; dashed blackline: carbon chains of the phospholipid, black line: terminal carbons of the phospholipid; red lineazoALY peptide.
For both peptides, the membrane thickness of the peptide/membrane systems was measuredin order to estimate the perturbation of the membrane packing induced by the peptide, when onlyconsidering the lipids surrounding the peptide with a distance of 4 Å. The membrane thickness wasmeasured as the average distance between the center of mass of the phosphate atoms of the inner layerand the outer layer. The thickness of the pure POPC/POPG bilayer did not change during the 50 nssimulation, suggesting that the system was equilibrated with an initial value of 38.5 ± 0.3 Å. In thepresence of the two peptides, in the last 5 ns of the simulations, the membranes thickness values were38.7 ± 0.3 Å with ALY and 36.4 ± 0.5 with azoALY. The modified peptide causes a reduction of themembrane thickness. This different perturbation is due to different peptide-membrane interactions.The peptide ALY is placed between the water molecules and head groups, and it does not causeperturbation of the membrane packing. On the other hand, azoALY is anchored to the membrane core,which affects the invagination of the lipid surrounding and produces a significant reduction of themembrane thickness.
From Figure 2, in fact, the peptide azoALY (red line) is in the same position as the terminalcarbon atoms of the lipid tails. This simulation suggests that the peptide is anchored to the core of themembrane in the last 5 ns of the simulation time. The azo group has a significant influence on thepeptide-membrane interaction: due to its rigid and planar structure, the azo amino acid permeatesthe membrane, causing disorder in the lipid leaflet. We performed a deuterium order parameter(SCD) analysis. SCD studies provide comprehensive information on membrane fluidity of lipophilicphospholipid chains near peptide molecules to assess whether the modified peptide causes a change inmembrane fluidity. The analysis, performed on the surrounding lipids with a distance of 5 Å fromthe peptides, confirmed a different behavior of the two peptides. azoALY increases the mobility inthe lipid head more than peptide ALY. The results are shown in Figure S7 in the SupplementaryMaterials section.
The thickness maps in Figure 3 show the local membrane deformation along with the simulation.The ALY peptide has a minimal effect on membrane thickness with a constant fluctuation of lipidsaround a value of 38 Å (Figure 3a). The azo-modified peptide causes the invagination of the membrane,
40
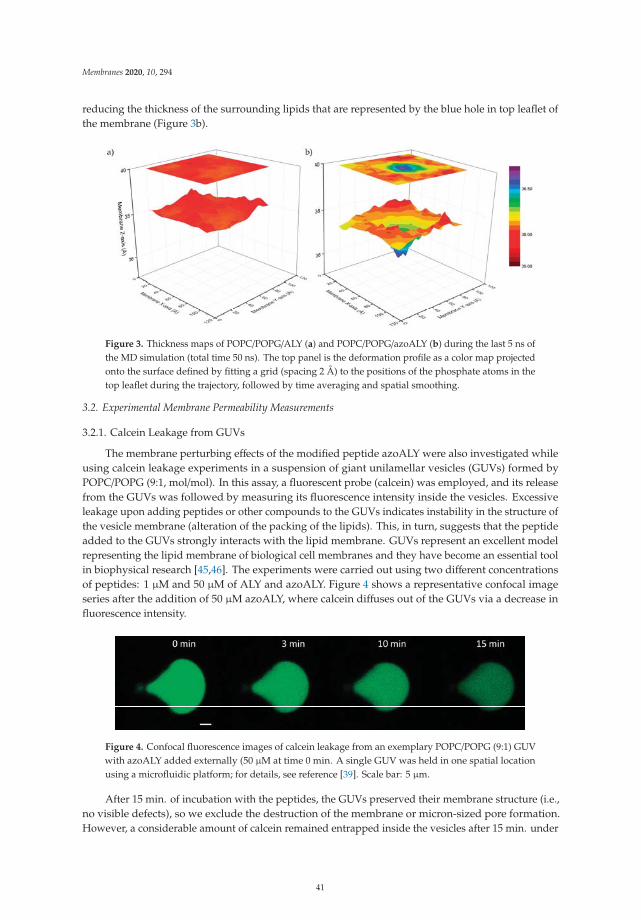
Membranes 2020, 10, 294
reducing the thickness of the surrounding lipids that are represented by the blue hole in top leaflet ofthe membrane (Figure 3b).
Figure 3. Thickness maps of POPC/POPG/ALY (a) and POPC/POPG/azoALY (b) during the last 5 ns ofthe MD simulation (total time 50 ns). The top panel is the deformation profile as a color map projectedonto the surface defined by fitting a grid (spacing 2 Å) to the positions of the phosphate atoms in thetop leaflet during the trajectory, followed by time averaging and spatial smoothing.
3.2. Experimental Membrane Permeability Measurements
3.2.1. Calcein Leakage from GUVs
The membrane perturbing effects of the modified peptide azoALY were also investigated whileusing calcein leakage experiments in a suspension of giant unilamellar vesicles (GUVs) formed byPOPC/POPG (9:1, mol/mol). In this assay, a fluorescent probe (calcein) was employed, and its releasefrom the GUVs was followed by measuring its fluorescence intensity inside the vesicles. Excessiveleakage upon adding peptides or other compounds to the GUVs indicates instability in the structure ofthe vesicle membrane (alteration of the packing of the lipids). This, in turn, suggests that the peptideadded to the GUVs strongly interacts with the lipid membrane. GUVs represent an excellent modelrepresenting the lipid membrane of biological cell membranes and they have become an essential toolin biophysical research [45,46]. The experiments were carried out using two different concentrationsof peptides: 1 μM and 50 μM of ALY and azoALY. Figure 4 shows a representative confocal imageseries after the addition of 50 μM azoALY, where calcein diffuses out of the GUVs via a decrease influorescence intensity.
Figure 4. Confocal fluorescence images of calcein leakage from an exemplary POPC/POPG (9:1) GUVwith azoALY added externally (50 μM at time 0 min. A single GUV was held in one spatial locationusing a microfluidic platform; for details, see reference [39]. Scale bar: 5 μm.
After 15 min. of incubation with the peptides, the GUVs preserved their membrane structure (i.e.,no visible defects), so we exclude the destruction of the membrane or micron-sized pore formation.However, a considerable amount of calcein remained entrapped inside the vesicles after 15 min. under
41

Membranes 2020, 10, 294
the used conditions. The analysed GUVs were selected to have the same diameter of approximately 12μm to maintain the same surface area for comparable results. The mean pixel intensities within eachGUV were normalized and plotted against time (Figure 5).
Figure 5. Kinetics of calcein release from POPC/POPG (9:1) GUVs for externally added ALY or azoALY(1 and 50 μM) using 3 separate vesicles. Control measurements without the addition of peptide showedno calcein release (data not shown).
At low concentrations of ALY peptide (1 μM), during the first 15 min. of exposure, the calceinfluorescence undergoes a decrease of 17%. Nevertheless, while using the same concentration of themodified azoALY peptide, a decrease of 31% in intensity was observed at the same time. In contrast,when high concentrations of peptides were used (50 μM), it was possible to observe that the percentageof calcein release is similar for both of the peptides. In that case, the addition of azoALY resulted ina faster calcein release than the reference peptide ALY. In fact, during the first three minutes of theexperiment, 25% of calcein leakage was observed, though, after 15 min., both of the peptides reachedthe same calcein leakage.
3.2.2. Permeabilization of LUVs
We performed an enzymatic assay for detecting possible changes in the permeability of LUVs tofurther evaluate the membrane permeability increase upon peptide addition to the calcein-containingGUVs. For this purpose, LUVs containing entrapped horseradish peroxidase isoenzyme C (HRPC)were prepared. Afterward, the chromogenic substrate ABTS2− and hydrogen peroxide (H2O2) wereadded to the enzyme-containing vesicles. An unperturbed phospholipid membrane is impermeablefor HRPC and ABTS2−. The HRPC molecules cannot cross the membrane due to their large size, andABTS2− molecules cannot move from the external bulk solution into the interior of the vesicles due totheir negative charge. On the contrary, H2O2, being small and uncharged, can easily permeate acrossfluid phospholipid bilayers [47]. The release of HRPC from the LUVs and/or the uptake of ABTS2− bythe LUVs after peptide addition can be conveniently monitored by UV-vis spectrophotometry as theHRPC-catalysed oxidation of ABTS2− to ABTS•− results in increased absorbance (see Figure 6 for aschematic representation of the permeability assay).
42
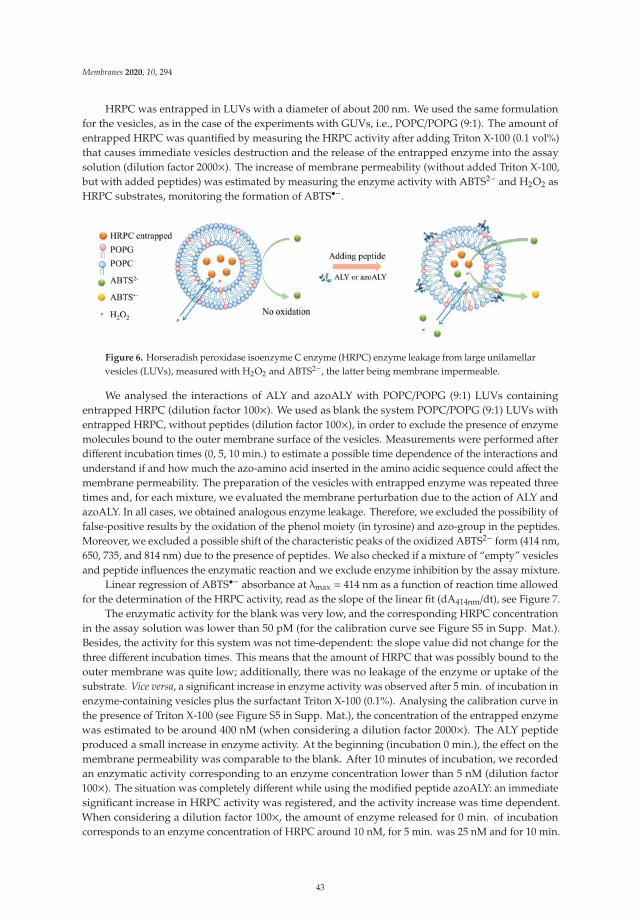
Membranes 2020, 10, 294
HRPC was entrapped in LUVs with a diameter of about 200 nm. We used the same formulationfor the vesicles, as in the case of the experiments with GUVs, i.e., POPC/POPG (9:1). The amount ofentrapped HRPC was quantified by measuring the HRPC activity after adding Triton X-100 (0.1 vol%)that causes immediate vesicles destruction and the release of the entrapped enzyme into the assaysolution (dilution factor 2000×). The increase of membrane permeability (without added Triton X-100,but with added peptides) was estimated by measuring the enzyme activity with ABTS2− and H2O2 asHRPC substrates, monitoring the formation of ABTS•−.
Figure 6. Horseradish peroxidase isoenzyme C enzyme (HRPC) enzyme leakage from large unilamellarvesicles (LUVs), measured with H2O2 and ABTS2−, the latter being membrane impermeable.
We analysed the interactions of ALY and azoALY with POPC/POPG (9:1) LUVs containingentrapped HRPC (dilution factor 100×). We used as blank the system POPC/POPG (9:1) LUVs withentrapped HRPC, without peptides (dilution factor 100×), in order to exclude the presence of enzymemolecules bound to the outer membrane surface of the vesicles. Measurements were performed afterdifferent incubation times (0, 5, 10 min.) to estimate a possible time dependence of the interactions andunderstand if and how much the azo-amino acid inserted in the amino acidic sequence could affect themembrane permeability. The preparation of the vesicles with entrapped enzyme was repeated threetimes and, for each mixture, we evaluated the membrane perturbation due to the action of ALY andazoALY. In all cases, we obtained analogous enzyme leakage. Therefore, we excluded the possibility offalse-positive results by the oxidation of the phenol moiety (in tyrosine) and azo-group in the peptides.Moreover, we excluded a possible shift of the characteristic peaks of the oxidized ABTS2− form (414 nm,650, 735, and 814 nm) due to the presence of peptides. We also checked if a mixture of “empty” vesiclesand peptide influences the enzymatic reaction and we exclude enzyme inhibition by the assay mixture.
Linear regression of ABTS•− absorbance at λmax = 414 nm as a function of reaction time allowedfor the determination of the HRPC activity, read as the slope of the linear fit (dA414nm/dt), see Figure 7.
The enzymatic activity for the blank was very low, and the corresponding HRPC concentrationin the assay solution was lower than 50 pM (for the calibration curve see Figure S5 in Supp. Mat.).Besides, the activity for this system was not time-dependent: the slope value did not change for thethree different incubation times. This means that the amount of HRPC that was possibly bound to theouter membrane was quite low; additionally, there was no leakage of the enzyme or uptake of thesubstrate. Vice versa, a significant increase in enzyme activity was observed after 5 min. of incubation inenzyme-containing vesicles plus the surfactant Triton X-100 (0.1%). Analysing the calibration curve inthe presence of Triton X-100 (see Figure S5 in Supp. Mat.), the concentration of the entrapped enzymewas estimated to be around 400 nM (when considering a dilution factor 2000×). The ALY peptideproduced a small increase in enzyme activity. At the beginning (incubation 0 min.), the effect on themembrane permeability was comparable to the blank. After 10 minutes of incubation, we recordedan enzymatic activity corresponding to an enzyme concentration lower than 5 nM (dilution factor100×). The situation was completely different while using the modified peptide azoALY: an immediatesignificant increase in HRPC activity was registered, and the activity increase was time dependent.When considering a dilution factor 100×, the amount of enzyme released for 0 min. of incubationcorresponds to an enzyme concentration of HRPC around 10 nM, for 5 min. was 25 nM and for 10 min.
43

Membranes 2020, 10, 294
was 33 nM. We could estimate an increase of enzyme release or ABTS2− uptake time dependent withan enzyme concentration in the pooled fraction of 10 nM, 25 nM, and 32.5 nM, respectively.
Figure 7. Enzymatic activity time dependence in four different systems: (grey bar) Blank vesicleswith HRPC entrapped without peptides (dilution factor 100×); (green bar) control vesicles with HRPCentrapped, adding Triton X-100 (dilution factor 2000×); (yellow bar) vesicles with HRPC entrapped,adding a solution of ALY at 4 μM (dilution factor 100×); and (blue bar) vesicles with HRPC entrapped,adding a solution of azoALY at 4 μM (dilution factor 100×). Each data point shown is the average fromthree measurements and the small standard deviation is indicated with a bar.
The HRPC/LUV experiments indicate a time-dependent increased membrane permeability uponthe addition of azoALY. However, it remains to be clarified whether the higher enzymatic activity isascribed to ABTS2− uptake or HRPC release from the vesicles.
4. Conclusions
The combined use of MD simulations, together with experimental tests, allowed for us to investigatethe interaction of a natural peptide and its azobenzene modified analog with artificial membranemodels. We have designed a novel peptide (azoALY) by modifying a natural membrane-active peptide(ALY) with a tyrosine containing an azo-group in the side chain. Computational and experimentalpermeability studies with model membrane systems (vesicles of POPC and POPG at a molar ration of9:1) suggest that the insertion of the modified tyrosine residue in the peptide sequence increases thepeptide affinity to the vesicle membrane. A different membrane permeability for ALY and azoALYwas observed in experimental membrane permeability assays while using GUVs and LUVs: increasedcalcein release form GUVs and increased HRPC leakage from the LUVs or increased ABTS2− uptakeby the LUVs. The MD simulations on model membranes support these results. The all-atom moleculardynamics showed a higher membrane perturbation by the modified peptide (azoALY) than theunmodified peptide (ALY) under the same conditions. The azoALY peptide penetrates the hydrophobiccore of the bilayers, while the ALY structure only interacts with the lipid headgroups, causing a lowerextent of membrane alteration. As a more general consideration, our investigations showed that theresults obtained from physical-chemical in vitro investigations with simple membrane model systemsmight not directly correlate with the in vivo behavior of biological membranes of living cells. Thevesicle and the bacterial membrane compositions were very different, and the actual concentrations interms of peptides and membrane components were difficult to compare. Similar conclusions weredrawn before from other studies [48,49].
44
Membranes 2020, 10, 294
Still, based on the obtained results, the presence of a modified amino acid residue appears tobe essential in determining the perturbation effect of the azobenzene peptide membrane. Undersuch conditions, modified peptides could increase peptide-membrane interaction and complete theirbiological task (for example, antimicrobial agents). The novel semi-synthetic peptide could act as aprodrug, generating in vivo the antimicrobial azo compound. The preliminary results of membranepermeability underlined a higher membrane perturbation with time-dependence leakage from lipidvesicles after interaction with modified peptide as compared to the unmodified peptide under thesame conditions. In conclusion, we evidenced a different behavior of the natural and the azo-modifiedpeptide, and we suggested the use of azo-modified amino acid moieties to increase the membranemodification. Although only one peptide pair and one membrane model were studied, the differenteffects on membrane perturbation suggest that these effects are potentially of broader significance.Additional work is needed in order to clarify the possible generalization of the results that wereobserved in this study.
Supplementary Materials: The following are available online at http://www.mdpi.com/2077-0375/10/10/294/s1.Figure S1. Scheme showing a trapped GUV isolated by a donut valve; Figure S2. Wide-field fluorescence image ofa single GUV trapped hydrodynamically by the posts; Figure S3. OD403 originating from light scattering (turbidity)of the vesicles present in the fractions eluting up to an elution volume of about 12 mL, and HRPC activity of thedifferent fractions, measured with ABTS2−/H2O2 as substrates. Figure S4. Changes of the absorption spectrum ofthe reaction solution as a function of reaction time; Figure S5. HRPC concentration dependency of the absorbanceof the reaction solution at 414 nm; Figure S6. Snapshot of the starting configuration of both peptide/POPC-POPGsystems and the last frame at 50 ns of simulation time. Figure S7. Order parameter SCD for (a) the unsaturatedoleic and (b) the saturated palmitoyl acyl chains of phospholipids in POPC/POPG/peptide.
Author Contributions: Conceptualization, L.S., P.W. and S.P.; Data curation, L.S., S.C., P.W., A.P. and B.P.;Investigation, L.S., S.C. and A.P.; Methodology, L.S., T.R. and U.C.; Resources, S.C., P.W., P.S.D. and S.P.;Writing–original draft, L.S.; Writing–review & editing, L.S., S.C., P.W., T.R., P.S.D. and S.P. All authors have readand agreed to the published version of the manuscript.
Funding: This research was funded by the Italian Ministry of Education, University and Research(MIUR) [grant number 300395FRB17] and by the European Grant CLINGLIO, Research & InnovationH2020-SC1-2017-Two-Stage-RTD Call H2020-SC1-2016-2017.
Conflicts of Interest: The authors declare no conflict of interest.
References
1. Guha, S.; Ghimire, J.; Wu, E.; Wimley, W.C. Mechanistic Landscape of Membrane-Permeabilizing Peptides.Chem. Rev. 2019, 119, 6040–6085. [CrossRef]
2. Hasan, M.; Yamazaki, M. Elementary Processes and Mechanisms of Interactions of Antimicrobial Peptideswith Membranes—Single Giant Unilamellar Vesicle Studies. In Antimicrobial Peptides. Advances in ExperimentalMedicine and Biology; Springer: Berlin/Heidelberg, Germany, 2019; Volume 1117, pp. 17–32.
3. Shai, Y. Mechanism of the binding, insertion and destabilization of phospholipid bilayer membranes byα-helical antimicrobial and cell non-selective membrane-lytic peptides. Biochim. Biophys. Acta (BBA)Biomembr. 1999, 1462, 55–70. [CrossRef]
4. Ergene, C.; Yasuhara, K.; Palermo, E.F. Biomimetic antimicrobial polymers: Recent advances in moleculardesign. Polym. Chem. 2018, 9, 2407–2427. [CrossRef]
5. Galdiero, S.; Falanga, A.; Cantisani, M.; Vitiello, M.; Morelli, G.; Galdiero, M. Peptide-Lipid Interactions:Experiments and Applications. Int. J. Mol. Sci. 2013, 14, 18758–18789. [CrossRef]
6. Hall, B.A.; Chetwynd, A.P.; Sansom, M.S.P. Exploring Peptide-Membrane Interactions with Coarse-GrainedMD Simulations. Biophys. J. 2011, 100, 1940–1948. [CrossRef]
7. Sato, H.; Feix, J.B. Peptide–membrane interactions and mechanisms of membrane destruction by amphipathicα-helical antimicrobial peptides. Biochim. Biophys. Acta (BBA) Biomembr. 2006, 1758, 1245–1256. [CrossRef]
8. Hollmann, A.; Martinez, M.; Maturana, P.; Semorile, L.C.; Maffia, P.C. Antimicrobial Peptides: Interaction WithModel and Biological Membranes and Synergism With Chemical Antibiotics. Front. Chem. 2018, 6. [CrossRef]
9. Travkova, O.G.; Moehwald, H.; Brezesinski, G. The interaction of antimicrobial peptides with membranes.Adv. Colloid Interface Sci. 2017, 247, 521–532. [CrossRef]
45

Membranes 2020, 10, 294
10. Pillong, M.; Hiss, J.A.; Schneider, P.; Lin, Y.-C.; Posselt, G.; Pfeiffer, B.; Blatter, M.; Müller, A.T.; Bachler, S.;Neuhaus, C.S.; et al. Rational Design of Membrane-Pore-Forming Peptides. Small 2017, 13, 1701316.[CrossRef]
11. Friedman, R.; Khalid, S.; Aponte-Santamaría, C.; Arutyunova, E.; Becker, M.; Boyd, K.J.; Christensen, M.;Coimbra, J.T.S.; Concilio, S.; Daday, C.; et al. Understanding Conformational Dynamics of Complex LipidMixtures Relevant to Biology. J. Membr. Biol. 2018, 251, 609–631. [CrossRef]
12. Ishibashi, J.; Saido-Sakanaka, H.; Yang, J.; Sagisaka, A.; Yamakawa, M. Purification, cDNA cloning andmodification of a defensin from the coconut rhinoceros beetle, Oryctes rhinoceros. Eur. J. Biochem. 1999, 266,616–623. [CrossRef] [PubMed]
13. Piotto, S.P.; Sessa, L.; Concilio, S.; Iannelli, P. YADAMP: Yet another database of antimicrobial peptides. Int. J.Antimicrob. Agents 2012, 39, 346–351. [CrossRef] [PubMed]
14. Piotto, S.; Di Biasi, L.; Sessa, L.; Concilio, S. Transmembrane Peptides as Sensors of the Membrane PhysicalState. Front. Phys. 2018, 6. [CrossRef]
15. Scrima, M.; Di Marino, S.; Grimaldi, M.; Campana, F.; Vitiello, G.; Piotto, S.P.; D’Errico, G.; D’Ursi, A.M.Structural features of the C8 antiviral peptide in a membrane-mimicking environment. Biochim. Biophys.Acta (BBA) Biomembr. 2014, 1838, 1010–1018. [CrossRef] [PubMed]
16. Chen, C.H.; Melo, M.C.; Berglund, N.; Khan, A.; de la Fuente-Nunez, C.; Ulmschneider, J.P.;Ulmschneider, M.B. Understanding and modelling the interactions of peptides with membranes: Frompartitioning to self-assembly. Curr. Opin. Struct. Biol. 2020, 61, 160–166. [CrossRef] [PubMed]
17. Mondal, S.; Khelashvili, G.; Shan, J.; Andersen, O.S.; Weinstein, H. Quantitative modeling of membranedeformations by multihelical membrane proteins: Application to G-protein coupled receptors. Biophys. J.2011, 101, 2092–2101. [CrossRef]
18. Piotto, S.; Concilio, S.; Sessa, L.; Diana, R.; Torrens, G.; Juan, C.; Caruso, U.; Iannelli, P. Synthesis andantimicrobial studies of new antibacterial azo-compounds active against staphylococcus aureus and listeriamonocytogenes. Molecules 2017, 22, 1372. [CrossRef]
19. Concilio, S.; Sessa, L.; Petrone, A.M.; Porta, A.; Diana, R.; Iannelli, P.; Piotto, S. Structure modification of anactive azo-compound as a route to new antimicrobial compounds. Molecules 2017, 22, 875. [CrossRef]
20. Chan, Y.H.M.; Boxer, S.G. Model membrane systems and their applications. Curr. Opin. Chem. Biol. 2007, 11,581–587. [CrossRef]
21. Kumagai, P.S.; Sousa, V.K.; Donato, M.; Itri, R.; Beltramini, L.M.; Araujo, A.P.; Buerck, J.; Wallace, B.;Lopes, J.L. Unveiling the binding and orientation of the antimicrobial peptide Plantaricin 149 in zwitterionicand negatively charged membranes. Eur. Biophys. J. 2019, 48, 621–633. [CrossRef]
22. Ning, L.; Mu, Y. Aggregation of PrP106–126 on surfaces of neutral and negatively charged membranesstudied by molecular dynamics simulations. Biochim. Biophys. Acta (BBA) Biomembr. 2018, 1860, 1936–1948.[CrossRef]
23. Leber, R.; Pachler, M.; Kabelka, I.; Svoboda, I.; Enkoller, D.; Vácha, R.; Lohner, K.; Pabst, G. Synergism ofantimicrobial frog peptides couples to membrane intrinsic curvature strain. Biophys. J. 2018, 114, 1945–1954.[CrossRef]
24. Salnikov, E.S.; Bechinger, B. Lipid-controlled peptide topology and interactions in bilayers: Structural insightsinto the synergistic enhancement of the antimicrobial activities of PGLa and magainin 2. Biophys. J. 2011, 100,1473–1480. [CrossRef]
25. Tzong-Hsien, L.; Kristopher, N.H.; Marie-Isabel, A. Antimicrobial Peptide Structure and Mechanism ofAction: A Focus on the Role of Membrane Structure. Curr. Top. Med. Chem. 2016, 16, 25–39. [CrossRef]
26. Matsuzaki, K.; Harada, M.; Handa, T.; Funakoshi, S.; Fujii, N.; Yajima, H.; Miyajima, K. Magainin 1-InducedLeakage of Entrapped Calcein out of Negatively-Charged Lipid Vesicles. Biochim. Biophys. Acta 1989, 981,130–134. [CrossRef]
27. Matsuzaki, K.; Fukui, M.; Fujii, N.; Miyajima, K. Interactions of an antimicrobial peptide, tachyplesin I, withlipid membranes. Biochim. Biophys. Acta 1991, 1070, 259–264. [CrossRef]
28. King, R.D.; Sternberg, M.J. Identification and application of the concepts important for accurate and reliableprotein secondary structure prediction. Protein Sci. 1996, 5, 2298–2310. [CrossRef] [PubMed]
29. Holton, T.A.; Pollastri, G.; Shields, D.C.; Mooney, C. CPPpred: Prediction of cell penetrating peptides.Bioinformatics 2013, 29, 3094–3096. [CrossRef]
46
Membranes 2020, 10, 294
30. Altomare, A.; Burla, M.C.; Camalli, M.; Cascarano, G.L.; Giacovazzo, C.; Guagliardi, A.; Moliterni, A.G.;Polidori, G.; Spagna, R. SIR97: A new tool for crystal structure determination and refinement. J. Appl.Crystallogr. 1999, 32, 115–119. [CrossRef]
31. Jo, S.; Lim, J.B.; Klauda, J.B.; Im, W. CHARMM-GUI Membrane Builder for Mixed Bilayers and Its Applicationto Yeast Membranes. Biophys. J. 2009, 97, 50–58. [CrossRef]
32. Krieger, E.; Vriend, G. YASARA View-molecular graphics for all devices-from smartphones to workstations.Bioinformatics 2014, 30, 2981–2982. [CrossRef] [PubMed]
33. Guixà-González, R.; Rodriguez-Espigares, I.; Ramírez-Anguita, J.M.; Carrió-Gaspar, P.; Martinez-Seara, H.;Giorgino, T.; Selent, J. MEMBPLUGIN: Studying membrane complexity in VMD. Bioinformatics 2014, 30,1478–1480. [CrossRef]
34. Concilio, S.; Ferrentino, I.; Sessa, L.; Massa, A.; Iannelli, P.; Diana, R.; Panunzi, B.; Rella, A.; Piotto, S. A novelfluorescent solvatochromic probe for lipid bilayers. Supramol. Chem. 2017, 29, 887–895. [CrossRef]
35. Maget-Dana, R.; Bonmatin, J.M.; Hetru, C.; Ptak, M.; Maurizot, J.C. The secondary structure of the insectdefensin A depends on its environment. A circular dichroism study. Biochimie 1995, 77, 240–244. [CrossRef]
36. Pieri, E.; Ledentu, V.; Huix-Rotllant, M.; Ferré, N. Sampling the protonation states: The pH-dependent UVabsorption spectrum of a polypeptide dyad. Phys. Chem. Chem. Phys. 2018, 20, 23252–23261. [CrossRef]
37. Angelova, M.I.; Soleau, S.; Meleard, P.; Faucon, J.F.; Bothorel, P. Preparation of Giant Vesicles by External AcElectric-Fields-Kinetics and Applications. Prog. Coll. Pol. Sci. 1992, 89, 127–131. [CrossRef]
38. Robinson, T.; Dittrich, P.S. Observations of membrane domain reorganization in mechanically compressedartificial cells. ChemBioChem 2019, 20, 2666–2673. [CrossRef] [PubMed]
39. Robinson, T.; Kuhn, P.; Eyer, K.; Dittrich, P.S. Microfluidic trapping of giant unilamellar vesicles to studytransport through a membrane pore. Biomicrofluidics 2013, 7, 044105. [CrossRef]
40. Zhang, Y.; Schmid, Y.R.F.; Luginbühl, S.; Wang, Q.; Dittrich, P.S.; Walde, P. Spectrophotometric Quantificationof Peroxidase with p-Phenylene-diamine for Analyzing Peroxidase-Encapsulating Lipid Vesicles. Anal.Chem. 2017, 89, 5484–5493. [CrossRef] [PubMed]
41. Childs, R.E.; Bardsley, W.G. The steady-state kinetics of peroxidase with 2,2’-azino-di-(3-ethyl-benzthiazoline-6-sulphonic acid) as chromogen. Biochem. J. 1975, 145, 93–103. [CrossRef]
42. Welinder, K.G.; Smillie, L.B. Amino acid sequence studies of horseradish peroxidase. II. Thermolytic peptides.Can. J. Biochem. 1972, 50, 63–90. [CrossRef] [PubMed]
43. Veitch, N.C. Horseradish peroxidase: A modern view of a classic enzyme. Phytochemistry 2004, 65, 249–259.[CrossRef] [PubMed]
44. Porstmann, B.; Porstmann, T.; Gaede, D.; Nugel, E.; Egger, E. Temperature dependent rise in activity ofhorseradish peroxidase caused by non-ionic detergents and its use in enzyme-immunoassay. Clin. Chim.Acta 1981, 109, 175–181. [CrossRef]
45. Walde, P.; Cosentino, K.; Engel, H.; Stano, P. Giant vesicles: Preparations and applications. ChemBioChem2010, 11, 848–865. [CrossRef] [PubMed]
46. Dimova, R. Giant vesicles and their use in assays for assessing membrane phase state, curvature, mechanics,and electrical properties. Annu. Rev. Biophys. 2019, 48, 93–119. [CrossRef] [PubMed]
47. Yoshimoto, M.; Higa, M. A kinetic analysis of catalytic production of oxygen in catalase-containing liposomedispersions for controlled transfer of oxygen in a bioreactor. J. Chem. Technol. Biotechnol. 2014, 89, 1388–1395.[CrossRef]
48. Shimanouchi, T.; Walde, P.; Gardiner, J.; Mahajan, Y.R.; Seebach, D.; Thomae, A.; Krämer, S.D.; Voser, M.;Kuboi, R. Permeation of a β-heptapeptide derivative across phospholipid bilayers. Biochim. Biophys. Acta(BBA) Biomembr. 2007, 1768, 2726–2736. [CrossRef]
49. Zepik, H.H.; Walde, P.; Kostoryz, E.L.; Code, J.; Yourtee, D.M. Lipid vesicles as membrane models fortoxicological assessment of xenobiotics. Crit. Rev. Toxicol. 2008, 38, 1–11. [CrossRef] [PubMed]
Publisher’s Note: MDPI stays neutral with regard to jurisdictional claims in published maps and institutionalaffiliations.
© 2020 by the authors. Licensee MDPI, Basel, Switzerland. This article is an open accessarticle distributed under the terms and conditions of the Creative Commons Attribution(CC BY) license (http://creativecommons.org/licenses/by/4.0/).
47


membranes
Article
Influence of Cholesterol on the Orientation of theFarnesylated GTP-Bound KRas-4B Binding withAnionic Model Membranes
Huixia Lu and Jordi Martí *
Department of Physics, Technical University of Catalonia-Barcelona Tech, 08034 Barcelona, Spain;[email protected]* Correspondence: [email protected]
Received: 6 October 2020; Accepted: 18 November 2020; Published: 22 November 2020
Abstract: The Ras family of proteins is tethered to the inner leaflet of the cell membranes which playsan essential role in signal transduction pathways that promote cellular proliferation, survival, growth,and differentiation. KRas-4B, the most mutated Ras isoform in different cancers, has been underextensive study for more than two decades. Here we have focused our interest on the influence ofcholesterol on the orientations that KRas-4B adopts with respect to the plane of the anionic modelmembranes. How cholesterol in the bilayer might modulate preferences for specific orientationstates is far from clear. Herein, after analyzing data from in total 4000 ns-long molecular dynamics(MD) simulations for four KRas-4B systems, properties such as the area per lipid and thickness ofthe membrane as well as selected radial distribution functions, penetration of different moietiesof KRas-4B, and internal conformational fluctuations of flexible moieties in KRas-4B have beencalculated. It has been shown that high cholesterol content in the plasma membrane (PM) favorsone orientation state (OS1), exposing the effector-binding loop for signal transduction in the cellfrom the atomic level. We confirm that high cholesterol in the PM helps KRas-4B mutant stay inits constitutively active state, which suggests that high cholesterol intake can increase mortalityand may promote cancer progression for cancer patients. We propose that during the treatment ofKRas-4B-related cancers, reducing the cholesterol level in the PM and sustaining cancer progressionby controlling the plasma cholesterol intake might be taken into account in anti-cancer therapies.
Keywords: KRas-4B; mutation; post-translational modification; HVR; anionic plasma membrane;signaling; cholesterol
1. Introduction
The cell membrane plays an important role in controlling the passing of nutrients, wastes,drugs, and heat between the inner and outer parts of a cell. The principal components of humancellular membranes are phospholipids, cholesterol, and proteins, etc. Moreover, the concentrationof each constituent differs for different types of cells. Phospholipids provide the framework tobiomembranes and they consist of two leaflets of amphiphilic lipids with a hydrophilic headand one or two hydrophobic tails which self-assemble due to the hydrophobic effect [1,2].For instance, 1,2-dioleoyl-sn-glycero-3-phosphocholine (DOPC) belongs to the unsaturatedphospholipids which is a typical constituent of real biological membranes. Furthermore,1,2-dioleoyl-sn-glycero-3-phospho-L-serine (DOPS) is the most common anionic lipid in the plasmamembrane (PM) of mammalian cells, which is preferentially targeted by the PM intracellular surfaceprotein KRas-4B [3] for signal transduction.
PM systems have been extensively studied over several decades [4–8] on their association withproteins. Recent studies have shown that the role of proteins and their interactions with components of
Membranes 2020, 10, 364; doi:10.3390/membranes10110364 www.mdpi.com/journal/membranes
49

Membranes 2020, 10, 364
PM is extremely important to understand the mechanisms of protein anchoring into the membrane thatcan lead to oncogenesis [9]. GTPases are a large family of hydrolase enzymes that bind to the nucleotideguanosine triphosphate (GTP) and hydrolyze it to guanosine diphosphate (GDP). GDP/GTP cyclingis controlled by two main classes of regulatory proteins. Guanine-nucleotide-exchange factors(GEFs) promote the formation of the active, GTP-bound form, while GTPase-activating proteins(GAPs) inactivate Ras by enhancing the intrinsic GTPase activity to promote the formation of theinactive GDP-bound form [10–12]. Ras proteins are small molecular weight GTPases and function asGDP/GTP-regulated molecular switches controlling pathways involved in critical cellular functions,like cell proliferation, signaling, cell growth, and anti-apoptosis pathways [13]. The three Ras genes giverise to three base protein sequences: KRas, HRas, and NRas. Over 30% of cancers are driven by mutantRas proteins, thereinto, one method called catalog of somatic mutations in cancer (COSMIC) [14]confirms that HRas (3%) are the least frequently mutated Ras isoforms in human cancers, where KRas(86%) are the predominantly mutated isoforms followed by NRas (11%) [15].
KRas can be found as two splice variants designated KRas-4A and KRas-4B. They both havepolybasic sequences that facilitate membrane-association in acidic membrane regions [16], however,for KRas-4A, it is covalently modified by a single palmitic acid. KRas-4B is distinguished from KRas-4Aisoform in the residue 181 that serves as a phosphorylation site within its flexible hypervariable region(HVR, residues 167–185) that contains the farnesyl group (FAR) serving as the lipid anchor. The HVRof KRas-4B contains multiple amino-acid lysines that act as an electrostatic farnesylated switch whichguarantees KRas-4B’s association with the negatively charged phospholipids in the inner PM leaflet.It has been reported that the KRas-4B activation level in diseased cells is linked to phosphatidylserinecontents [17]. Anionic lipids could influence the membrane potential which in turn regulates theorientation, location, and signaling ability of KRas-4B [18,19].
The catalytic domain (CD, residues 1–166), which contains the catalytic lobe (lobe 1, residues 1–86)and the allosteric lobe (lobe 2, residues 87–166), highly homologous, conserved, and the structure isshared and identical for KRas-4A and KRas-4B. According to P. Prakash et al. [20–22], three distinctorientation states of the oncogenic G12V-KRas-4B mutant on the membrane have been reported, namely,OS1, OS2, and OS0. OS1, with an accessible effector-binding loop, and OS2, with the effector-bindingloop occluded by the membrane, has been reported. They differ in the accessibility of functionallycritical switch loops to the downstream effectors, suggesting that membrane reorientation of KRas-4Bon the inner cell leaflet may modulate its signaling [21]. The idea of the more flexible in the structureof proteins, the larger the number of their populated states have been pointed out [23]. We and otherresearchers have recently shown that despite the HVR and FAR anchor, the CD of KRas-4B couldinteract with anionic model membranes by forming steady salt bridges and hydrogen bonds to helporganize its orientations in cells [18,24,25].
All Ras proteins’ signaling strongly depends on their correct localization in the cell membrane andit is essential for activating downstream signaling pathways. KRas-4B function, membrane associationand interaction with other proteins are regulated by post-translational modifications (PTMs) [26–28],including ubiquitination, acetylation, prenylation, phosphorylation, and carboxymethylation,see Figure 1. Firstly, the prenylation reaction, catalyzed by cytosolic farnesyltrasferase (FTase) orgeranylgeranyltransferase (GGTase), proceeds through the addition of an isoprenyl group to theCys-185 side chain. Then, farnesylated KRas-4B is ready for further processing: hydrolysis, catalyzedby the endopeptidase enzyme called Ras-converting enzyme 1 (RCE1); during the process, the VIMmotif (HVR tail is composed of three amino acids: valine-isoleucine-methionine) of the C-terminalCys-185 is lost in step 2.
50

Membranes 2020, 10, 364
Figure 1. Post-translational modifications (PTMs) steps of KRas-4B: prenylation, hydrolysis,carboxymethylation and decarboxymethylation.
In step 3, KRas-4B is transferred to the endoplasmic reticulum for carboxymethylation at thecarboxyl terminus of Cys-185 catalyzed by isoprenylcysteine carboxyl methyltransferase (ICMT),forming a reversible ester bond. The reversible ester bond can go through decarboxymethylation,catalyzed by prenylated/polyisoprenylated methylated protein methyl esterases (PMPEases) givingrise to a farnesylated and demethylated KRas-4B (KRas-4B-Far). Carboxymethylation is one of thebest known reversible PTMs in HVR [29]. This reversible reaction can modulate the equilibriumof methylated/demethylated KRas-4B population (KRas-4B-FMe/KRas-4B-Far) in tumors andconsequently can impact downstream signaling, protein–protein interactions, or protein–lipidinteractions [30]. Another well-known reversible PTM in the HVR is phosphorylation [28,31,32].There are two sites (Ser-171 and Ser-181) within HVR that could be phosphorylated. Phosphorylationinvolves the addition of phosphate (PO3−
4 ) group to the side chain of the amino acid serine, then thephosphorylated serine is obtained. In this work, we have only applied the phosphorylation at Ser-181(PHOS) for the oncogenic KRas-4B. Phosphorylation at Ser-181 operates a farnesyl-electrostaticswitch that reduces but does not completely inhibit membrane association and clustering ofKRas-4B, leading to the redistribution of the cytoplasm and endomembranes [27,33,34]. Functionally,the phosphorylation of KRas-4B can have either a negative [35,36] or positive [34,37] regulatoryeffect on tumor cell growth, depending on the conditions [30]. For instance, from a moleculardynamics (MD) simulation of the HVR peptide with the FAR at Cys-185 of KRas-4B in two types ofmodel membranes, it has been observed that phosphorylation at Ser-181 prohibits spontaneous FARmembrane insertion [38]. According to Agell et al., KRas-4B binding with calmodulin leads to differentbehaviors: short or prolonged signaling whether KRas-4B is at its phosphorylated state on residueSer-181 [34,39]. Moreover, according to Barcelo et al. [37], phosphorylation at Ser-181 of oncogenicKRas is required for tumor growth. In summary, the phosphorylation of the HVR of KRas-4B can affectits function, membrane association, and reacting with downstream effectors [30].
Phosphodiest-eraseδ (PDEδ) has been revealed to promote effective KRas-4B signaling bysequestering KRas-4B-FMe from the cytosol by binding the prenylated HVR and help to enhance itsdiffusion to the PM throughout the cell, where it is released to activate various signaling pathwaysrequired for the initiation and maintenance of cancer [40–43], hoping to identify a panel of novel PDEδ
inhibitors. As described in our earlier work [24], despite KRas-4B-Far’s poor affinity for PDEδ [40],it can still be transferred to the PM through trapping and vesicular transport without the help of
51

Membranes 2020, 10, 364
PDEδ [44]. Moreover, according to Ntai et al., 91% of the mutant KRas-4B and 51% of wild-typeKRas-4B proteins in certain colorectal tumor samples have been found to exist in its KRas-4B-Far form.While there is a relatively high abundance of KRas-4B-Far (wild-type and mutant) lacking the methylgroup of Cys-185 in tumors, the effects of demethylated KRas-4B-Far on downstream signaling haveyet to be determined [45]. While extensive research has been focused on methylated KRas-4B-FMe,we believe that demethylated KRas-4B-Far could play a big role in the signaling pathway that happenson the inner leaflet of the membrane bilayers.
Cholesterol plays an important role in maintaining the structure of different membranes andregulating their functions [46,47], and cancer development as well [48]. In some types of cells, however,the distribution of cholesterol is different in the inner and outer leaflets of the membrane, ranging from0.1% to 50% of total membrane lipids depending on the cell type [49]. The average value of cholesterolconcentration in the PM fell in the range of the reported value of 19–40 % [50–52]. For example, in redcells, the percentage of cholesterol differs in the outer leaflet (51%) and the inner leaflet (49%) [53].In other types of cells, cholesterol constitutes about 33.3% of the outer leaflet in healthy colorectalcells [50]. Previous simulations with percentages of 10%, 20%, and 40% for DPPC lipid bilayers showedno further relevant physical changes compared to the cholesterol percentages of 0%, 30% and 50%adopted in our previous work [54].
The fluidity of the membrane is mainly regulated by the amount of cholesterol, in such a way thatmembranes with high cholesterol contents are stiffer than those with low amounts but keeping theappropriate fluidity for allowing normal membrane functions. Extensive research has been done onthe influence of cholesterol on the mechanism of membrane structures [55], the 18-kDa translocatorprotein (TSPO) binding in the brain [56], etc. Pancreatic ductal adenocarcinoma (PDAC) is one of themost lethal cancers with the lowest survival rate (five-year survival of only 8%) among the cancersreported by the American Cancer Society [57]. There is evidence that shows that high cholesterolincreases PDAC cancer risk. According to Chen et al. [58], a linear dose–response relationship hasattested that the risk of pancreatic cancer rises by 8% with 100 mg/day of cholesterol intake through thedose-response analysis. In addition, cholesterol does not influence the mortality among patients withPDAC cancer for both statin users and nonusers measured at different time windows and analyzed ascontinuous, dichotomous, and categorical variables [59].
The mechanisms underlying the cholesterol-cancer correlation have not been fully elucidated.In the present work, we used molecular dynamics (MD) simulations, a very successful tool to describea wide variety of molecular setups at the all-atom level, such as complex biological and aqueoussystems [60–62]. We have investigated whether cholesterol in membranes affects the signaling ofRas proteins by interfering with their orientations when the oncogenic and wild-type KRas bindingwith the membrane. Moreover, two percentages of cholesterol (0% and 30%) have been considered.Gaining a precise understanding of the influence of cholesterol on the reorientation of mutant andwild-type KRas-4B-Far binding at the anionic model membranes is the goal of the current work.
2. Results and Discussion
2.1. Area Per Lipid
Area per lipid is often used as the key parameter when assessing the validity of MD simulationsof cell membranes. It has been proposed that a good test for such validation is the comparison of thearea per lipid and thickness of the membrane with experimental data obtained from scattering densityprofiles [63]. The area per lipid and thickness along the simulation time of the last 500 ns have beencomputed (see Figure A1 of Appendix A.1) and the average values are reported in Table 1.
52

Membranes 2020, 10, 364
Table 1. The average area per lipid (A) and thickness (Δz) of the anionic membrane for four KRas-4B-Farsystems studied in this work. The thickness of the membrane Δz by computing the mean distancebetween phosphorus atoms of DOPC head groups from both leaflets. Estimated errors in parenthesis.
System A (nm2) Δz (nm)
wt. chol.-0% 0.679 (0.008) 3.84 (0.04)wt. chol.-30% [24] 0.523 (0.007) 4.35 (0.05)
onc. chol.-0% 0.679 (0.008) 3.89 (0.04)onc. chol.-30% [24] 0.525 (0.006) 4.23 (0.04)
The experimental value of 0.71 nm2 for area per lipid of DOPC/DOPS (4:1) at 297 K wasreported in Ref. [64] and the experimental value of thickness to be of 3.94 nm at 303 K was reportedby Novakova et al. [65]. As temperature increases, atoms in the lipid structure oscillate moreperpendicularly to their bonds. So, increasing the temperature of the system leads to an increased areaper lipid of certain phosphatidylcholine lipids, as was observed for temperatures below 420 K [66].It was previously reported that KRas-4B can interact with head groups of DOPC and DOPS lipidmolecules through long-lived salt bridges and hydrogen bonds [24]. Accordingly, when the systemtemperature rises, for the same model membrane, its thickness decreases. Our results of the areaper lipid (0.03 nm2) and thickness (∼0.1 nm) are smaller than the experiment values for pure lipidsystems. The main reason is the contribution of the joint effect of raising the system temperature andthe appearance of KRas-4B-Far, showing a slight condensing effect on the membrane. According toearlier research [67], in the case of relatively high cholesterol concentration, 10 ∼ 20% smaller areaper lipid will be considered to be reasonable and close to equilibrium ones. From another work [68],compared to pure DMPC bilayer, the area per lipid of DMPC with cholesterol (30%) has been decreasedby 32% from 0.62 to 0.42 nm2. In the regime with chol. ≤ 30%, the area per lipid has been reported todecrease sharply as cholesterol is added into the system [69]. In Table 1, the area per lipid for highcholesterol cases (chol.-30%) has been decreased by 23% when compared with the cholesterol-free cases(chol.-0%). The results make much sense when compared with the experimental values confirmingcholesterol’s condensation effect on DOPC/DOPS membrane bilayers. The results of the area per lipidand thickness of membrane bilayers we have investigated are in good agreement with experimentalvalues. Hence, the validity of MD simulations reported here, regarding the structural characteristics ofthe membrane, has been established.
2.2. Preferential Localization of Kras-4b-Far on Membranes
Ras proteins are activated following an incoming signal from their upstream regulators andinteract with their downstream effectors only when they are anchored into the membrane and being atthe GTP-bound state. Tracking the movement of the FAR of KRas-4B-Far and GTP along the membranenormal could give us direct information on how the KRas-4B proteins and GTP molecule regulate eachother. We report in Figure 2, the Z-axis positions of the centers of FAR and GTP from the center oflipids (i.e., Z = 0) using the second half of 1000 ns simulation for all cases.
As is described in Ref. [24], the FAR of the wild-type KRas-4B-Far is revealed to be able to anchorinto and depart from the membrane without difficulty in the chol.-30% case when GTP favors bindwith the interface of the membrane through salt bridges and hydrogen bonds, located at around2.39 nm from the membrane center. The FAR can have two preferred localisations: (1) 3.90 nm whenFAR wanders in the water region, and (2) 1.73 nm when FAR anchors inside of the PM. However,in the chol.-free case, the FAR of the wild-type KRas-4B-Far is found to be anchoring constantly intothe anionic membrane for the entire duration of the simulations. FAR keeps locating around 1.30 nm,while GTP keeps binding to the CD, staying around 4.38 nm.
53

Membranes 2020, 10, 364
0
2
4
6
8Z
wt.
cho
l.-30
%[n
m]
2.39
3.90
1.73
Head groups of bilayersFARGTP
0
2
4
6
8
Zon
c. c
hol.-
30%
[nm
]
5.16
1.37
0 50 100 150 200 250 300 350 400 450 500Simulation time [ns]
0
1
2
3
4
Zon
c. c
hol.-
0% [
nm]
2.78
1.54
0 50 100 150 200 250 300 350 400 450 500Simulation time [ns]
0
2
4
Zw
t. c
hol.-
0% [
nm]
4.38
1.30
Figure 2. The localizations of the farnesyl group (FAR) and GTP of four KRas-4B systems studied inthis work with respect to the center of the membrane along with the membrane normal as a function ofsimulation time. Geometric centers of the FAR, GTP, and phosphorus atoms of DOPC lipids from bothleaflets are indicated as triangle up in violet and circle in turquoise, respectively. Data for chol.-30%shown here are adopted from our previous work [24] for the convenience of the audience. The averagevalues of the FAR and GTP are indicated in dashed lines.
For the mutant KRas-4B-Far, when diffusing in the DOPC/DOPS (4:1) bilayer, GTP tends towander around 2.78 nm away from the membrane center along with the membrane normal direction.When 30% of cholesterol was considered, GTP favors binding with the CD instead of wandering nearthe interface region of the membrane. For both oncogenic cases, FAR is revealed to be anchoringconstantly into the anionic membrane as a function of the simulation time, as might be expected.
By comparing the four systems we studied, we propose that adding cholesterol into the system hasless influence on the behavior of FAR of the oncogenic KRas-4B-Far anchoring to the anionic membrane.Moreover, for a different type of KRas-4B-Far, GTP’s localization cannot be predicted according todifferent types of mutations in the KRas-4B’s structure and the constitution of the cell membrane weare studying. Remarkably, the existence of cholesterol helps FAR of the mutant KRas-4B-Far anchor0.17 nm deeper into the anionic membrane than the chol.-0% case.
2.3. Conformation of the 5-Aa-Sequence in The Hvr
As suggested by Dharmaiah et al. [40], a 5-amino-acid-long sequence motif in its HVR(K-S-K-T-K, residues 180-184), which is shared by KRas-4B-Far and KRas-4B-FMe, may enable PDEδ tobind prenylated KRas-4B.
54
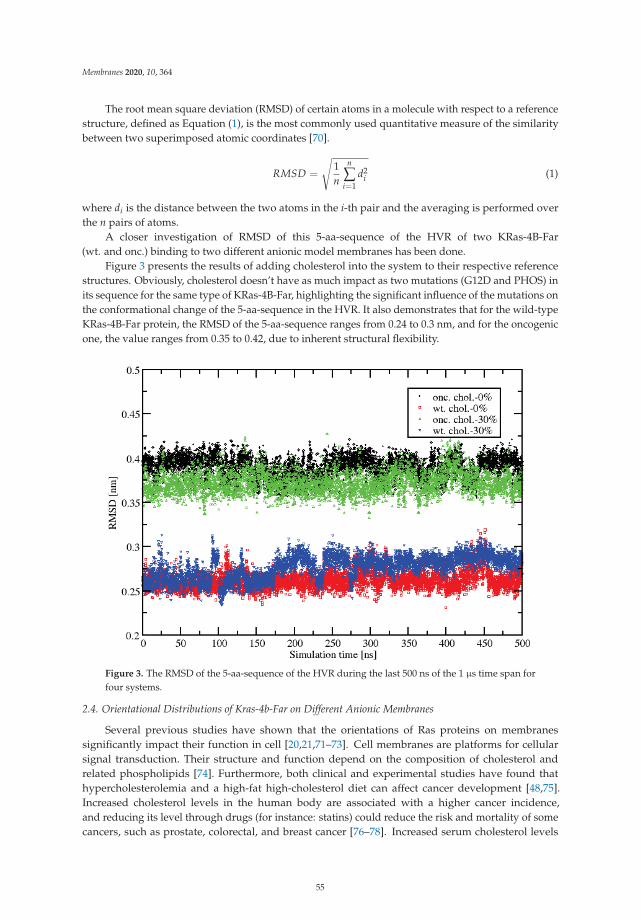
Membranes 2020, 10, 364
The root mean square deviation (RMSD) of certain atoms in a molecule with respect to a referencestructure, defined as Equation (1), is the most commonly used quantitative measure of the similaritybetween two superimposed atomic coordinates [70].
RMSD =
√1n
n
∑i=1
d2i (1)
where di is the distance between the two atoms in the i-th pair and the averaging is performed overthe n pairs of atoms.
A closer investigation of RMSD of this 5-aa-sequence of the HVR of two KRas-4B-Far(wt. and onc.) binding to two different anionic model membranes has been done.
Figure 3 presents the results of adding cholesterol into the system to their respective referencestructures. Obviously, cholesterol doesn’t have as much impact as two mutations (G12D and PHOS) inits sequence for the same type of KRas-4B-Far, highlighting the significant influence of the mutations onthe conformational change of the 5-aa-sequence in the HVR. It also demonstrates that for the wild-typeKRas-4B-Far protein, the RMSD of the 5-aa-sequence ranges from 0.24 to 0.3 nm, and for the oncogenicone, the value ranges from 0.35 to 0.42, due to inherent structural flexibility.
Figure 3. The RMSD of the 5-aa-sequence of the HVR during the last 500 ns of the 1 μs time span forfour systems.
2.4. Orientational Distributions of Kras-4b-Far on Different Anionic Membranes
Several previous studies have shown that the orientations of Ras proteins on membranessignificantly impact their function in cell [20,21,71–73]. Cell membranes are platforms for cellularsignal transduction. Their structure and function depend on the composition of cholesterol andrelated phospholipids [74]. Furthermore, both clinical and experimental studies have found thathypercholesterolemia and a high-fat high-cholesterol diet can affect cancer development [48,75].Increased cholesterol levels in the human body are associated with a higher cancer incidence,and reducing its level through drugs (for instance: statins) could reduce the risk and mortality of somecancers, such as prostate, colorectal, and breast cancer [76–78]. Increased serum cholesterol levels
55

Membranes 2020, 10, 364
could be used as an indicator for developing cancers, such as colon, prostatic, testicular, and rectalcancer [79,80].
To explore the influence of cholesterol on the orientation of KRas, we employed the definitionof the orientation of KRas-4B-FMe described by Prakash et al. [20] to compare with the results fromthis work and propose a new method to define the orientation of KRas binding to the PM. In general,two order parameters have been adopted: (1) the distance (z) between Cα atoms of the residue 132on the lobe 2 and the residue 183 on the HVR, and (2) the angle Θ between the membrane normaldirection and a vector running the Cα atoms of the residue 5 and the residue 9 which belong to the firststrand β1 in the structure of KRas-4B. The results of the density distribution of conformations definedby the order parameter z and cosΘ during the last 500 ns simulation time for four systems studied inthis work have been presented in Figure 4.
Two distinct orientations of KRas were proposed in their work: OS1, in which the loop issolvent-accessible, and OS2, in which the effector-binding loop is occluded by the membrane.The remaining conformations are categorized into the intermediate state OS0.
Moreover, we define a new parameter, the angle Φ that runs the membrane normal and a vectorrunning the Cα atoms of residues 163 and 156 on the last helix α5 of lobe 2. According to data fromreferences [81–83], it is known that dimerization of KRas-4B is a requirement for KRas signalingactivity and tumor growth. The helix α5 has been reported to be involved in its dimerization interface.However, despite this being a relevant and interesting topic, dimerization of KRas-4B is outside of thescope of the MD study reported here, since the classical force field we have employed in the presentwork (CHARMM36) does not allow us to simulate the breaking and formation of chemical bonds.Due to its highly conserved structure for the CD, providing the information of the angle Θ along withthe Φ could provide a new way for researchers to define the movement and orientation for KRas whenbinding to the membranes. We have calculated the angle and distance as described above. Moreover,the parameter we newly introduce here will be discussed further later.
Through the two-dimensional histogram, (z, cosΘ), three orientation states OS1 , OS2, and OS0
were reported to be centered around (1.86, −0.5), (4.97, 1), and (3.33, 0.9), respectively, accordingto Prakash et al. [20]. In OS1, KRas-4B can interact with other proteins in cells, confirming thatcholesterol has an important impact on the signaling activity for KRas-4B, especially for mutantones, by increasing the flexibility and fluctuation in its CD with the exposed effector-binding loop.In Figure 4, we can observe that only when oncogenic KRas-4B-Far is bound to the chol.-30% membrane,can OS1 be shown for KRas-4B in a time span of 500 ns. As expected, when binding to the chol.-30%membrane, the wild-type Kras-4B-Far has been observed to stay in its inactive state (OS2). From thelast 500 ns simulation time analyzed in this work, when binding to the anionic cholesterol-richmembrane, the wild-type and mutant KRas-4B-Far proteins can reach all three conformational regions,indicating more flexibility for the CD in the membrane normal direction and less affinity to thecholesterol-rich PM.
However, using these two coordinates (z, cosΘ) defined by Prakash et al. makes it difficult for us tocategorize the conformational states of (wild-type and oncogenic) KRas-4B-Far for the cholesterol-freesystems, and no clear OS1, OS2, and OS0 have been observed, see the upper panels in Figure 4.However, OS1 for the oncogenic KRas-4B-Far in Figure A3 and OS2 for the wild-type KRas-4B-Far inFigure A4 have been observed for the chol.-0% membrane systems. So, using two well-defined anglesto describe the orientation of KRas-4B on the anionic membrane could be a good idea.
We have also investigated the time evolution of z for each system as reported in Figure A2,which shows major conformational fluctuations for four systems (oncogenic KRas-4B-Far and wild-typeKRas-4B-Far, for 0 and 30% chol). For the cholesterol-free membrane systems, the protein majorlyfluctuates between two distinct states in ranges of 2.4 ≤ z ≤ 4.3 and z > 4.3 nm, rarely visiting lowerz values.
56
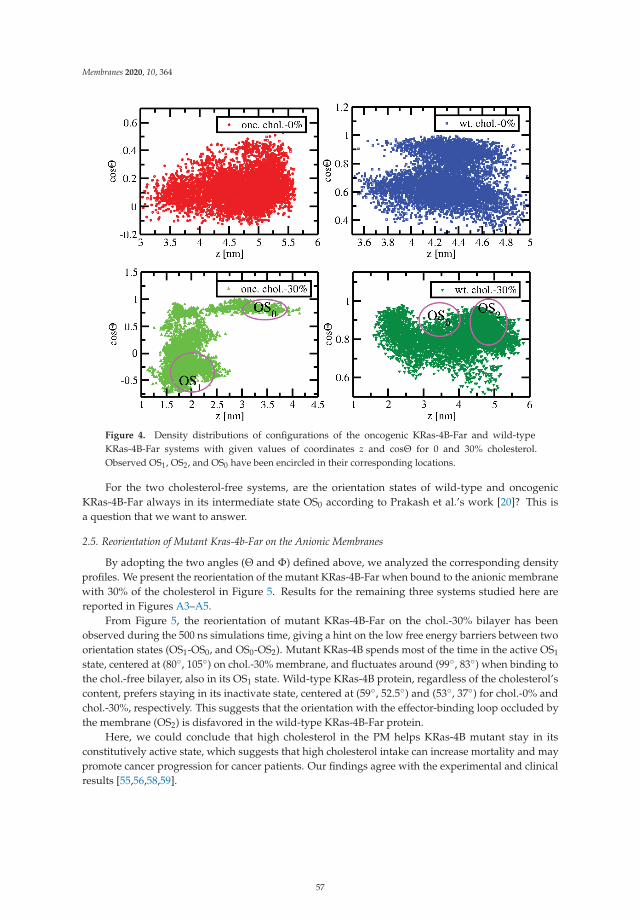
Membranes 2020, 10, 364
Figure 4. Density distributions of configurations of the oncogenic KRas-4B-Far and wild-typeKRas-4B-Far systems with given values of coordinates z and cosΘ for 0 and 30% cholesterol.Observed OS1, OS2, and OS0 have been encircled in their corresponding locations.
For the two cholesterol-free systems, are the orientation states of wild-type and oncogenicKRas-4B-Far always in its intermediate state OS0 according to Prakash et al.’s work [20]? This isa question that we want to answer.
2.5. Reorientation of Mutant Kras-4b-Far on the Anionic Membranes
By adopting the two angles (Θ and Φ) defined above, we analyzed the corresponding densityprofiles. We present the reorientation of the mutant KRas-4B-Far when bound to the anionic membranewith 30% of the cholesterol in Figure 5. Results for the remaining three systems studied here arereported in Figures A3–A5.
From Figure 5, the reorientation of mutant KRas-4B-Far on the chol.-30% bilayer has beenobserved during the 500 ns simulations time, giving a hint on the low free energy barriers between twoorientation states (OS1-OS0, and OS0-OS2). Mutant KRas-4B spends most of the time in the active OS1
state, centered at (80◦, 105◦) on chol.-30% membrane, and fluctuates around (99◦, 83◦) when binding tothe chol.-free bilayer, also in its OS1 state. Wild-type KRas-4B protein, regardless of the cholesterol’scontent, prefers staying in its inactivate state, centered at (59◦, 52.5◦) and (53◦, 37◦) for chol.-0% andchol.-30%, respectively. This suggests that the orientation with the effector-binding loop occluded bythe membrane (OS2) is disfavored in the wild-type KRas-4B-Far protein.
Here, we could conclude that high cholesterol in the PM helps KRas-4B mutant stay in itsconstitutively active state, which suggests that high cholesterol intake can increase mortality and maypromote cancer progression for cancer patients. Our findings agree with the experimental and clinicalresults [55,56,58,59].
57
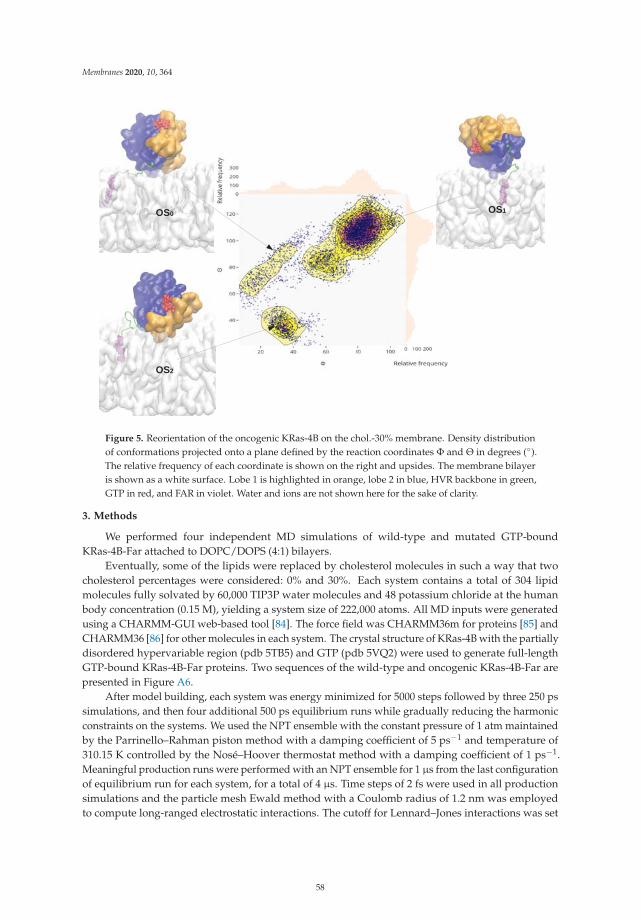
Membranes 2020, 10, 364
Figure 5. Reorientation of the oncogenic KRas-4B on the chol.-30% membrane. Density distributionof conformations projected onto a plane defined by the reaction coordinates Φ and Θ in degrees (◦).The relative frequency of each coordinate is shown on the right and upsides. The membrane bilayeris shown as a white surface. Lobe 1 is highlighted in orange, lobe 2 in blue, HVR backbone in green,GTP in red, and FAR in violet. Water and ions are not shown here for the sake of clarity.
3. Methods
We performed four independent MD simulations of wild-type and mutated GTP-boundKRas-4B-Far attached to DOPC/DOPS (4:1) bilayers.
Eventually, some of the lipids were replaced by cholesterol molecules in such a way that twocholesterol percentages were considered: 0% and 30%. Each system contains a total of 304 lipidmolecules fully solvated by 60,000 TIP3P water molecules and 48 potassium chloride at the humanbody concentration (0.15 M), yielding a system size of 222,000 atoms. All MD inputs were generatedusing a CHARMM-GUI web-based tool [84]. The force field was CHARMM36m for proteins [85] andCHARMM36 [86] for other molecules in each system. The crystal structure of KRas-4B with the partiallydisordered hypervariable region (pdb 5TB5) and GTP (pdb 5VQ2) were used to generate full-lengthGTP-bound KRas-4B-Far proteins. Two sequences of the wild-type and oncogenic KRas-4B-Far arepresented in Figure A6.
After model building, each system was energy minimized for 5000 steps followed by three 250 pssimulations, and then four additional 500 ps equilibrium runs while gradually reducing the harmonicconstraints on the systems. We used the NPT ensemble with the constant pressure of 1 atm maintainedby the Parrinello–Rahman piston method with a damping coefficient of 5 ps−1 and temperature of310.15 K controlled by the Nosé–Hoover thermostat method with a damping coefficient of 1 ps−1.Meaningful production runs were performed with an NPT ensemble for 1 μs from the last configurationof equilibrium run for each system, for a total of 4 μs. Time steps of 2 fs were used in all productionsimulations and the particle mesh Ewald method with a Coulomb radius of 1.2 nm was employedto compute long-ranged electrostatic interactions. The cutoff for Lennard–Jones interactions was set
58

Membranes 2020, 10, 364
to 1.2 nm. In all MD simulations, the GROMACS/2018.3 package was employed [87] and periodicboundary conditions in three directions of space have been taken.
4. Conclusions
In this work, we performed MD simulations on four systems of wild-type/oncogenic KRas-4B-Farprotein binding to membranes with different cholesterol contents (0% and 30%) to study the influenceof cholesterol on the orientation of KRas. KRas-4B-Far shows the condensing effect on the area per lipidof the anionic model membrane through strong interactions between its CD and HVR moieties with thehead groups of the lipids. More flexibility in its CD structure of KRas-4B-Far has been observed whenbinding to the PM with high cholesterol concentration, for both wild-type and mutant KRas-4B-Farproteins. The reorientation of mutant KRas-4B-Far on the anionic chol.-30% model membrane has beenobserved during the 500 ns simulations time, giving a hint on the low free energy barriers betweena pair of orientation states (e.g., OS1-OS0, and OS0-OS2).
It has been shown for the first time that cholesterol makes it much easier for the mutantKRas-4B-Far shifting between different orientation states. The high cholesterol content in the PMfavors OS1, exposing the effector-binding loop for signal transduction in cells from the atomic level.We propose that during the treatment of KRas-4B-related cancers, reducing the cholesterol level in thePM and sustaining cancer progression by controlling the plasma cholesterol intake should be takeninto account in anti-cancer therapies. The present study of the role of cholesterol in Kras-4B orientationcan provide one more direction and method for the treatment and prevention of cancer. By conductingfour μs MD simulations, we confirm that high cholesterol in the PM helps KRas-4B mutant stays in itsconstitutively active state, which suggests that high cholesterol intake can increase mortality and maypromote cancer progression for cancer patients.
Author Contributions: Data curation, H.L., J.M.; formal analysis, H.L., J.M.; funding acquisition, J.M.;investigation, H.L., J.M.; project administration, J.M.; software, H.L., J.M.; supervision, J.M.; writing—originaldraft preparation, H.L., J.M.; writing—review and editing, H.L., J.M. All authors have read and agreed to thepublished version of the manuscript.
Funding: We are thankful for the financial support provided by the Spanish Ministry of Science, Innovation andUniversities (project number PGC2018-099277-B-C21, funds MCIU/AEI/FEDER, UE). Huixia Lu is a Ph.D. fellowfrom the China Scholarship Council (201607040059).
Acknowledgments: We acknowledge the use of computer resources from the “Barcelona SupercomputingCenter-Red Espanola de Supercomputacion” through projects FI-2019-3-0008 and FI-2019-2-0004.
Conflicts of Interest: The authors declare no conflict of interest.
Abbreviations
The following abbreviations are used in this manuscript:
MD molecular dynamicsPM plasma membraneDOPC 1,2-dioleoyl-sn-glycero-3-phosphocholineDOPS 1,2-dioleoyl-sn-glycero-3-phospho-L-serineGDP guanosine diphosphateGTP guanosine triphosphateGEF guanine-nucleotide-exchange factorsGAP GTPase-activating proteinsCOSMIC catalog of somatic mutations in cancerKRas-4B-Far farnesylated and demethylated KRas-4BKRas-4B-FMe farnesylated and methylated KRas-4BHVR hypervariable regionFAR farnesyl groupCD catalytic domain
59

Membranes 2020, 10, 364
PHOS phosphorylated serinePTMs post-translational modificationsOS orientation stateRMSD root mean square deviationPDEδ phosphodiest-eraseδ
FTase farnesyltrasferaseGGTase geranylgeranyltransferaseRCE1 Ras-converting enzyme 1ICMT isoprenylcysteine carboxyl methyltransferasePMPEases prenylated/polyisoprenylated methylated protein methyl esterasesTSPO translocator protein
Appendix A. Supporting Information
Appendix A.1. Area Per Lipid
0 100 200 300 400 500Simulation time [ns]
0.45
0.5
0.55
0.6
0.65
0.7
0.75
A [
nm²]
0.52
0.68
wt. chol.-0%onc. chol.-0%onc. chol.-30%wt. chol.-30%
Figure A1. Area per lipid of four wild-type/mutant KRas-4B-Far systems with different content ofcholesterol as a function of simulation time. The black dashed line indicates the average value for eachsystem of the second half of the total 1000 ns production runs.
60

Membranes 2020, 10, 364
Appendix A.2. Orientation of Kras-4b on the Pm
Figure A2. Time evolution of z during the last 500 ns MD simulations of the onc. and wt. KRas-4B-Farproteins for four cases studied in this work. The ratios of the different regions defined in Ref. [20] ofthe distance are shown on each panel. Three different pools of conformational states are depicted indifferent colors: z ∈ [0, 2.4) in red, z ∈ [2.4, 4.3] in green, and z ∈ (4.3, 6] in blue. Panel (A) refers to onc.chol.-0%, panel (B) refers to the wt. chol.-0% system, panel (C) stands for the onc. chol.-30% system,and panel (D) represents the wt. chol.-30% system, respectively.
Figure A3. Orientation of the mutant KRas-4B-Far on the chol.-0% membrane. Colors defined asFigure 5.
61

Membranes 2020, 10, 364
Figure A4. Orientation of the wild-type KRas-4B-Far on the chol.-0% membrane. Colors defined asFigure 5.
Figure A5. Orientation of the wild-type KRas-4B-Far on the anionic chol.-30% membrane.Colors defined as Figure 5.
Appendix A.3. Sequences of Wild-Type and Mutant Kras-4b-Far Proteins
Here in Figure A6, sequences for wild-type and mutated KRas-4B-Far are presented.
62
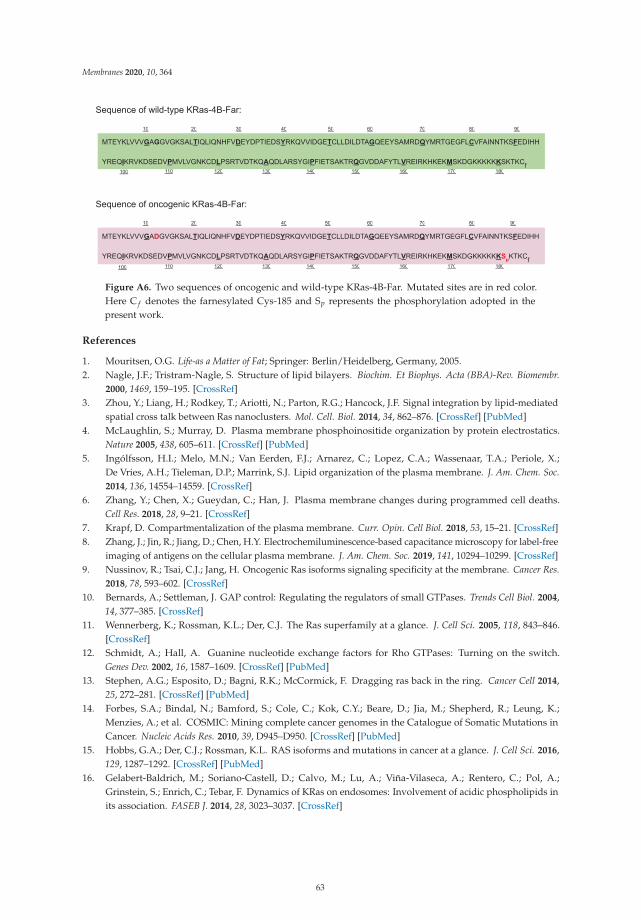
Membranes 2020, 10, 364
Figure A6. Two sequences of oncogenic and wild-type KRas-4B-Far. Mutated sites are in red color.Here C f denotes the farnesylated Cys-185 and Sp represents the phosphorylation adopted in thepresent work.
References
1. Mouritsen, O.G. Life-as a Matter of Fat; Springer: Berlin/Heidelberg, Germany, 2005.2. Nagle, J.F.; Tristram-Nagle, S. Structure of lipid bilayers. Biochim. Et Biophys. Acta (BBA)-Rev. Biomembr.
2000, 1469, 159–195. [CrossRef]3. Zhou, Y.; Liang, H.; Rodkey, T.; Ariotti, N.; Parton, R.G.; Hancock, J.F. Signal integration by lipid-mediated
spatial cross talk between Ras nanoclusters. Mol. Cell. Biol. 2014, 34, 862–876. [CrossRef] [PubMed]4. McLaughlin, S.; Murray, D. Plasma membrane phosphoinositide organization by protein electrostatics.
Nature 2005, 438, 605–611. [CrossRef] [PubMed]5. Ingólfsson, H.I.; Melo, M.N.; Van Eerden, F.J.; Arnarez, C.; Lopez, C.A.; Wassenaar, T.A.; Periole, X.;
De Vries, A.H.; Tieleman, D.P.; Marrink, S.J. Lipid organization of the plasma membrane. J. Am. Chem. Soc.2014, 136, 14554–14559. [CrossRef]
6. Zhang, Y.; Chen, X.; Gueydan, C.; Han, J. Plasma membrane changes during programmed cell deaths.Cell Res. 2018, 28, 9–21. [CrossRef]
7. Krapf, D. Compartmentalization of the plasma membrane. Curr. Opin. Cell Biol. 2018, 53, 15–21. [CrossRef]8. Zhang, J.; Jin, R.; Jiang, D.; Chen, H.Y. Electrochemiluminescence-based capacitance microscopy for label-free
imaging of antigens on the cellular plasma membrane. J. Am. Chem. Soc. 2019, 141, 10294–10299. [CrossRef]9. Nussinov, R.; Tsai, C.J.; Jang, H. Oncogenic Ras isoforms signaling specificity at the membrane. Cancer Res.
2018, 78, 593–602. [CrossRef]10. Bernards, A.; Settleman, J. GAP control: Regulating the regulators of small GTPases. Trends Cell Biol. 2004,
14, 377–385. [CrossRef]11. Wennerberg, K.; Rossman, K.L.; Der, C.J. The Ras superfamily at a glance. J. Cell Sci. 2005, 118, 843–846.
[CrossRef]12. Schmidt, A.; Hall, A. Guanine nucleotide exchange factors for Rho GTPases: Turning on the switch.
Genes Dev. 2002, 16, 1587–1609. [CrossRef] [PubMed]13. Stephen, A.G.; Esposito, D.; Bagni, R.K.; McCormick, F. Dragging ras back in the ring. Cancer Cell 2014,
25, 272–281. [CrossRef] [PubMed]14. Forbes, S.A.; Bindal, N.; Bamford, S.; Cole, C.; Kok, C.Y.; Beare, D.; Jia, M.; Shepherd, R.; Leung, K.;
Menzies, A.; et al. COSMIC: Mining complete cancer genomes in the Catalogue of Somatic Mutations inCancer. Nucleic Acids Res. 2010, 39, D945–D950. [CrossRef] [PubMed]
15. Hobbs, G.A.; Der, C.J.; Rossman, K.L. RAS isoforms and mutations in cancer at a glance. J. Cell Sci. 2016,129, 1287–1292. [CrossRef] [PubMed]
16. Gelabert-Baldrich, M.; Soriano-Castell, D.; Calvo, M.; Lu, A.; Viña-Vilaseca, A.; Rentero, C.; Pol, A.;Grinstein, S.; Enrich, C.; Tebar, F. Dynamics of KRas on endosomes: Involvement of acidic phospholipids inits association. FASEB J. 2014, 28, 3023–3037. [CrossRef]
63

Membranes 2020, 10, 364
17. Cho, K.J.; van der Hoeven, D.; Zhou, Y.; Maekawa, M.; Ma, X.; Chen, W.; Fairn, G.D.; Hancock, J.F.Inhibition of acid sphingomyelinase depletes cellular phosphatidylserine and mislocalizes K-Ras from theplasma membrane. Mol. Cell. Biol. 2016, 36, 363–374. [CrossRef]
18. Gregory, M.C.; McLean, M.A.; Sligar, S.G. Interaction of KRas4b with anionic membranes: A special role forPIP2. Biochem. Biophys. Res. Commun. 2017, 487, 351–355. [CrossRef]
19. Zhou, Y.; Wong, C.O.; Cho, K.J.; Van Der Hoeven, D.; Liang, H.; Thakur, D.P.; Luo, J.; Babic, M.;Zinsmaier, K.E.; Zhu, M.X.; et al. Membrane potential modulates plasma membrane phospholipid dynamicsand K-Ras signaling. Science 2015, 349, 873–876. [CrossRef]
20. Prakash, P.; Litwin, D.; Liang, H.; Sarkar-Banerjee, S.; Dolino, D.; Zhou, Y.; Hancock, J.F.; Jayaraman, V.;Gorfe, A.A. Dynamics of membrane-bound G12V-KRAS from simulations and single-molecule FRET innative nanodiscs. Biophys. J. 2019, 116, 179–183. [CrossRef]
21. Prakash, P.; Zhou, Y.; Liang, H.; Hancock, J.F.; Gorfe, A.A. Oncogenic K-Ras binds to an anionic membranein two distinct orientations: A molecular dynamics analysis. Biophys. J. 2016, 110, 1125–1138. [CrossRef]
22. Prakash, P.; Gorfe, A.A. Probing the conformational and energy landscapes of KRAS membrane orientation.J. Phys. Chem. B 2019, 123, 8644–8652. [CrossRef] [PubMed]
23. Tsai, C.J.; Ma, B.; Sham, Y.Y.; Kumar, S.; Nussinov, R. Structured disorder and conformational selection.Proteins Struct. Funct. Bioinform. 2001, 44, 418–427. [CrossRef] [PubMed]
24. Lu, H.; Martí, J. Long-lasting Salt Bridges Provide the Anchoring Mechanism of Oncogenic Kirsten RatSarcoma Proteins at Cell Membranes. J. Phys. Chem. Lett. 2020, 11, 9938–9945. [CrossRef] [PubMed]
25. Cao, S.; Chung, S.; Kim, S.; Li, Z.; Manor, D.; Buck, M. K-Ras G-domain binding with signaling lipidphosphatidylinositol (4, 5)-phosphate (PIP2): Membrane association, protein orientation, and function.J. Biol. Chem. 2019, 294, 7068–7084. [CrossRef] [PubMed]
26. Yang, M.H.; Laurent, G.; Bause, A.S.; Spang, R.; German, N.; Haigis, M.C.; Haigis, K.M. HDAC6 and SIRT2regulate the acetylation state and oncogenic activity of mutant K-RAS. Mol. Cancer Res. 2013, 11, 1072–1077.[CrossRef]
27. Lu, S.; Jang, H.; Gu, S.; Zhang, J.; Nussinov, R. Drugging Ras GTPase: A comprehensive mechanistic andsignaling structural view. Chem. Soc. Rev. 2016, 45, 4929–4952. [CrossRef]
28. Ahearn, I.M.; Haigis, K.; Bar-Sagi, D.; Philips, M.R. Regulating the regulator: Post-translational modificationof RAS. Nat. Rev. Mol. Cell Biol. 2012, 13, 39–51. [CrossRef]
29. Zhou, B.; Cox, A.D. Posttranslational Modifications of Small G Proteins. In Ras Superfamily Small G Proteins:Biology and Mechanisms 1; Springer: Vienna, Austria, 2014; pp. 99–131.
30. Abdelkarim, H.; Banerjee, A.; Grudzien, P.; Leschinsky, N.; Abushaer, M.; Gaponenko, V. The HypervariableRegion of K-Ras4B Governs Molecular Recognition and Function. Int. J. Mol. Sci. 2019, 20, 5718. [CrossRef]
31. Ahearn, I.; Zhou, M.; Philips, M.R. Posttranslational modifications of RAS proteins. Cold Spring Harb.Perspect. Med. 2018, a031484. [CrossRef]
32. Konstantinopoulos, P.A.; Karamouzis, M.V.; Papavassiliou, A.G. Post-translational modifications andregulation of the RAS superfamily of GTPases as anticancer targets. Nat. Rev. Drug Discov. 2007, 6, 541–555.[CrossRef]
33. Zhang, S.Y.; Sperlich, B.; Li, F.Y.; Al-Ayoubi, S.; Chen, H.X.; Zhao, Y.F.; Li, Y.M.; Weise, K.; Winter, R.;Chen, Y.X. Phosphorylation weakens but does not inhibit membrane binding and clustering of K-Ras4B.ACS Chem. Biol. 2017, 12, 1703–1710. [CrossRef] [PubMed]
34. Alvarez-Moya, B.; Lopez-Alcala, C.; Drosten, M.; Bachs, O.; Agell, N. K-Ras4B phosphorylation at Ser181is inhibited by calmodulin and modulates K-Ras activity and function. Oncogene 2010, 29, 5911–5922.[CrossRef] [PubMed]
35. Bivona, T.G.; Quatela, S.E.; Bodemann, B.O.; Ahearn, I.M.; Soskis, M.J.; Mor, A.; Miura, J.; Wiener, H.H.;Wright, L.; Saba, S.G.; et al. PKC regulates a farnesyl-electrostatic switch on K-Ras that promotes itsassociation with Bcl-XL on mitochondria and induces apoptosis. Mol. Cell 2006, 21, 481–493. [CrossRef][PubMed]
36. Kollár, P.; Rajchard, J.; Balounová, Z.; Pazourek, J. Marine natural products: Bryostatins in preclinical andclinical studies. Pharm. Biol. 2014, 52, 237–242. [CrossRef]
37. Barceló, C.; Paco, N.; Morell, M.; Alvarez-Moya, B.; Bota-Rabassedas, N.; Jaumot, M.; Vilardell, F.; Capella, G.;Agell, N. Phosphorylation at Ser-181 of oncogenic KRAS is required for tumor growth. Cancer Res. 2014,74, 1190–1199. [CrossRef]
64

Membranes 2020, 10, 364
38. Jang, H.; Abraham, S.J.; Chavan, T.S.; Hitchinson, B.; Khavrutskii, L.; Tarasova, N.I.; Nussinov, R.;Gaponenko, V. Mechanisms of membrane binding of small GTPase K-Ras4B farnesylated hypervariableregion. J. Biol. Chem. 2015, 290, 9465–9477. [CrossRef]
39. Alvarez-Moya, B.; Barceló, C.; Tebar, F.; Jaumot, M.; Agell, N. CaM interaction and Ser181 phosphorylationas new K-Ras signaling modulators. Small GTPases 2011, 2, 5911–5922. [CrossRef]
40. Dharmaiah, S.; Bindu, L.; Tran, T.H.; Gillette, W.K.; Frank, P.H.; Ghirlando, R.; Nissley, D.V.; Esposito, D.;McCormick, F.; Stephen, A.G.; et al. Structural basis of recognition of farnesylated and methylated KRAS4bby PDEδ. Proc. Natl. Acad. Sci. USA 2016, 113, E6766–E6775. [CrossRef]
41. Schmick, M.; Vartak, N.; Papke, B.; Kovacevic, M.; Truxius, D.C.; Rossmannek, L.; Bastiaens, P.I.KRas localizes to the plasma membrane by spatial cycles of solubilization, trapping and vesicular transport.Cell 2014, 157, 459–471. [CrossRef]
42. Zimmermann, G.; Papke, B.; Ismail, S.; Vartak, N.; Chandra, A.; Hoffmann, M.; Hahn, S.A.; Triola, G.;Wittinghofer, A.; Bastiaens, P.I.; et al. Small molecule inhibition of the KRAS–PDEδ interaction impairsoncogenic KRAS signalling. Nature 2013, 497, 638–642. [CrossRef]
43. Muratcioglu, S.; Jang, H.; Gursoy, A.; Keskin, O.; Nussinov, R. PDEδ binding to Ras isoforms providesa route to proper membrane localization. J. Phys. Chem. B 2017, 121, 5917–5927. [CrossRef] [PubMed]
44. Murarka, S.; Martín-Gago, P.; Schultz-Fademrecht, C.; Al Saabi, A.; Baumann, M.; Fansa, E.K.; Ismail, S.;Nussbaumer, P.; Wittinghofer, A.; Waldmann, H. Development of pyridazinone chemotypes targeting thePDEδ prenyl binding site. Chem. Eur. J. 2017, 23, 6083–6093. [CrossRef] [PubMed]
45. Ntai, I.; Fornelli, L.; DeHart, C.J.; Hutton, J.E.; Doubleday, P.F.; LeDuc, R.D.; van Nispen, A.J.; Fellers, R.T.;Whiteley, G.; Boja, E.S.; et al. Precise characterization of KRAS4b proteoforms in human colorectal cells andtumors reveals mutation/modification cross-talk. Proc. Natl. Acad. Sci. USA 2018, 115, 4140–4145. [CrossRef][PubMed]
46. McMullen, T.P.; Lewis, R.N.; McElhaney, R.N. Cholesterol–phospholipid interactions, the liquid-orderedphase and lipid rafts in model and biological membranes. Curr. Opin. Colloid Interface Sci. 2004, 8, 459–468.[CrossRef]
47. Levitan, I.; Fang, Y.; Rosenhouse-Dantsker, A.; Romanenko, V. Cholesterol and ion channels. In CholesterolBinding and Cholesterol Transport Proteins; Springer: Dordrecht, The Netherlands, 2010; pp. 509–549.
48. Ding, X.; Zhang, W.; Li, S.; Yang, H. The role of cholesterol metabolism in cancer. Am. J. Cancer Res. 2019,9, 219.
49. Phillips, R. Membranes by the Numbers. In Physics of Biological Membranes; Springer: Cham, Switzerland,2018; pp. 73–105.
50. Liu, S.L.; Sheng, R.; Jung, J.H.; Wang, L.; Stec, E.; O’Connor, M.J.; Song, S.; Bikkavilli, R.K.; Winn, R.A.;Lee, D.; et al. Orthogonal lipid sensors identify transbilayer asymmetry of plasma membrane cholesterol.Nat. Chem. Biol. 2017, 13, 268–274. [CrossRef]
51. Lange, Y.; Swaisgood, M.; Ramos, B.; Steck, T. Plasma membranes contain half the phospholipid and 90% ofthe cholesterol and sphingomyelin in cultured human fibroblasts. J. Biol. Chem. 1989, 264, 3786–3793.
52. Das, A.; Brown, M.S.; Anderson, D.D.; Goldstein, J.L.; Radhakrishnan, A. Three pools of plasma membranecholesterol and their relation to cholesterol homeostasis. Elife 2014, 3, e02882. [CrossRef]
53. Lange, Y.; Slayton, J.M. Interaction of cholesterol and lysophosphatidylcholine in determining red cell shape.J. Lipid Res. 1982, 23, 1121–1127.
54. Lu, H.; Martí, J. Effects of cholesterol on the binding of the precursor neurotransmitter tryptophan tozwitterionic membranes. J. Chem. Phys. 2018, 149, 164906. [CrossRef]
55. Boughter, C.T.; Monje-Galvan, V.; Im, W.; Klauda, J.B. Influence of cholesterol on phospholipid bilayerstructure and dynamics. J. Phys. Chem. B 2016, 120, 11761–11772. [CrossRef] [PubMed]
56. Kim, S.W.; Wiers, C.E.; Tyler, R.; Shokri-Kojori, E.; Jang, Y.J.; Zehra, A.; Freeman, C.; Ramirez, V.; Lindgren, E.;Miller, G.; et al. Influence of alcoholism and cholesterol on TSPO binding in brain: PET [11 C] PBR28 studiesin humans and rodents. Neuropsychopharmacology 2018, 43, 1832–1839. [CrossRef] [PubMed]
57. Miller, K.D.; Siegel, R.L.; Lin, C.C.; Mariotto, A.B.; Kramer, J.L.; Rowland, J.H.; Stein, K.D.; Alteri, R.; Jemal, A.Cancer treatment and survivorship statistics, 2016. CA Cancer J. Clin. 2016, 66, 271–289. [CrossRef] [PubMed]
58. Chen, H.; Qin, S.; Wang, M.; Zhang, T.; Zhang, S. Association between cholesterol intake and pancreaticcancer risk: evidence from a meta-analysis. Sci. Rep. 2015, 5, 8243. [CrossRef] [PubMed]
65

Membranes 2020, 10, 364
59. Huang, B.Z.; Chang, J.I.; Li, E.; Xiang, A.H.; Wu, B.U. Influence of statins and cholesterol on mortality amongpatients with pancreatic cancer. JNCI: J. Natl. Cancer Inst. 2017, 109. [CrossRef]
60. Karplus, M.; Petsko, G. Molecular dynamics simulations in biology. Nature 1990, 347, 631–639. [CrossRef]61. Karplus, M.; McCammon, J. Molecular dynamics simulations of biomolecules. Nat. Struct. Biol. 2002,
9, 646–652. [CrossRef]62. Nagy, G.; Gordillo, M.; Guàrdia, E.; Martí, J. Liquid water confined in carbon nanochannels at high
temperatures. J. Phys. Chem. B 2007, 111, 12524–12530. [CrossRef]63. Poger, D.; Mark, A.E. On the validation of molecular dynamics simulations of saturated and
cis-monounsaturated phosphatidylcholine lipid bilayers: A comparison with experiment. J. Chem.Theory Comput. 2010, 6, 325–336. [CrossRef]
64. Lütgebaucks, C.; Macias-Romero, C.; Roke, S. Characterization of the interface of binary mixed DOPC:DOPS liposomes in water: The impact of charge condensation. J. Chem. Phys. 2017, 146, 044701. [CrossRef]
65. Novakova, E.; Giewekemeyer, K.; Salditt, T. Structure of two-component lipid membranes on solid support:An x-ray reflectivity study. Phys. Rev. E 2006, 74, 051911. [CrossRef] [PubMed]
66. Chaban, V. Computationally efficient prediction of area per lipid. Chem. Phys. Lett. 2014, 616, 25–29.[CrossRef]
67. Petrache, H.I.; Tristram-Nagle, S.; Gawrisch, K.; Harries, D.; Parsegian, V.A.; Nagle, J.F. Structure andfluctuations of charged phosphatidylserine bilayers in the absence of salt. Biophys. J. 2004, 86, 1574–1586.[CrossRef]
68. Lu, H.; Martí, J. Binding and dynamics of melatonin at the interface of phosphatidylcholine-cholesterolmembranes. PLoS ONE 2019, 14, e0224624. [CrossRef]
69. Litz, J.P.; Thakkar, N.; Portet, T.; Keller, S.L. Depletion with cyclodextrin reveals two populations ofcholesterol in model lipid membranes. Biophys. J. 2016, 110, 635–645. [CrossRef]
70. Kufareva, I.; Abagyan, R. Methods of protein structure comparison. In Homology Modeling; Springer:Berlin/Heidelberg, Germany; Humana Press: Totowa, NJ, USA, 2011; pp. 231–257.
71. Abankwa, D.; Gorfe, A.A.; Inder, K.; Hancock, J.F. Ras membrane orientation and nanodomain localizationgenerate isoform diversity. Proc. Natl. Acad. Sci. USA 2010, 107, 1130–1135. [CrossRef]
72. Kapoor, S.; Triola, G.; Vetter, I.R.; Erlkamp, M.; Waldmann, H.; Winter, R. Revealing conformational substatesof lipidated N-Ras protein by pressure modulation. Proc. Natl. Acad. Sci. USA 2012, 109, 460–465. [CrossRef]
73. Mazhab-Jafari, M.T.; Marshall, C.B.; Smith, M.J.; Gasmi-Seabrook, G.M.; Stathopulos, P.B.; Inagaki, F.;Kay, L.E.; Neel, B.G.; Ikura, M. Oncogenic and RASopathy-associated K-RAS mutations relievemembrane-dependent occlusion of the effector-binding site. Proc. Natl. Acad. Sci. USA 2015, 112, 6625–6630.[CrossRef]
74. Yan, S.; Qu, X.; Xu, L.; Che, X.; Ma, Y.; Zhang, L.; Teng, Y.; Zou, H.; Liu, Y. Bufalin enhances TRAIL-inducedapoptosis by redistributing death receptors in lipid rafts in breast cancer cells. Anti-Cancer Drugs 2014,25, 683–689. [CrossRef]
75. Kuzu, O.F.; Noory, M.A.; Robertson, G.P. The role of cholesterol in cancer. Cancer Res. 2016, 76, 2063–2070.[CrossRef]
76. Ravnskov, U.; Rosch, P.J.; McCully, K.S. Statins do not protect against cancer: Quite the opposite.J. Clin. Oncol. 2015, 33, 810–811. [CrossRef] [PubMed]
77. Ravnskov, U.; McCully, K.; Rosch, P. The statin-low cholesterol-cancer conundrum. QJM Int. J. Med. 2012,105, 383–388. [CrossRef] [PubMed]
78. Nielsen, S.F.; Nordestgaard, B.G.; Bojesen, S.E. Statin use and reduced cancer-related mortality. N. Engl.J. Med. 2012, 367, 1792–1802. [CrossRef] [PubMed]
79. Radišauskas, R.; Kuzmickiene, I.; Milinaviciene, E.; Everatt, R. Hypertension, serum lipids and cancer risk:A review of epidemiological evidence. Medicina 2016, 52, 89–98. [CrossRef]
80. Murai, T. Cholesterol lowering: Role in cancer prevention and treatment. Biol. Chem. 2015, 396, 1–11.[CrossRef]
81. Khan, I.; Spencer-Smith, R.; O’Bryan, J.P. Targeting the α4–α5 dimerization interface of K-RAS inhibits tumorformation in vivo. Oncogene 2019, 38, 2984–2993. [CrossRef]
82. Spencer-Smith, R.; Koide, A.; Zhou, Y.; Eguchi, R.R.; Sha, F.; Gajwani, P.; Santana, D.; Gupta, A.;Jacobs, M.; Herrero-Garcia, E.; et al. Inhibition of RAS function through targeting an allosteric regulatory site.Nat. Chem. Biol. 2017, 13, 62–68. [CrossRef]
66
Membranes 2020, 10, 364
83. Ambrogio, C.; Köhler, J.; Zhou, Z.W.; Wang, H.; Paranal, R.; Li, J.; Capelletti, M.; Caffarra, C.; Li, S.;Lv, Q.; et al. KRAS dimerization impacts MEK inhibitor sensitivity and oncogenic activity of mutant KRAS.Cell 2018, 172, 857–868. [CrossRef]
84. Jo, S.; Kim, T.; Iyer, V.G.; Im, W. CHARMM-GUI: A web-based graphical user interface for CHARMM.J. Comput. Chem. 2008, 29, 1859–1865. [CrossRef]
85. Huang, J.; Rauscher, S.; Nawrocki, G.; Ran, T.; Feig, M.; de Groot, B.L.; Grubmüller, H.; MacKerell, A.D.CHARMM36m: An improved force field for folded and intrinsically disordered proteins. Nat. Methods 2017,14, 71–73. [CrossRef]
86. Huang, J.; MacKerell, A.D., Jr. CHARMM36 all-atom additive protein force field: Validation based oncomparison to NMR data. J. Comput. Chem. 2013, 34, 2135–2145. [CrossRef] [PubMed]
87. Lemkul, J. From proteins to perturbed Hamiltonians: A suite of tutorials for the GROMACS-2018 molecularsimulation package [article v1. 0]. Living J. Comput. Mol. Sci. 2018, 1, 5068. [CrossRef]
Publisher’s Note: MDPI stays neutral with regard to jurisdictional claims in published maps and institutionalaffiliations.
© 2020 by the authors. Licensee MDPI, Basel, Switzerland. This article is an open accessarticle distributed under the terms and conditions of the Creative Commons Attribution(CC BY) license (http://creativecommons.org/licenses/by/4.0/).
67

membranes
Article
A Study of the Interaction of a New Benzimidazole Schiff Basewith Synthetic and Simulated Membrane Models of Bacterialand Mammalian Membranes
Alberto Aragón-Muriel 1, Yamil Liscano 2, David Morales-Morales 3, Dorian Polo-Cerón 1,*
and Jose Oñate-Garzón 2,*
Citation: Aragón-Muriel, A.;
Liscano, Y.; Morales-Morales, D.;
Polo-Cerón, D.; Oñate-Garzón, J. A
Study of the Interaction of a New
Benzimidazole Schiff Base with
Synthetic and Simulated Membrane
Models of Bacterial and Mammalian
Membranes. Membranes 2021, 11, 449.
https://doi.org/10.3390/
membranes11060449
Academic Editors: Jordi Marti and
Carles Calero
Received: 2 May 2021
Accepted: 10 June 2021
Published: 16 June 2021
Publisher’s Note: MDPI stays neutral
with regard to jurisdictional claims in
published maps and institutional affil-
iations.
Copyright: © 2021 by the authors.
Licensee MDPI, Basel, Switzerland.
This article is an open access article
distributed under the terms and
conditions of the Creative Commons
Attribution (CC BY) license (https://
creativecommons.org/licenses/by/
4.0/).
1 Laboratorio de Investigación en Catálisis y Procesos (LICAP), Departamento de Química, Facultad deCiencias Naturales y Exactas, Universidad del Valle, Cali 760031, Colombia;[email protected]
2 Grupo de Investigación en Química y Biotecnología (QUIBIO), Facultad de Ciencias Básicas, UniversidadSantiago de Cali, Cali 760035, Colombia; [email protected]
3 Instituto de Química, Universidad Nacional Autónoma de México, Cd. Universitaria, Circuito Exterior,Coyoacán, Mexico D.F. 04510, Mexico; [email protected]
* Correspondence: [email protected] (D.P.-C.); [email protected] (J.O.-G.)
Abstract: Biological membranes are complex dynamic systems composed of a great variety ofcarbohydrates, lipids, and proteins, which together play a pivotal role in the protection of organ-isms and through which the interchange of different substances is regulated in the cell. Given thecomplexity of membranes, models mimicking them provide a convenient way to study and better un-derstand their mechanisms of action and their interactions with biologically active compounds. Thus,in the present study, a new Schiff base (Bz-Im) derivative from 2-(m-aminophenyl)benzimidazoleand 2,4-dihydroxybenzaldehyde was synthesized and characterized by spectroscopic and spectro-metric techniques. Interaction studies of (Bz-Im) with two synthetic membrane models preparedwith 1,2-dimyristoyl-sn-glycero-3-phosphocholine (DMPC) and DMPC/1,2-dimyristoyl-sn-glycero-3-phosphoglycerol (DMPG) 3:1 mixture, imitating eukaryotic and prokaryotic membranes, respectively,were performed by applying differential scanning calorimetry (DSC). Molecular dynamics simu-lations were also developed to better understand their interactions. In vitro and in silico assaysprovided approaches to understand the effect of Bz-Im on these lipid systems. The DSC resultsshowed that, at low compound concentrations, the effects were similar in both membrane models.By increasing the concentration of Bz-Im, the DMPC/DMPG membrane exhibited greater fluidity asa result of the interaction with Bz-Im. On the other hand, molecular dynamics studies carried out onthe erythrocyte membrane model using the phospholipids POPE (1-palmitoyl-2-oleoyl-sn-glycero-3-phosphoethanolamine), SM (N-(15Z-tetracosenoyl)-sphing-4-enine-1-phosphocholine), and POPC(1-palmitoyl-2-oleoyl-sn-glycero-3-phosphocholine) revealed that after 30 ns of interaction, bothhydrophobic interactions and hydrogen bonds were responsible for the affinity of Bz-Im for PE andSM. The interactions of the imine with POPG (1-Palmitoyl-2-Oleoyl-sn-Glycero-3-Phosphoglycerol)in the E. coli membrane model were mainly based on hydrophobic interactions.
Keywords: model membranes; molecular dynamics; calorimetry; Schiff base; imine; benzimidazole;2,4-dihydroxybenzaldehyde
1. Introduction
Biological membranes are essential for life since they regulate the entry and exit ofnutrients, neurotransmitters, and drugs [1]. Biological membranes contain three maintypes of lipids: phospholipids, glycolipids, and cholesterol. Phospholipids are, in turn,divided into different groups according to the structural properties of the polar head:phosphatidylcholine (PC), sphingomyeline (SM), and phosphatidylethanolamine (PE) arecommon lipids present in eukaryotic cell membranes [2].
Membranes 2021, 11, 449. https://doi.org/10.3390/membranes11060449 https://www.mdpi.com/journal/membranes69

Membranes 2021, 11, 449
Since drugs operate through different mechanisms when their main targets are intracel-lular and, therefore, they must penetrate the cell membrane to exert their pharmacologicalaction, it is essential to understand drug–membrane interactions [3]. However, the com-plexity of the structure and functionality of cell membranes, as well as the highly dynamicnature of lipid–lipid and lipid–protein interactions, make drug–membrane system studiesdifficult [4].
Thus, artificial model membrane systems were developed to facilitate the understand-ing of the effects of membrane lipids on drug transport and absorption in cells, drug activity,and even drug toxicity [5,6]. Within the different types of model membranes, liposomesare highly suitable for permeability research and drug delivery systems. Additionally,they allow for the use of various thermoanalytical and spectroscopic techniques—suchas isothermal titration calorimetry (ITC), differential scanning calorimetry (DSC), Fouriertransform infrared spectroscopy (FT-IR), fluorescence spectroscopy, and nuclear magneticresonance (NMR) methods—to study biophysical interactions of the drug–membranecomplex [7–11].
In studies that make use of model membranes, saturated or unsaturated PC speciesare used to mimic eukaryotic cells, while the PC/PG model is used to mimic bacterialmembranes [12]. Studies have revealed that the effect of azole compounds on modelmembranes [13,14], including membranes based on the PC/PG species, is controlled bydrug–membrane interactions which depend on the length, unsaturation, and head groupof the phospholipids, as well as the surface charge of the target cell [15]. In particular,compounds derived from benzimidazole interact with model membranes of human ery-throcytes using the passive diffusion method [16]. In silico studies demonstrated thathydroxyl groups present in derivatives of benzimidazole decrease the hydrophobic charac-ter of DPPC (dipalmitoylphosphatidylcholine) model membranes and interact with thephosphate group of the polar heads present in the membrane [17].
Studies including compounds with the benzimidazole motif on their structures areinteresting for the scientific community, not only because of their known antibacterialand cytotoxic properties [18–20], but because of the high conjugation that they exhibitwhen forming Schiff bases, improving their electronic characteristics and often conferringfluorescent properties that facilitate the monitoring of morphology in microorganismssubjected to these types of drugs [21].
Hence, based on the antibacterial and cytotoxic properties that Schiff bases obtainedfrom (1H-benzimidazol-2-yl)anilines have demonstrated [22–24], this article describes thesynthesis and characterization of 4-(((3-(1H-benzo[d]imidazol-2-yl)phenyl)imino)methyl)benzene-1,3-diol and the study of its possible mechanism of interaction with bacterial andmammalian membrane models by analyzing the thermodynamic profiles of the phasetransition by DSC. In addition, in order to explore the Bz-Im effect on the thermotropicbehavior of bacterial and mammalian systems, proper membrane models consistent withexperimental membrane models were developed. Thus, the interaction of the iminetowards model membranes of human erythrocytes and E. coli were described from resultsby molecular dynamics (MD) simulations.
2. Materials and Methods
2.1. Synthesis of Benzimidazole Schiff Base2.1.1. Materials
All chemical reagents used for the synthesis of benzimidazole and subsequent iminewere used as received and without further purification. Elemental analyses were performedusing Flash EA 1112 Series CHN Analyzer. A Shimadzu Affinity 1 FT-IR spectrometer wasused to obtain the infrared spectra. IR data are reported using the following abbreviations:vs = very strong; s = strong; m = medium; w = weak; sh = shoulder; br = broad. 1H and13C{1H} NMR spectra were obtained on a Bruker Avance II 400 spectrometer using DMSO-d6 as a solvent at 25 ◦C. The following abbreviations were used: s = singlet; d = doublet;t = triplet; m = multiplet. The mass spectrum of the benzimidazole was recorded on a
70

Membranes 2021, 11, 449
Shimadzu-GCMS-QP2010 at 70 eV by electronic impact (EI) ionization, while the mass spec-trum of the derived imine was obtained by direct analysis in real time (DART) ionizationsystem on a JEOL AccuTOF JMS-T100LC.
2.1.2. Synthesis of 2-(m-aminophenyl)benzimidazole (Bz)
The condensation reaction of o-phenylenediamine with m-aminobenzoic acid was carriedout following a similar methodology to that previously reported [25]. o-phenylenediamine(0.54 g, 5 mmol), m-aminobenzoic acid (0.69 g, 5 mmol), and polyphosphoric acid weremixed and stirred for 2.5 h at 180 ◦C. After this time, the resulting reaction mixture wasallowed to cool and then neutralized with sodium carbonate (20%) before the resultingsolution was filtered. The violet precipitate was then washed with distilled water, purifiedwith activated carbon, and recrystallized in ethanol to give the final product as a beigepowder. Yield: 0.87 g, 83%. C13H11N3 (209.25 g·mol−1): Calc. C, 74.62; H, 5.30; N, 20.08.Found: C, 74.58; H, 5.36; N, 20.09%. IR (ATR cm−1): 3826 w, 3739 w, 3425 w, 3321 w, 3205 w,2328 w, 1683 w, 1616 vs. 1566 s, 1510 s, 1463 s, 1394 m, 1346 m, 1234 m, 1062 m, 945 w,893 m, 835 w, 750 vs. 1H NMR (DMSO-d6) δ (ppm) 12.70 (s, 1H), 7.62 (d, J = 7.0 Hz, 1H),7.49 (d, J = 7.0 Hz, 1H), 7.43 (s, 1H), 7.28 (d, J = 7.5 Hz, 1H), 7.23–7.11 (m, 3H), 6.68 (d,J = 7.8 Hz, 1H), 5.30 (s, 2H). MS (EI, m/z): 209.
2.1.3. Synthesis of 4-(((3-(1H-benzo[d]imidazol-2-yl)phenyl)imino)methyl)benzene-1,3-diol(Bz-Im)
As was the case for the intermediate Bz, the imine Bz-Im was synthesized basedon previously reported procedures [26,27]. 2-(m-aminophenyl)benzimidazole (0.52 g,2.5 mmol), 2,4-dihydroxybenzaldehyde (0.35 g, 2.5 mmol), and methanol were mixedand set to reflux under stirring for 2 h. After this time, the yellow precipitate obtainedwas washed with cold water and then dried under vacuum for 4 h. Yield: 0.72 g, 87%.C20H15N3O2 (329.36 g·mol−1): Calc. C, 72.94; H, 4.59; N, 12.76. Found: C, 72.83; H, 4.56; N,12.91%. IR (ATR cm−1): 3381 w, 3046 w, 1891 w, 1600 s, 1567 sh, 1512 w, 1494 vs. 1451 m,1384 s, 1268 sh, 1259 s, 1222 m, 1143 s, 1114 m, 963 w, 910 m, 856 s, 807 vs. 725 vs. 1H NMR(DMSO-d6) δ (ppm) 13.46 (s, 1H), 12.98 (s, 1H), 10.34 (s, 1H), 8.94 (s, 1H), 8.22–8.01 (m, 2H),7.70–7.45 (m, 5H), 7.24 (s, 2H), 6.45 (dd, J = 8.4, 2.3 Hz, 1H), 6.35 (d, J = 2.3 Hz, 1H). 13C{1H}NMR (DMSO-d6) δ (ppm) 163.7, 163.5, 163.2, 151.3, 149.3, 144.2, 135.5, 135.1, 131.83, 130.6,124.6, 123.2, 122.8, 122.3, 119.6, 119.4, 112.6, 111.9, 108.5, 102.9. MS (DART+) m/z: 330.
2.2. Interaction with Models of Synthetic Membranes2.2.1. Membrane Preparation
Model membranes mimicking mammalian and bacterial membranes were preparedfollowing the methodology reported previously [28]. Thus, DMPC and DMPG lipids ata molar ratio of 3:1 were dissolved in chloroform/methanol (2:1 v/v) to imitate gram-negative bacterial membranes [2], while the DMPC lipid alone was dissolved in chloro-form/methanol (2:1 v/v) to imitate zwitterionic human cell membranes. The lipid mixturewas first dried under a stream of nitrogen and then under vacuum for a further three hours.The hydration process was performed by preparing different concentrations of Bz-Im usingHEPES buffer (25 mM HEPES, pH 7.0; 100 mM NaCl and 0.2 mM EDTA), which wereadded to the existing dry lipid mixture and vigorously shaken with a vortex for 2 minbefore incubation for 10 min at 37 ◦C above the phase transition temperature (Tm). Themultilamellar vesicles (MLVs) were obtained after repeating the shaking and incubationprocess three times [29].
2.2.2. Differential Scanning Calorimetry
For the acquisition of thermograms by DSC analysis, a TA instrument DSC Q25 wasused. Multillamellar vesicles (MLVs) were prepared using 2 mg of lipids hydrated withBz-Im diluted in HEPES buffer to give three Bz-Im–lipid ratios: 1:50, 1:25, and 1:10. HEPESbuffer was used as a reference solution. The samples were placed and subsequently sealed
71
Membranes 2021, 11, 449
within standard aluminum DSC pans, and were analyzed over a range of 10 to 35 ◦Cat a heating rate of 1 ◦C/min. Trios software (TA Instruments) was used to obtain thephase transition temperature (Tm), the transition enthalpy (ΔH), and the full width athalf-maximum from thermograms (FWHM, ΔTm/2).
2.3. Molecular Dynamics (MD) Studies2.3.1. Construction of the 3D Structure of Bz-Im
The 3D structure of Bz-Im was drawn using Chemdraw software (https://chemdrawdirect.perkinelmer.cloud/js/sample/index.html, access date: 8 March 2021). The Bz-Im structurewas optimized using the universal force field (UFF) [30] and the steepest descent algorithmwith Avogadro version 1.2 software.
2.3.2. Erythrocyte Membrane Construction
The zwitterionic model membrane of erythrocyte cells, which was mimicked byzwitterionic phosphatidylcholine for DSC assays, was built with the CHARMM-GUI [31]platform using, as a basis, the phospholipid composition mentioned by Texeira et al. [32].The phospholipid proportions used were 20 units of POPE, 40 units of SM, and 40 unitsof POPC, which were distributed both in the upper and lower layer of the membrane.For the placement of the ions, the Monte Carlo method was used with a concentrationof 0.15 M NaCl. In addition, a water thickness of 22.5 Å, and a force field for the entireCHARMM36m system was used [33]. The files were prepared to minimize energy, balance,and dynamics with GROMACS [34] at 310 K.
2.3.3. Construction of Gram-Negative Bacterial Membrane Models
The membrane model systems for E. coli were constructed based on the data reportedby Epand et al. [35], using the same distribution published by Liscano et al. [36] for agram-negative membrane model system (POPE = 80 units and POPG = 20 units), withCHARMM-GUI software [31].
2.3.4. Implementing Molecular Dynamics
The minimization energy of the erythrocyte model membrane and E. coli membranesystem with the ligand Bz-Im was adjusted with the steepest descent algorithm in 5000 stepsusing the Verlet cutoff scheme. Equilibration was performed for 2 ns using the Berendsenalgorithm to equilibrate the temperature and pressure of the system. Molecular dynamicswere run for 10 ns at 310 K using the Nose–Hoover and Parrinello–Rahman algorithms toadjust temperature and pressure.
Gromacs software version 2020.1 [34] was used for the molecular dynamics simulationof gram-negative bacterial and erythrocyte membrane models. The CHARMM36m forcefield [33] was used for the simulation. For the localization of the ions, the Monte Carlomethod was used with 0.15 M NaCl in water 22.5 Å thick. For the energy minimization,the steepest descent algorithm was used, running for 1 ns. Using the Berendsen algorithm,the system was adjusted to a temperature of 310 K with an equilibration of 2 fs/step for300 ps to 155,000 n-steps. Once the system was equilibrated the molecular dynamics wererun for 30 ns for both erythrocyte and E. coli model membranes, using the Nose–Hooverand Parrinello–Rahman algorithms to adjust the temperature and pressure.
2.3.5. Interaction Analysis
Gromacs was used to obtain the hydrogen bonds between Bz-Im and the phospholipidsof each membrane model system within 30 ns. PyMOL PDB files were obtained for eachmembrane system at six different times: 1, 5, 10, 20, 25, and 30 ns. These files were used tovisualize and analyze the interactions between the different components of each modelsystem and the Bz-Im using Discovery Studio Visualizer software.
72

Membranes 2021, 11, 449
3. Results and Discussion
3.1. Schiff Base (Imine) Characterization
The synthesis of Schiff base 4-(((3-(1H-benzo[d]imidazol-2-yl)phenyl)imino)methyl)benzene-1,3-diol (Bz-Im) was carried out from the reaction between 2,4-dihydroxybenzaldehydeand 2-(m-aminophenyl)benzimidazole (Bz) (Scheme 1).
Bz Bz-Im Scheme 1. Synthesis of Bz-Im.
Compound Bz-Im was obtained in high yield (87%) as a yellow powder, and itsstructure was unequivocally determined by mass spectrometry, elemental analyses (C,H, and N), infrared spectroscopy, and nuclear magnetic resonance spectroscopy. The FT-IR spectra of Bz-Im showed bands corresponding to υ (3425 and 3321 cm−1) stretchingand deformation δ (1616 cm−1) vibrations of the amino group in Bz disappeared afterthe formation of the imine, while a new band was observed at 1600 cm−1, characteristicfor this type of compound, confirming the formation of the N=CH bond [37]. In theinfrared spectrum, the characteristic band of the stretching vibration υC-O at 1259 cm−1
was also observed (phenolic fragment). In addition, the 1H NMR spectrum of Bz-Imshowed the characteristic signal of the imine group at 8.94 ppm, while signals due to thearomatic protons were observed around 8.25–6.25 ppm [22,27]. Additionally, the 13C{1H}NMR spectra exhibited a typical signal due to the imine carbon at ~163 ppm. This one-dimensional NMR analysis was further supported with two-dimensional studies that canbe consulted in Figures S4, S6, and S7 of the supplementary material. Finally, analysis bymass spectrometry (DART+) afforded a spectrum exhibiting the peak due to the molecularion [M+1] at 330 m/z (Figure S9). Elemental analysis results were also in agreement withthe proposed structure.
3.2. Model Membrane Studies3.2.1. Thermotropic Behavior of Synthetic Model Membranes
The membrane models included mammalian-like membranes consisting of the phos-pholipid DMPC and bacterial-like membranes consisting of a 3:1 ratio of DMPC:DMPG. Bygradually heating the vesicles without compound, the acquisition of thermotropic profileswas achieved (Figure 1), where a pre-transition endothermic peak was observed at 12.94 ◦Cfor the DMPC systems and at 12.71 ◦C for the DMPC: DMPG 3:1 mixture. PCs have a fairlybulky headgroup, creating a size mismatch with their acyl chains, especially below themain phase transition [38]. As the temperature increases, the main transition peak emergesat 23.02 ◦C for the two systems mentioned above—these results being consistent with thosereported previously [28].
73
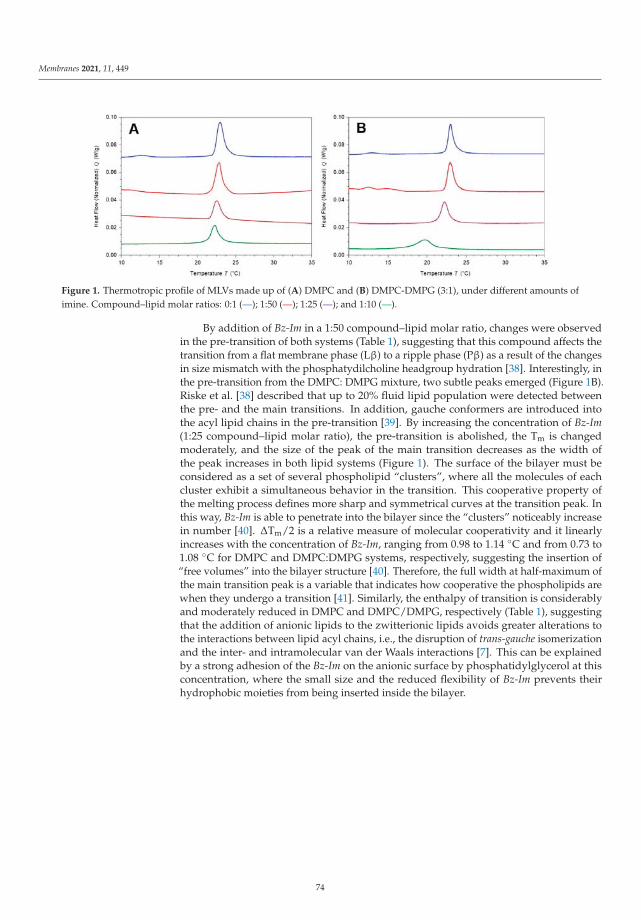
Membranes 2021, 11, 449
Figure 1. Thermotropic profile of MLVs made up of (A) DMPC and (B) DMPC-DMPG (3:1), under different amounts ofimine. Compound–lipid molar ratios: 0:1 (—); 1:50 (—); 1:25 (—); and 1:10 (—).
By addition of Bz-Im in a 1:50 compound–lipid molar ratio, changes were observedin the pre-transition of both systems (Table 1), suggesting that this compound affects thetransition from a flat membrane phase (Lβ) to a ripple phase (Pβ) as a result of the changesin size mismatch with the phosphatydilcholine headgroup hydration [38]. Interestingly, inthe pre-transition from the DMPC: DMPG mixture, two subtle peaks emerged (Figure 1B).Riske et al. [38] described that up to 20% fluid lipid population were detected betweenthe pre- and the main transitions. In addition, gauche conformers are introduced intothe acyl lipid chains in the pre-transition [39]. By increasing the concentration of Bz-Im(1:25 compound–lipid molar ratio), the pre-transition is abolished, the Tm is changedmoderately, and the size of the peak of the main transition decreases as the width ofthe peak increases in both lipid systems (Figure 1). The surface of the bilayer must beconsidered as a set of several phospholipid “clusters”, where all the molecules of eachcluster exhibit a simultaneous behavior in the transition. This cooperative property ofthe melting process defines more sharp and symmetrical curves at the transition peak. Inthis way, Bz-Im is able to penetrate into the bilayer since the “clusters” noticeably increasein number [40]. ΔTm/2 is a relative measure of molecular cooperativity and it linearlyincreases with the concentration of Bz-Im, ranging from 0.98 to 1.14 ◦C and from 0.73 to1.08 ◦C for DMPC and DMPC:DMPG systems, respectively, suggesting the insertion of“free volumes” into the bilayer structure [40]. Therefore, the full width at half-maximum ofthe main transition peak is a variable that indicates how cooperative the phospholipids arewhen they undergo a transition [41]. Similarly, the enthalpy of transition is considerablyand moderately reduced in DMPC and DMPC/DMPG, respectively (Table 1), suggestingthat the addition of anionic lipids to the zwitterionic lipids avoids greater alterations tothe interactions between lipid acyl chains, i.e., the disruption of trans-gauche isomerizationand the inter- and intramolecular van der Waals interactions [7]. This can be explainedby a strong adhesion of the Bz-Im on the anionic surface by phosphatidylglycerol at thisconcentration, where the small size and the reduced flexibility of Bz-Im prevents theirhydrophobic moieties from being inserted inside the bilayer.
74

Membranes 2021, 11, 449
Table 1. Tm, ΔTm/2, and enthalpy transition (ΔH) values of MLVs constituted by DMPC and DMPC/DMPG (3:1) beforeand after the addition of Bz-Im at different Bz-Im–lipid molar ratios.
MLVCompound–Lipid
Molar RatioPretransition
Temperature (◦C)Tm (◦C) ΔTm/2 (◦C) ΔH (J·g−1)
DMPC 0:1 12.94 23.02 0.98 1.48
DMPC-Compound1:50 11.58 22.94 1.09 1.051:25 - 22.60 1.14 0.781:10 - 22.38 1.23 0.76
DMPC/DMPG (3:1) 0:1 12.71 23.02 0.73 1.71
DMPC/DMPG(3:1)-Compound
1:50 12.49 22.98 0.90 1.461:25 - 22.24 1.08 1.381:10 - 19.72 2.34 1.13
At the maximum concentration of Bz-Im, the size of the peaks representing the maintransition were decreased. Interestingly, a pronounced change in Tm and in the width ofthe peak was observed only in the DMPC/DMPG mixture (Figure 1), suggesting that Bz-Imat this concentration increases the fluidity and the lateral phase separation in membranesthat mimic those of bacteria. In fact, fluidity is known to increase in response to an increasein the lateral diffusion rates of lipid molecules [42], and has been related to alterationswithin the hydrophobic nucleus of the bilayer [43]. Thus, it is likely that more moles ofBz-Im bind to a smaller unit area in DMPC/DMPG than to an entire surface area of DMPC,reaching a lower threshold concentration due to the presence of DMPG, which is related tothe degree of insertion of compounds inside the bilayer [44].
3.2.2. Analysis of Molecular Dynamics
In order to understand the results of the thermotropic profile of the membrane mod-els, the interaction between Bz-Im and the molecular models of erythrocyte zwitterionicmembranes was analyzed by molecular dynamics. Figure 2 shows the root mean squaredeviation (RMSD) of Bz-Im in the erythrocyte membrane over 30 ns. From 0 to 10 ns acontinuous variation of the RMSD is observed (Figure 2A), suggesting the whole structurefluctuates, or it might reflect only large displacements of a small structural subset within anoverall rigid structure [45] as a result of the loss of bonds between phospholipids and theformation of Bz-Im-membrane interactions during the insertion and adjustment of the com-pound inside the polar head of the phospholipids in these first nanoseconds (Figure 2B). Astabilization of the structural configuration of Bz-Im is observed from 10 ns that coincideswith the penetration of Bz-Im inside the polar region of the membrane, indicating that itdoes not bring any considerable changes to the overall conformation of the system over30 ns MD trajectories.
75
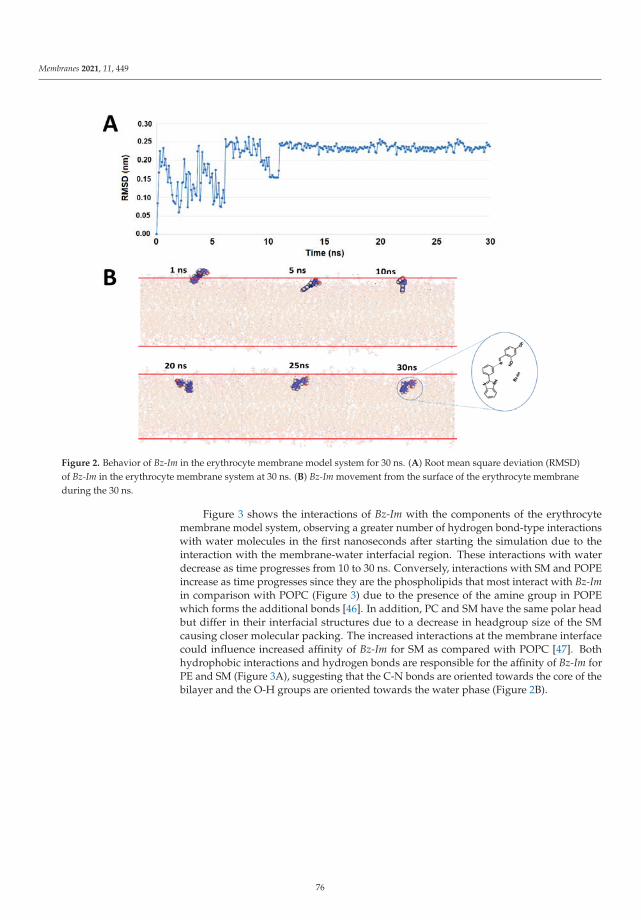
Membranes 2021, 11, 449
Figure 2. Behavior of Bz-Im in the erythrocyte membrane model system for 30 ns. (A) Root mean square deviation (RMSD)of Bz-Im in the erythrocyte membrane system at 30 ns. (B) Bz-Im movement from the surface of the erythrocyte membraneduring the 30 ns.
Figure 3 shows the interactions of Bz-Im with the components of the erythrocytemembrane model system, observing a greater number of hydrogen bond-type interactionswith water molecules in the first nanoseconds after starting the simulation due to theinteraction with the membrane-water interfacial region. These interactions with waterdecrease as time progresses from 10 to 30 ns. Conversely, interactions with SM and POPEincrease as time progresses since they are the phospholipids that most interact with Bz-Imin comparison with POPC (Figure 3) due to the presence of the amine group in POPEwhich forms the additional bonds [46]. In addition, PC and SM have the same polar headbut differ in their interfacial structures due to a decrease in headgroup size of the SMcausing closer molecular packing. The increased interactions at the membrane interfacecould influence increased affinity of Bz-Im for SM as compared with POPC [47]. Bothhydrophobic interactions and hydrogen bonds are responsible for the affinity of Bz-Im forPE and SM (Figure 3A), suggesting that the C-N bonds are oriented towards the core of thebilayer and the O-H groups are oriented towards the water phase (Figure 2B).
76
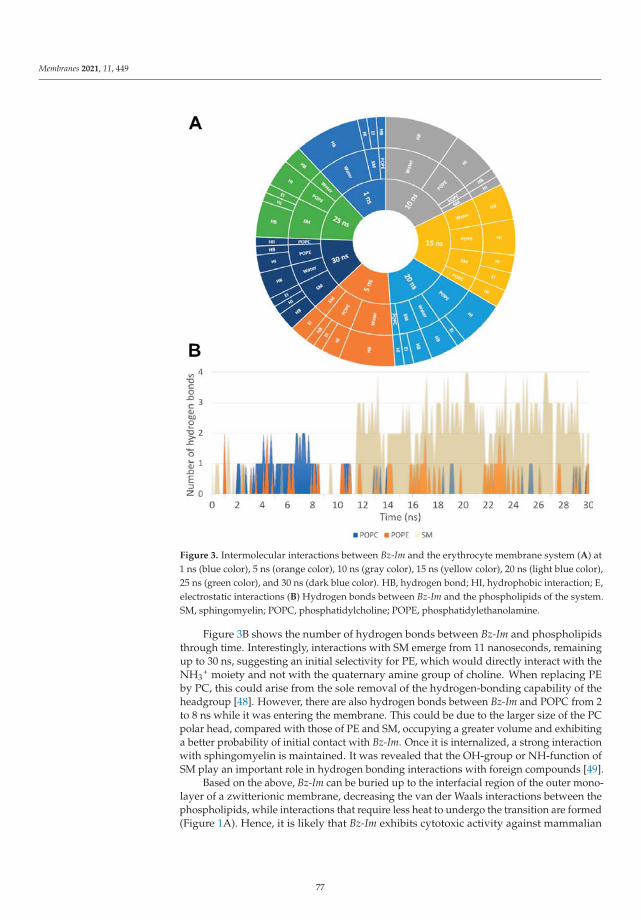
Membranes 2021, 11, 449
Figure 3. Intermolecular interactions between Bz-Im and the erythrocyte membrane system (A) at1 ns (blue color), 5 ns (orange color), 10 ns (gray color), 15 ns (yellow color), 20 ns (light blue color),25 ns (green color), and 30 ns (dark blue color). HB, hydrogen bond; HI, hydrophobic interaction; E,electrostatic interactions (B) Hydrogen bonds between Bz-Im and the phospholipids of the system.SM, sphingomyelin; POPC, phosphatidylcholine; POPE, phosphatidylethanolamine.
Figure 3B shows the number of hydrogen bonds between Bz-Im and phospholipidsthrough time. Interestingly, interactions with SM emerge from 11 nanoseconds, remainingup to 30 ns, suggesting an initial selectivity for PE, which would directly interact with theNH3
+ moiety and not with the quaternary amine group of choline. When replacing PEby PC, this could arise from the sole removal of the hydrogen-bonding capability of theheadgroup [48]. However, there are also hydrogen bonds between Bz-Im and POPC from 2to 8 ns while it was entering the membrane. This could be due to the larger size of the PCpolar head, compared with those of PE and SM, occupying a greater volume and exhibitinga better probability of initial contact with Bz-Im. Once it is internalized, a strong interactionwith sphingomyelin is maintained. It was revealed that the OH-group or NH-function ofSM play an important role in hydrogen bonding interactions with foreign compounds [49].
Based on the above, Bz-Im can be buried up to the interfacial region of the outer mono-layer of a zwitterionic membrane, decreasing the van der Waals interactions between thephospholipids, while interactions that require less heat to undergo the transition are formed(Figure 1A). Hence, it is likely that Bz-Im exhibits cytotoxic activity against mammalian
77
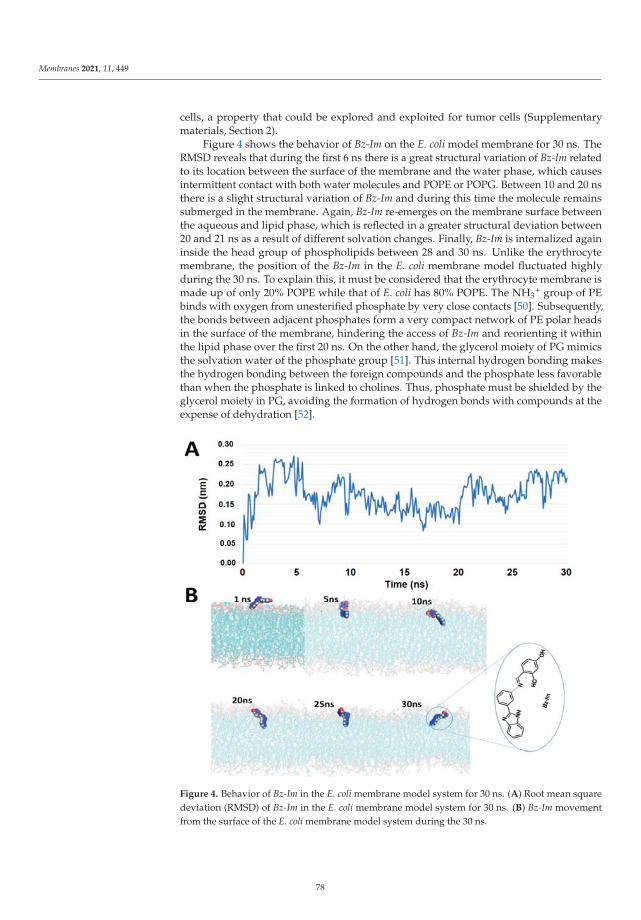
Membranes 2021, 11, 449
cells, a property that could be explored and exploited for tumor cells (Supplementarymaterials, Section 2).
Figure 4 shows the behavior of Bz-Im on the E. coli model membrane for 30 ns. TheRMSD reveals that during the first 6 ns there is a great structural variation of Bz-Im relatedto its location between the surface of the membrane and the water phase, which causesintermittent contact with both water molecules and POPE or POPG. Between 10 and 20 nsthere is a slight structural variation of Bz-Im and during this time the molecule remainssubmerged in the membrane. Again, Bz-Im re-emerges on the membrane surface betweenthe aqueous and lipid phase, which is reflected in a greater structural deviation between20 and 21 ns as a result of different solvation changes. Finally, Bz-Im is internalized againinside the head group of phospholipids between 28 and 30 ns. Unlike the erythrocytemembrane, the position of the Bz-Im in the E. coli membrane model fluctuated highlyduring the 30 ns. To explain this, it must be considered that the erythrocyte membrane ismade up of only 20% POPE while that of E. coli has 80% POPE. The NH3
+ group of PEbinds with oxygen from unesterified phosphate by very close contacts [50]. Subsequently,the bonds between adjacent phosphates form a very compact network of PE polar headsin the surface of the membrane, hindering the access of Bz-Im and reorienting it withinthe lipid phase over the first 20 ns. On the other hand, the glycerol moiety of PG mimicsthe solvation water of the phosphate group [51]. This internal hydrogen bonding makesthe hydrogen bonding between the foreign compounds and the phosphate less favorablethan when the phosphate is linked to cholines. Thus, phosphate must be shielded by theglycerol moiety in PG, avoiding the formation of hydrogen bonds with compounds at theexpense of dehydration [52].
Figure 4. Behavior of Bz-Im in the E. coli membrane model system for 30 ns. (A) Root mean squaredeviation (RMSD) of Bz-Im in the E. coli membrane model system for 30 ns. (B) Bz-Im movementfrom the surface of the E. coli membrane model system during the 30 ns.
78

Membranes 2021, 11, 449
Figure 5A shows a greater interaction with water molecules through hydrogen bondsin the first 15 nanoseconds. From 10 ns there is a tendency to form hydrophobic bondswith both phospholipids; this type of interaction is maintained until 30 ns, suggestingthat Bz-Im must penetrate at least partially into the hydrophobic core of the phospholipidbilayer. As the system is highly dynamic, it is probable that the hydrophobic moiety of thearomatic heterocyclic ring interacts with the acyl chains in a region close to the interface(Figure 4B). The partial insertion into the hydrophobic core would be responsible for theincrease in the fluidity described in bacterial model membranes at a 1:10 Bz-Im:lipid molarratio (Figure 1B), since interaction of compounds with the phospholipid acyl chains hasbeen related to a net fluidizing effect of the apolar part of the bilayer [43]. Finally, Figure 5Bshows the number of hydrogen bonds formed between Bz-Im and the phospholipids ofthe E. coli model membrane; a similar interaction with POPE and POPG was observed,except for at 10 and 22 ns when interaction peaks with POPE of up to six hydrogen bondswere found. The amine group of PE which forms additional bonds [46] would be favorablyoriented towards the polar groups of Bz-Im at both times.
Figure 5. Intermolecular interactions between Bz-Im and the E. coli membrane model (A) at 1 ns(blue color), 5 ns (orange color), 10 ns (gray color), 15 ns (yellow color), 20 ns (light blue color), 25 ns(green color), and 30 ns (dark blue color). HB, hydrogen bond; HI, hydrophobic interaction; EI,electrostatic interactions. (B) Hydrogen bonds between Bz-Im and the phospholipids of the system.POPE, phosphatidylethanolamine; POPG, phosphatidylglycerol.
79
Membranes 2021, 11, 449
4. Conclusions
A benzimidazole-derived imine was successfully synthesized and characterized byspectroscopic and spectrometric techniques. The thermotropic profiles indicate that thiscompound can bind both to DMPC and DMPC:DMPG (3:1), which mimic the mammalianand bacterial membranes, respectively. Our results suggest that Bz-Im can increase thefluidity in membranes that mimic those of bacteria, which might be correlated with theirpotential antibacterial activity, representing a valuable contribution towards the furtherdesign of antimicrobial compounds based on benzimidazole-derived imine analogues.Preliminary evidence shows that compound Bz-Im has affinity for PC phospholipids,suggesting that this molecule may have effects against normal human cells, that is, theBz-Im compound could be cytotoxic toward these cells. At 30 ns of simulation, hydrogenbonding interactions between Bz-Im and SM prevail in erythrocyte membrane models,while in E. coli membrane models the hydrophobic interactions between Bz-Im and PG/PEplay an important role on the fluidizing effect exhibited in bacterial membrane models.Although 30 ns is a relatively short simulation time, it is sufficient to understand thebehavior of the system since a trend is clearly defined from 10 ns. Finally, this studyserves as a prototype for better understanding of the interactions between these kindsof molecules and biological membranes, as well as opening prospects for future work inthis area.
Supplementary Materials: The following are available online at https://www.mdpi.com/article/10.3390/membranes11060449/s1. Section 1: Spectral data. Figure S1: Comparative FT-IR spectra ofBz and Bz-Im. Figure S2: NMR-1H spectra of Bz. Figure S3: NMR-1H spectra of Bz-Im. Figure S4:NMR-COSY spectra of Bz-Im. Figure S5: NMR-13C{1H} spectra of Bz-Im. Figure S6: NMR-HSQCspectra of Bz-Im. Figure S7: NMR-HMBC spectra of Bz-Im. Figure S8: Mass spectra (EI) of Bz.Figure S9: Mass spectra (DART+) of Bz-Im [M+1]; Section 2: Figure S10: Root-mean-square deviation(RMSD) of Bz-Im in the system. Figure S11: Hydrogen bonds between Bz-Im and the phospholipidsof the system.
Author Contributions: Conceptualization, A.A.-M. and Y.L.; methodology, A.A.-M., Y.L., and J.O.-G.;software, Y.L.; validation, J.O.-G. and D.P.-C.; formal analysis, A.A.-M., D.M.-M., Y.L., and J.O.-G.;investigation, A.A.-M. and Y.L.; resources, J.O.-G. and D.P.-C.; data curation, A.A.-M. and Y.L.;writing—original draft preparation, A.A.-M.; writing—review and editing, D.M.-M., J.O.-G., andD.P.-C.; visualization, A.A.-M., Y.L., and J.O.-G.; supervision, D.P.-C.; project administration, D.P.-C.;funding acquisition, D.M.-M., J.O.-G., and D.P.-C. All authors have read and agreed to the publishedversion of the manuscript.
Funding: This research was funded by the Universidad del Valle, by Dirección General de Investi-gaciones of Universidad Santiago de Cali under call No. 01-2021 and grant number DGI-COCEINNo 512-621120-1529, and the “Doctorados Nacionales Colciencias Convocatoria 727–2015” program.D.M.-M. would like to thank PAPIIT-DGAPA-UNAM (PAPIIT IN210520) and CONACYT A1-S-33933for their generous financial support.
Institutional Review Board Statement: Not applicable.
Conflicts of Interest: The authors declare no conflict of interest.
References
1. Xu, Y.; Tillman, T.S.; Tang, P. Membranes and Drug Action, 1st ed.; Elsevier Inc.: Amsterdam, The Netherlands, 2009; ISBN9780123695215.
2. Van Meer, G.; Voelker, D.R.; Feigenson, G.W. Membrane lipids: Where they are and how they behave. Nat. Rev. Mol. Cell Biol.2008, 9, 112–124. [CrossRef] [PubMed]
3. Schubert, T.; Römer, W. How synthetic membrane systems contribute to the understanding of lipid-driven endocytosis. Biochim.Biophys. Acta Mol. Cell Res. 2015, 1853, 2992–3005. [CrossRef] [PubMed]
4. Peetla, C.; Stine, A.; Labhasetwar, V. Biophysical interactions with model lipid membranes: Applications in drug discovery anddrug delivery. Mol. Pharm. 2009, 6, 1264–1276. [CrossRef]
5. Essaid, D.; Rosilio, V.; Daghildjian, K.; Solgadi, A.; Vergnaud, J.; Kasselouri, A.; Chaminade, P. Artificial plasma membranemodels based on lipidomic profiling. Biochim. Biophys. Acta Biomembr. 2016, 1858, 2725–2736. [CrossRef] [PubMed]
80
Membranes 2021, 11, 449
6. Knobloch, J.; Suhendro, D.K.; Zieleniecki, J.L.; Shapter, J.G.; Köper, I. Membrane-drug interactions studied using model membranesystems. Saudi J. Biol. Sci. 2015, 22, 714–718. [CrossRef] [PubMed]
7. Oñate-Garzón, J.; Ausili, A.; Manrique-Moreno, M.; Torrecillas, A.; Aranda, F.J.; Patiño, E.; Gomez-Fernández, J.C. The increasein positively charged residues in cecropin D-like Galleria mellonella favors its interaction with membrane models that imitatebacterial membranes. Arch. Biochem. Biophys. 2017, 629, 54–62. [CrossRef]
8. Rivera-Sánchez, S.P.; Agudelo-Góngora, H.A.; Oñate-Garzón, J.; Flórez-Elvira, L.J.; Correa, A.; Londoño, P.A.; Londoño-Mosquera,J.D.; Aragón-Muriel, A.; Polo-Cerón, D.; Ocampo-Ibáñez, I.D. Antibacterial Activity of a Cationic Antimicrobial Peptide againstMultidrug-Resistant Gram-Negative Clinical Isolates and Their Potential Molecular Targets. Molecules 2020, 25, 5035. [CrossRef]
9. Correa, W.; Manrique-Moreno, M.; Patiño, E.; Peláez-Jaramillo, C.; Kaconis, Y.; Gutsmann, T.; Garidel, P.; Heinbockel, L.;Brandenburg, K. Galleria mellonella native and analogue peptides Gm1 and Δgm1. I) Biophysical characterization of the interactionmechanisms with bacterial model membranes. Biochim. Biophys. Acta Biomembr. 2014, 1838, 2728–2738. [CrossRef]
10. Haralampiev, I.; Alonso de Armiño, D.J.; Luck, M.; Fischer, M.; Abel, T.; Huster, D.; Di Lella, S.; Scheidt, H.A.; Müller, P. Interactionof the small-molecule kinase inhibitors tofacitinib and lapatinib with membranes. Biochim. Biophys. Acta Biomembr. 2020, 1862,183414. [CrossRef]
11. Kaur, N.; Fischer, M.; Kumar, S.; Gahlay, G.K.; Scheidt, H.A.; Mithu, V.S. Role of cationic head-group in cytotoxicity of ionicliquids: Probing changes in bilayer architecture using solid-state NMR spectroscopy. J. Colloid Interface Sci. 2021, 581, 954–963.[CrossRef] [PubMed]
12. Lind, T.K.; Skoda, M.W.A.; Cárdenas, M. Formation and Characterization of Supported Lipid Bilayers Composed of Phos-phatidylethanolamine and Phosphatidylglycerol by Vesicle Fusion, a Simple but Relevant Model for Bacterial Membranes. ACSOmega 2019, 4, 10687–10694. [CrossRef]
13. Britt, H.M.; Prakash, A.S.; Appleby, S.; Mosely, J.A.; Sanderson, J.M. Lysis of membrane lipids promoted by small organicmolecules: Reactivity depends on structure but not lipophilicity. Sci. Adv. 2020, 6, eaaz8598. [CrossRef]
14. Dadhich, R.; Singh, A.; Menon, A.P.; Mishra, M.; Athul, C.D.; Kapoor, S. Biophysical characterization of mycobacterial modelmembranes and their interaction with rifabutin: Towards lipid-guided drug screening in tuberculosis. Biochim. Biophys. ActaBiomembr. 2019, 1861, 1213–1227. [CrossRef]
15. Alves, A.C.; Ribeiro, D.; Nunes, C.; Reis, S. Biophysics in cancer: The relevance of drug-membrane interaction studies. Biochim.Biophys. Acta Biomembr. 2016, 1858, 2231–2244. [CrossRef]
16. Castillo, I.; Suwalsky, M.; Gallardo, M.J.; Troncoso, V.; Sánchez-Eguía, B.N.; Santiago-Osorio, E.; Aguiñiga, I.; González-Ugarte,A.K. Structural and functional effects of benzimidazole/thioether-copper complexes with antitumor activity on cell membranesand molecular models. J. Inorg. Biochem. 2016, 156, 98–104. [CrossRef]
17. Lopes-de-Campos, D.; Nunes, C.; Sarmento, B.; Jakobtorweihen, S.; Reis, S. Metronidazole within phosphatidylcholine lipidmembranes: New insights to improve the design of imidazole derivatives. Eur. J. Pharm. Biopharm. 2018, 129, 204–214. [CrossRef][PubMed]
18. Chen, M.; Su, S.; Zhou, Q.; Tang, X.; Liu, T.; Peng, F.; He, M.; Luo, H.; Xue, W. Antibacterial and antiviral activities and actionmechanism of flavonoid derivatives with a benzimidazole moiety. J. Saudi Chem. Soc. 2021, 25, 101194. [CrossRef]
19. Aragón-Muriel, A.; Liscano-Martínez, Y.; Rufino-Felipe, E.; Morales-Morales, D.; Oñate-Garzón, J.; Polo-Cerón, D. Synthesis,biological evaluation and model membrane studies on metal complexes containing aromatic N,O-chelate ligands. Heliyon 2020, 6,e04126. [CrossRef] [PubMed]
20. Alasmary, F.A.S.; Snelling, A.M.; Zain, M.E.; Alafeefy, A.M.; Awaad, A.S.; Karodia, N. Synthesis and evaluation of selectedbenzimidazole derivatives as potential antimicrobial agents. Molecules 2015, 20, 15206–15223. [CrossRef] [PubMed]
21. Saluja, P.; Sharma, H.; Kaur, N.; Singh, N.; Jang, D.O. Benzimidazole-based imine-linked chemosensor: Chromogenic sensor forMg2+ and fluorescent sensor for Cr3+. Tetrahedron 2012, 68, 2289–2293. [CrossRef]
22. Dutta Gupta, S.; Revathi, B.; Mazaira, G.I.; Galigniana, M.D.; Subrahmanyam, C.V.S.; Gowrishankar, N.L.; Raghavendra, N.M.2,4-dihydroxy benzaldehyde derived Schiff bases as small molecule Hsp90 inhibitors: Rational identification of a new anticancerlead. Bioorg. Chem. 2015, 59, 97–105. [CrossRef] [PubMed]
23. Ganga Raju, M.; Saritha, L.; Dutta Gupta, S.; Divya, N. Antimicrobial, Anti-Inflammatory and Anti-Parkinson’s Screening ofImine Analogues through HSP90 Inhibition. J. Chem. Pharm. Res. 2017, 9, 258–266.
24. Mahmood, K.; Hashmi, W.; Ismail, H.; Mirza, B.; Twamley, B.; Akhter, Z.; Rozas, I.; Baker, R.J. Synthesis, DNA binding andantibacterial activity of metal(II) complexes of a benzimidazole Schiff base. Polyhedron 2019, 157, 326–334. [CrossRef]
25. Brana, M.F.; Castellano, J.M.; Yunta, M.J.R. Synthesis of benzimidazo-substituted 3-quinolinecarboxylic acids as antibacterialagents. J. Heterocycl. Chem. 1990, 27, 1177–1180. [CrossRef]
26. Roopashree, B.; Gayathri, V.; Gopi, A.; Devaraju, K.S. Syntheses, characterizations, and antimicrobial activities of binuclearruthenium(III) complexes containing 2-substituted benzimidazole derivatives. J. Coord. Chem. 2012, 65, 4023–4040. [CrossRef]
27. Suman, G.R.; Bubbly, S.G.; Gudennavar, S.B.; Muthu, S.; Roopashree, B.; Gayatri, V.; Nanje Gowda, N.M. Structural investigation,spectroscopic and energy level studies of Schiff base: 2-[(3′-N-salicylidenephenyl)benzimidazole] using experimental and DFTmethods. J. Mol. Struct. 2017, 1139, 247–254. [CrossRef]
28. Aragón-Muriel, A.; Ausili, A.; Sánchez, K.; Rojas, A.O.E.; Londoño Mosquera, J.; Polo-Cerón, D.; Oñate-Garzón, J. Studies onthe Interaction of Alyteserin 1c Peptide and Its Cationic Analogue with Model Membranes Imitating Mammalian and BacterialMembranes. Biomolecules 2019, 9, 527. [CrossRef]
81

Membranes 2021, 11, 449
29. Oñate-Garzón, J.; Manrique-Moreno, M.; Trier, S.; Leidy, C.; Torres, R.; Patiño, E. Antimicrobial activity and interactions ofcationic peptides derived from Galleria mellonella cecropin D-like peptide with model membranes. J. Antibiot. 2017, 70, 238–245.[CrossRef]
30. Rappe, A.K.; Casewit, C.J.; Colwell, K.S.; Goddard, W.A.; Skiff, W.M. UFF, a full periodic table force field for molecular mechanicsand molecular dynamics simulations. J. Am. Chem. Soc. 1992, 114, 10024–10035. [CrossRef]
31. Jo, S.; Kim, T.; Iyer, V.G.; Im, W. CHARMM-GUI: A web-based graphical user interface for CHARMM. J. Comput. Chem. 2008, 29,1859–1865. [CrossRef]
32. Teixeira, V.; Feio, M.J.; Bastos, M. Role of lipids in the interaction of antimicrobial peptides with membranes. Prog. Lipid Res. 2012,51, 149–177. [CrossRef]
33. Huang, J.; Mackerell, A.D. CHARMM36 all-atom additive protein force field: Validation based on comparison to NMR data. J.Comput. Chem. 2013, 34, 2135–2145. [CrossRef]
34. Abraham, M.J.; Murtola, T.; Schulz, R.; Páll, S.; Smith, J.C.; Hess, B.; Lindah, E. Gromacs: High performance molecular simulationsthrough multi-level parallelism from laptops to supercomputers. SoftwareX 2015, 1–2, 19–25. [CrossRef]
35. Epand, R.F.; Savage, P.B.; Epand, R.M. Bacterial lipid composition and the antimicrobial efficacy of cationic steroid compounds(Ceragenins). Biochim. Biophys. Acta Biomembr. 2007, 1768, 2500–2509. [CrossRef]
36. Liscano, Y.; Salamanca, C.H.; Vargas, L.; Cantor, S.; Laverde-Rojas, V.; Oñate-Garzón, J. Increases in hydrophilicity and chargeon the polar face of alyteserin 1c helix change its selectivity towards gram-positive bacteria. Antibiotics 2019, 8, 238. [CrossRef][PubMed]
37. Chandrakala, M.; Sheshadri, B.S.; Nanje Gowda, N.M.; Murthy, K.G.S.; Nagasundara, K.R. Synthesis and spectral studies of2-salicylidine-4-aminophenyl benzimidazole and its reaction with divalent Zn, Cd and Hg: Crystal structure of the cadmiumbromide complex. J. Chem. Res. 2010, 576–580. [CrossRef]
38. Riske, K.A.; Barroso, R.P.; Vequi-Suplicy, C.C.; Germano, R.; Henriques, V.B.; Lamy, M.T. Lipid bilayer pre-transition as thebeginning of the melting process. Biochim. Biophys. Acta Biomembr. 2009, 1788, 954–963. [CrossRef] [PubMed]
39. Meyer, H.W. Pretransition-ripples in bilayers of dipalmitoylphosphatidylcholine: Undulation or periodic segments? A freeze-fracture study. Biochim. Biophys. Acta Lipids Lipid Metab. 1996, 1302, 138–144. [CrossRef]
40. Di Foggia, M.; Bonora, S.; Tinti, A.; Tugnoli, V. DSC and Raman study of DMPC liposomes in presence of Ibuprofen at differentpH. J. Therm. Anal. Calorim. 2017, 127, 1407–1417. [CrossRef]
41. Ohline, S.M.; Campbell, M.L.; Turnbull, M.T.; Kohler, S.J. Differential scanning calorimetric study of bilayer membrane phasetransitions: A biophysical chemistry experiment. J. Chem. Educ. 2001, 78, 1251–1256. [CrossRef]
42. Bilge, D.; Kazanci, N.; Severcan, F. Acyl chain length and charge effect on Tamoxifen-lipid model membrane interactions. J. Mol.Struct. 2013, 1040, 75–82. [CrossRef]
43. Carrillo, C.; Teruel, J.A.; Aranda, F.J.; Ortiz, A. Molecular mechanism of membrane permeabilization by the peptide antibioticsurfactin. Biochim. Biophys. Acta Biomembr. 2003, 1611, 91–97. [CrossRef]
44. Huang, H.W. Action of antimicrobial peptides: Two-state model. Biochemistry 2000, 39, 8347–8352. [CrossRef]45. Martínez, L. Automatic identification of mobile and rigid substructures in molecular dynamics simulations and fractional
structural fluctuation analysis. PLoS ONE 2015, 10, e0119264. [CrossRef]46. Bera, I.; Klauda, J.B. Molecular Simulations of Mixed Lipid Bilayers with Sphingomyelin, Glycerophospholipids, and Cholesterol.
J. Phys. Chem. B 2017, 121, 5197–5208. [CrossRef] [PubMed]47. Björkbom, A.; Róg, T.; Kaszuba, K.; Kurita, M.; Yamaguchi, S.; Lönnfors, M.; Nyholm, T.K.M.; Vattulainen, I.; Katsumura, S.;
Slotte, J.P. Effect of sphingomyelin headgroup size on molecular properties and interactions with cholesterol. Biophys. J. 2010, 99,3300–3308. [CrossRef] [PubMed]
48. Hakizimana, P.; Masureel, M.; Gbaguidi, B.; Ruysschaert, J.M.; Govaerts, C. Interactions between phosphatidylethanolamineheadgroup and LmrP, a multidrug transporter: A conserved mechanism for proton gradient sensing? J. Biol. Chem. 2008, 283,9369–9376. [CrossRef] [PubMed]
49. Blom, T.S.; Koivusalo, M.; Kuismanen, E.; Kostiainen, R.; Somerharju, P.; Ikonen, E. Mass spectrometric analysis reveals anincrease in plasma membrane polyunsaturated phospholipid species upon cellular cholesterol loading. Biochemistry 2001, 40,14635–14644. [CrossRef]
50. Hauser, H.; Pascher, I.; Pearson, R.H.; Sundell, S. Preferred conformation and molecular packing of phosphatidylethanolamineand phosphatidylcholine. BBA Rev. Biomembr. 1981, 650, 21–51. [CrossRef]
51. Zhang, Y.P.; Lewis, R.N.A.H.; McElhaney, R.N. Calorimetric and spectroscopic studies of the thermotropic phase behavior of then-saturated 1,2-diacylphosphatidylglycerols. Biophys. J. 1997, 72, 779–793. [CrossRef]
52. Lairion, F.; Disalvo, E.A. Effect of phloretin on the dipole potential of phosphatidylcholine, phosphatidylethanolamine, andphosphatidylglycerol monolayers. Langmuir 2004, 20, 9151–9155. [CrossRef] [PubMed]
82
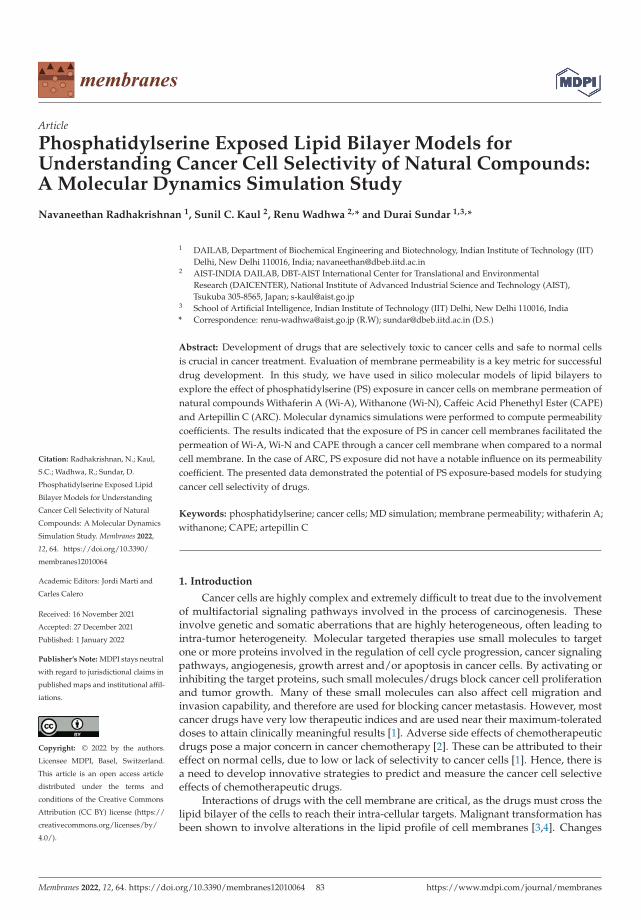
Citation: Radhakrishnan, N.; Kaul,
S.C.; Wadhwa, R.; Sundar, D.
Phosphatidylserine Exposed Lipid
Bilayer Models for Understanding
Cancer Cell Selectivity of Natural
Compounds: A Molecular Dynamics
Simulation Study. Membranes 2022,
12, 64. https://doi.org/10.3390/
membranes12010064
Academic Editors: Jordi Marti and
Carles Calero
Received: 16 November 2021
Accepted: 27 December 2021
Published: 1 January 2022
Publisher’s Note: MDPI stays neutral
with regard to jurisdictional claims in
published maps and institutional affil-
iations.
Copyright: © 2022 by the authors.
Licensee MDPI, Basel, Switzerland.
This article is an open access article
distributed under the terms and
conditions of the Creative Commons
Attribution (CC BY) license (https://
creativecommons.org/licenses/by/
4.0/).
membranes
Article
Phosphatidylserine Exposed Lipid Bilayer Models forUnderstanding Cancer Cell Selectivity of Natural Compounds:A Molecular Dynamics Simulation Study
Navaneethan Radhakrishnan 1, Sunil C. Kaul 2, Renu Wadhwa 2,* and Durai Sundar 1,3,*
1 DAILAB, Department of Biochemical Engineering and Biotechnology, Indian Institute of Technology (IIT)Delhi, New Delhi 110016, India; [email protected]
2 AIST-INDIA DAILAB, DBT-AIST International Center for Translational and EnvironmentalResearch (DAICENTER), National Institute of Advanced Industrial Science and Technology (AIST),Tsukuba 305-8565, Japan; [email protected]
3 School of Artificial Intelligence, Indian Institute of Technology (IIT) Delhi, New Delhi 110016, India* Correspondence: [email protected] (R.W); [email protected] (D.S.)
Abstract: Development of drugs that are selectively toxic to cancer cells and safe to normal cellsis crucial in cancer treatment. Evaluation of membrane permeability is a key metric for successfuldrug development. In this study, we have used in silico molecular models of lipid bilayers toexplore the effect of phosphatidylserine (PS) exposure in cancer cells on membrane permeation ofnatural compounds Withaferin A (Wi-A), Withanone (Wi-N), Caffeic Acid Phenethyl Ester (CAPE)and Artepillin C (ARC). Molecular dynamics simulations were performed to compute permeabilitycoefficients. The results indicated that the exposure of PS in cancer cell membranes facilitated thepermeation of Wi-A, Wi-N and CAPE through a cancer cell membrane when compared to a normalcell membrane. In the case of ARC, PS exposure did not have a notable influence on its permeabilitycoefficient. The presented data demonstrated the potential of PS exposure-based models for studyingcancer cell selectivity of drugs.
Keywords: phosphatidylserine; cancer cells; MD simulation; membrane permeability; withaferin A;withanone; CAPE; artepillin C
1. Introduction
Cancer cells are highly complex and extremely difficult to treat due to the involvementof multifactorial signaling pathways involved in the process of carcinogenesis. Theseinvolve genetic and somatic aberrations that are highly heterogeneous, often leading tointra-tumor heterogeneity. Molecular targeted therapies use small molecules to targetone or more proteins involved in the regulation of cell cycle progression, cancer signalingpathways, angiogenesis, growth arrest and/or apoptosis in cancer cells. By activating orinhibiting the target proteins, such small molecules/drugs block cancer cell proliferationand tumor growth. Many of these small molecules can also affect cell migration andinvasion capability, and therefore are used for blocking cancer metastasis. However, mostcancer drugs have very low therapeutic indices and are used near their maximum-tolerateddoses to attain clinically meaningful results [1]. Adverse side effects of chemotherapeuticdrugs pose a major concern in cancer chemotherapy [2]. These can be attributed to theireffect on normal cells, due to low or lack of selectivity to cancer cells [1]. Hence, there isa need to develop innovative strategies to predict and measure the cancer cell selectiveeffects of chemotherapeutic drugs.
Interactions of drugs with the cell membrane are critical, as the drugs must cross thelipid bilayer of the cells to reach their intra-cellular targets. Malignant transformation hasbeen shown to involve alterations in the lipid profile of cell membranes [3,4]. Changes
Membranes 2022, 12, 64. https://doi.org/10.3390/membranes12010064 https://www.mdpi.com/journal/membranes83
Membranes 2022, 12, 64
in the levels of different types of lipid molecules in cell membranes have been reportedin various types of cancers [5–10]. A common hallmark observed across several types ofcancers appears to be the loss of asymmetry in the distribution of different types of lipidmolecules between the two leaflets of the cell membrane [11–13]. The basic structure ofthe cell membrane consists of a lipid bilayer that is mainly composed of phospholipids.Phosphatidylcholines (PC), phosphatidylethanolamines (PE), phosphatidylserines (PS),phosphatidylinositols (PI) and sphingomyelins (SM) form the majority of the phospholipidsin the cell membrane [14]. A non-uniform distribution of these lipids across the two leafletsof the bilayer is a characteristic feature of a normal eukaryotic cell membrane [14,15]. PS andPE are usually present in the inner leaflet, while the outer leaflet is mostly composed of PCand SM [14,15]. This asymmetric distribution is actively maintained by the ATP-dependentenzymes, flippases and floppases [16]. PS and PE are transported from outer leaflet to innerleaflet by flippases, while PC and SM are transported in the opposite direction by flop-pases [16]. An absence of such asymmetric distribution of phospholipids has been reportedin cancers. Exposure of phosphatidylserine and phosphatidylethanolamine molecules onthe outer leaflet has been reported in cancer cells [11–13]. The altered distribution of lipidsin cancer cell membranes makes their structural and biophysical properties different to thatof normal cells. Such changes could modulate drug penetration, thereby influencing drugactivity [4].
Molecular dynamics simulations using atomistic models of lipid bilayers made up ofPC, SM, PS, PE and/or cholesterol have been used by different studies to investigate theeffects of asymmetric lipid distribution on membrane properties [17–20]. Studies on thepermeability of lipid bilayers to small molecules using molecular dynamics simulationshave demonstrated the potential of in silico membrane models in analyzing the membranepermeation of drugs [21–24].
In the present study, molecular dynamics simulations involving in silico atomisticmodels of lipid bilayers have been used to explicitly explore the effect of PS exposure incancer cells on membrane permeation of natural compounds reported to have anti-cancerproperties. Atomistic lipid bilayer models of cancer and normal cell membranes used inthis study are based on the relative distribution of two kinds of phospholipids: the mostcommon phospholipid, phosphatidylcholine (PC), and the anionic phospholipid which isexposed exclusively in cancer cells, phosphatidylserine (PS). Both the bilayer models werebuilt using PC and PS in the ratio 2:1 that roughly equates to their reported proportion [14].The normal cell membrane model was built to have all the 1-palmitoyl-2-oleoyl-sn-glycero-3-phosphoserine (POPS) molecules in the inner leaflet, whereas the cancer cell membranemodel was built with POPS molecules in both leaflets of the membrane. For simplicity,other types of phospholipids and sterols were not included in the model.
The natural anti-cancer compounds chosen for this study included Withaferin A(Wi-A), Withanone (Wi-N), Caffeic Acid Phenethyl Ester (CAPE) and Artepillin C (ARC)(Figure 1). These are bioactive molecules from natural sources known for their therapeuticpotential with lesser side effects compared to synthetic drugs. Wi-A and Wi-N are secondarymetabolites from Ashwagandha that have been extensively studied for their anti-canceractivities [25–28]. Molecular modeling approaches accompanied with in vitro assays haverevealed the multi-modal anti-cancer activities of Wi-A and Wi-N [25–27,29]. Although Wi-A and Wi-N are closely related structural analogs, several previous studies have reportedtheir different levels of cytotoxicity in cancer and normal cells [30,31]. Whereas Wi-Ashowed stronger cytotoxicity to both cancer and normal cells, Wi-N exhibited milder toxicityto cancer cells and was safer for normal cells [31]. CAPE, a bioactive compound isolatedfrom New Zealand honeybee propolis, was earlier studied for its anti-cancer activitiesand reported to cause the death of cancer cells selectively [26]. Another propolis-derivedbioactive compound, ARC—particularly enriched in Brazilian honeybee propolis—has alsobeen reported for its anti-cancer activity [32–34].
84
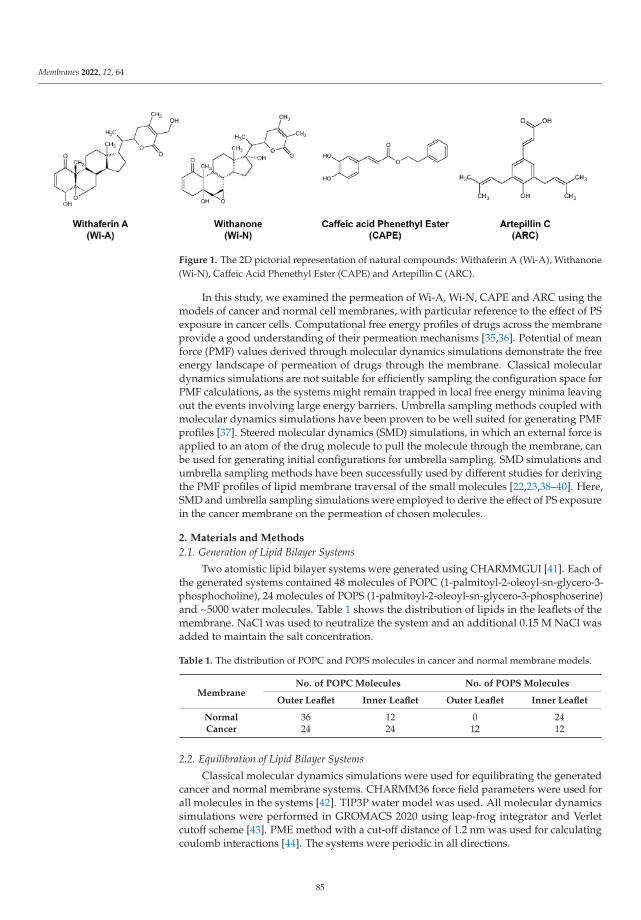
Membranes 2022, 12, 64
Figure 1. The 2D pictorial representation of natural compounds: Withaferin A (Wi-A), Withanone(Wi-N), Caffeic Acid Phenethyl Ester (CAPE) and Artepillin C (ARC).
In this study, we examined the permeation of Wi-A, Wi-N, CAPE and ARC using themodels of cancer and normal cell membranes, with particular reference to the effect of PSexposure in cancer cells. Computational free energy profiles of drugs across the membraneprovide a good understanding of their permeation mechanisms [35,36]. Potential of meanforce (PMF) values derived through molecular dynamics simulations demonstrate the freeenergy landscape of permeation of drugs through the membrane. Classical moleculardynamics simulations are not suitable for efficiently sampling the configuration space forPMF calculations, as the systems might remain trapped in local free energy minima leavingout the events involving large energy barriers. Umbrella sampling methods coupled withmolecular dynamics simulations have been proven to be well suited for generating PMFprofiles [37]. Steered molecular dynamics (SMD) simulations, in which an external force isapplied to an atom of the drug molecule to pull the molecule through the membrane, canbe used for generating initial configurations for umbrella sampling. SMD simulations andumbrella sampling methods have been successfully used by different studies for derivingthe PMF profiles of lipid membrane traversal of the small molecules [22,23,38–40]. Here,SMD and umbrella sampling simulations were employed to derive the effect of PS exposurein the cancer membrane on the permeation of chosen molecules.
2. Materials and Methods
2.1. Generation of Lipid Bilayer Systems
Two atomistic lipid bilayer systems were generated using CHARMMGUI [41]. Each ofthe generated systems contained 48 molecules of POPC (1-palmitoyl-2-oleoyl-sn-glycero-3-phosphocholine), 24 molecules of POPS (1-palmitoyl-2-oleoyl-sn-glycero-3-phosphoserine)and ~5000 water molecules. Table 1 shows the distribution of lipids in the leaflets of themembrane. NaCl was used to neutralize the system and an additional 0.15 M NaCl wasadded to maintain the salt concentration.
Table 1. The distribution of POPC and POPS molecules in cancer and normal membrane models.
MembraneNo. of POPC Molecules No. of POPS Molecules
Outer Leaflet Inner Leaflet Outer Leaflet Inner Leaflet
Normal 36 12 0 24Cancer 24 24 12 12
2.2. Equilibration of Lipid Bilayer Systems
Classical molecular dynamics simulations were used for equilibrating the generatedcancer and normal membrane systems. CHARMM36 force field parameters were used forall molecules in the systems [42]. TIP3P water model was used. All molecular dynamicssimulations were performed in GROMACS 2020 using leap-frog integrator and Verletcutoff scheme [43]. PME method with a cut-off distance of 1.2 nm was used for calculatingcoulomb interactions [44]. The systems were periodic in all directions.
85

Membranes 2022, 12, 64
Energy minimization was performed for 5000 steps using steepest descent algorithm.During energy minimization, position restraints were applied to phosphate atoms with aforce constant of 1000 kJ/mol/nm2. After energy minimization, simulation was conductedin canonical (NVT) ensemble for 100 ps with a timestep of 1 fs, during which a temperatureof 310 K was reached using a velocity rescale thermostat with a time constant of 1 ps.During NVT equilibration, position restraints were applied to phosphate atoms with aforce constant of 1000 kJ/mol/nm2.
After NVT equilibration, the systems were equilibrated in isothermal–isobaric (NPT)ensemble in six stages: from NPT-1 to NPT-6 for 502.5 ns. Position restraints applied tothe phosphate atoms were gradually relieved during NPT-1 to NPT-4, with no restraintsapplied in NPT-5 and NPT-6. The force constants used for position restraints on phosphateatoms were 600 kJ/mol/nm2, 400 kJ/mol/nm2, 200 kJ/mol/nm2 and 50 kJ/mol/nm2 fromNPT-1 to NPT-4, respectively. Timestep was set to 1 fs in NPT-1 and NPT-2, while fromNPT-3 onwards it was set to 2 fs. From NPT-1 to NPT-5, temperature was maintainedat 310 K using a velocity rescale thermostat with a time constant of 1 ps, while pressurewas maintained at 1 atm by semi-isotropic coupling using Berendsen barostat with a timeconstant of 5 ps. During NPT-6, Nose–Hoover thermostat with a time constant of 1 psand Parrinello–Rahman barostat with a time constant of 5 ps were used to maintain thetemperature and the pressure at 310 K and 1 atm, respectively. NPT-1 to NPT-6 were runfor a duration of 250 ps, 250 ps, 1 ns, 1 ns, 300 ns and 200 ns, respectively. The productionsimulation during which membrane properties were assessed was run in NPT ensemblefor 200 ns. No position restraints were used during production and the time step was 2 fs.Thermostat and barostat used were the same as for the NPT-6 equilibration. Snapshotswere saved every 10 ps for analysis.
2.3. Calculation of Membrane Properties
Area per lipid and order parameters of lipid tails were calculated using MEMBPLU-GIN through VMD [45,46]. Area per lipid was computed by selecting a triad of atomsfor phospholipids, projecting their x and y coordinates into a plane, dividing them intopolygons using a Voronoi diagram [47] and then calculating the area of the polygons. Theformula used for order parameter (SCD) calculation is as follows [48]:
SCD= −12
3 cos2θ − 1, (1)
where θ is the instantaneous angle between the C–H bond and the bilayer normal.
2.4. Steered Molecular Dynamics Simulations and Umbrella Sampling
To compute PMF and diffusivities of the molecules, configurations and energies ofdrug molecules had to be sampled along the bilayer normal. Steered molecular dynamicssimulations were performed to generate the initial configurations for sampling. The forcefield parameters of small molecules Wi-A, Wi-N, CAPE and ARC were generated usingCGENFF server [42].
The small molecule was inserted into the water at around 2 nm from the lipid headgroups. After insertion of the small molecule into the system, energy minimization wasperformed using steepest descent algorithm for 5000 steps, followed by NVT and NPTequilibration for 50 ps and 100 ps, respectively. Position restraints were applied to the smallmolecule in Z-direction during NVT and NPT equilibration. Steered MD simulations wereperformed in NVT ensemble using the pull-code of GROMACS. Nose–Hoover thermostatwith a time constant of 1 picosecond and Parrinello–Rahman barostat with a time constantof 5 ps were used to maintain the temperature and pressure at 310 K and 1 atm, respectively,during the pulling simulation. The small molecule was pulled along Z-direction fromwater, towards the hydrophobic core of the membrane, using an umbrella potential witha force constant of 100 kJ/mol/nm2 and a pulling rate of 0.00025 nm/ps. After pulling,configurations were sampled every 0.2 nm along the reaction coordinate: the Z-component
86
Membranes 2022, 12, 64
of distance (z). A total of 22 windows spaced 0.2 nm apart were taken for umbrellasampling (US).
For each window, US simulations were performed in NPT ensemble, with a harmonicforce constant of 100 kJ/mol/nm2. Nosé–Hoover thermostat was used for maintainingtemperature at 310 K, with a semi-isotropic Parrinello–Rahman barostat used to maintainpressure at 1 atm. Each window was run for 40 ns, and data from the last 25 ns wereused for analysis. Positions and forces along the reaction coordinate were saved every2 fs. For the cancer cell membrane, US simulations were performed along only one leaflet,as the membrane has a symmetric distribution of lipids between the two leaflets. Forthe normal cell membrane, US sampling simulations were performed along both leafletsindependently.
2.5. Calculation of PMF and Permeability Coefficients
PMF profiles were estimated using Weighted Histogram Analysis Method (WHAM)implementation in GROMACS [27]. For the normal membrane model, PMF values werecalculated for both leaflets separately, starting from bulk water to membrane core, andthe PMF curves were smoothened by using moving average spanning 0.5 Å. In the caseof the cancer membrane, PMF values of one leaflet were duplicated for the other, withmoving average smoothing conducted the same way as for the normal membrane. Theconvergence of PMF profiles was confirmed by checking PMF values at different intervalsof umbrella sampling simulations (Supplementary Materials: Figure S1). The permeabilitycoefficient (P) was calculated using the Inhomogeneous Solubility Diffusion model [35,36].Accordingly, P was derived from effective resistivity (Reff) using the relation,
P =1
Reff, (2)
and Reff was calculated using,
Reff =∫ z2
z1
R(z) dz, (3)
where z is a collective variable describing the relative position of the solute along thereaction coordinate and R(z) is the resistivity at z. R(z) was calculated from free energies(ΔG(z)) and diffusion coefficients (D(z)) along z using the equation,
R(z) =e βΔG(z)
D(z)(4)
where β is the inverse of the Boltzmann constant times the temperature.Diffusion coefficients were calculated using the method proposed in 2005 by Hum-
mer [49], from the autocorrelation function (Czz(t)) of z and variance (var(z)) of z as follows.
D(z) =var(z)2∫ ∞
0 Czz(t) dt(5)
Czz(t) was calculated using the ”analyze” module of GROMACS.
3. Results and Discussion
The phospholipid PS is usually present in the inner leaflet of the cell membranesof normal cells [14,15]. Exposure of PS on the cell membrane of cancer cells has beenreported in a wide range of cancers [11,12,50,51]. Here, atomistic models of cancer andnormal membranes based on a relative PS distribution between the outer and the innerleaflets of the membrane were built to study the permeation of some natural compounds(Wi-A, Wi-N, CAPE and ARC) shown to possess anti-cancer activity. The built membranemodels consisted of only two types of lipid molecules, POPC and POPS, in contrast tothe diversity of lipid molecules in the cell membrane. Usage of such simplistic models
87
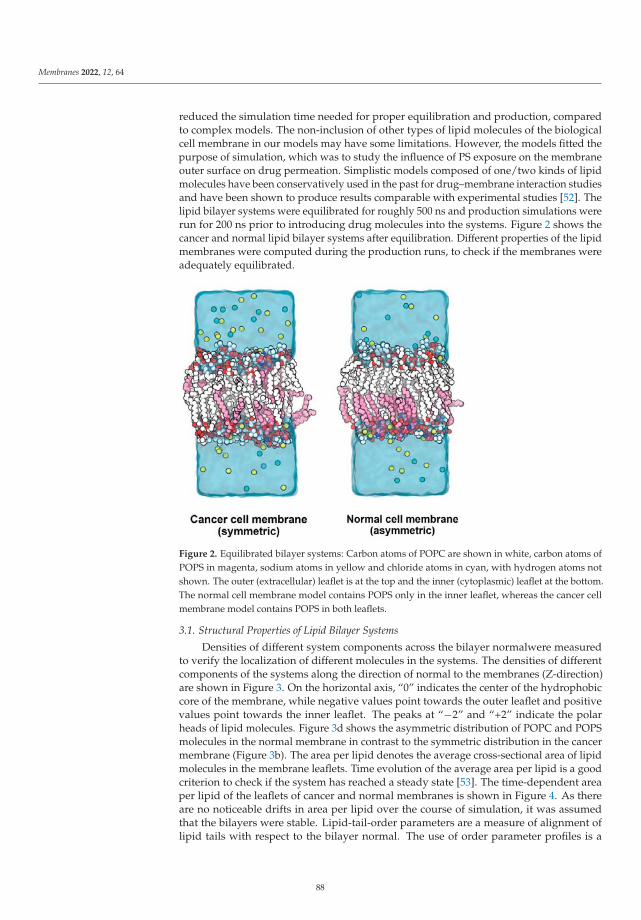
Membranes 2022, 12, 64
reduced the simulation time needed for proper equilibration and production, comparedto complex models. The non-inclusion of other types of lipid molecules of the biologicalcell membrane in our models may have some limitations. However, the models fitted thepurpose of simulation, which was to study the influence of PS exposure on the membraneouter surface on drug permeation. Simplistic models composed of one/two kinds of lipidmolecules have been conservatively used in the past for drug–membrane interaction studiesand have been shown to produce results comparable with experimental studies [52]. Thelipid bilayer systems were equilibrated for roughly 500 ns and production simulations wererun for 200 ns prior to introducing drug molecules into the systems. Figure 2 shows thecancer and normal lipid bilayer systems after equilibration. Different properties of the lipidmembranes were computed during the production runs, to check if the membranes wereadequately equilibrated.
Figure 2. Equilibrated bilayer systems: Carbon atoms of POPC are shown in white, carbon atoms ofPOPS in magenta, sodium atoms in yellow and chloride atoms in cyan, with hydrogen atoms notshown. The outer (extracellular) leaflet is at the top and the inner (cytoplasmic) leaflet at the bottom.The normal cell membrane model contains POPS only in the inner leaflet, whereas the cancer cellmembrane model contains POPS in both leaflets.
3.1. Structural Properties of Lipid Bilayer Systems
Densities of different system components across the bilayer normalwere measuredto verify the localization of different molecules in the systems. The densities of differentcomponents of the systems along the direction of normal to the membranes (Z-direction)are shown in Figure 3. On the horizontal axis, “0” indicates the center of the hydrophobiccore of the membrane, while negative values point towards the outer leaflet and positivevalues point towards the inner leaflet. The peaks at “−2” and “+2” indicate the polarheads of lipid molecules. Figure 3d shows the asymmetric distribution of POPC and POPSmolecules in the normal membrane in contrast to the symmetric distribution in the cancermembrane (Figure 3b). The area per lipid denotes the average cross-sectional area of lipidmolecules in the membrane leaflets. Time evolution of the average area per lipid is a goodcriterion to check if the system has reached a steady state [53]. The time-dependent areaper lipid of the leaflets of cancer and normal membranes is shown in Figure 4. As thereare no noticeable drifts in area per lipid over the course of simulation, it was assumedthat the bilayers were stable. Lipid-tail-order parameters are a measure of alignment oflipid tails with respect to the bilayer normal. The use of order parameter profiles is a
88
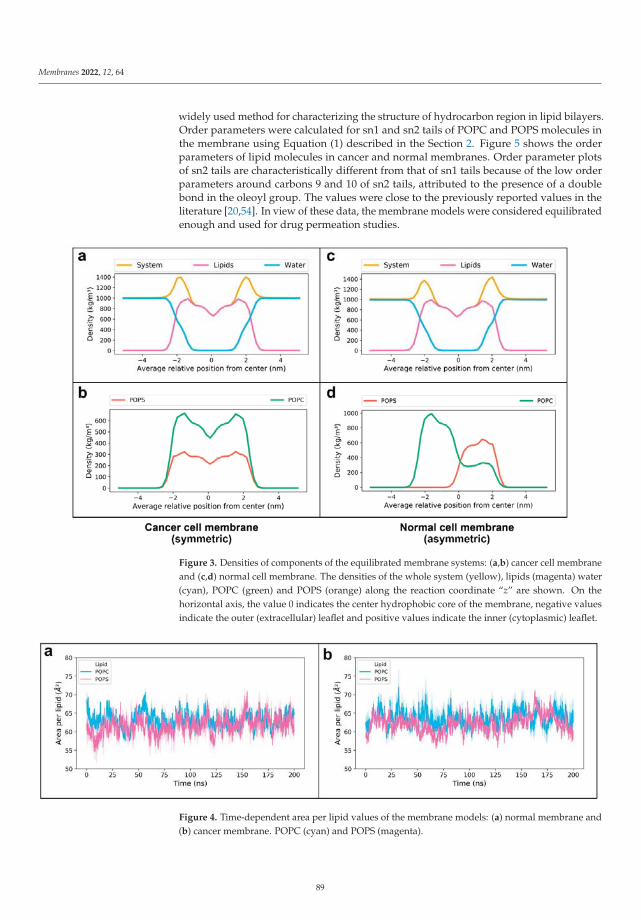
Membranes 2022, 12, 64
widely used method for characterizing the structure of hydrocarbon region in lipid bilayers.Order parameters were calculated for sn1 and sn2 tails of POPC and POPS molecules inthe membrane using Equation (1) described in the Section 2. Figure 5 shows the orderparameters of lipid molecules in cancer and normal membranes. Order parameter plotsof sn2 tails are characteristically different from that of sn1 tails because of the low orderparameters around carbons 9 and 10 of sn2 tails, attributed to the presence of a doublebond in the oleoyl group. The values were close to the previously reported values in theliterature [20,54]. In view of these data, the membrane models were considered equilibratedenough and used for drug permeation studies.
Figure 3. Densities of components of the equilibrated membrane systems: (a,b) cancer cell membraneand (c,d) normal cell membrane. The densities of the whole system (yellow), lipids (magenta) water(cyan), POPC (green) and POPS (orange) along the reaction coordinate “z” are shown. On thehorizontal axis, the value 0 indicates the center hydrophobic core of the membrane, negative valuesindicate the outer (extracellular) leaflet and positive values indicate the inner (cytoplasmic) leaflet.
Figure 4. Time-dependent area per lipid values of the membrane models: (a) normal membrane and(b) cancer membrane. POPC (cyan) and POPS (magenta).
89
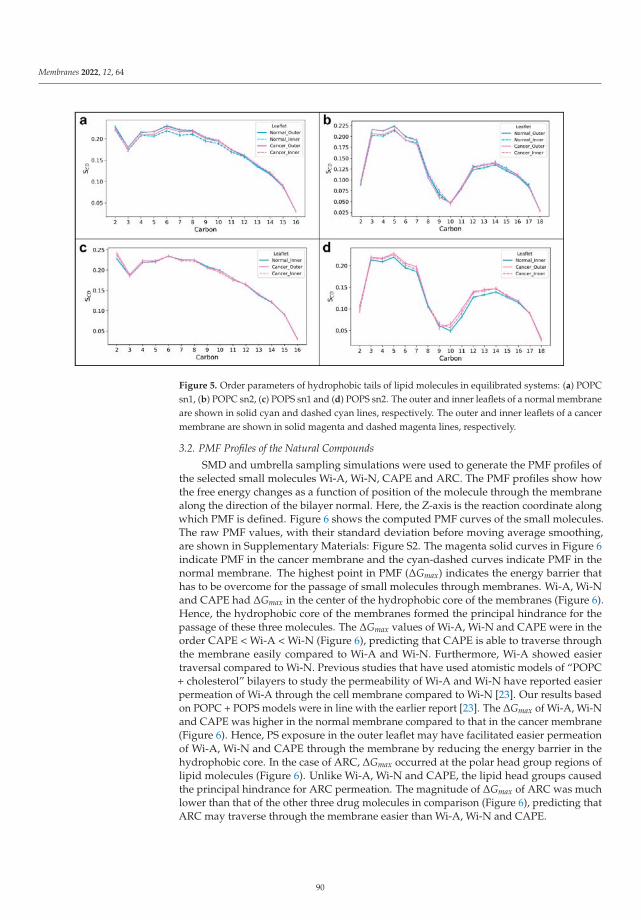
Membranes 2022, 12, 64
Figure 5. Order parameters of hydrophobic tails of lipid molecules in equilibrated systems: (a) POPCsn1, (b) POPC sn2, (c) POPS sn1 and (d) POPS sn2. The outer and inner leaflets of a normal membraneare shown in solid cyan and dashed cyan lines, respectively. The outer and inner leaflets of a cancermembrane are shown in solid magenta and dashed magenta lines, respectively.
3.2. PMF Profiles of the Natural Compounds
SMD and umbrella sampling simulations were used to generate the PMF profiles ofthe selected small molecules Wi-A, Wi-N, CAPE and ARC. The PMF profiles show howthe free energy changes as a function of position of the molecule through the membranealong the direction of the bilayer normal. Here, the Z-axis is the reaction coordinate alongwhich PMF is defined. Figure 6 shows the computed PMF curves of the small molecules.The raw PMF values, with their standard deviation before moving average smoothing,are shown in Supplementary Materials: Figure S2. The magenta solid curves in Figure 6indicate PMF in the cancer membrane and the cyan-dashed curves indicate PMF in thenormal membrane. The highest point in PMF (ΔGmax) indicates the energy barrier thathas to be overcome for the passage of small molecules through membranes. Wi-A, Wi-Nand CAPE had ΔGmax in the center of the hydrophobic core of the membranes (Figure 6).Hence, the hydrophobic core of the membranes formed the principal hindrance for thepassage of these three molecules. The ΔGmax values of Wi-A, Wi-N and CAPE were in theorder CAPE < Wi-A < Wi-N (Figure 6), predicting that CAPE is able to traverse throughthe membrane easily compared to Wi-A and Wi-N. Furthermore, Wi-A showed easiertraversal compared to Wi-N. Previous studies that have used atomistic models of “POPC+ cholesterol” bilayers to study the permeability of Wi-A and Wi-N have reported easierpermeation of Wi-A through the cell membrane compared to Wi-N [23]. Our results basedon POPC + POPS models were in line with the earlier report [23]. The ΔGmax of Wi-A, Wi-Nand CAPE was higher in the normal membrane compared to that in the cancer membrane(Figure 6). Hence, PS exposure in the outer leaflet may have facilitated easier permeationof Wi-A, Wi-N and CAPE through the membrane by reducing the energy barrier in thehydrophobic core. In the case of ARC, ΔGmax occurred at the polar head group regions oflipid molecules (Figure 6). Unlike Wi-A, Wi-N and CAPE, the lipid head groups causedthe principal hindrance for ARC permeation. The magnitude of ΔGmax of ARC was muchlower than that of the other three drug molecules in comparison (Figure 6), predicting thatARC may traverse through the membrane easier than Wi-A, Wi-N and CAPE.
90
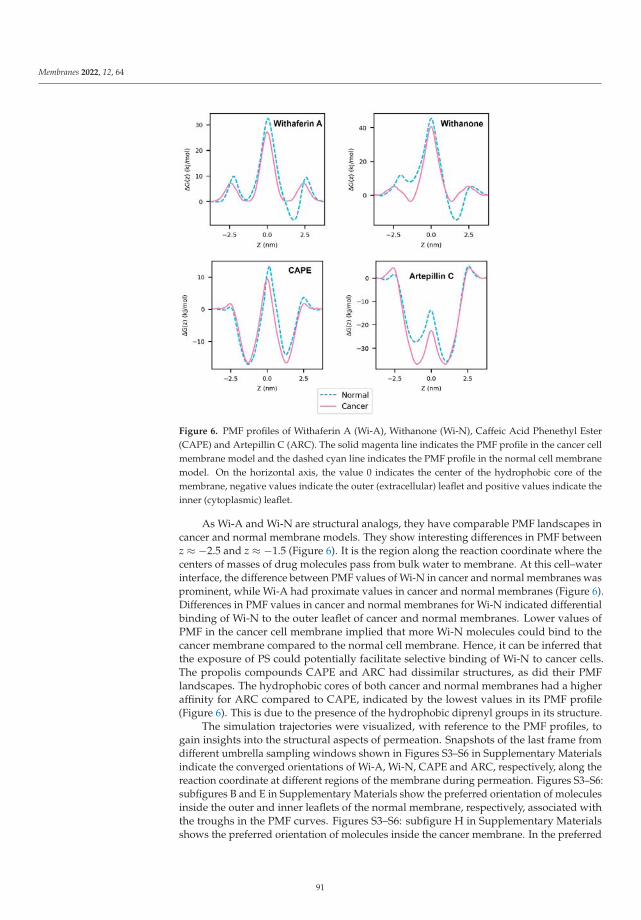
Membranes 2022, 12, 64
Figure 6. PMF profiles of Withaferin A (Wi-A), Withanone (Wi-N), Caffeic Acid Phenethyl Ester(CAPE) and Artepillin C (ARC). The solid magenta line indicates the PMF profile in the cancer cellmembrane model and the dashed cyan line indicates the PMF profile in the normal cell membranemodel. On the horizontal axis, the value 0 indicates the center of the hydrophobic core of themembrane, negative values indicate the outer (extracellular) leaflet and positive values indicate theinner (cytoplasmic) leaflet.
As Wi-A and Wi-N are structural analogs, they have comparable PMF landscapes incancer and normal membrane models. They show interesting differences in PMF betweenz ≈ −2.5 and z ≈ −1.5 (Figure 6). It is the region along the reaction coordinate where thecenters of masses of drug molecules pass from bulk water to membrane. At this cell–waterinterface, the difference between PMF values of Wi-N in cancer and normal membranes wasprominent, while Wi-A had proximate values in cancer and normal membranes (Figure 6).Differences in PMF values in cancer and normal membranes for Wi-N indicated differentialbinding of Wi-N to the outer leaflet of cancer and normal membranes. Lower values ofPMF in the cancer cell membrane implied that more Wi-N molecules could bind to thecancer membrane compared to the normal cell membrane. Hence, it can be inferred thatthe exposure of PS could potentially facilitate selective binding of Wi-N to cancer cells.The propolis compounds CAPE and ARC had dissimilar structures, as did their PMFlandscapes. The hydrophobic cores of both cancer and normal membranes had a higheraffinity for ARC compared to CAPE, indicated by the lowest values in its PMF profile(Figure 6). This is due to the presence of the hydrophobic diprenyl groups in its structure.
The simulation trajectories were visualized, with reference to the PMF profiles, togain insights into the structural aspects of permeation. Snapshots of the last frame fromdifferent umbrella sampling windows shown in Figures S3–S6 in Supplementary Materialsindicate the converged orientations of Wi-A, Wi-N, CAPE and ARC, respectively, along thereaction coordinate at different regions of the membrane during permeation. Figures S3–S6:subfigures B and E in Supplementary Materials show the preferred orientation of moleculesinside the outer and inner leaflets of the normal membrane, respectively, associated withthe troughs in the PMF curves. Figures S3–S6: subfigure H in Supplementary Materialsshows the preferred orientation of molecules inside the cancer membrane. In the preferred
91

Membranes 2022, 12, 64
orientation, the polar groups of the natural compounds are oriented towards the headgroups of lipids, with hydrophobic groups of natural compounds oriented towards thelipid hydrocarbon region. The passage of natural compounds through the membrane coreinvolves a flip in the orientation of natural compounds from their polar groups orientedtowards the head groups of outer leaflet lipids to that of lower leaflet lipids. In the case ofWi-A, Wi-N and CAPE, the primary barrier to permeation—related to ΔGmax—is associatedwith the traversal of their polar groups through the hydrophobic core of the membrane. Inlight of this fact, the hydrophobic cores of cancer and normal membranes were inspected.It was found that the lipid head polar groups of the two leaflets of cancer membrane wereslightly closer to the hydrophobic core in the cancer membrane compared to that in thenormal membrane (Supplementary Materials: Figure S7). This could be the basis for thelower ΔGmax of Wi-A, Wi-N and CAPE in the cancer membrane. In the case of ARC, theprimary barrier to permeation is associated with the passage of its hydrophobic diprenylgroups through the hydrophilic head region of lipids.
3.3. Resistivity Profiles of the Natural Compounds
Resistivity profiles of the drug molecules were calculated from PMF (Figure 6) anddiffusivity profiles (Supplementary Materials: Figure S8) using Equation 4. The calculatedresistivity profiles are shown in Figure 7. The curves of Wi-A, Wi-N and CAPE weresimilar in shape, showing the highest resistance for permeation in the hydrophobic coreof the membrane (Figure 7). The resistance offered by the hydrophobic core of the cancermembrane was less compared to that of the normal membrane for Wi-A, Wi-N and CAPE,indicating higher permeation rates in the cancer membrane. ARC had resistivity peaks atpolar regions of the membrane (Figure 7). ARC had higher resistance in the inner leafletof the normal membrane, where POPS molecules were high in number compared to thatin the cancer membrane. It implied that the presence of POPS head groups increased theresistance for the passage of ARC through polar regions of the membrane.
3.4. Permeability Coefficients of the Natural Compounds
Permeability coefficients (P) of the drug molecules were calculated using the In-homogeneous Solubility Diffusion model (ISD) [35,36]. Table 2 shows the permeabilitycoefficients of Wi-A, Wi-N, CAPE and ARC in cancer and normal membranes. The perme-ability coefficients were compared with the computed octanol–water partition coefficients(XLogP3-AA) of the drug molecules obtained from the Pubchem database [55,56]. Theoctanol–water partition coefficient is a measure of lipophilicity of the molecule. The calcu-lated permeability coefficients were directly correlated with the octanol–water partitioncoefficients obeying Meyer–Overton’s rule [57], confirming the validity of the methodsused in our study (Table 2). The calculated permeability coefficients were in the orderWi-N < Wi-A < CAPE < ARC (Table 2). The lower permeability coefficients of Wi-A andWi-N were anticipated due to their bigger size and the presence of polar groups all overtheir structures. The lower permeability of Wi-N compared to that of its analog Wi-A is inline with the higher IC50 values of Wi-N compared to that of Wi-A, as reported in previ-ous studies (IC50 for Wi-A and Wi-N for most cancer cells is 0.3–0.5 μM and >10–20 μM,respectively) [26,29,30]. The higher permeability coefficients of ARC and CAPE is dueto the presence of hydrophobic diprenyl group and phenethyl group in their structures,respectively. The higher lipophilicity (XLogP3-AA in Table 2) of ARC and CAPE alsoimplies that they undergo higher membrane retention compared to Wi-A and Wi-N. Therelatively extreme negative PMF values of ARC within the membrane core surrounded byPMF peaks at lipid polar regions (Figure 6) implies that more ARC molecules will becometrapped inside the membrane core. This might be an underlying cause of the low efficacyof ARC (IC50 = 275 μM) [58].
92
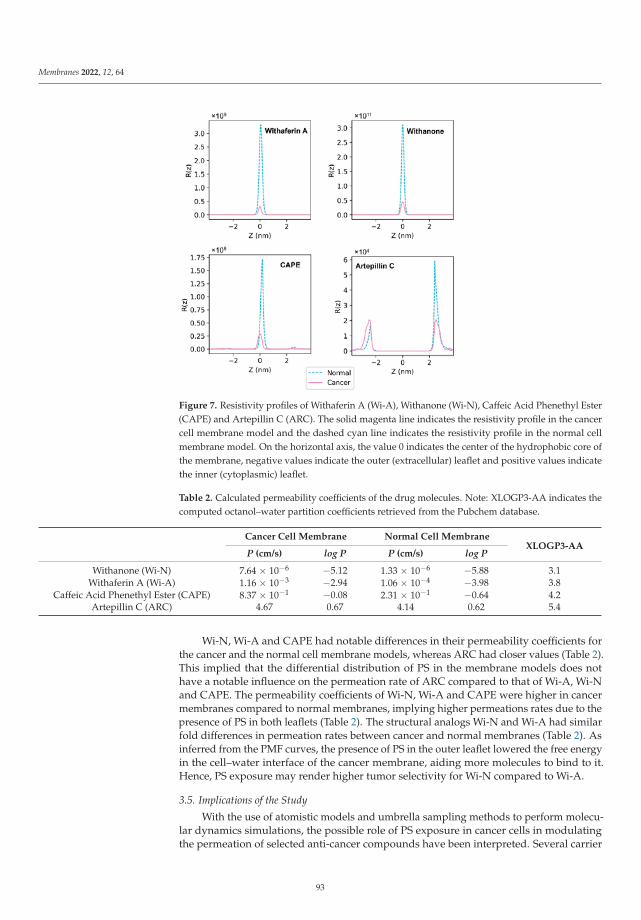
Membranes 2022, 12, 64
Figure 7. Resistivity profiles of Withaferin A (Wi-A), Withanone (Wi-N), Caffeic Acid Phenethyl Ester(CAPE) and Artepillin C (ARC). The solid magenta line indicates the resistivity profile in the cancercell membrane model and the dashed cyan line indicates the resistivity profile in the normal cellmembrane model. On the horizontal axis, the value 0 indicates the center of the hydrophobic core ofthe membrane, negative values indicate the outer (extracellular) leaflet and positive values indicatethe inner (cytoplasmic) leaflet.
Table 2. Calculated permeability coefficients of the drug molecules. Note: XLOGP3-AA indicates thecomputed octanol–water partition coefficients retrieved from the Pubchem database.
Cancer Cell Membrane Normal Cell MembraneXLOGP3-AA
P (cm/s) log P P (cm/s) log P
Withanone (Wi-N) 7.64 × 10⁻⁶ −5.12 1.33 × 10⁻⁶ −5.88 3.1Withaferin A (Wi-A) 1.16 × 10⁻³ −2.94 1.06 × 10⁻⁴ −3.98 3.8
Caffeic Acid Phenethyl Ester (CAPE) 8.37 × 10⁻¹ −0.08 2.31 × 10⁻¹ −0.64 4.2Artepillin C (ARC) 4.67 0.67 4.14 0.62 5.4
Wi-N, Wi-A and CAPE had notable differences in their permeability coefficients forthe cancer and the normal cell membrane models, whereas ARC had closer values (Table 2).This implied that the differential distribution of PS in the membrane models does nothave a notable influence on the permeation rate of ARC compared to that of Wi-A, Wi-Nand CAPE. The permeability coefficients of Wi-N, Wi-A and CAPE were higher in cancermembranes compared to normal membranes, implying higher permeations rates due to thepresence of PS in both leaflets (Table 2). The structural analogs Wi-N and Wi-A had similarfold differences in permeation rates between cancer and normal membranes (Table 2). Asinferred from the PMF curves, the presence of PS in the outer leaflet lowered the free energyin the cell–water interface of the cancer membrane, aiding more molecules to bind to it.Hence, PS exposure may render higher tumor selectivity for Wi-N compared to Wi-A.
3.5. Implications of the Study
With the use of atomistic models and umbrella sampling methods to perform molecu-lar dynamics simulations, the possible role of PS exposure in cancer cells in modulatingthe permeation of selected anti-cancer compounds have been interpreted. Several carrier
93

Membranes 2022, 12, 64
systems using nanoparticles, synthetic polymers, liposomes, peptides and antibodies havebeen reported in the literature for targeted delivery of drugs to cancer cells [59–64]. How-ever, successful clinical translations of such systems are limited. The present study reliedon the fact that studying the molecules, which are inherently selective to cancer cells inaction, will aid in understanding the molecular mechanisms that confer them selectivity.Though there are numerous factors that govern selectivity of a drug towards cancer cells,we have focused only on the effect of PS exposure on modulating membrane permeation.The exposure of PS caused alterations in the free energy landscapes underlying the traversalof the drug molecules through the membrane, thereby influencing the permeation. Themolecular models and methods employed in this study have explained the selectivity ofWi-A, Wi-N and CAPE by differences in PMF landscapes and permeability coefficientsbetween cancer and normal membrane models. In the case of ARC, PS exposure did notseem to have notable effects on the permeation rates. The interesting case is the structuralanalogs Wi-A and Wi-N, whose differential selectivity was explained by differences in freeenergy landscapes underlying membrane permeation. The used models demonstrate thepossible contribution of PS exposure to drug selectivity. Hence, studying the influence ofPS exposure on drug permeation offers, though not complete, a reasonable understandingof tumor selectivity of the drugs.
This study used simplistic molecular models to evaluate the possible contributionof PS exposure to drug selectivity and, hence, the limitations associated with the usedmaterials and methods must be understood. The effect of PS exposure has been explored inthe absence of other diverse types of lipid molecules, which might have led to a reductionin accuracy. The combination effect of different types of lipids and their distributionon the permeability of small molecules will differ from the observed sole effect of PSdistribution in our binary lipid mixture. The models are not completely reflective of thecellular membrane, however, they aided in exploring one specific aspect that contributes tothe differences in permeability between cancer and normal cells. The effect of PS exposureusing complex models containing other major lipids will be explored in the future in lightof the findings from this study. The proportion of charged species of small molecules in thetumor microenvironment and their interaction with the cell membrane also influence thepermeation, and thereby their activity. Here, only the neutral species of the small moleculeswere studied.
4. Conclusions
Permeability of drugs through the cell membrane is crucial for its bioactivity. Inthis study, we have built cancer and normal membrane models based on PS distributionbetween membrane leaflets and assessed the permeation of natural compounds (Wi-A,Wi-N, CAPE and ARC) that have been shown to possess anti-cancer potential. It has beenshown that PS exposure may influence drug permeation and thereby the drug activity. Thecancer cell selectivity of these compounds was clearly evident. This study highlightedthe effect of PS exposure in the cancer cell membrane on selective action of the chosenmolecules. Though the simplistic models based on PS exposure might not be sufficient toexplain the tumor selectivity of all drugs, this study explored a potential niche area, whichmay aid in the development or optimization of drugs that are inherently selective to cancercells in action. With a high number of drugs failing in clinical trial due to lack of selectivity,the molecular differences between cancer and normal cell membranes can be exploited toimprove the selectivity of potent drugs. Similar specialized in silico models of cancer cellmembranes can be easily developed in the future to assess the tumor selectivity of existingdrugs and to screen compound libraries to find cancer selective drugs.
94

Membranes 2022, 12, 64
Supplementary Materials: The following supporting information can be downloaded at: https://www.mdpi.com/article/10.3390/membranes12010064/s1, Figure S1: PMF curves of Withaferin A(Wi-A), Withanone (Wi-N), Caffeic Acid Phenethyl Ester (CAPE) and Artepillin C (ARC) calculatedafter 10, 20, 30 and 40 ns: (A) PMF values in outer (extracellular) leaflet of normal membrane, (B)PMF values in inner (cytoplasmic) leaflet of normal membrane and (C) PMF values in outer leafletof cancer membrane. Figure S2: PMF values of Withaferin A (Wi-A), Withanone (Wi-N), CaffeicAcid Phenethyl Ester (CAPE) and Artepillin C (ARC) before moving average smoothing: Magentamarkers indicates PMF values in the cancer cell membrane model and cyan markers indicate PMFvalues in the normal cell membrane model. ‘0’ in horizontal axis indicates the center hydrophobiccore of the membrane, negative values indicate the outer (extracellular) leaflet, positive valuesindicate the inner (cytoplasmic) leaflet. Error bars show standard deviation. Figure S3: Snapshotsof last frame from umbrella sampling windows showing the converged orientations of WithaferinA (Wi-A) associated with permeation through (A–F) normal and (G–I) cancer membranes: Outer(extracellular) leaflet is shown at the top and inner (cytoplasmic) leaflet is shown at the bottom. (B,E)Orientations corresponding to the lowest points in PMF in the outer and inner leaflets of the normalmembrane model. (H) Orientation corresponding to the lowest points in PMF in the leaflets of thecancer membrane model. Orientations are shown for only one leaflet in cancer membrane, as thecancer membrane model is symmetric. Colors are as per CPK rules. Figure S4: Snapshots of lastframe from umbrella sampling windows showing the converged orientations of Withanone (Wi-N)associated with permeation through (A–F) normal and (G–I) cancer membranes: Outer (extracellular)leaflet is shown at the top and inner (cytoplasmic) leaflet is shown at the bottom. (B,E) Orientationscorresponding to the lowest points in PMF in the outer and inner leaflets of the normal membranemodel. (H) Orientation corresponding to the lowest points in PMF in the leaflets of the cancermembrane model. Orientations are shown for only one leaflet in cancer membrane, as the cancermembrane model is symmetric. Colors are as per CPK rules. Figure S5: Snapshots of last framefrom umbrella sampling windows showing the converged orientations of Caffeic Acid PhenethylEster (CAPE) associated with permeation through (A–F) normal and (G–I) cancer membranes: Outer(extracellular) leaflet is shown at the top and inner (cytoplasmic) leaflet is shown at the bottom.(B,E) Orientations corresponding to the lowest points in PMF in the outer and inner leaflets of thenormal membrane model. (H) Orientation corresponding to the lowest points in PMF in the leafletsof the cancer membrane model. Orientations are shown for only one leaflet in cancer membrane,as the cancer membrane model is symmetric. Colors are as per CPK rules. Figure S6: Snapshotsof last frame from umbrella sampling windows showing the converged orientations of ArtepillinC (ARC) associated with permeation through (A–F) normal and (G–I) cancer membranes: Outer(extracellular) leaflet is shown at the top and inner (cytoplasmic) leaflet is shown at the bottom.(B,E) Orientations corresponding to the lowest points in PMF in the outer and inner leaflets of thenormal membrane model. (H) Orientation corresponding to the lowest points in PMF in the leafletsof the cancer membrane model. Orientations are shown for only one leaflet in cancer membrane,as the cancer membrane model is symmetric. Colors are as per CPK rules. Figure S7: Density ofpolar groups of cancer (magenta) and normal (normal) membranes along the reaction coordinate‘z’. ‘0’ in the horizontal axis indicates the center hydrophobic core of the membrane, negative valuesindicate the outer (extracellular) leaflet, positive values indicate the inner (cytoplasmic) leaflet. FigureS8: Diffusivities of Withaferin A (Wi-A), Withanone (Wi-N), Caffeic Acid Phenethyl Ester (CAPE)and Artepillin C (ARC): Magenta markers indicates diffusivity values in the cancer cell membranemodel and cyan markers indicate diffusivity values in the normal cell membrane model. ‘0’ inhorizontal axis indicates the center hydrophobic core of the membrane, negative values indicate theouter (extracellular) leaflet, positive values indicate the inner (cytoplasmic) leaflet. Error bars showstandard deviation.
Author Contributions: Conceptualization, N.R., S.C.K., R.W. and D.S.; Methodology, N.R. and D.S.;Writing—original draft, N.R.; Writing—review and editing, N.R., S.C.K., R.W. and R.W. All authorshave read and agreed to the published version of the manuscript.
Funding: This study was supported by the funds granted by DBT (India) and AIST (Japan).
Data Availability Statement: The data generated during this study are included in this article.
95

Membranes 2022, 12, 64
Acknowledgments: We acknowledge the High-Performance Computing (HPC) Facility of IIT Delhifor computational resources. NR was awarded the BINC Junior Research Fellowship (JRF), Depart-ment of Biotechnology (DBT), Govt. of India.
Conflicts of Interest: The authors declare no conflict of interest.
References
1. Chari, R.V. Targeted cancer therapy: Conferring specificity to cytotoxic drugs. Acc. Chem. Res. 2008, 41, 98–107. [CrossRef][PubMed]
2. Coates, A.; Abraham, S.; Kaye, S.B.; Sowerbutts, T.; Frewin, C.; Fox, R.; Tattersall, M. On the receiving end—Patient perception ofthe side-effects of cancer chemotherapy. Eur. J. Cancer Clin. Oncol. 1983, 19, 203–208. [CrossRef]
3. Escribá, P.V. Membrane-lipid therapy: A new approach in molecular medicine. Trends Mol. Med. 2006, 12, 34–43. [CrossRef]4. Alves, A.C.; Ribeiro, D.; Nunes, C.; Reis, S. Biophysics in cancer: The relevance of drug-membrane interaction studies. Biochim.
Biophys. Acta (BBA)-Biomembr. 2016, 1858, 2231–2244. [CrossRef] [PubMed]5. Azordegan, N.; Fraser, V.; Le, K.; Hillyer, L.M.; Ma, D.W.; Fischer, G.; Moghadasian, M.H. Carcinogenesis alters fatty acid profile
in breast tissue. Mol. Cell. Biochem. 2013, 374, 223–232. [CrossRef]6. Merchant, T.; Kasimos, J.; De Graaf, P.; Minsky, B.; Gierke, L.; Glonek, T. Phospholipid profiles of human colon cancer using 31 P
magnetic resonance spectroscopy. Int. J. Colorectal Dis. 1991, 6, 121–126. [CrossRef] [PubMed]7. Selkirk, J.K.; Elwood, J.; Morris, H. Study on the proposed role of phospholipid in tumor cell membrane. Cancer Res. 1971, 31,
27–31. [PubMed]8. Hildebrand, J.; Marique, D.; Vanhouche, J. Lipid composition of plasma membranes from human leukemic lymphocytes. J. Lipid
Res. 1975, 16, 195–199. [CrossRef]9. Liebes, L.F.; Pelle, E.; Zucker-Franklin, D.; Silber, R. Comparison of lipid composition and 1, 6-diphenyl-1, 3, 5-hexatriene
fluorescence polarization measurements of hairy cells with monocytes and lymphocytes from normal subjects and patients withchronic lymphocytic leukemia. Cancer Res. 1981, 41, 4050–4056. [PubMed]
10. Baro, L.; Hermoso, J.; Nunez, M.; Jimenez-Rios, J.; Gil, A. Abnormalities in plasma and red blood cell fatty acid profiles of patientswith colorectal cancer. Br. J. Cancer 1998, 77, 1978–1983. [CrossRef]
11. Ran, S.; Downes, A.; Thorpe, P.E. Increased exposure of anionic phospholipids on the surface of tumor blood vessels. Cancer Res.2002, 62, 6132–6140. [PubMed]
12. Ran, S.; Thorpe, P.E. Phosphatidylserine is a marker of tumor vasculature and a potential target for cancer imaging and therapy.Int. J. Radiat. Oncol. Biol. Phys. 2002, 54, 1479–1484. [CrossRef]
13. Stafford, J.H.; Thorpe, P.E. Increased exposure of phosphatidylethanolamine on the surface of tumor vascular endothelium.Neoplasia 2011, 13, 299–308. [CrossRef] [PubMed]
14. Verkleij, A.; Zwaal, R.; Roelofsen, B.; Comfurius, P.; Kastelijn, D.; Van Deenen, L. The asymmetric distribution of phospholipids inthe human red cell membrane. A combined study using phospholipases and freeze-etch electron microscopy. Biochim. Biophys.Acta (BBA)-Biomembr. 1973, 323, 178–193. [CrossRef]
15. Yamaji-Hasegawa, A.; Tsujimoto, M. Asymmetric distribution of phospholipids in biomembranes. Biol. Pharm. Bull. 2006, 29,1547–1553. [CrossRef] [PubMed]
16. Clark, M.R. Flippin’lipids. Nat. Immunol. 2011, 12, 373–375. [CrossRef] [PubMed]17. Gurtovenko, A.A.; Vattulainen, I. Lipid transmembrane asymmetry and intrinsic membrane potential: Two sides of the same coin.
J. Am. Chem. Soc. 2007, 129, 5358–5359. [CrossRef]18. Gurtovenko, A.A.; Vattulainen, I. Membrane potential and electrostatics of phospholipid bilayers with asymmetric transmembrane
distribution of anionic lipids. J. Phys. Chem. B 2008, 112, 4629–4634. [CrossRef]19. Falkovich, S.G.; Martinez-Seara, H.; Nesterenko, A.M.; Vattulainen, I.; Gurtovenko, A.A. What Can We Learn about Cholesterol’s
Transmembrane Distribution Based on Cholesterol-Induced Changes in Membrane Dipole Potential? J. Phys. Chem. Lett. 2016, 7,4585–4590. [CrossRef] [PubMed]
20. López Cascales, J.; Otero, T.; Smith, B.D.; Gonzalez, C.; Marquez, M. Model of an asymmetric DPPC/DPPS membrane: Effect ofasymmetry on the lipid properties. A molecular dynamics simulation study. J. Phys. Chem. B 2006, 110, 2358–2363. [CrossRef]
21. Orsi, M.; Sanderson, W.E.; Essex, J.W. Permeability of small molecules through a lipid bilayer: A multiscale simulation study. J.Phys. Chem. B 2009, 113, 12019–12029. [CrossRef] [PubMed]
22. Thai, N.Q.; Theodorakis, P.E.; Li, M.S. Fast Estimation of the Blood–Brain Barrier Permeability by Pulling a Ligand through aLipid Membrane. J. Chem. Inf. Model. 2020, 60, 3057–3067. [CrossRef] [PubMed]
23. Wadhwa, R.; Yadav, N.S.; Katiyar, S.P.; Yaguchi, T.; Lee, C.; Ahn, H.; Yun, C.-O.; Kaul, S.C.; Sundar, D. Molecular dynamicssimulations and experimental studies reveal differential permeability of withaferin-A and withanone across the model cellmembrane. Sci. Rep. 2021, 11, 1–15. [CrossRef] [PubMed]
24. Dickson, C.J.; Hornak, V.; Bednarczyk, D.; Duca, J.S. Using Membrane Partitioning Simulations to Predict Permeability ofForty-Nine Drug-Like Molecules. J. Chem. Inf. Model. 2019, 59, 236–244. [CrossRef]
96
Membranes 2022, 12, 64
25. Bhargava, P.; Malik, V.; Liu, Y.; Ryu, J.; Kaul, S.C.; Sundar, D.; Wadhwa, R. Molecular insights into withaferin-A-inducedsenescence: Bioinformatics and experimental evidence to the role of NFκB and CARF. J. Gerontol. Ser. A 2019, 74, 183–191.[CrossRef]
26. Sari, A.N.; Bhargava, P.; Dhanjal, J.K.; Putri, J.F.; Radhakrishnan, N.; Shefrin, S.; Ishida, Y.; Terao, K.; Sundar, D.; Kaul, S.C.Combination of withaferin-A and CAPE provides superior anticancer potency: Bioinformatics and experimental evidence to theirmolecular targets and mechanism of action. Cancers 2020, 12, 1160. [CrossRef]
27. Garg, S.; Huifu, H.; Kumari, A.; Sundar, D.; Kaul, S.C.; Wadhwa, R. Induction of senescence in cancer cells by a novel combinationof Cucurbitacin B and withanone: Molecular mechanism and therapeutic potential. J. Gerontol. Ser. A 2020, 75, 1031–1041.[CrossRef] [PubMed]
28. Malik, V.; Kumar, V.; Kaul, S.C.; Wadhwa, R.; Sundar, D. Computational Insights into the Potential of Withaferin-A, Withanoneand Caffeic Acid Phenethyl Ester for Treatment of Aberrant-EGFR Driven Lung Cancers. Biomolecules 2021, 11, 160. [CrossRef][PubMed]
29. Yu, Y.; Katiyar, S.P.; Sundar, D.; Kaul, Z.; Miyako, E.; Zhang, Z.; Kaul, S.C.; Reddel, R.R.; Wadhwa, R. Withaferin-A kills cancer cellswith and without telomerase: Chemical, computational and experimental evidences. Cell Death Dis. 2017, 8, e2755. [CrossRef][PubMed]
30. Gao, R.; Shah, N.; Lee, J.-S.; Katiyar, S.P.; Li, L.; Oh, E.; Sundar, D.; Yun, C.-O.; Wadhwa, R.; Kaul, S.C. Withanone-rich combinationof Ashwagandha withanolides restricts metastasis and angiogenesis through hnRNP-K. Mol. Cancer Ther. 2014, 13, 2930–2940.[CrossRef] [PubMed]
31. Vaishnavi, K.; Saxena, N.; Shah, N.; Singh, R.; Manjunath, K.; Uthayakumar, M.; Kanaujia, S.P.; Kaul, S.C.; Sekar, K.; Wadhwa, R.Differential Activities of the Two Closely Related Withanolides, Withaferin A and Withanone: Bioinformatics and ExperimentalEvidences. PLoS ONE 2012, 7, e44419. [CrossRef]
32. Kimoto, T.; Arai, S.; Kohguchi, M.; Aga, M.; Nomura, Y.; Micallef, M.J.; Kurimoto, M.; Mito, K. Apoptosis and suppression oftumor growth by artepillin C extracted from Brazilian propolis. Cancer Detect. Prev. 1998, 22, 506–515. [CrossRef]
33. Szliszka, E.; Zydowicz, G.; Mizgala, E.; Krol, W. Artepillin C (3,5-diprenyl-4-hydroxycinnamic acid) sensitizes LNCaP prostatecancer cells to TRAIL-induced apoptosis. Int. J. Oncol. 2012, 41, 818–828. [CrossRef] [PubMed]
34. Souza, R.P.; Bonfim-Mendonça, P.S.; Damke, G.M.; de-Assis Carvalho, A.R.; Ratti, B.A.; Dembogurski, D.S.; da-Silva, V.R.;Silva, S.O.; Da-Silva, D.B.; Bruschi, M.L. Artepillin C induces selective oxidative stress and inhibits migration and invasionin a comprehensive panel of human cervical cancer cell lines. Anti-Cancer Agents Med. Chem. 2018, 18, 1750–1760. [CrossRef][PubMed]
35. Diamond, J.M.; Katz, Y. Interpretation of nonelectrolyte partition coefficients between dimyristoyl lecithin and water. J. Membr.Biol. 1974, 17, 121–154. [CrossRef]
36. Marrink, S.-J.; Berendsen, H.J. Simulation of water transport through a lipid membrane. J. Phys. Chem. 1994, 98, 4155–4168.[CrossRef]
37. Torrie, G.M.; Valleau, J.P. Nonphysical sampling distributions in Monte Carlo free-energy estimation: Umbrella sampling. J.Comput. Phys. 1977, 23, 187–199. [CrossRef]
38. Meng, F.; Xu, W. Drug permeability prediction using PMF method. J. Mol. Model. 2013, 19, 991–997. [CrossRef] [PubMed]39. Lee, C.T.; Comer, J.; Herndon, C.; Leung, N.; Pavlova, A.; Swift, R.V.; Tung, C.; Rowley, C.N.; Amaro, R.E.; Chipot, C. Simulation-
based approaches for determining membrane permeability of small compounds. J. Chem. Inf. Model. 2016, 56, 721–733. [CrossRef]40. DeMarco, K.R.; Bekker, S.; Clancy, C.E.; Noskov, S.Y.; Vorobyov, I. Digging into lipid membrane permeation for cardiac ion
channel blocker d-sotalol with all-atom simulations. Front. Pharmacol. 2018, 9, 26. [CrossRef]41. Jo, S.; Kim, T.; Iyer, V.G.; Im, W. CHARMM-GUI: A web-based graphical user interface for CHARMM. J. Comput. Chem. 2008, 29,
1859–1865. [CrossRef]42. Vanommeslaeghe, K.; Hatcher, E.; Acharya, C.; Kundu, S.; Zhong, S.; Shim, J.; Darian, E.; Guvench, O.; Lopes, P.; Vorobyov, I.
CHARMM general force field: A force field for drug-like molecules compatible with the CHARMM all-atom additive biologicalforce fields. J. Comput. Chem. 2010, 31, 671–690. [CrossRef] [PubMed]
43. Berendsen, H.J.; van der Spoel, D.; van Drunen, R. GROMACS: A message-passing parallel molecular dynamics implementation.Comput. Phys. Commun. 1995, 91, 43–56. [CrossRef]
44. Essmann, U.; Perera, L.; Berkowitz, M.L.; Darden, T.; Lee, H.; Pedersen, L.G. A smooth particle mesh Ewald method. J. Chem.Phys. 1995, 103, 8577–8593. [CrossRef]
45. Guixà-González, R.; Rodriguez-Espigares, I.; Ramírez-Anguita, J.M.; Carrió-Gaspar, P.; Martinez-Seara, H.; Giorgino, T.; Selent, J.MEMBPLUGIN: Studying membrane complexity in VMD. Bioinformatics 2014, 30, 1478–1480. [CrossRef]
46. Humphrey, W.; Dalke, A.; Schulten, K. VMD: Visual molecular dynamics. J. Mol. Gr. 1996, 14, 33–38. [CrossRef]47. Barber, C.B.; Dobkin, D.P.; Huhdanpaa, H. The quickhull algorithm for convex hulls. ACM Trans. Math. Softw. (TOMS) 1996, 22,
469–483. [CrossRef]48. Vermeer, L.S.; De Groot, B.L.; Réat, V.; Milon, A.; Czaplicki, J. Acyl chain order parameter profiles in phospholipid bilayers:
Computation from molecular dynamics simulations and comparison with 2 H NMR experiments. Eur. Biophys. J. 2007, 36,919–931. [CrossRef]
49. Hummer, G. Position-dependent diffusion coefficients and free energies from Bayesian analysis of equilibrium and replicamolecular dynamics simulations. New J. Phys. 2005, 7. [CrossRef]
97
Membranes 2022, 12, 64
50. Utsugi, T.; Schroit, A.J.; Connor, J.; Bucana, C.D.; Fidler, I.J. Elevated expression of phosphatidylserine in the outer membraneleaflet of human tumor cells and recognition by activated human blood monocytes. Cancer Res. 1991, 51, 3062–3066.
51. Riedl, S.; Rinner, B.; Asslaber, M.; Schaider, H.; Walzer, S.; Novak, A.; Lohner, K.; Zweytick, D. In search of a novel target—Phosphatidylserine exposed by non-apoptotic tumor cells and metastases of malignancies with poor treatment efficacy. Biochim.Biophys. Acta (BBA)-Biomembr. 2011, 1808, 2638–2645. [CrossRef] [PubMed]
52. Lopes, D.; Jakobtorweihen, S.; Nunes, C.; Sarmento, B.; Reis, S. Shedding light on the puzzle of drug-membrane interactions:Experimental techniques and molecular dynamics simulations. Prog. Lipid Res. 2017, 65, 24–44. [CrossRef]
53. Moradi, S.; Nowroozi, A.; Shahlaei, M. Shedding light on the structural properties of lipid bilayers using molecular dynamicssimulation: A review study. RSC Adv. 2019, 9, 4644–4658. [CrossRef]
54. Klauda, J.B.; Venable, R.M.; Freites, J.A.; O’Connor, J.W.; Tobias, D.J.; Mondragon-Ramirez, C.; Vorobyov, I.; MacKerell, A.D., Jr.;Pastor, R.W. Update of the CHARMM all-atom additive force field for lipids: Validation on six lipid types. J. Phys. Chem. B 2010,114, 7830–7843. [CrossRef]
55. Kim, S.; Thiessen, P.A.; Bolton, E.E.; Chen, J.; Fu, G.; Gindulyte, A.; Han, L.; He, J.; He, S.; Shoemaker, B.A. PubChem substanceand compound databases. Nucleic Acids Res. 2016, 44, D1202–D1213. [CrossRef] [PubMed]
56. Cheng, T.; Zhao, Y.; Li, X.; Lin, F.; Xu, Y.; Zhang, X.; Li, Y.; Wang, R.; Lai, L. Computation of octanol-water partition coefficients byguiding an additive model with knowledge. J. Chem. Inf. Model. 2007, 47, 2140–2148. [CrossRef] [PubMed]
57. Missner, A.; Pohl, P. 110 years of the Meyer–Overton rule: Predicting membrane permeability of gases and other small compounds.ChemPhysChem 2009, 10, 1405–1414. [CrossRef] [PubMed]
58. Bhargava, P.; Grover, A.; Nigam, N.; Kaul, A.; Ishida, Y.; Kakuta, H.; Kaul, S.C.; Terao, K.; Wadhwa, R. Anticancer activity of thesupercritical extract of Brazilian green propolis and its active component, artepillin C: Bioinformatics and experimental analysesof its mechanisms of action. Int. J. Oncol. 2018, 52, 925–932. [CrossRef]
59. Li, J.; Shen, Z.; Ma, X.; Ren, W.; Xiang, L.; Gong, A.; Xia, T.; Guo, J.; Wu, A. Neuropeptide Y Y1 receptors meditate targeteddelivery of anticancer drug with encapsulated nanoparticles to breast cancer cells with high selectivity and its potential for breastcancer therapy. ACS Appl. Mater. Interfaces 2015, 7, 5574–5582. [CrossRef] [PubMed]
60. Zhao, X.B.; Lee, R.J. Tumor-selective targeted delivery of genes and antisense oligodeoxyribonucleotides via the folate receptor.Adv. Drug Deliv. Rev. 2004, 56, 1193–1204. [CrossRef] [PubMed]
61. Mahmoodzadeh, F.; Jannat, B.; Ghorbani, M. Chitosan-based nanomicelle as a novel platform for targeted delivery of methotrexate.Int. J. Biol. Macromol. 2019, 126, 517–524. [CrossRef]
62. Chatzisideri, T.; Leonidis, G.; Sarli, V. Cancer-targeted delivery systems based on peptides. Future Med. Chem. 2018, 10, 2201–2226.[CrossRef] [PubMed]
63. Zhou, X.; Zhang, M.; Yung, B.; Li, H.; Zhou, C.; Lee, L.J.; Lee, R.J. Lactosylated liposomes for targeted delivery of doxorubicin tohepatocellular carcinoma. Int. J. Nanomed. 2012, 7, 5465. [CrossRef]
64. Ayatollahi, S.; Salmasi, Z.; Hashemi, M.; Askarian, S.; Oskuee, R.K.; Abnous, K.; Ramezani, M. Aptamer-targeted delivery ofBcl-xL shRNA using alkyl modified PAMAM dendrimers into lung cancer cells. Int. J. Biochem. Cell Biol. 2017, 92, 210–217.[CrossRef] [PubMed]
98
Citation: Trejo-Soto, C.; Lázaro, G.R.;
Pagonabarraga, I.; Hernández-
Machado, A. Microfluidics Approach
to the Mechanical Properties of Red
Blood Cell Membrane and Their
Effect on Blood Rheology. Membranes
2022, 12, 217. https://doi.org/
10.3390/membranes12020217
Academic Editors: Jordi Marti and
Carles Calero
Received: 15 December 2021
Accepted: 18 January 2022
Published: 13 February 2022
Publisher’s Note: MDPI stays neutral
with regard to jurisdictional claims in
published maps and institutional affil-
iations.
Copyright: © 2022 by the authors.
Licensee MDPI, Basel, Switzerland.
This article is an open access article
distributed under the terms and
conditions of the Creative Commons
Attribution (CC BY) license (https://
creativecommons.org/licenses/by/
4.0/).
membranes
Article
Microfluidics Approach to the Mechanical Properties of RedBlood Cell Membrane and Their Effect on Blood Rheology
Claudia Trejo-Soto 1,*, Guillermo R. Lázaro 2 and Ignacio Pagonabarraga 2,3,4 and Aurora Hernández-Machado 2,5,6
1 Instituto de Física, Pontificia Universidad Católica de Valparaiso, Casilla 4059, Chile2 Departament de Física de la Materia Condensada, Universitat de Barcelona, Av. Diagonal 645,
08028 Barcelona, Spain; [email protected] (G.R.L.); [email protected] (I.P.);[email protected] (A.H.-M.)
3 CECAM, Centre Europeén de Calcul Atomique et Moleéculaire, École Polytechnique Feédeérale de Lausanne(EPFL), Batochime—Avenue Forel 2, 1015 Lausanne, Switzerland
4 Universitat de Barcelona Institute of Complex Systems (UBICS), Universitat de Barcelona,08028 Barcelona, Spain
5 Centre de Recerca Matemàtica, Edifici C, Campus de Bellaterra, 08193 Barcelona, Spain6 Institute of Nanoscience and Nanotechnology (IN2UB), University of Barcelona, 08028 Barcelona, Spain* Correspondence: [email protected]
Abstract: In this article, we describe the general features of red blood cell membranes and their effecton blood flow and blood rheology. We first present a basic description of membranes and moveforward to red blood cell membranes’ characteristics and modeling. We later review the specificproperties of red blood cells, presenting recent numerical and experimental microfluidics studiesthat elucidate the effect of the elastic properties of the red blood cell membrane on blood flow andhemorheology. Finally, we describe specific hemorheological pathologies directly related to themechanical properties of red blood cells and their effect on microcirculation, reviewing microfluidicapplications for the diagnosis and treatment of these diseases.
Keywords: membrane elasticity; red blood cells; hemodynamics; hemorheology; microfluidics
1. Introduction
The membrane is a fundamental structure in all living organisms, as it defines thecell as an entity. It separates the external environment from the cell’s inner region, whichcontains all the organelles and molecular machinery. The elastic behavior of more complexmembranes, such as those present in mammalian cells, is still subject to lively debate inthe literature. In this context, most research has focused on the study of human red bloodcells as a mechanical model system [1,2], due to its structural simplicity and the lack of anucleus and any internal structure.
From a theoretical point of view, our knowledge about membranes’ molecular compo-sitions and functioning has continuously increased from the pioneer biological model ofthe fluid mosaic by Singer and Nicolson [3]. In the last 40 years, membranes have also beenstudied by physicists, providing a complementary picture about membrane behavior andthe properties of vesicles and cells. The subject was first approached by Canham in 1970 [4]and then by Helfrich in 1973 [5,6], and based on their models an outstanding number ofmembrane phenomena have been understood and explained from a physical perspective.Additionally, in spite of membranes’ intrinsic complexity, physical models have explaineda high number of phenomena observed experimentally, inviting an extensive theoreticalexploration of biological membranes.
Erythrocytes or red blood cells (RBCs hereafter) present a remarkable capability todeform and pass through very thin capillaries, and in microcirculation they acquire strangeshapes, the benefits of which are still unknown; see the article of G. Tomaiuolo 2009 [7].
Membranes 2022, 12, 217. https://doi.org/10.3390/membranes12020217 https://www.mdpi.com/journal/membranes99

Membranes 2022, 12, 217
The dynamics of RBCs in shear flow have been studied and an unsteady tumbling solid-like motion has been observed when cells are suspended in plasma [8]. Additionally,at high shear stress they exhibit a drop-like tank-treading motion characterized by a steadyorientation and membrane rotation about the internal fluid [9–11]. They also develop anumber of different morphologies if their membranes are altered or damaged, as knownfrom a number of anemias, malaria, or during blood storage [12]. The delicate membraneequilibrium at the molecular scale ultimately affects the mechanisms taking place at a muchlarger scale, such as cell shape and blood properties.
Initially, RBCs were studied from a numerical point of view, considering confinedgeometries to simulate the circulatory system conditions. In the present decade, the devel-opments in microfluidics technologies have contributed significantly to the experimentalstudy of RBCs’ membrane properties [13] and the rheological properties of blood and itsrelation to the RBCs [14,15]. The combination of biological studies with microfluidics hasbeen fundamental in the biomedical research of the biomechanical properties of the RBCsin health and disease [16] and the development of new Point of Care Diagnostics (PoCD)techniques using blood [17–19].
Considering that the blood is the most important fluid in our body and that bloodcirculation plays a fundamental role in maintaining an appropriate environment in thebody’s tissues, ensuring the optimal functioning of cells, understanding the flow propertiesof blood is crucial. These properties depend on the composition of blood and the particularproperties of its constituents. The blood is known to be a complex mixture of blood plasmaand blood cells. It presents a non-Newtonian behavior, even if blood plasma behaves asa Newtonian fluid by itself. The study of blood flow can be approached from two pointsof view: we can study the fluid dynamics of the blood flow as a continuous fluid with itsconstitutive equations or we can study the flow properties and rheology of blood and itscomponents’ contributions, from single cells to their collective behavior.
This review is dedicated to describing the general features of RBC membranes andtheir effect on blood flow, using numerical and experimental studies based on microfluidicstechnologies. Section 2 is dedicated to describing the composition of the cell membrane inorder to understand its constitution. In Section 3, we discuss current numerical modelingtechniques of RBC membranes. In Section 4, we review the composition of blood, and themechanical properties of RBCs. Here, we define how these properties affect the behavior ofblood and its consequences. In Section 5, we refer to the past and current studies of thecharacteristics of RBCs and blood flow at the microscale and their effect on blood rheologyfrom a single cell to the collective behavior. Finally, Section 6 is dedicated to describing ourinterest in hemorheology, exposing its high importance in the diagnosis of diseases relatedto blood viscosity and the properties of RBC membranes, focusing on novel microfluidicsapplications for diagnosis and treatment.
2. Cell Membranes
Cell membranes represent an essential element in the development of living organisms.They constitute the cells’ boundaries, separating the interior of the cell from the externalenvironment. Membranes enclose the organelles and components that together formthe basic units of life. However, membrane functionality is not limited to its simplestructural role, but membranes are also responsible for the interactions of the cell withneighboring cells. These interactions are mediated by a certain type of transmembraneproteins that coordinate the cell signaling, enabling the cell’s response to environmentalpressures. Additionally, membranes maintain ion gradients which allow the synthesisof ATP, the basic energetic molecule [20]. The plasma membrane is the most importantmembrane of the cell, but other types of membranes are present in organelles such as thenucleus, the Golgi apparatus, the endoplasmic reticulum and the mitochondria. All themembranes of the cell constitute around 30% of the total protein activity [21].
All biological membranes share a common structure and composition in spite of beingpart of different entities, and regardless of their function. Membranes are composed of
100

Membranes 2022, 12, 217
different lipid molecules that assemble to form bilayers. Lipid bilayers are selectivelypermeable to the exchange of polar molecules and host a high density of transmembraneproteins, which essentially define the specific membrane functionality. Lipids are bound byrelatively weak, non-covalent interactions that allow a rapid lateral interchange of positions,leading to a significant surface diffusion over the membrane plane, D ≈ 10−12 m2/s,refs. [12,22]. The lipids practically behave as a fluid in the bilayer plane, a propertywith important implications for the cell activity. The membrane is connected with theinner cytoskeleton, a three-dimensional mesh formed by actin filaments which providescompactness and structural ordering, and determines the cell shape, which in turn dependson the type of cell and its function. In some cells, an exterior cytoskeleton also exists,and it connects with neighboring cells in order to facilitate a coordinate response of thetissue. The membrane equilibrium is controlled by a number of active processes, includinga flip-flop rearrangement of the different lipid species of the bilayer, remodeling of thecytoskeleton, or the balance of lipid densities during vesiculation processes (e.g., duringendo- and exocytosis), which are able to occur due to the existence of lipid reservoirs in theinterior of the cell.
Lipids represent up to 50% of the total mass of the membrane in mammalian cells [23,24].They are amphiphilic molecules with a polar head (which prefers to contact and interactwith other polar molecules, such as water) and a tail formed by two hydrocarbon chainswhich present a strong hydrophobicity, and therefore the tails avoid the interacting withwater. If lipids are immersed in water, they tend to self-assemble to avoid the hydrophobicinteractions with the surrounding water. Two basic structures can be formed by these aggre-gates. Sometimes they assemble to form micelles, a closed structure, with all the tails in theinner, free-water region, and the lipid heads oriented to the exterior, in contact with water.Another possibility is the formation of bilayers and vesicles, when two lipid monolayersfold in opposite directions, so that the heads form two parallel sheets whereas the tails aretrapped in the intermediate region, without contact with the aqueous environment, seeFigure 1. Lipids rearrange to avoid the presence of edges, forming closed surfaces in whichthe water is at both the inner and outer regions, but there is no direct interaction with thetails. The strong hydrophobicity causes these closed structures to be much energeticallyfavorable, thus ensuring large stability under thermal fluctuations and other mechanicaldisruptions [23].
Figure 1. Different aggregates formed by lipids: micelle, bilayer, and closed bilayer, forming a vesicle.The preference of the lipids to aggregate in one structure or another is determined by the shape of thelipid; phospholipids form bilayers. Credits: Mariana Ruiz Villareal available under Public Domain.
A eukaryotic cell is typically composed of 500–1000 different species of lipids; however,the major components reduce to the phospholipids, which are asymmetrically distributedin the bilayers. A discussion on the polymorphism of lipids can found in the work of Cullis
101
Membranes 2022, 12, 217
(1986) [25]. In addition to the phospholipids, animal cell membranes also contain cholesteroland glycolipids. Cholesterol is a small molecule with a polar hydroxyl group and a shorthydrocarbon chain. Cholesterol occupies the space between phospholipid tails in the innerregion of the bilayer, with its head oriented close to the phospholipid head. Mammaliancell membranes are rich in cholesterol, which plays an important role in the control ofbilayer fluidity, and it also affects the membrane rigidity when present at abnormally highdensities [26,27]. Another important constituent of the cell membrane is transmembraneproteins, responsible for the main processes that take place in the membrane, and thereforethey define the membrane functionality. Depending on the membrane, proteins represent25–75% of the total mass of the membrane. Since proteins are much larger than lipids,this concentration corresponds to a protein per ≈50–100 lipids. Transmembrane proteinsare also amphiphilic and orient their polar groups to the aqueous environment (cytosoland exterior of the cell), whereas the hydrophobic groups interact with the lipid tails.The bilayers of mammalian cells are complex structures with a bewildering number ofproteins working on and through them. They have a typical thickness of 4 nm, while mosteukaryotic cells are ≈5 μm–8 μm in length. Thus, the membrane thickness is three ordersof magnitude smaller than the overall cell length. Although the bilayer is usually fluid, thisproperty presents a strong dependence on the temperature and lipid composition [28].
Most cells have a complex mesh formed by actin filaments that occupies most of theinner cytosolic volume and connects the different organelles and microstructures of the cell.This structural element provides mechanical strength to the cell and it often participatesin determining the cell shape and cell mobility. This structure, known as a cortical cy-toskeleton, is connected with the membrane in order to coordinate the response to externalperturbations [29]. The cells also contains a much simpler cytoskeletal structure, the so-called membrane cytoskeleton, which lies underneath the lipid bilayer. The membranecytoskeleton has a structural functionality, providing strength and preventing from certainshape deformations, such as vesiculation or the pinching-off of the bilayer. The membranecytoskeleton is a two-dimensional spectrin network anchored to the inner (cytosolic) mono-layer of the plasma bilayer of certain cells [30], such as human erythrocytes. The presenceof ATP is crucial for maintaining the cytoskeleton properties, and when this molecule isdepleted, the cell experiences drastic shape changes. Although this phenomenon is notcompletely understood, the fluid gel hypothesis assumes that the network is subjected tocontinuous remodeling, which allows the relaxation of cytoskeleton tensions [31]. Hence,when active processes cease, the cytoskeleton loses its fluidic behavior and stiffens.
Eukaryotic cells present an extensive variety of shapes, as an adaptation to theirspecific function and location within the different tissues. The cortical cytoskeleton and theplasma membrane are the two main elements responsible for the cell shape and mechanicalresponse. Still, the different organelles occupy an important portion of the cell volume,and their presence implies that the cell must accommodate them. Hence, while studyingthe mechanical properties of the cell, it is difficult to discern between the different effects,obscuring the understanding of the specific properties of the membrane. Taking intoaccount this problem, the RBC represents an interesting case. Mammalian RBCs lacka nucleus and any internal structure, so that their unique components are the plasmamembrane with its underlying cytoskeleton [32]. Accordingly, the shape of the RBC can bedirectly understood as the result of its membrane properties. The RBC is therefore studiedas a model system in order to understand plasma membrane properties and, indeed, manyof the studies that have elucidated key insights on membrane biology focused on RBCs.Nevertheless, RBCs are interesting not only as a model system but also due to their crucialrole in our lives, as they are the main component of blood and the unique carriers of oxygen.
3. Cell Membrane Modeling
To develop a physical approach to membrane modeling, the use of mesoscopic theo-ries is beneficial. Considering the membrane as locally homogeneous and introducing acontinuum description, each small part of the membrane is characterized by some certain
102
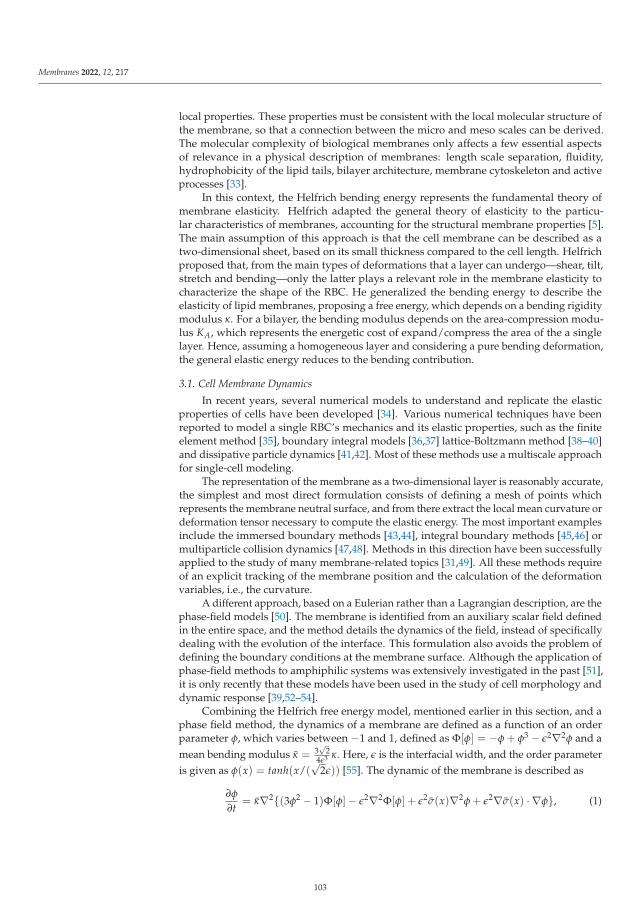
Membranes 2022, 12, 217
local properties. These properties must be consistent with the local molecular structure ofthe membrane, so that a connection between the micro and meso scales can be derived.The molecular complexity of biological membranes only affects a few essential aspectsof relevance in a physical description of membranes: length scale separation, fluidity,hydrophobicity of the lipid tails, bilayer architecture, membrane cytoskeleton and activeprocesses [33].
In this context, the Helfrich bending energy represents the fundamental theory ofmembrane elasticity. Helfrich adapted the general theory of elasticity to the particu-lar characteristics of membranes, accounting for the structural membrane properties [5].The main assumption of this approach is that the cell membrane can be described as atwo-dimensional sheet, based on its small thickness compared to the cell length. Helfrichproposed that, from the main types of deformations that a layer can undergo—shear, tilt,stretch and bending—only the latter plays a relevant role in the membrane elasticity tocharacterize the shape of the RBC. He generalized the bending energy to describe theelasticity of lipid membranes, proposing a free energy, which depends on a bending rigiditymodulus κ. For a bilayer, the bending modulus depends on the area-compression modu-lus KA, which represents the energetic cost of expand/compress the area of the a singlelayer. Hence, assuming a homogeneous layer and considering a pure bending deformation,the general elastic energy reduces to the bending contribution.
3.1. Cell Membrane Dynamics
In recent years, several numerical models to understand and replicate the elasticproperties of cells have been developed [34]. Various numerical techniques have beenreported to model a single RBC’s mechanics and its elastic properties, such as the finiteelement method [35], boundary integral models [36,37] lattice-Boltzmann method [38–40]and dissipative particle dynamics [41,42]. Most of these methods use a multiscale approachfor single-cell modeling.
The representation of the membrane as a two-dimensional layer is reasonably accurate,the simplest and most direct formulation consists of defining a mesh of points whichrepresents the membrane neutral surface, and from there extract the local mean curvature ordeformation tensor necessary to compute the elastic energy. The most important examplesinclude the immersed boundary methods [43,44], integral boundary methods [45,46] ormultiparticle collision dynamics [47,48]. Methods in this direction have been successfullyapplied to the study of many membrane-related topics [31,49]. All these methods requireof an explicit tracking of the membrane position and the calculation of the deformationvariables, i.e., the curvature.
A different approach, based on a Eulerian rather than a Lagrangian description, are thephase-field models [50]. The membrane is identified from an auxiliary scalar field definedin the entire space, and the method details the dynamics of the field, instead of specificallydealing with the evolution of the interface. This formulation also avoids the problem ofdefining the boundary conditions at the membrane surface. Although the application ofphase-field methods to amphiphilic systems was extensively investigated in the past [51],it is only recently that these models have been used in the study of cell morphology anddynamic response [39,52–54].
Combining the Helfrich free energy model, mentioned earlier in this section, and aphase field method, the dynamics of a membrane are defined as a function of an orderparameter φ, which varies between −1 and 1, defined as Φ[φ] = −φ + φ3 − ε2∇2φ and amean bending modulus κ = 3
√2
4ε3 κ. Here, ε is the interfacial width, and the order parameteris given as φ(x) = tanh(x/(
√2ε)) [55]. The dynamic of the membrane is described as
∂φ
∂t= κ∇2{(3φ2 − 1)Φ[φ]− ε2∇2Φ[φ] + ε2σ(x)∇2φ + ε2∇σ(x) · ∇φ}, (1)
103

Membranes 2022, 12, 217
where the term μmem = (3φ2 − 1)Φ[φ]− ε2∇2Φ[φ] + ε2σ(x)∇2φ represents the chemicalpotential of the membrane. The parameter σ is the mean surface tension of the membranedefined as σ(x) =
√2
6ε3κσ(x).
3.2. Membrane Dynamics and Hydrodynamic Coupling
The dynamics of the membrane are dictated by Equation (1), but, in many systems,the hydrodynamic effects of the aqueous environment are also crucial in the membraneevolution. A typical example is the study of lipid vesicles in shear flow [56,57], whichserves as a model system for RBCs while flowing along capillaries forced by an externalflow. To model the interaction of the membrane with the surrounding fluid, the Navier–Stokes equation is frequently used to describe the dynamics of the fluid, and both equationsare coupled describing the membrane–fluid interaction. The complete Navier–Stokesphase-field model (NS-PF) [58,59] is
∂φ
∂t+ v · ∇φ = M∇2μmem, (2)
ρ
[∂v
∂t+ (v · ∇v)
]= −∇P − φ∇μmem + η∇2v + fext, (3)
where φ is the order parameter, v is the velocity of the fluid, μmem is the chemical potentialof the membrane, ρ is the density of the suspension, P is the pressure exerted on the fluidand fext are the external forces applied to the fluid.
From the perspective of RBC elasticity, the membrane mechanics are often character-ized with the bending and shear modulii. The minimization of the Helfrich free energyfor an ellipsoidic shape under the appropriate values of area and volume leads to thebiconcave discocyte of the RBC as the equilibrium shape. Nevertheless, to obtain an accu-rate model of RBC membranes, the cytoskeleton’s elastic properties must be considered.The cytoskeleton presents a low resistance to bend, with a bending modulus at least twoorders of magnitude lower than that of the bilayer. It does present, however, resistance toshear and compression in the membrane layer, and it is known to play a fundamental rolein inhibiting budding and vesiculation processes. Different models have been formulatedto model the cytoskeleton’s elasticity. A simple way is to represent it as a spring mesh,relating the spring constant with the elastic modulii. A different approach is to recover thecontinuum mechanics description and consider the finite strain theory [60].
The elastic properties of the RBC membrane are highly dependent on the specificbilayer lipid composition, ATP concentration, age of the cell, and temperature. They arealso known to vary with the morphological state of the cell, and echinocytes or spherocytesare considerably more rigid than discocytes. The bending rigidity has been measured bydifferent experimental techniques [61], such as, micropipette [1], AFM [62] and opticaltweezers [63]. Typical values fall between 10 and 50 kBT, with slight deviations dependingon the specific technique. The shear modulus of the bilayer is negligible due to its fluidicnature in the membrane plane, given that any shear stress is instantaneously relaxed by therapid lateral rearrangement of lipids.
With the improvement of miniaturization techniques and methods in the past 20 years,microfluidics has become a fundamental aspect for studying the elastic and mechanicalproperties of the RBCs from an experimental point of view. As a result, several studies havebeen successful in relating theoretical and numerical analyses with experiments [7,64,65].
4. Human Red Blood Cells and Blood Components
4.1. Human Red Blood Cells
Mammalian RBCs have different shapes and sizes, depending on the animal’s physio-logical requirements (e.g., oxygen consumption in animals inhabiting high-altitude moun-tains). Human RBCs have a disk shape with a typical diameter of 8μm, with a concaveregion in the center where the cell achieves its minimum thickness of 1μm, and a convex
104

Membranes 2022, 12, 217
outer rim where it reaches a maximum thickness of 2μm; see Figure 2. This particular shapeis usually known as the biconcave discocyte, and it corresponds to the healthy state of thecell. The typical cell area and volume of a healthy individual are 140μm2 and 90μm3 [66],respectively. Cells present specific regulatory systems to maintain their area and volumeconstant, thus ensuring that their resting shape is fixed.
In humans, RBCs exhibit a huge intraindividual variability, with strong correlationwith sex and age. Cells of men are up to 20% larger than in women, and men also presenthigher hematocrit in the circulatory system. Aging affects to the RBC membrane rigidity, sothat old individuals present more rigid cells. The biconcave discocyte, however, representsjust one of the many morphologies exhibited by RBCs, and it responds to a very specificconditions of area-to-volume ratio, bilayer and cytoskeleton elastic properties, membraneinternal asymmetry and pH of the surrounding aqueous environment, among others. Otherwell-known morphologies are the stomatocyte, when the cell acquires a cup-like shape,and the echynocyte, when the cell becomes spherical and it develops many spikes aroundits contour. The entire shape deformation comprises a sequence of different morphologiesusually known as stomato-discoechynocyte [67], and it is triggered by the disruption of themembrane microstructure which changes the membrane asymmetry.
Figure 2. Photograph of RBCs. In this picture, the biconcave disc shape of RBCs is observed. The RBCsare from a healthy 18-year-old male and were imaged on a SEM microscope as quickly as possible sothe blood cells did not shrink and distort. The image has been digitally modified to add the red colortypical of RBCs. Credits: Annie Cavanagh available under Creative Commons by-nc-nd 4.0 fromhttp://wellcomeimages.org/, accessed on 30 January 2020.
The origins of the peculiar discocyte shape have been subject to debate for decades.It seems reasonable that the large cell area compared to volume (compared to that of asphere, the so-called reduced volume vred = V/(4πR2/3) = 0.6, where R =
√A/(4π) is
the radius of a sphere with equal area to the cell; thus, for a sphere, vred = 1), responds tothe necessity of optimizing the diffusion of oxygen across the membrane. Alternatively,it has been proposed that the disk has a low inertial momentum, so that it does notrotate when flowing in the main arteries, minimizing the formation of turbulent flows [68].Another hypothesis postulates that the discocyte is an appropriate shape to undergo strongdeformations and pass through the smallest capillaries, after recovering the normal relaxedshape [69].
Three fundamental effects, derived from the characteristic geometry of RBCs, affectblood flow: (1) The geometry gives them the capacity to align with the direction of flow.(2) The cellular membrane of a healthy RBC is flexible, which means that it can changeits shape and deform under different flow conditions. (3) RBCs’ shape facilitates their
105
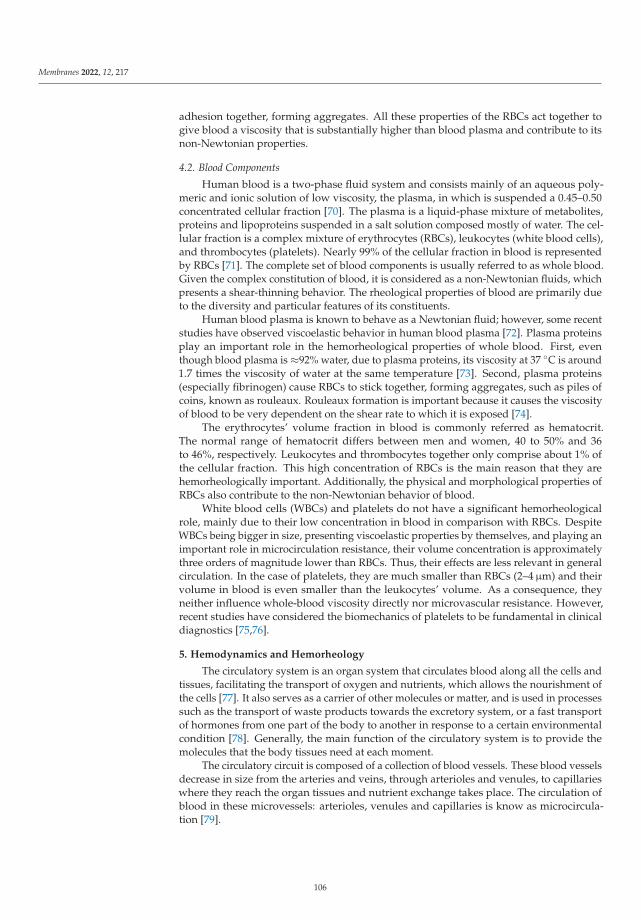
Membranes 2022, 12, 217
adhesion together, forming aggregates. All these properties of the RBCs act together togive blood a viscosity that is substantially higher than blood plasma and contribute to itsnon-Newtonian properties.
4.2. Blood Components
Human blood is a two-phase fluid system and consists mainly of an aqueous poly-meric and ionic solution of low viscosity, the plasma, in which is suspended a 0.45–0.50concentrated cellular fraction [70]. The plasma is a liquid-phase mixture of metabolites,proteins and lipoproteins suspended in a salt solution composed mostly of water. The cel-lular fraction is a complex mixture of erythrocytes (RBCs), leukocytes (white blood cells),and thrombocytes (platelets). Nearly 99% of the cellular fraction in blood is representedby RBCs [71]. The complete set of blood components is usually referred to as whole blood.Given the complex constitution of blood, it is considered as a non-Newtonian fluids, whichpresents a shear-thinning behavior. The rheological properties of blood are primarily dueto the diversity and particular features of its constituents.
Human blood plasma is known to behave as a Newtonian fluid; however, some recentstudies have observed viscoelastic behavior in human blood plasma [72]. Plasma proteinsplay an important role in the hemorheological properties of whole blood. First, eventhough blood plasma is ≈92% water, due to plasma proteins, its viscosity at 37 ◦C is around1.7 times the viscosity of water at the same temperature [73]. Second, plasma proteins(especially fibrinogen) cause RBCs to stick together, forming aggregates, such as piles ofcoins, known as rouleaux. Rouleaux formation is important because it causes the viscosityof blood to be very dependent on the shear rate to which it is exposed [74].
The erythrocytes’ volume fraction in blood is commonly referred as hematocrit.The normal range of hematocrit differs between men and women, 40 to 50% and 36to 46%, respectively. Leukocytes and thrombocytes together only comprise about 1% ofthe cellular fraction. This high concentration of RBCs is the main reason that they arehemorheologically important. Additionally, the physical and morphological properties ofRBCs also contribute to the non-Newtonian behavior of blood.
White blood cells (WBCs) and platelets do not have a significant hemorheologicalrole, mainly due to their low concentration in blood in comparison with RBCs. DespiteWBCs being bigger in size, presenting viscoelastic properties by themselves, and playing animportant role in microcirculation resistance, their volume concentration is approximatelythree orders of magnitude lower than RBCs. Thus, their effects are less relevant in generalcirculation. In the case of platelets, they are much smaller than RBCs (2–4μm) and theirvolume in blood is even smaller than the leukocytes’ volume. As a consequence, theyneither influence whole-blood viscosity directly nor microvascular resistance. However,recent studies have considered the biomechanics of platelets to be fundamental in clinicaldiagnostics [75,76].
5. Hemodynamics and Hemorheology
The circulatory system is an organ system that circulates blood along all the cells andtissues, facilitating the transport of oxygen and nutrients, which allows the nourishment ofthe cells [77]. It also serves as a carrier of other molecules or matter, and is used in processessuch as the transport of waste products towards the excretory system, or a fast transportof hormones from one part of the body to another in response to a certain environmentalcondition [78]. Generally, the main function of the circulatory system is to provide themolecules that the body tissues need at each moment.
The circulatory circuit is composed of a collection of blood vessels. These blood vesselsdecrease in size from the arteries and veins, through arterioles and venules, to capillarieswhere they reach the organ tissues and nutrient exchange takes place. The circulation ofblood in these microvessels: arterioles, venules and capillaries is know as microcircula-tion [79].
106
Membranes 2022, 12, 217
Blood circulates constantly around the body, and therefore the study of blood flow andits rheological properties is crucial to understand the processes underlying microcirculation.Moreover, several studies have demonstrated that the alteration of hemodynamics andhemorheology is associated with various diseases that affect the normal circulation ofblood [16,80–82]. In this section, we will review the general features of hemodynamics andhemorheology, and the contribution of recent numerical and experimental microfluidictechniques, to study the hemodynamical and hemorheological properties of blood from asingle-cell effect to their collective behavior.
5.1. Hemodynamics and Hemorheology for a Single Cell
Hemodynamics is the area of biophysics and physiology that studies the fluid dynam-ics of blood flow inside the different structures of the circulatory system: arteries, veins,arterioles, venules and capillaries. Blood flow in the human body is affected by severalfactors, such as the driving pressure of the flow, the flow characteristics of blood andthe geometric structure and mechanical properties of blood vessels [83]. Hemodynamicsresearch has a long history and is an attractive topic, with several theoretical, experimentaland computational studies having been developed in the past 50 years [84–88]. The fieldcontinues to expand due to recent advancements in numerical and experimental techniquesat the microscale. These new techniques have enabled the prediction and observationof blood flow in vitro, emulating in vivo conditions. The combination of computationalhydrodynamics and microfluidics have become key elements to approximating the bloodflow in the microcirculatory system.
Blood circulates the human body pumped by the heart, which generates a pressuredifference in the system. As the blood flows through the circulatory system, the pressurefalls progressively by the time it reaches the termination of the venae cavae where theyempty into the right atrium of the heart [78]. The heart pumping is pulsatile, and thereforethe arterial pressure alternates between a systolic pressure level and a diastolic pressurelevel. This pressure difference allows blood to flow through the different blood vessels inour body, enabling microcirculation.
Microcirculation flow is characterized by a low Reynolds number Re = ηvDρ < 1,
where v is the velocity of the flow, D is the diameter of the microvessel, η is the dynamicviscosity of the fluid and ρ is the fluid density. The Reynolds number is defined as theratio between the inertial and viscous forces, and in the microvessels it ranges between0.001 < Re < 0.1. Hence, the viscous effects are more significant than the inertial effects,and the flow is laminar. In microvessels over 200μm diameter, it can be assumed that bloodis a homogeneous continuous fluid. This assumption is not true for smaller microvesselsand here the individual motion of RBCs becomes important. When small objects, suchas droplets or cell, enter a microchannel, the hydraulic resistance along the channel isgiven as the addition of the resistance of the channel in the absence of the particle and theresistance developed across the length of the object. The resistance of the object will dependon the local characteristics of the flow and the viscoelastic properties of the object [89].
To measure the factors that affect hemodynamics, several numerical and experimentaltechniques are used, such as dielectrophoresis, magnetic interaction, optical traps andbiomarkers [14]. Using these techniques, researchers have been able to study blood flowbehavior from a single RBC to their collective behavior and blood as a homogeneous fluid.When studying blood flow in confined geometries for a single cells, the effect of the systemwalls are relevant, enabling RBCs to form a single train at the center of the microchannel.However, when studying the collective behavior of RBCs, a focusing phenomenon arisedue to the presence of walls and cells to cells interactions. The effects of focusing, or RBCmigration, affects the rheological properties of blood, affecting its viscosity and thereforethe blood flow.
From a numerical point of view, several techniques have been reported to model RBCsin blood flow [90–94]. Most of these methods have in common a multiscale approachfor single-cell modeling in confined geometries. Confinement is crucial to exploring the
107

Membranes 2022, 12, 217
RBCs’ elasticity effect in microcirculation, since it replicates the in vivo conditions ofblood circulation.
To model the interaction between RBC membrane elasticity and flow, a dimensionlessquantity, Cκ (usually referred to as capillary number) is defined as the ratio between theelastic relaxation time, τm, of the membrane of cells suspended in the fluid, and a viscoustime τη associated with the viscous forces of the fluid [58,59]
Cκ =τκ
τη=
η0vzd2
κ
(db
), (4)
where vz is the mean velocity in the direction of the flow, η0 is the viscosity of the sur-rounding fluid, d is the diameter of the RBC d ≈ 8 μm, b is a geometrical parameter whichaccounts for the confinement and κ is the bending modulus. For human RBCs, the typicalvalues of the bending modulus are κ ≈ 50kBT = 2 × 10⁻¹⁹ J. The ratio d/b is a parameterthat relates the RBC size to the size of the system to establish the confinement. The dy-namics of the cell membrane are controlled by the viscosity ratio between the inner andouter regions of the cell, and the capillary number which characterizes the shear rate of theforce relative to the membrane rigidity. The effective (or apparent) viscosity of the wholesuspension (i.e., liquid and cells) is computed from the relation of the applied force, f0,and the outcome flow given by the mean velocity vz,
ηe f f =f0
12vzb2. (5)
Figure 3 shows three different RBC morphologies in a Poiseuille flow, modeled usingthe Navier–Stokes phase field models discussed in Section 3, as a function of the capillarynumber [58,59]. The effects of the hydrodynamics on the viscosity of the solution is shownin Figure 4.
Figure 3. Red blood cell morphologies in a Poiseuille flow, modelled through Equations (4) and (5)for an increasing capillary number, Cκ . The letters associated to the red blood cells represent differentstages of the cell morphology. The parameter used to model the RBC was a reduced volumevred = 0.48 and a confinement d/b = 0.71, defined as the ratio between the RBC size and the systemsize. The colored regions represent the three main morphological regimes, namely the discocyte(yellow), the slipper (red), and the parachute (blue). The dotted line represents the channel axis,and the crosses are the center of mass of each RBC. Image reproduced from Lázaro et al. (2014) [58].
From an experimental point of view, early hemodynamical experiments only provideda qualitative understanding of blood flow. Quantitative information, such as rheologicaleffects and blood cell deformability were difficult to obtain due to lack of time and spatialresolution. Eventually, high-speed and high-resolution cameras, with an enhanced sen-sitivity and mounted to an optical microscope, enabled velocity measurements of suchsmall-scale flows. In this aspect, several techniques have been developed to measurethe velocity fields of blood and RBCs at the microscale, such as μPIV (microparticles im-age velocimetry) or PTV (particle tracking velocimetry) and wavelet-based optical flowvelocimetry (wOFV) [95–99].
108
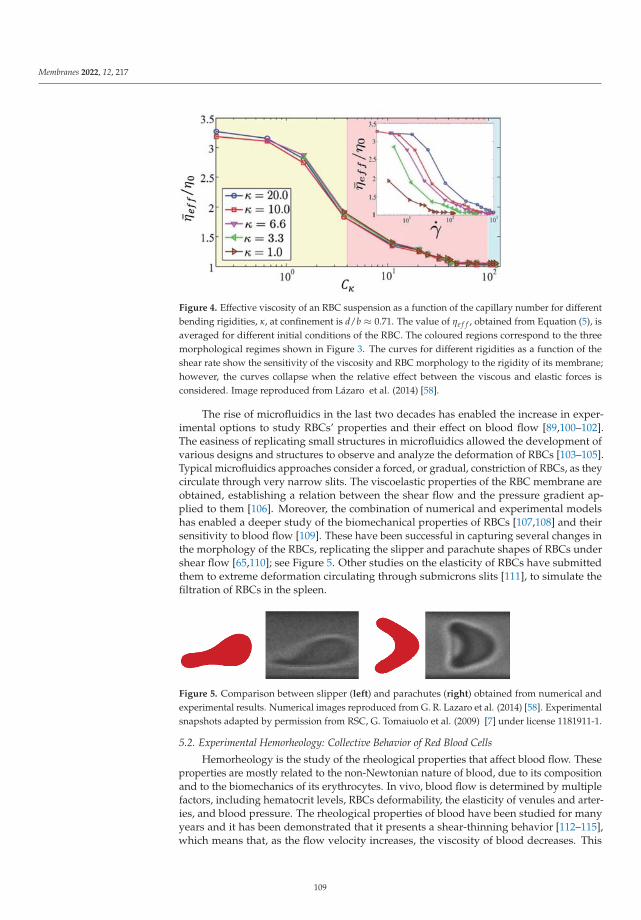
Membranes 2022, 12, 217
Figure 4. Effective viscosity of an RBC suspension as a function of the capillary number for differentbending rigidities, κ, at confinement is d/b ≈ 0.71. The value of ηe f f , obtained from Equation (5), isaveraged for different initial conditions of the RBC. The coloured regions correspond to the threemorphological regimes shown in Figure 3. The curves for different rigidities as a function of theshear rate show the sensitivity of the viscosity and RBC morphology to the rigidity of its membrane;however, the curves collapse when the relative effect between the viscous and elastic forces isconsidered. Image reproduced from Lázaro et al. (2014) [58].
The rise of microfluidics in the last two decades has enabled the increase in exper-imental options to study RBCs’ properties and their effect on blood flow [89,100–102].The easiness of replicating small structures in microfluidics allowed the development ofvarious designs and structures to observe and analyze the deformation of RBCs [103–105].Typical microfluidics approaches consider a forced, or gradual, constriction of RBCs, as theycirculate through very narrow slits. The viscoelastic properties of the RBC membrane areobtained, establishing a relation between the shear flow and the pressure gradient ap-plied to them [106]. Moreover, the combination of numerical and experimental modelshas enabled a deeper study of the biomechanical properties of RBCs [107,108] and theirsensitivity to blood flow [109]. These have been successful in capturing several changes inthe morphology of the RBCs, replicating the slipper and parachute shapes of RBCs undershear flow [65,110]; see Figure 5. Other studies on the elasticity of RBCs have submittedthem to extreme deformation circulating through submicrons slits [111], to simulate thefiltration of RBCs in the spleen.
Figure 5. Comparison between slipper (left) and parachutes (right) obtained from numerical andexperimental results. Numerical images reproduced from G. R. Lazaro et al. (2014) [58]. Experimentalsnapshots adapted by permission from RSC, G. Tomaiuolo et al. (2009) [7] under license 1181911-1.
5.2. Experimental Hemorheology: Collective Behavior of Red Blood Cells
Hemorheology is the study of the rheological properties that affect blood flow. Theseproperties are mostly related to the non-Newtonian nature of blood, due to its compositionand to the biomechanics of its erythrocytes. In vivo, blood flow is determined by multiplefactors, including hematocrit levels, RBCs deformability, the elasticity of venules and arter-ies, and blood pressure. The rheological properties of blood have been studied for manyyears and it has been demonstrated that it presents a shear-thinning behavior [112–115],which means that, as the flow velocity increases, the viscosity of blood decreases. This
109

Membranes 2022, 12, 217
rheological properties of blood highly depend on the properties of its RBCs, which affectthe viscosity of blood, as well as its shear-thinning behavior. Typical values for the viscosityof healthy blood at a low shear rate (0.28 s−1) are 39 ± 4 mPas for females and 48 ± 6 mPasfor males. At high shear rates (128 s−1), the viscosity values are 4.3 ± 0.2 mPas and4.7 ± 0.2 mPas for females and males, respectively [116].
From a macrorheological point of view, the viscosity of blood is directly related to thefraction of RBCs suspended in plasma. Given the particular properties of RBCs, the increaseor decrease in its concentration in plasma (hematocrit) will affect the behavior of blood,where the erythrocyte concentration is directly proportional to the viscosity [117]. Therefore,increased hematocrit levels will lead to an increased viscosity of blood and decreased hema-tocrit levels will lead to a decreased viscosity. Thus, the concentration of RBCs in plasmaaffects the whole-blood viscosity values, as well as its non-Newtonian behavior, which islost at low hematocrit levels [118]. From a microscopical point of view, two properties ofRBCs are particularly important in the effort to understand the shear-thinning behavior ofblood: their deformability [119] and their tendency to form aggregates [74,120,121]. Bothproperties cause the highly non-Newtonian behavior observed for RBC suspensions inplasma [122]. At low shear rates, the viscosity of blood is high, whereas, at a high shearrate, red cell disaggregation and deformation reduces the viscosity of blood.
The viscosity of fluids is measured using viscometers. Complex fluids’, such as blood,rheological properties are studied using a rheometer, capable of measuring their behaviorunder different flow conditions. Rheometers differentiate from the type of flow they induceon a material; these may be drag or pressure-induced flows. Typical drag flow rheometersare cone-plate and cylindrical Couette rheometers. On the other hand, the most typicalpressure-driven flow is the capillary rheometer. The capillary rheometer was the firstrheometer, and is still the most common method to measure viscosity, due its low costand easy operation. In comparison with rotational rheometers (cone-plate and Couette),they can be closed devices, which avoid the evaporation of solvents and the expulsionof samples. Capillary viscometers and rheometers have been used since the beginningof hemorheology in the 1960s, to measure the viscosity of blood plasma and blood [123].However, the rise of microfluidics at the end of the 1990s brought new applications andinnovation in this area. In recent years, a variety of microfluidics devices and methods havebeen developed with the objective of measuring the viscosity of blood plasma [124–127]and blood [128], using optical detection techniques [75,129–134], pressure sensors [135,136]and electrical sensors [137–139]; see Figure 6.and electrical sensors [137–139]; see Figure 6.
Figure 6. Images of two different microfluidics devices developed to measure blood viscosity.(a) Image reprinted by permission from Springer Nature, Morhell and Pastoriza (2013) [135] underlicense 5235930238113. (b) Image adapted by permission from MDPI Kang (2018) [132] under CreativeCommons CC by 4.0 license.
110
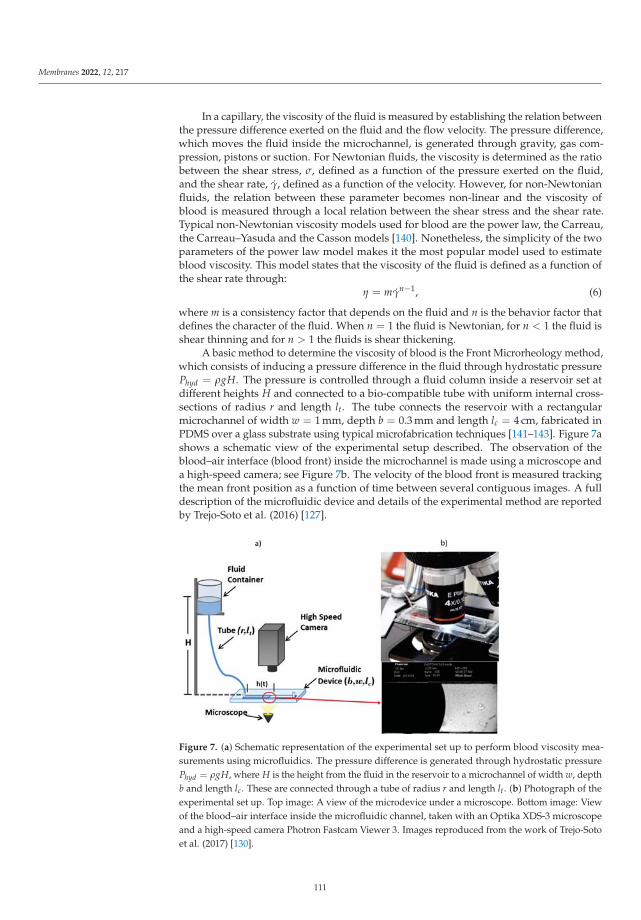
Membranes 2022, 12, 217
In a capillary, the viscosity of the fluid is measured by establishing the relation betweenthe pressure difference exerted on the fluid and the flow velocity. The pressure difference,which moves the fluid inside the microchannel, is generated through gravity, gas com-pression, pistons or suction. For Newtonian fluids, the viscosity is determined as the ratiobetween the shear stress, σ, defined as a function of the pressure exerted on the fluid,and the shear rate, γ, defined as a function of the velocity. However, for non-Newtonianfluids, the relation between these parameter becomes non-linear and the viscosity ofblood is measured through a local relation between the shear stress and the shear rate.Typical non-Newtonian viscosity models used for blood are the power law, the Carreau,the Carreau–Yasuda and the Casson models [140]. Nonetheless, the simplicity of the twoparameters of the power law model makes it the most popular model used to estimateblood viscosity. This model states that the viscosity of the fluid is defined as a function ofthe shear rate through:
η = mγn−1, (6)
where m is a consistency factor that depends on the fluid and n is the behavior factor thatdefines the character of the fluid. When n = 1 the fluid is Newtonian, for n < 1 the fluid isshear thinning and for n > 1 the fluids is shear thickening.
A basic method to determine the viscosity of blood is the Front Microrheology method,which consists of inducing a pressure difference in the fluid through hydrostatic pressurePhyd = ρgH. The pressure is controlled through a fluid column inside a reservoir set atdifferent heights H and connected to a bio-compatible tube with uniform internal cross-sections of radius r and length lt. The tube connects the reservoir with a rectangularmicrochannel of width w = 1 mm, depth b = 0.3 mm and length lc = 4 cm, fabricated inPDMS over a glass substrate using typical microfabrication techniques [141–143]. Figure 7ashows a schematic view of the experimental setup described. The observation of theblood–air interface (blood front) inside the microchannel is made using a microscope anda high-speed camera; see Figure 7b. The velocity of the blood front is measured trackingthe mean front position as a function of time between several contiguous images. A fulldescription of the microfluidic device and details of the experimental method are reportedby Trejo-Soto et al. (2016) [127].
Figure 7. (a) Schematic representation of the experimental set up to perform blood viscosity mea-surements using microfluidics. The pressure difference is generated through hydrostatic pressurePhyd = ρgH, where H is the height from the fluid in the reservoir to a microchannel of width w, depthb and length lc. These are connected through a tube of radius r and length lt. (b) Photograph of theexperimental set up. Top image: A view of the microdevice under a microscope. Bottom image: Viewof the blood–air interface inside the microfluidic channel, taken with an Optika XDS-3 microscopeand a high-speed camera Photron Fastcam Viewer 3. Images reproduced from the work of Trejo-Sotoet al. (2017) [130].
111

Membranes 2022, 12, 217
According to this experimental setup, an effective pressure ΔPe f f = ρgH − PL isdefined, where PL is the Laplace pressure due to the curvature of the fluid interface. Thiseffective pressure is related to the stress through [130]:
σ =r
2lt(ρgH − PL), (7)
where r and lt are the internal radius and the length of the tube, respectively. The shear rateof the system is defined as a function of the velocity of the interface, and the geometricalparameter of the coupled system tube-microchannel, through the following expression:
γF(n) =b2wπr3
(3 +
1n
)vb
, (8)
where b and w are the geometrical parameters of the experimental microchannel. The pa-rameter n is the behavior exponent obtained using a power law model to describe theviscosity of blood. The viscosity of blood and its shear-thinning behavior have been mea-sured and observed using several methods [144]; see Figure 8. Using the power law model,typical values of the exponent for blood are around n = 0.80 [129,136].
Figure 8. Viscosity of blood as function of the shear rate. In both images, the non-Newtonian natureof whole blood is shown. At a low shear rate, RBCs form aggregates which are responsible for anincrease in viscosity. As the shear rate increases, cells disaggregate and move freely through bloodvessels. If the shear rate keep increasing, RBCs deform, elongate and align with the direction ofthe flow, which happen in microcapillary vessels. The image on the left (a) shows one of the firstviscosity measures of blood obtained using a typical rheometer, image reproduced from Baskurt et al.(2007) [116]. On the right (b), shows the viscosity of a fresh 48% hematocrit blood sample (magenta)and the same sample 5 days from extraction (blue), we observe how the aging of the sample affectsthe viscosity of the sample. Image reproduced from Trejo-Soto et al. (2017) [130].
Although this standard procedure provides important information about the bulkbehavior of the fluid, it is of limited interest for understanding the flow in very confinedsystems, when the rheological behavior can be severely affected. For a single cell, elasticproperties are more relevant, and RBCs as an ensemble are mainly affected by confinementand focusing.
5.3. Comparison with Numerical Results of the Collective Behavior of RBCs
As mentioned earlier, the flow of RBCs in tubes and channels is critically controlled bythe hematocrit. The interactions between the RBCs, involving hydrodynamic interactions,purely geometrical constraints, or aggregation, play a fundamental role in the collectivedynamics of the RBC suspension. At low concentrations, vesicles and hard spheres flowing
112
Membranes 2022, 12, 217
in thick tubes migrate from the center line and reach a stable trajectory at ≈0.6r fromthe axis, forming an annulus of high density at this radial distance, the so-called Segre–Silberberg effect [145]. At high concentrations, however, RBCs distribute along the tubecore, avoiding the region close to the wall. The transition from the single-cell to the highhematocrit behavior is still poorly understood in spite of its importance in the rheologicalbehavior of the fluid.
When blood measures are at the microscale, other effects may be observed, namely,the Fåhraeus [146] and the Fåhraeus–Lindqvist effects [147]. The latter, characterized bya dependence of the blood viscosity with the channel thickness, are perhaps the mostimportant example [148]. In the range between roughly 300μm and 10μm of the tubediameter, the effective viscosity decreases up to 4–5 times. This effect occurs as a conse-quence of the strong repulsion from the walls that forces the blood cells to concentrate onthe central region of the channel. The formation of layers free of cells close to the wallsallows a rapid flow in these regions, enhancing the overall fluidity. At high confinements,the walls’ proximity enforces a more concentrated distribution of cells in the center andconsequently broader layers of free flow are present [149]. In larger channels, the free layersare proportionally thinner until their effect becomes eventually negligible. Although, inthe narrowest channels (<10μm), RBCs are ordered in a single row for flow at low con-centrations, and thus interactions between cells are disregardable. At an intermediatechannel size (≈20μm), RBCs present a more complex behavior and collective effects mustbe considered [150].
While flowing in thicker channels, where cells typically flow at higher concentrations,RBCs do interact, and collective effects substantially change the flow properties. From atheoretical point of view, the organization in trains (observed for single cells) also offersan interesting way to study the hydrodynamic interactions between neighboring cells,and how it affects the RBCs’ dynamics. The membrane stiffness dictates the flow disruptioninduced by the RBCs. Rigid cells induce stronger perturbations of the incoming flow thansofter ones. Even if deviations from the imposed flow are small when RBCs are distant,interactions strengthen for lower distances between cells, favoring RBCs’ collective behavior.If RBCs are initially placed very close to each other, even at high capillary numbers, theydo not migrate towards the walls but flow whilst maintaining a centered position.
RBCs are very sensitive to the hydrodynamic interactions with other cells, and thecompetition between these interactions and the wall effects dictates different RBC flowproperties when several cells are flowing at high and moderate concentrations. For in-stance, in the inertial regime, the limit of single-cell behavior is characterized by theSegré–Silberberg effect, when cells migrate towards a specific lateral position, whereas athigher concentrations the collective behavior dominates and cells are located at the tubecore, the Fåhraeus–Lindqvist effect. The dynamics of several RBCs at moderate concen-trations have proven to differ in several aspects from the single-cell case, and this affectsthe rheological behavior of the suspension. Recent numerical analyses have computed theeffective viscosity for three configurations (one ordered and two disordered initial condi-tions), at a low volume fraction and concluded that the viscosity curves show the expectedshear-thinning behavior, though two main differences were found with respect to thesingle-cell case: the magnitude of the effective viscosity obtained and the Cκ , Equation (4),required to observe the shear-thinning decay [151]; see Figure 9.
Other important characteristics of RBCs in their collective interaction is their aggrega-tion. RBCs have a tendency to form stacked structures (aggregation), commonly knownas rouleaux. The formation of aggregates affects blood flow and its rheological properties,increasing blood viscosity, and therefore slowing down the flow. These structures haveseveral characteristics, such as, the number of RBCs per rouleau being variable and side-to-side formations being possible, due to the particular discocyte shape of the RBCs [74].Figure 10 shows two images of rouleaux formation of two blood samples with differenthematocrit levels, where some of these characteristics are observed.
113

Membranes 2022, 12, 217
Figure 9. (a) Simulation of RBCs during flow in a confined channel. (b) Numerical results of theeffective viscosity for an RBC suspension at a low concentration of RBCs and low confinementas a function of the capillary number, Equation (5). Three initial conditions, one ordered andtwo disordered, are calculated, obtaining similar results. The curve shows the expected shear-thinning behavior, and the differences with the single-cell case. Image reproduced from Lázaro et al.(2019) [151].
Figure 10. (a) Red blood cells aggregates from a blood sample at 5% hematocrit. The image wastaken with an inverted Optika XDS-3 microscope using a 50× magnitude objective. (b) Large RBCaggregate from a blood sample at 38% hematocrit. The image was taken with an Optika B-353LDImicroscope using a 40× magnitude objective.
Aggregation has rheological consequences in blood and it determines its non- New-tonian behavior at low shear rates. When RBCs are aggregated, more shear is requiredto move the fluid, but as shear increases, RBCs start to disaggregate, making it easier tochange the state of motion of blood. If we keep increasing the shear, cells start to align withthe flow, deform, and elongate. Therefore, if aggregation increases, then blood viscosityincreases as well and the shear-thinning behavior of blood is altered. Numerical studieshave demonstrated the effects of aggregation in blood viscosity [120,122,152–154] andexperimental studies have observed that RBCs’ deformability induces cell aggregationduring flow in microcapillaries, allowing the formation of clusters of cells [98,155,156].Moreover, the aging of storaged RBCs also contributes to the increase in aggregation andaffects its viscosity. However, when scaling according to adhesion energies, a collapse inthe viscosity curves defines a single universal behavior for blood viscosity [130]. To analyzethe effects of aging, the hematocrit levels were fixed and the behavior of the blood sampleas it ages was studied, showing that as the sample aged, the aggregate formation increased.
114

Membranes 2022, 12, 217
By introducing a non-linear scaling parameter, the adhesion scaling number, A, the effectsof aging on RBC aggregation was quantified. This quantity is defined as
A =η0γd3
kaE0, (9)
where η0 is the viscosity of plasma, d is the average diameter of an RBC, E0 is the energyscale associated with the aggregation energy between RBCs [122], and ka is a scaling factorthat accounts for the relative increase in the adhesion energy when the blood ages. Then,the parameter A can be interpreted as the ratio between the characteristic viscous energyscale and the aggregation energy. When the viscosity of the fluid is normalized accordingto the hematocrit levels and blood plasma ηe f f = η/η0, the changes in the viscosity dependonly on the adhesion scaling number. Figure 11a shows the effect on blood viscosity due toRBC aggregation, induced by aging.
Figure 11. The plot shows how the normalized viscosity, η/η0, follows a universal curve as theadhesion scaling number changes. Image reproduced from Trejo-Soto et al. (2017) [130].
In general, blood rheology has been proven to be experimentally difficult to measure.Thus, inaccurate interpretations have frequently been made [157]. Many microfluidicstechniques have been able to reduce difficulties using capillary rheometry and pressure-driven flow. The advantages of microfluidics in this area stand out, mainly portabilityand the need for only a small sample. Additionally, some microfluidic techniques relatedexperimentally blood viscosity with the properties of RBCs [158]. Still, many considerationsneed to be taken into account to obtain feasible results.
6. Hemorheological Pathologies and Emergent Microfluidics Diagnostics Techniques
As mentioned in previous sections, human blood is an unusual fluid. While bloodplasma alone behaves as a Newtonian fluid, the complete set of blood components arenon-Newtonian, meaning that, its viscosity varies according to the speed at which itcirculates. This characteristic presents two important issues in clinical hemorheology. First,in vitro measurements of the viscosity of plasma alone never reflect the totality of eventsoccurring in vivo in patient circulation. Second, the cellular elements, by acting as particlesin suspension, are mainly responsible for the non-Newtonian behavior of blood. This iswhy, instead of considering only abnormal plasma proteins in diseases, we should alsoconsider the rheological abnormalities of the erythrocytes. The dynamics and the elasticmechanics of RBCs in confined systems are subjects of fundamental interest due to their
115

Membranes 2022, 12, 217
enormous application potential in biomedical engineering, as they affect hemorheologyduring blood handling and storage, or manipulate cells in pathology diagnosis. Alteredblood due to abnormal RBC concentrations or stiffening of the cells can lead to a reductionin the oxygen delivered or obstruction of the blood vessels. The healthy running of RBCcirculation and oxygen transport can be affected by different disorders.
Plasma proteins are responsible for the elevation of blood plasma viscosity in com-parison to water; a change in their composition may as well alter the hemorheologicalproperties of blood. Some diseases, such as Wasldenstrom’s macroglobulinaemia, inducean increase in macrogobulins, which increases the viscosity of blood plasma [159]. Further-more, in this condition, it is more likely that proteins will form rouleaux, which increasesblood viscosity at low shear rates. An elevated concentration of fibrinogen in plasma gener-ates an abnormal increase in RBC aggregation, changing the rheological behavior of blood.Aggregation and its effect in blood rheology have been related to several diseases [160–162],such as inflammation, diabetes [80,163,164], hypertension [165], obesity [166] and coronarysyndromes [167–169].
Although plasma affects blood viscosity, RBCs are the most prominent hematologicalfactor influencing hemorheology. Among circulating blood cells, erythrocytes interactmost significantly with plasma, mainly as a function of the hematocrit levels. Most typi-cal diseases related to blood viscosity are related to the percentage of RBC concentration(hematocrit), such as anemia (low % hematocrit) or polycythemia (high % hematocrit) [116].Elevated values of blood viscosity are characteristic of hyperviscosity syndromes. Hy-perviscosity may occur due to different properties of blood: an increase in the viscosityof blood plasma, a high production of fibrinogen, an increased numbers of cells (poly-cythemia or leukemia) or a increased resistance of cells to deformation (sicklemia orspherocytosis) [170,171]. In the case of whole blood, the most influential factor to increaseits viscosity is hematocrit. If the hematocrit levels of blood exceed 65% (which is the caseof polycythemia), various rheological abnormalities arise, for example, the sedimentationrates decrease significantly as a result of RBC crowding. Additionally, in severe cases, theelasticity and deformation properties of RBCs become crucial to achieving smooth drivenflows; otherwise, microcirculation may be severely compromised. On the contrary, anemiaspresent low hematocrit levels, less than 35%. Anemia may have different origins: irondeficiency, hemolysis due to particular diseases or heredity. Hematocrit levels lower than30% tend to neglect almost every non-Newtonian characteristic and usually displays aNewtonian behavior. However, in some cases of hemolytic anemias, low hematocrit levelslead to high viscosity, due to the alterations of the RBCs’ properties.
Other disorders concern inherited pathologies which affect the RBC membrane, pro-ducing abnormalities in RBC shape or deformability, which potentially reduce the healthyfunctioning of blood circulation. These membrane alterations provide important informa-tion about the membrane’s structural balance, and their main causes and consequences aredisorders such as sickle cell anemia, hemolytic anemias and thalasemic syndromes, whichare directly related to the RBC elasticity, deformation or aggregation properties [16,172].In addition, some infectious diseases, such as malaria (which does not have a geneticorigin), are also known to impair the membrane microstructure, leading to cell stiffening,affecting whole-blood viscosity [173].
Sickle cell anemia (drepanocytosis) is characterized by the formation of sickle cells(ISC) that lose their capability to deform and recover the discocyte shape, altering oxygendelivery. The molecular basis for this is an abnormal phosphorilation of hemogoblin thatpromotes a massive aggregation of this molecule under low concentrations. The formationof these molecular aggregates affects the concentration of the protein band 3, and thecell membrane is damaged in a process similar to aging, becoming rigid [174]. Patientsaffected by this pathology present a reduced life expectancy, although modern medicaltreatments allow a normal life. Due to the presence of ISC, in oxygenated conditions,the ”htc/viscosity” ratio is lower than for normal blood samples. If the natural hematocritlevels of the sample are raised to the typical levels of non-anemic blood, an increased
116

Membranes 2022, 12, 217
viscosity is observed at all shear rates [82]. The plasma viscosity of subjects with sickle cellanemia is also higher than the viscosity of healthy subjects. In severe cases, ISCs obstructmicrovessels, altering the normal circulation of blood. In the last decade, microfluidicdevices have played the important role of determining the biophysical characteristics ofsickle red cells [175], measuring the mechanical stresses on erythrocytes in sickle cell dis-ease [176], studying vaso-oclusion [104,177,178], identifying biophysical markers [179,180],segregating sickle cells [181], and developing point-of-care diagnostic technologies forlow-resource settings [182] and possible treatments [183].
Hemolytic anemias are diseases characterized by the reduction in RBC life expectancy(120 days) and an increased destruction of RBCs (trought hemolysis). Hemolytic disordersoriginated due to the hereditary defects of three RBC components: the membrane, enzymesand hemoglobin. Hemolysis occurs via two mechanisms, extravascular hemolysis, whereRBCs are eliminated prematurely from circulation through the microcirculation fagociticsystem (liver and spleen), and intravascular hemolysis, where RBC membranes ruptureduring blood circulation [184]. In hereditary spherocytosis, patients present a high con-centration of spheroidal-shaped RBCs, as a consequence of defects in several proteins ofthe membrane (mainly from the bilayer–cytoskeleton links), which cause fragility of themembrane. The alteration of membrane properties allows vesiculation and a loss of themembrane surface, triggering cell-shape deformation. Spherocytes rapidly retire fromcirculation due to the spleenic system, leading to hemolysis. Patients must be treated withblood transfusions for critical levels of anemia [185]. Hereditary elliptocytosis is character-ized by abnormalities in the spectrin dimers, causing weakness of the cytoskeleton, whichimpairs membrane stability. RBCs deform into ellipsoidal (or cigarshaped) cells. The RBCfunctionality might not be severely affected, as most patients are asymptomatic and only10% present anemia. Thalassemia syndromes such as αthalassemia and βthalassemiaare genetic hematological disorders caused by defects in the synthesis of one or morehemoglobin chains. α-thalassemia, also known as HbH disease, is caused by a reduced orabsent synthesis of the α-globin chains, and an excess of β-globin chains in the cytoskele-ton. It has been reported [186,187], through measurements of cellular deformability, thatα-thalassemic and β-thalassemic erythrocytes exhibit increased surface areas in relation tocell volume, increased membrane rigidity and increased membrane viscosity. Althoughthe stability of α-thalassemic erythrocytes membranes are normal, they are uniformly lessdense than healthy erythrocytes. A typical diagnosis for hemolytic anemias is made usinga technique known as ektacytometry [188,189]. However, in recent years, microfluidic andlab-on-a-chip devices have presented new alternatives to study RBCs deformation usingdiverse techniques such as deformability cytometry [103,190], magnetic measurement [191],electrical measurement [192], single-cell chamber arrays [193], combination of microfluidicswith machine learning [194] and pressure-driven microrheometry [195].
Malaria is caused by the infection of a parasite of the genus Plasmodium. InfectedRBCs develop advanced proteinic machinery, including the formation of organelles similarto the Golgi apparatus, which are used for nutrient transport and storage, and allowenzymatic activity. The parasite is hosted in a vacuole, and during its maturation it reachesthe size of a nucleus in a typical eukaryotic cell. Apart from this new internal structure,the parasite produces changes in the membrane proteins that affect the deformability of thecell [196]. RBCs also adopt a more spherical shape, and proteins allocated in the externalface of the membrane promote aggregation with other infected cells, avoiding hemolysisin the spleen. All these conformational changes strongly affect the cells’ mechanicalproperties, modifying the rheological properties of blood [197,198]. As in the case ofnon-infectious diseases, in recent years, microfluidic devices have been developed tosupport Malaria diagnosis mostly directed to low-resource locations [199–201] or to findpossible treatments [202–204].
Severe hemorheological disorders are usually related to alterations in the RBCs’ me-chanical properties. RBCs have physical properties of their own, and are capable of directlyinfluencing blood flow regardless of hematocrit levels, hence the importance of taking
117
Membranes 2022, 12, 217
RBCs properties into account when studying its effects on diseases that affects wholeblood viscosity. Therefore, understanding these properties from theoretical, numerical,and experimental points of views is the key to improving diagnostics techniques and todeveloping successful treatments. Microfluidic technologies play a remarkable role inbiomedical research, and in combination with biomimetics, lab-on-a-chip and organ-on-a-chip technologies are the cornerstone of future medical diagnoses and treatments.
7. Conclusions
In this review, we have described the general features of RBC membranes and theireffects on blood flow, from numerical and experimental perspectives, highlighting theachievements of microfluidics technology in performing in vitro studies assessing RBCmembranes’ elasticity, hemodynamics and hemorheology.
First, we described the main composition of mammalian cell membranes and referto the RBC membranes, due to the their special characteristics, specifically their lack of anucleus and simple structure, which makes them easier to model. We mentioned severalmethods to model the RBC membranes’ elasticity; however, we discussed the Helfrich freeenergy model combined with a phase field model to study the cells and vesicles from asingle RBC to their collective behavior. In this matter, we found that the dynamics of asingle isolated cell immersed in a Poiseuille flow can be modeled using a phase field modelcoupled with the Navier–Stokes equations. Through this model, we were able to observethe deformation of the RBCs in shear flow.
We later discussed blood and its constitution to relate the elastic properties of the RBCsto the bulk behavior of blood, describing its effect in hemodynamics and hemorheology,again from single-cell to their collective behavior. We presented numerical and experimentalpoints of view considering the latest advances in microfluidics technology to achieve newobservations in vitro. From an experimental point of view, we were able to determinethe viscosity of blood using microfluidic technology and to determine the effect of RBCaggregation and erythrocyte concentration on whole-blood rheological properties.
Finally, we reviewed and described hematological disorders associated with wholeblood and the elastic properties of red blood cells, and how their alterations affect thehemodynamics and rheological properties of blood. We addressed these diseases takinginto account the new microfluidic methods that are being developed for diagnostics andfuture treatment of blood pathologies and their RBC membrane abnormalities. Eventhough the development of these devices has increased significantly in the past decade,new applications and improvements are being created and discovered every year. Hence,microfluidics applications to diagnostics through the analysis of whole-blood properties orRBCs properties are still and will remain a hot topic in the future.
Author Contributions: Writing—original draft preparation, C.T.-S. and G.R.L.; writing—reviewand editing, C.T.-S., I.P. and A.H.-M. All authors have read and agreed to the published version ofthe manuscript.
Funding: This research was funded by VRIEA/PUCV (Grant No. DIII039.425/2021); ANID/PCI(Grant No. MEC80180021); Ministerio de Ciencia e Innovación (Grant No. PID2019-106063GB-100);MINECO (Grant No. PGC2018-098373-B-100); DURSI (Grant No. 2017 SGR 884), and SNF Projectno. 200021-175719.
Institutional Review Board Statement: The experimental study mentioned in this article was con-ducted according to the guidelines of the Declaration of Helsinki, and approved by the University ofBarcelona’s Bioethics Commission (CBUB) (Project 160016 and date of approval March 1st 2016).
Informed Consent Statement: Informed consent was obtained from all subjects involved in the study.
Data Availability Statement: All the data is contained within the article.
118
Membranes 2022, 12, 217
Acknowledgments: Figure 5, adapted by permission from the Royal Society from Chemistry:SoftMatter [7] Tomaiuolo et al. (2009) under license 1181911-1; Figure 6a, reprinted by permission fromSpringer Nature: Microfluidics and Nanofluidics, [135] Morhell & Pastoriza (2013) under license5235930238113. Figure 6b adapted by permission from MDPI: Micromachines [132] Kang et al. underCreative Commons CC BY 4.0 license
Conflicts of Interest: The authors declare no conflict of interest.
References
1. Evans, E.A. Bending elastic modulus of red blood cell membrane derived from buckling instability in micropipet aspiration tests.Biophys. J. 1983, 43, 27–30. [CrossRef]
2. Evans, E.A. Structure and deformation properties of red blood cells: Concepts and quantitative methods. In Methods in Enzymology;Elsevier: Amsterdam, The Netherlands, 1989; Volume 173, pp. 3–35.
3. Singer, S.J.; Nicolson, G.L. The fluid mosaic model of the structure of cell membranes. Science 1972, 175, 720–731. [CrossRef][PubMed]
4. Canham, P.B. The minimum energy of bending as a possible explanation of the biconcave shape of the human red blood cell. J.Theor. Biol. 1970, 26, 61–81. [CrossRef]
5. Helfrich, W. Elastic properties of lipid bilayers: Theory and possible experiments. Zeitschrift für Naturforschung C 1973, 28, 693–703.[CrossRef]
6. Deuling, H.; Helfrich, W. Red blood cell shapes as explained on the basis of curvature elasticity. Biophys. J. 1976, 16, 861–868.[CrossRef]
7. Tomaiuolo, G.; Simeone, M.; Martinelli, V.; Rotoli, B.; Guido, S. Red blood cell deformation in microconfined flow. Soft Matter2009, 5, 3736–3740. [CrossRef]
8. Goldsmith, H.; Marlow, J.; MacIntosh, F.C. Flow behaviour of erythrocytes-I. Rotation and deformation in dilute suspensions.Proc. R. Soc. London. Ser. B Biol. Sci. 1972, 182, 351–384.
9. Fischer, T.M.; Stohr-Lissen, M.; Schmid-Schonbein, H. The red cell as a fluid droplet: Tank tread-like motion of the humanerythrocyte membrane in shear flow. Science 1978, 202, 894–896. [CrossRef]
10. Abkarian, M.; Faivre, M.; Viallat, A. Swinging of red blood cells under shear flow. Phys. Rev. Lett. 2007, 98, 188302. [CrossRef]11. Dupire, J.; Socol, M.; Viallat, A. Full dynamics of a red blood cell in shear flow. Proc. Natl. Acad. Sci. USA 2012, 109, 20808–20813.
[CrossRef]12. Melzak, K.A.; Lázaro, G.R.; Hernández-Machado, A.; Pagonabarraga, I.; de Espada, J.M.C.D.; Toca-Herrera, J.L. AFM measure-
ments and lipid rearrangements: Evidence from red blood cell shape changes. Soft Matter 2012, 8, 7716–7726. [CrossRef]13. Mohandas, N.; Gallagher, P.G. Red cell membrane: Past, present, and future. Blood 2008, 112, 3939–3948. [CrossRef]14. Toner, M.; Irimia, D. Blood-on-a-chip. Annu. Rev. Biomed. Eng. 2005, 7, 77. [CrossRef]15. Viallat, A.; Abkarian, M. Dynamics of Blood Cell Suspensions in Microflows; CRC Press: Boca Raton, FL, USA, 2019.16. Tomaiuolo, G. Biomechanical properties of red blood cells in health and disease towards microfluidics. Biomicrofluidics 2014,
8, 051501. [CrossRef]17. Gervais, L.; De Rooij, N.; Delamarche, E. Microfluidic chips for point-of-care immunodiagnostics. Adv. Mater. 2011, 23, H151–H176.
[CrossRef]18. Sackmann, E.K.; Fulton, A.L.; Beebe, D.J. The present and future role of microfluidics in biomedical research. Nature 2014,
507, 181–189. [CrossRef]19. Sebastian, B.; Dittrich, P.S. Microfluidics to mimic blood flow in health and disease. Annu. Rev. Fluid Mech. 2018, 50, 483–504.
[CrossRef]20. Lipowsky, R.; Sackmann, E. Structure and Dynamics of Membranes: I. from Cells to Vesicles/II. Generic and Specific Interactions; Elsevier:
Amsterdam, The Netherlands, 1995.21. Alberts, B. The cell as a collection of protein machines: Preparing the next generation of molecular biologists. Cell 1998,
92, 291–294. [CrossRef]22. Alberts, B.; Bray, D.; Lewis, J.; Raff, M.; Roberts, K.; Watson, J.D. Molecular Biology of the Cell; Garland Science: New York, NY,
USA, 1994.23. Van Meer, G.; Voelker, D.R.; Feigenson, G.W. Membrane lipids: Where they are and how they behave. Nat. Rev. Mol. Cell Biol.
2008, 9, 112. [CrossRef]24. Yeagle, P.L. The Membranes of Cells; Academic Press: Cambridge, MA, USA, 2016.25. Cullis, P.R.; Hope, M.J.; Tilcock, C.P. Lipid polymorphism and the roles of lipids in membranes. Chem. Phys. Lipids 1986,
40, 127–144. [CrossRef]26. Finegold, L.X. Cholesterol in Membrane Models; CRC Press: Boca Raton, FL, USA, 1992.27. Maxfield, F.R.; van Meer, G. Cholesterol, the central lipid of mammalian cells. Curr. Opin. Cell Biol. 2010, 22, 422–429. [CrossRef]
[PubMed]28. Yeagle, P.L. The Structure of Biological Membranes; CRC Press: Boca Raton, FL, USA, 2004.29. Boal, D.; Boal, D.H. Mechanics of the Cell; Cambridge University Press: Cambridge, UK, 2012.
119

Membranes 2022, 12, 217
30. Bennett, V. The spectrin-actin junction of erythrocyte membrane skeletons. Biochim. Biophys. Acta (BBA)-Rev. Biomembr. 1989,988, 107–121. [CrossRef]
31. Li, J.; Dao, M.; Lim, C.; Suresh, S. Spectrin-level modeling of the cytoskeleton and optical tweezers stretching of the erythrocyte.Biophys. J. 2005, 88, 3707–3719. [CrossRef] [PubMed]
32. Mohandas, N.; Evans, E. Mechanical properties of the red cell membrane in relation to molecular structure and genetic defects.Annu. Rev. Biophys. Biomol. Struct. 1994, 23, 787–818. [CrossRef] [PubMed]
33. Stillwell, W. An Introduction to Biological Membranes: From Bilayers to Rafts; Newnes: Oxford, UK, 2013.34. Závodszky, G.; van Rooij, B.; Azizi, V.; Hoekstra, A. Cellular level in-silico modeling of blood rheology with an improved material
model for red blood cells. Front. Physiol. 2017, 8, 563. [CrossRef] [PubMed]35. Peng, Z.; Mashayekh, A.; Zhu, Q. Erythrocyte responses in low-shear-rate flows: Effects of non-biconcave stress-free state in the
cytoskeleton. J. Fluid Mech. 2014, 742, 96–118. [CrossRef]36. Salehyar, S.; Zhu, Q. Deformation and internal stress in a red blood cell as it is driven through a slit by an incoming flow. Soft
Matter 2016, 12, 3156–3164. [CrossRef] [PubMed]37. Freund, J.B. The flow of red blood cells through a narrow spleen-like slit. Phys. Fluids 2013, 25, 110807. [CrossRef]38. Gompper, G.; Schick, M.; Milner, S. Self-assembling amphiphilic systems. Phys. Today 2008, 48, 91–93. [CrossRef]39. Lázaro, G.R.; Pagonabarraga, I.; Hernández-Machado, A. Phase-field theories for mathematical modeling of biological membranes.
Chem. Phys. Lipids 2015, 185, 46–60. [CrossRef]40. Pontrelli, G.; Halliday, I.; Melchionna, S.; Spencer, T.J.; Succi, S. Lattice Boltzmann method as a computational framework for
multiscale haemodynamics. Math. Comput. Model. Dyn. Syst. 2014, 20, 470–490. [CrossRef]41. Pivkin, I.V.; Karniadakis, G.E. Accurate coarse-grained modeling of red blood cells. Phys. Rev. Lett. 2008, 101, 118105. [CrossRef]42. Fedosov, D.A.; Caswell, B.; Karniadakis, G.E. A multiscale red blood cell model with accurate mechanics, rheology, and dynamics.
Biophys. J. 2010, 98, 2215–2225. [CrossRef]43. Peskin, C.S. The immersed boundary method. Acta Numer. 2002, 11, 479–517. [CrossRef]44. Kaoui, B.; Krüger, T.; Harting, J. How does confinement affect the dynamics of viscous vesicles and red blood cells? Soft Matter
2012, 8, 9246–9252. [CrossRef]45. Pozrikidis, C. Boundary Integral and Singularity Methods for Linearized Viscous Flow; Cambridge University Press: Cambridge, UK,
1992.46. Pozrikidis, C. Finite deformation of liquid capsules enclosed by elastic membranes in simple shear flow. J. Fluid Mech. 1995,
297, 123–152. [CrossRef]47. Malevanets, A.; Kapral, R. Mesoscopic model for solvent dynamics. J. Chem. Phys. 1999, 110, 8605–8613. [CrossRef]48. McWhirter, J.L.; Noguchi, H.; Gompper, G. Flow-induced clustering and alignment of vesicles and red blood cells in microcapil-
laries. Proc. Natl. Acad. Sci. USA 2009, 106, 6039–6043. [CrossRef]49. Peng, Z.; Li, X.; Pivkin, I.V.; Dao, M.; Karniadakis, G.E.; Suresh, S. Lipid bilayer and cytoskeletal interactions in a red blood cell.
Proc. Natl. Acad. Sci. USA 2013, 110, 13356–13361. [CrossRef]50. Du, Q.; Liu, C.; Wang, X. A phase field approach in the numerical study of the elastic bending energy for vesicle membranes. J.
Comput. Phys. 2004, 198, 450–468. [CrossRef]51. Gompper, G.; Shick, M. Phase Transitions and Critical Phenomena; Elsevier: Amsterdam, The Netherlands, 1994; Volume 76, p. 16. .52. Campelo, F.; Hernandez-Machado, A. Shape instabilities in vesicles: A phase-field model. Eur. Phys. J. Spec. Top. 2007,
143, 101–108. [CrossRef]53. Rosolen, A.; Peco, C.; Arroyo, M. An adaptive meshfree method for phase-field models of biomembranes. Part I: Approximation
with maximum-entropy basis functions. J. Comput. Phys. 2013, 249, 303–319. [CrossRef]54. Peco, C.; Rosolen, A.; Arroyo, M. An adaptive meshfree method for phase-field models of biomembranes. Part II: A Lagrangian
approach for membranes in viscous fluids. J. Comput. Phys. 2013, 249, 320–336. [CrossRef]55. Campelo, F.; Hernandez-Machado, A. Dynamic model and stationary shapes of fluid vesicles. Eur. Phys. J. E 2006, 20, 37–45.
[CrossRef] [PubMed]56. Deschamps, J.; Kantsler, V.; Segre, E.; Steinberg, V. Dynamics of a vesicle in general flow. Proc. Natl. Acad. Sci. USA 2009,
106, 11444–11447. [CrossRef] [PubMed]57. Deschamps, J.; Kantsler, V.; Steinberg, V. Phase diagram of single vesicle dynamical states in shear flow. Phys. Rev. Lett. 2009,
102, 118105. [CrossRef] [PubMed]58. Lázaro, G.R.; Hernández-Machado, A.; Pagonabarraga, I. Rheology of red blood cells under flow in highly confined microchannels:
I. effect of elasticity. Soft Matter 2014, 10, 7195–7206. [CrossRef] [PubMed]59. Lázaro, G.R.; Hernández-Machado, A.; Pagonabarraga, I. Rheology of red blood cells under flow in highly confined microchannels.
II. Effect of focusing and confinement. Soft Matter 2014, 10, 7207–7217. [CrossRef]60. Mofrad, M.R. Rheology of the cytoskeleton. Annu. Rev. Fluid Mech. 2009, 41, 433–453. [CrossRef]61. Dimova, R. Recent developments in the field of bending rigidity measurements on membranes. Adv. Colloid Interface Sci. 2014,
208, 225–234. [CrossRef]62. Scheffer, L.; Bitler, A.; Ben-Jacob, E.; Korenstein, R. Atomic force pulling: Probing the local elasticity of the cell membrane. Eur.
Biophys. J. 2001, 30, 83–90. [CrossRef]
120
Membranes 2022, 12, 217
63. Betz, T.; Lenz, M.; Joanny, J.F.; Sykes, C. ATP-dependent mechanics of red blood cells. Proc. Natl. Acad. Sci. USA 2009,106, 15320–15325. [CrossRef]
64. Abkarian, M.; Viallat, A. Vesicles and red blood cells in shear flow. Soft Matter 2008, 4, 653–657. [CrossRef]65. Mauer, J.; Mendez, S.; Lanotte, L.; Nicoud, F.; Abkarian, M.; Gompper, G.; Fedosov, D.A. Flow-induced transitions of red blood
cell shapes under shear. Phys. Rev. Lett. 2018, 121, 118103. [CrossRef]66. Zarda, P.; Chien, S.; Skalak, R. Elastic deformations of red blood cells. J. Biomech. 1977, 10, 211–221. [CrossRef]67. Besis, M. Red Cell Shapes, An Illustrated Classification and Its Rationale. In Red Cell Shape; Besis, M., Weed, R.I., Leblond, P.F.,
Eds.; Springer: Berlin/Heidelberg, Germany, 1973.68. Uzoigwe, C. The human erythrocyte has developed the biconcave disc shape to optimise the flow properties of the blood in the
large vessels. Med. Hypotheses 2006, 67, 1159–1163. [CrossRef]69. Reinhart, W.H.; Chien, S. Red cell rheology in stomatocyte-echinocyte transformation: Roles of cell geometry and cell shape.
Blood 1986, 67, 1110–1118. [CrossRef]70. Hoffman, R.; Benz, E.J., Jr.; Silberstein, L.E.; Heslop, H.; Anastasi, J.; Weitz, J. Hematology: Basic Principles and Practice; Elsevier
Health Sciences: Amsterdam, The Netherlands, 2013.71. Mathew, J.; Sankar, P.; Varacallo, M. Physiology, Blood Plasma; StatPearls Publishing: Treasure Island, FL, USA 2018.72. Brust, M.; Schaefer, C.; Doerr, R.; Pan, L.; Garcia, M.; Arratia, P.; Wagner, C. Rheology of human blood plasma: Viscoelastic versus
Newtonian behavior. Phys. Rev. Lett. 2013, 110, 078305. [CrossRef]73. Schaller, J.; Gerber, S.; Kaempfer, U.; Lejon, S.; Trachsel, C. Human Blood Plasma Proteins: Structure and Function; John Wiley &
Sons: Hoboken, NJ, USA, 2008.74. Baskurt, O.; Neu, B.; Meiselman, H.J. Red Blood Cell Aggregation; CRC Press: Boca Raton, FL, USA, 2011.75. Yeom, E.; Park, J.H.; Kang, Y.J.; Lee, S.J. Microfluidics for simultaneous quantification of platelet adhesion and blood viscosity.
Sci. Rep. 2016, 6, 24994. [CrossRef]76. George, M.J.; Bynum, J.; Nair, P.; Cap, A.P.; Wade, C.E.; Cox, C.S., Jr.; Gill, B.S. Platelet biomechanics, platelet bioenergetics, and
applications to clinical practice and translational research. Platelets 2018, 29, 431–439. [CrossRef]77. Fung, Y. Biomechanics; Springer Science+Business Media: New York, NY, USA, 1985.78. Hall, J.E.; Hall, M.E. Guyton and Hall Textbook of Medical Physiology E-Book; Elsevier Health Sciences: Amsterdam, The Netherlands,
2020.79. Secomb, T.W. Blood flow in the microcirculation. Annu. Rev. Fluid Mech. 2017, 49, 443–461. [CrossRef]80. Cho, Y.I.; Mooney, M.P.; Cho, D.J. Hemorheological disorders in diabetes mellitus. J. Diabetes Sci. Technol. 2008, 2, 1130–1138.
[CrossRef] [PubMed]81. Cowan, A.Q.; Cho, D.J.; Rosenson, R.S. Importance of blood rheology in the pathophysiology of atherothrombosis. Cardiovasc.
Drugs Ther. 2012, 26, 339–348. [CrossRef] [PubMed]82. Connes, P.; Alexy, T.; Detterich, J.; Romana, M.; Hardy-Dessources, M.D.; Ballas, S.K. The role of blood rheology in sickle cell
disease. Blood Rev. 2015, 330, 111–118 [CrossRef] [PubMed]83. Secomb, T.W. Hemodynamics. Compr. Physiol. 2011, 6, 975–1003.84. Goldsmith, H.; Skalak, R. Hemodynamics. Annu. Rev. Fluid Mech. 1975, 7, 213–247. [CrossRef]85. Lipowsky, H.H. Microvascular rheology and hemodynamics. Microcirculation 2005, 12, 5–15. [CrossRef] [PubMed]86. Popel, A.S.; Johnson, P.C. Microcirculation and hemorheology. Annu. Rev. Fluid Mech. 2005, 37, 43. [CrossRef]87. Omori, T.; Imai, Y.; Kikuchi, K.; Ishikawa, T.; Yamaguchi, T. Hemodynamics in the Microcirculation and in Microfluidics. Ann.
Biomed. Eng. 2015, 43, 238–257. [CrossRef]88. Ju, M.; Ye, S.S.; Namgung, B.; Cho, S.; Low, H.T.; Leo, H.L.; Kim, S. A review of numerical methods for red blood cell flow
simulation. Comput. Methods Biomech. Biomed. Eng. 2015, 18, 130–140. [CrossRef]89. Abkarian, M.; Faivre, M.; Horton, R.; Smistrup, K.; Best-Popescu, C.A.; Stone, H.A. Cellular-scale hydrodynamics. Biomed. Mater.
2008, 3, 034011. [CrossRef]90. Kaoui, B.; Biros, G.; Misbah, C. Why do red blood cells have asymmetric shapes even in a symmetric flow? Phys. Rev. Lett. 2009,
103, 188101. [CrossRef]91. Lei, H.; Fedosov, D.A.; Caswell, B.; Karniadakis, G.E. Blood flow in small tubes: Quantifying the transition to the non-continuum
regime. J. Fluid Mech. 2013, 722, 214–239. [CrossRef]92. Fedosov, D.A.; Noguchi, H.; Gompper, G. Multiscale modeling of blood flow: From single cells to blood rheology. Biomech. Model.
Mechanobiol. 2014, 13, 239–258. [CrossRef]93. Lázaro, G.R.; Pagonabarraga, I.; Hernández-Machado, A. Elastic and dynamic properties of membrane phase-field models. Eur.
Phys. J. E 2017, 40, 77. [CrossRef]94. Arroyo, M.; DeSimone, A. Relaxation dynamics of fluid membranes. Phys. Rev. E 2009, 79, 031915. [CrossRef]95. Sugii, Y.; Okuda, R.; Okamoto, K.; Madarame, H. Velocity measurement of both red blood cells and plasma of in vitro blood flow
using high-speed micro PIV technique. Meas. Sci. Technol. 2005, 16, 1126. [CrossRef]96. Pitts, K.L.; Mehri, R.; Mavriplis, C.; Fenech, M. Micro-particle image velocimetry measurement of blood flow: Validation and
analysis of data pre-processing and processing methods. Meas. Sci. Technol. 2012, 23, 105302. [CrossRef]97. Pitts, K.L.; Fenech, M. High speed versus pulsed images for micro-particle image velocimetry: A direct comparison of red blood
cells versus fluorescing tracers as tracking particles. Physiol. Meas. 2013, 34, 1363. [CrossRef]
121
Membranes 2022, 12, 217
98. Pasias, D.; Passos, A.; Constantinides, G.; Balabani, S.; Kaliviotis, E. Surface tension driven flow of blood in a rectangularmicrofluidic channel: Effect of erythrocyte aggregation. Phys. Fluids 2020, 32, 071903. [CrossRef]
99. Kucukal, E.; Man, Y.; Gurkan, U.A.; Schmidt, B. Blood Flow Velocimetry in a Microchannel During Coagulation Using ParticleImage Velocimetry and Wavelet-Based Optical Flow Velocimetry. J. Biomech. Eng. 2021, 143, 091004. [CrossRef] [PubMed]
100. Abkarian, M.; Faivre, M.; Stone, H.A. High-speed microfluidic differential manometer for cellular-scale hydrodynamics. Proc.Natl. Acad. Sci. USA 2006, 103, 538–542. [CrossRef] [PubMed]
101. Tomaiuolo, G.; Barra, M.; Preziosi, V.; Cassinese, A.; Rotoli, B.; Guido, S. Microfluidics analysis of red blood cell membraneviscoelasticity. Lab A Chip 2011, 11, 449–454. [CrossRef]
102. Kang, Y.J. Continuous and simultaneous measurement of the biophysical properties of blood in a microfluidic environment.Analyst 2016, 141, 6583–6597. [CrossRef] [PubMed]
103. Guruprasad, P.; Mannino, R.G.; Caruso, C.; Zhang, H.; Josephson, C.D.; Roback, J.D.; Lam, W.A. Integrated automated particletracking microfluidic enables high-throughput cell deformability cytometry for red cell disorders. Am. J. Hematol. 2019,94, 189–199. [CrossRef] [PubMed]
104. Man, Y.; Maji, D.; An, R.; Ahuja, S.P.; Little, J.A.; Suster, M.A.; Mohseni, P.; Gurkan, U.A. Microfluidic electrical impedanceassessment of red blood cell-mediated microvascular occlusion. Lab A Chip 2021, 21, 1036–1048. [CrossRef] [PubMed]
105. Reichenwallner, A.K.; Vurmaz, E.; Battis, K.; Handl, L.; Üstün, H.; Mach, T.; Hörnig, G.; Lipfert, J.; Richter, L. Optical Investigationof Individual Red Blood Cells for Determining Cell Count and Cellular Hemoglobin Concentration in a Microfluidic Channel.Micromachines 2021, 12, 358. [CrossRef] [PubMed]
106. Guo, Q.; Duffy, S.P.; Matthews, K.; Santoso, A.T.; Scott, M.D.; Ma, H. Microfluidic analysis of red blood cell deformability. J.Biomech. 2014, 47, 1767–1776. [CrossRef]
107. Li, X.; Peng, Z.; Lei, H.; Dao, M.; Karniadakis, G.E. Probing red blood cell mechanics, rheology and dynamics with a two-component multi-scale model. Philos. Trans. R. Soc. A Math. Phys. Eng. Sci. 2014, 372, 20130389. [CrossRef]
108. Pivkin, I.V.; Peng, Z.; Karniadakis, G.E.; Buffet, P.A.; Dao, M.; Suresh, S. Biomechanics of red blood cells in human spleen andconsequences for physiology and disease. Proc. Natl. Acad. Sci. USA 2016, 113, 7804–7809. [CrossRef]
109. Quinn, D.J.; Pivkin, I.; Wong, S.Y.; Chiam, K.H.; Dao, M.; Karniadakis, G.E.; Suresh, S. Combined simulation and experimentalstudy of large deformation of red blood cells in microfluidic systems. Ann. Biomed. Eng. 2011, 39, 1041–1050. [CrossRef]
110. Guckenberger, A.; Kihm, A.; John, T.; Wagner, C.; Gekle, S. Numerical–experimental observation of shape bistability of red bloodcells flowing in a microchannel. Soft Matter 2018, 14, 2032–2043. [CrossRef]
111. Lu, H.; Peng, Z. Boundary integral simulations of a red blood cell squeezing through a submicron slit under prescribed inlet andoutlet pressures. Phys. Fluids 2019, 31, 031902.
112. Cokelet, G.; Merrill, E.; Gilliland, E.; Shin, H.; Britten, A.; Wells , R., Jr. The rheology of human blood—Measurement near and atzero shear rate. Trans. Soc. Rheol. 1963, 7, 303–317. [CrossRef]
113. Merrill, E.W. Rheology of blood. Physiol. Rev 1969, 49, 863–888. [CrossRef]114. Chien, S. Shear dependence of effective cell volume as a determinant of blood viscosity. Science 1970, 168, 977–979. [CrossRef]115. Thurston, G.B. Viscoelasticity of human blood. Biophys. J. 1972, 12, 1205. [CrossRef]116. Baskurt, O.K. Handbook of Hemorheology and Hemodynamics; IOS Press: Amsterdam, The Netherlands 2007; Volume 69.117. Eckmann, D.M.; Bowers, S.; Stecker, M.; Cheung, A.T. Hematocrit, volume expander, temperature, and shear rate effects on blood
viscosity. Anesth. Analg. 2000, 91, 539–545. [CrossRef]118. Thurston, G.B.; Henderson, N.M. Effects of flow geometry on blood viscoelasticity. Biorheology 2006, 43, 729–746.119. Chien, S. Red cell deformability and its relevance to blood flow. Annu. Rev. Physiol. 1987, 49, 177–192. [CrossRef]120. Liu, Y.; Liu, W.K. Rheology of red blood cell aggregation by computer simulation. J. Comput. Phys. 2006, 220, 139–154. [CrossRef]121. McWhirter, J.L.; Noguchi, H.; Gompper, G. Deformation and clustering of red blood cells in microcapillary flows. Soft Matter
2011, 7, 10967–10977. [CrossRef]122. Fedosov, D.A.; Pan, W.; Caswell, B.; Gompper, G.; Karniadakis, G.E. Predicting human blood viscosity in silico. Proc. Natl. Acad.
Sci. USA 2011, 108, 11772–11777. [CrossRef] [PubMed]123. Lowe, G.D.O. Clinical Blood Rheology; CRC Press: Boca Raton, FL, USA, 1988.124. Srivastava, N.; Davenport, R.D.; Burns, M.A. Nanoliter viscometer for analyzing blood plasma and other liquid samples. Anal.
Chem. 2005, 77, 383–392. [CrossRef] [PubMed]125. Guillot, P.; Panizza, P.; Salmon, J.B.; Joanicot, M.; Colin, A.; Bruneau, C.H.; Colin, T. Viscosimeter on a microfluidic chip. Langmuir
2006, 22, 6438–6445. [CrossRef] [PubMed]126. Burns, M.A.; Srivastava, N.; Davenport, R.D. Nanoliter Viscometer for Analyzing Blood Plasma and Other Liquid Samples. U.S.
Patent 7,188,515, 13 March 2007.127. Trejo-Soto, C.; Costa-Miracle, E.; Rodriguez-Villarreal, I.; Cid, J.; Alarcón, T.; Hernández-Machado, A. Capillary Filling at the
Microscale: Control of Fluid Front Using Geometry. PLoS ONE 2016, 11, e0153559. [CrossRef] [PubMed]128. Gupta, S.; Wang, W.S.; Vanapalli, S.A. Microfluidic viscometers for shear rheology of complex fluids and biofluids. Biomicrofluidics
2016, 10, 043402. [CrossRef]129. Kang, Y.J.; Yoon, S.Y.; Lee, K.H.; Yang, S. A highly accurate and consistent microfluidic viscometer for continuous blood viscosity
measurement. Artif. Organs 2010, 34, 944–949. [CrossRef]
122
Membranes 2022, 12, 217
130. Trejo-Soto, C.; Costa-Miracle, E.; Rodriguez-Villarreal, I.; Cid, J.; Castro, M.; Alarcon, T.; Hernandez-Machado, A. Frontmicrorheology of the non-Newtonian behaviour of blood: Scaling theory of erythrocyte aggregation by aging. Soft Matter 2017,13, 3042–3047. [CrossRef]
131. Kim, B.J.; Lee, S.Y.; Jee, S.; Atajanov, A.; Yang, S. Micro-viscometer for measuring shear-varying blood viscosity over a wide-ranging shear rate. Sensors 2017, 17, 1442. [CrossRef]
132. Kang, Y.J. Microfluidic-based technique for measuring RBC aggregation and blood viscosity in a continuous and simultaneousfashion. Micromachines 2018, 9, 467. [CrossRef]
133. Khnouf, R.; Karasneh, D.; Abdulhay, E.; Abdelhay, A.; Sheng, W.; Fan, Z.H. Microfluidics-based device for the measurement ofblood viscosity and its modeling based on shear rate, temperature, and heparin concentration. Biomed. Microdevices 2019, 21, 80.[CrossRef]
134. Carvalho, V.; Gonçalves, I.M.; Souza, A.; Souza, M.S.; Bento, D.; Ribeiro, J.E.; Lima, R.; Pinho, D. Manual and Automatic ImageAnalysis Segmentation Methods for Blood Flow Studies in Microchannels. Micromachines 2021, 12, 317. [CrossRef]
135. Morhell, N.; Pastoriza, H. A single channel capillary microviscometer. Microfluid. Nanofluidics 2013, 15, 475–479. [CrossRef]136. Morhell, N.; Pastoriza, H. Power law fluid viscometry through capillary filling in a closed microchannel. Sens. Actuators B Chem.
2016, 227, 24–28. [CrossRef]137. Delamarche, E.; Temiz, Y. Continuous, Capacitance-Based Monitoring of Liquid Flows in a Microfluidic Device. U.S. Patent
10,369,567, 6 August 2019.138. Farrarons, J.C.; Machado, A.H.; Cor, T.A.; Villarreal, A.I.R.; Catala, P.L.M. Method, Apparatus and Micro-Rheometer for
Measuring Rheological Properties of Newtonian and Non-Newtonian Fluids. U.S. Patent 10,386,282, 20 August 2019.139. Méndez-Mora, L.; Cabello-Fusarés, M.; Ferré-Torres, J.; Riera-Llobet, C.; Lopez, S.; Trejo-Soto, C.; Alarcón, T.; Hernandez-
Machado, A. Microrheometer for Biofluidic Analysis: Electronic Detection of the Fluid-Front Advancement. Micromachines 2021,12, 726. [CrossRef]
140. Larson, R.G. The Structure and Rheology of Complex Fluids; Oxford University Press: New York, NY, USA, 1999; Volume 150.141. Xia, Y.; Whitesides, G.M. Soft lithography. Annu. Rev. Mater. Sci. 1998, 28, 153–184. [CrossRef]142. Vulto, P.; Glade, N.; Altomare, L.; Bablet, J.; Del Tin, L.; Medoro, G.; Chartier, I.; Manaresi, N.; Tartagni, M.; Guerrieri, R.
Microfluidic channel fabrication in dry film resist for production and prototyping of hybrid chips. Lab A Chip 2005, 5, 158–162.[CrossRef]
143. Qin, D.; Xia, Y.; Whitesides, G.M. Soft lithography for micro-and nanoscale patterning. Nat. Protoc. 2010, 5, 491–502. [CrossRef]144. Yilmaz, F.; Gundogdu, M.Y. A critical review on blood flow in large arteries; relevance to blood rheology, viscosity models, and
physiologic conditions. Korea-Aust. Rheol. J. 2008, 20, 197–211.145. Matas, J.P.; Glezer, V.; Guazzelli, É.; Morris, J.F. Trains of particles in finite-Reynolds-number pipe flow. Phys. Fluids 2004,
16, 4192–4195. [CrossRef]146. Fåhræus, R. VOL. IX APRIL, 1929 No. 2. Physiol. Rev. 1929, 9, 241–274 .147. Fåhræus, R.; Lindqvist, T. The viscosity of the blood in narrow capillary tubes. Am. J. Physiol.- Content 1931, 96, 562–568.
[CrossRef]148. Stergiou, Y.G.; Keramydas, A.T.; Anastasiou, A.D.; Mouza, A.A.; Paras, S.V. Experimental and Numerical Study of Blood Flow in
μ-vessels: Influence of the Fahraeus–Lindqvist Effect. Fluids 2019, 4, 143. [CrossRef]149. Geislinger, T.M.; Franke, T. Hydrodynamic lift of vesicles and red blood cells in flow—From Fåhræus & Lindqvist to microfluidic
cell sorting. Adv. Colloid Interface Sci. 2014, 208, 161–176.150. Iss, C.; Midou, D.; Moreau, A.; Held, D.; Charrier, A.; Mendez, S.; Viallat, A.; Helfer, E. Self-organization of red blood cell
suspensions under confined 2D flows. Soft Matter 2019, 15, 2971–2980. [CrossRef]151. Lázaro, G.R.; Hernández-Machado, A.; Pagonabarraga, I. Collective behavior of red blood cells in confined channels. Eur. Phys. J.
E 2019, 42, 46. [CrossRef]152. Zhang, J.; Johnson, P.C.; Popel, A.S. Red blood cell aggregation and dissociation in shear flows simulated by lattice Boltzmann
method. J. Biomech. 2008, 41, 47–55. [CrossRef]153. Wang, T.; Pan, T.W.; Xing, Z.; Glowinski, R. Numerical simulation of rheology of red blood cell rouleaux in microchannels. Phys.
Rev. E 2009, 79, 041916. [CrossRef]154. Xu, D.; Kaliviotis, E.; Munjiza, A.; Avital, E.; Ji, C.; Williams, J. Large scale simulation of red blood cell aggregation in shear flows.
J. Biomech. 2013, 46, 1810–1817. [CrossRef]155. Tomaiuolo, G.; Lanotte, L.; D’Apolito, R.; Cassinese, A.; Guido, S. Microconfined flow behavior of red blood cells. Med. Eng. Phys.
2016, 38, 11–16. [CrossRef] [PubMed]156. Mehri, R.; Mavriplis, C.; Fenech, M. Red blood cell aggregates and their effect on non-Newtonian blood viscosity at low hematocrit
in a two-fluid low shear rate microfluidic system. PLoS ONE 2018, 13, e0199911. [CrossRef] [PubMed]157. Thiébaud, M.; Shen, Z.; Harting, J.; Misbah, C. Prediction of anomalous blood viscosity in confined shear flow. Phys. Rev. Lett.
2014, 112, 238304. [CrossRef] [PubMed]158. Viallat, A.; Abkarian, M. Red blood cell: From its mechanics to its motion in shear flow. Int. J. Lab. Hematol. 2014, 36, 237–243.
[CrossRef] [PubMed]159. Vijay, A.; Gertz, M.A. Waldenström macroglobulinemia. Blood J. Am. Soc. Hematol. 2007, 109, 5096–5103. [CrossRef] [PubMed]
123

Membranes 2022, 12, 217
160. Luquita, A.; Urli, L.; Svetaz, M.; Gennaro, A.M.; Volpintesta, R.; Palatnik, S.; Rasia, M. Erythrocyte aggregation in rheumatoidarthritis: Cell and plasma factor’s role. Clin. Hemorheol. Microcirc. 2009, 41, 49–56. [CrossRef] [PubMed]
161. Flormann, D.; Schirra, K.; Podgorski, T.; Wagner, C. On the rheology of red blood cell suspensions with different amounts ofdextran: Separating the effect of aggregation and increase in viscosity of the suspending phase. Rheol. Acta 2016, 55, 477–483.[CrossRef]
162. Gyawali, P.; Ziegler, D.; Cailhier, J.F.; Denault, A.; Cloutier, G. Quantitative measurement of erythrocyte aggregation as a systemicinflammatory marker by ultrasound imaging: A systematic review. Ultrasound Med. Biol. 2018, 44, 1303–1317. [CrossRef]
163. Le Devehat, C.; Vimeux, M.; Khodabandehlou, T. Blood rheology in patients with diabetes mellitus. Clin. Hemorheol. Microcirc.2004, 30, 297–300.
164. Li, Q.; Li, L.; Li, Y. Enhanced RBC aggregation in type 2 diabetes patients. J. Clin. Lab. Anal. 2015, 29, 387–389. [CrossRef]165. Presti, R.L.; Hopps, E.; Caimi, G. Hemorheological abnormalities in human arterial hypertension. Korea-Aust. Rheol. J. 2014,
26, 199–204. [CrossRef]166. Wiewiora, M.; Piecuch, J.; Gluck, M.; Slowinska-Lozynska, L.; Sosada, K. The effects of weight loss surgery on blood rheology in
severely obese patients. Surg. Obes. Relat. Dis. 2015, 11, 1307–1314. [CrossRef]167. Lowe, G.; Lee, A.; Rumley, A.; Price, J.; Fowkes, F. Blood viscosity and risk of cardiovascular events: The Edinburgh Artery Study.
Br. J. Haematol. 1997, 96, 168–173. [CrossRef]168. Bilgi, M.; Güllü, H.; Kozanoglu, I.; Özdogu, H.; Sezgin, N.; Sezgin, A.T.; Altay, H.; Erol, T.; Müderrisoglu, H. Evaluation of
blood rheology in patients with coronary slow flow or non-obstructive coronary artery disease. Clin. Hemorheol. Microcirc. 2012,53, 317–326. [CrossRef]
169. Sloop, G.; Holsworth Jr, R.E.; Weidman, J.J.; St Cyr, J.A. The role of chronic hyperviscosity in vascular disease. Ther. Adv.Cardiovasc. Dis. 2015, 9, 19–25. [CrossRef]
170. Kwaan, H.C.; Bongu, A. The hyperviscosity syndromes. Seminars in Thrombosis and Hemostasis; Thieme Medical Publishers, Inc.:Stuttgart, Germany, 1999; Volume 25, pp. 199–208.
171. Gertz, M.A. Acute hyperviscosity: Syndromes and management. Blood 2018, 132, 1379–1385. [CrossRef]172. Gallagher, P.G. Red cell membrane disorders. ASH Educ. Program Book 2005, 2005, 13–18. [CrossRef]173. Sloop, G.D.; De Mast, Q.; Pop, G.; Weidman, J.J.; Cyr, J.A.S. The role of blood viscosity in infectious diseases. Cureus 2020, 12,
e7090. [CrossRef]174. Chien, S.; Usami, S.; Bertles, J.F. Abnormal rheology of oxygenated blood in sickle cell anemia. J. Clin. Investig. 1970, 49, 623.
[CrossRef] [PubMed]175. Aich, A.; Lamarre, Y.; Sacomani, D.P.; Kashima, S.; Covas, D.T.; De la Torre, L.G. Microfluidics in Sickle Cell Disease Research:
State of the Art and a Perspective Beyond the Flow Problem. Front. Mol. Biosci. 2021, 7, 252. [CrossRef]176. Iragorri, M.A.L.; El Hoss, S.; Brousse, V.; Lefevre, S.D.; Dussiot, M.; Xu, T.; Ferreira, A.R.; Lamarre, Y.; Pinto, A.C.S.; Kashima, S.;
et al. A microfluidic approach to study the effect of mechanical stress on erythrocytes in sickle cell disease. Lab A Chip 2018,18, 2975–2984. [CrossRef] [PubMed]
177. Higgins, J.; Eddington, D.; Bhatia, S.; Mahadevan, L. Sickle cell vasoocclusion and rescue in a microfluidic device. Proc. Natl.Acad. Sci. USA 2007, 104, 20496–20500. [CrossRef] [PubMed]
178. Man, Y.; Kucukal, E.; An, R.; Watson, Q.D.; Bosch, J.; Zimmerman, P.A.; Little, J.A.; Gurkan, U.A. Microfluidic assessment of redblood cell mediated microvascular occlusion. Lab A Chip 2020, 20, 2086–2099. [CrossRef] [PubMed]
179. Wood, D.K.; Soriano, A.; Mahadevan, L.; Higgins, J.M.; Bhatia, S.N. A biophysical indicator of vaso-occlusive risk in sickle celldisease. Sci. Transl. Med. 2012, 4, 123ra26. [CrossRef]
180. Kucukal, E.; Man, Y.; Hill, A.; Liu, S.; Bode, A.; An, R.; Kadambi, J.; Little, J.A.; Gurkan, U.A. Whole blood viscosity and red bloodcell adhesion: Potential biomarkers for targeted and curative therapies in sickle cell disease. Am. J. Hematol. 2020, 95, 1246–1256.[CrossRef]
181. Clavería, V.; Connes, P.; Lanotte, L.; Renoux, C.; Joly, P.; Fort, R.; Gauthier, A.; Wagner, C.; Abkarian, M. In vitro red blood cellsegregation in sickle cell anemia. Front. Phys. 2021, 9, 712. [CrossRef]
182. Ilyas, S.; Simonson, A.E.; Asghar, W. Emerging point-of-care technologies for sickle cell disease diagnostics. Clin. Chim. Acta2020, 501, 85–91. [CrossRef]
183. Lu, X.; Chaudhury, A.; Higgins, J.M.; Wood, D.K. Oxygen-dependent flow of sickle trait blood as an in vitro therapeuticbenchmark for sickle cell disease treatments. Am. J. Hematol. 2018, 93, 1227–1235. [CrossRef]
184. Osorio, G. Libro Hematología. Diagnóstico y Terapéutica. Adultos y niños. Rev. Chil. Pediatr. 2019, 90, 458–459. [CrossRef]185. Xu, T.; Lizarralde-Iragorri, M.A.; Roman, J.; Ghasemi, R.; Lefevre, J.P.; Martincic, E.; Brousse, V.; Français, O.; El Nemer, W.;
Le Pioufle, B. Characterization of red blood cell microcirculatory parameters using a bioimpedance microfluidic device. Sci. Rep.2020, 10, 9869. [CrossRef]
186. Advani, R.; Sorenson, S.; Shinar, E.; Lande, W.; Rachmilewitz, E.; Schrier, S.L. Characterization and comparison of the red bloodcell membrane damage in severe human alpha-and beta-thalassemia. Blood 1992, 79, 1058–1063. [CrossRef]
187. Krishnevskaya, E.; Payan-Pernia, S.; Hernández-Rodríguez, I.; Sevilla, Á.F.R.; Serra, Á.A.; Morales-Indiano, C.; Ferrer, M.S.;Vives-Corrons, J.L. Distinguishing iron deficiency from beta-thalassemia trait by new generation ektacytometry. Int. J. Lab.Hematol. 2021, 43, e58–e60. [CrossRef]
124

Membranes 2022, 12, 217
188. Bessis, M.; Mohandas, N.; Feo, C. Automated ektacytometry: A new method of measuring red cell deformability and red cellindices. In Automation in Hematology; Springer: Berlin/Heidelberg, Germany, 1981; pp. 153–165.
189. Vives-Corrons, J.L.; Krishnevskaya, E.; Rodriguez, I.H.; Ancochea, A. Characterization of hereditary red blood cell membra-nopathies using combined targeted next-generation sequencing and osmotic gradient ektacytometry. Int. J. Hematol. 2021,113, 163–174. [CrossRef]
190. Gossett, D.R.; Henry, T.; Lee, S.A.; Ying, Y.; Lindgren, A.G.; Yang, O.O.; Rao, J.; Clark, A.T.; Di Carlo, D. Hydrodynamic stretchingof single cells for large population mechanical phenotyping. Proc. Natl. Acad. Sci. USA 2012, 109, 7630–7635. [CrossRef]
191. Reisbeck, M.; Helou, M.J.; Richter, L.; Kappes, B.; Friedrich, O.; Hayden, O. Magnetic fingerprints of rolling cells for quantitativeflow cytometry in whole blood. Sci. Rep. 2016, 6, 32838. [CrossRef]
192. Zheng, Y.; Nguyen, J.; Wang, C.; Sun, Y. Electrical measurement of red blood cell deformability on a microfluidic device. Lab AChip 2013, 13, 3275–3283. [CrossRef]
193. Lee, D.W.; Doh, I.; Kuypers, F.A.; Cho, Y.H. Sub-population analysis of deformability distribution in heterogeneous red blood cellpopulation. Biomed. Microdevices 2015, 17, 102. [CrossRef]
194. Rizzuto, V.; Mencattini, A.; Álvarez-González, B.; Di Giuseppe, D.; Martinelli, E.; Beneitez-Pastor, D.; del Mar Mañú-Pereira,M.; Lopez-Martinez, M.J.; Samitier, J. Combining microfluidics with machine learning algorithms for RBC classification in rarehereditary hemolytic anemia. Sci. Rep. 2021, 11, 13553. [CrossRef]
195. Méndez-Mora, L.; Cabello-Fusarés, M.; Ferré-Torres, J.; Riera-Llobet, C.; Krishnevskaya, E.; Trejo-Soto, C.; Payán-Pernía, S.;Hernández-Rodríguez, I.; Morales-Indiano, C.; Alarcón, T.; et al. Blood Rheological Characterization of β-Thalassemia Trait andIron Deficiency Anemia Using Front Microrheometry. Front. Physiol. 2021, 12, 761411 . [CrossRef]
196. Picot, J.; Ndour, P.A.; Lefevre, S.D.; El Nemer, W.; Tawfik, H.; Galimand, J.; Da Costa, L.; Ribeil, J.A.; de Montalembert, M.;Brousse, V.; et al. A biomimetic microfluidic chip to study the circulation and mechanical retention of red blood cells in the spleen.Am. J. Hematol. 2015, 90, 339–345. [CrossRef]
197. Dondorp, A.M.; Kager, P.A.; Vreeken, J.; White, N.J. Abnormal blood flow and red blood cell deformability in severe malaria.Parasitol. Today 2000, 16, 228–232. [CrossRef]
198. Hosseini, S.M.; Feng, J.J. How malaria parasites reduce the deformability of infected red blood cells. Biophys. J. 2012, 103, 1–10.[CrossRef]
199. Warkiani, M.E.; Tay, A.K.P.; Khoo, B.L.; Xiaofeng, X.; Han, J.; Lim, C.T. Malaria detection using inertial microfluidics. Lab A Chip2015, 15, 1101–1109. [CrossRef]
200. Tay, A.; Pavesi, A.; Yazdi, S.R.; Lim, C.T.; Warkiani, M.E. Advances in microfluidics in combating infectious diseases. Biotechnol.Adv. 2016, 34, 404–421. [CrossRef]
201. Reboud, J.; Xu, G.; Garrett, A.; Adriko, M.; Yang, Z.; Tukahebwa, E.M.; Rowell, C.; Cooper, J.M. based microfluidics for DNAdiagnostics of malaria in low resource underserved rural communities. Proc. Natl. Acad. Sci. USA 2019, 116, 4834–4842. [CrossRef]
202. Hou, H.W.; Bhagat, A.A.S.; Chong, A.G.L.; Mao, P.; Tan, K.S.W.; Han, J.; Lim, C.T. Deformability based cell margination—Asimple microfluidic design for malaria-infected erythrocyte separation. Lab A Chip 2010, 10, 2605–2613. [CrossRef]
203. Wu, W.T.; Martin, A.B.; Gandini, A.; Aubry, N.; Massoudi, M.; Antaki, J.F. Design of microfluidic channels for magnetic separationof malaria-infected red blood cells. Microfluid. Nanofluidics 2016, 20, 41. [CrossRef]
204. Elizalde-Torrent, A.; Trejo-Soto, C.; Méndez-Mora, L.; Nicolau, M.; Ezama, O.; Gualdrón-López, M.; Fernández-Becerra, C.;Alarcón, T.; Hernández-Machado, A.; Del Portillo, H.A. Pitting of malaria parasites in microfluidic devices mimicking spleeninterendothelial slits. Sci. Rep. 2021, 11, 22099. [CrossRef]
125

Citation: Hu, Z.; Marti, J. In Silico
Drug Design of Benzothiadiazine
Derivatives Interacting with
Phospholipid Cell Membranes.
Membranes 2022, 12, 331.
https://doi.org/10.3390/
membranes12030331
Academic Editor: Slawomir Sek
Received: 25 February 2022
Accepted: 15 March 2022
Published: 17 March 2022
Publisher’s Note: MDPI stays neutral
with regard to jurisdictional claims in
published maps and institutional affil-
iations.
Copyright: © 2022 by the authors.
Licensee MDPI, Basel, Switzerland.
This article is an open access article
distributed under the terms and
conditions of the Creative Commons
Attribution (CC BY) license (https://
creativecommons.org/licenses/by/
4.0/).
membranes
Article
In Silico Drug Design of Benzothiadiazine DerivativesInteracting with Phospholipid Cell Membranes
Zheyao Hu † and Jordi Marti *,†
Department of Physics, Polytechnic University of Catalonia-Barcelona Tech, B4-B5 Northern Campus UPC,08034 Barcelona, Spain; [email protected]* Correspondence: [email protected]† These authors contributed equally to this work.
Abstract: The use of drugs derived from benzothiadiazine, a bicyclic heterocyclic benzene derivative,has become a widespread treatment for diseases such as hypertension, low blood sugar or thehuman immunodeficiency virus, among others. In this work we have investigated the interactions ofbenzothiadiazine and four of its derivatives designed in silico with model zwitterionic cell membranesformed by dioleoylphosphatidylcholine, 1,2-dioleoyl-sn-glycero-3-phosphoserine and cholesterol atthe liquid–crystal phase inside aqueous potassium chloride solution. We have elucidated the localstructure of benzothiadiazine by means of microsecond molecular dynamics simulations of systemsincluding a benzothiadiazine molecule or one of its derivatives. Such derivatives were obtained by thesubstitution of a single hydrogen site of benzothiadiazine by two different classes of chemical groups,one of them electron-donating groups (methyl and ethyl) and another one by electron-acceptinggroups (fluorine and trifluoromethyl). Our data have revealed that benzothiadiazine derivativeshave a strong affinity to stay at the cell membrane interface although their solvation characteristicscan vary significantly—they can be fully solvated by water in short periods of time or continuouslyattached to specific lipid sites during intervals of 10–70 ns. Furthermore, benzothiadiazines are ableto bind lipids and cholesterol chains by means of single and double hydrogen-bonds of characteristiclengths between 1.6 and 2.1 Å.
Keywords: benzothiadiazine derivatives; drug design; molecular dynamics; phospholipid membrane
1. Introduction
Plasma membranes are fundamental in the behavior of human cells, being not onlyresponsible for the interactions between the cell and its environment but also for processessuch as cellular signaling [1], enzyme catalysis [2], endocytosis [3] and transport, amongothers. The main structure of the cell membrane is composed of bilayer phospholipidsincluding sterols, proteins, glycolipids and a wide variety of other biological molecules.High compositional complexity and versatility of membranes are closely related to theenvironment and the physiological state of cells [4,5] so that many diseases such as cancer,cardiopathies, diabetes, atherosclerosis, infectious diseases or neurodegenerative patholo-gies are accompanied by changes in the composition of cell membranes [6–9]. For such areason, the knowledge of the behavior of drugs interacting with different membrane com-ponents and their distribution in damaged tissues maybe key to improving drug efficiencyand the therapy of the diseases and it has become a topic of greatest scientific interest.
It is well known that the composition of cell membranes in different tissues and organsof the human body exhibits large variations. In the treatment of diseases, an efficient drugdesign could enhance the interaction of active pharmaceutical ingredients with membranecomponents in specific tissues helping to reach the target site successfully. Thus, there is agreat demand for a full understanding of the rules of drug–membrane interactions, whichmay help us predict the distribution and curative effect of drugs in the body when it comes
Membranes 2022, 12, 331. https://doi.org/10.3390/membranes12030331 https://www.mdpi.com/journal/membranes127
Membranes 2022, 12, 331
to the designing and testing of new drug molecules. Generally, medicinal chemists tendedto overcome the difficulty of drugs in entering cells or crossing biological barriers, such asthe blood–brain barrier [10–12] by modifying their structures to enhance the lipophilicity ofdrugs. However, little research has been performed on the influence of drug structure on therule of drug–membrane interaction, notably the direct information on atomic interactionsof drug-membrane systems at the all-atom level. In this work we establish a procedure forthe in silico design of derivatives of the well-known family of benzothiadiazines.
Heterocyclic compounds are ubiquitous in the structure of drug molecules [13,14]playing an important role in human life [15,16]. Such compounds are common parts ofcommercial drugs having multiple applications based on the control of lipophilicity, po-larity and molecular hydrogen bonding capacity. Among them, benzothiadiazine and itsderivatives have wide pharmacological applications, such as diuretic [17], anti-viral [18],anti-inflammatory [19], regulating the central nervous system [20] and, more recently, asanti-cancer agents [21–23]. In addition to the above-mentioned biopharmacological activi-ties, benzothiadiazine derivatives also have bio-activity such as Factor Xa inhibition [24],anti-Mycobacterium [25,26] and anti-benign prostatic hyperplasia [27]. 3,4-dihydro-1,2,4-benzothiadiazine-1,1-dioxide (DBD) being the main common structure of the benzoth-iadiazine family was investigated in a previous work [28] to elucidate the mechanismsresponsible for the interactions of DBD with the basic components of cell membranes inall-atom level for the first time. In the present work, our aim was to design in silico DBDderivatives that may be employed with the purpose of inhibiting a limited variety of tumorsproduced by the oncogenic protein KRas-4B (such as pancreatic, lung or colorectal [29,30]),work currently in progress in our lab. For such a purpose, it has been found convenientto model the substrate cell membrane with DOPC/DOPS lipids, since these particularcomponents are most relevant for the absorption of the oncogene at the cell membrane’sinterface (see for instance [31,32]). Further, in an effort to produce a more realistic setup,we decided to include cholesterol in the membrane model. Cholesterol constitutes about33.3% of the outer leaflet in healthy colorectal cells [33], which is in good agreement withthe 30% of cholesterol adopted in this work. We have already observed [28] that DBDhas a strong affinity to the DOPC species of lipids and that it is also able to bind othermembrane components by single and double hydrogen bonds. In this paper, we modifiedDBD and evaluated the effect of different substitutes on the affinity of the DBD to cellmembrane components.
2. Methods
Five models of lipid bilayer membranes in aqueous solution have been constructedusing the CHARMM-GUI web-based tool [34,35]. The membrane components and theamount of particles of each class are as follows: all systems include one single DBD deriva-tive, 112 neutral DOPC lipids, 28 DOPS associated with K+ (DOPS-K) lipids, 60 cholesterolmolecules, 49 potassium ions, 21 chlorine ions and 10,000 water molecules. The lipidshave been distributed in two symmetric leaflets embedded inside an electrolyte potassium–chloride solution at 0.15 M concentration. We have considered five different setups, whereonly the benzothiadiazine derivative is different in each case. We considered a previouslyinvestigated [28] standard DBD species as the reference (DBD1) and four more DBD deriva-tives (DBD2, DBD3, DBD4 and DBD5), designed by ourselves using in silico techniques.The way we designed the new DBD species followed the fact that medicinal chemistsmodify the chemical structure of the drug for the purpose of improving its therapeuticeffect, reducing toxicity and side effects. The modification method depends on the structureof the drug. Generally, when performing the structure modification, the basic structureof the drug will remain unchanged and only some functional group will change. Whenthe drug acts, the binding methods of drug and receptor form a reversible complex andare generally by ionic bond, hydrogen bond or covalent bond. In a previous work [28]we observed that DBD can form hydrogen bonds (HB) and become absorbed by the cellmembrane with DBD having strong affinity for DOPC. ‘H2’ and ‘H4’ sites of DBD are
128

Membranes 2022, 12, 331
important for the formation of such HB with membrane components. The ‘R’ site (shownin Figure 1) is very close to the ‘H2’ and ‘H4’ sites so that the size, electronegativity andother properties of the R substituent will affect the ability of ‘H2’/‘H4’ to form hydrogenbonds with cell membrane components. So, with the tool of CHARMM-GUI platform“Ligand Reader & Modeller”, we introduced methyl, ethyl, fluorine and trifluoromethylinto this site in order to assess the effect of new drug structures on the behavior of DBD incell membranes.
Sketches of all species are reported in Figure 1. Each DBD species and each phospho-lipid was described with atomic resolution (DBD1 and DBD4 have 20 sites, DBD2 and DBD5have 23 sites, DBD3 has 26 sites, DOPC has 138 sites, DOPS has 131 sites and cholesterol has74 sites). In all simulations water has been represented by rigid 3-site TIP3P [36] molecules,included in the CHARMM36 force field [37,38], that was adopted for lipid—lipid andlipid—protein interactions. In particular, we selected the version CHARMM36m [39],which is able to reproduce the area per lipid for the most relevant phospholipid membranesin excellent agreement with experimental data. The parameterization of the DBD specieswas performed by means of the “Ligand Reader & Modeller” tool in CHARMM-GUIplatform (https://charmm-gui.org/?doc=input/ligandrm, accessed on 31 December 2021).All bonds involving hydrogen atoms were set to fixed lengths, allowing fluctuations ofbond distances and angles for the remaining atoms. Van der Waals interactions were cut offat 12 Å with a smooth switching function starting at 10 Å. Finally, long-ranged electrostaticforces were computed using the particle mesh Ewald method [40], with a grid space of 1 Å,updating electrostatic interactions every time step of the simulation runs.
OH
Cholesterol
O
OO
O
OPO
O
O
N
O
OO
O
OPO
O
O
K
H3N
H
HH
H
N
NS
O O
32
22
11
1213
14
13
14
11
1222
32
1211
2
4
DOPC
DOPS-K
O
O
H
H
R
H
R =DBD1: —HDBD2: —CH3DBD3: —CH2CH3DBD4: —FDBD5: —CF3
DBDs
Figure 1. Chemical structures of benzothiadiazine derivatives, phospholipids and cholesterol. Site ‘R’stands for the five DBD derivatives considered in the present work.
Molecular dynamics (MD) simulations have been revealed to be a very reliable toolfor the simulation of the microscopic structure and dynamics of all sorts of condensed
129

Membranes 2022, 12, 331
systems, such as aqueous solutions in bulk or under confinement [41–47] towards model cellmembranes in electrolyte solution [48–50] and, more recently, small-molecule and proteinsystems attached to phospholipid membranes [51–53]. Five sets of MD runs were performedby means of the GROMACS2021 simulation package [54–58]. We run all the simulations atthe fixed pressure of 1 atm and at the temperature of 310.15 K, typical of the human bodyand also well above the crossover temperatures for pure DOPC and DOPS needed to beat the liquid crystal phase (253 and 262 K, respectively) [59]. In all cases, the temperaturewas controlled by a Nose–Hoover thermostat [60] with a damping coefficient of 1 ps−1,whereas the pressure was controlled by a Parrinello–Rahman barostat [61] with a dampingtime of 5 ps. In the isobaric—isothermal ensemble, i.e., under the condition of a constantnumber of particles, pressure and temperature, equilibration periods for all simulationswere around 200 ns. In all cases, we recorded statistically meaningful trajectories of 600 ns.The simulation boxes had the same size in all cases, i.e., 78.1 × 78.1× 95.7 Å3. We haveconsidered periodic boundary conditions in the three directions of space. The simulationtime step was fixed to 2 fs in all cases.
3. Results and Discussion
3.1. Characteristics of the Bilayer Systems
The phospholipid bilayer considered in this work was previously simulated and itsmain characteristics were reported [28,30]. We found reliable values of the area per lipidA and the thickness Δz of the membranes to be in qualitative agreement with availableexperimental data. In order to corroborate these results in the present work where thesystem contains DBD derivatives, we computed A and Δz as usual, considering the totalsurface along the XY plane (plane along the bilayer surface) divided by the number oflipids and cholesterol in one single leaflet [62] and the difference between the z-coordinatesof the phosphorus atoms of the two leaflets, respectively. The results of the averagedvalues obtained from the 600 ns production runs are reported in Table 1, whereas the timeevolution of both properties is displayed in Figure 2.
Table 1. Area/lipid A and thickness Δz of the systems simulated in this work, given in Å2 and Åunits, respectively. Estimated errors based on standard deviations correspond to the last significantfigures, i.e., ±0.01 in each case.
DBD Derivative A Δz
DBD1 52.18 43.04DBD2 52.20 43.02DBD3 52.23 42.98DBD4 52.19 43.02DBD5 52.23 42.97
The results shown in Figure 2 indicate that the simulated trajectories were well equili-brated in all cases. The comparison with previous results indicates that the effect of DBDderivatives on the area per lipid and thickness of the membrane is totally marginal. Firstly,the averaged result of A = 52.2 Å2 in all cases matches perfectly the previous reportedvalue of 52.0 Å2 [30] (where a large protein was embedded in the system) and also theexperimental value of 54.4 Å2 reported by Nagle et al. [63]. Area/lipid shows fluctuationsaround 5% of the averaged values. Secondly, thickness of the membranes are also in goodqualitative agreement with previous works: from Figure 2 we observe fluctuations less than5% of the averaged values, of around 43.0 Å, as expected. Such value is in qualitative agree-ment with the experimental measurement of Δz = 40 Å for the DOPC-cholesterol (30%)bilayer, as reported by Nagle et al. [63] and it matches the previously found Δz = 43.0 Åobtained in previous simulations for the DOPC/DOPS/cholesterol membrane [30].
130
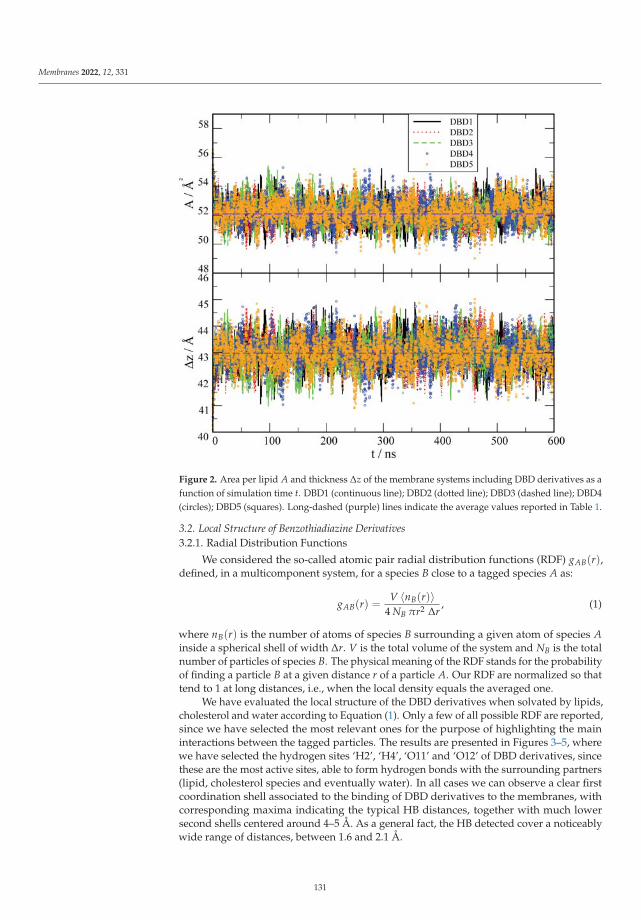
Membranes 2022, 12, 331
Figure 2. Area per lipid A and thickness Δz of the membrane systems including DBD derivatives as afunction of simulation time t. DBD1 (continuous line); DBD2 (dotted line); DBD3 (dashed line); DBD4(circles); DBD5 (squares). Long-dashed (purple) lines indicate the average values reported in Table 1.
3.2. Local Structure of Benzothiadiazine Derivatives3.2.1. Radial Distribution Functions
We considered the so-called atomic pair radial distribution functions (RDF) gAB(r),defined, in a multicomponent system, for a species B close to a tagged species A as:
gAB(r) =V 〈nB(r)〉
4 NB πr2 Δr, (1)
where nB(r) is the number of atoms of species B surrounding a given atom of species Ainside a spherical shell of width Δr. V is the total volume of the system and NB is the totalnumber of particles of species B. The physical meaning of the RDF stands for the probabilityof finding a particle B at a given distance r of a particle A. Our RDF are normalized so thattend to 1 at long distances, i.e., when the local density equals the averaged one.
We have evaluated the local structure of the DBD derivatives when solvated by lipids,cholesterol and water according to Equation (1). Only a few of all possible RDF are reported,since we have selected the most relevant ones for the purpose of highlighting the maininteractions between the tagged particles. The results are presented in Figures 3–5, wherewe have selected the hydrogen sites ‘H2’, ‘H4’, ‘O11’ and ‘O12’ of DBD derivatives, sincethese are the most active sites, able to form hydrogen bonds with the surrounding partners(lipid, cholesterol species and eventually water). In all cases we can observe a clear firstcoordination shell associated to the binding of DBD derivatives to the membranes, withcorresponding maxima indicating the typical HB distances, together with much lowersecond shells centered around 4–5 Å. As a general fact, the HB detected cover a noticeablywide range of distances, between 1.6 and 2.1 Å.
131

Membranes 2022, 12, 331
Figure 3. Radial distribution functions between site ‘H2’ of DBD derivatives and selected oxygensites in DOPC and DOPS phospholipids. Sites ‘O13-14’ stand for head groups of the cell membranephospholipids and sites ‘O22-32’ stand for tail groups located deeper in the membrane interface.
The structure of DBD derivatives described by their ‘H2’ site (see Figure 1) indicates theexistence of HB formed by ‘H2’ and several sorts of lipid oxygen sites and it is representedin Figure 3. We can notice that the typical HB length is of 1.7 Å in all cases, both forthe binding with oxygen atoms of the phosphoryl group ‘O13-14’ (located at the headgroups of DOPC and DOPS, with both oxygen sites sharing a negative charge) and forthe binding with sites ‘O22-32’ (located in the tail groups of the lipids) as well. This is thetypical distance of the binding of small-molecules to cell membranes, such as tryptophanto dipalmytoilphosphatidylcholine (see for instance the review [64]). It should be pointedout that using fluorescence spectroscopy, Liu et al. [65] obtained values for the HB lengthsof tryptophan-water between 1.6 and 2.1 Å, i.e., of the same range as those reported here.
This indicates that: (1) all sorts of DBD derivatives can bind the membranes at bothhead and tail groups and (2) depending on the oxygen sites, some derivatives are able tocreate HB stronger than others; however, the strength of the HB binding is not uniformand it clearly depends of the class of derivative and lipid chain involved. Despite we willqualitatively analyze the strength of the HB in Section 3.2.2, we can give some general clueshere. For instance, DBD2 is able to bind DOPC more strongly than DBD1 (species that wewill consider as the reference), with the remaining derivatives making bonds of similarstrength. Nevertheless, when DOPS is concerned, all derivatives form stronger HB thanDBD1, with DBD3 the strongest. Similar trends are observed when the internal tail groupsites ‘O22-32’ are analyzed: DBD5 makes the strongest HB with DOPC and DBD4 makesthe strongest bond with DOPS. In this latter case, the enhancement of the HB is milderthan it occurred in the former case (head group bindings). Overall, we can observe thatthe one-site modifications proposed with the design of the new DBD-derivatives reportedin this work has produced significant changes and enhancement of the HB connections to
132
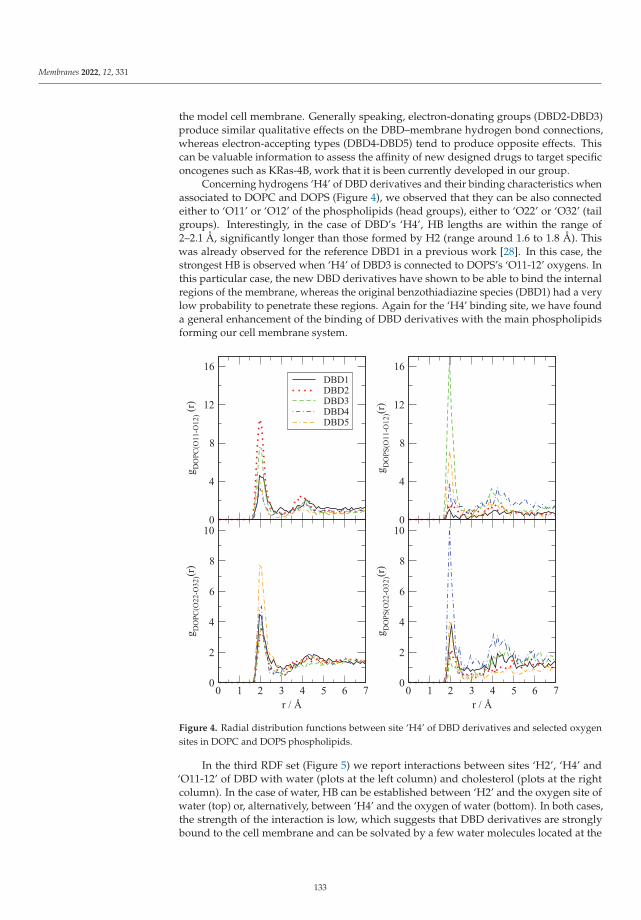
Membranes 2022, 12, 331
the model cell membrane. Generally speaking, electron-donating groups (DBD2-DBD3)produce similar qualitative effects on the DBD–membrane hydrogen bond connections,whereas electron-accepting types (DBD4-DBD5) tend to produce opposite effects. Thiscan be valuable information to assess the affinity of new designed drugs to target specificoncogenes such as KRas-4B, work that it is been currently developed in our group.
Concerning hydrogens ‘H4’ of DBD derivatives and their binding characteristics whenassociated to DOPC and DOPS (Figure 4), we observed that they can be also connectedeither to ‘O11’ or ‘O12’ of the phospholipids (head groups), either to ‘O22’ or ‘O32’ (tailgroups). Interestingly, in the case of DBD’s ‘H4’, HB lengths are within the range of2–2.1 Å, significantly longer than those formed by H2 (range around 1.6 to 1.8 Å). Thiswas already observed for the reference DBD1 in a previous work [28]. In this case, thestrongest HB is observed when ‘H4’ of DBD3 is connected to DOPS’s ‘O11-12’ oxygens. Inthis particular case, the new DBD derivatives have shown to be able to bind the internalregions of the membrane, whereas the original benzothiadiazine species (DBD1) had a verylow probability to penetrate these regions. Again for the ‘H4’ binding site, we have founda general enhancement of the binding of DBD derivatives with the main phospholipidsforming our cell membrane system.
Figure 4. Radial distribution functions between site ‘H4’ of DBD derivatives and selected oxygensites in DOPC and DOPS phospholipids.
In the third RDF set (Figure 5) we report interactions between sites ‘H2’, ‘H4’ and‘O11-12’ of DBD with water (plots at the left column) and cholesterol (plots at the rightcolumn). In the case of water, HB can be established between ‘H2’ and the oxygen site ofwater (top) or, alternatively, between ‘H4’ and the oxygen of water (bottom). In both cases,the strength of the interaction is low, which suggests that DBD derivatives are stronglybound to the cell membrane and can be solvated by a few water molecules located at the
133
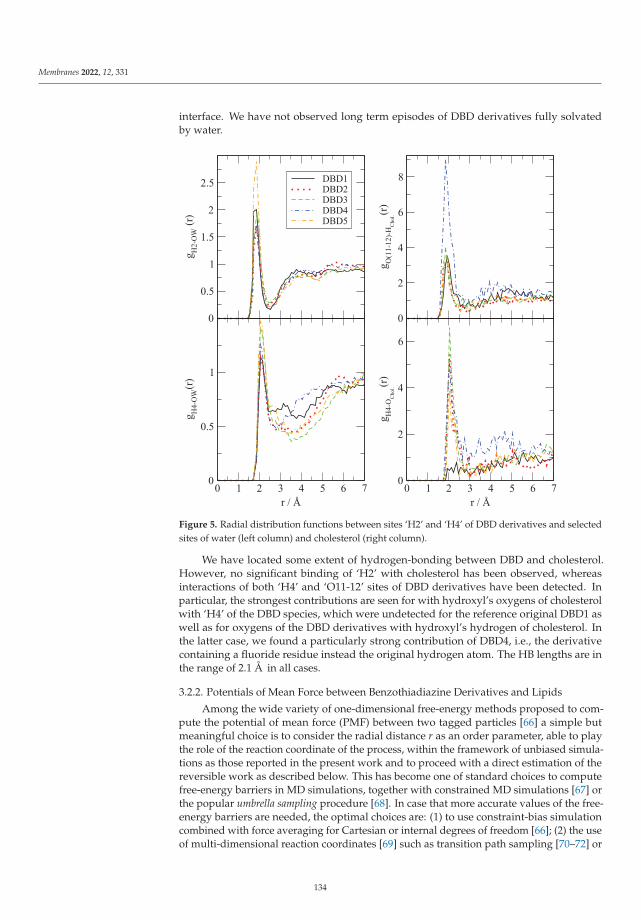
Membranes 2022, 12, 331
interface. We have not observed long term episodes of DBD derivatives fully solvatedby water.
Figure 5. Radial distribution functions between sites ‘H2’ and ‘H4’ of DBD derivatives and selectedsites of water (left column) and cholesterol (right column).
We have located some extent of hydrogen-bonding between DBD and cholesterol.However, no significant binding of ‘H2’ with cholesterol has been observed, whereasinteractions of both ‘H4’ and ‘O11-12’ sites of DBD derivatives have been detected. Inparticular, the strongest contributions are seen for with hydroxyl’s oxygens of cholesterolwith ‘H4’ of the DBD species, which were undetected for the reference original DBD1 aswell as for oxygens of the DBD derivatives with hydroxyl’s hydrogen of cholesterol. Inthe latter case, we found a particularly strong contribution of DBD4, i.e., the derivativecontaining a fluoride residue instead the original hydrogen atom. The HB lengths are inthe range of 2.1 Å in all cases.
3.2.2. Potentials of Mean Force between Benzothiadiazine Derivatives and Lipids
Among the wide variety of one-dimensional free-energy methods proposed to com-pute the potential of mean force (PMF) between two tagged particles [66] a simple butmeaningful choice is to consider the radial distance r as an order parameter, able to playthe role of the reaction coordinate of the process, within the framework of unbiased simula-tions as those reported in the present work and to proceed with a direct estimation of thereversible work as described below. This has become one of standard choices to computefree-energy barriers in MD simulations, together with constrained MD simulations [67] orthe popular umbrella sampling procedure [68]. In case that more accurate values of the free-energy barriers are needed, the optimal choices are: (1) to use constraint-bias simulationcombined with force averaging for Cartesian or internal degrees of freedom [66]; (2) the useof multi-dimensional reaction coordinates [69] such as transition path sampling [70–72] or
134

Membranes 2022, 12, 331
(3) considering collective variables, such as metadynamics [30,73] although such methodsrequire a huge amount of computational time. Since the determination of reaction coordi-nates for the binding of DBD at zwitterionic membranes is out of the scope of this work,we limit ourselves to use radial distances between two species as our order parameters toperform reversible work calculations.
In this framework, a good approximation of the PMF can be obtained by means ofthe reversible work WAB(r) required to move two tagged particles (A, B) from infiniteseparation to a relative separation r (see for instance Ref. [74], chapter 7):
WAB(r) = − 1β
ln gAB(r), (2)
where β = 1/(kBT) is the Boltzmann factor, kB the Boltzmann constant and T the temper-ature. In the calculations reported here, the radial distance r is the distance used in thecorresponding RDF (Section 3.2) i.e., it is not related to the atom position relative to thecenter of the membrane. All free-energy barriers are simply defined (in kBT units) by a neatfirst minimum and a first maximum of each W(r), with barrier size ΔW obtained as thedifference between the former. As a sort of example, we present the free-energy barrierswith largest values for each DBD species in Figure 6.
Figure 6. Potentials of mean force for the binding of ‘H2’ sites of DBD derivatives to the sites ‘O13-14’of DOPC and DOPS.
The full set of free-energy barriers for a wide selection of bound pairs has beenreported in Table 2. There we can observe overall barriers between 1.2 and 5.2 kBT, whichcorrespond to 0.7–3.1 kcal/mol, for the simulated temperature of 310.15 K. We observestable binding distances (given by the position of the first minima of the PMF) matchingthe typical hydrogen-bond distances, as expected. As a reference, it is known that thetypical energy of water–water hydrogen-bonds estimated from ab initio calculations is of4.9 kcal/mol for a water dimer in vacuum [75], whereas in our model system (includingTIP3P water) the barrier associated to the HB signature, given by the first maximum of
135

Membranes 2022, 12, 331
water’s oxygen–hydrogen RDF, is of 1.1 kcal/mol. This low value can be directly associatedwith two facts: (1) first, we have estimated this energy in the bulk, condensed phase of theaqueous ionic solvent, whereas the reference value of Feyereisen et al. [75] correspondsto an isolated water dimer, i.e., can be related to gas phase; (2) secondly, the TIP3P watermodel included in the CHARMM36 force field is well known to have significant drawbacksto describe liquid water [76].
Table 2. Free-energy barriers ΔW (in kBT) from reversible work calculations for the binding of DBDto cholesterol, lipids and water. In order to quantify the height of all barriers, 1 kBT = 0.596 kcal/mol.Labels as indicated in Figure 1. Estimated errors of ±0.1 in all cases.
DBD Site Lipid SiteΔW
DBD1 DBD2 DBD3 DBD4 DBD5
H2 O13-14 DOPC 4.2 4.0 4.0 4.2 5.2H2 O22-32 DOPC 3.4 3.2 2.5 4.4 3.7H2 O13-14 DOPS 4.2 3.8 5.0 4.7 4.7H2 O22-32 DOPS 2.8 3.5 3.3 3.0 2.2H4 O11 DOPC 2.0 2.5 2.4 1.9 3.1H4 O22-32 DOPC 1.6 2.2 1.9 2.3 2.3H4 O11 DOPS 2.3 1.2 3.5 1.8 3.8H4 O22-32 DOPS 1.8 1.6 2.0 4.0 3.9H4 O Cholesterol 1.2 3.2 2.9 2.4 3.4
O11-12 H Cholesterol 1.8 2.4 2.2 2.6 2.3
In an earlier work [28] we reported by the first time DBD–membrane related free-energy barriers. For the sake of comparison with other similar systems, we can remarkthat the PMF of tryptophan in a di-oleoyl-phosphatidyl-choline bilayer membrane showsa barrier of the order of 4 kcal/mol [77], whereas the barrier for the movement of trypto-phan attached to a poly-leucine α-helix inside a DPPC membrane was reported to be of3 kcal/mol [78]. Finally, neurotransmitters such as glycine, acetylcholine or glutamate werereported to show small barriers of about 0.5–1.2 kcal/mol when located close to the lipidglycerol backbone [79]. These values could further indicate that our estimations match wellthe order of magnitude of the free-energy barriers for other small-molecules of similar size.
We designed two sets of DBD derivatives according to their characteristics: in DBD2and DBD3 we replaced a hydrogen by electron-donating groups (methyl and ethyl, re-spectively) whereas in DBD4 and DBD5 we replaced a hydrogen by electron-acceptinggroups (fluorine and trifluoromethyl, respectively). Regardless of the type of replacementconsidered, our general result is that most of the barriers are in the range of 1–5 kcal/mol,regardless of the specific derivative considered. As more specific features, we can observethat the barriers corresponding to the HB formed by the residue ‘H2’ of the DBD deriva-tives are overall larger than those related to the hydrogen-bonds formed by ‘H4’, whichsuggests that ‘H2’ is the most stable binding site between DBD species and the modelcell membranes considered in this work. Among the five DBD species analyzed we canobserve that, regarding the ‘H2’ site of DBD, interactions of its derivatives with DOPCare about 10% stronger that those with DOPS but when ‘H4’ is concerned, the strengthof its HB with DOPC is weaker than those with DOPS only when the tail groups ‘O22-32’are considered. Nevertheless, the barriers of ‘H4’ to head groups are of similar size forboth DOPC and DOPS. Further, we should remark a gross feature based on the class ofsubstitution: derivatives DBD2 and DBD3 (where the -H group of the original DBD1 wasreplaced by electron-donating groups) show similar free-energy barriers and close to thevalues obtained for DBD1, whereas derivatives DBD4 and DBD5 (where the -H group of theoriginal DBD1 was replaced by electron-accepting groups) also show similar free-energybarriers but less similar to the values obtained for DBD1. Finally, the binding of DBD withcholesterol is revealed to be sensibly weaker than that to DOPC and DOPS.
136
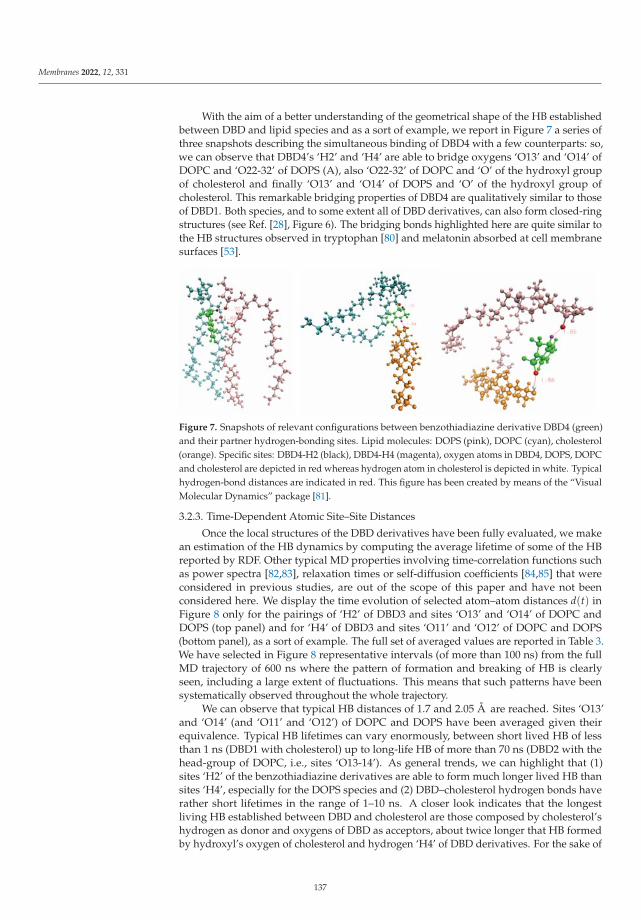
Membranes 2022, 12, 331
With the aim of a better understanding of the geometrical shape of the HB establishedbetween DBD and lipid species and as a sort of example, we report in Figure 7 a series ofthree snapshots describing the simultaneous binding of DBD4 with a few counterparts: so,we can observe that DBD4’s ‘H2’ and ‘H4’ are able to bridge oxygens ‘O13’ and ‘O14’ ofDOPC and ‘O22-32’ of DOPS (A), also ‘O22-32’ of DOPC and ‘O’ of the hydroxyl groupof cholesterol and finally ‘O13’ and ‘O14’ of DOPS and ‘O’ of the hydroxyl group ofcholesterol. This remarkable bridging properties of DBD4 are qualitatively similar to thoseof DBD1. Both species, and to some extent all of DBD derivatives, can also form closed-ringstructures (see Ref. [28], Figure 6). The bridging bonds highlighted here are quite similar tothe HB structures observed in tryptophan [80] and melatonin absorbed at cell membranesurfaces [53].
Figure 7. Snapshots of relevant configurations between benzothiadiazine derivative DBD4 (green)and their partner hydrogen-bonding sites. Lipid molecules: DOPS (pink), DOPC (cyan), cholesterol(orange). Specific sites: DBD4-H2 (black), DBD4-H4 (magenta), oxygen atoms in DBD4, DOPS, DOPCand cholesterol are depicted in red whereas hydrogen atom in cholesterol is depicted in white. Typicalhydrogen-bond distances are indicated in red. This figure has been created by means of the “VisualMolecular Dynamics” package [81].
3.2.3. Time-Dependent Atomic Site–Site Distances
Once the local structures of the DBD derivatives have been fully evaluated, we makean estimation of the HB dynamics by computing the average lifetime of some of the HBreported by RDF. Other typical MD properties involving time-correlation functions suchas power spectra [82,83], relaxation times or self-diffusion coefficients [84,85] that wereconsidered in previous studies, are out of the scope of this paper and have not beenconsidered here. We display the time evolution of selected atom–atom distances d(t) inFigure 8 only for the pairings of ‘H2’ of DBD3 and sites ‘O13’ and ‘O14’ of DOPC andDOPS (top panel) and for ‘H4’ of DBD3 and sites ‘O11’ and ‘O12’ of DOPC and DOPS(bottom panel), as a sort of example. The full set of averaged values are reported in Table 3.We have selected in Figure 8 representative intervals (of more than 100 ns) from the fullMD trajectory of 600 ns where the pattern of formation and breaking of HB is clearlyseen, including a large extent of fluctuations. This means that such patterns have beensystematically observed throughout the whole trajectory.
We can observe that typical HB distances of 1.7 and 2.05 Å are reached. Sites ‘O13’and ‘O14’ (and ‘O11’ and ‘O12’) of DOPC and DOPS have been averaged given theirequivalence. Typical HB lifetimes can vary enormously, between short lived HB of lessthan 1 ns (DBD1 with cholesterol) up to long-life HB of more than 70 ns (DBD2 with thehead-group of DOPC, i.e., sites ‘O13-14’). As general trends, we can highlight that (1)sites ‘H2’ of the benzothiadiazine derivatives are able to form much longer lived HB thansites ‘H4’, especially for the DOPS species and (2) DBD–cholesterol hydrogen bonds haverather short lifetimes in the range of 1–10 ns. A closer look indicates that the longestliving HB established between DBD and cholesterol are those composed by cholesterol’shydrogen as donor and oxygens of DBD as acceptors, about twice longer that HB formedby hydroxyl’s oxygen of cholesterol and hydrogen ‘H4’ of DBD derivatives. For the sake of
137

Membranes 2022, 12, 331
comparison, we should remark that the typical lifetime of hydrogen-bonds in pure waterhas been estimated to be of the order of 1 ps [86]. Finally, we should indicate that the shorterlifetimes reported in a previous work where DBD1 was studied [28] must be attributed tothe shorter trajectories considered there and, especially, to the fact that some lifetimes wereestimated without taking into account short-lived breaking and reformation of HB, as wedid in the present work.
Figure 8. Time evolution of distances between selected sites of DBD3 (‘H2’, ‘H4’) and their partneroxygen sites of DOPC and DOPS.
Table 3. Averaged distances (in Å) between selected sites of DBD and the membrane. Continuoustime intervals (τ, in ns) have been obtained from averaged computations along the 600 ns trajectory.Labels as indicated in Figure 1. Estimated errors of ±0.1 in all cases.
DBD Site Lipid Site Distance τDBD1 τDBD2 τDBD3 τDBD4 τDBD5
H2 O13-14 DOPC 1.7 67.4 73.7 63.2 28.4 38.5H2 O22-32 DOPC 1.8 20.4 11.8 12.3 19.4 24.6H2 O13-14 DOPS 1.7 6.9 8.8 27.0 9.6 9.7H2 O22-32 DOPS 1.8 1.4 1.9 2.3 3.1 0.9H4 O11-12 DOPC 1.9 42.5 64.4 61.5 15.6 35.9H4 O22-32 DOPC 2.0 16.5 14.0 13.0 16.6 28.4H4 O11-12 DOPS 1.9 1.3 1.9 24.8 1.9 6.4H4 O22-32 DOPS 2.0 1.8 1.4 0.9 2.6 1.9H4 O Cholesterol 2.0 0.5 3.4 4.4 3.7 3.6
O11-12 H Cholesterol 1.9 4.6 4.5 6.6 10.3 6.0
138

Membranes 2022, 12, 331
4. Conclusions
We report results from molecular dynamics simulations of benzothiadiazine deriva-tives embedded in a phospholipid bilayer membrane formed by 200 lipid molecules withconcentrations of 56% of DOPC, 14% of DOPS and 30% of cholesterol in aqueous potassiumchloride solution using the CHARMM36m force field. Starting from a standard 3,4-dihydro-1,2,4-benzothiadiazine-1,1-dioxide molecule we have designed in silico four derivativesbased on the replacement of a single hydrogen atom by two different classes of chemicalgroups, one of them electron-donating groups (methyl and ethyl) and another one byelectron-accepting groups (fluorine and trifluoromethyl). The electronegativity of thesetwo groups is very different: whereas the electronegativity of electron-donating groupsis smaller than that of hydrogen atoms, the electronegativity of electron-accepting groupsis larger. In this paper, the electronegativity of methyl and ethyl groups, being smallerthan that of hydrogen has the inductive effect of electron donation, which will increasethe electron density of the DBD molecule to a certain extent. On the contrary, fluorineand trifluoromethyl will reduce the electron density of the molecule. When the hydrogenof the C-H bond in the DBD molecule is replaced by a substituent, the electron densitydistribution of the molecule changes, which has significant impact on the formation ofhydrogen bonds between the drug and cell membrane components, as it has been reportedin the present work.
As a gross feature, the same class of chemical groups produce similar effects on theHB between DBD and cell membranes, whereas different types tend to produce overallopposite effects. With this kind of study our aim is to elucidate the effects of differentchemical groups on DBD–cell interactions. Our analysis is based on the computation of thelocal structures of the DBD derivatives when associated to lipids, water and cholesterolmolecules. After the systematic analysis of meaningful data, we have found that the locationof DBD at the interface of the membrane is permanent. We have computed RDF definedfor the most reactive particles, especially hydrogens ‘H2’ and ‘H4’ and oxygens ‘O11-12’ ofDBD (see Figure 1) correlated with sites of lipids and cholesterol able to form HB with DBD.All RDF have shown a strong first coordination shell and a weak second coordination shellfor all DBD–lipid structures. The first shell is the signature of HB of lengths between 1.7and 2.1 Å, in overall good agreement with experimental measurements [65] for comparablesmall-molecules at interfacial membranes.
The analysis of PMF of DBD–lipid interactions has revealed free-energy barriers ofthe order of 1–3 kcal/mol (Table 2), with the largest barriers corresponding to hydrogenbonds between DBD’s ‘H2’ site and oxygens sites of DOPC and DOPS; however, it has beenobserved that DBD derivatives are able to bind to cholesterol as well as the two classesof phospholipids, providing bridging connections that are able to locally estabilize andcompactify the cell membrane, although the area per lipid and thickness of the wholemembrane are not affected by the presence of the DBD species in any case. The influence ofcholesterol has been especially noted in the weakening of DBD–lipid HB connections, whichshould be taken in consideration for the interaction of drugs with cell membranes froma pharmaceutical point of view. After a thorough analysis monitoring relative distancesbetween tagged sites of DBD and lipids we have estimated the lifetime of HB by averagingdata from the 600 ns MD trajectories to range in between 1 and 70 ns.
Author Contributions: Conceptualization, Z.H. and J.M.; methodology, Z.H. and J.M.; validation,Z.H. and J.M.; formal analysis, Z.H. and J.M.; investigation, Z.H. and J.M.; resources, Z.H. and J.M.;data curation, Z.H.; writing—original draft preparation, Z.H. and J.M.; writing—review and editing,Z.H. and J.M.; visualization, Z.H. and J.M.; supervision, J.M.; project administration, J.M.; fundingacquisition, J.M. All authors have read and agreed to the published version of the manuscript.
Funding: Z.H. is the recipient of a grant from the China Scholarship Council (number 202006230070).J.M. gratefully acknowledges financial support from by the Spanish Ministry of Economy andKnowledge (grant PGC2018-099277-B-C21, funds MCIU/AEI/FEDER, UE).
Institutional Review Board Statement: Not applicable.
139

Membranes 2022, 12, 331
Informed Consent Statement: Not applicable.
Data Availability Statement: Not applicable.
Acknowledgments: We thank Huixia Lu for fruitful discussions and technical support.
Conflicts of Interest: The authors declare no conflict of interest.
References
1. Escribá, P.V.; Sastre, M.; García-Sevilla, J.A. Disruption of cellular signalling pathways by daunomycin through destabilization ofnonlamellar membrane structures. Proc. Natl. Acad. Sci. USA 1995, 92, 7595. [CrossRef]
2. Tong, S.; Lin, Y.; Lu, S.; Wang, M.; Bogdanov, M.; Zheng, L. Structural Insight into Substrate Selection and Catalysis of LipidPhosphate Phosphatase PgpB in the Cell Membrane. J. Biol Chem. 2016, 291, 18342. [CrossRef]
3. Doherty, G.J.; McMahon, H.T. Mechanisms of endocytosis. Annu. Rev. Biochem. 2009, 78, 857. [CrossRef] [PubMed]4. Escribá, P.V.; González-Ros, J.M.; Goñi, F.M.; Kinnunen, P.K.; Vigh, L.; Sánchez-Magraner, L.; Fernández, A.M.; Busquets, X.;
Horvath, I.; Barceló-Coblijn, G. Membranes: A meeting point for lipids, proteins and therapies. J. Cell Mol. Med. 2008, 12, 829.[CrossRef]
5. Noutsi, P.; Gratton, E.; Chaieb, S. Assessment of Membrane Fluidity Fluctuations during Cellular Development Reveals Time andCell Type Specificity. PLoS ONE. 2016, 11, e0158313. [CrossRef]
6. Hakomori, S. Aberrant glycosylation in cancer cell membranes as focused on glycolipids: Overview and perspectives. Cancer Res.1985, 45, 2405.
7. Simons, K.; Ehehalt, R. Cholesterol, lipid rafts, and disease. J. Clin. Investig. 2002, 110, 597. [CrossRef] [PubMed]8. Vigh, L.; Escribá, P.V.; Sonnleitner, A.; Sonnleitner, M.; Piotto, S.; Maresca, B.; Horvath, I.; Harwood, J.L. The significance of lipid
composition for membrane activity: New concepts and ways of assessing function. Prog. Lipid Res. 2005, 44, 303. [CrossRef]9. Kim, Y.; Shanta, S.R.; Zhou, L.H.; Kim, K.P. Mass spectrometry based cellular phosphoinositides profiling and phospholipid
analysis: A brief review. Exp. Mol. Med. 2010, 42, 1. [CrossRef] [PubMed]10. Jolliet-Riant, P.; Tillement, J.P. Drug transfer across the blood-brain barrier and improvement of brain delivery. Fundam. Clin.
Pharmacol. 1999, 13, 16. [CrossRef]11. Bodor, N.; Buchwald, P. Barriers to remember: Brain-targeting chemical delivery systems and Alzheimer’s disease. Drug Discov.
Today 2002, 7, 766. [CrossRef]12. Waterhouse, R.N. Determination of lipophilicity and its use as a predictor of blood-brain barrier penetration of molecular imaging
agents. Mol. Imaging Biol. 2003, 5, 376. [CrossRef] [PubMed]13. Rees, C.W. Polysulfur-Nitrogen Heterocyclic Chemistry. J. Heterocycl. Chem. 1992, 29, 639. [CrossRef]14. Vitaku, E.; Smith, D.T.; Njardarson, J.T. Analysis of the structural diversity, substitution patterns, and frequency of nitrogen
heterocycles among U.S. FDA approved pharmaceuticals. J. Med. Chem. 2014, 57, 10257. [CrossRef] [PubMed]15. Horton, D.A.; Bourne, G.T.; Smythe, M.L. The combinatorial synthesis of bicyclic privileged structures or privileged substructures.
Chem. Rev. 2003, 103, 893. [CrossRef] [PubMed]16. Sharma, V.; Kamal, R.; Kumar, V. Heterocyclic Analogues as Kinase Inhibitors: A Focus Review. Curr. Top. Med. Chem. 2017,
17, 2482. [CrossRef] [PubMed]17. Platts, M.M. Hydrochlorothiazide, a new oral diuretic. Br. Med. J. 1959, 1, 1565. [CrossRef]18. Martínez, A.; Esteban, A.I.; Castro, A.; Gil, C.; Conde, S.; Andrei, G.; Snoeck, R.; Balzarini, J.; De Clercq, E. Novel potential agents
for human cytomegalovirus infection: Synthesis and antiviral activity evaluation of benzothiadiazine dioxide acyclonucleosides.J. Med. Chem. 1999, 42, 1145. [CrossRef]
19. Tait, A.; Luppi, A.; Hatzelmann, A.; Fossa, P.; Mosti, L. Synthesis, biological evaluation and molecular modelling studies onbenzothiadiazine derivatives as PDE4 selective inhibitors. Bioorg. Med. Chem. 2005, 13, 1393. [CrossRef]
20. Larsen, A.P.; Francotte, P.; Frydenvang, K.; Tapken, D.; Goffin, E.; Fraikin, P.; Caignard, D.H.; Lestage, P.; Danober, L.; Pirotte,B.; et al. Synthesis and Pharmacology of Mono-, Di-, and Trialkyl-Substituted 7-Chloro-3,4-dihydro-2H-1,2,4-benzothiadiazine1,1-Dioxides Combined with X-ray Structure Analysis to Understand the Unexpected Structure-Activity Relationship at AMPAReceptors. ACS Chem. Neurosci. 2016, 7, 378. [CrossRef]
21. Ma, X.; Wei, J.; Wang, C.; Gu, D.; Hu, Y.; Sheng R. Design, synthesis and biological evaluation of novel benzothiadiazinederivatives as potent PI3Kδ-selective inhibitors for treating B-cell-mediated malignancies. Eur. J. Med. Chem. 2019, 170, 112.[CrossRef] [PubMed]
22. Shaik, T.B.; Malik, M.S.; Routhu, S.R.; Seddigi, Z.S.; Althagafi, I.I.; Kamal, A. Evaluation of anticancer and anti-mitotic propertiesof quinazoline and quinazolino-benzothiadiazine derivatives. Anti-Cancer Agents Med. Chem. 2020, 20, 599–611. [CrossRef][PubMed]
23. Huwaimel, B.I.; Bhakta, M.; Kulkarni, C.A.; Milliken, A.S.; Wang, F.; Peng, A.; Brookes, P.S.; Trippier, P.C. Discovery ofHalogenated Benzothiadiazine Derivatives with Anticancer Activity. Chem. Med. Chem. 2021, 16, 1143–1162. [CrossRef] [PubMed]
24. Hirayama, F.; Koshio, H.; Katayama, N.; Ishihara, T.; Kaizawa, H.; Taniuchi, Y.; Sato, K.; Sakai-Moritani, Y.; Kaku, S.; Kurihara, H.;et al. Design, synthesis and biological activity of YM-60828 derivatives. Part 2: Potent and orally-bioavailable factor Xa inhibitorsbased on benzothiadiazine-4-one template. Bioorg. Med. Chem. 2003, 11, 367–381. [CrossRef]
140
Membranes 2022, 12, 331
25. Kamal, A.; Reddy, K.-S.; Ahmed, S.-K.; Khan, M.-N.; Sinha, R.-K.; Yadav, J.-S.; Arora, S.-K. Anti-tubercular agents. Part 3.Benzothiadiazine as a novel scaffold for anti-Mycobacterium activity. Bioorg. Med. Chem. 2006, 14, 650–658. [CrossRef]
26. Kamal, A.; Shetti, R.-V.; Azeeza, S.; Ahmed, S.-K.; Swapna, P.; Reddy, A.-M.; Khan, I.-A.; Sharma, S.; Abdullah, S.-T. Anti-tubercular agents. Part 5: Synthesis and biological evaluation of benzothiadiazine 1,1-dioxide based congeners. Eur. J. Med. Chem.2010, 45, 4545–4553. [CrossRef]
27. Tait, A.; Luppi, A.; Franchini, S.; Preziosi, E.; Parenti, C.; Buccioni, M.; Marucci, G.; Leonardi, A.; Poggesi, E.; Brasili, L.1,2,4-Benzothiadiazine derivatives as alpha1 and 5-HT1A receptor ligands. Bioorg. Med. Chem. Lett. 2005, 15, 1185–1188.[CrossRef]
28. Hu, Z.; Martí, J.; Lu, H. Structure of benzothiadiazine at zwitterionic phospholipid cell membranes. J. Chem. Phys. 2021,155, 154303. [CrossRef]
29. Prior, I.A.; Lewis, P.D.; Mattos, C.A comprehensive survey of Ras mutations in cancer. Cancer Res. 2012, 72, 2457–2467. [CrossRef]30. Lu, H.; Martí, J. Long-lasting Salt Bridges Provide the Anchoring Mechanism of Oncogenic Kirsten Rat Sarcoma Proteins at Cell
Membranes. J. Phys. Chem. Lett. 2020, 11, 9938–9945. [CrossRef]31. Jang, H.; Abraham, S.J.; Chavan, T.S.; Hitchinson, B.; Khavrutskii, L.; Tarasova, N.I.; Nussinov, R.; Gaponenko, V. Mechanisms of
membrane binding of small GTPase K-Ras4B farnesylated hypervariable region. J. Biol. Chem. 2015, 290, 9465–9477. [CrossRef]32. Lu, S.; Jang, H.; Muratcioglu, S.; Gursoy, A.; Keskin, O.; Nussinov, R.; Zhang, J. Ras conformational ensembles, allostery, and
signaling. Chem. Rev. 2016, 116, 6607–6665. [CrossRef] [PubMed]33. Liu, S.-L.; Sheng, R.; Jung, J.H.; Wang, L.; Stec, E.; O’Connor, M.J.; Song, S.; Bikkavilli, R.K.; Winn, R.A.; Lee, D.; et al. Orthogonal
lipid sensors identify transbilayer asymmetry of plasma membrane cholesterol. Nat. Chem. Biol. 2017, 13, 268–274. [CrossRef][PubMed]
34. Jo, S.; Kim, T.; Iyer, V.G.; Im, W. CHARMM-GUI: A web-based graphical user interface for CHARMM. J. Comput. Chem. 2008,29, 1859. [CrossRef]
35. Jo, S.; Lim, J.B.; Klauda, J.B.; Im, W. CHARMM-GUI Membrane Builder for mixed bilayers and its application to yeast membranes.Biophys. J. 2009, 97, 50. [CrossRef]
36. Jorgensen, W.L.; Chandrasekhar, J.; Madura, J.D.; Impey, R.W.; Klein, M.L. Comparison of simple potential functions forsimulating liquid water. J. Chem. Phys. 1983, 79, 926. [CrossRef]
37. Klauda, J.B.; Venable, R.M.; Freites, J.A.; O’Connor, J.W.; Tobias, D.J.; Mondragon-Ramirez, C.; Vorobyov, I.; MacKerell, A.D., Jr.;Pastor, R.W. Update of the CHARMM all-atom additive force field for lipids: Validation on six lipid types. J Phys. Chem. B 2010,114, 7830. [CrossRef] [PubMed]
38. Lim, J.B.; Rogaski, B.; Klauda, J.B. Update of the cholesterol force field parameters in CHARMM. J. Phys. Chem. B 2012, 116, 203.[CrossRef]
39. Huang, J.; MacKerell, A.D., Jr. CHARMM36 all-atom additive protein force field: Validation based on comparison to NMR data.J. Comput. Chem. 2013, 34, 2135. [CrossRef] [PubMed]
40. Linse, B.; Linse, P. Tuning the smooth particle mesh Ewald sum: Application on ionic solutions and dipolar fluids. J. Chem. Phys.2014, 141, 184114. [CrossRef]
41. Heinzinger, K. Computer Modelling of Fluids Polymers and Solids; Springer: Berlin/Heidelberg, Germany, 1990; pp. 357–394.42. Brodholt, J.P. Molecular dynamics simulations of aqueous NaCl solutions at high pressures and temperatures. Chem. Geol. 1998,
151, 11. [CrossRef]43. Chowdhuri, S.; Chandra, A. Molecular dynamics simulations of aqueous NaCl and KCl solutions: Effects of ion concentration
on the single-particle, pair, and collective dynamical properties of ions and water molecules. J. Chem. Phys. 2001, 115, 3732.[CrossRef]
44. Nagy, G.; Gordillo, M.C.; Guàrdia, E.; Martí, J. Liquid water confined in carbon nanochannels at high temperatures. J. Phys. Chem.B 2007, 111, 12524. [CrossRef] [PubMed]
45. Videla, P.; Sala, J.; Martí, J.; Guàrdia, E.; Laria, D. Aqueous electrolytes confined within functionalized silica nanopores. J. Chem.Phys. 2011, 135, 104503. [CrossRef]
46. Sala, J.; Guàrdia, E.; Martí, J. Specific ion effects in aqueous eletrolyte solutions confined within graphene sheets at the nanometricscale. Phys. Chem. Chem. Phys. 2012, 14, 10799. [CrossRef]
47. Calero, C.; Martí, J.; Guàrdia, E. 1H nuclear spin relaxation of liquid water from molecular dynamics simulations. J. Phys. Chem. B2015, 119, 1966–1973. [CrossRef] [PubMed]
48. Joseph, S.; Mashl, R.J.; Jakobsson, E.; Aluru, N.R. Electrolytic transport in modified carbon nanotubes. Nano Lett. 2003, 3, 1399.[CrossRef]
49. Allen, T.W.; Andersen, O.S.; Roux, B. Molecular dynamics—Potential of mean force calculations as a tool for understanding ionpermeation and selectivity in narrow channels. Biophys. Chem. 2006, 124, 251. [CrossRef]
50. Yang, J.; Calero, C.; Martí, J. Diffusion and spectroscopy of water and lipids in fully hydrated dimyristoylphosphatidylcholinebilayer membranes. J. Chem. Phys. 2014, 140, 104901. [CrossRef] [PubMed]
51. Lu, H.; Martí, J. Binding and dynamics of melatonin at the interface of phosphatidylcholine-cholesterol membranes. PLoS ONE2019, 14, e0224624. [CrossRef]
141
Membranes 2022, 12, 331
52. Drew Bennett, W.F.; He, S.; Bilodeau, C.L.; Jones, D.; Sun, D.; Kim, H.; Allen, J.E.; Lightstone, F.C.; Ingólfsson, H.I. Predictingsmall molecule transfer free energies by combining molecular dynamics simulations and deep learning. J. Chem. Inf. Model. 2020,60, 5375. [CrossRef] [PubMed]
53. Lu, H.; Martí, J. Cellular absorption of small molecules: Free energy landscapes of melatonin binding at phospholipid membranes.Sci. Rep. 2020, 10, 9235. [CrossRef] [PubMed]
54. Abraham, M.J.; Murtola, T.; Schulz, R.; Páll, S.; Smith, J.C.; Hess, B.; Lindahl, E. GROMACS: High performance molecularsimulations through multi-level parallelism from laptops to supercomputers. SoftwareX 2015, 1, 19. [CrossRef]
55. Pronk, S.; Páll, S.; Schulz, R.; Larsson, P.; Bjelkmar, P.; Apostolov, R.; Shirts, M.R. Smith, J.C.; Kasson, P.M. van der Spoel, D.; et al.GROMACS 4.5: A high-throughput and highly parallel open source molecular simulation toolkit. Bioinformatics 2013, 29, 845.[CrossRef] [PubMed]
56. Van Der Spoel, D.; Lindahl, E.; Hess, B.; Groenhof, G.; Mark, A.E.; Berendsen, H.J.C. GROMACS: Fast, flexible, and free. J. Comput.Chem. 2005, 26, 1701. [CrossRef] [PubMed]
57. Lindahl, E.; Hess, B.; Van Der Spoel, D. GROMACS 3.0: A package for molecular simulation and trajectory analysis. Mol. Model.Annu. 2001, 7, 306. [CrossRef]
58. Berendsen, H.J.C.; Van der Spoel, D.; Van Drunen, R. GROMACS: A message-passing parallel molecular dynamics implementation.Comput. Phys. Commun. 1995, 91, 43. [CrossRef]
59. Chen, W.; Dusa, F.; Witos, J.; Ruokonen, S.-K.; Wiedmer, S.K. Determination of the main phase transition temperature ofphospholipids by nanoplasmonic sensing. Sci. Rep. 2018, 8, 14815. [CrossRef] [PubMed]
60. Evans, D.J.; Holian, B.L. The Nose–Hoover thermostat. J. Chem. Phys. 1985, 83, 4069–4074. [CrossRef]61. Parrinello, M.; Rahman, A. Crystal structure and pair potentials: A molecular-dynamics study. Phys. Rev. Lett. 1980, 45, 1196.
[CrossRef]62. Pandey, P.R.; Roy, S. Headgroup mediated water insertion into the DPPC bilayer: A molecular dynamics study. J. Phys. Chem. B
2011, 115, 3155–3163. [CrossRef] [PubMed]63. Pan, J.; Tristram-Nagle, S.; Nagle, J.F. Effect of cholesterol on structural and mechanical properties of membranes depends on
lipid chain saturation. Phys. Rev. E 2009, 80, 021931. [CrossRef] [PubMed]64. Martí, J.; Lu, H. Microscopic interactions of melatonin, serotonin and tryptophan with zwitterionic phospholipid membranes. Int.
J. Mol. Sci. 2021, 22, 2842. [CrossRef] [PubMed]65. Liu, H.; Zhang, H.; Jin, B. Fluorescence of tryptophan in aqueous solution. Spectrochim. Acta Part A Mol. Biomol. Spectrosc. 2013,
106, 54–59. [CrossRef] [PubMed]66. Trzesniak, D.; Kunz, A.-P.E.; van Gunsteren, W.F. A comparison of methods to compute the potential of mean force. ChemPhysChem
2007, 8, 162–169. [CrossRef] [PubMed]67. Guàrdia, E.; Rey, R.; Padró, J.A. Statistical errors in constrained molecular dynamics calculations of the mean force potential. Mol.
Sim. 1992, 9, 201–211. [CrossRef]68. K’astner, J. Umbrella sampling. Wiley Interdiscip. Rev. Comp. Mol. Sci. 2011, 1, 932–942. [CrossRef]69. Geissler, P.L.; Dellago, C.; Chandler, D.; Hutter, J.; Parrinello, M. Autoionization in liquid water. Science 2001, 291, 2121–2124.
[CrossRef]70. Martí, J.; Csajka, F.S.; Chandler, D. Stochastic transition pathways in the aqueous sodium chloride dissociation process. Chem.
Phys. Lett. 2000, 328, 169–176. [CrossRef]71. Bolhuis, P.G.; Chandler, D.; Dellago, C.; Geissler, P.L. Transition path sampling: Throwing ropes over rough mountain passes, in
the dark. Annu. Rev. Phys. Chem. 2002, 53, 291–318. [CrossRef]72. Martí, J.; Csajka, F.S. Transition path sampling study of flip-flop transitions in model lipid bilayer membranes. Phys. Rev. E 2004,
69, 061918. [CrossRef] [PubMed]73. Barducci, A.; Bussi, G.; Parrinello, M. Well-tempered metadynamics: A smoothly converging and tunable free-energy method.
Phys. Rev. Lett. 2008, 100, 020603. [CrossRef] [PubMed]74. Chandler, D. Introduction to Modern Statistical Mechanics; Oxford University Press: Oxford, UK, 198775. Feyereisen, M.W.; Feller, D.; Dixon, D.A. Hydrogen bond energy of the water dimer. J. Phys. Chem. 1996, 100, 2993–2997.
[CrossRef]76. Vega, C.; Abascal, J.L.F.; Conde, M.M.; Aragones, J.L. What ice can teach us about water interactions: A critical comparison of the
performance of different water models. Faraday Discuss. 2009, 141, 251–276. [CrossRef]77. MacCallum, J.L.; Bennett, W.F.D.; Tieleman, D.P. Distribution of amino acids in a lipid bilayer from computer simulations. Biophys.
J. 2008, 94, 3393–3404. [CrossRef]78. De Jesus, A.J.; Allen, T.W. The role of tryptophan side chains in membrane protein anchoring and hydrophobic mismatch.
BBA Biomembr. 2013, 1828, 864–876. [CrossRef]79. Peters, G.H.; Werge, M.; Elf-Lind, M.N.; Madsen, J.J.; Velardez, G.F.; Westh, P. Interaction of neurotransmitters with a phospholipid
bilayer: A molecular dynamics study. Chem. Phys. Lipids 2014, 184, 7–17. [CrossRef] [PubMed]80. Lu, H.; Martí, J. Effects of cholesterol on the binding of the precursor neurotransmitter tryptophan to zwitterionic membranes.
J. Chem. Phys. 2018, 149, 164906. [CrossRef] [PubMed]81. Humphrey, W.; Dalke, A.; Schulten, K. VMD: Visual molecular dynamics. J. Mol. Graph. 1996, 14, 33–38. [CrossRef]
142

Membranes 2022, 12, 331
82. Martí, J.; Padró, J.A.; Guàrdia, E. Computer simulation of molecular motions in liquids: Infrared spectra of water and heavywater. Mol. Sim. 1993, 11, 321–336. [CrossRef]
83. Padró, J.A.; Martí, J. Response to “Comment on ‘An interpretation of the low-frequency spectrum of liquid water’” [J. Chem.Phys. 118, 452 (2003)]. J. Chem. Phys. 2004, 120, 1659–1660. [CrossRef]
84. Padró, J.A.; Martí, Guàrdia, E. Molecular dynamics simulation of liquid water at 523 K. J. Phys. Condens. Matter 1994, 6, 2283.[CrossRef]
85. Martí, J.; Gordillo, M.C. Microscopic dynamics of confined supercritical water. Chem. Phys. Lett. 2002, 354, 227–232. [CrossRef]86. Martí, J. Dynamic properties of hydrogen-bonded networks in supercritical water. Phys. Rev. E 2000, 61, 449. [CrossRef] [PubMed]
143


Citation: Asare, I.K.; Galende, A.P.;
Garcia, A.B.; Cruz, M.F.;
Moura, A.C.M.; Campbell, C.C.;
Scheyer, M.; Alao, J.P.; Alston, S.;
Kravats, A.N.; et al. Investigating
Structural Dynamics of KCNE3 in
Different Membrane Environments
Using Molecular Dynamics
Simulations. Membranes 2022, 12, 469.
https://doi.org/10.3390/
membranes12050469
Academic Editors: Jordi Marti
and Carles Calero
Received: 11 February 2022
Accepted: 21 April 2022
Published: 27 April 2022
Publisher’s Note: MDPI stays neutral
with regard to jurisdictional claims in
published maps and institutional affil-
iations.
Copyright: © 2022 by the authors.
Licensee MDPI, Basel, Switzerland.
This article is an open access article
distributed under the terms and
conditions of the Creative Commons
Attribution (CC BY) license (https://
creativecommons.org/licenses/by/
4.0/).
membranes
Article
Investigating Structural Dynamics of KCNE3 in DifferentMembrane Environments Using Molecular DynamicsSimulations
Isaac K. Asare 1, Alberto Perez Galende 1, Andres Bastidas Garcia 1, Mateo Fernandez Cruz 1,
Anna Clara Miranda Moura 1, Conner C. Campbell 1, Matthew Scheyer 1, John Paul Alao 2, Steve Alston 1,
Andrea N. Kravats 2, Charles R. Sanders 3, Gary A. Lorigan 2,* and Indra D. Sahu 1,2,*
1 Natural Science Division, Campbellsville University, Campbellsville, KY 42718, USA;[email protected] (I.K.A.); [email protected] (A.P.G.);[email protected] (A.B.G.); [email protected] (M.F.C.);[email protected] (A.C.M.M.); [email protected] (C.C.C.);[email protected] (M.S.); [email protected] (S.A.)
2 Department of Chemistry and Biochemistry, Miami University, Oxford, OH 45056, USA;[email protected] (J.P.A.); [email protected] (A.N.K.)
3 Center for Structural Biology, Department of Biochemistry, Vanderbilt University, Nashville, TN 37232, USA;[email protected]
* Correspondence: [email protected] (G.A.L.); [email protected] (I.D.S.);Tel.: +1-(513)-529-2813 (G.A.L.); +1-(270)-789-5597 (I.D.S.)
Abstract: KCNE3 is a potassium channel accessory transmembrane protein that regulates the functionof various voltage-gated potassium channels such as KCNQ1. KCNE3 plays an important role in therecycling of potassium ion by binding with KCNQ1. KCNE3 can be found in the small intestine, colon,and in the human heart. Despite its biological significance, there is little information on the structuraldynamics of KCNE3 in native-like membrane environments. Molecular dynamics (MD) simulationsare a widely used as a tool to study the conformational dynamics and interactions of proteinswith lipid membranes. In this study, we have utilized all-atom molecular dynamics simulations tocharacterize the molecular motions and the interactions of KCNE3 in a bilayer composed of: a mixtureof POPC and POPG lipids (3:1), POPC alone, and DMPC alone. Our MD simulation results suggestedthat the transmembrane domain (TMD) of KCNE3 is less flexible and more stable when compared tothe N- and C-termini of KCNE3 in all three membrane environments. The conformational flexibilityof N- and C-termini varies across these three lipid environments. The MD simulation results furthersuggested that the TMD of KCNE3 spans the membrane width, having residue A69 close to thecenter of the lipid bilayers and residues S57 and S82 close to the lipid bilayer membrane surfaces.These results are consistent with previous biophysical studies of KCNE3. The outcomes of theseMD simulations will help design biophysical experiments and complement the experimental dataobtained on KCNE3 to obtain a more detailed understanding of its structural dynamics in the nativemembrane environment.
Keywords: KCNE3; structural dynamics; lipid bilayers; molecular dynamics simulation; membranemimetic
1. Introduction
KCNE3 is a potassium channel accessory transmembrane protein belonging to theKCNE family that regulates the function of various voltage-gated potassium channels suchas KCNQ1 and KCNQ4 [1–4]. KCNE3 has been expressed in the small intestine, colon, andhuman heart [5–7]. Previous studies have shown that in the presence of KCNE3, KCNQ1’svoltage sensitivity shows a linear current-voltage (I-V) relationship that gives rise to apotassium ion conductivity in non-excitable cells as polarized epithelial cells of the colon,
Membranes 2022, 12, 469. https://doi.org/10.3390/membranes12050469 https://www.mdpi.com/journal/membranes145
Membranes 2022, 12, 469
small intestine, and airways [3,8,9]. Its malfunction has been proven to contribute to healthdisorders such as cardiac arrhythmia, long QT syndrome, tinnitus, cystic fibrosis, andMenière’s disease [3,5,10–15]. For such a biologically significant membrane protein, littleinformation is known about the structural and dynamic properties of KCNE3 in nativelike membrane environment, where interactions between lipids and proteins help stabilizethe structure of the protein and influence protein function within the membrane. PreviousNMR studies of KCNE3 in detergent micelles and isotropic bicelles by the Sanders labhave shown KCNE3’s structure consists of an extracellular N-terminus surface associatedamphipathic helix connected by a loop to an alpha helical transmembrane domain [16].A disordered C-terminus is connected to the transmembrane domain by a short juxtamembrane helix [16]. Recent studies by Sun et al. using cryo-electron microscopy (Cryo-EM) showed that KCNE3 tucks its single membrane spanning helix against KCNQ1 at apoint that appears to keep the voltage sensor in its depolarized confirmation [8]. However,it is not fully understood how these various sections behave structurally and dynamicallyin various membrane bilayer environments.
Molecular dynamics (MD) simulations serve as a structure biology tool to complementexperimental studies in order to study the stability and structural dynamic properties ofmembrane proteins at an atomic level [17–21]. Here, we use all-atom MD simulationsin the course of 105 ns to study stability and structural dynamic properties of KCNE3 inbilayers composed of POPC (1-palmitoyl-2-oleoyl-sn-glycero-3-phosphocholine)/POPG(1-palmitoyl-2-oleoyl-sn-glycero-3-phospho-(1′-rac-glycerol) (sodium salt)) (3:1), POPCalone, and DMPC (1,2-dimyristoyl-sn-glycero-3-phosphocholine) only. The POPC/POPGmixtures, POPC alone and DMPC are widely used lipid systems to mimic biological mem-brane bilayers for biophysical studies [16,17]. Previous MD simulation studies on similarmembrane proteins and other protein systems have suggested that the simulation timesof 10–100 ns can provide reliable analysis of protein–detergent and protein–lipid inter-actions [17,22–24]. We have analyzed MD simulation trajectory data to obtain severalstructural dynamics related parameters such as backbone root mean square deviation(RMSD), root mean square fluctuation (RMSF), lipid bilayer membrane width, Z-distances,total protein–lipid interaction energy, TMD helical tilt angle, and a heat map of the correla-tion between parameters, results that yield insight into the stability, molecular motion andinteraction of KCNE3 in different phospholipid bilayer membranes.
2. Methods
2.1. Molecular Dynamics Modeling of Wild-Type KCNE3 in Lipid Bilayers
Nanoscale molecular dynamics (NAMD) [25] version 2.14 with the CHARMM36force field was employed to perform molecular dynamics simulations on a full lengthKCNE3 (PDB ID: 2M9Z, the original pdb file is available in the Supporting Informationof the ref. [16] in lipid bilayers composed of POPC/POPG (3:1), POPC alone, and DMPCalone [26–28]). The simulation set up and input files were generated by using CHARMM-GUI [29]. The visual molecular dynamics software (VMD) Xplor version 1.13 [30,31] wasused for MD trajectory data analysis. The bilayer, composed of a pre-equilibrated lipidmolecules with a ~12,010.5 Å2 surface, was built using membrane builder protocol underCHARMM-GUI [29,32]. The total charge of KCNE3 was 2.0 in the simulation. The positivelycharged amino acid residues were protonated, and negatively charged amino acids weredeprotonated. The histidine (HIS) residues were protonated to the neutral form (HSD).The protein was inserted into the membrane and the system was solvated into a TIP3water box and ionized to add bulk water above and below the membrane and to neutralizethe system with KCl using the membrane builder protocol [29,32]. The final assembledsystem comprised waters, phospholipids, ions and the protein (a total of ~174,071 atoms).Six equilibration steps of each protein-lipid system were performed for 50–200 ps with 2 fstimesteps using the NAMD program with input files generated by CHARMM-GUI [29,32].The minimization equilibration utilized collective variable restraints to slowly releasesystem motion and facilitate simulation stability. Starting from this equilibrated system,
146
Membranes 2022, 12, 469
NAMD simulations were carried out for ~105 ns using Langevin dynamics for the threemembrane environments [18]. Electrostatic interactions were computed using the Particle-Mesh Ewald algorithm with a 12 Å cutoff distance [33] and Van der Waals interactionswere computed with a 12 Å cutoff distance and a switching function to reduce the potentialenergy function smoothly to zero between 10–12 Å. Periodic-boundary conditions wereused, and constant temperature (303 K) and pressure (1 atm) were maintained. Equationsof motion were integrated with a timestep of 2 fs and trajectory data was recorded in 20 psincrements [18].
2.2. Analysis of the MD Simulation Data
The structures in the MD trajectory data were aligned with respect to the startingstructure in the production run for each membrane bilayer environment before furtheranalysis. The stability and structural dynamic behavior of KCNE3 was obtained from thealigned trajectory data by calculating root mean square deviation (RMSD) of all atomsof the backbone, root mean square fluctuation (RMSF), lipid bilayer membrane width, Z-distances, total protein–lipid interaction energy, and TMD helical tilt angle using the scriptsavailable in the VMD software package [30]. The heatmaps for the correlation betweendifferent simulation parameters were graphed using Matlab (https://www.mathworks.comaccessed on 10 February 2022). The images were prepared using the Igor Pro graphicsprogram (https://www.wavemetrics.com accessed on 10 February 2022). All moleculardynamics simulations were run on the Miami Redhawk cluster computing facility atMiami University.
3. Results and Discussions
The stability and structural dynamic properties of KCNE3 in different phospholipidbilayer environments were investigated using NAMD molecular dynamics simulationtrajectory data. A wild-type KCNE3 protein was incorporated into three different lipidbilayer environments including POPC/POPG (3:1), POPC alone, and DMPC alone tostudy how structural and dynamic properties of KCNE3 behave in different lipid bilayerenvironments; POPC and POPG are monounsaturated lipids and DMPC is saturated lipid.These lipids are widely used in studying membrane protein/peptides. POPG lipids containa negative charge and hence the mixture of POPC and POPG at the molar ratio of 3 to 1 mayprovide more favorable condition to stabilize the TMD of KCNE3 buried into lipid bilayerswhile spanning the width of the bilayer membrane [34,35]. Figure 1A shows the chemicalstructure of the lipids used in this study. The protein lipid systems were set up beginningwith the NMR structure of KCNE3. KCNE3 was inserted into the respective lipid bilayerwith the transmembrane helix spanning the membrane with the C- and N-terminal helicesoriented on either side of the bilayer and interacting with the solvent. Figure 1B showsthe setup for the KCNE3-POPC/POPG system; the amino acid sequence of the wild-typeKCNE3 is indicated in Figure 1C with the red box indicating the transmembrane helix, theblue boxes indicating the N- and C-terminal helices and the distribution of charged aminoacids by color codes [16].
Molecular Motion of KCNE3 in Different Phospholipid Bilayer Environments
An all-atom molecular dynamics simulation on wild-type KCNE3 in three differentlipid bilayer environments was carried out over the course of 105 ns. Figure 2 shows thesnapshots of the representative MD simulation output trajectory data of KCNE3 incorpo-rated into all three lipid bilayer systems (POPC/POPG, POPC alone, and DMPC alone)for 16 ns, 40 ns, 80 ns and 105 ns. The interaction of C- and N-termini of KCNE3 with thelipid bilayer surface is flexible and dynamic for all three lipid compositions. Interestingly,the initial few amino acid sites of N-terminal of KCNE3 showed formation of a short betastrand structure in the DMPC lipid system.
147
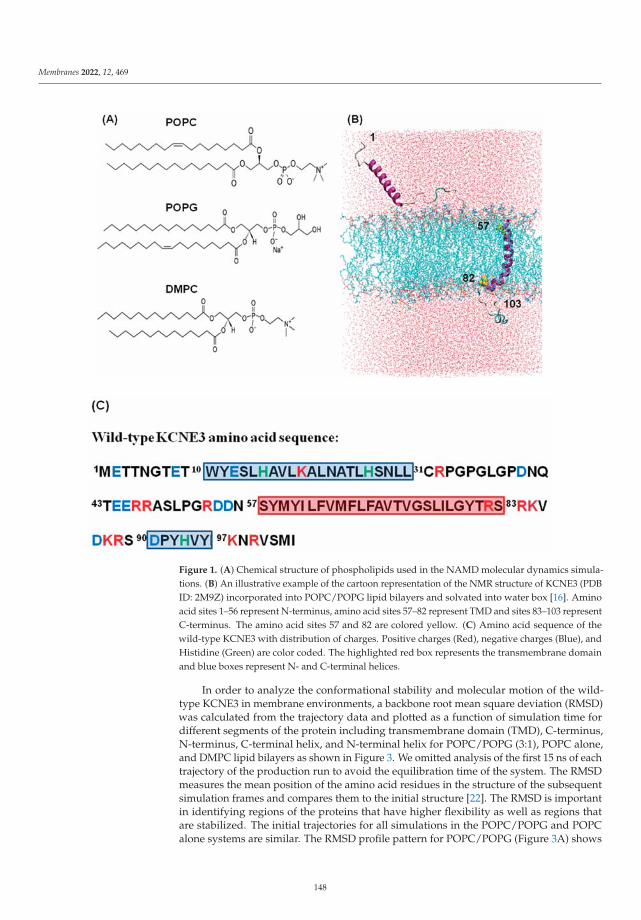
Membranes 2022, 12, 469
Figure 1. (A) Chemical structure of phospholipids used in the NAMD molecular dynamics simula-tions. (B) An illustrative example of the cartoon representation of the NMR structure of KCNE3 (PDBID: 2M9Z) incorporated into POPC/POPG lipid bilayers and solvated into water box [16]. Aminoacid sites 1–56 represent N-terminus, amino acid sites 57–82 represent TMD and sites 83–103 representC-terminus. The amino acid sites 57 and 82 are colored yellow. (C) Amino acid sequence of thewild-type KCNE3 with distribution of charges. Positive charges (Red), negative charges (Blue), andHistidine (Green) are color coded. The highlighted red box represents the transmembrane domainand blue boxes represent N- and C-terminal helices.
In order to analyze the conformational stability and molecular motion of the wild-type KCNE3 in membrane environments, a backbone root mean square deviation (RMSD)was calculated from the trajectory data and plotted as a function of simulation time fordifferent segments of the protein including transmembrane domain (TMD), C-terminus,N-terminus, C-terminal helix, and N-terminal helix for POPC/POPG (3:1), POPC alone,and DMPC lipid bilayers as shown in Figure 3. We omitted analysis of the first 15 ns of eachtrajectory of the production run to avoid the equilibration time of the system. The RMSDmeasures the mean position of the amino acid residues in the structure of the subsequentsimulation frames and compares them to the initial structure [22]. The RMSD is importantin identifying regions of the proteins that have higher flexibility as well as regions thatare stabilized. The initial trajectories for all simulations in the POPC/POPG and POPCalone systems are similar. The RMSD profile pattern for POPC/POPG (Figure 3A) shows
148
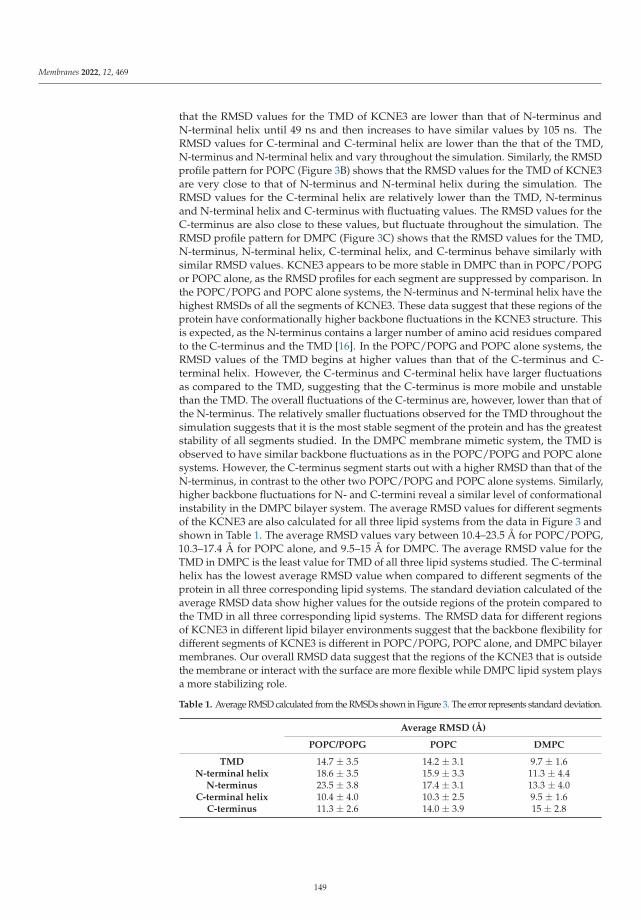
Membranes 2022, 12, 469
that the RMSD values for the TMD of KCNE3 are lower than that of N-terminus andN-terminal helix until 49 ns and then increases to have similar values by 105 ns. TheRMSD values for C-terminal and C-terminal helix are lower than the that of the TMD,N-terminus and N-terminal helix and vary throughout the simulation. Similarly, the RMSDprofile pattern for POPC (Figure 3B) shows that the RMSD values for the TMD of KCNE3are very close to that of N-terminus and N-terminal helix during the simulation. TheRMSD values for the C-terminal helix are relatively lower than the TMD, N-terminusand N-terminal helix and C-terminus with fluctuating values. The RMSD values for theC-terminus are also close to these values, but fluctuate throughout the simulation. TheRMSD profile pattern for DMPC (Figure 3C) shows that the RMSD values for the TMD,N-terminus, N-terminal helix, C-terminal helix, and C-terminus behave similarly withsimilar RMSD values. KCNE3 appears to be more stable in DMPC than in POPC/POPGor POPC alone, as the RMSD profiles for each segment are suppressed by comparison. Inthe POPC/POPG and POPC alone systems, the N-terminus and N-terminal helix have thehighest RMSDs of all the segments of KCNE3. These data suggest that these regions of theprotein have conformationally higher backbone fluctuations in the KCNE3 structure. Thisis expected, as the N-terminus contains a larger number of amino acid residues comparedto the C-terminus and the TMD [16]. In the POPC/POPG and POPC alone systems, theRMSD values of the TMD begins at higher values than that of the C-terminus and C-terminal helix. However, the C-terminus and C-terminal helix have larger fluctuationsas compared to the TMD, suggesting that the C-terminus is more mobile and unstablethan the TMD. The overall fluctuations of the C-terminus are, however, lower than that ofthe N-terminus. The relatively smaller fluctuations observed for the TMD throughout thesimulation suggests that it is the most stable segment of the protein and has the greateststability of all segments studied. In the DMPC membrane mimetic system, the TMD isobserved to have similar backbone fluctuations as in the POPC/POPG and POPC alonesystems. However, the C-terminus segment starts out with a higher RMSD than that of theN-terminus, in contrast to the other two POPC/POPG and POPC alone systems. Similarly,higher backbone fluctuations for N- and C-termini reveal a similar level of conformationalinstability in the DMPC bilayer system. The average RMSD values for different segmentsof the KCNE3 are also calculated for all three lipid systems from the data in Figure 3 andshown in Table 1. The average RMSD values vary between 10.4–23.5 Å for POPC/POPG,10.3–17.4 Å for POPC alone, and 9.5–15 Å for DMPC. The average RMSD value for theTMD in DMPC is the least value for TMD of all three lipid systems studied. The C-terminalhelix has the lowest average RMSD value when compared to different segments of theprotein in all three corresponding lipid systems. The standard deviation calculated of theaverage RMSD data show higher values for the outside regions of the protein compared tothe TMD in all three corresponding lipid systems. The RMSD data for different regionsof KCNE3 in different lipid bilayer environments suggest that the backbone flexibility fordifferent segments of KCNE3 is different in POPC/POPG, POPC alone, and DMPC bilayermembranes. Our overall RMSD data suggest that the regions of the KCNE3 that is outsidethe membrane or interact with the surface are more flexible while DMPC lipid system playsa more stabilizing role.
Table 1. Average RMSD calculated from the RMSDs shown in Figure 3. The error represents standard deviation.
Average RMSD (Å)
POPC/POPG POPC DMPC
TMD 14.7 ± 3.5 14.2 ± 3.1 9.7 ± 1.6N-terminal helix 18.6 ± 3.5 15.9 ± 3.3 11.3 ± 4.4
N-terminus 23.5 ± 3.8 17.4 ± 3.1 13.3 ± 4.0C-terminal helix 10.4 ± 4.0 10.3 ± 2.5 9.5 ± 1.6
C-terminus 11.3 ± 2.6 14.0 ± 3.9 15 ± 2.8
149
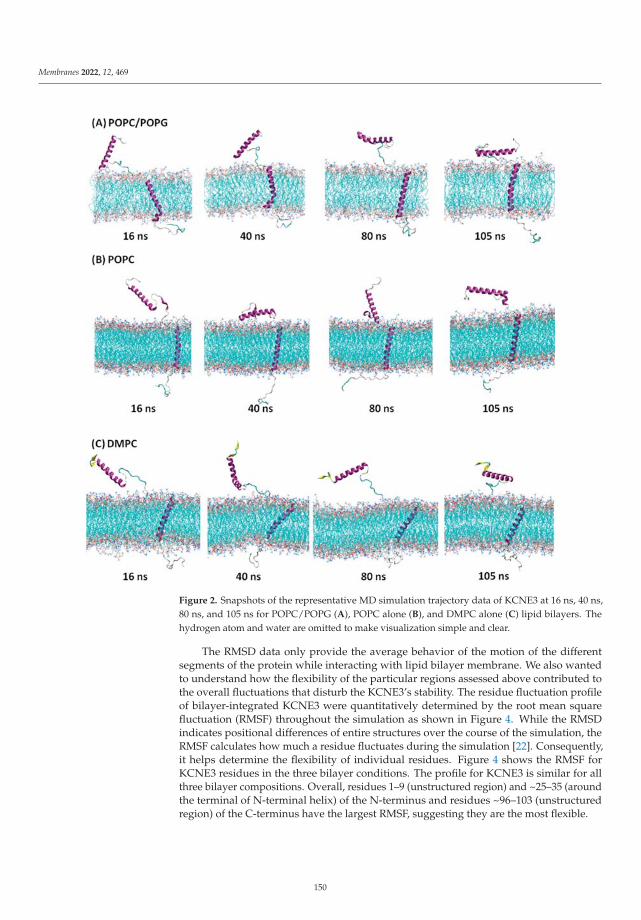
Membranes 2022, 12, 469
Figure 2. Snapshots of the representative MD simulation trajectory data of KCNE3 at 16 ns, 40 ns,80 ns, and 105 ns for POPC/POPG (A), POPC alone (B), and DMPC alone (C) lipid bilayers. Thehydrogen atom and water are omitted to make visualization simple and clear.
The RMSD data only provide the average behavior of the motion of the differentsegments of the protein while interacting with lipid bilayer membrane. We also wantedto understand how the flexibility of the particular regions assessed above contributed tothe overall fluctuations that disturb the KCNE3’s stability. The residue fluctuation profileof bilayer-integrated KCNE3 were quantitatively determined by the root mean squarefluctuation (RMSF) throughout the simulation as shown in Figure 4. While the RMSDindicates positional differences of entire structures over the course of the simulation, theRMSF calculates how much a residue fluctuates during the simulation [22]. Consequently,it helps determine the flexibility of individual residues. Figure 4 shows the RMSF forKCNE3 residues in the three bilayer conditions. The profile for KCNE3 is similar for allthree bilayer compositions. Overall, residues 1–9 (unstructured region) and ~25–35 (aroundthe terminal of N-terminal helix) of the N-terminus and residues ~96–103 (unstructuredregion) of the C-terminus have the largest RMSF, suggesting they are the most flexible.
150

Membranes 2022, 12, 469
Figure 3. Root mean square deviation (RMSD) as a function of simulation time for different segmentsof KCNE3 in POPC/POPG (A), POPC alone (B), and DMPC (C).
Figure 4. Plot of the root mean square fluctuation (RMSF) of KCNE3 as a function of simulation timefor three different lipid compositions: POPC/POPG (Red), POPC (Blue), and DMPC (Black).
151
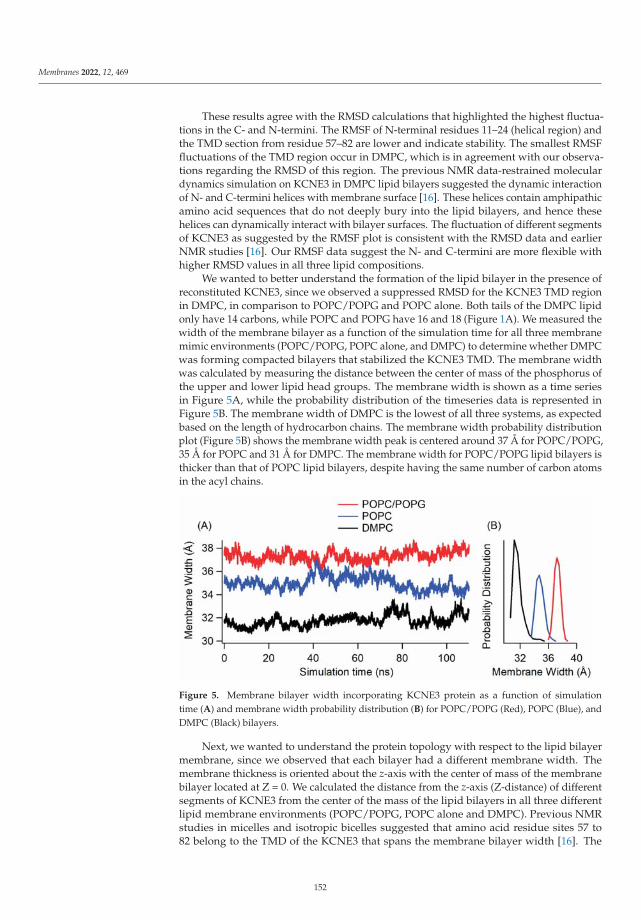
Membranes 2022, 12, 469
These results agree with the RMSD calculations that highlighted the highest fluctua-tions in the C- and N-termini. The RMSF of N-terminal residues 11–24 (helical region) andthe TMD section from residue 57–82 are lower and indicate stability. The smallest RMSFfluctuations of the TMD region occur in DMPC, which is in agreement with our observa-tions regarding the RMSD of this region. The previous NMR data-restrained moleculardynamics simulation on KCNE3 in DMPC lipid bilayers suggested the dynamic interactionof N- and C-termini helices with membrane surface [16]. These helices contain amphipathicamino acid sequences that do not deeply bury into the lipid bilayers, and hence thesehelices can dynamically interact with bilayer surfaces. The fluctuation of different segmentsof KCNE3 as suggested by the RMSF plot is consistent with the RMSD data and earlierNMR studies [16]. Our RMSF data suggest the N- and C-termini are more flexible withhigher RMSD values in all three lipid compositions.
We wanted to better understand the formation of the lipid bilayer in the presence ofreconstituted KCNE3, since we observed a suppressed RMSD for the KCNE3 TMD regionin DMPC, in comparison to POPC/POPG and POPC alone. Both tails of the DMPC lipidonly have 14 carbons, while POPC and POPG have 16 and 18 (Figure 1A). We measured thewidth of the membrane bilayer as a function of the simulation time for all three membranemimic environments (POPC/POPG, POPC alone, and DMPC) to determine whether DMPCwas forming compacted bilayers that stabilized the KCNE3 TMD. The membrane widthwas calculated by measuring the distance between the center of mass of the phosphorus ofthe upper and lower lipid head groups. The membrane width is shown as a time seriesin Figure 5A, while the probability distribution of the timeseries data is represented inFigure 5B. The membrane width of DMPC is the lowest of all three systems, as expectedbased on the length of hydrocarbon chains. The membrane width probability distributionplot (Figure 5B) shows the membrane width peak is centered around 37 Å for POPC/POPG,35 Å for POPC and 31 Å for DMPC. The membrane width for POPC/POPG lipid bilayers isthicker than that of POPC lipid bilayers, despite having the same number of carbon atomsin the acyl chains.
Figure 5. Membrane bilayer width incorporating KCNE3 protein as a function of simulationtime (A) and membrane width probability distribution (B) for POPC/POPG (Red), POPC (Blue), andDMPC (Black) bilayers.
Next, we wanted to understand the protein topology with respect to the lipid bilayermembrane, since we observed that each bilayer had a different membrane width. Themembrane thickness is oriented about the z-axis with the center of mass of the membranebilayer located at Z = 0. We calculated the distance from the z-axis (Z-distance) of differentsegments of KCNE3 from the center of the mass of the lipid bilayers in all three differentlipid membrane environments (POPC/POPG, POPC alone and DMPC). Previous NMRstudies in micelles and isotropic bicelles suggested that amino acid residue sites 57 to82 belong to the TMD of the KCNE3 that spans the membrane bilayer width [16]. The
152
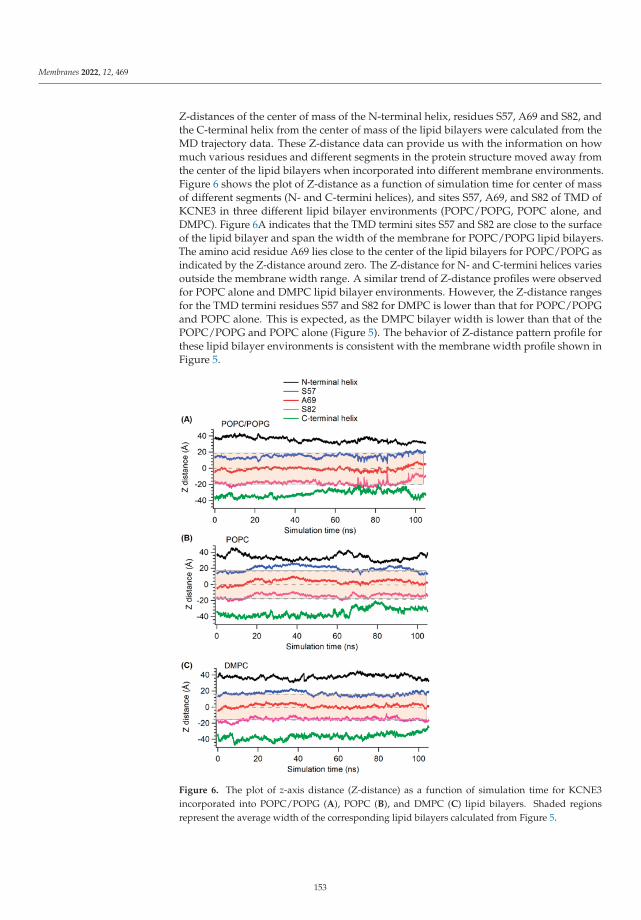
Membranes 2022, 12, 469
Z-distances of the center of mass of the N-terminal helix, residues S57, A69 and S82, andthe C-terminal helix from the center of mass of the lipid bilayers were calculated from theMD trajectory data. These Z-distance data can provide us with the information on howmuch various residues and different segments in the protein structure moved away fromthe center of the lipid bilayers when incorporated into different membrane environments.Figure 6 shows the plot of Z-distance as a function of simulation time for center of massof different segments (N- and C-termini helices), and sites S57, A69, and S82 of TMD ofKCNE3 in three different lipid bilayer environments (POPC/POPG, POPC alone, andDMPC). Figure 6A indicates that the TMD termini sites S57 and S82 are close to the surfaceof the lipid bilayer and span the width of the membrane for POPC/POPG lipid bilayers.The amino acid residue A69 lies close to the center of the lipid bilayers for POPC/POPG asindicated by the Z-distance around zero. The Z-distance for N- and C-termini helices variesoutside the membrane width range. A similar trend of Z-distance profiles were observedfor POPC alone and DMPC lipid bilayer environments. However, the Z-distance rangesfor the TMD termini residues S57 and S82 for DMPC is lower than that for POPC/POPGand POPC alone. This is expected, as the DMPC bilayer width is lower than that of thePOPC/POPG and POPC alone (Figure 5). The behavior of Z-distance pattern profile forthese lipid bilayer environments is consistent with the membrane width profile shown inFigure 5.
Figure 6. The plot of z-axis distance (Z-distance) as a function of simulation time for KCNE3incorporated into POPC/POPG (A), POPC (B), and DMPC (C) lipid bilayers. Shaded regionsrepresent the average width of the corresponding lipid bilayers calculated from Figure 5.
153
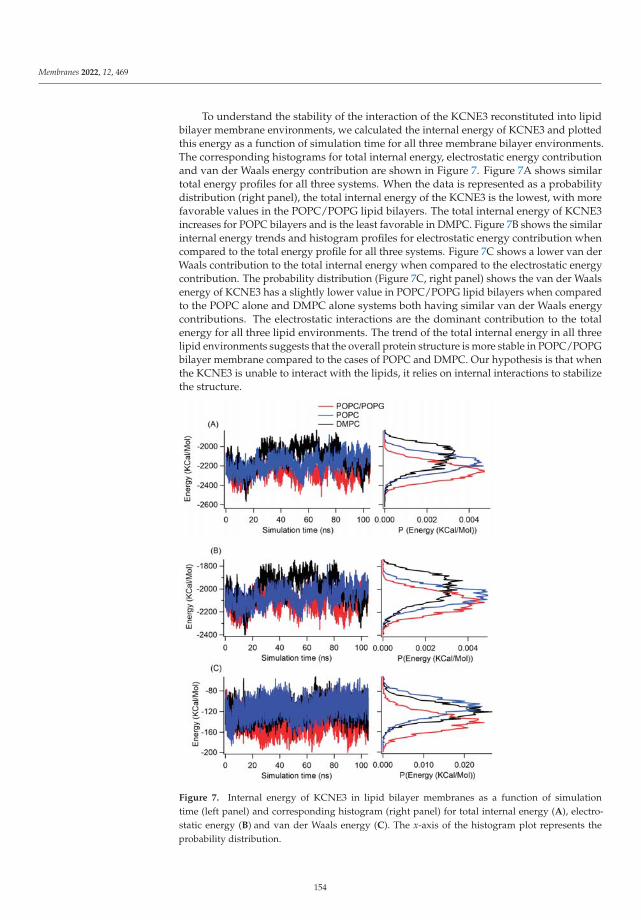
Membranes 2022, 12, 469
To understand the stability of the interaction of the KCNE3 reconstituted into lipidbilayer membrane environments, we calculated the internal energy of KCNE3 and plottedthis energy as a function of simulation time for all three membrane bilayer environments.The corresponding histograms for total internal energy, electrostatic energy contributionand van der Waals energy contribution are shown in Figure 7. Figure 7A shows similartotal energy profiles for all three systems. When the data is represented as a probabilitydistribution (right panel), the total internal energy of the KCNE3 is the lowest, with morefavorable values in the POPC/POPG lipid bilayers. The total internal energy of KCNE3increases for POPC bilayers and is the least favorable in DMPC. Figure 7B shows the similarinternal energy trends and histogram profiles for electrostatic energy contribution whencompared to the total energy profile for all three systems. Figure 7C shows a lower van derWaals contribution to the total internal energy when compared to the electrostatic energycontribution. The probability distribution (Figure 7C, right panel) shows the van der Waalsenergy of KCNE3 has a slightly lower value in POPC/POPG lipid bilayers when comparedto the POPC alone and DMPC alone systems both having similar van der Waals energycontributions. The electrostatic interactions are the dominant contribution to the totalenergy for all three lipid environments. The trend of the total internal energy in all threelipid environments suggests that the overall protein structure is more stable in POPC/POPGbilayer membrane compared to the cases of POPC and DMPC. Our hypothesis is that whenthe KCNE3 is unable to interact with the lipids, it relies on internal interactions to stabilizethe structure.
Figure 7. Internal energy of KCNE3 in lipid bilayer membranes as a function of simulationtime (left panel) and corresponding histogram (right panel) for total internal energy (A), electro-static energy (B) and van der Waals energy (C). The x-axis of the histogram plot represents theprobability distribution.
154

Membranes 2022, 12, 469
To test this hypothesis, we computed the interaction energy of different segmentsof the KCNE3 with the lipid bilayer membrane as shown in Figure 8. In all three lipidenvironments, the interaction energy of the TMD section with the lipid is lower thanthat of C-terminus, C-terminal helix, and N-terminal helix with the respective lipid. Theinteraction energy of the N-terminus is close to interaction energy of the TMD but fluctuatesthroughout the simulation. While the interactions of the N- and C- termini appear to bestrong and exhibit large fluctuations, the N- and C-termini helices weakly interact with thelipid. Inspection of the trajectory data suggests these helices are closely interacting withthe membrane surface throughout the simulation, where the interaction energy attainsthe lowest values. The average interaction energies for each section of KCNE3 during thesimulation were calculated for all three lipid systems from the interaction energy data(Figure 8) as shown in Table 2. The average interaction energy for the TMD of KCNE3 is notsignificantly different for all three lipid systems. Similarly, other segments of the proteinhave similar average interaction energy (within the error) in all three corresponding lipidsystems. However, the standard deviation values are larger for the N- and C-termini inall three lipid systems. These data suggest that the interactions of the N- and C-termini ofKCNE3 with the membrane surface are dynamic.
Figure 8. Interaction energy of different segments of KCNE3 with lipid bilayer membranes as afunction of simulation time for POPC/POPG (A), POPC (B), and DMPC (C) lipid bilayers.
155

Membranes 2022, 12, 469
Table 2. Average interaction energy calculated from the interaction energy shown in Figure 8. Theerror represents standard deviation.
Average Interaction Energy (KCal/Mol)
POPC/POPG POPC DMPC
TMD −313.7 ± 42.3 −316.6 ± 37.5 −317.5 ± 42.2N-terminal helix −5.6 ± 10.9 −8.0 ± 14.8 −5.4 ± 9.4
N-terminus −465.3 ± 85.3 −371.8 ± 105.3 −401.3 ± 86.8C-terminal helix −4.9 ± 8.8 −11.6 ± 20.2 −7.5 ± 13.7
C-terminus −162.5 ± 64.5 −184.7 ± 63.7 −200.6 ± 68.5
These interaction energy data suggest that the N-terminus interacts most stronglywith the membrane surface but the interaction is dynamic and unstable, as the standarddeviation in the average energy calculation is very high for this segment of the protein.While the interaction energy of TMD is higher than that of the N-terminus, the stabilityof the TMD structure may be attributed to the internal energy of the protein its transientinteractions with water molecules [16].
To better understand the conformational stability and the interaction of the transmem-brane domain (TMD) of KCNE3 with membrane bilayers, we calculated the helical tilt ofthe TMD within the bilayer. In our previous results, we saw that the membrane thicknesswas dependent upon the lipid environment, though there were minute differences in theZ-distances of the terminal residues of the TMD helix. We wanted to establish whetherthe deformation of the helix occurred to accommodate the structure within the bilayer.We have plotted the probability density of the transmembrane (TM) helical tilt of KCNE3with the membrane normal and the Z-distance of the TMD of KCNE3 from the center ofthe mass of lipid bilayers for all three different membrane environments (POPC/POPG,POPC alone, and DMPC) as shown in Figure 9. The initial Z-distance fluctuates around 0 Å.When KCNE3 is embedded in the POPC/POPG lipid bilayer, two conformations of theTMD helix are observed; the dominant population is centered around a Z-distance of −3 Åand a helical tilt of 45◦, while the second less populated conformation is at a Z-distance of2 Å and a helical tilt of 75◦. In the case of POPC alone, similar conformations are observedas in the POPC/POPG system, though the populations are more diffuse with samplingof many intermediate states between the two dominant conformations. By comparison,only one dominant conformation exists in the DMPC lipid, which is unique to DMPCand not observed in the other two lipid environments. The highest probability is centeredaround a Z-distance of 3.5 Å, while the helical tilt fluctuates between 45◦ and 70◦. Thesedata suggest that there is a strong correlation between TM helical tilt angle and Z-distancefor POPC/POPG bilayers and DMPC bilayers, and a weak correlation for POPC bilayers.Interestingly, the dominant probability density for the DMPC membrane appears for theZ-distance of the TMD of around 4 Å from the center of the mass of the bilayers and TMhelical angle of around 45–70◦. This suggests that the TMD helix tilts to remain embeddedwithin the lipid bilayers. However, in DMPC the TMD helix is more stationary at theZ-distance and samples less tilt angles, suggesting that it is more stable in this lipid system.In contrast, when the TMD helix is in POPC/POPG and POPC alone, the tilting behavior ofthe TMD helix results in changes in Z-position, suggesting the TMD helix is more mobilewithin these lipids. These probability distribution patterns are also consistent with themembrane width data shown in Figure 5.
We wanted to further understand the conformational stability and interaction ofdifferent segments of KCNE3 with membrane bilayers. We plotted the correlation betweenthe total interaction energy of different segments of KCNE3 (N-terminus, N-terminal helix,TMD, C-terminal helix and C-terminus) and the corresponding Z-distances from the centerof the mass of the membrane bilayers in Figure 10. Figure 10A shows the probability densityfor the N-terminus. Similar trends are observed for POPC/POPG and DMPC, with onedominant population that varies between Z-distances of 35–50 Å and interacts strongly withthe lipids with energies ranging from −550 to −750 kcal/mol. Interestingly, the probability
156

Membranes 2022, 12, 469
density for POPC alone is more dispersed and involves much lower interaction energies.Visualization of the trajectory data suggests that the interaction of the N-terminus with thePOPC membrane surface is dynamic and very unstable, with a wide spreading of its portionabove the surface with occasionally anchoring to it. For the N-terminal helix of KCNE3(Figure 10B), the probability densities are similar for all three lipid environments. However,an additional disperse density with higher interactions and Z-distances closer to the lipidhead groups is observed for POPC/POPG. Visualization of the trajectory data suggests thatN-terminal helix also interacts dynamically with the POPC/POPG membrane surface anddevelops a bending in the helix during the interaction during certain periods of simulationtimes. A similar trend of a dominant population for the TMD helix is observed for all threesystems (Figure 10C). However, an additional dispersed density with higher interactionswith same Z-distance has been observed in POPC. The probability density for the TMDhelix also shows higher interactions in DMPC. For the C-terminal helix (Figure 10D) andthe C-terminus (Figure 10E), similar populations are observed in all three lipid systemswith a slightly weaker interactions observed in the POPC/POPG system. Together, thesedata suggest that the TMD of KCNE3 stably interacts with all three lipid systems, withDMPC conferring the greatest stability. While the N-terminus of KCNE3 is interactingstrongly with POPC/POPG, it is more dynamic and less stable. The interaction trend ofC-terminus is similar in POPC alone and DMPC. The weak interaction of the C-terminusin POPC/POPG suggests that the unanchored regions of either termini are stabilized bythe interactions with water. The probability density pattern for different KCNE3 segmentsobserved in these three environments are consistent with our RMSD, RMSF, membranewidth, Z-distances, and total interaction energy data (Figures 3–7).
Figure 9. Probability density plot of transmembrane (TM) helical tilt angle against the Z-distanceof TMD of KCNE3 in different lipid bilayer membranes. The yellow color indicates the highestprobability, and the blue color represents the lowest probability.
NMR studies by the Sanders lab on KCNE3 in LMPC (lyso-myristoylphosphatidylcholine) micelles and DMPG (dimyristoylphosphatidylglycerol)/ DHPC (dihexanoylphos-phatidylcholine) isotropic bicelles have suggested that KCNE3 adopts a single α-helicaltransmembrane domain (57–81). This is connected to a flexible loop with N-terminal surfaceassociated amphipathic helix (10–30) and a short juxtamembrane helix (90 to 95) and adisordered C-terminus (96 to 103) [16]. The previous double electron electron resonance(DEER) electron paramagnetic resonance (EPR) data on KCNE3 in POPC/POPG bilayeredvesicles suggested that the TMD helix of KCNE3 adopts a moderate curvature with residuesT71, S74, and G78 facing the concave side of the curvature [16]. The TMD of KCNE3 iscrucial to its function, and the curvature is important for binding to the activated-statechannel [16]. A recent cryo-electron microscopic (Cryo-EM) spectroscopic study on theKCNE3-KCNQ1 complex in detergent micelles suggested that there is a deviation on thestructure of KCNE3 interacting with KCNQ1 relative to the KCNE3 NMR structure modelin isotropic bicelles with a root mean square deviation (RMSD) of 7.6 Å between the twostructures [8]. Our all-atom molecular dynamics simulation data for 105 ns obtained onKCNE3 in POPC/POPG, POPC alone and DMPC bilayers reported in this study suggestedthat the center of mass of the KCNE3 TMD is slightly increased and more stable in DMPCwhen compared to POPC/POPG and POPC alone. In contrast, N- and C-termini weremore conformationally flexible and interacted differently in all three environments. The
157
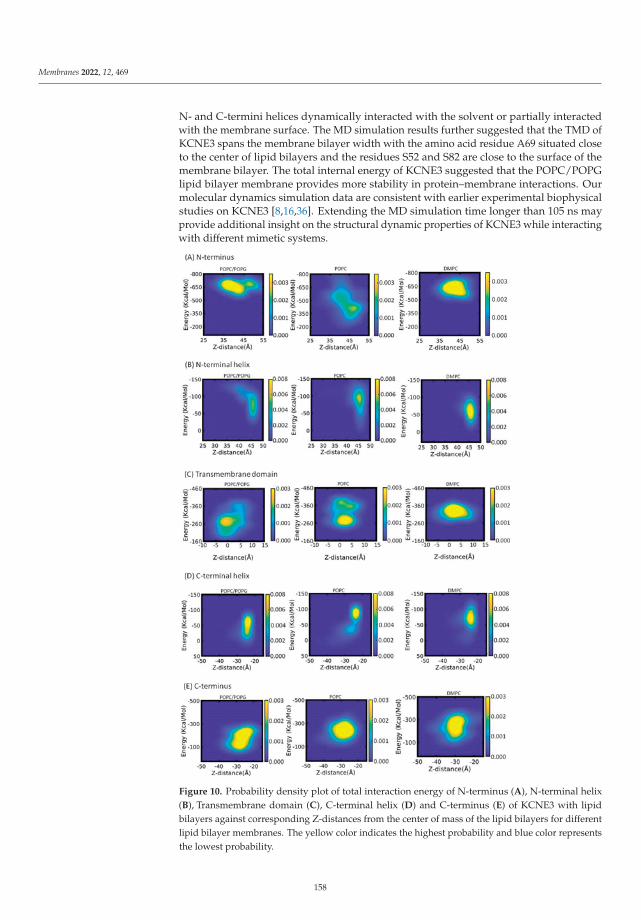
Membranes 2022, 12, 469
N- and C-termini helices dynamically interacted with the solvent or partially interactedwith the membrane surface. The MD simulation results further suggested that the TMD ofKCNE3 spans the membrane bilayer width with the amino acid residue A69 situated closeto the center of lipid bilayers and the residues S52 and S82 are close to the surface of themembrane bilayer. The total internal energy of KCNE3 suggested that the POPC/POPGlipid bilayer membrane provides more stability in protein–membrane interactions. Ourmolecular dynamics simulation data are consistent with earlier experimental biophysicalstudies on KCNE3 [8,16,36]. Extending the MD simulation time longer than 105 ns mayprovide additional insight on the structural dynamic properties of KCNE3 while interactingwith different mimetic systems.
Figure 10. Probability density plot of total interaction energy of N-terminus (A), N-terminal helix(B), Transmembrane domain (C), C-terminal helix (D) and C-terminus (E) of KCNE3 with lipidbilayers against corresponding Z-distances from the center of mass of the lipid bilayers for differentlipid bilayer membranes. The yellow color indicates the highest probability and blue color representsthe lowest probability.
158
Membranes 2022, 12, 469
4. Conclusions
All atom molecular dynamics simulations for 105 ns were performed on KCNE3incorporated into POPC/POPG, POPC alone and DMPC alone membrane bilayer environ-ments to study the structural dynamic properties of KCNE3. The MD simulation resultssuggested that the TMD of the KCNE3 is less conformationally flexible and more stablewhen compared to the N- and C-termini in all three membrane environments. The N- andC-termini of KCNE3 are conformationally more flexible and dynamic in all these three lipidenvironments. The MD simulation results further suggested that the TMD of KCNE3 spansthe membrane width, with residue A69 located near the center of the lipid bilayers andresidues S57 and S82 located at the opposing lipid bilayer membrane surfaces. These MDsimulation results complement the experimental biophysical studies of KCNE3 in lipidbilayer membranes to illuminate its structural dynamic properties in more detail.
Author Contributions: Conceptualization, I.D.S., G.A.L. and C.R.S.; methodology, I.K.A. and I.D.S.;formal analysis, I.K.A., I.D.S., A.N.K. and J.P.A.; investigation, I.K.A., A.P.G., A.B.G., M.F.C., A.C.M.M.,C.C.C. and M.S.; resources, I.D.S. and G.A.L.; writing—original draft preparation, I.K.A. and I.D.S.;writing—review and editing, G.A.L., S.A., A.N.K., C.R.S. and I.D.S., supervision, I.D.S.; fundingacquisition, I.D.S. All authors have read and agreed to the published version of the manuscript.
Funding: This work is generously supported by National Science Foundation NSF MCB-2040917award. Gary A. Lorigan would like to acknowledge support from NSF (MRI-1725502) grant,NIGMS/NIH Maximizing Investigator’s Research Award (MIRA) R35 GM126935 award, the OhioBoard of Regents, and Miami University. Gary A. Lorigan would also like to acknowledge supportfrom the John W. Steube Professorship. Charles R. Sanders would like to acknowledge support fromUS NIH grant R01 HL122010.
Institutional Review Board Statement: Not applicable.
Informed Consent Statement: Not applicable.
Data Availability Statement: Not applicable.
Acknowledgments: We would like to appreciate Jens Mueller, the Facility Manager Redhawk ClusterMiami University, for assistance with the computational work.
Conflicts of Interest: The authors declare no conflict of interest.
Abbreviations
MD molecular dynamics;RMSD root mean square deviation;RMSF root mean square fluctuation;LMPC lyso-myristoylphosphatidyl choline;DMPC 1,2-dimyristoyl-sn-glycero-3-phosphocholine;DHPC dihexanoylphosphatidylcholine;DMPG dimyristoylphosphatidylglycerol;POPC 1-palmitoyl-2-oleoyl-sn-glycero-3-phosphocholine;POPG 1-palmitoyl-2-oleoyl-sn-glycero-3-phospho-(1′-rac-glycerol) (sodium salt);TMD Transmembrane Domain;EPR electron paramagnetic resonance;DEER double electron-electron resonance.
References
1. Abbott, G.W. KCNE1 and KCNE3: The yin and yang of voltage-gated K+ channel regulation. Gene 2016, 576, 1–13. [CrossRef][PubMed]
2. Lewis, A.; McCrossan, Z.A.; Abbott, G.W. MinK, MiRP1, and MiRP2 diversify Kv3.1 and Kv3.2 potassium channel gating. J. Biol.Chem. 2004, 279, 7884–7892. [CrossRef]
3. Schroeder, B.C.; Waldegger, S.; Fehr, S.; Bleich, M.; Warth, R.; Greger, R.; Jentsch, T.J. A constitutively open potassium channelformed by KCNQ1 and KCNE3. Nature 2000, 403, 196–199. [CrossRef] [PubMed]
159
Membranes 2022, 12, 469
4. Barro-Soria, R.; Ramentol, R.; Liin, S.I.; Perez, M.E.; Kass, R.S.; Larsson, H.P. KCNE1 and KCNE3 modulate KCNQ1 channels byaffecting different gating transitions. Proc. Natl. Acad. Sci. USA 2017, 114, E7367–E7376. [CrossRef] [PubMed]
5. Ohno, S.; Toyoda, F.; Zankov, D.P.; Yoshida, H.; Makiyama, T.; Tsuji, K.; Honda, T.; Obayashi, K.; Ueyama, H.; Shimizu, W.; et al.Novel KCNE3 Mutation Reduces Repolarizing Potassium Current and Associated with Long QT Syndrome. Hum. Mutat. 2009,30, 557–563. [CrossRef]
6. Lundquist, A.L.; Manderfield, L.J.; Vanoye, C.G.; Rogers, C.S.; Donahue, B.S.; Chang, P.A.; Drinkwater, D.C.; Murray, K.T.;George, L.A., Jr. Expression of multiple KCNE genes in human heart may enable variable modulation of I(Ks). J. Mol. Cell. Cardiol.2005, 38, 277–287. [CrossRef] [PubMed]
7. Grahammer, F.; Warth, R.; Barhanin, J.; Bleich, M.; Hug, M.J. The small conductance K+ channel. 2001 KCNQ1—Expression,function, and subunit composition in murine trachea. J. Biol. Chem. 2001, 276, 42268–42275. [CrossRef]
8. Sun, J.; MacKinnon, R. Structural Basis of Human KCNQ1 Modulation and Gating. Cell 2020, 180, 340–347.e9. [CrossRef]9. Barro-Soria, R.; Perez, M.E.; Larsson, H.P. KCNE3 acts by promoting voltage sensor activation in KCNQ1. Proc. Natl. Acad. Sci.
USA 2015, 112, E7286–E7292. [CrossRef]10. Preston, P.; Wartosch, L.; Gunzel, D.; Fromm, M.; Kongsuphol, P.; Ousingsawat, J.; Kunzelmann, K.; Barhanin, J.; Warth, R.; Jentsch,
T.J. Disruption of the K+ Channel beta-Subunit KCNE3 Reveals an Important Role in Intestinal and Tracheal Cl− Transport. J.Biol. Chem. 2010, 285, 7165–7175. [CrossRef]
11. Boucherot, A.; Schreiber, R.; Kunzelmann, K. Regulation and properties of KCNQ1 (K(v)LQT1) and impact of the cystic fibrosistransmembrane conductance regulator. J. Membr. Biol. 2001, 182, 39–47. [CrossRef] [PubMed]
12. Lundby, A.; Ravn, L.S.; Svendsen, J.H.; Haunso, S.; Olesen, S.P.; Schmitt, N. KCNE3 mutation V17M identified in a patient withlone atrial fibrillation. Cell. Physiol. Biochem. 2008, 21, 47–54. [CrossRef] [PubMed]
13. Abbott, G.W.; Butler, M.H.; Goldstein, S.A.N. Phosphorylation and protonation of neighboring MiRP2 sites: Function andpathophysiology of MiRP2-Kv3.4 potassium channels in periodic paralysis. FASEB J. 2006, 20, 293–301. [CrossRef]
14. Delpon, E.; Cordeiro, J.M.; Nunez, L.; Thomsen, P.E.B.; Guerchicoff, A.; Pollevick, G.D.; Wu, Y.S.; Kanters, J.K.; Larsen, C.T.;Burashnikov, E.; et al. Functional Effects of KCNE3 Mutation and Its Role in the Development of Brugada Syndrome. Circ.-Arrhythmia Electrophysiol. 2008, 1, 209–218. [CrossRef] [PubMed]
15. Zhang, D.F.; Liang, B.; Lin, J.; Liu, B.; Zhou, Q.S.; Yang, Y.Q. KCNE3 R53H substitution in familial atrial fibrillation. Chin. Med. J.2005, 118, 1735–1738. [PubMed]
16. Kroncke, B.M.; Van Horn, W.D.; Smith, J.; Kang, C.B.; Welch, R.C.; Song, Y.L.; Nannemann, D.P.; Taylor, K.C.; Sisco, N.J.;George, A.L.; et al. Structural basis for KCNE3 modulation of potassium recycling in epithelia. Sci. Adv. 2016, 2, e1501228.[CrossRef]
17. Sansom, M.S.P.; Bond, P.J.; Deol, S.S.; Grottesi, A.; Haider, S.; Sands, Z.A. Molecular simulations and lipid-protein interactions:Potassium channels and other membrane proteins. Biochem. Soc. Trans. 2005, 33, 916–920. [CrossRef]
18. Ramelot, T.A.; Yang, Y.; Sahu, I.D.; Lee, H.-W.; Xiao, R.; Lorigan, G.A.; Montelione, G.T.; Kennedy, M.A. NMR structure andMD simulations of the AAA protease intermembrane space domain indicates peripheral membrane localization within thehexaoligomer. FEBS Lett. 2013, 587, 3522–3528. [CrossRef]
19. Sahu, I.D.; Craig, A.F.; Dunagum, M.M.; McCarrick, R.M.; Lorigan, G.A. Characterization of bifunctional spin labels forinvestigating the structural and dynamic properties of membrane proteins using EPR spectroscopy. J. Phys. Chem. B 2017, 121,9185–9195. [CrossRef]
20. Weng, J.; Wang, W. Molecular Dynamics Simulation of Membrane Proteins. In Protein Conformational Dynamics; Han, K.-L.,Zhang, X., Yang, M.-J., Eds.; Springer: New York, NY, USA, 2013; pp. 305–329.
21. Muller, M.P.; Jiang, T.; Sun, C.; Lihan, M.Y.; Pant, S.; Mahinthichaichan, P.; Trifan, A.; Tajkhorshid, E. Characterization ofLipid-Protein Interactions and Lipid-Mediated Modulation of Membrane Protein Function through Molecular Simulation. Chem.Rev. 2019, 119, 6086–6161. [CrossRef]
22. Pandey, B.; Grover, A.; Sharma, P. Molecular dynamics simulations revealed structural differences among WRKY domain-DNAinteraction in barley (Hordeum vulgare). BMC Genom. 2018, 19, 132. [CrossRef] [PubMed]
23. Li, M.H.; Luo, Q.A.; Xue, X.G.; Li, Z.S. Molecular dynamics studies of the 3D structure and planar ligand binding of a quadruplexdimer. J. Mol. Model. 2011, 17, 515–526. [CrossRef] [PubMed]
24. Sonntag, Y.; Musgaard, M.; Olesen, C.; Schiott, B.; Moller, J.V.; Nissen, P.; Thogersen, L. Mutual adaptation of a membrane proteinand its lipid bilayer during conformational changes. Nat. Commun. 2011, 2, 304. [CrossRef]
25. Phillips, J.C.; Braun, R.; Wang, W.; Gumbart, J.; Tajkhorshid, E.; Villa, E.; Chipot, C.; Skeel, R.D.; Kalé, L.; Schulten, K. Scalablemolecular dynamics with NAMD. J. Comput. Chem. 2005, 26, 1781–1802. [CrossRef]
26. MacKerell, A.D.; Bashford, D.; Bellott, M.; Dunbrack, R.L.; Evanseck, J.D.; Field, M.J.; Fischer, S.; Gao, J.; Guo, H.; Ha, S.; et al.All-atom empirical potential for molecular modeling and dynamics studies of proteins. J. Phys. Chem. B 1998, 102, 3586–3616.[CrossRef] [PubMed]
27. MacKerell, A.D.; Feig, M.; Brooks, C.L. Improved treatment of the protein backbone in empirical force fields. J. Am. Chem. Soc.2004, 126, 698–699. [CrossRef] [PubMed]
28. Asare, I.K.; Perez, A.; Garcia, A.B.; Cruz, M.F.; Moura, A.C.M.; Campbell, C.C.; Scheyer, M.; Alao, J.P.; Kravats, A.N.;Lorigan, G.A.; et al. Studying structural and dynamic properties of KCNE3 in different membrane mimic systems using moleculardynamics simulations. Biophys. J. 2022, 121, 196a. [CrossRef]
160

Membranes 2022, 12, 469
29. Jo, S.; Kim, T.; Iyer, V.G.; Im, W. Software news and updates—CHARNIM-GUI: A web-based grraphical user interface forCHARMM. J. Comput. Chem. 2008, 29, 1859–1865. [CrossRef]
30. Humphrey, W.; Dalke, A.; Schulten, K. VMD-Visual Molecular Dynamics. J. Molec.Graph. 1996, 14, 33–38. [CrossRef]31. Schwieters, C.D.; Clore, G.M. The VMD-XPLOR visualization package for NMR structure refinement. J. Magn. Reson. 2001, 149,
239–244. [CrossRef]32. Jo, S.; Kim, T.; Im, W. Automated Builder and Database of Protein/Membrane Complexes for Molecular Dynamics Simulations.
PLoS ONE 2007, 2, e880. [CrossRef] [PubMed]33. Essmann, U.; Perera, L.; Berkowitz, M.L.; Darden, T.; Lee, H.; Pedersen, L.G. A smooth particle mesh ewald method. J. Chem.
Phys. 1995, 103, 8577–8593. [CrossRef]34. Barrett, P.J.; Song, Y.; Van Horn, W.D.; Hustedt, E.J.; Schafer, J.M.; Hadziselimovic, A.; Beel, A.J.; Sanders, C.R. The Amyloid
Precursor Protein Has a Flexible Transmembrane Domain and Binds Cholesterol. Science 2012, 336, 1168–1171. [CrossRef][PubMed]
35. Sahu, I.D.; Craig, A.F.; Dunagan, M.M.; Troxel, K.R.; Zhang, R.; Meiberg, A.G.; Harmon, C.N.; MaCarrick, R.M.; Kroncke, B.M.;Sanders, C.R.; et al. Probing Structural Dynamics and Topology of the KCNE1 Membrane Protein in Lipid Bilayers via Site-Directed Spin Labeling and Electron Paramagnetic Resonance Spectroscopy. Biochemistry 2015, 54, 6402–6412. [CrossRef]
36. Kang, C.B.; Vanoye, C.G.; Welch, R.C.; Van Horn, W.D.; Sanders, C.R. Functional Delivery of a Membrane Protein into OocyteMembranes Using Bicelles. Biochemistry 2010, 49, 653–655. [CrossRef]
161


MDPISt. Alban-Anlage 66
4052 BaselSwitzerland
Tel. +41 61 683 77 34Fax +41 61 302 89 18
www.mdpi.com
Membranes Editorial OfficeE-mail: [email protected]
www.mdpi.com/journal/membranes


ISBN 978-3-0365-4938-5
MDPI
St. Alban-Anlage 66
4052 Basel
Switzerland
Tel: +41 61 683 77 34
www.mdpi.com