Modeling and parametric analysis of hollow fiber membrane system for carbon capture from...
12
Modeling and Parametric Analysis of Hollow Fiber Membrane System for Carbon Capture from Multicomponent Flue Gas Rajab Khalilpour and Ali Abbas School of Chemical and Biomolecular Engineering, The University of Sydney, Sydney, Australia Zhiping Lai and Ingo Pinnau Advanced Membranes and Porous Materials Center KAUST, Thuwal, Saudi Arabia DOI 10.1002/aic.12699 Published online August 12, 2011 in Wiley Online Library (wileyonlinelibrary.com). The modeling and optimal design/operation of gas membranes for postcombustion carbon capture (PCC) is presented. A systematic methodology is presented for analysis of membrane systems considering multicomponent flue gas with CO 2 as target component. Simplifying assumptions is avoided by namely multicomponent flue gas represented by CO 2 /N 2 binary mixture or considering the co/countercurrent flow pattern of hollow-fiber membrane system as mixed flow. Optimal regions of flue gas pressures and membrane area were found within which a technoeconomical process system design could be carried out. High selectivity was found to not necessarily have notable impact on PCC membrane performance, rather, a medium selectivity combined with medium or high permeance could be more advantageous. V V C 2011 American Institute of Chemical Engineers AIChE J, 58: 1550–1561, 2012 Keywords: carbon capture, membrane, multicomponent gas, modeling, parametric analysis Introduction Avoiding CO 2 emissions is seen as imperative, and gov- ernments have recognized this as a key objective toward curbing effects of extreme weather, higher temperatures, worsening droughts and floods, and rising sea levels. Fossil fuels are the main contributors for CO 2 emissions. As such, carbon capture and storage (CCS) is viewed as a solution and a bridge from the current fossil fuel-based energy sys- tem to one that has near-zero carbon emissions. The premier interest in implementation of CCS projects is the large CO 2 sources, e.g., power plants accounting for about 78% of worldwide large stationary CO 2 sources. 1 There are three main approaches to capturing CO 2 from power plants; precombustion, oxyfuel combustion and postcombustion. Comprehensive descriptions of these processes can be found elsewhere. 2–3 Although oxyfuel and precombustion technolo- gies are studied extensively to be applied into new-build power plants, postcombustion (PCC) may be the most acces- sible option for retrofitting existing power plants due to mini- mum changes required to the existing plant. 4 A few technologies have been discussed for PCC; i.e., sol- vent-based absorption-desorption, 5 membrane, adsorption 6–7 and mineralization. 8 Solvent-based PCC although being the best available technology (BAT), is not a long-term desired technology for PCC due to its high-energy penalty for sol- vent regeneration. 5 Membrane-based PCC (MPCC) is one of the technologies that may have good potential to compete with solvent tech- nology although currently being under very controversial dis- cussions. The main advantages of membrane separation over other technologies include compactness, modularity, and ease of installation by skid-mounting, ability to be applied in remote areas such as offshore, flexibility in operation and maintenance and in most cases lower capital cost as well as lower energy consumption. 9 Carbon dioxide separation using membranes is widely addressed in the context of natural gas sweetening where the gas coming from the well contains CO 2 and H 2 S and is required to be reduced to pipeline specifications (CO 2 ¼ 2% and H 2 S ¼ 4 ppm). 10–11 However, this does not necessarily certify the practicality of using membranes for separation of CO 2 from flue gas due to the CH 4 -CO 2 and CO 2 -N 2 systems having differences in selectivity and in molecular size ratios of the binary components as well as due to different impacts of adsorption or capillary condensation effects. The pioneer work on CO 2 /N 2 separation may be traced back to the article by Kawakami et al. 12 They studied the impact of blending a low-permeable glassy polymer (cellu- lose nitrate) with a plasticizer membrane (poly (ethylene gly- col), PEG) on CO 2 /N 2 separation. The interesting point of this research was that the authors did not have clear ideas for industrial applications of CO 2 /N 2 separation and only projected that the separation of CO 2 from N 2 might be used ‘‘in order to recover carbon resources or to control CO 2 con- centration in an artificial atmosphere’’. It was mainly after the United Nation’s Earth Summit, held June 1992 in Brazil, that researches on different alter- native approaches, including membrane, for separation of CO 2 from flue gas (PCC) accelerated due to the high- commercial value forecast. Since then various researches Correspondence concerning this article should be addressed to A. Abbas at ali. [email protected]. V V C 2011 American Institute of Chemical Engineers 1550 AIChE Journal May 2012 Vol. 58, No. 5
Transcript of Modeling and parametric analysis of hollow fiber membrane system for carbon capture from...
Modeling and Parametric Analysis of Hollow Fiber MembraneSystem for Carbon Capture from Multicomponent Flue Gas
Rajab Khalilpour and Ali AbbasSchool of Chemical and Biomolecular Engineering, The University of Sydney, Sydney, Australia
Zhiping Lai and Ingo PinnauAdvanced Membranes and Porous Materials Center KAUST, Thuwal, Saudi Arabia
DOI 10.1002/aic.12699Published online August 12, 2011 in Wiley Online Library (wileyonlinelibrary.com).
The modeling and optimal design/operation of gas membranes for postcombustion carbon capture (PCC) is presented. Asystematic methodology is presented for analysis of membrane systems considering multicomponent flue gas with CO2 astarget component. Simplifying assumptions is avoided by namely multicomponent flue gas represented by CO2/N2 binarymixture or considering the co/countercurrent flow pattern of hollow-fiber membrane system as mixed flow. Optimal regionsof flue gas pressures and membrane area were found within which a technoeconomical process system design could becarried out. High selectivity was found to not necessarily have notable impact on PCC membrane performance, rather, amedium selectivity combined with medium or high permeance could be more advantageous. VVC 2011 American Institute of
Chemical Engineers AIChE J, 58: 1550–1561, 2012Keywords: carbon capture, membrane, multicomponent gas, modeling, parametric analysis
Introduction
Avoiding CO2 emissions is seen as imperative, and gov-ernments have recognized this as a key objective towardcurbing effects of extreme weather, higher temperatures,worsening droughts and floods, and rising sea levels. Fossilfuels are the main contributors for CO2 emissions. As such,carbon capture and storage (CCS) is viewed as a solutionand a bridge from the current fossil fuel-based energy sys-tem to one that has near-zero carbon emissions.
The premier interest in implementation of CCS projects isthe large CO2 sources, e.g., power plants accounting for about78% of worldwide large stationary CO2 sources.1 There arethree main approaches to capturing CO2 from power plants;precombustion, oxyfuel combustion and postcombustion.Comprehensive descriptions of these processes can be foundelsewhere.2–3 Although oxyfuel and precombustion technolo-gies are studied extensively to be applied into new-buildpower plants, postcombustion (PCC) may be the most acces-sible option for retrofitting existing power plants due to mini-mum changes required to the existing plant.4
A few technologies have been discussed for PCC; i.e., sol-vent-based absorption-desorption,5 membrane, adsorption6–7
and mineralization.8 Solvent-based PCC although being thebest available technology (BAT), is not a long-term desiredtechnology for PCC due to its high-energy penalty for sol-vent regeneration.5
Membrane-based PCC (MPCC) is one of the technologiesthat may have good potential to compete with solvent tech-
nology although currently being under very controversial dis-cussions. The main advantages of membrane separation overother technologies include compactness, modularity, andease of installation by skid-mounting, ability to be applied inremote areas such as offshore, flexibility in operation andmaintenance and in most cases lower capital cost as well aslower energy consumption.9
Carbon dioxide separation using membranes is widely
addressed in the context of natural gas sweetening where the
gas coming from the well contains CO2 and H2S and is
required to be reduced to pipeline specifications (CO2 ¼ 2%
and H2S ¼ 4 ppm).10–11 However, this does not necessarily
certify the practicality of using membranes for separation of
CO2 from flue gas due to the CH4-CO2 and CO2-N2 systems
having differences in selectivity and in molecular size ratios
of the binary components as well as due to different impacts
of adsorption or capillary condensation effects.The pioneer work on CO2/N2 separation may be traced
back to the article by Kawakami et al.12 They studied the
impact of blending a low-permeable glassy polymer (cellu-
lose nitrate) with a plasticizer membrane (poly (ethylene gly-
col), PEG) on CO2/N2 separation. The interesting point of
this research was that the authors did not have clear ideas
for industrial applications of CO2/N2 separation and only
projected that the separation of CO2 from N2 might be used
‘‘in order to recover carbon resources or to control CO2 con-
centration in an artificial atmosphere’’.It was mainly after the United Nation’s Earth Summit,
held June 1992 in Brazil, that researches on different alter-native approaches, including membrane, for separation ofCO2 from flue gas (PCC) accelerated due to the high-commercial value forecast. Since then various researches
Correspondence concerning this article should be addressed to A. Abbas at [email protected].
VVC 2011 American Institute of Chemical Engineers
1550 AIChE JournalMay 2012 Vol. 58, No. 5
have been carried out on membrane material design (MMD)and membrane systems engineering (MSE) specifically forseparation of CO2 from flue gas.
The review of studies on MMD is out of the context ofthis study. In a detailed study, Powell and Qiao13 reviewedavailable membrane materials for flue gas separation, possi-ble design strategies, synthesis, fabrication and role of novelmaterials. Their survey included a number of differentclasses of polymers as well as carbon and mixed matrixmembranes. Their survey which covered some 190 reportsconcluded that copolymers and polymer blends had higherpotential for further research.
It is currently observed that most of the studies on CO2
capture membranes are focused on improving selectivity andliterature lacks proper attention to other important require-ments such as stability, resistance to high pressure, usefullifetime, and so on. The other gap in the literature is ignor-ing the impact of other components of flue gas such as watervapor, O2, CO2, SOx, NOx, NH3, etc. With few excep-tions,14–16 all prior studies focus on a binary mixture of N2
and CO2. Most of the available selectivity values are for thisbinary mixture.
Understanding the important role of minor components inthe design and operation of membranes for carbon capture,Scholes et al.17 reviewed those polymeric membranes con-sidering impact of minor gases on membrane permeability,plasticization and aging effects. Their conclusion was that‘‘while many minor components can affect performance boththrough competitive sorption and plasticization muchremains unknown. This limits the selection process for mem-branes in this application’’. One of the examples of this typeis the recent study of Merkel et al.14 who highlighted thebeneficial effect of water vapor in PCC. This is while, it hasbeen traditionally thought that water, due to having higherpermeability than CO2 and due to solubility of CO2 in water,will cause plasticization effect and also Scholes et al.15 veryrecently, reported negative impact of water.
Even in significant portion of studies, permeability of eachpure gas N2 and CO2 over the membrane is experimentallyanalyzed and then CO2/N2 selectivity is obtained by divisionof the two values. This is while it is a general consensusthat permeability of a gas at pure and at mixture conditionsis very different due to different molecules’ competition indiffusion and sorption.18 An analogy can be drawn with ther-modynamics, the first approach could be called ‘‘ideal’’ se-lectivity and the latter ‘‘real’’. Therefore, future studiesshould first place effort in producing real selectivity valuesfor CO2/N2 mixtures, and the second attempt to use realisticflue gas compositions at least while considering oxygen andwater vapor.
We can, therefore, conclude from this review that researchin the field of MMD is mainly focused on improving thepermselectivity of CO2/N2 and other attributes of a propermembrane, i.e., stability and compatibility, while influenceand considerations of the real process environment andoperational parameters are not explored well yet.
Another series of studies have focused on MSE. Vander-sluijs et al.19 in an economical study, investigated the feasi-bility of polymer membranes for the recovery of CO2 fromflue gases of a power plant. They presented a cross-flow per-meation model and used optimization to determine CO2
abatement costs. They pointed out that with the membranesavailable at the time of their study, MPCC could not com-pete with solvent-based technologies. They proposed that for
membranes to become economically attractive for carboncapture, membranes with CO2/N2 selectivity higher than 200along with high permeability would be required. The valueof selectivity of 200 has thereafter been widely acceptedand/or cited by various publications.20–23 According toKazama et al.24 the total cost of amine process is evencheaper than a cardo polyimide hollow fiber membraneswith CO2/N2 selectivity of 40 and having high CO2
permeance of 1,000 GPUs. They estimated that in the CO2
concentration range above 25%, membrane systems becomeadvantageous over other technologies.
Matsumiya et al.25 having concern about energy consump-tion for the separation of CO2 in the flue gas used two dif-ferent scenarios for achieving required driving force betweenfeed and permeate side. In one scenario they compressedflue gas while the permeate side was under atmosphericpressure. In the other approach they used flue gas in its natu-ral atmospheric pressure but made vacuum condition indownstream permeate side. They noticed that the energyconsumption required for achieving the driving force usingthe vacuum strategy was significantly less than the one withcompression.
Bounaceur et al.26 assuming the flue gas as a binarymixture of CO2 and N2 and using cross-plug flow modelinside a single-stage membrane compared the feasibility ofmembrane against that of amine solvent process. The studyconcluded that with the available membranes of the timehaving CO2/N2 selectivities less than 50, the membraneprocess was not feasible and values above 100 wererequired. Another study in the same year claimed thatMEA-based technology is less expensive than membranetechnology even for CO2 purity requirements as low as60%.27 The same conclusion was reported elsewhere.28 Tillthis stage there was general consensus on infeasibility ofMPCC for power plants although the quantitative valuesfor feasibility thresholds were different for various studies.However, after this some new studies have contradicted theinfeasibility idea.
Favre21 debated the general consensus that solvent absorp-tion technologies are more feasible than membranes. The arti-cle criticized the IPCC statement1 on inappropriateness ofmembranes as being based on either incomplete or uncleararguments. According to that author, the potential of densepolymeric membranes to solve the flue gas treatment problemmay have been underestimated. Ho et al.29 with similar idea toothers25–26 compared membranes with compression against invacuo scenarios for a flue gas from a coal-fired power-plant.They showed that while vacuum strategy required relativelyhigh membrane area, it could achieve 35% less capture costper tonne CO2 avoided compared with compression systems.However, the conclusion was that no available membranecould result in capture cost competitive with amines.
Merkel et al.14 reported their development of a new mem-brane with CO2 permeances of greater than 1,000 GPUs anda CO2/N2 selectivity of 50 at 30
�C which according to them
has permeance 10 times higher than commercial CO2 mem-branes and selectivity in the range of the highest reportedfor nonfacilitated transport materials. They simulated two-stage membranes with vacuum pumps and using combustionair as sweep flow. The study claimed that the membrane pro-cess can capture 90% of CO2 in flue gas as a sequestration-ready supercritical fluid using about 16% of plant’s energyat a cost as low as $23/tonne CO2. This suggested the feasi-bility of MPCC.
AIChE Journal May 2012 Vol. 58, No. 5 Published on behalf of the AIChE DOI 10.1002/aic 1551
Bernardo et al.30 in a detailed review of state-of-the-artmembranes for gas separation point-out the fact that the con-cept of membranes application for PCC is not fully exploredand ‘‘significant design optimization would be required toidentify efficient, feasible, and environmentally sound techni-cal solutions’’.
In our agreement with Bernardo et al.30 one of the mainproblems of current studies on membrane carbon capture isthe lack of proper membrane process models to be used.Most of the studies assume the flues gas as a binary mixture(CO2 and N2) which is not an acceptable simplification.There are some other studies that assume mixed-flow patternwhich is subject to error as in reality cocurrent or counter-current flow are used. Hollow fiber types have also undoubt-edly proved to be the best at least for gas separation. Wehave identified a notable lack in the literature in systematicengineering analysis of membrane systems in any type ofgas separation including carbon capture.31
In this study, we introduce our previously discussed mem-brane gas separation simulation algorithm,31 implement it forsingle-stage membrane carbon capture and evaluate the poten-tial of membranes in this application. The model is firstpresented in the following section and then its solution is pre-sented in the other section considering both concurrent andcountercurrent flow pattern hollow fiber membranes. Thismodel has potential for identifying the optimal operatingconditions (e.g., pressure) and design parameters (e.g., area).We have also presented results from a detailed parametricanalysis with discussions on the interaction between variousparameters as well as on the regions of optimality. Finally, con-clusions are presented summarizing key findings and discussingthe merits of multistage configurations as well as the value ofthis modeling approach in feasibility analysis of MPCC forglobal decision-makers in the field of carbon capture.
Multicomponent Gas Membrane Modeling
Modeling
The overall mass transfer across the membrane for anycomponent i could be formulated as
Ni ¼ DFfi
A¼ Pfbi � Ppbi
R(1)
where Ni is mass-transfer flux of component i, DFfi is the feedflow rate passing through the membrane, A is membrane area,Pfb and Ppbi
are bulk partial pressures of feed and permeate for
component i, respectively, and R is overall mass-transferresistance. The overall mass-transfer resistance (R) isdescribed as a combination of three resistances (1) feed side(external) boundary layer, (2) membrane structure, and (3) thepermeate side (internal) boundary layer. However, in the caseof low-permeance polymer membranes for gas separation thatfollow solution-diffusion mechanism, permeance is the control-ling parameter, and the internal/external mass-transfer resis-tances might be relatively negligible. This simplifies Eq. 1 to
DFfi ¼ A�Pi
lmðPfi � PpiÞ (2)
where �Pi is permeability of component i over the membrane,
lm is membrane thickness and �Pi=lm is permeance (Kmi). Four
parameters affect mass transfer across the membrane;
membrane area, thickness, permeability, and gas pressure. A
successful membrane separation process, thus, requires proper
values of these parameters from which two of them (thickness
and permeability) are related to membrane synthesis while the
other two (gas pressure and membrane area) are defined by
membrane or system design.Besides thermodynamic and mass-transfer properties,
membrane module design and flow patterns also affect mem-
brane separation.32 There are four main types of membrane
designs, i.e., flat (plate-and-frame), tubular, spiral-wound and
hollow-fiber. The latter is receiving increasing attention
(especially for gas separation) due to its high-packing den-
sity as a result of higher area per volume.9 Five flow patterns
have also been studied, i.e., one-side-mixing, perfect mixing,
cross flow, cocurrent and countercurrent flow,32–33 while for
hollow fiber systems the practical options are cocurrent and
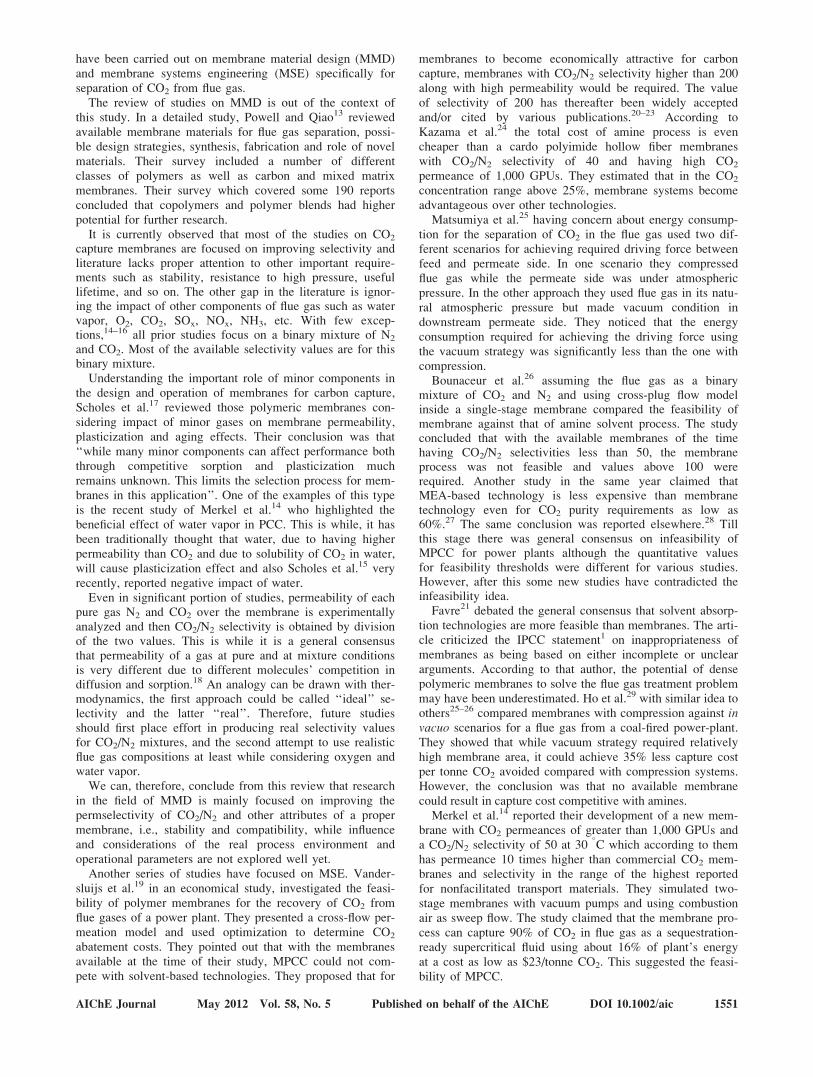
countercurrent flows (Figure 1).In this study, we consider hollow fiber membrane design
and aim to study performance of both cocurrent and counter-current flow patterns borrowing the idea from Pan.34 Figure1 illustrates a hollow fiber membrane with feed in shell-sideand permeate in lumen-side. This will be our base-casemodel although there is not much difference when feed isinside lumen and permeate diffuses to shell-side. The keyassumptions of this modeling are:
1 Permeabilities of gas components are assumed to beindependent of pressure.
2 Feed-side pressure drop is assumed to be negligible.3 Permeate pressure-drop follows the highly accepted
Hagen-Poiseuille equation.35
The overall mass balance is given by
Figure 1. Schematic of hollow fiber membrane module with (a) cocurrent, and (b) countercurrent flow arrangement.
1552 DOI 10.1002/aic Published on behalf of the AIChE May 2012 Vol. 58, No. 5 AIChE Journal
Ff þ Fp ¼ Ff0
xiFf þ yiFp ¼ xi0Ff0
�yi ¼ xi0Ff0 � xiFf
Ff0 � Ff(3)
where Ff and Fp are feed and permeate flow rates, respectively.
Accordingly, xi and yi are molar fraction of component i infeed and permeate. The subscript 0 refers to feed condition at
membrane inlet.Following Eq. 2, the permeation rate of gas component i
as well as total gas permeation through the membrane isgiven by Eqs. 4 and 5, respectively
dðxiFf Þdz
¼ �2pRoLNKmiðxiPf � yiPpÞ (4)
dFf
dz¼ �2pRoLN
XC1
KmiðxiPf � yiPpÞ (5)
where Ro, L and N are outer radius, length and total number of
hollow fiber membrane, respectively. For a feed with Ccomponents, a set of C equations for (4) should be solved
simultaneously. However, as it is noticed the ODE contains a
term xiFf where both xi and Ff are variables over hollow fiber
length. Therefore, the following equation requires further
simplification
dxidz
¼ �1
Ff2pRoLNKmi
ðxiPf � yiPpÞ þ xidFf
dz
� �(6)
for both feed and permeate sides, the following conditionsshould be, respectively satisfied
XCi¼1
xi ¼ 1 (7)
XCi¼1
yi ¼ 1 (8)
The next step is to define an equation for calculation ofpermeate component fraction yi. Given dðxiFf Þ ¼ yidFf com-bination of Eqs. 4 and 5 results in the desired Eq. 9
yi ¼Kmi
xiPC
1 ðyi=KmiÞ
1� bþ bKmi
PC1 ðyi=Kmi
Þ (9)
In which b is the pressure ratio of permeate over feed (Pp/Pf). Pressure drop in the permeate side is defined fromHagen-Poiseuille equation
dPp
dz¼ �8RTLlmðFf0 � Ff Þ
pR4inNPp
(10)
where R is ideal gas constant, T is temperature, lm is gasmixture viscosity, and Rin is hollow fiber inner radius.Equation 10 carries positive and negative signs for cocurrentand countercurrent flows, respectively.
The important parameter in Eq.10 requiring attention is vis-cosity, which varies as the concentration of permeate(and feed) changes through the fiber length. We have used thewell-known Wilke36 equation which is proved to predict mul-ticomponent gas viscosities within an average error of 2%.
Solution algorithm
Considering the gas flow has C components (i ¼ 1,2,…, C), we want to obtain the concentration profile of
both feed (xi) and permeate (yi) over the hollow fiber
length. The profiles of feed-gas flow rate and permeate
pressure are also required. The profile of feed-gas pressure
is not required to be calculated as we assumed it not to
change over the fiber length. Permeate flow rate calcula-
tion is also redundant as by having feed-gas flow rate pro-
file, it could be easily obtained using mass balance Eq. 3.
Therefore, we have 2C þ 2 unknowns. The same number
of equations is required to solve the problem. Equations 5,
6, 9 and 10 are candidate equations. These equations form
a system of nonlinear differential-algebraic equation
(NDAE). To solve this problem, we convert the ODEs
into algebraic equations using backward finite differential
equations over j segments (j ¼ 1, 2,…, J) of the fiber
and then solve the new set of equations, all algebraic,
using Gauss-Seidel algorithms.The solution algorithm for countercurrent flow has a small
difference due to the reverse direction of permeate. In cocur-
rent flow, both the feed and permeate initial values start at
j ¼ 0; the values of other segments j are then calculated step
by step. However, in the case of countercurrent flow we
do not have permeate pressure at j ¼ 0 (Pp,0) and instead
we have Pp,j. In this condition the numerical solution
will have one extra iteration loop and, hence, will be more
time-consuming.
Solution Output
For solution of the model, we considered a flue gas con-
taining four components, N2, CO2, O2 and H2O at different
operating conditions. Finding permselectivity data was a dif-
ficult task due to almost complete lack of such experimental
data for a membrane using flue gas with more than two com-
ponents. Sada et al.16 presented experimental permselectivity
data for three components of CO2, N2 and O2. However, the
data are out of date with low CO2/N2 selectivity of 15.65.
Recently Merkel et al.14 used a commercial membrane with
selectivity values of 50, 2.5 and 100 for CO2/N2, O2/N2 and
H2O/N2, respectively. We used these data as base-case in
our simulation work.The model was solved using MATLAB R2009a on a PC
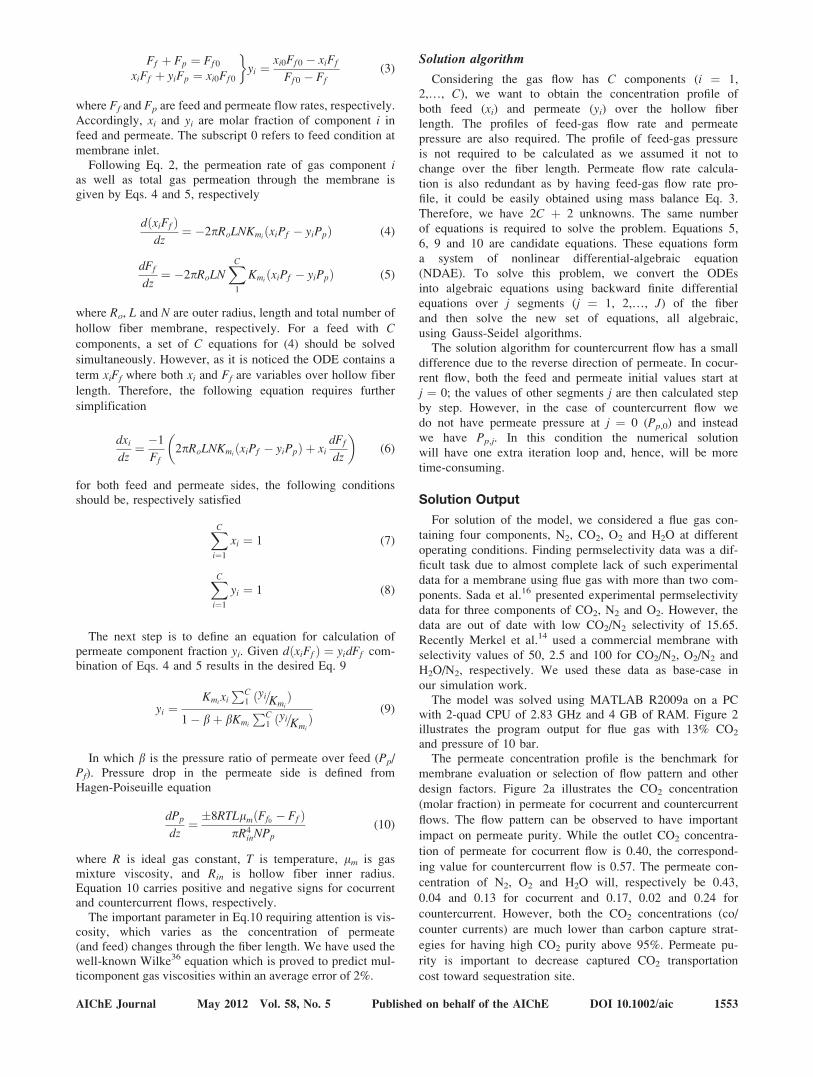
with 2-quad CPU of 2.83 GHz and 4 GB of RAM. Figure 2illustrates the program output for flue gas with 13% CO2
and pressure of 10 bar.The permeate concentration profile is the benchmark for
membrane evaluation or selection of flow pattern and other
design factors. Figure 2a illustrates the CO2 concentration
(molar fraction) in permeate for cocurrent and countercurrent
flows. The flow pattern can be observed to have important
impact on permeate purity. While the outlet CO2 concentra-
tion of permeate for cocurrent flow is 0.40, the correspond-
ing value for countercurrent flow is 0.57. The permeate con-
centration of N2, O2 and H2O will, respectively be 0.43,
0.04 and 0.13 for cocurrent and 0.17, 0.02 and 0.24 for
countercurrent. However, both the CO2 concentrations (co/
counter currents) are much lower than carbon capture strat-
egies for having high CO2 purity above 95%. Permeate pu-
rity is important to decrease captured CO2 transportation
cost toward sequestration site.
AIChE Journal May 2012 Vol. 58, No. 5 Published on behalf of the AIChE DOI 10.1002/aic 1553
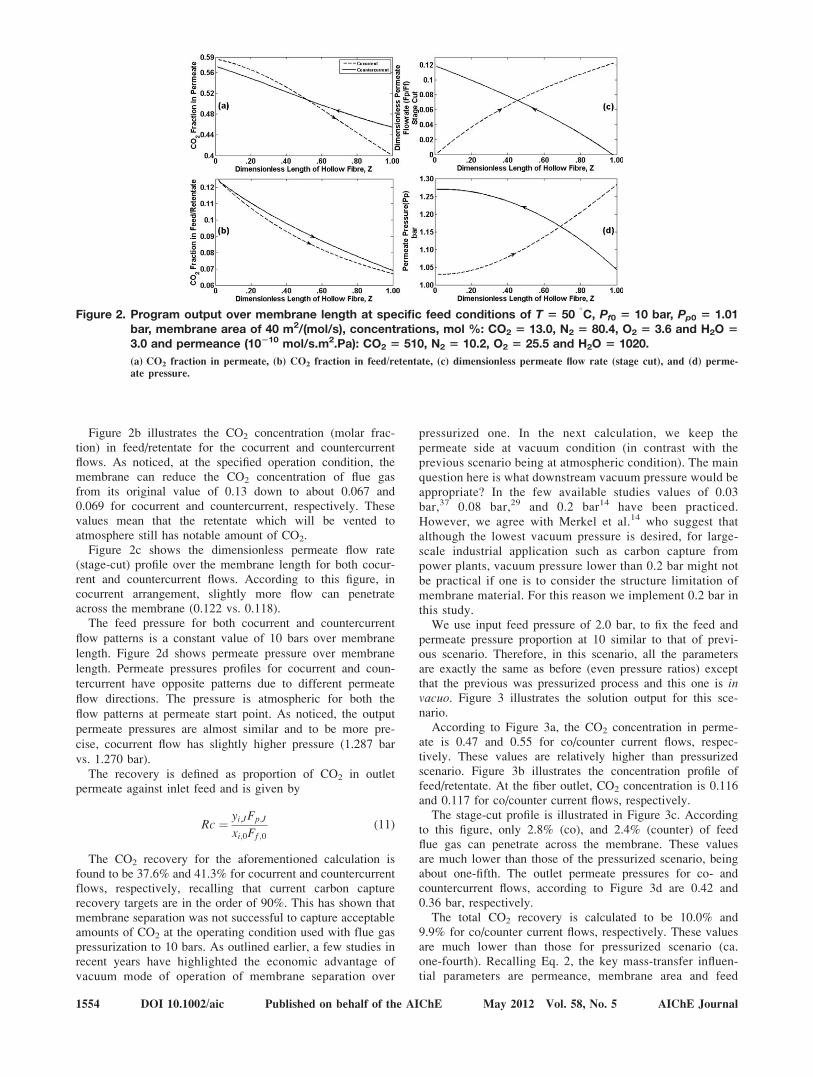
Figure 2b illustrates the CO2 concentration (molar frac-tion) in feed/retentate for the cocurrent and countercurrentflows. As noticed, at the specified operation condition, themembrane can reduce the CO2 concentration of flue gasfrom its original value of 0.13 down to about 0.067 and0.069 for cocurrent and countercurrent, respectively. Thesevalues mean that the retentate which will be vented toatmosphere still has notable amount of CO2.
Figure 2c shows the dimensionless permeate flow rate(stage-cut) profile over the membrane length for both cocur-rent and countercurrent flows. According to this figure, incocurrent arrangement, slightly more flow can penetrateacross the membrane (0.122 vs. 0.118).
The feed pressure for both cocurrent and countercurrent
flow patterns is a constant value of 10 bars over membrane
length. Figure 2d shows permeate pressure over membrane
length. Permeate pressures profiles for cocurrent and coun-
tercurrent have opposite patterns due to different permeate
flow directions. The pressure is atmospheric for both the
flow patterns at permeate start point. As noticed, the output
permeate pressures are almost similar and to be more pre-
cise, cocurrent flow has slightly higher pressure (1.287 bar
vs. 1.270 bar).The recovery is defined as proportion of CO2 in outlet
permeate against inlet feed and is given by
Rc ¼ yi;JFp;J
xi;0Ff ;0(11)
The CO2 recovery for the aforementioned calculation isfound to be 37.6% and 41.3% for cocurrent and countercurrentflows, respectively, recalling that current carbon capturerecovery targets are in the order of 90%. This has shown thatmembrane separation was not successful to capture acceptableamounts of CO2 at the operating condition used with flue gaspressurization to 10 bars. As outlined earlier, a few studies inrecent years have highlighted the economic advantage ofvacuum mode of operation of membrane separation over
pressurized one. In the next calculation, we keep thepermeate side at vacuum condition (in contrast with theprevious scenario being at atmospheric condition). The mainquestion here is what downstream vacuum pressure would beappropriate? In the few available studies values of 0.03bar,37 0.08 bar,29 and 0.2 bar14 have been practiced.However, we agree with Merkel et al.14 who suggest thatalthough the lowest vacuum pressure is desired, for large-scale industrial application such as carbon capture frompower plants, vacuum pressure lower than 0.2 bar might notbe practical if one is to consider the structure limitation ofmembrane material. For this reason we implement 0.2 bar inthis study.
We use input feed pressure of 2.0 bar, to fix the feed andpermeate pressure proportion at 10 similar to that of previ-ous scenario. Therefore, in this scenario, all the parametersare exactly the same as before (even pressure ratios) exceptthat the previous was pressurized process and this one is invacuo. Figure 3 illustrates the solution output for this sce-nario.
According to Figure 3a, the CO2 concentration in perme-ate is 0.47 and 0.55 for co/counter current flows, respec-tively. These values are relatively higher than pressurizedscenario. Figure 3b illustrates the concentration profile offeed/retentate. At the fiber outlet, CO2 concentration is 0.116and 0.117 for co/counter current flows, respectively.
The stage-cut profile is illustrated in Figure 3c. Accordingto this figure, only 2.8% (co), and 2.4% (counter) of feedflue gas can penetrate across the membrane. These valuesare much lower than those of the pressurized scenario, beingabout one-fifth. The outlet permeate pressures for co- andcountercurrent flows, according to Figure 3d are 0.42 and0.36 bar, respectively.
The total CO2 recovery is calculated to be 10.0% and9.9% for co/counter current flows, respectively. These valuesare much lower than those for pressurized scenario (ca.one-fourth). Recalling Eq. 2, the key mass-transfer influen-tial parameters are permeance, membrane area and feed
Figure 2. Program output over membrane length at specific feed conditions of T 5 50�C, Pf0 5 10 bar, Pp0 5 1.01
bar, membrane area of 40 m2/(mol/s), concentrations, mol %: CO2 5 13.0, N2 5 80.4, O2 5 3.6 and H2O 53.0 and permeance (10210 mol/s.m2.Pa): CO2 5 510, N2 5 10.2, O2 5 25.5 and H2O 5 1020.
(a) CO2 fraction in permeate, (b) CO2 fraction in feed/retentate, (c) dimensionless permeate flow rate (stage cut), and (d) perme-ate pressure.
1554 DOI 10.1002/aic Published on behalf of the AIChE May 2012 Vol. 58, No. 5 AIChE Journal
pressure (driving force). With permeance being constant,
we can conclude that for the vacuum mode of operation to
achieve similar recovery to that of the pressurized mode, it
requires either higher pressure ratio or higher membrane
area. The pressurization is discarded as the objective of
having vacuum process is to prevent the high-compression
costs. The area, however, might be the solution, meaning
that vacuum process will require high membrane area.
Therefore, the appropriateness of vacuum mode of opera-
tion, whether for carbon capture or any other membrane
gas separation system, lies in the trade-off between energy
costs and membrane material costs. Therefore, detailed
technoeconomical analyses are warranted for this. We can
only project that with growing energy price and with deve-
lopment of new high-efficiency and low-cost membranes,
the vacuum process might be the choice in the future. In
the next section, we investigate the impact of various
parameters on membrane performance including both vac-
uum and pressurized scenarios.
Parametric Analysis
Membrane separation performance, according to Eq. 2 and
as discussed throughout the previous sections, is directly
related to permeance, pressure and area. There are other
secondary parameters such as selectivity and/or feed concen-
tration, etc., that affect the decision on the application of
membranes. In this section, we study the impact of these
parameters on membrane performance.
Membrane design
One of the important questions that a membrane manu-
facturer may encounter is the determination of the required
length of a membrane module. We know that membrane
area is given by A ¼ 2pRoLN. Having A and Ro constant,
we have constant value for LN, i.e., the product of length
(L) by number of fibers (N). The answer to the design
question for a single membrane module can then be either:
less number of longer fibers, or larger number of shorter
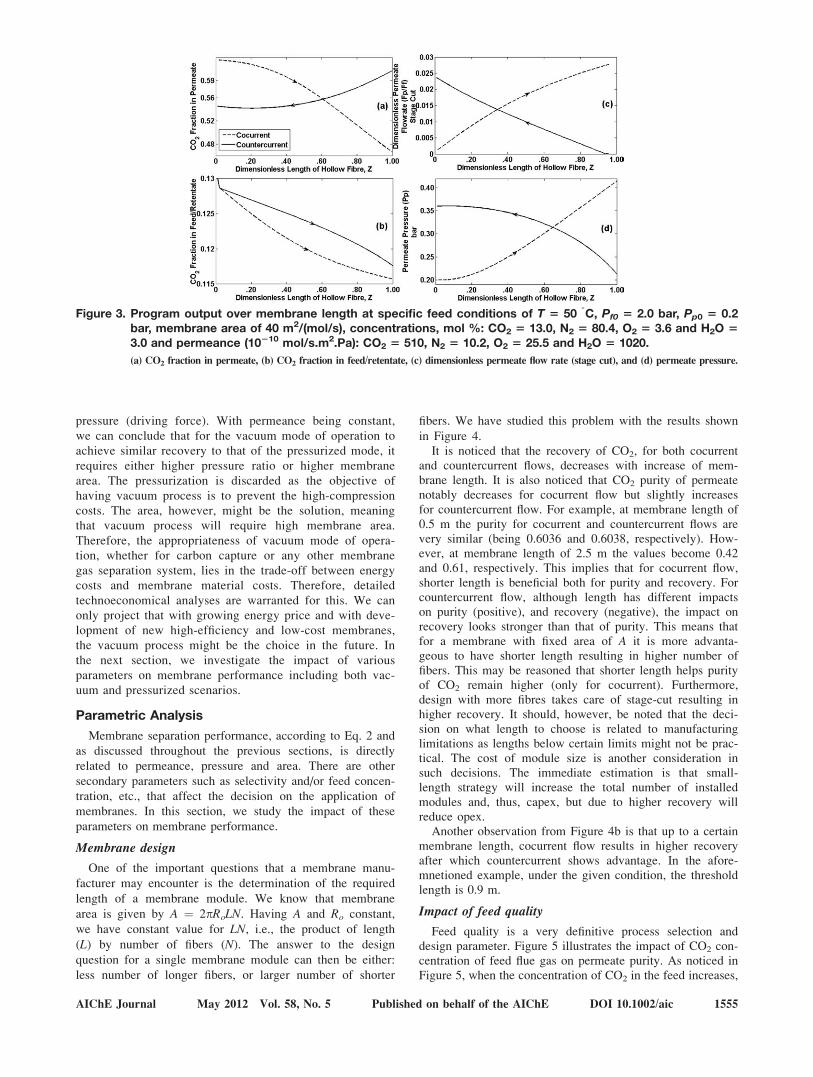
fibers. We have studied this problem with the results shown
in Figure 4.It is noticed that the recovery of CO2, for both cocurrent
and countercurrent flows, decreases with increase of mem-brane length. It is also noticed that CO2 purity of permeatenotably decreases for cocurrent flow but slightly increasesfor countercurrent flow. For example, at membrane length of0.5 m the purity for cocurrent and countercurrent flows arevery similar (being 0.6036 and 0.6038, respectively). How-ever, at membrane length of 2.5 m the values become 0.42and 0.61, respectively. This implies that for cocurrent flow,shorter length is beneficial both for purity and recovery. Forcountercurrent flow, although length has different impactson purity (positive), and recovery (negative), the impact onrecovery looks stronger than that of purity. This means thatfor a membrane with fixed area of A it is more advanta-geous to have shorter length resulting in higher number offibers. This may be reasoned that shorter length helps purityof CO2 remain higher (only for cocurrent). Furthermore,design with more fibres takes care of stage-cut resulting inhigher recovery. It should, however, be noted that the deci-sion on what length to choose is related to manufacturinglimitations as lengths below certain limits might not be prac-tical. The cost of module size is another consideration insuch decisions. The immediate estimation is that small-length strategy will increase the total number of installedmodules and, thus, capex, but due to higher recovery willreduce opex.
Another observation from Figure 4b is that up to a certainmembrane length, cocurrent flow results in higher recoveryafter which countercurrent shows advantage. In the afore-mnetioned example, under the given condition, the thresholdlength is 0.9 m.
Impact of feed quality
Feed quality is a very definitive process selection anddesign parameter. Figure 5 illustrates the impact of CO2 con-centration of feed flue gas on permeate purity. As noticed inFigure 5, when the concentration of CO2 in the feed increases,
Figure 3. Program output over membrane length at specific feed conditions of T 5 50�C, Pf0 5 2.0 bar, Pp0 5 0.2
bar, membrane area of 40 m2/(mol/s), concentrations, mol %: CO2 5 13.0, N2 5 80.4, O2 5 3.6 and H2O 53.0 and permeance (10210 mol/s.m2.Pa): CO2 5 510, N2 5 10.2, O2 5 25.5 and H2O 5 1020.
(a) CO2 fraction in permeate, (b) CO2 fraction in feed/retentate, (c) dimensionless permeate flow rate (stage cut), and (d) permeate pressure.
AIChE Journal May 2012 Vol. 58, No. 5 Published on behalf of the AIChE DOI 10.1002/aic 1555
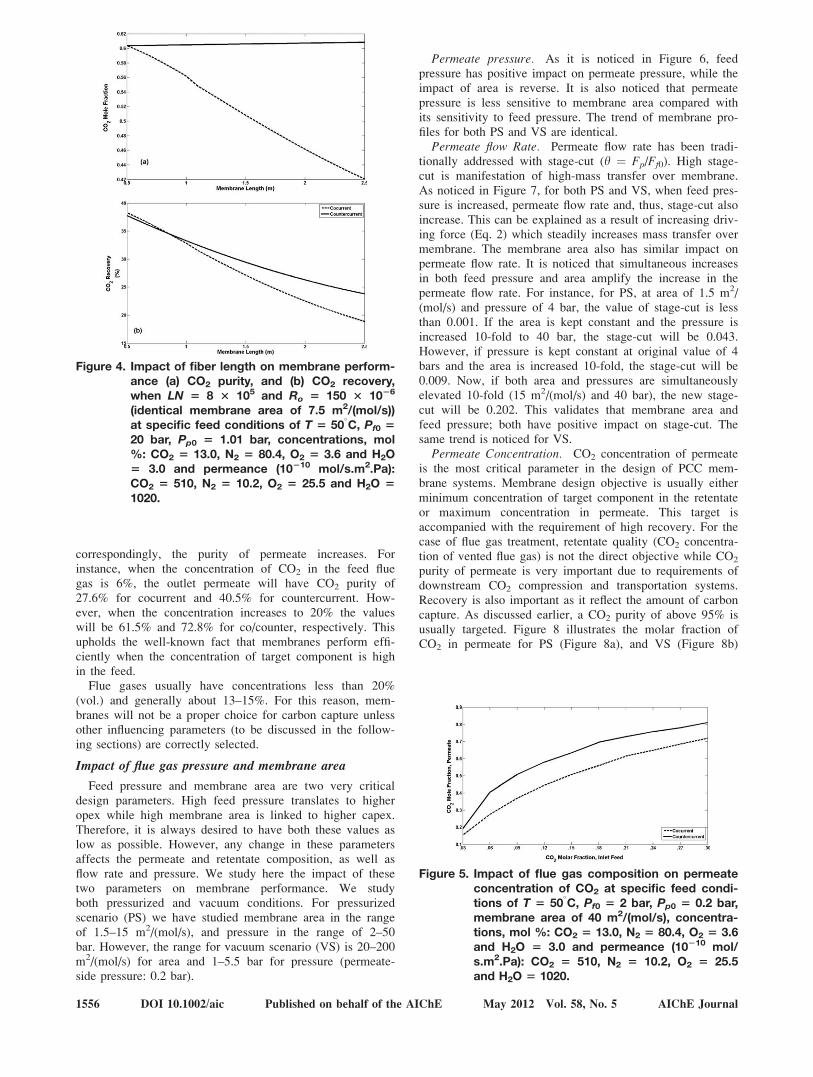
correspondingly, the purity of permeate increases. Forinstance, when the concentration of CO2 in the feed fluegas is 6%, the outlet permeate will have CO2 purity of27.6% for cocurrent and 40.5% for countercurrent. How-ever, when the concentration increases to 20% the valueswill be 61.5% and 72.8% for co/counter, respectively. Thisupholds the well-known fact that membranes perform effi-ciently when the concentration of target component is highin the feed.
Flue gases usually have concentrations less than 20%(vol.) and generally about 13–15%. For this reason, mem-branes will not be a proper choice for carbon capture unlessother influencing parameters (to be discussed in the follow-ing sections) are correctly selected.
Impact of flue gas pressure and membrane area
Feed pressure and membrane area are two very criticaldesign parameters. High feed pressure translates to higheropex while high membrane area is linked to higher capex.Therefore, it is always desired to have both these values aslow as possible. However, any change in these parametersaffects the permeate and retentate composition, as well asflow rate and pressure. We study here the impact of thesetwo parameters on membrane performance. We studyboth pressurized and vacuum conditions. For pressurizedscenario (PS) we have studied membrane area in the rangeof 1.5–15 m2/(mol/s), and pressure in the range of 2–50bar. However, the range for vacuum scenario (VS) is 20–200m2/(mol/s) for area and 1–5.5 bar for pressure (permeate-side pressure: 0.2 bar).
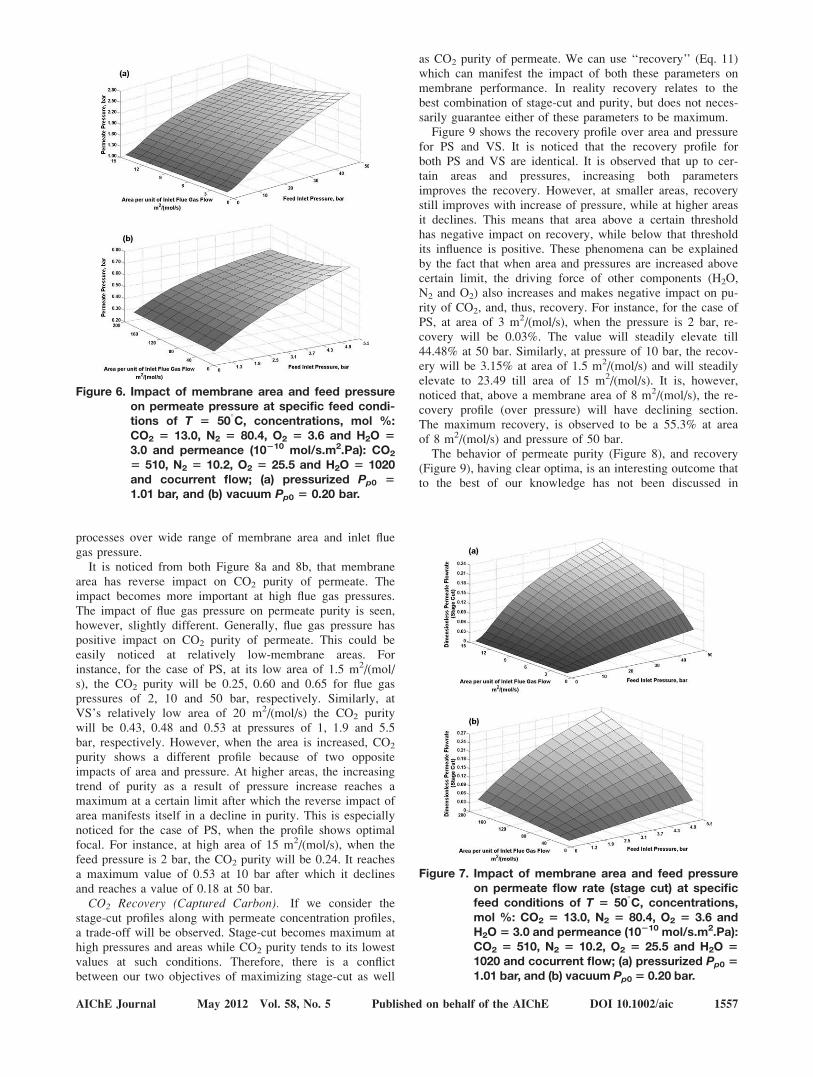
Permeate pressure. As it is noticed in Figure 6, feedpressure has positive impact on permeate pressure, while theimpact of area is reverse. It is also noticed that permeatepressure is less sensitive to membrane area compared withits sensitivity to feed pressure. The trend of membrane pro-files for both PS and VS are identical.
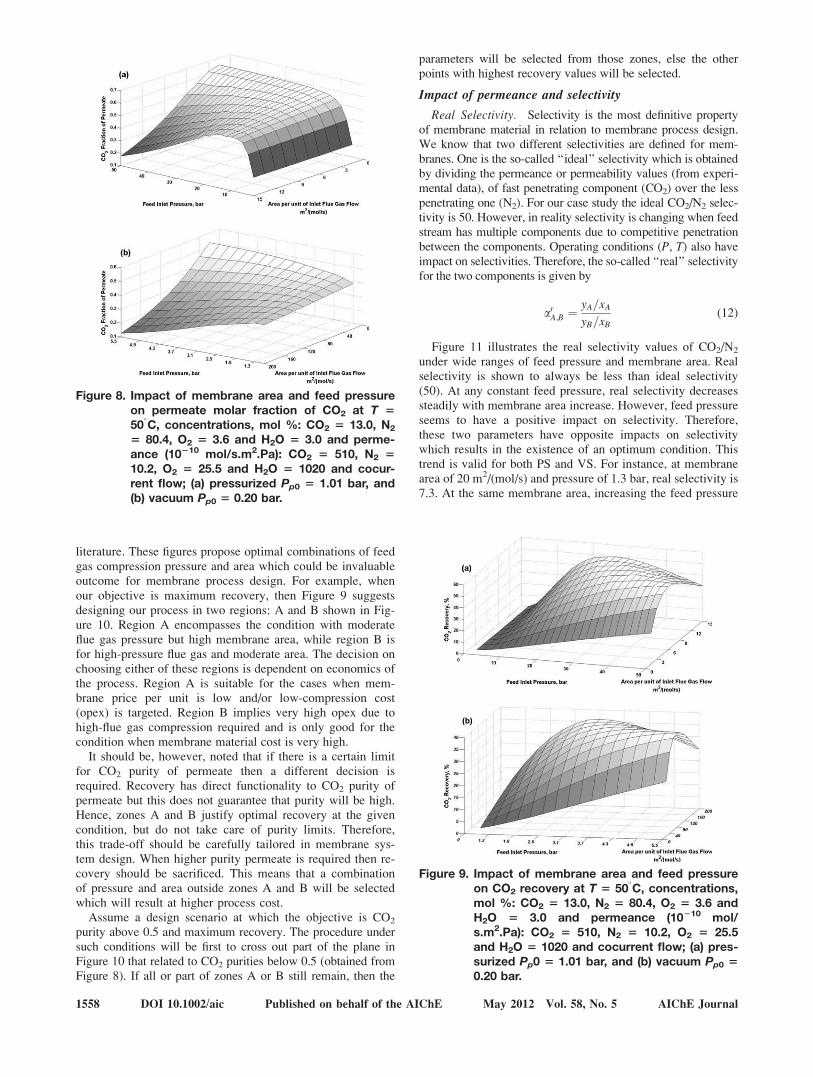
Permeate flow Rate. Permeate flow rate has been tradi-tionally addressed with stage-cut (h ¼ Fp/Ff0). High stage-cut is manifestation of high-mass transfer over membrane.As noticed in Figure 7, for both PS and VS, when feed pres-sure is increased, permeate flow rate and, thus, stage-cut alsoincrease. This can be explained as a result of increasing driv-ing force (Eq. 2) which steadily increases mass transfer overmembrane. The membrane area also has similar impact onpermeate flow rate. It is noticed that simultaneous increasesin both feed pressure and area amplify the increase in thepermeate flow rate. For instance, for PS, at area of 1.5 m2/(mol/s) and pressure of 4 bar, the value of stage-cut is lessthan 0.001. If the area is kept constant and the pressure isincreased 10-fold to 40 bar, the stage-cut will be 0.043.However, if pressure is kept constant at original value of 4bars and the area is increased 10-fold, the stage-cut will be0.009. Now, if both area and pressures are simultaneouslyelevated 10-fold (15 m2/(mol/s) and 40 bar), the new stage-cut will be 0.202. This validates that membrane area andfeed pressure; both have positive impact on stage-cut. Thesame trend is noticed for VS.
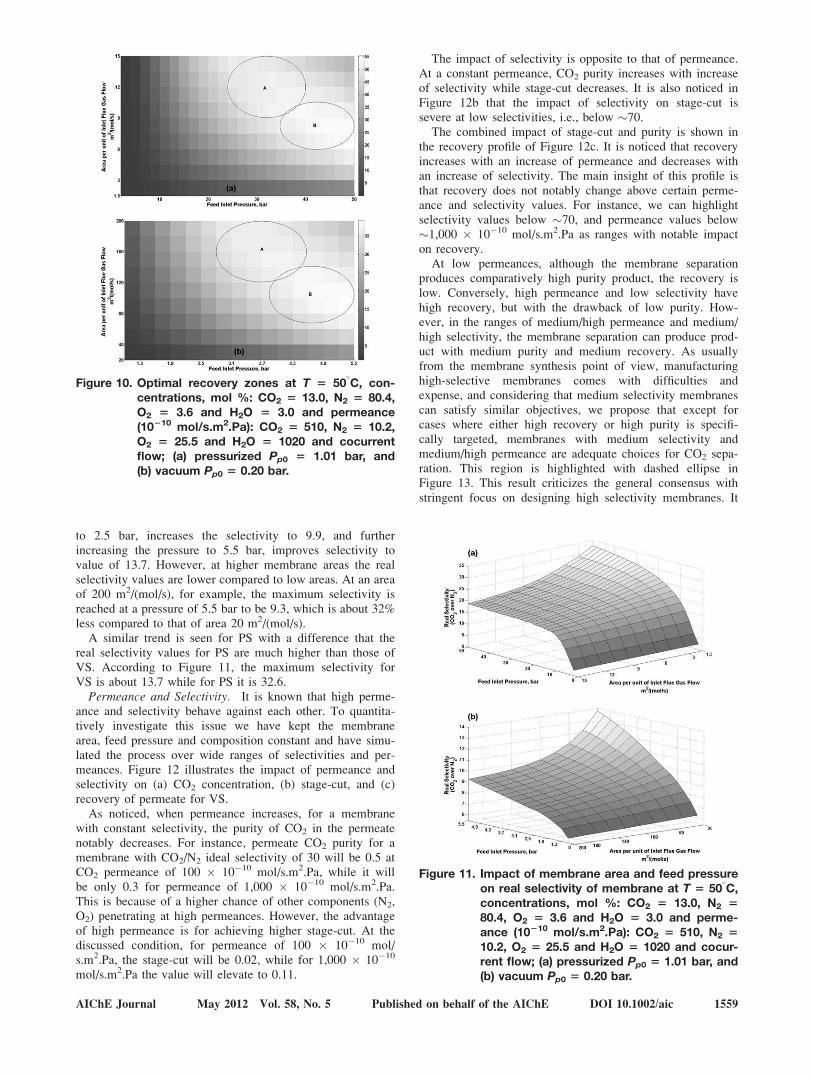
Permeate Concentration. CO2 concentration of permeateis the most critical parameter in the design of PCC mem-brane systems. Membrane design objective is usually eitherminimum concentration of target component in the retentateor maximum concentration in permeate. This target isaccompanied with the requirement of high recovery. For thecase of flue gas treatment, retentate quality (CO2 concentra-tion of vented flue gas) is not the direct objective while CO2
purity of permeate is very important due to requirements ofdownstream CO2 compression and transportation systems.Recovery is also important as it reflect the amount of carboncapture. As discussed earlier, a CO2 purity of above 95% isusually targeted. Figure 8 illustrates the molar fraction ofCO2 in permeate for PS (Figure 8a), and VS (Figure 8b)
Figure 5. Impact of flue gas composition on permeateconcentration of CO2 at specific feed condi-tions of T 5 50
�C, Pf0 5 2 bar, Pp0 5 0.2 bar,
membrane area of 40 m2/(mol/s), concentra-tions, mol %: CO2 5 13.0, N2 5 80.4, O2 5 3.6and H2O 5 3.0 and permeance (10210 mol/s.m2.Pa): CO2 5 510, N2 5 10.2, O2 5 25.5and H2O 5 1020.
Figure 4. Impact of fiber length on membrane perform-ance (a) CO2 purity, and (b) CO2 recovery,when LN 5 8 3 105 and Ro 5 150 3 1026
(identical membrane area of 7.5 m2/(mol/s))at specific feed conditions of T 5 50
�C, Pf0 5
20 bar, Pp0 5 1.01 bar, concentrations, mol%: CO2 5 13.0, N2 5 80.4, O2 5 3.6 and H2O5 3.0 and permeance (10210 mol/s.m2.Pa):CO2 5 510, N2 5 10.2, O2 5 25.5 and H2O 51020.
1556 DOI 10.1002/aic Published on behalf of the AIChE May 2012 Vol. 58, No. 5 AIChE Journal
processes over wide range of membrane area and inlet fluegas pressure.
It is noticed from both Figure 8a and 8b, that membranearea has reverse impact on CO2 purity of permeate. Theimpact becomes more important at high flue gas pressures.The impact of flue gas pressure on permeate purity is seen,however, slightly different. Generally, flue gas pressure haspositive impact on CO2 purity of permeate. This could beeasily noticed at relatively low-membrane areas. Forinstance, for the case of PS, at its low area of 1.5 m2/(mol/s), the CO2 purity will be 0.25, 0.60 and 0.65 for flue gaspressures of 2, 10 and 50 bar, respectively. Similarly, atVS’s relatively low area of 20 m2/(mol/s) the CO2 puritywill be 0.43, 0.48 and 0.53 at pressures of 1, 1.9 and 5.5bar, respectively. However, when the area is increased, CO2
purity shows a different profile because of two oppositeimpacts of area and pressure. At higher areas, the increasingtrend of purity as a result of pressure increase reaches amaximum at a certain limit after which the reverse impact ofarea manifests itself in a decline in purity. This is especiallynoticed for the case of PS, when the profile shows optimalfocal. For instance, at high area of 15 m2/(mol/s), when thefeed pressure is 2 bar, the CO2 purity will be 0.24. It reachesa maximum value of 0.53 at 10 bar after which it declinesand reaches a value of 0.18 at 50 bar.
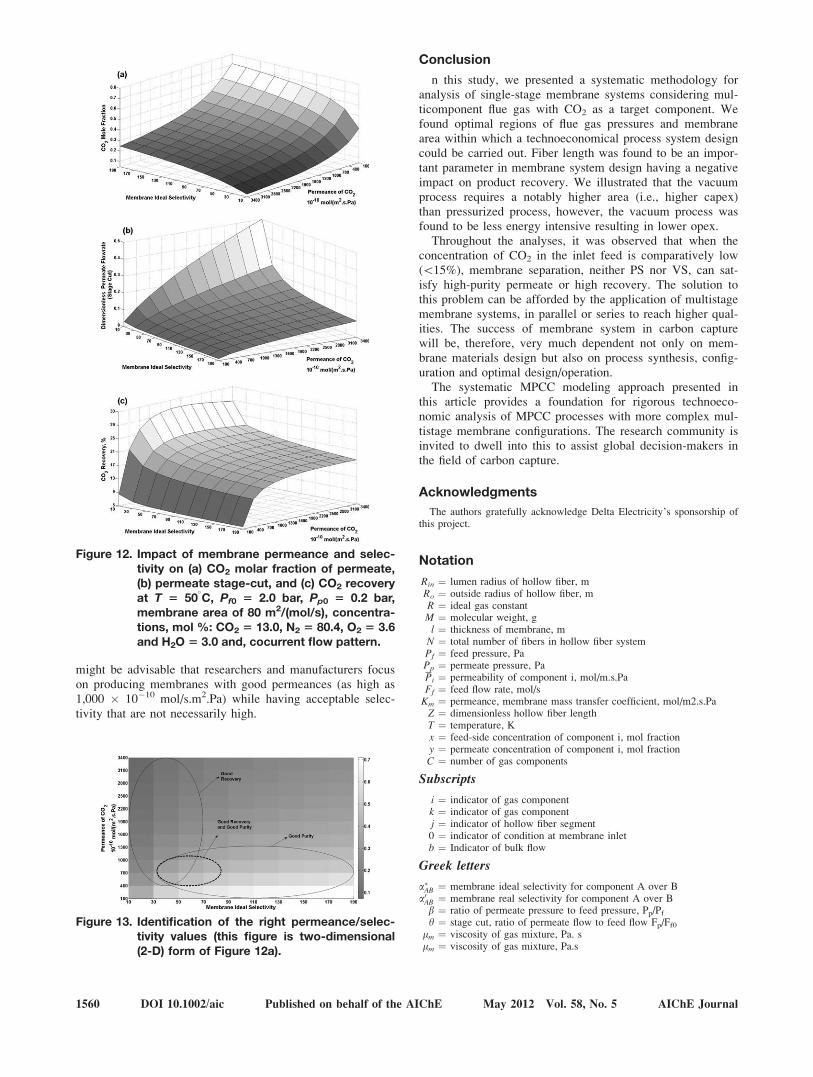
CO2 Recovery (Captured Carbon). If we consider thestage-cut profiles along with permeate concentration profiles,a trade-off will be observed. Stage-cut becomes maximum athigh pressures and areas while CO2 purity tends to its lowestvalues at such conditions. Therefore, there is a conflictbetween our two objectives of maximizing stage-cut as well
as CO2 purity of permeate. We can use ‘‘recovery’’ (Eq. 11)which can manifest the impact of both these parameters onmembrane performance. In reality recovery relates to thebest combination of stage-cut and purity, but does not neces-sarily guarantee either of these parameters to be maximum.
Figure 9 shows the recovery profile over area and pressurefor PS and VS. It is noticed that the recovery profile forboth PS and VS are identical. It is observed that up to cer-tain areas and pressures, increasing both parametersimproves the recovery. However, at smaller areas, recoverystill improves with increase of pressure, while at higher areasit declines. This means that area above a certain thresholdhas negative impact on recovery, while below that thresholdits influence is positive. These phenomena can be explainedby the fact that when area and pressures are increased abovecertain limit, the driving force of other components (H2O,N2 and O2) also increases and makes negative impact on pu-rity of CO2, and, thus, recovery. For instance, for the case ofPS, at area of 3 m2/(mol/s), when the pressure is 2 bar, re-covery will be 0.03%. The value will steadily elevate till44.48% at 50 bar. Similarly, at pressure of 10 bar, the recov-ery will be 3.15% at area of 1.5 m2/(mol/s) and will steadilyelevate to 23.49 till area of 15 m2/(mol/s). It is, however,noticed that, above a membrane area of 8 m2/(mol/s), the re-covery profile (over pressure) will have declining section.The maximum recovery, is observed to be a 55.3% at areaof 8 m2/(mol/s) and pressure of 50 bar.
The behavior of permeate purity (Figure 8), and recovery(Figure 9), having clear optima, is an interesting outcome thatto the best of our knowledge has not been discussed in
Figure 7. Impact of membrane area and feed pressureon permeate flow rate (stage cut) at specificfeed conditions of T 5 50
�C, concentrations,
mol %: CO2 5 13.0, N2 5 80.4, O2 5 3.6 andH2O 5 3.0 and permeance (10210 mol/s.m2.Pa):CO2 5 510, N2 5 10.2, O2 5 25.5 and H2O 51020 and cocurrent flow; (a) pressurized Pp0 51.01 bar, and (b) vacuum Pp0 5 0.20 bar.
Figure 6. Impact of membrane area and feed pressureon permeate pressure at specific feed condi-tions of T 5 50
�C, concentrations, mol %:
CO2 5 13.0, N2 5 80.4, O2 5 3.6 and H2O 53.0 and permeance (10210 mol/s.m2.Pa): CO2
5 510, N2 5 10.2, O2 5 25.5 and H2O 5 1020and cocurrent flow; (a) pressurized Pp0 51.01 bar, and (b) vacuum Pp0 5 0.20 bar.
AIChE Journal May 2012 Vol. 58, No. 5 Published on behalf of the AIChE DOI 10.1002/aic 1557
literature. These figures propose optimal combinations of feedgas compression pressure and area which could be invaluableoutcome for membrane process design. For example, whenour objective is maximum recovery, then Figure 9 suggestsdesigning our process in two regions: A and B shown in Fig-ure 10. Region A encompasses the condition with moderateflue gas pressure but high membrane area, while region B isfor high-pressure flue gas and moderate area. The decision onchoosing either of these regions is dependent on economics ofthe process. Region A is suitable for the cases when mem-brane price per unit is low and/or low-compression cost(opex) is targeted. Region B implies very high opex due tohigh-flue gas compression required and is only good for thecondition when membrane material cost is very high.
It should be, however, noted that if there is a certain limitfor CO2 purity of permeate then a different decision isrequired. Recovery has direct functionality to CO2 purity ofpermeate but this does not guarantee that purity will be high.Hence, zones A and B justify optimal recovery at the givencondition, but do not take care of purity limits. Therefore,this trade-off should be carefully tailored in membrane sys-tem design. When higher purity permeate is required then re-covery should be sacrificed. This means that a combinationof pressure and area outside zones A and B will be selectedwhich will result at higher process cost.
Assume a design scenario at which the objective is CO2
purity above 0.5 and maximum recovery. The procedure undersuch conditions will be first to cross out part of the plane inFigure 10 that related to CO2 purities below 0.5 (obtained fromFigure 8). If all or part of zones A or B still remain, then the
parameters will be selected from those zones, else the otherpoints with highest recovery values will be selected.
Impact of permeance and selectivity
Real Selectivity. Selectivity is the most definitive propertyof membrane material in relation to membrane process design.We know that two different selectivities are defined for mem-branes. One is the so-called ‘‘ideal’’ selectivity which is obtainedby dividing the permeance or permeability values (from experi-mental data), of fast penetrating component (CO2) over the lesspenetrating one (N2). For our case study the ideal CO2/N2 selec-tivity is 50. However, in reality selectivity is changing when feedstream has multiple components due to competitive penetrationbetween the components. Operating conditions (P, T) also haveimpact on selectivities. Therefore, the so-called ‘‘real’’ selectivityfor the two components is given by
arA;B ¼ yA=xAyB=xB
(12)
Figure 11 illustrates the real selectivity values of CO2/N2
under wide ranges of feed pressure and membrane area. Realselectivity is shown to always be less than ideal selectivity(50). At any constant feed pressure, real selectivity decreasessteadily with membrane area increase. However, feed pressureseems to have a positive impact on selectivity. Therefore,these two parameters have opposite impacts on selectivitywhich results in the existence of an optimum condition. Thistrend is valid for both PS and VS. For instance, at membranearea of 20 m2/(mol/s) and pressure of 1.3 bar, real selectivity is7.3. At the same membrane area, increasing the feed pressure
Figure 8. Impact of membrane area and feed pressureon permeate molar fraction of CO2 at T 550
�C, concentrations, mol %: CO2 5 13.0, N2
5 80.4, O2 5 3.6 and H2O 5 3.0 and perme-ance (10210 mol/s.m2.Pa): CO2 5 510, N2 510.2, O2 5 25.5 and H2O 5 1020 and cocur-rent flow; (a) pressurized Pp0 5 1.01 bar, and(b) vacuum Pp0 5 0.20 bar.
Figure 9. Impact of membrane area and feed pressureon CO2 recovery at T 5 50
�C, concentrations,
mol %: CO2 5 13.0, N2 5 80.4, O2 5 3.6 andH2O 5 3.0 and permeance (10210 mol/s.m2.Pa): CO2 5 510, N2 5 10.2, O2 5 25.5and H2O 5 1020 and cocurrent flow; (a) pres-surized Pp0 5 1.01 bar, and (b) vacuum Pp0 50.20 bar.
1558 DOI 10.1002/aic Published on behalf of the AIChE May 2012 Vol. 58, No. 5 AIChE Journal
to 2.5 bar, increases the selectivity to 9.9, and furtherincreasing the pressure to 5.5 bar, improves selectivity tovalue of 13.7. However, at higher membrane areas the realselectivity values are lower compared to low areas. At an areaof 200 m2/(mol/s), for example, the maximum selectivity isreached at a pressure of 5.5 bar to be 9.3, which is about 32%less compared to that of area 20 m2/(mol/s).
A similar trend is seen for PS with a difference that thereal selectivity values for PS are much higher than those ofVS. According to Figure 11, the maximum selectivity forVS is about 13.7 while for PS it is 32.6.
Permeance and Selectivity. It is known that high perme-ance and selectivity behave against each other. To quantita-tively investigate this issue we have kept the membranearea, feed pressure and composition constant and have simu-lated the process over wide ranges of selectivities and per-meances. Figure 12 illustrates the impact of permeance andselectivity on (a) CO2 concentration, (b) stage-cut, and (c)recovery of permeate for VS.
As noticed, when permeance increases, for a membranewith constant selectivity, the purity of CO2 in the permeatenotably decreases. For instance, permeate CO2 purity for amembrane with CO2/N2 ideal selectivity of 30 will be 0.5 atCO2 permeance of 100 � 10�10 mol/s.m2.Pa, while it willbe only 0.3 for permeance of 1,000 � 10�10 mol/s.m2.Pa.This is because of a higher chance of other components (N2,O2) penetrating at high permeances. However, the advantageof high permeance is for achieving higher stage-cut. At thediscussed condition, for permeance of 100 � 10�10 mol/s.m2.Pa, the stage-cut will be 0.02, while for 1,000 � 10�10
mol/s.m2.Pa the value will elevate to 0.11.
The impact of selectivity is opposite to that of permeance.At a constant permeance, CO2 purity increases with increaseof selectivity while stage-cut decreases. It is also noticed inFigure 12b that the impact of selectivity on stage-cut issevere at low selectivities, i.e., below �70.
The combined impact of stage-cut and purity is shown inthe recovery profile of Figure 12c. It is noticed that recoveryincreases with an increase of permeance and decreases withan increase of selectivity. The main insight of this profile isthat recovery does not notably change above certain perme-ance and selectivity values. For instance, we can highlightselectivity values below �70, and permeance values below�1,000 � 10�10 mol/s.m2.Pa as ranges with notable impacton recovery.
At low permeances, although the membrane separationproduces comparatively high purity product, the recovery islow. Conversely, high permeance and low selectivity havehigh recovery, but with the drawback of low purity. How-ever, in the ranges of medium/high permeance and medium/high selectivity, the membrane separation can produce prod-uct with medium purity and medium recovery. As usuallyfrom the membrane synthesis point of view, manufacturinghigh-selective membranes comes with difficulties andexpense, and considering that medium selectivity membranescan satisfy similar objectives, we propose that except forcases where either high recovery or high purity is specifi-cally targeted, membranes with medium selectivity andmedium/high permeance are adequate choices for CO2 sepa-ration. This region is highlighted with dashed ellipse inFigure 13. This result criticizes the general consensus withstringent focus on designing high selectivity membranes. It
Figure 10. Optimal recovery zones at T 5 50�C, con-
centrations, mol %: CO2 5 13.0, N2 5 80.4,O2 5 3.6 and H2O 5 3.0 and permeance(10210 mol/s.m2.Pa): CO2 5 510, N2 5 10.2,O2 5 25.5 and H2O 5 1020 and cocurrentflow; (a) pressurized Pp0 5 1.01 bar, and(b) vacuum Pp0 5 0.20 bar.
Figure 11. Impact of membrane area and feed pressureon real selectivity of membrane at T 5 50
�C,
concentrations, mol %: CO2 5 13.0, N2 580.4, O2 5 3.6 and H2O 5 3.0 and perme-ance (10210 mol/s.m2.Pa): CO2 5 510, N2 510.2, O2 5 25.5 and H2O 5 1020 and cocur-rent flow; (a) pressurized Pp0 5 1.01 bar, and(b) vacuum Pp0 5 0.20 bar.
AIChE Journal May 2012 Vol. 58, No. 5 Published on behalf of the AIChE DOI 10.1002/aic 1559
might be advisable that researchers and manufacturers focuson producing membranes with good permeances (as high as1,000 � 10�10 mol/s.m2.Pa) while having acceptable selec-tivity that are not necessarily high.
Conclusion
n this study, we presented a systematic methodology foranalysis of single-stage membrane systems considering mul-ticomponent flue gas with CO2 as a target component. Wefound optimal regions of flue gas pressures and membranearea within which a technoeconomical process system designcould be carried out. Fiber length was found to be an impor-tant parameter in membrane system design having a negativeimpact on product recovery. We illustrated that the vacuumprocess requires a notably higher area (i.e., higher capex)than pressurized process, however, the vacuum process wasfound to be less energy intensive resulting in lower opex.
Throughout the analyses, it was observed that when theconcentration of CO2 in the inlet feed is comparatively low(\15%), membrane separation, neither PS nor VS, can sat-isfy high-purity permeate or high recovery. The solution tothis problem can be afforded by the application of multistagemembrane systems, in parallel or series to reach higher qual-ities. The success of membrane system in carbon capturewill be, therefore, very much dependent not only on mem-brane materials design but also on process synthesis, config-uration and optimal design/operation.
The systematic MPCC modeling approach presented inthis article provides a foundation for rigorous technoeco-nomic analysis of MPCC processes with more complex mul-tistage membrane configurations. The research community isinvited to dwell into this to assist global decision-makers inthe field of carbon capture.
Acknowledgments
The authors gratefully acknowledge Delta Electricity’s sponsorship ofthis project.
Notation
Rin ¼ lumen radius of hollow fiber, mRo ¼ outside radius of hollow fiber, mR ¼ ideal gas constantM ¼ molecular weight, gl ¼ thickness of membrane, mN ¼ total number of fibers in hollow fiber systemPf ¼ feed pressure, PaPp ¼ permeate pressure, PaPi ¼ permeability of component i, mol/m.s.PaFf ¼ feed flow rate, mol/sKm ¼ permeance, membrane mass transfer coefficient, mol/m2.s.PaZ ¼ dimensionless hollow fiber lengthT ¼ temperature, Kx ¼ feed-side concentration of component i, mol fractiony ¼ permeate concentration of component i, mol fractionC ¼ number of gas components
Subscripts
i ¼ indicator of gas componentk ¼ indicator of gas componentj ¼ indicator of hollow fiber segment0 ¼ indicator of condition at membrane inletb ¼ Indicator of bulk flow
Greek letters
a�AB ¼ membrane ideal selectivity for component A over BarAB ¼ membrane real selectivity for component A over Bb ¼ ratio of permeate pressure to feed pressure, Pp/Pfh ¼ stage cut, ratio of permeate flow to feed flow Fp/Ff0
lm ¼ viscosity of gas mixture, Pa. slm ¼ viscosity of gas mixture, Pa.s
Figure 12. Impact of membrane permeance and selec-tivity on (a) CO2 molar fraction of permeate,(b) permeate stage-cut, and (c) CO2 recoveryat T 5 50
�C, Pf0 5 2.0 bar, Pp0 5 0.2 bar,
membrane area of 80 m2/(mol/s), concentra-tions, mol %: CO2 5 13.0, N2 5 80.4, O2 5 3.6and H2O 5 3.0 and, cocurrent flow pattern.
Figure 13. Identification of the right permeance/selec-tivity values (this figure is two-dimensional(2-D) form of Figure 12a).
1560 DOI 10.1002/aic Published on behalf of the AIChE May 2012 Vol. 58, No. 5 AIChE Journal
Literature Cited
1. Metz B, Davidson O, Coninck HD, Loos M, Meyer L. IPCC specialreport on carbon dioxide capture and storage. Cambridge: Cambridge Uni-versity Press, for the Intergovernmental Panel on Climate Change; 2005.
2. Thomas DC, Benson S. Carbon Dioxide Capture for Storage inDeep Geologic Formations: Results from the CO2 Capture Project.1st ed. Amsterdam; Boston: Elsevier; 2005;2(5):1331.
3. Wilson EJ, Gerard D. Carbon Capture and Sequestration : IntegratingTechnology, Monitoring and Regulation. Ames, Iowa: Blackwell Pub-lishing; 2007.
4. Deutch JM, Moniz EJ.Summary for Policy Makers. In: Retro-Fittingof Coal-Fired Power Plants for CO2 Emissions Reductions Sympo-sium. Massachusetts Institute of Technology; 2009.
5. Khalilpour R, Abbas A. HEN optimization for efficient retrofittingof coal-fired power plants with post-combustion carbon capture. IntJ Greenhouse Gas Contr. 2011;5:189–99
6. Gomes VG, Yee KWK. Pressure swing adsorption for carbon dioxidesequestration from exhaust gases. Sep Purif Technol. 2002;28:161–71.
7. Ho MT, Allinson GW, Wiley DE. Reducing the cost of CO2 capturefrom flue gases using pressure swing adsorption. Ind Eng Chem Res.2008;47:4883–90.
8. Zevenhoven R, Fagerlund JICSEES. CO2 fixation by mineralmatter; the potential of different mineralization routes. IOP Confer-ance Ser: Earth Environmental Science; 2009:6.
9. Seader JD, Henley EJ. Separation Process Principles. Hoboken, NJ:John Wiley &Sons; 2006:34.
10. Ettouneya HM, Al-Enezia G, Hughesa R. Modelling of enrichmentof natural gas wells by membranes Gas Sep Purif. 1995;9:3–11
11. Baker RW, Lokhandwala K. Natural gas processing with mem-branes: An overview. Ind Eng Chem Res. 2008;47:2109–21.
12. Kawakami M, Iwanaga H, Hara Y, Iwamoto M, Kagawa S. Gas per-meabilities of cellulose nitrate poly(ethylene glycol) blend mem-branes. J Appl Polym Sci. 1982;27:2387–93.
13. Powell CE, Qiao GG. Polymeric CO2/N-2 gas separation mem-branes for the capture of carbon dioxide from power plant fluegases. J Membr Sci. 2006;279:1–49.
14. Merkel TC, Lin H, Wei X, Baker R. Power plant post-combustioncarbon dioxide capture: An opportunity for membranes. J MembrSci. 2010;359:126–139.
15. Scholes CA, Stevens GW, Kentish SE. The effect of hydrogen sulfide,carbon monoxide and water on the performance of a PDMS membranein carbon dioxide/nitrogen separation. J Membr Sci. 2010;350:189–99.
16. Sada E, Kumazawa H, Wang JS, Koizumi M. Separation of carbon-dioxide by asymmetric hollow fiber membrane of cellulose triace-tate. J Appl Polym Sci. 1992;45:2181–6.
17. Scholes C, Kentish S, Stevens G. Effects of minor components incarbon dioxide capture using polymeric gas separation membranes.Sep Purif Rev. 2009;38:1–44.
18. Koros WJ, Fleming GK. Membrane-based gas separation. J MembrSci. 1993;83:1–80.
19. Vandersluijs JP, Hendriks CA, Blok K. Feasibility of polymer mem-branes for carbon-dioxide recovery from flue-gases. Energy ConversManage. 1992;33:429–36.
20. Feron PHM, Jansen AE, Klaassen R. Membrane technology in car-bon-dioxide removal. Energy Conver Manage. 1992;33:421–8.
21. Favre E. Carbon dioxide recovery from post-combustion processes:Can gas permeation membranes compete with absorption? J MembrSci. 2007;294:50–9.
22. Aresta M.Carbon Dioxide Recovery and Utilization. Dordrecht; Bos-ton: Kluwer Academic Publishers; 2003:21.
23. Wolsky AM, Daniels EJ, Jody BJ. CO2 Capture from the flue-gas ofconventional fossil-fuel-fired power-plants. Environ Progr. 1994;13:214–9.
24. Kazama S, Morimoto S, Tanaka S, Mano H, Yashima T, YamadaK, Haraya K. Cardo Polyimide Membranes for CO2 Capture from FlueGases, Greenhouse Gas Control Technologies. In: 7th International Con-ference on Greenhouse Gas Control Technologies. Vancouver, Canada;2004.
25. Matsumiya N, Teramoto M, Kitada S, Matsuyama H. Evaluation ofenergy consumption for separation of CO2 in flue gas by hollowfiber facilitated transport membrane module with permeation ofamine solution. Sep Purif Technol. 2005;46:26–32.
26. Bounaceur R, Lape N, Roizard D, Vallieres C, Favre E. Membraneprocesses for post-combustion carbon dioxide capture: A parametricstudy. Energy. 2006;31:2556–70.
27. Ho MT, Leamon G, Allinson GW, Wiley DE. Economics of CO2and mixed gas geosequestration of flue gas using gas separationmembranes. Ind Eng Chem Res. 2006;45:2546–52.
28. Ho MT, Allinson G, Wiley DE. Comparison of CO2 separationoptions for geo-sequestration: are membranes competitive? Desali-nation. 2006;192:288–95.
29. Ho MT, Allinson GW, Wiley DE. Reducing the cost of CO2 capturefrom flue gases using membrane technology. Ind Eng Chem Res.2008;47:1562–8.
30. Bernardo P, Drioli E, Golemme G. Membrane gas separation: Areview/state of the art. Ind Eng Chem Res. 2009;48:4638–63.
31. Khalilpour R, Abbas A, Lai Z, Pinnau I.Membrane Systems Engi-neering: Modeling Hollow Fiber Membranes for MulticomponentGas Separation. Australia: The University of Sydney; 2011.
32. Geankoplis CJ.Transport Processes and Unit Operations. EngelwoodCliffs, NJ: PTR Prentice Hall; 1993:13.
33. Shindo Y, Hakuta T, Yoshitome H, Inoue H. Calculation methodsfor multicomponent gas separation by permeation. Sep Sci Technol.1985;20:445–59.
34. Pan CY. Gas separation by high-flux, asymmetric hollow-fiber mem-brane. AIChE J. 1986;32:2020–7.
35. McCabe WL, Smith JC, Harriott P.Unit Operations of Chemical En-gineering. Boston: McGraw-Hill; 2005:25.
36. Wilke CR. A viscosity equation for gas mixtures. J Chem Phys.1950;18:517–9.
37. Zhao L, Riensche E, Menzer R, Blum L, Stolten D. A parametricstudy of CO2/N-2 gas separation membrane processes for post-com-bustion capture. J Membr Sci. 2008;325:284–94.
Manuscript received Dec. 8, 2010, revision received Apr. 26, 2011, and finalrevision received Jun. 1, 2011.
AIChE Journal May 2012 Vol. 58, No. 5 Published on behalf of the AIChE DOI 10.1002/aic 1561