Circular Seamless Stainless Steel Hollow Products from Japan
Upload
khangminh22Category
view
0download
0
Numerical Modelling of Lean Duplex Stainless
Steel Hollow and Concrete-filled Columns of
Square, L-, T- and +-shape Sections under Pure
Axial Compression
A thesis submitted for the degree of
Doctor of Philosophy
by
M. Longshithung Patton
Department of Civil Engineering
Indian Institute on Technology Guwahati
Guwahati – 781 039, India
© October 2013
Declaration
I hereby certify that the work embodied in this thesis entitled ‘Numerical Modelling of
Lean Duplex Stainless Steel Hollow and Concrete-filled Columns of Square, L-, T- and
+-shape Sections under Pure Axial Compression’ in partial fulfilment of the
requirements for the award of the Degree of Doctor of Philosophy and submitted in the
Department of Civil Engineering, Indian Institute of Technology Guwahati, India, is an
authentic record of my own work carried out during a period from July, 2009 to
October, 2013 under the supervision of Dr. Konjengbam Darunkumar Singh, Associate
Professor, Department of Civil Engineering, Indian Institute of Technology Guwahati,
India.
The matter presented in the thesis has not been submitted by me for the award of any
other degree of this or any other institute.
Date: (Mr. M. Longshithung Patton)
Place: Reg. No: 09610405
TH-1259_09610405

CERTIFICATE
This is to certify that the thesis entitled ‘Numerical Modelling of Lean Duplex Stainless
Steel Hollow and Concrete-filled Columns of Square, L-, T-, and +-shape Sections
under Pure Axial Compression’ being submitted by Mr. M. Longshithung Patton to
the Indian Institute of Technology Guwahati, India, for the award of degree of Doctor of
Philosophy is a record of bonafide research work carried out by him under my
supervision.
The thesis work, in my opinion is worthy of considering for the award of degree of
Doctor of Philosophy in accordance with the regulation of the Institute.
(Dr. Konjengbam Darunkumar Singh)
Associate Professor
Department of Civil Engineering
Indian Institute of Technology Guwahati
Date:
Place:
TH-1259_09610405

to the Lord Almighty
to my dearest Parents
Mhonbemo and Myingthungbeni
TH-1259_09610405
i
ABSTRACT
Since the last two decades, there has been an accelerating interest in the use of stainless
steel in the construction industry (Mann, 1993, Gardner 2005) owing to the benefits of
stainless steels in terms of its good structural performance, aesthetic features and ease of
construction of structural members. Generally, the austenitic stainless steel grades which
contain ~ 8% - 11% nickel feature most prominently within the constructional industry.
However, with increasing nickel prices there is an escalation in the demand for Lean
Duplex Stainless Steel (LDSS) with low nickel content of ~ 1.5%, such as grade EN
1.4162 (Gardner, 2005b; Baddoo, 2008; EN 10088-4, 2009). LDSS, such as, grade EN
1.4162, has twice the mechanical strength of conventional austenitic and ferritic stainless
steel and has a potential for use as main structural members (Gardner, 2005b). Even
though there are several favourable characteristics involved in the use of LDSS material,
often it may not be economical due to its relatively high material costs. Hence, a
promising and innovative way to reduce the cost is through composite construction,
where concrete is filled inside the stainless steel hollow sections (also known as
Concrete-Filled Stainless Steel Tubular (CFSST) structures), which combines the
advantages of both stainless steel and concrete, and thus providing not only an increase in
the load-carrying capacity but also rapid construction (i.e. formwork is not required) (e.g.
Uy and Patil, 2006; Zhao et al., 2010; Young and Ellobody, 2006; Lam and Gardner,
2008; Uy et al., 2011). In addition to the benefits gained in terms of economy and
strength with the use of LDSS material and a composite construction, further benefits
may be gained by combining it with the use of special-shaped sections, such as, L-, T-,
and +-shape sections (Non-Rectangular Sections or NRSs). In engineering structures,
NRSs are mainly used in reinforced concrete columns because of their convenient
construction at beam-column joints, larger moment of inertia of the cross-sections that
TH-1259_09610405
ABSTRACT
ii
leads to much higher capacity for resisting lateral load along with the advantage of
providing a flushed wall face, resulting in an enlarged usable and regular indoor floor
space area. To the best of author’s knowledge, till date, there are no literatures available
regarding studies on the structural behavior of LDSS hollow and concrete-filled stub and
slender tubular columns with NRSs. Hence, the primary objective of the study undertaken
in this research was to explore the structural behavior of LDSS hollow and concrete-filled
tubular stub and slender columns with NRSs by comparing with a representative square
section having same LDSS material cross-sectional area (i.e. equal LDSS material
consumption adopted) under pure axial compressive loading through finite element (FE)
analyses using general-purpose FE software package Abaqus (2009).
In the first component of the present study, the effect of cross-sectional shapes and
thickness of the LDSS tube on the strength and deformation capacities as well as the
failure modes of the LDSS hollow tubular stub and slender columns are reported towards
understanding the behavior of NRSs over the representative square section. For LDSS
hollow tubular stub columns, it was found that, for LDSS tube thickness < 30 mm, NRSs
showed higher strength capacities by about 36 % to 3 %, 72 % to 3 %, and 134 % to 9 %
for L-, T- and +-shape section, respectively, over the representative square section, with
the percentage difference in strength decreasing with increasing thicknesses of the LDSS
tube. But for LDSS tube thickness ≥ 30 mm, the ratio of the strengths for the NRSs and
the representative square section tends to 1.0. The axial deformation at ultimate load of
the NRSs hollow tubular stub columns are higher compared to the representative square
section, with +-shape section estimating a much higher deformation capacity, suggesting
that there is a provision for achieving a better ductility in the use of NRSs. And for LDSS
hollow tubular slender columns, a range of column lengths viz., 3.0 m – 10.0 m, thereby
providing a range of non-dimensional member slenderness ( ) from 0.05 to 3.0, was
considered to account for the variations in buckling strength with changes in the column
lengths, cross-sectional shapes and LDSS tube thickness viz. 5.25 mm (Class 3 section)
and 2.0 mm (Class 4 section). For Class 3 sections, for ≤ 0.5, all the sections exhibit
similar structural capacities. For 0.5 < ≤ 2.0, there is a nearly linear variation in
TH-1259_09610405
ABSTRACT
iii
strengths (increasing trend for +HC, similar trend for THC and decreasing trend for
LHC), with stabilization beyond > 2.0. For > 2.0, Pu for +HC showed ~ 30% higher;
THC showed similar strength; and LHC showed ~20% lower than the corresponding
value for SHC, indicating that +HC has an improved ultimate strength for all the ranges
of . For Class 4 sections, in contrast to Class 3 sections, cross-sectional shape becomes
increasingly significant with decreasing , however, the cross-sectional shape becomes
insignificant for very high as also the case for Class 3 sections. The average strength
enhancement for the Class 4 NRSs as compared to the representative square section, for
all considered, are ~ 10 %, 50 %, and 90 % higher for LHC, THC, and +HC,
respectively. The deformation capacities of the LDSS hollow tubular slender columns are
similar irrespective of the cross-sectional shapes and class classification. Based on the FE
studies, the applicability of the currently available design standards for stainless steel,
such as the European specification, EN 1993-1-4 (2006), and the American specification,
ASCE 8-02 (2002), for the design of LDSS hollow tubular stub and slender columns
were assessed. Both the current design specifications are generally capable of predicting
the LDSS hollow tubular column strengths. However, the European specification tends to
be more conservative compared to the American specification.
In the next part of the investigation, the benefits in the use of NRSs LDSS hollow tubular
columns over those of the representative square section is extended to concrete-filled lean
duplex slender stainless steel tubular (CFDSST) columns with an objective to explore and
compare the structural behaviours such as the load and deformation capacities as well as
to study the effect of the LDSS tube thickness and concrete compressive strength on the
CFDSST columns. Similar to the approach followed in the analyses of LDSS hollow
tubular columns, the concept of equal LDSS material cross-sectional area was followed
(LDSS material being expensive compared to concrete), thereby, resulting in ~ 36 %
reduction of concrete core area in the NRSs CFDSST columns as compared to the
representative square CFDSST columns. The study suggested that NRSs CFDSST stub
columns are more effective for specimens with a normal concrete strength (≤ 40 MPa).
Also, NRSs CFDSST stub columns filled with high strength concrete can also be used
TH-1259_09610405
ABSTRACT
iv
with the advantages of providing lighter sections (i.e. 36 % reduction in the concrete core
volume) with only 18 %, 15 % and 12 % reduction of strength compared to the
representative square section for L-, T-, and +-shape sections, respectively, for 100 MPa
concrete strength. The axial deformation at ultimate load in CFDSST stub columns
decreases with increasing concrete strengths, but increases as the cross-sectional shape
changes from square → L- → T- → +-shape. In fixed-ended CFDSST slender columns,
for ~ < 0.5, +-shape showed a 7 % higher strength and L- and +-shape showed similar
strengths compared to the representative square section. For 0.5 ≤ ≥ 1.5, a linear
increasing trend in strength is seen with increasing . However, for > 0.5, T- and +-
shape showed a 10 % and 25 % more strength and L-shape showing a 10 % lower
strength compared to the representative square section. Thus, in fixed-ended CFDSST
slender columns, change of cross-sectional shape from square section to NRSs is
significant, especially for T-shape and +-shape sections, and can promote the application
of thin-wall LDSS tube. The influence of the cross-sectional shapes on the axial
deformation capacity becomes less significant with increasing , but becomes
increasingly significant with decreasing . Also, NRSs shows a higher axial deformation
capacity for all considered compared to the representative square section, with +-shape
section showing the highest axial deformation capacity. In comparison with the European
specification, EN 1994-1-1 (2004), and the American specification, ANSI/AISC 360-05
(2005), for the design of fixed-ended CFDSST columns, FE strengths over predicts the
design strengths, and also European specification tends to be more conservative
compared to the American specification. For CFDSST slender columns, the design
standards show over conservative results for square and L-shape sections and
conservative for T-shape and +-shape sections. Also, the European specification gives a
conservative estimation of strengths compared to the American specification for square
and L-shape sections and vice versa in case of T-shape and +-shape sections.
TH-1259_09610405

v
ACKNOWLEDGEMENT
The following acknowledgements are an account of the indebtedness I feel towards those
who have been a guiding light and source of inspiration towards the completion of this
thesis.
I express my deepest sense of gratitude and reverence to my supervisor Dr. Konjengbam
Darunkumar Singh for his constant valuable guidance, enthusiastic involvement and
kind help throughout my research work. He has been a constant source of motivation and
has treated me as a good friend. I will forever remain indebted to him for his untiring
effort and help extended to me that went beyond academics. The extraordinary
experience of working with him would be remembered in my life.
I am thankful to Dr. Arbind K. Singh, Dr. Arunasis Chakraborty and Dr. K.S.R. Krishna
Murthy, my doctoral committee members, who has contributed with valuable remarks
and ideas from time to time to give a good shape to this thesis.
I would like to thank the Department of Civil Engineering for providing the required
facilities for my research work. Cooperation extended by the Head of the Department and
office staffs deserves special thanks from my side. I would like to express my sincere
thanks to all faculty members who helped me directly or indirectly during my research
work.
I would like to express my sincere gratitude for the privilege of having associated with
good friends like Sonu, Sachi, Jackie, Ashish, Moa, Shahnilo, Rosang, Kiran and
Narendra.
TH-1259_09610405

ACKNOWLEDGEMENT
vi
I will cherish the friendship of Deori, Romen and Bishwa for the enriching experiences,
especially having vibrant, cheerful and entertaining company, making life more enjoyable
in IIT-Guwahati.
The episode of acknowledgement would remain incomplete without the care and support
of my parents, my brothers and sisters who are an inseparable part of my life. I owe my
gratitude to all of them.
I would express my deepest gratitude to all my well wishers.
Last but not the least, I express my thanks to Almighty God for his constant guidance and
blessing and giving the strength to complete this work.
M Longshithung Patton
TH-1259_09610405

vii
CONTENTS
ABSTRACT ........................................................................................................................ i
ACKNOWLEDGEMENT .................................................................................................v
CONTENTS..................................................................................................................... vii
LIST OF FIGURES ....................................................................................................... xiii
LIST OF TABLES ....................................................................................................... xviii
NOTATIONS.................................................................................................................. xix
CHAPTER 1: INTRODUCTION 1-11
1.1 Background ......................................................................................................................1
1.1.1 Lean duplex stainless steel ....................................................................................4
1.1.2 Concrete-filled tubular column .............................................................................4
1.2 Objectives of the Investigation ........................................................................................5
1.3 Outline of the Report .......................................................................................................5
CHAPTER 2: LITERATURE REVIEW 12-39
2.1 Introduction ......................................................................................................................12
2.2 Structural Hollow Tubular Columns ................................................................................13
2.3 Structural Concrete-filled Tubular Columns ...................................................................14
2.4 Structural LDSS Material ................................................................................................15
2.4.1 Previous Research on LDSS..................................................................................16
2.4.2 Design guidance on structural stainless steel ........................................................17
2.5 Structural Tubular Columns with NRSs ..........................................................................19
2.6 Material Modelling ..........................................................................................................20
TH-1259_09610405
CONTENTS
viii
2.6.1 Stainless steel ........................................................................................................20
2.6.1.1 Ramberg-Osgood model ..........................................................................20
2.6.1.2 Rasmussen model.....................................................................................21
2.6.1.3 Gardner and Ashraf model .......................................................................22
2.6.2 Confined concrete core ..........................................................................................23
2.7 Initial Geometric Imperfections .......................................................................................26
2.7.1 Local geometric imperfections ..............................................................................27
2.7.2 Global geometric imperfections ............................................................................29
2.8 The Production of Stainless Steel Tubular Sections ........................................................31
2.9 Summary of the Literature Review ..................................................................................31
CHAPTER 3 – NUMERICAL MODELLING OF LEAN DUPLEX
STAINLESS STEEL HOLLOW STUB COLUMNS 40-68
3.1 Introduction ......................................................................................................................40
3.2 FE Modelling ...................................................................................................................41
3.2.1 Boundary conditions and analysis technique ........................................................41
3.2.2 FE mesh .................................................................................................................42
3.2.3 Appraisal of existing material models ...................................................................43
3.2.4 Local geometric imperfections ..............................................................................44
3.3 Verification of the FE Models .........................................................................................44
3.4 Hollow Tubular Stub Column Modeling .........................................................................46
3.4.1 Introduction ...........................................................................................................46
3.4.2 Development of the FE models .............................................................................46
3.5 Results and Discussion ....................................................................................................47
3.5.1 Introduction ...........................................................................................................47
3.5.2 Deformed shapes of NRSs and square section ......................................................47
3.5.3 Load-axial deformation profile .............................................................................48
3.5.4 Strength capacity of NRSs and square section ......................................................49
3.5.5 Deformation capacity of NRSs and square section ...............................................50
3.5.6 Comparison with design codes ..............................................................................50
TH-1259_09610405
CONTENTS
ix
3.5.6.1 Effective area determination ....................................................................51
3.5.6.2 Cross-section resistance ...........................................................................52
3.5.6.3 Comparison of FE strengths with design strengths..................................52
3.5.6.4 Reliability analysis of the codes ..............................................................53
3.7 Conclusions ......................................................................................................................55
CHAPTER 4 – NUMERICAL MODELLING OF LEAN DUPLEX
STAINLESS STEEL HOLLOW SLENDER COLUMNS 69-94
4.1 Introduction ......................................................................................................................69
4.2 FE Modelling ...................................................................................................................70
4.2.1 Boundary conditions and analysis technique ........................................................70
4.2.2 FE mesh .................................................................................................................70
4.2.3 Initial geometric imperfections .............................................................................71
4.3 Verification of the FE models ..........................................................................................71
4.4 Hollow Tubular Slender Column Modeling ....................................................................72
4.4.1 Introduction ...........................................................................................................72
4.4.2 Development of the FE models .............................................................................73
4.5 Results and Discussion ....................................................................................................73
4.5.1 Introduction ...........................................................................................................73
4.5.2 Deformed shapes of NRSs and square section ......................................................74
4.5.3 Load-axial deformation profile .............................................................................75
4.5.4 Buckling strength of NRSs and square section .....................................................75
4.5.4.1 Class 3 sections ........................................................................................75
4.5.4.2 Class 4 sections ........................................................................................76
4.5.5 Deformation capacity of NRSs and square section ...............................................76
4.5.5.1 Class 3 sections ........................................................................................76
4.5.5.2 Class 4 sections ........................................................................................77
4.5.6 Comparison with design codes ..............................................................................77
4.5.6.1 Effective area determination ....................................................................78
4.5.6.2 Design strengths .......................................................................................78
TH-1259_09610405
CONTENTS
x
4.5.6.3 Comparison of FE strengths with design strengths..................................79
4.5.6.4 Reliability analysis of the codes ..............................................................80
4.6 Conclusions ......................................................................................................................80
CHAPTER 5 – NUMERICAL MODELLING OF CONCRETE-FILLED
LEAN DUPLEX STAINLESS STEEL STUB COLUMNS 95-126
5.1 Introduction ......................................................................................................................95
5.2 FE Modelling ...................................................................................................................96
5.2.1 Boundary conditions and analysis technique ........................................................96
5.2.2 FE mesh .................................................................................................................97
5.2.3 Concrete core material model ................................................................................97
5.2.4 Modelling of concrete-steel tube interface ............................................................98
5.3 Verification of the FE Models .........................................................................................99
5.4 Concrete-filled Tubular Stub Column Modeling .............................................................99
5.4.1 Introduction ...........................................................................................................99
5.4.2 Development of the FE models .............................................................................100
5.5 Results and Discussion ....................................................................................................101
5.5.1 Introduction ...........................................................................................................101
5.5.2 Deformed shapes of NRSs and square section ......................................................101
5.5.3 Load-axial deformation profile .............................................................................102
5.5.4 Influence of the LDSS tube ...................................................................................103
5.5.5 Strength capacity of NRSs and square section ......................................................104
5.5.6 Deformation capacity of NRSs and square section ...............................................105
5.5.7 Comparison with design codes ..............................................................................106
5.5.7.1 Effective area determination ....................................................................106
5.5.7.2 Cross-section resistance ...........................................................................107
5.5.7.3 Comparison of FE strengths with design strengths..................................107
5.5.7.4 Reliability analysis of the codes ..............................................................108
5.6 Conclusions ......................................................................................................................108
TH-1259_09610405
CONTENTS
xi
CHAPTER 6 – NUMERICAL MODELLING OF CONCRETE-FILLED
LEAN DUPLEX STAINLESS STEEL SLENDER COLUMNS 127-148
6.1 Introduction ......................................................................................................................127
6.2 FE Modelling ...................................................................................................................128
6.2.1 Concrete core material model ................................................................................128
6.2.2 Initial geometric imperfections .............................................................................129
6.3 Verification of the FE Models .........................................................................................129
6.4 Concrete-filled Tubular Slender Column Modeling ........................................................130
6.4.1 Introduction ...........................................................................................................130
6.4.2 Development of the FE models .............................................................................130
6.5 Results and Discussion ....................................................................................................132
6.5.1 Introduction ...........................................................................................................132
6.5.2 Deformed shapes of NRSs and square section ......................................................132
6.5.3 Load-axial deformation profile .............................................................................132
6.5.4 Strength capacity of NRSs and square section ......................................................133
6.5.5 Deformation capacity of NRSs and square section ...............................................134
6.5.6 Comparison with design codes ..............................................................................134
6.5.6.1 Effective area determination ....................................................................134
6.5.6.2 Design strengths .......................................................................................135
6.5.6.3 Comparison of FE strengths with design strengths..................................135
6.5.6.4 Reliability analysis of the codes ..............................................................135
6.6 Conclusions ......................................................................................................................136
CHAPTER 7 – CONCLUSIONS AND SUGGESTIONS FOR FURTHER WORK 149-157
7.1 Conclusions ......................................................................................................................149
7.1.1 Hollow tubular stub columns of NRSs and square section ...................................149
7.1.2 Hollow tubular slender columns of NRSs and square section ..............................151
7.1.3 Concrete-filled tubular stub columns of NRSs and square section .......................153
7.1.4 Concrete-filled tubular slender columns of NRSs and square section ..................154
TH-1259_09610405

CONTENTS
xii
7.2 Suggestions for further work ...........................................................................................156
7.2.1 Loading Conditions ...............................................................................................156
7.2.2 In-fill Materials ......................................................................................................157
7.2.3 Other Suggestions ..................................................................................................157
REFERENCES .....................................................................................................................158-175
APPENDIX A - SQUARE HOLLOW TUBULAR STUB COLUMN
DESIGN SAMPLE ....................................................................................176
APPENDIX B – FIXED-ENDED SQUARE HOLLOW TUBULAR
SLENDER COLUMN DESIGN SAMPLE ..............................................179
APPENDIX C – FE MODELLING OF THE CONCRETE CORE:
D-P PLASTICITY MODEL .....................................................................182
APPENDIX D - CONCRETE-FILLED SQUARE TUBULAR STUB
COLUMN DESIGN SAMPLE .................................................................186
APPENDIX E - FE MODELLING OF THE CONCRETE CORE: CDP MODEL .............189
APPENDIX D - FIXED-ENDED CONCRETE-FILLED SQUARE
TUBULAR SLENDER COLUMN DESIGN SAMPLE ...........................193
LIST OF PUBLICATIONS ................................................................................................198
TH-1259_09610405
xiii
LIST OF FIGURES
1.1 Hollow tubular stainless steel sections of (a) Square,
(b) Rectangular, (c) Circular and (d) Oval ....................................................................8
1.2 Examples of the use of stainless steel hollow tubular columns ....................................9
1.3 Few examples of composite stainless steel-concrete column sections .........................10
1.4 Examples of the use of lean duplex stainless steel material .........................................10
1.5 Examples of the use of concrete-filled stainless steel tubular columns ........................11
2.1 Examples of experimental test on stainless steel hollow tubular columns ...................35
2.2 Examples of experimental test on stainless steel concrete-filled
tubular columns .............................................................................................................35
2.3 Examples of experimental test on LDSS hollow tubular columns ...............................36
2.4 Tested specimens of specially shaped reinforced concrete
columns (Xu and Wu, 2009) .........................................................................................36
2.5 Schematic diagram of stainless steel and carbon material
stress-strain behavior (Courtesy: BSSA) ......................................................................37
2.6 Illustration of the stress-strain curve of the Ramberg-Osgood model with
test results (Ashraf et. al., 2006) for an austentic Grade 1.4301 tensile
coupon with σ0.2 = 296 Mpa and n = 5.8 .......................................................................37
2.7 Equivalent uniaxial stress-strain curve for confined and
un-confined concrete .....................................................................................................38
2.8 Identification of partial products (slabs, blooms and billets) and
finished products (tubular and hot rolled sections) .......................................................39
2.9 Examples of hollow tubular sections formed from different processes ........................39
3.1 Boundary conditions applied to a square LDSS hollow tubular stub
column FE models. .......................................................................................................59
TH-1259_09610405

LIST OF FIGURES
xiv
3.2 Typical mesh convergence study of FE models ...........................................................59
3.3 First eigen buckling modes for (a) SHC; (b) LHC, (c) THC, & (d) +-HC ...................60
3.4 Stress strain curve of the lean duplex stainless steel material
Grade EN 1.4162 using the experimental results provided by
Theofanous & Gardner (2009) ......................................................................................60
3.5 Typical FE deformed shape of 80 X 80 X 4-SC2 .........................................................61
3.6 Variation of P with δ for 80x80x4-SC2. .......................................................................61
3.7 Specimen cross-sections of (a) square and (b-d)NRSs .................................................62
3.8 Typical failure modes for hollow tubular stub columns with NRSs
and square section for (a-d) slender and (e-h) stocky sections
at axial deformation corresponding to 4xδu. .................................................................63
3.9 Variation of P/Agfy with δ for hollow tubular stub columns with
NRSs and representative square section. ......................................................................64
3.10 Effect of cross-sectional shape on the load capacity of hollow
tubular stub columns .....................................................................................................65
3.11 Variation of Pu with cross-sectional shapes ..................................................................65
3.12 Variation of perfentage Pu/Pu(sq) with cross-sectional shapes .......................................66
3.13 Effect of cross-sectional shape on the deformation capacity
of hollow tubular stub columns.....................................................................................66
3.14 Schematic diagam showing determination of Be ..........................................................67
3.15 Variation of Pu with t for LDSS hollow tubular stub columns .....................................68
4.1 Typical boundary conditions applied to fixed-ended slender
column FE models ........................................................................................................84
4.2 Typical lowest eigen modes for fixed-ended hollow tubular slender
columns with NRSs and representative square section showing
(a-d) global buckling modes and (e - h) local buckling modes.....................................84
4.3 Variation of Pu vs Le for SHC 80 x 80 x 4 ....................................................................85
4.4 Typical deformed shapes for hollow tubular slender column
with a square section .....................................................................................................85
TH-1259_09610405
LIST OF FIGURES
xv
4.5 Class 3 and 4 sections with LDSS tube thicknesses of 5.25mm
and 2.0 mm, respectively, as per EN1993-1-4 (2006) for
NRSs and representative square section .......................................................................86
4.6 Von-Mises stress (superimposed on deformed shape) at Pu for
Class 3 NRSs and representative square section (L = 300 mm) ...................................87
4.7 Von-Mises stress (superimposed on deformed shape) at Pu for
Class 4 NRSs and representative square section (L = 300 mm) ...................................87
4.8 Von-Mises stress (superimposed on deformed shape)
corresponding to deformation at 2xδu for Class 3 NRSs and
representative square section (L = 300 mm) .................................................................88
4.9 Von-Mises stress (superimposed on deformed shape)
corresponding to deformation at 2xδu for Class 4 NRSs and
representative square section (L = 300 mm) .................................................................88
4.10 Von-Mises stress (superimposed on deformed shape)
corresponding to deformation at 1.5xδu for Class 3 NRSs and
representative square section (L = 3000 mm) ..............................................................89
4.11 Typical variation of P with δ with varying lengths (Class 3 SHC) ..............................90
4.12 (a) Variation of Pu with and (b) Pu/ Pu(SHC) with for Class 3 sections ......................91
4.13 (a) Variation of Pu with and (b) Pu/ Pu(SHC) with for Class 4 sections .....................91
4.14 Variation of εu with for Class 3 sections.....................................................................92
4.15 Variation of δu/ δu,SHC with for Class 3 sections .........................................................92
4.16 Variation of εu with for Class 4 sections....................................................................93
4.17 Variation of δu/ δu,SHC with for Class 4 sections .........................................................93
4.18 Variation of Pnom with for Class 3 sections ...............................................................94
4.19 Variation of Pnom with for Class 4 sections ................................................................94
5.1 Typical Boundary conditions applied to CFDSST stub column FE models ................114
5.2 Concrete-filled steel tubular stub column specimens ...................................................114
5.3 Comparison of the experimental and FE failure modes for the
concrete-filled steel tubular stub columns ....................................................................115
TH-1259_09610405
LIST OF FIGURES
xvi
5.4 P versus δ plot for the concrete-filled tubular stub columns specimens .......................116
5.5 Numerical test specimens of CFDSST stub columns ...................................................117
5.6 (a-f) Typical failure modes (von-Mises stress superimposed over
deformed shape) at Pu and (g-l) 3 x δu the deformation at Pu for
CFDSST stub columns of NRSs and representative square section .............................117
5.7 Typical P- ε plot for CFDSST stub columns of (a&b) Square section,
(c) +-shape section and (d) NRSs and representative square section ...........................118
5.8 Typical P- ε plot for CFDSST stub columns with thickness of 10.0 mm .....................119
5.9 Effect of the steel tube on the load and deformation capacities
of CFDSST stub columns .............................................................................................120
5.10 Typical plot of Pu versus fck for CFDSST stub columns (t = 10.0 mm) .......................121
5.11 Efficiency of CFDSST stub columns for thicknesses of
7.5 mm and 10.0 mm ....................................................................................................121
5.12 (a) P versus t for CFDSST stub columns; (b) Typical plot of Pu
versus fck for CFDSST stub columns ............................................................................122
5.13 (a) Effect of shape on the δu versus fck for CFDSST stub columns;
(b) Effect of t on the δu versus fck for CFDSST stub columns ......................................123
5.14 Schematic diagams showing determination of Be for the LDSS
tube in CFDSST stub columns ......................................................................................124
5.15 Comparison of Pu versus fck for square section with (a) European
and (b) American specifications ...................................................................................125
5.16 Comparison of Pu versus fck for L-shape section with (a) European
and (b) American specifications ...................................................................................125
5.17 Comparison of Pu versus fck for T-shape section with (a) European
and (b) American specifications ...................................................................................126
5.18 Comparison of Pu versus fck for +-shape section with (a) European
and (b) American specifications ...................................................................................126
6.1 Typical boundary conditions applied to fixed-ended CFDSST
slender columns FE models ..........................................................................................141
TH-1259_09610405

LIST OF FIGURES
xvii
6.2 Plot of Pu versus L/D ratio for concrete-filled thin-walled
stainless steel slender columns......................................................................................141
6.3 Numerical test specimens of the fixed-ended CFDSST slender columns ....................142
6.4 (a-d)Schematic failure modes of fixed-ended CFDSST slender columns;
(e-h) Typical midspan failure shapes of hollow tubular columns
and (i-l) CFDSST slender columns ...............................................................................143
6.5 Typical P versus δ curves for the fixed-ended hollow tubular and
CFDSST slender columns .............................................................................................144
6.6 Typical P versus um curves for the fixed-ended hollow tubular and
CFDSST slender columns .............................................................................................144
6.7 Effect of cross-sectional shape on the Pu versus curves of
fixed-ended CFDSST slender column ..........................................................................145
6.8 Efficiency of the fixed-ended concrete-filled CFDSST slender
columns of NRSs ..........................................................................................................145
6.9 Effect of cross-sectional shape on the εu versus curves of
fixed-ended CFDSST slender columns .........................................................................146
6.10 Comparison of Pu with L/D for fixed-ended CFDSST slender
columns for square section............................................................................................146
6.11 Comparison of Pu with L/D for fixed-ended CFDSST slender
columns for L-shape section .........................................................................................147
6.12 Comparison of Pu with L/D for fixed-ended CFDSST slender columns
for T-shape section ........................................................................................................147
6.13 Comparison of Pu with L/D for fixed-ended CFDSST slender columns
for +-shape section ........................................................................................................148
TH-1259_09610405

xviii
LIST OF TABLES
2.1 Compound Ramberg–Osgood parameters obtained from coupon test results ..............34
3.1 Compressive flat material properties ............................................................................58
3.2 Measured dimensions of stub columns .........................................................................58
3.3 Comparison of FE strengths with codal design strengths for Class 3 sections .............58
4.1 Comparison of FE strengths with codal design strengths for Class 3 sections .............83
4.2 Comparison of FE strengths with codal design strengths for Class 4 sections .............83
5.1 Measured dimensions of concrete-filled stub columns .................................................111
5.2 Details of LDSS hollow tubular and CFDSST stub columns of
NRSs and the representative square sections ................................................................111
5.3 Comparison of FE strengths with codal design strengths for
7.5 mm thickness of the steel tube ................................................................................112
5.4 Comparison of FE strengths with codal design strengths for 9.0 mm
thickness of the steel tube .............................................................................................112
5.5 Comparison of FE strengths with codal design strengths for
10.0 mm thickness of the steel tube ..............................................................................113
6.1 Concrete-filled steel stub and slender column dimensions and material properties .....139
6.2 Details of the fixed-ended CFDSST slender columns ..................................................139
6.3 Comparison of FE strengths with codal design strengths for fixed-ended
CFDSST columns .........................................................................................................140
TH-1259_09610405

xix
NOTATIONS
A Cross-sectional area
Ac Cross-sectional area of the in-filled concrete cor
Ae Effective cross-sectional area
As Cross-sectional area of the LDSS tube
Ag Gross cross-sectional area
B Overall width of the plate
Be Effective width of the plate
c Width of the flat plate
CFDSST Concrete-filled Lean Duplex Slender Stainless Steel Tubular
CFSST Concrete-filled Stainless Steel Tubular
D Overall depth of the plate
E0 Young’s modulus (or initial tangent modulus)
E0.2 Tangent modulus (stiffness) at 0.2% proof stress
Ecc Initial modulus of elasticity of the confined concrete
FE Finite Element
fc Unconfined cylindrical compressive strength of concrete = 0.8 fck
fcc Confined cylindrical compressive strength of concrete
fck Characteristic cubic compressive strength of concrete
Pu Ultimate load
TH-1259_09610405
NOTATIONS
xx
Pu,FE Ultimate load obtained from finite element analysis
PASCE 8-02 Design strength predicted by ASCE 8-02 (2002)
PEN 1994-1-1 Design strength predicted by EN 1994-1-1 (2004)
PEN 1993-1-4 Design strength predicted by EN 1993-1-4 (2006)
PANSI/AISC 360-05 Design strength predicted by ANSI/AISC 360-05 (2005)
i Second moment of inertia
ic Second moment of inertia of concrete
is Second moment of inertia of LDSS
k Buckling coefficient
K Ratio of flow stress in triaxial tension to that in compression
L Length
LDSS Lean Duplex Stainless Steel
Le Effective length
LHC L-shaped hollow tubular column
n Ramberg-Osgood exponent between zero strain and εt0.2
NRSs Non-rectangular sections such as L-, T-, and +-shape sections
'
0.1,2.0n Compound Ramberg-Osgood exponent based on σ0.2 and σ1.0
P Load
Pnom Normalised load = Pu/Afy
Pu Ultimate load
r Radius of gyration
ri Internal corner radius
SHC Square hollow tubular column
t Thickness of the LDSS tube
TH-1259_09610405
NOTATIONS
xxi
THC T-shaped hollow tubular column
+HC +-shaped hollow tubular column
α Imperfection factor
β Angle of friction
β0 Reliability Index
δ Axial displacement
δu Displacement at ultimate load
εc Axial strain
ε0 Elastic strain at the material 0.2% proof stress = σ0.2/E0
εc Unconfined concrete strain
εcc Confined concrete strain
pl
nom True plastic strain
εnom Engineering strain
εu Strain at Pu = δu /L
εt0.2 Total strain at 0.2% proof stress
λ Slenderness ratio
Non-dimensional member slenderness
λ0 Limiting member slenderness
ν Poisson’s ratio
ρ Reduction factor for local buckling
σ0.2 0.2% proof stress
σ1.0 1.0% proof stress
σtrue True stress
TH-1259_09610405

NOTATIONS
xxii
σu Ultimate stress
σy Yield stress
χ Buckling reduction factor
ω0 Imperfection amplitude
µ Coefficient of friction
µs Poisson's ratio of the LDSS
µc Poisson's ratio of concrete
TH-1259_09610405
1
CHAPTER 1
INTRODUCTION
1.1 BACKGROUND
Since the commercial birth of stainless steel in the early twentieth century, it is seen as
the answer to the technical objective of achieving a non-corrosive steel, which not only
offers better practical performances but also good aesthetic characteristics of a durable
metallic surface compared to the parent carbon steel. Although it cannot replace carbon
steel and other widely used construction materials, it has started playing an important role
where durability, safety or aesthetic requirements cannot be cost effectively met by other
materials.
The industrialization of stainless steel is generally attributed to an English metallurgist,
Harry Brearley, in 1913, who referred to the material as ‘rustless steel’ and it was a
cutlery manager, Ernest Stuart, who popularised the term ‘stainless’. Stainless steel is an
alloy of iron, chromium, nickel and to varying degrees of molybdenum, which does not
readily corrode, rust or stain with water as ordinary steel does and is also called
corrosion-resistant steel when the alloy type and grade are not detailed. The characteristic
corrosion resistance of stainless steels is dependent on the chromium content and is
enhanced by additions of molybdenum and nitrogen. Stainless steel contains a minimum
of 10.5% to 11 % chromium content by mass. Chromium is the most important alloying
element in stainless steels because it provides their basic corrosion resistance by creating
TH-1259_09610405
CHAPTER 1 - INTRODUCTION
2
a very thin, invisible surface film in oxidizing environments. This film is an oxide that
protects the steel from attack in an aggressive environment. Nickel is added, primarily, to
ensure the correct microstructure and mechanical properties of the steel, very good
corrosion resistance, constant magnetic permeability, very slight thermal expansion, and
extraordinary good properties at high temperatures, excellent weldability, and a very
good creep resistance (Buijs, 2008). Molybdenum substantially increases the resistance to
both general and localized corrosion. It increases the mechanical strength and hardness
and promotes a ferritic structure. Thus, the higher corrosion resistance of the material
makes it one of the most durable families of construction materials, gaining clear
advantages in terms of economy, reduction in environmental impact and lower
maintenance costs.
Owing to the benefits of stainless steel, such as aesthetic appearance, high corrosion
resistance, ease of maintenance, smooth and uniform surface, high fire resistance, high
ductility and impact resistance, reuse and recycling capability, as well as ease of
construction of stainless steel structural members, there has been an accelerating interest
in the use of stainless steel in construction industry as structural members (Mann, 1993;
Gardner, 2005). A lot of construction projects around the world are now using stainless
steel as main structural material. Designers, engineers and architects alike have used
stainless steels in most large modern structures, such as stadiums, skyscrapers, residential
buildings, bridges and airports, with further use certain to feature a dominant material in
the construction industry. Stainless steels are available in the form of plate, sheet, tube,
bar, cold-formed structural sections and hot-rolled structural sections, with the most
commonly used products for structural applications being cold-formed (square,
rectangular and circular) hollow tubular sections, and nowadays elliptical shaped hollow
tubular sections are also available (see Figure 1.1). Examples of the use of stainless steel
material as structural members in the form of hollow tubular columns in construction
fields are shown in Figure 1.2.
TH-1259_09610405
CHAPTER 1 - INTRODUCTION
3
However, the use of stainless steel still remains limited in the construction industry due to
its high material cost compared to other materials such as concrete. Hence, a composite
(stainless steel-concrete) construction remains the ultimate choice for structural
engineers, where there is an advantage in utilizing the beneficial material properties of
both elements effectively (i.e. high compressive strength of the concrete and good tensile
strength of the steel). It was in the late nineteenth century where the composite
construction as we know it today was first used in both buildings and bridges in the
United States. The use of composite steel-concrete beam, which is the earliest form of
composite construction, having many advantages such as economic steel weight, reduced
displacements, high ultimate strength and seismic proof (Porco et al., 1994), marked the
beginning of the development of fully composite systems in steel and concrete.
Composite construction can be used in a range of fields, from civil and industrial
construction through to the mining industry. In structural engineering, a composite
construction has been mainly applied to bridges and multistorey buildings, with the more
traditional forms of composite beams and composite columns. Concrete-encased steel
sections (see Figure 1.3a) were used as columns in early tall buildings constructions in
order to overcome the problem of fire and instability of the steel section (Ellobody and
Young, 2011) along with the advantages of the steel section and concrete acting
compositely to resist axial force and bending moment. Also, the use of concrete-filled
tubular sections (see Figure 1.3b), where concrete is filled inside the stainless steel
hollow tubular sections, as structural columns are recently getting popular due to its high
strength, high ductility, and large absorption capacity (e.g. Hu et al., 2003) along with
many inherent aforementioned additional beneficial factors involved in the use of
stainless steels. The following sub-sections discusses briefly the beneficial factor
involved in the use of lean duplex stainless steel (LDSS) material as a structural member
and concrete-filled tubular columns in construction industries.
TH-1259_09610405
CHAPTER 1 - INTRODUCTION
4
1.1.1 Lean duplex stainless steel
Over the last 20 years, significant developments have occurred in materials processing,
thereby, the number of stainless steel grades have increased rapidly. Based on the
composition of alloys and properties, stainless steel are commonly classified as ferritic,
martensitic, austenitic and duplex (ferritic-austenitic) stainless steels to suit the structural
requirements and environmental conditions. There are several factors, such as cost,
strength-to-weight ratios, or location, which had to be taken into account while selecting
the stainless steel grades. Cost is also an important factor as the use of stainless steel
raises the initial price of the work between 5 % and 15 % (Nurberger, 1996). Generally,
austenitic grades which contain ~ 8% - 11% nickel feature most prominently within the
constructional industry. However, with increasing nickel prices, which also represents a
significant portion of the cost to austenitic stainless steels, there is an escalation in the
demand for LDSS, a subset of duplexes steels, with low nickel content ~ 1.5%, such as
grade EN 1.4162 (Gardner, 2005b; Baddoo, 2008; EN 10088-4, 2009). This grade (EN
1.4162) of LDSS is generally less expensive and possesses higher strength than the
commonly used austenitics (Theofanous and Gardner, 2009), thus enabling a reduction in
section sizes leading to higher strength to weight ratios, and still retaining good corrosion
resistance and high temperature properties (Gardner et al., 2010), weldability (Nilsson et
al., 2008) and fracture toughness (Sieurin et al., 2007). Examples of the recent use of
LDSS material as structural member in the form of hollow tubular columns in
construction fields are shown in Figure 1.4. More details about the LDSS chemical
composition, mechanical and physical properties and fabrication methods are available in
Outokumpu (2013).
1.1.2 Concrete-filled tubular column
With the advent of stainless steel, recently, there have been an increasing number of
significant uses of stainless steel in the construction industries because of many
favourable factors associated in the use of stainless steels (as discussed in previous
TH-1259_09610405
CHAPTER 1 - INTRODUCTION
5
sections). However, high material cost limits their use in conventional constructions thus
giving rise to a new form of composite construction, such as, concrete-filled tubular
columns. These type of construction techniques combines the advantages of both steel
and concrete, and thus provide not only an increase in the load-carrying capacity but also
rapid construction (Uy et al., 2006; Zhao et al., 2010). Also, concrete-filled tubular
columns in particular does not need any formwork or reinforcement and the amount of
stainless steel used can be greatly reduced by concrete filling as reported by several
researchers (e.g. Young and Ellobody, 2006; Lam and Gardner, 2008; Dabaon et al.,
2009; Uy et al., 2011). Thus, the use of concrete-filled tubular columns in a building
project can significantly reduce the overall cost of a structure (Johansson, 2002). Some of
the largest and highest engineering adopted stainless steel concrete-filled tubular columns
on tall buildings are given in Figure 1.5.
1.2 OBJECTIVES OF THE INVESTIGATION
The following are the objectives of the investigation:
1) Considering the beneficial factors involved in the use of LDSS material, this thesis
adopts LDSS material, to investigate the structural behaviour of LDSS hollow tubular
stub and slender columns under pure axial compressive loading in order to give a
slight push to further advance in the field of research and to encourage in the use of
such material.
2) To investigate the behaviour of LDSS concrete-filled tubular stub and slender
columns under pure axial compressive loading.
1.3 OUTLINE OF THE REPORT
This Chapter provides a brief introduction of stainless steel material and its use as an
important structural member in the construction industry as well as the driving issues
TH-1259_09610405
CHAPTER 1 - INTRODUCTION
6
associated with the use of new grade of stainless steel such as LDSS material. The
benefits in the use of concrete-filled tubular columns are also highlited.
Chapter 2 contains a detailed literature review of relevant work carried out by various
researchers on stainless steel hollow and concrete-filled tubular columns. As most of the
studies were related to conventional shapes such as square, rectangular and circular, the
need to extend the studies relating to special shapes such as L-, T-, and +-shape sections
are discussed. Limited studies regarding the use of LDSS material as hollow and
concrete-filled tubular columns are brought out in this chapter. Based on the literature
review it has been concluded that there is still a need for more studies relating to LDSS
hollow as well as concrete-filled tubular columns.
In Chapter 3, numerical analyses on LDSS hollow tubular stub columns are presented.
Finite element (FE) modeling was carried out on hollow tubular stub columns with L-, T,
and +-shape sections (Non-Rectangular Sections or NRSs) and representative square
section to investigate the behavior of such sections under pure axial compression. The
results are shown in the form of load and deformation capacities as well as the failure
modes. The applicability of current existing codes, such as European and American
specifications, in the design of LDSS hollow tubular stub columns are also discussed.
Chapter 4 presents an extended study of the LDSS hollow tubular stub columns to fixed-
ended LDSS hollow tubular slender columns under pure axial compression. The effect of
cross-sectional shapes and column length on the load and deformation capacities as well
as the failure modes was presented. Discussion on the applicability of current existing
codes, such as European and American specifications, in the design of fixed-ended LDSS
hollow tubular slender columns was presented.
FE analyses on LDSS concrete-filled tubular stub columns with NRSs and representative
square section under pure axial compression are presented in Chapter 5. Parametric
studies were conducted to investigate the effect of cross-section, LDSS tube thickness
and concrete strength on the load and deformation capacities. Comparison of FE results
with the codal specifications, such as European and American specifications, was done to
TH-1259_09610405

CHAPTER 1 - INTRODUCTION
7
assess the applicability of the codes in the design of LDSS concrete-filled tubular stub
columns.
Chapter 6 presents an extended study of the LDSS concrete-filled tubular stub columns
to fixed-ended LDSS concrete-filled tubular slender columns. The buckling behavior of
concrete-filled LDSS tubular slender columns at different column lengths along with the
effects of cross-sectional shape was investigated. FE results are then compared with the
codal specifications, such as European and American specifications, to assess the
applicability of the codes in the design of fixed-ended concrete-filled LDSS tubular
slender columns.
Summary and conclusions of the important findings from the current work are provided
in Chapter 7.
Few suggestions for further work are highlighted in Chapter 8.
Appendices are added in the end of this thesis. Appendices A, B, D and F give the
detailed design sample calculation of a square LDSS hollow and concrete-filled tubular
stub as well as slender columns using the European and American specifications. The
detailed modeling of the concrete core in concrete-filled tubular stub columns through
Drucker-Prager yield criterion plasticity model have been explained in Appendix C.
Appendix E presents the detailed modeling of the concrete core in concrete-filled tubular
slender columns through Concrete Damage Plasticity model.
TH-1259_09610405

CHAPTER 1 - INTRODUCTION
8
(a) Square
(b) Rectangular
(c) Circular (d) Oval
Figure 1.1: Hollow tubular stainless steel sections of (a) Square, (b) Rectangular, (c)
Circular and (d) Oval (Courtesy: SMC).
TH-1259_09610405

CHAPTER 1 - INTRODUCTION
9
(a) Transit terminal in Wisconsin
(Courtesy: SSEF)
(b) Stratford DLR station in London
(Courtesy: SSEF)
(c) Inland Steel Building in Chicago
(Courtesy: Galinsky)
(d) Gatwick Airport in London
(Courtesy: Geograph)
Figure 1.2: Examples of the use of stainless steel hollow tubular columns.
Hollow
Tubular
Columns
Hollow
Tubular
Columns
Hollow
Tubular
Columns
Hollow
Tubular
Columns
TH-1259_09610405

CHAPTER 1 - INTRODUCTION
10
(a) Schematic concrete encased steel sections
(b) Schematic concrete-filled tubular stainless steel sections
Figure 1.3: Examples of composite stainless steel-concrete column sections.
(a) Celtic Gateway footbridge in UK
(Courtesy: Wikimedia)
(b) Siena footbridge in Italy
(Courtesy: Theofanous and Gardner, 2009)
Figure 1.4: Examples of the use of lean duplex stainless steel material.
Encased steel tube
Concrete
Stirrups
Longitudinal
reinforcement
Steel tube
Confined
concrete
TH-1259_09610405

CHAPTER 1 - INTRODUCTION
11
(a) SEG Plaza in China
(Courtesy: Wikipedia)
(b) Tecno-Station in Japan
(Courtesy: NSSMC)
Figure 1.5: Examples of the use of concrete-filled stainless steel tubular columns.
TH-1259_09610405

12
CHAPTER 2
LITERATURE REVIEW
2.1 INTRODUCTION
In the past, the use of stainless steel has only been limited to minor applications in
structural engineering. As the construction industry continues to evolve and with more in-
depth research into their structural behavior, stainless steels are used in the construction
industry as main structural members due to several advantageous factors involved in the
use of such materials as discussed in Chapter 1. Yet the high price of stainless steel
greatly limits the application to major construction projects. Hence, a new and innovative
approach is to adopt a stainless steel-concrete composite construction, which not only
offers several advantages to the structural behavior over stainless steel structural
members as discussed in Chapter 1, but also delivers the economies of a concrete
construction with the speed of construction and the constructability of stainless steel
structural members, resulting in significant economies in the overall structure of a
building project (Johansson, 2002).
This chapter presents a critical review of previous work on structural stainless steel
hollow and concrete-filled tubular columns under pure axial compressive loading that is
pertinent to this report. Development of the stainless steel stress-strain curve through
various material models such as Ramberg-Osgood model (Ramberg and Osgood, 1943),
Rasmussen model (Rasmussen, 2003), and Gardner and Ashraf model (Gardner and
Ashraf, 2006) as well as the development of the stress-strain relationship for the confined
TH-1259_09610405
CHAPTER 2 – LITERATURE REVIEW
13
concrete core in concrete-filled tubular columns proposed by Saenez (1964) are
presented. A general summary of the types of processes that are used for production of
hollow tubular sections are also mentioned in this chapter. On the basis of the literature
review, gaps in the current understanding of structural behavior, particularly to LDSS
hollow and concrete-filled tubular columns, have been identified.
2.2 STRUCTURAL HOLLOW TUBULAR COLUMNS
Exploiting its corrosion resistance and aesthetic appeal, stainless steel is often employed
for exposed structural elements (e.g. Baddoo et al., 1997). Stainless steel tubular
construction, such as the hollow tubular columns, are also becoming increasingly popular
for structural applications as they shows excellent properties with regard to loading in
compression, torsion and bending in all directions combined with an attractive
characteristics as detailed in Chapter 1. Until recently, the primary tubular cross-section
shapes available to structural engineers and architects have been square, rectangular and
circular (e.g. Theofanous et al., 2009a&b). Hollow tubular columns with square and
circular sections are often most effective as compression members (e.g. Virdi, 1981;
Young and Hartono, 2002; Lui and Young, 2003; Gardner and Nethercot, 2004c; Gardner
and Nethercot, 2004a&b; Zhou and Young, 2005; Ashraf et al., 2008; Dabaon et al.,
2009), rectangular hollow tubular columns, with greater stiffness about one principal axis
than the other, are generally more suitable in bending (e.g. Virdi, 1981; Talja and Salmi,
1995; Gardner and Nethercot, 2004c; Ellobody and Young, 2005; Zhou and Young,
2005; Dabaon et al., 2009). Nowadays, elliptical sections are also getting popular in
many structural applications due to its aesthetic external profile as well as offering
inherent torsional stiffness and suitability for resisting flexure similar to that of a
rectangular section (e.g. Kempner and Chen, 1974; Chen and Kempner, 1976;
Grigorenko and Rozhok, 2002; Gardner, 2005a; Theofanous et al., 2009a&b; Nowzartash
and Mohareb, 2009; Nowzartash and Mohareb, 2011).
TH-1259_09610405
CHAPTER 2 – LITERATURE REVIEW
14
Several researchers have studied on stainless steel (mainly austenitic) hollow tubular stub
columns with commonly available cross-sectional shapes such as square (Lui and Young,
2003; Gardner and Nethercot, 2004c; Dabaon et al., 2009), rectangular (Talja and Salmi,
1995; Gardner and Nethercot, 2004c; Zhou and Young, 2005; Dabaon et al., 2009),
circular (Gardner and Nethercot, 2004a&b; Ashraf et al., 2008), and elliptical (Gardner
and Ministro, 2004; Gardner, 2005a; Gardner and Chan, 2007; Chan and Gardner, 2008;
Law and Gardner, 2013). Also, several literatures were reported on the flexural buckling
response of stainless steel hollow tubular slender columns with square (Rasmussen, 2000;
Gardner, 2002; Lui and Young, 2003; Ellobody, 2007; Dabaon et al., 2009), rectangular
(Gardner, 2002; Ellobody, 2007; Dabaon et al., 2009), circular (Rasmussen, 2000; Young
and Hartono, 2002), and elliptical (Zhao et al., 2007; Theofanous et al., 2009) sections.
The investigations were focused to assess the effect of cross-sectional aspect ratio,
stainless steel tube thicknesses and member slenderness on the strength and structural
behavior of such columns. Some examples of experimental investigation on stainless
steel hollow tubular columns are shown in Figure 2.1.
2.3 STRUCTURAL CONCRETE-FILLED TUBULAR COLUMNS
In recent years the use of concrete-filled tubular columns has gained its popularity
throughout the world, particularly in Australia and the Far East due to the structural (i.e.
high strength and high energy dissipation ability) and economical advantages offered by
concrete-filled tubular columns over hollow tubular construction (Lam and Gardner,
2008). In addition to the enhancement in structural properties, a considerable amount of
construction time can be reduced as formwork can be avoided. Because of its superior
structural behavior, concrete-filled tubes have been generally used as columns or piers in
buildings or infrastructures. It can be said that a concrete-filled tubular column delivers
the economies of a reinforced-concrete column, resulting in significant economies in the
overall structure of a building project (Hassanein, 2010). Since the mid-twentieth century,
various research on concrete-filled tubular steel columns have been reported (e.g.
Furlong, 1967; Knowles and Park, 1969; Furlong, 1974; Ge and Usami, 1992; Ge and
TH-1259_09610405
CHAPTER 2 – LITERATURE REVIEW
15
Usami, 1994; Boyd et al., 1995; Bradford, 1996; Hajjar and Gourley, 1996; Shams and
Saadeghvaziri, 1997; Morino 1998; Schneider, 1998; Uy, 1998; Zhang and Shahrooz,
1999; Liang and Uy, 2000; Bradford et al., 2002).
There are several investigations related to concrete-filled stainless steel tubular (CFSST)
stub columns under pure axial compression with sections, such as, square (e.g. Han and
Yao, 2004; Ellobody and Young, 2006a&b; Uy et al., 2011; Yang and Han, 2012),
rectangular (e.g. Young and Ellobody, 2006a&b; Uy et al., 2011), circular (e.g.
Giakoumelis and Lam, 2004; Han and Yao, 2004; Uy et al., 2011; Yang and Han, 2012),
and elliptical (e.g. Zhao et al., 2007; Yang et al., 2008; Zhao and Packer, 2009;
Jamaluddin et al., 2013) sections, reporting the effect of cross-section capacities, concrete
compressive strength and stainless steel tube thickness on the structural behavior. Also,
several studies has been performed on CFSST slender columns pertaining to sections
such as square (Vrcelj and Uy, 2002; Uy et al., 2011), rectangular (Gho and Lui, 2004;
Uy et al., 2011), circular (Kato, 1996; Uy et al., 2011; An et al., 2012), and elliptical
(Jamaluddin et al., 2013), to quantify the influence of member geometry and constituent
material properties on the structural behavior. Some examples of recent experimental
investigation on stainless steel concrete-filled tubular columns are shown in Figure 2.2.
2.4 STRUCTURAL LDSS MATERIAL
Although good amount of literatures are available on the studies relating to stainless steel
tubular columns, there are still limited studies done on LDSS tubular columns. Due to the
benefits in the use of LDSS material as structural members (and its early application in
construction fields as discussed in Section 1.1.1), its use has seen significant growth and
development over the past two decades. The following sections presents the study
reported on LDSS hollow tubular and concrete-filled tubular columns, followed by a
report on the currently available design standards for stainless steels, and the assessment
by various researchers on their applicability for the design of structural LDSS.
TH-1259_09610405
CHAPTER 2 – LITERATURE REVIEW
16
2.4.1 Previous research on LDSS
Till date, not much literature is available on studies relating to LDSS hollow and
concrete-filled tubular columns. Theofanous and Gardner (2009) performed experimental
studies on LDSS square and rectangular hollow tubular columns under axial compression
and supplemented by FE studies, and parametric studies were performed to generate
results over a wider range of cross-sectional and member slenderness. The results were
presented in terms of ultimate loads and comparison with the currently available design
standards for stainless steel was achieved. A comparison of structural performance of
LDSS and that of the other more commonly used austenitic grades was made. It was
found that; overall, LDSS is shown to offer superior structural performance compared to
the austenitic grades and at a lower cost. A test program on cold-formed LDSS square
and rectangular hollow tubular columns at different lengths compressed between pinned
ends was conducted by Huang and Young (2013). The results are resented in terms of
ultimate loads and the failure modes, and also compared with the available design
standards. Umbarkar et al., 2013 presented a FE study to see the effect of various
geometrical parameters of circular single perforation on the critical/ultimate buckling
load of a LDSS circular stub column loaded axially. Also, recent investigation on
structural LDSS sections includes the flexural behavior of LDSS girders with slender
stiffened webs (Hassanein and Silvertre, 2013); shear failure mechanisms characteristics
of LDSS plate girders with slender webs (Hassanein, 2011; Saliba and Gardner, 2013b);
and cross-section stability of LDSS welded I-sections (Saliba and Gardner, 2013a),
suggests an increasing interest in the use of LDSS as a structural material and has a great
potential for replacing other stainless steel grades as it betters in terms of structural
performance along with lower cost, making it an attractive choice in the future for
structural applications.
Hassanein (2010) was the first to report studies regarding FE modeling for LDSS
concrete-filled tubular stub columns under uniform axial compression loading. The study
was predominantly concerned with two parameters: cross-sectional shape and concrete
compressive strength. Based on the study, new design strength was proposed to represent
TH-1259_09610405
CHAPTER 2 – LITERATURE REVIEW
17
the behaviour of LDSS concrete-filled tubular stub columns. Hassanein et al. (2013)
presented the study on the fundamental behavior of circular LDSS concrete-filled tubular
stub column under axial compression. Parametric studies were undertaken to investigate
the effects of concrete compressive strength and diameter-to-steel tube thickness (D/t)
ratio on the behavior of LDSS concrete-filled tubular stub columns. The results showed
that the ultimate axial strength of the column increases with increasing concrete
compressive strength but decreases with an increase in the D/t ratio.
2.4.2 Design guidance on structural stainless steel
Design of stainless steel structures is supported by various design standards, such as,
American, European, Japanese, Canadian, Australian and New Zealand specifications.
This section reviews currently available design standards for stainless steel structures,
with particular emphasis on the American and European specifications as the other design
standards are based on these two design standards.
Hammer and Peterson (1955) performed the first research program on structural stainless
steel. The first specific design rules for structural stainless steel was produced in America
by the AISI (1968) based of the research program carried out by Johnston and Winter
(1966). Following an extensive research project at Cornell University, in 1974 the
specification was revised and published as the AISI (1974). In 1990, the first ASCE
standard ANSI/ASCE-8-90 was introduced to provide the Load and Resistance Factor
Design (LRFD) method and the Allowable 132 Stress Design (ASD) method criteria for
the design of structural stainless steel. This ASCE standard has been revised in 2002 as
SEI/ASCE 8-02 (2002) based on a larger amount of available test data. In 2006, the
specification ANSI/AISC 360-05 (2005) provided an integrated treatment of ASD and
LRFD, and thus combines and replaces earlier specifications that treated the two design
methods separately.
In 1988, a joint industry project was undertaken by The UK Steel Construction Institute
to develop the Euro Inox ‘Design Manual for Structural Stainless Steel’ for European
TH-1259_09610405
CHAPTER 2 – LITERATURE REVIEW
18
stainless steel structures; but not published until 1994 (Euro Inox, 1994). In 1996, the
European Standards organization (CEN) issued the ‘pre-standard’ Eurocode ENV 1993-
1-4 (1996): Design of steel structures, and contains supplementary rules for stainless
steels. This standard (ENV 1993-1-4, 1996) is closely aligned with the guidance in the
Euro Inox (1994), with some changes arising from the need to align to the provisions for
carbon steel in ENV 1993-1-1 (1996) as much as possible. The standard ENV 1993-1-4
(1996) has now been published as a full European standard EN 1993-1-4 (2006). Also,
EN 1993-1-1 (2004) which applies to a design of composite structures and members for
building and civil engineering works, using the limit state design philosophy, was
approved by CEN in 2004.
In 1995, the Japanese stainless steel structural design standard was issued (SSBJA, 1995).
Based largely of the Canadian design standard for carbon steel, the South African
structural stainless steel code was published in 1997 (SABS, 1997). Most recently, in
2001, the Australian and New Zealand design code for cold-formed stainless steel
structures (Aust/AZS, 2001) was published. Development of the code was described by
Rasmussen (2000b).
Currently, there is only one grade of lean duplex included (1.4362) in EN 1993-1-4
(2006), and the amendment of EN 1993-1-4 (2006) is underway to include different
grades of lean duplexes to provide engineers with a useful sub-set of stainless steels to
specify in structural applications (Gardner, 2013).
Based on the experimental investigation conducted for LDSS hollow tubular columns
(Theofanous and Gardner, 2009; Huang and Young, 2012), the current buckling curve for
stainless steel hollow sections given by European specification (EN 1993-1-4, 2006) is
deemed suitable. Also, Huang and Young (2012) suggested that the currently available
American specification (ASCE 8-02, 2002) is capable of predicting the column test
strengths of LDSS material. Hassanein (2010) performed numerical studies on concrete-
filled LDSS tubular stub columns; it was found that the design rules specified in the
American specification (ASCE 8-02, 2002) are highly conservative for square and
TH-1259_09610405

CHAPTER 2 – LITERATURE REVIEW
19
rectangular sections while they are conservative in the case of European specification
(EN 1994-1-1, 2004).
2.5 STRUCTURAL TUBULAR COLUMNS WITH NRSs
In engineering structures, special-shaped reinforced concrete columns with L-, T-, and +-
shape sections (Non-Rectangular Sections or NRSs) (see Figure 2.4) are extensively used
because of their convenient construction at beam-column joints, larger moment of inertia
of cross-section that leads to much higher capacity for resisting lateral load, and ability to
provide a flushed wall face, resulting in an enlarged and more regular usable indoor floor
space area (Xu and Wu, 2009). So, reinforced concrete columns with NRSs were used in
residential high-rise buildings and are welcomed by architects.
Some of the studies reported on the behavior of reinforced concrete columns with NRSs,
such as, L- and T-shape (e.g. Joaquin, 1979; Cheng and Thomas, 1989; Mallikarjuna and
Mahadevappa, 1992; Dundar and Sahin, 1993; Yau et al., 1993; Zhang and Ye, 2003;
Gao et al., 2005; Wang et al., 2007; Xu and Wu, 2009) and +-shape (e.g. Xu and Wu,
2009), suggests a research interest and importance in the use of such specially shaped
columns and the need for more study to understand their structural behaviours.
Extensive investigations have also been carried out to study the mechanical performance
of concrete-filled steel tubular columns with NRSs, such as L-shape (e.g. Ohashi, 1992;
Lin et al., 2009; Zuo et al., 2012; Zhang and Yang, 2012) and T-shape section (e.g. Du et
al., 2008; Wang et al., 2009; Yang et al., 2010) in order to assess the effect of steel tube
thicknesses, concrete strengths and stiffeners on the load and deformations capacities as
well as the failure modes of such columns.
TH-1259_09610405
CHAPTER 2 – LITERATURE REVIEW
20
2.6 MATERIAL MODELLING
Accurate representation and good understanding on the basic material behaviour, such as,
the stainless steel and the concrete core in concrete-filled tubular columns, are
fundamental to any research project as it contributes to the prediction of the structural
behavior of the members during loading. The following sub-sections explain briefly the
various material models available in describing the material behavior of stainless steel as
well as for the confined concrete core through a widely adopted three stage model
proposed by Saenz (1964).
2.6.1 Stainless steel
The stress-strain behavior of stainless steel differs from that of carbon steel in a number
of respects. The most important difference is in the shape of the stress-strain curve, with
carbon steel exhibiting a linear elastic behavior up to the yield stress (σy) and a plateau
before strain hardening, unlike stainless steel which has a more rounded response with no
well-defined yield stress and the material exhibiting significant strain hardening (Bearley,
1989) (see Figure 2.5). As the transition between elastic and plastic behavior is not well
defined, convention defines the yield point as the 0.2 % proof stress (σ0.2) obtained at the
point of the 0.2% plastic strain and the limit of proportionality of the stainless steel is
generally defined as the stress at 0.01 % plastic strain (σ0.01). For improved efficiency,
several types of models describing existing functions that have been applied to the
modelling of the stainless steel non-linear behavior are discussed on their suitability for
describing accurate material stress-strain response for all the stainless steel families.
2.6.1.1 Ramberg-Osgood model
The Ramberg-Osgood model (1943) (defined in Equation 2.1) is a popular material
model which provides a smooth stress-strain curve for all values of strain for nonlinear
TH-1259_09610405
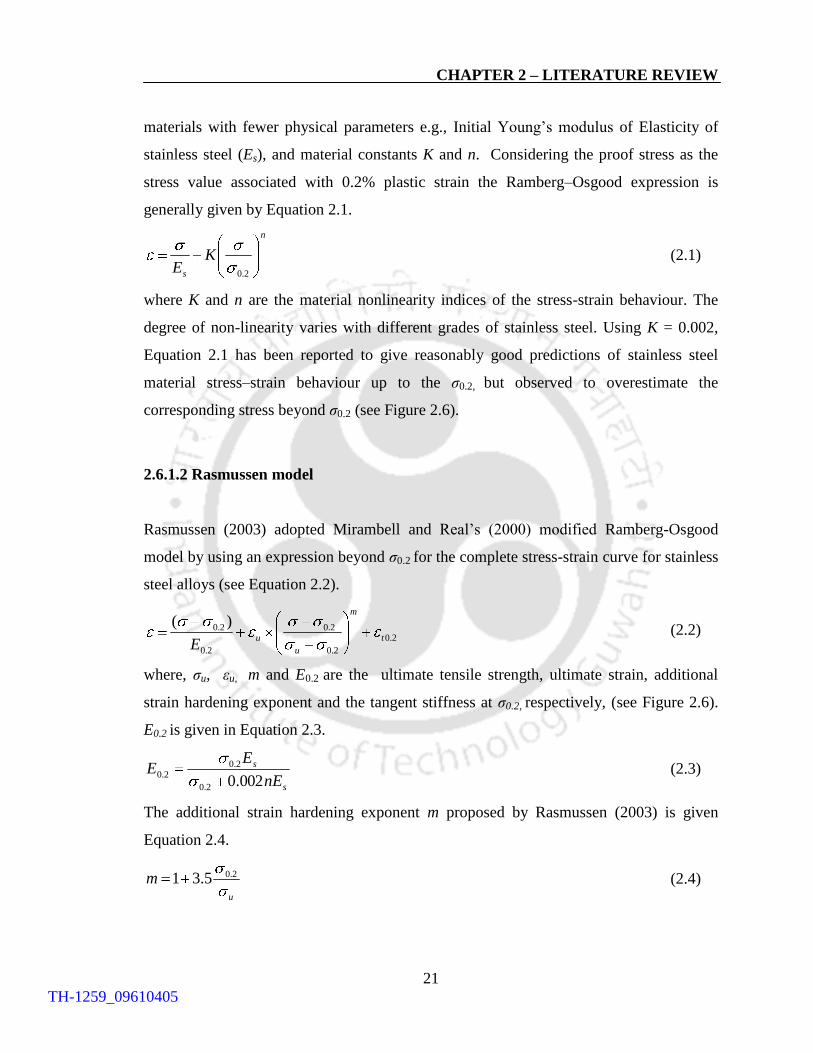
CHAPTER 2 – LITERATURE REVIEW
21
materials with fewer physical parameters e.g., Initial Young’s modulus of Elasticity of
stainless steel (Es), and material constants K and n. Considering the proof stress as the
stress value associated with 0.2% plastic strain the Ramberg–Osgood expression is
generally given by Equation 2.1.
n
s
KE 2.0
(2.1)
where K and n are the material nonlinearity indices of the stress-strain behaviour. The
degree of non-linearity varies with different grades of stainless steel. Using K = 0.002,
Equation 2.1 has been reported to give reasonably good predictions of stainless steel
material stress–strain behaviour up to the σ0.2, but observed to overestimate the
corresponding stress beyond σ0.2 (see Figure 2.6).
2.6.1.2 Rasmussen model
Rasmussen (2003) adopted Mirambell and Real’s (2000) modified Ramberg-Osgood
model by using an expression beyond σ0.2 for the complete stress-strain curve for stainless
steel alloys (see Equation 2.2).
2.0
2.0
2.0
2.0
2.0 )(t
m
u
uE
(2.2)
where, σu, εu, m and E0.2 are the ultimate tensile strength, ultimate strain, additional
strain hardening exponent and the tangent stiffness at σ0.2, respectively, (see Figure 2.6).
E0.2 is given in Equation 2.3.
s
s
nE
EE
002.02.0
2.02.0 (2.3)
The additional strain hardening exponent m proposed by Rasmussen (2003) is given
Equation 2.4.
u
m 2.05.31 (2.4)
TH-1259_09610405
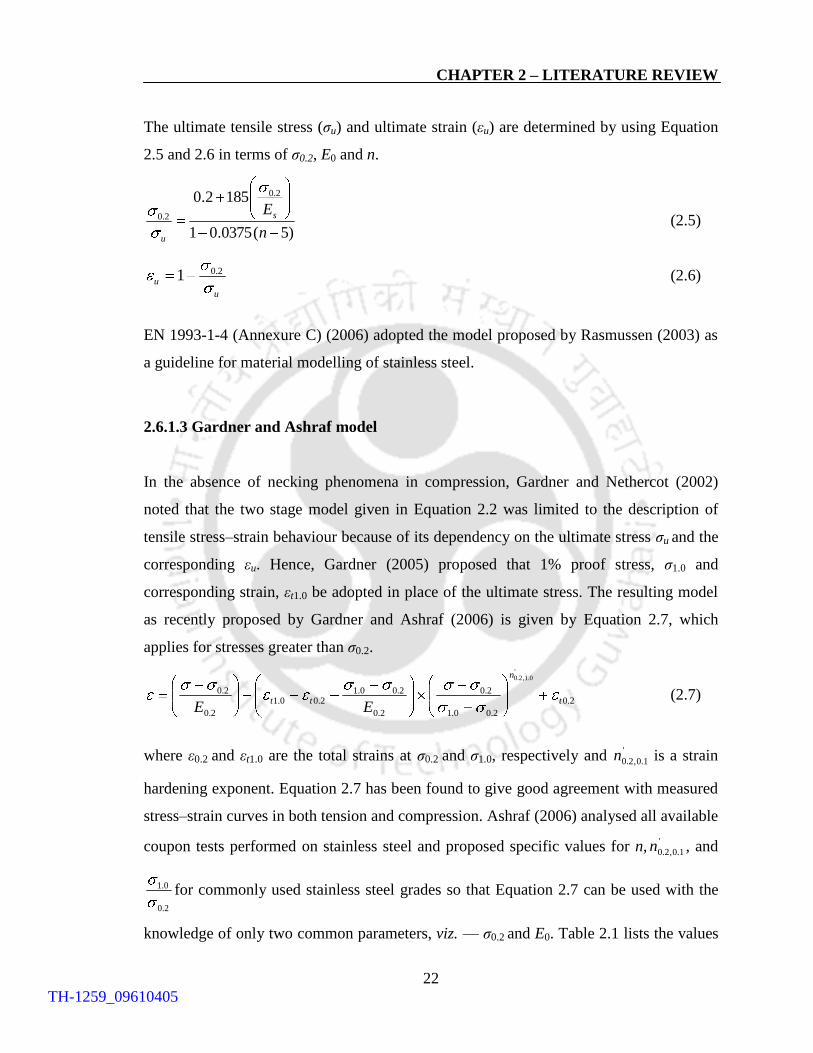
CHAPTER 2 – LITERATURE REVIEW
22
The ultimate tensile stress (σu) and ultimate strain (εu) are determined by using Equation
2.5 and 2.6 in terms of σ0.2, E0 and n.
)5(0375.01
1852.0 2.0
2.0
n
Es
u
(2.5)
u
u2.01 (2.6)
EN 1993-1-4 (Annexure C) (2006) adopted the model proposed by Rasmussen (2003) as
a guideline for material modelling of stainless steel.
2.6.1.3 Gardner and Ashraf model
In the absence of necking phenomena in compression, Gardner and Nethercot (2002)
noted that the two stage model given in Equation 2.2 was limited to the description of
tensile stress–strain behaviour because of its dependency on the ultimate stress σu and the
corresponding εu. Hence, Gardner (2005) proposed that 1% proof stress, σ1.0 and
corresponding strain, εt1.0 be adopted in place of the ultimate stress. The resulting model
as recently proposed by Gardner and Ashraf (2006) is given by Equation 2.7, which
applies for stresses greater than σ0.2.
2.0
2.00.1
2.0
2.0
2.00.12.00.1
2.0
2.0
'0.1,2.0
t
n
ttEE
(2.7)
where ε0.2 and εt1.0 are the total strains at σ0.2 and σ1.0, respectively and '
1.0,2.0n is a strain
hardening exponent. Equation 2.7 has been found to give good agreement with measured
stress–strain curves in both tension and compression. Ashraf (2006) analysed all available
coupon tests performed on stainless steel and proposed specific values for n,'
1.0,2.0n , and
2.0
0.1 for commonly used stainless steel grades so that Equation 2.7 can be used with the
knowledge of only two common parameters, viz. — σ0.2 and E0. Table 2.1 lists the values
TH-1259_09610405
CHAPTER 2 – LITERATURE REVIEW
23
proposed for the coefficients involved. Ashraf et al. (2006) compared the numerical
models with experimentally obtained load–deformation response and failure modes, and
found that Gardner and Ashraf (2006) model given by Equation 2.7 gives the best
prediction.
2.6.2 Confined concrete core
In reinforced concrete columns, the increase in strength and ductility of the concrete
confined by lateral reinforcements is well documented now (Mander et al., 1988; Sheikh
and Uzmeri, 1988; Cusson and Paultre, 1994). On application of compressive loading,
concrete undergoes volumetric changes with a lateral increase in dimensions due to
Poisson’s effect. The lateral expansion of the concrete is resisted when transverse
reinforcements are provided in the form of the spirals, hoops or ties by developing tensile
forces, consequently exerting a compressive reaction force on the concrete core. Thus,
the concrete core experiences a state of multi-axial compression enhancing both the
deformation capacity and strength of the concrete. The concrete core in such state is said
to be confined.
The response of CFSST members is determined in part by the material response of the
confined concrete core of which it is composed. Thus, analysis and prediction of
structural response of CFSST members to static or dynamic loadings requires accurate
prediction of the confined concrete core response to such loadings. In CFSST columns,
the stainless steel tube provides passive confinement to the concrete core. In the case of
passive confinement, the confining pressure is not constant as is the case for active
confinement, and it also depends on the lateral deformation of the concrete core under
axial load and the stress-strain relationship of the confining steel. However, it has been
found that the concrete behavior is similar irrespective of whether the confining pressure
is active or passive (Attard and Setung, 1996). Also, several researchers have studied on
the triaxial state of stresses in concrete-filed steel tubular columns (Gardner and
Jacobson, 1967; Tomii et al., 1977; Orito et al., 1987; Schneider, 1998). Concentrically
TH-1259_09610405

CHAPTER 2 – LITERATURE REVIEW
24
loaded CFSST stub columns are significantly affected by the difference between the
values of Poisson’s ratio of the steel tube (νs) and the concrete core (νc). At the initial
stage of loading, Poisson’s ratio of concrete is lower than that of steel; therefore, the steel
tube expands faster in the radial direction than the concrete core, i.e. the steel does not
restrain the concrete core. As the load increases and the compressed concrete starts to
plasticize, the lateral deformations of the concrete catch up with those of the steel and, for
further increase in load, the steel tube restrains the concrete core and the hoop stresses in
the steel become tensile. At this stage and later, the concrete core is stressed triaxially and
the steel tube biaxially. The following discusses the development of constitutive material
model for the concrete core based on the current focus of research pertaining to the
concrete confined by composition of plated elements rather than circular elements.
In CFSST columns, the confinement provided by the steel tube on the concrete depends
on the steel depth-to-thickness (D/t) ratio. A lower value of D/t ratio provides high
considerable confinement for the concrete, thereby improving the strength of CFSST
columns. However, with inadequate confinement (i.e. a higher D/t ratio), there is a
premature failure of the CFSST columns due to local buckling of steel tubes. Mander et
al. (1988) defined the limiting D/t ratio between confined and unconfined concrete to be
equal to 29.2. Figure 2.7 presents the equivalent uniaxial stress-strain curve for confined
concrete, as well as the unconfined stress-strain concrete curve.
The value of unconfined concrete strain (εc) is usually taken as 0.003 as suggested by
ACI specification (1999). Poisson's ratio (µc) in the elastic part of concrete under uniaxial
compression stress ranges from 0.15 to 0.22, with a representative value of 0.19 to 0.2
according to ASCE (1982). In the current study, µc is taken as 0.2. The confined
cylindrical concrete compressive strength (fcc) and the corresponding confined strain (εcc)
can be calculated from Equations 2.8 and 2.9, respectively, proposed by Mander et al.
(1988).
latccc kff 1 (2.8)
c
latccc
fk21 (2.9)
TH-1259_09610405
CHAPTER 2 – LITERATURE REVIEW
25
where, σlat is the lateral confining pressure imposed on the concrete by the steel tube and
dependent on σy, D/t ratio, cross-sectional shape, and stiffening means. The approximate
values of σlat can be interpolated from the measured values given by Hu et al. (2003). The
value of σlat has significant effect for steel tubes with small D/t ratio. However, with steel
tube D/t ratio greater than or equal to 29.2, the value of σlat is taken as zero (i.e not
significant) (Mander et al., 1988). The factors k1 and k2 are taken as 4.1 and 20.5,
respectively, as given by Richart et al. (1928).
The first part of the curve is the elastic part upto the proportional limit, which is taken as
(0.5fcc). The initial modulus of elasticity of the confined concrete (Ecc) (in MPa) is highly
correlated to its compressive strength and can be calculated with reasonable accuracy
from the empirical equation ACI (1999) as given in Equation 2.10:
cccc fE 4700 (2.10)
The second part of the curve is the nonlinear portion, starting from the proportional limit
stress (0.5fcc) to the confined concrete strength (fcc). The stress-strain relationship
proposed by Saenz (1964) has been widely adopted as the uniaxial stress-strain curve for
concrete and it has the following form:
32
)12()2(1CCCCCC
E
cc
RRRR
Ef (2.11)
Where:
cc
cccccc
f
ER (2.12)
RR
RRR E 1
)1(
)1(2
(2.13)
The constants Rσ and Rε are taken equal to 4.0 as recommended by Hu and Schnobrich
(1989).
The third part of the confined concrete stress–strain curve with ε > εcc, which is used to
describe the softening behavior of the concrete, is the linear descending line from the fcc
to a value lower than or equal to rk3fcc with the corresponding strain of 11 εcc. The
TH-1259_09610405

CHAPTER 2 – LITERATURE REVIEW
26
material degradation parameter (k3) depends on the steel D/t ratio and σy, and can be
approximately calculated from the empirical equations given by Hu et al. (1989). The
reduction factor (r) was introduced by Ellobody et al. (2006) based on the experimental
investigation conducted by Giakoumelis and Lam (2004), to account for the effect of
different concrete strengths. The value of r is taken as 1.0 for concrete with cube strength
(fck) equal to 30 MPa. While, the value of r is taken as 0.5 for concrete with fck greater
than or equal to 100 MPa, as given by Tomii (1991) and Mursi and Uy (2003), and linear
interpolation is used to determine the value of r for concrete cube strength between 30
and 100MPa.
2.7 INITIAL GEOMETRIC IMPERFECTIONS
The importance of initial geometric imperfections in thin-walled structures has been
recognized by researchers for more than three decades, which was limited to ordinary
carbon steel sections. More recently, the development of design codes for stainless steel
requires identification of initial geometric imperfection characteristics for stainless steel
members.
Apart from many beneficial factors involved in the use of stainless steel hollow tubular
sections in structural applications, they are often susceptible to initial geometric
imperfections (local or global or both). These imperfections are an inseparable property
of real structures and may arise during manufacturing, carrying and fabrication, etc, in the
form of bowing, warping, and twisting as well as local deviations and greatly influences
the structural behavior. Hence, the knowledge of the magnitude of member imperfections
is required because it affects the member capacity and especially those carrying axial
compressive loads (ENV 1993-1-1, 1992). There are several studies which consider
different types of initial geometric imperfections and ways of their introduction into a
numerical model. One way of taking initial geometric imperfections into account, which
dominates in design codes, is to induce them by applying an appropriate pattern of
additional loading. However, it works well only for the global type of imperfections, e.g.
TH-1259_09610405
CHAPTER 2 – LITERATURE REVIEW
27
in the case of multistory frames with columns exhibiting deviations from the vertical
direction. In the case of local geometric imperfections, it seems reasonable to introduce
perturbed geometry by measured values of imperfections. However, this procedure can
be tedious when the FE method is used. Moreover, it is not a general procedure since it
can be applied only to those members for which the imperfections have been measured.
Thus, the following sub-sections reviews a general approach of tackling these
imperfections pertaining to thin-walled hollow tubular columns.
2.7.1 Local geometric imperfections
In real life, stainless steel hollow tubular columns composed of plates are often affected
by local geometric imperfections, which are characterized by dents and regular
undulations in the plates. Initial plate imperfection magnidute (ω0) given by Equation
2.14 is often considered as a fixed multiple of plate thickness.
ω0 = Kpt (2.14)
where Kp is a constant.
Dawson and Walker (1972) considered a value of 0.2 for Kp which conservatively fit to
test data on cold-formed steel cross-sections. However, its general applicability is
questionable since it does not consider the other important parameters such as material
strength, fabrication process and boundary conditions. They also proposed the following
expressions for simply supported steel plates under compression and bending as:
twcr
y
0 (2.15)
twcr
y
0 (2.16)
L
lEE sscr (2.17)
where σcr is the elastic critical buckling stress determined from the buckling analysis, τ
and γ are constants, λ is the eigen value obtained from the results of FE analysis, Δl is the
TH-1259_09610405

CHAPTER 2 – LITERATURE REVIEW
28
initial displacement at the movable end input in the boundary conditions, and L is the
length of the column. These two equations are much more rational in the sense that they
include both material property and boundary conditions in addition to the plate thickness
of the plate. For convenience in both hand and numerical analyses, the shape of a local
initial geometric imperfection is often assumed to be the same as that of the lowest
buckling mode, or eigenmodes (Dawson & Walker, 1972).
Sun and Butterworth (1998) incorporated initial geometric imperfections on the
developed non-linear FE model in the form of half sine waves along the length and with
four different values of Kp, such as 0.167, 0.333, 0.5, and 0.667, and found that, Kp =
0.167, gave the best agreement with the test results.
Chou et al. (2000) conducted FE modeling of cold-formed lipped channel and hat section
carbon steel stub columns and used various values of Kp, such as, 0.1, 0.5 and also
Dawson and Walkers’s (1972) proposal. Ultimate load predictions obtained using
Dawson and Walkers’s (1972) proposal with τ = 0.3 gave consistent results.
Gardner (2002) investigated the suitability of Dawson and Walkers’s (1972) proposed
formulations, Equations 2.15 and 2.16, for roll-formed stainless steel hollow tubular
members under compression, and based of the studies Equation 2.18 was proposed (i.e
the local geometric imperfection magnitude for plates), based on the measured
imperfections,
twcr
2.00 023.0 (2.18)
Gardner (2002) found that the proposed equation gave good predictions, which predicts
imperfection amplitudes on the basis of both geometric and material properties of cross-
sections.
Theofanous and Gardner (2009) conducted FE studies on LDSS hollow tubular columns
with square and rectangular sections under axial compression with Kp = 0.1 and 0.01 and
and also the imperfection amplitude proposed by Gardner (2002) (Equation 2.18). It was
TH-1259_09610405
CHAPTER 2 – LITERATURE REVIEW
29
found that the ultimate load and end shortening at ultimate load are generally well-
predicted for the measured imperfection amplitude proposed by Gardner (2002) and Kp =
0.01, whereas with the value of Kp = 0.1, there is a clear underestimation of the load
carrying capacity and end shortening at ultimate load of the stub columns.
However, in contrast to the use of local geometric imperfections in any FE studies for
hollow tubular columns, generally the effect of local geometric imperfections on CFST
columns were neglected because the strength reduction is not significant compared to
thin-walled hollow tubes owing to the delaying effect of steel tube local buckling by the
core concrete (e.g. Tao et al., 2009, Hassanein, 2010).
2.7.2 Global geometric imperfections
In fact, all stainless steel hollow tubular columns in framed structures in reality are
geometrically imperfect in some degree and if a frame is geometrically imperfect, lateral
deflection commences as soon as a loading is applied, which create bending deformation
on the columns. In framed structures, global geometric imperfections are initial out-of-
straightness of a member, which is described as a lateral deflection of a member relative
to a straight line between its end points. As a result of initial out-of-straightness, even a
column with perfectly aligned axial load undergoes compression and bending. In design
of any stainless steel hollow tubular columns, initial out-of-straightness is to be
considered as it is one of the main effect factors on the ultimate strength (Galambos,
1998). The following discusses some general approach of representing the initial out-of-
straightness in hollow and concrete-filled slender tubular columns.
Galambos (1998) reported that due to the manufacturing process employed, stainless steel
hollow tubular columns were generally much straighter than steel columns. Stainless steel
hollow tubular columns could have the maximum initial out-of-straightness from L/3000
to L/8000 (where L in the specimen length) with an average of around L/ 6500. Lui and
Young (2003) performed experimental studies on fixed-ended stainless steel square
hollow tubular column compression members, where, the value of the initial out-of-
TH-1259_09610405
CHAPTER 2 – LITERATURE REVIEW
30
straightness of the columns measured at the mid-heights were ranged from L/950 to
L/4970. Han (2007) took the maximum value of initial out-of-straightness of L/1000
according to the Chinese code (GB50017-2003, 2003). Hong and Varma (2009)
performed sensitivity analysis on the imperfection magnitude and considered L/7500 as
the value of maximum initial out-of-straightness for modeling and analysis. Theofanous
and Gardner (2009) conducted an experimental test on pin-ended LDSS hollow tubular
columns by considering an initial out-of-straightness in all the test specimens as L/1500.
This value is the statistical mean of geometric imperfections in steel structural members
as suggested by Bjorhovde (1972). Sensitivity analysis through FE study was also
performed, in which the values of initial out-of-straightness considered were L/500,
L/1000, L/1500 and L/2000. It was found that the most accurate and consistent prediction
of test response is obtained for an imperfection magnitude of L/1500. Huang and Young
(2013) measured the initial out-of-straightness on the test specimens of pin-ended cold-
formed LDSS hollow tubular slender columns. The average overall initial out-of-
straightness at mid-height ranged from L/2085, L/2167, L/2157, L/2435, L/1992 and
L/2155.
In general, global geometric imperfections for real columns vary randomly depending on
different supplied stainless steel tubes. To the best of author’s knowledge, there are no
specific rules regarding selection of an appropriate value of initial out-of-straightness for
hollow tubular slender columns. Based on the literature survey, the magnitude of initial
out-of-straightness chosen in the studies usually ranges from L/1000 to L/10000. Further
research is needed to recommend a codified initial out-of-straightness, and to present a
suitable design method for stainless steel hollow tubular slender columns.
TH-1259_09610405
CHAPTER 2 – LITERATURE REVIEW
31
2.8 THE PRODUCTION OF STAINLESS STEEL TUBULAR SECTIONS
Stainless steel is typically produced in an electric arc furnace (EAF) from a mixture of
alloying elements and scrap carbon steel and/or stainless steel. Partial products such as
blooms, billets and slabs which are produced from the continuous caster are the starting
material for the manufacture of a number of final products, such as, tubular and hot rolled
sections (see Figure 2.8). Hot rolled sections (I-, C-, or L-sections) are formed through
reheated blooms and billets, whilst tubular sections are formed by reheating the slabs.
For stainless steel hollow tubular sections, the production route has an important
influence on the stainless steel final material properties as it is sensitive to plastic
deformation and thermal effects, thereby, influencing the residual stress and geometric
imperfections found in the sections. Structural stainless steel tubular sections are typically
produced in two principal ways, such as, the seamless method or by welding (see Figure
2.9). The majority of seamless tube is made by piercing the solid ingot or bar and then
elongating it in a rotary forge (called the Pilger process). Welded hollow sections for
structural applications are produced by electric or submerged arc welding.
For the very thick sections, seamless sections may be used. Square or rectangular hollow
sections are sometimes made by using channel sections, which are welded together or by
shaping a single strip to the required shape and closing it by a single weld, preferably in
the middle of a face. Similar approach as discussed may be followed in making NRSs
with ease. More detailed information about the manufacturing processes and the
limitations in sizes can be obtained from CIDECT (1984) and Dutta and Wurker (1988).
2.9 SUMMARY OF THE LITERATURE REVIEW
This chapter presents an overview of previous research on stainless steel and LDSS
tubular (both hollow and concrete-filled) columns. The development of stress-strain
curve for stainless steel material and the confined concrete core in concrete-filled tubular
TH-1259_09610405
CHAPTER 2 – LITERATURE REVIEW
32
column based on the material models available has been presented. Based on the
literature review, the following concluding remarks can be made:
1) The structural behavior of stainless steel hollow tubular columns with commonly
available shapes, such as, square, rectangular, circular and elliptical, have been
extensively investigated and are getting very popular in structural application due to
its excellent properties with regard to loading in compression, torsion and bending in
all directions combined with its aesthetic external profile in the use of such structural
stainless steel sections.
2) The use of concrete-filled tubular columns has gained its popularity throughout the
world, and such composite construction delivers the economies of a reinforced-
concrete column, resulting in significant economies in the overall structure of a
building project.
3) Several literatures have been reported to understand the structural behavior of CFSST
columns with square, rectangular, circular and elliptical sections, and to quantify the
influence of member geometry and constituent material properties on the structural
behavior.
4) The benefits in the use of LDSS material in terms of its superior structural
performance along with lower cost compared with other stainless steel grades have
been addressed and indicate a great potential in the future for replacing other stainless
steel grades for structural applications.
5) There are many design standards available in the design of stainless steel structures.
Currently the amendment of EN 1993-1-4 (2006) is underway to include different
grades of lean duplexes to provide engineers with a useful sub-set of stainless steels to
specify in structural applications.
6) The importance and advantages in the use of special-shaped reinforced-concrete
columns with NRSs has been addressed. More studies are required to better
understand the benefits in the use of such special-shaped sections as hollow or
concrete-filled tubular columns.
TH-1259_09610405
CHAPTER 2 – LITERATURE REVIEW
33
7) Elaborate discussions on the various material models available in describing the
material behavior of stainless steel families as well as confined concrete core model
development are detailed. Stainless steel material model development proposed by
Gardner and Ashraf (2006) was found to give the best prediction. For the confined
concrete core material model development, the widely used stress-strain relationship
proposed by Saenz (1964) was adopted.
8) Many researchers have recognized the importance of initial geometric imperfections,
such as the local and global geometric imperfections, in thin-walled structures. The
local geometric imperfection equation proposed by Gardner (2002) gave good
predictions. The magnitude of initial out-of-straightness chosen in the studies usually
ranges from L/1000 to L/10000. Further research is needed to recommend a codified
initial out-of-straightness, and to present a suitable design method for stainless steel
hollow tubular slender columns.
In the context of this thesis, the following areas have been identified justifying the
present investigation.
Many have studied and analysed the structural behaviours of stainless steel hollow and
concrete-filled tubular columns pertaining to commonly available shapes such as square,
rectangular, circular and elliptical sections. The benefits in the use of LDSS material in
terms of its superior structural performance along with lower cost and the importance and
advantages in the use NRSs to columns has been brought out. However, relatively little
attention being paid on the structural behaviour of tubular columns (both hollow and
concrete-filled) having equal material consumption, as stainless steel material being
expensive, along with the beneficial factors involved in the use of special shaped
sections, such as the NRSs. Such a study would be particularly relevant to predictive
assessment of mechanical strength and behavior of structures under axial compression
and would serve as a valuable addition to the scarce body of literature on this issue in the
literature.
TH-1259_09610405

CHAPTER 2 – LITERATURE REVIEW
34
Table 2.1: Compound Ramberg–Osgood parameters obtained from coupon test results.
Type Grade Forming
process
Tension or
compression n
'
0.1,2.0n 2.0
0.1
Austenitic 1.4301
Press-braked Tension 5.8 2.7 1.20
Compression 5.3 2.5 1.20
Roll-formed Tension 5.4 3.4 1.14
Compression 4.3 2.7 1.25
Ferritic
- - - 4.4 3.1 1.17
- - - 6.4 3.2 1.16
- - - 7.3 3.3 1.14
Duplex - - - 5.0 3.4 1.15
TH-1259_09610405
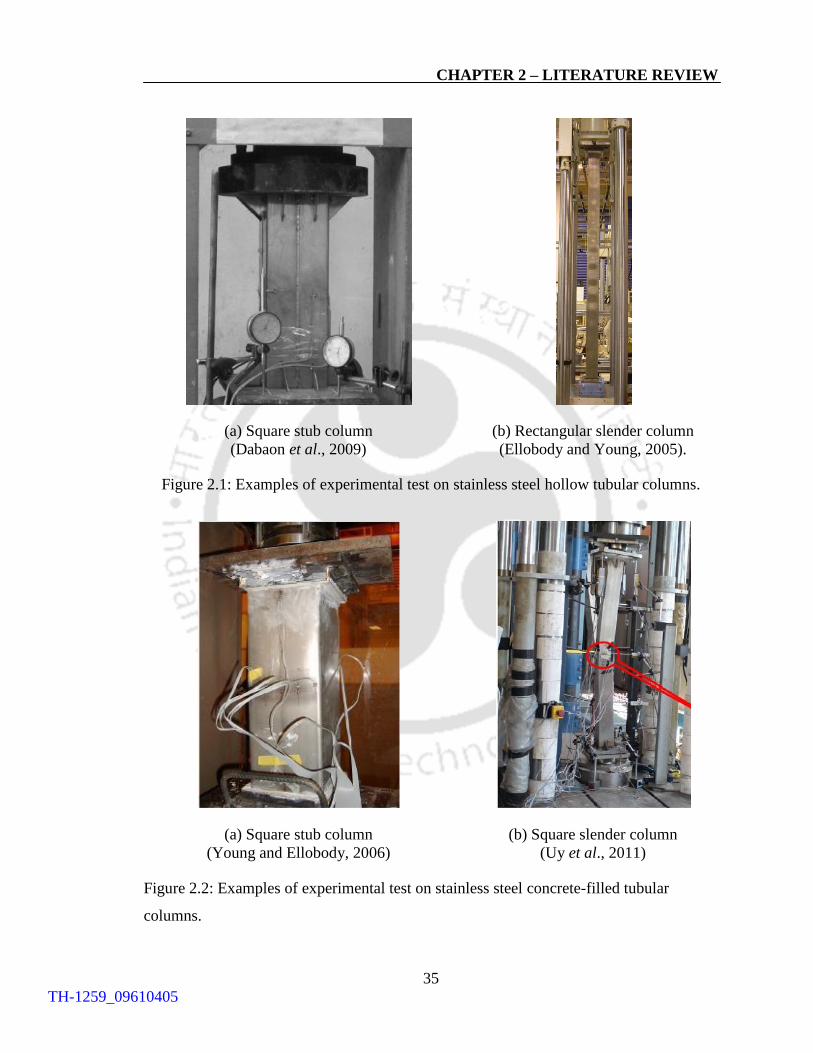
CHAPTER 2 – LITERATURE REVIEW
35
(a) Square stub column
(Dabaon et al., 2009)
(b) Rectangular slender column
(Ellobody and Young, 2005).
Figure 2.1: Examples of experimental test on stainless steel hollow tubular columns.
(a) Square stub column
(Young and Ellobody, 2006)
(b) Square slender column
(Uy et al., 2011)
Figure 2.2: Examples of experimental test on stainless steel concrete-filled tubular
columns.
TH-1259_09610405
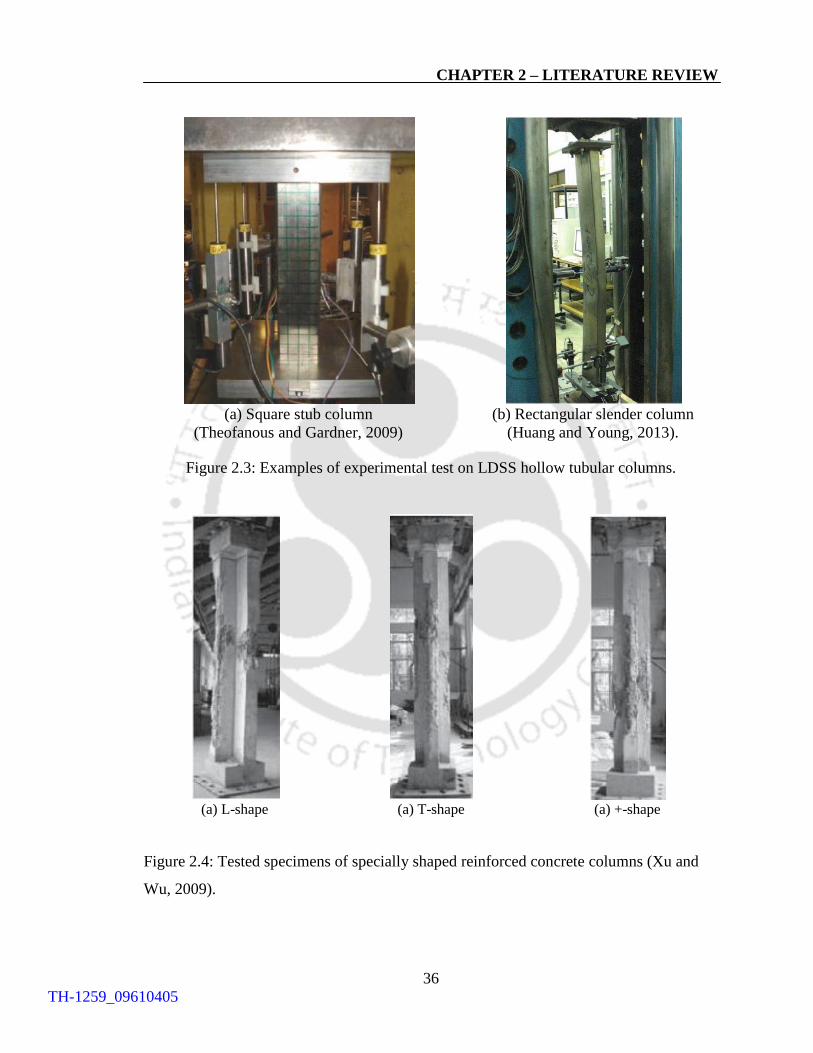
CHAPTER 2 – LITERATURE REVIEW
36
(a) Square stub column
(Theofanous and Gardner, 2009)
(b) Rectangular slender column
(Huang and Young, 2013).
Figure 2.3: Examples of experimental test on LDSS hollow tubular columns.
(a) L-shape (a) T-shape (a) +-shape
Figure 2.4: Tested specimens of specially shaped reinforced concrete columns (Xu and
Wu, 2009).
TH-1259_09610405
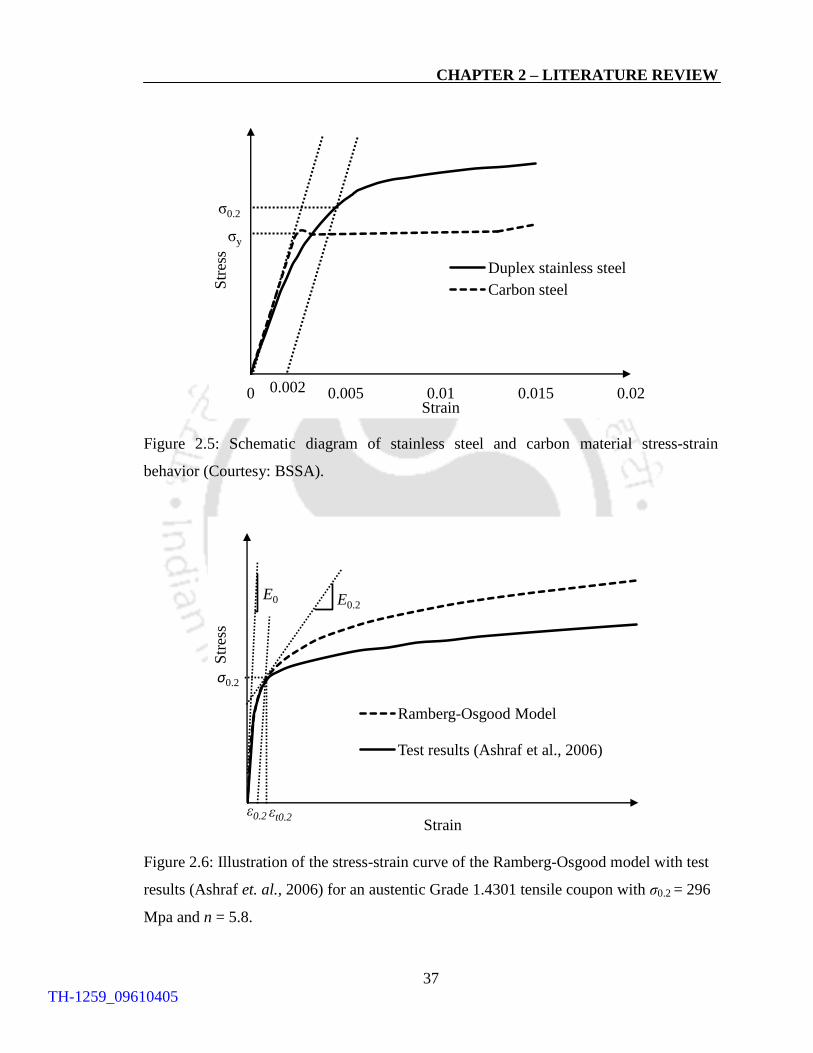
CHAPTER 2 – LITERATURE REVIEW
37
Figure 2.5: Schematic diagram of stainless steel and carbon material stress-strain
behavior (Courtesy: BSSA).
Figure 2.6: Illustration of the stress-strain curve of the Ramberg-Osgood model with test
results (Ashraf et. al., 2006) for an austentic Grade 1.4301 tensile coupon with σ0.2 = 296
Mpa and n = 5.8.
0
100
200
300
400
500
600
700
800
900
0 0.005 0.01 0.015 0.02
Str
ess
Strain
Duplex stainless steel
Carbon steel
σ0.2
0.002
σy
0
100
200
300
400
500
600
700
0 0.02 0.04 0.06 0.08 0.1
Str
ess
Strain
Ramberg-Osgood Model
Test results (Ashraf et al., 2006)
E0 E0.2
σ0.2
ε0.2 εt0.2
TH-1259_09610405
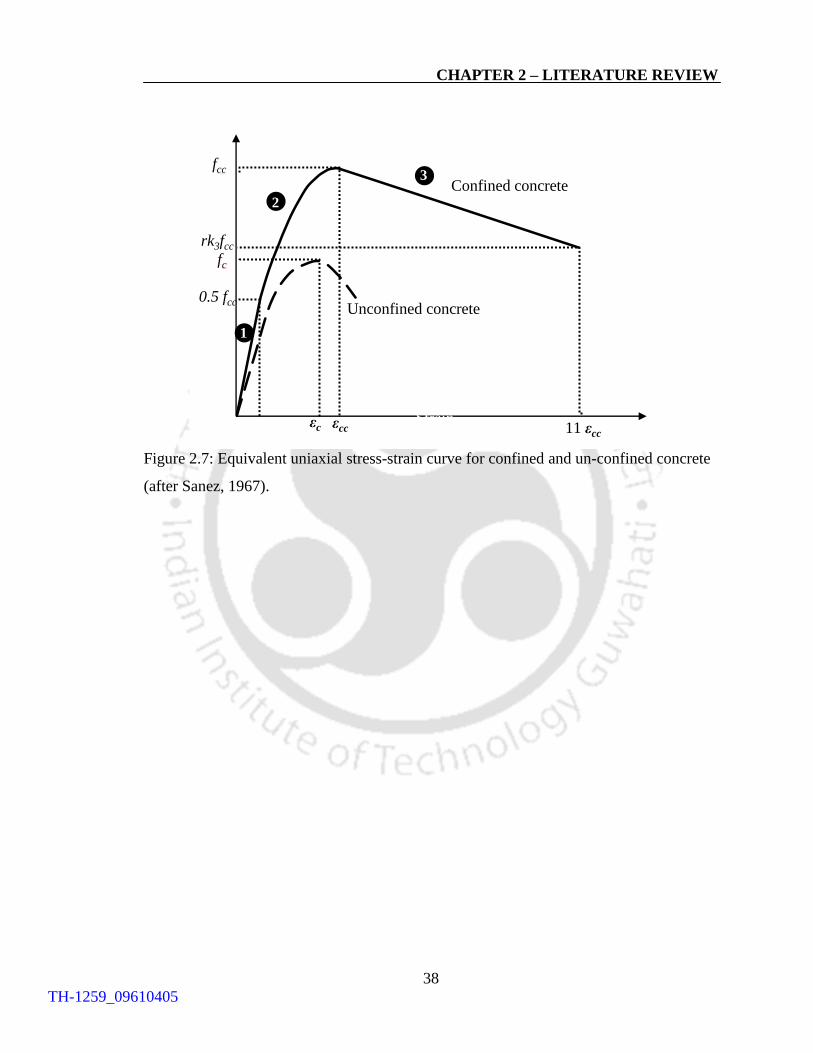
CHAPTER 2 – LITERATURE REVIEW
38
Figure 2.7: Equivalent uniaxial stress-strain curve for confined and un-confined concrete
(after Sanez, 1967).
0
5
10
15
20
25
30
35
40
45
50
0 0.002 0.004 0.006 0.008 0.01 0.012
Str
ess
Strain
fcc
rk3fcc
fc
εc εcc 11 εcc
0.5 fcc
1
2
3
Unconfined concrete
Confined concrete
TH-1259_09610405
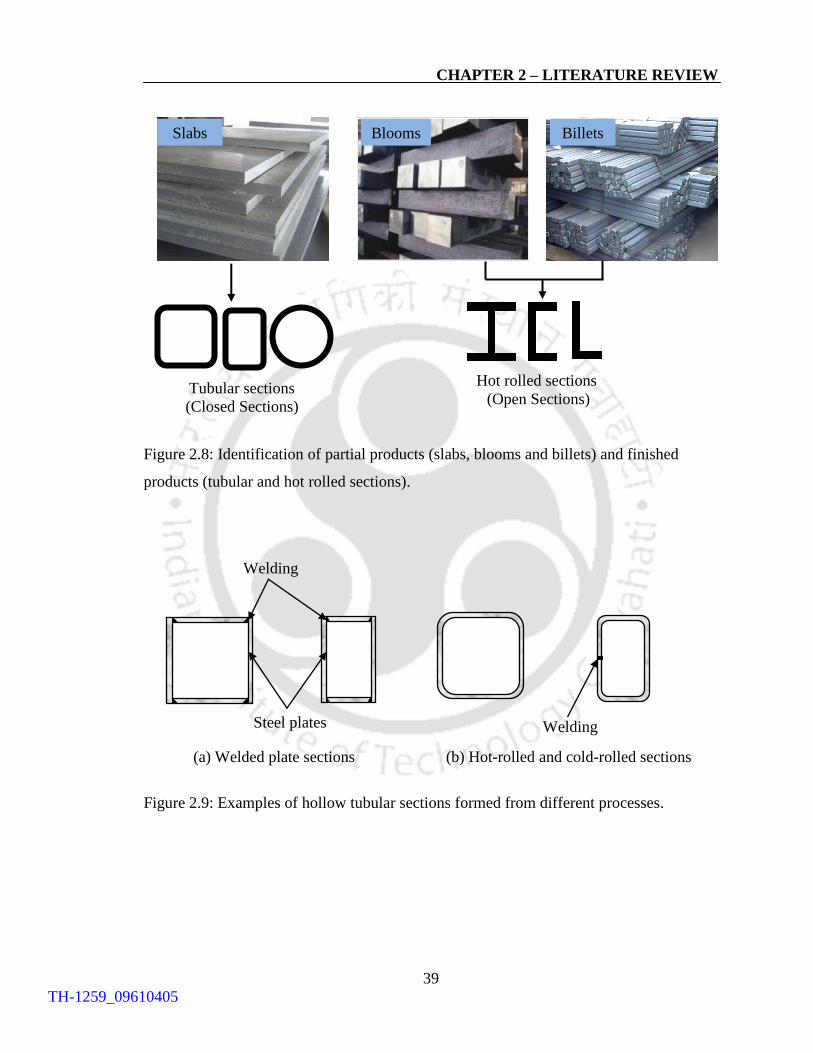
CHAPTER 2 – LITERATURE REVIEW
39
Tubular sections
(Closed Sections)
Hot rolled sections
(Open Sections)
Figure 2.8: Identification of partial products (slabs, blooms and billets) and finished
products (tubular and hot rolled sections).
(a) Welded plate sections (b) Hot-rolled and cold-rolled sections
Figure 2.9: Examples of hollow tubular sections formed from different processes.
Slabs Blooms Billets
Welding
Steel plates Welding
TH-1259_09610405
40
CHAPTER 3
NUMERICAL MODELLING OF LEAN DUPLEX
STAINLESS STEEL HOLLOW STUB COLUMNS
3.1 INTRODUCTION
Numerical techniques have now become an efficient tool for analyzing the behavior of
structures provided that suitable care is taken to ensure that the finite element (FE) model
is appropriate and the input parameters are accurately specified. Owing to the expense
and impracticality of generating comprehensive data on the behaviour of stainless steel
structures through experimentation, a FE study was undertaken using the general-purpose
FE software package Abaqus (2009) throughout the study. In the present work, the FE
models were verified with the experimental test done by other researchers based on
similar areas of work, to generate further results through variation of appropriate
parameters in the FE models.
This chapter focuses on the axial compressive resistance of hollow tubular stub columns
with NRSs and a representative square section having equal LDSS material cross-
sectional area as that of the NRSs (i.e. equal material consumption). The main objective
of the study is to see the effect of cross-sectional shape and thickness of the LDSS tube
on the structural behavior, such as, the load and deformation capacities of hollow tubular
stub columns. The FE results were compared with the currently available design
standards for stainless steel, such as the European specification (EN 1993-1-4, 2006) and
the American specification (ASCE 8-02, 2002), to assess their applicability in the design
TH-1259_09610405
CHAPTER 3 - NUMERICAL MODELLING OF LDSS HOLLOW STUB
COLUMNS
41
of LDSS hollow tubular columns. Reliability analysis of the design standards was also
carried out based on the FE studies.
3.2 FE MODELLING
Compared to carbon steel which has a well defined yield point, LDSS exhibits a rounded
stress-strain curve with no sharp yield point as discussed in Section 2.6.1. Accurate
representation of the basic material behavior forms the most important aspects of any FE
simulation. The following sub-sections presents various details for achieving an accurate
FE model representation of LDSS hollow tubular stub columns as also followed by
several researchers.
3.2.1 Boundary conditions and analysis technique
The present modeling approach follows those published in the literature (e.g. Gardner and
Nethercot, 2004; Ellobody and Young, 2006; Theofanous and Gardner, 2009; Dai and
Lam, 2010; Hassanein, 2010). Figure 3.1 shows a typical geometry of a square LDSS
hollow tubular stub column. The bottom part is fixed while the top loaded part is allowed
to have free vertical translation (i.e. along the loading axis line). The boundary condition
is accomplished using two rigid plates that were tied to the column ends via surface-to-
node tie constraints available in Abaqus (2009). The rigid body reference nodes (RP-1
and RP-2 for bottom and top, respectively) associated with the rigid plates was then used
to restrain all degrees of freedom apart from vertical translation at the loaded end, which
was constrained via kinematic coupling to follow the same vertical displacement. A
central concentrated normal load was applied statically at the RP-2 (see Figure 3.1) using
displacement control, thus applying uniform pressure at the top edges of the column
through the rigid plate.
TH-1259_09610405
CHAPTER 3 - NUMERICAL MODELLING OF LDSS HOLLOW STUB
COLUMNS
42
In the present study, linear elastic analysis technique using the *BUCKLING command
was employed to obtain the relevant eigenmodes, which were subsequently used to
represent initial geometric imperfections in subsequent nonlinear analyses. All the stub
columns were treated as geometrically nonlinear static problems involving buckling.
Abaqus (2009) offers several techniques to analyse this type of problem and among the
available options the ‘modified RIKS method’ was chosen because of its simplicity and
widespread use by several researchers in similar applications (e.g. Ashraf et al., 2006;
Huang and Young, 2012). In the modified RIKS method, the load is applied
proportionally in several load increments. In each load increment the equilibrium
iteration is performed and the equilibrium path is tracked in the load displacement space.
The nonlinear effects arising from geometric and material nonlinearity were included
using the ‘NLGEOM’ option and *PLASTIC command respectively as stated in Abaqus
(2009).
3.2.2 FE mesh
Shell elements are generally used to model thin-walled structures. Abaqus (2009)
includes general-purpose shell elements as well as elements that are specifically
formulated to analyse ‘thick’ and ‘thin’ shell problems. The general purpose shell
elements provide robust and accurate solutions to most applications although, in certain
cases, enhanced performance may be obtained using the thin or thick shell elements
(Ashraf et al., 2006). General purpose shell elements include transverse shear
deformation, whilst thin shell elements may be used in cases where transverse shear
flexibility is negligible. Stainless steel structural members are generally modeled using
either of the following two shell elements available in Abaqus (2009): general-purpose
thin-shell S9R5 (e.g. Mirambell and Real, 2000; Gardner and Nethercot, 2004; Ashraf et
al., 2006) or S4R, (e.g. Gardner and Nethercot, 2004; Ellobody and Young, 2005; Ashraf
et al., 2006; Theofanous and Gardner, 2009; Theofanous et al., 2009; Hassanein, 2010;
Hassanein, 2011). Ashraf et al. (2006) suggested that there is no significant difference
TH-1259_09610405
CHAPTER 3 - NUMERICAL MODELLING OF LDSS HOLLOW STUB
COLUMNS
43
between the results obtained using the two commonly employed shell elements.
However, in line with similar previous investigations on the behavior of LDSS hollow
tubular sections, S4R elements are known to provide accurate solutions to most
applications (for both thin and thick shell problems) and agreed well with the test results
(Theofanous and Gardner, 2009; Hassanein, 2010; Hassanein, 2011). Hence, S4R
elements has been utilised in the current study to discretize the FE models. The aspect
ratios of the elements are kept at ~ 1.0 in all the FE models (see Figure 3.1).
One of the most important aspects of FE modeling is to identify a suitable mesh size.
Finer meshes are always preferred to obtain better predictions. But there is no general
guidance for this fineness. As a result a convergence study is a pre-requisite to find a
suitable mesh for FE investigation. Although finer meshes are expected to provide better
predictions, they make the whole process more expensive in terms of the computational
time. A compromise is therefore needed between the level of accuracy and the solution
cost. In the present study, σcr, which is expressed by Equation 2.15 and calculated first by
obtaining the eigen value through elastic linear analysis technique, was used to check
mesh convergence by monitoring the σcr with mesh refinement (see Figure 3.2). A
suitable mesh size is chosen at a point where there is little improvement in the σcr with
further mesh refinement. Accordingly, the element size of about 20 – 30 mm was chosen
in all the FE models and the aspect ratio of the elements are kept at ~ 1.0.
3.2.3 Appraisal of existing material models
This section describes existing functions that have been applied to the modelling of non-
linear behavior, and discusses their suitability for describing LDSS material stress-strain
response. The minimum specified material properties of LDSS Grade EN 1.4162
according to EN 10088-4 (2009) are σ0.2 of 530 MPa and ultimate stress (σu) of 700-900
MPa. The Poisson’s ratio of the LDSS material was suitably chosen as 0.3 (e.g.
Theofanous and Gardner, 2009; Hassanein, 2010; Hassanein, 2011). The compressive flat
TH-1259_09610405
CHAPTER 3 - NUMERICAL MODELLING OF LDSS HOLLOW STUB
COLUMNS
44
material properties given by Theofanous and Gardner (2009) (see Table 3.1) were used in
deriving the stress-strain curve of LDSS material through three models viz., Ramberg-
Osgood (Ramberg and Osgood, 1943; Hill, 1944), Rasmussen (2003) and Gardener and
Asraf (2006) models, as discussed in the previour chapter. The last two models are
modified versions of the original Ramberg–Osgood model. These models are tested in the
present FE analyses by comparing with an experimental result from Theofanous and
Gardener (2009) to select a suitable model appropriate for the present work.
3.2.4 Local geometric imperfections
Hollow tubular stub columns are often subjected to local geometric imperfections rather
than global geometric imperfections, hence, local geometric imperfections was applied.
In Section 2.8.1, a detailed discussion on local imperfection magnitude based on several
literatures for inclusion in the FE models to accurately simulate the tests was shown. It
was found that the value of ω0 proposed by Gardner (2002) as given in Equation 2.16 also
gave good agreement with the test results performed on structural LDSS hollow tubular
columns. Hence, Gardner`s (2002) model was employed in deriving the ω0 for further
parametric studies of the LDSS hollow tubular columns. The proposed ω0 by Gardner
(2002) was used to perturb the geometry of the columns by scaling the lowest eigenmode
in all the NRSs and the representative square section (see Figure 3.3).
3.3 VERIFICATION OF THE FE MODELS
In order to validate and compare the three material models mentioned in Section 2.7.1,
the experimental result obtained by Theofanous and Gardner (2009) for LDSS (Grade EN
1.4162) square hollow-section columns (80x80x4-SC2) has been considered as the
benchmark. The LDSS material properties and the measured dimensions by Theofanous
and Gardner (2009) are given in Tables 3.1 and 3.2, respectively. It may be noted that this
column has been formed using cold-form technique, resulting in different properties
TH-1259_09610405
CHAPTER 3 - NUMERICAL MODELLING OF LDSS HOLLOW STUB
COLUMNS
45
between flat and corner portions of the column, and as a result residual stresses are
induced due to inelastic material deformations during cold-forming. However, Gardner
(2002) presented a study on the effect of residual stresses on hollow tubular columns and
found that it causes only a small reduction in the stiffness but have little or negligible
influence on the overall behavior or ultimate load carrying capacities. Hence, in the
present study, only flat material properties are used in describing the FE models.
Figure 3.4 shows the stress-strain plot of LDSS material using the experimental values
obtained by Theofanous and Gardner (2009) through various materials models viz.,
Ramberg-Osgood, Rasmussen and Gardner and Ashraf models. It can be seen that
beyond σ0.2, Ramberg-Osgood model predicts higher stress values as compared to the
Gardner and Ashraf and Rasmussen models. The material models shown in Figure 3.4 are
then used as input parameters to Abaqus, by converting into true stresss (σtrue) and true
plastic strains (εpl
true) using the following Equations 3.1 and 3.2.
σtrue = σnom (1+εnom) (3.1)
0)1ln(
Enom
pl
truetrue
(3.2)
where σnom and єnom are engineering stress and strain, respectively. Imperfection
magnitude was seeded in the FE model as discussed in Section 3.2.4.
The deformed shape of a typical LDSS hollow tubular stub column is shown in Figure
3.5. It can be seen from Figure 3.5 that the column fails by local buckling and it occurs
near the middle length consistent with other FE models (e.g. Gardner, 2005; Ellobody
and Young, 2006) and experimental studies reported in the literature (e.g. Ellobody and
Young, 2006; Lu et al., 2010; Yang et al., 2010; Zuo et al., 2010). Figure 3.6 presents the
load (P)-axial displacement (δ) curves for the LDSS hollow tubular column (80x80x4-
SC2). It is observed that all the three models predicts similar trend up to a load of ~ 800
kN (see Figure 3.6). From Figure 3.6, it can be seen that compared to Ramber-Osgood
and Rasmussen models, Gardner and Ashraf model predicts closer ultimate load (Pu) (~ -
0.18 %) and axial displacement at peak load (δu) (~ -3.85%) with the experimental values
TH-1259_09610405
CHAPTER 3 - NUMERICAL MODELLING OF LDSS HOLLOW STUB
COLUMNS
46
(Thefanous and Gardner, 2009). Hence for all the subsequent FE analyses in the present
study, the material model proposed by Gardner and Ashraf (2006) is used.
3.4 HOLLOW TUBULAR STUB COLUMN MODELLING
3.4.1 Introduction
As part of the current study, a series of FE models are investigated to provide data on the
load and deformation capacity of LDSS hollow tubular stub columns with NRSs and
representative square section under pure axial compression. Parametric studies are
conducted to investigate the influence of key variables, such as thickness and cross-
sectional shape, and to generate further results.
3.4.2 Development of the FE models
A total of 176 LDSS hollow tubular stub columns FE models were considered for the
parametric studies. Figure 3.7 shows the LDSS hollow tubular stub column cross-sections
considered in the study. The columns are labeled such that the cross-sectional shape can
be identified from the label. For example, the label “SHC” and “+HC” defines the LDSS
Hollow tubular stub Columns with a Square and +-shape sections, respectively.
The thickness of the LDSS tube was varied from 5 mm to 40 mm to encompass a wide
range of cross-sectional slenderness, such as Class 3 (stocky) and Class 4 (slender)
sections, as per EN 1993-1-4 (2006) codal provision, and will be discussed further in
Section 3.5.7.1. The stub column lengths were set equal to three times the maximum
outer dimension (i.e. 3 x 600 mm = 1800 mm), to avoid the effects of flexural buckling
and end conditions similar to the approach followed by several other researchers (e.g.
Ellobody and Young, 2006; Theofanous & Gardner, 2009; Hassanein, 2010). To simplify
the modeling process corners of the NRSs and representative square section are assumed
TH-1259_09610405
CHAPTER 3 - NUMERICAL MODELLING OF LDSS HOLLOW STUB
COLUMNS
47
to be at right angles (i.e. corner radii as in the validation (detailed in Section 3.3) are not
considered), together with the possibility of welding at the corners and due to the lack of
experimental material properties available for the corner region (in case of cold work
techniques adopted in the manufacturing of hollow tubular members). Further, it is
assumed that the material properties are same both at the flat and corner regions (also
detailed in Section 3.3).
3.5 RESULTS and DISCUSSION
3.5.1 Introduction
The results of the FE analysis for hollow tubular stub columns was presented in terms of
variation in the load and deformation capacities and failure modes with change in the
cross-sectional shape and thickness of the LDSS tube as well as the presence of initial
geometric imperfections in such columns. The FE results was then compared with the
design strengths predicted by the EN1993-1-4 (2006) and ASCE 8-02 (2002)
specifications. The applicability and reliability of these codes on LDSS hollow tubular
stub columns was also assessed based on the FE studies.
3.5.2 Deformed shapes of NRSs and square section
Figure 3.8 shows typical failure modes at four times δu (4xδu) for stocky and slender
section of hollow tubular stub columns with NRSs and representative square section. It
can be seen from Figure 3.8 that slender NRSs and representative square sections (both
stocky and slender sections) failed with the same characteristic failure mode, whereby, all
the faces of a section buckles locally alternately outward and inward (see Figures 3.8a-d
and 3.8e). However, for stocky NRSs, local buckling is effectively prevented as
compared to the representative square section. As the sectional shape changes from
square → L → T → +-shape (i.e number of sides in a section increases), more effective
TH-1259_09610405
CHAPTER 3 - NUMERICAL MODELLING OF LDSS HOLLOW STUB
COLUMNS
48
the section becomes in controlling local buckling due to increase in the stiffness of the
section.
3.5.3 Load-axial deformation profile
Figure 3.9 shows the variation of P/Agfy (or Pnom) (where Ag is the LDSS tube material
gross cross-sectional area) with δ is shown for NRSs and the representative square
section for LDSS tube thickness of 5 mm and 20 mm (i.e. to compare slender section (5
mm) and stocky section (20 mm)). The term Agfy can be considered as the global yield
load. A ratio of Pnom < 1.0 indicates that the sections are slender and can buckle prior to
yield. For Pnom ≥ 1.0 (i.e. stocky sections), yielding precedes buckling, and may be
followed by hardening prior to buckling. It can be observed from Figure 3.9 that all the
specimens (slender and stocky sections of NRSs and representative square section)
possess similar ascending stiffness but the ultimate strength of the column increases as it
goes from square, L-, T-, to +-shaped sections.
For slender sections, NRSs shows higher Pu compared to the representative square
section in order of square < L < T < +-shape, and may be related to the higher stiffening
effects of the corner regions and the potential for stress redistribution once local buckling
of the wider plate face occurs. As the numbers of corners (right angled joints) are
increased the Pu also increases. It can be primarily noticed that as it goes from square to
+-shaped section, the sharper is the load-axial deformation behaviour (for t = 5mm). For
stocky sections, the Pu is similar for all the sections due to all the cross-sectional shape
considered effectively preventing the local buckling befor yielding, thus reaching the full
material capacity. During the decending stage, load-axial displacement profile for slender
section specimens of NRSs and representative square section are similar, however, for
stocky sections, as the cross-sectional shape changes from square → L → T → +-shape,
the descending tendency is slowed down and the ductility of the specimen is improved.
TH-1259_09610405
CHAPTER 3 - NUMERICAL MODELLING OF LDSS HOLLOW STUB
COLUMNS
49
3.5.4 Strength capacity of NRSs and square section
Figure 3.10 shows a plot of Pu versus t to see the effect of cross-sectional shape on the
load capacity of hollow tubular stub columns. It can be seen from Figure 3.10 that, for
NRSs, there is approximately a linear increase of Pu with increasing LDSS tube
thicknesses, whereas, for the representative square section, a milder increase of Pu is seen
at lower thickness and linear increase at higher LDSS tube thicknesses. Also, for LDSS
tube thickness < 30 mm, NRSs shows a higher strength capacity compared to the
representative square section, with +-shaped section having the highest strengths,
possibly due to the better delay in the local buckling shown by the NRSs. This may be
attributed to the presence of shorter plate faces and more number of corners in the NRSs
compared to the representative square section. However at LDSS tube thicknesses ≥ 30
mm, all the sections considered gave similar strengths, which may be due to the sections
reaching the ultimate material capacity rather than failing by local buckling before
yielding (see Figure 3.9). It can also be observed from Figure 3.10 that, for all the cross-
sections considered, there appears to be a linear increase in Pu with increasing thicknesses
of the LDSS tube.
Figure 3.11 shows the variation of Pu with cross-sectional shapes for different thicknesses
of the LDSS tube. It can be observed from Figure 3.11 that there is a linear increase of Pu
at lower thicknesses with change in the cross-section from S → L- → T- → +-shape. For
changes in the cross-sectional shape from square to + shape, the increase in Pu are ~
136%, 109%, 72%, 26%, 9% for 5mm, 10, mm, 15 mm, 20 mm and 25 mm, respectively,
showing that the increase in Pu is more effective at thinner sections. At higher thickness
(i.e t ≥ 30.0 mm), all the section analysed gives similar strengths.
Variation of Pu/Pu,SHC (where Pu,SHC is the Pu of the representative square section) with
cross-sectional shape are shown in Figure 3.12. It can be seen from Figure 3.12 that the
gain in Pu with change in the cross-sectional shape from square to L, T and +-shape are in
the range 120%-150%, 130%-170%, 140%-230%, respectively, at lower thicknesses of
TH-1259_09610405

CHAPTER 3 - NUMERICAL MODELLING OF LDSS HOLLOW STUB
COLUMNS
50
the steel tube (< 20 mm). Thus, it can be seen that by switching over to + shape sections,
significant gain in ultimate strength can be obtained for all the thicknesses considered,
with thinner sections giving more pronounced gain. Hence, it is possible to achieve
higher Pu with increasing number of corners/sides rather than increasing thickness,
providing a potential application for a much lighter structures and hence economizing
construction cost.
3.5.5 Deformation capacity of NRSs and square section
Figure 3.13 shows a typical plot of ultimate strain at Pu (εu = δu/L) versus t to see the
effect of cross-sectional shape on the deformation capacity of hollow tubular stub
columns. It can be seen that NRSs have notably better deformation capacity compared to
the representative square section, with +-shape section estimating a much higher
deformation capacity. The reason may be due to delay in the local buckling provided by
the NRSs, thus providing a substantial strain hardening before failure giving a much
higher εu (see Figure 3.9). Also, the deformation capacity increases with increasing
thickness for all the hollow tubular stub columns analysed.
3.5.6 Comparison with design codes
The FE results for the LDSS hollow tubular stub columns are given in this chapter, where
comparison is made between all the available FE results and predicted cross-section
resistances according to EN 1993-1-4 (2006) and ASCE 8-02 (2002) specifications. A
sample cross-sectional resistance calculation of a square hollow tubular stub column with
the two design standards is given in Appendix A. The design based on the current
existing design specifications are given only for stainless steel material and hence their
applicability on LDSS is discussed through comparison with the FE results analyses.
TH-1259_09610405
CHAPTER 3 - NUMERICAL MODELLING OF LDSS HOLLOW STUB
COLUMNS
51
3.5.6.1 Effective area determination
The current study comprises of two classes of cross-sectional slenderness for the hollow
tubular stub columns considered viz., Class 3 and Class 4 sections as per EN 1993-1-
4(2006). For Class 3 sections, no deduction in the material cross-sectional area is made
(i.e. Ag is considered) in the calculation of axial strengths of the column. However, for
Class 4 sections, effective area (Ae) of the cross-section is used to account for the
reduction in the resistance due to the effects of local buckling. Cross-section slenderness
of a given section is calculated by c/tε, where for Class 3 (c/tε ≤ 30.70) and Class 4 (c/tε >
30.70). Here, c is the flat element width (see Figure 3.16), t is the element thickness and
5.0
0
210000
235
E
f y
, fy is the material yield stress.
For sections lying under Class 4, effective area (Ae) is to be calculated using the
following Equation 3.3.
)( esge BctnAA (3.3)
where ns is number of sides of the column and Be is the effective width (Be = ρc). The
expressions used for computing the reduction factor (ρ) for local buckling by EN 1993-1-
4 (2006) and ASCE 8-02 (2002) is given in Equation 3.4 & 3.5, respectively.
2
125.0772.0
pp but ≤ 1.0 (3.4)
2
22.01
but ≤ 1.0 (3.5)
where p and λ are the element slenderness as defined EN1993-1-4 (2006) and ASCE 8-
02 2002), and given by Equation 3.6 & 3.7, respectively.
k
t
c
p
4.28
(3.6)
TH-1259_09610405
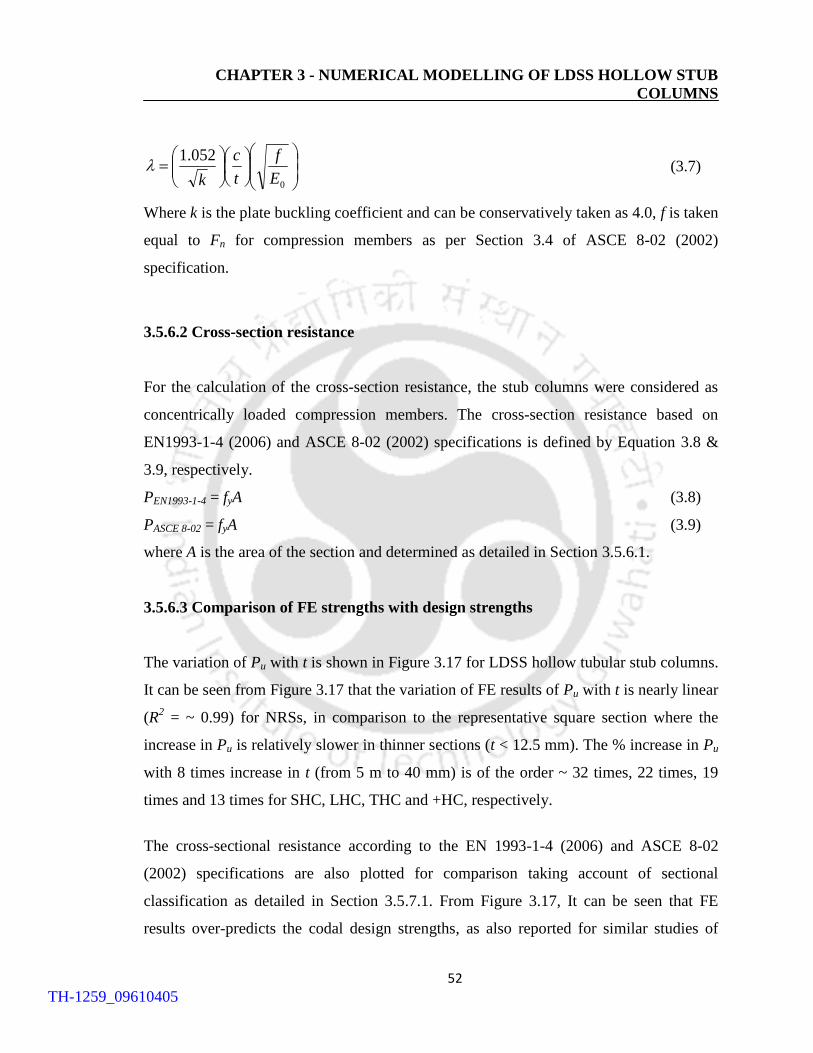
CHAPTER 3 - NUMERICAL MODELLING OF LDSS HOLLOW STUB
COLUMNS
52
0
052.1
E
f
t
c
k (3.7)
Where k is the plate buckling coefficient and can be conservatively taken as 4.0, f is taken
equal to Fn for compression members as per Section 3.4 of ASCE 8-02 (2002)
specification.
3.5.6.2 Cross-section resistance
For the calculation of the cross-section resistance, the stub columns were considered as
concentrically loaded compression members. The cross-section resistance based on
EN1993-1-4 (2006) and ASCE 8-02 (2002) specifications is defined by Equation 3.8 &
3.9, respectively.
PEN1993-1-4 = fyA (3.8)
PASCE 8-02 = fyA (3.9)
where A is the area of the section and determined as detailed in Section 3.5.6.1.
3.5.6.3 Comparison of FE strengths with design strengths
The variation of Pu with t is shown in Figure 3.17 for LDSS hollow tubular stub columns.
It can be seen from Figure 3.17 that the variation of FE results of Pu with t is nearly linear
(R2 = ~ 0.99) for NRSs, in comparison to the representative square section where the
increase in Pu is relatively slower in thinner sections (t < 12.5 mm). The % increase in Pu
with 8 times increase in t (from 5 m to 40 mm) is of the order ~ 32 times, 22 times, 19
times and 13 times for SHC, LHC, THC and +HC, respectively.
The cross-sectional resistance according to the EN 1993-1-4 (2006) and ASCE 8-02
(2002) specifications are also plotted for comparison taking account of sectional
classification as detailed in Section 3.5.7.1. From Figure 3.17, It can be seen that FE
results over-predicts the codal design strengths, as also reported for similar studies of
TH-1259_09610405
CHAPTER 3 - NUMERICAL MODELLING OF LDSS HOLLOW STUB
COLUMNS
53
LDSS hollow tubular stub column with square sections in the literatures (Theofanous and
Gardner, 2009; Huang and Young, 2013).
For stocky sections both the specification predicts similar strengths due to the fact that
the calculation of the cross-section resistance for both the specifications (Equations 3.8
and 3.9) is based on the gross area, thus giving similar prediction. It is seen that for
stocky sections (t ~ > 20 mm), FE strengths over predicts the codal strengths by about 28
% for all the section studied. This may be related to the hollow tubular stub column tests
approximately reaching the ultimate strength of the material, whereas the design strengths
were calculated based on the σ0.2 of the LDSS material.
For slender sections, at lower thicknesses of the steel tube (t ~ < 20 mm), FE strengths
over predicts the European specification, EN 1993-1-4 (2006), by 28 %, 26 %, 21 % and
23 % for SHC, LHC, THC and +HC, respectively, and American specification, ASCE 8-
02 (2002), by 5%, 6%, 9% and 17 % for SHC, LHC, THC and +HC, respectively. The
difference in the values of cross-sectional resistance calculated by the two codal
specifications for slender sections is related to the way the code takes care of the
reduction in the resistance due to local buckling by calculating Ae as mentioned in
Section 3.5.7.1. Based on the FE studies it can be inferred that, for slender sections, the
American specification provides closer values as compared to the European specification,
thus, providing a significant material saving through design by the American
specification for slender sections.
3.5.6.4 Reliability analysis of the codes
In order to compare and assess the relative reliability inherent in the current stainless steel
design codes to LDSS hollow tubular columns, such as, EN 1993-1-4 (2006) and ASCE
8-02 (2002), which is not covered in the current design specification, reliability analysis
was carried out based on the FE studies.
TH-1259_09610405
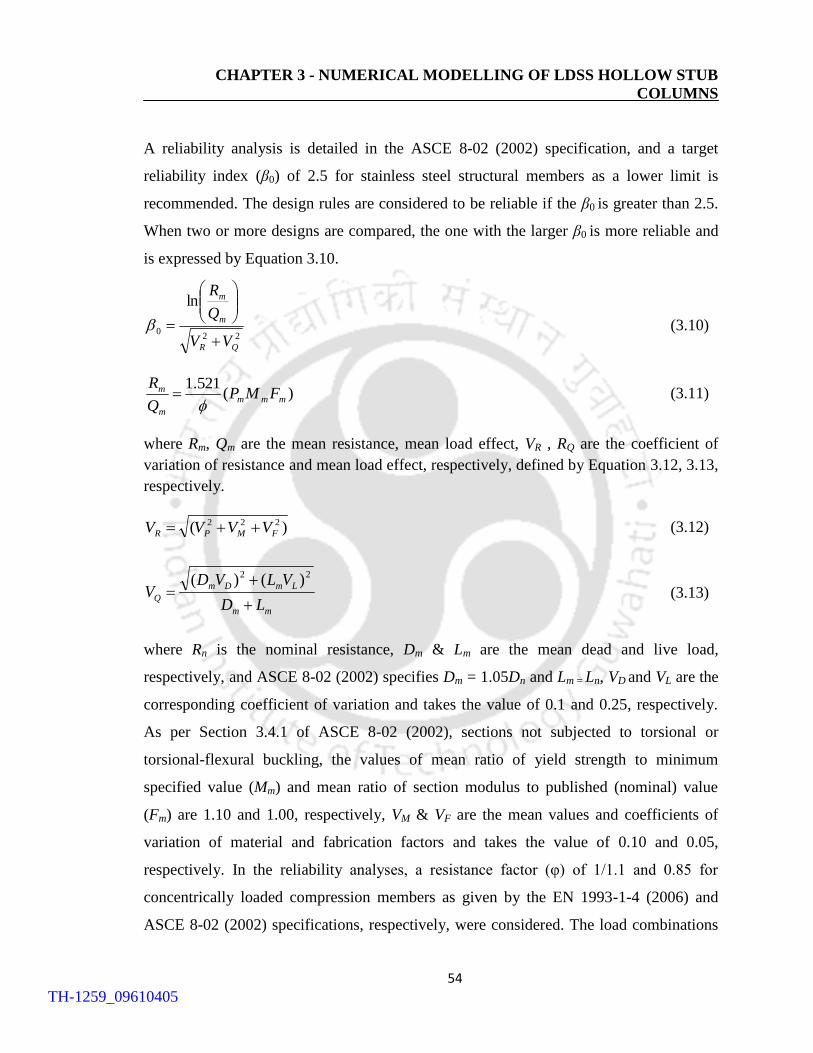
CHAPTER 3 - NUMERICAL MODELLING OF LDSS HOLLOW STUB
COLUMNS
54
A reliability analysis is detailed in the ASCE 8-02 (2002) specification, and a target
reliability index (β0) of 2.5 for stainless steel structural members as a lower limit is
recommended. The design rules are considered to be reliable if the β0 is greater than 2.5.
When two or more designs are compared, the one with the larger β0 is more reliable and
is expressed by Equation 3.10.
220
ln
QR
m
m
VV
Q
R
(3.10)
)(521.1
mmm
m
m FMPQ
R
(3.11)
where Rm, Qm are the mean resistance, mean load effect, VR , RQ are the coefficient of
variation of resistance and mean load effect, respectively, defined by Equation 3.12, 3.13,
respectively.
)( 222
FMPR VVVV (3.12)
mm
LmDm
QLD
VLVDV
22 )()( (3.13)
where Rn is the nominal resistance, Dm & Lm are the mean dead and live load,
respectively, and ASCE 8-02 (2002) specifies Dm = 1.05Dn and Lm = Ln, VD and VL are the
corresponding coefficient of variation and takes the value of 0.1 and 0.25, respectively.
As per Section 3.4.1 of ASCE 8-02 (2002), sections not subjected to torsional or
torsional-flexural buckling, the values of mean ratio of yield strength to minimum
specified value (Mm) and mean ratio of section modulus to published (nominal) value
(Fm) are 1.10 and 1.00, respectively, VM & VF are the mean values and coefficients of
variation of material and fabrication factors and takes the value of 0.10 and 0.05,
respectively. In the reliability analyses, a resistance factor (φ) of 1/1.1 and 0.85 for
concentrically loaded compression members as given by the EN 1993-1-4 (2006) and
ASCE 8-02 (2002) specifications, respectively, were considered. The load combinations
TH-1259_09610405

CHAPTER 3 - NUMERICAL MODELLING OF LDSS HOLLOW STUB
COLUMNS
55
used are 1.35Dn + 1.5Ln and 1.2Dn + 1.6Ln for EN 1993-1-4 (2006) and ASCE 8-02
(2002) specifications, respectively, where DL is the dead load and LL is the live load.
Mean value (Pm) and coefficient of variation (Vp) of FE-to-codal load ratios are tabulated
in Table 3.3 along with β0 considering both the specifications.
Based on the reliability analyses it can be seen that, both the codes show β0 ≥ 2.5 when
compared with the present FE results. Considering the lower limit of β0 = 2.5 suggested
by ASCE 8-02 (2002) specification for structural members, it can be inferred that both
specifications can be adopted for all the design of LDSS hollow tubular stub columns.
However, for LDSS hollow tubular stub columns, design based on the European
specification tends to be slightly more reliable compared to the American specification,
except for +-shape section, where the American specification tends to be more reliable.
3.8 CONCLUSIONS
Finite element analyses of LDSS hollow tubular stub columns with NRSs and
representative square section for various thicknesses are presented using Abaqus (2009),
to understand the cross-sectional shape effects on the load and deformation capacity.
Based on the study following conclusions are identified:
1) As the section goes from square → L → T → +-shape (i.e number of sides in a section
increases), more effective the section becomes in controlling local buckling due to
increase in the stiffness of the section.
2) For NRSs, there is approximately a linear increase of Pu with increasing LDSS tube
thicknesses, whereas, for the representative square section, a milder increase of Pu is
seen at lower thickness and linear increase at higher LDSS tube thicknesses.
TH-1259_09610405

CHAPTER 3 - NUMERICAL MODELLING OF LDSS HOLLOW STUB
COLUMNS
56
3) For LDSS tube thickness < 30 mm, NRSs shows a higher strength capacity compared
to the representative square section, with +-shaped section having the highest
strengths. However at LDSS tube thicknesses ≥ 30 mm, all the sections considered
gave similar strengths.
4) For changes in the cross-sectional shape from square to + shape, the increase in Pu are
~ 136%, 109%, 72%, 26%, 9% for 5mm, 10, mm, 15 mm, 20 mm and 25 mm,
respectively, showing that the increase in Pu is more effective at thinner sections.
5) The gain in Pu with change in the cross-sectional shape from square to L, T and +-
shape are in the range 120%-150%, 130%-170%, 140%-230%, respectively, at lower
thicknesses of the steel tube (< 20 mm). Thus, it can be seen that by switching over to
+ shape sections, significant gain in ultimate strength can be obtained for all the
thicknesses considered, with thinner sections giving more pronounced gain.
6) NRSs have notably better deformation capacity compared to the representative square
section, with +-shape section estimating a much higher deformation capacity. Also,
the deformation capacity increases with increasing thickness for all the hollow tubular
stub columns analysed.
7) Both the current design specifications are generally capable of predicting the LDSS
hollow tubular column strengths. For stocky sections, FE strengths over predicts both
the codal strengths (European and American specifications) by about 28 % for all the
section studied. For slender sections, at lower thicknesses of the steel tube (i.e t ~ < 20
mm), FE strengths over predicts the European specification by 28 %, 26 %, 21 % and
23 % for SHC, LHC, THC and +HC, respectively, and American specification by 5%,
6%, 9% and 17 % for SHC, LHC, THC and +HC, respectively. Based on the FE
studies it can be inferred that, for slender sections, the American specification
provides closer values as compared to the European specification, thus, providing a
significant material saving through design by the American specification.
TH-1259_09610405

CHAPTER 3 - NUMERICAL MODELLING OF LDSS HOLLOW STUB
COLUMNS
57
8) Based on the reliability analyses it can be inferred that both specifications can be
adopted for all the design of LDSS hollow tubular stub columns. However, for LDSS
hollow tubular stub columns, design based on European specification tends to be
slightly more reliable compared to the American specification, except for +-shape
section, where the American specification tends to be more reliable.
TH-1259_09610405
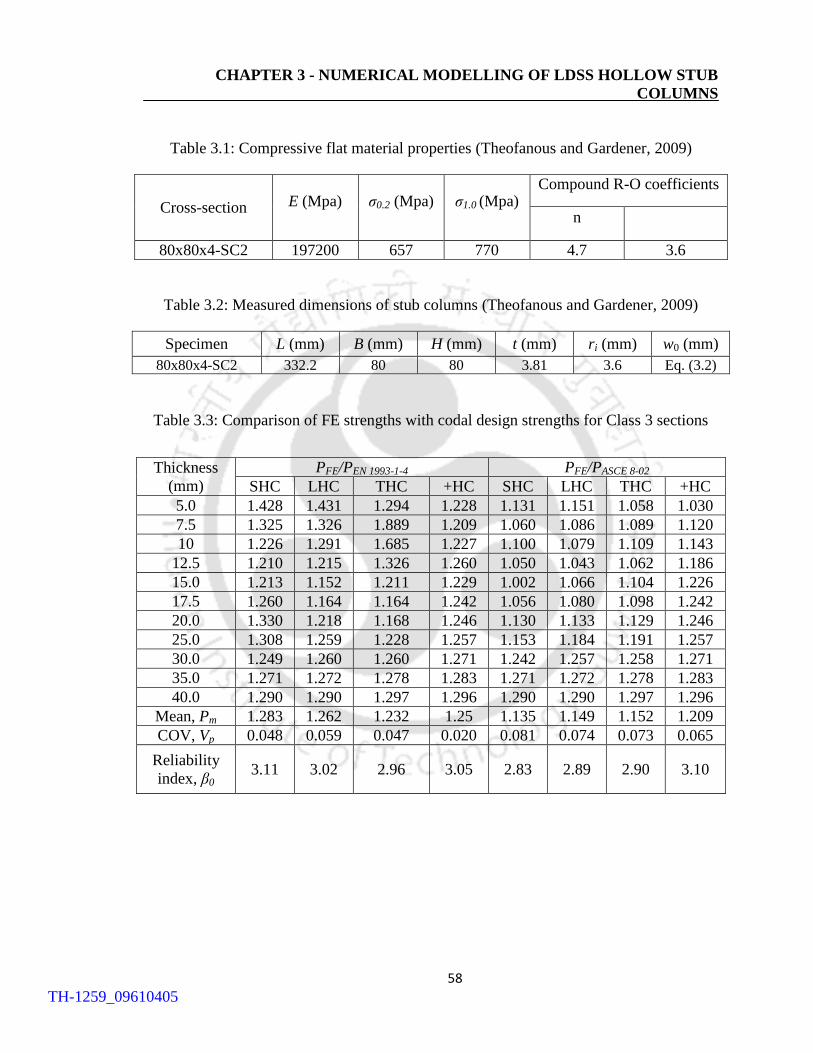
CHAPTER 3 - NUMERICAL MODELLING OF LDSS HOLLOW STUB
COLUMNS
58
Table 3.1: Compressive flat material properties (Theofanous and Gardener, 2009)
Cross-section E (Mpa) σ0.2 (Mpa) σ1.0 (Mpa) Compound R-O coefficients
n
80x80x4-SC2 197200 657 770 4.7 3.6
Table 3.2: Measured dimensions of stub columns (Theofanous and Gardener, 2009)
Specimen L (mm) B (mm) H (mm) t (mm) ri (mm) w0 (mm)
80x80x4-SC2 332.2 80 80 3.81 3.6 Eq. (3.2)
Table 3.3: Comparison of FE strengths with codal design strengths for Class 3 sections
Thickness
(mm)
PFE/PEN 1993-1-4 PFE/PASCE 8-02
SHC LHC THC +HC SHC LHC THC +HC
5.0 1.428 1.431 1.294 1.228 1.131 1.151 1.058 1.030
7.5 1.325 1.326 1.889 1.209 1.060 1.086 1.089 1.120
10 1.226 1.291 1.685 1.227 1.100 1.079 1.109 1.143
12.5 1.210 1.215 1.326 1.260 1.050 1.043 1.062 1.186
15.0 1.213 1.152 1.211 1.229 1.002 1.066 1.104 1.226
17.5 1.260 1.164 1.164 1.242 1.056 1.080 1.098 1.242
20.0 1.330 1.218 1.168 1.246 1.130 1.133 1.129 1.246
25.0 1.308 1.259 1.228 1.257 1.153 1.184 1.191 1.257
30.0 1.249 1.260 1.260 1.271 1.242 1.257 1.258 1.271
35.0 1.271 1.272 1.278 1.283 1.271 1.272 1.278 1.283
40.0 1.290 1.290 1.297
1.294
1.272
1.277
1.195
1.146
1.137
1.168
1.228
1.260
1.278
1.297
1.296 1.290 1.290 1.297 1.296
Mean, Pm 1.283 1.262 1.232 1.25 1.135 1.149 1.152 1.209
COV, Vp 0.048 0.059 0.047 0.020 0.081 0.074 0.073 0.065
Reliability
index, β0 3.11 3.02 2.96 3.05 2.83 2.89 2.90 3.10
TH-1259_09610405
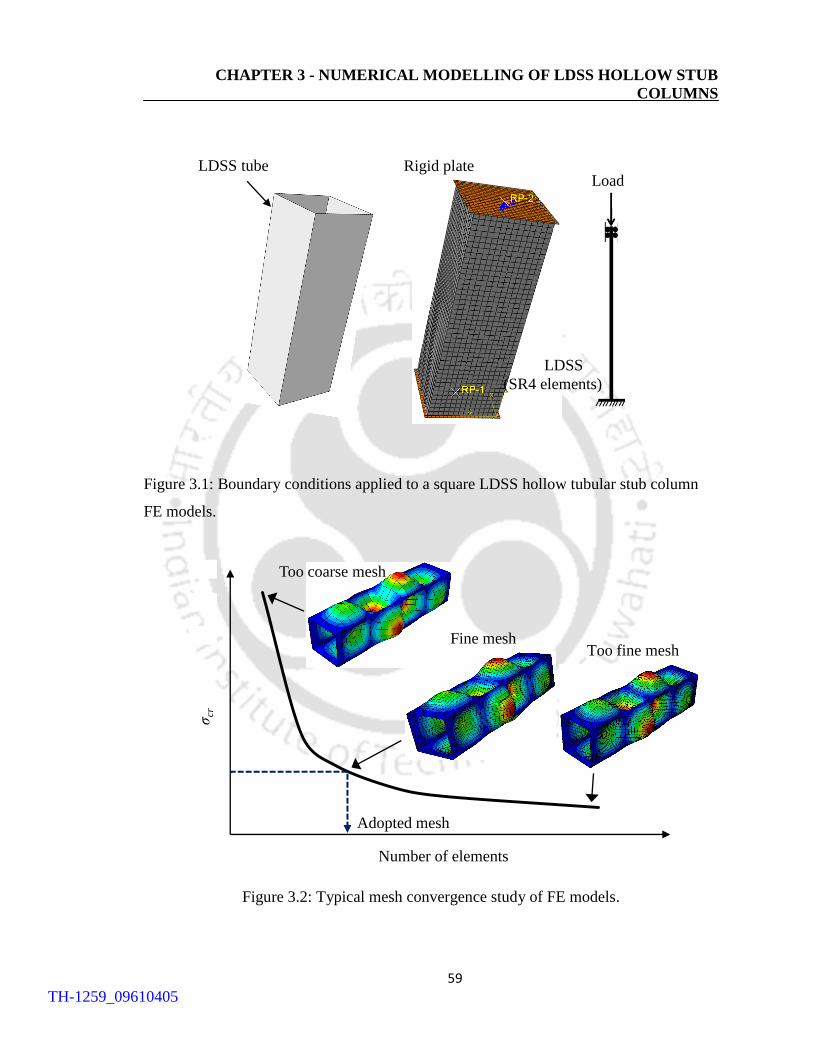
CHAPTER 3 - NUMERICAL MODELLING OF LDSS HOLLOW STUB
COLUMNS
59
Figure 3.1: Boundary conditions applied to a square LDSS hollow tubular stub column
FE models.
Figure 3.2: Typical mesh convergence study of FE models.
1.80
1.82
1.84
1.86
1.88
1.90
1.92
1.94
1.96
0 2000 4000 6000 8000 10000
σcr
Number of elements
Too coarse mesh
Fine mesh Too fine mesh
Adopted mesh
LDSS
(SR4 elements)
Load Rigid plate LDSS tube
TH-1259_09610405
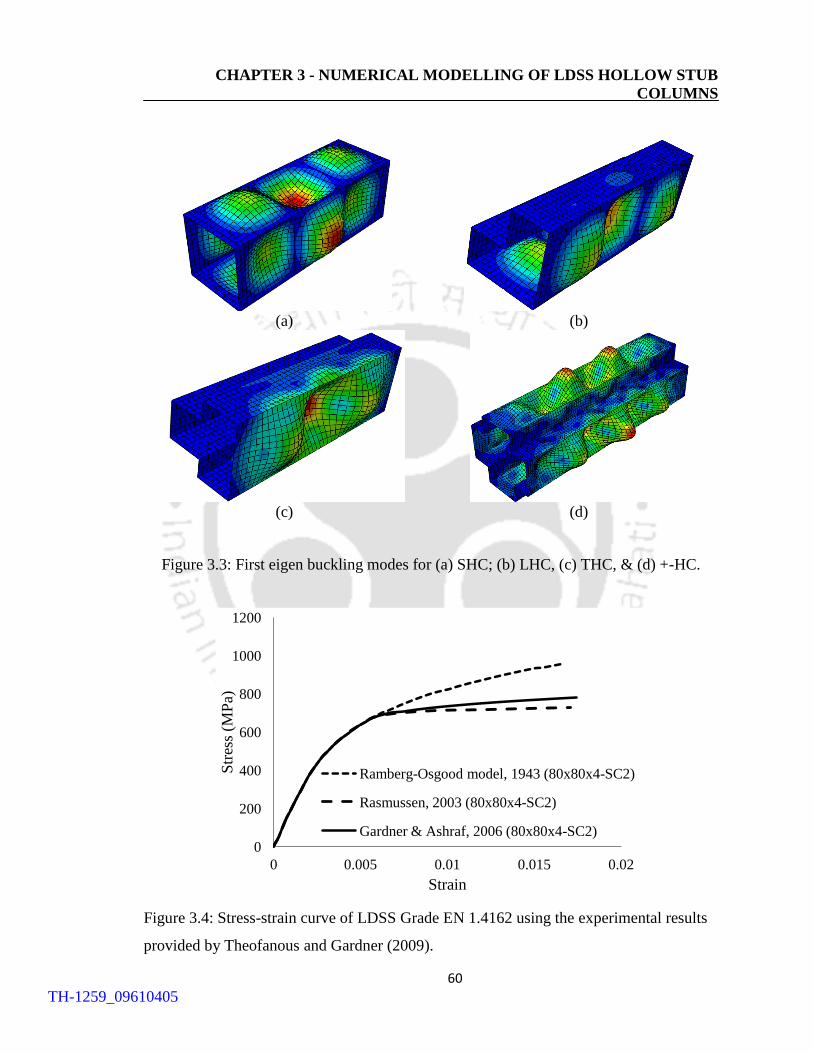
CHAPTER 3 - NUMERICAL MODELLING OF LDSS HOLLOW STUB
COLUMNS
60
(a) (b)
(c) (d)
Figure 3.3: First eigen buckling modes for (a) SHC; (b) LHC, (c) THC, & (d) +-HC.
Figure 3.4: Stress-strain curve of LDSS Grade EN 1.4162 using the experimental results
provided by Theofanous and Gardner (2009).
0
200
400
600
800
1000
1200
0 0.005 0.01 0.015 0.02
Str
ess
(MP
a)
Strain
Ramberg-Osgood model, 1943 (80x80x4-SC2)
Rasmussen, 2003 (80x80x4-SC2)
Gardner & Ashraf, 2006 (80x80x4-SC2)
TH-1259_09610405

CHAPTER 3 - NUMERICAL MODELLING OF LDSS HOLLOW STUB
COLUMNS
61
Figure 3.5: Typical FE deformed shape of 80 X 80 X 4-SC2.
Figure 3.6: Variation of P with δ for 80x80x4-SC2.
0
200
400
600
800
1000
0 2 4 6 8
P (
kN
)
δ (mm)
Exp (80x80x4-SC2) - Theofanous and Gardner, 2009
Ramberg-Osgood model-(80x80x4-SC2)
Rasmussen model-(80x80x4-SC2)
Gardner & Ashraf model-(80x80x4-SC2)
Pu
δu
Local buckling
TH-1259_09610405

CHAPTER 3 - NUMERICAL MODELLING OF LDSS HOLLOW STUB
COLUMNS
62
(a) SHC (b) LHC (c) THC (d)+HC
Figure 3.7: Specimen cross-sections of (a) square and (b - d) NRSs.
600 mm
t
600 m
m
300 mm
t
300 m
m
300 mm
3
00 m
m
t
600 mm
mm
600 m
m
300 mm
300 m
m
600 mm
t
TH-1259_09610405
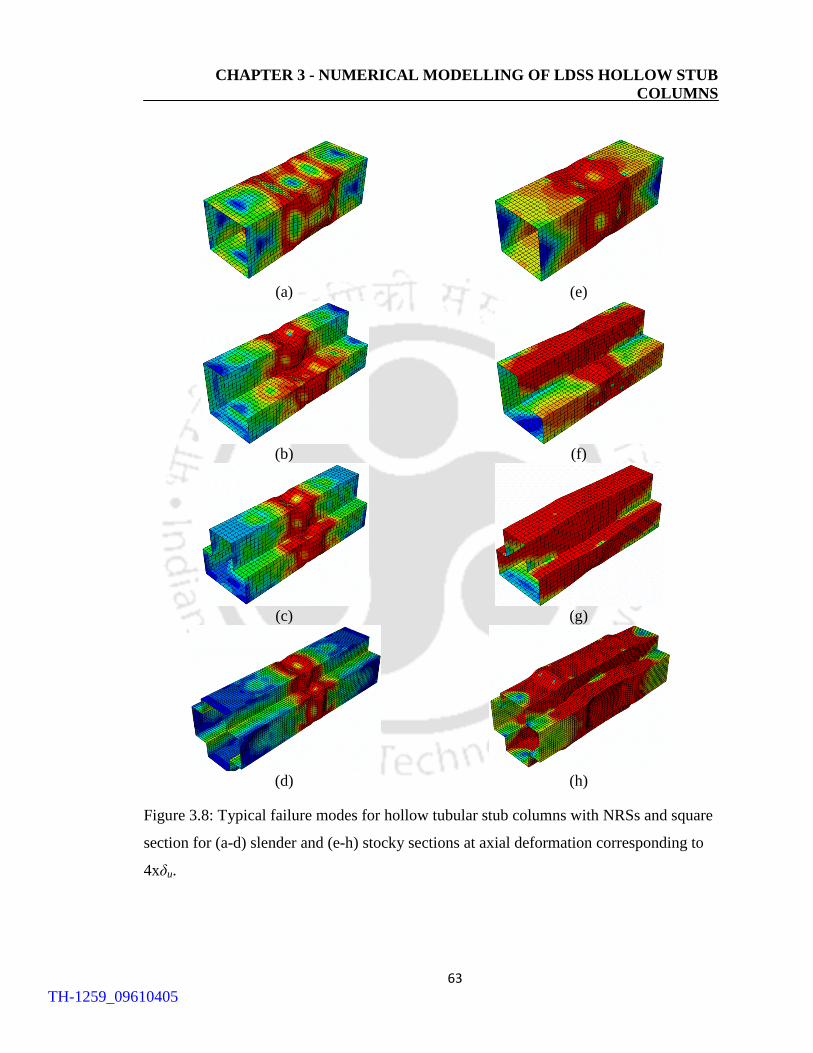
CHAPTER 3 - NUMERICAL MODELLING OF LDSS HOLLOW STUB
COLUMNS
63
(a) (e)
(b) (f)
(c) (g)
(d) (h)
Figure 3.8: Typical failure modes for hollow tubular stub columns with NRSs and square
section for (a-d) slender and (e-h) stocky sections at axial deformation corresponding to
4xδu.
TH-1259_09610405

CHAPTER 3 - NUMERICAL MODELLING OF LDSS HOLLOW STUB
COLUMNS
64
Figure 3.9: Variation of P/Agfy with δ for hollow tubular stub columns with NRSs and
representative square section.
0
0.2
0.4
0.6
0.8
1
1.2
1.4
0 10 20 30 40 50
Pn
om
δ (mm)
SHC
LHC
THC
+HC
SHC
LHC
THC
+HC
t =
5 m
m
t =
20
mm
TH-1259_09610405

CHAPTER 3 - NUMERICAL MODELLING OF LDSS HOLLOW STUB
COLUMNS
65
Figure 3.10: Effect of cross-sectional shape on the load capacity of hollow tubular stub
columns.
Figure 3.11: Variation of Pu with cross-sectional shapes.
0
20000
40000
60000
80000
0 10 20 30 40 50
Pu (
kN
)
t (mm)
SHC
LHC
THC
+HC
0
10000
20000
30000
40000
50000
60000
70000
80000
90000
0 1 2 3 4
Pu (
kN
)
Cross-sectional shape
5.0 mm
7.5 mm
10.0 mm
12.5 mm
15.0 mm
17.5 mm
20.0 mm
25.0 mm
30.0 mm
35.0 mm
40.0 mm
SHC LHC +HC THC
TH-1259_09610405
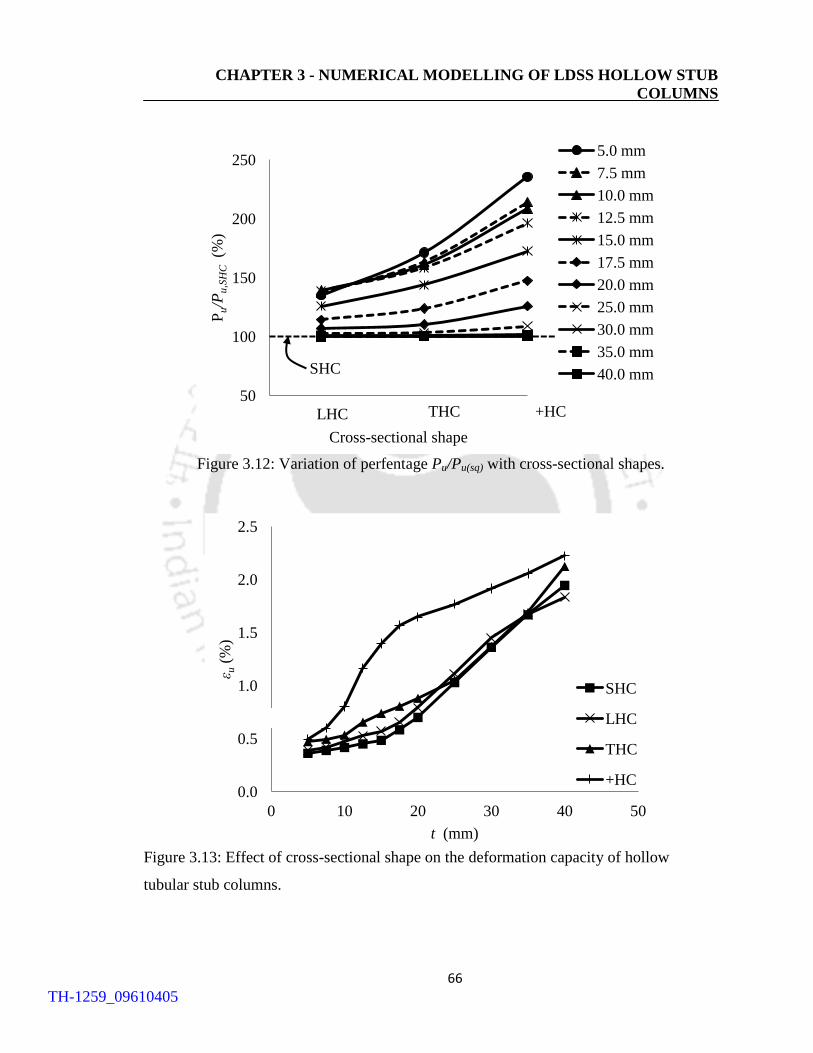
CHAPTER 3 - NUMERICAL MODELLING OF LDSS HOLLOW STUB
COLUMNS
66
Figure 3.12: Variation of perfentage Pu/Pu(sq) with cross-sectional shapes.
Figure 3.13: Effect of cross-sectional shape on the deformation capacity of hollow
tubular stub columns.
50
100
150
200
250
0.5 1.5 2.5
Pu/P
u,S
HC (%
)
Cross-sectional shape
5.0 mm
7.5 mm
10.0 mm
12.5 mm
15.0 mm
17.5 mm
20.0 mm
25.0 mm
30.0 mm
35.0 mm
40.0 mm
LHC THC +HC
SHC
0.0
0.5
1.0
1.5
2.0
2.5
0 10 20 30 40 50
ε u (
%)
t (mm)
SHC
LHC
THC
+HC
TH-1259_09610405
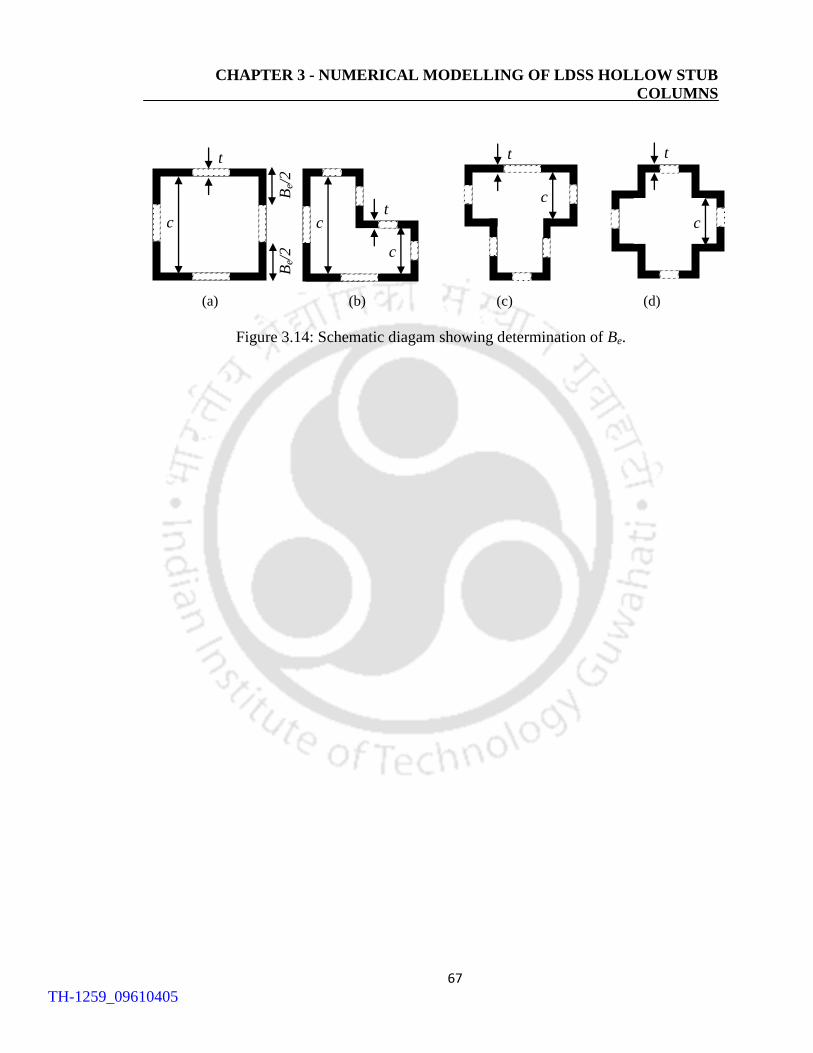
CHAPTER 3 - NUMERICAL MODELLING OF LDSS HOLLOW STUB
COLUMNS
67
Figure 3.14: Schematic diagam showing determination of Be.
(a) (b) (c) (d)
c
t c
c
t
c
t
c
Be/
2
Be/
2
t
TH-1259_09610405
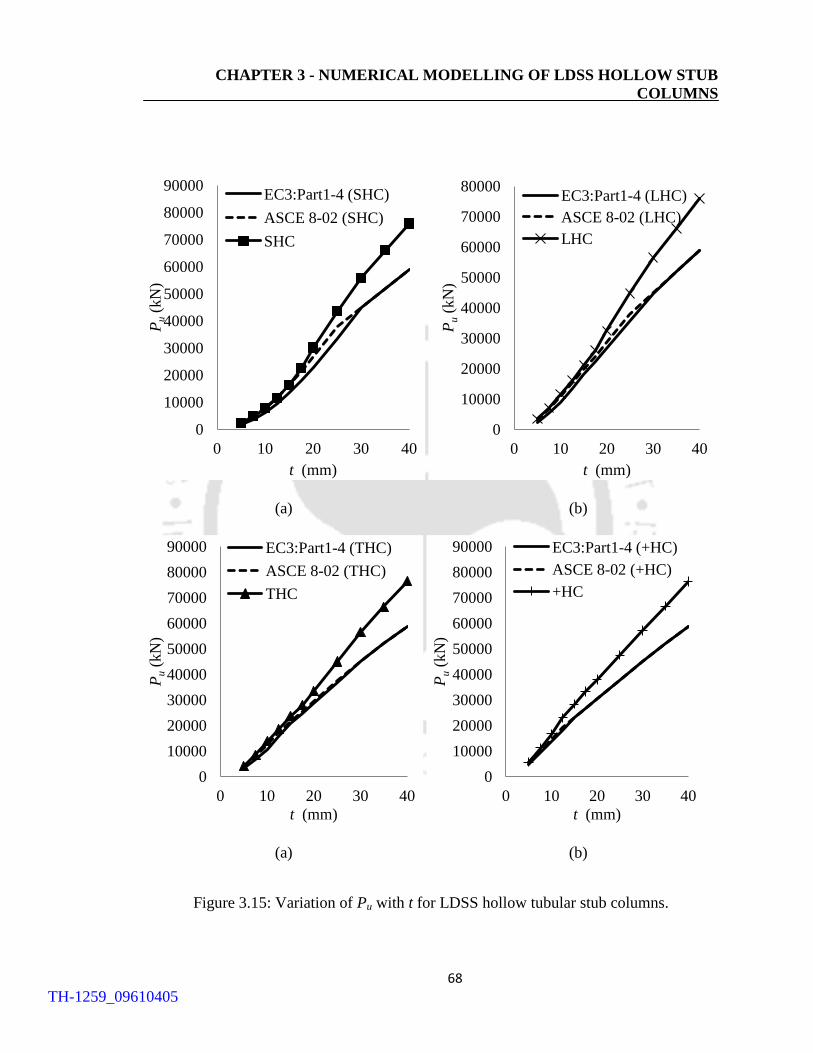
CHAPTER 3 - NUMERICAL MODELLING OF LDSS HOLLOW STUB
COLUMNS
68
(a) (b)
(a) (b)
Figure 3.15: Variation of Pu with t for LDSS hollow tubular stub columns.
0
10000
20000
30000
40000
50000
60000
70000
80000
90000
0 10 20 30 40
Pu (
kN
)
t (mm)
EC3:Part1-4 (SHC)
ASCE 8-02 (SHC)
SHC
0
10000
20000
30000
40000
50000
60000
70000
80000
0 10 20 30 40 P
u (
kN
)
t (mm)
EC3:Part1-4 (LHC)
ASCE 8-02 (LHC)
LHC
0
10000
20000
30000
40000
50000
60000
70000
80000
90000
0 10 20 30 40
Pu (
kN
)
t (mm)
EC3:Part1-4 (THC)
ASCE 8-02 (THC)
THC
0
10000
20000
30000
40000
50000
60000
70000
80000
90000
0 10 20 30 40
Pu (
kN
)
t (mm)
EC3:Part1-4 (+HC)
ASCE 8-02 (+HC)
+HC
TH-1259_09610405
69
CHAPTER 4
NUMERICAL MODELLING OF LEAN DUPLEX
STAINLESS STEEL HOLLOW SLENDER
COLUMNS
4.1 INTRODUCTION
In the previous chapter, FE analyses on the structural behavior of LDSS hollow tubular
stub columns of NRSs and representative square section was performed. This chapter
presents an extension of the studies to fixed-ended hollow tubular slender columns
employing FE approach. Two classes of cross-sections, such as Class 3 & 4 sections, as
per EN 1993-1-4 (2006) codal provision were considered for studying the variations in
buckling strength of varying cross-sectional shapes (keeping equal material cross-
sectional areas or equal material consumption), over a range of column lengths involving
both local buckling and global flexural buckling. The applicability of the currently
available design standards for stainless steel, such as the European specification (EN
1993-1-4, 2006) and the American specification (ASCE 8-02, 2002) in the design of
LDSS hollow tubular stub columns was assessed based on the FE studies. Reliability
analysis of the design standards was also carried out based on the FE studies.
TH-1259_09610405
CHAPTER 4 - NUMERICAL MODELLING OF LDSS HOLLOW SLENDER
COLUMNS
70
4.2 FE MODELLING
LDSS material stress-strain curve developed through Gardner and Ashraf (2006) model
(as discussed in Section 3.3) was further used in the FE analyses of fixed-ended LDSS
hollow tubular slender columns, which was found to give the best agreement through
validation with an expermintal test performed on hollow tubular stub column by
Thefanous and Gardner (2009). The following sub-sections presents various details for
achieving a reliable FE model representation of LDSS hollow tubular slender columns as
also followed by several researchers.
4.2.1 Boundary conditions and analysis technique
The boundary conditions for the fixed-ended LDSS hollow tubular slender columns are
similar to that followed for the stub columns (as detailed in Section 3.2.1), whereby the
ends are fixed while the top loaded part is allowed to have free vertical translation, and
also followed by other researcher for fixed-ended hollow tubular slender columns (e.g.
Lui and Young, 2003; Ellobody, 2007; Ellobody and Young, 2005) (see Figure 4.1).
Similar analyses technique as that detailed in Section 3.2.1, in which elastic linear
analysis technique was employed for obtaining the relevant eigenmodes and the modified
RIKS method for further nonlinear analyses of the FE models was followed.
4.2.2 FE mesh
As discussed in Section 3.2.2, S4R elements were employed to discretize the slender
column FE models. The aspect ratios of the elements are kept at ~ 1.0 in all the FE
models. Similar approach of mesh convergence study by monitoring the σcr as detailed in
Section 3.2.2 was followed in achieving a suitable mesh for further nonlinear analysis of
hollow tubular slender columns.
TH-1259_09610405

CHAPTER 4 - NUMERICAL MODELLING OF LDSS HOLLOW SLENDER
COLUMNS
71
4.2.3 Initial geometric imperfections
Linear elastic analysis technique was initially performed on the fixed-ended hollow
tubular slender column FE models to extract both local and global buckling mode shapes.
The first (i.e. lowest) local and global buckling mode shapes are then utilised as initial
geometric imperfections pattern to perturb the geometry of the slender columns as also
followed by several researchers (e.g. Ellobody, 2007; Ellobody and Young, 2005). For
slender columns superposition of the two provided the final imperfection pattern. The
lowest local and global buckling modes generally appeared in the first few eigen modes.
Typical first global and local eigenmodes for the hollow tubular slender columns of
NRSs and the representative square section are shown in Figure 4.2.
The magnitude of the local geometric imperfection is taken equal to ω0 as discussed in
Section 3.2.4. As discussed in Section 2.7.2, there is no clear cut evidence on the basis for
selection of an appropriate value of initial out-of-straightness pertaining to hollow tubular
columns. Thus, in the current study, the initial out-of-straightness for the fixed-ended
column was assumed to be same as that of the experimental tests conducted by
Theofanous and Gardner (2009) for pinned-ended LDSS hollow tubular columns, which
is a fraction of L of the order of L/1500. This imperfection magnitude was applied at the
mid-height of the column in the plane of the weaker principal axis for all the fixed-ended
hollow tubular slender columns studied.
4.3 VERIFICATION OF THE FE MODELS
Development of the FE models for fixed-ended LDSS hollow tubular slender columns
was similar to that of the hollow tubular stub columns as discussed in Chapter 3. Models
included predicted material properties and initial plate imperfections as described in
Section 4.2.3. In order to validate the FE analyses approach in predicting the behaviors of
fixed-ended LDSS hollow tubular slender columns, experimental test conducted by
TH-1259_09610405
CHAPTER 4 - NUMERICAL MODELLING OF LDSS HOLLOW SLENDER
COLUMNS
72
Theofanous and Gardner (2009) on pinned-ended hollow tubular columns with three
different lengths was considered as the benchmark. Figure 4.3 shows a variation of Pu
with effective length (Le) for a pinned-ended columns from experimental (Theofanous
and Gardner, 2009) as well as FE results. It can be seen that the present modelling
approach is able to achieve good agreement with the experimental values, for Le varying
from 300 mm to 2000 mm. As a result, the verification ensures the accuracy of
simulating the slender LDSS columns with a high degree of confidence. Figure 4.4 shows
a typical experimental (Theofanous and Gardner, 2009) and FE failure mode for a
pinned-ended slender column with a square section. It can be seen from Figure 4.4 that
the experimental and FE model failure mode is also similar.
4.4 HOLLOW TUBULAR SLENDER COLUMN MODELLING
4.4.1 Introduction
The behaviour of fixed-ended LDSS hollow tubular slender columns can be accurately
replicated using the described modelling techniques and assumptions (as detailed in
Section 4.2). This demonstrates the ability to predict the load and deformation capacities
of the fixed-ended LDSS hollow tubular slender columns. The chapter encompasses a
series of FE models to understand the structural behavior of fixed-ended hollow tubular
slender columns with NRSs and representative square section subjected to pure axial
compression. The effects of column lengths and cross-section thicknesses (i.e
encompassing Class 3 (stocky) and Class 4 (slender) sections) on the buckling strength of
these columns were analysed.
TH-1259_09610405
CHAPTER 4 - NUMERICAL MODELLING OF LDSS HOLLOW SLENDER
COLUMNS
73
4.4.2 Development of the FE models
A total of 56 fixed-ended LDSS hollow tubular slender column FE models of NRSs and
representative square sections with thicknesses of 5.25 mm and 2.0 mm, over a range of
column lengths viz., 3.0 - 10.0 m, which provided a range of non-dimensional member
slenderness ( ), defined through by Equation 4.1, in accordance with EN1993-1-4
(2006), from 0.05 to 3.16, were considered for the parametric studies.
s
Aye
Er
L
1 (4.1)
where, Le , r and βA are the effective length, radius of gyration of the gross cross-section,
and ratio of the effective cross-section area to the gross cross-section area. The two
thicknesses of 5.25 mm and 2.0 mm were chosen to represent Class 3 and Class 4
sections, respectively, as per EN 1993-1-4 (2006) codal provision (see Figure 4.5).
Similar labelling approach as mentioned in Section 3.4.2 is also followed for the fixed-
ended LDSS hollow tubular slender columns.
4.5 RESULTS AND DISCUSSION
4.5.1 Introduction
The results of the FE analyses for the fixed-ended LDSS hollow tubular slender columns
was presented in terms of the variations in buckling strength with changes in the column
lengths, cross-sectional shapes and thicknesses of the LDSS tubes (i.e involving Class 3
and Class 4 sections). The FE results was then compared with the design strengths
predicted by the EN1993-1-4 (2006) and ASCE 8-02 (2002) specifications. The
applicability and reliability of these codes on the design of fixed-ended LDSS hollow
tubular slender columns was also assessed based on the FE studies.
TH-1259_09610405
CHAPTER 4 - NUMERICAL MODELLING OF LDSS HOLLOW SLENDER
COLUMNS
74
4.5.2 Deformed shapes of NRSs and square section
Figures 4.6 and 4.7 show Von-Mises stress (superimposed on deformed shape) at Pu for
Class 3 and Class 4 NRSs and representative square section for L = 300 mm. For this
particular length considered in Figure 4.6, it can be seen that the four sections i.e., square,
L-, T-, and +-shape are all uniformly stressed without noticeable signs of local buckling.
However for slender sections, i.e. t = 2.0 mm (Class 4 sections), the onset of local
buckling modes at ultimate load could be seen for SHC, LHC and THC, whereas it is
uniformly stressed for the +HC (see Figure 4.7).
The deformed shapes corresponding to 2xδu are shown in Figures 4.8 and 4.9 for Class 3
and Class 4 sections, respectively, where, the appearances of post-ultimate local buckling
are seen. As compared to Class 3 sections, the corresponding cross-section types with
Class 4 sections showed larger distressed surface areas. This may be related to earlier
occurrence of local buckling in slender sections (Class 4) as compared to that of stocky
sections i.e. Class 3 sections.
Figure 4.10 shows typical Von-Mises stress variation superimposed on deformed shape
corresponding to axial deformation at 1.5xδu, for slender columns (L = 3000 mm). The
local buckling near the mid-height can be seen for all the sections analyzed. The slender
columns fails first by overall flexural buckling followed by local buckling at mid-height
of the column, irrespective of the cross-sectional shape considered, and is seen to be
typical for both the Class 3 and 4 sections. The direction for the flexural buckling of the
hollow tubular slender columns follows the lowest principal buckling axis (see Figure
4.10), whereby, square, T-, and +-shape sections buckles in the y-y direction and L-shape
section buckles in the x-y direction. The flexural buckling axes are based on the
limitations of the cross-sectional dimensions considered in the current study (see Figure
4.5).
TH-1259_09610405

CHAPTER 4 - NUMERICAL MODELLING OF LDSS HOLLOW SLENDER
COLUMNS
75
4.5.3 Load-axial deformation profile
Figure 4.11 shows a typical variation of effect of column lengths on P versus δ curve for
hollow tubular columns with square section under Class 3 category. Since hollow tubular
slender columns with NRSs showed the same nature as those with a square section in
terms of the effect of lengths, no curves of NRSs were given. It can be observed from
Figure 4.11 that the buckling strength of fixed-ended hollow tubular slender columns
(both Class 3 and Class 4 sections) decreases with increasing lengths due to reduction in
the stiffness of the columns, with very slender columns failing by elastic instability
failure where the Pu is mainly dominated by flexural rigidity.
4.5.4 Buckling strength of NRSs and square section
4.5.4.1 Class 3 sections
Figure 4.12 shows the variation of Pu and Pu/ Pu,SHC with for Class 3 sections. It can be
seen from Figure 4.12a that FE analysis predicted a general trend of asymptotic decrease
of Pu with increasing . For ≤ 0.5 and at high , all the sections exhibit similar
structural capacities. The reason being, at lower , regardless of the cross-sectional
shapes, all the sections experiences hardening above the global yielding load (Agfy)
without any occurrences of local buckling at ultimate load; and the failure for high
slender columns are governed principally by member stiffness rather than the cross-
sectional shape.
However, for 0.5 < ≥ 2.0, there is a nearly linear variation in strengths (increasing trend
for +HC, similar trend for THC and decreasing trend for LHC), with stabilization beyond
> 2.0. For > 2.0, Pu for +HC showed ~ 30% higher; THC showed similar strength;
and LHC showed ~20% lower than the corresponding value for SHC, indicating that
+HC has an improved ultimate strength for all the ranges of (see Figure 4.12b). The
TH-1259_09610405

CHAPTER 4 - NUMERICAL MODELLING OF LDSS HOLLOW SLENDER
COLUMNS
76
reason for LHC showing lower flexural buckling strength may be related to the
unsymmetrical buckling of the L-shape section in the direction of x-y axis (as discussed
in Section 4.5.2), thereby, resulting in lesser bending stiffness of the column.
4.5.4.2 Class 4 sections
Figure 4.13 shows the variation of Pu and Pu/ Pu,SHC with for Class 4 sections. It can be
seen from Figure 4.13a that in contrast to Class 3 sections, cross-sectional shape becomes
increasingly significant with decreasing , which is due to the reduction in the local
buckling effect as the cross-section changes from S → L → T → +-shape. However, the
cross-sectional shape becomes insignificant for very high as also the case for Class 3
sections.
It is seen that the average strength enhancement (Pu/ Pu(SHC) > 100 %) as compared to the
representative square section are ~ 10 %, 50 %, and 90 % higher for LHC, THC, and
+HC, respectively (see Figure 4.13b). Hence, for fixed-ended columns with slender
cross-sections, NRSs gives better structural performances over those of the representative
square section.
4.5.5 Deformation capacity of NRSs and square section
4.5.5.1 Class 3 sections
Figure 4.14 shows the plot of εu (%) with for Class 3 sections. It can be observed from
Figure 4.14 that at lower < ~ 0.50, the values of εu are found to be highest for +HC,
whilst SHC, LHC and THC predicted similar values. However, at higher ≥ 0.50, εu
values lies in the range of ~ 0.2 – 0.6 % for all the section analysed.
TH-1259_09610405
CHAPTER 4 - NUMERICAL MODELLING OF LDSS HOLLOW SLENDER
COLUMNS
77
Figure 4.15 shows the plot of the plot of δu/δu,SHC (%) with for Class 3 sections. It can
be seen from Figure 4.15 that, at lower < ~ 0.50, +HC shows greater deformation at
peak load which decreased linearly and becomes similar to that of SHC beyond ~ 0.50.
The observed higher deformation in the case of +HC may be related to a hardening
process as a result of the interaction between neighboring faces, which occurs at post-
global yield load (Agfy) thereby delaying local buckling through enhanced member
stiffness.
4.5.5.2 Class 4 sections
Figure 4.16 shows the plot of variation of εu with for Class 4 sections. Similar to Class 3
(see Figure 4.14), +HC predicted higher deformation at peak load, as compared to SHC,
LHC and THC, at lower values of (< ~ 1.0). Similar to Class 3 sections, at higher
slenderness ( > ~ 1.0), εu values also lies in the range of ~ 0.2 – 0.5 % for all the section
analysed. This may again be related to higher values of δu for +HC at < ~ 1.0 associated
with corresponding possible stiffness enhancement via interaction between neighboring
faces, which occurs at post-global yielding load.
Figure 4.17 shows a comparison of δu/δu,SHC (%) with . From Figure 4.17, it can be
observed that in comparison to SHC, +HC showed higher deformation compared to SHC
at > ~ 1.0, which decreased linearly and approaches the SHC values beyond ~ 2.0.
Similar to Class 3 sections (see Figure 4.15), it can be seen that δu values for LHC and
THC are closer to SHC for all the ranges of considered.
4.5.6 Comparison with design codes
The results from the FE analyses were compared with the unfactored design strengths
predicted using the EN1993-1-4 (2006) and ASCE 8-02 (2002) specifications. A sample
TH-1259_09610405
CHAPTER 4 - NUMERICAL MODELLING OF LDSS HOLLOW SLENDER
COLUMNS
78
design strength calculation of a square hollow tubular stub column with the two design
standards is given in Appendix B. As the current design standards are based on stainless
steel material, the applicability of these codes in the design of LDSS hollow tubular
columns are assessed through the FE studies. A detail comparison between the FE results
and the design standard predictions are discussed in the following sub-sections.
4.5.6.1 Effective area determination
As mentioned in the previous sections, two classes of cross-sectional slenderness were
considered in the study viz., Class 3 and Class 4 sections as per EN 1993-1-4 (2006). For
Class 3 sections, no deduction in the material cross-sectional area is made (i.e. Ag is
considered) in the calculation of axial strengths of the column. However, for Class 4
sections, Ae of the cross-section is used to account for the reduction in the resistance due
to the effects of local buckling and detailed in Section 3.5.7.1.
4.5.6.2 Design strengths
Design strengths for the fixed-ended hollow tubular slender columns were also designed
as concentrically loaded compression members and Le was assumed to be L/2 as
recommended in the literatures. The design strengths based on the EN1993-1-4 (2006)
and ASCE 8-02 (2002) specifications are defined by Equation 4.2 and 4.3, respectively.
PEN1993-1-4 = χfyA (4.2)
PASCE 8-02 = Afn (4.3)
where;
0.1
15.0
22
(4.4)
2
015.0 (4.5)
TH-1259_09610405
CHAPTER 4 - NUMERICAL MODELLING OF LDSS HOLLOW SLENDER
COLUMNS
79
y
e
tn f
r
L
Ef
2
2 (4.6)
1
002.0
n
y
sy
sy
t
f
fnEf
EfE (4.7)
where, A is determined as detailed in Section 3.5.7.1, χ is the reduction factor to account
for flexural buckling, Et is the tangent modulus in compression corresponding to the
buckling stress, α and are the imperfection factor and limiting slenderness taken as
0.49 and 0.40, respectively, which were obtained from Table 5.2 of the EN1993-1-4
(2006) specification, n is the Ramberg-Osgood parameter, and f is the stress (fn) in the
member. ASCE 8-02 (2002) specification replaces the Es with the tangent modulus (Et),
in order to take account of the non-linearity of the stainless steel.
4.5.6.3 Comparison of FE strengths with design strengths
Figures 4.18 and 4.19 show a plot of Pnom with for Class 3 and Class 4 NRSs and
representative square section, respectively. For Class 3 and 4 sections, Ag and Ae,
respectively, were used in the normalization of Pu. The results from FE analyses were
compared with the unfactored design strengths predicted through the European and
American specifications.
From Figures 4.18 and 4.19, it is observed that, for both the Class 3 and Class 4 sections,
at lower (≤ 0.40 for EN 1993-1-4, 2006 and ≤ 0.51 for ASCE 8-02, 2002), FE predicted
higher Pnom as compared to the codal design strengths, as also observed in Section 3.5.7.3
for the hollow tubular stub columns. A higher , for both the Class 3 and Class 4
sections, European specification gives a conservative estimation of strengths compared to
the American specification, which gives slightly conservative value, in the design of
LDSS hollow tubular slender columns. However, the design of hollow tubular slender
TH-1259_09610405
CHAPTER 4 - NUMERICAL MODELLING OF LDSS HOLLOW SLENDER
COLUMNS
80
column with L-shape section through the American specification tends to be critical
where it over predicts the FE strengths.
4.5.6.4 Reliability analysis of the codes
In order to compare the design column curves obtained through the EN 1993-1-4 (2006)
and ASCE 8-02 (2002) specifications, a reliability analysis was carried out based on the
FE studies and are presented in Tables 4.1 and 4.2 for both the Class 3 and 4 sections,
respectively. Reliability index determination is detailed in Section 3.5.7.4.
Based on the reliability analyses it can be seen that except for Class 3 LHC, both the
codes show βo ≥ 2.5 when compared with the FE results. Considering the lower limit of
βo = 2.5 suggested by ASCE 8-02 (2002) specification for structural members, it can be
inferred that both the specifications can be adopted for all the design of fixed-ended
LDSS hollow tubular slender columns except for Class 3 LHC, wherein a suitable
modification may be employed after systematic studies (including experiments). For the
design of Class 3 sections, European specification tends to be more reliable compared to
the American specification and vice versa in the design of Class 4 sections.
4.6 CONCLUSIONS
FE analyses on fixed-ended LDSS hollow tubular slender columns with NRSs and
representative square section subjected to pure axial compressive loading are presented in
this chapter. Two thicknesses of steel tube with 5.25 mm and 2.0 mm, which lie in Class
3 (stocky) and Class 4 (slender) sections, respectively, as per EN 1993-1-4 (2006)
classification were considered in the study. Variations in buckling strength with changes
in the cross-sectional shapes were studied by considering NRSs having equal material
cross-sectional areas (or equal material consumption) as that of the representative square
section over a range of column lengths. The FE results of the hollow tubular slender
TH-1259_09610405
CHAPTER 4 - NUMERICAL MODELLING OF LDSS HOLLOW SLENDER
COLUMNS
81
columns were then compared with the design strengths predicted by the EN1993-1-4
(2006) and ASCE 8-02 (2002) specifications. Based on the present study the following
conclusions are drawn:
1) Hollow tubular slender column fail first by overall flexural buckling followed by local
buckling at mid-height of the column, irrespective of the cross-sectional shape
considered, and is seen to be typical for both the Class 3 and 4 sections.
2) The buckling strength of the fixed-ended hollow tubular slender columns (both Class 3
and Class 4 sections) decreases with increasing lengths due to reduction in the
stiffness of the columns, with very slender columns failing by elastic instability failure
where the Pu is mainly dominated by flexural rigidity.
3) For Class 3 sections:
a) For ≤ 0.5 and at high , all the sections exhibit similar structural capacities. The
reason being, at lower , regardless of the cross-sectional shapes, all the sections
experiences hardening above the global yielding load without any occurrences of
local buckling at ultimate load; and the failure for high slender columns are
governed principally by member stiffness rather than the cross-sectional shape.
b) For 0.5 < ≥ 2.0, there is a nearly linear variation in strengths (increasing trend
for +HC, similar trend for THC and decreasing trend for LHC), with stabilization
beyond > 2.0. For > 2.0, Pu for +HC showed ~ 30% higher; THC showed
similar strength; and LHC showed ~20% lower than the corresponding value for
SHC, indicating that +HC has an improved ultimate strength for all the ranges of
.
c) At lower < ~ 0.50, the values of εu are found to be highest for +HC, whilst SHC,
LHC and THC predicted similar values. However, at higher ≥ 0.50, εu values
lies in the range of ~ 0.2 – 0.6 % for all the section analysed.
TH-1259_09610405

CHAPTER 4 - NUMERICAL MODELLING OF LDSS HOLLOW SLENDER
COLUMNS
82
4) For Class 4 sections:
a) In contrast to Class 3 sections, cross-sectional shape becomes increasingly
significant with decreasing , however, the cross-sectional shape becomes
insignificant for very high as also the case for Class 3 sections.
b) The average strength enhancement as compared to the representative square
section are ~ 10 %, 50 %, and 90 % higher for LHC, THC, and +HC, respectively.
c) Similar to Class 3, +HC predicted higher deformation at peak load, as compared
to SHC, LHC and THC, at lower values of (< ~ 1.0). At higher slenderness ( >
~ 1.0), εu values also lies in the range of ~ 0.2 – 0.5 % for all the section analysed.
5) A higher , for both the Class 3 and Class 4 sections, European specification gives a
conservative estimation of strengths compared to the American specification, which
gives slightly conservative value, in the design of LDSS hollow tubular slender
columns. However, the design of hollow tubular slender column with L-shape section
through the American specification tends to be critical where it over predicts the FE
strengths.
6) Based on the reliability analyses it is recommended that both the specifications can be
adopted for all the design of fixed-ended LDSS hollow tubular slender columns
except for Class 3 LHC, wherein a suitable modification may be employed after
systematic studies (including experiments). For the design of Class 3 sections,
European specification tends to be more reliable compared to the American
specification and vice versa in the design of Class 4 sections.
TH-1259_09610405
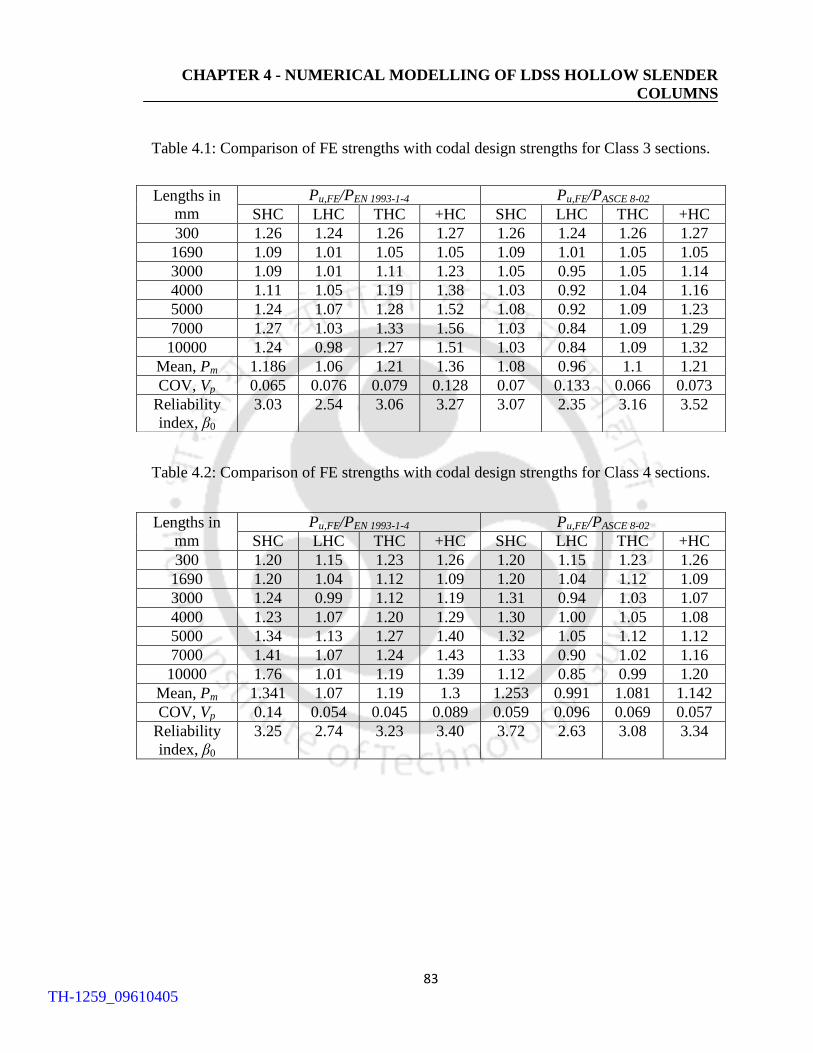
CHAPTER 4 - NUMERICAL MODELLING OF LDSS HOLLOW SLENDER
COLUMNS
83
Table 4.1: Comparison of FE strengths with codal design strengths for Class 3 sections.
Table 4.2: Comparison of FE strengths with codal design strengths for Class 4 sections.
Lengths in
mm
Pu,FE/PEN 1993-1-4 Pu,FE/PASCE 8-02
SHC LHC THC +HC SHC LHC THC +HC
300 1.20 1.15 1.23 1.26 1.20 1.15 1.23 1.26
1690 1.20 1.04 1.12 1.09 1.20 1.04 1.12 1.09
3000 1.24 0.99 1.12 1.19 1.31 0.94 1.03 1.07
4000 1.23 1.07 1.20 1.29 1.30 1.00 1.05 1.08
5000 1.34 1.13 1.27 1.40 1.32 1.05 1.12 1.12
7000 1.41 1.07 1.24 1.43 1.33 0.90 1.02 1.16
10000 1.76 1.01 1.19 1.39 1.12 0.85 0.99 1.20
Mean, Pm 1.341 1.07 1.19 1.3 1.253 0.991 1.081 1.142
COV, Vp 0.14 0.054 0.045 0.089 0.059 0.096 0.069 0.057
Reliability
index, β0
3.25 2.74 3.23 3.40 3.72 2.63 3.08 3.34
Lengths in
mm
Pu,FE/PEN 1993-1-4 Pu,FE/PASCE 8-02
SHC LHC THC +HC SHC LHC THC +HC
300 1.26 1.24 1.26 1.27 1.26 1.24 1.26 1.27
1690 1.09 1.01 1.05 1.05 1.09 1.01 1.05 1.05
3000 1.09 1.01 1.11 1.23 1.05 0.95 1.05 1.14
4000 1.11 1.05 1.19 1.38 1.03 0.92 1.04 1.16
5000 1.24 1.07 1.28 1.52 1.08 0.92 1.09 1.23
7000 1.27 1.03 1.33 1.56 1.03 0.84 1.09 1.29
10000 1.24 0.98 1.27 1.51 1.03 0.84 1.09 1.32
Mean, Pm 1.186 1.06 1.21 1.36 1.08 0.96 1.1 1.21
COV, Vp 0.065 0.076 0.079 0.128 0.07 0.133 0.066 0.073
Reliability
index, β0
3.03 2.54 3.06 3.27 3.07 2.35 3.16 3.52
TH-1259_09610405
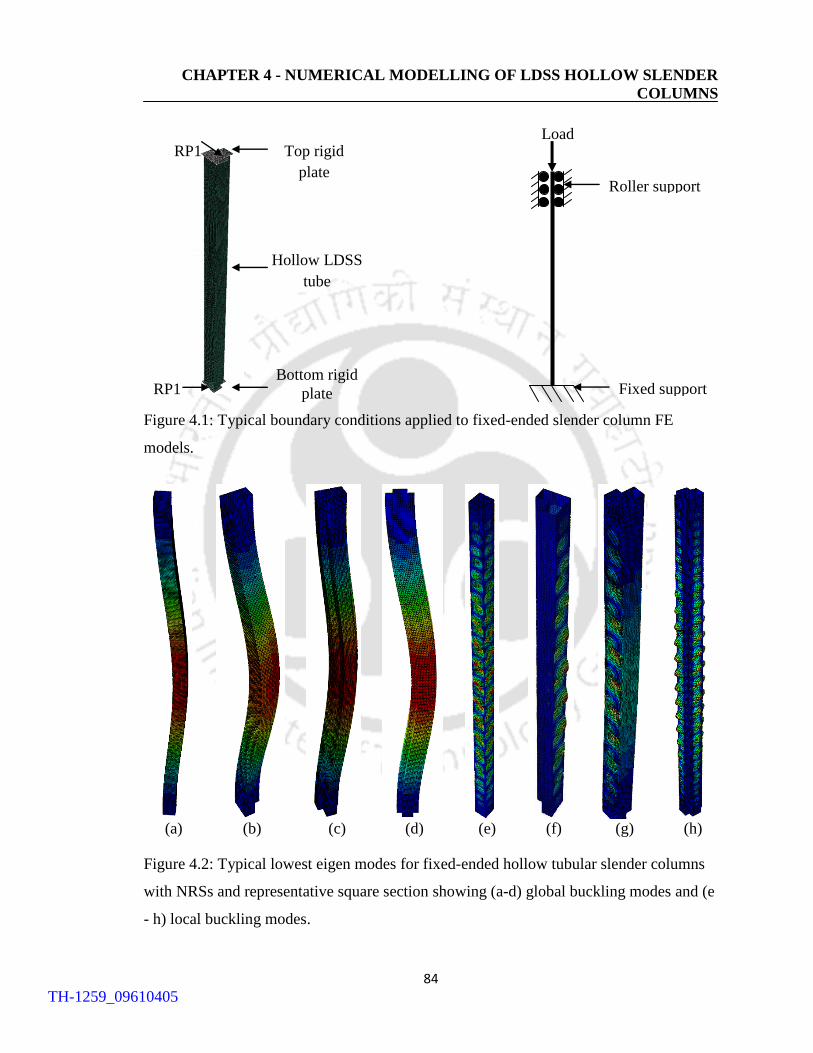
CHAPTER 4 - NUMERICAL MODELLING OF LDSS HOLLOW SLENDER
COLUMNS
84
Figure 4.1: Typical boundary conditions applied to fixed-ended slender column FE
models.
(a) (b) (c) (d) (e) (f) (g) (h)
Figure 4.2: Typical lowest eigen modes for fixed-ended hollow tubular slender columns
with NRSs and representative square section showing (a-d) global buckling modes and (e
- h) local buckling modes.
RP1
RP1 Top rigid
plate
Bottom rigid
plate
Hollow LDSS
tube
Roller support
Fixed support
Load
TH-1259_09610405
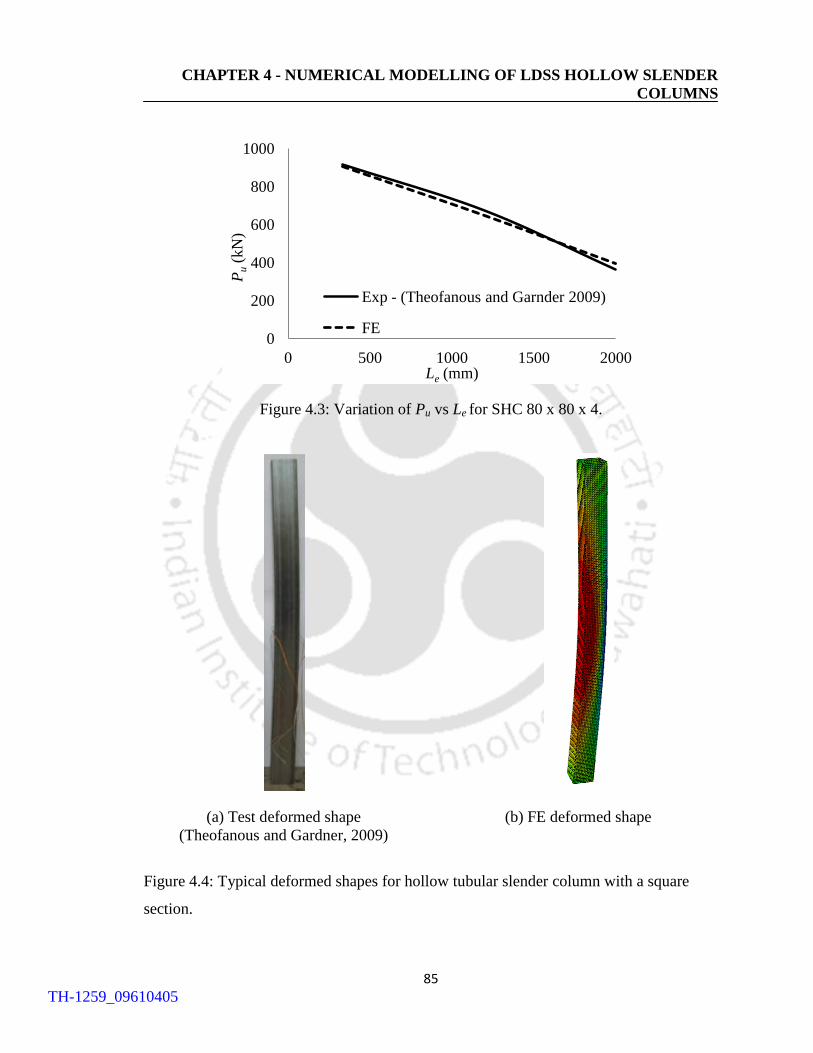
CHAPTER 4 - NUMERICAL MODELLING OF LDSS HOLLOW SLENDER
COLUMNS
85
Figure 4.3: Variation of Pu vs Le for SHC 80 x 80 x 4.
(a) Test deformed shape
(Theofanous and Gardner, 2009)
(b) FE deformed shape
Figure 4.4: Typical deformed shapes for hollow tubular slender column with a square
section.
0
200
400
600
800
1000
0 500 1000 1500 2000
Pu (
kN
)
Le (mm)
Exp - (Theofanous and Garnder 2009)
FE
TH-1259_09610405
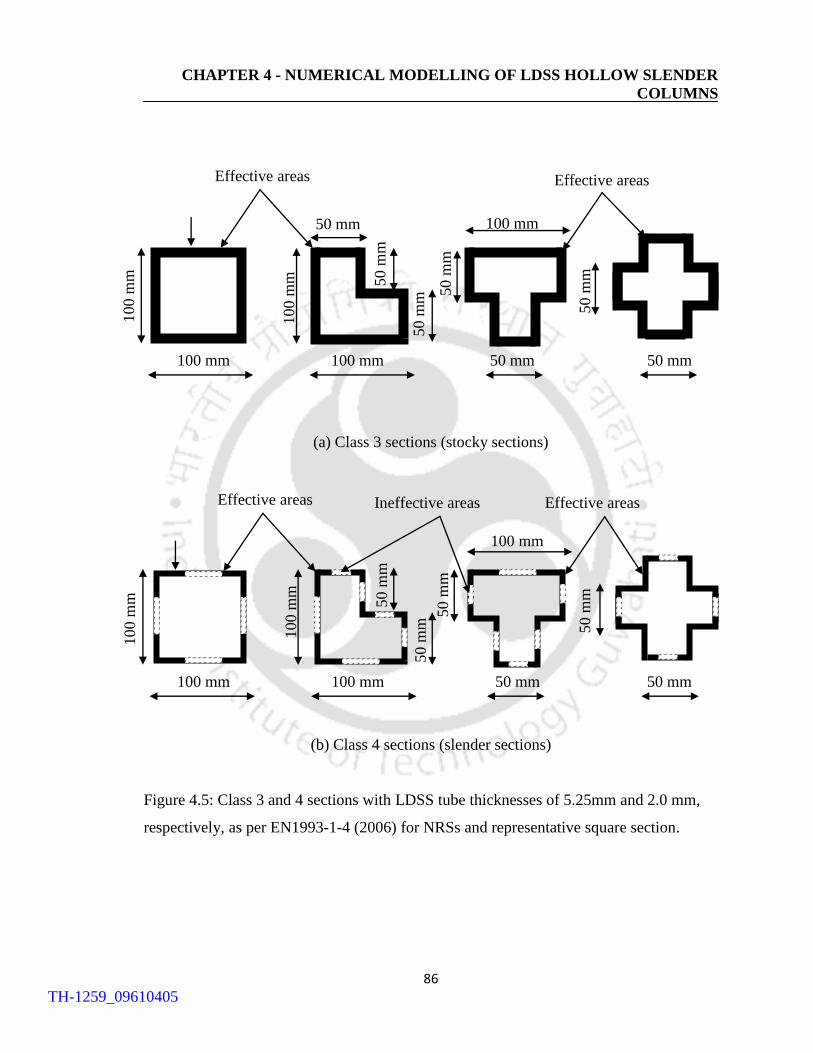
CHAPTER 4 - NUMERICAL MODELLING OF LDSS HOLLOW SLENDER
COLUMNS
86
(a) Class 3 sections (stocky sections)
(b) Class 4 sections (slender sections)
Figure 4.5: Class 3 and 4 sections with LDSS tube thicknesses of 5.25mm and 2.0 mm,
respectively, as per EN1993-1-4 (2006) for NRSs and representative square section.
t
Effective areas
100 mm
100 m
m
50 m
m
100 m
m
100 mm
50 mm
50 m
m 50 m
m
100 mm
50 mm
50 m
m
50 mm
Effective areas
50 m
m
Effective areas
t
100 mm
100 m
m
100 m
m
100 mm
50 m
m 5
0 m
m
100 mm
50 mm
Ineffective areas
50 mm
50 m
m
Effective areas
TH-1259_09610405

CHAPTER 4 - NUMERICAL MODELLING OF LDSS HOLLOW SLENDER
COLUMNS
87
Figure 4.6: Von-Mises stress (superimposed on deformed shape) at Pu for Class 3 NRSs
and representative square section (L = 300 mm).
Figure 4.7: Von-Mises stress (superimposed on deformed shape) at Pu for Class 4 NRSs
and representative square section (L = 300 mm).
Local bucking Local bucking
TH-1259_09610405
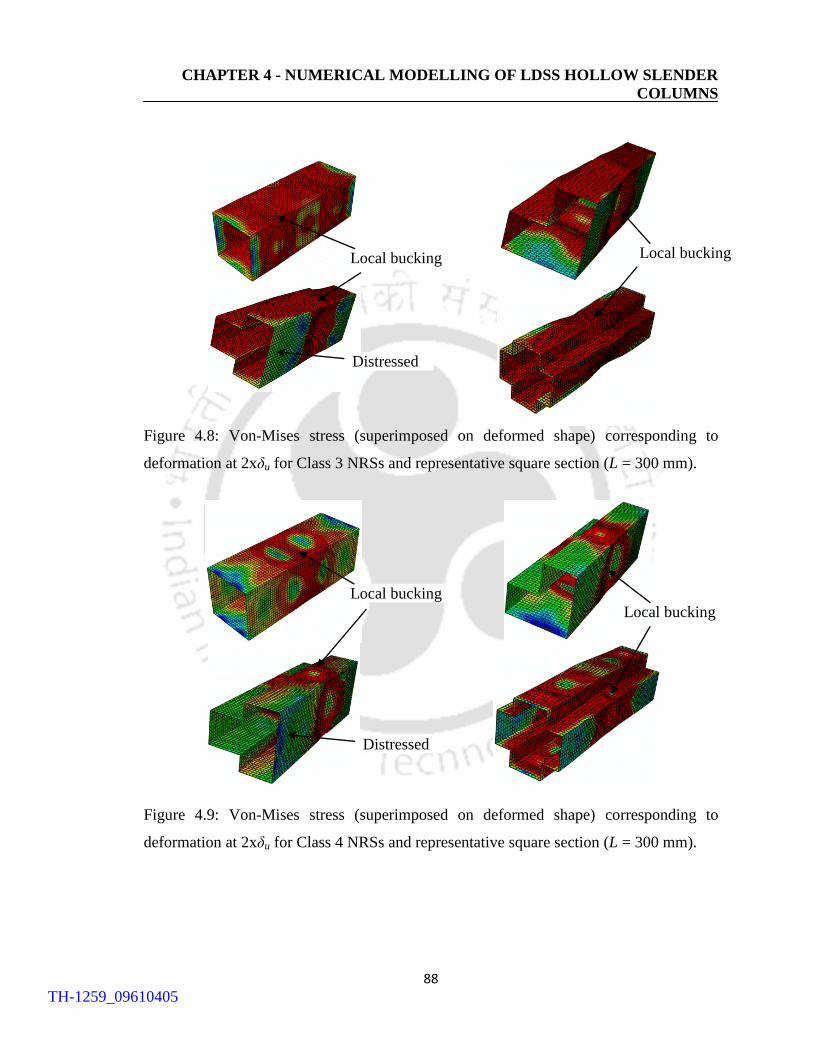
CHAPTER 4 - NUMERICAL MODELLING OF LDSS HOLLOW SLENDER
COLUMNS
88
Figure 4.8: Von-Mises stress (superimposed on deformed shape) corresponding to
deformation at 2xδu for Class 3 NRSs and representative square section (L = 300 mm).
Figure 4.9: Von-Mises stress (superimposed on deformed shape) corresponding to
deformation at 2xδu for Class 4 NRSs and representative square section (L = 300 mm).
Local bucking
Local bucking
Local bucking Local bucking
Distressed
Distressed
TH-1259_09610405
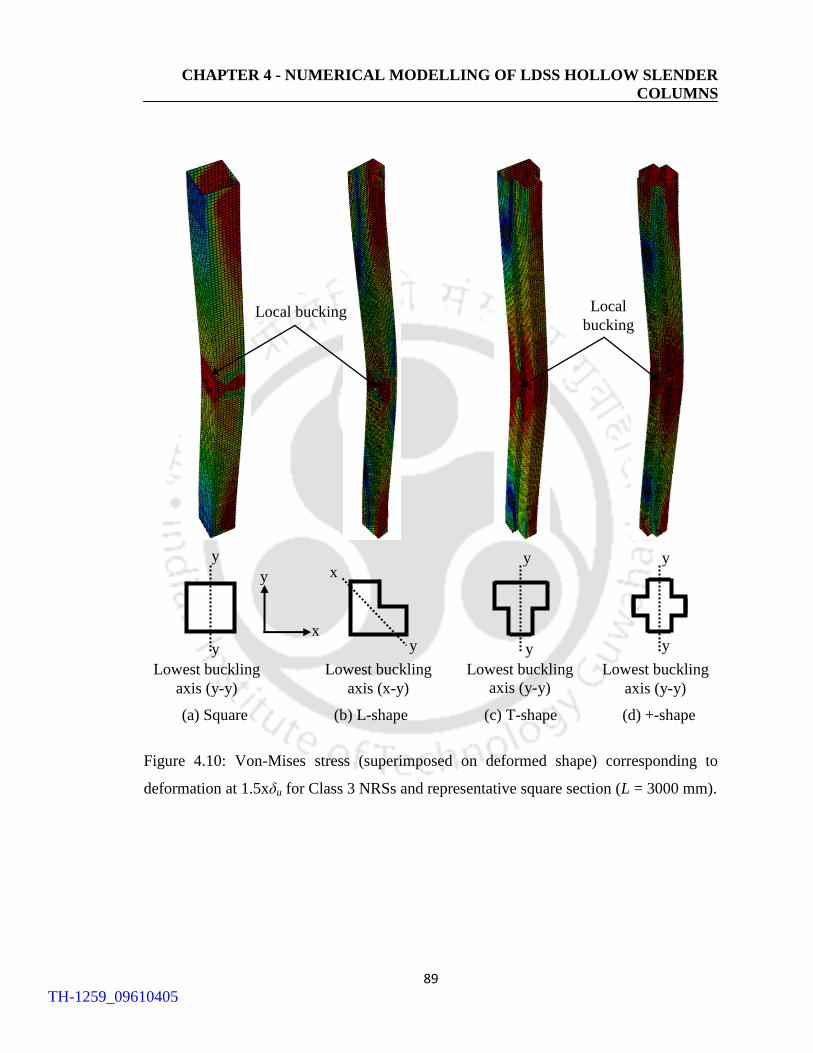
CHAPTER 4 - NUMERICAL MODELLING OF LDSS HOLLOW SLENDER
COLUMNS
89
(a) Square (b) L-shape (c) T-shape (d) +-shape
Figure 4.10: Von-Mises stress (superimposed on deformed shape) corresponding to
deformation at 1.5xδu for Class 3 NRSs and representative square section (L = 3000 mm).
Local bucking
Lowest buckling
axis (y-y)
Local
bucking
Lowest buckling
axis (x-y)
Lowest buckling
axis (y-y)
Lowest buckling
axis (y-y)
y
x
y
y
y
y
y
y
x
y
TH-1259_09610405
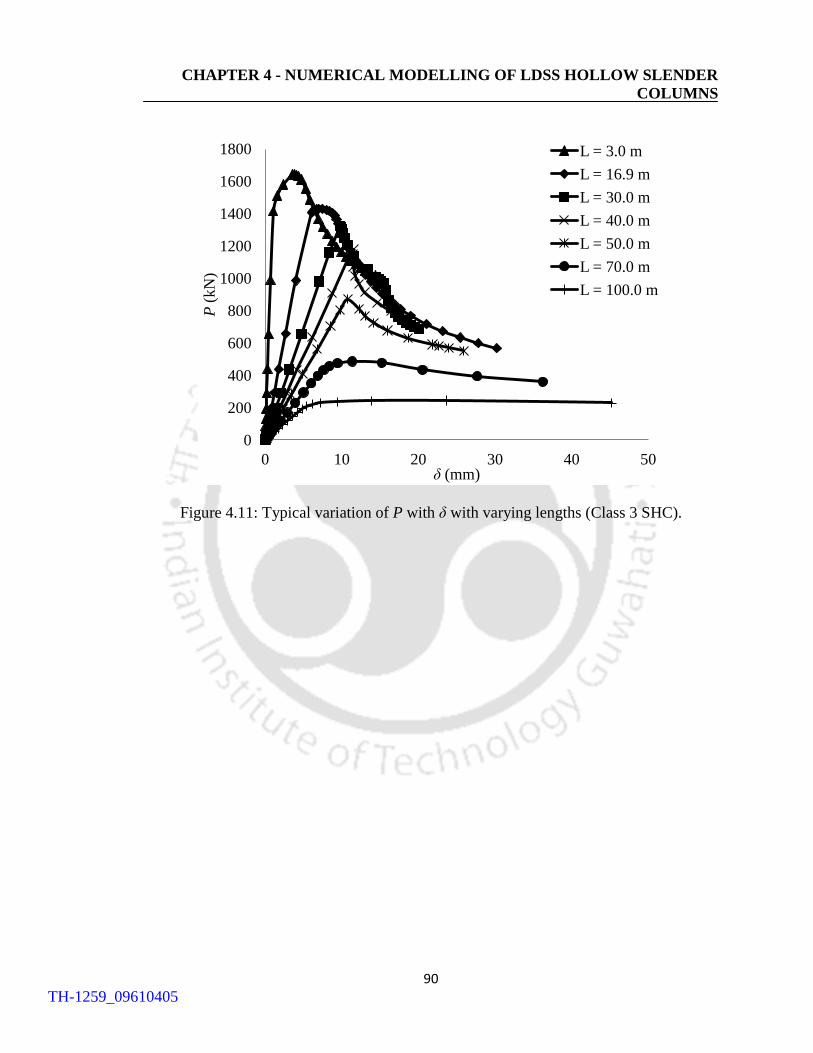
CHAPTER 4 - NUMERICAL MODELLING OF LDSS HOLLOW SLENDER
COLUMNS
90
Figure 4.11: Typical variation of P with δ with varying lengths (Class 3 SHC).
0
200
400
600
800
1000
1200
1400
1600
1800
0 10 20 30 40 50
P (
kN
)
δ (mm)
L = 3.0 m
L = 16.9 m
L = 30.0 m
L = 40.0 m
L = 50.0 m
L = 70.0 m
L = 100.0 m
TH-1259_09610405
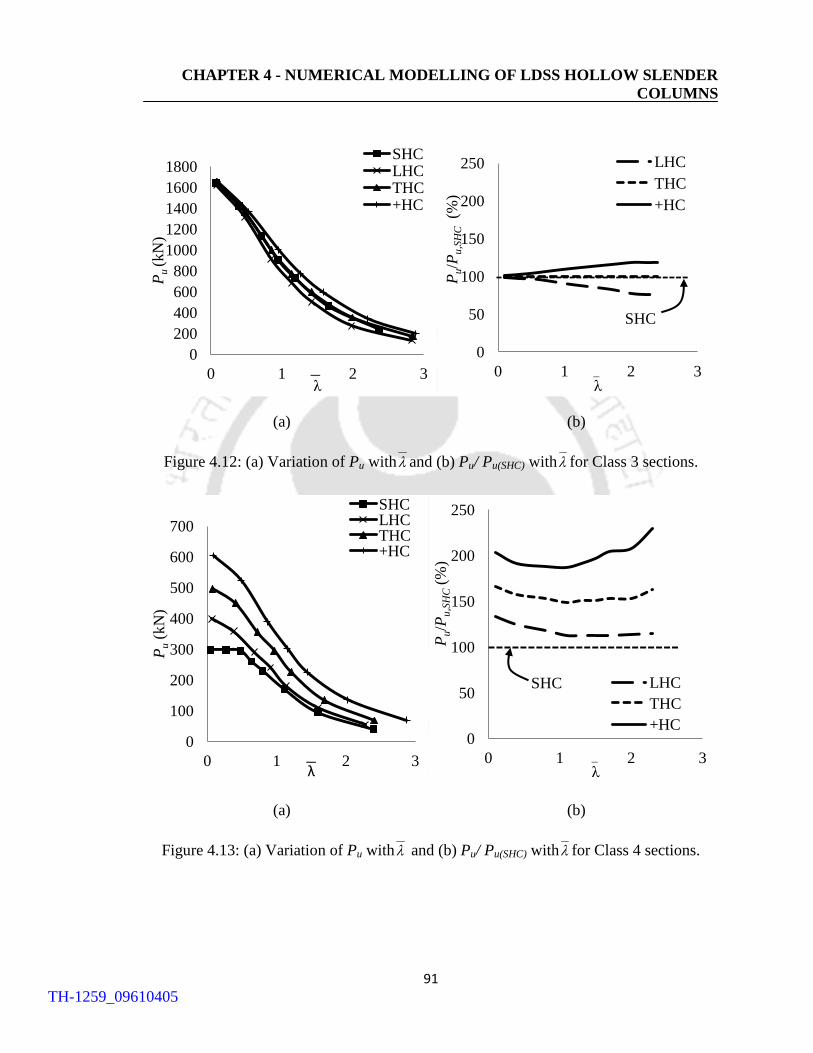
CHAPTER 4 - NUMERICAL MODELLING OF LDSS HOLLOW SLENDER
COLUMNS
91
(a) (b)
Figure 4.12: (a) Variation of Pu with and (b) Pu/ Pu(SHC) with for Class 3 sections.
(a) (b)
Figure 4.13: (a) Variation of Pu with and (b) Pu/ Pu(SHC) with for Class 4 sections.
0
200
400
600
800
1000
1200
1400
1600
1800
0 1 2 3
Pu
(k
N)
λ
SHC LHC THC +HC
_ 0
50
100
150
200
250
0 1 2 3
Pu/P
u,S
HC (%
)
λ
LHC
THC
+HC
–
SHC
0
100
200
300
400
500
600
700
0 1 2 3
Pu (
kN
)
λ
SHC LHC THC +HC
_ 0
50
100
150
200
250
0 1 2 3
Pu/P
u,S
HC (
%)
λ
LHC
THC
+HC
–
SHC
TH-1259_09610405
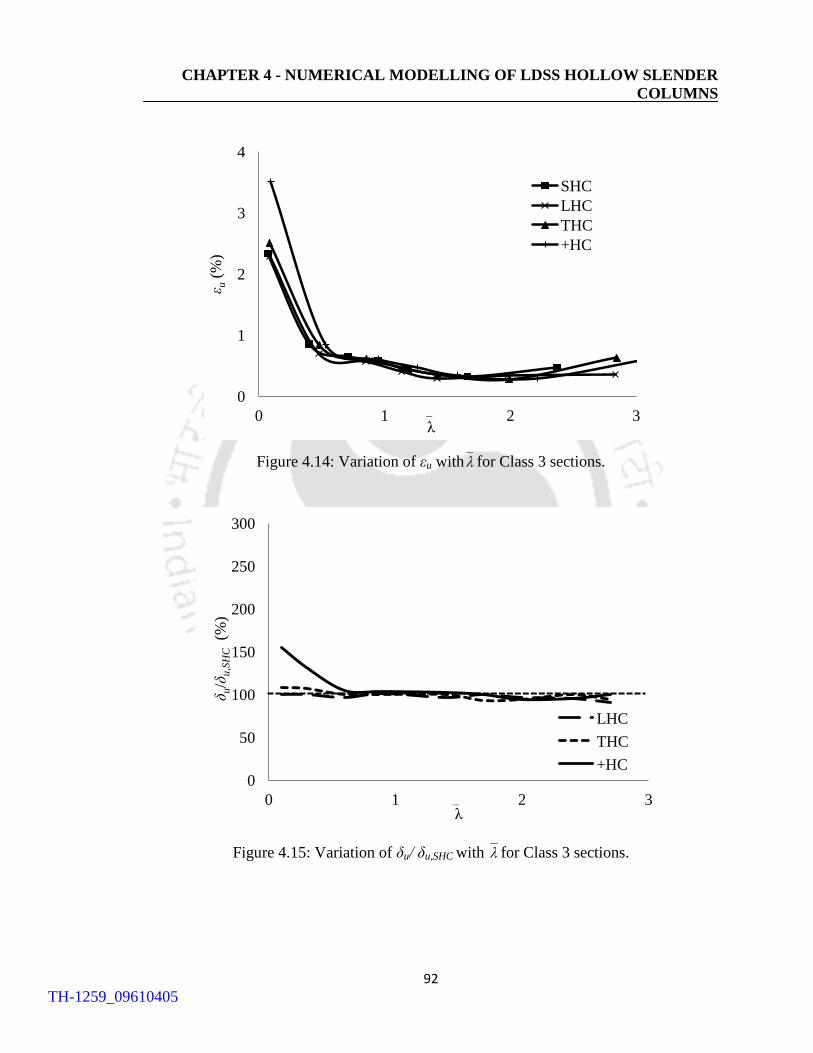
CHAPTER 4 - NUMERICAL MODELLING OF LDSS HOLLOW SLENDER
COLUMNS
92
Figure 4.14: Variation of εu with for Class 3 sections.
Figure 4.15: Variation of δu/ δu,SHC with for Class 3 sections.
0
1
2
3
4
0 1 2 3
ε u (
%)
λ
SHC
LHC
THC
+HC
–
0
50
100
150
200
250
300
0 1 2 3
δu/δ
u,S
HC (%
)
λ
LHC
THC
+HC
–
TH-1259_09610405
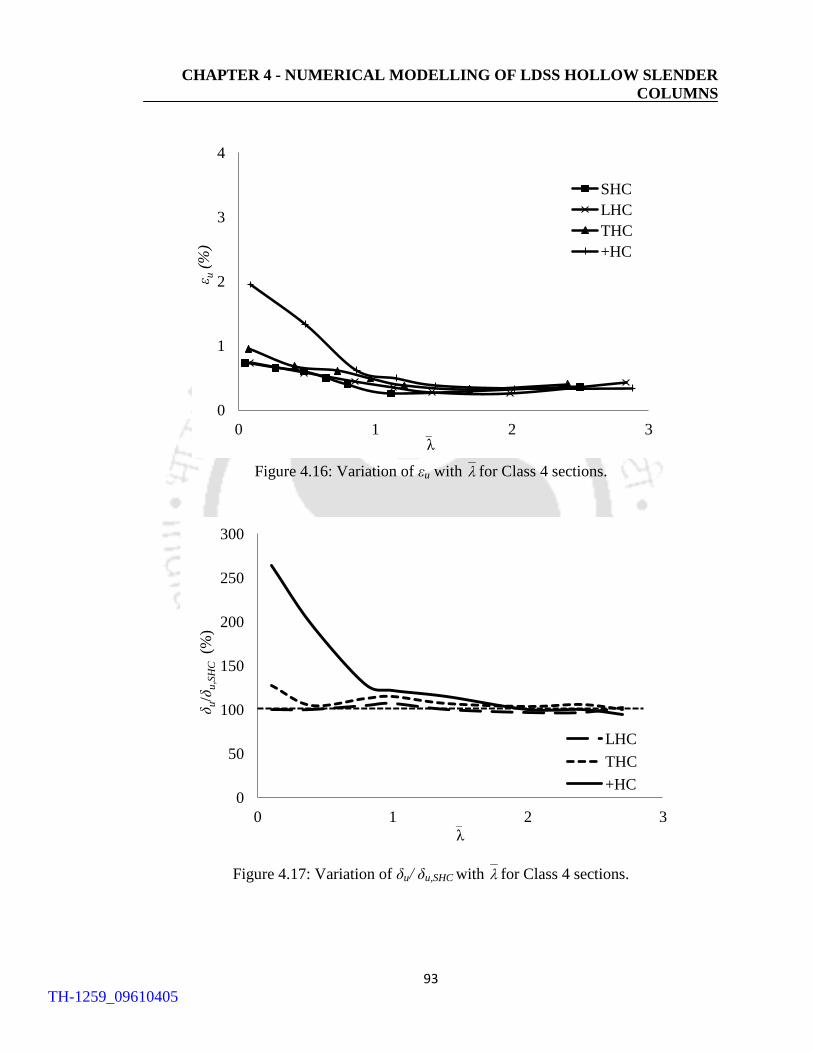
CHAPTER 4 - NUMERICAL MODELLING OF LDSS HOLLOW SLENDER
COLUMNS
93
Figure 4.16: Variation of εu with for Class 4 sections.
Figure 4.17: Variation of δu/ δu,SHC with for Class 4 sections.
0
1
2
3
4
0 1 2 3
ε u (
%)
λ
SHC
LHC
THC
+HC
–
0
50
100
150
200
250
300
0 1 2 3
δu/δ
u,S
HC (%
)
λ
LHC
THC
+HC
–
TH-1259_09610405
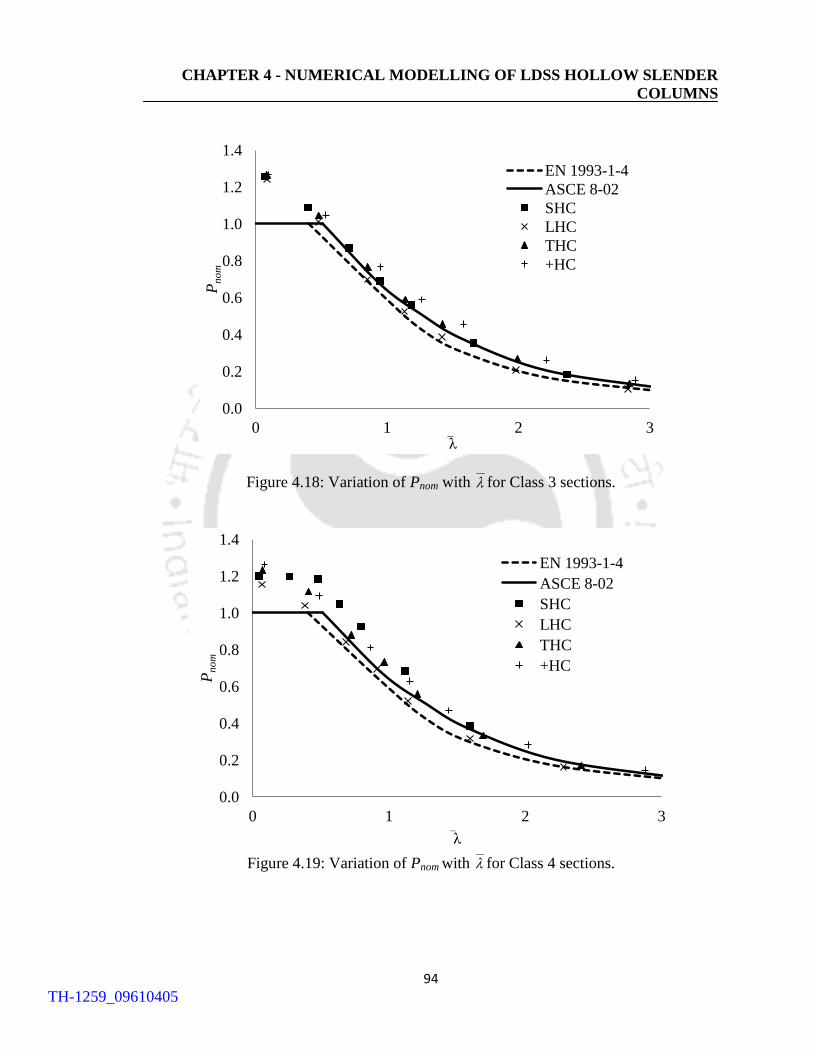
CHAPTER 4 - NUMERICAL MODELLING OF LDSS HOLLOW SLENDER
COLUMNS
94
Figure 4.18: Variation of Pnom with for Class 3 sections.
Figure 4.19: Variation of Pnom with for Class 4 sections.
0.0
0.2
0.4
0.6
0.8
1.0
1.2
1.4
0 1 2 3
Pn
om
λ
EN 1993-1-4
ASCE 8-02
SHC
LHC
THC
+HC
–
0.0
0.2
0.4
0.6
0.8
1.0
1.2
1.4
0 1 2 3
Pn
om
λ
EN 1993-1-4
ASCE 8-02
SHC
LHC
THC
+HC
–
TH-1259_09610405

95
CHAPTER 5
NUMERICAL MODELLING OF CONCRETE-
FILLED LEAN DUPLEX STAINLESS STEEL
STUB COLUMNS
5.1 INTRODUCTION
This chapter describes a series of numerical investigation on the behavior and strength of
Concrete-Filled Lean Duplex Slender Stainless steel Tubular (CFDSST) stub columns
under pure axial compression. The main objective of this study is to explore and compare
the structural behaviours such as the load and deformation capacities and to see the effect
of the LDSS tube thickness and concrete strength on the structural behavior of the
CFDSST stub columns with NRSs and the representative square sections, but noting that
all these column types have equal LDSS material cross-sectional areas as followed in
Chapters 3 and 4, thus resulting in reduction of concrete core area by 36 % for NRSs
compared to the representative square section. The FE results were compared with the
currently available design standards for stainless steel, such as the European specification
(EN 1994-1-1, 2004) and the American specification (ASCE 8-02, 2002), to assess their
applicability in the design of concrete-filled LDSS hollow tubular stub columns.
Reliability analysis of the design standards was also carried out based on the FE studies.
TH-1259_09610405
CHAPTER 5 - NUMERICAL MODELLING OF CONCRETE-FILLED LDSS
STUB COLUMNS
96
5.2 FE MODELLING
The development of an appropriate FE model requires a correct representation of the
corresponding material characteristics as inaccurate representation of the material
behavior, such as the LDSS and the concrete core material in the CFDSST columns, will
overshadow the performance of even the most refined FE models. Gardner and Ashraf
(2006) model is used to describe the LDSS material, as also validated through
experimental test performed on hollow tubular stub column by Theofanous and Gardner
(2009) and detailed in Section 3.3, in the FE modeling of CFDSST stub columns. In
concrete-filled stainless steel tubular columns, small D/t ratios provide high considerable
confinement for the concrete; hence, an equivalent uniaxial stress-strain relationship for
confined concrete should be used. Whereas, high D/t ratios of concrete-filled stainless
steel tubular columns provide inadequate confinement for the concrete, therefore the
uniaxial stress-strain relationship for unconfined concrete can be used. As discussed in
Section 2.6.2, Mander et al. (1988) defined the limiting D/t ratio between confined and
unconfined concrete to be approximately equal to 29.2. In the present study of CFDSST
stub columns with NRSs and the representative square sections, the uniaxial stress-strain
relationship for the unconfined concrete was adopted as D/t ratio of the entire specimens
lie in the range 30.0 to 80.0. The following sub-section presents further discussions on
the steps followed to achieve an accurate FE model representation of the CFDSST stub
columns.
5.2.1 Boundary conditions and analysis technique
The CFDSST stub columns considered had fixed ends which is similar to the approach
followed for hollow tubular stub column FE models as discussed in Section 3.2.1. Figure
5.1 shows a typical geometry of a square CFDSST stub column. Similar analysis
technique as mentioned in Section 3.2.1was followed, and the modified RIKS method
was used in the nonlinear analyses of the CFDSST stub column FE models in line with
TH-1259_09610405
CHAPTER 5 - NUMERICAL MODELLING OF CONCRETE-FILLED LDSS
STUB COLUMNS
97
several other researchers (e.g. Dai and Lam, 2010; Hassanein, 2010; Hassanein et al.,
2013).
5.2.2 FE mesh
S4R elements were used for representing the LDSS tube as detailed in Section 3.2.2. For
the concrete core, a three-dimensional eight-noded solid element with reduced integration
(C3D8R) having three translation degrees-of-freedom at each node was used. C3D8R is
known to give an accurate representation of the concrete material, as also verified by
various researchers (e.g. Ellobody and Young, 2006; Hassanein, 2010; Tao et al., 2011;
Hassanein et al., 2013). A slightly coarse mesh was used throughout the FE study of
CFDSST stub columns as the mesh refinement has very little influence on the numerical
results (Hassanein, 2010). Accordingly, a mesh of an approximate global size ranging
from 40 to 60 mm is used in the current modeling for the LDSS tube and concrete core.
The aspect ratio of the element is kept at ~1.0 in all the FE models (see Figure 5.1).
5.2.3 Concrete core material model
The stress-strain curve development of the concrete core in the CFDSST stub columns is
detailed in Section 2.7.2. Due to the thin nature of the LDSS tube adopted in the FE
models (i.e. D/t > 29.2); inadequately confined concrete material model was adopted.
Detailed modelling of the inadequately confined concrete core in the CFDSST stub
column FE models through the Drucker-Prager (D-P) yield criterion model available in
Abaqus (2009) and its potential in simulating the constitutive behavior of the concrete
core is presented in Appendix C.
TH-1259_09610405
CHAPTER 5 - NUMERICAL MODELLING OF CONCRETE-FILLED LDSS
STUB COLUMNS
98
5.2.4 Modelling of concrete-LDSS tube interface
The contact between the LDSS tube and the concrete is modeled using interface elements
which consist of two matching contact faces of LDSS tube and concrete elements. The
mechanical property of the contact interaction is defined along normal and tangential
directions to the interface respectively. The tangential mechanical property of the contact
interaction is simulated by an isotropic Coulomb friction model, and the friction between
the two faces is maintained as long as the surfaces remained in contact.
Dai and Lam (2010) studied different coefficient of friction (µ) (i.e. in the tangential
direction), from 0.1 to 0.5, between the two interacting faces of the outer concrete core
surface and the LDSS tube inner surface. It was found that there was little effect on the
axial resistance when different friction factors were used, but using a smaller friction
factor induced a convergent problem with large deformation. Therefore a µ of 0.2 to 0.3
is suggested to achieve a quick convergence and to obtain accurate results in the FE
analyses of concrete-filled tubular columns. Hence, in the present FE studies of LDSS
concrete-filled tubular stub columns, µ is taken as 0.25, in agreement with other
researchers (e.g. Ellobody and Young, 2006; Hassanein, 2010; Hassanein et al., 2013).
The ‘Hard contact’ relation in Abaqus (2009) is selected as normal mechanical property
with no penetration allowed between the concrete core and the LDSS tube, which is to
transfer the confinement effect of the LDSS hollow tubular sections to the concrete core,
but is allowed to separate (e.g. Dai and Lam, 2010; Hassanein, 2010; Hassanein et al.,
2013).
The effect of initial local imperfections on the CFDSST stub columns were neglected
because the strength reduction is not significant compared to thin-walled hollow tubes
owing to the delaying effect of steel tube local buckling by the core concrete (Tao et al.,
2009).
TH-1259_09610405
CHAPTER 5 - NUMERICAL MODELLING OF CONCRETE-FILLED LDSS
STUB COLUMNS
99
5.3 VERIFICATION OF THE FE MODELS
In order to check the validity of the CFDSST stub column with NRSs and the
representative square section for accurate representation of the concrete core strengths,
similar experimental test conducted with D/t > 29.2 (i.e. the hollow tubular sections
providing inadequately confinement to the concrete core) by Ellobody and Young (2006),
Zuo et al., (2012) and Yang et al. (2010) for concrete-filled steel tubular stub columns
with a square, L-shape, and T-shape sections, respectively, have been considered as the
benchmark for verification. The measured dimensions and the steel material properties
for the concrete-filled steel tubular stub columns with a square, L-shape, and T-shape
sections are given in Figure 5.2 and Table 5.1.
Figure 5.3 shows a comparison of experimental results (Ellobody and Young, 2006; Zuo
et al., 2012 and Yang et al., 2010) and FE results for concrete-filled steel tubular stub
columns with a square, L-shape, and T-shape sections, and good agreement can be seen
(see Figure 5.4). Also, in order to check the current FE models capability of simulating
different concrete strengths, a comparison is made with the FE results by Hassanein
(2010) for a rectangular CFDSST stub column with concrete compressive strengths of 25
MPa and 85 MPa (see Figure 5.4e). From Figure 5.4e, it can be seen that very good
agreement was achieved. Hence, similar constitutive modeling of inadequately confined
concrete stress-strain curve (as detailed in Appendix C) and the steps followed in the
verification of FE models have been taken up in the subsequent FE analyses.
5.4 CONCRETE-FILLED TUBULAR STUB COLUMN MODELLING
5.4.1 Introduction
As a part of the study, a series of FE models to investigate the behaviour and strength of
CFDSST stub columns are presented in this chapter. CFDSST stub columns of NRSs and
TH-1259_09610405
CHAPTER 5 - NUMERICAL MODELLING OF CONCRETE-FILLED LDSS
STUB COLUMNS
100
representative square section with compressive concrete strengths varying from 25 MPa
to 100 MPa were analysed for the parametric study. The principle target was to build a
knowledge basis for the mechanical behavior of this type of columns, which has not yet
been investigated.
5.4.2 Development of the FE models
A total of 72 CFDSST stub columns along with 12 LDSS hollow tubular stub columns of
NRSs and representative square sections with compressive concrete strengths varying
from 25 MPa to 100 MPa were analysed for the parametric study. The dimensions as well
as material properties of the LDSS hollow tubular and CFDSST stub columns are
summarized in Table 5.2 (also see Figure 5.5). The LDSS cross-sectional areas of all the
CFDSST stub columns are kept equal, to have the same steel material consumption, thus
resulting in reduction of the concrete core area by 36 % for NRSs compared to the
representative square section. LDSS hollow tubular and CFDSST stub columns are
labeled such that the cross-sectional shape and concrete compressive strength can be
identified from the label. For example, the label ‘L1C0’and ‘L2C25’ defines the LDSS
hollow tubular and CFDSST stub columns, respectively, with L-shape section of 7.5 mm
and 9.0 mm thickness indicated by the letter “L1 and L2”, respectively, and the letter “C0
and C25” defines the LDSS hollow tube and concrete compressive strength in MPa (25
MPa).
The length of all the stub columns (L) was chosen to be three times the overall depth of
the sections to avoid the effects of flexural buckling and end conditions, as followed by
several researchers (Dabaon et al., 2009, Hassanein, 2010, Uy et al., 2001, Young &
Ellobody, 2006, Zuo et al., 2012, Zhang & Yang, 2012). In line with other researchers
(Hassanein, 2010, Zhang & Yang, 2012, Zuo et al., 2012), the corners of the CFDSST
stub columns of NRSs and representative square section are assumed herein to be exact
900 (i.e. corner radii are not considered).
TH-1259_09610405
CHAPTER 5 - NUMERICAL MODELLING OF CONCRETE-FILLED LDSS
STUB COLUMNS
101
Based on the thickness of the steel tube in the current investigation, which were taken as
7.5 mm, 9.0 mm and 10 mm, the lateral confining pressure (σlat) imposed by the current
LDSS tubes were found to be negligible in all the models, as the D/t ratios of all the plate
elements for the NRSs and representative square section considered are found to be
greater than 29.2 (Mander et al., 1988). And hence, inadequately confined concrete
models were considered in the FE models as discussed in the Section 2.7.2 and
supplemented by Appendix C.
5.5 RESULTS AND DISCUSSION
5.5.1 Introduction
The results of the FE analysis for the CFDSST stub columns were presented in terms of
variation in the load and deformation capacities along with the failure modes with change
in the cross-sectional shape and thickness of the LDSS tube. The FE results of the
CFDSST stub columns were compared with the currently available design standards for
stainless steel, such as, the European (EN1994-1-1, 2004) and American (ASCE 8-02,
2002) specifications for their applicability in the design of the CFDSST stub columns.
Reliability analyses of these design standards were also discussed based on the FE
studies.
5.5.2 Deformed shapes of NRSs and square section
Figures 5.6a-f show typical von-mises stress superimposed over deformed shapes (or
failure modes) at Pu for square, L, T, and +-shape sections. It can be seen that only slight
overall out-of-plane deformation of the entire four faces, two faces, and one face (i.e at
the longer faces of 600 mm wide) can be seen for the square, L-shaped and T-shaped
sections, respectively, at Pu, for all the thickness considered (see Figure 5.6a-e), except
for +-shaped section and at the shorter faces of L- and T-shape sections (i.e 300 mm side
TH-1259_09610405
CHAPTER 5 - NUMERICAL MODELLING OF CONCRETE-FILLED LDSS
STUB COLUMNS
102
width) where no local buckling is seen at Pu (see Figure 5.6b-f). Thus, it can seen that the
initiation of local buckling can be delayed by decreasing the width-to-thickness ratio of
the LDSS tube.
Figures 5.6g-l show typical von-mises stress superimposed over deformed shapes at 3xδu
for square, L, T, and +-shape sections. The post peak failure modes in all the CFDSST
stub columns are mainly through localized outward buckling of the wider faces of the
LDSS tube (i.e local outward buckling at mid-height for the square and T-shape sections
and near the two ends for L- and +-shape sections) followed by local buckling of the
remaining shorter faces (i.e alternate local inward and outward buckling at mid-height for
the L- and T-shape sections (see Figure 5.6)), and compression crushing of the concrete
core. However, for +-shape section, no significant local buckling is not seen at the shorter
faces (150 mm side width) of the LDSS tube which may be attributed to enhanced cross-
section stability due to shorter sides and increased number of corners (similar to the
observations made for hollow tubular stub columns), which further delays local buckling
of the LDSS tube.
5.5.3 Load-axial deformation profile
Figure 5.7 shows typical variation of P with δ for CFDSST stub columns (square section
and +-shape section) along with variation of von-mises stress distribution (over deformed
shaped) at pre-peak (location S1), peak (location S2) and post-peak loads (location S3
and S4). ). S1 marks the stage at which a profound change in the curve is seen, which
approximately occurs at around ~ 0.75 Pu for all the CFDSST stub columns, as also
observed by other researchers (e.g. Ren et al., 2011). S2 defines the ultimate strength
capacity of the CFDSST stub column, and depends on the concrete cubic strength (see
Figures 5.7a&b), cross-sectional shapes, and the LDSS tube thicknesses. Figure 5.8
shows the effect of concrete core strength on the P versus ε curve of CFDSST stub
columns and found to be typical for all the thicknesses studied. Hence, only the LDSS
tube thickness of 10.0 mm was plotted. It can be seen from Figure 5.8 that filling the
TH-1259_09610405
CHAPTER 5 - NUMERICAL MODELLING OF CONCRETE-FILLED LDSS
STUB COLUMNS
103
LDSS tube with concrete greatly enhances the strength capacity of the CFDSST stub
columns, however, at the cost of decreasing εu (i.e. ε at Pu) with increasing concrete
strengths. And with change in the cross-section from square → L → T → + shape, the
better the section becomes in achieving more strain hardening and delay strain softening
due to the increased confinement provided to the concrete core by the steel tube (see
Figures 5.7a&c and Figure 5.7d). Thus, achieving a higher axial deformation capacity by
the concrete-filled tubular stub column with NRSs compared to the representative square
section (see Figure 5.8). At the location S3 of the post-peak (i.e taken at 0.85 Pu), there is
local buckling of the steel tube and consequently reduces the confining pressure on the
concrete. With change in the concrete strength as well as cross-section from square → L
→ T → + shape, the difference in the crushing strain of S2 and S3 gets wider and post
peak curve from S2 to S3 gets milder due to the delay in localized buckling of the LDSS
tube (see Figures 5.7 and 5.8), as also explained in Section 5.5.2. At S4, there is total
failure of the CFDSST stub columns, as seen is Figures 5.7 and 5.8, where there is no
increase in the P with further increase of ε. However, there is still a redundant strength
(which may be coming from the combined effect of the LDSS tube and the confined
crushed concrete) as also observed by several other researchers (e.g. Tao et al., 2011, Zuo
et al., 2012,, Yang et al., 2010), of about 1.5 to 2 times that of the strength of the hollow
tubular stub columns (see Figure 5.8).
5.5.4 Influence of the LDSS tube
Figures 5.9a&b show a plot of Pu/Pu,hollow (%) versus fck for the CFDSST stub columns
with NRSs and representative square section. It can be seen form Figures 5.9a&b that the
influence of the LDSS tube alone (excluding the involvement of the concrete core and the
confinement effect) on the Pu decreases with increasing concrete strength and increases
with increasing thickness of the steel tube. Also, it can be readily seen that the
contribution of the LDSS tube on the Pu becomes more effective as the cross-sectional
shape changes from square → L → T → +-shape section. This may attributed to the
TH-1259_09610405
CHAPTER 5 - NUMERICAL MODELLING OF CONCRETE-FILLED LDSS
STUB COLUMNS
104
delay in the local buckling offered by the NRSs. Based on the findings of the study it was
found that on filling the LDSS tube with concrete, there is an increase in the Pu by about
70 % to 435 %, 63 % to 299 %, 35 % to 283 %, and 20 % to 181% for square, L, T, and
+-shape sections, respectively.
Figures 5.9c&d show a plot of δu/δu,hollow (%) versus fck for the CFDSST stub column with
NRSs and representative square section. It can be seen from Figures 5.9c&d that the
influence of the LDSS tube on the δu increases with increasing thickness of the LDSS
tube (i.e influence of local buckling on the LDSS tube decreases with increasing
thickness) and increasing concrete strength (i.e as concrete strengths increases, it
becomes less ductile, thereby, the main contribution on δu comes from the LDSS tubes).
Hence, a simple change of cross-section provides effective utilization of the steel tube
material which in turn improves the strength and deformation capacities of CFDSST stub
columns.
5.5.5 Strength capacity of concrete-filled NRSs and square section
Figure 5.10 shows the variation of Pu with fck for CFDSST stub columns of NRSs and
representative square section with LDSS tube thickness of 10.0 mm. Only the results
corresponding to 10.0 mm was plotted as similar behavior has been observed for both the
thicknesses of 7.5 mm and 9.0 mm. It can be seen from Figure 5.10 that Pu linearly
increases with increasing fck from 25 MPa to 100 MPa. The rate of increase in the load
capacities with increasing fck for square section is higher compared to NRSs, where, the
all the NRSs showed a similar rate. From Figure 5.10, it can also be observed that for
normal concrete strength (fck ≤ 40 MPa), NRSs appears to have similar or slightly
enhanced Pu, in comparison with square section. At higher fck (> 40 MPa), L-, T-, and +-
shape sections predicted lower values of Pu (for fck = 100 MPa) by about 18 %, 15 % and
12 %, respectively, compared to the representative square section. Thus, it indicates that
there appears to have certain tangible benefit in using NRSs for normal concrete as
TH-1259_09610405

CHAPTER 5 - NUMERICAL MODELLING OF CONCRETE-FILLED LDSS
STUB COLUMNS
105
compared to the representative square section, this is in addition to the 36% area
reduction in concrete core (leading to lighter sections). But in the case of high strength
concrete core, NRSs are clearly at disadvantage as far as the values of Pu is concerned,
however as the NRSs are lighter by 36%, they still offers an attractive options for the
designers.
In order to examine the effect of concrete strength on the CFDSST stub columns, the
efficiency of the cross-sections expressed as Pu/Pu,C25 was calculated, where Pu,C25 is the
FE ultimate strength for the CFDSST stub columns with fck = 25 MPa. Figure 5.11 plots
the efficiency with respect to fckI for LDSS tube thicknesses of 7.5 mm and 10.0 mm.
Simply, it can be noticed that by increasing the strength of the concrete core, for all the
NRSs and representative square section, there is a linear increase in the strength for the
range of concrete strengths investigated herein (25–100 MPa). Also, it can be seen that
the square section shows a higher increasing rate compared to the NRSs for the same
LDSS tube thickness.
Figures 5.12a&b show a typical plot of Pu versus t and fck, respectively, for CFDSST stub
columns. It can be seen from Figure 5.12(a) that on increase in thickness of the LDSS
tube for all the CFDSST stub columns from 7.5 mm to 9.0 (20 % increase) and 10.0 mm
(33% increase), the average increase in strengths are 14-19 % and 25-30 %, respectively.
On increase in concrete strength from 40 MPa to 48 MPa (20 % increase) and 53 MPa
(33% increase), the average increase in strengths are 6 - 9 % and 10 - 15 %, respectively
(see Figure 5.12b). Hence increasing the thickness of the LDSS tube is more beneficial in
increasing the strength of the CFDSST stub columns rather than the concrete strength.
5.5.6 Deformation capacity of concrete-filled NRSs and square section
Figure 5.13a shows variation of δu with fck for CFDSST stub columns. It shows that in
CFDSST stub columns, δu decreases with increasing concrete strengths, but increases as
the sections changes from Square → L → T → +-shape. The drop in δu with increasing
TH-1259_09610405

CHAPTER 5 - NUMERICAL MODELLING OF CONCRETE-FILLED LDSS
STUB COLUMNS
106
concrete strength may be related to increasing compression stiffness of the concrete core.
Further, lower values of δu for the representative square section may be attributed to early
buckling of the LDSS tube thus providing less confinement on the concrete core as
compared to the NRSs.
Figure 5.13b shows variation of δu with t for CFDSST stub columns. It can be seen from
Figure 5.13b that by increasing the steel tube thickness from 7.5 mm to 9.0 mm (20 %
increase) and 10.0 mm (33 % increase), the average increase in δu for square section is
5.39 % and 10.16 %, L-shaped section is 7.01 % and 13.97 %, T-shaped section is 7.01 %
and 13.97 %, and +-shaped section is 3.24 % and 7.17 %, respectively.
5.5.7 Comparison with design codes
The FE results were compared with the unfactored design strengths as per the European
(EN 1993-1-1, 2004) and American (ASCE 8-02, 2002) specifications. A sample cross-
section resistance calculation of a square CFDSST stub column with the two design
standards is given in Appendix D. The design standards are based on the stainless steel
material and hence their applicability on LDSS is assessed through the FE results.
5. 5.7.1 Effective area determination
The effective width concept as detailed in Section 3.5.7.1 given in EN 1993-1-4 (2006) to
account for the effect of local buckling on the LDSS tube was considered in the design
strengths of the CFDSST stub columns. In the present study of the CFDSST stub
columns, all the cross-sections considered lies under Class 4 section, and Figure 5.14
shows the location of Be for the Class 4 sections of NRSs and the representative square
section.
TH-1259_09610405
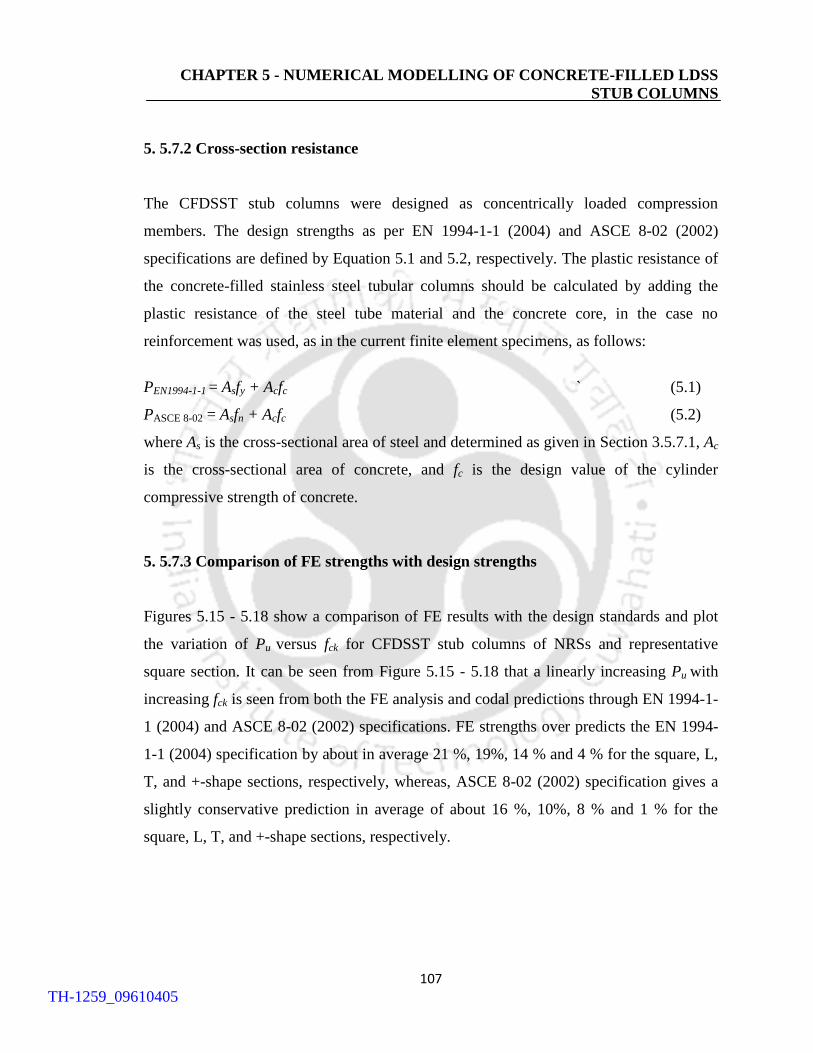
CHAPTER 5 - NUMERICAL MODELLING OF CONCRETE-FILLED LDSS
STUB COLUMNS
107
5. 5.7.2 Cross-section resistance
The CFDSST stub columns were designed as concentrically loaded compression
members. The design strengths as per EN 1994-1-1 (2004) and ASCE 8-02 (2002)
specifications are defined by Equation 5.1 and 5.2, respectively. The plastic resistance of
the concrete-filled stainless steel tubular columns should be calculated by adding the
plastic resistance of the steel tube material and the concrete core, in the case no
reinforcement was used, as in the current finite element specimens, as follows:
PEN1994-1-1 = Asfy + Acfc ` (5.1)
PASCE 8-02 = Asfn + Acfc (5.2)
where As is the cross-sectional area of steel and determined as given in Section 3.5.7.1, Ac
is the cross-sectional area of concrete, and fc is the design value of the cylinder
compressive strength of concrete.
5. 5.7.3 Comparison of FE strengths with design strengths
Figures 5.15 - 5.18 show a comparison of FE results with the design standards and plot
the variation of Pu versus fck for CFDSST stub columns of NRSs and representative
square section. It can be seen from Figure 5.15 - 5.18 that a linearly increasing Pu with
increasing fck is seen from both the FE analysis and codal predictions through EN 1994-1-
1 (2004) and ASCE 8-02 (2002) specifications. FE strengths over predicts the EN 1994-
1-1 (2004) specification by about in average 21 %, 19%, 14 % and 4 % for the square, L,
T, and +-shape sections, respectively, whereas, ASCE 8-02 (2002) specification gives a
slightly conservative prediction in average of about 16 %, 10%, 8 % and 1 % for the
square, L, T, and +-shape sections, respectively.
TH-1259_09610405

CHAPTER 5 - NUMERICAL MODELLING OF CONCRETE-FILLED LDSS
STUB COLUMNS
108
5.5.7.4 Reliability analysis of the codes
The reliability analysis of the EN 1993-1-1 (2004) and ASCE 8-02 (2002) specifications
based on the FE results is carried out as detailed in Section 3.6.6.4 of Chapter 3.
Reliability indices are tabulated in Tables 5.3, 5.4 and 5.5 for 7.5 mm, 9.0 mm, and 10.0
mm thickness, respectively.
Based on the reliability analyses it can be seen that except for CFDSST stub columns
with +-shape section, both the codes show β0 ≥ 2.5 when compared with the present FE
results. Considering the lower limit of β0 = 2.5 suggested by ASCE 8-02 (2002)
specification for structural members, it can be inferred that both specifications can be
adopted for all the design of CFDSST stub columns except for CFDSST stub columns
with +-shape section, wherein a suitable modification may be employed after systematic
studies (including experiments). However, for CFDSST stub columns, design based on
the American specification tends to be slightly more reliable compared to the European
specification.
5.6 CONCLUSIONS
A comprehensive FE analysis of CFDSST stub columns with NRSs and representative
square section for various concrete compressive strengths ranging from 25 MPa to 100
MPa has been carried out in this work to understand the cross-sectional shape effect on
the ultimate load and deformation characteristics. As the steel material being relatively
expensive compared to concrete, the steel material cross-sectional area for the NRSs and
representative square section are kept equal, giving a reduction in the concrete core area
of about 36 % for the NRSs. The following conclusions are drawn within the limitation
of this study:
1) Out-of-plane deformation (seen only at the longer faces) of the entire four faces, two
faces, and one face can be seen for the square, L-shaped and T-shaped sections,
TH-1259_09610405
CHAPTER 5 - NUMERICAL MODELLING OF CONCRETE-FILLED LDSS
STUB COLUMNS
109
respectively, at Pu, except for +-shaped section and at the shorter faces of L- and T-
shape sections where no local buckling is seen at Pu.
2) On filling the LDSS tube with concrete, there in an increase in the Pu by about 70 % to
435 %, 63 % to 299 %, 35 % to 283 %, and 20 % to 181% for square, L, T, and +-
shape sections, respectively.
3) The influence of the LDSS tube on the δu increases with increasing thickness of the
LDSS tube and increasing concrete strength.
4) For normal concrete strength (fck ≤ 40 MPa), NRSs appears to have similar or slightly
enhanced Pu, in comparison with square section. At higher fck (> 40 MPa), L-, T-, and
+-shape sections predicted lower values of Pu (for fck = 100 MPa) by about 18 %, 15 %
and 12 %, respectively, compared to the representative square section.
5) Increasing the strength of the concrete core, for all the NRSs and representative square
section, there is a linear increase in the strength for the range of concrete strengths
investigated herein (25–100 MPa). Also, it can be seen that the square section shows a
higher increasing rate compared to the NRSs for the same LDSS tube thickness.
6) On increase in thickness of the LDSS tube for all the CFDSST stub columns from 7.5
mm to 9.0 (20 % increase) and 10.0 mm (33% increase), the average increase in
strengths are 14-19 % and 25-30 %, respectively. On increase in concrete strength
from 40 MPa to 48 MPa (20 % increase) and 53 MPa (33% increase), the average
increase in strengths are 6 - 9 % and 10 - 15 %, respectively. Hence increasing the
thickness of the LDSS tube is more beneficial in increasing the strength of the
CFDSST stub columns rather than the concrete strength.
7) In CFDSST stub columns, δu decreases with increasing concrete strengths, but
increases as the sections changes from Square → L → T → +-shape.
TH-1259_09610405
CHAPTER 5 - NUMERICAL MODELLING OF CONCRETE-FILLED LDSS
STUB COLUMNS
110
8) FE strengths over predicts the EN 1994-1-1 (2004) specification by about in average
21 %, 19%, 14 % and 4 % for the square, L, T, and +-shape sections, respectively,
whereas, ASCE 8-02 (2002) specification gives a slightly conservative prediction by
about in average 16 %, 10%, 8 % and 1 % for the square, L, T, and +-shape sections,
respectively.
9) Based on the reliability analyses it can be inferred that both specifications can be
adopted for all the design of CFDSST stub columns except for CFDSST stub columns
with +-shape section, wherein a suitable modification may be employed after
systematic studies (including experiments). However, for CFDSST stub columns,
design based on the American specification tends to be slightly more reliable
compared to the European specification.
TH-1259_09610405
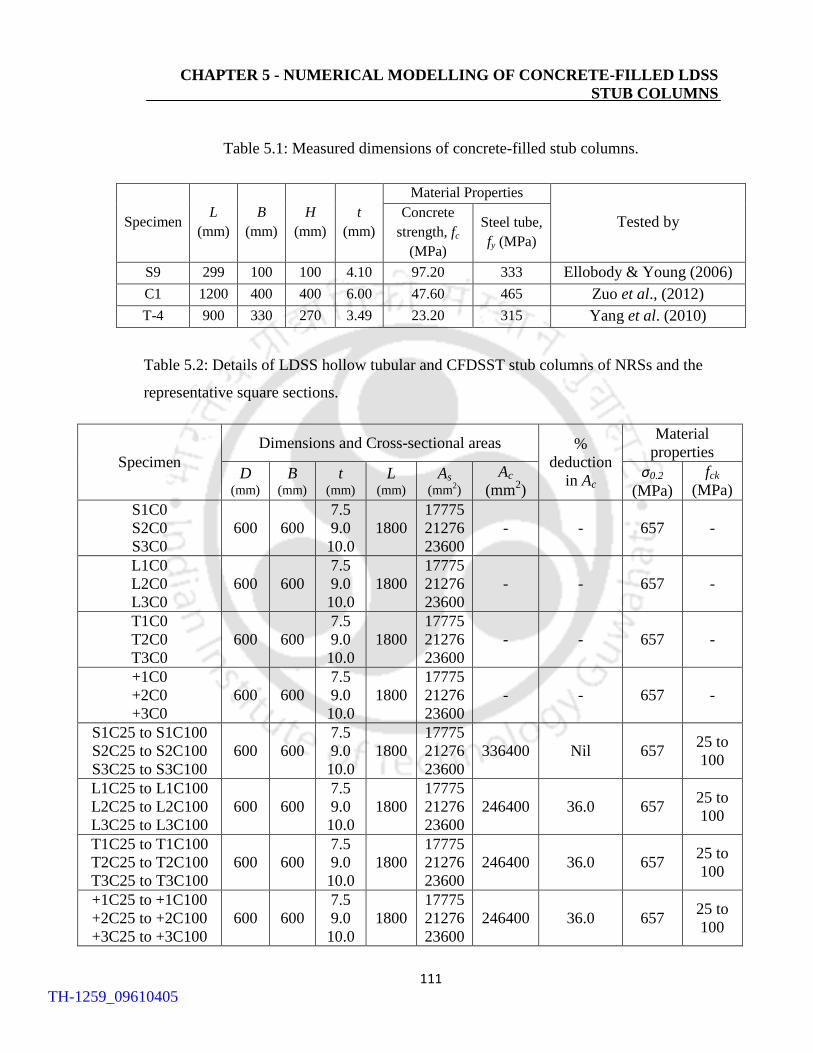
CHAPTER 5 - NUMERICAL MODELLING OF CONCRETE-FILLED LDSS
STUB COLUMNS
111
Table 5.1: Measured dimensions of concrete-filled stub columns.
Specimen L
(mm)
B
(mm)
H
(mm)
t
(mm)
Material Properties
Tested by Concrete
strength, fc
(MPa)
Steel tube,
fy (MPa)
S9 299 100 100 4.10 97.20 333 Ellobody & Young (2006)
C1 1200 400 400 6.00 47.60 465 Zuo et al., (2012)
T-4 900 330 270 3.49 23.20 315 Yang et al. (2010)
Table 5.2: Details of LDSS hollow tubular and CFDSST stub columns of NRSs and the
representative square sections.
Specimen
Dimensions and Cross-sectional areas %
deduction
in Ac
Material
properties
D
(mm)
B
(mm)
t (mm)
L (mm)
As (mm
2)
Ac
(mm2)
σ0.2
(MPa)
fck
(MPa)
S1C0
S2C0
S3C0
600 600
7.5
9.0
10.0
1800
17775
21276
23600
- - 657 -
L1C0
L2C0
L3C0
600 600
7.5
9.0
10.0
1800
17775
21276
23600
- - 657 -
T1C0
T2C0
T3C0
600 600
7.5
9.0
10.0
1800
17775
21276
23600
- - 657 -
+1C0
+2C0
+3C0
600 600
7.5
9.0
10.0
1800
17775
21276
23600
- - 657 -
S1C25 to S1C100
S2C25 to S2C100
S3C25 to S3C100
600 600
7.5
9.0
10.0
1800
17775
21276
23600
336400 Nil 657 25 to
100
L1C25 to L1C100
L2C25 to L2C100
L3C25 to L3C100 600 600
7.5
9.0
10.0
1800
17775
21276
23600
246400 36.0 657 25 to
100
T1C25 to T1C100
T2C25 to T2C100
T3C25 to T3C100 600 600
7.5
9.0
10.0
1800
17775
21276
23600
246400 36.0 657 25 to
100
+1C25 to +1C100
+2C25 to +2C100
+3C25 to +3C100 600 600
7.5
9.0
10.0
1800
17775
21276
23600
246400 36.0 657 25 to
100
TH-1259_09610405
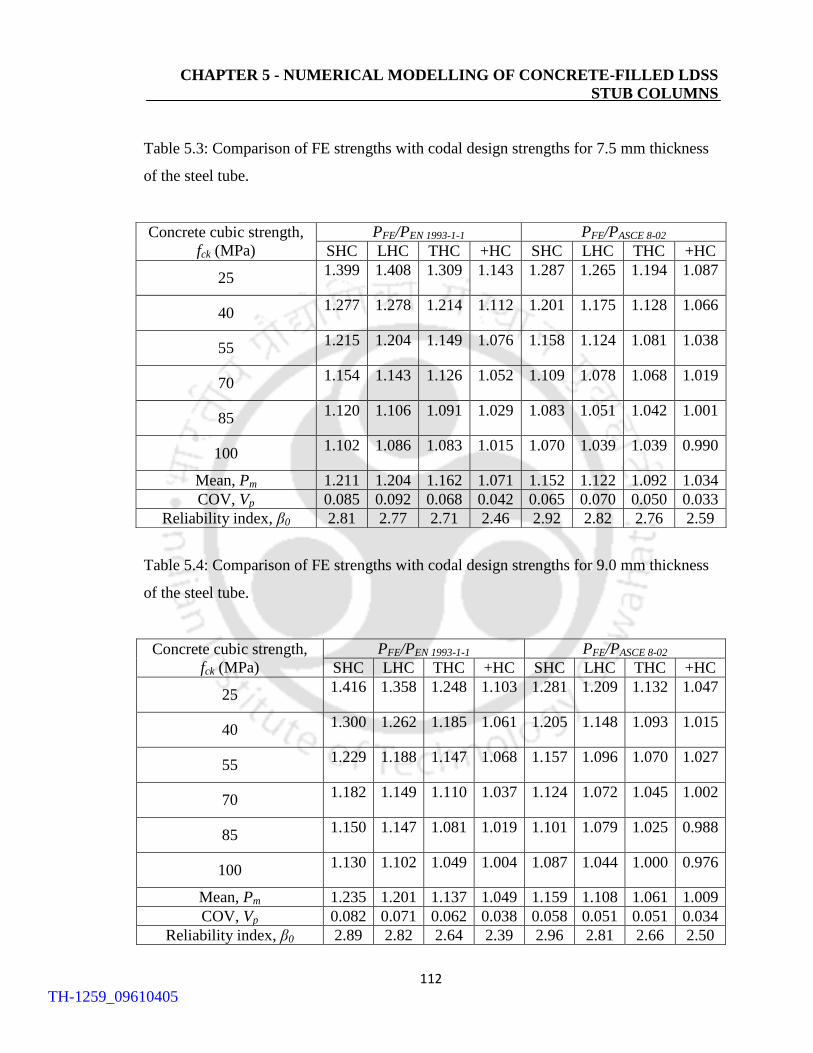
CHAPTER 5 - NUMERICAL MODELLING OF CONCRETE-FILLED LDSS
STUB COLUMNS
112
Table 5.3: Comparison of FE strengths with codal design strengths for 7.5 mm thickness
of the steel tube.
Table 5.4: Comparison of FE strengths with codal design strengths for 9.0 mm thickness
of the steel tube.
Concrete cubic strength,
fck (MPa)
PFE/PEN 1993-1-1 PFE/PASCE 8-02
SHC LHC THC +HC SHC LHC THC +HC
25 1.399 1.408 1.309 1.143 1.287 1.265 1.194 1.087
40 1.277 1.278 1.214 1.112 1.201 1.175 1.128 1.066
55 1.215 1.204 1.149 1.076 1.158 1.124 1.081 1.038
70 1.154 1.143 1.126 1.052 1.109 1.078 1.068 1.019
85 1.120 1.106 1.091 1.029 1.083 1.051 1.042 1.001
100 1.102 1.086 1.083 1.015 1.070 1.039 1.039 0.990
Mean, Pm 1.211 1.204 1.162 1.071 1.152 1.122 1.092 1.034
COV, Vp 0.085 0.092 0.068 0.042 0.065 0.070 0.050 0.033
Reliability index, β0 2.81 2.77 2.71 2.46 2.92 2.82 2.76 2.59
Concrete cubic strength,
fck (MPa)
PFE/PEN 1993-1-1 PFE/PASCE 8-02
SHC LHC THC +HC SHC LHC THC +HC
25 1.416 1.358 1.248 1.103 1.281 1.209 1.132 1.047
40 1.300 1.262 1.185 1.061 1.205 1.148 1.093 1.015
55 1.229 1.188 1.147 1.068 1.157 1.096 1.070 1.027
70 1.182 1.149 1.110 1.037 1.124 1.072 1.045 1.002
85 1.150 1.147 1.081 1.019 1.101 1.079 1.025 0.988
100 1.130 1.102 1.049 1.004 1.087 1.044 1.000 0.976
Mean, Pm 1.235 1.201 1.137 1.049 1.159 1.108 1.061 1.009
COV, Vp 0.082 0.071 0.062 0.038 0.058 0.051 0.051 0.034
Reliability index, β0 2.89 2.82 2.64 2.39 2.96 2.81 2.66 2.50
TH-1259_09610405
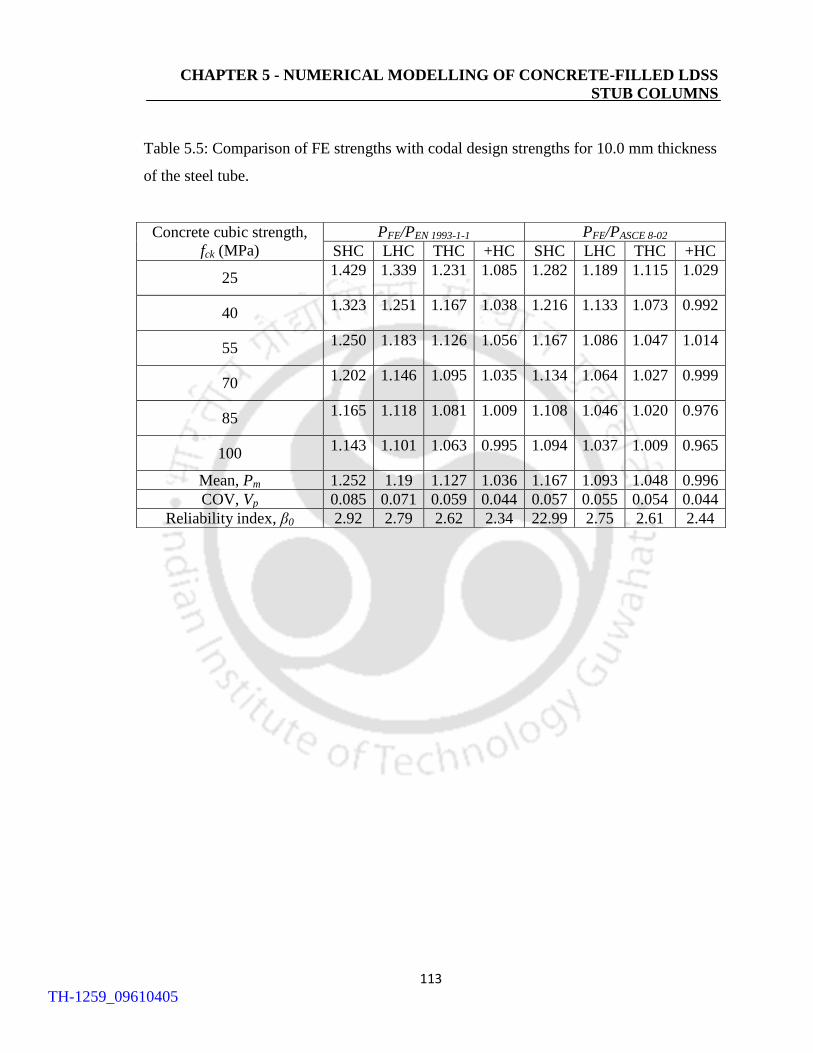
CHAPTER 5 - NUMERICAL MODELLING OF CONCRETE-FILLED LDSS
STUB COLUMNS
113
Table 5.5: Comparison of FE strengths with codal design strengths for 10.0 mm thickness
of the steel tube.
Concrete cubic strength,
fck (MPa)
PFE/PEN 1993-1-1 PFE/PASCE 8-02
SHC LHC THC +HC SHC LHC THC +HC
25 1.429 1.339 1.231 1.085 1.282 1.189 1.115 1.029
40 1.323 1.251 1.167 1.038 1.216 1.133 1.073 0.992
55 1.250 1.183 1.126 1.056 1.167 1.086 1.047 1.014
70 1.202 1.146 1.095 1.035 1.134 1.064 1.027 0.999
85 1.165 1.118 1.081 1.009 1.108 1.046 1.020 0.976
100 1.143 1.101 1.063 0.995 1.094 1.037 1.009 0.965
Mean, Pm 1.252 1.19 1.127 1.036 1.167 1.093 1.048 0.996
COV, Vp 0.085 0.071 0.059 0.044 0.057 0.055 0.054 0.044
Reliability index, β0 2.92 2.79 2.62 2.34 22.99 2.75 2.61 2.44
TH-1259_09610405

CHAPTER 5 - NUMERICAL MODELLING OF CONCRETE-FILLED LDSS
STUB COLUMNS
114
Figure 5.1: Typical Boundary conditions applied to CFDSST stub column FE models.
(a) S9
(Ellobody and Young, 2006)
(b) C1
(Zou et al., 2012)
(c) T-4
(Yang et al., 2012)
Figure 5.2: Concrete-filled steel tubular stub column specimens.
Concrete core Top rigid plate
Bottom rigid Plate
Roller
support
Fixed
support
CFDSST
stub column
LDSS tube
Concrete-infill
Steel tube
100 mm
100 m
m
400 m
m
150 mm
400 mm
150 m
m
110 mm
330 mm 110 m
m
Load
TH-1259_09610405
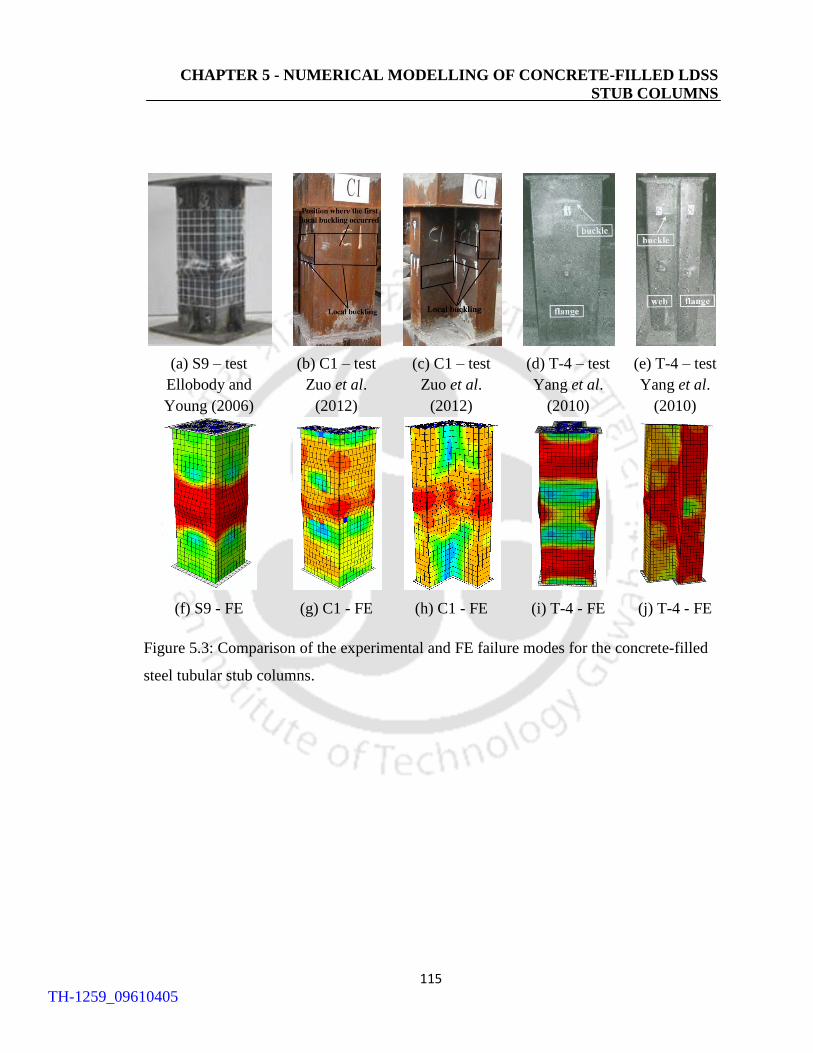
CHAPTER 5 - NUMERICAL MODELLING OF CONCRETE-FILLED LDSS
STUB COLUMNS
115
(a) S9 – test
Ellobody and
Young (2006)
(b) C1 – test
Zuo et al.
(2012)
(c) C1 – test
Zuo et al.
(2012)
(d) T-4 – test
Yang et al.
(2010)
(e) T-4 – test
Yang et al.
(2010)
(f) S9 - FE (g) C1 - FE (h) C1 - FE (i) T-4 - FE (j) T-4 - FE
Figure 5.3: Comparison of the experimental and FE failure modes for the concrete-filled
steel tubular stub columns.
TH-1259_09610405
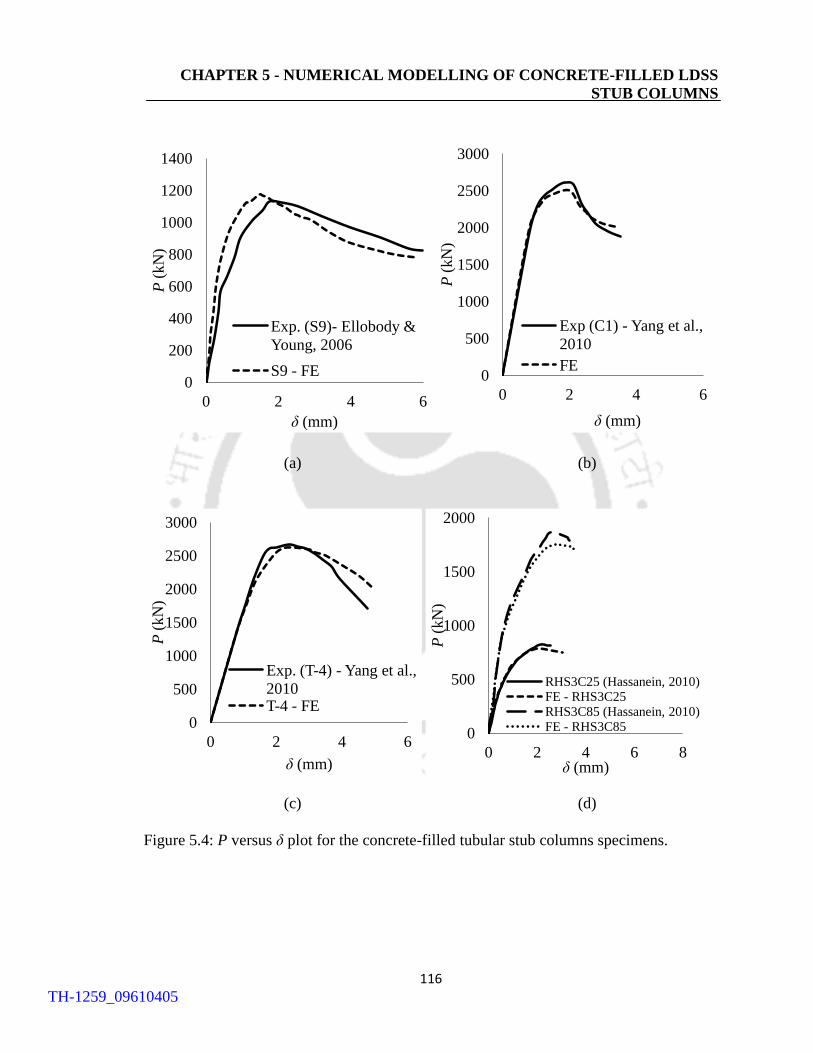
CHAPTER 5 - NUMERICAL MODELLING OF CONCRETE-FILLED LDSS
STUB COLUMNS
116
(a) (b)
(c) (d)
Figure 5.4: P versus δ plot for the concrete-filled tubular stub columns specimens.
0
200
400
600
800
1000
1200
1400
0 2 4 6
P (
kN
)
δ (mm)
Exp. (S9)- Ellobody &
Young, 2006
S9 - FE 0
500
1000
1500
2000
2500
3000
0 2 4 6
P (
kN
)
δ (mm)
Exp (C1) - Yang et al.,
2010
FE
0
500
1000
1500
2000
2500
3000
0 2 4 6
P (
kN
)
δ (mm)
Exp. (T-4) - Yang et al.,
2010 T-4 - FE
0
500
1000
1500
2000
0 2 4 6 8
P (
kN
)
δ (mm)
RHS3C25 (Hassanein, 2010) FE - RHS3C25 RHS3C85 (Hassanein, 2010) FE - RHS3C85
TH-1259_09610405
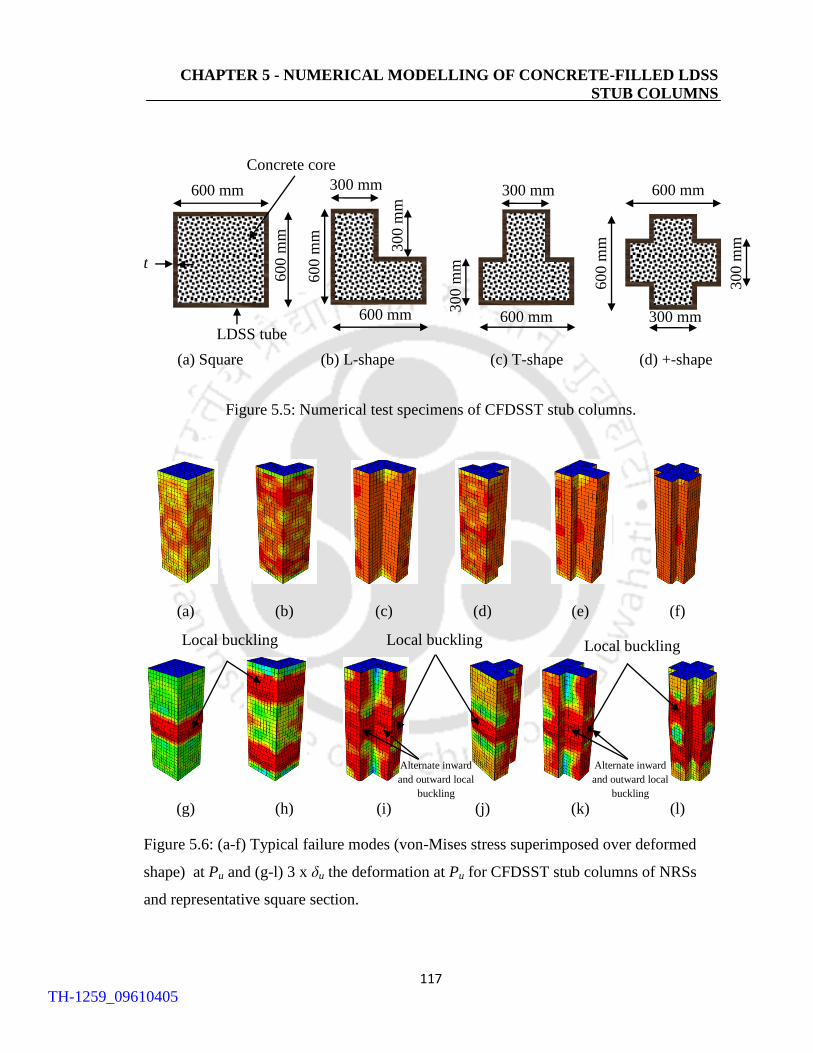
CHAPTER 5 - NUMERICAL MODELLING OF CONCRETE-FILLED LDSS
STUB COLUMNS
117
(a) Square (b) L-shape (c) T-shape (d) +-shape
Figure 5.5: Numerical test specimens of CFDSST stub columns.
(a) (b) (c) (d) (e) (f)
(g) (h) (i) (j) (k) (l)
Figure 5.6: (a-f) Typical failure modes (von-Mises stress superimposed over deformed
shape) at Pu and (g-l) 3 x δu the deformation at Pu for CFDSST stub columns of NRSs
and representative square section.
Local buckling
Alternate inward
and outward local
buckling
Alternate inward
and outward local
buckling
Local buckling Local buckling
300 mm
600 m
m
300 m
m
600 mm
300 m
m
600 mm
300 mm
600 m
m
600 mm
300 mm
300 m
m
600 m
m
600 mm
t
LDSS tube
Concrete core
TH-1259_09610405
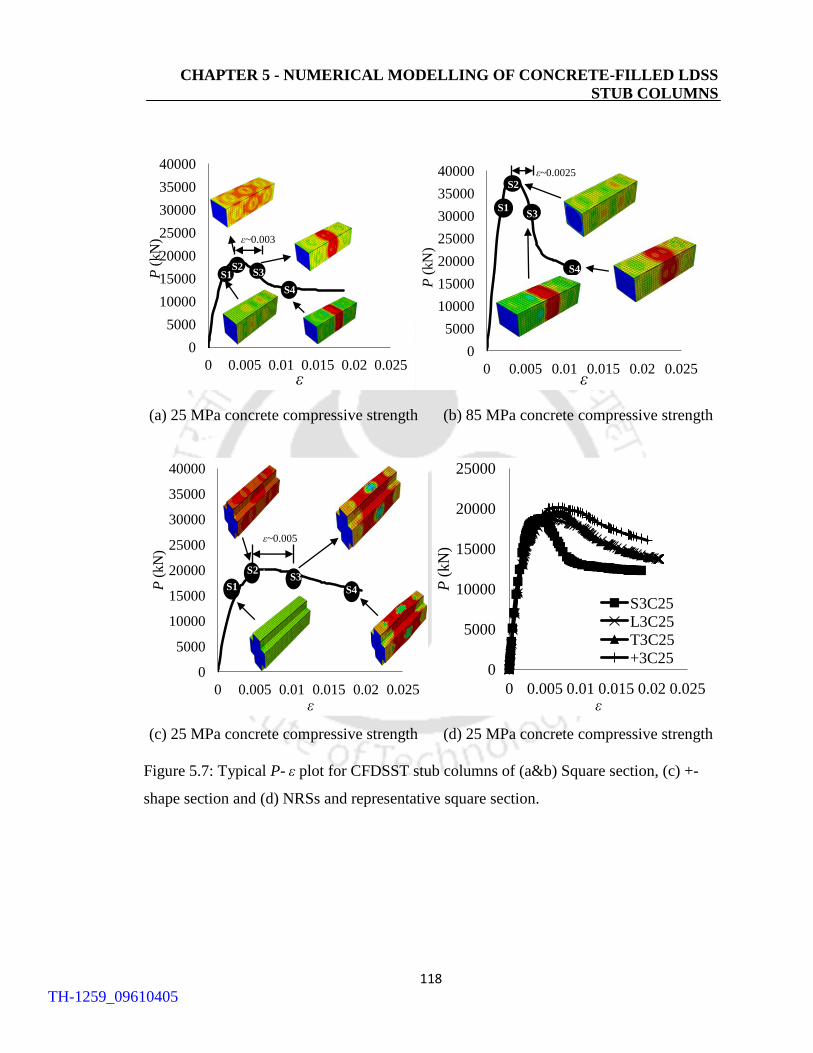
CHAPTER 5 - NUMERICAL MODELLING OF CONCRETE-FILLED LDSS
STUB COLUMNS
118
(a) 25 MPa concrete compressive strength (b) 85 MPa concrete compressive strength
(c) 25 MPa concrete compressive strength (d) 25 MPa concrete compressive strength
Figure 5.7: Typical P- ε plot for CFDSST stub columns of (a&b) Square section, (c) +-
shape section and (d) NRSs and representative square section.
0
5000
10000
15000
20000
25000
30000
35000
40000
0 0.005 0.01 0.015 0.02 0.025
P (
kN
)
ε
S1 S2
S3
S4
ε~0.003
0
5000
10000
15000
20000
25000
30000
35000
40000
0 0.005 0.01 0.015 0.02 0.025
P (
kN
)
ε
S2
S3
S4
S1
ε~0.0025
0
5000
10000
15000
20000
25000
30000
35000
40000
0 0.005 0.01 0.015 0.02 0.025
P (
kN
)
ε
S4
S2 S3
S1
ε~0.005
0
5000
10000
15000
20000
25000
0 0.005 0.01 0.015 0.02 0.025
P (
kN
)
ε
S3C25
L3C25
T3C25
+3C25
TH-1259_09610405
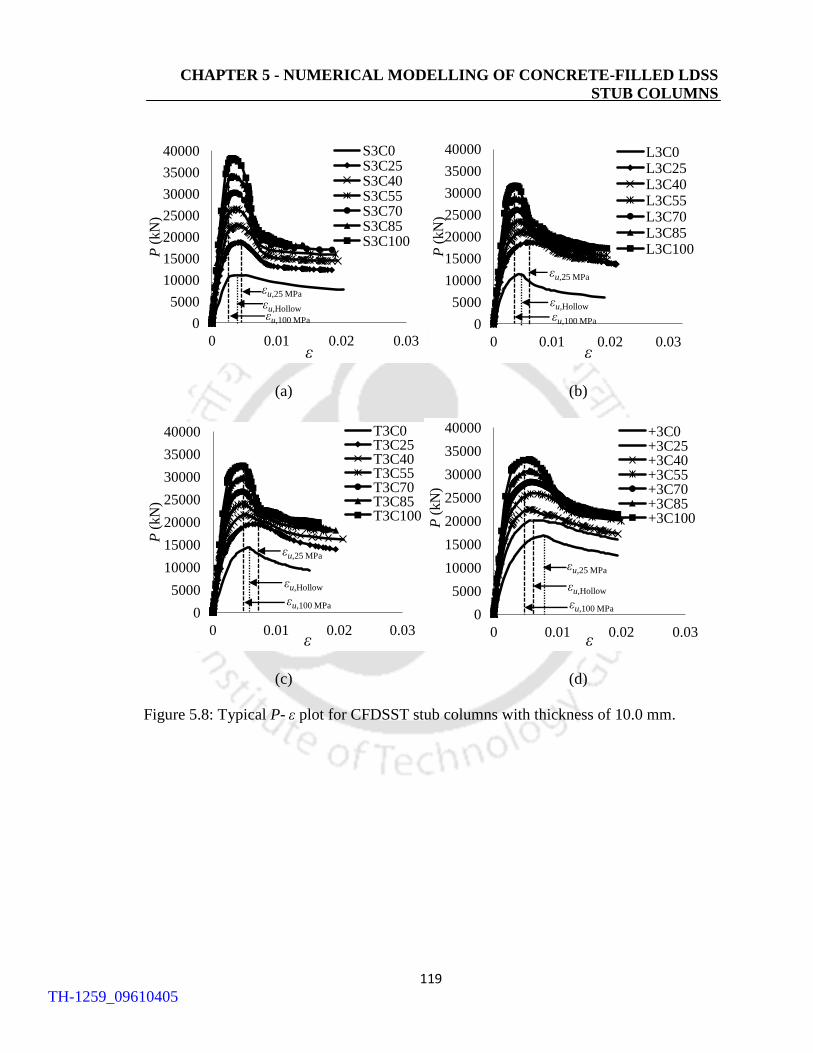
CHAPTER 5 - NUMERICAL MODELLING OF CONCRETE-FILLED LDSS
STUB COLUMNS
119
(a) (b)
(c) (d)
Figure 5.8: Typical P- ε plot for CFDSST stub columns with thickness of 10.0 mm.
0
5000
10000
15000
20000
25000
30000
35000
40000
0 0.01 0.02 0.03
P (
kN
)
ε
S3C0 S3C25 S3C40 S3C55 S3C70 S3C85 S3C100
εu,100 MPa
εu,Hollow
εu,25 MPa
0
5000
10000
15000
20000
25000
30000
35000
40000
0 0.01 0.02 0.03
P (
kN
)
ε
L3C0 L3C25 L3C40 L3C55 L3C70 L3C85 L3C100
εu,100 MPa
εu,Hollow
εu,25 MPa
0
5000
10000
15000
20000
25000
30000
35000
40000
0 0.01 0.02 0.03
P (
kN
)
ε
T3C0 T3C25 T3C40 T3C55 T3C70 T3C85 T3C100
εu,100 MPa
εu,Hollow
εu,25 MPa
0
5000
10000
15000
20000
25000
30000
35000
40000
0 0.01 0.02 0.03
P (
kN
)
ε
+3C0 +3C25 +3C40 +3C55 +3C70 +3C85 +3C100
εu,25 MPa
εu,Hollow
εu,100 MPa
TH-1259_09610405
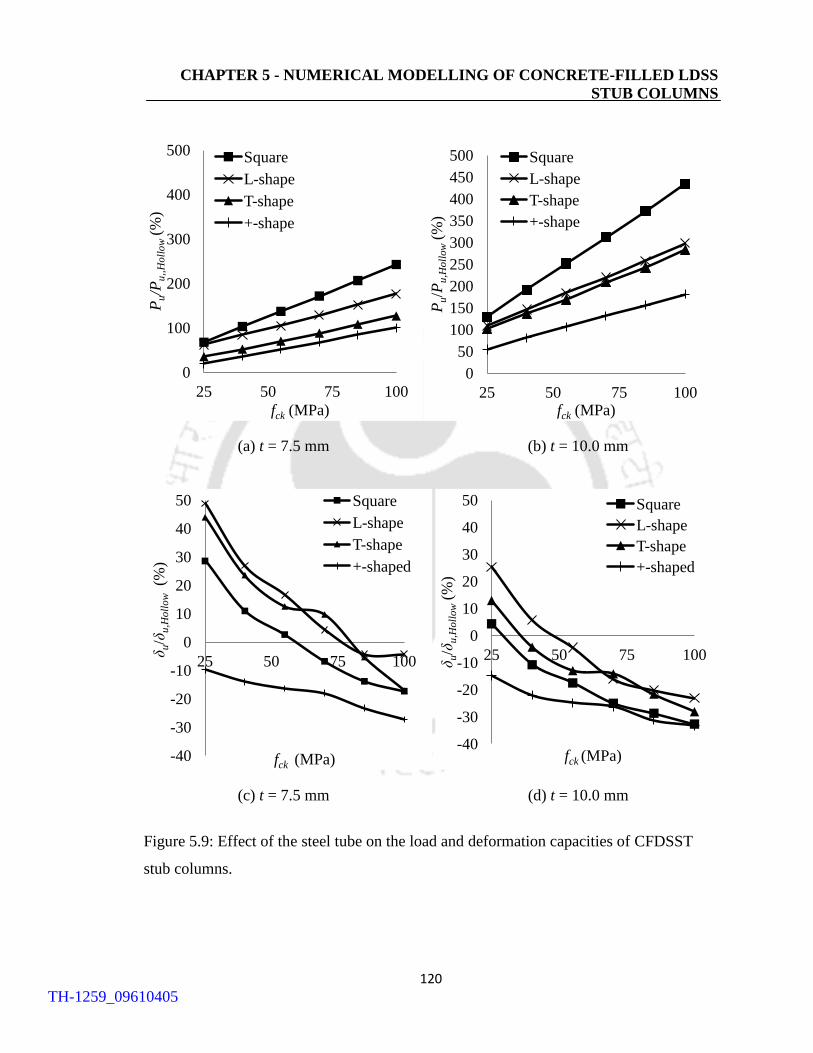
CHAPTER 5 - NUMERICAL MODELLING OF CONCRETE-FILLED LDSS
STUB COLUMNS
120
(a) t = 7.5 mm (b) t = 10.0 mm
(c) t = 7.5 mm (d) t = 10.0 mm
Figure 5.9: Effect of the steel tube on the load and deformation capacities of CFDSST
stub columns.
0
100
200
300
400
500
25 50 75 100
Pu/P
u,,
Ho
llo
w (
%)
fck (MPa)
Square
L-shape
T-shape
+-shape
0
50
100
150
200
250
300
350
400
450
500
25 50 75 100
Pu/P
u,H
oll
ow (
%)
fck (MPa)
Square
L-shape
T-shape
+-shape
-40
-30
-20
-10
0
10
20
30
40
50
25 50 75 100
δu/δ
u,H
oll
ow (%
)
fck (MPa)
Square
L-shape
T-shape
+-shaped
-40
-30
-20
-10
0
10
20
30
40
50
25 50 75 100
δu/δ
u,H
oll
ow (
%)
fck (MPa)
Square
L-shape
T-shape
+-shaped
TH-1259_09610405

CHAPTER 5 - NUMERICAL MODELLING OF CONCRETE-FILLED LDSS
STUB COLUMNS
121
Figure 5.10: Typical plot of Pu versus fck for CFDSST stub columns (t = 10.0 mm).
Figure 5.11: Efficiency of CFDSST stub columns for thicknesses of 7.5 mm and 10.0
mm.
0
5000
10000
15000
20000
25000
30000
35000
40000
20 40 60 80 100
Pu (
kN
)
fck (MPa)
Square
L-shape
T-shape
+-shape
Normal
strength
concrete
High
strength
concrete
1
1.2
1.4
1.6
1.8
2
2.2
2.4
2.6
25 50 75 100
Pu/P
u,2
5
fck (MPa)
S1 L1
T1 +1C
S3 L3
T3 +3C
TH-1259_09610405

CHAPTER 5 - NUMERICAL MODELLING OF CONCRETE-FILLED LDSS
STUB COLUMNS
122
(a)
(b)
Figure 5.12: (a) P versus t for CFDSST stub columns; (b) Typical plot of Pu versus fck for
CFDSST stub columns.
0
5000
10000
15000
20000
25000
30000
35000
40000
7 8 9 10
Pu (
kN
)
t (mm)
S - (25MPa) L - (25MPa)
T- (25MPa) +- (25MPa)
S - (100MPa) L- (100 MPa)
T- (100MPa) +- (100MPa)
0
5000
10000
15000
20000
25000
30000
35000
40000
20 40 60 80 100
Pu (
kN
)
fck (MPa)
S1
S2
S3
TH-1259_09610405

CHAPTER 5 - NUMERICAL MODELLING OF CONCRETE-FILLED LDSS
STUB COLUMNS
123
(a)
(b)
Figure 5.13: (a) Effect of shape on the δu versus fck for CFDSST stub columns; (b) Effect
of t on the δu versus fck for CFDSST stub columns.
0
2
4
6
8
10
12
25 50 75 100
δu (
mm
)
fck (MPa)
Square
L-shape
T-shape
+-shape
0
2
4
6
8
10
12
7.0 7.5 8.0 8.5 9.0 9.5 10.0
δu (
mm
)
t (mm)
S - 25MPa L - 25MPa
T - 25MPa + - 25MPa
S - 100MPa L - 100MPa
T - 100MPa + - 100MPa
TH-1259_09610405
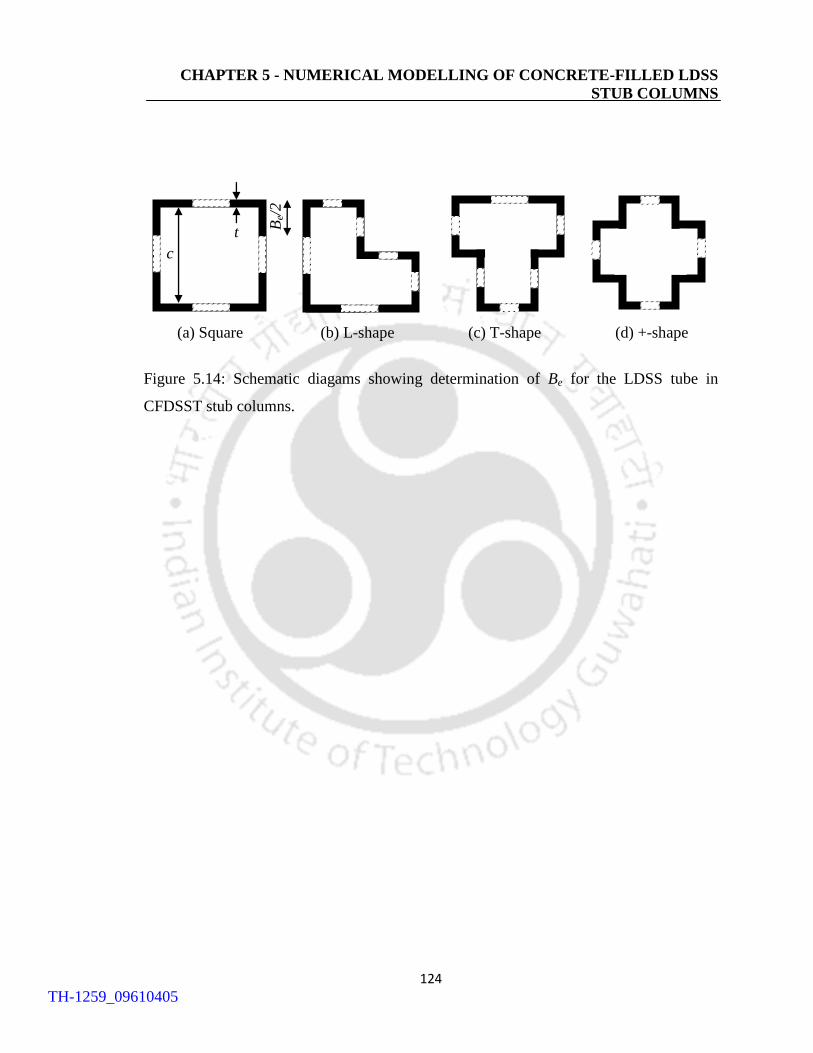
CHAPTER 5 - NUMERICAL MODELLING OF CONCRETE-FILLED LDSS
STUB COLUMNS
124
Figure 5.14: Schematic diagams showing determination of Be for the LDSS tube in
CFDSST stub columns.
(a) Square (b) L-shape (c) T-shape (d) +-shape
Be/
2
c
t
TH-1259_09610405
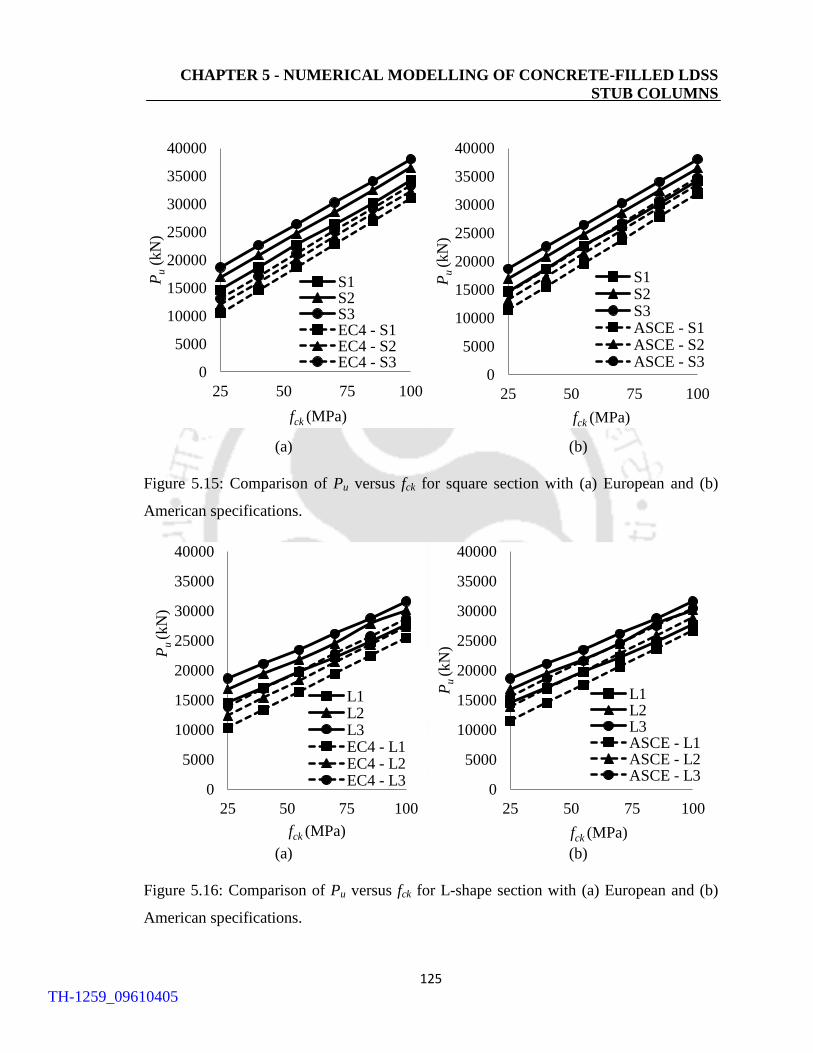
CHAPTER 5 - NUMERICAL MODELLING OF CONCRETE-FILLED LDSS
STUB COLUMNS
125
(a) (b)
Figure 5.15: Comparison of Pu versus fck for square section with (a) European and (b)
American specifications.
(a) (b)
Figure 5.16: Comparison of Pu versus fck for L-shape section with (a) European and (b)
American specifications.
0
5000
10000
15000
20000
25000
30000
35000
40000
25 50 75 100
Pu (
kN
)
fck (MPa)
S1 S2 S3 EC4 - S1 EC4 - S2 EC4 - S3
0
5000
10000
15000
20000
25000
30000
35000
40000
25 50 75 100
Pu
(kN
)
fck (MPa)
S1 S2 S3 ASCE - S1 ASCE - S2 ASCE - S3
0
5000
10000
15000
20000
25000
30000
35000
40000
25 50 75 100
Pu
(kN
)
fck (MPa)
L1 L2 L3 EC4 - L1 EC4 - L2 EC4 - L3
0
5000
10000
15000
20000
25000
30000
35000
40000
25 50 75 100
Pu
(kN
)
fck (MPa)
L1 L2 L3 ASCE - L1 ASCE - L2 ASCE - L3
TH-1259_09610405

CHAPTER 5 - NUMERICAL MODELLING OF CONCRETE-FILLED LDSS
STUB COLUMNS
126
(a) (b)
Figure 5.17: Comparison of Pu versus fck for T-shape section with (a) European and (b)
American specifications.
(a) (b)
Figure 5.18: Comparison of Pu versus fck for +-shape section with (a) European and (b)
American specifications.
0
5000
10000
15000
20000
25000
30000
35000
40000
25 50 75 100
Pu
(kN
)
fck (MPa)
T1
T2
T3
0
5000
10000
15000
20000
25000
30000
35000
40000
25 50 75 100
Pu
(kN
)
fck (MPa)
T1
T2
T3
0
5000
10000
15000
20000
25000
30000
35000
40000
25 50 75 100
Pu
(kN
)
fck (MPa)
+1 +2 +3 EC4 - +1 EC4 - +2 EC4 - +3
0
5000
10000
15000
20000
25000
30000
35000
40000
25 50 75 100
Pu
(kN
)
fck (MPa)
+1 +2 +3 ASCE - +1 ASCE - +2 ASCE - +3
TH-1259_09610405
127
CHAPTER 6
NUMERICAL MODELLING OF CONCRETE-
FILLED LEAN DUPLEX STAINLESS SLENDER
COLUMNS
6.1 INTRODUCTION
A detailed account of nonlinear FE analyses of CFDSST stub columns under pure axial
compression is given in Chapter 5, where comparison of the load and deformation
capacities of the CFDSST stub columns with NRSs and representative square section was
made. In this chapter, extension of the CFDSST stub columns to fixed-ended CFDSST
slender columns to explore their structural performances under axial compression at
different lengths, where the NRSs having same LDSS cross-sectional area and 36 %
reduction in the concrete core area as compared to the representative square section is
presented. The main objective is to study the effects of cross-sectional geometries on the
strength and behavior of the fixed-ended CFDSST slender columns with NRSs and
representative square section. The currently available design standards on stainless steel,
such as the European (EN 1994-1-1, 2004) and the American (ANSI/AISC 360-05, 2005)
specifications, were assessed based on the FE results for their applicability in the design
of fixed-ended CFDSST slender columns. Based on the FE results reliability analysis was
then carried out.
TH-1259_09610405
CHAPTER 6 - NUMERICAL MODELLING OF CONCRETE-FILLED SLENDER
COLUMNS
128
6.2 FE MODELLING
The development of an accurate FE models representation for the fixed-ended CFDSST
slender columns taking account of the appropriate representation of the corresponding
material characteristics (i.e. LDSS and concrete core material) were similar to that
detailed in Section 5.2. Similar analyses technique (i.e. the modified RIKS method),
boundary conditions, concrete-LDSS tube interface properties, and the elements used for
representation of the LDSS tube (S4R) and the concrete core (C3D8R) were adopted in
the FE analyses for the fixed-ended CFDSST slender columns as discussed in detail in
the previous chapters.
6.2.1 Concrete core material model
The stress-strain curve development of the concrete core in the fixed-ended CFDSST
slender columns is detailed in Section 2.7.2. Due to the thin nature of the LDSS tube
adopted in the FE models (i.e. D/t > 29.2); inadequately confined concrete material model
was adopted similar to that followed in the analyses of CFDSST stub columns. In the
CFDSST slender columns under pure axial compressive loading, the concrete core
experiences compressive state at initial stage of loading and both tensile and compressive
state at later stage due to flexural deformation of the column. Hence, the concrete damage
plasticity (CDP) model provided in the material library of Abaqus (2009) is applied for
describing the constitutive behavior of concrete core due to the inability of the Drucker-
Prager yield criterion model adopted in Chapter 5 to simulate the concrete core under
such tensile and compressive state. Detailed modelling of the inadequately confined
concrete core in fixed-ended CFDSST slender column FE models through the CDP
model is described in Appendix E.
TH-1259_09610405
CHAPTER 6 - NUMERICAL MODELLING OF CONCRETE-FILLED SLENDER
COLUMNS
129
6.2.2 Initial geometric imperfections
Linear elastic analysis technique was initially performed on the fixed-ended CFDSST
slender column FE models to the global buckling mode shapes. The first global buckling
mode shapes are then utilised as initial geometric imperfections pattern to perturb the
geometry of the slender columns similar to that followed in Chapter 4 for the FE analyses
of the fixed-ended hollow tubular slender columns.
The effect of local geometric imperfections on the fixed-ended CFDSST slender columns
were neglected because the strength reduction is not significant compared to thin-walled
hollow tubes owing to the delaying effect of steel tube local buckling by the concrete
core (Tao et al., 2009). However, global geometric imperfections were considered as it is
one of the main effect factors on the ultimate strength (Galambos, 1998). The global
geometric imperfections of the concrete-filled tubular columns mainly come from initial
out-of-straightness of the steel tubes. Thus, the global geometric imperfection magnitude
in all the fixed-ended CFDSST slender column FE models was assumed as L/1500
similar to that adopted in the FE analyses of fixed-ended hollow tubular slender columns
as discussed in Section 4.2.3. This imperfection magnitude was applied at the mid-span
of the column in the plane of the weaker principal axis for all the fixed-ended CFDSST
slender column FE models.
6.3 VERIFICATION OF THE FE MODEL
The validity of the fixed-ended CFDSST slender column FE models was established
through comparison with various experimental test conducted on concrete-filled thin-
walled stainless steel tubular slender columns of square and rectangular sections by Uy et
al., 2011. Figure 6.2 shows a comparison of Pu with L/D ratio for the concrete-filled thin-
walled stainless steel tubular slender columns. It can be seen from Figure 6.2 that good
agreement was achieved between the developed FE models and the experimental test
TH-1259_09610405
CHAPTER 6 - NUMERICAL MODELLING OF CONCRETE-FILLED SLENDER
COLUMNS
130
results. Hence, the steps followed in the verification of FE models was used in
subsequent FE analysis of fixed-ended CFDSST slender columns.
6.4 CONCRETE-FILLED TUBULAR SLENDER COLUMN MODELLING
6.4.1 Introduction
As part of the study, a series of FE models to investigate the structural behaviour of
fixed-ended CFDSST slender columns with NRSs and representative square section
subjected to pure axial compression over a range of column lengths having normal
concrete strength (i.e. 25 MPa) were reported. The effects of column lengths and cross-
sectional shapes on the buckling strength of these columns were analysed.
6.4.2 Development of the FE models
Fixed-ended CFDSST columns with NRSs and the representative square section with
lengths varying from 1.8 - 70.0 m which provided a range of , defined through by
Equation 6.1, in accordance with EN1993-1-4 (2006), from 0.05 to 2.0, were considered
for the parametric studies.
crN
N0 (6.1)
where;
No = Asfy + Acfc as per EN1994-1-1(2004) (6.2)
No = Asfn + Acfc as per ANSI/AISC 360-05 (2005) (6.3)
2
2 6.0
e
ccsscr
L
IEIEN
as per EN1994-1-1(2004) (6.4)
TH-1259_09610405
CHAPTER 6 - NUMERICAL MODELLING OF CONCRETE-FILLED SLENDER
COLUMNS
131
2
2 26.0
e
sc
sccss
crL
A
AIEIE
N
as per ANSI/AISC 360-05 (2005) (6.5)
Asc = As + Ac (6.6)
where Ncr is the nominal Euler load for concrete-filled tubular columns representing the
ultimate strength of an ideal elastic columns under pure axial compression, and Is and Ic
are the moment of inertia for steel tube and concrete core, respectively.
The dimensions and material properties of the CFDSST columns are summarized in
Table 6.2 (also see Figure 6.3). The fixed-ended CFDSST slender columns are labeled
such that the cross-sectional shape, concrete cube strength as well as the column lengths
can be identified from the label. For example, the label ‘SC25L36000’ and
‘LC25L36000’ defines the square and L-shaped LDSS columns indicated by the first
letter ‘S and L’, respectively, and the letter ‘C25’ and ‘L36000’ defines the concrete cube
strength in MPa (25 MPa) and length of 36000 mm, respectively. Similar to the work of
other researchers (e.g. Hassanein, 2010, Zuo et al., 2012, Zhang et al., 2012), the corners
of the CFDSST slender columns are assumed herein to be exact 900 (i.e corner radii are
not considered).
Based on the thickness of the LDSS tube of 10.0 mm considered in the current
investigation, the width-to-thickness ratios of the LDSS tube in all the cross-sections
considered are all greater than 29.2. Hence, inadequately confined concrete model was
adopted in the fixed-ended CFDSST slender column FE models as discussed in the
previous chapters, considering the thin-walled mature of the LDSS tube.
TH-1259_09610405
CHAPTER 6 - NUMERICAL MODELLING OF CONCRETE-FILLED SLENDER
COLUMNS
132
6.5 RESULTS AND DISCUSSIONS
6.5.1 Introduction
The results of the FE analysis for the fixed-ended CFDSST slender columns were
presented in terms of variation in the load and deformation capacities along with the
failure modes with change in the cross-sectional shapes. The FE results were compared
with the currently available design standards for stainless steel, such as, the European
(EN1994-1-1, 2004) and American (ANSI/AISC 360-05, 2005) specifications for their
applicability in the design of fixed-ended CFDSST slender columns. Reliability analyses
of these design standards were also discussed based on the FE studies.
6.5.2 Deformed shapes of concrete-filled NRSs and square section
Figure 6.4 shows the failure modes of fixed-ended LDSS hollow tubular and CFDSST
slender columns. It can be seen from Figure 6.4 that only overall buckling is seen for both
the hollow tubular and CFDSST columns at Pu. At post ultimate load, LDSS hollow
tubular members fails through overall buckling and thereafter accompanied by local
buckling of the LDSS tube at mid-height sections (see Figure 6.4e-h). However, local
buckling of the LDSS tube is prevented due to the concrete core in CFDSST columns
(see Figure 6.4i-l).
6.5.3 Load-axial deformation profile
Figures 6.5 and 6.6 show a typical P versus δ as well as umu (i.e. mid-height deflection at
Pu) for fixed-ended CFDSST and the reference LDSS hollow tubular slender columns. As
similar nature of P versus δ and P versus umu are also observed for other CFDSST’s and
the reference LDSS hollow tubular slender columns, only square and +-shape columns
are plotted.
TH-1259_09610405

CHAPTER 6 - NUMERICAL MODELLING OF CONCRETE-FILLED SLENDER
COLUMNS
133
It can be seen from Figure 6.5 that the Pu of CFDSST columns is higher than that of the
reference hollow steel tubular columns because of increased flexural rigidity provided by
the concrete core, thereby achieving higher umu by the CFDSST columns (see Figure 6.6).
However, δu of CFDSST column is lower than that of the reference LDSS hollow tubular
column because of higher compression stiffness offered by the concrete core. It can be
seen from Figure 6.6 that the larger the column length, the smaller the peak load is for
both the CFDSST and the reference LDSS hollow tubular columns due to the failure of
longer columns governed principally by flexure and failing to reach the yield load. Also,
with increasing column length, the post-peak curve becomes milder for both the hollow
and CFDSST column.
6.5.4 Strength capacity of NRSs and square section
Figure 6.7 shows the effect of cross-sectional shapes for fixed-ended CFDSST slender
columns on the Pu versus curves. It can be seen from Figure 6.7 that for all the sections
analysed Pu decreases with increasing . Also, +-shape and T-shape sections showed a
higher Pu for all the , however, L-shape section showed a similar Pu at lower and a
lower Pu at higher compared to that of the representative square section.
Figure 6.8 shows the efficiency of fixed-ended concrete-filled CFDSST slender columns
of NRSs to identify the type of relationship with change in the cross-sectional shape from
square section to NRSs. Simply, it can be seen from Figure 6.8 that, for ~ < 0.5, +-
shape showed a 7 % higher strength and L- and +-shape showed similar strengths
compared to the representative square section. For 0.5 ≤ ≥ 1.5, a linear increasing trend
in strength is seen with increasing . However, for > 0.5, T- and +-shape showed a 10
% and 25 % more strength and L-shape showing a 10 % lower strength compared to the
representative square section. Thus, in fixed-ended CFDSST slender columns, change of
TH-1259_09610405
CHAPTER 6 - NUMERICAL MODELLING OF CONCRETE-FILLED SLENDER
COLUMNS
134
cross-sectional shape from square section to NRSs is significant, especially for T-shape
and +-shape sections, and can promote the application of thin-wall LDSS tube.
6.5.5 Deformation capacity of NRSs and square section
Figure 6.9 shows the effect of cross-sectional shapes on the εu versus curves for fixed-
ended CFDSST slender columns. It can be seen that the influence of the cross-sectional
shapes on the εu becomes less significant with increasing , but becomes increasingly
significant with decreasing . Also, it can be seen that, the NRSs shows a higher εu for
all considered compared to the representative square section, with +-shape section
showing the highest εu.
6.5.6 Comparison with design codes
The results from the FE analyses were compared with the unfactored design strengths
predicted using the European (EN1994-1-1, 2004) and American (ANSI/AISC 360-05,
2005) specifications. A sample design strength calculation for the fixed-ended square
CFDSST slender column with the two design standards is given in Appendix F. As the
current design standards are based on stainless steel material, the applicability of these
codes in the design of fixed-ended CFDSST slender columns are assessed through the FE
studies. A detail comparison between the FE results and the design standard predictions
are discussed in the following sub-sections.
6.5.6.1 Effective area determination
In the present study of fixed ended CFDSST slender columns, all the cross-sections
considered lies under Class 4 section, hence, the effective width concept as detailed in
Section 3.5.7.1 given in EN 1993-1-4 (2006) to account for the effect of local buckling on
TH-1259_09610405
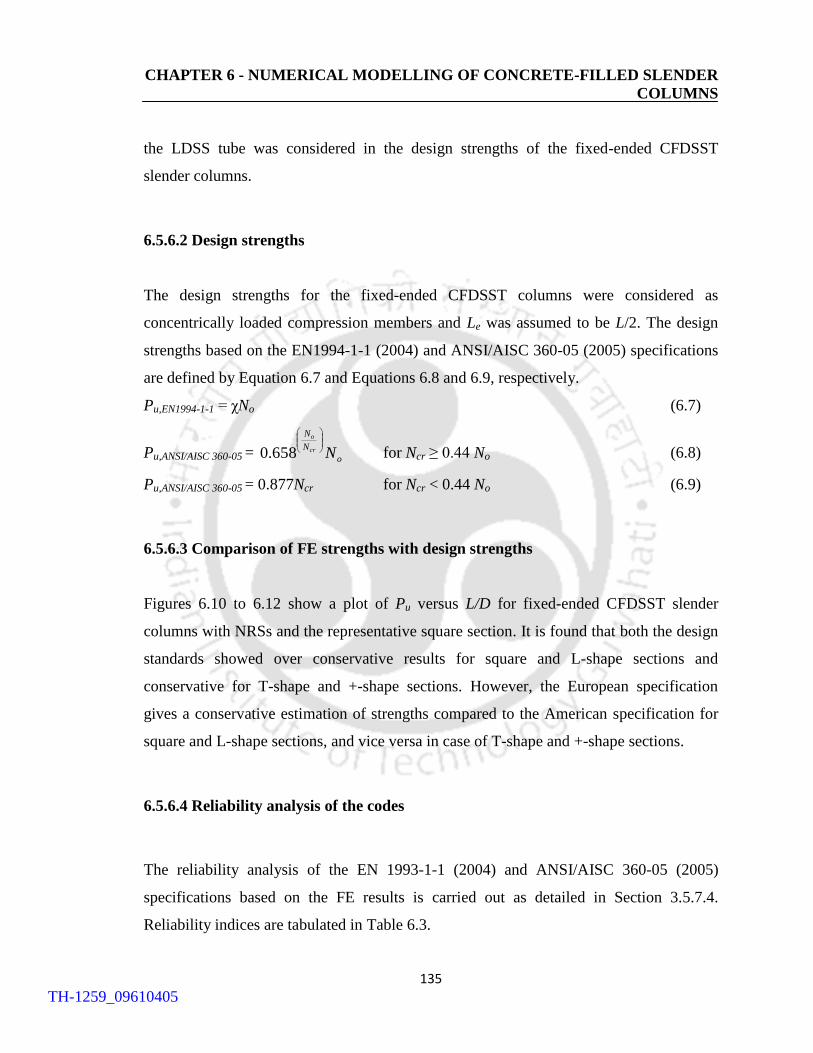
CHAPTER 6 - NUMERICAL MODELLING OF CONCRETE-FILLED SLENDER
COLUMNS
135
the LDSS tube was considered in the design strengths of the fixed-ended CFDSST
slender columns.
6.5.6.2 Design strengths
The design strengths for the fixed-ended CFDSST columns were considered as
concentrically loaded compression members and Le was assumed to be L/2. The design
strengths based on the EN1994-1-1 (2004) and ANSI/AISC 360-05 (2005) specifications
are defined by Equation 6.7 and Equations 6.8 and 6.9, respectively.
Pu,EN1994-1-1 = χNo (6.7)
Pu,ANSI/AISC 360-05 = o
N
N
Ncr
o
658.0 for Ncr ≥ 0.44 No (6.8)
Pu,ANSI/AISC 360-05 = 0.877Ncr for Ncr < 0.44 No (6.9)
6.5.6.3 Comparison of FE strengths with design strengths
Figures 6.10 to 6.12 show a plot of Pu versus L/D for fixed-ended CFDSST slender
columns with NRSs and the representative square section. It is found that both the design
standards showed over conservative results for square and L-shape sections and
conservative for T-shape and +-shape sections. However, the European specification
gives a conservative estimation of strengths compared to the American specification for
square and L-shape sections, and vice versa in case of T-shape and +-shape sections.
6.5.6.4 Reliability analysis of the codes
The reliability analysis of the EN 1993-1-1 (2004) and ANSI/AISC 360-05 (2005)
specifications based on the FE results is carried out as detailed in Section 3.5.7.4.
Reliability indices are tabulated in Table 6.3.
TH-1259_09610405
CHAPTER 6 - NUMERICAL MODELLING OF CONCRETE-FILLED SLENDER
COLUMNS
136
Based on the reliability analyses it can be seen that, except for L-shape section, both the
design standards show β0 ≥ 2.5 when compared with the FE results. Considering the
lower limit of β0 = 2.5 suggested by ASCE 8-02 (2002) specification for structural
members, it can be inferred that both specifications can be adopted for all the design of
fixed-ended CFDSST slender columns, except for the L-shape section, wherein a suitable
modification may be employed after systematic studies (including experiments). For the
design of fixed-ended CFDSST slender columns of square and L-shape sections,
American specification tends to be more reliable compared to the European specification
and vice versa in the design for the fixed-ended CFDSST slender columns of T-shape and
+-shape sections.
6.6 CONCLUSIONS
The FE modeling of fixed-ended CFDSST slender columns of NRSs and representative
square sections subjected to pure axial compressive loading are discussed in this Chapter.
Variations in buckling strength with changes in the cross-sectional shapes were studied
by considering equal LDSS material cross-sectional areas (or equal LDSS material
consumption), thereby giving a reduction in the concrete core area of the NRSs by about
36 % compared to the representative square section, over a range of column lengths. The
following conclusions are drawn within the limitation of this study:
1) At Pu, only overall buckling is seen for both the hollow tubular and CFDSST
columns. At post Pu, LDSS hollow tubular members fails through overall buckling
and thereafter accompanied by local buckling of the LDSS tube at mid-height
sections. However, local buckling of the LDSS tube is prevented due to the concrete
core in CFDSST columns.
TH-1259_09610405

CHAPTER 6 - NUMERICAL MODELLING OF CONCRETE-FILLED SLENDER
COLUMNS
137
2) The Pu of CFDSST columns is higher than that of the reference hollow steel tubular
columns because of increased flexural rigidity provided by the concrete core, thereby
achieving higher umu by the CFDSST columns. However, the δu of CFDSST column
is lower than that of the reference LDSS hollow tubular column because of a higher
elastic compression stiffness of the latter due to concrete core
3) For all the section analysed the Pu decreases with increasing . Also, +-shape and T-
shape sections show a higher Pu for all the , however, L-shape section showed a
similar Pu at lower and a lower Pu at higher compared to that of the
representative square section.
4) For ~ < 0.5, +-shape showed a 7 % higher strength and L- and +-shape showed
similar strengths compared to the representative square section. For 0.5 ≤ ≥ 1.5, a
linear increasing trend in strength is seen with increasing . However, for > 0.5, T-
and +-shape showed a 10 % and 25 % more strength and L-shape showing a 10 %
lower strength compared to the representative square section.
5) In fixed-ended CFDSST slender columns, change of cross-sectional shape from square
section to NRSs is significant, especially for T-shape and +-shape sections, and can
promote the application of thin-wall LDSS tube.
6) The influence of the cross-sectional shapes on the εu becomes less significant with
increasing , but becomes increasingly significant with decreasing . Also, NRSs
shows a higher εu for all considered compared to the representative square section,
with +-shape section showing the highest εu.
7) The design standards show over conservative results for square and L-shape sections
and conservative for T-shape and +-shape sections. However, the European
specification gives a conservative estimation of strengths compared to the American
TH-1259_09610405
CHAPTER 6 - NUMERICAL MODELLING OF CONCRETE-FILLED SLENDER
COLUMNS
138
specification for square and L-shape sections and vice versa in case of T-shape and +-
shape sections.
8) Based on the reliability analyses both specifications can be adopted for all the design
of fixed-ended CFDSST slender columns, except for the L-shape section, wherein a
suitable modification may be employed after systematic studies (including
experiments). For the design of fixed-ended CFDSST slender columns of square and
L-shape sections, American specification tends to be more reliable compared to the
European specification and vice versa in the design for the fixed-ended CFDSST
slender columns of T-shape and +-shape sections.
TH-1259_09610405
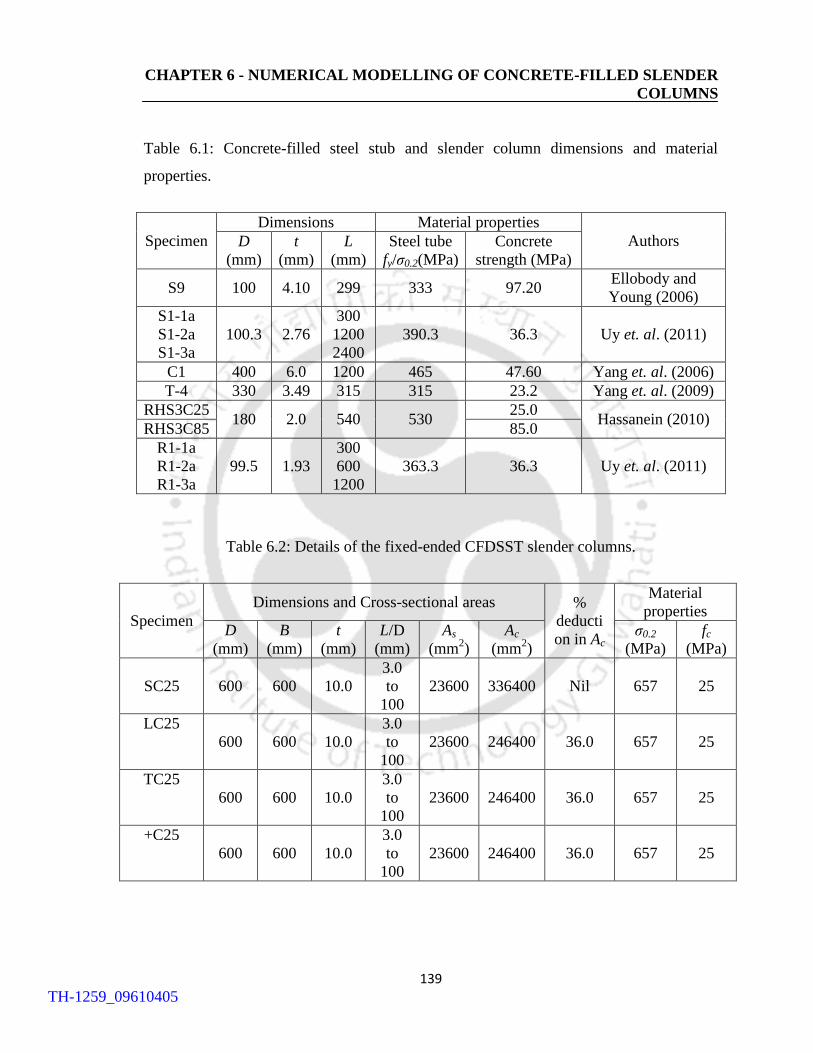
CHAPTER 6 - NUMERICAL MODELLING OF CONCRETE-FILLED SLENDER
COLUMNS
139
Table 6.1: Concrete-filled steel stub and slender column dimensions and material
properties.
Specimen
Dimensions Material properties
Authors D
(mm)
t
(mm)
L
(mm)
Steel tube
fy/σ0.2(MPa)
Concrete
strength (MPa)
S9 100 4.10 299 333 97.20 Ellobody and
Young (2006)
S1-1a
S1-2a
S1-3a
100.3 2.76
300
1200
2400
390.3 36.3 Uy et. al. (2011)
C1 400 6.0 1200 465 47.60 Yang et. al. (2006)
T-4 330 3.49 315 315 23.2 Yang et. al. (2009)
RHS3C25 180 2.0 540 530
25.0 Hassanein (2010)
RHS3C85 85.0
R1-1a
R1-2a
R1-3a
99.5 1.93
300
600
1200
363.3 36.3 Uy et. al. (2011)
Table 6.2: Details of the fixed-ended CFDSST slender columns.
Specimen
Dimensions and Cross-sectional areas %
deducti
on in Ac
Material
properties
D
(mm)
B
(mm)
t
(mm)
L/D
(mm)
As
(mm2)
Ac
(mm2)
σ0.2
(MPa)
fc
(MPa)
SC25 600 600 10.0
3.0
to
100
23600 336400 Nil 657 25
LC25
600 600 10.0
3.0
to
100
23600 246400 36.0 657 25
TC25
600 600 10.0
3.0
to
100
23600 246400 36.0 657 25
+C25
600 600 10.0
3.0
to
100
23600 246400 36.0 657 25
TH-1259_09610405
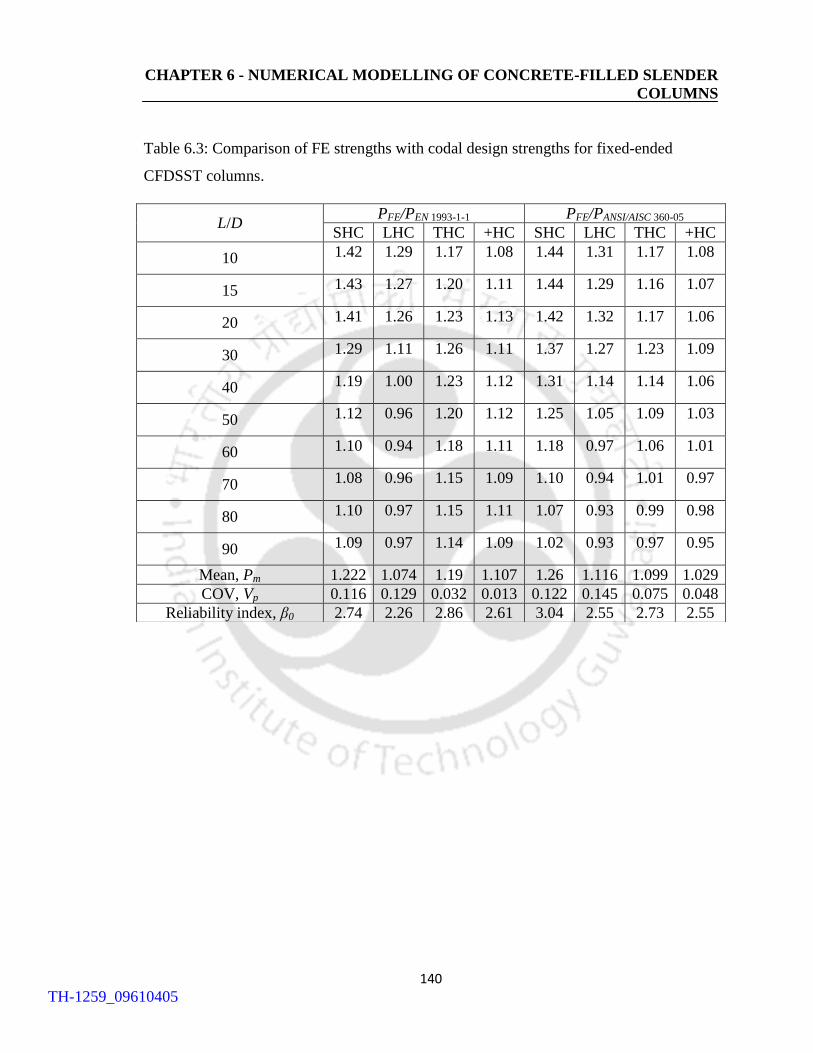
CHAPTER 6 - NUMERICAL MODELLING OF CONCRETE-FILLED SLENDER
COLUMNS
140
Table 6.3: Comparison of FE strengths with codal design strengths for fixed-ended
CFDSST columns.
L/D PFE/PEN 1993-1-1 PFE/PANSI/AISC 360-05
SHC LHC THC +HC SHC LHC THC +HC
10 1.42 1.29 1.17 1.08 1.44 1.31 1.17 1.08
15 1.43 1.27 1.20 1.11 1.44 1.29 1.16 1.07
20 1.41 1.26 1.23 1.13 1.42 1.32 1.17 1.06
30 1.29 1.11 1.26 1.11 1.37 1.27 1.23 1.09
40 1.19 1.00 1.23 1.12 1.31 1.14 1.14 1.06
50 1.12 0.96 1.20 1.12 1.25 1.05 1.09 1.03
60 1.10 0.94 1.18 1.11 1.18 0.97 1.06 1.01
70 1.08 0.96 1.15 1.09 1.10 0.94 1.01 0.97
80 1.10 0.97 1.15 1.11 1.07 0.93 0.99 0.98
90 1.09 0.97 1.14 1.09 1.02 0.93 0.97 0.95
Mean, Pm 1.222 1.074 1.19 1.107 1.26 1.116 1.099 1.029
COV, Vp 0.116 0.129 0.032 0.013 0.122 0.145 0.075 0.048
Reliability index, β0 2.74 2.26 2.86 2.61 3.04 2.55 2.73 2.55
TH-1259_09610405
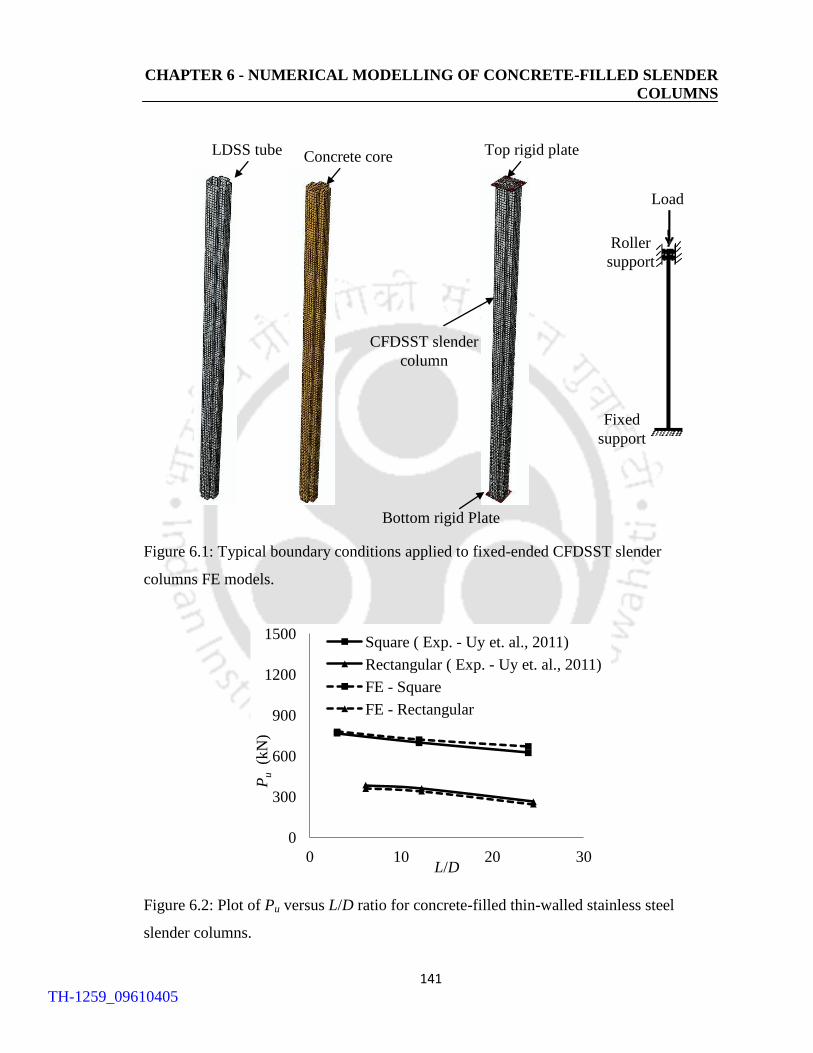
CHAPTER 6 - NUMERICAL MODELLING OF CONCRETE-FILLED SLENDER
COLUMNS
141
Figure 6.1: Typical boundary conditions applied to fixed-ended CFDSST slender
columns FE models.
Figure 6.2: Plot of Pu versus L/D ratio for concrete-filled thin-walled stainless steel
slender columns.
0
300
600
900
1200
1500
0 10 20 30
Pu (k
N)
L/D
Square ( Exp. - Uy et. al., 2011)
Rectangular ( Exp. - Uy et. al., 2011)
FE - Square
FE - Rectangular
LDSS tube Concrete core Top rigid plate
Bottom rigid Plate
CFDSST slender
column
Load
Roller
support
Fixed
support
TH-1259_09610405

CHAPTER 6 - NUMERICAL MODELLING OF CONCRETE-FILLED SLENDER
COLUMNS
142
(a) Square (b) L-shape (c) T-shape (d) +-shape
Figure 6.3: Numerical test specimens of the fixed-ended CFDSST slender columns.
300 mm
600 m
m
300 m
m
600 mm 300 m
m
600 mm
300 mm
600 m
m
600 mm
300 mm
300 m
m
600 m
m
600 mm
t
LDSS tube
Concrete core
TH-1259_09610405
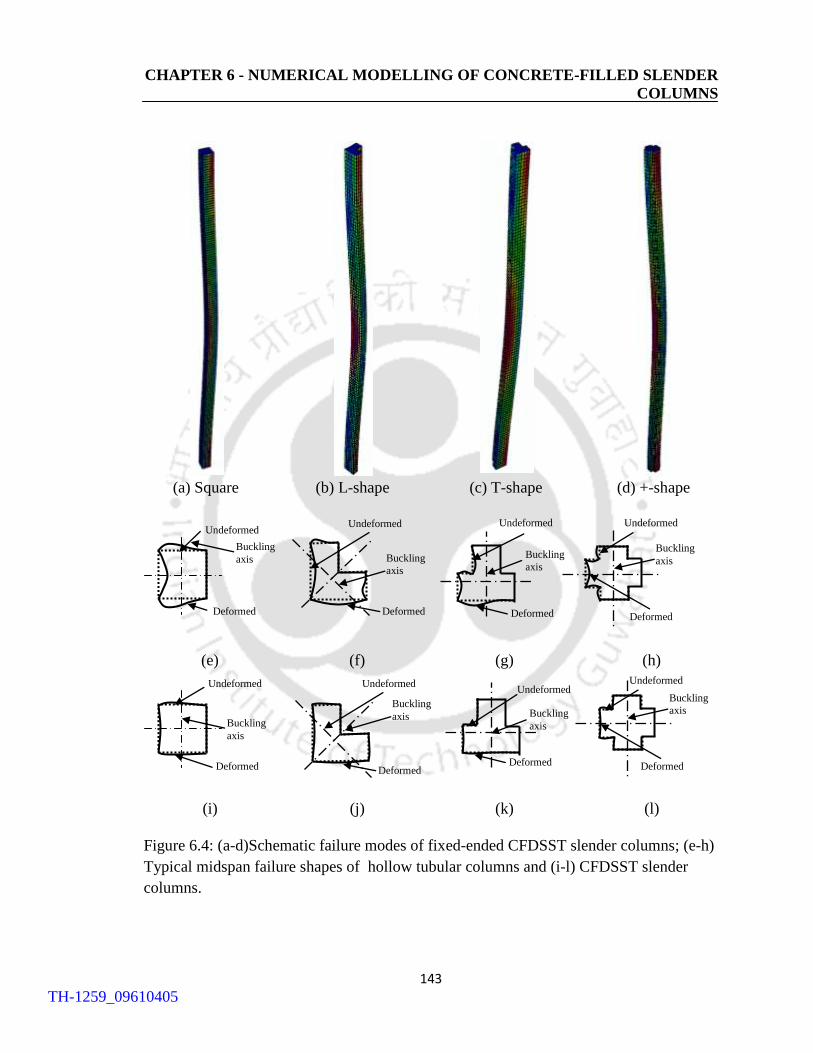
CHAPTER 6 - NUMERICAL MODELLING OF CONCRETE-FILLED SLENDER
COLUMNS
143
(a) Square (b) L-shape (c) T-shape (d) +-shape
(e) (f) (g) (h)
(i) (j) (k) (l)
Figure 6.4: (a-d)Schematic failure modes of fixed-ended CFDSST slender columns; (e-h)
Typical midspan failure shapes of hollow tubular columns and (i-l) CFDSST slender
columns.
Buckling
axis
Undeformed
Deformed
Undeformed
Deformed
Buckling
axis
Deformed
Buckling
axis
Undeformed Undeformed
Deformed
Buckling
axis
Undeformed
Deformed
Buckling
axis
Undeformed
Deformed
Buckling
axis
Undeformed
Deformed
Buckling
axis
Undeformed
Deformed
Buckling
axis
TH-1259_09610405
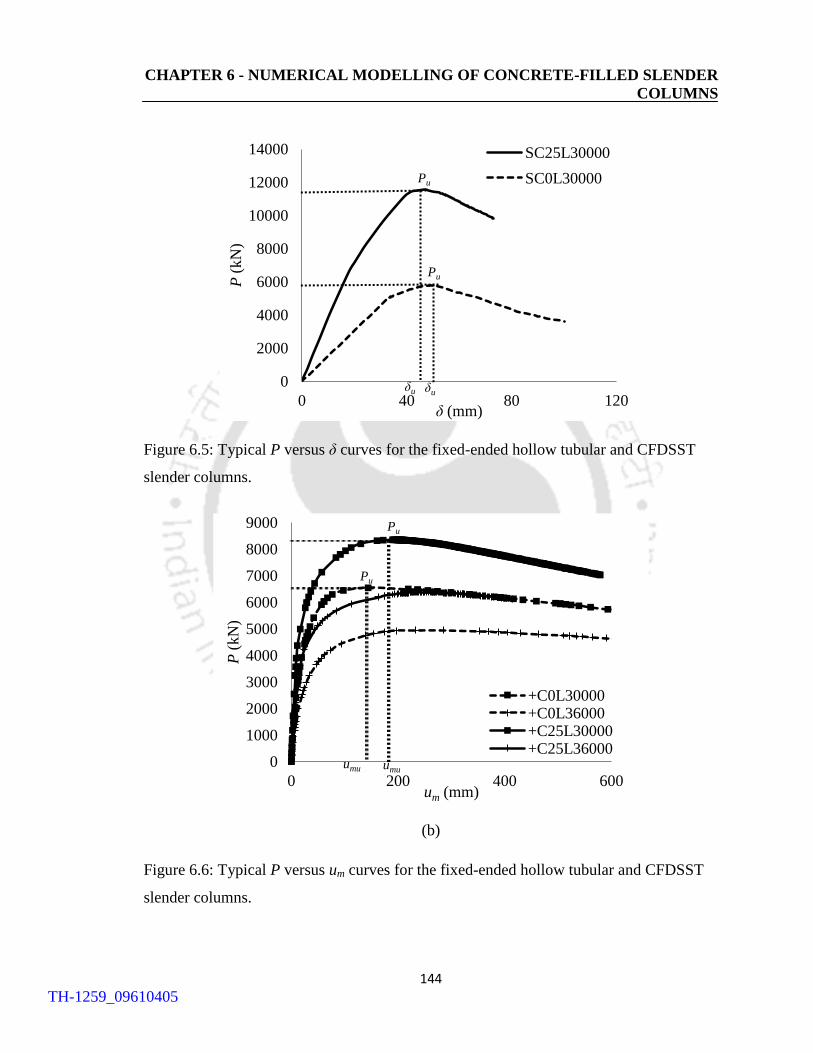
CHAPTER 6 - NUMERICAL MODELLING OF CONCRETE-FILLED SLENDER
COLUMNS
144
Figure 6.5: Typical P versus δ curves for the fixed-ended hollow tubular and CFDSST
slender columns.
(b)
Figure 6.6: Typical P versus um curves for the fixed-ended hollow tubular and CFDSST
slender columns.
0
2000
4000
6000
8000
10000
12000
14000
0 40 80 120
P (
kN
)
δ (mm)
SC25L30000
SC0L30000
δu δu
Pu
Pu
0
1000
2000
3000
4000
5000
6000
7000
8000
9000
0 200 400 600
P (
kN
)
um (mm)
+C0L30000 +C0L36000 +C25L30000 +C25L36000
umu umu
Pu
Pu
TH-1259_09610405
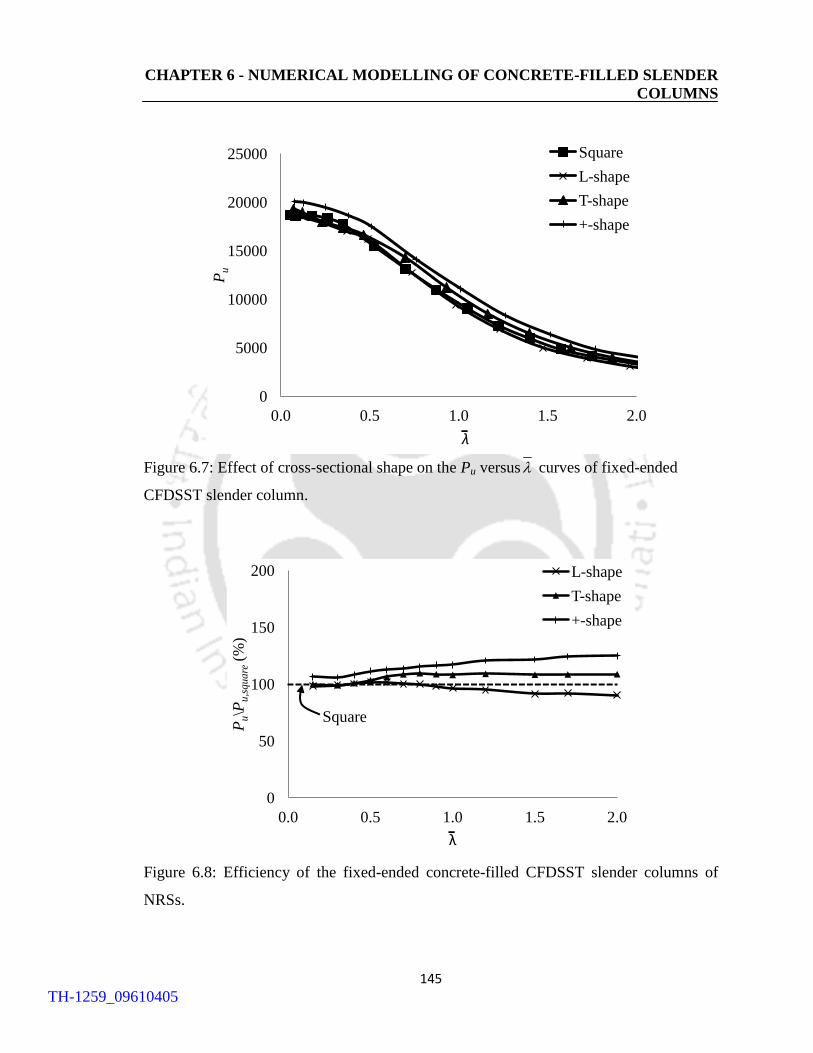
CHAPTER 6 - NUMERICAL MODELLING OF CONCRETE-FILLED SLENDER
COLUMNS
145
Figure 6.7: Effect of cross-sectional shape on the Pu versus curves of fixed-ended
CFDSST slender column.
Figure 6.8: Efficiency of the fixed-ended concrete-filled CFDSST slender columns of
NRSs.
0
5000
10000
15000
20000
25000
0.0 0.5 1.0 1.5 2.0
Pu
λ
Square
L-shape
T-shape
+-shape
-
0
50
100
150
200
0.0 0.5 1.0 1.5 2.0
Pu\P
u,s
qu
are
(%
)
λ
L-shape
T-shape
+-shape
-
Square
TH-1259_09610405
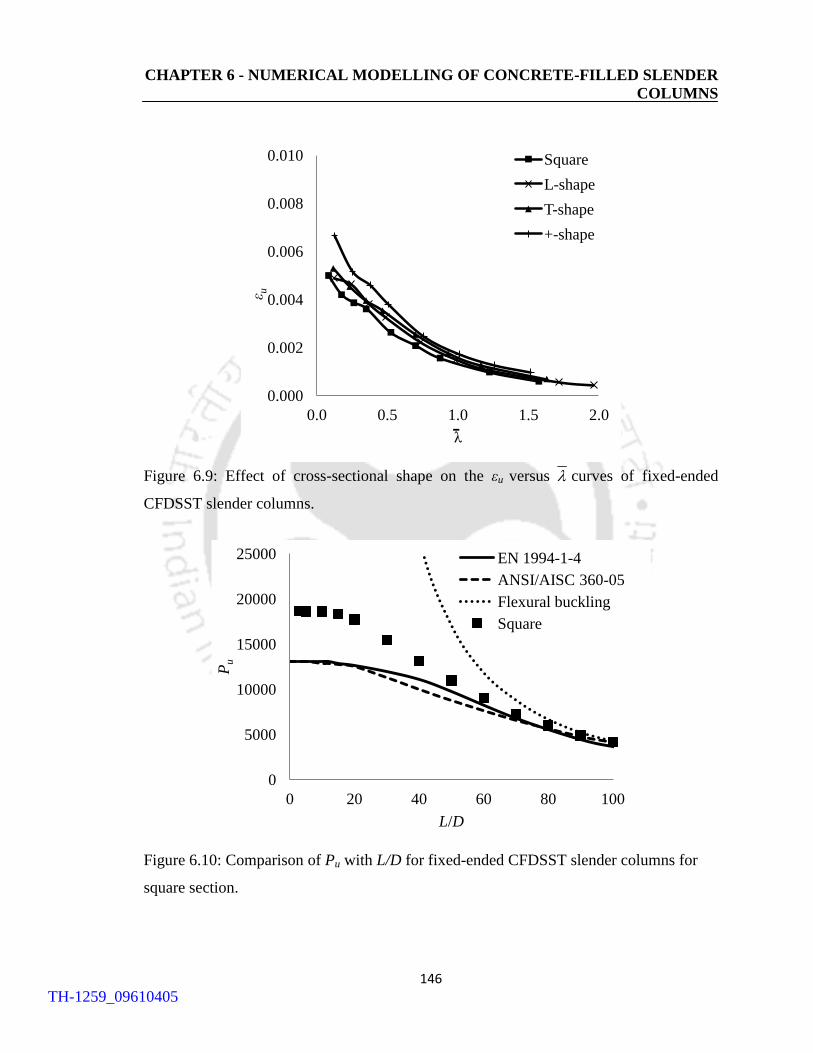
CHAPTER 6 - NUMERICAL MODELLING OF CONCRETE-FILLED SLENDER
COLUMNS
146
Figure 6.9: Effect of cross-sectional shape on the εu versus curves of fixed-ended
CFDSST slender columns.
Figure 6.10: Comparison of Pu with L/D for fixed-ended CFDSST slender columns for
square section.
0.000
0.002
0.004
0.006
0.008
0.010
0.0 0.5 1.0 1.5 2.0
ε u
λ
Square
L-shape
T-shape
+-shape
-
0
5000
10000
15000
20000
25000
0 20 40 60 80 100
Pu
L/D
EN 1994-1-4
ANSI/AISC 360-05
Flexural buckling
Square
TH-1259_09610405
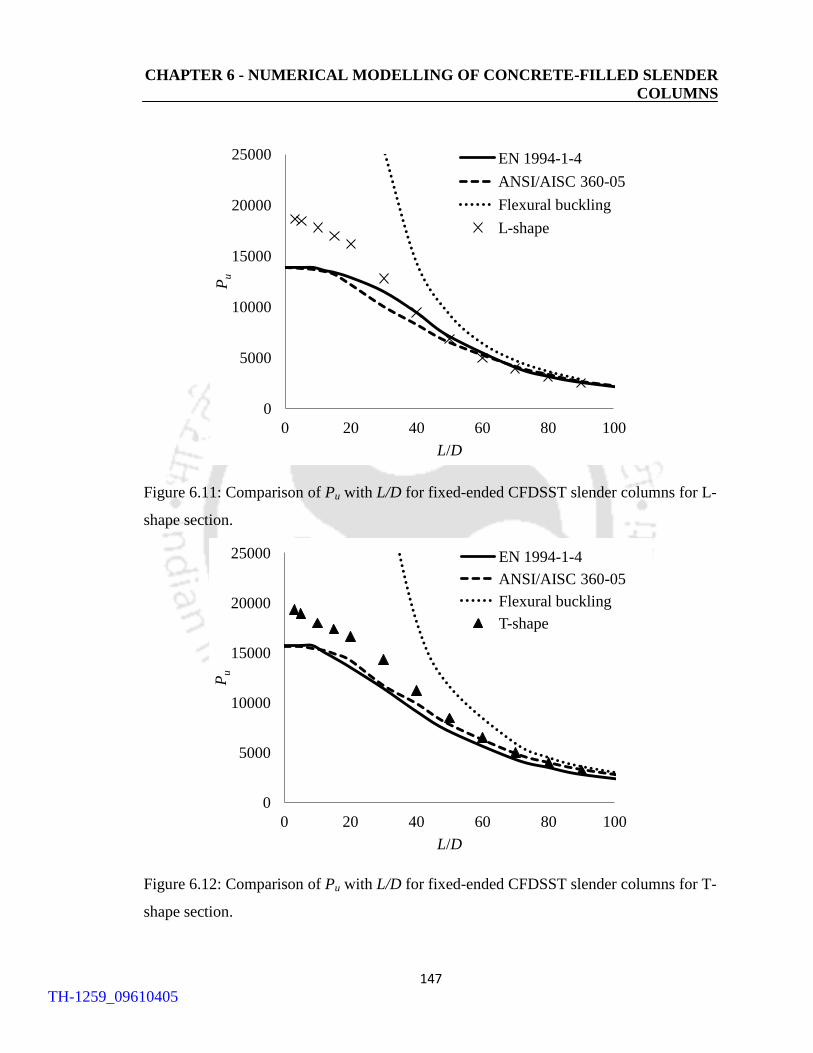
CHAPTER 6 - NUMERICAL MODELLING OF CONCRETE-FILLED SLENDER
COLUMNS
147
Figure 6.11: Comparison of Pu with L/D for fixed-ended CFDSST slender columns for L-
shape section.
Figure 6.12: Comparison of Pu with L/D for fixed-ended CFDSST slender columns for T-
shape section.
0
5000
10000
15000
20000
25000
0 20 40 60 80 100
Pu
L/D
EN 1994-1-4
ANSI/AISC 360-05
Flexural buckling
L-shape
0
5000
10000
15000
20000
25000
0 20 40 60 80 100
Pu
L/D
EN 1994-1-4
ANSI/AISC 360-05
Flexural buckling
T-shape
TH-1259_09610405
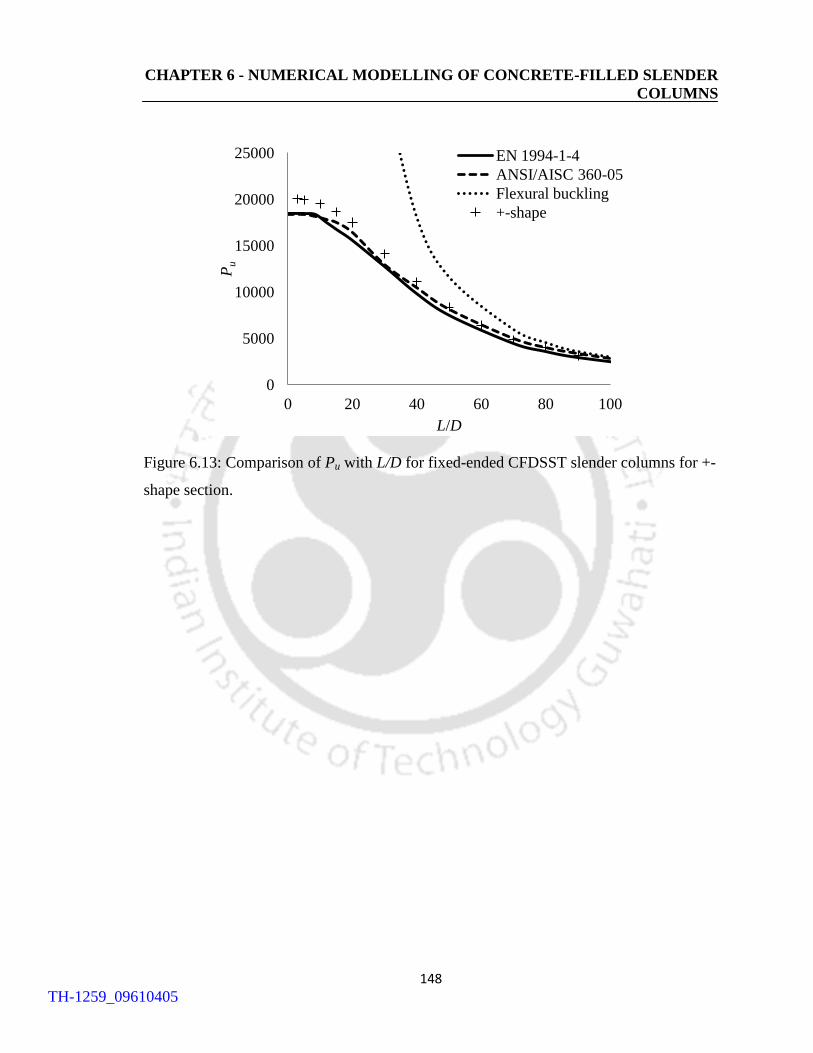
CHAPTER 6 - NUMERICAL MODELLING OF CONCRETE-FILLED SLENDER
COLUMNS
148
Figure 6.13: Comparison of Pu with L/D for fixed-ended CFDSST slender columns for +-
shape section.
0
5000
10000
15000
20000
25000
0 20 40 60 80 100
Pu
L/D
EN 1994-1-4
ANSI/AISC 360-05
Flexural buckling
+-shape
TH-1259_09610405
149
CHAPTER 7
CONCLUSIONS AND SUGGESTIONS FOR
FURTHER WORK
7.1 CONCLUSIONS
The present research was undertaken to investigate the structural behavior of LDSS
hollow tubular and concrete-filled tubular columns under pure axial compression using
FE software package Abaqus. The aim was to compare the load and deformation
characteristics as well as the failure modes of such columns with NRSs over those of the
representative square sections having equal LDSS cross-sectional area and an attempt has
been made to draw meaningful conclusions from the FE results generated. Further, effort
has been made to compare the FE results with the current existing codes on stainless steel
material to assess their applicability on the design of structural LDSS. Based on the study
following conclusions are identified:
7.1.1 Hollow tubular stub columns of NRSs and square section
1) As the section goes from square → L → T → +-shape (i.e number of sides in a section
increases), more effective the section becomes in controlling local buckling due to
increase in the stiffness of the section.
TH-1259_09610405

CHAPTER 7 – CONCLUSIONS AND SUGGESTIONS FOR FURTHER WORK
150
2) For NRSs, there is approximately a linear increase of Pu with increasing LDSS tube
thicknesses, whereas, for the representative square section, a milder increase of Pu is
seen at lower thickness and linear increase at higher LDSS tube thicknesses.
3) For LDSS tube thickness < 30 mm, NRSs shows a higher strength capacity compared
to the representative square section, with +-shaped section having the highest
strengths. However at LDSS tube thicknesses ≥ 30 mm, all the sections considered
gave similar strengths.
4) For changes in the cross-sectional shape from square to + shape, the increase in Pu are
~ 136%, 109%, 72%, 26%, 9% for 5mm, 10, mm, 15 mm, 20 mm and 25 mm,
respectively, showing that the increase in Pu is more effective at thinner sections.
5) The gain in Pu with change in the cross-sectional shape from square to L, T and +-
shape are in the range 120%-150%, 130%-170%, 140%-230%, respectively, at lower
thicknesses of the steel tube (< 20 mm). Thus, it can be seen that by switching over to
+ shape sections, significant gain in ultimate strength can be obtained for all the
thicknesses considered, with thinner sections giving more pronounced gain.
6) NRSs have notably better deformation capacity compared to the representative square
section, with +-shape section estimating a much higher deformation capacity. Also,
the deformation capacity increases with increasing thickness for all the hollow tubular
stub columns analysed.
7) Both the current design specifications are generally capable of predicting the LDSS
hollow tubular column strengths. For stocky sections, FE strengths over predicts both
the codal strengths (European and American specifications) by about 28 % for all the
section studied. For slender sections, at lower thicknesses of the steel tube (i.e t ~ < 20
mm), FE strengths over predicts the European specification by 28 %, 26 %, 21 % and
23 % for SHC, LHC, THC and +HC, respectively, and American specification by 5%,
6%, 9% and 17 % for SHC, LHC, THC and +HC, respectively. Based on the FE
studies it can be inferred that, for slender sections, the American specification
TH-1259_09610405
CHAPTER 7 – CONCLUSIONS AND SUGGESTIONS FOR FURTHER WORK
151
provides closer values as compared to the European specification, thus, providing a
significant material saving through design by the American specification.
8) Based on the reliability analyses it can be inferred that both specifications can be
adopted for all the design of LDSS hollow tubular stub columns. However, for LDSS
hollow tubular stub columns, design based on European specification tends to be
slightly more reliable compared to the American specification, except for +-shape
section, where the American specification tends to be more reliable.
7.1.2 Hollow tubular slender columns of NRSs and square section
1) Hollow tubular slender column fail first by overall flexural buckling followed by local
buckling at mid-height of the column, irrespective of the cross-sectional shape
considered, and is seen to be typical for both the Class 3 and 4 sections.
2) The buckling strength of the fixed-ended hollow tubular slender columns (both Class 3
and Class 4 sections) decreases with increasing lengths due to reduction in the
stiffness of the columns, with very slender columns failing by elastic instability failure
where the Pu is mainly dominated by flexural rigidity.
3) For Class 3 sections:
a) For ≤ 0.5 and at high , all the sections exhibit similar structural capacities. The
reason being, at lower , regardless of the cross-sectional shapes, all the sections
experiences hardening above the global yielding load without any occurrences of
local buckling at ultimate load; and the failure for high slender columns are
governed principally by member stiffness rather than the cross-sectional shape.
b) For 0.5 < ≥ 2.0, there is a nearly linear variation in strengths (increasing trend
for +HC, similar trend for THC and decreasing trend for LHC), with stabilization
beyond > 2.0. For > 2.0, Pu for +HC showed ~ 30% higher; THC showed
TH-1259_09610405
CHAPTER 7 – CONCLUSIONS AND SUGGESTIONS FOR FURTHER WORK
152
similar strength; and LHC showed ~20% lower than the corresponding value for
SHC, indicating that +HC has an improved ultimate strength for all the ranges of
.
c) At lower < ~ 0.50, the values of εu are found to be highest for +HC, whilst SHC,
LHC and THC predicted similar values. However, at higher ≥ 0.50, εu values
lies in the range of ~ 0.2 – 0.6 % for all the section analysed.
4) For Class 4 sections:
a) In contrast to Class 3 sections, cross-sectional shape becomes increasingly
significant with decreasing , however, the cross-sectional shape becomes
insignificant for very high as also the case for Class 3 sections.
b) The average strength enhancement as compared to the representative square
section are ~ 10 %, 50 %, and 90 % higher for LHC, THC, and +HC, respectively.
c) Similar to Class 3, +HC predicted higher deformation at peak load, as compared
to SHC, LHC and THC, at lower values of (< ~ 1.0). At higher slenderness ( >
~ 1.0), εu values also lies in the range of ~ 0.2 – 0.5 % for all the section analysed.
5) A higher , for both the Class 3 and Class 4 sections, European specification gives a
conservative estimation of strengths compared to the American specification, which
gives slightly conservative value, in the design of LDSS hollow tubular slender
columns. However, the design of hollow tubular slender column with L-shape section
through the American specification tends to be critical where it over predicts the FE
strengths.
6) Based on the reliability analyses it is recommended that both the specifications can be
adopted for all the design of fixed-ended LDSS hollow tubular slender columns
except for Class 3 LHC, wherein a suitable modification may be employed after
systematic studies (including experiments). For the design of Class 3 sections,
TH-1259_09610405
CHAPTER 7 – CONCLUSIONS AND SUGGESTIONS FOR FURTHER WORK
153
European specification tends to be more reliable compared to the American
specification and vice versa in the design of Class 4 sections.
7.1.3 Concrete-filled tubular stub columns of NRSs and square section
1) Out-of-plane deformation (seen only at the longer faces) of the entire four faces, two
faces, and one face can be seen for the square, L-shaped and T-shaped sections,
respectively, at Pu, except for +-shaped section and at the shorter faces of L- and T-
shape sections where no local buckling is seen at Pu.
2) On filling the LDSS tube with concrete, there in an increase in the Pu by about 70 % to
435 %, 63 % to 299 %, 35 % to 283 %, and 20 % to 181% for square, L, T, and +-
shape sections, respectively.
3) The influence of the LDSS tube on the δu increases with increasing thickness of the
LDSS tube and increasing concrete strength.
4) For normal concrete strength (fck ≤ 40 MPa), NRSs appears to have similar or slightly
enhanced Pu, in comparison with square section. At higher fck (> 40 MPa), L-, T-, and
+-shape sections predicted lower values of Pu (for fck = 100 MPa) by about 18 %, 15 %
and 12 %, respectively, compared to the representative square section.
5) Increasing the strength of the concrete core, for all the NRSs and representative square
section, there is a linear increase in the strength for the range of concrete strengths
investigated herein (25–100 MPa). Also, it can be seen that the square section shows a
higher increasing rate compared to the NRSs for the same LDSS tube thickness.
6) On increase in thickness of the LDSS tube for all the CFDSST stub columns from 7.5
mm to 9.0 (20 % increase) and 10.0 mm (33% increase), the average increase in
strengths are 14-19 % and 25-30 %, respectively. On increase in concrete strength
from 40 MPa to 48 MPa (20 % increase) and 53 MPa (33% increase), the average
increase in strengths are 6 - 9 % and 10 - 15 %, respectively. Hence increasing the
TH-1259_09610405

CHAPTER 7 – CONCLUSIONS AND SUGGESTIONS FOR FURTHER WORK
154
thickness of the LDSS tube is more beneficial in increasing the strength of the
CFDSST stub columns rather than the concrete strength.
7) In CFDSST stub columns, δu decreases with increasing concrete strengths, but
increases as the sections changes from Square → L → T → +-shape.
8) FE strengths over predicts the EN 1994-1-1 (2004) specification by about in average
21 %, 19%, 14 % and 4 % for the square, L, T, and +-shape sections, respectively,
whereas, ASCE 8-02 (2002) specification gives a slightly conservative prediction by
about in average 16 %, 10%, 8 % and 1 % for the square, L, T, and +-shape sections,
respectively.
9) Based on the reliability analyses it can be inferred that both specifications can be
adopted for all the design of CFDSST stub columns except for CFDSST stub columns
with +-shape section, wherein a suitable modification may be employed after
systematic studies (including experiments). However, for CFDSST stub columns,
design based on the American specification tends to be slightly more reliable
compared to the European specification.
7.1.4 Concrete-filled tubular slender columns of NRSs and square section
1) At Pu, only overall buckling is seen for both the hollow tubular and CFDSST
columns. At post Pu, LDSS hollow tubular members fails through overall buckling
and thereafter accompanied by local buckling of the LDSS tube at mid-height
sections. However, local buckling of the LDSS tube is prevented due to the concrete
core in CFDSST columns.
2) The Pu of CFDSST columns is higher than that of the reference hollow steel tubular
columns because of increased flexural rigidity provided by the concrete core, thereby
achieving higher umu by the CFDSST columns. However, the δu of CFDSST column
TH-1259_09610405

CHAPTER 7 – CONCLUSIONS AND SUGGESTIONS FOR FURTHER WORK
155
is lower than that of the reference LDSS hollow tubular column because of a higher
elastic compression stiffness of the latter due to concrete core
3) For all the section analysed the Pu decreases with increasing . Also, +-shape and T-
shape sections show a higher Pu for all the , however, L-shape section showed a
similar Pu at lower and a lower Pu at higher compared to that of the
representative square section.
4) For ~ < 0.5, +-shape showed a 7 % higher strength and L- and +-shape showed
similar strengths compared to the representative square section. For 0.5 ≤ ≥ 1.5, a
linear increasing trend in strength is seen with increasing . However, for > 0.5, T-
and +-shape showed a 10 % and 25 % more strength and L-shape showing a 10 %
lower strength compared to the representative square section.
5) In fixed-ended CFDSST slender columns, change of cross-sectional shape from square
section to NRSs is significant, especially for T-shape and +-shape sections, and can
promote the application of thin-wall LDSS tube.
6) The influence of the cross-sectional shapes on the εu becomes less significant with
increasing , but becomes increasingly significant with decreasing . Also, NRSs
shows a higher εu for all considered compared to the representative square section,
with +-shape section showing the highest εu.
7) The design standards show over conservative results for square and L-shape sections
and conservative for T-shape and +-shape sections. However, the European
specification gives a conservative estimation of strengths compared to the American
specification for square and L-shape sections and vice versa in case of T-shape and +-
shape sections.
8) Based on the reliability analyses both specifications can be adopted for all the design
of fixed-ended CFDSST slender columns, except for the L-shape section, wherein a
TH-1259_09610405

CHAPTER 7 – CONCLUSIONS AND SUGGESTIONS FOR FURTHER WORK
156
suitable modification may be employed after systematic studies (including
experiments). For the design of fixed-ended CFDSST slender columns of square and
L-shape sections, American specification tends to be more reliable compared to the
European specification and vice versa in the design for the fixed-ended CFDSST
slender columns of T-shape and +-shape sections.
7.2 SUGGESTIONS FOR FURTHER WORK
Even though a considerable understanding have been obtained in the present work for the
structural behavior of LDSS hollow tubular and concrete-filled tubular columns with
NRSs and representative square section under pure axial compression, significant amount
of work may be identified and suggestions for further work are presented under the
following sub-sections.
7.2.1 Loading Conditions
The present study is limited to structural members under pure axial compression.
Extension of the present work to cover different loading scenarios form an important part
of promoting hollow and concrete-filled tubular NRSs. Hollow and concrete-filled
tubular NRSs under following loading conditions may be studied:
1) Behavior of LDSS hollow and concrete-filled tubular NRSs under uniaxial and bi-
axial loading conditions.
2) Structural behavior of hollow and concrete-filled tubular NRSs under cyclic
loading condition.
3) Effect of impact/blast on LDSS hollow and concrete-filled tubular NRSs.
4) Studies on LDSS hollow and concrete-filled tubular NRSs at elevated
temperatures.
TH-1259_09610405

CHAPTER 7 – CONCLUSIONS AND SUGGESTIONS FOR FURTHER WORK
157
7.2.2 In-fill Materials
Different types of material or a combination of materials can be filled inside the hollow
steel tubes, in which the present study was focused mainly on plain concrete in-fill with
varying concrete strengths. The following presents a various in-fill materials which may
be investigated:
1) Use of fly-ash concrete material.
2) The strength and ductility enhancement in the use of steel reinforcement inside
the concrete-infill of NRSs need to be examined.
3) Possible use of very high strength concrete such as fiber reinforced concrete
material.
7.2.3 Other Suggestions
Apart from the two main categories mentioned in Section 8.1 & 8.2, exploitation on the
use of hollow and concrete-filled tubular NRSs are mentioned below:
1) Possibilities on the application of concrete-filled NRSs to beams.
2) The effect of perforations on the structural capacities of hollow and concrete-
filled tubular NRSs.
3) Comparison in the structural behavior of concrete-filled tubular NRSs to that of
reinforced concrete columns of such sections.
4) Studies may be done on the doubly skin hollow and concrete-filled tubular NRSs.
5) Investigation can also be done on the tapered hollow and concrete-filled tubular
NRSs.
6) Effect of confinement on the concrete-filled tubular NRSs.
TH-1259_09610405
158
REFERENCES
Abaqus, 2009. Hibbitt, Karlsson & Sorensen, Inc. Abaqus/Standard user's manual
volumes I-III and ABAQUS CAE manual. Version 6.9-EF1, Pawtucket, USA.
ACI, 1999. Building code requirement for structural concrete and commentary. ACI;
American concrete Institute; USA.
AISI, 1968. Specification for the design of light gauge cold-formed stainless steel
structural members. American Iron and Steel Institute. Washington, D.C.
AISI, 1974. Stainless steel cold-formed structural design manual. American Iron and
Steel Institute. Washington, D.C.
An, Y.F., Han, L.H. & Zhao, X.L., 2012. Behaviour and design calculations on very
slender thin-walled CFST columns. Thin-Walled Structures; 53: 161-175.
ANSI/AISC 360-05, 2005. Specification for structural steel buildings. Chicago (IL,
USA).
ASCE, 1982. ASCE task committee on concrete and masonry structure, state of the
art report on finite element analysis of reinforced concrete, American Society of Civil
Engineering; New York.
ASCE, 1990. Specification for the design of cold-formed stainless steel structural
members. ANSI/ASCE 8-90. American Society of Civil Engineering. New York.
ASCE 8-02, 2002. Specification for the design of cold-formed stainless steel
structural members. SEI/ASCE 8-02. American Society of Civil Engineering. New
York.
TH-1259_09610405
REFERENCES
159
Ashraf, M., 2006. Structural stainless steel design: Resistance based on deformation
capacity. PhD. thesis. Department of Civil and Environmental Engineering, Imperial
College London, UK.
Ashraf, M., Gardner, L. & Nethercot, D.A., 2006. Finite element modeling of
structural stainless steel cross-sections. Thin-Walled Structures; 44: 1048-1062.
Ashraf, M., Gardner, L. & Nethercot, D.A., 2008. Resistance of stainless steel CHS
columns based on cross-section deformation capacity. Journal of Constructional Steel
Research; 64: 962–970.
Attard, M. M. & Setung, S., 1996. Stress-Strain Relationship of Confined and
Unconfined Concrete, ACI, Materials Journal; 93-M49: 432-442.
Aust/NZS, 2001. Cold-formed stainless steel structures. Australian/ New Zealand
Standard AS/NZS 4673:2001. Sydney, Australia: Standards Australia.
Baddoo, N.R., Burgan, R. & Ogden, R., 1997. Architects' guide to stainless steel.
SCI-P-179, UK: The Steel Construction Institute.
Baddoo, N.R., 2008. Stainless steel in construction: a review of research, applications,
challenges and opportunities. Journal of Constructional Steel Research; 64: 1199-
1206.
Bearley, H., 1989. Harry Bearley: Stainless pioneer. British steel stainless and the
Kelham island industrial museum, Sheffield (eds.), McCann-Erickson Central
Solihull, West Midlands.
Bjorhovde, R., 1972. Deterministic and probabilistic approaches to the strength of
steel columns. Bethlehem (PA): Lehigh University.
Boyd, F. P., Cofer, W. F. & McLean, D., 1995. Seismic performance of steel-encased
concrete column under flexural loading. ACI Structural Journal; 92(3): 355–365.
Bradford, M. A., 1996. Design strength of slender concrete-filled rectangular steel
tubes. ACI Structural Journal; 93(2): 229–235.
TH-1259_09610405

REFERENCES
160
Bradford, M. A., Loh, H. Y. & Uy, B., 2002. Slenderness limits for filled circular
steel tubes. Journal of Constructional Steel Research; 58(2): 243–252.
BS EN 10088-1, 1995. Stainless steels – Part 1: List of stainless steels. British
Standards Institution.
BSSA. British Stainless Steel Association. http://www.bssa.org.uk/topics.php?
article=125.
Buijs, N.W., 2008. The role and signifance of nickel. http://www.innomet.nl/
docs/SSWtechHastelloy.pdf.
CIDECT, 1984. Construction with hollow steel sections. British Steel plc, Corby,
Northants, U.K., ISBN 0-9510062-0-7.
Chan, T.M. & Gardner L., 2008. Compressive resistance of hot-rolled elliptical
hollow sections. Engineering Structures; 30(2): 522–532.
Chen, Y.N. & Kempner, J., 1976. Buckling of oval cylindrical-shell under
compression and asymmetric bending. AIAA Journal; 14(9): 1235–1240.
Cheng, T. & Thomas, H., 1989. T-shaped reinforced concrete members under biaxial
and axial compression. ACI Structural Journal; 86(4): 2576-2595.
Chou, S.M., Chai, G.B. & Ling, L., 2000. Finite element technique for design of stub
columns. Thin-Walled Structures; 37: 92-112.
Cusson, D. & Paultre, P., 1994. High Strength Concrete Columns Confined by
Rectangular Ties, Journal of Structural Engineering Division, ASCE, No. 3; 120: 783-
804.
Dabaon, M.A., El-Boghdadi, M.H. & Hassanein, M.F., 2009. A comparative
experimental study between stiffened and unstiffened stainless steel hollow tubular
stub columns. Thin-Walled Structures; 47: 73–81.
TH-1259_09610405
REFERENCES
161
Dawson, R. G. & Walker, A. C., 1972. Post-buckling of geometrically imperfect
plates. Journal of the Structural Division, ASCE; 98: ST1, 75-94.
Dai, X. & Lam, D., 2010. Numerical modeling on the axial compressive behavior of
short concrete-filled elliptical columns. Journal of Constructional Steel Research; 66:
931-942.
Du, G.F., Xu, L.H., Wen, F. & Xu, H.R., 2008. Test study on behavior of T-shaped
concrete-filled steel tubular short columns under axial compression. Journal of
Huazhong University Science and Technology (Urban Science) 2008; 25(3):188–194
[in Chinese].
Dundar, C. & Sahin, B., 1993. Arbitrarily shaped reinforced concrete members
subjected to biaxial bending and axial load. Computers and Structures; 49(4): 643-
662.
Dutta, D., Würker, K.G, 1988. Handbuch Hohlprofile in Stahlkonstruktionen, Verlag
TÜV Rheinland GmbH, Köln, Germany, ISBN 3-88585-528-3.
Ellobody, E., 2007. Buckling analysis of high strength stainless steel stiffened and
unstiffened slender hollow section columns. Journal of Constructional Steel Research;
63: 145-155.
Ellobody, E. & Young, B., 2005. Structural performance of cold-formed high strength
stainless steel columns. Journal of Constructional Steel Research; 61: 1631-1649.
Ellobody, E. & Young, B., 2006a. Design and behaviour of concrete-filled cold-
formed stainless steel tube columns. Engineering Structures; 28: 716–728.
Ellobody, E. & Young, B., 2006b. Nonlinear analysis of concrete-filled steel SHS and
RHS columns. Thin-walled Structures; 44: 919-930.
Ellobody, E. & Young, B., 2011. Numerical simulation of concrete encased steel
composite columns. Journal of Constructional Steel Research; 67: 211-222.
TH-1259_09610405
REFERENCES
162
Ellobody, E., Young, B. & Lam, D., 2006. Behaviour of normal and high strength
concrete-filled compact steel tube circular stub columns. Journal of Constructional
Steel Research; 62(7): 706-15.
ENV1993-1-1, 1992. Design of steel structures, Part 1.1: General rules and rules for
buildings.
ENV 1993-1-4, 1996. Eurocode 3: Design of steel structures-Part 1.4: General rules-
Supplementary rules for stainless steel. CEN.
EN 1994-1-1, 2004. Design of composite steel and concrete structures, part 1.1:
general rules and rules for building. British Standards Institution. London (UK).
EN 1993-1-4, 2006. Eurocode 3: Design of steel structures-Part 1.4: General rules-
Supplementary rules for stainless steel. CEN.
EN 10088-4, 2009. Stainless steels_part 4: technical delivery conditions for
sheet/plate and strip of corrosion resisting steels for general purposes. CEN.
Euro Inox, 1994. Design manual for structural stainless steel. NIDI. Toronto, Canada.
Furlong, R. W., 1967. Strength of steel-encased concrete beam columns. Journal of
Structural Division, ASCE; 93 (5): 113–124.
Furlong, R. W., 1974. Concrete encased steel columns—Design tables.’’ Journal of
Structural Division, ASCE; 100(9): 1865–1882.
Galambos, T.V., 1998. Guide to stability design criteria for metal structures. 4th
Edition. New York: John Wiley and Sons Inc.
Galinsky. Inland Steel, Chicago. http://www.galinsky.com/buildings/inlandsteel/,
Retrieved on September 2013.
Gao, D.X., Ke, J. & Wang, L.H., 2005. Seismic behavior analysis of special-shaped
column frame structure. Journal of Xi’an University of Technology; 21(3): 285-288
[in Chinese].
TH-1259_09610405

REFERENCES
163
Gardner, L., 2002. A new approach to structural stainless steel design. PhD. Thesis.
Structures Section, Dept of Civil and Environmental Engineering; Imperial College
London, UK.
Gardner, L., 2005a. Structural behaviour of oval hollow sections. International
Journal of Advanced Steel Construction;1(2): 29–54.
Gardner, L., 2005b. The use of stainless steel in structures. Progress in Structural;
7(2): 45-55.
Gardner, L., 2013. Proposed Amendment to include Lean Duplexes , Evolution Group
for EN 1993-1-4, (Personal communication).
Gardner, L. & Ashraf, M., 2006. Structural design for non-linear metallic materials.
Engineering Structures; 28: 925-936.
Gardner, L. & Chan, T.M., 2007. Cross-section classification of elliptical hollow
sections. Steel Composite Structures;7(3):185–200.
Gardner, L., Insausti, A., Ng, K.T. & Ashraf, M., 2010. Elevated temperature material
properties of stainless steel alloys. Journal of Constructional Steel Research; 66: 634-
647.
Gardner, N. J. & Jacobson, E. R., 1967. Structural Behavior of Concrete Filled Steel
Tubes. ACI Journal; 64 (7): 404-413.
Gardner, L. & Ministro, A., 2004. Testing and numerical modelling of structural steel
oval hollow sections. In: Department of Civil and Environmental Engineering,
Structural section. Imperial College, UK: London.
Gardner, L. & Nethercot, D.A., 2002. Numerical modelling of cold-formed stainless
steel sections. In: NSCC 2001 proceedings: NSCC 2001 ninth Nordic steel
constructional conference, Helsinki, Finland. 781–790.
TH-1259_09610405
REFERENCES
164
Gardner, L. & Nethercot, D.A., 2004a. Experiments on stainless steel hollow
sections-Part 1: Material and cross-sectional behavior. Journal of Constructional Steel
Research; 60: 1291–1318.
Gardner, L. & Nethercot, D.A., 2004b. Experiments on stainless steel hollow
sections-Part 2: Member behaviour of columns and beams. Journal of Constructional
Steel Research; 60: 1319–1332.
Gardner, L. & Nethercot, D.A., 2004c. Numerical modeling of stainless steel
structural components-A consistent approach. Journal of Structural Engineering,
ASCE; 130(10): 1586-1601.
GB50017-2003, 2003. Code for design of steel structures. Beijing: China Planning
Press; 2003 [in Chinese].
Ge, H. B. & Usami, T., 1992. Strength of concrete-filled thin-walled steel box
columns: Experiment.’’ Journal of Structural Engineering; 118(11): 3036–3054.
Ge, H. B. & Usami, T., 1994. Strength analysis of concrete-filled thin-walled steel
box columns.’’ Journal of Constructional Steel Research; 30(3): 259–281.
Gedge, G., 2008. Structural uses of stainless steel-buildings and civil engineering.
Journal of Constructional Steel Research; 64(11): 1194-1198.
Geograph. London Gatwick North Terminal. http://www.geograph.org.uk/photo/
3177511, Retrieved on September 2013.
Gho, W and Liu, D., 2004. Flexural behaviour of high-strength rectangular concrete-
filled steel hollow sections. Journal of Constructional Steel Research; 60 (11): 1681-
1696.
Giakoumelis, G. & Lam, D., 2004. Axial capacity of circular concrete-filled tube
columns. Journal of Constructional Steel Research; 60(7):1049–68.
TH-1259_09610405

REFERENCES
165
Grigorenko, Y.M. & Rozhok, L.S., 2002. Stress analysis of hollow elliptic cylinders
with variable eccentricity and thickness. International journal of applied mechanics;
38(8): 954–966.
Hajjar, J. F. & Gourley, B. C., 1996. Representation of concrete-filled steel tube
cross-section strength. Journal of Structural Engineering; 122(11): 1327–1336.
Hammer, E.W.Jr. & Petersen, R.E., 1955. Column curves for type 301 stainless steel.
Aeronautical Engineering Review; 14: 12, 33-39 and 48.
Han, L.H., 2007. Concrete filled steel tubular structures. 2nd Edition. Beijing: China
Science Press; [in Chinese].
Han, L.H. & yao, G.H., 2004. Experimental behaviour of thin-walled hollow
structural steel (HSS) columns filled with self-consolidating concrete (SCC). Thin-
Walled Structures; 42: 1357-1377.
Hassanein, M.F., 2010. Numerical modelling of concrete-filled lean duplex slender
stainless steel tubular stub columns. Journal of Constructional Steel Research; 66:
1057-1068.
Hassanein, M.F., 2011. Finite element investigation of shear failure of lean duplex
stainless steel plate girders. Thin-Walled Structures; 49: 964-973.
Hassanein, M.F. & Silvestre N., 2013. Flexural behavior of lean duplex stainless steel
girders with slender unstiffened webs. Journal of Constructional Steel Research; 85:
12-23.
Hassanein, M.F., Kharoob, O.F. & Liang, Q.Q., 2013. Behaviour of circular concrete-
filled lean duplex stainless steel tubular short columns. Thin-Walled Structures; 68:
113-123.
Hill, H.N., 1944. Determination of stress-strain relations from ``offset'' yield strength
values. Technical Note No 927, Washington DC: National advisory committee for
aeronautics.
TH-1259_09610405
REFERENCES
166
Hong, S. & Varma, A.H., 2009. Analytical modeling of the standard fire behavior of
loaded CFT columns. Journal of Constructional Steel Research; 65(1): 54–69.
Hu, H.T. & Schnobrich, W.C., 1989. Constitutive modeling of concrete by using
nonassociated plasticity. Journal of Material Civil Engineering; 1 (4): 199-216.
Hu, H.T., Huang, C.S., Wu, M.H. & Wu, Y.M., 2003. Nonlinear analysis of axially
loaded concrete-filled tube columns with confinement effect. Journal of Structural
Engineering, ASCE; 129(10): 1322-1329.
Huang, Y. & Young, B., 2012. Material properties of cold-formed lean duplex
stainless steel sections. Thin-Walled Structures; 54: 72-81.
Huang, Y. & Young, B., 2013. Tests of pin-ended cold-formed lean duplex stainless
steel columns. Journal of Constructional Steel Research; 82: 203-215.
Jamaluddin, N., Lam, D., Dai, X.H. & Ye, J., 2013. An experimental study on
elliptical concrete-filled columns under axial compression. Journal of Constructional
Steel Research; 87: 6-16.
Joaquin, M., 1979. Design aids for L-shaped reinforced concrete columns. ACI
Structural Journal; 76(49): 1197-1216.
Johansson, M., 2002. Composite action and confinement effects in tubular
steel_concrete columns. Ph.D. thesis. Goteborg (Sweden): Chalmers University of
Technology.
Johnson, A.L. & Winter, G., 1966. Behaviour of stainless steel columns and beams.
Journal of the Structural Division, ASCE; ST5: 97-118.
Kato, B., 1996. Column curves of steel-concrete composite members. Journal of
Constructional Steel Research; 39(2): 121-135.
Kempner, J. & Chen, Y.N., 1974. Buckling and initial post-buckling of oval
cylindrical- shells under combined axial-compression and bending. Transactions of
the New York Academy of Sciences; 36(2): 171–191.
TH-1259_09610405
REFERENCES
167
Knowles, R. B. & Park, R., 1969. Strength of concrete filled steel tubular columns.
Journal of the Structural Division, ASCE; 95 (12): 2565–2587.
Kupfer, H. B. & Gerstle,K.H., 1973. Behaviour of concrete under biaxial stresses.
Journal of Engineering Mechanics Division; 99: 853-866.
Lam, D. & Gardner, L., 2008. Structural design of stainless steel concrete filled
columns. Journal of Constructional Steel Research; 64(11): 1275–82.
Law, k.H. & Gardner, L., 2013. Buckling of elliptical hollow section members under
combined compression and uniaxial bending. Journal of Constructional Steel
Research; 86: 1-16.
Lee, J. & Fenves,G.L., 1998. Plastic-damage model for cyclic loading of concrete
structures. Journal of Engineering Mechanics; 124(8): 892-900.
Liang, Q. Q. & Uy, B., 2000. Theoretical study on the post-local buckling of steel
plates in concrete-filled box column. Computers and Structures; 75(5): 479–490.
Lin, Z.Y., Shen, Z.Y., Luo, J.H. & Zhang, J.C., 2009. Study on behavior of L-shaped
concrete-filled steel tube stubs subjected to axial compression. Progress in Steel
Building Structures; 11(6): 14–19 [in Chinese].
Lu, X., Li, X. & Wang, D., 2007. Modelling and experimental verification on
concrete-filled steel tubular columns with L or T section. Frontiers of Architecture
and Civil Eng in China; 1: 163-169.
Lubliner, J., Oliver, J., Oller, S. & Oñate,E., 1989. A Plastic-Damage Model for
Concrete. International Journal of Solids and Structures; 25(3): 229–326.
Lui, Y. & Young, B., 2003. Buckling of stainless steel square hollow section
compression members. Journal of Constructional Steel Research; 59: 165–177.
Maekawa, K., Pimanmas, A. & Okamura, H. 2003. Nonlinear mechanics of
reinforced concrete. Spon Press.
TH-1259_09610405

REFERENCES
168
Mallikarjuna & Mahadevappa, P., 1992. Computer aided analysis of reinforced
concrete columns subjected to axial compression and bending-I L-shaped sections;
Computers and Structures; 44(5): 1121-1138.
Mann, A.P., 1993. The structural use of stainless steel. Journal of Structural
Engineering; 71(4):60–9.
Mander, J.B., Priestley, M.J.N. & Park, R., 1988. Theoritical stress-strain model for
confined concrete. Journal of Structural Engineering, ASCE; 114(8): 1804-1826.
Mirambell, E. & Real, E., 2000. On the calculation of deflections in structural
stainless steel beams: an experimental and numerical investigation. Journal of
Constructional Steel Research; 54: 109-133.
Morino, S., 1998. Recent developments in hybrid structures in Japan-Research, design
and construction. Engineering Structures, 20(4–6): 336–346.
Mursi, M. & Uy, B., 2003. Strength of concrete filled steel box columns incorporating
interaction buckling. Journal of Structural Engineering, ASCE; 129(5): 626–639.
Nayal, R. & Rasheed, H.A., 2006. Tension stiffening model for concrete beams
reinforced with steel and FRP bars. Journal of Materials in Civil Engineering; 18 (6):
831-841.
Nilsson, J.O., Chai, G. & Kivisäkk, U., 2008. Recent development of stainless steels.
In: Proceedings of the sixth European stainless steel conference; 585-590.
Nowzartash, F. & Mohareb, M., 2009. Plastic interaction relations for elliptical
hollow sections. Thin-Walled Structures; 47: 681-691.
Nowzartash, F. & Mohareb, M., 2011. Column curves for elliptical hollow section
members. Journal of Structural Engineering; 67: 1525-1536.
NSSMC. Nippon Steel and Sumitomo Metal. http://www.nssmc.com/en/
news/old_smi/2011/news2011-07-08.html/, Retrieved in September 2013.
TH-1259_09610405
REFERENCES
169
Nurberger, U., 1996. Stainless Steel in Concrete. State of the Art Report. Publication
number 18, European Federation of Corrosion.
Ohashi, Y., 1992. An experimental study on axial and flexural behavior of concrete
filled L-shaped steel tubes. Architecture Institute of Japan; 8: 1813–1814 [in
Japanese].
Orito, Y., Sato, T., Tanaka, N. & Watanabe, Y., 1987. Study on the unbonded steel
tube concrete structures. Engineering Foundation Conference on Composite
Constructions, Henniker, New Hampshire, USA.
Oshima, M. & Hashimoto, C. 1984. Mechanical properties of concrete confined by
steel rings. In: Summaries of the 39th annual convention, volume V. Japan Society of
Civil Engineers.
Outokumpu, 2013. http://www.outokumpu.com/en/stainless-steel/grades/duplex,
Retrieved in September 2013.
Porco, G., Spadea, G. & Zinno, R., 1994. Finite element analysis and parametric study
of steel-concrete composite beams. Cement and Concrete Composites; 16: 261-272.
Ramberg, W. & Osgood, W.R., 1943. Description of stress-strain curves by three
parameters. NACA Technical Note No. 902.
Rasmussen, K.J.R., 2000a. Recent research on stainless steel tubular structures; 54:
75-88.
Rasmussen, K. J. R., 2000b. The Development of an Australian Standard for Stainless
Steel Structures. Proceedings of the Fifteenth International Speciality Conference on
Cold-formed Steel Structures. St. Louis, Missouri, USA. 659-671.
Rasmussen, K.J.R., 2003. Full-range stress-strain curves for stainless steel alloys.
Journal of Constructional Steel Research; 59: 47-61.
Rasmussen, K.J.R. & Rondal, J., 1997. Explicit approach to design of stainless steel
columns. Journal of Structural Engineering, ASCE; 123: 7, 857-863.
TH-1259_09610405
REFERENCES
170
Ren, Q., Lv, Y., Jia, L. & Liu, D., 2011. Preliminary analysis on inclined concrete-
filled steel tubular stub columns with circular section under axial compression.
Applied Mechanics and Materials; (88-89): 46-49.
Richart, F.E., Brandzaeg, A., & Brown, R.L., 1928. A study of the failure of concrete
under combined compressive stresses. Bull. 185. Champaign, University of Illinois
Eng Exp Station. USA.
Riks, E., 1972. The application of Newton’s method to the problem of elastic stability.
Journal of Applied mechanics; 39: 1060-1065.
Riks, E., 1979. An incremental approach to the solution of snapping problems.
International Journal of Solids and Structures; 15: 529-551.
SABS, 1997. Structural use of steel – part 4: The design of cold-formed stainless steel
structural members. SABS 0162-4:1997.
Saenz, L.P., 1964. Discussion of ‘Equation for the stress-strain curve of concrete’ by
Desayi P. and Krishnan S.J. American Concrete Institute; 61: 1229-1235.
Saliba, N. & Gardner, L., 2013a. Cross-section stability of lean duplex stainless steel
welded I-sections. Journal of Constructional Steel Research; 80: 1-14.
Saliba, N. & Gardner, L., 2013b. Experimental study of the shear response of lean
duplex stainless steel plate girders. Engineering Structures; 46: 375-391.
Schneider, S. P., 1998. Axially loaded concrete-filled steel tubes. Journal of Structural
Engineering; 124 (10): 1125-1138.
Shams, M. & Saadeghvaziri, M. A., 1997. State of the art of concrete-filled steel
tubular columns. ACI Structural Journal; 94(5): 558–571.
Sheikh, S.A. & Uzmeri, S.M., 1988. Strength and ductility of tied concrete columns,
ASCE, Journal of Structural Division, No. 5; 106 (198): 1079-1102.
TH-1259_09610405

REFERENCES
171
Sieurin, H., Sandström, R. & Westin, E.M., 2007. Fracture toughness of the lean
duplex stainless steel LDX 2101. Metallurgical and Materials Transactions A; 37(10):
2975-2981.
SMC. Shanghai Metal Corporation, http://www.shanghaimetal.comFracture,
Retrieved in January 2013.
SSBJA, 1995. The design and construction specifications for stainless steel structures.
Stainless Steel Building Association of Japan [in Japanese].
SSEF. Fun is in the Details: Innovation in Steel Connections. http://tboake.com/
SSEF1/shapes.shtml, Retrieved in September 2013.
Sun, J. & Butterworth, J.W., 1998. Behaviour of steel single angle compression
members axially loaded through one leg.Proceedings of the Australian Structural
Engineering Conference. Auckland: 859-866.
Talja, A. & Salmi, P., 1995. Design of stainless steel RHS beams, columns and beam-
columns. VTT Research notes 1619. Espoo: Technical Research Centre of Finland.
Tao, Z., Uy, B., Han, L.H. & Wang, Z.B., 2009. Analysis and design of concrete-
filled stiffened thin-walled steel tubular columns under axial compression. Thin-
Walled Structures; 47(12):1544-1556.
Tao Z., Uy B, Liao, F.Y. & Han, L.H., 2011. Nonlinear analysis of concrete-filled
square stainless steel stub columns under compression. Journal of Constructional
Steel Research; 67: 1719-1732.
Theofanous, M., Chan, T.M. & Gardner, L., 2009a. Flexural behavior of stainless
steel oval hollow sections. Thin-Walled Structures; 47: 776-787.
Theofanous, M., Chan, T.M. & Gardner, L., 2009b. Structural response of stainless
steel oval hollow section compression members. Engineering Structures; 31: 922-934.
Theofanous, M. & Gardner, L., 2010. Experimental and numerical studies of lean
duplex stainless steel beams. Journal of Constructional Steel Research; 66: 816- 825.
TH-1259_09610405
REFERENCES
172
Theofanous, M. & Gardner, L., 2009. Testing and numerical modelling of lean duplex
stainless steel hollow section columns. Engineering Structures; 31: 3047-3058.
Tomii, M., 1991. Ductile and strong columns composed of steel tube, infilled concrete
and longitudinal steel bars. Special volume. In: Proceedings of the third international
conference on steel–concrete composite structures. Fukuoka, Japan: Association of
Steel-Concrete Structures: 39–66.
Tomii, M. Y., Yoshimura, K. & Morishita, Y., 1977. Experimental Studies on
Concrete filled steel tubular columns under concentric loading. Proeedings
International Colloquium on Stability of Structures under Static and Dynamic Loads;
718-741.
Truman, J., 1985. The initiation and growth of high alloy (stainless) steel production.
Journal of Historical Metallurgy Society. 19(1): 116-125.
Umbarkar, K.R., Patton, M.L. & Singh, K.D., 2012. Effect of single circular
perforation in lean duplex stainless steel (LDSS) hollow circular stub columns under
pure axial compression. Thin-Walled Structures; 54: 72-81.
Uy, B., 1998. Local and post-local buckling of concrete filled steel welded box
columns. Journal of Constructional Steel Research; 47(1–2): 47–72.
Uy, B. & Patil, S.B., 2006. Concrete filled high strength steel box columns for tall
buildings: behaviour and design. Structural Design of Tall Buildings; 5(2):75–94.
Uy, B., Tao, Z. & Han, L.H., 2011. Behaviour of short and slender concrete-filled
stainless steel tubular columns. Journal of Constructional Steel Research; 67: 360-
378.
Virdi, K.S., 1981. Design of circular and rectangular hollow section columns. Journal
of Constructional Steel Research; 1(4): 35-45.
Vrcelj, Z. & Uy, B., 2002. Strength of slender concrete-filled steel box columns
incorporating local buckling. Journal of Constructional Steel Research; 58: 275-300.
TH-1259_09610405
REFERENCES
173
Wahalathantri, B.L., Thambiratnam, D.P., Chan, T.H.T. & Fawzia, S., 2011. A
material model for flexural crack simulation in reinforced concrete elements using
Abaqus. In proceedings of the first international conference on Engineering,
Designing and Developing the Built Environment for Suistainable Wellbeing,
Queensland Universit of Technology, Brisbane; 260-264.
Wang, T.C., Li, X.H., Wang, T.Z. & Kang, G.Y., 2007. Hysteretic behavior of frame
with specially shaped columns subjected to cyclic loading; Journal of Jilin University,
Engineering and Technology Edition; 37(1): 224-228 [in Chinese].
Wang, D. & Lu, X., 2005. Experimental study on the seismic behavior of concrete
filled steel tubular columns with TL section. Journal of Building Structures; 26: 39-
44.
Wempner, G.A., 1971. Discrete approximation related to nonlinear theories of solids.
International Journal of Structural Division; 7: 1581-1599.
Wikimedia. The Celtic Gateway Footbridge, UK. http://commons.wikimedia.org/
wiki/File:Top_section_of_the_Celtic_Gateway_footbridge_-_geograph.org.uk_-
_743313.jpg, Retrieved in September 2013.
Wikipedia. SEG Plaza. http://en.wikipedia.org/wiki/SEG_Plaza, Retrieved in
September 2013.
Wu, M.H., 2000. Numerical analysis of concrete filled steel tubes subjected to axial
force. MS thesis, Dept. of Civil Engineering, National Cheng Kung Univ., Tainan,
Taiwan, R.O.C.
Xu, Y. & Wu, B., 2009. Fire resistance of reinforced concrete columns with L-, T-,
and +-shaped cross-sections. Fire safety Journal; 44: 869-880.
Yang, Y.F. & Han, L.H., 2012. Concrete filled steel tube (CFST) columns subjected
to concentrically partial compression. Thin-Walled Structures; 50: 147-156.
Yang, H., lam, H., & Gardner, L., 2008. Testing and analysis of concrete-filled
elliptical hollow sections. Engineering Structures; 30: 3771 – 3781.
TH-1259_09610405
REFERENCES
174
Yang, Y., Yang, H. & Zhang, S., 2010. Compressive behavior of T-shaped concrete-
filled steel tubular columns. International Journal of Steel Structures; 10-04: 419-430.
Yau, C.Y., Chan, S.L. & So, A.K.W., 1993. Biaxial bending design of arbitrarily
shaped reinforced concrete column. ACI Structural Journal; 90(3): 269-279.
Young, B. & Ellobody, E., 2006. Experimental investigation of concrete-filled cold-
formed high strength stainless steel tube columns. Journal of Constructional Steel
Research; 62(5): 484–92.
Young, B. & Hartono, W., 2002. Compression tests of stainless steel tubular
members. Journal of Structural Engineering, ASCE; 128(6): 754–761.
Young, B. & Lui, W.M., 2005. Behavior of Cold-Formed High Strength Stainless
Steel Sections. Journal of Structural Engineering, ASCE; 1738-1745.
Yu, T., Teng, J.G., Wong, Y.L. & Dong, S.L., 2010. Finite element modeling of
confined concrete-I: Drucker-Prager type plasticity model. Engineering Structures;
32: 665-679.
Zhang, W. & Shahrooz, B. M., 1999. Comparison between ACI and AISC for
concrete-filled tubular columns. Journal of Structural Engineering; 125(11): 1213–
1223.
Zhang, J. & Yang, J., 2012. Study on mechanism of L-shaped concrete-filled steel
tubular columns subjected to axial compression. Advanced Materials Research; 476-
478: 2463-2468.
Zhang, D. & Ye, X.G., 2003. Non-linear analysis of special-shaped reinforced
concrete columns. Journal of Hefei University of Technology; 26(4): 490-494 [in
Chinese].
Zhao, X.L., Han, L.H., & Lu, H., 2010. Concrete-filled tubular members and
connections. London: Spon Press.
TH-1259_09610405
REFERENCES
175
Zhao, X.L., Lu, H. & Galteri, S., 2007. Tests of elliptical sections filled with SCC
(self-compacting concrete). In: Proceedings of the fifth international conference on
advances in steel structures. Singapore: 950–955.
Zhao, X.L. & Packer, J.A., 2009. Tests and design of concrete-filled elliptical hollow
section stub columns. Thin-Walled Structures; 47(6–7): 617–628.
Zhou, F. & Young, B., 2005. Tests of cold-formed stainless steel tubular flexural
members. Thin-Walled Structures; 43: 1325-1337.
Zuo, Z.L., Cai J., Yang, C., Chen, Q.J. & Sun, S., 2012. Axial load behavior of L-
shaped CFT stub columns with binding bars. Engineering Structures; 37: 88-98.
TH-1259_09610405
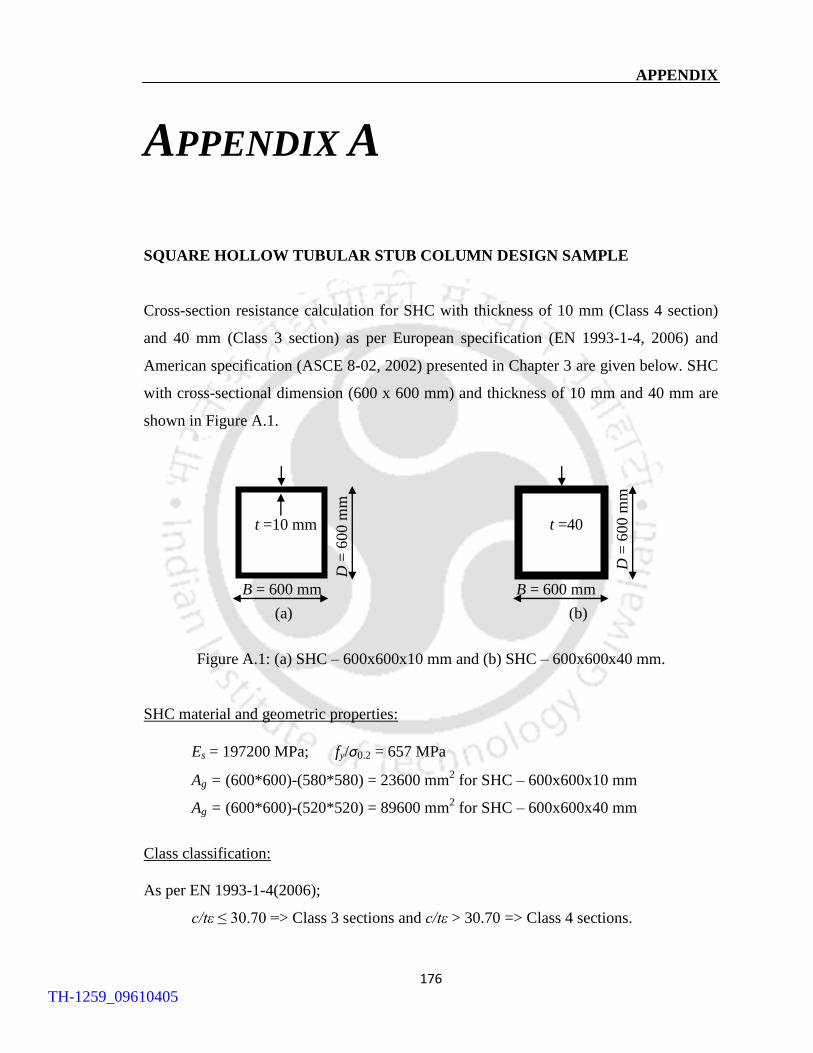
APPENDIX
176
APPENDIX A
SQUARE HOLLOW TUBULAR STUB COLUMN DESIGN SAMPLE
Cross-section resistance calculation for SHC with thickness of 10 mm (Class 4 section)
and 40 mm (Class 3 section) as per European specification (EN 1993-1-4, 2006) and
American specification (ASCE 8-02, 2002) presented in Chapter 3 are given below. SHC
with cross-sectional dimension (600 x 600 mm) and thickness of 10 mm and 40 mm are
shown in Figure A.1.
(a) (b)
Figure A.1: (a) SHC – 600x600x10 mm and (b) SHC – 600x600x40 mm.
SHC material and geometric properties:
Es = 197200 MPa; fy/σ0.2 = 657 MPa
Ag = (600*600)-(580*580) = 23600 mm2 for SHC – 600x600x10 mm
Ag = (600*600)-(520*520) = 89600 mm2 for SHC – 600x600x40 mm
Class classification:
As per EN 1993-1-4(2006);
c/tε ≤ 30.70 => Class 3 sections and c/tε > 30.70 => Class 4 sections.
c t =10 mm
B = 600 mm D
= 6
00
mm
c
B = 600 mm D
= 6
00 m
m
t =40
TH-1259_09610405
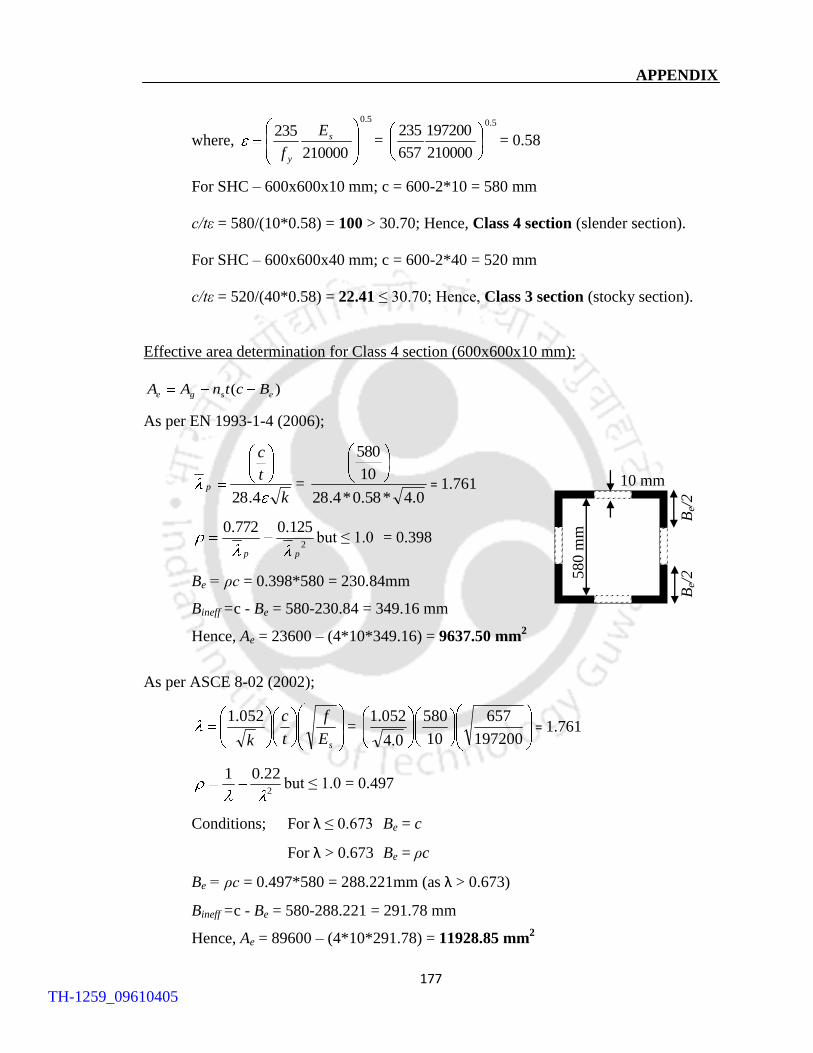
APPENDIX
177
where,
5.0
210000
235 s
y
E
f=
5.0
210000
197200
657
235= 0.58
For SHC – 600x600x10 mm; c = 600-2*10 = 580 mm
c/tε = 580/(10*0.58) = 100 > 30.70; Hence, Class 4 section (slender section).
For SHC – 600x600x40 mm; c = 600-2*40 = 520 mm
c/tε = 520/(40*0.58) = 22.41 ≤ 30.70; Hence, Class 3 section (stocky section).
Effective area determination for Class 4 section (600x600x10 mm):
)( esge BctnAA
As per EN 1993-1-4 (2006);
k
t
c
p
4.28=
0.4*58.0*4.28
10
580
= 1.761
2
125.0772.0
pp
but ≤ 1.0 = 0.398
Be = ρc = 0.398*580 = 230.84mm
Bineff =c - Be = 580-230.84 = 349.16 mm
Hence, Ae = 23600 – (4*10*349.16) = 9637.50 mm2
As per ASCE 8-02 (2002);
sE
f
t
c
k
052.1=
197200
657
10
580
0.4
052.1= 1.761
2
22.01but ≤ 1.0 = 0.497
Conditions; For λ ≤ 0.673 Be = c
For λ > 0.673 Be = ρc
Be = ρc = 0.497*580 = 288.221mm (as λ > 0.673)
Bineff =c - Be = 580-288.221 = 291.78 mm
Hence, Ae = 89600 – (4*10*291.78) = 11928.85 mm2
Be/
2
Be/
2
580
mm
10 mm
TH-1259_09610405
APPENDIX
178
Unfactored Cross-sectional resistance:
For Class 3 section (stocky section) of SHC – 600x600x40 mm;
PEN1993-1-4 = fyAg = 657*89600 = 58867.20 kN
PASCE 8-02 = fyAg = 657*89600 = 58867.20 kN
For Class 4 section (slender section) of SHC – 600x600x10 mm;
PEN1993-1-4 = fyAe = 657* 9637.50 = 6331.84 kN
PASCE 8-02 = fyAe = 657* 11928.85 = 7837.25 kN
TH-1259_09610405
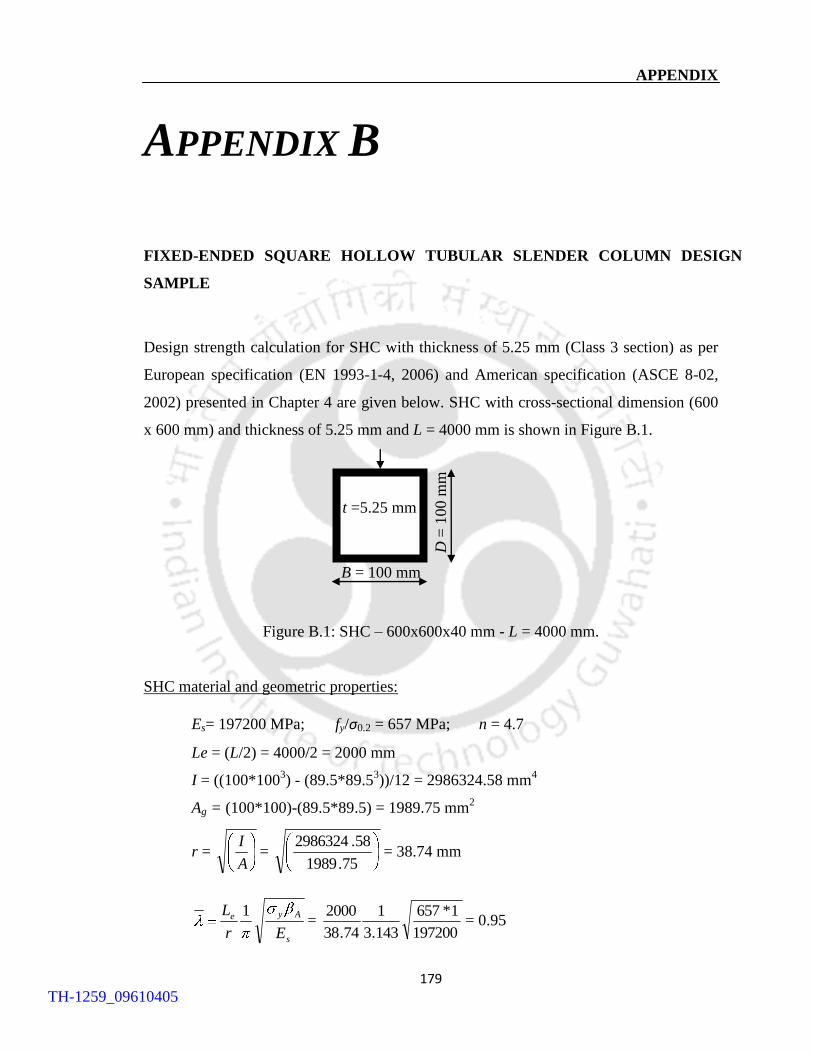
APPENDIX
179
APPENDIX B
FIXED-ENDED SQUARE HOLLOW TUBULAR SLENDER COLUMN DESIGN
SAMPLE
Design strength calculation for SHC with thickness of 5.25 mm (Class 3 section) as per
European specification (EN 1993-1-4, 2006) and American specification (ASCE 8-02,
2002) presented in Chapter 4 are given below. SHC with cross-sectional dimension (600
x 600 mm) and thickness of 5.25 mm and L = 4000 mm is shown in Figure B.1.
Figure B.1: SHC – 600x600x40 mm - L = 4000 mm.
SHC material and geometric properties:
Es= 197200 MPa; fy/σ0.2 = 657 MPa; n = 4.7
Le = (L/2) = 4000/2 = 2000 mm
I = ((100*1003) - (89.5*89.5
3))/12 = 2986324.58 mm
4
Ag = (100*100)-(89.5*89.5) = 1989.75 mm2
r = A
I=
75.1989
58.2986324= 38.74 mm
s
Aye
Er
L 1=
197200
1*657
143.3
1
74.38
2000= 0.95
c
D =
100 m
m
B = 100 mm
t =5.25 mm
TH-1259_09610405
APPENDIX
180
Class classification:
As per EN 1993-1-4(2006);
c/tε ≤ 30.70 => Class 3 sections and c/tε > 30.70 => Class 4 sections.
Where,
5.0
210000
235 s
y
E
f=
5.0
210000
197200
657
235= 0.58
For SHC – 100x100x5.25 mm; c = 100-2*5.25 = 89.5 mm
c/tε = 89.5/(5.25*0.58) = 29.39 ≤ 30.70; Hence, Class 3 section (stocky section).
Unfactored Design strength:
As per EN 1993-1-4 (2006);
))(1(5.0 2
0 = )95.0)40.095.0(49.01(5.0 2 = 1.086
0.1)(
1
5.022=
5.022 )95.0086.1(086.1
1= 0.62
PEN1993-1-4 = χfyAg = 0.62*657*1989.75 = 810.5 kN
As per ASCE 8-02 (2002);
Check 1: f = 657 MPa
1
002.0
n
y
sy
sy
t
f
fnEf
EfE =
14
657
657*197200*4*002.0657
197200*657= 51603.71 MPa
y
e
tn f
r
L
Ef
2
2
= 2
2
74.38
2000
71.51603*143.3= 191.27 657 (assumed value)
Check 2: f = 500 MPa
1
002.0
n
y
sy
sy
t
f
fnEf
EfE =
14
657
500*197200*4*002.0500
197200*500= 97275.72 MPa
TH-1259_09610405

APPENDIX
181
y
e
tn f
r
L
Ef
2
2
= 2
2
74.38
2000
723.97275*143.3= 360.56 500 (assumed value)
Check 3: f = 442.3MPa
1
002.0
n
y
sy
sy
t
f
fnEf
EfE =
14
657
3.442*197200*4*002.03.442
197200*3.442=119329 MPa
y
e
tn f
r
L
Ef
2
2
= 2
2
74.38
2000
119329*143.3= 442.3 = 442.3 (assumed value)
Hence, fn = 442.3MPa
P ASCE 8-02 = Agfn = 1989.75 *442.3 = 880.07 kN
TH-1259_09610405
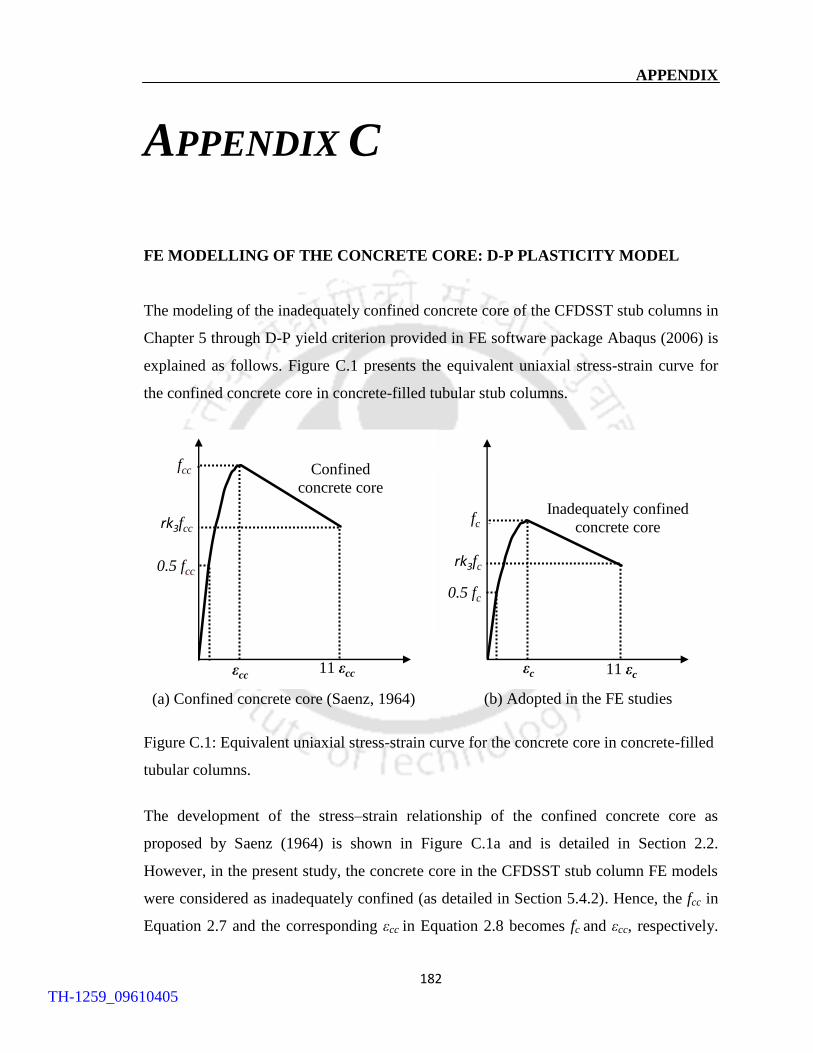
APPENDIX
182
APPENDIX C
FE MODELLING OF THE CONCRETE CORE: D-P PLASTICITY MODEL
The modeling of the inadequately confined concrete core of the CFDSST stub columns in
Chapter 5 through D-P yield criterion provided in FE software package Abaqus (2006) is
explained as follows. Figure C.1 presents the equivalent uniaxial stress-strain curve for
the confined concrete core in concrete-filled tubular stub columns.
(a) Confined concrete core (Saenz, 1964) (b) Adopted in the FE studies
Figure C.1: Equivalent uniaxial stress-strain curve for the concrete core in concrete-filled
tubular columns.
The development of the stress–strain relationship of the confined concrete core as
proposed by Saenz (1964) is shown in Figure C.1a and is detailed in Section 2.2.
However, in the present study, the concrete core in the CFDSST stub column FE models
were considered as inadequately confined (as detailed in Section 5.4.2). Hence, the fcc in
Equation 2.7 and the corresponding εcc in Equation 2.8 becomes fc and εcc, respectively.
0
5
10
15
20
25
30
35
40
45
50
0 0.005 0.01 0.015
Str
ess
Strain
fcc
rk3fcc
εcc 11 εcc
0.5 fcc
Confined
concrete core
0
10
20
30
40
50
60
70
0 0.005 0.01 0.015
Str
ess
Strain
fc
rk3fc
εc 11 εc
0.5 fc
Inadequately confined
concrete core
TH-1259_09610405

APPENDIX
183
Figure C.1b shows the adopted inadequately confined concrete core model in the
concrete-filled tubular stub column FE models.
The linear elasticity model was used in conjunction with the plasticity models. Classical
linear isotropic elastic constants of the confined concrete core such as Ec and νc (the
elastic part upto the proportional limit is taken as (0.5fc) as detailed in Section 2.7.2) are
taken care of by the *Elastic material option available in the Abaqus material library as
(e.g. for fck = 25 MPa):
*Elastic
21019., 0.2
The yielding part of the confined stress-strain curve for concrete core, which is part after
the proportional limit, is treated by the D-P yield criterion model available in the Abaqus
material library. This D-P model is intended to simulate material response under
essentially monotonic loading, such as the behavior of the concrete core in concrete-filled
tubular stub columns under pure axial compression, and also followed by many
researchers (e.g. Dai and Lam, 2010, Ellobody and Young, 2006, Hassanein, 2010,
Hassanein et al., 2013). Because the concrete in the concrete-filled tubular columns is
usually subjected to triaxial compressive stresses, the failure of concrete is dominated by
the compressive failure surface expanding with increasing hydrostatic pressure. Figure
C.2 shows a plot of second deviatoric stress invariant (J) with the first stress invariant (I1)
to model the yield surface of the confined concrete core.
Figure C.2: Linear D-P yield criterion for confined concrete core (Hu et al., 2003).
0
0.2
0.4
0.6
0.8
1
1.2
-4 -2 0 2 4 6
G
d
β
I1
J
Ec νc
TH-1259_09610405
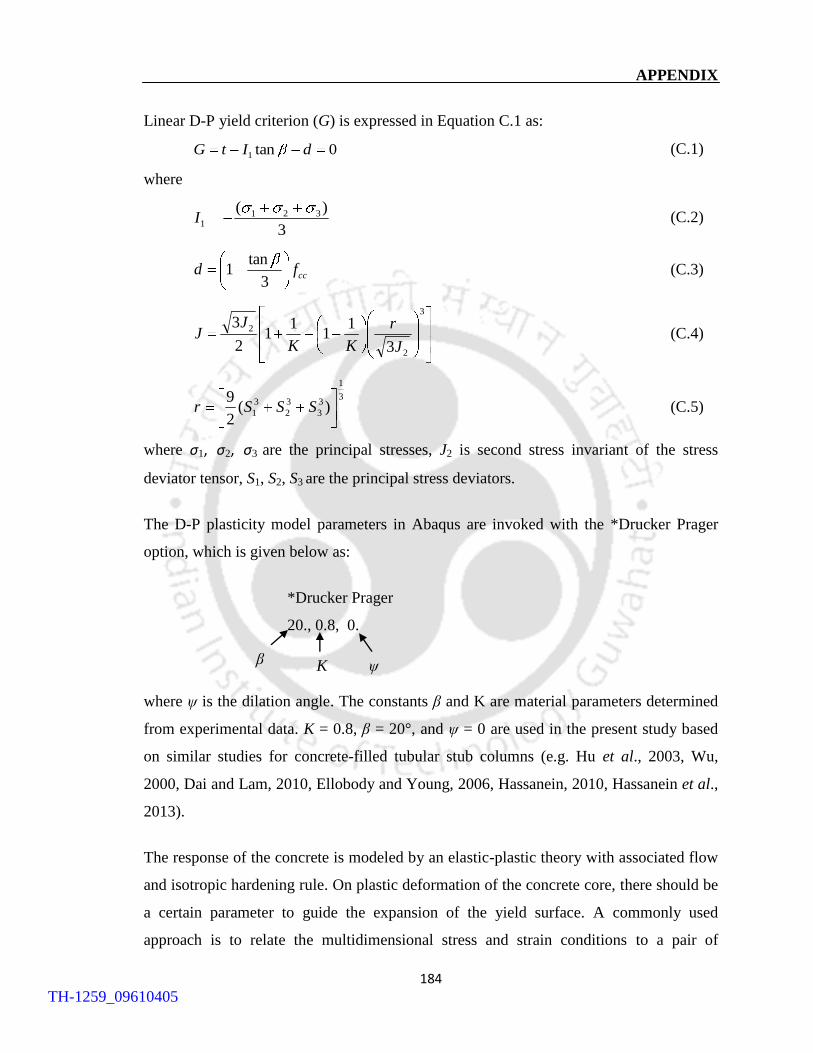
APPENDIX
184
Linear D-P yield criterion (G) is expressed in Equation C.1 as:
0tan1 dItG (C.1)
where
3
)( 3211I (C.2)
ccfd3
tan1 (C.3)
3
2
2
3
11
11
2
3
J
r
KK
JJ (C.4)
3
1
3
3
3
2
3
1 )(2
9SSSr (C.5)
where σ1, σ2, σ3 are the principal stresses, J2 is second stress invariant of the stress
deviator tensor, S1, S2, S3 are the principal stress deviators.
The D-P plasticity model parameters in Abaqus are invoked with the *Drucker Prager
option, which is given below as:
*Drucker Prager
20., 0.8, 0.
where ψ is the dilation angle. The constants β and K are material parameters determined
from experimental data. K = 0.8, β = 20°, and ψ = 0 are used in the present study based
on similar studies for concrete-filled tubular stub columns (e.g. Hu et al., 2003, Wu,
2000, Dai and Lam, 2010, Ellobody and Young, 2006, Hassanein, 2010, Hassanein et al.,
2013).
The response of the concrete is modeled by an elastic-plastic theory with associated flow
and isotropic hardening rule. On plastic deformation of the concrete core, there should be
a certain parameter to guide the expansion of the yield surface. A commonly used
approach is to relate the multidimensional stress and strain conditions to a pair of
β K ψ
TH-1259_09610405

APPENDIX
185
quantities, namely, fc and εc, such that results obtained following different loading paths
can all be correlated by means of the equivalent uniaxial stress-strain relationship
proposed by Saenez (1964), and is detailed in Chapter 2. The developed uniaxial stress-
strain curve (see Figure C.1) is then feeded in the Abaqus through the *Drucker Prager
Hardening option available in the Abaqus library.
TH-1259_09610405
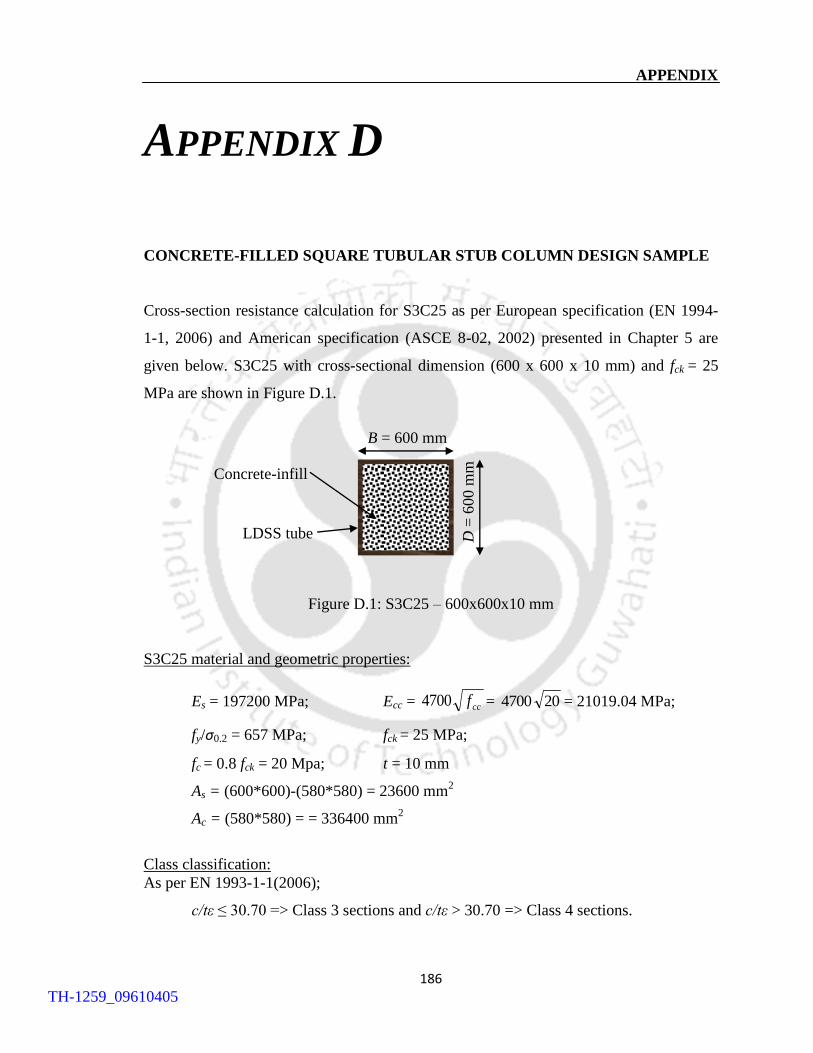
APPENDIX
186
APPENDIX D
CONCRETE-FILLED SQUARE TUBULAR STUB COLUMN DESIGN SAMPLE
Cross-section resistance calculation for S3C25 as per European specification (EN 1994-
1-1, 2006) and American specification (ASCE 8-02, 2002) presented in Chapter 5 are
given below. S3C25 with cross-sectional dimension (600 x 600 x 10 mm) and fck = 25
MPa are shown in Figure D.1.
Figure D.1: S3C25 – 600x600x10 mm
S3C25 material and geometric properties:
Es = 197200 MPa; Ecc = ccf4700 = 204700 = 21019.04 MPa;
fy/σ0.2 = 657 MPa; fck = 25 MPa;
fc = 0.8 fck = 20 Mpa; t = 10 mm
As = (600*600)-(580*580) = 23600 mm2
Ac = (580*580) = = 336400 mm2
Class classification:
As per EN 1993-1-1(2006);
c/tε ≤ 30.70 => Class 3 sections and c/tε > 30.70 => Class 4 sections.
B = 600 mm
Concrete-infill
LDSS tube D =
600 m
m
TH-1259_09610405
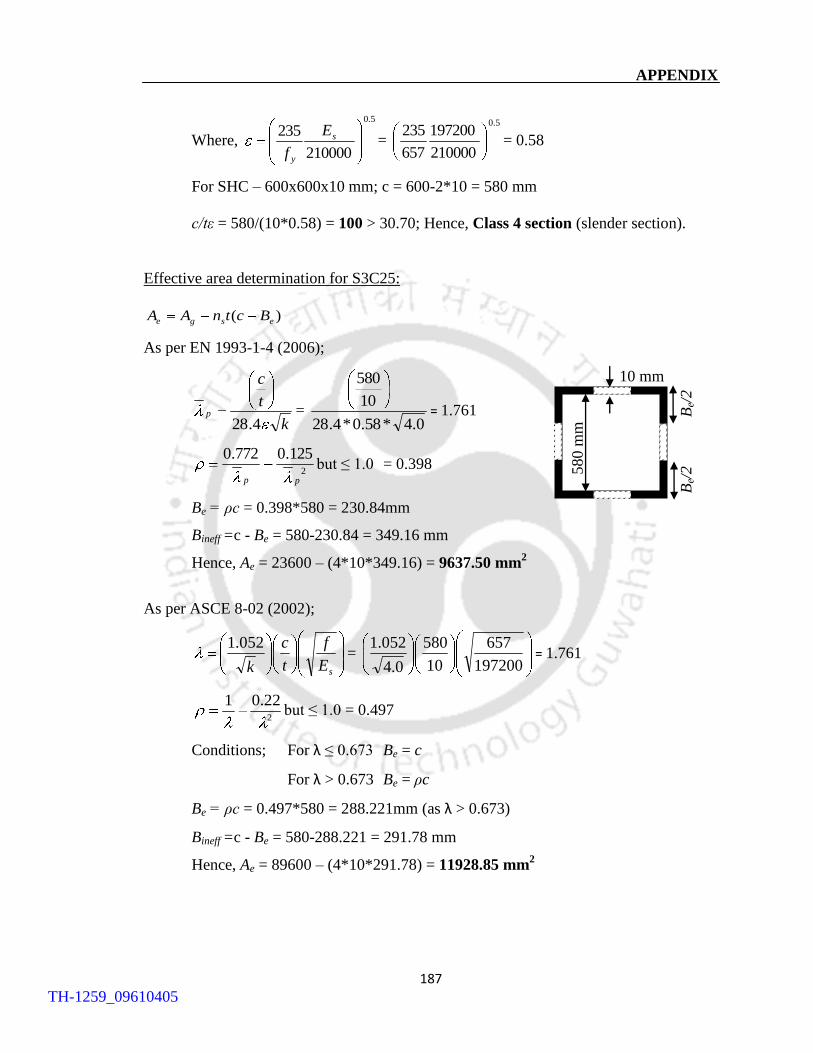
APPENDIX
187
Where,
5.0
210000
235 s
y
E
f=
5.0
210000
197200
657
235= 0.58
For SHC – 600x600x10 mm; c = 600-2*10 = 580 mm
c/tε = 580/(10*0.58) = 100 > 30.70; Hence, Class 4 section (slender section).
Effective area determination for S3C25:
)( esge BctnAA
As per EN 1993-1-4 (2006);
k
t
c
p
4.28=
0.4*58.0*4.28
10
580
= 1.761
2
125.0772.0
pp
but ≤ 1.0 = 0.398
Be = ρc = 0.398*580 = 230.84mm
Bineff =c - Be = 580-230.84 = 349.16 mm
Hence, Ae = 23600 – (4*10*349.16) = 9637.50 mm2
As per ASCE 8-02 (2002);
sE
f
t
c
k
052.1=
197200
657
10
580
0.4
052.1= 1.761
2
22.01but ≤ 1.0 = 0.497
Conditions; For λ ≤ 0.673 Be = c
For λ > 0.673 Be = ρc
Be = ρc = 0.497*580 = 288.221mm (as λ > 0.673)
Bineff =c - Be = 580-288.221 = 291.78 mm
Hence, Ae = 89600 – (4*10*291.78) = 11928.85 mm2
Be/
2
Be/
2
580 m
m
10 mm
TH-1259_09610405
APPENDIX
188
Unfactored cross-sectional resistance:
PEN1994-1-1 = (fyAe + fcAc)
= (657*9637.5+20*336400)
= 13059.84 kN
PASCE 8-02 = (fyAe + fcAc)
= (657*11928.85+20*336400)
= 14565.25 kN
TH-1259_09610405
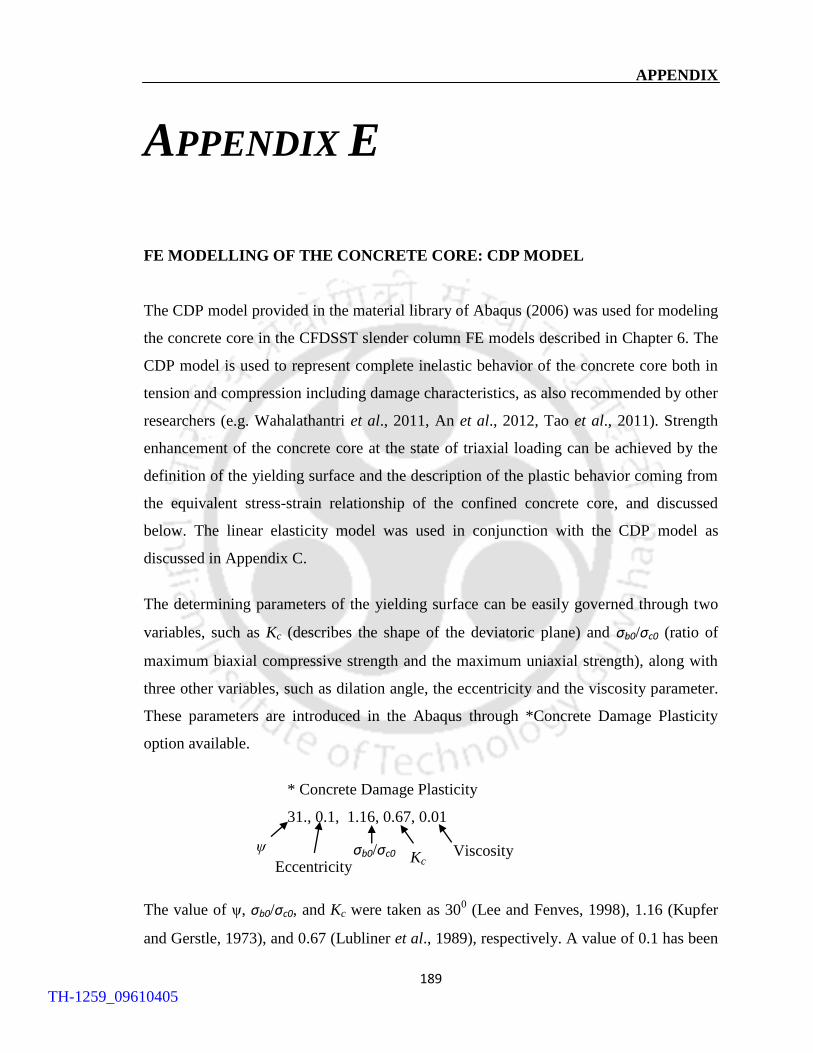
APPENDIX
189
APPENDIX E
FE MODELLING OF THE CONCRETE CORE: CDP MODEL
The CDP model provided in the material library of Abaqus (2006) was used for modeling
the concrete core in the CFDSST slender column FE models described in Chapter 6. The
CDP model is used to represent complete inelastic behavior of the concrete core both in
tension and compression including damage characteristics, as also recommended by other
researchers (e.g. Wahalathantri et al., 2011, An et al., 2012, Tao et al., 2011). Strength
enhancement of the concrete core at the state of triaxial loading can be achieved by the
definition of the yielding surface and the description of the plastic behavior coming from
the equivalent stress-strain relationship of the confined concrete core, and discussed
below. The linear elasticity model was used in conjunction with the CDP model as
discussed in Appendix C.
The determining parameters of the yielding surface can be easily governed through two
variables, such as Kc (describes the shape of the deviatoric plane) and σb0/σc0 (ratio of
maximum biaxial compressive strength and the maximum uniaxial strength), along with
three other variables, such as dilation angle, the eccentricity and the viscosity parameter.
These parameters are introduced in the Abaqus through *Concrete Damage Plasticity
option available.
* Concrete Damage Plasticity
31., 0.1, 1.16, 0.67, 0.01
The value of ψ, σb0/σc0, and Kc were taken as 300 (Lee and Fenves, 1998), 1.16 (Kupfer
and Gerstle, 1973), and 0.67 (Lubliner et al., 1989), respectively. A value of 0.1 has been
Kc σb0/σc0 ψ
Eccentricity Viscosity
TH-1259_09610405
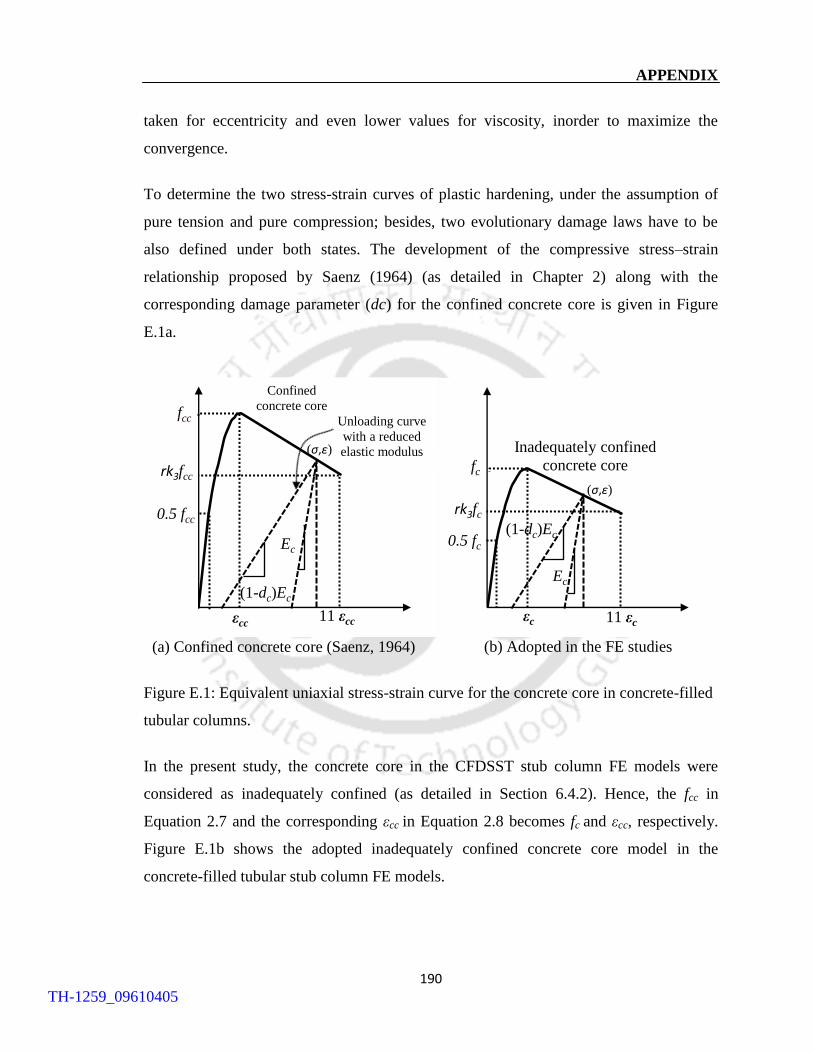
APPENDIX
190
taken for eccentricity and even lower values for viscosity, inorder to maximize the
convergence.
To determine the two stress-strain curves of plastic hardening, under the assumption of
pure tension and pure compression; besides, two evolutionary damage laws have to be
also defined under both states. The development of the compressive stress–strain
relationship proposed by Saenz (1964) (as detailed in Chapter 2) along with the
corresponding damage parameter (dc) for the confined concrete core is given in Figure
E.1a.
(a) Confined concrete core (Saenz, 1964) (b) Adopted in the FE studies
Figure E.1: Equivalent uniaxial stress-strain curve for the concrete core in concrete-filled
tubular columns.
In the present study, the concrete core in the CFDSST stub column FE models were
considered as inadequately confined (as detailed in Section 6.4.2). Hence, the fcc in
Equation 2.7 and the corresponding εcc in Equation 2.8 becomes fc and εcc, respectively.
Figure E.1b shows the adopted inadequately confined concrete core model in the
concrete-filled tubular stub column FE models.
0
5
10
15
20
25
30
35
40
45
50
0 0.005 0.01 0.015
Str
ess
Strain
fcc
rk3fcc
εcc 11 εcc
0.5 fcc
Confined
concrete core
(1-dc)Ec
Ec
Unloading curve
with a reduced
elastic modulus (σ,ε)
0
10
20
30
40
50
60
70
0 0.005 0.01 0.015
Str
ess
Strain
fc
rk3fc
εc 11 εc
0.5 fc
Inadequately confined
concrete core
(1-dc)Ec
Ec
(σ,ε)
TH-1259_09610405
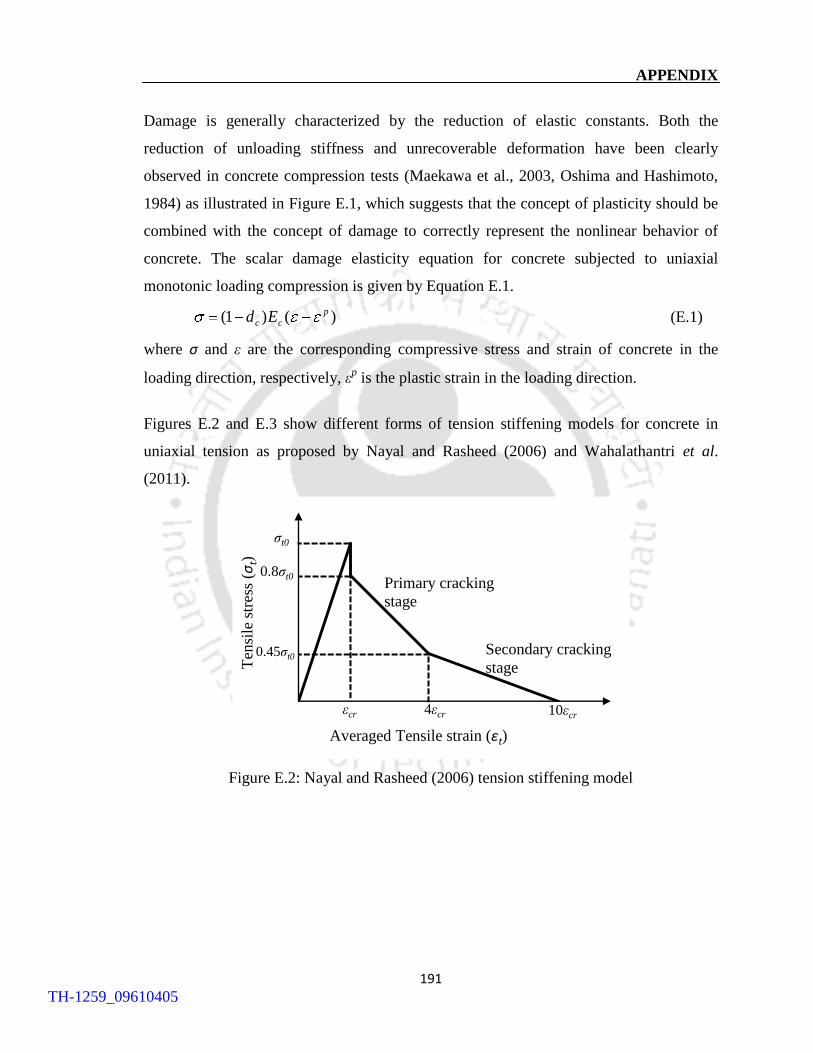
APPENDIX
191
Damage is generally characterized by the reduction of elastic constants. Both the
reduction of unloading stiffness and unrecoverable deformation have been clearly
observed in concrete compression tests (Maekawa et al., 2003, Oshima and Hashimoto,
1984) as illustrated in Figure E.1, which suggests that the concept of plasticity should be
combined with the concept of damage to correctly represent the nonlinear behavior of
concrete. The scalar damage elasticity equation for concrete subjected to uniaxial
monotonic loading compression is given by Equation E.1.
)()1( p
cc Ed (E.1)
where σ and ε are the corresponding compressive stress and strain of concrete in the
loading direction, respectively, εp is the plastic strain in the loading direction.
Figures E.2 and E.3 show different forms of tension stiffening models for concrete in
uniaxial tension as proposed by Nayal and Rasheed (2006) and Wahalathantri et al.
(2011).
Figure E.2: Nayal and Rasheed (2006) tension stiffening model
0
2
4
6
8
10
12
0 2 4 6
Primary cracking
stage
Averaged Tensile strain (εt)
Ten
sile
str
ess
(σt)
σt0
0.8σt0
0.45σt0 Secondary cracking
stage
εcr 4εcr 10εcr
TH-1259_09610405
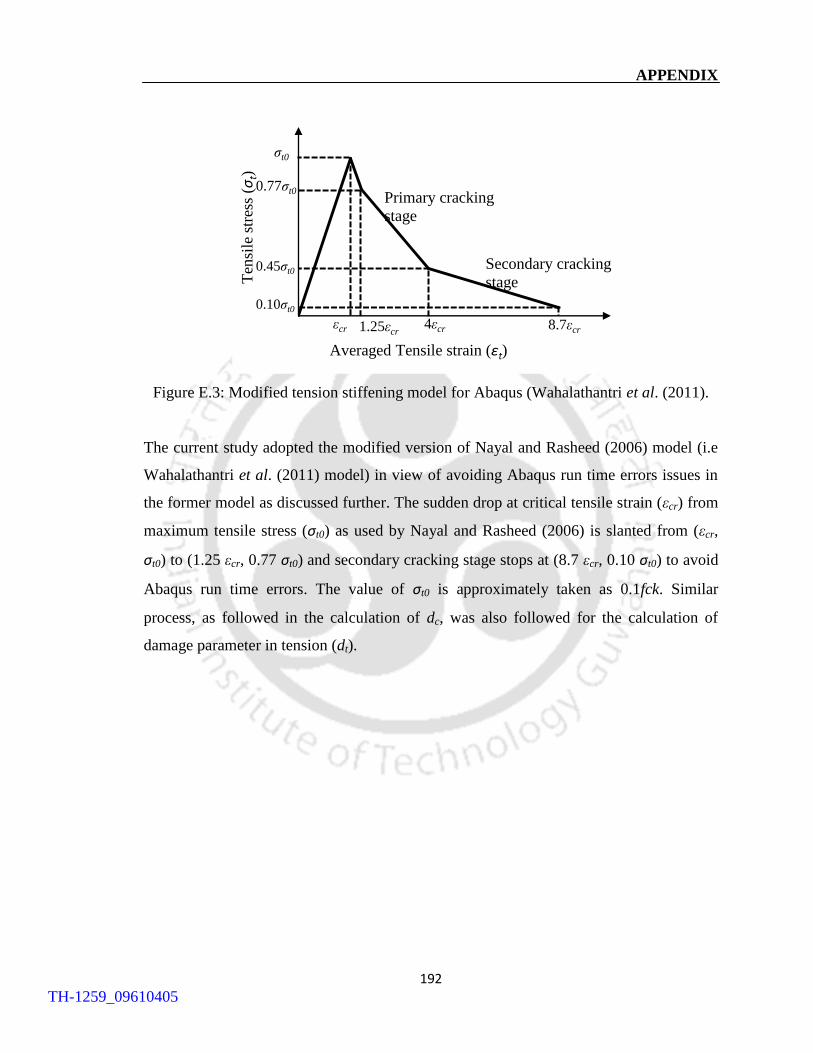
APPENDIX
192
Figure E.3: Modified tension stiffening model for Abaqus (Wahalathantri et al. (2011).
The current study adopted the modified version of Nayal and Rasheed (2006) model (i.e
Wahalathantri et al. (2011) model) in view of avoiding Abaqus run time errors issues in
the former model as discussed further. The sudden drop at critical tensile strain (εcr) from
maximum tensile stress (σt0) as used by Nayal and Rasheed (2006) is slanted from (εcr,
σt0) to (1.25 εcr, 0.77 σt0) and secondary cracking stage stops at (8.7 εcr, 0.10 σt0) to avoid
Abaqus run time errors. The value of σt0 is approximately taken as 0.1fck. Similar
process, as followed in the calculation of dc, was also followed for the calculation of
damage parameter in tension (dt).
0
2
4
6
8
10
12
0 2 4 6
Primary cracking
stage
Averaged Tensile strain (εt)
Ten
sile
str
ess
(σt)
σt0
0.77σt0
0.45σt0 Secondary cracking
stage
εcr 4εcr 8.7εcr
0.10σt0
1.25εcr
TH-1259_09610405
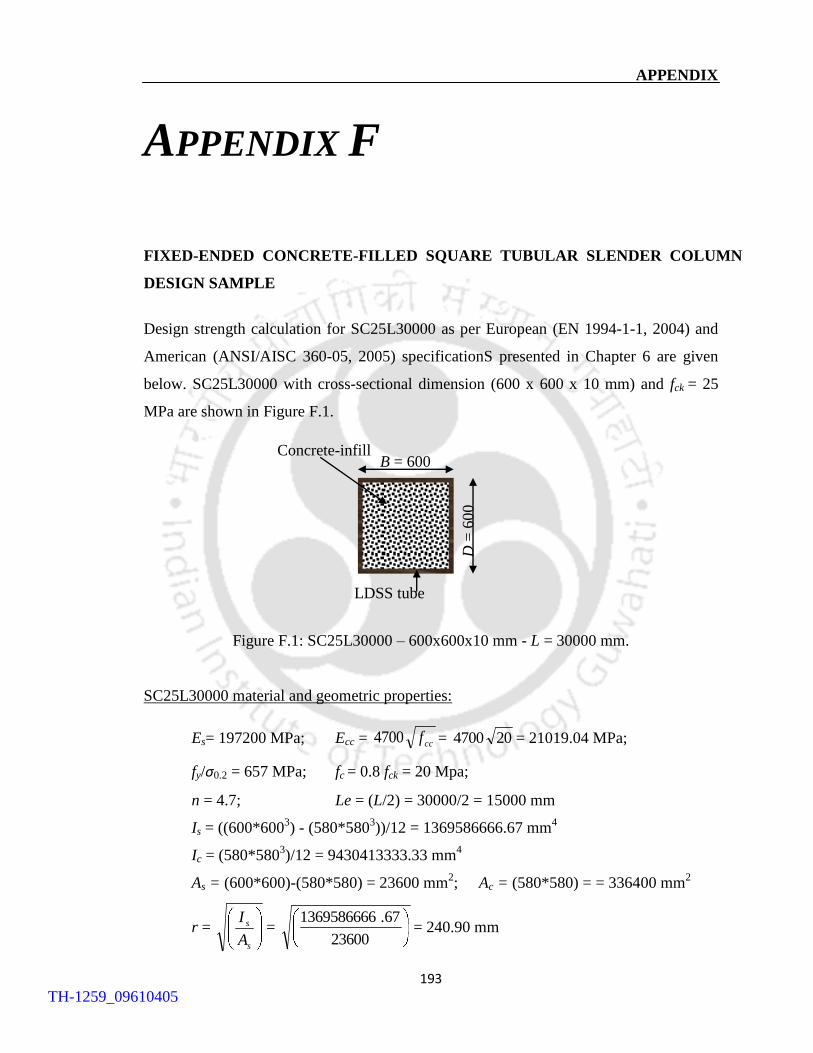
APPENDIX
193
APPENDIX F
FIXED-ENDED CONCRETE-FILLED SQUARE TUBULAR SLENDER COLUMN
DESIGN SAMPLE
Design strength calculation for SC25L30000 as per European (EN 1994-1-1, 2004) and
American (ANSI/AISC 360-05, 2005) specificationS presented in Chapter 6 are given
below. SC25L30000 with cross-sectional dimension (600 x 600 x 10 mm) and fck = 25
MPa are shown in Figure F.1.
Figure F.1: SC25L30000 – 600x600x10 mm - L = 30000 mm.
SC25L30000 material and geometric properties:
Es= 197200 MPa; Ecc = ccf4700 = 204700 = 21019.04 MPa;
fy/σ0.2 = 657 MPa; fc = 0.8 fck = 20 Mpa;
n = 4.7; Le = (L/2) = 30000/2 = 15000 mm
Is = ((600*6003) - (580*580
3))/12 = 1369586666.67 mm
4
Ic = (580*5803)/12 = 9430413333.33 mm
4
As = (600*600)-(580*580) = 23600 mm2; Ac = (580*580) = = 336400 mm
2
r = s
s
A
I=
23600
67.1369586666= 240.90 mm
Concrete-infill
LDSS tube
B = 600 D
= 6
00
TH-1259_09610405
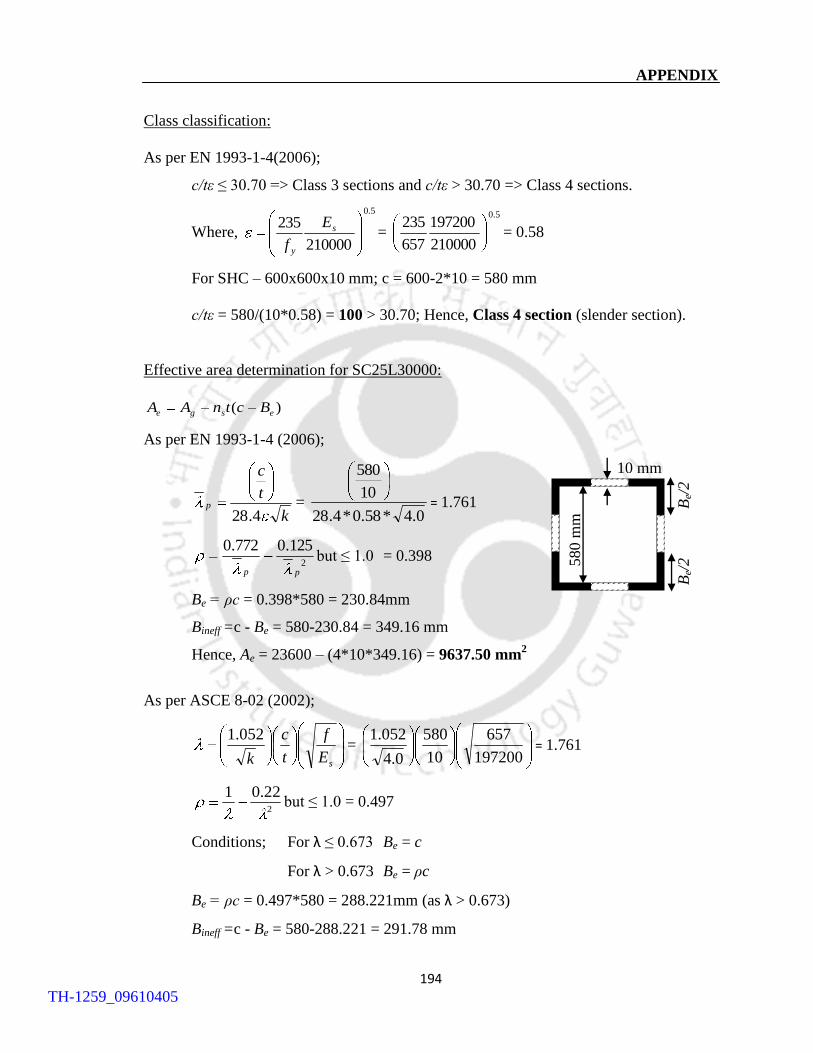
APPENDIX
194
Class classification:
As per EN 1993-1-4(2006);
c/tε ≤ 30.70 => Class 3 sections and c/tε > 30.70 => Class 4 sections.
Where,
5.0
210000
235 s
y
E
f=
5.0
210000
197200
657
235= 0.58
For SHC – 600x600x10 mm; c = 600-2*10 = 580 mm
c/tε = 580/(10*0.58) = 100 > 30.70; Hence, Class 4 section (slender section).
Effective area determination for SC25L30000:
)( esge BctnAA
As per EN 1993-1-4 (2006);
k
t
c
p
4.28=
0.4*58.0*4.28
10
580
= 1.761
2
125.0772.0
pp
but ≤ 1.0 = 0.398
Be = ρc = 0.398*580 = 230.84mm
Bineff =c - Be = 580-230.84 = 349.16 mm
Hence, Ae = 23600 – (4*10*349.16) = 9637.50 mm2
As per ASCE 8-02 (2002);
sE
f
t
c
k
052.1=
197200
657
10
580
0.4
052.1= 1.761
2
22.01but ≤ 1.0 = 0.497
Conditions; For λ ≤ 0.673 Be = c
For λ > 0.673 Be = ρc
Be = ρc = 0.497*580 = 288.221mm (as λ > 0.673)
Bineff =c - Be = 580-288.221 = 291.78 mm
Be/
2
Be/
2
580
mm
10 mm
TH-1259_09610405
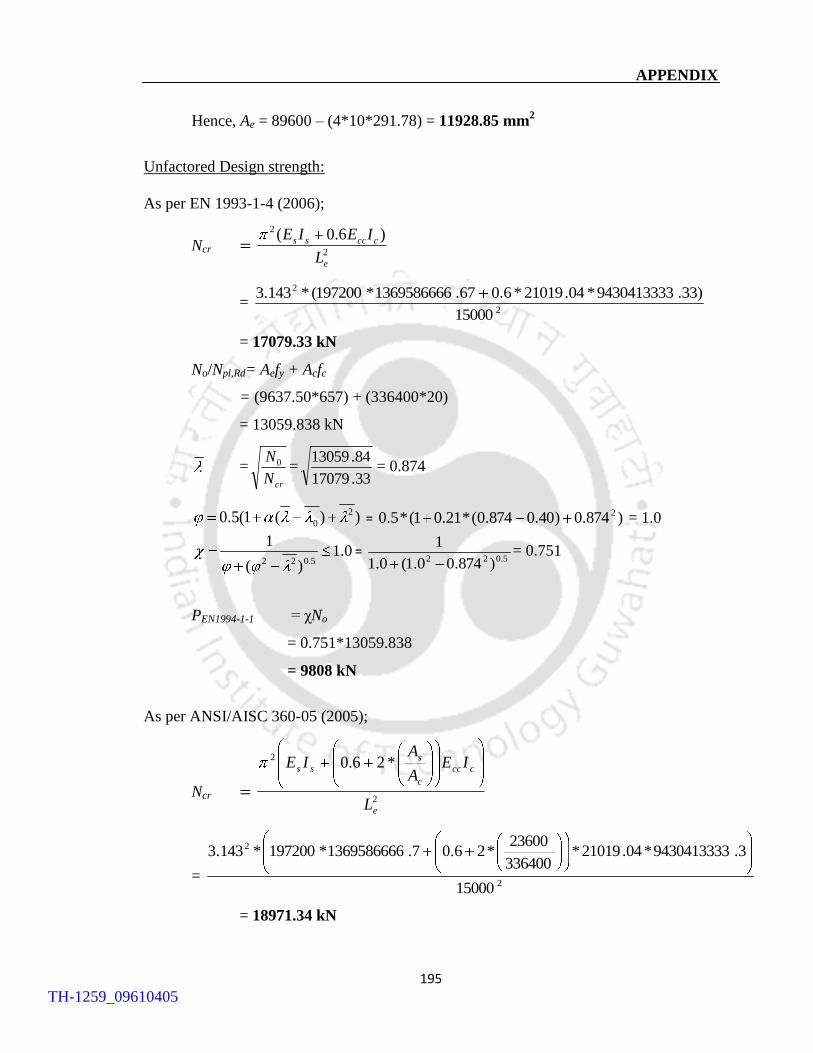
APPENDIX
195
Hence, Ae = 89600 – (4*10*291.78) = 11928.85 mm2
Unfactored Design strength:
As per EN 1993-1-4 (2006);
Ncr = 2
2 )6.0(
e
cccss
L
IEIE
= 2
2
15000
)33.9430413333*04.21019*6.067.1369586666*197200(*143.3
= 17079.33 kN
No/Npl,Rd= Aefy + Acfc
= (9637.50*657) + (336400*20)
= 13059.838 kN
=crN
N0 =33.17079
84.13059= 0.874
))(1(5.0 2
0 = )874.0)40.0874.0(*21.01(*5.0 2 = 1.0
0.1)(
1
5.022=
5.022 )874.00.1(0.1
1= 0.751
PEN1994-1-1 = χNo
= 0.751*13059.838
= 9808 kN
As per ANSI/AISC 360-05 (2005);
Ncr = 2
2 *26.0
e
ccc
c
s
ss
L
IEA
AIE
= 2
2
15000
3.9430413333*04.21019*336400
23600*26.07.1369586666*197200*143.3
= 18971.34 kN
TH-1259_09610405

APPENDIX
196
Check 1: Assume f = 657 MPa
1
002.0
n
y
sy
sy
t
f
fnEf
EfE =
17.4
657
657*197200*7.4*002.0657
197200*657= 51604 MPa
y
e
tn f
r
L
Ef
2
2
= 2
2
90.240
15000
51604*143.3= 131.48 657 (assumed value)
Check 2: Assume f = 500 MPa
Et = 1
002.0
n
y
sy
sy
f
fnEf
Ef=
17.4
657
500*197200*7.4*002.0500
197200*500
= 97275.72 MPa
y
e
tn f
r
L
Ef
2
2
= 2
2
90.240
15000
72.97275*143.3= 247.85 500 (assumed value)
Check 3: Assume f = 373 MPa
Et = 1
002.0
n
y
sy
sy
f
fnEf
Ef=
17.4
657
373*197200*1.4*002.0373
197200*373
= 146358.51 MPa
y
e
tn f
r
L
Ef
2
2
= 2
2
90.240
15000
51.146358*143.3= 373 = 373 (assumed value)
Hence, fn = 373MPa
No/Npl,Rd= Aefn + Acfc
= (11928.85*373) + (336400*20)
= 11297.105 kN
TH-1259_09610405
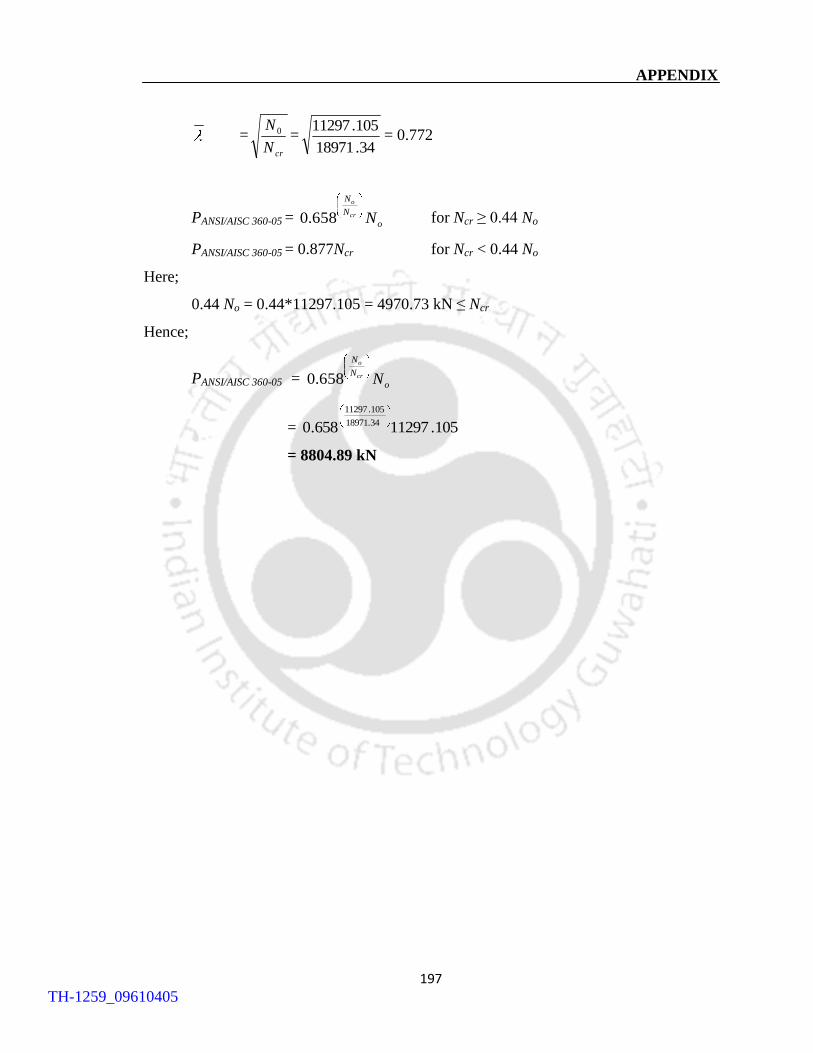
APPENDIX
197
=crN
N 0 =34.18971
105.11297= 0.772
PANSI/AISC 360-05 = o
N
N
Ncr
o
658.0 for Ncr ≥ 0.44 No
PANSI/AISC 360-05 = 0.877Ncr for Ncr < 0.44 No
Here;
0.44 No = 0.44*11297.105 = 4970.73 kN ≤ Ncr
Hence;
PANSI/AISC 360-05 = o
N
N
Ncr
o
658.0
= 105.11297658.0 18971.34
105.11297
= 8804.89 kN
TH-1259_09610405
198
LIST OF PUBLICATIONS
JOURNALS
Patton, M.L. & Singh, K.D., 2012. “Numerical modelling of lean duplex stainless steel
hollow columns of Square, L-, T-, and +-shaped cross sections under pure axial
compression”. Thin-walled structures; 53: 1-8.
Patton, M.L. & Singh, K.D., 2013. “Buckling of fixed-ended lean duplex stainless steel
hollow columns of Square, L-, T-, and +-shaped sections under pure axial compression - a
finite element study”. Thin-walled structures; 63: 106-116.
Patton, M.L. & Singh, K.D., 2012. “Finite element modelling of concrete-filled lean duplex
stainless steel tubular stub columns”. International journal of steel structures. (under
communication)
Patton, M.L. & Singh, K.D., 2012. “Effect of cross-sectional shape on the behaviour of
concrete-filled lean duplex slender stainless steel stub columns: FE study”. Engineering
structures. (manuscript prepared)
Patton, M.L. & Singh, K.D., 2012. “Buckling of fixed-ended concrete-filled lean duplex
slender stainless steel columns under axial compression”. Journal of structural engineering.
(manuscript prepared)
CONFERENCES
Patton, M.L. & Singh, K.D., 2012. “Lean duplex stainless steel hollow stub columns of
Square, L-, T-, and +-shaped cross sections under pure axial compression – a finite element
study.” 14th
International Symposium on Tubular Structures. London.
TH-1259_09610405
Copyright © 2022 FDOKUMEN