Fatigue damage analysis in a duplex stainless steel by digital image correlation technique
15
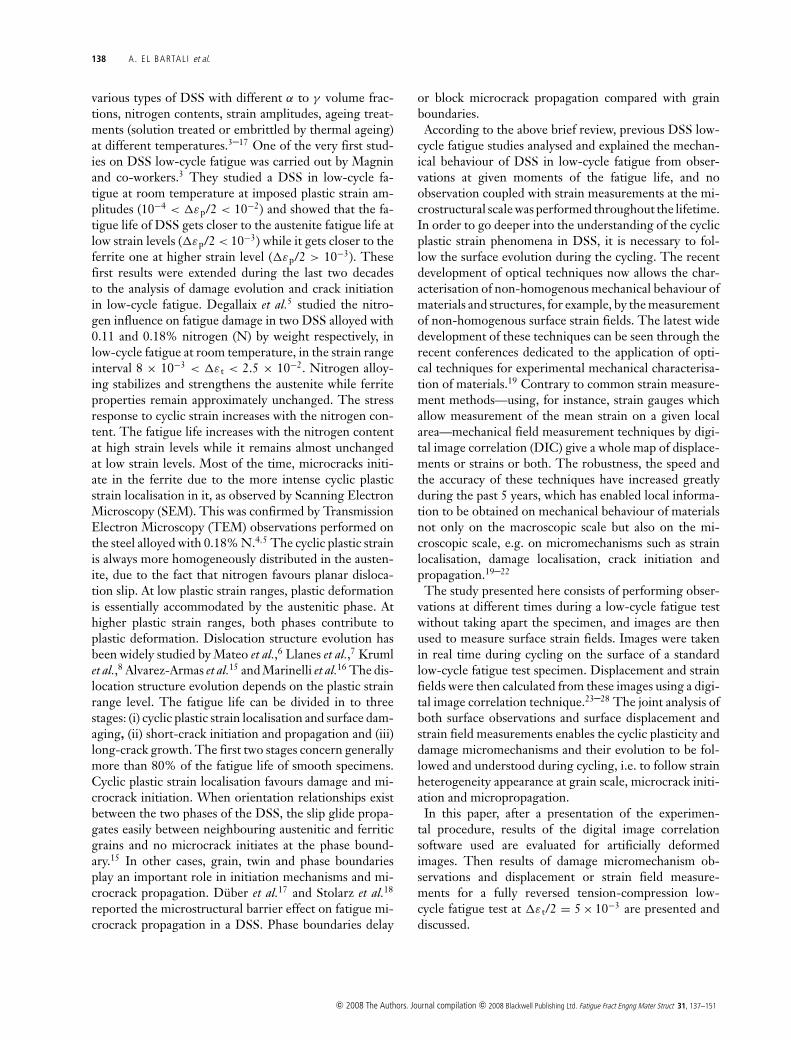
doi: 10.1111/j.1460-2695.2007.01207.x Fatigue damage analysis in a duplex stainless steel by digital image correlation technique A. EL BARTALI, V. AUBIN and S. DEGALLAIX Laboratoire de M´ ecanique de Lille (LML, UMR CNRS 8107) Ecole Centrale de Lille, BP 48, 59651 Villeneuve d’Ascq Cedex, France Received in final form 11 October 2007 ABSTRACT Strain field measurements by digital image correlation today offer new possibilities for analysing the mechanical behaviour of materials in situ during mechanical tests. The originality of the present study is to use this technique on the micro-structural scale, in order to understand and to obtain quantitative values of the fatigue surface damage in a two-phased alloy. In this paper, low-cycle fatigue damage micromechanisms in an austenitic-ferritic stainless steel are studied. Surface damage is observed in real time, with an in situ microscopic device, during a low-cycle fatigue test performed at room temperature. Surface displacement and strain fields are calculated using digital image correlation from images taken during cycling. A detailed analysis of optical images and strain fields measured enables us to follow precisely the evolution of surface strain fields and the damage micromechanisms. Firstly, strain heterogeneities are observed in austenitic grains. Initially, the austenitic phase accommodates the cyclic plastic strain and is then followed by the ferritic phase. Microcrack initiation takes place at the ferrite/ferrite grain boundaries. Microcracks propagate to the neighbouring austenitic grains following the slip markings. Displacement and strain gradients indicate probable microcrack initiation sites. Keywords damage; digital image correlation; duplex stainless steel; fatigue; strain het- erogeneity. INTRODUCTION Today, in structural design, increased requirements in terms of safety, cost and weight reduction involve using reduced safety coefficients, improving mechanical prop- erties of materials and establishing relevant constitutive laws. This involves knowing and understanding precisely the behaviour of materials in service on different scales. When the structure is loaded under multiaxial cyclic me- chanical loading, it is necessary to identify strain and dam- age physical mechanisms on the microstructural scale in order to define a relevant macroscopic constitutive law available in structured calculation software. Austenitic-ferritic stainless steels, also called duplex stainless steels (DSS), are two-phased alloys whose chem- ical composition and heat treatment are optimized to obtain quasi-balanced volume fractions of austenite (γ - phase, face cubic-centred crystallographic structure) and ferrite (α-phase, body-centred cubic crystallographic Correspondence: Ahmed El Bartali. E-mail: [email protected] structure). This two-phased structure, combined with a small grain size (≈10 μm), leads on the one hand to good mechanical properties, (high yield stress, ultimate tensile strength, hardening and ductility) which are further in- creased by nitrogen alloying, and on the other hand to a very good corrosion resistance. Nowadays, DSS are used in wide fields of industry, especially in the oil and gas, petrochemical, paper and nuclear industries. 1 Moreover, DSS mechanical properties, perhaps still more than that of other steels, depend on the microstructure that itself re- sults from chemical composition, elaboration process and heat treatment. This microstructure is characterized by the two-phased morphology, the phase volume fractions, the grain size, the grain orientation distribution, etc. In spite of the very good mechanical properties of DSS at room temperature, there is a detrimental effect of ageing at a temperature between 250 and 500 ◦ C, due to an em- brittlement phenomenon by spinodal decomposition of the ferrite. 2 In the past years, low-cycle fatigue behaviour and damage mechanisms were analysed in the literature in c 2008 The Authors. Journal compilation c 2008 Blackwell Publishing Ltd. Fatigue Fract Engng Mater Struct 31, 137–151 137 Fatigue & Fracture of Engineering Materials & Structures
Transcript of Fatigue damage analysis in a duplex stainless steel by digital image correlation technique
doi: 10.1111/j.1460-2695.2007.01207.x
Fatigue damage analysis in a duplex stainless steel by digital imagecorrelation technique
A. EL BARTALI , V. AUBIN and S. DEGALLAIXLaboratoire de Mecanique de Lille (LML, UMR CNRS 8107) Ecole Centrale de Lille, BP 48, 59651 Villeneuve d’Ascq Cedex, France
Received in final form 11 October 2007
A B S T R A C T Strain field measurements by digital image correlation today offer new possibilities foranalysing the mechanical behaviour of materials in situ during mechanical tests. Theoriginality of the present study is to use this technique on the micro-structural scale,in order to understand and to obtain quantitative values of the fatigue surface damagein a two-phased alloy. In this paper, low-cycle fatigue damage micromechanisms in anaustenitic-ferritic stainless steel are studied. Surface damage is observed in real time,with an in situ microscopic device, during a low-cycle fatigue test performed at roomtemperature. Surface displacement and strain fields are calculated using digital imagecorrelation from images taken during cycling. A detailed analysis of optical images andstrain fields measured enables us to follow precisely the evolution of surface strain fieldsand the damage micromechanisms. Firstly, strain heterogeneities are observed in austeniticgrains. Initially, the austenitic phase accommodates the cyclic plastic strain and is thenfollowed by the ferritic phase. Microcrack initiation takes place at the ferrite/ferrite grainboundaries. Microcracks propagate to the neighbouring austenitic grains following theslip markings. Displacement and strain gradients indicate probable microcrack initiationsites.
Keywords damage; digital image correlation; duplex stainless steel; fatigue; strain het-erogeneity.
I N T R O D U C T I O N
Today, in structural design, increased requirements interms of safety, cost and weight reduction involve usingreduced safety coefficients, improving mechanical prop-erties of materials and establishing relevant constitutivelaws. This involves knowing and understanding preciselythe behaviour of materials in service on different scales.When the structure is loaded under multiaxial cyclic me-chanical loading, it is necessary to identify strain and dam-age physical mechanisms on the microstructural scale inorder to define a relevant macroscopic constitutive lawavailable in structured calculation software.
Austenitic-ferritic stainless steels, also called duplexstainless steels (DSS), are two-phased alloys whose chem-ical composition and heat treatment are optimized toobtain quasi-balanced volume fractions of austenite (γ -phase, face cubic-centred crystallographic structure) andferrite (α-phase, body-centred cubic crystallographic
Correspondence: Ahmed El Bartali. E-mail: [email protected]
structure). This two-phased structure, combined with asmall grain size (≈10 μm), leads on the one hand to goodmechanical properties, (high yield stress, ultimate tensilestrength, hardening and ductility) which are further in-creased by nitrogen alloying, and on the other hand to avery good corrosion resistance. Nowadays, DSS are usedin wide fields of industry, especially in the oil and gas,petrochemical, paper and nuclear industries.1 Moreover,DSS mechanical properties, perhaps still more than thatof other steels, depend on the microstructure that itself re-sults from chemical composition, elaboration process andheat treatment. This microstructure is characterized bythe two-phased morphology, the phase volume fractions,the grain size, the grain orientation distribution, etc. Inspite of the very good mechanical properties of DSS atroom temperature, there is a detrimental effect of ageingat a temperature between 250 and 500 ◦C, due to an em-brittlement phenomenon by spinodal decomposition ofthe ferrite.2
In the past years, low-cycle fatigue behaviour anddamage mechanisms were analysed in the literature in
c© 2008 The Authors. Journal compilation c© 2008 Blackwell Publishing Ltd. Fatigue Fract Engng Mater Struct 31, 137–151 137
Fatigue & Fracture of Engineering Materials & Structures
138 A. EL BARTAL I et al.
various types of DSS with different α to γ volume frac-tions, nitrogen contents, strain amplitudes, ageing treat-ments (solution treated or embrittled by thermal ageing)at different temperatures.3–17 One of the very first stud-ies on DSS low-cycle fatigue was carried out by Magninand co-workers.3 They studied a DSS in low-cycle fa-tigue at room temperature at imposed plastic strain am-plitudes (10−4 < �εp/2 < 10−2) and showed that the fa-tigue life of DSS gets closer to the austenite fatigue life atlow strain levels (�εp/2 < 10−3) while it gets closer to theferrite one at higher strain level (�εp/2 > 10−3). Thesefirst results were extended during the last two decadesto the analysis of damage evolution and crack initiationin low-cycle fatigue. Degallaix et al.5 studied the nitro-gen influence on fatigue damage in two DSS alloyed with0.11 and 0.18% nitrogen (N) by weight respectively, inlow-cycle fatigue at room temperature, in the strain rangeinterval 8 × 10⁻³ < �ε t < 2.5 × 10⁻². Nitrogen alloy-ing stabilizes and strengthens the austenite while ferriteproperties remain approximately unchanged. The stressresponse to cyclic strain increases with the nitrogen con-tent. The fatigue life increases with the nitrogen contentat high strain levels while it remains almost unchangedat low strain levels. Most of the time, microcracks initi-ate in the ferrite due to the more intense cyclic plasticstrain localisation in it, as observed by Scanning ElectronMicroscopy (SEM). This was confirmed by TransmissionElectron Microscopy (TEM) observations performed onthe steel alloyed with 0.18% N.4,5 The cyclic plastic strainis always more homogeneously distributed in the austen-ite, due to the fact that nitrogen favours planar disloca-tion slip. At low plastic strain ranges, plastic deformationis essentially accommodated by the austenitic phase. Athigher plastic strain ranges, both phases contribute toplastic deformation. Dislocation structure evolution hasbeen widely studied by Mateo et al.,6 Llanes et al.,7 Krumlet al.,8 Alvarez-Armas et al.15 and Marinelli et al.16 The dis-location structure evolution depends on the plastic strainrange level. The fatigue life can be divided in to threestages: (i) cyclic plastic strain localisation and surface dam-aging, (ii) short-crack initiation and propagation and (iii)long-crack growth. The first two stages concern generallymore than 80% of the fatigue life of smooth specimens.Cyclic plastic strain localisation favours damage and mi-crocrack initiation. When orientation relationships existbetween the two phases of the DSS, the slip glide propa-gates easily between neighbouring austenitic and ferriticgrains and no microcrack initiates at the phase bound-ary.15 In other cases, grain, twin and phase boundariesplay an important role in initiation mechanisms and mi-crocrack propagation. Duber et al.17 and Stolarz et al.18
reported the microstructural barrier effect on fatigue mi-crocrack propagation in a DSS. Phase boundaries delay
or block microcrack propagation compared with grainboundaries.
According to the above brief review, previous DSS low-cycle fatigue studies analysed and explained the mechan-ical behaviour of DSS in low-cycle fatigue from obser-vations at given moments of the fatigue life, and noobservation coupled with strain measurements at the mi-crostructural scale was performed throughout the lifetime.In order to go deeper into the understanding of the cyclicplastic strain phenomena in DSS, it is necessary to fol-low the surface evolution during the cycling. The recentdevelopment of optical techniques now allows the char-acterisation of non-homogenous mechanical behaviour ofmaterials and structures, for example, by the measurementof non-homogenous surface strain fields. The latest widedevelopment of these techniques can be seen through therecent conferences dedicated to the application of opti-cal techniques for experimental mechanical characterisa-tion of materials.19 Contrary to common strain measure-ment methods—using, for instance, strain gauges whichallow measurement of the mean strain on a given localarea—mechanical field measurement techniques by digi-tal image correlation (DIC) give a whole map of displace-ments or strains or both. The robustness, the speed andthe accuracy of these techniques have increased greatlyduring the past 5 years, which has enabled local informa-tion to be obtained on mechanical behaviour of materialsnot only on the macroscopic scale but also on the mi-croscopic scale, e.g. on micromechanisms such as strainlocalisation, damage localisation, crack initiation andpropagation.19–22
The study presented here consists of performing obser-vations at different times during a low-cycle fatigue testwithout taking apart the specimen, and images are thenused to measure surface strain fields. Images were takenin real time during cycling on the surface of a standardlow-cycle fatigue test specimen. Displacement and strainfields were then calculated from these images using a digi-tal image correlation technique.23–28 The joint analysis ofboth surface observations and surface displacement andstrain field measurements enables the cyclic plasticity anddamage micromechanisms and their evolution to be fol-lowed and understood during cycling, i.e. to follow strainheterogeneity appearance at grain scale, microcrack initi-ation and micropropagation.
In this paper, after a presentation of the experimen-tal procedure, results of the digital image correlationsoftware used are evaluated for artificially deformedimages. Then results of damage micromechanism ob-servations and displacement or strain field measure-ments for a fully reversed tension-compression low-cycle fatigue test at �ε t/2 = 5 × 10⁻³ are presented anddiscussed.
c© 2008 The Authors. Journal compilation c© 2008 Blackwell Publishing Ltd. Fatigue Fract Engng Mater Struct 31, 137–151
FAT IGUE DAMAGE ANALYSIS IN A DUPLEX STAINLESS STEEL 139
E X P E R I M E N TA L P R O C E D U R E
Material
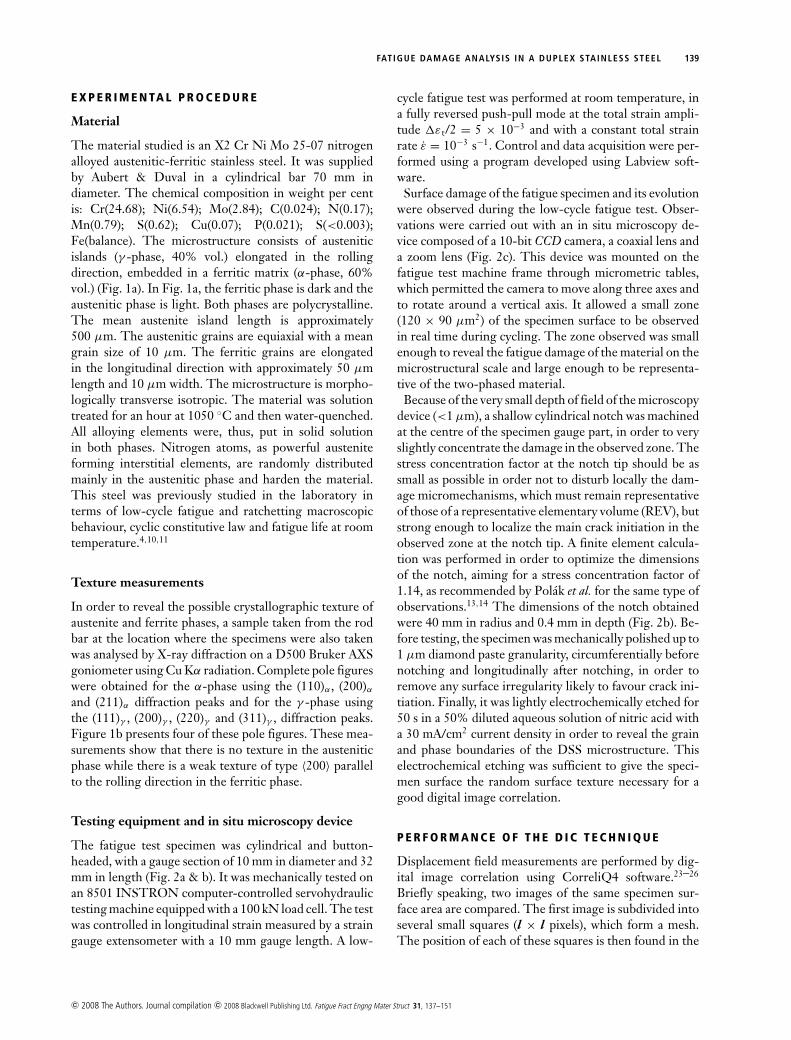
The material studied is an X2 Cr Ni Mo 25-07 nitrogenalloyed austenitic-ferritic stainless steel. It was suppliedby Aubert & Duval in a cylindrical bar 70 mm indiameter. The chemical composition in weight per centis: Cr(24.68); Ni(6.54); Mo(2.84); C(0.024); N(0.17);Mn(0.79); S(0.62); Cu(0.07); P(0.021); S(<0.003);Fe(balance). The microstructure consists of austeniticislands (γ -phase, 40% vol.) elongated in the rollingdirection, embedded in a ferritic matrix (α-phase, 60%vol.) (Fig. 1a). In Fig. 1a, the ferritic phase is dark and theaustenitic phase is light. Both phases are polycrystalline.The mean austenite island length is approximately500 μm. The austenitic grains are equiaxial with a meangrain size of 10 μm. The ferritic grains are elongatedin the longitudinal direction with approximately 50 μmlength and 10 μm width. The microstructure is morpho-logically transverse isotropic. The material was solutiontreated for an hour at 1050 ◦C and then water-quenched.All alloying elements were, thus, put in solid solutionin both phases. Nitrogen atoms, as powerful austeniteforming interstitial elements, are randomly distributedmainly in the austenitic phase and harden the material.This steel was previously studied in the laboratory interms of low-cycle fatigue and ratchetting macroscopicbehaviour, cyclic constitutive law and fatigue life at roomtemperature.4,10,11
Texture measurements
In order to reveal the possible crystallographic texture ofaustenite and ferrite phases, a sample taken from the rodbar at the location where the specimens were also takenwas analysed by X-ray diffraction on a D500 Bruker AXSgoniometer using Cu Kα radiation. Complete pole figureswere obtained for the α-phase using the (110)α , (200)α
and (211)α diffraction peaks and for the γ -phase usingthe (111)γ , (200)γ , (220)γ and (311)γ , diffraction peaks.Figure 1b presents four of these pole figures. These mea-surements show that there is no texture in the austeniticphase while there is a weak texture of type 〈200〉 parallelto the rolling direction in the ferritic phase.
Testing equipment and in situ microscopy device
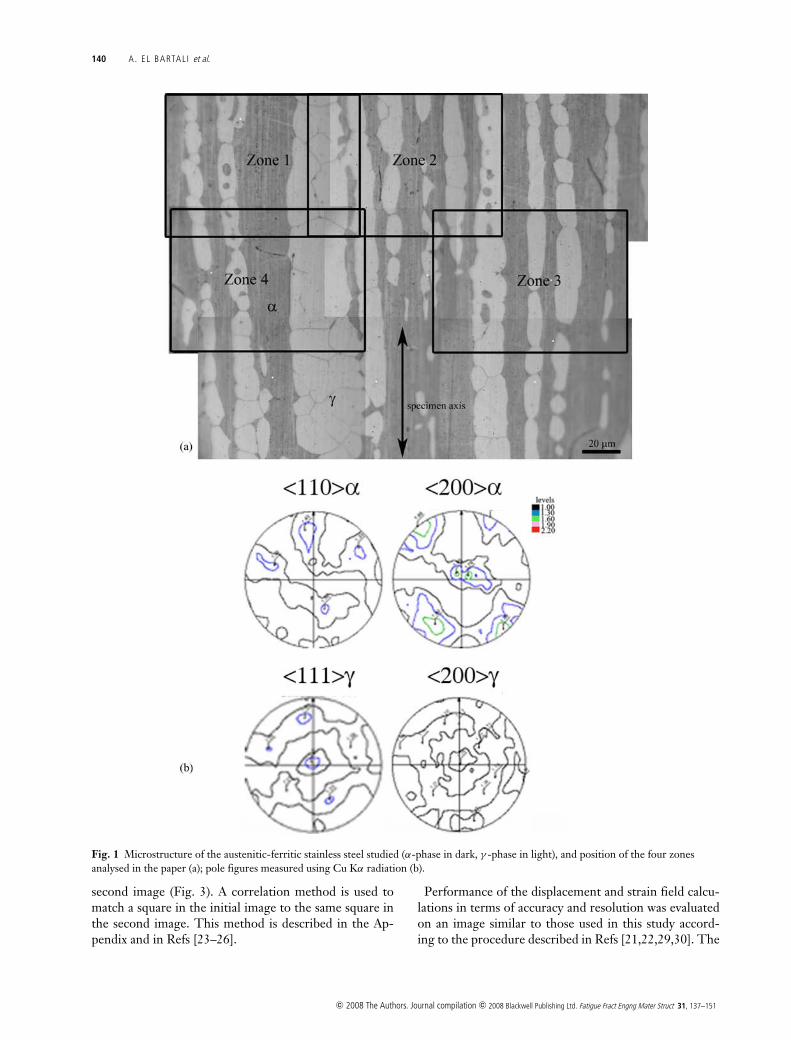
The fatigue test specimen was cylindrical and button-headed, with a gauge section of 10 mm in diameter and 32mm in length (Fig. 2a & b). It was mechanically tested onan 8501 INSTRON computer-controlled servohydraulictesting machine equipped with a 100 kN load cell. The testwas controlled in longitudinal strain measured by a straingauge extensometer with a 10 mm gauge length. A low-
cycle fatigue test was performed at room temperature, ina fully reversed push-pull mode at the total strain ampli-tude �ε t/2 = 5 × 10⁻³ and with a constant total strainrate ε = 10−3 s−1. Control and data acquisition were per-formed using a program developed using Labview soft-ware.
Surface damage of the fatigue specimen and its evolutionwere observed during the low-cycle fatigue test. Obser-vations were carried out with an in situ microscopy de-vice composed of a 10-bit CCD camera, a coaxial lens anda zoom lens (Fig. 2c). This device was mounted on thefatigue test machine frame through micrometric tables,which permitted the camera to move along three axes andto rotate around a vertical axis. It allowed a small zone(120 × 90 μm2) of the specimen surface to be observedin real time during cycling. The zone observed was smallenough to reveal the fatigue damage of the material on themicrostructural scale and large enough to be representa-tive of the two-phased material.
Because of the very small depth of field of the microscopydevice (<1 μm), a shallow cylindrical notch was machinedat the centre of the specimen gauge part, in order to veryslightly concentrate the damage in the observed zone. Thestress concentration factor at the notch tip should be assmall as possible in order not to disturb locally the dam-age micromechanisms, which must remain representativeof those of a representative elementary volume (REV), butstrong enough to localize the main crack initiation in theobserved zone at the notch tip. A finite element calcula-tion was performed in order to optimize the dimensionsof the notch, aiming for a stress concentration factor of1.14, as recommended by Polak et al. for the same type ofobservations.13,14 The dimensions of the notch obtainedwere 40 mm in radius and 0.4 mm in depth (Fig. 2b). Be-fore testing, the specimen was mechanically polished up to1 μm diamond paste granularity, circumferentially beforenotching and longitudinally after notching, in order toremove any surface irregularity likely to favour crack ini-tiation. Finally, it was lightly electrochemically etched for50 s in a 50% diluted aqueous solution of nitric acid witha 30 mA/cm2 current density in order to reveal the grainand phase boundaries of the DSS microstructure. Thiselectrochemical etching was sufficient to give the speci-men surface the random surface texture necessary for agood digital image correlation.
P E R F O R M A N C E O F T H E D I C T E C H N I Q U E
Displacement field measurements are performed by dig-ital image correlation using CorreliQ4 software.23–26
Briefly speaking, two images of the same specimen sur-face area are compared. The first image is subdivided intoseveral small squares (l × l pixels), which form a mesh.The position of each of these squares is then found in the
c© 2008 The Authors. Journal compilation c© 2008 Blackwell Publishing Ltd. Fatigue Fract Engng Mater Struct 31, 137–151
140 A. EL BARTAL I et al.
Fig. 1 Microstructure of the austenitic-ferritic stainless steel studied (α-phase in dark, γ -phase in light), and position of the four zonesanalysed in the paper (a); pole figures measured using Cu Kα radiation (b).
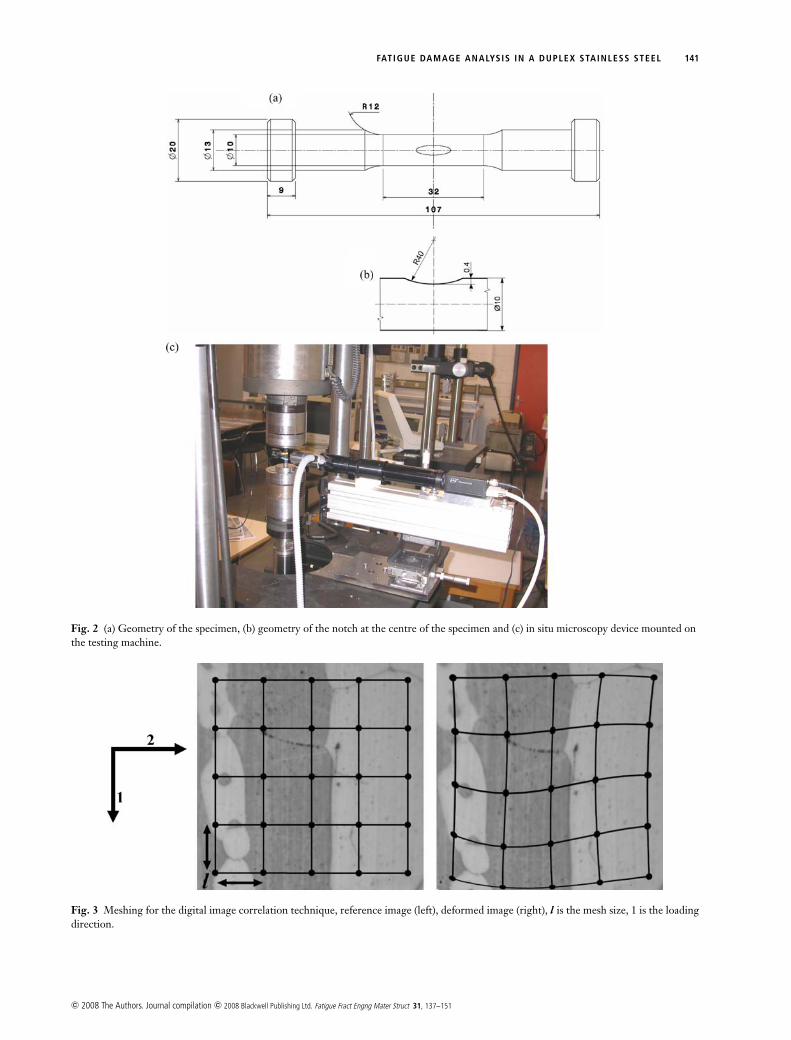
second image (Fig. 3). A correlation method is used tomatch a square in the initial image to the same square inthe second image. This method is described in the Ap-pendix and in Refs [23–26].
Performance of the displacement and strain field calcu-lations in terms of accuracy and resolution was evaluatedon an image similar to those used in this study accord-ing to the procedure described in Refs [21,22,29,30]. The
c© 2008 The Authors. Journal compilation c© 2008 Blackwell Publishing Ltd. Fatigue Fract Engng Mater Struct 31, 137–151
FAT IGUE DAMAGE ANALYSIS IN A DUPLEX STAINLESS STEEL 141
Fig. 2 (a) Geometry of the specimen, (b) geometry of the notch at the centre of the specimen and (c) in situ microscopy device mounted onthe testing machine.
Fig. 3 Meshing for the digital image correlation technique, reference image (left), deformed image (right), l is the mesh size, 1 is the loadingdirection.
c© 2008 The Authors. Journal compilation c© 2008 Blackwell Publishing Ltd. Fatigue Fract Engng Mater Struct 31, 137–151
142 A. EL BARTAL I et al.
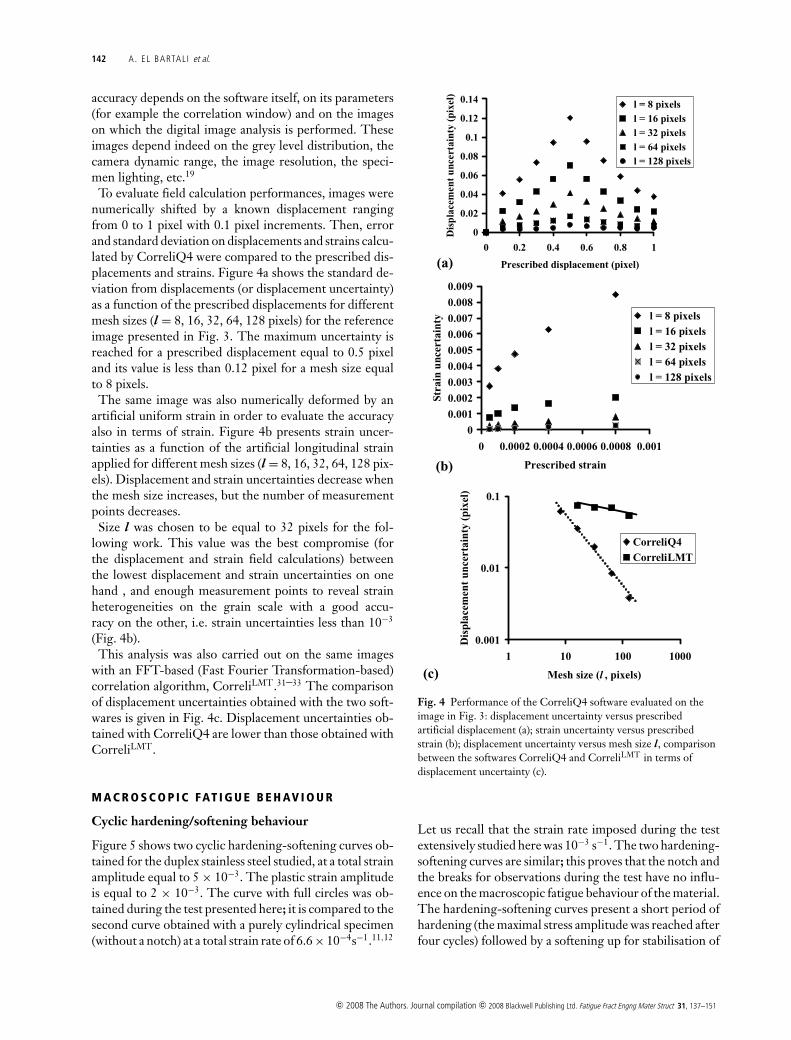
accuracy depends on the software itself, on its parameters(for example the correlation window) and on the imageson which the digital image analysis is performed. Theseimages depend indeed on the grey level distribution, thecamera dynamic range, the image resolution, the speci-men lighting, etc.19
To evaluate field calculation performances, images werenumerically shifted by a known displacement rangingfrom 0 to 1 pixel with 0.1 pixel increments. Then, errorand standard deviation on displacements and strains calcu-lated by CorreliQ4 were compared to the prescribed dis-placements and strains. Figure 4a shows the standard de-viation from displacements (or displacement uncertainty)as a function of the prescribed displacements for differentmesh sizes (l = 8, 16, 32, 64, 128 pixels) for the referenceimage presented in Fig. 3. The maximum uncertainty isreached for a prescribed displacement equal to 0.5 pixeland its value is less than 0.12 pixel for a mesh size equalto 8 pixels.
The same image was also numerically deformed by anartificial uniform strain in order to evaluate the accuracyalso in terms of strain. Figure 4b presents strain uncer-tainties as a function of the artificial longitudinal strainapplied for different mesh sizes (l = 8, 16, 32, 64, 128 pix-els). Displacement and strain uncertainties decrease whenthe mesh size increases, but the number of measurementpoints decreases.
Size l was chosen to be equal to 32 pixels for the fol-lowing work. This value was the best compromise (forthe displacement and strain field calculations) betweenthe lowest displacement and strain uncertainties on onehand , and enough measurement points to reveal strainheterogeneities on the grain scale with a good accu-racy on the other, i.e. strain uncertainties less than 10−3
(Fig. 4b).This analysis was also carried out on the same images
with an FFT-based (Fast Fourier Transformation-based)correlation algorithm, CorreliLMT.31–33 The comparisonof displacement uncertainties obtained with the two soft-wares is given in Fig. 4c. Displacement uncertainties ob-tained with CorreliQ4 are lower than those obtained withCorreliLMT.
M A C R O S C O P I C FAT I G U E B E H AV I O U R
Cyclic hardening/softening behaviour
Figure 5 shows two cyclic hardening-softening curves ob-tained for the duplex stainless steel studied, at a total strainamplitude equal to 5 × 10⁻³. The plastic strain amplitudeis equal to 2 × 10⁻³. The curve with full circles was ob-tained during the test presented here; it is compared to thesecond curve obtained with a purely cylindrical specimen(without a notch) at a total strain rate of 6.6 × 10⁻⁴s−1.11,12
0
0.02
0.04
0.06
0.08
0.1
0.12
0.14
0 0.2 0.4 0.6 0.8 1
Prescribed displacement (pixel)
Dis
pla
cem
ent
unc
erta
inty
(pi
xel)
l = 8 pixels l = 16 pixels l = 32 pixels l = 64 pixels l = 128 pixels
(a)
0
0.001
0.002
0.003
0.004
0.005
0.006
0.007
0.008
0.009
0 0.0002 0.0004 0.0006 0.0008 0.001
Prescribed strain
Stra
in u
ncer
tain
ty l = 8 pixels l = 16 pixels l = 32 pixels l = 64 pixels l = 128 pixels
(b)
0.001
0.01
0.1
1 10 100 1000
Mesh size (l , pixels)
Dis
plac
emen
t un
cert
aint
y (p
ixel
)
CorreliQ4CorreliLMT
(c)
Fig. 4 Performance of the CorreliQ4 software evaluated on theimage in Fig. 3: displacement uncertainty versus prescribedartificial displacement (a); strain uncertainty versus prescribedstrain (b); displacement uncertainty versus mesh size l, comparisonbetween the softwares CorreliQ4 and CorreliLMT in terms ofdisplacement uncertainty (c).
Let us recall that the strain rate imposed during the testextensively studied here was 10−3 s−1. The two hardening-softening curves are similar; this proves that the notch andthe breaks for observations during the test have no influ-ence on the macroscopic fatigue behaviour of the material.The hardening-softening curves present a short period ofhardening (the maximal stress amplitude was reached afterfour cycles) followed by a softening up for stabilisation of
c© 2008 The Authors. Journal compilation c© 2008 Blackwell Publishing Ltd. Fatigue Fract Engng Mater Struct 31, 137–151
FAT IGUE DAMAGE ANALYSIS IN A DUPLEX STAINLESS STEEL 143
0
100
200
300
400
500
600
700
1 10 100 1000 10000 100000
Number of cycles
Str
ess
amp
litu
de
(MP
a)
with notchwithout notch
Fig. 5 Cyclic hardening-softening curves of the duplex stainlesssteel during fatigue tests performed at �ε t/2 = 0.5 10−2 andRε = −1, on unnotched and notched specimens.
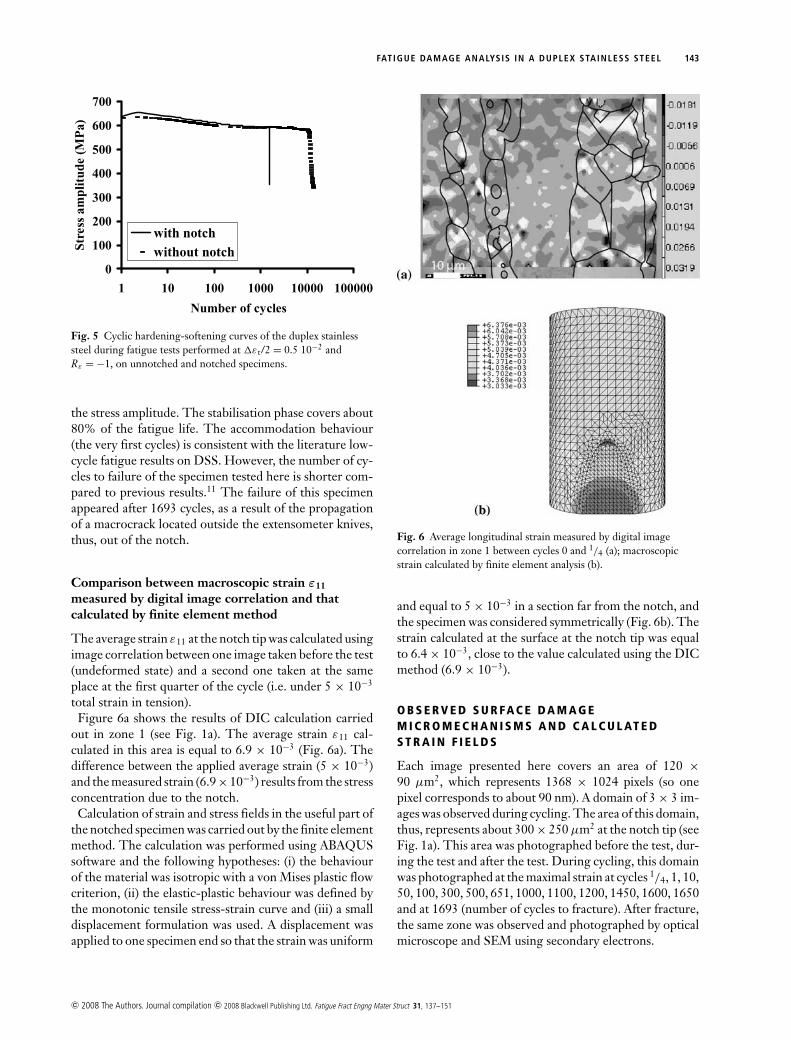
the stress amplitude. The stabilisation phase covers about80% of the fatigue life. The accommodation behaviour(the very first cycles) is consistent with the literature low-cycle fatigue results on DSS. However, the number of cy-cles to failure of the specimen tested here is shorter com-pared to previous results.11 The failure of this specimenappeared after 1693 cycles, as a result of the propagationof a macrocrack located outside the extensometer knives,thus, out of the notch.
Comparison between macroscopic strain ε11
measured by digital image correlation and thatcalculated by finite element method
The average strain ε11 at the notch tip was calculated usingimage correlation between one image taken before the test(undeformed state) and a second one taken at the sameplace at the first quarter of the cycle (i.e. under 5 × 10⁻³
total strain in tension).Figure 6a shows the results of DIC calculation carried
out in zone 1 (see Fig. 1a). The average strain ε11 cal-culated in this area is equal to 6.9 × 10⁻³ (Fig. 6a). Thedifference between the applied average strain (5 × 10⁻³)and the measured strain (6.9 × 10⁻³) results from the stressconcentration due to the notch.
Calculation of strain and stress fields in the useful part ofthe notched specimen was carried out by the finite elementmethod. The calculation was performed using ABAQUSsoftware and the following hypotheses: (i) the behaviourof the material was isotropic with a von Mises plastic flowcriterion, (ii) the elastic-plastic behaviour was defined bythe monotonic tensile stress-strain curve and (iii) a smalldisplacement formulation was used. A displacement wasapplied to one specimen end so that the strain was uniform
Fig. 6 Average longitudinal strain measured by digital imagecorrelation in zone 1 between cycles 0 and 1/4 (a); macroscopicstrain calculated by finite element analysis (b).
and equal to 5 × 10⁻³ in a section far from the notch, andthe specimen was considered symmetrically (Fig. 6b). Thestrain calculated at the surface at the notch tip was equalto 6.4 × 10⁻³, close to the value calculated using the DICmethod (6.9 × 10⁻³).
O B S E R V E D S U R FA C E D A M A G EM I C R O M E C H A N I S M S A N D C A L C U L AT E DS T R A I N F I E L D S
Each image presented here covers an area of 120 ×90 μm2, which represents 1368 × 1024 pixels (so onepixel corresponds to about 90 nm). A domain of 3 × 3 im-ages was observed during cycling. The area of this domain,thus, represents about 300 × 250 μm2 at the notch tip (seeFig. 1a). This area was photographed before the test, dur-ing the test and after the test. During cycling, this domainwas photographed at the maximal strain at cycles 1/4, 1, 10,50, 100, 300, 500, 651, 1000, 1100, 1200, 1450, 1600, 1650and at 1693 (number of cycles to fracture). After fracture,the same zone was observed and photographed by opticalmicroscope and SEM using secondary electrons.
c© 2008 The Authors. Journal compilation c© 2008 Blackwell Publishing Ltd. Fatigue Fract Engng Mater Struct 31, 137–151
144 A. EL BARTAL I et al.
In order to analyse the displacement and strain mapsat the microstructural scale, the phase and grain bound-aries are superimposed on the maps. The full lines corre-spond to the grain boundaries clearly identified and thedashed ones correspond to twin or grain boundaries as-sumed. Displacements are given in pixels and strains infull scale. The loading axis is Axis 1 and corresponds tothe vertical axis on the figures (Fig. 3). Only ε11 strainfields are presented here.
During cycling, the image texture changes slightly, es-pecially due to the emergence of slip markings. How-ever, for a good correlation, it is necessary to keep thesame grey level distribution as long as possible and a tex-ture as close as possible to the initial one. So, the refer-ence image for the displacement and strain calculationsis then updated for each calculation. So, only the dis-placement and strain fields calculated between the im-age taken before cycling (without any deformation) andat the first quarter of cycle (i.e. under 0.5% total strainin monotonous tension) are true displacements and truestrains, respectively. After this first step, the displacementsand strains are calculated between two deformed statescorresponding to two successive breaks and are, thus, ad-ditional displacements and strains. The actual displace-ments or strains at a given break must, thus, be calculatedby adding all displacements or strains until the currentbreak.
Damage evolution
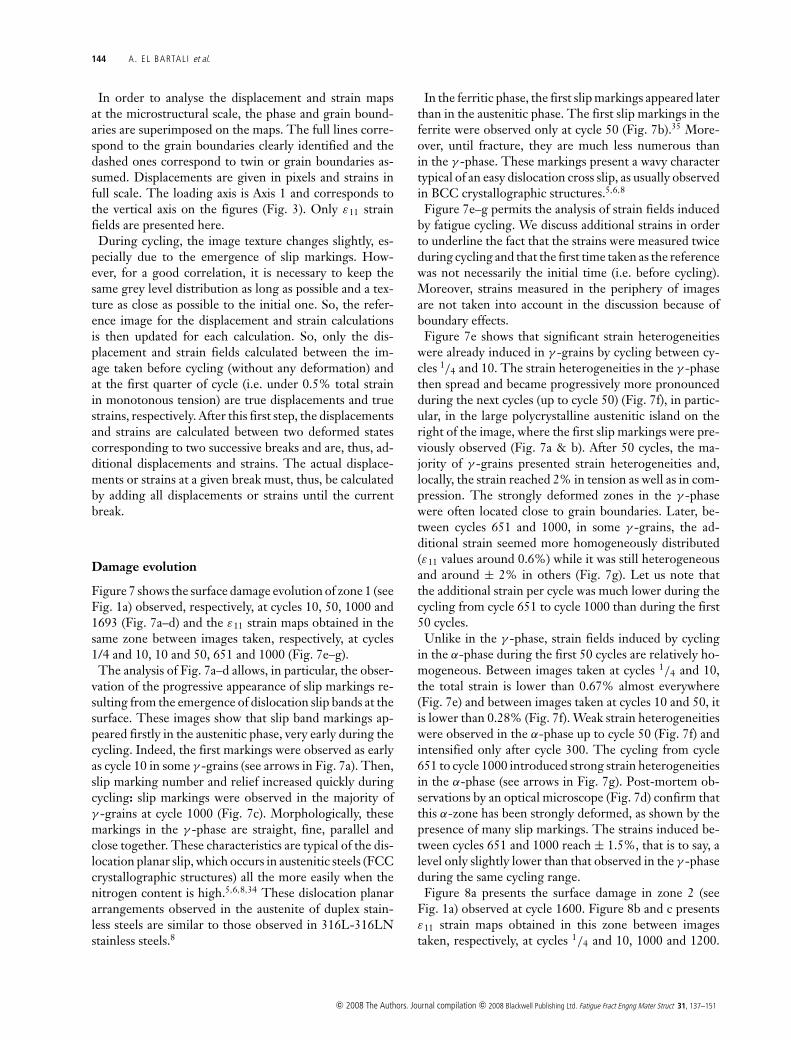
Figure 7 shows the surface damage evolution of zone 1 (seeFig. 1a) observed, respectively, at cycles 10, 50, 1000 and1693 (Fig. 7a–d) and the ε11 strain maps obtained in thesame zone between images taken, respectively, at cycles1/4 and 10, 10 and 50, 651 and 1000 (Fig. 7e–g).
The analysis of Fig. 7a–d allows, in particular, the obser-vation of the progressive appearance of slip markings re-sulting from the emergence of dislocation slip bands at thesurface. These images show that slip band markings ap-peared firstly in the austenitic phase, very early during thecycling. Indeed, the first markings were observed as earlyas cycle 10 in some γ -grains (see arrows in Fig. 7a). Then,slip marking number and relief increased quickly duringcycling: slip markings were observed in the majority ofγ -grains at cycle 1000 (Fig. 7c). Morphologically, thesemarkings in the γ -phase are straight, fine, parallel andclose together. These characteristics are typical of the dis-location planar slip, which occurs in austenitic steels (FCCcrystallographic structures) all the more easily when thenitrogen content is high.5,6,8,34 These dislocation planararrangements observed in the austenite of duplex stain-less steels are similar to those observed in 316L-316LNstainless steels.8
In the ferritic phase, the first slip markings appeared laterthan in the austenitic phase. The first slip markings in theferrite were observed only at cycle 50 (Fig. 7b).35 More-over, until fracture, they are much less numerous thanin the γ -phase. These markings present a wavy charactertypical of an easy dislocation cross slip, as usually observedin BCC crystallographic structures.5,6,8
Figure 7e–g permits the analysis of strain fields inducedby fatigue cycling. We discuss additional strains in orderto underline the fact that the strains were measured twiceduring cycling and that the first time taken as the referencewas not necessarily the initial time (i.e. before cycling).Moreover, strains measured in the periphery of imagesare not taken into account in the discussion because ofboundary effects.
Figure 7e shows that significant strain heterogeneitieswere already induced in γ -grains by cycling between cy-cles 1/4 and 10. The strain heterogeneities in the γ -phasethen spread and became progressively more pronouncedduring the next cycles (up to cycle 50) (Fig. 7f), in partic-ular, in the large polycrystalline austenitic island on theright of the image, where the first slip markings were pre-viously observed (Fig. 7a & b). After 50 cycles, the ma-jority of γ -grains presented strain heterogeneities and,locally, the strain reached 2% in tension as well as in com-pression. The strongly deformed zones in the γ -phasewere often located close to grain boundaries. Later, be-tween cycles 651 and 1000, in some γ -grains, the ad-ditional strain seemed more homogeneously distributed(ε11 values around 0.6%) while it was still heterogeneousand around ± 2% in others (Fig. 7g). Let us note thatthe additional strain per cycle was much lower during thecycling from cycle 651 to cycle 1000 than during the first50 cycles.
Unlike in the γ -phase, strain fields induced by cyclingin the α-phase during the first 50 cycles are relatively ho-mogeneous. Between images taken at cycles 1/4 and 10,the total strain is lower than 0.67% almost everywhere(Fig. 7e) and between images taken at cycles 10 and 50, itis lower than 0.28% (Fig. 7f). Weak strain heterogeneitieswere observed in the α-phase up to cycle 50 (Fig. 7f) andintensified only after cycle 300. The cycling from cycle651 to cycle 1000 introduced strong strain heterogeneitiesin the α-phase (see arrows in Fig. 7g). Post-mortem ob-servations by an optical microscope (Fig. 7d) confirm thatthis α-zone has been strongly deformed, as shown by thepresence of many slip markings. The strains induced be-tween cycles 651 and 1000 reach ± 1.5%, that is to say, alevel only slightly lower than that observed in the γ -phaseduring the same cycling range.
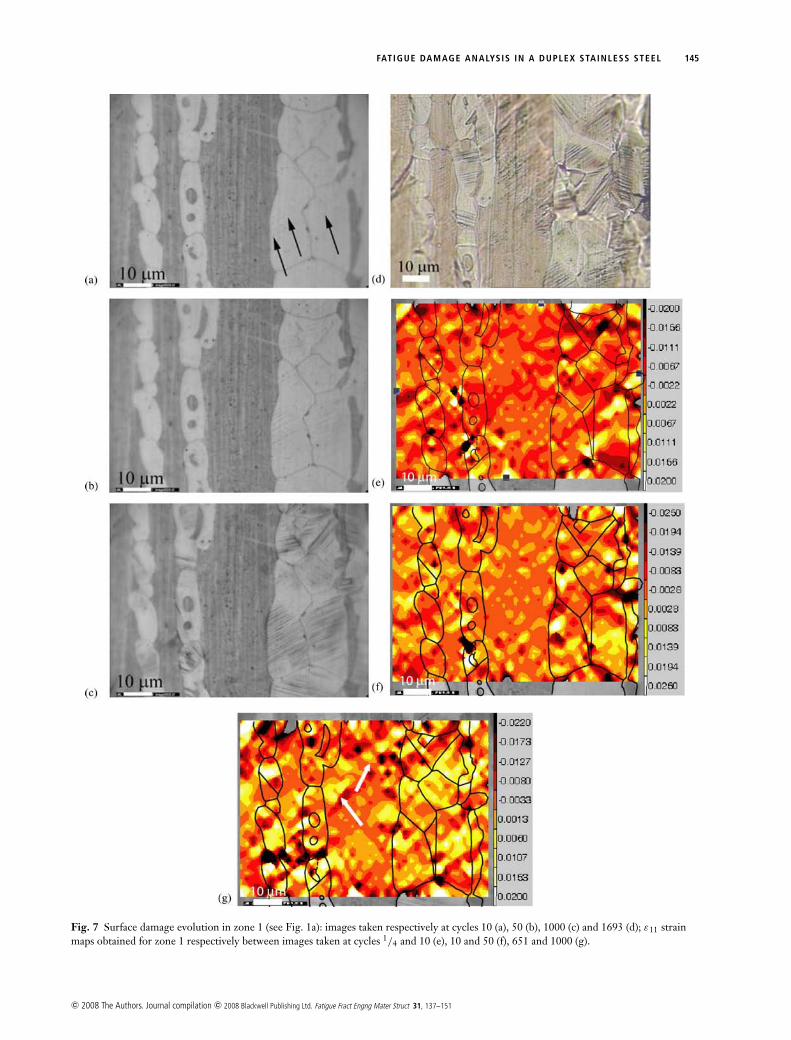
Figure 8a presents the surface damage in zone 2 (seeFig. 1a) observed at cycle 1600. Figure 8b and c presentsε11 strain maps obtained in this zone between imagestaken, respectively, at cycles 1/4 and 10, 1000 and 1200.
c© 2008 The Authors. Journal compilation c© 2008 Blackwell Publishing Ltd. Fatigue Fract Engng Mater Struct 31, 137–151
FAT IGUE DAMAGE ANALYSIS IN A DUPLEX STAINLESS STEEL 145
Fig. 7 Surface damage evolution in zone 1 (see Fig. 1a): images taken respectively at cycles 10 (a), 50 (b), 1000 (c) and 1693 (d); ε11 strainmaps obtained for zone 1 respectively between images taken at cycles 1/4 and 10 (e), 10 and 50 (f), 651 and 1000 (g).
c© 2008 The Authors. Journal compilation c© 2008 Blackwell Publishing Ltd. Fatigue Fract Engng Mater Struct 31, 137–151
146 A. EL BARTAL I et al.
Fig. 8 Surface damage evolution in zone 2 (see Fig. 1a): imagestaken at cycle 1600 (a), ε11 strain maps obtained for zone 2respectively between images taken at cycles 1/4 and 10 (b), 1000and 1200 (c).
In Fig. 8a, intense rectilinear slip markings in the γ -phaseand wavy slip markings in the α-phase are still observed.Annealing twins, highlighted by the orientation changesof the slip markings, are also observed inside austeniticgrains. Moreover, some slip markings propagate from aγ -grain to an α-grain in a rectilinear way at the surface(see arrows in Fig. 8a). This characteristic can probablybe connected to the existence of a crystallographic orien-tation relationships between ferritic and austenitic grains.In this zone, no strain localization is observed in the strainmaps (Fig. 8b & c).
Microcrack initiation and propagation
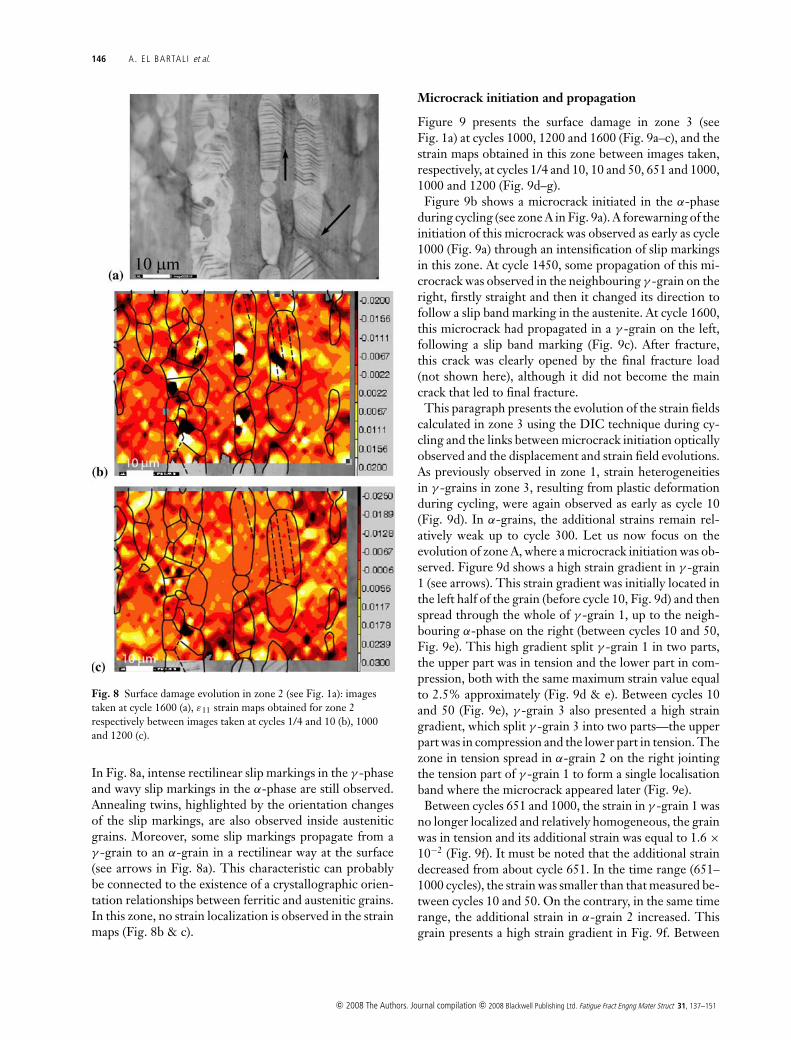
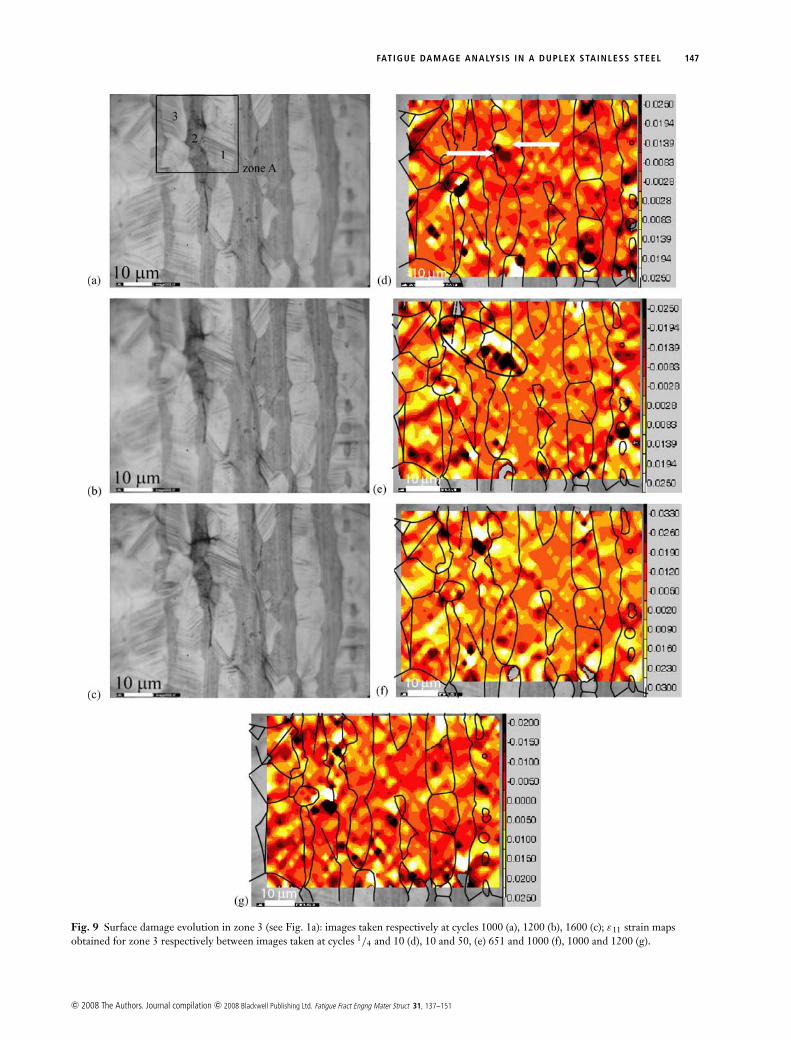
Figure 9 presents the surface damage in zone 3 (seeFig. 1a) at cycles 1000, 1200 and 1600 (Fig. 9a–c), and thestrain maps obtained in this zone between images taken,respectively, at cycles 1/4 and 10, 10 and 50, 651 and 1000,1000 and 1200 (Fig. 9d–g).
Figure 9b shows a microcrack initiated in the α-phaseduring cycling (see zone A in Fig. 9a). A forewarning of theinitiation of this microcrack was observed as early as cycle1000 (Fig. 9a) through an intensification of slip markingsin this zone. At cycle 1450, some propagation of this mi-crocrack was observed in the neighbouring γ -grain on theright, firstly straight and then it changed its direction tofollow a slip band marking in the austenite. At cycle 1600,this microcrack had propagated in a γ -grain on the left,following a slip band marking (Fig. 9c). After fracture,this crack was clearly opened by the final fracture load(not shown here), although it did not become the maincrack that led to final fracture.
This paragraph presents the evolution of the strain fieldscalculated in zone 3 using the DIC technique during cy-cling and the links between microcrack initiation opticallyobserved and the displacement and strain field evolutions.As previously observed in zone 1, strain heterogeneitiesin γ -grains in zone 3, resulting from plastic deformationduring cycling, were again observed as early as cycle 10(Fig. 9d). In α-grains, the additional strains remain rel-atively weak up to cycle 300. Let us now focus on theevolution of zone A, where a microcrack initiation was ob-served. Figure 9d shows a high strain gradient in γ -grain1 (see arrows). This strain gradient was initially located inthe left half of the grain (before cycle 10, Fig. 9d) and thenspread through the whole of γ -grain 1, up to the neigh-bouring α-phase on the right (between cycles 10 and 50,Fig. 9e). This high gradient split γ -grain 1 in two parts,the upper part was in tension and the lower part in com-pression, both with the same maximum strain value equalto 2.5% approximately (Fig. 9d & e). Between cycles 10and 50 (Fig. 9e), γ -grain 3 also presented a high straingradient, which split γ -grain 3 into two parts—the upperpart was in compression and the lower part in tension. Thezone in tension spread in α-grain 2 on the right jointingthe tension part of γ -grain 1 to form a single localisationband where the microcrack appeared later (Fig. 9e).
Between cycles 651 and 1000, the strain in γ -grain 1 wasno longer localized and relatively homogeneous, the grainwas in tension and its additional strain was equal to 1.6 ×10⁻² (Fig. 9f). It must be noted that the additional straindecreased from about cycle 651. In the time range (651–1000 cycles), the strain was smaller than that measured be-tween cycles 10 and 50. On the contrary, in the same timerange, the additional strain in α-grain 2 increased. Thisgrain presents a high strain gradient in Fig. 9f. Between
c© 2008 The Authors. Journal compilation c© 2008 Blackwell Publishing Ltd. Fatigue Fract Engng Mater Struct 31, 137–151
FAT IGUE DAMAGE ANALYSIS IN A DUPLEX STAINLESS STEEL 147
Fig. 9 Surface damage evolution in zone 3 (see Fig. 1a): images taken respectively at cycles 1000 (a), 1200 (b), 1600 (c); ε11 strain mapsobtained for zone 3 respectively between images taken at cycles 1/4 and 10 (d), 10 and 50, (e) 651 and 1000 (f), 1000 and 1200 (g).
c© 2008 The Authors. Journal compilation c© 2008 Blackwell Publishing Ltd. Fatigue Fract Engng Mater Struct 31, 137–151
148 A. EL BARTAL I et al.
cycles 1000 and 1200, the additional strain in α-grain 2stabilized but strain gradients became less intense. Thiscan be linked to the microcrack initiation observed in thiszone at cycle 1200 that produced relaxation in the vicinityof the crack.
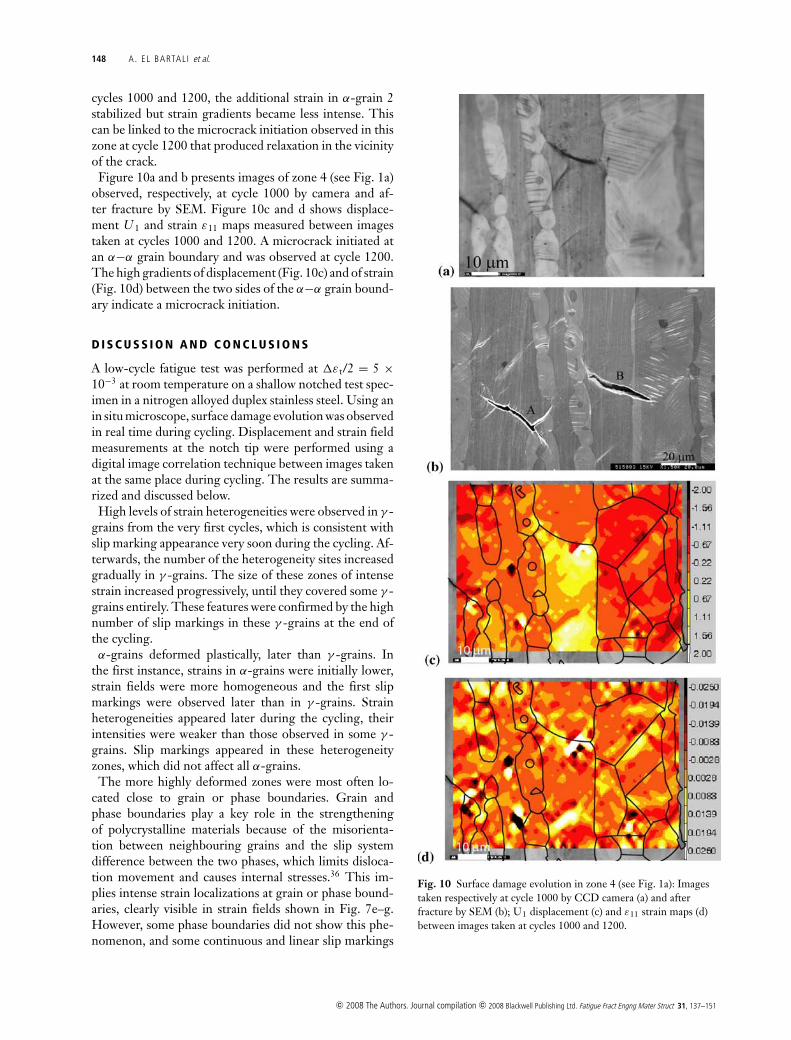
Figure 10a and b presents images of zone 4 (see Fig. 1a)observed, respectively, at cycle 1000 by camera and af-ter fracture by SEM. Figure 10c and d shows displace-ment U 1 and strain ε11 maps measured between imagestaken at cycles 1000 and 1200. A microcrack initiated atan α−α grain boundary and was observed at cycle 1200.The high gradients of displacement (Fig. 10c) and of strain(Fig. 10d) between the two sides of the α−α grain bound-ary indicate a microcrack initiation.
D I S C U S S I O N A N D C O N C L U S I O N S
A low-cycle fatigue test was performed at �ε t/2 = 5 ×10⁻³ at room temperature on a shallow notched test spec-imen in a nitrogen alloyed duplex stainless steel. Using anin situ microscope, surface damage evolution was observedin real time during cycling. Displacement and strain fieldmeasurements at the notch tip were performed using adigital image correlation technique between images takenat the same place during cycling. The results are summa-rized and discussed below.
High levels of strain heterogeneities were observed in γ -grains from the very first cycles, which is consistent withslip marking appearance very soon during the cycling. Af-terwards, the number of the heterogeneity sites increasedgradually in γ -grains. The size of these zones of intensestrain increased progressively, until they covered some γ -grains entirely. These features were confirmed by the highnumber of slip markings in these γ -grains at the end ofthe cycling.α-grains deformed plastically, later than γ -grains. In
the first instance, strains in α-grains were initially lower,strain fields were more homogeneous and the first slipmarkings were observed later than in γ -grains. Strainheterogeneities appeared later during the cycling, theirintensities were weaker than those observed in some γ -grains. Slip markings appeared in these heterogeneityzones, which did not affect all α-grains.
The more highly deformed zones were most often lo-cated close to grain or phase boundaries. Grain andphase boundaries play a key role in the strengtheningof polycrystalline materials because of the misorienta-tion between neighbouring grains and the slip systemdifference between the two phases, which limits disloca-tion movement and causes internal stresses.36 This im-plies intense strain localizations at grain or phase bound-aries, clearly visible in strain fields shown in Fig. 7e–g.However, some phase boundaries did not show this phe-nomenon, and some continuous and linear slip markings
Fig. 10 Surface damage evolution in zone 4 (see Fig. 1a): Imagestaken respectively at cycle 1000 by CCD camera (a) and afterfracture by SEM (b); U1 displacement (c) and ε11 strain maps (d)between images taken at cycles 1000 and 1200.
c© 2008 The Authors. Journal compilation c© 2008 Blackwell Publishing Ltd. Fatigue Fract Engng Mater Struct 31, 137–151
FAT IGUE DAMAGE ANALYSIS IN A DUPLEX STAINLESS STEEL 149
through α-γ boundaries were observed. It is also wellknown that crystallographic orientation relationships ex-ist in DSS between ferrite (BCC) and austenite (FCC)grains.9,15,37 Such orientation relationships, referred to asK-S relationships (Kurdjumov-Sachs relationships), typ-ically [110](1-11)γ //[111](1-10)α , express that some easyslip directions in one phase quasi-coincide with easy slipdirections in the other phase. Such compatibility of easyslip systems in both phases favours the passing on of dislo-cation slip from austenite to ferrite through phase bound-aries, to further the local stress concentration caused bydislocation pile-ups in the austenite.36 In the zone wheresuch orientation relationships were observed, no strainlocalization was seen (Fig. 8b & c).This agrees with re-cent observations performed by Marinelli et al.38 by TEMjust beneath the surface of a fatigued specimen of a SAF2507 DSS alloyed with 0.26% N. At �ε t = 8 × 10⁻³
(�εp = 2.4 × 10⁻³), they observed an important role ofcrystallographic correlation between phases. When K-Srelationships between BBC and FCC grains are satisfied,the slip bands easily cross phase boundaries. On the con-trary, when the correlation between phases is lacking, mi-crocracks initiated at the slip band gets arrested at thephase boundary. At �ε t = 1.2 × 10⁻² (�εp = 6.6 × 10⁻³),they observed no role of K-S relations. Both phases ex-hibit a more homogenous distribution of plastic deforma-tion; however, extrusions-intrusions and microcracks areobserved preferentially in the ferrite.
In situ observations show several microcrack initiationsin the analysed zone (Figs 9c & 10c). Although austeniticgrains deformed plastically in an intensive way first dur-ing cycling, the first microcracks initiated in the fer-ritic phase, preferentially at ferrite/ferrite grain bound-aries.5,13–15 Initiation in ferrite can be explained by slipmode differences between austenite and ferrite, influencedby nitrogen content. The nitrogen alloying changes theslip mode in the austenite from wavy to planar, thus, in-creasing the reversibility of dislocation slip under cyclicloading and leading to a better spatial distribution of cyclicplastic strain. This, therefore, modifies the surface damagedistribution because of a less marked intrusion-extrusionrelief. On the contrary, in the ferritic phase, irreversibilityof the dislocation slip due to easy cross slip produces awavy surface relief with steeper extrusions and intrusions,which favours the crack initiation in ferrite.
Strain intense localization zones were observed in someplaces from the first cycle. Microcrack initiations werecorrelated with some of these high strain gradient zones(Figs 9e & 10d). It must be noted that these initiation zonesappeared very early during cycling and not only just beforeinitiation. Moreover, it could be surprising to observe twoparts of the same grain split by a high gradient zone—onedeformed in tension, the other in compression—with ap-proximately the same strain level, but reversed. The high
stress triaxiality level existing in a grain of a polycrystal,due to the numerous surrounding grains, could explainthe high strain heterogeneity observed in this grain. Thecrystallographic orientations of the grains in the aggre-gate also play an important role on the strain in each grain.Moreover, strain gradients shown here concern only theε11 strain component, in the loading direction. It could beinteresting to go further and analyse all the strain compo-nents.
A quantification of plastic strain levels achieved in thegrains of a polycrystalline material after a mechanical testis very difficult to obtain. Although it is theoretically pos-sible to evaluate partly the plastic strain level reached ina grain from the number and the height of slip markingspresent at the surface of this grain, by AFM for exam-ple,39 these measurements are difficult to carry out. Thatis the reason why most authors evaluate the beginning ofthe plasticity with the first slip markings and compare theplastic strain levels between two grains using the numberof slip markings but rarely quantify it. This quantificationcan nevertheless be obtained by strain field measurementsusing DIC. Modern equipment and recent developmentsin DIC allow such measurements to be performed todayon the microstructural scale. The present work shows thatstrain field measurements performed on the microstruc-tural scale are a good tool for studying fatigue damagemicromechanisms, especially in regard to strain gradientswhich are forewarning signs of microcrack initiation. Thedevelopment of 2D, even 3D, strain field measurementscan give hope for better performance and accuracy of suchstudies.
Acknowledgements
The authors acknowledge M. Francois Hild, from the‘Laboratoire de Mecanique et Technologie’ (LMT) ofENS-Cachan, for his help concerning the use of Cor-reliQ4 software and for fruitful discussions about the re-sults. The authors are also grateful to SRMA/LA2M ofCEA for the crystallographic texture analysis.
R E F E R E N C E S
1 Charles, J. (1991) Superduplex stainless steels: structures andproperties, In: Duplex Stainless Steels 91 (Edited by J. Charlesand S. Bernhardsson), Editions de Physique, Les Ulis, France,pp. 3–48.
2 Nystrom, M. and Karlsson, B. (1996) Fatigue of duplexstainless steel. Influence of discontinuous, spinodallydecomposed ferrite. Mater. Sci. Engng. A 215, 26–38.
3 Magnin, T., Lardon, J.M. and Coudreuse, L. (1988) A newapproach to low-cycle fatigue behavior of a duplex stainlesssteel based on the deformation mechanisms of the individualphases. In: Low-Cycle Fatigue, American Society for Testing andMaterials: ASTM STP 942 (Edited by H. D. Solomon, G.R.Halford, L.R. Kaisand and B.N. Leis), pp. 812–823.
c© 2008 The Authors. Journal compilation c© 2008 Blackwell Publishing Ltd. Fatigue Fract Engng Mater Struct 31, 137–151
150 A. EL BARTAL I et al.
4 Seddouki, A. (1994) Endommagement en fatigue plastiqueoligocyclique a temperature ambiante d’aciers inoxydablesduplex austeno-ferritiques type Z2 CND 22-05 allies a l’azote.PhD thesis. University of Lille 1, France.
5 Degallaix, S., Seddouki, A., Degallaix, G., Kruml, T. and PolakJ. (1995) Fatigue damage in austenitic-ferritic duplex stainlesssteels. Fatigue Fract. Engng. Mater. Struct. 18, 65–77.
6 Mateo, A., Llanes, L., Iturgoyen, L. and Anglada, M. (1996)Cyclic stress-strain response and dislocation substructureevolution of a ferrite-austenite stainless steel. Acta Mater. 44,1143–1153.
7 Llanes, L., Mateo, A., Iturgoyen, L. and Anglada, M. (1996)Aging effects on the cyclic deformation mechanisms of a duplexstainless steel. Acta Mater. 10, 3967–3978.
8 Kruml, T., Polak J., Obrtlık K. and Degallaix, S. (1997)Dislocation structures in the bands of localized cyclic plasticstrain in austenitic 316L and austenitic-ferritic duplex stainlesssteels. Acta Mater. 45, 5145–5151.
9 Verhaeghe, B., Louchet, F., Doisneau-Cottignies B., Brechet,Y. and Massoud, J. P. (1997) Micromechanisms of deformationof an austenoferritic duplex stainless steel. Phil. Mag. A 76,1079–1091.
10 Moussavi Torshizi, S. E. (1997) Ecrouissage cyclique d’aciersinoxydables austenitiques: influence de l’histoire dechargement. PhD thesis. University of Lille1, France.
11 Aubin, V. (2001) Plasticite cyclique d’un acier inoxydableausteno-ferritique sous chargement biaxial non proportionnel.PhD thesis. University of Lille1, France.
12 Aubin, V., Quaegebeur, P. and Degallaix, S. (2003) Cyclicplasticity of a duplex stainless steel under non-proportionalloading. Mater. Sci. Engng. A 346, 208–215.
13 Polak, J., Kruml, T., Degallaix, S. and Nilsson, J. O. (1999)Fatigue damage in austenitic-ferritic duplex stainless steel. In:Proceedings of Eighth International Conference on MechanicalBehaviour (ICM8), Progress in Mechanical Behaviour ofMaterials, Vol. 1, (Edited by F. Ellyin and J. W. Provan).Canada. pp. 47–52.
14 Polak, J. and Zezulka, P. (2005) Short crack growth and fatiguelife in austenitic-ferritic duplex steel. Fatigue Fract. Engng.Mater. Struct. 28, 923–935.
15 Alvarez-Armas, I., Marinelli, M. C., Malarrıa J. A., Degallaix,S. and Armas, A. F. (2006) Microstructure associated with crackinitiation during low-cycle fatigue in a low nitrogen duplexstainless steel. Int. J. Fatigue 29, 758–764.
16 Marinelli, M. C., Degallaix, S. and Alvarez-Armas, I. (2006)Dislocation structure developed in the austenitic-phase of SAF2507 duplex stainless steel. Mater. Sci. Engng. A 435–436,305–308.
17 Duber, O., Kunkler, B., Krupp, U., Christ, H. J. and Fritzen,C. P. (2006) Experimental characterization andtwo-dimensional simulation of short-crack propagation in anaustenitic –ferritic duplex steel. Int. J. Fatigue 28, 983–992.
18 Stolarz, J. and Foct, J. (2001) Specific features of two phasealloys response to cyclic deformation. Mater. Sci. Engng. A 316,501–505.
19 Photomechanics 2006 (2006) International Conference onfull-field measurement technique and their application inexperimental solid mechanics (Edited by M. Grediac and J.Huntly). Clermont-Ferrand, France.
20 Bergonnier, S., Hild, F., Rieunier, J. B. and Roux, S. (2005)Strain heterogeneities and local anisotropy in crimped glasswool. J. Mater. Sci. 40, 5949–5954.
21 Hild, H., Perie J. N., Lemon, J. and Puyo-Pain, M. (2005) Onthe use of digital image correlation to analyse the mechanicalproperties of brittle matrix composites. In: Proceedings of 107thAnnual Meeting, Exposition, and Technology Fair of the AmericanCeramic Society Baltimore, MD, USA.
22 Forquin, P., Rota, L., Charles, Y. and Hild, F. (2004) A methodto determine the macroscopic toughness scatter of brittlematerials. Int. J. Fracture 125, 171–187.
23 Hild, F. and Roux, S. (2006) Digital image correlation: fromdisplacement measurement to identification of elasticproperties. Strain 42, 69–80.
24 Roux, S. and Hild, F. (2006) Stress intensity factormeasurements from digital image correlation: post-processingand integrated approaches. Int. J. Fracture 140, 141–157.
25 Hild, F. and Roux, S. (2006) Measuring stress intensity factorswith a camera: Integrated digital images correlation (I-DIC). C.R. Mecanique 334, 8–12.
26 Besnard, G., Hild, F. and Roux, S. (2006) “Finite-element”displacement fields analysis from digital images: Application toPortevin-Le Chatelier Bands. Exp. Mech. 46, 789–803.
27 Sun, Y., Pang, J. H. L., Weng, C. K. and Su, F. (2005) Finiteelement formulation for a digital image correlation method.Appl. Opt. 44, 7357–7363.
28 Wagne, B., Roux, S. and Hild, F. (2002) Spectral approach todisplacement evaluation from image analysis. Eur. Phy. J. Appl.Phy. 17, 247–252.
29 Chu, T.C., Ranson, W. F., Sutton, M. A. and Peters, W. H.(1985) Applications of digital image correlation techniques toexperimental mechanics. Exp. Mech. 25, 232–244.
30 Schreier, H. W. and Sutton, M. A. (2002) Systematic errors indigital image correlation due to undermatched subset shapefunctions. Exp. Mech. 42, 303–310.
31 El Bartali, A., Aubin, V. and Degallaix, S. (2006) “Surface strainand damage measurement in an austenitic-ferritic stainless steel”,Euromech-Mecamat EMMC9, MORET SUR LOING, 9-12May 2006. Texte paru in: Local Approach to Fracture, EMMC9(Edited by J. Besson, D. Moinereau, D. Steglich), Ecole desMines de Paris, ISBN 2-911762-73-8, pp. 347–352.
32 El Bartali, A., Aubin, V. and Degallaix, S. (2006) Fatiguedamage micromechanism in an austenitic-ferritic stainlesssteel. In: Proceeding of the 16th of European conference of Fracture,Alexandroupolis, Greece, CD-ROM.
33 El Bartali, A., Aubin, V. and Degallaix (2006) In situ surfacestrain measurements during low-cycle fatigue tests. In:Proceedings of Photomechanics 2006, International Conference onfull-field measurement technique and their application inexperimental solid mechanics, (Edited by M. Grediac and J.Huntly). Clermont-Ferrand, France.
34 Degallaix, S., Taillard, R. and Foct, J. (1984) Role of nitrogeninterstitials in plastic fatigue of austenitic stainless steels. In:Fatigue 84, Vol. 1, (Edited by C. J. Beevers), pp. 49–59.
35 El Bartali, A., Aubin, V., Sabatier, L., Quaegebeur, P. andDegallaix, S. (2005) Fatigue damage micromechanism analysismethod in austenitic-ferritic stainless steel. In: Proceeding inStainless Steel World 2005, Maastricht, Netherlands,pp. 290–294.
36 Zielinski, W., Swiatnicki, W., Barstch, M., and Messerschmidt,U. (2003) Non-uniform distribution of plastic strain in duplexsteel during TEM in situ deformation. Mater. Chem. Phy. 81,476–479.
c© 2008 The Authors. Journal compilation c© 2008 Blackwell Publishing Ltd. Fatigue Fract Engng Mater Struct 31, 137–151
FAT IGUE DAMAGE ANALYSIS IN A DUPLEX STAINLESS STEEL 151
37 Frechard, S., Martin, F., Clement, C. and Cousty, J. (2006)AFM and EBSD combined studies of plastic deformation in aduplex stainless steel. Mater. Sci. Engng. A 418, 312–319.
38 Marinelli, M. C., Degallaix, S. and Alvarez-Armas, I. (2007)Short crack initiation during low-cycle fatigue in SAF 2507Duplex Stainless Steel. Key Engng Mater. 345–346, 343–346.
39 Villechaise, P., Sabatier, L. and Girard, J.C. (2002) On slipband features and crack initiation in fatigued 316L austeniticstainless steel: Part 1: Analysis by electron back-scattereddiffraction and atomic force microscopy. Mater. Sci. Engng. A323, 377–385.
A P P E N D I X : D I G I TA L I M A G E C O R R E L AT I O N
In this section, the principles of the digital image corre-lation technique used in this work are summarized. Cor-reliQ4 software was used to perform displacement fieldmeasurements.23–26 Two digital images of the same anal-ysis area taken at two different times are considered. Thefirst image is called the ‘reference image’, and the secondimage is the ‘deformed image’ (Fig. 3). The grey level dis-tribution of the reference image and the deformed imageare defined by f (x) and g(x) respectively, where x is theposition field of the pixels in the image considered, suchthat
g(x + u) = f (x) + b(x), (A.1)
where u(x) is the unknown in-plane displacement field,and b(x) is the noise induced by image acquisition, which isneglected either because of its low amplitude with respectto those of f and g or because of its scale separation withsignificant components of the displacement field.
An objective function �(v) is introduced,23,24 operatingon displacement fields v(x)
�(v) =∫ ∫
[g(x + v) − f (x)]2d x. (A.2)
This functional reaches its minimum value, 0, for v = u(see Eq. (1)). When f and g are sufficiently smooth and the
displacement is small enough in amplitude, a first orderTaylor expansion of g is performed, and the displacementis estimated through the minimisation of linearized �
�(v) =∫ ∫
[g(x) − f (x) + v(x).∇g(x)]2dx. (A.3)
The displacement field is decomposed as a linear com-bination on the basis of known functions ψ i
v(x) =∑
i
uiψi(x), (A.4)
where ψ i are known functions and ui are the vector ampli-tudes to be determined. The problem consists of solvinga linear system that is written in a matrix form as
[M] {w} = {m} , (A.5)
where {w} is a vector containing all the unknown com-ponents vi, [M] and {m} are known quantities dependingon f , g and ψ . In CorreliQ4 software, the basis functionsare defined as bilinear functions for each component ofthe displacement over square elements. They are Q4P1-shape functions used in the language of the finite elementmethod. The element is made up of four nodes of thequadrilateral. Each element is mapped onto the square[−1, 1]2, where the four basic functions (i.e. P1 polyno-mials) are (1−x)(1−y), x(1−y), (1−x)y and xy in local (x,y)frame.26
In practice, the reference image is subdivided into smallzones. These small zones define the elements with size l
in pixels. The corner of each of these zones is a node ofthe mesh (Fig. 3). The elementary matrix Me
ij and vectorme
j are calculated for each element using Eqs (3) and (4).Then, an assembly of elementary matrices and vectors iscarried out as in any finite element analysis. The displace-ment field is then calculated by inversion of Eq. (5). Thedisplacement field obtained is globally continuous.23 Thestrain field is finally calculated as the discrete derivationof the displacement field or by using the shape functions.
c© 2008 The Authors. Journal compilation c© 2008 Blackwell Publishing Ltd. Fatigue Fract Engng Mater Struct 31, 137–151