The Weldability of Duplex Stainless-Steel in Structural ... - MDPI
24
metals Article The Weldability of Duplex Stainless-Steel in Structural Components to Withstand Corrosive Marine Environments Iñigo Calderon-Uriszar-Aldaca 1, *, Estibaliz Briz 2 , Harkaitz Garcia 2 and Amaia Matanza 3 1 TECNALIA, Basque Research and Technology Alliance (BRTA), Mikeletegi Pasealekua 2, 20009 Donostia-San Sebastián, Spain 2 Department of Mechanical Engineering, University of the Basque Country (UPV/EHU), 48940 Leioa, Vizcaya, Spain; [email protected] (E.B.); [email protected] (H.G.) 3 SIAME-MPC (UPV/EHU) Université de Pau et des pays de l’Adour ISA BTP, 64600 Anglet, France; [email protected] * Correspondence: [email protected]; Tel.: +34-699-907-343 Received: 12 October 2020; Accepted: 3 November 2020; Published: 5 November 2020 Abstract: There is still a considerable gap in the definition of the weldability of Duplex Stainless Steel (DSS). A lack of clarity that is explained by the standard specification of the maximum content of equivalent carbon that defines a “weldable” steel coupled with the fact that the alloying elements of DSS exceed this defined limit of weldability. In this paper, welding quality in an inert environment and in presence of chlorides is analyzed with the aim of defining optimum welding conditions of 2001, 2304, and 2205 DSS. The same procedure is followed for a hybrid weld between DSS 2205 and a low carbon mild steel, S275JR. As main output, this study defined the optimal welding conditions with tungsten inert gas without filler for each type of DSS weld that showed excellent anti-corrosion performance, with the exception of the DSS 2205-S275JR weld where widespread corrosion was observed. Additionally, this study established a relationship between the thermal input during welding and the content of alloying elements in defect-free joints. Furthermore, it demonstrated that an increase in ferrite content did not lead to a worse corrosion resistance, as expected after passivation. Keywords: stainless steels; weldability; aggressive environments; marine environments; heat input 1. Introduction Offshore steel structures, but also onshore in coastal areas up to a few km to the coast, suffer the effects of a harsh corrosive marine environment. This is caused mainly by moisture and chlorides that are present in the atmosphere near the sea. Chlorides cause a localized pitting corrosion attack that, in structures under tension, can cause stress concentration hot spots developing the early failure of the structure by sudden crack propagation. Thus, to face this problem, one emerging strategy is the use of Duplex Stainless Steel (DSS) instead of the simply painted carbon steel or other lesser stainless steels. DSS presents better properties, especially in terms of strength, durability, and fire resistance [1,2], when compared to the most widely used carbon structural steel in the construction industry (S275JR). These properties are due to the presence of alloying elements such as nickel and chromium, among others, generating an external protective or passive layer their microstructure, depending on the lower amount of ferrite. Nevertheless, steel structures are composed by hot-rolled profiles and other singular elements that need to be joined to form them. When these joints are made by welding, the welding itself constitutes a localized thermal treatment that could evaporate the protective elements and change the microstructure, increasing the ferrite fraction. Thus, the protective properties of DSS could be Metals 2020, 10, 1475; doi:10.3390/met10111475 www.mdpi.com/journal/metals
-
Upload
khangminh22 -
Category
Documents
-
view
1 -
download
0
Transcript of The Weldability of Duplex Stainless-Steel in Structural ... - MDPI
metals
Article
The Weldability of Duplex Stainless-Steel inStructural Components to Withstand CorrosiveMarine Environments
Iñigo Calderon-Uriszar-Aldaca 1,*, Estibaliz Briz 2, Harkaitz Garcia 2 and Amaia Matanza 3
1 TECNALIA, Basque Research and Technology Alliance (BRTA), Mikeletegi Pasealekua 2,20009 Donostia-San Sebastián, Spain
2 Department of Mechanical Engineering, University of the Basque Country (UPV/EHU),48940 Leioa, Vizcaya, Spain; [email protected] (E.B.); [email protected] (H.G.)
3 SIAME-MPC (UPV/EHU) Université de Pau et des pays de l’Adour ISA BTP, 64600 Anglet, France;[email protected]
* Correspondence: [email protected]; Tel.: +34-699-907-343
Received: 12 October 2020; Accepted: 3 November 2020; Published: 5 November 2020�����������������
Abstract: There is still a considerable gap in the definition of the weldability of Duplex Stainless Steel(DSS). A lack of clarity that is explained by the standard specification of the maximum content ofequivalent carbon that defines a “weldable” steel coupled with the fact that the alloying elements ofDSS exceed this defined limit of weldability. In this paper, welding quality in an inert environmentand in presence of chlorides is analyzed with the aim of defining optimum welding conditions of2001, 2304, and 2205 DSS. The same procedure is followed for a hybrid weld between DSS 2205 and alow carbon mild steel, S275JR. As main output, this study defined the optimal welding conditionswith tungsten inert gas without filler for each type of DSS weld that showed excellent anti-corrosionperformance, with the exception of the DSS 2205-S275JR weld where widespread corrosion wasobserved. Additionally, this study established a relationship between the thermal input duringwelding and the content of alloying elements in defect-free joints. Furthermore, it demonstrated thatan increase in ferrite content did not lead to a worse corrosion resistance, as expected after passivation.
Keywords: stainless steels; weldability; aggressive environments; marine environments; heat input
1. Introduction
Offshore steel structures, but also onshore in coastal areas up to a few km to the coast, suffer theeffects of a harsh corrosive marine environment. This is caused mainly by moisture and chloridesthat are present in the atmosphere near the sea. Chlorides cause a localized pitting corrosion attackthat, in structures under tension, can cause stress concentration hot spots developing the early failureof the structure by sudden crack propagation. Thus, to face this problem, one emerging strategyis the use of Duplex Stainless Steel (DSS) instead of the simply painted carbon steel or other lesserstainless steels. DSS presents better properties, especially in terms of strength, durability, and fireresistance [1,2], when compared to the most widely used carbon structural steel in the constructionindustry (S275JR). These properties are due to the presence of alloying elements such as nickel andchromium, among others, generating an external protective or passive layer their microstructure,depending on the lower amount of ferrite.
Nevertheless, steel structures are composed by hot-rolled profiles and other singular elementsthat need to be joined to form them. When these joints are made by welding, the welding itselfconstitutes a localized thermal treatment that could evaporate the protective elements and changethe microstructure, increasing the ferrite fraction. Thus, the protective properties of DSS could be
Metals 2020, 10, 1475; doi:10.3390/met10111475 www.mdpi.com/journal/metals

Metals 2020, 10, 1475 2 of 24
removed by welding precisely at the more critical spots in joints, that tend to concentrate stresses.Therefore, the research on how to correctly weld these DSS with a proper thermal input is valuable toenable the safe manufacturing of steel structures under marine environment.
The main reason specific building standards, such as the Eurocodes [3–9], have yet to include theuse of these steel grades is the uncertainty surrounding spots that are subjected to thermal aggressions.In other words, these standards have not yet included stainless steel in building structures, due to thecomplexity of establishing the parameters that can guarantee suitable and safe use of the materialsafter the welding process [10,11].
Consequently, research on the equivalent carbon content method specified in these standards [3–9]indicates that it is well suited to those non-alloyed steels, the so-called weldable steels in thestandardization literature. Thus, the application of that method to stainless steel that has a highproportion of alloying elements is pointless, because the equivalent carbon content of them will alwaysexceed the previously set threshold. Weldability as such, therefore, needs to be demonstrated by otheralternative methods, which will ensure that the protective properties of the corresponding alloy will belocally retained within the Heat-Affected Zone (HAZ) of the weld.
Locally applied heat treatment, when incorrectly applied, could modify the welding zone ofstainless steel, in such a way as to reduce the protective elements of the material and leave residualstresses. For instance, Elsaady et al. presented the behavior of different welding temperature rangesfor a duplex steel [12]. The effects on the affected area made it much more vulnerable to corrosiveprocesses such as localized pitting corrosion in a marine environment [13].
However, there is still a key clear gap between current understanding and engineering practice.According to these standards, only “weldable” steels must be used to form steel structures, even moreso in marine environments, but only the equivalent carbon content method is prescribed to determinewhether a steel is weldable or not, despite it discriminating DSS systematically. Thus, although DSSare in fact weldable under certain conditions and perform much better in marine environments,paradoxically they are unfairly discarded in practice because of not being “weldable” under carbonequivalent content. Therefore, there is still a need for practical and feasible alternative procedures todemonstrate the weldability of a DSS under certain conditions going beyond the equivalent carboncontent method.
In fact, there are standardized procedures to see the ferrite content, or the corrosion performanceunder salt-spray chamber, or to do a visual examination, or to analyze a micrograph looking forintermetallic phases. Every single one of such procedures determines one single property of the DSSwelding but is not able individually to determine whether a DSS is weldable or not and, even moreimportantly, how to do it.
Therefore, the first task is to define which properties are required to make a DSS “weldable”, at leastunder certain conditions. The second task is to identify the more feasible way to empirically verifythat such properties are meeting corresponding requirements, and define a methodology supportedby standards and practice. Then, the third task is to put everything into practice, demonstrating theweldability of a single DSS by this practical way. Finally, the fourth and last task is generalization,validating proposed methodology by succeeding in applying it for more than a single DSS.
The practical significance of the work carried on in this study is that it was able to close thatloop. It determined which properties are required to make a DSS weldable, and at least in equivalentterms the carbon equivalent content method does this. It proposed an alternative holistic methodologyto verify such requirements. Finally, it was executed for four different types of welding with fourdifferent steels, three DSS and one carbon steel, determining the optimal thermal input and conditionsfor everyone.
Hence, with the aim of ensuring stainless steel properties, 1.5 mm thickness steel plates willbe used for calibration tests to determine the optimum thermal input. These plates are selected asrepresentative of cold-formed corrugated steel to which the standardized range of tests is applicable,including tests on automatic welding and welding beams with no filler metal, considered later on.

Metals 2020, 10, 1475 3 of 24
The aim here is to minimize the effects of any working variables that do not depend on the material itselfavoiding introducing an additional variable relating to material compatibility. Tungsten Inert Gas (TIG)welding was chosen rather than welding, which is also widely used and might be more economical,because TIG welding without filler performs better in terms of corrosion resistance, presenting uniformwelding beads and a narrower HAZ [14,15].
In addition to demonstrating the sound weldability of the flat steel plates and sheeting, thesecalibration tests will serve to verify the competitive properties of the plates when used alongside steelrebars, usually welded together in preassembled meshes to reinforce unique structural components.The flat steel products in the mesh often share the concrete matrix with other carbon steel rebars,placed in peripheral positions and protected only by the corresponding concrete cover. As hybridspecimens, the corrosion resistance tests of these steel products will therefore be representative of theirsuitability for the structural optimization of mesh reinforcements within the concrete matrices.
Accordingly, for the sake of integrating all the characteristic procedures of industrial welding,the process schedule was as follows:
1. Specimen preparation, border alignment, cleaning, bench placement, etc.2. Welding of the specimen.3. Brushing + pickling + passivization.
Hence, the first objective of this research is to define the optimum thermal input of each of thetested duplex stainless steels, i.e., the optimum temperature at the beginning of welding and betweenpasses, which differs a priori for each steel grade.
Thermal input is the most important variable in any definition of properly welded stainlesssteel, a fact that has been confirmed in multiple studies, including those by Mohammed et al.,which concluded that DSS steel 2205 tolerated a higher thermal input than austenitic steels [16], and byAsif et al., which concluded that duplex 2205 stainless steel performed better with a higher thermalinput than austenitic steels [17]. Likewise, Tasalloti et al. concluded that lower heat inputs, also for DSS2205, produced a great disparity in its composition (i.e., Cr, Ni and Mo) [18]. Besides, it is noteworthythat prolonged thermal inputs can improve the performance of welds [19]. Additionally, Asif et al. [17]underlined how lower inputs imply higher fractions of ferrite and severe precipitation of chromiumnitrides; this implies a degradation of mechanical properties and corrosion resistance, such as chloridepitting corrosion, typical of marine environments.
Finally, it is worth mentioning the work carried out by Subramanian et al., who carried out anexhaustive analysis of the anode metal to cathode metal ratio and its influence on the degree of galvaniccorrosion [20], to be later considered in this study for dissimilar joints. Likewise, the study by Paulet al. should be highlighted, which examined the way excessive polarization can be controlled to avoidpitting and can simultaneously reduce anode consumption [21].
Secondly, after welding with each corresponding optimum input (welding speed, temperature, etc.),the welds were validated by the full range of Non-Destructive Tests (NDT) required for the certificationof welding procedures and, likewise, corrosion tests in a salt spray chamber in accordance withEN ISO 9227-NSS [22].
Although studies support the good performance of stainless steel in all types of environments [23],the equilibrium in DSS between ferrite and austenite is necessary for a good performance in marineenvironments, [24]. Hence, these tests successfully determined which of the DSS welded jointspresented the most competitive characteristics for mechanical performance and which of them stillbehaved well in saline environments.
Additionally, following the same above-mentioned procedures, the feasibility of welding DSSand S275JR, a weldable type of carbon steel, was also analyzed in this research, above all with respectto galvanism. In similar studies, Sternhell et al. [25] showed the anodal role of copper in marineenvironments and Subramanian et al. analyzed the behavior of zinc with stainless steel in tropicalmarine environments [20].

Metals 2020, 10, 1475 4 of 24
Finally, as a last remark, the research value chain presents several stages. In the first stage,the novelty lies in realizing and identifying a problem that need to be solved. Then, the novelty comeswhen the first solutions to that problem are proposed, and when these solutions are optimized afterthat. Finally, at the end of the day, the novelty and the research added value still lie in performingit simply and more feasibly in a practical way. Thus, the novelty of this study is presenting anoptimized and feasible procedure to determine DSS weldability in practice, alternative to the verysimple carbon equivalent method. Furthermore, the novelty also lies in putting it in practice forseveral DSS, demonstrating simultaneously the weldability of the DSS, the relationship between theiroptimized thermal inputs, the feasibility of the methodology itself and its generalization for severalDSS, effectively closing the loop.
2. Materials and Methods
2.1. Materials
Regarding the used materials, Table 1 shows the results of the DSS chemical composition tests ofeach steel grade with the aim of assessing the weldability of the different types of DSS and their corrosionresistance in marine environments. Each specimen was formed by two sheets of 180 × 80 × 1.5 mm3
dimensions, welded together by Tungsten Inert Gas (TIG) welding. Four different specimen typeswere built up depending on the material of each welded sheet and several samples of each type:
• Pure DSS 1.4482 (2001)• Pure DSS 1.4362 (2304)• Pure DSS 1.4462 (2205)• Hybrid DSS 1.4462 (2205)/carbon steel (S275JR)
Table 1. Chemical composition of duplex stainless steels (%).
Steel C Si Mn Pmax S Cr Ni Mo N Cu
2001 LDSS ≤0.03 ≤1 4.0–6.0 35 0.03 19.5–21.5 1.5–3.5 0.1–0.6 0.05–0.25 ≤12304 LDSS ≤0.03 ≤1 ≤2 35 0.015 22–24 3.5–5.5 0.1–0.6 0.05–0.25 0.15–0.62205 DSS ≤0.03 ≤1 ≤2 35 0.015 21–23 4.5–6.5 2.5–3.5 0.1–0.22 -
S275JR 21 - 1.5 0.035 35 - 0.012 - - 0.55
2.2. Methods
The research tasks were divided into different stages, as indicated in Table 2. The first step was todetermine the optimum thermal input, after this, different specimens were welded and analyzed todetermine their welding quality and its behaviour in a marine environment.
Table 2. Research stages.
Stage Item Description
S1 Welding Experimental characterization of the optimum thermal input foreach steel grade under TIG welding conditions without filler.
S2 Welding Performing TIG welds without filler, each material will use itsoptimal input.
S3 Test Application of NDT: Visual, penetrating liquids, X-rays
S4 Test Micrographies, microstructural analysis and ferrite content
S5 Test Corrosion test in salt spray chamber
The base material for welding the austenitic-ferritic stainless steel was prepared in differentdimensions for the post-welding tests.

Metals 2020, 10, 1475 5 of 24
Figure 1 schematizes weld join design (a) and welding sequence (b) used in each specimen. From adesign point of view, a butt weld with full penetration between two 1.5 mm sheets was carried out,without edge preparation and without sheet spacing. Besides, an automatic TIG welding without fillerwas performed in a single pass from one side and without backing. Accordingly, this minimizes thenumber of variables of the procedure.
Metals 2020, 10, x FOR PEER REVIEW 5 of 24
Table 3 summarizes the predefined variables used during the welding for the different materials. These variables are identical for the welding of all materials because they are directly associated with the welding process, regardless of the type of material to be welded.
(a) (b)
Figure 1. Detail of butt weld with full penetration without edge preparation nor sheet spacing: (a) cross-section of welded joint design; (b) Welding sequences.
Table 3. Values considered for predefined variables.
Variables Value Welding process T.I.G. (Tungsten Inert Gas. 141)
Mechanization level Automated Type of welded joint Butt weld, Single side, Backless (BW SS NB)
Welding positions Under hand (PA) Thickness of base sheet (mm) 1.5 mm
Outside diameter (mm) N/A Type of metal filler No support
Shielding gas 99.9% Argon Shielding gas flow rate 12 L/min Shielding Gas Support 99.9% Argon
Support shielding gas flow rate 4 L/min Type of electricity Direct Current, Electrode to negative
Minimum preheating temperature Room temperature (15 °C) Maximum temperature between passes N/A
Post-Welding Heat Treatment N/A Maximum bead oscillation/width Straight
Pulsed welding parameters No Tungsten electrode, type/diameter Tungsten + 2% Torio (Red), 2.4 mm
Arc length 3–4 mm Gun angle 70–80°
Preparation and cleaning method Initial cleaning: brushing with stainless steel tines Final cleaning: brushing, pickling + passivization
Welding machine Praxair Triton 2201 AC/DC Automation equipment Tractor carriage BUG-O SYSTEMS
Others Sheet clamping by tools
During stage 2, prior to the welding of the final coupons, a series of welding tests were performed to check the behavior of each base material. The purpose of these tests was to weld the coupons of each base material with different thermal inputs and to assess their specific inputs, thereby obtaining metallic welding continuity and adequate penetration through the root zone. This input should result in welds without plate perforation due to excessive input, while also avoiding the lack of fusion because of insufficient input.
Figure 1. Detail of butt weld with full penetration without edge preparation nor sheet spacing:(a) cross-section of welded joint design; (b) Welding sequences.
Table 3 summarizes the predefined variables used during the welding for the different materials.These variables are identical for the welding of all materials because they are directly associated withthe welding process, regardless of the type of material to be welded.
Table 3. Values considered for predefined variables.
Variables Value
Welding process T.I.G. (Tungsten Inert Gas. 141)Mechanization level AutomatedType of welded joint Butt weld, Single side, Backless (BW SS NB)
Welding positions Under hand (PA)Thickness of base sheet (mm) 1.5 mm
Outside diameter (mm) N/AType of metal filler No support
Shielding gas 99.9% ArgonShielding gas flow rate 12 L/minShielding Gas Support 99.9% Argon
Support shielding gas flow rate 4 L/minType of electricity Direct Current, Electrode to negative
Minimum preheating temperature Room temperature (15 ◦C)Maximum temperature between passes N/A
Post-Welding Heat Treatment N/AMaximum bead oscillation/width Straight
Pulsed welding parameters NoTungsten electrode, type/diameter Tungsten + 2% Torio (Red), 2.4 mm
Arc length 3–4 mmGun angle 70–80◦
Preparation and cleaning method Initial cleaning: brushing with stainless steel tinesFinal cleaning: brushing, pickling + passivization
Welding machine Praxair Triton 2201 AC/DCAutomation equipment Tractor carriage BUG-O SYSTEMS
Others Sheet clamping by tools
During stage 2, prior to the welding of the final coupons, a series of welding tests were performedto check the behavior of each base material. The purpose of these tests was to weld the coupons ofeach base material with different thermal inputs and to assess their specific inputs, thereby obtaining

Metals 2020, 10, 1475 6 of 24
metallic welding continuity and adequate penetration through the root zone. This input should resultin welds without plate perforation due to excessive input, while also avoiding the lack of fusionbecause of insufficient input.
Variables defined in Table 3 were the same for each specimen; however, thermal input depends onthe material of specimens, so specific thermal input was defined for each specimen. Besides, it dependson current intensity, voltage, and welding speed. Thus, the following Equation (1) was used for thecalculation of the thermal input, where Q is the derived thermal input in J/mm, I is the current intensityin Amperes, V is the voltage in Volts, and Sw is the welding speed in mm/s. For this study 100 A currentdensity was defined; arc length defines voltages, considering an arc length of 3–4 mm (as Table 3summarizes) means a voltage of 11–11.5 V.
Q =I·VSW
(1)
The coupons were welded at different speeds, using the option provided by the equipment toregulate the speed, see Figure 2. In this way, the welding was performed with different thermal inputsand the corresponding results were compared and analyzed to define the optimum one. Initial testsshowed that 2001 LDSS resists lower thermal input before drilling than 2304 LDSS and 2205 LDSSwhile 2304 LDSS resist a little bit more thermal input than 2001 LDSS and 2205 DSS a little bit morethan 2304 LDSS. Thus, 11 tests were carried out only to optimize the thermal input of 2001 LDSS and,taking this as a reference, the thermal input was slightly increased step by step for 2304 LDSS and2205 LDSS thereafter, until reaching their own optimum input.
Metals 2020, 10, x FOR PEER REVIEW 6 of 24
Variables defined in Table 3 were the same for each specimen; however, thermal input depends on the material of specimens, so specific thermal input was defined for each specimen. Besides, it depends on current intensity, voltage, and welding speed. Thus, the following Equation (1) was used for the calculation of the thermal input, where Q is the derived thermal input in J/mm, I is the current intensity in Amperes, V is the voltage in Volts, and Sw is the welding speed in mm/s. For this study 100 A current density was defined; arc length defines voltages, considering an arc length of 3–4 mm (as Table 3 summarizes) means a voltage of 11–11.5 V. = ∙
(1)
The coupons were welded at different speeds, using the option provided by the equipment to regulate the speed, see Figure 2. In this way, the welding was performed with different thermal inputs and the corresponding results were compared and analyzed to define the optimum one. Initial tests showed that 2001 LDSS resists lower thermal input before drilling than 2304 LDSS and 2205 LDSS while 2304 LDSS resist a little bit more thermal input than 2001 LDSS and 2205 DSS a little bit more than 2304 LDSS. Thus, 11 tests were carried out only to optimize the thermal input of 2001 LDSS and, taking this as a reference, the thermal input was slightly increased step by step for 2304 LDSS and 2205 LDSS thereafter, until reaching their own optimum input.
Figure 2. Automatic welding equipment: including sheet tooling, traction carriage on longitudinal guide rail to automatically control welding speed, Tungsten Inert Gas (TIG) welding machine to apply constant thermal input parameters, and shielding gas connection to perform welding under inert gas.
Thermal input also can be defined from nickel equivalent and chromium equivalent numbers. For instance, using the Schaeffler equation [26], a direct relationship can be derived between the summation of equivalent nickel and equivalent chromium of each DSS steel grade and the corresponding optimal thermal input of its welding seams. See Equation (2).
Then, once each coupon was welded at different welding speeds, the weld seam and adjacent area was pickled and passivated, to restore the corrosion resistance properties of the steel after welding and grinding. A pickling and passivation paste was used for this purpose. Figure 3 shows the coupons following this treatment process. Finally, following the application of these restorative treatments, the saline spray tests were performed to ensure post-welding corrosion resistance.
Figure 2. Automatic welding equipment: including sheet tooling, traction carriage on longitudinalguide rail to automatically control welding speed, Tungsten Inert Gas (TIG) welding machine to applyconstant thermal input parameters, and shielding gas connection to perform welding under inert gas.
Thermal input also can be defined from nickel equivalent and chromium equivalent numbers.For instance, using the Schaeffler equation [26], a direct relationship can be derived between thesummation of equivalent nickel and equivalent chromium of each DSS steel grade and the correspondingoptimal thermal input of its welding seams. See Equation (2).
Then, once each coupon was welded at different welding speeds, the weld seam and adjacent areawas pickled and passivated, to restore the corrosion resistance properties of the steel after welding andgrinding. A pickling and passivation paste was used for this purpose. Figure 3 shows the coupons

Metals 2020, 10, 1475 7 of 24
following this treatment process. Finally, following the application of these restorative treatments,the saline spray tests were performed to ensure post-welding corrosion resistance.Metals 2020, 10, x FOR PEER REVIEW 7 of 24
(a) (b) (c)
(d) (e) (f)
Figure 3. Welded coupons for testing, already prepared after pickling and passivation: (a) Detail of the HAZ appearing after welding; (b) Application of pickling and passivation product; (c) Removing the pickling and passivation product; (d) Sample and weld seam cleaning; (e) Comparison of the welded seam before and after pickling and passivation; (f) Welded coupons prepared for testing.
Every coupon was then analyzed by non-destructive tests (NDT) to determine the optimal thermal input for each steel as the minimum thermal input required for welding without any fault, according to the following standards.
• Visual test: as per standard ISO-17637:2011 [27], in replacement of standard EN-970:1997 [28]. • Test for the detection of surface cracks by penetrating liquids: as per standard EN-571-1:1997
[29]. • Radiographic test: as per standard EN-1435:1998 [30].
Besides, standard EN 5817 [31] was used for the result assessment; the standard defines three different quality level (D,C,B) on the basis of type, size and amount of selected imperfection. B means the highest quality and D the lowest. Accordingly, only B level was accepted in this study
The tests to derive ferrite content is based on ASTM E562 standard [32]. In order to evaluate the welded joints, the following specimen preparation and test application tasks are applied:
1. Saw cutting, in a mechanical workshop, of welding section. 2. Specific preparation of specimens, at the laboratory level, by embossing the samples in resin and
mirror polishing. 3. Electrolytic attack of samples using 40% NaOH soda, to calculate the ferrite content on
micrographies, 4. Electrolytic attack of samples by 10% oxalic acid, for microstructural observation in light
microscope.
These tests are followed by destructive neutral salt spray (NSS) according to ISO 9227 [22]. Therefore, the samples were sprayed in a 5% sodium chloride solution within the pH range of 6.5 to 7.2 in a controlled environment, with an exposure duration up to 216 h. Figure 4 shows the coupons placed inside test chamber
Figure 3. Welded coupons for testing, already prepared after pickling and passivation: (a) Detail of theHAZ appearing after welding; (b) Application of pickling and passivation product; (c) Removing thepickling and passivation product; (d) Sample and weld seam cleaning; (e) Comparison of the weldedseam before and after pickling and passivation; (f) Welded coupons prepared for testing.
Every coupon was then analyzed by non-destructive tests (NDT) to determine the optimal thermalinput for each steel as the minimum thermal input required for welding without any fault, according tothe following standards.
• Visual test: as per standard ISO-17637:2011 [27], in replacement of standard EN-970:1997 [28].• Test for the detection of surface cracks by penetrating liquids: as per standard EN-571-1:1997 [29].• Radiographic test: as per standard EN-1435:1998 [30].
Besides, standard EN 5817 [31] was used for the result assessment; the standard defines threedifferent quality level (D,C,B) on the basis of type, size and amount of selected imperfection. B meansthe highest quality and D the lowest. Accordingly, only B level was accepted in this study
The tests to derive ferrite content is based on ASTM E562 standard [32]. In order to evaluate thewelded joints, the following specimen preparation and test application tasks are applied:
1. Saw cutting, in a mechanical workshop, of welding section.2. Specific preparation of specimens, at the laboratory level, by embossing the samples in resin and
mirror polishing.3. Electrolytic attack of samples using 40% NaOH soda, to calculate the ferrite content
on micrographies,4. Electrolytic attack of samples by 10% oxalic acid, for microstructural observation in
light microscope.
These tests are followed by destructive neutral salt spray (NSS) according to ISO 9227 [22].Therefore, the samples were sprayed in a 5% sodium chloride solution within the pH range of 6.5 to7.2 in a controlled environment, with an exposure duration up to 216 h. Figure 4 shows the couponsplaced inside test chamber

Metals 2020, 10, 1475 8 of 24
Metals 2020, 10, x FOR PEER REVIEW 8 of 24
Figure 4. Samples of Tungsten Inert Gas (TIG) welded stainless-steel sheets (2001, 2304, 2205 and S275-2205) during the application of the marine corrosion test in a salt spray chamber.
3. Results
This section discloses the results of the NDT for determination of optimized thermal input of each steel joint type, the results regarding the ferrite content by means of micrographies and microstructural analysis and the results of the salt spray chamber destructive tests.
3.1. Optimized Thermal Input
The process for the determination of thermal input of DSS 2001 is analyzed below. The process followed for the other materials was the same.
As mentioned before, the voltage derived from the applied arc height ranged from 11–11.5 V. A mean voltage of 11.25 V was taken into account for the calculation of the thermal input by Equation (1). A total of 11 DSS coupons were welded. Table 4 summarizes the thermal input value used for each specimen relating to 1.4482 (2001) DSS coupons.
Table 4. Therma input used for each coupon of 1.4482 (2001).
Ref. Coupon Q (kJ/mm) 2001 × 180-A 0.256 2001 × 180-B 0.188 2001 × 180-C 0.150 2001 × 180-D 0.138 2001 × 180-E 0.321 2001 × 180-F 0.275 2001 × 180-G 0.307 2001 × 180-H 0.181 2001 × 180-I 0.231 2001 × 180-J 0.245 2001 × 180-K 0.281
For 2001 × 180-D and 2001 × 180-E coupons, the penetrating liquid and radiography tests were not applied, since they presented lack of root penetration and perforation, respectively, during visual examination. A and G coupons failed to pass the evaluation of the radiographic test, due to detected internal fusion faults. The remaining coupons met the requirements of the radiographic test.
Figure 4. Samples of Tungsten Inert Gas (TIG) welded stainless-steel sheets (2001, 2304, 2205 andS275-2205) during the application of the marine corrosion test in a salt spray chamber.
3. Results
This section discloses the results of the NDT for determination of optimized thermal input of eachsteel joint type, the results regarding the ferrite content by means of micrographies and microstructuralanalysis and the results of the salt spray chamber destructive tests.
3.1. Optimized Thermal Input
The process for the determination of thermal input of DSS 2001 is analyzed below. The processfollowed for the other materials was the same.
As mentioned before, the voltage derived from the applied arc height ranged from 11–11.5 V.A mean voltage of 11.25 V was taken into account for the calculation of the thermal input by Equation (1).A total of 11 DSS coupons were welded. Table 4 summarizes the thermal input value used for eachspecimen relating to 1.4482 (2001) DSS coupons.
Table 4. Therma input used for each coupon of 1.4482 (2001).
Ref. Coupon Q (kJ/mm)
2001 × 180-A 0.2562001 × 180-B 0.1882001 × 180-C 0.1502001 × 180-D 0.1382001 × 180-E 0.3212001 × 180-F 0.2752001 × 180-G 0.3072001 × 180-H 0.1812001 × 180-I 0.2312001 × 180-J 0.2452001 × 180-K 0.281
For 2001 × 180-D and 2001 × 180-E coupons, the penetrating liquid and radiography tests werenot applied, since they presented lack of root penetration and perforation, respectively, during visualexamination. A and G coupons failed to pass the evaluation of the radiographic test, due to detectedinternal fusion faults. The remaining coupons met the requirements of the radiographic test. However,
Metals 2020, 10, 1475 9 of 24
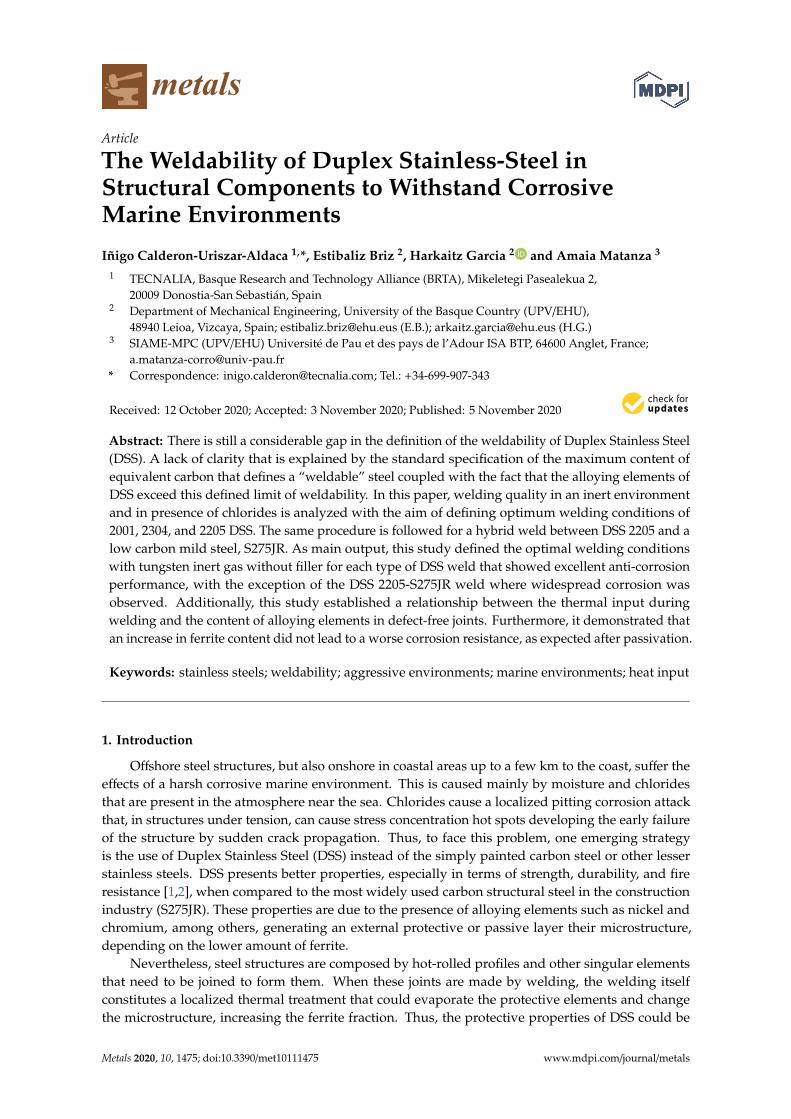
visual observation of the weld-seam surface should also be considered. See Figure 5 showing X-rayand penetrating liquids NDT procedure for some samples.
Metals 2020, 10, x FOR PEER REVIEW 9 of 24
However, visual observation of the weld-seam surface should also be considered. See Figure 5 showing X-ray and penetrating liquids NDT procedure for some samples.
Following the completion of the radiographic test, a visual examination of the coupon welding surfaces was completed (Figure 6 shows the status of some welded specimens). The weld seam surface of coupon “2001 × 180-K” was unstable and irregular, with a sinusoidal weld along the entire joint. 2001 × 180-F coupon ref. showed a longitudinal contraction towards the inside of the seam on the welding side; this contraction appeared to be a kind of root concavity defect. Coupon “2001 × 180-J” was welded with a slightly lower thermal input than the coupon “2001 × 180-A”. The surface showed an irregular and sinusoidal weld. It was therefore discarded as a non-optimal weld. The seam on coupon ref. “2001 × 180-B” showed an irregularly shaped bead at the welding face side, so the solidification of the seam is not optimal and could be improved. On the other hand, coupons with ref. “2001 × 180-H” and “2001 × 180-C” showed an excessively narrow weld seam width in the root area. This effect is attributed to the application of an excessively high welding speed on both coupons, and therefore, an excessively low thermal input. Table 5 summarizes radiographic results.
(a) (b)
(c) (d)
Figure 5. X-ray and penetrating liquids non-destructive testing performed on samples: (a) X-ray plates and test certificates of samples; (b) Application of penetrating liquids in red; (c) Application of revealing product after cleaning; (d) 2304 Duplex Stainless Steel (DSS) sample showing a good result with no penetration.
Figure 5. X-ray and penetrating liquids non-destructive testing performed on samples: (a) X-rayplates and test certificates of samples; (b) Application of penetrating liquids in red; (c) Application ofrevealing product after cleaning; (d) 2304 Duplex Stainless Steel (DSS) sample showing a good resultwith no penetration.
Following the completion of the radiographic test, a visual examination of the coupon weldingsurfaces was completed (Figure 6 shows the status of some welded specimens). The weld seam surfaceof coupon “2001 × 180-K” was unstable and irregular, with a sinusoidal weld along the entire joint.2001 × 180-F coupon ref. showed a longitudinal contraction towards the inside of the seam on thewelding side; this contraction appeared to be a kind of root concavity defect. Coupon “2001 × 180-J”was welded with a slightly lower thermal input than the coupon “2001 × 180-A”. The surface showedan irregular and sinusoidal weld. It was therefore discarded as a non-optimal weld. The seam oncoupon ref. “2001 × 180-B” showed an irregularly shaped bead at the welding face side, so thesolidification of the seam is not optimal and could be improved. On the other hand, coupons withref. “2001 × 180-H” and “2001 × 180-C” showed an excessively narrow weld seam width in the rootarea. This effect is attributed to the application of an excessively high welding speed on both coupons,and therefore, an excessively low thermal input. Table 5 summarizes radiographic results.

Metals 2020, 10, 1475 10 of 24Metals 2020, 10, x FOR PEER REVIEW 10 of 24
(a) (b) (c) (d)
(e) (f) (g) (h)
(i) (j) (k) (l)
Figure 6. Welded coupons of 2001 steel from welding face and root sides: (a) 2001 × 180-K from the welding face side (Q = 281 kJ/mm); (b) 2001 × 180-K from the welding face side (Q = 281 kJ/mm); (c) 2001 × 180-F from the welding face side (Q = 275 kJ/mm); (d) 2001 × 180-F from the welding face side (Q = 275 kJ/mm); (e) 2001 × 180-J from the welding face side (Q = 245 kJ/mm); (f) 2001 × 180-J from the welding face side (Q = 245 kJ/mm); (g) 2001 × 180-B from the welding face side (Q = 188 kJ/mm); (h)
Figure 6. Welded coupons of 2001 steel from welding face and root sides: (a) 2001 × 180-K from thewelding face side (Q = 281 kJ/mm); (b) 2001 × 180-K from the welding face side (Q = 281 kJ/mm);(c) 2001 × 180-F from the welding face side (Q = 275 kJ/mm); (d) 2001 × 180-F from the welding faceside (Q = 275 kJ/mm); (e) 2001 × 180-J from the welding face side (Q = 245 kJ/mm); (f) 2001 × 180-J fromthe welding face side (Q = 245 kJ/mm); (g) 2001 × 180-B from the welding face side (Q = 188 kJ/mm);(h) 2001 × 180-B from the welding face side (Q = 188 kJ/mm); (i) 2001 × 180-H from the welding face side(Q = 181 kJ/mm); (j) 2001 × 180-H from the welding face side (Q = 181 kJ/mm); (k) 2001 × 180-C fromthe welding face side (Q = 150 kJ/mm); (l) 2001 × 180-C from the welding face side (Q = 150 kJ/mm).

Metals 2020, 10, 1475 11 of 24
Table 5. Radiographic results and observations depending on the thermal input.
Ref. Coupon Q [kJ/mm] Radiography Test Remarks
2001 × 180-E 321 Not applicable Drilling2001 × 180-G 307 Not acceptable X-ray: Lack of internal fusion2001 × 180-K 281 OK Irregular weld seam2001 × 180-F 275 OK Longitudinal contraction per side2001 × 180-A 256 Not acceptable X-ray: Lack of internal fusion2001 × 180-J 245 OK Irregular weld seam2001 × 180-I 231 OK Weld seam without relevant indications2001 × 180-B 188 OK Weld bead that can be improved per face area2001 × 180-H 181 OK Excessively narrow weld bead per root2001 × 180-C 150 OK Excessively narrow weld bead per root2001 × 180-D 138 Not applicable Lack of root penetration
According to the results from the visual inspection, liquid penetration test and radiographic test,I coupon was defined as the optimum weld with a thermal input of 0.231 kJ/mm. Table 6 summarizesthe optimal thermal input obtained by the same procedure for different materials and parameters usedin weld process.
Table 6. Summary of welding parameters and corresponding optimized thermal input.
MATERIAL I(A)
Vmean(V)
Forward Speed(mm/s)
Q(kJ/mm)
2001 100 11.5 4.86 0.2312304 100 11 3.76 0.2932205 100 11.75 3.67 0.320
2205-S275 100 12 3.61 0.332
3.2. Ferrite Content
Prior to the microstructural analysis, a macrograph of each type of material is taken, in whichbase materials are observed, with corresponding heat affected zones (HAZ) and the weld.
Subsequently, a microstructural analysis is carried out including images of the cord, the HAZ andthe base material. At least six micrographs are obtained for each type of material at ×400 magnification.The ferrite content and the possible presence of intergranular precipitates are analyzed. Thus, two typesof micrographs are obtained:
• Micrographs of samples electrolytically etched with 40% NaOH soda: for the calculation ofthe ferrite content. These micrographs are displayed in color. Austenite is visualized in white,and ferrite in color.
• Micrographs of samples electrolytically attacked with 10% oxalic acid: for microstructuralobservation in an optical microscope (possible precipitates, intermetallic phases, etc.).These micrographs are displayed in black and white.
3.2.1. Macrographies
Figure 7 discloses the macrographies of the cross section corresponding to the four steel jointtypes belonging to 2001, 2304, 2205 and 275-2205 base materials. Each shows a correct welding zonewith minimum drop to the root and clearly showing different aspects for the welding, base materialand HAZ transition zones that indicate the presence of different phases and material inclusions.Therefore, since the welding can act as a thermal treatment evaporating the protective elements of thestainless steels disclosed at Table 1 and changing its microstructure, a micrography and microstructuralanalysis is required to ensure the welding process is not depriving the corrosion resistance of suchmaterials to marine environments full of chlorides.

Metals 2020, 10, 1475 12 of 24
Metals 2020, 10, x FOR PEER REVIEW 12 of 24
the stainless steels disclosed at Table 1 and changing its microstructure, a micrography and microstructural analysis is required to ensure the welding process is not depriving the corrosion resistance of such materials to marine environments full of chlorides.
(a) (b)
(c) (d)
Figure 7. Cross-Section welded joint macrographies: (a) 2001-2001 steel joint with ×12 Magnification; (b) 2304-2304 steel joint with ×9 Magnification; (c) 2205-2205 steel joint with ×8 Magnification; (d) 275-2205 steel joint with ×9 magnification.
3.2.2. Micrographies
As already mentioned, the micrographies have been performed on previously etched samples with 40% NaOH soda. These micrographs are displayed in color, with austenite shown in white, and ferrite is colored. Accordingly, Table 7 summarizes the ferrite content obtained for each welded coupon after applying the test, depending on the zone
Table 7. Ferrite content of each optimized coupon (%).
Reference Base Steel HAZ Welding 2001 × 180-I 53.0 68.4 73.5 2304 × 180-A 55.6 71.6 82.4 2205 × 180-D 59.8 74 86.3
2205-S275 × 180-C 60.2 72.5 47.5
Besides, Figures 8–11 show the micrographies with ×400 magnification of the four steel joint types considered in this study. As general remarks for all cases, ferrite and austenite bands can be seen in the base material, and are elongated in the direction of the sheet hot-rolling. In welding zones, an increase in the percentage of ferrite is appreciated when compared to the base material, and it can be observed
Figure 7. Cross-Section welded joint macrographies: (a) 2001-2001 steel joint with ×12 Magnification;(b) 2304-2304 steel joint with ×9 Magnification; (c) 2205-2205 steel joint with ×8 Magnification;(d) 275-2205 steel joint with ×9 magnification.
3.2.2. Micrographies
As already mentioned, the micrographies have been performed on previously etched sampleswith 40% NaOH soda. These micrographs are displayed in color, with austenite shown in white,and ferrite is colored. Accordingly, Table 7 summarizes the ferrite content obtained for each weldedcoupon after applying the test, depending on the zone.
Table 7. Ferrite content of each optimized coupon (%).
Reference Base Steel HAZ Welding
2001 × 180-I 53.0 68.4 73.52304 × 180-A 55.6 71.6 82.42205 × 180-D 59.8 74 86.3
2205-S275 × 180-C 60.2 72.5 47.5
Besides, Figures 8–11 show the micrographies with ×400 magnification of the four steel joint typesconsidered in this study. As general remarks for all cases, ferrite and austenite bands can be seen in thebase material, and are elongated in the direction of the sheet hot-rolling. In welding zones, an increasein the percentage of ferrite is appreciated when compared to the base material, and it can be observedthe presence of acicular austenite too. The same is applicable for the HAZ, in which the grains presenta greater orientation to the hot rolling direction at the area closest to the base material (left).

Metals 2020, 10, 1475 13 of 24
Metals 2020, 10, x FOR PEER REVIEW 13 of 24
the presence of acicular austenite too. The same is applicable for the HAZ, in which the grains present a greater orientation to the hot rolling direction at the area closest to the base material (left).
(a) (b)
(c)
Figure 8. 2001-2001 steel joint micrographies: (a) Base 2001 steel with ×400 magnification; (b) Welding zone with ×400 Magnification; (c) 2205 HAZ zone with ×400 magnification.
(a) (b)
(c)
Figure 9. 2304-2304 steel joint micrographies: (a) Base 2304 steel with ×400 magnification; (b) Welding zone with ×400 Magnification; (c) HAZ zone with ×400 magnification.
Figure 8. 2001-2001 steel joint micrographies: (a) Base 2001 steel with ×400 magnification; (b) Weldingzone with ×400 Magnification; (c) 2205 HAZ zone with ×400 magnification.
Metals 2020, 10, x FOR PEER REVIEW 13 of 24
the presence of acicular austenite too. The same is applicable for the HAZ, in which the grains present a greater orientation to the hot rolling direction at the area closest to the base material (left).
(a) (b)
(c)
Figure 8. 2001-2001 steel joint micrographies: (a) Base 2001 steel with ×400 magnification; (b) Welding zone with ×400 Magnification; (c) 2205 HAZ zone with ×400 magnification.
(a) (b)
(c)
Figure 9. 2304-2304 steel joint micrographies: (a) Base 2304 steel with ×400 magnification; (b) Welding zone with ×400 Magnification; (c) HAZ zone with ×400 magnification. Figure 9. 2304-2304 steel joint micrographies: (a) Base 2304 steel with ×400 magnification; (b) Weldingzone with ×400 Magnification; (c) HAZ zone with ×400 magnification.

Metals 2020, 10, 1475 14 of 24Metals 2020, 10, x FOR PEER REVIEW 14 of 24
(a) (b)
(c)
Figure 10. 2205-2205 steel joint micrographies: (a) Base 2205 steel with ×400 magnification; (b) Welding zone with ×400 Magnification; (c) HAZ zone with ×400 magnification.
Additionally, for the hybrid 275-2205 steel joint, see Figure 11, the ferrite appears in orange in the area of 2205 base material and corresponding HAZ. Nevertheless, the ferrite appears bluish in welding area. This difference in color is due to the fact that in the welding area, as no filler material has been used, there has been a dilution between the austeno-ferritic material 2205 and the carbon steel S275, and when this area is attacked with soda, the ferrite has reacted turning blue.
(a) (b)
Figure 10. 2205-2205 steel joint micrographies: (a) Base 2205 steel with ×400 magnification; (b) Weldingzone with ×400 Magnification; (c) HAZ zone with ×400 magnification.
Additionally, for the hybrid 275-2205 steel joint, see Figure 11, the ferrite appears in orange in thearea of 2205 base material and corresponding HAZ. Nevertheless, the ferrite appears bluish in weldingarea. This difference in color is due to the fact that in the welding area, as no filler material has beenused, there has been a dilution between the austeno-ferritic material 2205 and the carbon steel S275,and when this area is attacked with soda, the ferrite has reacted turning blue.
Metals 2020, 10, x FOR PEER REVIEW 14 of 24
(a) (b)
(c)
Figure 10. 2205-2205 steel joint micrographies: (a) Base 2205 steel with ×400 magnification; (b) Welding zone with ×400 Magnification; (c) HAZ zone with ×400 magnification.
Additionally, for the hybrid 275-2205 steel joint, see Figure 11, the ferrite appears in orange in the area of 2205 base material and corresponding HAZ. Nevertheless, the ferrite appears bluish in welding area. This difference in color is due to the fact that in the welding area, as no filler material has been used, there has been a dilution between the austeno-ferritic material 2205 and the carbon steel S275, and when this area is attacked with soda, the ferrite has reacted turning blue.
(a) (b)
Figure 11. Cont.
Metals 2020, 10, 1475 15 of 24Metals 2020, 10, x FOR PEER REVIEW 15 of 24
(c) (d)
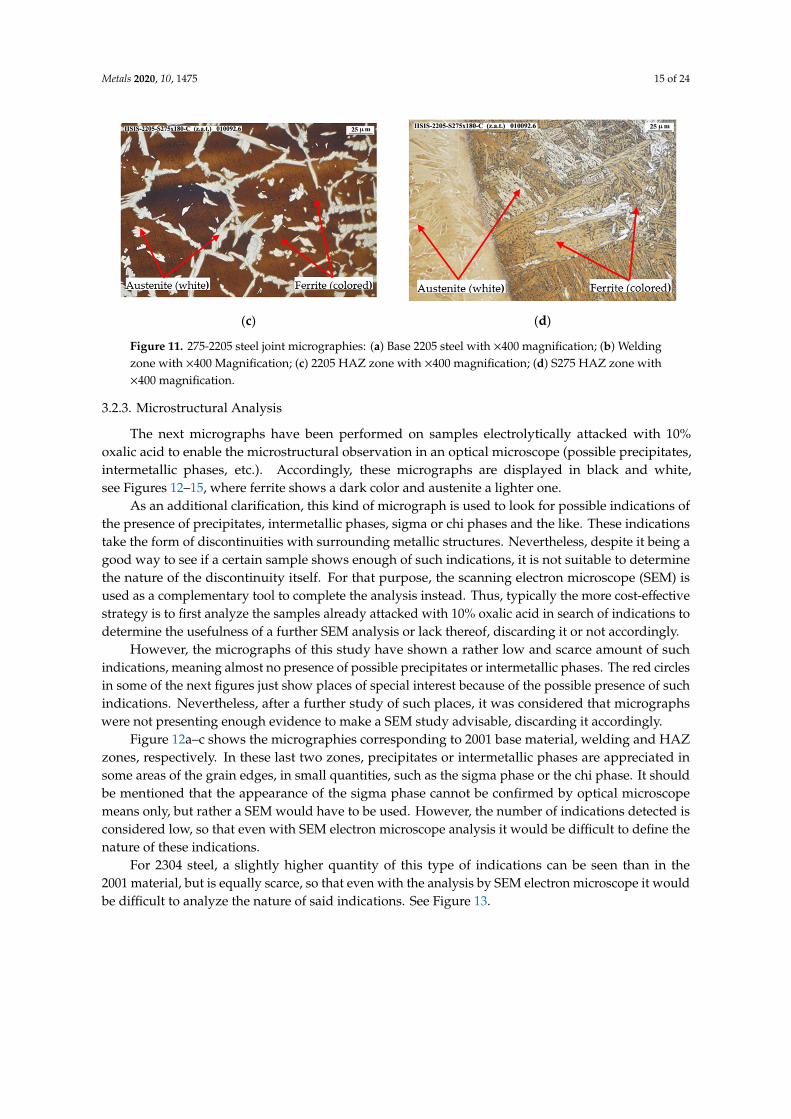
Figure 11. 275-2205 steel joint micrographies: (a) Base 2205 steel with ×400 magnification; (b) Welding zone with ×400 Magnification; (c) 2205 HAZ zone with ×400 magnification; (d) S275 HAZ zone with ×400 magnification.
3.2.3. Microstructural Analysis
The next micrographs have been performed on samples electrolytically attacked with 10% oxalic acid to enable the microstructural observation in an optical microscope (possible precipitates, intermetallic phases, etc.). Accordingly, these micrographs are displayed in black and white, see Figures 12–15, where ferrite shows a dark color and austenite a lighter one.
As an additional clarification, this kind of micrograph is used to look for possible indications of the presence of precipitates, intermetallic phases, sigma or chi phases and the like. These indications take the form of discontinuities with surrounding metallic structures. Nevertheless, despite it being a good way to see if a certain sample shows enough of such indications, it is not suitable to determine the nature of the discontinuity itself. For that purpose, the scanning electron microscope (SEM) is used as a complementary tool to complete the analysis instead. Thus, typically the more cost-effective strategy is to first analyze the samples already attacked with 10% oxalic acid in search of indications to determine the usefulness of a further SEM analysis or lack thereof, discarding it or not accordingly.
However, the micrographs of this study have shown a rather low and scarce amount of such indications, meaning almost no presence of possible precipitates or intermetallic phases. The red circles in some of the next figures just show places of special interest because of the possible presence of such indications. Nevertheless, after a further study of such places, it was considered that micrographs were not presenting enough evidence to make a SEM study advisable, discarding it accordingly.
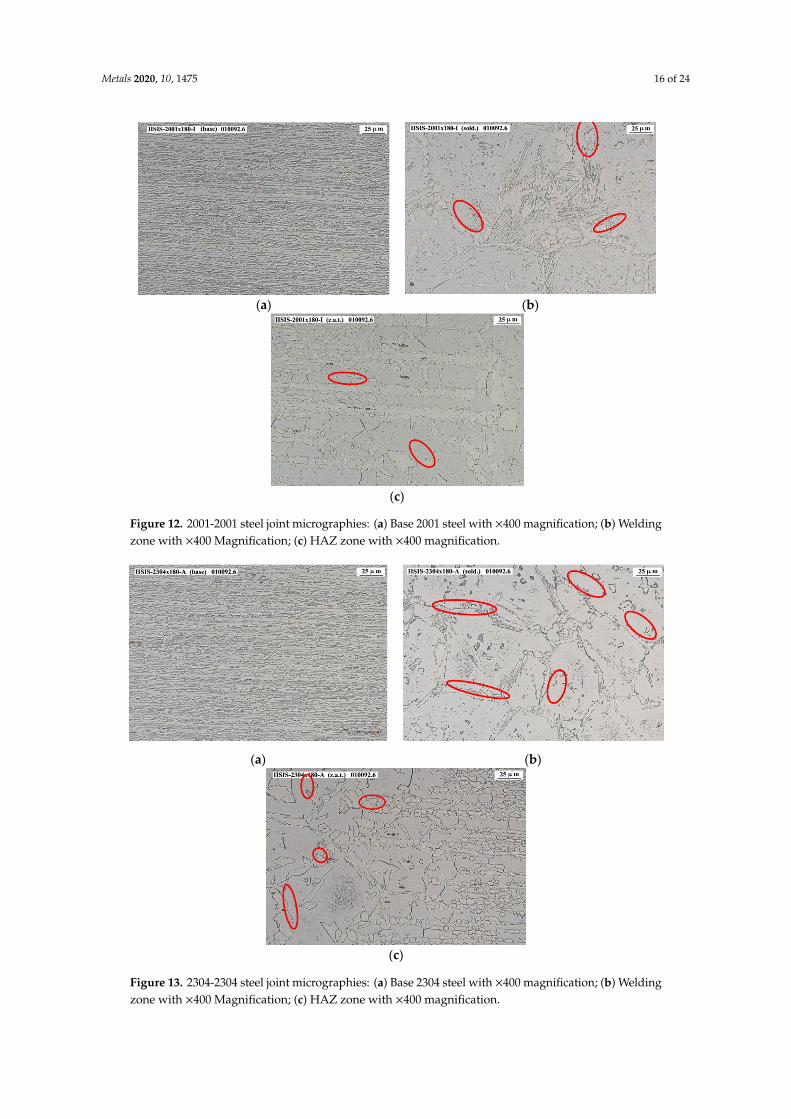
Figure 12a–c shows the micrographies corresponding to 2001 base material, welding and HAZ zones, respectively. In these last two zones, precipitates or intermetallic phases are appreciated in some areas of the grain edges, in small quantities, such as the sigma phase or the chi phase. It should be mentioned that the appearance of the sigma phase cannot be confirmed by optical microscope means only, but rather a SEM would have to be used. However, the number of indications detected is considered low, so that even with SEM electron microscope analysis it would be difficult to define the nature of these indications.
For 2304 steel, a slightly higher quantity of this type of indications can be seen than in the 2001 material, but is equally scarce, so that even with the analysis by SEM electron microscope it would be difficult to analyze the nature of said indications. See Figure 13.
Figure 11. 275-2205 steel joint micrographies: (a) Base 2205 steel with ×400 magnification; (b) Weldingzone with ×400 Magnification; (c) 2205 HAZ zone with ×400 magnification; (d) S275 HAZ zone with×400 magnification.
3.2.3. Microstructural Analysis
The next micrographs have been performed on samples electrolytically attacked with 10%oxalic acid to enable the microstructural observation in an optical microscope (possible precipitates,intermetallic phases, etc.). Accordingly, these micrographs are displayed in black and white,see Figures 12–15, where ferrite shows a dark color and austenite a lighter one.
As an additional clarification, this kind of micrograph is used to look for possible indications ofthe presence of precipitates, intermetallic phases, sigma or chi phases and the like. These indicationstake the form of discontinuities with surrounding metallic structures. Nevertheless, despite it being agood way to see if a certain sample shows enough of such indications, it is not suitable to determinethe nature of the discontinuity itself. For that purpose, the scanning electron microscope (SEM) isused as a complementary tool to complete the analysis instead. Thus, typically the more cost-effectivestrategy is to first analyze the samples already attacked with 10% oxalic acid in search of indications todetermine the usefulness of a further SEM analysis or lack thereof, discarding it or not accordingly.
However, the micrographs of this study have shown a rather low and scarce amount of suchindications, meaning almost no presence of possible precipitates or intermetallic phases. The red circlesin some of the next figures just show places of special interest because of the possible presence of suchindications. Nevertheless, after a further study of such places, it was considered that micrographswere not presenting enough evidence to make a SEM study advisable, discarding it accordingly.
Figure 12a–c shows the micrographies corresponding to 2001 base material, welding and HAZzones, respectively. In these last two zones, precipitates or intermetallic phases are appreciated insome areas of the grain edges, in small quantities, such as the sigma phase or the chi phase. It shouldbe mentioned that the appearance of the sigma phase cannot be confirmed by optical microscopemeans only, but rather a SEM would have to be used. However, the number of indications detected isconsidered low, so that even with SEM electron microscope analysis it would be difficult to define thenature of these indications.
For 2304 steel, a slightly higher quantity of this type of indications can be seen than in the2001 material, but is equally scarce, so that even with the analysis by SEM electron microscope it wouldbe difficult to analyze the nature of said indications. See Figure 13.
Metals 2020, 10, 1475 16 of 24
Metals 2020, 10, x FOR PEER REVIEW 16 of 24
(a) (b)
(c)
Figure 12. 2001-2001 steel joint micrographies: (a) Base 2001 steel with ×400 magnification; (b) Welding zone with ×400 Magnification; (c) HAZ zone with ×400 magnification.
(a) (b)
(c)
Figure 13. 2304-2304 steel joint micrographies: (a) Base 2304 steel with ×400 magnification; (b) Welding zone with ×400 Magnification; (c) HAZ zone with ×400 magnification.
For 2205 steel, a lower amount of this type of indications is seen than in materials 2001 and 2304, see Figure 14.
Figure 12. 2001-2001 steel joint micrographies: (a) Base 2001 steel with ×400 magnification; (b) Weldingzone with ×400 Magnification; (c) HAZ zone with ×400 magnification.
Metals 2020, 10, x FOR PEER REVIEW 16 of 24
(a) (b)
(c)
Figure 12. 2001-2001 steel joint micrographies: (a) Base 2001 steel with ×400 magnification; (b) Welding zone with ×400 Magnification; (c) HAZ zone with ×400 magnification.
(a) (b)
(c)
Figure 13. 2304-2304 steel joint micrographies: (a) Base 2304 steel with ×400 magnification; (b) Welding zone with ×400 Magnification; (c) HAZ zone with ×400 magnification.
For 2205 steel, a lower amount of this type of indications is seen than in materials 2001 and 2304, see Figure 14.
Figure 13. 2304-2304 steel joint micrographies: (a) Base 2304 steel with ×400 magnification; (b) Weldingzone with ×400 Magnification; (c) HAZ zone with ×400 magnification.

Metals 2020, 10, 1475 17 of 24
For 2205 steel, a lower amount of this type of indications is seen than in materials 2001 and 2304,see Figure 14.Metals 2020, 10, x FOR PEER REVIEW 17 of 24
(a) (b)
(c)
Figure 14. 2205-2205 steel joint micrographies: (a) Base 2205 steel with ×400 magnification; (b) Welding zone with ×400 Magnification; (c) HAZ zone with ×400 magnification.
Finally, a lower amount of this type of indications is appreciated in S275-2205 joint than in the materials 2001 and 2304 and a similar amount to that appreciated in the coupon of material 2205. See Figure 15.
(a) (b)
Figure 14. 2205-2205 steel joint micrographies: (a) Base 2205 steel with ×400 magnification; (b) Weldingzone with ×400 Magnification; (c) HAZ zone with ×400 magnification.
Finally, a lower amount of this type of indications is appreciated in S275-2205 joint than in thematerials 2001 and 2304 and a similar amount to that appreciated in the coupon of material 2205.See Figure 15.
Metals 2020, 10, x FOR PEER REVIEW 17 of 24
(a) (b)
(c)
Figure 14. 2205-2205 steel joint micrographies: (a) Base 2205 steel with ×400 magnification; (b) Welding zone with ×400 Magnification; (c) HAZ zone with ×400 magnification.
Finally, a lower amount of this type of indications is appreciated in S275-2205 joint than in the materials 2001 and 2304 and a similar amount to that appreciated in the coupon of material 2205. See Figure 15.
(a) (b)
Figure 15. Cont.

Metals 2020, 10, 1475 18 of 24Metals 2020, 10, x FOR PEER REVIEW 18 of 24
(c) (d)
Figure 15. 275-2205 steel joint micrographies: (a) Base 2205 steel with ×400 magnification; (a) Base 275 steel with ×400 magnification; (c) Welding zone with ×400 Magnification; (d) HAZ zone with ×400 magnification.
3.3. Salt Spray Chamber Test
During this test, the samples were exposed to a harsh environment in a climatic chamber. Thus, after 216 h of exposure to an environment with 5% sodium chloride at a pH ranging from 6.5 to 7.2, it was observed that the welded samples of DSS materials under refs. ‘2304 × 180-A’, ‘2205 × 180-D’ and ‘2001 × 180-I’ remained in perfect state, unaffected by corrosion. See Figure 16.
Conversely, the sample weld between DSS 2205 and the carbon steel, S275, under ref. ‘2205-S275 × 180-C’ showed a continuous progression of red chloride corrosion in the S275 carbon steel area. See Figure 17. According to salt-spray chamber standardized testing procedure, the corrosion stages need to be checked after 24, 48, 168 and 216 h, and the results can be summarized in next steps:
• 24 h: Red corrosion on the right side of the weld. Additionally, a red corrosion spot on the left surface.
• 48 h: No significant variations, progression of red corrosion front to the left surface. • 168 h: No significant variations, progression of red corrosion front to the left surface continues
growing. • 216 h: Spalling and mass loss due to progression of red corrosion.
Therefore, according to the results, the welding of DSS appears suitable for structural elements placed under marine environments when such welding is done with the proper thermal input. However, the welding of such DSS with carbon steel is not advisable, as it turns the carbon steel into a sacrificial anode. In view of such a result, those steels can be considered as weldable DSS steels, even though they surpass the equivalent carbon maximum content defined in current standards.
(a) (b)
Figure 15. 275-2205 steel joint micrographies: (a) Base 2205 steel with ×400 magnification; (a) Base275 steel with ×400 magnification; (c) Welding zone with ×400 Magnification; (d) HAZ zone with×400 magnification.
3.3. Salt Spray Chamber Test
During this test, the samples were exposed to a harsh environment in a climatic chamber. Thus,after 216 h of exposure to an environment with 5% sodium chloride at a pH ranging from 6.5 to 7.2,it was observed that the welded samples of DSS materials under refs. ‘2304 × 180-A’, ‘2205 × 180-D’and ‘2001 × 180-I’ remained in perfect state, unaffected by corrosion. See Figure 16.
Conversely, the sample weld between DSS 2205 and the carbon steel, S275, under ref. ‘2205-S275× 180-C’ showed a continuous progression of red chloride corrosion in the S275 carbon steel area. SeeFigure 17. According to salt-spray chamber standardized testing procedure, the corrosion stages needto be checked after 24, 48, 168 and 216 h, and the results can be summarized in next steps:
• 24 h: Red corrosion on the right side of the weld. Additionally, a red corrosion spot on theleft surface.
• 48 h: No significant variations, progression of red corrosion front to the left surface.• 168 h: No significant variations, progression of red corrosion front to the left surface
continues growing.• 216 h: Spalling and mass loss due to progression of red corrosion.
Therefore, according to the results, the welding of DSS appears suitable for structural elementsplaced under marine environments when such welding is done with the proper thermal input.However, the welding of such DSS with carbon steel is not advisable, as it turns the carbon steel intoa sacrificial anode. In view of such a result, those steels can be considered as weldable DSS steels,even though they surpass the equivalent carbon maximum content defined in current standards.
Metals 2020, 10, x FOR PEER REVIEW 18 of 24
(c) (d)
Figure 15. 275-2205 steel joint micrographies: (a) Base 2205 steel with ×400 magnification; (a) Base 275 steel with ×400 magnification; (c) Welding zone with ×400 Magnification; (d) HAZ zone with ×400 magnification.
3.3. Salt Spray Chamber Test
During this test, the samples were exposed to a harsh environment in a climatic chamber. Thus, after 216 h of exposure to an environment with 5% sodium chloride at a pH ranging from 6.5 to 7.2, it was observed that the welded samples of DSS materials under refs. ‘2304 × 180-A’, ‘2205 × 180-D’ and ‘2001 × 180-I’ remained in perfect state, unaffected by corrosion. See Figure 16.
Conversely, the sample weld between DSS 2205 and the carbon steel, S275, under ref. ‘2205-S275 × 180-C’ showed a continuous progression of red chloride corrosion in the S275 carbon steel area. See Figure 17. According to salt-spray chamber standardized testing procedure, the corrosion stages need to be checked after 24, 48, 168 and 216 h, and the results can be summarized in next steps:
• 24 h: Red corrosion on the right side of the weld. Additionally, a red corrosion spot on the left surface.
• 48 h: No significant variations, progression of red corrosion front to the left surface. • 168 h: No significant variations, progression of red corrosion front to the left surface continues
growing. • 216 h: Spalling and mass loss due to progression of red corrosion.
Therefore, according to the results, the welding of DSS appears suitable for structural elements placed under marine environments when such welding is done with the proper thermal input. However, the welding of such DSS with carbon steel is not advisable, as it turns the carbon steel into a sacrificial anode. In view of such a result, those steels can be considered as weldable DSS steels, even though they surpass the equivalent carbon maximum content defined in current standards.
(a) (b)
Figure 16. Cont.

Metals 2020, 10, 1475 19 of 24Metals 2020, 10, x FOR PEER REVIEW 19 of 24
(c)
Figure 16. DSS welded samples under simulated marine environment in salt-spray chamber test after 216 h of exposition: (a) 2304 DSS showing no significative variations; (b) 2205 DSS showing no significative variations; (c) 2001 DSS showing no significative variations.
(a) (b)
(c) (d)
Figure 17. Hybrid 2205-S275 welded sample under simulated marine environment in salt-spray chamber test: (a) After 24 h of exposition showing corrosion at S275 carbon steel; (b) After 48 h of exposition showing corrosion progression; (c) After 168 h of exposition; (d) After 216 h of exposition showing corrosion at S275 carbon steel with aggravated mass loss and small progression towards 2205 steel.
Figure 16. DSS welded samples under simulated marine environment in salt-spray chamber testafter 216 h of exposition: (a) 2304 DSS showing no significative variations; (b) 2205 DSS showing nosignificative variations; (c) 2001 DSS showing no significative variations.
Metals 2020, 10, x FOR PEER REVIEW 19 of 24
(c)
Figure 16. DSS welded samples under simulated marine environment in salt-spray chamber test after 216 h of exposition: (a) 2304 DSS showing no significative variations; (b) 2205 DSS showing no significative variations; (c) 2001 DSS showing no significative variations.
(a) (b)
(c) (d)
Figure 17. Hybrid 2205-S275 welded sample under simulated marine environment in salt-spray chamber test: (a) After 24 h of exposition showing corrosion at S275 carbon steel; (b) After 48 h of exposition showing corrosion progression; (c) After 168 h of exposition; (d) After 216 h of exposition showing corrosion at S275 carbon steel with aggravated mass loss and small progression towards 2205 steel.
Figure 17. Hybrid 2205-S275 welded sample under simulated marine environment in salt-spraychamber test: (a) After 24 h of exposition showing corrosion at S275 carbon steel; (b) After 48 h ofexposition showing corrosion progression; (c) After 168 h of exposition; (d) After 216 h of expositionshowing corrosion at S275 carbon steel with aggravated mass loss and small progression towards2205 steel.

Metals 2020, 10, 1475 20 of 24
4. Discussion
First, in view of the results disclosed in previous section, every steel joint type was able to beexecuted at a certain optimized thermal input that was found during the tests. This optimized thermalinput is the minimum input required to ensure a suitable and faultless welding seam according toNDT (visual examination, penetrating liquids and radiographic means). Nevertheless, in case of DSSneeding to resist chloride corrosion when exposed to a marine environment, there is a risk that suchwelding processes could cause a protective element loss and ferrite formation weakening the weldingand heat affected zones. The higher the thermal input, the higher the risk, so a minimum thermalinput while still enough to ensure correct welding is a key founding, but it also requires additionalverification of the ferrite formation and remaining corrosion resistance after welding.
Hence, macrographies and micrographies for microstructural analysis have been performedand the results show clearly separated zones corresponding to base metal, HAZ and welding zone,see Figure 7. Ferrite content in base steel was found to be around 53–60%, with 68–72% at HAZ and73–86% at welding zone. However, an unexpected decrease in the percentage of ferrite is observed inthe welding zone of S275-2205 hybrid steel joint in comparison with the austenitic-ferritic base material2205, up to 47.5%, due to the dilution between both base materials because of the welding withoutfiller, that turned that micrograph to blue instead, see Figure 11b.
Nevertheless, despite the unavoidable rise in ferrite percentage caused by the welding process,although mitigated by optimized thermal input, every DSS still counts on the protective elements intheir chemical composition, see Table 1, that protect it from corrosion. Thus, the true performanceof each weld needs to be tested in corrosion scenario to see how well each welded joint behaves tocorrosion. Accordingly, salt-spray chamber tests have been performed on each steel joint, findingthat every steel joint conserve their corrosion resistance with the only exception of the hybrid steeljoint S275-2205. In the case of this last joint, the early corrosion attack at the S275 steel half up tothe welding seam showed a possible sacrificial anode behavior and the key aspect of the remainingprotective elements of DSS after welding, since despite the much lower ferrite content, it showedaccelerated corrosion.
Second, adapting the Schaeffler formula [26] with the data gathered in Table 8, obtained directlyfrom DSS chemical composition already disclosed in Table 1, shows a well fitted relationship betweenthe summation of equivalent nickel Nieq and equivalent chromium Creq of each DSS steel grade withthe corresponding optimal thermal input of its welding seams. It shows a good correlation underthe initial boundary conditions, i.e., butt welding of two narrow 1.5 mm thick steel sheets with fullpenetration and neither spacing nor edge preparation. Thus, Figure 18 shows the linear regressionperformed to derive the terms of Equation (2).
Following this procedure, the optimal thermal input Q in KJ/mm of any DSS can therefore bederived from Equation (2), simply by introducing the summation of equivalent Chromium and NickelCreq + Nieq, in accordance with the Schaeffler formula.
Q = 0.0102·(Nieq + Creq
)− 0.1144 (2)
Third, the absence of macrodefects does not necessarily mean that the resulting weld strengthis good enough. For that purpose, additional strength tests are required to ensure the welding isperforming at least as good as the base materials. Besides, cyclic loadings can cause the appearanceof such macrodefects, even later unleashing corrosion fatigue problems [33,34], and even permanenttensions can cause development of stress corrosion cracking if weld bead suddenly changes geometryor accelerates corrosion fatigue deterioration [35,36].
Nevertheless, regardless of such final strength, this study is still enough to demonstrate that aproper weld design, considering this strength, should be suitable for the whole service life, since theapplied thermal input does not imply protective properties loss in the weld and HAZ zones.

Metals 2020, 10, 1475 21 of 24
Finally, as a last comment, following an analysis of the results on optimized thermal input obtainedfrom the tests of the different coupons made of the three DSS in this study, it was concluded that DSS2001 could not be welded with inputs as high as those for 2304 and 2205 steels, because the DSS 2001material began to suffer perforations more easily than the other two as the input increased. Besides,evidence showed that 2205 DSS was also able to tolerate a slightly higher input than 2304 with noperforation. See Table 6.
Table 8. Thermal input to nickel and chromium equivalent content correlation.
Steel Grade Nieq Creq Nieq + Creq Q (KJ/mm)
2001 12 22,145 34,145 2312304 134 261 395 2932205 15 28 43 32
Metals 2020, 10, x FOR PEER REVIEW 21 of 24
Figure 18. Optimum thermal input depending on equivalent Nickel and Chromium content.
Following this procedure, the optimal thermal input Q in KJ/mm of any DSS can therefore be derived from Equation (2), simply by introducing the summation of equivalent Chromium and Nickel Creq + Nieq, in accordance with the Schaeffler formula. = 0.0102 ∙ 0.1144 (2)
Third, the absence of macrodefects does not necessarily mean that the resulting weld strength is good enough. For that purpose, additional strength tests are required to ensure the welding is performing at least as good as the base materials. Besides, cyclic loadings can cause the appearance of such macrodefects, even later unleashing corrosion fatigue problems [33,34], and even permanent tensions can cause development of stress corrosion cracking if weld bead suddenly changes geometry or accelerates corrosion fatigue deterioration [35,36].
Nevertheless, regardless of such final strength, this study is still enough to demonstrate that a proper weld design, considering this strength, should be suitable for the whole service life, since the applied thermal input does not imply protective properties loss in the weld and HAZ zones.
Finally, as a last comment, following an analysis of the results on optimized thermal input obtained from the tests of the different coupons made of the three DSS in this study, it was concluded that DSS 2001 could not be welded with inputs as high as those for 2304 and 2205 steels, because the DSS 2001 material began to suffer perforations more easily than the other two as the input increased. Besides, evidence showed that 2205 DSS was also able to tolerate a slightly higher input than 2304 with no perforation. See Table 6.
5. Conclusions
1. Four types of Duplex Stainless Steel (DSS) joint samples, namely 2001 to 2001, 2304 to 2304, 2205 to 2205, and 2205 have been welded to carbon steel S275 for testing purposes. These DSS samples exceeded the maximum equivalent carbon rate for their theoretical classification as weldable steels in accordance with current structural standards [3–9], so an alternative procedure has been developed to ensure weldability.
2. Each DSS coupon sample has been welded holding certain boundary conditions constant, such as TIG welding without filler, no backing, no spacing, and no edge preparation, with automatic advance, and the same current intensity and voltage. Hence, the thermal input variation was
Figure 18. Optimum thermal input depending on equivalent Nickel and Chromium content.
5. Conclusions
1. Four types of Duplex Stainless Steel (DSS) joint samples, namely 2001 to 2001, 2304 to 2304, 2205to 2205, and 2205 have been welded to carbon steel S275 for testing purposes. These DSS samplesexceeded the maximum equivalent carbon rate for their theoretical classification as weldablesteels in accordance with current structural standards [3–9], so an alternative procedure has beendeveloped to ensure weldability.
2. Each DSS coupon sample has been welded holding certain boundary conditions constant, such asTIG welding without filler, no backing, no spacing, and no edge preparation, with automaticadvance, and the same current intensity and voltage. Hence, the thermal input variation wassimply controlled by varying only the welding speed. Several coupons of each material weretherefore prepared with different thermal inputs.
3. Every coupon of the same DSS has been studied by means of non-destructive testing (NDT),according to the standard specifications for the certification of a welding procedure. Namely,visual inspection, radiographic X-ray tests and penetrating liquid tests. Those NDT were then

Metals 2020, 10, 1475 22 of 24
used to define the lowest optimum thermal input for welding an acceptable seam. Table 4summarizes the optimum thermal input of each material.
4. Finally, to ensure remaining corrosion resistance to marine environments and chloride corrosionafter welding, each specimen has been studied by means of a macrography to separate the basematerial, welding and heat-affected zones. Then several micrographies to obtain the ferrite contentat each zone and detect indications of sigma, chi or other elements during a microstructuralanalysis, and finally a destructive accelerated corrosion test in a salt-spray chamber.
5. This study established a relationship between the heat generation during welding and the contentof alloying elements in defect-free joints. Furthermore, it found that an increase in ferrite contentdid not lead to a worse corrosion resistance, as expected after passivation.
6. A salt spray test within a climatic chamber was performed on the different types of weldedcoupons according to EN ISO 9227 [22], using the Neutral Salt Spray (NSS) test, lasting up to216 h, in order to demonstrate that the optimum thermal inputs had no effect on the corrosionresistance properties within the heat affected and welding zones. Following the application of thetest, it was observed that the welded samples of DSS material 2001, 2304 and 2205 were corrosionfree. In contrast, a continuous progression of red chloride corrosion was observed in the hybridsample of combined materials 2205-S275, on the carbon steel half of the S275 coupon.
7. The results have shown suitable welding seams and an adequate weldability of the DSS materials2001, 2304, and 2205 under the previously specified welding conditions, in terms of metalliccontinuity and corrosion behavior.
8. The hybrid welded joint of DSS steel 2205 and carbon steel S275 showed a bad performance underchloride environment as the carbon steel underwent appreciable corrosion, presumably when thejoint became a galvanic couple, acting as a sacrificial anode.
Author Contributions: Conceptualization, I.C.-U.-A.; methodology, I.C.-U.-A.; formal analysis, E.B. and H.G.;investigation, A.M.; resources, I.C.-U.-A.; data curation, H.G. and E.B.; writing—original draft preparation,H.G. and E.B.; writing—review and editing, I.C.-U.-A.; visualization, A.M.; supervision, I.C.-U.-A. and A.M.;project administration, I.C.-U.-A.; funding acquisition, I.C.-U.-A. All authors have read and agreed to the publishedversion of the manuscript.
Funding: This research was funded by ACERINOX EUROPA through Center for the Development of IndustrialTechnology (CDTI) within the frame of IISIS project, grant number IPT-20111023.
Acknowledgments: The tests presented in this manuscript were performed as part of the IISIS: “InvestigaciónIntegrada en Islas Sostenibles” (Integrated research in Sustainable Islands) research project, in receipt of fundingfrom the Center for the Development of Industrial Technology (CDTI) and the Technological Fund, part ofthe Spanish Ministry of Industry, through the INNPRONTA research program. The final goal of the project isto research different technologies for building offshore island-cities, involving construction, energy and smarttechnologies with leading companies and research centers focused on each field. In the field of construction,the challenge is to develop modular construction and special marine reinforced concrete for the constructionof islands that are capable of withstanding corrosive marine environments. In this context, most pathologieslinked to reinforced concrete in marine environments are caused by rebar deterioration within the concrete andespecially by chloride attack. The use of stainless steels is a very promising way to solve this problem, as hasbeen demonstrated in several tests, among which those presented in this paper. Besides, the authors want toacknowledge Mario Oyarbide and Adrián Gastesi in particular for their technical support during the experimentalcampaign performed on these steels. Authors would like to acknowledge UPV/EHU PPGA19/61 contract aswell as to the IT1314-19 (Basque Government) and GIU19/029 (UPV/EHU) research groups and to Laboratoiredes ciencies de l’ingenieur appliquées, Fédération IPRA-EA4581, from the Université de Pau et Pays de l’Adour,for their support setting a cooperation framework. Finally, we are also especially thankful to ACERINOX EUROPA(part of the ACERINOX Group) for funding the IISIS project, supplying the necessary rebar samples for testing,and particularly to Rafael Sanchez and Julia Contreras from Technical Dpt./Labs for their expertise and for theircommitment that greatly assisted our research.
Conflicts of Interest: The authors declare no conflict of interest.
References
1. Faccoli, M.; Roberti, R. Study of hot deformation behaviour of 2205 duplex stainless steel through hot tensiontests. J. Mater. Sci. 2013, 48, 5196–5203. [CrossRef]
Metals 2020, 10, 1475 23 of 24
2. Saliba, N.; Gardner, L. Cross-section stability of lean duplex stainless steel welded I-sections. J. Constr. SteelRes. 2013, 80, 1–14. [CrossRef]
3. CEN. Eurocode 2: Design of Concrete Structures—Part 1-1: General Rules and Rules for Buildings; Comité Européende Normalisation: Brussels, Belgium, 2004.
4. CEN. Eurocode 3: Design of Steel Structures, Part 1-1: General Rules and Rules for Buildings; Comité Européen deNormalisation: Brussels, Belgium, 2005.
5. CEN. Eurocode 3: Design of Steel Structures, Part 1-4: General Rules-Supplementary Rules for Stainless Steels;Comité Européen de Normalisation: Brussels, Belgium, 2006.
6. Espanya. Código Técnico de la Edificación: (C.T.E.); Ministerio de Vivienda: Madrid, Spain, 2006;ISBN 978-84-340-1631-6.
7. Espanya. Instrucción de Acero Estructural (EAE); Ministerio de la Presidencia: Madrid, Spain, 2011;ISBN 978-84-340-1980-5.
8. Espanya. Instrucción de Hormigon Estructural. EHE-08; Ministerio de Fomento: Madrid, Spain, 2011;ISBN 978-84-498-0899-9.
9. CEN. Eurocode 3: Design of Steel Structures, Part 1-8: Design of Joints; Comité Européen de Normalisation:Brussels, Belgium, 2005.
10. Verma, J.; Taiwade, R.V. Effect of welding processes and conditions on the microstructure, mechanicalproperties and corrosion resistance of duplex stainless steel weldments—A review. J. Manuf. Process. 2017,25, 134–152. [CrossRef]
11. Paulraj, P.; Garg, R. Effect of intermetallic phases on corrosion behavior and mechanical properties of duplexstainless steel and super-duplex stainless steel. Adv. Sci. Technol. Res. J. 2015, 9, 87–105. [CrossRef]
12. Elsaady, M.A.; Khalifa, W.; Nabil, M.A.; El-Mahallawi, I.S. Effect of prolonged temperature exposure onpitting corrosion of duplex stainless steel weld joints. Ain Shams Eng. J. 2018, 9, 1407–1415. [CrossRef]
13. Vinoth Jebaraj, A.; Ajaykumar, L.; Deepak, C.R.; Aditya, K.V.V. Weldability, machinability and surfacingof commercial duplex stainless steel AISI2205 for marine applications—A recent review. J. Adv. Res. 2017,8, 183–199. [CrossRef]
14. Kanemaru, S.; Sasaki, T.; Sato, T.; Mishima, H.; Tashiro, S.; Tanaka, M. Study for TIG–MIG hybrid weldingprocess. Weld. World 2014, 58, 11–18. [CrossRef]
15. Kumar, M.L.S.; Verma, D.S.M.; RadhakrishnaPrasad, P. Experimental Investigation for Welding Aspects ofAISI 304 & 316 by Taguchi Technique for the Process of TIG & MIG Welding. Int. J. Eng. Trends Technol. 2011,2, 28–33.
16. Mohammed, G.R.; Ishak, M.; Aqida, S.N.; Abdulhadi, H.A. Effects of Heat Input on Microstructure, Corrosionand Mechanical Characteristics of Welded Austenitic and Duplex Stainless Steels: A Review. Metals 2017,7, 39. [CrossRef]
17. M, M.A.; Shrikrishna, K.A.; Sathiya, P.; Goel, S. The impact of heat input on the strength, toughness,microhardness, microstructure and corrosion aspects of friction welded duplex stainless steel joints. J. Manuf.Process. 2015, 18, 92–106. [CrossRef]
18. Tasalloti, H.; Kah, P.; Martikainen, J. Effect of heat input on dissimilar welds of ultra high strength steel andduplex stainless steel: Microstructural and compositional analysis. Mater. Charact. 2017, 123, 29–41. [CrossRef]
19. Yang, Y.; Yan, B.; Li, J.; Wang, J. The effect of large heat input on the microstructure and corrosion behaviourof simulated heat affected zone in 2205 duplex stainless steel. Corros. Sci. 2011, 53, 3756–3763. [CrossRef]
20. Subramanian, G.; Palraj, S.; Balasubramanian, T.M. Galvanic corrosion interactions of zinc and SS.304 in thetropical marine atmosphere of Mandapam. Anti-Corros. Methods Mater. 1999, 46, 332–337. [CrossRef]
21. Paul, S.; Basu, K.; Mitra, P. A resistor-controlled sacrificial anode for cathodic protection of stainless steel inseawater. Bull. Electrochem. 2005, 21, 269–273.
22. ISO. Corrosion Tests in Artificial Atmospheres—Salt Spray Tests; International Standard Organization: Geneva,Switzerland, 2017.
23. Liu, X.; Xia, Z.; Zhou, H.; Yuan, B.; Li, Z.; Guo, F. Corrosion Behavior of Different Steel Substrates CoupledWith Conductive Polymer under Different Serving Conditions. J. Iron Steel Res. Int. 2013, 20, 87–92. [CrossRef]
24. Yousefieh, M.; Shamanian, M.; Saatchi, A. Influence of Heat Input in Pulsed Current GTAW Process onMicrostructure and Corrosion Resistance of Duplex Stainless Steel Welds. J. Iron Steel Res. Int. 2011,18, 65–69. [CrossRef]

Metals 2020, 10, 1475 24 of 24
25. Sternhell, G.; Paul, D.; Taylor, D. Itzhak galvanic effects of various metallic couples on marine biofouling in acoral reef environment. Corros. Rev. 2002, 20, 453–468. [CrossRef]
26. Schaeffler, A.L. Constitution Diagram for Stainless Steel Weld Metal. Met. Prog. 1949, 56, 680.27. ISO. Non-Destructive Testing of Welds—Visual Testing of Fusion-Welded Joints; International Standard
Organization: Geneva, Switzerland, 2016.28. CEN. Non-Destructive Examination of Fusion Welds—Visual Examination; Comité Européen de Normalisation:
Brussels, Belgium, 1997.29. CEN. Non-Destructive Testing—Penetrant Testing—Part 1: General Principles; Comité Européen de
Normalisation: Brussels, Belgium, 1997.30. CEN. Non-Destructive Examination of Welds—Radiographic Examination of Welded Joints; Comité Européen de
Normalisation: Brussels, Belgium, 1997.31. ISO. Welding—Fusion-Welded Joints in Steel, Nickel, Titanium and Their Alloys (Beam Welding Excluded)—Quality
Levels For Imperfections; International Standard Organization: Geneva, Switzerland, 2014.32. E04 Committee. Test Method for Determining Volume Fraction by Systematic Manual Point Count;
ASTM International: West Conshohocken, PA, USA, 2019.33. Calderon-Uriszar-Aldaca, I.; Briz, E.; Biezma, M.V.; Puente, I. A plain linear rule for fatigue analysis
under natural loading considering the coupled fatigue and corrosion effect. Int. J. Fatigue 2019,122, 141–151. [CrossRef]
34. Calderón-Uríszar-Aldaca, I.; Briz, E.; Matanza, A.; Martin, U.; Bastidas, D.M. Corrosion Fatigue NumericalModel for Austenitic and Lean-Duplex Stainless-Steel Rebars Exposed to Marine Environments. Metals 2020,10, 1217. [CrossRef]
35. Briz, E.; Martin, U.; Biezma, M.V.; Calderon-Uriszar-Aldaca, I.; Bastidas, D.M. Evaluation of the mechanicalbehavior of 2001 LDSS and 2205 DSS reinforcements exposed to simultaneous load and corrosion in chloridecontained concrete pore solution. J. Build. Eng. 2020, 31, 101456. [CrossRef]
36. Calderón-Uríszar-Aldaca, I.; Biezma, M.V.; Matanza, A.; Briz, E.; Bastidas, D.M. Second-order fatigue ofintrinsic mean stress under random loadings. Int. J. Fatigue 2020, 130, 105257. [CrossRef]
Publisher’s Note: MDPI stays neutral with regard to jurisdictional claims in published maps and institutionalaffiliations.
© 2020 by the authors. Licensee MDPI, Basel, Switzerland. This article is an open accessarticle distributed under the terms and conditions of the Creative Commons Attribution(CC BY) license (http://creativecommons.org/licenses/by/4.0/).