measurements and modeling of flue height influence on air ...
12
IJE Transactions B: Applications Vol. 15, No. 3, October 2002 – 273 MEASUREMENTS AND MODELING OF FLUE HEIGHT INFLUENCE ON AIR POLLUTION EMISSIONS AND THERMAL EFFICIENCY OF NATURAL-DRAUGHT GAS FIRED BOILERS M. Moghiman Department of Mechanical Engineering, Ferdowsi University of Mashhad Mashhad, Iran, [email protected] (Received: January 29, 2001 – Accepted in Revised Form: April 9, 2002) Abstract This paper presents and analyses results from experimental and CFD work undertaken on a 24 kW domestic natural-draught gas fired boiler. The effect of chimney height on boiler flue gases is being considered to address the need for increasing concern over environmental safety as well as saving of energy. A multi-component analysis computer (DELTA 2000 CD) is used to analyze the flue gases. 3D numerical simulations are performed using the CFD-code Fluent. The theoretical results of partially premixed combustion incorporating the prompt NO x model compare well with measurements. The results show that the pollutant emissions and thermal behavior of natural-draught burners are sensitive to draught produced by the chimney and there is an optimum chimney height, which corresponds to the minimum air pollution emissions. The results also show that the level of NO exits the natural-draught boiler is lower than Environmental Protection Agency (EPA) standard for gas fired boilers and small-scale boilers are environmentally cleaner than large central heating boilers. Key Words Natural Convection, Air Pollution, Chimney Effect, Domestic Boilers ﭼﻜﻴﺪﻩ ﭼﻜﻴﺪﻩ ﭼﻜﻴﺪﻩ ﭼﻜﻴﺪﻩ ﻣﺸﻌﻞ ﺑﺎ ﺳﻮﺯ ﮔﺎﺯ ﺩﻳﮓ ﻳﻚ ﺑﺮﺍﻱ ﺁﻣﺪﻩ ﺩﺳﺖ ﺑﻪ ﻣﺤﺎﺳﺒﺎﺗﻲ ﻭ ﺗﺠﺮﺑﻲ ﻧﺘﺎﻳﺞ ﻣﻘﺎﻟﻪ ﺍﻳﻦ ﺩﺭ ﺍ ﺗﻤﺴﻔﺮ ﻳﻚ ﻭ ﺗﻮﺍﻥ24 ﺍﺳﺖ ﮔﺮﻓﺘﻪ ﻗﺮﺍﺭ ﺗﺤﻠﻴﻞ ﻭ ﺗﺠﺰﻳﻪ ﻣﻮﺭﺩ ﻛﺶ ﺩﻭﺩ ﻣﺨﺘﻠﻒ ﻫﺎﻱ ﺍﻧﺪﺍﺯﻩ ﺩﺭ ﻭﺍﺕ ﻛﻴﻠﻮ. ﻣﺸﺨﺼﺎﺕ ﻭ ﻧﻮﻉ ﺑﺎ ﺩﻳﮓ ﺍﺯ ﺧﺮﻭﺟﻲ ﮔﺎﺯﻫﺎﻱ ﺍﻱ ﺭﺍﻳﺎﻧﻪ ﺩﺳﺘﮕﺎﻩ ﺍﺯ ﺍﺳﺘﻔﺎﺩﻩDELTA CD2000 ﺍﻧﺪﺍﺯﻩ ﮔﺎﺯ ﺑﻌﺪﻱ ﺳﻪ ﺟﺮﻳﺎﻥ ﻭ ﮔﻴﺮﻱ ﺍﻓﺰﺍﺭ ﻧﺮﻡ ﺍﺯ ﺍﺳﺘﻔﺎﺩﻩ ﺑﺎ ﺩﻭﺩﻛﺶ ﺩﺭ ﻭ ﺩﻳﮓ ﺩﺍﺧﻞ ﺩﺭ ﺍﺣﺘﺮﺍﻗﻲ ﻫﺎﻱFLUENT ﺍﺳﺖ ﺷﺪﻩ ﺳﺎﺯﻱ ﺷﺒﻴﻪ. ﺗﻮﻟﻴﺪNO ﻣﻜﺎﻧﻴﺰﻡ ﺍﺯ ﺍﺳﺘﻔﺎﺩﻩ ﺑﺎ ﺍﺣﺘﺮﺍﻕ ﻣﺤﻔﻈﻪ ﺩﺍﺧﻞ ﺩﺭPrompt ﺍﻧﺪﺍﺯﻩ ﻛﻤﻴﺘﻬﺎﻱ ﺑﺎ ﺗﺌﻮﺭﻱ ﻧﺘﺎﻳﺞ ﻣﻘﺎﻳﺴﻪ ﻭ ﻣﺤﺎﺳﺒﻪ ﺑﺎﺷﺪ ﻣﻲ ﺑﺨﺶ ﺭﺿﺎﻳﺖ ﺷﺪﻩ ﮔﺮﻓﺘﻪ. ﻧﺸﺎﻥ ﻧﺘﺎﻳﺞ ﺑﻪ ﻧﺴﺒﺖ ﻫﺎ ﺁﻻﻳﻨﺪﻩ ﻧﺸﺮ ﻣﻘﺪﺍﺭ ﻭ ﺣﺮﺍﺭﺗﻲ ﺑﺎﺯﺩﻩ ﻛﻪ ﺩﻫﺪ ﻣﻲ ﻣﻘﺪﺍﺭ ﻛﻤﺘﺮﻳﻦ ﻫﺎ ﺁﻻﻳﻨﺪﻩ ﻧﺸﺮ ﺁﻥ ﺩﺭ ﻛﻪ ﺩﺍﺭﺩ ﻭﺟﻮﺩ ﺩﻭﺩﻛﺶ ﺑﺮﺍﻱ ﺑﻬﻴﻨﻪ ﺍﺭﺗﻔﺎﻉ ﻳﻚ ﻭ ﺑﻮﺩﻩ ﺣﺴﺎﺱ ﺩﻭﺩﻛﺶ ﺍﺭﺗﻔﺎﻉ ﺩﺍﺭﺩ ﺭﺍ. ﻣﻘﺪﺍﺭ ﻛﻪ ﺩﻫﺪ ﻣﻲ ﻧﺸﺎﻥ ﻧﺘﺎﻳﺞ ﻫﻤﭽﻨﻴﻦNO ﺣﺪ ﺑﺎﻻﺗﺮﻳﻦ ﺍﺯ ﺍﺗﻤﺴﻔﺮﻳﻚ ﻣﺸﻌﻞ ﺑﺎ ﺩﻳﮕﻬﺎﻱ ﺩﺭ ﺷﺪﻩ ﺗﻮﻟﻴﺪ ﻣﺠﺎﺯ ﺍﺳﺘﺎﻧﺪﺍﺭﺩ ﺩﺭ ﺷﺪﻩ ﺩﺍﺩﻩEPA ﻣﺮﻛﺰﻱ ﺣﺮﺍﺭﺕ ﺩﻳﮕﻬﺎﻱ ﺑﺎ ﻣﻘﺎﻳﺴﻪ ﺩﺭ ﻭ ﺑﻮﺩﻩ ﻛﻤﺘﺮ ﺳﻮﺯ ﮔﺎﺯ ﺩﻳﮕﻬﺎﻱ ﺑﺮﺍﻱ ﺩﻫﻨﺪ ﻣﻲ ﺍﻧﺘﺸﺎﺭ ﻫﻮﺍ ﺑﻪ ﻛﻤﺘﺮﻱ ﺍﺯﺕ ﺍﻛﺴﻴﺪﻫﺎﻱ ﻣﻌﻤﻮﻟﻲ،. INTRODUCTION Natural draught gas fired burners are the most widely used source of supplying the domestic heating needs. The increasing knowledge of pollution problems and environmental impact arising from these devices is a growing field of interest for combustion system designers [1,2,3]. Small boilers with small furnace dimensions that limit combustion modification pose great challenges. To reduce the pollutant emissions, different rules concerning the gas emission output of domestically natural-draught boilers have been imposed in many countries [4]. In order to achieve a better knowledge of the combustion process in domestically burners numerical techniques have been used as a useful tool [5,6]. One of the main factors that have a significant influence on flue gas emissions of natural-draught burners is the draught produced by the height of the chimney. This affects both thermal efficiency and flue-emitted pollutants. In many buildings due to installation of
-
Upload
khangminh22 -
Category
Documents
-
view
7 -
download
0
Transcript of measurements and modeling of flue height influence on air ...

IJE Transactions B: Applications Vol. 15, No. 3, October 2002 – 273
MEASUREMENTS AND MODELING OF FLUE HEIGHT INFLUENCE ON AIR POLLUTION EMISSIONS AND
THERMAL EFFICIENCY OF NATURAL-DRAUGHT GAS FIRED BOILERS
M. Moghiman
Department of Mechanical Engineering, Ferdowsi University of Mashhad Mashhad, Iran, [email protected]
(Received: January 29, 2001 – Accepted in Revised Form: April 9, 2002)
Abstract This paper presents and analyses results from experimental and CFD work undertaken on a 24 kW domestic natural-draught gas fired boiler. The effect of chimney height on boiler flue gases is being considered to address the need for increasing concern over environmental safety as well as saving of energy. A multi-component analysis computer (DELTA 2000 CD) is used to analyze the flue gases. 3D numerical simulations are performed using the CFD-code Fluent. The theoretical results of partially premixed combustion incorporating the prompt NOx model compare well with measurements. The results show that the pollutant emissions and thermal behavior of natural-draught burners are sensitive to draught produced by the chimney and there is an optimum chimney height, which corresponds to the minimum air pollution emissions. The results also show that the level of NO exits the natural-draught boiler is lower than Environmental Protection Agency (EPA) standard for gas fired boilers and small-scale boilers are environmentally cleaner than large central heating boilers.
Key Words Natural Convection, Air Pollution, Chimney Effect, Domestic Boilers
و يكتمسفرادر اين مقاله نتايج تجربي و محاسباتي به دست آمده براي يك ديگ گاز سوز با مشعل چكيدهچكيدهچكيدهچكيده
نوع و مشخصات . كيلو وات در اندازه هاي مختلف دود كش مورد تجزيه و تحليل قرار گرفته است24توان گيري و جريان سه بعدي گاز اندازهDELTA CD2000استفاده از دستگاه رايانه اي گازهاي خروجي از ديگ با
توليد . شبيه سازي شده استFLUENT هاي احتراقي در داخل ديگ و در دودكش با استفاده از نرم افزار NO در داخل محفظه احتراق با استفاده از مكانيزمPrompt محاسبه و مقايسه نتايج تئوري با كميتهاي اندازه
مي دهد كه بازده حرارتي و مقدار نشر آالينده ها نسبت به نتايج نشان . گرفته شده رضايت بخش مي باشدارتفاع دودكش حساس بوده و يك ارتفاع بهينه براي دودكش وجود دارد كه در آن نشر آالينده ها كمترين مقدار
توليد شده در ديگهاي با مشعل اتمسفريك از باالترين حد NO همچنين نتايج نشان مي دهد كه مقدار . را داردبراي ديگهاي گاز سوز كمتر بوده و در مقايسه با ديگهاي حرارت مركزي EPA داده شده در استاندارد مجاز
.معمولي، اكسيدهاي ازت كمتري به هوا انتشار مي دهند
INTRODUCTION Natural draught gas fired burners are the most widely used source of supplying the domestic heating needs. The increasing knowledge of pollution problems and environmental impact arising from these devices is a growing field of interest for combustion system designers [1,2,3]. Small boilers with small furnace dimensions that limit combustion modification pose great challenges. To reduce the pollutant emissions,
different rules concerning the gas emission output of domestically natural-draught boilers have been imposed in many countries [4]. In order to achieve a better knowledge of the combustion process in domestically burners numerical techniques have been used as a useful tool [5,6]. One of the main factors that have a significant influence on flue gas emissions of natural-draught burners is the draught produced by the height of the chimney. This affects both thermal efficiency and flue-emitted pollutants. In many buildings due to installation of

274 - Vol. 15, No. 3, October 2002 IJE Transactions B: Applications
similar boilers in different floors, actually these boilers are connected to chimneys with different heights. Obviously, the concentration of the emitted pollutants as well as thermal behavior of the device can be affected by the height of the chimney. Little has been done to determine the influence of chimney height on flue gas compositions and pollutant emissions [7,8]. The aim of this paper is to use available experimental techniques and numerical methods in the field of domestic natural-draught burners, and derive a better understanding of the influence of chimney draught on pollutant emissions and thermal behavior of these heating devices.
EXPERIMENTAL MEASUREMENTS The measurements were carried out on a natural-draught domestic gas fired boiler (package) of 24 kW thermal power. The atmospheric burner of the
boiler was supplied natural gas at 178 mm H2O pressure. The temperature of the two inlet flows was T = 295 K. The boiler was subjected to the draught created by a steel test chimney. The internal diameter of the chimney was 10 cm with a chimney height in the range of 1 to 6 m. Measurements were carried out for 20 cm increments for each step of flue height. The boiler needed a warm up stage to get to the steady state. A multi-component analysis computer (DELTA 2000 CD) was used to analyze the flue gas. The combustion products were sampled by means of a sampling probe placed inside the flue, 15 cm from the top of the boiler. The flue gas was drawn in through the flue gas tube by means of a diaphragm pump. The transported tube leads flue gas through condensate trap with fine filter into the DELTA 2000 CD and to the electrochemical sensors. The analogue values of the sensors were analyzed by microprocessor, converted into digital signs and transmitted to PC. The NiCrNi thermocouple on the pivot of the probe measured core temperature.
Figure 1. Schematic of experimental telescopic test flue and sampling probe.

IJE Transactions B: Applications Vol. 15, No. 3, October 2002 – 275
The thermocouple output was connected to voltmeters, which displayed the temperatures directly in degrees centigrade. The chimney draft of the DELTA 2000 CD was a continuous measurement and was carried out using a strain gage sensor. DELTA 2000 CD uses the thermochemical relations to measure boiler efficiency. The experimental measurements were carried out at a test laboratory at constant temperature of 22°C. [The experimental measurements were carried out at test laboratory of Beh-Afroozan Co. (Manufacture of household package boilers). The external ambient temperature was 10°C with a relative humidity of the air 45 %. Figure 1 shows the schematic of the telescopic test flue and the sampling probe. The accuracy of the experimental measurements is as follow: Oxygen < 0.2 % absolute Carbon monoxide < 400 ppm ± 10 ppm > 400 ppm ± 5 % of measured value Nitrogen monoxide < 100 ppm ±5 ppm >100 ppm ± 5 % of measured value Temperature ± 1 %
MODEL EQUATIONS Partially premixed laminar methane-air flame computations combined with buoyant flow calculations have been made with the CFD-code Fluent [9]. The modeling of buoyant flow that is driven by buoyant forces requires additional modeling effort [9,10]. The momentum equation in the direction of gravity includes the body force resulting from buoyancy:
( ) ( ) ( )y
pggradvdivvudiv
∂∂−−−= 0ρρµρ v
(1)
Where – g(ρ-ρ0) is the buoyancy term and ρ0 is a reference density. The density of mixtures of air, fuel and combustion products, ρ, is computed using the incompressible ideal gas law for mixtures [9]:
∑=
α α
αρ
M
YRT
Pop (2)
Where R is the universal gas constant, T is the temperature, Pop is the operating pressure, and Yα and Mα are the mass fraction and molecular weight of species α respectively. Combustion Modeling The modeling of reacting flows requires definition of many reactions and kinetic models. Models that consider many intermediate reactions require a vast amount of computing resources, so in this study two-step model that incorporates two reactions has been used. 2CH4 + 3(O2 + 3.76 N2)→2CO + 2H2O + 11.28 N2
(Reaction 1) 2 CO + O2 → 2 CO2 (Reaction 2) The reaction rate is calculated from the Arrhenius rate expression. The parameters of reactions are as follow: Reaction 1: Volumetric reaction
Arrhenius Preexponential factor: A = 1×10¹³
Activation Energy: E = 1×10⁸ Jkg-1mol-1 Rate exponent for CH4: 1 Rate exponent for O2: 1 Temperature rate exponent: 0
Reaction 2: Volumetric reaction
Arrhenius Preexponential factor: A = 1×10¹³
Activation Energy: E = 1×10⁸ Jkg-1mol-1 Rate exponent for CO and O2: 1 Temperature rate exponent: 0
In addition to all the flow equations, the transport equations for the mass fraction Yα of each species α must be solved. Chemical energy is released as heat during combustion and the resulting enthalpy is obtained by solving its transport equation. The balance equations for species and enthalpy may be written as:

276 - Vol. 15, No. 3, October 2002 IJE Transactions B: Applications
αααρ S
x
j
x
Yu
i
i
ii +
∂∂
=∂∂
(3)
Riip
n
i
ipiii
qjx
Y
ch
x
x
h
cxx
hu
+
+
∂∂
∂∂−
=
∂∂
∂∂−
∂∂
∑=
αα
αα
λ
λρ
1
(4)
Where jαi is the diffusion flux of species α which arises due to concentration gradients, λ is the thermal conductivity, cp is the mean specific heat at constant pressure, ui is the component of flow velocity vector, Sα is the volumetric rate of generation or destruction of species α, hα is the enthalpy of species α and qR is the radiative heat flux. An equation of the form equation (3) is solved for N–1 species where N is the total number of chemical species defined by combustion model. Transported properties are simplified by neglecting the Dufour and Soret effect and by replacing multicomponent diffusion by Fick’s law with a single diffusion coefficient: jαi = -ρ D (∂Yα /∂xi) , ρD ≡ λ / cp , i.e. Le =1 (5) Where D is the diffusion coefficient and Le is the Lewis number λ /(ρcpD). The reaction rates that appear as source terms in Equation 3 are computed by Arrhenius rate expressions [9].
Radiation Modeling The radiation contribution to the enthalpy equation is evaluated by a discrete transfer radiation model (DTRM) [11]. In this model the change of radiant intensity, I, along a path ds is expressed as:
πσ 4Ta
Iads
dI =+ (6)
Where a is the gas absorption coefficient which was equated to true gas absorption coefficient [12], T is the gas local temperature, σ is the Stefan-Boltzman constant (5.672×10⁻² W/m2K4)). The DTRM integrates equation (6) along a series of rays emanating from a single point in each discrete control volume on a surface. These rays cover the
hemispherical solid angle about that point. If a is a constant along the ray, then the integrated radiant intensity becomes as given below,
( ) ( )[ ] ( )asIasT
sI o −+−−= expexp14
πσ
(7)
Where Io is the radiant intensity at the start of the incremental path ds. The enthalpy source in the fluid due to radiation is calculated by summing the change in intensity along the path of each ray that is traced through the fluid control volume. In the Fluent radiation model, radiation is assumed to be gray radiation that means there is no dependence on wavelengths in radiation and all surfaces are in the model. Thus the predicted radiant intensity from the equation above is equivalent to an integrated intensity across all wavelengths. Therefore the Fluent radiation model can be called a gray-diffuse radiation model [9]. Although most of the gases present in combustion systems such as carbon dioxide and water vapor are strong absorbers and emitters, they do not scatter radiation significantly [13]. The scattering coefficient is found to have a negligible effect (i.e. increasing the coefficient from 1×10⁻⁸ to 1×10⁻³, decreased the temperature level by only 4° C for a near stoichiometric mixture ratio). A variable absorption coefficient is enabled due to the importance of composition dependence of the radiation absorption in combustion systems with water vapor and carbon dioxide contributing to the absorption and emission in the flame (calculated absorption coefficients are in the range of 0.55 to 0.85). Radiation properties are enabled to be computed by the program. Wall emissivity is set to 0.6 (typical value for gas combustion). Emissivity coefficients at flow inlets and exit are taken to be 1.0 (black body absorption).
NOx Modeling The NOx produced in flames is due to three phenomena: thermal NOx (oxidation of atmospheric nitrogen), the prompt NOx (high speed reactions at the flame front) and fuel NOx (oxidation of the nitrogen present in the fuel). However natural gas is free of nitrogen-type compounds chemically bound with the fuel molecule [14] and the rate of formation of thermal NO is significant only at high temperatures (T >1800 K) [15].

IJE Transactions B: Applications Vol. 15, No. 3, October 2002 – 277
The prompt NOx mechanism that first was reported by Fenimore [16] is especially important in low temperature gas flames, fuel rich combustions and with short time of residence. Fenimore measured [NO] above a hydrocarbon flat flame and noted that the [NO] did not approach zero as the probe approached the flame from the downstream side, as Zeldovich mechanism predicts [13]. The additional mechanism that is promptly producing NO at the flame front is more complicated than thermal NO [17]. This [NOx] production mechanism obeys to the next reactions: CH + N2 ⇔ HCN + N (8)
N + O2 ⇔ NO + O (9)
HCN + OH ⇔ CN + H2O (10)
CN + O2 ⇔ NO + CO (11)
From Reactions 8 to 11, it can be calculated that the production of prompt NOx formation within the flame requires coupling of the NOx kinetics to an actual hydrocarbon combustion mechanism. In the present NOx model, a global kinetic parameter derived by De Soete [18] is used:
[ ]
[ ][ ] [ ]
−
=
RT
ECHONkf
dt
NOd
aapr
pr
exp422
(12)
Where a is the oxygen reaction order, R is the universal gas constant and f is a correction factor which incorporates the effect of fuel type and equivalence ratio for gaseous aliphatic hydrocarbons,
32 2.12322.230819.075.4 φφφ −+−+= nf (13)
n is the number of carbon atoms per molecule for the fuel, and φ is the equivalence ratio. Values of kpr and Ea are selected in accordance with reference [19]. The mass transport equation is solved for the NO calculation, taking into account convection, production and consumption of NO:
NOpri
NO
ii
NOi S
x
YD
xx
Yu ,+
∂
∂∂∂=
∂∂
ρρ (14)
The NO source term due to prompt NOx mechanism is
[ ]dt
NOdMS pr
NONOpr =, (15)
Where MNO is the molecular weight of NO, and d[NO]pr /dt is computed from equation (14).
SOLUTION ALGORITHM AND BOUNDARY CONDITIONS
The code resolves the coupled 3D set of non-linear partial differential equations of continuity, momentum, energy and species discretized on an orthogonal unstructured mesh. The discretization is made using the finite volume method. The convective terms are discretized by the second-order upwind scheme. The pressure field is found by the SIMPLE algorithm, which stands for Semi-Implicit Method for Pressure-Linked Equations. The procedure has been described in Versteeg and Malalaseke [10]. In SIMPLE, the operations are started with a guessed pressure field, and the continuity equation is turned into an equation for the pressure correction. In this algorithm the problem of appearing unrealistic velocity and pressure fields is solved using displaced or staggered grid for the velocity components. The set of algebraic equations is solved sequentially with line-by-line tridiagonal matrix algorithm. The solution is regarded as converged when the maximum value of the normalized residuals of any equation is less than 5×10⁻⁵. Sever under-relaxation is required to secure convergence of iteration procedure. The range of the under relaxation factor is 0.1–0.3 for velocity, pressure, density, enthalpy and chemical species. All calculations presented here are carried out with a 35×35×56 cell grid. Comparing results based on three different spatial grids assessed grid dependence. It was revealed that the field quantities vary less than 1% after the grid size was increased beyond 35×35×56. Due to buoyancy-driven air flux, pressure inlet boundary conditions were used to define the air pressure at airflow inlet. At the outlet boundary zero gradient conditions were applied. No slip boundary conditions were used at the solid walls.

278 - Vol. 15, No. 3, October 2002 IJE Transactions B: Applications
A fixed temperature condition was applied at the wall of the boiler. For radiation model, emissivity coefficients at flow inlets and exit were taken to be 1.0 (black body absorption). Wall emissivity was set to 0.6 (typical value for gas combustion). The power law viscosity law was used to calculate the viscosity [9]:
n
T
T
=
00µµ
Where µ is the viscosity in kg/m-s, T is the static temperature in K, T0 is the reference temperature (=298 K), µ0 is the reference value (=1.85×10⁻⁵ kg/m-s) and for air moderate temperature and pressure, n = 2/3. To reduce the CPU time it is easier to start first with a constant value and then to make it temperature dependent. The chosen value for the mixture was a constant µ of 4×10⁻⁵ kg/m-s. The other required inputs necessary to define the physical properties were as follow:
Thermal Conductivity: λ = 2.5 × 10⁻⁵ Wm-1K-1 Specific Heat Capacity: Cp = 1.1×10³ Jkg-1K-1
RESULTS To inves t i ga t e t he ch imney e f f ec t both experimental as well as theoretical studies have been carried out for flue height in the range of 1.2 to 6 m. The experimental measurements have been carried out for 20 cm increments for each step of flue height. Figure 2 displays the measured variations of flue gas temperature and thermal efficiency of the boiler as a function of flue height. The figure shows that, when flue height increases from 1.2 m to about 5 m the flue gas temperature rises and the thermal efficiency decreases. This occurs because an increase in flue height enhances natural convection in the chimney and leads to a higher gas velocity in the combustion system that reduces the hot gas residence time in the boiler. This induces an increase in flue gas temperature and a decrease in thermal efficiency of the boiler. The figure shows that if the chimney height exceeds from about 5 m, flue gas temperature decreases and boiler efficiency increases. This is due to higher heat transfer and friction loss in the chimney region that reduces the natural convection in relatively tall flues.
Figure 2. Effect of chimney height on measured flue gas temperature and boiler efficiency.

IJE Transactions B: Applications Vol. 15, No. 3, October 2002 – 279
Figure 3 shows the effect of flue height on measured NO and CO pollutant emissions exhausted from the boiler. NO exits the boiler ranging from 56 to 74 ppm that is lower than EPA standard for gas fired boilers [15]. The figure shows that NO and CO levels decrease initially with flue height increase. The minimum levels of NO and CO observed at the point where the flue
gas temperature has its maxima (see Figure2). This is because of high natural convection that increases the concentration of O2 and decreases the residence time of hot gases in the boiler. For flue heights higher than 5 m an increase in flue height increases the residence time of hot gases in the boiler and consequently increases the NO production. As expected, the pre-mixed combustion measurements
Figure 3 Effect of flue height on measured NO and CO boiler output.
Figure 4. Effect of flue height on measured O2 and CO2 boiler output.
280 - Vol. 15, No. 3, October 2002 IJE Transactions B: Applications
reveal that NO concentrations are higher than the CO concentrations. The figure indicates that over a relatively wide range of flue height (3.5 to 5.5 m) the emissions of both NO and CO from the boiler are sufficiently low. What is significant about these results is that the maximum NO and CO mass fractions are obtained for low flue heights (low natural convections). Figure 4 presents the effect of flue height on measured O2 and CO2 mass fraction emissions exit the boiler. It can be seen that for flue heights less than about 5 m an increase in chimney height increases mass fraction of oxygen whilst decreases mass fraction of carbon dioxide. In fact, although an increase in chimney draught increases mass fractions of both O2 and CO2 but due to dilution by entrainment air the mass fraction of CO2 decreases. The figure shows that the highest CO2 mass fraction occurs for lowest O2 mass fraction and vice-versa. As mentioned before, for flue heights
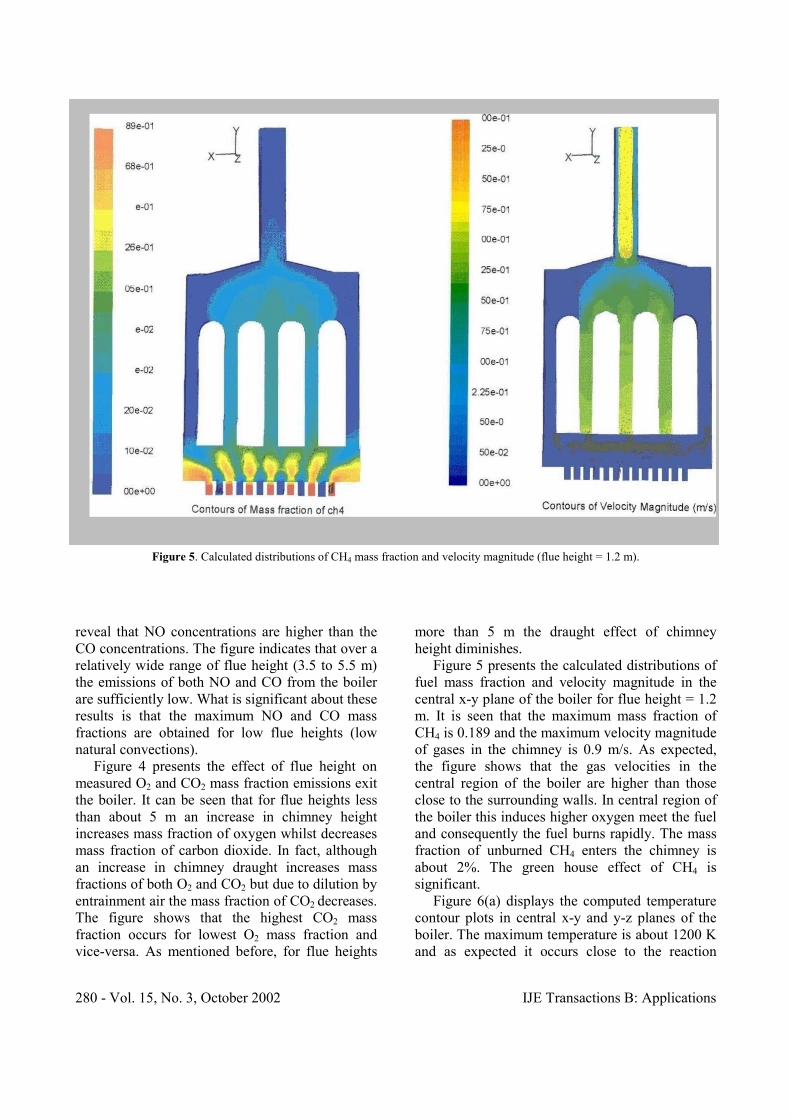
more than 5 m the draught effect of chimney height diminishes. Figure 5 presents the calculated distributions of fuel mass fraction and velocity magnitude in the central x-y plane of the boiler for flue height = 1.2 m. It is seen that the maximum mass fraction of CH4 is 0.189 and the maximum velocity magnitude of gases in the chimney is 0.9 m/s. As expected, the figure shows that the gas velocities in the central region of the boiler are higher than those close to the surrounding walls. In central region of the boiler this induces higher oxygen meet the fuel and consequently the fuel burns rapidly. The mass fraction of unburned CH4 enters the chimney is about 2%. The green house effect of CH4 is significant. Figure 6(a) displays the computed temperature contour plots in central x-y and y-z planes of the boiler. The maximum temperature is about 1200 K and as expected it occurs close to the reaction
Figure 5. Calculated distributions of CH4 mass fraction and velocity magnitude (flue height = 1.2 m).

IJE Transactions B: Applications Vol. 15, No. 3, October 2002 – 281
zone. Since the premixed fuel-air mixture is injected uniformly through flame ports of burner bars, a relatively flat flame is formed in the combustion zone. The temperature of the gas enters the chimney is about 550 K which is in accord with experimental measurements. The comparison between Figure 2 and Figure 6(a) shows that the numerical predictions of the flue temperature are in good agreement with the experimental measurements. Clearly, due to low levels of temperatures in the boiler furnace (<1800 K) the rate of formation of thermal NO must be negligible. Figure 6(b) shows the computed contour plots of CH4 mass fraction in central y-z plane. Methane disappears well in the central region of the combustion chamber. The figure shows that in the vicinity of surrounding walls the fuel is not burned
completely. The unburned fuel is emitted to the atmosphere as a pollutant. In order to check the accuracy of the CFD modeling, comparisons were performed between the theoretical computations and experimental measurements. The calculations were carried out for flue heights 1.2, 3, 4, 5 and 6 m. Figure 7 compares the measured and computed flue gas temperatures exited the boiler. It is seen that the theory predicts correctly the overall profile of the temperature, the maximum disagreement being less than 2 percent. This discrepancy can be attributed to the assumptions of the combustion model, in particular, the assumption of limited number of flame reactions. Both methods give maxima in flue gas temperature at flue height ≈5 m. Figure 8 presents the comparison between the calculated levels of NO and CO with
(a) (b)
Figure 6. (a) Computed temperature contour plots in central y-x and y-z planes (K) and (b) Computed contours of CH4 mass fraction in central y-z plane [%].

282 - Vol. 15, No. 3, October 2002 IJE Transactions B: Applications
measurements. The general trends of predicted results are in good agreement with experimental results. It is seen that the prompt NO model predicts NO concentration lower (4 –5 %) than the experimental measurements. This discrepancy can be attributed to predicted flue gas temperatures in Figure 7, where calculated temperatures show that hot gases leave the boiler rapidly. CO profiles for both experimental and numerical results are qualitatively very similar. The slight differences coincide with the detailed elementary chemical reactions of combustion model. Clearly a more sophisticated combustion model that considers the
effect of hydroxyl on oxidation of CH4 and CO can improve the predicted results. In Figure 9, the calculated mass fractions of O2 and CO2 exhausted the boiler are compared with measurements. Theoretical predictions of oxygen and carbon dioxide mass fractions closely match the experimental results. As mentioned before, although an increase in O2 mass fraction increases net mass of CO2 but due to dilution by entrainment of air the mass fraction of CO2 decreases. The best agreement is obtained for flue height = 1.2 m where the lowest chimney draught is produced. The comparison between Figures 4 and 9 appears
240
250
260
270
280
290
0 1 2 3 4 5 6 7
Flue Height (m )
Temperature C
Measured
Predicted
Figure 7. Comparison of predicted and measured temperature.
0
20
40
60
80
100
120
140
0 1 2 3 4 5 6 7
Flue Height (m )
ppm
NO (Measured)
NO (Predicted)
CO Measured)
CO (Predicted)
Figure 8. Comparison of predicted and measured NO and CO boiler output.

IJE Transactions B: Applications Vol. 15, No. 3, October 2002 – 283
again that the numerical predictions are in good agreement with experimental data.
CONCLUSIONS This paper is focused on the sensitivity of pollutants emitted from stack gases of natural-draught boilers. A 24 kW gas fired boiler has been studied. Both experimental as well as theoretical studies have been carried out in a combustion zone in which buoyancy effects are significant. The prompt NOx model is used to predict NOx formation and numerical results show reasonable accuracy. The comparison between experimental measurements and the theoretical predictions shows good capability of the numerical technique. The temperature and the main pollutant concentrations NO and CO are well predicted. Both measurements and computations show the sensitivity of thermal efficiency and air pollution emissions to natural-convection structure and buoyancy produced by the chimney height. The results show some practical recommendations concerning the installation of domestic boilers in order to reduce pollutant emissions. The results also reveal that small-scale boilers are environmentally cleaner than conventional large central heating boilers.
ACKNOWLEDGEMENTS The author would like to thank Ferdowsi University and Beh-Afroozan Co. (Manufacture of household package boilers), Mashhad, Iran, for their support of experimental measurements.
REFERENCES
1. Taki, Y., Babus’Hay, R. F. and Probert, S. D., “Combined Heat and Power as a Contributory Means of Maintaining a Green Environment”, Applied Energy, Vol. 39, No. 2, (1991), 83-91.
2. Jones, C., “NOx Emissions Control: Small Boilers Pose Great Challenges”, Power, Vol. 138, No. 12, (1994), 67-78.
3. Chang, S. G. and Lee, G. C., “LBL PhoSNOX Process for Combined Removal of SOx and NOx from Flue Gas”, Environmental Progress, Vol. 11, No. 1, (1992), 66-73.
4. European Standard EN 297 for Gas-Fired Central Heating Boilers (Packages), Vol. 1, (1994), 41-52.
5. Katta, V. R. and Roquenore, W. M., “Simulation of Dynamic Methane Jet Diffusion Flames Using Finite Rate Chemistry Models”, AIAA Journal, 36, (11), (1998), 2044-2054.
6. Gavrilov, E. I., “Operational Conditions of Chimneys”, Thermal Engineering, Vol. 31, No. 4, (1984), 215-219.
7. Gicquel, O., Brenez, L. and Quilichini, S., “Using Numerical Simulations to Predict Partially-Premixed Laminar Flames in a Domestic Burner”, 5th European Conference on Industrial Furnaces and Boilers, Porto-
3
4
5
6
7
8
9
10
0 1 2 3 4 5 6 7
Flue Height (m )
Mass fraction (%)
O2 (Measured)
O2 (Predicted)
CO2 (Measured)
CO2 (Predicted)
Figure 9. Comparison of predicted and measured O2 and CO2 boiler output.

284 - Vol. 15, No. 3, October 2002 IJE Transactions B: Applications
Portugal, (2000), 721-730. 8. Fisher, T. S. and Torrance, K. E., “Experiments on
Chimney-Enhanced Free Convection”, Journal of Heat Transfer, Transactions ASME, Vol. 121, No. 3, (1999), 603-609.
9. Fluent 5, Fluent Incorporated, Lebanon, NH, (1998). 10. Verst eeg, H. K. and Malal aseke, W. , “An
Introduction to Computational Fluid Dynamics-The Finite Volume Method”, Longman Scientific and Technical, (1996).
11. Carvalho, M. G., Farias, T. and Fontes, P., “Predicting Radiative Heat Transfer in Absorbing, Emitting, and Scattering Media Using the Discrete Transfer Method”, In W. A. Fiveland et al., Editor, Fundamentals of Radiation Heat Transfer, Vol. 160, ASME HTD, (1991), 17-26.
12. Gosman, A. D. and Lockwood, F. C., “Incorporation of a Flux Model for Radiation into a Finite-Difference Procedure for Furnace Calculations”, 14th Symposium
(International) on Combustion, (1973), 661-671. 13. Ilbas, M., “Studies of Ultra Low NOx Burners”, PhD
Thesis, University of Wales, U. K., (1997). 14. Wark, K. and Warner, C. F., “Air Pollution, Its Origin
and Control”, A IEP A Din-Ennelly Publisher, Newyork, (1976).
15. Lawn, C. (Edi tor ) , “P r incip les o f Co mbust ion Engineering for Boilers”, Academic Press, (1987).
16. Fenimore, C. P., “Formation of Nitric Oxide in Premixed Hydrocarbon Flames”, 13th Symp. (Int’l) on Combustion, The Combustion Institute, (1971), 373.
17. Warnatz J., Maas, U. and Dibble, R. W., “Combustion”, Springer, 3th Edition, (2001).
18. De Soete, G. G., “Overall Reaction Rates of NO and N2 Formation from Fuel Nitrogen”, In 15th Symp. (Int’l) on Combustion, The Combustion Institute, (1975), 1093.
19. Dupont, V., Porkashanian, M., Williams. A., and Woolley, R., “Reduction of NOx Formation in a Tural Gas Burner Flames”, Fuel, Vol. 72, No. 4, (1993), 497-503.