SURFACE MORPHOLOGY OF MULTICOMPONENT WATERBORNE PRESSURE SENSITIVE ADHESIVE COATINGS
16
SURFACE MORPHOLOGY OF MULTI-COMPONENT WATERBORNE PRESSURE SENSITIVE ADHESIVE COATINGS ~a John Ouyang , Simon Gibbon b, Jeff McVey a, Rama Chandran a (a) National Starch and Chemical, Bridgewater, NJ 08807 (b) ICI Strategic Technology Group, Wilton Centre, TS 10 4RF, UK Abstract This paper describes the surface morphology of the latex films formed from mixtures of acrylic and tackifier emulsions. The mixtures of the two components at various ratios were spin-coated for atomic force microscopy and scanning electron microscopy imaging studies. The surface morphology of the films was characterized using atomic force microscopy under various conditions. The composition and temperature were Varied to change the surface structure. The adhesion performance of the films cast from the mixtures was also evaluated. o Introduction Waterborne technologies have been widely employed in the pressure sensitive adhesives industry for many years as a result of increasingly stringent legislation concerning solvent emission from solvent borne adhesives. The interest in waterborne pressure sensitive adhesives continues to grow substantially. • Aqueous dispersions of adhesive base polymers are required to obtain the adhesion performance and other performance characteristics such as humidity and chemical resistance. Emulsion polymers are a particularly convenient form for formulation into waterborne products. The pressure sensitive adhesive properties of the emulsion polymers can be further improved or modified by formulating the emulsions with various additives. The most common blending partner is a tackifier when an improved peel adhesion is required. 1 In order to obtain an optimum adhesion performance, it is important to understand the adhesive structure and coating surface morphology. 2 Most conventional techniques characterize the bulk behavior of the adhesive distant from surface 3-4 In the last few decades, more and more attention has been paid to the study of surface structure and properties as we have realized the importance of surface properties in practical applications. 56 The use of Atomic Force Microscope (AFM) allows for detailed mapping of adhesive coating surface morphology.79 In this paper, we have carefully examined adhesive coatings cast from mixtures of two pressure sensitive adhesive components using AFM and SEM. The surface AFM images are obtained from coatings of various compositions. The surface roughness of the coatings is analyzed. The objective of the study is to examine the morphology of films cast from the blended acrylic emulsion and tackifier under various conditions including aging at different temperatures for various times. It is not intended to be a definitive study of the film formation mechanism for the acrylic base/tackifier blends, rather to be a fact-finding exercise that may help waterborne PSA product development. 55
-
Upload
balabtechit -
Category
Documents
-
view
0 -
download
0
Transcript of SURFACE MORPHOLOGY OF MULTICOMPONENT WATERBORNE PRESSURE SENSITIVE ADHESIVE COATINGS

S U R F A C E M O R P H O L O G Y O F M U L T I - C O M P O N E N T W A T E R B O R N E P R E S S U R E S E N S I T I V E A D H E S I V E C O A T I N G S
~a John Ouyang , Simon Gibbon b, Jeff McVey a, Rama Chandran a
(a) National Starch and Chemical, Bridgewater, NJ 08807 (b) ICI Strategic Technology Group, Wilton Centre, TS 10 4RF, UK
Abstract This paper describes the surface morphology of the latex films formed from mixtures of acrylic
and tackifier emulsions. The mixtures of the two components at various ratios were spin-coated for atomic force microscopy and scanning electron microscopy imaging studies. The surface morphology of the films was characterized using atomic force microscopy under various conditions. The composition and temperature were Varied to change the surface structure. The adhesion performance of the films cast from the mixtures was also evaluated.
o
Introduction Waterborne technologies have been widely employed in the pressure sensitive adhesives industry
for many years as a result of increasingly stringent legislation concerning solvent emission from solvent borne adhesives. The interest in waterborne pressure sensitive adhesives continues to grow substantially.
• Aqueous dispersions of adhesive base polymers are required to obtain the adhesion performance and other performance characteristics such as humidity and chemical resistance. Emulsion polymers are a particularly convenient form for formulation into waterborne products. The pressure sensitive adhesive properties of the emulsion polymers can be further improved or modified by formulating the emulsions with various additives. The most common blending partner is a tackifier when an improved peel adhesion is required. 1
In order to obtain an optimum adhesion performance, it is important to understand the adhesive structure and coating surface morphology. 2 Most conventional techniques characterize the bulk behavior of the adhesive distant from surface 3-4 In the last few decades, more and more attention has been paid to the study of surface structure and properties as we have realized the importance of surface properties in practical applications. 56 The use of Atomic Force Microscope (AFM) allows for detailed mapping of adhesive coating surface morphology.79 In this paper, we have carefully examined adhesive coatings cast from mixtures of two pressure sensitive adhesive components using AFM and SEM. The surface AFM images are obtained from coatings of various compositions. The surface roughness of the coatings is analyzed. The objective of the study is to examine the morphology of films cast from the blended acrylic emulsion and tackifier under various conditions including aging at different temperatures for various times. It is not intended to be a definitive study of the film formation mechanism for the acrylic base/tackifier blends, rather to be a fact-finding exercise that may help waterborne PSA product development.
55

Exper imenta l
Materials An acrylic based pressure sensitive adhesive latex resin with a low Tg and a rosin ester tackifier
emulsion were used in all adhesion evaluation and imaging studies. The acrylic latex was Nacor 78- 6650 that was manufactured by National Starch and Chemical. The rosin ester tackifier emulsion was available commercially from Arizona Chemical under the trade name Aquatac 6085. Both commercial products were used without further processing. The physical properties of both materials are summarized in Table 1.
Table 1. Physical Pro
Material Function
Nacor 78-6650 PSA base Aquatac 6085 Tackifier
~erties of Nacor 78-6650 and Aquatac 6085
Solid Level (%) 50 6O
Viscosity (cps)
50 4000
.
Mean Particle Size
0.21 l.tm 1.58 ~m
411
The particle size distributions are shown in Figure 1. Nacor 78-6650 (Figure 1A) has a normal particle size distribution with mean particle size of 0.21 ~tm. A single mode in the particle size distribution was observed. Aquatac 6085 (Figure 1B) has a much larger particle size and broader particle size distribution with a peak at 1.58 l.tm. A broad shoulder was evident between 2 and 3 l.tm. Therefore, a stable mixture of Nacor 78-6650 and Aquatac 6085 consists of basically two types of spherical particles: one at 0.21 ~tm, and another of much bigger size at 1.58 ~m. In a formulated sample, these particles of different sizes can be well mixed and evenly distributed. Once the sample is coated onto a substrate, however, the distribution of the particles of different sizes in the coating could be non- uniform. The surface morphology of the coating can undergo dramatic change during the drying process. Aging could result in segregation. The changes in the coating uniformity and surface morphology can ultimately impact the adhesion performance of the coating.
0.4
=30
~2o
0 0.1 02. 0.3
Particle Size (microns) 2 4 6
Particle Size (microns)
16
~.12
~ 4
0
j 0
Figure 1. Particle Size Distribution of Nacor 78-6650 (A) and Aquatac 6085 (B).
Shown in Figure 2, Nacor 78-6650 and Aquatac 6085 have very different dynamic mechanic behaviors. The DMA shows that 78-6650 has pressure sensitive adhesive properties and a low Tg. According to the technical data sheet provided by its manufacturer, Aquatac 6085 has a softening point around 85°C. However, the DMA shows that Aquatac 6085 has a broad range for the softening point.
56

This is most likely caused by the broad distribution of the tackifier molecular weight. The DMA also shows that Aquatac 6085 has the typical mechanic properties of a low molecular weight material.
~ d
~:.. "~ ,~. •
(A) 78-6650
d
#
d
~:,~ ~ ~ ~ _:[
L
~ w ~mvI'q
(B) Aquatac 6085 Figure 2. Dynamic Mechanic Analysis of Nacor 78-6650 from-80°C to 220°C (A) and Aquatac
6085 from 30°C to 100°C (B).
Adhesion Evaluation • The preparation of coatings and the testing of adhesives were carried out using standard
industrial test procedures. The adhesive samples were coated onto a silicone release liner using a wired rod and dried at 250°F for 10 minutes. For the temperature dependence study, the drying temperature was varied accordingly. The coatings were then transferred onto a facestock film. The adhesive coatings on the facestock films were used to evaluate the peel adhesion and shear resistance. The adhesive bonds on testing substrates were formed by rolling a standard 2 kg roll across the bonded area at a fixed speed. Peel adhesion was measured after a certain contact time. The peel adhesion strength was measured by the force per unit width required to peel a 1-inch strip of a coated film from a stainless steel or HDPE panel at an angle of 180 ° using a crosshead displacement rate o f 12 inches/minute. An Instron was used in the measurement. Shear resistance was measured as the time taken to the complete failure of an overlap bond (1" x 1" contact area) between the coated film and a stainless steel plate. The stainless plate was held at 2 ° to the vertical under a static shear force applied by suspending a 2 kg weight from the film after a certain contact time.
SEM A JEOL JXA 6400 Scanning Electron Microscope was used to image the coating samples.
Portions were mounted and gold-coated by sputter coating, and then imaged at 10 kV accelerating voltage, with low probe current, at 30 degrees sample tilt. Scanning did not degrade the samples. Original magnifications were x4000 and x7000.
AFM Tapping mode AFM measurements were carried out using a Digital Instrument multi-mode
atomic force microscope. In tapping mode AFM, the AFM probe tip oscillates above the surface and changes in the motion of cantilever are used to determine both the topology and the phase images. The system was controlled by either a Nanoscope IIIa or Nanoscope IV controller. Subsequent processing of AFM images was undertaken using the Femtoscan scanning probe microscopy processing system (Advanced Technologies Centre, Moscow).
57

The scanner used for the majority of the work was a J-scanner (120 x 120 ~tm) with 5.6~tm z displacement. The in-situ heated work was undertaken using the Digital Instruments polymer heater system, this consists of a modified J-scanner with a sample heater immediately underneath the steel sample disc and a water cooled piezo scanner tube to avoid depoling of the scanner caused by overheating.
For non-contact AFM imaging a TopoMetrix Explorer Scanning Probe Microscope was used with 130 micron x and y, with 12 micron z displacement.
All the coatings in the tapping mode AFM studies were prepared on 0.5-inch steel discs, which were precleaned with a detergent wash, followed by acetone to remove any oil present. The latex and tackifier were mixed in a specified weight ratio and then mixed by vigorous hand agitation. The PSA formulation was coated onto the steel discs by spin coating. A 301.tl drop was placed on the steel disc mounted on the spin coater, this was then spun for 30seconds at 2000rpm, and each coating was repeated 3 times. Similarly in the non-contact mode AFM studies, coatings were prepared on 1-inch glass disc without additional cleaning. In both sets of AFM studies, the coatings were in the range of 100 to 200 l.tm. The coated steel or glass discs were either immediately transferred to the AFM for examination or held under various aging conditions such as the relevant temperature variations for the experiment being undertaken.
Results and Discussion
Adhesion vs. Tackified Coating Composition The properties of a pressure sensitive adhesive depend on the viscoelastic nature of the adhesive
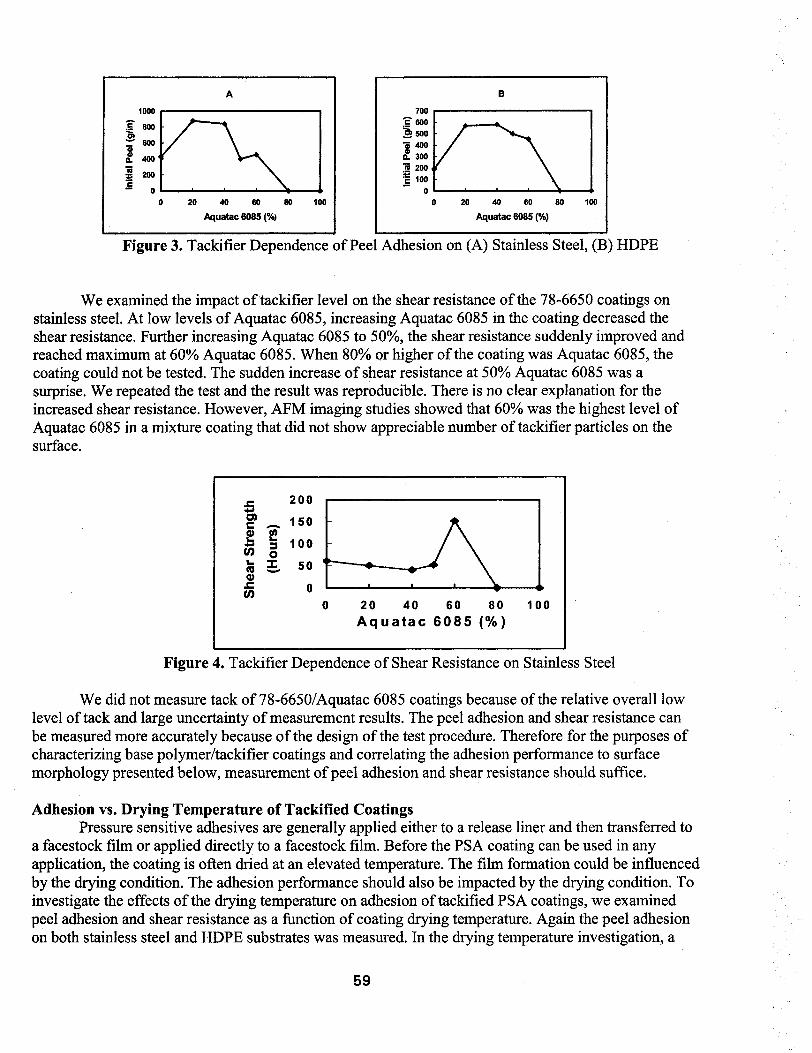
materials. Pressure sensitive adhesives are viscoelastic materials that can adhere strongly to a Variety of substrates upon application of light contact pressure and short contact time. The viscoelastic behavior of an adhesive base can be modified by using various additives. The most commonly used modifier is a tackifier that is compatible with the base polymer. Addition of a tackifier improves tackiness or peel adhesion. However, the level of the tackifier added to the adhesive base is critically important. There is an optimum level of the tackifier for the tack or peel adhesion as shown in Figure 3. The initial peel adhesion of 78-6650 coatings on stainless steel was about 400 g/in (Figure 3A). Addition of Aquatac 6085 initially improved the peel adhesion. At 20% by weight of Aquatac 6085, the initial peel adhesion increased to almost 900 g/in. The peel adhesion peaked somewhere between 20% and 40%. Further increase of Aquatac 60.85 in the coating became detrimental to the peel adhesion. When the coating contained 50% of Aquatac 6085, the peel adhesion dropped to the original strength of 78-6650 coatings. Once the coating reached 80% of Aquatac 6085, the peel adhesion diminished completely. A similar peel adhesion-Aquatac 6085 concentration profile was observed on HDPE (Figure 3B). Other authors have reported the optimum tackifier levels for other base polymer/tackifier systems. The effectiveness of tackifiers varies. The observation that there is an optimum level of tackifier for the peel adhesion is common, although the actual level of tackifier for an optimum peel adhesion differs for each base polymer/tackifier combination.
58
A
1000
8OO o )
~ " 600
L 400 m N 21111
~ 0 • v
0 20 40 60 80
Aquatac 6085 (%)
v
100
B
700 . . . . . .
~ ~o ~ ~ o
3OO
~ 200 "E loo
0 0 20 40 60 80
Aquatac 6085 (%)
100
Figure 3. Tackifier Dependence of Peel Adhesion on (A) Stainless Steel, (B) HDPE
We examined the impact oftackifier level on the shear resistance of the 78-6650 coatings on stainless steel. At low levels of Aquatac 6085, increasing Aquatac 6085 in the coating decreased the shear resistance. Further increasing Aquatac 6085 to 50%, the shear resistance suddenly improved and reached maximum at 60% Aquatac 6085. When 80% or higher of the coating was Aquatac 6085, the coating could not be tested. The sudden increase of shear resistance at 50% Aquatac 6085 was a surprise. We repeated the test and the result was reproducible. There is no clear explanation for the increased shear resistance. However, AFM imaging studies showed that 60% was the highest level of Aquatac 6085 in a mixture coating that did not show appreciable number of tackifier particles on the surface.
j= 2 0 0 . . . .
0 '# ¢ ~.~ 1 5 0
* , := 1 0 0 (n o L. m ~ so (9
" ¢ 0 - - ' . . . . . . . - - ( / )
0 2 0 4 0 6 0 8 0 1 0 0
Aquatac 6085 (%)
Figure 4. Tackifier Dependence of Shear Resistance on Stainless Steel
We did not measure tack of 78-6650/Aquatac 6085 coatings because of the relative overall low level of tack and large uncertainty of measurement results. The peel adhesion and shear resistance can be measured more accurately because of the design of the test procedure. Therefore for the purposes of characterizing base polymer/tackifier coatings and correlating the adhesion performance to surface morphology presented below, measurement of peel adhesion and shear resistance should suffice.
Adhesion vs. Drying Temperature of Tackified Coatings Pressure sensitive adhesives are generally applied either to a release liner and then transferred to
a facestock film or applied directly to a facestock film. Before the PSA coating can be used in any application, the coating is often dried at an elevated temperature. The film formation could be influenced by the drying condition. The adhesion performance should also be impacted by the drying condition. To investigate the effects of the drying temperature on adhesion of tackified PSA coatings, we examined peel adhesion and shear resistance as a function of coating drying temperature. Again the peel adhesion on both stainless steel and HDPE substrates was measured. In the drying temperature investigation, a
59
/
/ ' i ¸
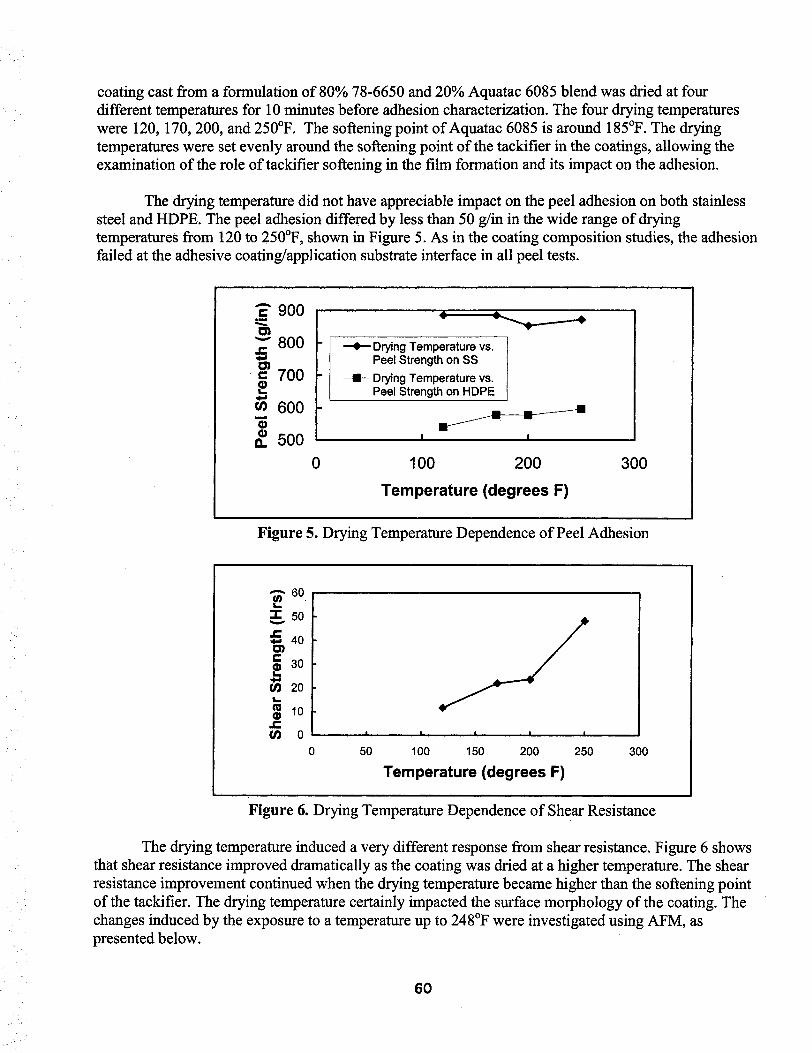
coating cast from a formulation of 80% 78-6650 and 20% Aquatac 6085 blend was dried at four different temperatures for 10 minutes before adhesion characterization. The four drying temperatures were 120, 170, 200, and 250°F. The softening point of Aquatac 6085 is around 185°F. The drying temperatures were set evenly around the softening point of the tackifier in the coatings, allowing the examination of the role of tackifier softening in the film formation and its impact on the adhesion.
The drying temperature did not have appreciable impact on the peel adhesion on both stainless steel and HDPE. The peel adhesion differed by less than 50 g/in in the wide range of drying temperatures from 120 to 250°F, shown in Figure 5. As in the coating composition studies, the adhesion failed at the adhesive coating/application substrate interface in all peel tests.
A
.= 900 O~
" " 800
= 700
tn 600 . . . . =
a. 500
Drying Temperature vs. Peel Strength on SS
Drying Temperature vs. Peel Strength on HDPE
,! I
0 100 200 300
Temperature (degrees F) , , , , , , , ,
Figure 5. Drying Temperature Dependence of Peel Adhesion
A 60
• 1" 50
40 O1 C .~ 3o
~ 20 L .
~ 10
~ 0 I I . , I I I
0 50 100 150 200 250 300
Temperature (degrees F) , , , , , , , . , , ,
Figure 6. Drying Temperature Dependence of Shear Resistance
The drying temperature induced a very different response from shear resistance. Figure 6 shows that shear resistance improved dramatically as the coating was dried at a higher temperature. The shear resistance improvement continued when the drying temperature became higher than the softening point of the tackifier. The drying temperature certainly impacted the surface morphology of the coating. The changes induced by the exposure to a temperature up to 248°F were investigated using AFM, as presented below.
60
AFM and SEM Images of Latex/Tackifier Coatings Non-contact mode AFM images were obtained for coatings cast from acrylic base/tackifier
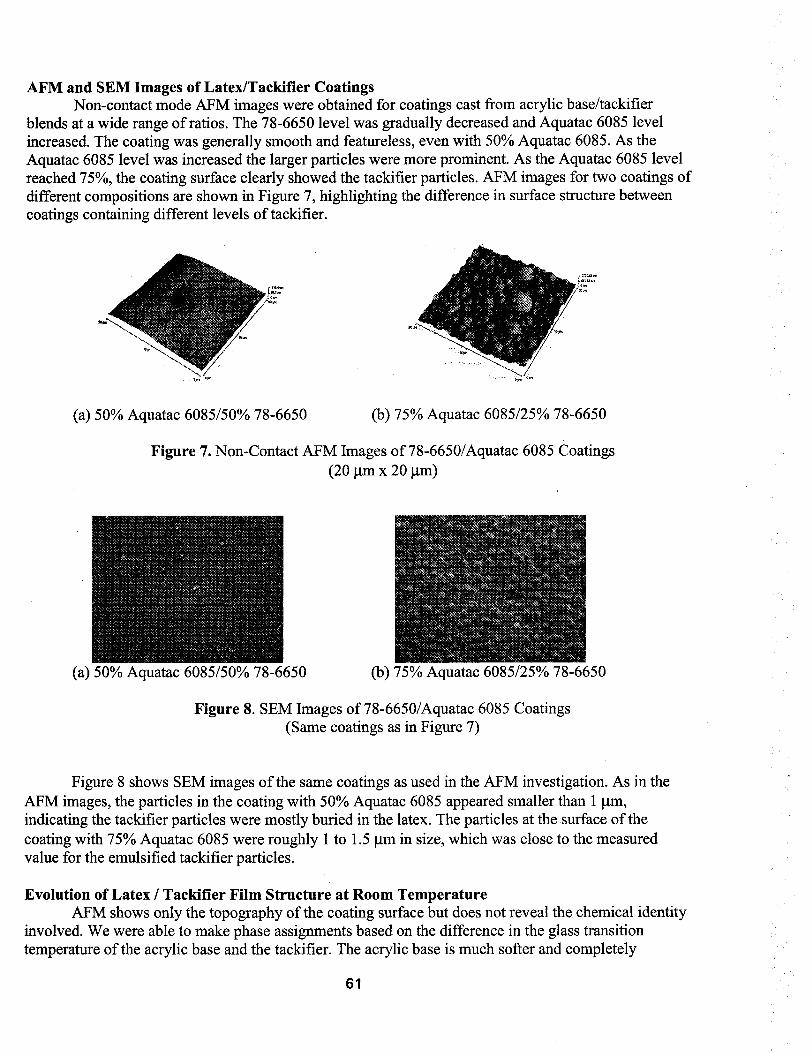
blends at a wide range of ratios. The 78-6650 level was gradually decreased and Aquatac 6085 level increased. The coating was generally smooth and featureless, even with 50% Aquatac 6085. As the Aquatac 6085 level was increased the larger particles were more prominent. As the Aquatac 6085 level reached 75%, the coating surface clearly showed the tackifier particles. AFM images for two coatings of different compositions are shown in Figure 7, highlighting the difference in surface structure between coatings containing different levels of tackifier.
• ~ . .
(a) 50% Aquatac 6085/50% 78-6650 (b) 75% Aquatac 6085/25% 78-6650
Figure 7. Non-Contact AFM Images of 78-6650/Aquatac 6085 Coatings (20 ~tm x 20 ~m)
~i:,iii ',~i iiiiii~ii :::,ii::!ii i'::,i':iiii ::ili ;':! iii~i i~iiii iii i!i:: !i:,~,i i iiiii'i i~i;i ~iiii:!ii i i~ii',!ii~iiiiiii~:,i!i',':i iii:, iii ::~ili i',i !ii i! ',ili i i!i!i!:iii i iii!i~iiiiiii~ ~i !ii ii~::,il !i~ii~iiii:,:, i!ii~ii~':~ !!',!~',i!ii'~i!i~':',',~ ~i i!!iiii i!i ii i i i}
i!::!::?:: !!!ii ;?ii 12:. i i?ii:: ;ii i:.i:: i ii:.!i ;ii~!ii?)!il !i !!::i::;ii !i;i i siii::i?i:-i?!::il;ii~ !i !:: )if i i i;):2ii::id i!!iii:!i!:.i ::)i;i)ii51:.i:: !:: i i !ii ::i ii ::i! i ii::~)~}i i~i::ii::! ::ii:-ii il)i ;i !i i iii 2?ii!::i: i~i i iiii!2!i:=i!i:.!i i ii::;i!::
i iii::iiii i!i !iiiii:i:iii:: i~ii ill!i! ili:.iiiiiii::iii~i::i::i:iii i::i::i::iii:: iii~!:: i::ili::i:-i::ii ii iii!i~iil ii~ii::iiiii~il ii~i ii!ii~.~iiii i!iii~il iii iiiiii!!:: i::!ili ii iii iiiil iiil ~i:i::i::i:-::i ~ i:.i~ :! ili:i~iiiii:-i i!iii~ ii iii!! i li i! if!i i i i! !i:iiii~i iiilii !il ii:ii i :iili !iiili ili iiii::iiiiil iii!i iiiiiiiiiii ii:ill !iiiiiiiiiilil ii ii ilil ili !! iiiiiiil ilii ii! iiiiiliiii!iiii ii!ii!! ii ii iii iiii ii !iilii !i!ii! i iii iii!iill ii ~il ~iiiii!!~i~:~
', ii i~,!': :,:,i ;:,!ii!ii',i ;i ill i;~,iiii:~i!~i:;i !!! ii',iii!ii!?i ii? i!iii~:i',i!i i i',!!! :,i! iii:~ i!~i',:i', ':!i~!i':i:,',;',i ii', iiii":::':i',i!:: i:: ii!:i! !~ !i:!~i::i:::!:i: i: ii:i:ii::i ::ii :i':i',i~ ',~:1!i:,;i' :,i?!i?iiii!iiii::'::i!!i:!i i;!i;) !!g :iii::i i i:: i!!ii ??ii iiiiiii: i:: i i i i::! ::~:ii111i!i !~ iii::::15: ::~ !i i li:.::il i! i ~ g iii2iiiic!ii! !:-iiii!~i !il ::ill S i i! :.i i~ii ~!ilili i i:.iii4ii::iiii~!~!Sii?ii::::i:i i i:. i:: i iiii!4 i i i! i ii:!i:i :::21 !~:j!?:. iii'2iliiii::ii: i~i:i i~?~:~ ::~,
i!~ii!iiii:::i;!i!'::!i!ii:!::i!::i;;::iiii~ii;! ii::~.::!i~;::~:~)i!ii:~i~!~i~;!5!!i:ii!~ii::?:~ii;~i:~;!;~i~ii~!~!i!i~.i::i~`~ii!~i~i!ii~iii!:~:~ii!!~iiii~!~::i!~!;::~):.!i~:.
~i: ~i ~iiiiiii~i~i~!ii!~!~!!~i~i~!~i~ii~iiiii!~ii~i~!~iiiii~iiiii!~!i!!~iiii~i~!iiii!!ii!i~i:ii!~i!~!~`:`.!i~iiii!~iiiiii~!iiii!!iii~iii~ii!iiiiiiiiiiii~!!~!
..... !! ~: :~<! : : : : : ~ : : :::::: :::i:: ~:.:: :!:!:i:i~ :i i.!::~:!::: :~: :i:.:: :i:!!!-!i~:!:i:~..~..": ::: :.'..! ::::::::::::::::::::::::::: ::!! i :!
~i~::: :~%ii ili~ i ~i :: ~i::ililili~ :: i!::::: ::!!i~iii ::::i !~ii~!::i::!~i::i~:i ! ::i ::i i :.i!::! ii!::ii iiii::i~i~iiiiiii i~i !~!!i ili~i il :i! ~ i ::::: ::::::::::::::::::::::::::: ======================================~::::::::::::::::::::::::::::::::::::::::::::::::::::: ==================================================================== !!!ii-~ii~ili ~::!! i~iii! iii iiii i~i !!!~i i!i~%il ::iiiiii ~! ii!iiiii!~i iil i~iii~ ::~ii!i~ii i iiiiii!ii~!!iiii~iiiiiii!~ii~ilili;~i ~:::.~:!::i :i:.i::::i::~iii~iiii::i!!::!::i!!i::::::!~ii::iiiiiiiiii!i::~-ii ~::i!::::ii::!i~!!~iiii~ii:;:iiii:.iiiiiii~ii:: i~iiiiii !ii'ii:::.!::~ i i!!:: i ::~iiiill i iliiiii~-~ i ~iili !,~
i!::i!i ii iii~iiii~::iii~!i! i~iii::~ ~ii~ii~iii~!~i~iiiii`~ii!~i~i~i~!~i~i~!~i~!~iiiii~iii~ii~!i~ii~!i~!~!~ii~i~!~iiiii~iii~ii~i~!iii~i~
i~ii :.i i::i:ii :~:ii iii.~:i~:!:: !'~:!i! i~i!~ i ~ iiii! :~:: i~ i:iiiii~ii !i~iiil iili! iii!~!ii~i:.:! i::i ii~iiiiiiii~ili~ii i~!?.-.~il i ii iiiii:!::i~:.: :.!: i:::i!::ii~:i!;.!i!~i~ !~i~:
(a) 50% Aquatac 6085/50% 78-6650 (b) 75% Aquatac 6085/25% 78-6650
Figure 8. SEM Images of 78-6650/Aquatac 6085 Coatings (Same coatings as in Figure 7)
Figure 8 shows SEM images of the same coatings as used in the AFM investigation. As in the AFM images, the particles in the coating with 50% Aquatac 6085 appeared smaller than 1 ~tm, indicating the tackifier particles were mostly buffed in the latex. The particles at the surface of the coating with 75% Aquatac 6085 were roughly 1 to 1.5 ~tm in size, which was close to the measured value for the emulsified tackifier particles.
Evolution of Latex / Tackifier Film Structure at Room Temperature AFM shows only the topography of the coating surface but does not reveal the chemical identity
involved. We were able to make phase assignments based on the difference in the glass transition temperature of the acrylic base and the tackifier. The acrylic base is much softer and completely
61
I

• L
interdiffuses, forming a continuous matrix. The tackifier particles are much harder and remain as separate entities. Both acrylic base and tackifier contain a small quantity of surfactants. The location of the surfactant molecules in the coating has not been investigated in this study.
PSA formulations consisting in their simplest form of purely latex and tackifier are known to age once coated onto a substrate, such that adhesion properties will change with time after coating as demonstrated above. Typically maximum adhesion may not be reached until weeks after coating. Normally PSA coatings are dried at elevated temperatm'es after coating.
In order to determine whether it would be possible to carry out an AFM study of such an adhesive system as a tackified low temperature latex, a number of model formulations were prepared and examined immediately after coating. We started our latex film formation investigation from aging at room temperature. The film formation of acrylic emulsion is an important factor in performance of the PSA. Scheme 1 depicts the film formation process for an emulsion polymer showing the transition from a liquid cast film to the final coalesced dry film. The scheme represents that the evaporation of the water in the coating results in close packing of emulsion particles. Further drying either at an elevated temperature or for a longer period of time allows the particles to coalesce. At the final step of film formation, polymer interdiffusion also takes place to generate a clear and transparent film.
Scheme 1
Film Formation Model
O Q O Water Evaporation ~ _ ~ ~ ~
!~:!!!i!i~ii!i~iiiii~!!!!!!!~:!!!~i~i~i~iiii~;~!i!~:!ii!!!~:~:~i!i~i~iii~;~ ~.!!i!!!i!ii~ii',iiiiiiii'.'~!!iii!!:,i!iii!:~i:,iiii~:i!!',i!!':~ iii!i~iiiiiii~!i!ii!~i i~iii ~!i
Film Aging
Time, Temperature
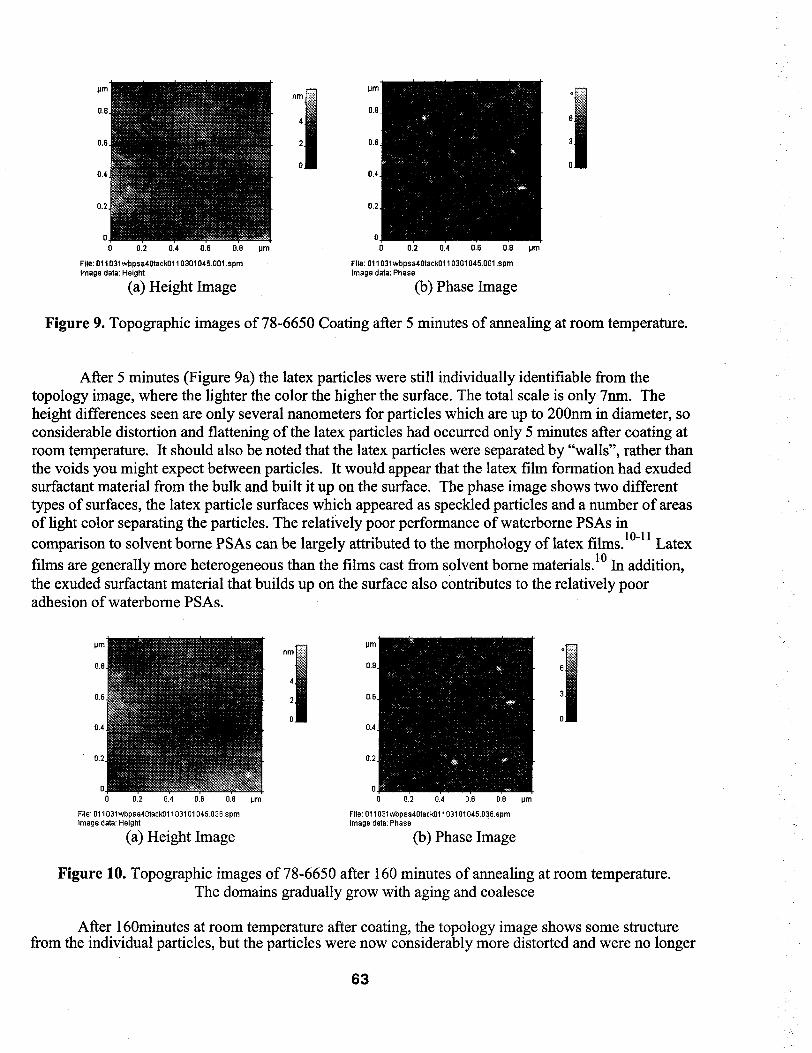
We first examined the surface of the latex film cast from acrylic emulsion without tackifier. According to the film formation model, the emulsion particles in a coating should maintain the particle structure before the coating becomes completely coalesced. The images in Figures 9 & 10 show the topology of a latex film 5 minutes and 160 minutes after coating.
62
0.4 0.4
0.2 0.2
0 0 0~2 0~4 016 018 pm' 0 0~2 0~4 0~6 018
File: 011031wbpsa40taek0110301045.001 .spin File: 011031wbpsa40tack0110301045.001 .spm Image data: Height Image data: Phase
(a) Height Image (b) Phase Image
pm
Figure 9. Topographic images of 78-6650 Coating after 5 minutes of annealing at room temperature.
o
r1 : : : : : : : :
. i
After 5 minutes (Figure 9a) the latex particles were still individually identifiable from the topology image, where the lighter the color the higher the surface. The total scale is only 7nm. The height differences seen are only several nanometers for particles which are up to 200nm in diameter, so considerable distortion and flattening of the latex particles had occurred only 5 minutes after coating at room temperature. It should also be noted that the latex particles were separated by "walls", rather than the voids you might expect between particles. It would appear that the latex film formation had exuded surfactant material from the bulk and built it up on the surface. The phase image shows two different types of surfaces, the latex particle surfaces which appeared as speckled particles and a number of areas of light color separating the particles. The relatively poor performance of waterborne PSAs in comparison to solvent borne PSAs can be largely attributed to the morphology of latex films.l°'11 Latex films are generally more heterogeneous than the films cast from solvent borne materials. ]° In addition, the exuded surfactant material that builds up on the surface also contributesto the relatively poor adhesion of waterborne PSAs.
I~m
0.8
0.6
0.4
0.2
n m
i pm
0.8
0.6
0.4
0.2
0 0 0 0.2 0.4 0.8 0.8 ~m ~ 0?2 0?4 0?8 078
File: 011031wbpea40tack01103101045.036.spm File: 011031wbpsa40tack01103101045.036.spin Image data: Height Image data: Phase
(a) Height Image (b) Phase Image
pm
o
6
Figure 10. Topographic images of 78-6650 after 160 minutes of annealing at room temperature. The domains gradually grow with aging and coalesce
After 160minutes at room temperature after coating, the topology image shows some structure from the individual particles, but the particles were now considerably more distorted and were no longer
63
r.
separated by continuous high areas. The phase image showed a similar, somewhat more chaotic structure, with distorted particles and broken connecting areas. Overall the surface showed a more coalesced structure.
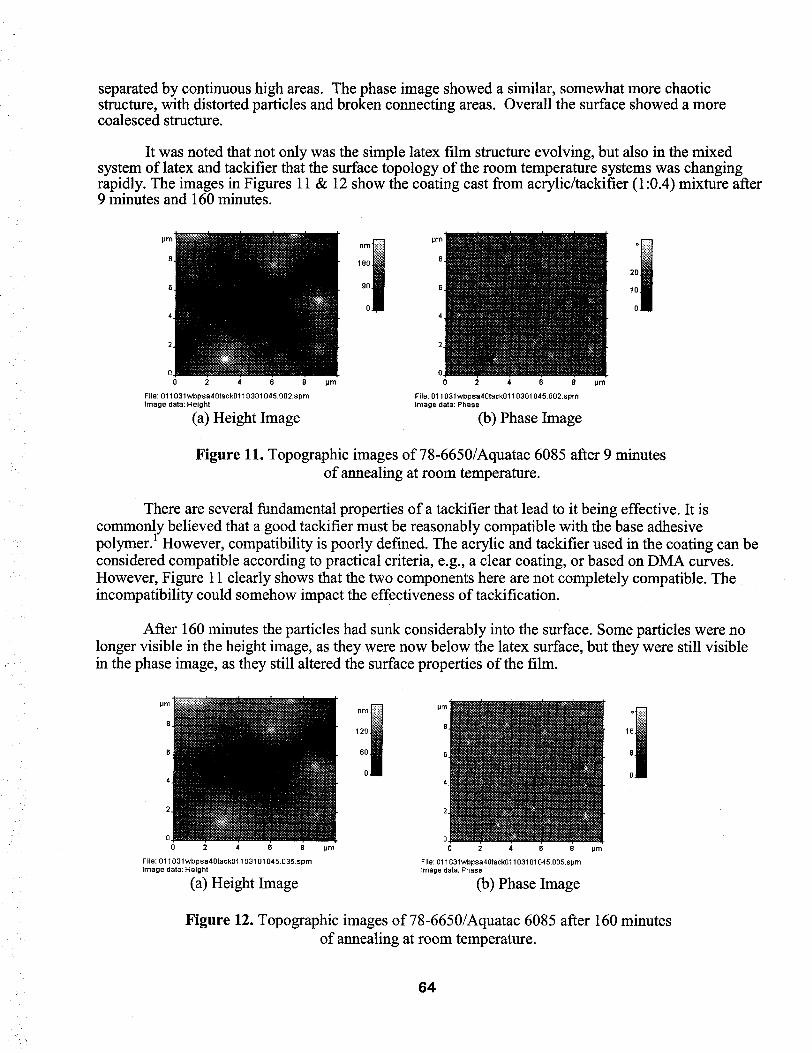
It was noted that not only was the simple latex film structure evolving, but also in the mixed system of latex and tackifier that the surface topology of the room temperature systems was changing rapidly. The images in Figures 11 & 12 show the coating cast from acrylic/tackifier (1:0.4) mixture after 9 minutes and 160 minutes.
~!i! !ii! ~:~i~?~!~:~ ~ ~:!ii i iii i!iii!i!ii!iii!~ il ~I~::~~~
:: .: :::::::. ::..:.:::
.: ...... :~i~:::~?::::~ii::iiii)i~i~::;i;i~i~::}::)::)i;i)iii~}::~i~::~!i?)i?:~:;~i~:i~::;~:~}:~i~i::: . : ~ . - . ." :.~:~: :~:::~::~i:~i~:::!i!ii::i~!~ii!!::i!i::::::i::::~i!::ii~::i!i!!!i~::~!::i::ii:~::iii~iiii!!iiiiiii::is:.i::iii;~::::::~i~ii!i:~::: i~:::i:~i.i:: : : i " :
iliili i l i l i i iili i i iiiii! i i i!il ̧ ~i!~iiii!!i!i!~i!~!~!~!iiii~!i!iii~iii!i~i~i!i!~i!~ii~!ii!!ii~i~ii~ii~iiiii~i~!!i!~i;iii!~!i!~!!iii!~i~iii~ii!i~i!i!!i~!i!!ii~i~i~ii~ii~i!!~ ~i:i:iiiii~iiiiiiiiii~ii iiiiiii~i~iiiiiiiiiiilili!iiiiii!i!ii~iiiiiiiii~ii• .~ii~i~iiiiii!iiiii~!ii~iiiii~iiii~ii~ii~iii~ii!~iiiii!~ii~i~!~!!~i~i~!iii~i~ iii!!ii!ii!i!iii!iiii!iiiiiiii!ii!iiiii! iiiiiiiii~i!iiii!~!iii!iiiiii~i!iiii!ii~iii~ii!ii~i~!!i~i!!~iiiiii!~i~!i!iii!~ii~!iiii~iii~i~i!i~iii~i!!~ii!i~ii!i!ii~i~i~i!ii!i~iii~ii!i~!!i!iiiiiiiiiii!iii!!!!i~iiii~iiii!i!iiiiiii~!i~
tim
8
nm o
180 8, 20
90 6, 100
0 .
0 . , . . . . . , 0 . o , , - - , - - ,
0 2 4 6 8 pm 0 2 4 6 8
File: 011031wbpsa4Otack0110301045.002.spm File: 011031wbpsa4Otack0110301045.002.spm Image data: Height Image data: Phase
(a) Height Image (b) Phase Image
p m
Figure 11. Topographic images of 78-6650/Aquatac 6085 after 9 minutes of annealing at room temperature.
There are several fundamental properties of a tackifier that lead to it being effective. It is commonly believed that a good tackifier must be reasonably compatible with the base adhesive polymer. 1 However, compatibility is poorly defmed. The acrylic and tackifier used in the coating can be considered compatible according to practical criteria, e.g., a clear coating, or based on DMA curves. However, Figure 11 clearly shows that the two components here are not completely compatible. The incompatibility could somehow impact the effectiveness of tackification.
After 160 minutes the particles had sunk considerably into the surface. Some particles were no longer visible in the height image, as they were now below the latex surface, but they were still visible in the phase image, as they still altered the surface properties of the film.
pm ~ pm nm o
8 8 120 16
4 4
2 2
0 0 2 4 6 8
File: 011031wbpsa40tack01103101045.035.spin Image data: Height
(a) Height Image
0 gm 0 2 4 6 8 tim
File: 011031wbpsa40tack01103101045.035.spm Image data: Phase
(b) Phase Image
Figure 12. Topographic images of 78-6650/Aquatac 6085 after 160 minutes of annealing at room temperature.
64

The height image can also be displayed as a 3-dimensional surface as shown below.
Figure 13. 3-Dimensional images of 78-6650/Aquatac 6085 after 160 minutes o f annealing at room temperature.
A number of formulations of latex and tackifier were used to study room temperature surface topology development with time. The changes in surface topology have been quantified by measuring surface roughness (rms) over a 10~t square which is displayed in Figure 14 for a number of different formulations.
The range of formulations studied have shown some obvious trends, such as the more tackifier particles present the rougher the surface and the longer it takes to flatten to a given roughness. It should be noted that as only a 10~tm square has been examined and some of the tackifier particles are bigger than 1 ~tm in size, the statistics are not necessarily very good and can be influenced by particles which are near the edge of the scan and hence appear to move in and out of the area being scanned, resulting in the spiky appearance of some of the curves. The 1:0.1 formulation has such a low number of tackifier particles present that the minimum roughness is reached very rapidly.
Surface Roughness Development After PSA Coating
1 4 0 '
1 2 0 -
A E
~ o o -
e , -
" 8 0 -
O3 ~ 6 0 -
4 0
2 0
%J
1 : 0 . 1 - L a t e x : T a c k i f i e r
• - 1 : 0 . 5 - L a t e x : T a c k i f i e r
- ' -= ' . -" . - 1 : 0 . 8 - L a t e x : T a c k i f i e r
o * *
* - . o * * * *
" ' ' ° - e . . O . O O . o o . e o " " , o - o - e o . . . o o . . . .
_ ,,,,, _ ~ : . . . . . . . _ _ ~ _ = - - - - _ _ . - - - _ ~
! u , , ! , ,
0 5 0 1 0 0 1 5 0 2 0 0 2 5 0 3 0 0 3
Time After Coat ing ( m i n u t e s )
Figure 14. RMS Roughness-Time Profiles of 78-6650/Aquatac 6085 Coatings at room temperature.
65
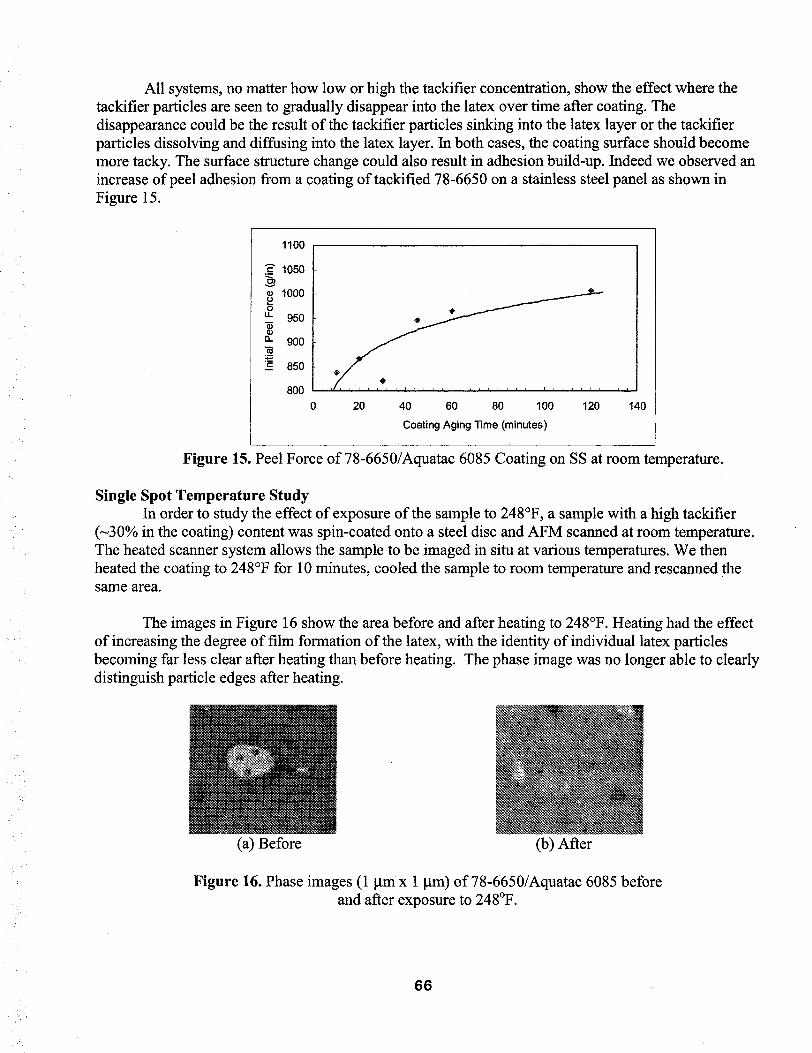
All systems, no matter how low or high the tackifier concentration, show the effect where the tackifier particles are seen to gradually disappear into the latex over time after coating. The disappearance could be the result of the tackifier particles sinking into the latex layer or the tackifier particles dissolving and diffusing into the latex layer. In both cases, the coating surface should become more tacky. The surface structure change could also result in adhesion build-up. Indeed we observed an increase of peel adhesion from a coating of tackified 78-6650 on a stainless steel panel as shown in Figure 15.
1100
1050
• 1000 p o u_ 950 m
a.. 900 m
. ~ , . = . , . ,
~ 850
800
0 20 40 60 80 100 120
Coating Aging Time (minutes)
140
Figure 15. Peel Force of 78-6650/Aquatac 6085 Coating on SS at room temperature.
Single Spot Temperature Study In order to study the effect of exposure of the sample to 248°F, a sample with a high tackifier
(-~30% in the coating) content was spin-coated onto a steel disc and AFM scanned at room temperature. The heated scanner system allows the sample to be imaged in situ at various temperatures. We then heated the coating to 248°F for 10 minutes, cooled the sample to room temperature and rescanned the same area.
The images in Figure 16 show the area before and after heating to 248°F. Heating had the effect of increasing the degree of film formation of the latex, with the identity of individual latex particles becoming far less clear after heating than before heating. The phase image was no longer able to clearly distinguish particle edges after heating.
. . . . . . . . . . . . . . . . . . . . . . . . . . . ~ ~ : : : : _ _ : . . . . . . . .
-
(a) Before
~. . . . ~N
%11!i,,'
(b) After
Figure 16. Phase images (1 g m x 1 gm)of78-6650/Aquatac 6085 before and after exposure to 248°F.
66

We scanned a larger area before and after heating the same coating to 248°F. The image before heating showed the presence of the tackifier particles very clearly, they showed up as bumps in the topology image and as differentiated phase regions in the phase image.
i~ i!;ii!!~.,-;ii!~i:: i i:i !ii :~!!ii:~ :i;i:::~i~ii:~,i:i;~i::i!i~i;i~; i i iii!i ::.. :ii;ili:.: ;::i; ~!;:: ;ii i! .:::.:-:.:~. ========================================== :::::::::::::::::::::::::::::::::::::::::::::::::::
~!~ii~!~!~:::~:~:~i!i~!i~ii~i!i!~!!~iiiiii~ii~iii~i~iii~ii!~iii~ii~!~!~ii:~!i~ii~i~iiiiiiii~i~ :~iii~::~ii~::!~ii!iii~iii~iii~ii~i~i~ii~iii!!~ii~i~ii!~i!~i!ii!i~!~!!ii~ii~iiii::~!iii~iii~i~::i!ii :-~'::...x. ii:~:iii~ii::! ii::!ii i i::i::::i::~!ii::!::j:i:: ::!ii~iiiiii~::::ii::iii::iiiiiii::i::~:i~i!iii::i i~ii:: i:/i~!~::ii:iii~
i::;i;i{i~iiii::iiNiiii!ii:i!::iii!iiiii2i:~i2:iii::;iiii?ii:i;ii ~s~s~iiiii::i:i)iiiiiiii!::iii::}i}::!!::;i!i!iiiii!ii{!}}ii::iiii;
!~ii ii~i:i i! ~iiiiNiiii! :! ~21 ~i !! ~;~i!;ii;iiii~!i;~iii~iii~;:i{i;~ii~::i::;i)ii~i~iii~!;ii!;!~iiiii;ii:~i!i:~i~i~`?~ii::~!~::~ii~!::::~:~
(b) After
Figure 17. Images of 78-6650/Aquatac 6085 before and after exposure to 248°F. The 3-dimensional images are height and the 2-dimensional intensity plots are the phase image.
After heating, the separate tackifier phase was no longer identifiable in the phase image and the latex particles showed a greater degree of coalescence. With many samples, after heating it would appear that where the tackifier particles were present that holes in the surface were now present. We would postulate that given sufficient time at the high temperature, the tackifier was literally dissolving into the latex and hence leaves a void where the particle had been. Partial dissolution would result in a decrease in size of the original tackifier particle and complete dissolution would leave a small hole.
The Effect of Different Temperatures A series of samples of a same composition were held for 10 minutes at a range of different
temperatures and then examined by tapping mode AFM. The temperature study basically followed the trend expected, with the surfaces becoming smoother as the temperature was increased. The particles were clearly defined on the surface at room temperature. After the coating was held at 176°F, near the softening point of the tackifier, particles on the surface became less visible. When the temperature was increased to 248°F, tackifier particles were no longer observed.
67

(a) 68°F
..... : :
~ m
(b) 176°F ::: :0 i
(c) 248°F
Figure 18. 3-dimensional height images of 78-6650/Aquatac 6085 (1:0.4) after exposure to various temperatures.
Effect of Time at 248°F A series of samples were spin coated, allowed to dry at room temperature for 72 hours, and were
then placed in an oven at 248°F for a range of different times. AFM images were then acquired. After 72 hours at room temperature, most of the samples did not show tackifier Particles on the surface, however phase images imply that the tackifier particles are just subsurface. This concurred with our understanding that at room temperature no dissolution of the tackifier should have occurred, the particles should have just sunk into the latex.
68

The overall observation was that even up to times as long as 40 minutes at 248°F, with a range of different tackifier contents, surface flattening was still occurring as shown up by a decreasing surface roughness. This might be due to a combination of three effects, the further sinking of the tackifier particles within the sea of latex, the continuing dissolution of the tackifier particles sub-surface, and the continued flow of the latex driven by surface energy effects to reduce the overall surface roughness.
..
After short times the different level tackifier samples were more difficult to distinguish. It is believed that this may be due to the opposing effects of more particles making the surfaces rougher, but a higher concentration of tackifier resulting in the latex being able to flatten more rapidly.
Tackifier Particle Structure The importance of the dissolution of the tackifier particles has been highlighted by this work, so
a detailed investigation of the tackifier particles was undertaken. The phase images of the apparently smooth tackifier particles showed that in fact the particles had a complex phase behavior. When the phase image was painted onto the topology image, it produced an image of particles composed of many fragments. While we do not have an explanation for the existence of fragments, we should point out that the tackifier is emulsified and stabilized using a polymeric surfactant material. It is possible that the polymeric surfactant material adsorbed and aggregated on the tackifier particles during the coating drying process.
....... : ................ !::..:.:..~ ~ ~ :: : : : : : : : : : : : : : : : : : : : : : :~~ ~:!:~:i:~:~:~:~:~:~:~:~:~:~!:i!~:..~:s: ~ • "~i:~.~i~ii!~i!ii~
. . . . . . . . . ~ ' . ~{N}.~N
05
- ~ ::::::::::::::::::::::::::::::::::::::::::::::::::::::::::::::::::::::::::::::::::
. . . . . . 0 0.5 1 1.5 2 IJm
File: A O 6 0 8 5 & 0 0 6 sp in Image data: Height
(a) Height
n m ~ Pm2
300
200 1
0,5
i .............. ! .............. ! . . . . . . . . . . !...~ ........... t ........ ii;i~i~ iiiii ~!iiiiii{il !i ! ii;i;ii!iiiiiiii:~ii$~! i ~ :,i!~ ::::::i~::~::~iiii~i::~!ii~i:~::::::;~::~::~i~}~::+::~:i~i~i~+...!::~!i::i!i!!!ii:~ii~iii!!iii!!~:~::~::::;!!!ii~ii:~{::i~!~::~i:!:i!::~::i~i::ii~:~:i!:~::~:~i
ii~iiiiiiii!iiiii~ii',}:,i~i:~!iiiiiiiii~iiii~i;i~! :~9~i~i~,i",!!ii!!i!i}!i!iii!iii~i:i:!i:~i:
!! { i i !i~iiiiiii i i ii i~iiiiiiii!i! i iii~.~iii i ~ ~ i l i i:iii; i i i i ~ i ! i ~ i i i i i i } : : : i : : : : : : : : : : : :::::::::::::::::::::::::::::::::::::::::::::::: ::::::::::::::::::::: ::::::::::::::::::::: ::::":::::::: ::$ .:$i:i$:::: ::: $ :::::i%:
!iiiii!i;i!!!i!i!i;!!i i ! ; ili!! ii;i;! iii!iiiiiiii ii iiiii; iii;il 0.5 1 1.5 2 pm
File: AO6085A.006.spm Image data: Phase
(b) Phase
o
4O
Figure 19. Images of tackifier Aquatac 6085 coatings
The composite image which is the result of adding the height data to the topology data is no longer a genuine phase image. It is purely a useful way of showing the information.
I.I1"11"
2
1.5
1
0.5
0 0 0.5
File: AQ6085A.006.spm Image data: Phase
::i i i;iiii }
' 1 1.5 2 pro'
o
8O
'i
Figure 20. Phase Images of tackifier Aquatac 6085 coatings
69
Conclusions The surface morphology of waterborne pressure sensitive adhesive coatings has been
characterized using AFM. Simple model PSA coatings are made of two components, acrylic polymer and rosin ester tackifier. The surface structure of such coatings changes with the coating composition. AFM images obtained from coatings with different compositions are essentially the same as the SEM images taken from the same coatings. With less than 50% tackifier in a coating, the tackifier particles are almost invisible on the coating surface. With an increase in the tackifier content in the coating, tackifier particles become evident on the coating surface. Aging always results in a smoother surface for coatings with various compositions, which may provide better peel adhesion upon aging of the coatings used in this study. Increasing the aging temperatureup to tackifier softening point gradually, but not completely, removes tackifier particles from the coating surface. Exposure to a temperature higher than tackifier's softening point substantially removes the tackifier particles from the coating surface, most likely through the dissolution of tackifier into latex matrix. This surface morphology change has an impact on the adhesion properties of the adhesive coatings.
Acknowledgements The authors thank Lilly Shen and Greg Fleming for the assistance in the evaluation of adhesion
performance of various adhesive materials. The management of National Starch and Chemical is gratefully acknowledged for the permission of the publication of this manuscript.
References 1. D. Satas, Handbook of Pressure Sensitive Adhesive Technology, D. Satas, Ed.; 1999; Van Nostrand
Reinhold: New York.
2. A.G. Gilicinski, R.J. Haney, A. Famili and T. Mebranhu, J. Adh. AndSeal. Council. 1,513 (1996).
3. M. Fujita, M. Kajiyama, A. Takemura, H. Ono, and H. Mizumachi, J. Appl. Polym. Sci., 70, 771 (1998).
4. M. Fujita, M. Kajiyama, A. Takemura, H. Ono, and H. Mizumachi, J. Appl. Polym. Sci., 70, 777 (1998).
5. R. Bates, J. Appl. Polym. Sci., 20, 2941 (1976).
6. E.H. Andrews, T. A. Khan, P. Drew, and R. Rance, J. Appl. Polym. Sci., 41,595 (1990).
7. A. Paiva and M. D. Foster, J. Adhesion, 75, 145 (2001).
8. A. Paiva, N. Sheller, M. D. Foster, A. J. Crosby, and K. R. Shull, Macromolecues, 34, 2269 (2001).
9. J. Mallegol, O. Dupont, J. L. Keddie, Langmuir, 17, 7022 (2001).
10. J. Y. Charmeau, R. Berthet, C. Gringreau, Y. Holl, and E. Kientz, Int. J. Adhes. Adhes., 17, 169 (1997).
11. J. L. Keddie, Mater. Sci. Eng. Rep., R21 (3), 101 (1997).
70