Model peptides mimic the structure and function of the N-terminus of the pore-forming toxin...
12
Model Peptides Mimic the Structure and Function of the N-terminus of the Pore- Forming Toxin Sticholysin II Fa ´ bio Casallanovo 1 Felipe J. F. de Oliveira 1 Fernando C. de Souza 2 Uris Ros 3 Yohanka Martı ´nez 3 David Pento ´n 3 Mayra Tejuca 3 Diana Martı ´nez 3 Fabiola Pazos 3 Thelma A. Pertinhez 4 Alberto Spisni 4 Eduardo M. Cilli 2 Marı ´a E. Lanio 3 Carlos Alvarez 3 Shirley Schreier 1 1 Department of Biochemistry, Institute of Chemistry, University of Sa ˜ o Paulo, Sa ˜ o Paulo, SP, Brazil 2 Department of Biochemistry, Institute of Chemistry, Sa ˜ o Paulo State University, Araraquara, SP, Brazil 3 Center for Protein Studies, Faculty of Biology, University of Havana, Havana, Cuba 4 Center for Molecular Structural Biology, National Laboratory of Synchrotron Light, Campinas, SP, Brazil Received 19 July 2005; revised 30 August 2005; accepted 4 September 2005 Published online 16 September 2005 in Wiley InterScience (www.interscience.wiley.com). DOI 10.1002/bip.20374 Abstract: To investigate the role of the N-terminal region in the lytic mechanism of the pore-form- ing toxin sticholysin II (St II), we studied the conformational and functional properties of peptides encompassing the first 30 residues of the protein. Peptides containing residues 1–30 (P1–30) and 11–30 (P11–30) were synthesized and their conformational properties were examined in aqueous solution as a function of peptide concentration, pH, ionic strength, and addition of the secondary structure-inducing solvent trifluoroethanol (TFE). CD spectra showed that increasing concentra- tion, pH, and ionic strength led to aggregation of P1–30; as a consequence, the peptide acquired b-sheet conformation. In contrast, P11–30 exhibited practically no conformational changes under the same conditions, remaining essentially structureless. Moreover, this peptide did not undergo aggregation. These differences clearly point to the modulating effect of the first 10 hydrophobic res- idues on the peptides aggregation and conformational properties. In TFE both the first ten hydro- phobic peptides acquired a-helical conformation, albeit to a different extent, P11–30 displayed lower a-helical content. P1–30 presented a larger fraction of residues in a-helical conformation in Correspondence to: Shirley Schreier; e-mail: [email protected] Biopolymers (Peptide Science), Vol. 84, 169–180 (2006) # 2005 Wiley Periodicals, Inc. 169
-
Upload
independent -
Category
Documents
-
view
3 -
download
0
Transcript of Model peptides mimic the structure and function of the N-terminus of the pore-forming toxin...
Model Peptides Mimic theStructure and Function ofthe N-terminus of the Pore-Forming Toxin Sticholysin II
Fabio Casallanovo1
Felipe J. F. de Oliveira1
Fernando C. de Souza2
Uris Ros3
Yohanka Martınez3
David Penton3
Mayra Tejuca3
Diana Martınez3
Fabiola Pazos3
Thelma A. Pertinhez4
Alberto Spisni4
Eduardo M. Cilli2
Marıa E. Lanio3
Carlos Alvarez 3
Shirley Schreier11 Department of Biochemistry,
Institute of Chemistry,University of Sao Paulo,
Sao Paulo, SP, Brazil
2 Department of Biochemistry,Institute of Chemistry,
Sao Paulo State University,Araraquara, SP, Brazil
3 Center for Protein Studies,Faculty of Biology,
University of Havana,Havana, Cuba
4 Center for MolecularStructural Biology,
National Laboratory ofSynchrotron Light,
Campinas, SP, Brazil
Received 19 July 2005;revised 30 August 2005;
accepted 4 September 2005Published online 16 September 2005 in Wiley InterScience(www.interscience.wiley.com). DOI 10.1002/bip.20374
Abstract: To investigate the role of the N-terminal region in the lytic mechanism of the pore-form-ing toxin sticholysin II (St II), we studied the conformational and functional properties of peptidesencompassing the first 30 residues of the protein. Peptides containing residues 1–30 (P1–30) and11–30 (P11–30) were synthesized and their conformational properties were examined in aqueoussolution as a function of peptide concentration, pH, ionic strength, and addition of the secondarystructure-inducing solvent trifluoroethanol (TFE). CD spectra showed that increasing concentra-tion, pH, and ionic strength led to aggregation of P1–30; as a consequence, the peptide acquiredb-sheet conformation. In contrast, P11–30 exhibited practically no conformational changes underthe same conditions, remaining essentially structureless. Moreover, this peptide did not undergoaggregation. These differences clearly point to the modulating effect of the first 10 hydrophobic res-idues on the peptides aggregation and conformational properties. In TFE both the first ten hydro-phobic peptides acquired a-helical conformation, albeit to a different extent, P11–30 displayedlower a-helical content. P1–30 presented a larger fraction of residues in a-helical conformation in
Correspondence to: Shirley Schreier; e-mail: [email protected]
Biopolymers (Peptide Science), Vol. 84, 169–180 (2006)
# 2005 Wiley Periodicals, Inc.
169

TFE than that found in St II’s crystal structure for that portion of the protein. Since TFE mimics themembrane environment, such increase in helical content could also occur upon toxin binding tomembranes and represent a step in the mechanism of pore formation. The peptides conformationalproperties correlated well with their functional behavior. Thus, P1–30 exhibited much higher hemo-lytic activity than P11–30. In addition, P11–30 was able to block the toxin’s hemolytic activity. Thesize of pores formed in red blood cells by P1–30 was estimated by measuring the permeability toPEGs of different molecular mass. The pore radius (0.95 6 0.01 nm) was very similar to that of thepore formed by the toxin. The results demonstrate that the synthetic peptide P1–30 is a good modelof St II conformation and function and emphasize the contribution of the toxin’s N-terminal region,and, in particular, the hydrophobic residues 1–10 to pore formation. # 2005 Wiley Periodicals,
Inc. Biopolymers 84: 169–180, 2006
This article was originally published online as an accepted preprint. The ‘‘Published Online’’ datecorresponds to the preprint version. You can request a copy of the preprint by emailing theBiopolymers editorial office at [email protected]
Keywords: Sticholysin II; actinoporin; pore-forming toxin; hemolytic peptide; circular dichroism
INTRODUCTION
Sticholysin II (St II) is the most hemolytic isoform of
the pore-forming proteins (PFP) produced by the sea
anemone Stichodactyla helianthus.1 St II forms cat-
ion-selective hydrophilic pores2 both in natural and
model lipid membranes of around 1 nm hydrodynamic
radius.3 Despite the extensive work attempting to clar-
ify how this water-soluble protein inserts, oligomer-
izes, and eventually disrupts target membranes, little
is known about the actual amino acid sequence(s)
involved in each event.2–7 St II belongs to the actino-
porin family, a unique class of eukaryotic PFP exclu-
sively found in sea anemones. They are cysteineless
proteins, with Mr around 20 kDa, and a preference for
sphingomyelin (SM)-containing membranes.2,5,8
The structures of the soluble state of equinatoxin II
(EqT II), a highly homologous actinoporin (66% iden-
tity and higher than 80% similarity) purified from the
sea anemone Actinia equina,9 and St II10 were recentlysolved by X-ray crystallography. The solution struc-
ture of EqT II was also solved by NMR.11 Both toxins
contain a hydrophobic �-sandwich core, flanked on
the opposite sides by two �-helices. In St II, the two
�-helices comprise residues 14–23 and 128–135.10
The first thirty N-terminal residues, which include one
of the helices, are thought to be the best candidates for
pore formation. This region contains an amphipathic
stretch, well conserved in all actinoporins, clearly sim-
ilar to some membrane-interacting peptides such as
melittin and fusogenic viral peptides,12 and is the only
portion of the molecule that can change conformation
without perturbing the general protein fold.9,10 Fur-
thermore, it has been demonstrated that a flexible N-
terminal region and a stable �-sandwich are prerequi-
sites for proper pore formation by EqT II.13
Recently, a cysteine-scanning mutagenesis of the
region encompassing residues 10–28 of EqT II sug-
gested that this portion adopts �-helical conformation
in the membrane and that the �-helix is longer than
in the soluble form. In the membrane-bound state this
portion lays on the water–lipid interface and it inserts
into the membrane to line the pore interior forming
an angle of around 208 with the bilayer normal.14 A
small increase in helicity of sticholysins occurs upon
binding to lipid membranes, as found by FTIR spec-
troscopy.15 However, a more definitive picture of this
mechanism would require the determination of the
structure of the oligomerized toxins in membranes. A
model for St II pore formation was proposed based
on low resolution electron microscopy data of the
lipid-bound toxin.10
The study of actinoporins is important not only to
understand their envenoming properties, but also, in a
more general sense, to investigate basic mechanisms
of lipid–protein interaction, as well as the sequences
responsible for their biological activity. Furthermore,
these toxins—or their functionally relevant amino
acid sequences—could also be potential tools for the
construction of immunoconjugates addressed to can-
cer or other undesirable cells. In fact, they have
already been used for the construction of antitumoral
and antiparasite chimeric molecules.16–21 The under-
standing of the basic molecular mechanisms involved
in toxin–cell interaction is essential for the rational
design of these immunotoxins.
To clarify the role of St II’s N-terminal sequence
to protein function we have synthesized and con-
ducted conformational and functional studies of two
peptides containing residues 1–30 (P1–30) and 11–30
(P11–30) of the toxin. The peptides conformational
properties were examined in aqueous solution by circu-
170 Casallanovo et al.
Biopolymers (Peptide Science) DOI 10.1002/bip
lar dichroism (CD) as a function of peptide concentra-
tion, pH, ionic strength, and addition of the secondary
structure-inducing solvent trifluoroethanol (TFE). The
peptides’ functional properties were assessed by means
of their hemolytic activity (HA). The results demon-
strate that the hydrophobic N-terminal sequence (resi-
dues 1–10) plays an important role in the hemolytic
activity and that the synthetic peptide P1–30 is a good
model of both St II structure and function.
MATERIALS AND METHODS
Materials
All natural 9-fluorenylmethyloxycarbonyl (Fmoc) amino
acids and Rink-amide MBHAR resin were purchased from
Advanced Chemtech (Louisville, KY, USA) and Novabio-
chem (San Diego, CA, USA). Solvents and reagents were
from Sigma–Aldrich Co (St. Louis, MO, USA) and Fluka
(Switzerland). Polyethylene glycol was obtained from
Fluka (Buchs, Switzerland). Sticholysin II was purified
from the sea anemone S. helianthus according to Lanio
et al.1
Methods
Peptide Synthesis. The peptides (with amidated C-termi-
nus) were synthesized manually according to the standard
N�-Fmoc protecting-group strategy.22 The following side
chain protecting groups were used: Boc (t-butoxycarbonyl)for K; tBut (t-butyl) for D, S, T, and E; and Pmc (2,2,5,7,8-
pentamethyl-chromane-6-sulfonyl) for R. After the cou-
pling of the C-terminal amino acid to 4-(20,40-dimethoxy-
phenyl-Fmoc-aminomethyl)-phenoxyacetamido-norleucyl-
(4-methylbenzhydrylamine) resin (Rink-amide-MBHAR),
the successive �-amino group deprotection and neutraliza-
tion steps were performed in 20% piperidine/dimehtylfor-
mamide (DMF) for 20 min. The amino acids were coupled
at threefold excess using diisopropylcarbodiimide/N-hydroxybenzotriazole (HOBt) in DMF and, if necessary, 2-
(1H-benzotriazole-1-yil)-1,1,3,3-tetramethyluroniumhexa-
fluoro-phosphate/HOBt/diisopropylethylamine in 20% dimethyl
sulfoxide (DMSO)/N-methylpiperidinone. After a 2-h cou-
pling time, the ninhydrin test was performed to estimate the
completeness of the reaction. Cleavage from the resin and
removal of the side chain protecting groups were simultane-
ously performed with Reagent K (82.5% trifluoroacetic acid
(TFA), 5% thioanisole, 2.5% ethanedithiol, and 5% water)
over 2 h. In this procedure, the crude peptides were precipi-
tated with anhydrous ethyl ether, separated from soluble
nonpeptide material by centrifugation, extracted into 5%
acetic acid in water, and lyophilized. The peptides, after
dissolution in 0.045% TFA/H2O (solvent A), were purified
by semipreparative HPLC on a Shimadzu system (Tokyo,
Japan) using a reverse phase C18 column with a linear gra-
dient 20–70% solvent B (0.036% TFA/acetonitrile) over
150 min. The flow rate was 5 mL/min. UV detection was
carried out at 220 nm. The peptides’ homogeneity was
checked by analytical HPLC (Varian, Walnut Creek, CA,
USA), using solvents A and B with a linear gradient of 5–
95% solvent B for 30 min, at a flow rate of 1.5 mL/min and
UV detection at 220 nm. The identity of the peptides was con-
firmed by electrospray mass spectrometry on a ZMD model
apparatus (Micromass, Manchester, UK) and amino acid anal-
ysis (Shimadzu model LC-10A/C-47A, Tokyo, Japan).
CD Studies. Circular dichroism spectra were obtained in
0.5 mm path length cuvettes, at room temperature (22
6 2 8C) using a Jobin Yvon CD6 spectropolarimeter (Longju-
meau, France). The instrument was routinely calibrated with
an aqueous solution of recrystallized D-10-camphorsulfonic
acid. Data are expressed as mean residue molar ellipticity,
[�] (in deg � cm2 � dmol–1). pH titration was performed using
5 mM phosphate–borate–citrate (PBC) buffer. The pH was
adjusted by adding small amounts of NaOH. Variable ionic
strength experiments were performed at pH 4.0; the ionic
strength was adjusted by adding increasing amounts of
NaCl. As for variable TFE concentration, samples were pre-
pared by mixing appropriate amounts of two peptide stock
solutions, one in 100% TFE and the other in aqueous solu-
tion, pH 4.0.
Hemolytic Activity. HA was evaluated turbidimetrically at
600 nm at room temperature (22 6 2 8C) in a Labsystems
microplate reader (Helsinki, Finland) as previously described.4
Erythrocyte suspensions were prepared using pooled fresh
human red blood cells (RBC), washed, and resuspended in
physiological Tris-buffered saline (TBS, 145 mM NaCl,
10 mM Tris–HCl, pH 7.4). The RBC suspensions were
diluted to an absorbance of 0.1 at 600 nm. Peptide samples
were twofold serially diluted in saline buffer in a flat-bottom
96-well microplate, rendering peptide concentrations rang-
ing from 0.075 to 110 �M. The reaction was started by
adding the same volume of erythrocyte suspension to each
well (200 �l final volume) and the decrease in absorbance
was recorded as a function of time with intermittent shaking.
The loss of turbidity was quantitatively related to the toxin
HA.4 In some cases, the HA was quantitatively expressed
by HC50, the toxin concentration needed to elicit 50% disrup-
tion of the RBC ensemble.23 Peptides were dissolved in
DMSO (0.5%, vol:vol) to improve their solubility, in particular
that of P1–30.
Inhibition of St II HA by P11–30. Inhibition of St II HA
by sublytic P11–30 concentrations was assayed by preincu-
bating the cell suspension with a fixed peptide concentra-
tion for 30 min at 258C. Hemolysis was started by adding
the cell suspension to wells with two different St II concen-
trations to attain 1.1 and 2.6� 105 peptide/St II molar ratios.
Pore Size Determination. Pore size was determined in
RBC prepared as described above. Briefly, in each well, a
fixed concentration (20 or 160 �M) of P1–30 was present,
in a final volume of 100 �L of TBS, with or without 60 mM
of a polyethylene glycol series: PEG200, PEG400, PEG600,
PEG900, PEG1000, and PEG1500.3 The reaction was
Peptides from the N-terminus of Sticholysin II 171
Biopolymers (Peptide Science) DOI 10.1002/bip

started by adding 100 �L of RBC, at a titer corresponding
to an initial absorbance at 600 nm of around 0.1. The micro-
plate was stirred and read every 10 s during 45 min. Addi-
tion of large osmoticants increased the half-time of P1–30–
induced hemolysis (t½), in a size-dependent manner. The
difference t½ – t½8, the half-times in the presence and
absence of osmotic protectants, respectively, was used as an
estimate of the introduced delay; this parameter measures
the time necessary for the osmolite to diffuse inside the cell
through the toxin-induced lesions. Accordingly, 1/(t½ – t½8)is an estimate of the permeability of the PEGs through the
pore, which can be used to build a Renkin plot24,25 reporting
the relative permeability of the molecule versus its size.
This measurement allows the estimation of the size of the
lesion originated by P1–30 in erythrocytes.3
RESULTS AND DISCUSSION
Conformational Properties of St II’sN-terminal Peptides: CD Studies
St II is the most potent cytolysin produced by the sea
anemone S. helianthus exerting hemolytic activity via
pore formation in the membrane.3 It is likely that the
N-terminal sequence plays an important role in this
event by means of the interaction with the target cell
membrane. This is suggested by the presence of
hydrophobic (residues 1–10) and highly amphipathic
(residues 14–35) sequences in the St II N-termi-
nus26,27 and is in agreement with evidence collected
for homologous EqT II.14 The toxin N-terminal
region would be responsible for insertion, destabiliza-
tion of the target membrane, and organization of the
pore. To investigate the role of the N-terminal region
of St II in the mechanism of pore formation, two pep-
tides from the N-terminal sequence of St II were syn-
thesized in an attempt to model the corresponding
regions in the whole protein. An analogous experi-
mental approach has been used to characterize the
contribution of different regions of another hemoly-
sin, the lectin Cel-III.28 We also used this approach to
study another family of membrane-bound proteins, G
protein–coupled receptors (GPCR), as well as the �subunit of the G protein. We found that fragments of
GPCR corresponding to extramembranous loops tend
to display conformational propensities similar to
those found or calculated for the same sequences in
the whole protein.29–34 Similar results were obtained
for the C-terminus of the G protein � subunit.35
The 1–30 sequence of St II is ALAGTIIA-
GASLTFQVLDKVLEELGKVSRK.26 The peptides
used in this study contained either residues 1–30 (P1–
30) or residues 11–30 (P11–30). While the first ten
residues correspond to an essentially hydrophobic
stretch,27 residues 14–23 correspond to the toxin’s N-
terminal �-helix, as determined by X-ray crystallo-
graphy.10 This helix is of amphipathic nature, as cal-
culated using the algorithm of Eisenberg et al.36,37
(results not shown).
Making use of the algorithm of Rost and Sander,38
theoretical predictions (Figure 1A and B) indicate
that both peptides display a high propensity to adopt
an �-helical conformation between residues 14 and
24 (of the protein), in excellent agreement with the
X-ray data, which show that the amphipathic �-helixoccurs in the F14–E23 stretch.10 Moreover, in P1–30
(Figure 1A), amino acids 11–13 and 24 also display a
considerable propensity to acquire �-helical confor-mation. Helical propensity of a similar magnitude
(> 60%) is also predicted for residues 25–30 (Figure
1A). Due to end effects, the absence of the first ten
residues in P11–30 leads to a decrease of the average
propensity of residues 11–30 to acquire �-helicalconformation. Thus, while the average �-helical con-tent of these residues in P1–30 is 92.5%, this value
decreases to 68.3% in P11–30. This analysis shows
that the first ten residues influence the ability of the
subsequent residues to form an �-helix. The helical
wheel projection39 in Figure 1C corroborates the �-helix amphipathic nature: while D18, K19, E22, E23,
and K26 form the polar face, F14, V16, L17, V20, L21,
and L24 give rise to the helix apolar face.
At pH 7.0, the CD spectrum of P1–30 in aqueous
solution (Figure 2A) presents a positive band cen-
tered at 195 nm, a negative band at 220 nm, a
shoulder at ca. 208 nm, and a crossover point at
205 nm, indicating that P1–30 adopts a �-sheet con-formation, very likely resulting from peptide aggrega-
tion. This process is probably favored by the highly
hydrophobic 1–10 sequence. �-Sheet peptides usuallygive rise to CD spectra displaying a positive band
between 195 and 200 nm, characteristic of the amide
p?p* transition, and a negative band around 216 nm
due to the amide n?p* transition.40 In addition, a
crossover point between 204 and 207 nm is usually
observed.41 On the other hand, the CD spectra of
P11–30 present two negative bands, one more intense
centered at 202 nm and another at 225 nm, showing
that this fragment preferentially adopts a flexible con-
formation under these experimental conditions. The
negative band around 225 nm suggests that the pep-
tide is partially folded.40
The X-ray crystallographic structure of St II’s
soluble monomer10 revealed a small �-strand in the
N-terminal region between residues I6 and A8, fol-
lowed by an �-helix extending from F14 to E23. The
absence of this region in P11–30 is probably respon-
sible for its enhanced aqueous solubility. For this rea-
son, we investigated the effect of concentration on
172 Casallanovo et al.
Biopolymers (Peptide Science) DOI 10.1002/bip

the peptides conformation. The CD spectra of P11–
30 remained practically unaltered in the whole con-
centration range studied (5–80 �M, data not shown),
corroborating the notion that this peptide does not
have a tendency to aggregate. On the other hand, P1–
30 displays a �-sheet conformation between 20 and
80 �M, as a consequence of peptide aggregation (Fig-
ure 2B). For 5 �M peptide, the lowest concentration
assayed, a spectrum suggestive of �-helical confor-mation was obtained (Figure 2B); however, the noise
prevented a more detailed spectral analysis. It is con-
FIGURE 1
FIGURE 2 (A) Far-UV CD spectra of P1–30 (—) and
P11–30 (----) in aqueous solution, pH 7.0. Peptide concen-
tration: 80 �M. (B) CD spectra of P1–30 as a function of
peptide concentration (�M): 5 (.—); 20 (----); 40 (� � � � � �);60 (�-�-�); 80 (-� � �-� � �-).
FIGURE 1 Secondary structure prediction according to
Rost and Sander38 for P1–30 (A) and P11–30 (B), and heli-
cal wheel diagram for residues 1–30 (C) according to
Schiffer and Edmundson.39
Peptides from the N-terminus of Sticholysin II 173
Biopolymers (Peptide Science) DOI 10.1002/bip

ceivable that under physiological conditions aggrega-
tion might play an important role in the mechanism
of actinoporins pore formation. It has been proposed
that the N-terminal segment of actinoporins plays a
relevant role in pore formation, an event that would
be preceded by protein oligomerization.14,42
To gain insight into the nature of the forces
involved in peptide folding and aggregation, we also
studied the effect of pH on peptide conformation.
Both peptides share the same ionizable groups: the
terminal amino group, D18, K19, E22, E23, K26, R29,
and K30 (the C-terminus is amidated); however,
only P1–30 exhibited pH-dependent conformational
changes (Figure 3A). At pH 4.0 and below, the CD
spectra of P1–30 display two negative bands, one at
202 nm and another at 225 nm, suggesting the contri-
bution of two populations, one extended and the other
partially folded.40 As the pH is increased to 6.0,
despite the propensity of P1–30 to acquire �-helicalconformation (Figure 1A), the CD spectrum changes
to that of a �-sheet, displaying a positive band cen-
tered at 198 nm, a negative band at 221 nm, and a
shoulder at ca. 208 nm. No further conformational
changes were observed with increasing pH; above pH
8.0, flattening of the positive band occurred, which
might be related to light scattering due to peptide
aggregation. In fact, at alkaline pH, particles could be
visually detected in suspension, evincing aggregation.
The observed conformational change is probably
induced by changes in the extent of dissociation of
ionizable groups, modifying the charge balance (see
below). However, despite the fact that P1–30 and
P11–30 have the same ionizable groups, the latter
peptide displayed a disordered conformation through-
out the pH range studied (data not shown). The differ-
ent spectral behavior of both peptides is most likely
due to the N-terminal hydrophobic segment. Thus,
changes in the ionization degree and the presence of
the 1–10 hydrophobic stretch, which acts as a nuclea-
tion site, lead to P1–30 aggregation, giving rise to the
�-sheet features in the peptide’s CD spectra at pH 6.0
and above.
Figure 3B shows the effect of pH on the mean
molar residue ellipticity at 222 nm ([�]222) and on the
peptides formal charge calculated based on the pKas of
the individual ionizable groups. This calculation does
not take into account possible changes in pKa due to
charge effects of neighboring residues.34 For P1–30,
the greatest changes in [�]222 occur in the pH range
between 3.0 and 6.0. The titration curve shows a mid-
point at ca. pH 4.5. A smaller change is seen between
pH 8 and 11, with a midpoint at ca. pH 9.3. The
increase in [�]222 in this region is probably due to flat-
tening of the spectrum resulting from peptide aggrega-
tion, which causes light scattering. It is noteworthy to
analyze the occurrence of the midpoints in connection
with the formal charge versus pH curve. At pH ca. 4.5
and 9.3, the peptide’s formal charge would be approxi-
mately þ2.5 and þ1, respectively. On the other hand,
the formal charge curve indicates the peptide would
bear a net charge of zero at a pH close to 10. The fact
that extensive aggregation is detected at pH 8 suggests
that pK shifts occurred due to the mutual influence of
the charged residues on each other’s ionization and
that, very likely, the zero net charge was reached at a
pH lower than that predicted using the pKas of the
individual amino acids. In contrast with the above
results, in the case of P11–30, [�]222 remained practi-
cally unaltered between pH 2.0 and 6.0; a small
decrease of molar ellipticity was observed between pH
FIGURE 3 (A) CD spectra of 80 �M P1–30 in aqueous
solution as a function of pH. pH: 2 (—); 4 (– – – ); 6
(� � � � � �); 8 (�-�-�-�) 10 (-� � �-� � �-); 12 (-----). (B) Formal
charge (^) and mean molar residue ellipticity at 222 nm
([�]222) in the CD spectra of P1–30 (&) and P11–30 (*) as
a function of pH.
174 Casallanovo et al.
Biopolymers (Peptide Science) DOI 10.1002/bip
6 and 8, followed by a slight increase between pH 8
and 11. The differences between P1–30 and P11–30
again point to the role of residues 1–10 in the confor-
mational behavior of both peptides.
Studies at varying ionic strength corroborated the
effects found with variable pH. The CD spectrum of
P1–30 at pH 4.0 continually changed with increasing
ionic strength from one of a random conformation in
the absence of salt to that of a predominantly �-sheetstructure at 100 mM NaCl. Concomitantly, �min at
201 nm shifted to higher wavelengths (Figure 4A). A
second minimum around 224 nm is observed at
10 mM NaCl; as the salt concentration increases, this
minimum is blue shifted to 220 nm. At pH 4.0 the
peptides are positively charged and, therefore, charge
repulsion prevents P1–30 from acquiring a higher
content of secondary structure; as the ionic strength
increases, charge screening occurs, enabling the pep-
tide to aggregate and fold into a �-sheet conforma-
tion. Interestingly, the spectra show that the aggrega-
tion process takes place stepwise and that increasing
the ionic strength has a less pronounced effect than
increasing the pH. On the other hand, P11–30 dis-
played minimal changes of [�]222, evincing the reten-
tion of an extended conformation (Figure 4B). The
differences in the CD spectra of P1–30 and P11–30
when obtained at the same pH or same ionic strength
clearly point to the modulating effect of the first ten
hydrophobic amino acids on the peptide conforma-
tional properties.
We also examined the effect of TFE, a well-known
secondary structure inducer,43 on the conformation of
St II peptides. Figure 5 shows the CD spectra of P1–
30 as a function of TFE. In aqueous solution at pH
4.0, the peptide adopts an extended conformation, as
seen by the negative band around 200 nm. The pep-
tide acquires increasing �-helical conformation with
increasing TFE, as indicated by the gradual decrease
of [�]222 up to 40% TFE.40 The inset in Figure 5
shows the �-helical content of both P1–30 and P11–
30 as a function of TFE concentration, calculated
according to Rohl and Baldwin.44 It is seen that the
secondary structure content of both peptides in-
creased up to around 40% TFE, remaining constant
thereafter. Moreover, P1–30 presents a higher helical
content, corroborating theoretical predictions (Figure
1). According to the inset in Figure 5, at 100% TFE
P1–30 has around 60% �-helical content, which cor-
responds to about 18 residues.
We have previously shown that binding of St II to
model membranes results in small changes in the tox-
in’s secondary structure.7 Moreover, FTIR data indi-
cated a 5% increase in St II �-helical content uponlipid binding.15 Such an increase corresponds to
approximately 9 residues (the protein has 175 amino
acids). We suggest that the ca. 18 residues of P1–30
found in �-helical conformation in TFE consist of the
F14–E23 stretch found in the toxin’s X-ray structure
plus 8 additional residues. The Rost and Sander plot38
of Figure 1A shows that residues 11–13 and 24 also
display a considerable propensity to acquire �-helicalconformation. Moreover, it has been shown that
amino acids such as G, I, and V that do not display a
propensity to �-helical conformation in aqueous solu-
tion, do so in a bilayer or membrane mimetic environ-
ment such as TFE.45 Therefore, the hydrophobic
sequence in the N-terminal region enhances the pro-
pensity of P1–30 to adopt �-helical conformation. On
FIGURE 4 (A) Effect of ionic strength on CD spectra of
P1–30 in aqueous solution, pH 4.0. [NaCl] (mM): 0 (—);
10 (– – –); 30 (� � � � � �); 50 (�-�-�-); 100 (-� � �-� � �-). (B) Mean
molar residue ellipticity at 222 nm ([�]222) as a function of
ionic strength for P1–30 (&) and P11–30 (*). Peptide con-
centration: 80 �M.
Peptides from the N-terminus of Sticholysin II 175
Biopolymers (Peptide Science) DOI 10.1002/bip
the other hand, P11–30 acquires approximately 45%
�-helical content in TFE, indicating that around 9
residues are involved in the �-helical structure. Thelack of the first ten residues in P11–30 could account
for its significantly lower �-helical content, evincingthe importance of the N-terminus for helix stabiliza-
tion.
The increased length of the helix in the membrane
mimetic environment compared to that in the crystal
structure of the monomeric toxin (18 versus 10 resi-
dues, respectively) could represent a step in the
mechanism of pore formation. It has been proposed
that, upon binding to the membrane, the actinoporins
N-terminus detaches from the protein surface and the
amphipathic �-helix lays flat on the membrane sur-
face.14 A subsequent event would be the insertion of
the 1–10 hydrophobic stretch in the bilayer accompa-
nied by a membrane-induced increase of �-helicalcontent of this stretch. Oligomerization of this struc-
ture would finally give rise to the functional pore. It
should be noticed that helix formation by residues
downstream to L24 would keep the amphipathic na-
ture of the helix (Figure 1C). At this point we cannot
define whether residues from the C-terminal portion
also participate in the lengthening of the helix. It is
also worthwhile noticing that residues 4–8 contain
the GXXXA motif, which is similar to the GXXXG
motif present in the transmembrane helix of glyco-
phorin A and other proteins, considered to be impor-
tant for protein dimerization.46,47 Although it has
been found that the G to A mutation exerts an unfav-
orable effect in the energetics of glycophorin A dime-
rization, the mutated sequence is also considered to
be a dimerization motif.48 It is conceivable that this
motif also plays a role in P1–30 aggregation and in
peptide and toxin oligomerization during pore forma-
tion.
Hemolytic Activity of St II N-terminalPeptides
Native St II exhibits hemolytic activity in the pico-
molar concentration range.4 Hence, we decided to test
the ability of the peptides to promote human red
FIGURE 5 Effect of TFE on P1–30 CD spectra. TFE
(%, v/v): 0 (—); 10 (– – –); 20 (� � � � � �); 30 (�-�-�-�); 40
(-� � �-� � �-); 80 (-----); 100 ( � � � � � � ). (Inset) �-Helical con-tent (%) as a function of TFE, calculated according to Rohl
and Baldwin.44 Peptide concentration: 80 �M. P1–30 (*)
and P11–30 (!).
FIGURE 6 (A) Time course of P1–30–induced hemoly-
sis of human RBC. The time course of hemolysis was fol-
lowed by the decrease in turbidity of a cell suspension ini-
tially adjusted to an apparent absorbance of 0.1 at 600 nm.
The peptide dissolved in 0.5% DMSO was added at concen-
trations (�M): 0.075 (þ), 0.15 (*), 0.3 (q), 0.6 (!), 1.2
(~), 5.0 (&). Hemolysis was started by adding the RBC
suspension. (B) Comparison between the hemolytic activity
of St II (n) and P1–30 (l). HA was estimated from the
extent of hemolysis after 30 min and plotted as a function
of St II or P1–30 concentration.
176 Casallanovo et al.
Biopolymers (Peptide Science) DOI 10.1002/bip
blood cell lysis. As previously shown, since P1–30
has a strong tendency to aggregate in aqueous solu-
tion (Figure 2B), we attempted to overcome this
problem by dissolving the peptides in a solution con-
taining DMSO so that the solvent final concentration
in the HA assay was 0.25%. This DMSO concentra-
tion neither affected the apparent red blood cell
stability nor the activity of St II (data not shown).
Figure 6A shows the time course of P1–30–eli-
cited hemolysis. The rate of cell integrity loss and the
extent of lysis were dose dependent. The peptide
effect occurred in the concentration range between
0.075 and 2 �M, while that of the toxin is in the nano-
molar range (0.001–0.04 nM); therefore St II is ca.
105-fold more active than P1–30 (Figure 6B).
The fact that P1–30 exhibits HA, albeit in a higher
concentration range, reinforces the notion that this
peptide can mimic not only the conformational, but
also the functional behavior of St II. Differences in
the order of the HA very likely arise from the absence
in P1–30 of the exposed aromatic cluster in actino-
porins9,10 that mediates the initial attachment to
membranes, considered to be the first step of the
pore-forming mechanism.14,42 In fact, steric shielding
of the aromatic cluster or mutation of W112 and W116
to F significantly reduced the EqT II–lipid interac-
tion.42
The rate of P1–30 and P11–30–elicited hemolysis
was expressed as 1/t50 versus peptide concentration,
where t50 is the time necessary to attain 50% cell rup-
ture. This parameter was obtained from hemolysis
time courses such as those in Figure 6A. Both pepti-
des displayed concentration-dependent HA but to dif-
ferent degrees. The hemolysis rate of P1–30 was
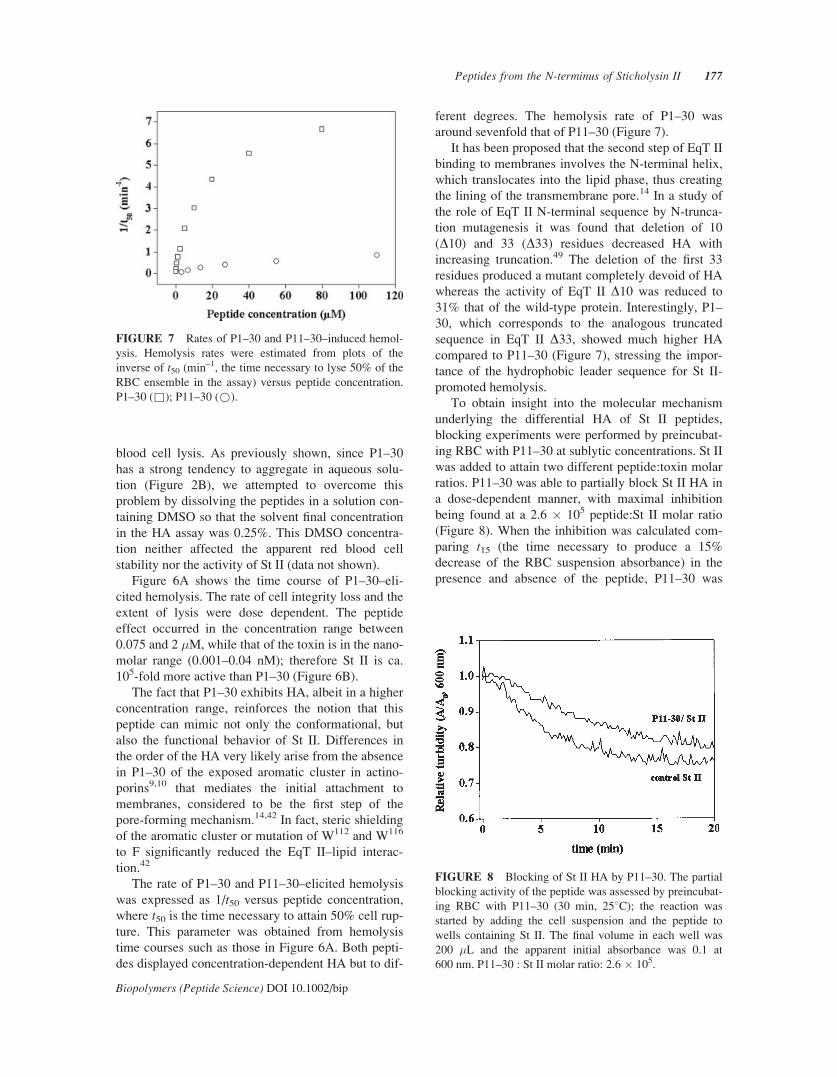
around sevenfold that of P11–30 (Figure 7).
It has been proposed that the second step of EqT II
binding to membranes involves the N-terminal helix,
which translocates into the lipid phase, thus creating
the lining of the transmembrane pore.14 In a study of
the role of EqT II N-terminal sequence by N-trunca-
tion mutagenesis it was found that deletion of 10
(D10) and 33 (D33) residues decreased HA with
increasing truncation.49 The deletion of the first 33
residues produced a mutant completely devoid of HA
whereas the activity of EqT II D10 was reduced to
31% that of the wild-type protein. Interestingly, P1–
30, which corresponds to the analogous truncated
sequence in EqT II D33, showed much higher HA
compared to P11–30 (Figure 7), stressing the impor-
tance of the hydrophobic leader sequence for St II-
promoted hemolysis.
To obtain insight into the molecular mechanism
underlying the differential HA of St II peptides,
blocking experiments were performed by preincubat-
ing RBC with P11–30 at sublytic concentrations. St II
was added to attain two different peptide:toxin molar
ratios. P11–30 was able to partially block St II HA in
a dose-dependent manner, with maximal inhibition
being found at a 2.6 � 105 peptide:St II molar ratio
(Figure 8). When the inhibition was calculated com-
paring t15 (the time necessary to produce a 15%
decrease of the RBC suspension absorbance) in the
presence and absence of the peptide, P11–30 was
FIGURE 7 Rates of P1–30 and P11–30–induced hemol-
ysis. Hemolysis rates were estimated from plots of the
inverse of t50 (min–1, the time necessary to lyse 50% of the
RBC ensemble in the assay) versus peptide concentration.
P1–30 (&); P11–30 (*).
FIGURE 8 Blocking of St II HA by P11–30. The partial
blocking activity of the peptide was assessed by preincubat-
ing RBC with P11–30 (30 min, 258C); the reaction was
started by adding the cell suspension and the peptide to
wells containing St II. The final volume in each well was
200 �L and the apparent initial absorbance was 0.1 at
600 nm. P11–30 : St II molar ratio: 2.6 � 105.
Peptides from the N-terminus of Sticholysin II 177
Biopolymers (Peptide Science) DOI 10.1002/bip
found to inhibit the toxin HA by a factor of two. P1–
30 showed HA in a lower micromolar concentration
range than P11–30 (Figure 7), hence it was not possi-
ble to assay its blocking activity in the same concen-
tration conditions. Furthermore, no synergistic effect
was observed when both P1–30 and St II were present
in the hemolytic assay (data not shown).
We hypothesize that the blocking activity of P11–
30 could result from either the interaction of the pep-
tide with the RBC membrane, resulting in partial sat-
uration of the toxin binding sites, or the formation of
peptide–St II heterooligomers capable of binding to
the membrane but unable to form competent pores. In
this case, nonfunctional P11–30/St II oligomers would
form, most probably via an interaction between the
peptide and St II’s N-terminus. Interhelical contacts
would stabilize the complex and, at the same time,
shield part of the toxin residues required for pore for-
mation. Such complexation could prevent the detach-
ment of the St II N-terminus from the whole protein
fold, not allowing the binding of this region to the
membrane surface and its further insertion.
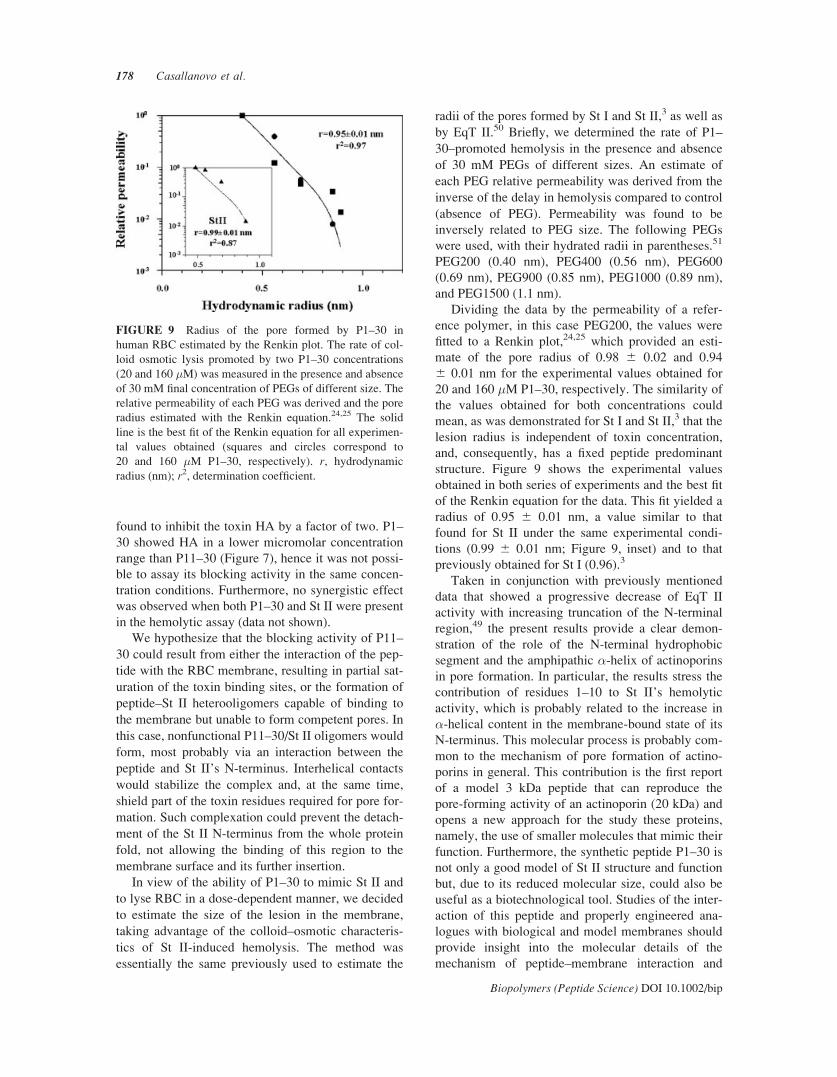
In view of the ability of P1–30 to mimic St II and
to lyse RBC in a dose-dependent manner, we decided
to estimate the size of the lesion in the membrane,
taking advantage of the colloid–osmotic characteris-
tics of St II-induced hemolysis. The method was
essentially the same previously used to estimate the
radii of the pores formed by St I and St II,3 as well as
by EqT II.50 Briefly, we determined the rate of P1–
30–promoted hemolysis in the presence and absence
of 30 mM PEGs of different sizes. An estimate of
each PEG relative permeability was derived from the
inverse of the delay in hemolysis compared to control
(absence of PEG). Permeability was found to be
inversely related to PEG size. The following PEGs
were used, with their hydrated radii in parentheses.51
PEG200 (0.40 nm), PEG400 (0.56 nm), PEG600
(0.69 nm), PEG900 (0.85 nm), PEG1000 (0.89 nm),
and PEG1500 (1.1 nm).
Dividing the data by the permeability of a refer-
ence polymer, in this case PEG200, the values were
fitted to a Renkin plot,24,25 which provided an esti-
mate of the pore radius of 0.98 6 0.02 and 0.94
6 0.01 nm for the experimental values obtained for
20 and 160 �M P1–30, respectively. The similarity of
the values obtained for both concentrations could
mean, as was demonstrated for St I and St II,3 that the
lesion radius is independent of toxin concentration,
and, consequently, has a fixed peptide predominant
structure. Figure 9 shows the experimental values
obtained in both series of experiments and the best fit
of the Renkin equation for the data. This fit yielded a
radius of 0.95 6 0.01 nm, a value similar to that
found for St II under the same experimental condi-
tions (0.99 6 0.01 nm; Figure 9, inset) and to that
previously obtained for St I (0.96).3
Taken in conjunction with previously mentioned
data that showed a progressive decrease of EqT II
activity with increasing truncation of the N-terminal
region,49 the present results provide a clear demon-
stration of the role of the N-terminal hydrophobic
segment and the amphipathic �-helix of actinoporins
in pore formation. In particular, the results stress the
contribution of residues 1–10 to St II’s hemolytic
activity, which is probably related to the increase in
�-helical content in the membrane-bound state of its
N-terminus. This molecular process is probably com-
mon to the mechanism of pore formation of actino-
porins in general. This contribution is the first report
of a model 3 kDa peptide that can reproduce the
pore-forming activity of an actinoporin (20 kDa) and
opens a new approach for the study these proteins,
namely, the use of smaller molecules that mimic their
function. Furthermore, the synthetic peptide P1–30 is
not only a good model of St II structure and function
but, due to its reduced molecular size, could also be
useful as a biotechnological tool. Studies of the inter-
action of this peptide and properly engineered ana-
logues with biological and model membranes should
provide insight into the molecular details of the
mechanism of peptide–membrane interaction and
FIGURE 9 Radius of the pore formed by P1–30 in
human RBC estimated by the Renkin plot. The rate of col-
loid osmotic lysis promoted by two P1–30 concentrations
(20 and 160 �M) was measured in the presence and absence
of 30 mM final concentration of PEGs of different size. The
relative permeability of each PEG was derived and the pore
radius estimated with the Renkin equation.24,25 The solid
line is the best fit of the Renkin equation for all experimen-
tal values obtained (squares and circles correspond to
20 and 160 �M P1–30, respectively). r, hydrodynamic
radius (nm); r2, determination coefficient.
178 Casallanovo et al.
Biopolymers (Peptide Science) DOI 10.1002/bip

should allow the optimization of their potential appli-
cations.
We thank one of the reviewers for pointing out to us the
importance of the GXXXA motif in protein dimerization.
This work was supported by grants from FAPESP to SS and
EMC, and from IFS (2886) to MT, and by a CNPq-MES
cooperation project. We also acknowledge the following
fellowships: UNU-BIOLAC (travel, CA and MEL), CNPq
(research, SS and EMF) FAPESP (Ph.D., FC), CAPES
(M.Sc., FCS), CNPq-PIBIC (undergraduate, FJFO).
REFERENCES
1. Lanio, M. E.; Morera, V.; Alvarez, C.; Tejuca, M.;
Gomez, T.; Pazos, F.; Besada, V.; Martinez, D.;
Huerta, V.; Padron, G.; Chavez, M. A. Toxicon 2001,
39, 187–194.
2. Tejuca, M.; Dalla Serra, M.; Ferreras, M.; Lanio,
M.E.; Menestrina, G. Biochemistry 1996, 35, 14947–
14957.
3. Tejuca, M.; Dalla Serra, M.; Potrich, C.; Alvarez, C.;
Menestrina, G. J. Membr Biol 2001, 183, 125–135.
4. Martinez, D.; Campos, A. M.; Pazos, F.; Alvarez, C.;
Lanio, M. E.; Casallanovo, F.; Schreier, S.; Salinas,
R. K.; Vergara, C.; Lissi, E. Toxicon 2001, 39, 1547–
1560.
5. Alvarez-Valcarcel, C. A.; Dalla Serra, M.; Potrich, C.;
Bernhart, I.; Tejuca, M.; Martinez, D.; Pazos, F.;
Lanio, M. E; Menestrina, G. Biophys J 2001, 80,
2761–2774.
6. Lanio, M. E.; Alvarez, C.; Pazos, F.; Martinez, D.;
Martinez, Y.; Casallanovo, F.; Abuin, E.; Schreier, S.;
Lissi, E. Toxicon 2003, 4, 65–70.
7. Alvarez, C.; Casallanovo, F.; Shida, C. S.; Nogueira,
L. V.; Martinez, D.; Tejuca, M.; Pazos, I. F.; Lanio,
M. E.; Menestrina, G.; Lissi, E.; Schreier, S. Chem
Phys Lipids 2003, 122, 97–105.
8. Anderluh, G.; Macek, P. Toxicon 2002, 40, 111–124.
9. Athanasiadis, A.; Anderluh, G.; Macek, P.; Turk, D.
Structure 2001, 19, 341–346.
10. Mancheno, J. M.; Martin-Benito, J.; Martınez-Ripoll,
M.; Gavilanes, J. G.; Hermoso, J. A. Structure 2003,
11, 1319–1328.
11. Hinds, M. G.; Zhang, W.; Anderluh, G.; Hansen, P. E.;
Norton, R. S. J Mol Biol 2002, 315, 1219–1229.
12. Belmonte, G.; Menestrina, G.; Pederzolli, C.; Krizaj,
I.; Gubensek, F.; Turk, T.; Macek, P. Biochim Biophys
Acta 1994, 1192, 197–204.
13. Kristan, K.; Podlesek, Z.; Hojnik, V.; Gutierrez-
Aguirre, I.; Guncar, G.; Turk, D.; Gonzalez-Manas,
J. M.; Lakey, J. H.; Macek, P.; Anderluh G. J Biol
Chem 2004, 279, 46509–46517.
14. Malovrh, P.; Viero, G.; Dalla Serra, M.; Podlesek, Z.;
Lakey, J. H.; Macek, P.; Menestrina, G.; Anderluh, G.
J Biol Chem 2003, 278, 22678–22685.
15. Menestrina, G.; Cabiaux, V.; Tejuca, M. Biochem Bio-
phys Res Commun 1999, 254, 174–180.
16. Avila, A. D.; de Acosta, M. C.; Lage, A. Int J Cancer
1988, 42, 568–571.
17. Avila, A. D.; de Acosta, M. C.; Lage, A. Int J Cancer
1989, 43, 926–929.
18. Pederzolli, C.; Belmonte, G.; Dalla Serra, M.; Macek, P.;
Menestrina, G. Bioconjugate Chem 1995, 6, 166–173.
19. Tejuca, M.; Anderluh, G.; Macek, P.; Alvarez, C.;
Lanio, M. E.; Marcet, R.; Torres, D.; Sarracent, J.;
Dalla Serra, M.; Menestrina, G. Int J Parasitol 1999,
29, 489–498.
20. Tejuca, M.; Diaz, I.; Figueredo, R.; Roque, L.; Pazos,
F.; Martinez, D.; Iznaga-Escobar, N.; Perez, R.;
Alvarez, C.; Lanio, M. E. Int Immunopharmacol 2004,
4, 731–744.
21. Potrich, C.; Tomazzolli, R.; Dalla Serra M.; Anderluh,
G.; Malovrh, P.; Macek, P.; Menestrina, G.; Tejuca,
M. Bioconjugate Chem 2005, 16, 369–376.
22. Atherton, E.; Sheppard, R. C. Solid Phase Peptide
Synthesis: A Practical Approach; Oxford University
Press: Oxford, 1989.
23. Kabat, O.; Mayer, R. Experimental Immunochemistry;
Academic Press: New York, 1961.
24. Renkin, E. M. J Gen Physiol 1954, 38, 225–243.
25. Ginsburg, H.; Stein, W. D. J Membr Biol 1987, 96,
1–10.
26. Huerta, V.; Morera, V.; Guanche, Y.; Chinea, G.; Gon-
zalez, L. J.; Betancourt, L.; Martinez, D.; Alvarez, C.;
Lanio, M. E.; Besada, V. Toxicon 2001, 39, 1253–
1256.
27. Martınez, D.; Morera, V.; Garcia, Y.; Martinez, Y.;
Casallanovo, F.; Potrich, C.; Dalla Serra, M.; Schreier,
S.; Menestrina, G.; Lissi, E.; Raida, M.; Alvarez, C.;
Lanio, M. E., submitted.
28. Hatakeyama, T.; Suenaga, T.; Eto, S.; Niidome, T.;
Aoyagi, H. J Biochem 2004, 135, 65–70.
29. Pertinhez, T. A.; Nakaie, C. R.; Carvalho, R. S.; Paiva,
A. C. M.; Tabak, M.; Toma, F.; Schreier, S. FEBS Lett
1995, 375, 239–242.
30. Pertinhez, T. A.; Nakaie, C. R.; Paiva, A. C. M.;
Schreier, S. Biopolymers 1997, 42, 821–829.
31. Pertinhez, T. A.; Krybus, R.; Cilli, E. M.; Paiva, A. C. M.;
Nakaie, C. R.; Franzoni, L.; Sartor, G.; Spisni, A.; Schre-
ier, S. J Pept Sci 2002, 8, 23–35.
32. Franzoni, L.; Nicastro, G.; Pertinhez, T. A.; Tato, M.;
Nakaie, C. R.; Paiva, A. C. M.; Schreier, S.; Spisni, A.
J Biol Chem 1997, 272, 9734–9741.
33. Franzoni, L.; Nicastro, G.; Pertinhez, T. A.; Oliveira,
E.; Nakaie, C. R; Paiva, A. C. M.; Schreier, S.; Spisni,
A. J Biol Chem 1999, 274, 227–235.
34. Salinas, R. K.; Shida, C. S.; Pertinhez, T. A.; Spisni,
A.; Nakaie, C. R.; Paiva, A. C. M.; Schreier, S. Bio-
polymers 2002, 65, 21–31.
35. Casallanovo, F.; Nakaie, C. R.; Paiva, A. C. M.; Schre-
ier, S. In Peptide Revolution: Genomics, Proteomics
and Therapeutics; Chorev, M.; Sawyer, T. K., Eds.;
American Peptide Society: San Diego, 2004; pp 250–
251.
Peptides from the N-terminus of Sticholysin II 179
Biopolymers (Peptide Science) DOI 10.1002/bip

36. Eisenberg, D.; Weiss, R. M.; Terwilliger, T. C. Proc
Natl Acad Sci U S A 1984, 81, 140–144.
37. Eisenberg, D.; Schwarz, E.; Komaromy, M.; Wall, R.
J Mol Biol 1984, 179, 125–142.
38. Rost, B.; Sander, C. Methods Mol Biol 2000, 143, 71–
95.
39. Schiffer, M.; Edmundson, A. B. Biophys J 1967, 7,
121–135.
40. Woody, R. W. In The Peptides, Vol. 7; Hruby V. J.,
Ed.; Academic Press: New York, 1985; pp 15–114.
41. Ganesh, S.; Prakash, S.; Jayakumar, R. Biopolymers
2003, 70, 346–354.
42. Hong, Q.; Gutierrez-Aguirre, I.; Barlic, A.; Malovrh,
P.; Kristan, K.; Podlesek, Z.; Macek, P.; Turk, D.;
Gonzalez-Manas, J. M.; Lakey, J. H.; Anderluh, G.
J Biol Chem 2002, 277, 41916–41924.
43. Buck, M. Q Rev Biophys 1998, 31, 297–355.
44. Rohl, C. A.; Baldwin, R. L. Methods Enzymol 1998,
295, 1–26.
45. Deber, C. M.; Liu, L. P.; Wang, C. J Pept Res 1999,
54, 200–205.
46. Curran, A. R.; Engelman, D. M. Curr Opin Struct Biol
2003, 13, 412–417.
47. Senes, A.; Engel, D. E.; DeGrado, W. F. Curr Opin
Struct Biol 2004, 14, 465–479.
48. Fleming, K. G.; Engelman, D. M. Proc Natl Acad Sci
U S A 2001, 98, 14340–14344.
49. Anderluh, G.; Pungercar, J.; Krizaj, I.; Borut, S.; Guben-
sek, F.; Macek, P. Protein Eng 1997, 10, 751–755.
50. Belmonte, G.; Pederzolli, C.; Macek, P.; Menestrina,
G. J Membr Biol 1993, 131, 11–22.
51. Kuga, S. J Chromatogr 1981, 206, 449–461.
180 Casallanovo et al.
Biopolymers (Peptide Science) DOI 10.1002/bip