Mn influence on the electrochemical behaviour of Li3V2(PO4)3 cathode material
9
This article appeared in a journal published by Elsevier. The attached copy is furnished to the author for internal non-commercial research and education use, including for instruction at the authors institution and sharing with colleagues. Other uses, including reproduction and distribution, or selling or licensing copies, or posting to personal, institutional or third party websites are prohibited. In most cases authors are permitted to post their version of the article (e.g. in Word or Tex form) to their personal website or institutional repository. Authors requiring further information regarding Elsevier’s archiving and manuscript policies are encouraged to visit: http://www.elsevier.com/copyright
-
Upload
independent -
Category
Documents
-
view
1 -
download
0
Transcript of Mn influence on the electrochemical behaviour of Li3V2(PO4)3 cathode material
This article appeared in a journal published by Elsevier. The attachedcopy is furnished to the author for internal non-commercial researchand education use, including for instruction at the authors institution
and sharing with colleagues.
Other uses, including reproduction and distribution, or selling orlicensing copies, or posting to personal, institutional or third party
websites are prohibited.
In most cases authors are permitted to post their version of thearticle (e.g. in Word or Tex form) to their personal website orinstitutional repository. Authors requiring further information
regarding Elsevier’s archiving and manuscript policies areencouraged to visit:
http://www.elsevier.com/copyright
Author's personal copy
Electrochimica Acta 56 (2011) 2648–2655
Contents lists available at ScienceDirect
Electrochimica Acta
journa l homepage: www.e lsev ier .com/ locate /e lec tac ta
Mn influence on the electrochemical behaviour of Li3V2(PO4)3 cathode material
Marcella Bini, Stefania Ferrari, Doretta Capsoni ∗, Vincenzo MassarottiDepartment of Physical Chemistry “M. Rolla”, University of Pavia, Viale Taramelli 16, 27100 Pavia, Italy
a r t i c l e i n f o
Article history:Received 6 July 2010Received in revised form 6 December 2010Accepted 6 December 2010Available online 16 December 2010
Keywords:Li3V2(PO4)3
Mn substitutionCyclic voltammetryXRPDCathode material
a b s t r a c t
The role played by the substitution of Mn on the electrochemical behaviour of Li3V2(PO4)3 has beeninvestigated. Independently of the synthesis route, the Mn doping improves the electrochemical featureswith respect to the undoped samples. Different reasons can be taken into consideration to explain theelectrochemical enhancement. In the sol–gel synthesis the capacity slightly enhances due to the Mnsubstitution on both the V sites, within the solubility limit x = 0.124 in Li3V2−xMnx(PO4)3. In the solidstate synthesis the significant capacity enhancement is preferentially due to the microstructural featuresof the crystallites and to the LiMnPO4 phase formation.
© 2010 Elsevier Ltd. All rights reserved.
1. Introduction
The research on cathode materials for lithium rechargeable bat-teries is now very active due to the high demand of power sourceswith low environmental impact [1,2]. Besides the well knownLiCoO2, LiNiO2 and LiMn2O4 [3,4], the lithium metal phosphatesare promising compounds due to their high intercalation voltage(about 4 V depending on the material) and long life cycling and sta-bility [5–7]. Among the phosphates, the olivine type materials arewidely investigated [8–11] but, at present, compounds with NASI-CON structure are emerging. In particular, Li3V2(PO4)3 is attractingmuch interest due to its high theoretical capacity (197 mAh/g) andits thermal stability [12] that make it suitable for high power den-sity and large scale applications. However, as for the major partof the compounds belonging to this class of materials, the lowelectronic conductivity and cyclability limit their wide applica-tion. In order to overcome these restrictions, different synthesisroutes, such as sol–gel, solid state, carbothermal reduction andhydrothermal synthesis, were developed to obtain an ideal particlemorphology and a proper carbon coating, both necessary to favourthe intercalation/deintercalation process [13–18].
The substitution of vanadium with other transition metal ionse.g. Fe, Co, Cr, Ti, Zr [19–23] or with non electrochemically activeelements such as Mg and Al [12,24] has also been investigated asan alternative way to enhance the cycling stability and rate perfor-mance of this material. Li3V2(PO4)3 can exist in the monoclinic or
∗ Corresponding author. Tel.: +39 382 987213; fax: +39 382 987575.E-mail address: [email protected] (D. Capsoni).
rhombohedral structure and in the high temperature orthorhombic�-phase. The room temperature (RT) monoclinic structure (spacegroup P21/n) displays two V crystallographic sites, V1 and V2. Bothsites have the highest multiplicity (4e site) for this space group. Aslightly distorted octahedron is centred on both sites.
It has been proved that the doping does not cause struc-tural changes except for the Zr substitution which stabilizes theorthorhombic �-phase [23] characterized by a better ionic conduc-tivity than the monoclinic one at RT.
The aim of the present article is to investigate the effect ofMn doping on the structure and electrochemical properties ofLi3V2−xMnx(PO4)3.
Both sol–gel (0 ≤ x ≤ 0.30) and solid state (0 ≤ x ≤ 0.20) synthesisroutes have been employed for the preparation of the samples. Eachsample has been electrochemically characterized by cyclic voltam-metry and charge–discharge measurements. The electrochemicalfeatures have been related to the structure and microstructure-morphology, investigated by the structural refinement (Rietveldmethod) of X-ray powder diffraction (XRPD) data, by scanning elec-tron microscopy (SEM) measurements and by Raman spectroscopy.
2. Experimental
The Li3V2−xMnx(PO4)3 samples were synthesized via both solidstate and sol–gel syntheses.
The sol–gel samples with x = 0.0, 0.10, 0.20 and 0.30 (SG, SG10,SG20 and SG30 in the following) were prepared by using the pro-cedure reported in the literature [14], and adding Mn2O3 (Aldrich,99.999%) in the proper amount to obtain the desired stoichiome-try for the doped samples. Citric acid (Aldrich, 99+%) was used as
0013-4686/$ – see front matter © 2010 Elsevier Ltd. All rights reserved.doi:10.1016/j.electacta.2010.12.011
Author's personal copy
M. Bini et al. / Electrochimica Acta 56 (2011) 2648–2655 2649
chelating agent and source of carbon. Each sample was treated 8 hat 750 ◦C and 8 h at 800 ◦C in N2 flow, with intermediate grinding.
Two samples with x = 0.0 and 0.20 (SS and SS20 respectively)were also prepared by solid state synthesis using the carbothermalreduction method [25,26] from stoichiometric amount of Li2CO3(Aldrich, 99.6%), V2O5 (Aldrich, 99.6%), (NH4)2HPO4 (Merck, 99%)and Mn2O3; carbon black (Alfa) was added to reduce the vanadiumions to the 3+ oxidation state (1 wt% C excess with respect to thestoichiometric amount). The mixtures were ball milled in tungstencarbide jars for 30 min at 400 rpm; in particular the jar contain-ing the SS20 mixture was hermetically closed in Ar to prevent theoxidation during the milling processes. The thermal treatment wasperformed in N2 flow at 300 ◦C for 4 h and at 900 ◦C for 16 h.
RT XRPD measurements were performed in air on a BrukerD5005 diffractometer with the CuK� radiation, Ni filter and aposition sensitive detector (PSD). Rietveld structural and profilerefinement was carried out by means of TOPAS V3.0 program [27].
The SEM measurements were performed with a Zeiss EVO®-MA10-HR microscope on Au sputtered samples.
Micro-Raman measurements were carried out at RT by usinga Labram Dilor spectrometer equipped with an Olympus micro-scope HS BX40. The 632.8 nm light from He–Ne laser was employedas excitation radiation. The samples, mounted on a motorized xystage, were tested with a 100× objective and with a laser spot ofabout 1 mm of diameter. The spectral resolution was about 1 cm−1.
An ICP-OES Perkin Elmer Optima 3300 DV was used for the ele-mental analysis measurements, following the operating conditionssuggested by the manufacturers.
Conductivity measurements (IS) were carried out by meansof Autolab PGSTAT30 in the frequency range 105–1 Hz. IS mea-surements were performed as a function of temperature on diskshaped samples sintered at the final synthesis temperatures of SS20and SG20 samples, covered with Ag to deposit the electrodes andinserted in a polythermal electrochemical cell.
In order to prepare the cathode layer, a slurry was made bymixing the Li3V2−xMnx(PO4)3 active material with carbon black(Alfa) and poly(vinylidene fluoride) (PVdF, Solvay) in N-methyl-2-pyrrolidone (NMP, Aldrich) with a weight ratio of 75:15:10. Theobtained suspensions were spread on an aluminium current col-lector by using a doctor blade. After the evaporation of the solventin an oven at 60 ◦C for 24 h, the foils were transferred to an Ar-filled dry-box (MBraun, <1 ppm O2, <1 ppm H2O). They were cutinto disks of 1 cm diameter with a loading of about 4 mg/cm2 ofactive material; considering their surface, thickness and the lowmass loading, an average error of about 4% on the reversible capac-ity can be estimated (the significant digits are related to this error).The electrochemical tests were performed using a three-electrodesT-cell with lithium metal as the negative electrode and a glass-wool (Whatman GF/A) disc as the separator. The electrolyte was1 M LiPF6 in ethylene carbonate/diethyl carbonate (EC/DEC) 1:1(Merck). All the cells were assembled in a dry-box under Argonatmosphere. The cyclic voltammetry (CV) was performed by usinga Solartron Electrochemical Interface 1287 at a scan rate of 0.1 mV/sin the potential range 3.0–4.8 V. All the cells were tested at roomtemperature. The galvanostatic cycling tests were carried out usingthe same apparatus between 3.0 and 4.8 V. The cells were chargedand discharged at C/10.
3. Results and discussion
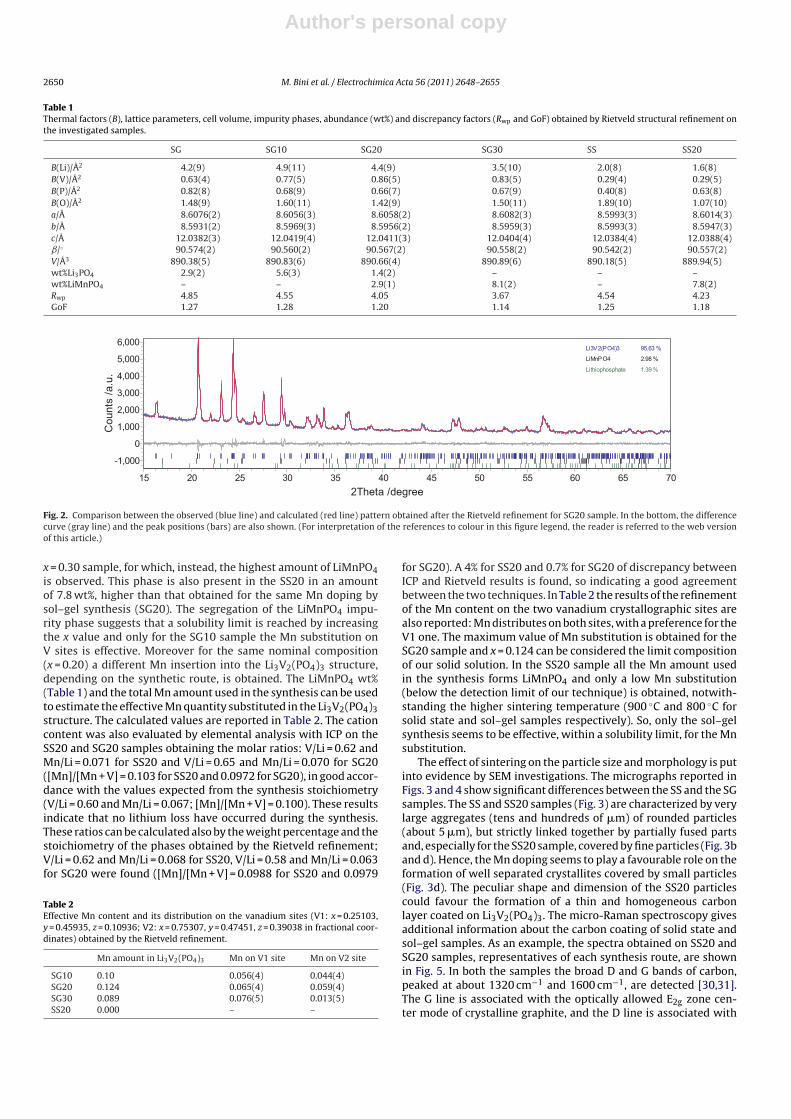
Fig. 1a and b shows the XRPD patterns of the sol–gel andsolid-state samples respectively. The peaks are explained on thebasis of the Li3V2(PO4)3 monoclinic structure. No impurity phasesare present in the SS sample, while small amounts of Li3PO4 (+),LiMnPO4 (*) or both are observed in the other ones.
2θ/ degree
10 20 30 40 50
Inte
nsity
/ a.u
.
*+
SG
SG10
SG20
SG30
a
*
2θ/ degree
10 20 30 40 50
Inte
nsity
/ a.u
.
*
SS
SS20
b
Fig. 1. XRPD patterns of a) sol–gel and b) solid state samples. The Li3PO4 (+) andLiMnPO4 (*) impurity phases are also indicated.
The structural and profile refinement on the basis of the Rietveldmethod was performed on the XRPD patterns of all the samples. Thelattice parameters, the cell volume, the isotropic thermal factors B(constrained for the same ion type) [28], and the impurity phaseswt% obtained by the refinement are reported in Table 1. The dis-crepancy factors and goodness of fit are also shown. Their valuesindicate satisfactory results for the refinement procedure, as alsodemonstrated in Fig. 2 by the comparison of the calculated andexperimental patterns for the SG20 sample, taken as an example.
Reliable values for the B factors are obtained from the refine-ment. For what concerns the lithium sites, B values of about 4 A2 and2 A2 are found for the sol–gel and solid state samples respectively.These values are not surprising for this ion, in particular for the Li+
penta-coordinated to oxygen ions. No trend is observed on bothlattice parameters and cell volume by increasing x; this is expectedon the basis of the similar values of the ionic radii of Mn2+ and V3+
ions in octahedral coordination [29]. EPR measurements performedon SG10 sample suggest the +2 oxidation state for the Mn ion; noMn3+ has been detected. This result is consistent with the carboth-ermal reduction synthesis. Interesting considerations regarding thesynthesis route and the Mn amount effectively substituted in theLi3V2(PO4)3 structure can be performed by analysing the impu-rity phases percentages obtained by the refinement. Li3PO4 formsonly from the sol–gel route and, for the doped samples, its abun-dance decreases by increasing x and it is not detected for the
Author's personal copy
2650 M. Bini et al. / Electrochimica Acta 56 (2011) 2648–2655
Table 1Thermal factors (B), lattice parameters, cell volume, impurity phases, abundance (wt%) and discrepancy factors (Rwp and GoF) obtained by Rietveld structural refinement onthe investigated samples.
SG SG10 SG20 SG30 SS SS20
B(Li)/Å2 4.2(9) 4.9(11) 4.4(9) 3.5(10) 2.0(8) 1.6(8)B(V)/Å2 0.63(4) 0.77(5) 0.86(5) 0.83(5) 0.29(4) 0.29(5)B(P)/Å2 0.82(8) 0.68(9) 0.66(7) 0.67(9) 0.40(8) 0.63(8)B(O)/Å2 1.48(9) 1.60(11) 1.42(9) 1.50(11) 1.89(10) 1.07(10)a/Å 8.6076(2) 8.6056(3) 8.6058(2) 8.6082(3) 8.5993(3) 8.6014(3)b/Å 8.5931(2) 8.5969(3) 8.5956(2) 8.5959(3) 8.5993(3) 8.5947(3)c/Å 12.0382(3) 12.0419(4) 12.0411(3) 12.0404(4) 12.0384(4) 12.0388(4)ˇ/◦ 90.574(2) 90.560(2) 90.567(2) 90.558(2) 90.542(2) 90.557(2)V/Å3 890.38(5) 890.83(6) 890.66(4) 890.89(6) 890.18(5) 889.94(5)wt%Li3PO4 2.9(2) 5.6(3) 1.4(2) – – –wt%LiMnPO4 – – 2.9(1) 8.1(2) – 7.8(2)Rwp 4.85 4.55 4.05 3.67 4.54 4.23GoF 1.27 1.28 1.20 1.14 1.25 1.18
2Theta /degree706560555045403530252015
Cou
nts
/a.u
.
6,000
5,000
4,000
3,000
2,000
1,000
0
-1,000
Li3V2(PO4)3 95.63 %
LiMnPO4 2.98 %
Lithiophosphate 1.39 %
Fig. 2. Comparison between the observed (blue line) and calculated (red line) pattern obtained after the Rietveld refinement for SG20 sample. In the bottom, the differencecurve (gray line) and the peak positions (bars) are also shown. (For interpretation of the references to colour in this figure legend, the reader is referred to the web versionof this article.)
x = 0.30 sample, for which, instead, the highest amount of LiMnPO4is observed. This phase is also present in the SS20 in an amountof 7.8 wt%, higher than that obtained for the same Mn doping bysol–gel synthesis (SG20). The segregation of the LiMnPO4 impu-rity phase suggests that a solubility limit is reached by increasingthe x value and only for the SG10 sample the Mn substitution onV sites is effective. Moreover for the same nominal composition(x = 0.20) a different Mn insertion into the Li3V2(PO4)3 structure,depending on the synthetic route, is obtained. The LiMnPO4 wt%(Table 1) and the total Mn amount used in the synthesis can be usedto estimate the effective Mn quantity substituted in the Li3V2(PO4)3structure. The calculated values are reported in Table 2. The cationcontent was also evaluated by elemental analysis with ICP on theSS20 and SG20 samples obtaining the molar ratios: V/Li = 0.62 andMn/Li = 0.071 for SS20 and V/Li = 0.65 and Mn/Li = 0.070 for SG20([Mn]/[Mn + V] = 0.103 for SS20 and 0.0972 for SG20), in good accor-dance with the values expected from the synthesis stoichiometry(V/Li = 0.60 and Mn/Li = 0.067; [Mn]/[Mn + V] = 0.100). These resultsindicate that no lithium loss have occurred during the synthesis.These ratios can be calculated also by the weight percentage and thestoichiometry of the phases obtained by the Rietveld refinement;V/Li = 0.62 and Mn/Li = 0.068 for SS20, V/Li = 0.58 and Mn/Li = 0.063for SG20 were found ([Mn]/[Mn + V] = 0.0988 for SS20 and 0.0979
Table 2Effective Mn content and its distribution on the vanadium sites (V1: x = 0.25103,y = 0.45935, z = 0.10936; V2: x = 0.75307, y = 0.47451, z = 0.39038 in fractional coor-dinates) obtained by the Rietveld refinement.
Mn amount in Li3V2(PO4)3 Mn on V1 site Mn on V2 site
SG10 0.10 0.056(4) 0.044(4)SG20 0.124 0.065(4) 0.059(4)SG30 0.089 0.076(5) 0.013(5)SS20 0.000 – –
for SG20). A 4% for SS20 and 0.7% for SG20 of discrepancy betweenICP and Rietveld results is found, so indicating a good agreementbetween the two techniques. In Table 2 the results of the refinementof the Mn content on the two vanadium crystallographic sites arealso reported: Mn distributes on both sites, with a preference for theV1 one. The maximum value of Mn substitution is obtained for theSG20 sample and x = 0.124 can be considered the limit compositionof our solid solution. In the SS20 sample all the Mn amount usedin the synthesis forms LiMnPO4 and only a low Mn substitution(below the detection limit of our technique) is obtained, notwith-standing the higher sintering temperature (900 ◦C and 800 ◦C forsolid state and sol–gel samples respectively). So, only the sol–gelsynthesis seems to be effective, within a solubility limit, for the Mnsubstitution.
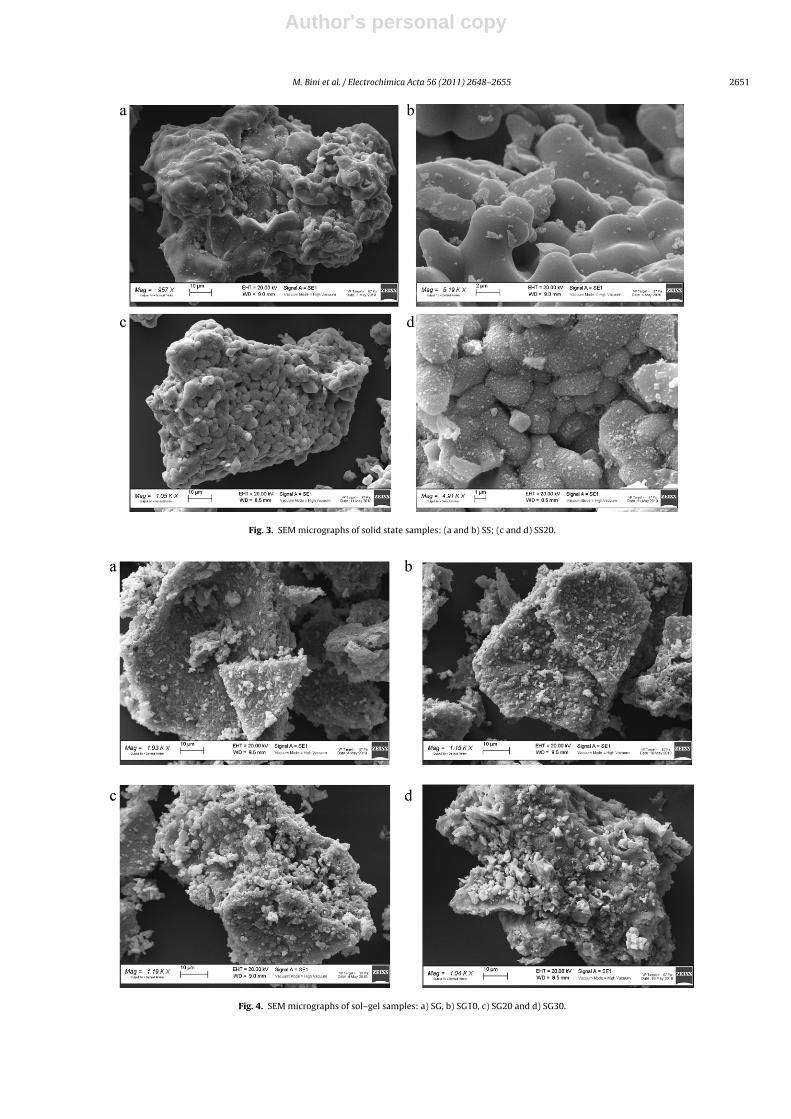
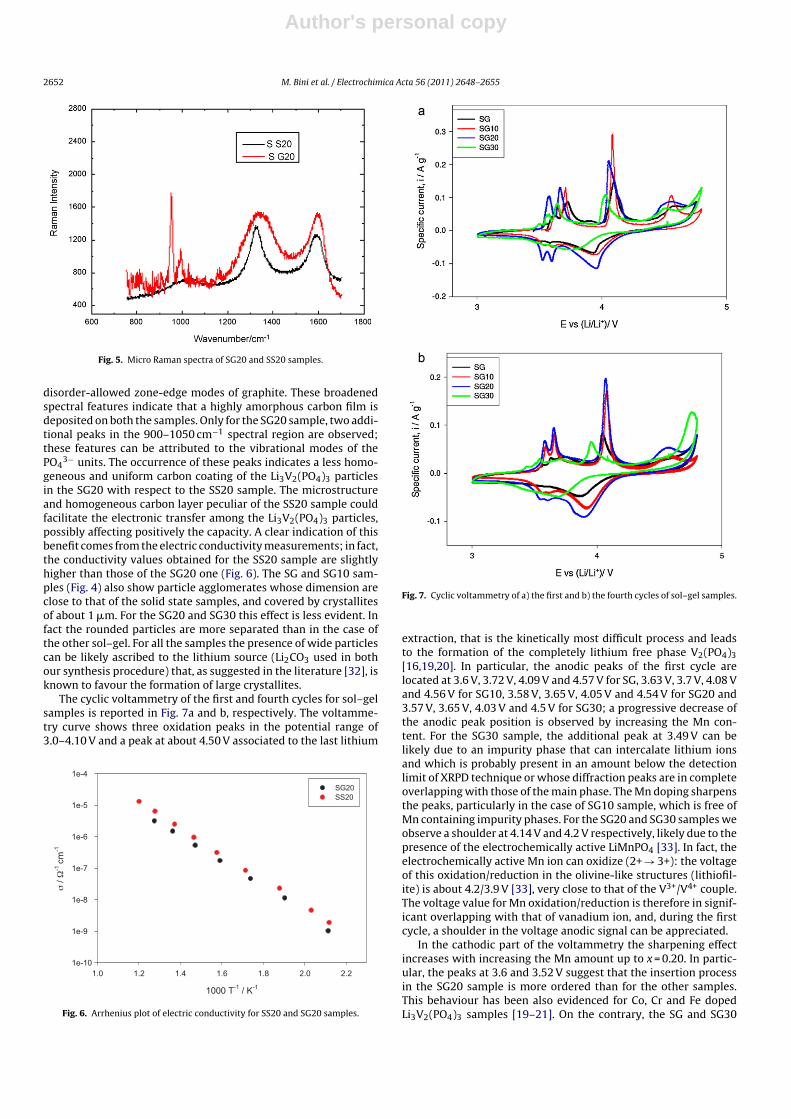
The effect of sintering on the particle size and morphology is putinto evidence by SEM investigations. The micrographs reported inFigs. 3 and 4 show significant differences between the SS and the SGsamples. The SS and SS20 samples (Fig. 3) are characterized by verylarge aggregates (tens and hundreds of �m) of rounded particles(about 5 �m), but strictly linked together by partially fused partsand, especially for the SS20 sample, covered by fine particles (Fig. 3band d). Hence, the Mn doping seems to play a favourable role on theformation of well separated crystallites covered by small particles(Fig. 3d). The peculiar shape and dimension of the SS20 particlescould favour the formation of a thin and homogeneous carbonlayer coated on Li3V2(PO4)3. The micro-Raman spectroscopy givesadditional information about the carbon coating of solid state andsol–gel samples. As an example, the spectra obtained on SS20 andSG20 samples, representatives of each synthesis route, are shownin Fig. 5. In both the samples the broad D and G bands of carbon,peaked at about 1320 cm−1 and 1600 cm−1, are detected [30,31].The G line is associated with the optically allowed E2g zone cen-ter mode of crystalline graphite, and the D line is associated with
Author's personal copy
M. Bini et al. / Electrochimica Acta 56 (2011) 2648–2655 2651
Fig. 3. SEM micrographs of solid state samples: (a and b) SS; (c and d) SS20.
Fig. 4. SEM micrographs of sol–gel samples: a) SG, b) SG10, c) SG20 and d) SG30.
Author's personal copy
2652 M. Bini et al. / Electrochimica Acta 56 (2011) 2648–2655
Fig. 5. Micro Raman spectra of SG20 and SS20 samples.
disorder-allowed zone-edge modes of graphite. These broadenedspectral features indicate that a highly amorphous carbon film isdeposited on both the samples. Only for the SG20 sample, two addi-tional peaks in the 900–1050 cm−1 spectral region are observed;these features can be attributed to the vibrational modes of thePO4
3− units. The occurrence of these peaks indicates a less homo-geneous and uniform carbon coating of the Li3V2(PO4)3 particlesin the SG20 with respect to the SS20 sample. The microstructureand homogeneous carbon layer peculiar of the SS20 sample couldfacilitate the electronic transfer among the Li3V2(PO4)3 particles,possibly affecting positively the capacity. A clear indication of thisbenefit comes from the electric conductivity measurements; in fact,the conductivity values obtained for the SS20 sample are slightlyhigher than those of the SG20 one (Fig. 6). The SG and SG10 sam-ples (Fig. 4) also show particle agglomerates whose dimension areclose to that of the solid state samples, and covered by crystallitesof about 1 �m. For the SG20 and SG30 this effect is less evident. Infact the rounded particles are more separated than in the case ofthe other sol–gel. For all the samples the presence of wide particlescan be likely ascribed to the lithium source (Li2CO3 used in bothour synthesis procedure) that, as suggested in the literature [32], isknown to favour the formation of large crystallites.
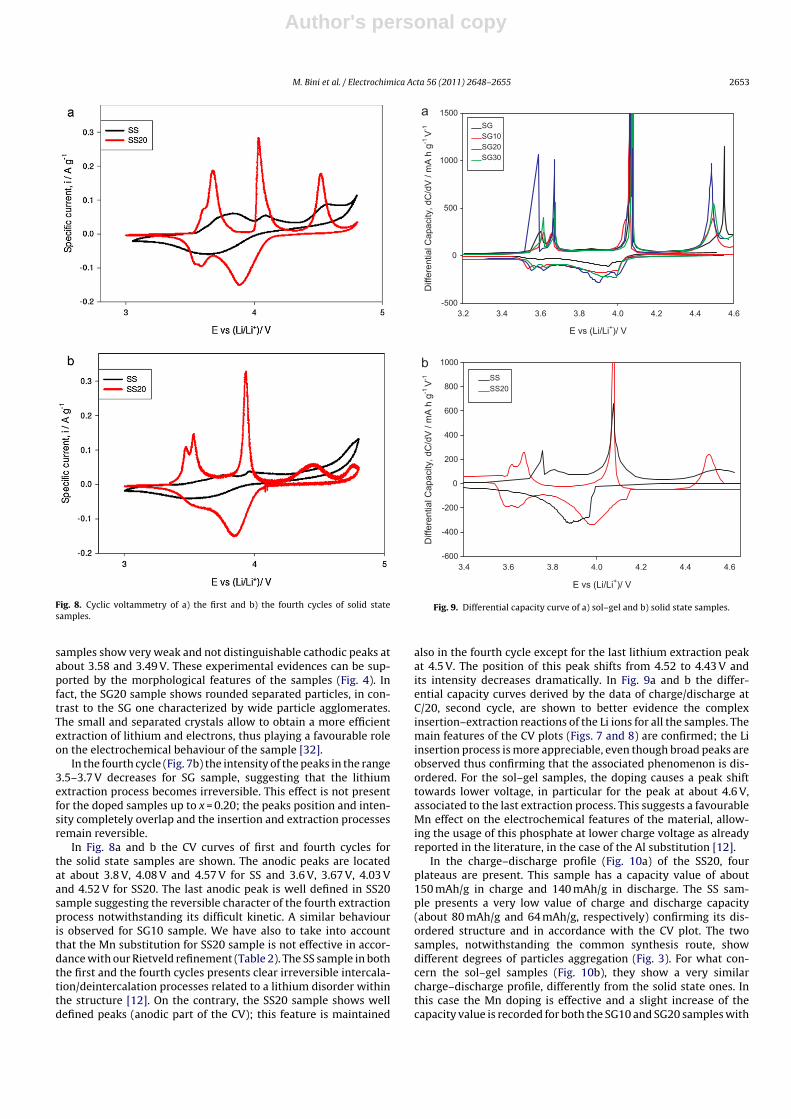
The cyclic voltammetry of the first and fourth cycles for sol–gelsamples is reported in Fig. 7a and b, respectively. The voltamme-try curve shows three oxidation peaks in the potential range of3.0–4.10 V and a peak at about 4.50 V associated to the last lithium
1000 T-1 / K-1
2.21.81.61.41.2 2.01.0
σ / Ω
-1 cm
-1
1e-10
1e-9
1e-8
1e-7
1e-6
1e-5
1e-4
SG20SS20
Fig. 6. Arrhenius plot of electric conductivity for SS20 and SG20 samples.
Fig. 7. Cyclic voltammetry of a) the first and b) the fourth cycles of sol–gel samples.
extraction, that is the kinetically most difficult process and leadsto the formation of the completely lithium free phase V2(PO4)3[16,19,20]. In particular, the anodic peaks of the first cycle arelocated at 3.6 V, 3.72 V, 4.09 V and 4.57 V for SG, 3.63 V, 3.7 V, 4.08 Vand 4.56 V for SG10, 3.58 V, 3.65 V, 4.05 V and 4.54 V for SG20 and3.57 V, 3.65 V, 4.03 V and 4.5 V for SG30; a progressive decrease ofthe anodic peak position is observed by increasing the Mn con-tent. For the SG30 sample, the additional peak at 3.49 V can belikely due to an impurity phase that can intercalate lithium ionsand which is probably present in an amount below the detectionlimit of XRPD technique or whose diffraction peaks are in completeoverlapping with those of the main phase. The Mn doping sharpensthe peaks, particularly in the case of SG10 sample, which is free ofMn containing impurity phases. For the SG20 and SG30 samples weobserve a shoulder at 4.14 V and 4.2 V respectively, likely due to thepresence of the electrochemically active LiMnPO4 [33]. In fact, theelectrochemically active Mn ion can oxidize (2+ → 3+): the voltageof this oxidation/reduction in the olivine-like structures (lithiofil-ite) is about 4.2/3.9 V [33], very close to that of the V3+/V4+ couple.The voltage value for Mn oxidation/reduction is therefore in signif-icant overlapping with that of vanadium ion, and, during the firstcycle, a shoulder in the voltage anodic signal can be appreciated.
In the cathodic part of the voltammetry the sharpening effectincreases with increasing the Mn amount up to x = 0.20. In partic-ular, the peaks at 3.6 and 3.52 V suggest that the insertion processin the SG20 sample is more ordered than for the other samples.This behaviour has been also evidenced for Co, Cr and Fe dopedLi3V2(PO4)3 samples [19–21]. On the contrary, the SG and SG30
Author's personal copy
M. Bini et al. / Electrochimica Acta 56 (2011) 2648–2655 2653
Fig. 8. Cyclic voltammetry of a) the first and b) the fourth cycles of solid statesamples.
samples show very weak and not distinguishable cathodic peaks atabout 3.58 and 3.49 V. These experimental evidences can be sup-ported by the morphological features of the samples (Fig. 4). Infact, the SG20 sample shows rounded separated particles, in con-trast to the SG one characterized by wide particle agglomerates.The small and separated crystals allow to obtain a more efficientextraction of lithium and electrons, thus playing a favourable roleon the electrochemical behaviour of the sample [32].
In the fourth cycle (Fig. 7b) the intensity of the peaks in the range3.5–3.7 V decreases for SG sample, suggesting that the lithiumextraction process becomes irreversible. This effect is not presentfor the doped samples up to x = 0.20; the peaks position and inten-sity completely overlap and the insertion and extraction processesremain reversible.
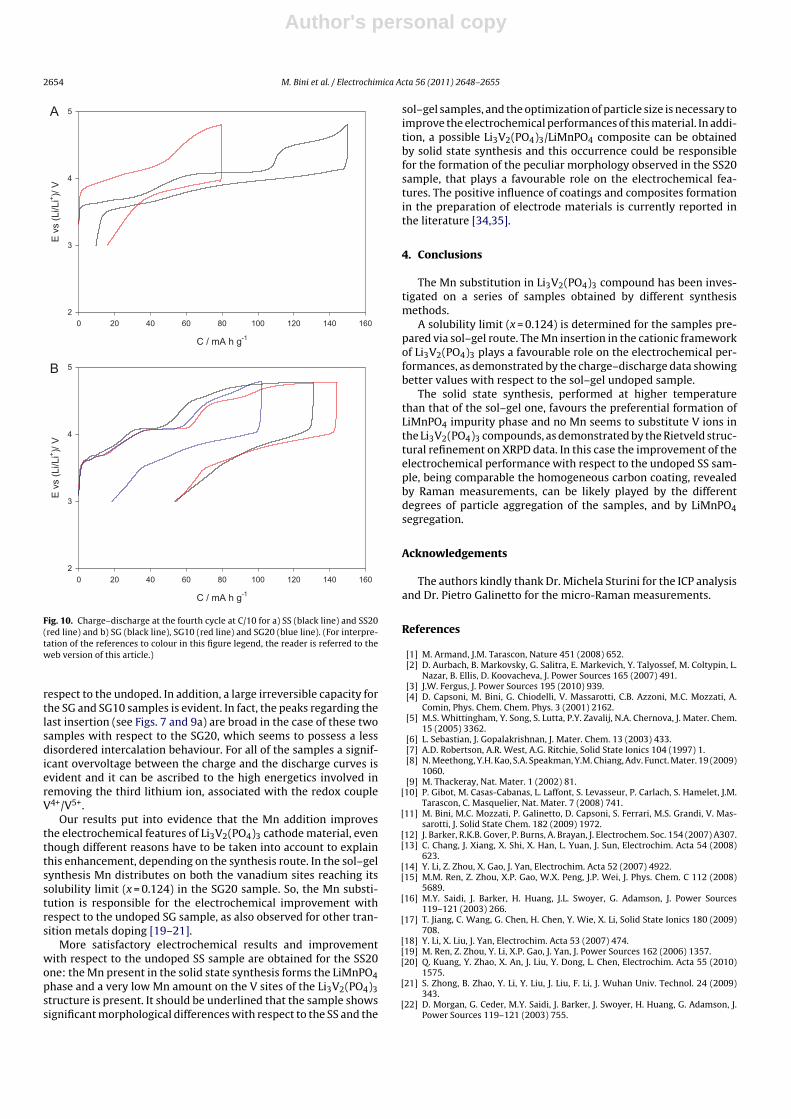
In Fig. 8a and b the CV curves of first and fourth cycles forthe solid state samples are shown. The anodic peaks are locatedat about 3.8 V, 4.08 V and 4.57 V for SS and 3.6 V, 3.67 V, 4.03 Vand 4.52 V for SS20. The last anodic peak is well defined in SS20sample suggesting the reversible character of the fourth extractionprocess notwithstanding its difficult kinetic. A similar behaviouris observed for SG10 sample. We have also to take into accountthat the Mn substitution for SS20 sample is not effective in accor-dance with our Rietveld refinement (Table 2). The SS sample in boththe first and the fourth cycles presents clear irreversible intercala-tion/deintercalation processes related to a lithium disorder withinthe structure [12]. On the contrary, the SS20 sample shows welldefined peaks (anodic part of the CV); this feature is maintained
E vs (Li/Li+)/ V
4.64.44.23.83.63.43.2 4.0
Diff
eren
tial C
apac
ity, d
C/d
V /
mA
h g
-1V
-1
-500
0
500
1000
1500a
b
SG
SG10
SG20
SG30
E vs (Li/Li+)/ V
4.64.44.23.83.63.4 4.0
Diff
eren
tial C
apac
ity, d
C/d
V /
mA
h g
-1 V
-1
-600
-400
-200
0
200
400
600
800
1000
SS
SS20
Fig. 9. Differential capacity curve of a) sol–gel and b) solid state samples.
also in the fourth cycle except for the last lithium extraction peakat 4.5 V. The position of this peak shifts from 4.52 to 4.43 V andits intensity decreases dramatically. In Fig. 9a and b the differ-ential capacity curves derived by the data of charge/discharge atC/20, second cycle, are shown to better evidence the complexinsertion–extraction reactions of the Li ions for all the samples. Themain features of the CV plots (Figs. 7 and 8) are confirmed; the Liinsertion process is more appreciable, even though broad peaks areobserved thus confirming that the associated phenomenon is dis-ordered. For the sol–gel samples, the doping causes a peak shifttowards lower voltage, in particular for the peak at about 4.6 V,associated to the last extraction process. This suggests a favourableMn effect on the electrochemical features of the material, allow-ing the usage of this phosphate at lower charge voltage as alreadyreported in the literature, in the case of the Al substitution [12].
In the charge–discharge profile (Fig. 10a) of the SS20, fourplateaus are present. This sample has a capacity value of about150 mAh/g in charge and 140 mAh/g in discharge. The SS sam-ple presents a very low value of charge and discharge capacity(about 80 mAh/g and 64 mAh/g, respectively) confirming its dis-ordered structure and in accordance with the CV plot. The twosamples, notwithstanding the common synthesis route, showdifferent degrees of particles aggregation (Fig. 3). For what con-cern the sol–gel samples (Fig. 10b), they show a very similarcharge–discharge profile, differently from the solid state ones. Inthis case the Mn doping is effective and a slight increase of thecapacity value is recorded for both the SG10 and SG20 samples with
Author's personal copy
2654 M. Bini et al. / Electrochimica Acta 56 (2011) 2648–2655
C / mA h g-1
160140120100806040200
E v
s (L
i/Li+
)/ V
2
3
4
5A
B
C / mA h g-1
160140120100806040200
E v
s (L
i/Li+
)/ V
2
3
4
5
Fig. 10. Charge–discharge at the fourth cycle at C/10 for a) SS (black line) and SS20(red line) and b) SG (black line), SG10 (red line) and SG20 (blue line). (For interpre-tation of the references to colour in this figure legend, the reader is referred to theweb version of this article.)
respect to the undoped. In addition, a large irreversible capacity forthe SG and SG10 samples is evident. In fact, the peaks regarding thelast insertion (see Figs. 7 and 9a) are broad in the case of these twosamples with respect to the SG20, which seems to possess a lessdisordered intercalation behaviour. For all of the samples a signif-icant overvoltage between the charge and the discharge curves isevident and it can be ascribed to the high energetics involved inremoving the third lithium ion, associated with the redox coupleV4+/V5+.
Our results put into evidence that the Mn addition improvesthe electrochemical features of Li3V2(PO4)3 cathode material, eventhough different reasons have to be taken into account to explainthis enhancement, depending on the synthesis route. In the sol–gelsynthesis Mn distributes on both the vanadium sites reaching itssolubility limit (x = 0.124) in the SG20 sample. So, the Mn substi-tution is responsible for the electrochemical improvement withrespect to the undoped SG sample, as also observed for other tran-sition metals doping [19–21].
More satisfactory electrochemical results and improvementwith respect to the undoped SS sample are obtained for the SS20one: the Mn present in the solid state synthesis forms the LiMnPO4phase and a very low Mn amount on the V sites of the Li3V2(PO4)3structure is present. It should be underlined that the sample showssignificant morphological differences with respect to the SS and the
sol–gel samples, and the optimization of particle size is necessary toimprove the electrochemical performances of this material. In addi-tion, a possible Li3V2(PO4)3/LiMnPO4 composite can be obtainedby solid state synthesis and this occurrence could be responsiblefor the formation of the peculiar morphology observed in the SS20sample, that plays a favourable role on the electrochemical fea-tures. The positive influence of coatings and composites formationin the preparation of electrode materials is currently reported inthe literature [34,35].
4. Conclusions
The Mn substitution in Li3V2(PO4)3 compound has been inves-tigated on a series of samples obtained by different synthesismethods.
A solubility limit (x = 0.124) is determined for the samples pre-pared via sol–gel route. The Mn insertion in the cationic frameworkof Li3V2(PO4)3 plays a favourable role on the electrochemical per-formances, as demonstrated by the charge–discharge data showingbetter values with respect to the sol–gel undoped sample.
The solid state synthesis, performed at higher temperaturethan that of the sol–gel one, favours the preferential formation ofLiMnPO4 impurity phase and no Mn seems to substitute V ions inthe Li3V2(PO4)3 compounds, as demonstrated by the Rietveld struc-tural refinement on XRPD data. In this case the improvement of theelectrochemical performance with respect to the undoped SS sam-ple, being comparable the homogeneous carbon coating, revealedby Raman measurements, can be likely played by the differentdegrees of particle aggregation of the samples, and by LiMnPO4segregation.
Acknowledgements
The authors kindly thank Dr. Michela Sturini for the ICP analysisand Dr. Pietro Galinetto for the micro-Raman measurements.
References
[1] M. Armand, J.M. Tarascon, Nature 451 (2008) 652.[2] D. Aurbach, B. Markovsky, G. Salitra, E. Markevich, Y. Talyossef, M. Coltypin, L.
Nazar, B. Ellis, D. Koovacheva, J. Power Sources 165 (2007) 491.[3] J.W. Fergus, J. Power Sources 195 (2010) 939.[4] D. Capsoni, M. Bini, G. Chiodelli, V. Massarotti, C.B. Azzoni, M.C. Mozzati, A.
Comin, Phys. Chem. Chem. Phys. 3 (2001) 2162.[5] M.S. Whittingham, Y. Song, S. Lutta, P.Y. Zavalij, N.A. Chernova, J. Mater. Chem.
15 (2005) 3362.[6] L. Sebastian, J. Gopalakrishnan, J. Mater. Chem. 13 (2003) 433.[7] A.D. Robertson, A.R. West, A.G. Ritchie, Solid State Ionics 104 (1997) 1.[8] N. Meethong, Y.H. Kao, S.A. Speakman, Y.M. Chiang, Adv. Funct. Mater. 19 (2009)
1060.[9] M. Thackeray, Nat. Mater. 1 (2002) 81.
[10] P. Gibot, M. Casas-Cabanas, L. Laffont, S. Levasseur, P. Carlach, S. Hamelet, J.M.Tarascon, C. Masquelier, Nat. Mater. 7 (2008) 741.
[11] M. Bini, M.C. Mozzati, P. Galinetto, D. Capsoni, S. Ferrari, M.S. Grandi, V. Mas-sarotti, J. Solid State Chem. 182 (2009) 1972.
[12] J. Barker, R.K.B. Gover, P. Burns, A. Brayan, J. Electrochem. Soc. 154 (2007) A307.[13] C. Chang, J. Xiang, X. Shi, X. Han, L. Yuan, J. Sun, Electrochim. Acta 54 (2008)
623.[14] Y. Li, Z. Zhou, X. Gao, J. Yan, Electrochim. Acta 52 (2007) 4922.[15] M.M. Ren, Z. Zhou, X.P. Gao, W.X. Peng, J.P. Wei, J. Phys. Chem. C 112 (2008)
5689.[16] M.Y. Saidi, J. Barker, H. Huang, J.L. Swoyer, G. Adamson, J. Power Sources
119–121 (2003) 266.[17] T. Jiang, C. Wang, G. Chen, H. Chen, Y. Wie, X. Li, Solid State Ionics 180 (2009)
708.[18] Y. Li, X. Liu, J. Yan, Electrochim. Acta 53 (2007) 474.[19] M. Ren, Z. Zhou, Y. Li, X.P. Gao, J. Yan, J. Power Sources 162 (2006) 1357.[20] Q. Kuang, Y. Zhao, X. An, J. Liu, Y. Dong, L. Chen, Electrochim. Acta 55 (2010)
1575.[21] S. Zhong, B. Zhao, Y. Li, Y. Liu, J. Liu, F. Li, J. Wuhan Univ. Technol. 24 (2009)
343.[22] D. Morgan, G. Ceder, M.Y. Saidi, J. Barker, J. Swoyer, H. Huang, G. Adamson, J.
Power Sources 119–121 (2003) 755.

Author's personal copy
M. Bini et al. / Electrochimica Acta 56 (2011) 2648–2655 2655
[23] M. Sato, H. Ohkawa, K. Yoshida, M. Saito, K. Uematsu, K. Toda, Solid State Ionics135 (2000) 137.
[24] C. Dai, Z. Chen, H. Jin, X. Hu, J. Power Sources 195 (2010) 5775.[25] J. Barker, M.Y. Saidi, J.L. Swoyer, J. Electrochem. Soc. 150 (2003) A1267.[26] J. Barker, M.Y. Saidi, J.L. Swoyer, J. Electrochem. Soc. Solid State Lett. 6 (2003)
A53.[27] Bruker AXS, TOPAS V3.0: General Profile and Structural Analysis Software for
Powder Diffraction Data. User Manual, Bruker AXS, Karlsruhe, Germany, 2005.[28] S.C. Yin, P.S. Strobel, H. Grondey, L.F. Nazar, Chem. Mater. 16 (2004) 1456.[29] R.D. Shannon, Acta Crystallogr. A 32 (1976) 751.
[30] C.M. Julien, K. Zaghib, A. Mauger, M. Massot, A. Ait-Salah, M. Selmane, F. Gen-dron, J. Appl. Phys. 100 (2006) 063511.
[31] M. Bini, M.C. Mozzati, P. Galinetto, D. Capsoni, S. Ferrari, M.S. Grandi, V. Mas-sarotti, J. Solid State Chem. 182 (2009) 1972.
[32] P. Fu, Y. Zhao, Y. Dong, X. An, G. Shan, Electrochim. Acta 52 (2006) 1003.[33] Z. Bakenov, I. Taniguchi, Electrochem. Commun. 12 (2010) 75.[34] L. Zhang, X.L. Wang, J.Y. Xiang, J. Zhou, S.J. Shi, J.P. Tu, J. Power Sources 195
(2010) 5057.[35] J.-C. Zheng, X.-H. Li, Z.-X. Wang, S.-S. Niu, D.-R. Liu, L. Wu, L.-J. Li, J.-H. Li, H.-J.
Guo, J. Power Sources 195 (2010) 2935.