Mining in a data-flow environment: experience in network intrusion detection
11
Mining in a Data-flow Environment: Experience in Network Intrusion Detection Wenke Lee Salvatore J. Stolfo Kui W. Mok Computer Science Department Columbia University {wenke,sal,mok}@cs.columbia.edu Abstract We discuss the KDD process in “data-flow” environments, where unstructured and time dependent data can be processed into various levels of structured and semantically- rich forms for analysis tasks. Using network intrusion detection as a concrete application example, we describe how to construct models that are both accurate in describing the underlying concepts, and efficient when used to analyze data in real-time. We present procedures for analyzing frequent patterns from lower level data and constructing appropriate features to formulate higher level data. The features generated from various levels of data have different computational costs (in time and space). We show that in order to minimize the time required in using the classification models in a real-time environment, we can exploit the “necessary conditions” associated with the low- cost features to determine whether some high-cost features need to be computed and the corresponding classification rules need to be checked. We have applied our tools to the problem of building network intrusion detection models. We report our experiments using the network data provided as part of the 1998 DARPA Intrusion Detection Evaluation program. We also discuss our experience in using the mined models in NFR, a real-time network intrusion detection system. 1 Introduction In many business and engineering applications, raw data collected from fielded systems needs to be pro- cessed into various forms of structured and semantically- rich records before data analysis tasks can produce ac- curate, useful, and understandable results. Consider the problem of credit card fraud detection. Each credit card purchase transmits a stream of data containing the credit card number, amount, and the type of merchan- dise, etc., to the credit card company’s data server. The data is then processed into a “transaction record” that contains additional computed features (fields) measur- ing the short and long term activity behavior of the account. In network intrusion detection, a packet “snif- fer” such as tcpdump [JLM89] can be used to record each passing network packet. The data then needs to be pro- cessed into “connection records” that contains for each connection its hosts, service (e.g., telnet, ftp, etc.), and number of bytes, etc., that describe the network states. We refer to such applications that involve real-time data collection, processing, and analysis as “data-flow” envi- ronments. The accuracy of data analysis depends not only on the algorithms employed, but to a very large degree, on the quality of the processed data. For example, if the activity history of the account, e.g., “number of X type of purchases in the past n hours”, which is very useful in predicting certain frauds, is missing from the credit card transaction records, the accuracy of the fraud detection system will suffer. However, defining such features, that is, determining the constituent attributes of records, have traditionally been based on deep domain knowledge. In a real-time environment, the efficiency of data analysis is critical. For example, on-line fraud detection systems need to respond, with an approval or rejection on the transaction, within a few seconds. A trade- off between model accuracy and model evaluation efficiency needs to be considered. Researchers have recognized that KDD is not a single plan of well-defined operations, rather, it is a sequence of iterative steps that include (but not limited to) data cleaning and preprocessing, feature extraction and data mining, and consolidating and utilizing the discovered knowledge [FPSS96]. However, most of the research in KDD focuses on the data mining step, which assumes the availability of preprocessed data. Since KDD is about finding useful knowledge, it would be interesting to see whether and how we can apply KDD techniques to automate some of the knowledge-intensive data preprocessing tasks.
Transcript of Mining in a data-flow environment: experience in network intrusion detection
Mining in a Data-flow Environment: Experience in Network Intrusion
Detection
Wenke Lee Salvatore J. Stolfo Kui W. Mok
Computer Science Department
Columbia University
{wenke,sal,mok}@cs.columbia.edu
Abstract
We discuss the KDD process in “data-flow” environments,where unstructured and time dependent data can beprocessed into various levels of structured and semantically-rich forms for analysis tasks. Using network intrusiondetection as a concrete application example, we describehow to construct models that are both accurate in describingthe underlying concepts, and efficient when used to analyzedata in real-time. We present procedures for analyzingfrequent patterns from lower level data and constructingappropriate features to formulate higher level data. Thefeatures generated from various levels of data have differentcomputational costs (in time and space). We show thatin order to minimize the time required in using theclassification models in a real-time environment, we canexploit the “necessary conditions” associated with the low-cost features to determine whether some high-cost featuresneed to be computed and the corresponding classificationrules need to be checked. We have applied our tools tothe problem of building network intrusion detection models.We report our experiments using the network data providedas part of the 1998 DARPA Intrusion Detection Evaluationprogram. We also discuss our experience in using the minedmodels in NFR, a real-time network intrusion detectionsystem.
1 Introduction
In many business and engineering applications, rawdata collected from fielded systems needs to be pro-cessed into various forms of structured and semantically-rich records before data analysis tasks can produce ac-curate, useful, and understandable results. Considerthe problem of credit card fraud detection. Each creditcard purchase transmits a stream of data containing thecredit card number, amount, and the type of merchan-
dise, etc., to the credit card company’s data server. Thedata is then processed into a “transaction record” thatcontains additional computed features (fields) measur-ing the short and long term activity behavior of theaccount. In network intrusion detection, a packet “snif-fer” such as tcpdump [JLM89] can be used to record eachpassing network packet. The data then needs to be pro-cessed into “connection records” that contains for eachconnection its hosts, service (e.g., telnet, ftp, etc.), andnumber of bytes, etc., that describe the network states.We refer to such applications that involve real-time datacollection, processing, and analysis as “data-flow” envi-ronments.
The accuracy of data analysis depends not only onthe algorithms employed, but to a very large degree,on the quality of the processed data. For example, ifthe activity history of the account, e.g., “number ofX type of purchases in the past n hours”, which isvery useful in predicting certain frauds, is missing fromthe credit card transaction records, the accuracy of thefraud detection system will suffer. However, definingsuch features, that is, determining the constituentattributes of records, have traditionally been based ondeep domain knowledge.
In a real-time environment, the efficiency of dataanalysis is critical. For example, on-line fraud detectionsystems need to respond, with an approval or rejectionon the transaction, within a few seconds. A trade-off between model accuracy and model evaluationefficiency needs to be considered.
Researchers have recognized that KDD is not asingle plan of well-defined operations, rather, it is asequence of iterative steps that include (but not limitedto) data cleaning and preprocessing, feature extractionand data mining, and consolidating and utilizing thediscovered knowledge [FPSS96]. However, most of theresearch in KDD focuses on the data mining step, whichassumes the availability of preprocessed data. SinceKDD is about finding useful knowledge, it would beinteresting to see whether and how we can apply KDDtechniques to automate some of the knowledge-intensivedata preprocessing tasks.
Many data mining techniques consider only accuracyand/or complexity measures as evaluation criteria whenextracting models from data. The problem of efficiency,i.e., the cost, in time and space, of model execution inreal-time has not been adequately studied.
To address these important and challenging problemsadequately, one needs to have access to the “data-flow”in its entirety. This is sometimes impossible becauseof legal or organizational constraints. Our researchis in a somewhat different and advantageous contextsince, in applying data mining techniques to buildnetwork intrusion detection models [LSM98, LSM99],data is abundant nearly everywhere (all one needs is acomputer on a network).
In this paper, we focus our discussion on the auto-matic techniques of comparing frequent patterns minedfrom normal and intrusion data, and constructing ap-propriate features for building classification models. Wereport the results of the 1998 DARPA Intrusion Detec-tion Evaluation, which showed that the detection mod-els produced using our data mining programs performedbetter than or equivalent to the knowledge engineeredintrusion detection systems. We also discuss techniquesfor deriving the low cost “necessary” conditions of eachlearned rule, which are used to filter out “unnecessary”(i.e., wasteful) real-time rule checking.
Our contributions to KDD are: new techniques forfeature construction based on frequent patterns minedfrom the data with a “minimum” preprocessing; asimple yet useful pattern encoding and comparisontechnique to assist model construction; strategies forminimizing the cost of model execution in real-time;and most importantly, the demonstration (i.e., throughobjective evaluation) of the feasibility and advantageof applying these more systematic and semi-automaticdata mining approaches to network intrusion detection,an important, challenging, and traditionally knowledgeengineering application area.
The rest of the paper is organized as follows. Wefirst give a brief overview of the problem of networkintrusion detection, and summarize the extentions wemade to the basic association rules [AIS93] and frequentepisodes [MTV95] algorithms, that are based on thecharacteristics of network audit data. We then discussthe feature construction steps, which include miningand comparing two sets of patterns to identify the“intrusion only” frequent patterns, and parsing eachsuch pattern to construct temporal and statisticalfeatures. We report the experiments of using ourtechniques on the DARPA data. We then describe howto utilize the associations between low cost features andthe class labels as the “necessary” conditions for rulesto be checked in real-time execution.
2 Data Mining and Intrusion
Detection
Intrusions are actions that aim to compromise the secu-rity goals of a computer system, namely, confidential-ity, integrity, and availability. Intrusion detection (ID)is considered an integral part of critical infrastructureprotection mechanisms. Traditionally, intrusion detec-tion systems (IDSs) have been built using purely knowl-edge engineering approaches, that is, system buildersencode their security knowledge into detection models.The manual and ad hoc nature of the development pro-cess impinges upon the effectiveness and adaptabilityof IDSs (in the face of new attack methods or changednetwork configurations).
We aim to automate the process of building IDSsas much as possible. We are developing a framework,MADAM ID (described in detail in [LSM99]), forMining Audit Data for Automated Models for IntrusionDetection. This framework consists of classification andmeta-classification [CS93] programs, association rulesand frequent episodes programs, as well as a featureconstruction system. The end product is concise andintuitive classification rules that can detect intrusions.
We had previously discussed and demonstrated theneed to select and construct a set of temporal and sta-tistical features in order to build accurate classificationmodels to detect network intrusions [LSM98]. For ex-ample, since a large number of “rejected” network con-nections in a very short time span is strong evidenceof some intrusions, we need to include a feature thatmeasures this indicator.
We proposed to use the frequent sequential patternsmined from audit data as guidelines for feature con-struction [LSM98]. The process of using data miningapproaches to build intrusion detection models is shownin Figure 1. Here raw (binary) audit data is first pro-cessed into ASCII network packet (or host event data),which is in turn summarized into connection records(or host session records) containing a number of within-connection features, e.g., service, duration, flag (indicat-ing the normal or error status according to the proto-cols), etc. Data mining programs are then applied to theconnection records to compute the frequent sequentialpatterns, which are in turn analyzed to construct addi-tional features for the connection records. Classificationprograms, for example, RIPPER [Coh95], are then usedto inductively learn the detection models. This processis of course iterative. For example, poor performanceof the classification models often indicates that morepattern mining and feature construction is needed.
2.1 Mining Audit Data
It is important to incorporate domain knowledge todirect data mining algorithms to find “relevant” pat-terns efficiently. We described in detail several ex-
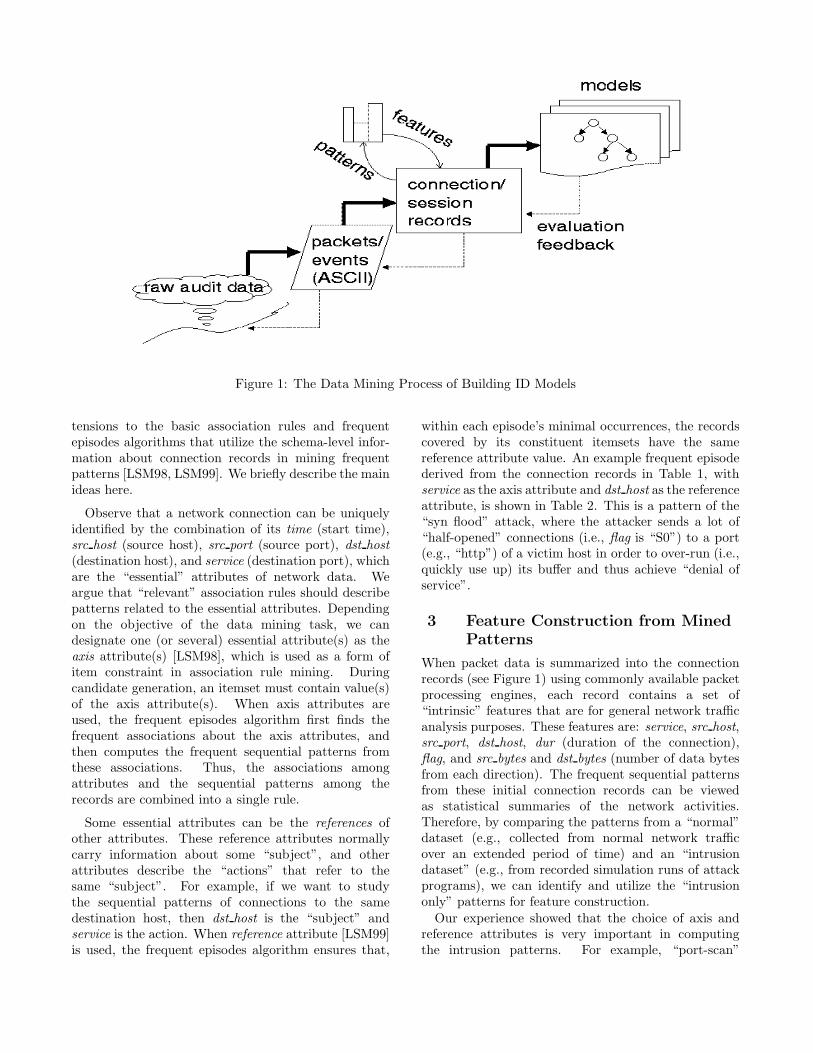
Figure 1: The Data Mining Process of Building ID Models
tensions to the basic association rules and frequentepisodes algorithms that utilize the schema-level infor-mation about connection records in mining frequentpatterns [LSM98, LSM99]. We briefly describe the mainideas here.
Observe that a network connection can be uniquelyidentified by the combination of its time (start time),src host (source host), src port (source port), dst host
(destination host), and service (destination port), whichare the “essential” attributes of network data. Weargue that “relevant” association rules should describepatterns related to the essential attributes. Dependingon the objective of the data mining task, we candesignate one (or several) essential attribute(s) as theaxis attribute(s) [LSM98], which is used as a form ofitem constraint in association rule mining. Duringcandidate generation, an itemset must contain value(s)of the axis attribute(s). When axis attributes areused, the frequent episodes algorithm first finds thefrequent associations about the axis attributes, andthen computes the frequent sequential patterns fromthese associations. Thus, the associations amongattributes and the sequential patterns among therecords are combined into a single rule.
Some essential attributes can be the references ofother attributes. These reference attributes normallycarry information about some “subject”, and otherattributes describe the “actions” that refer to thesame “subject”. For example, if we want to studythe sequential patterns of connections to the samedestination host, then dst host is the “subject” andservice is the action. When reference attribute [LSM99]is used, the frequent episodes algorithm ensures that,
within each episode’s minimal occurrences, the recordscovered by its constituent itemsets have the samereference attribute value. An example frequent episodederived from the connection records in Table 1, withservice as the axis attribute and dst host as the referenceattribute, is shown in Table 2. This is a pattern of the“syn flood” attack, where the attacker sends a lot of“half-opened” connections (i.e., flag is “S0”) to a port(e.g., “http”) of a victim host in order to over-run (i.e.,quickly use up) its buffer and thus achieve “denial ofservice”.
3 Feature Construction from Mined
Patterns
When packet data is summarized into the connectionrecords (see Figure 1) using commonly available packetprocessing engines, each record contains a set of“intrinsic” features that are for general network trafficanalysis purposes. These features are: service, src host,src port, dst host, dur (duration of the connection),flag, and src bytes and dst bytes (number of data bytesfrom each direction). The frequent sequential patternsfrom these initial connection records can be viewedas statistical summaries of the network activities.Therefore, by comparing the patterns from a “normal”dataset (e.g., collected from normal network trafficover an extended period of time) and an “intrusiondataset” (e.g., from recorded simulation runs of attackprograms), we can identify and utilize the “intrusiononly” patterns for feature construction.
Our experience showed that the choice of axis andreference attributes is very important in computingthe intrusion patterns. For example, “port-scan”
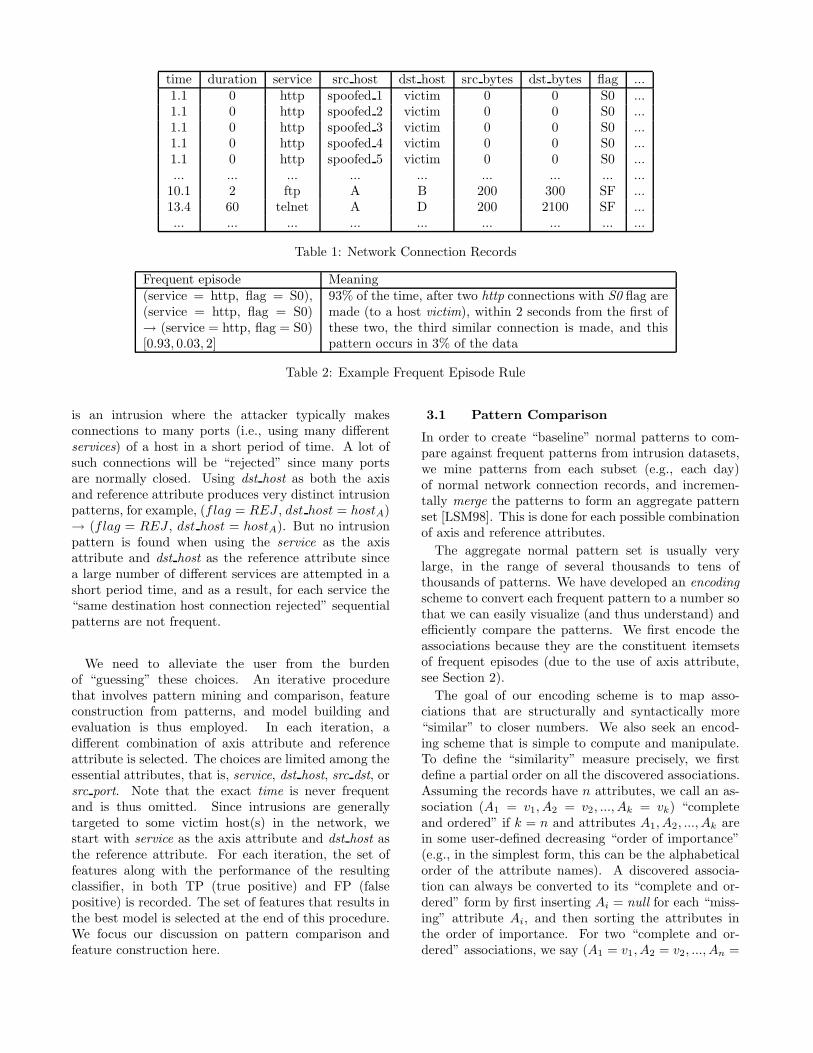
time duration service src host dst host src bytes dst bytes flag ...1.1 0 http spoofed 1 victim 0 0 S0 ...1.1 0 http spoofed 2 victim 0 0 S0 ...1.1 0 http spoofed 3 victim 0 0 S0 ...1.1 0 http spoofed 4 victim 0 0 S0 ...1.1 0 http spoofed 5 victim 0 0 S0 ...... ... ... ... ... ... ... ... ...
10.1 2 ftp A B 200 300 SF ...13.4 60 telnet A D 200 2100 SF ...... ... ... ... ... ... ... ... ...
Table 1: Network Connection Records
Frequent episode Meaning(service = http, flag = S0),(service = http, flag = S0)→ (service = http, flag = S0)[0.93, 0.03, 2]
93% of the time, after two http connections with S0 flag aremade (to a host victim), within 2 seconds from the first ofthese two, the third similar connection is made, and thispattern occurs in 3% of the data
Table 2: Example Frequent Episode Rule
is an intrusion where the attacker typically makesconnections to many ports (i.e., using many differentservices) of a host in a short period of time. A lot ofsuch connections will be “rejected” since many portsare normally closed. Using dst host as both the axisand reference attribute produces very distinct intrusionpatterns, for example, (flag = REJ , dst host = hostA)→ (flag = REJ , dst host = hostA). But no intrusionpattern is found when using the service as the axisattribute and dst host as the reference attribute sincea large number of different services are attempted in ashort period time, and as a result, for each service the“same destination host connection rejected” sequentialpatterns are not frequent.
We need to alleviate the user from the burdenof “guessing” these choices. An iterative procedurethat involves pattern mining and comparison, featureconstruction from patterns, and model building andevaluation is thus employed. In each iteration, adifferent combination of axis attribute and referenceattribute is selected. The choices are limited among theessential attributes, that is, service, dst host, src dst, orsrc port. Note that the exact time is never frequentand is thus omitted. Since intrusions are generallytargeted to some victim host(s) in the network, westart with service as the axis attribute and dst host asthe reference attribute. For each iteration, the set offeatures along with the performance of the resultingclassifier, in both TP (true positive) and FP (falsepositive) is recorded. The set of features that results inthe best model is selected at the end of this procedure.We focus our discussion on pattern comparison andfeature construction here.
3.1 Pattern Comparison
In order to create “baseline” normal patterns to com-pare against frequent patterns from intrusion datasets,we mine patterns from each subset (e.g., each day)of normal network connection records, and incremen-tally merge the patterns to form an aggregate patternset [LSM98]. This is done for each possible combinationof axis and reference attributes.
The aggregate normal pattern set is usually verylarge, in the range of several thousands to tens ofthousands of patterns. We have developed an encoding
scheme to convert each frequent pattern to a number sothat we can easily visualize (and thus understand) andefficiently compare the patterns. We first encode theassociations because they are the constituent itemsetsof frequent episodes (due to the use of axis attribute,see Section 2).
The goal of our encoding scheme is to map asso-ciations that are structurally and syntactically more“similar” to closer numbers. We also seek an encod-ing scheme that is simple to compute and manipulate.To define the “similarity” measure precisely, we firstdefine a partial order on all the discovered associations.Assuming the records have n attributes, we call an as-sociation (A1 = v1, A2 = v2, ..., Ak = vk) “completeand ordered” if k = n and attributes A1, A2, ..., Ak arein some user-defined decreasing “order of importance”(e.g., in the simplest form, this can be the alphabeticalorder of the attribute names). A discovered associa-tion can always be converted to its “complete and or-dered” form by first inserting Ai = null for each “miss-ing” attribute Ai, and then sorting the attributes inthe order of importance. For two “complete and or-dered” associations, we say (A1 = v1, A2 = v2, ..., An =
vn) < (A1 = u1, A2 = u2, ..., An = un), if vj = uj, forj = 1, 2, ..., i− 1, and vi < ui. We say association Xi ismore “similar” to Xj than to Xk if Xi < Xj < Xk (orXk < Xj < Xi) holds.
Given a set of associations, we use the followingalgorithm to compute the encodings:
• Convert each association to its “complete and order”form.
• The encoding of an association (A1 = v1, A2 =v2, ..., An = vn) is a number ev1
ev2. . . evn
, wherethe order of the digits, from most to least significant,corresponds to the decreasing “order of importance”of the attributes.
• Each eviis:
– 0 if vi is null, i.e., attribute Ai is missing from theoriginal association;
– the order of appearance of vi among all the valuesof Ai seen (processed) thus far in the encodingprocess (other forms of ordering can be triviallyincorporated).
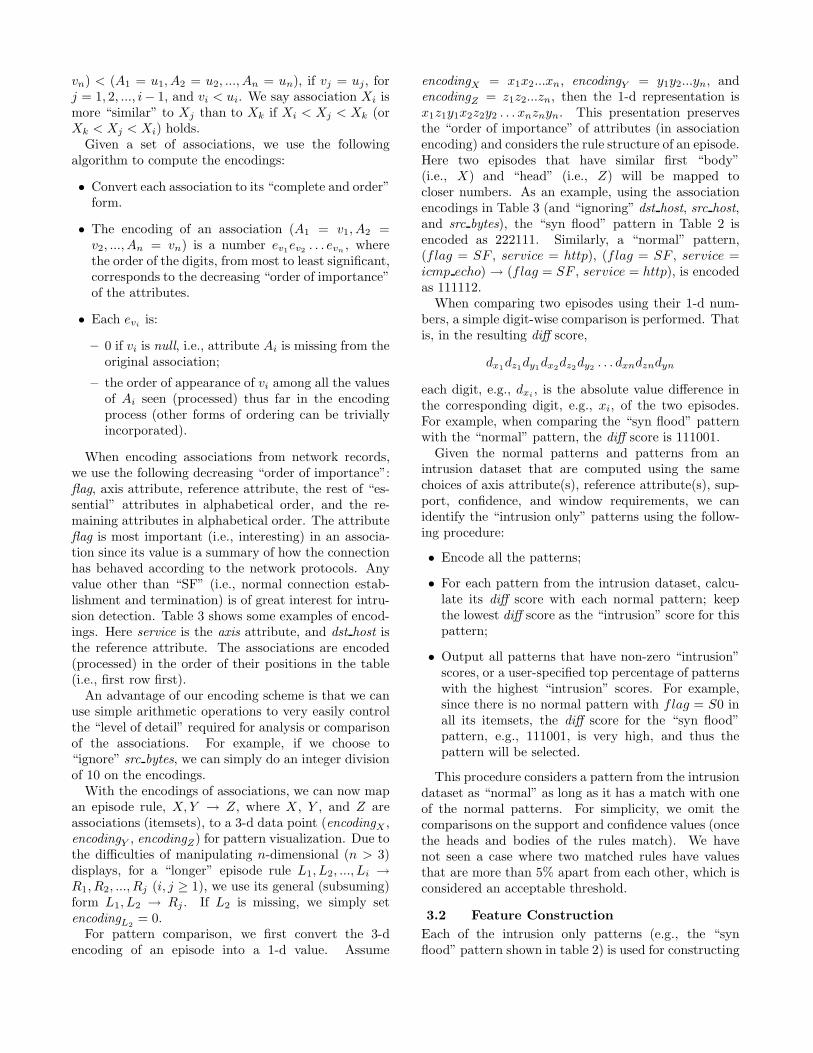
When encoding associations from network records,we use the following decreasing “order of importance”:flag, axis attribute, reference attribute, the rest of “es-sential” attributes in alphabetical order, and the re-maining attributes in alphabetical order. The attributeflag is most important (i.e., interesting) in an associa-tion since its value is a summary of how the connectionhas behaved according to the network protocols. Anyvalue other than “SF” (i.e., normal connection estab-lishment and termination) is of great interest for intru-sion detection. Table 3 shows some examples of encod-ings. Here service is the axis attribute, and dst host isthe reference attribute. The associations are encoded(processed) in the order of their positions in the table(i.e., first row first).
An advantage of our encoding scheme is that we canuse simple arithmetic operations to very easily controlthe “level of detail” required for analysis or comparisonof the associations. For example, if we choose to“ignore” src bytes, we can simply do an integer divisionof 10 on the encodings.
With the encodings of associations, we can now mapan episode rule, X,Y → Z, where X , Y , and Z areassociations (itemsets), to a 3-d data point (encodingX ,encodingY , encodingZ) for pattern visualization. Due tothe difficulties of manipulating n-dimensional (n > 3)displays, for a “longer” episode rule L1, L2, ..., Li →R1, R2, ..., Rj (i, j ≥ 1), we use its general (subsuming)form L1, L2 → Rj . If L2 is missing, we simply setencodingL2
= 0.For pattern comparison, we first convert the 3-d
encoding of an episode into a 1-d value. Assume
encodingX = x1x2...xn, encodingY = y1y2...yn, andencodingZ = z1z2...zn, then the 1-d representation isx1z1y1x2z2y2 . . . xnznyn. This presentation preservesthe “order of importance” of attributes (in associationencoding) and considers the rule structure of an episode.Here two episodes that have similar first “body”(i.e., X) and “head” (i.e., Z) will be mapped tocloser numbers. As an example, using the associationencodings in Table 3 (and “ignoring” dst host, src host,and src bytes), the “syn flood” pattern in Table 2 isencoded as 222111. Similarly, a “normal” pattern,(flag = SF , service = http), (flag = SF , service =icmp echo) → (flag = SF , service = http), is encodedas 111112.
When comparing two episodes using their 1-d num-bers, a simple digit-wise comparison is performed. Thatis, in the resulting diff score,
dx1dz1
dy1dx2
dz2dy2
. . . dxndzndyn
each digit, e.g., dxi, is the absolute value difference in
the corresponding digit, e.g., xi, of the two episodes.For example, when comparing the “syn flood” patternwith the “normal” pattern, the diff score is 111001.
Given the normal patterns and patterns from anintrusion dataset that are computed using the samechoices of axis attribute(s), reference attribute(s), sup-port, confidence, and window requirements, we canidentify the “intrusion only” patterns using the follow-ing procedure:
• Encode all the patterns;
• For each pattern from the intrusion dataset, calcu-late its diff score with each normal pattern; keepthe lowest diff score as the “intrusion” score for thispattern;
• Output all patterns that have non-zero “intrusion”scores, or a user-specified top percentage of patternswith the highest “intrusion” scores. For example,since there is no normal pattern with flag = S0 inall its itemsets, the diff score for the “syn flood”pattern, e.g., 111001, is very high, and thus thepattern will be selected.
This procedure considers a pattern from the intrusiondataset as “normal” as long as it has a match with oneof the normal patterns. For simplicity, we omit thecomparisons on the support and confidence values (oncethe heads and bodies of the rules match). We havenot seen a case where two matched rules have valuesthat are more than 5% apart from each other, which isconsidered an acceptable threshold.
3.2 Feature Construction
Each of the intrusion only patterns (e.g., the “synflood” pattern shown in table 2) is used for constructing
association encoding(flag = SF, service = http, src bytes = 200) 11001(service = icmp echo, dst host = hostB) 02100(flag = S0, service = http, src host = hostA) 21010(service = user app, src host = hostA) 03010(flag = SF, service = icmp echo, dst host = hostB , src host = hostC) 12120... ...
Table 3: Encodings of Associations
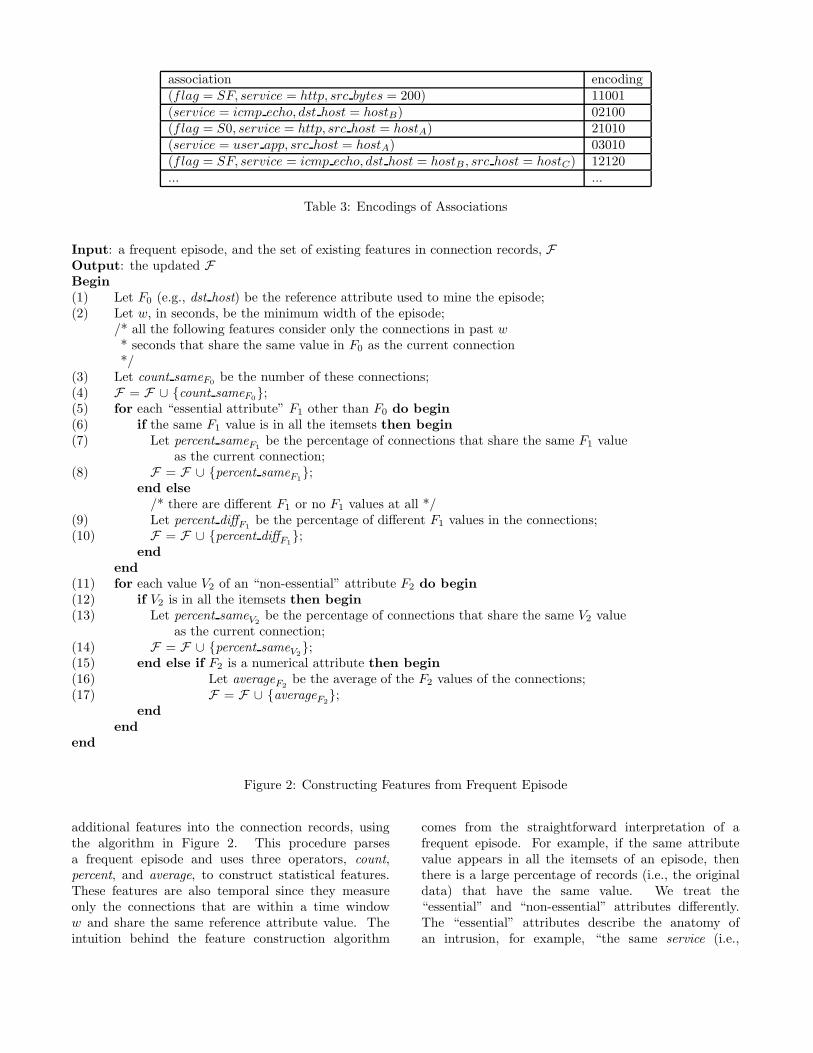
Input: a frequent episode, and the set of existing features in connection records, FOutput: the updated FBegin
(1) Let F0 (e.g., dst host) be the reference attribute used to mine the episode;(2) Let w, in seconds, be the minimum width of the episode;
/* all the following features consider only the connections in past w
* seconds that share the same value in F0 as the current connection*/
(3) Let count sameF0be the number of these connections;
(4) F = F ∪ {count sameF0};
(5) for each “essential attribute” F1 other than F0 do begin
(6) if the same F1 value is in all the itemsets then begin
(7) Let percent sameF1be the percentage of connections that share the same F1 value
as the current connection;(8) F = F ∪ {percent sameF1
};end else
/* there are different F1 or no F1 values at all */(9) Let percent diffF1
be the percentage of different F1 values in the connections;(10) F = F ∪ {percent diffF1
};end
end
(11) for each value V2 of an “non-essential” attribute F2 do begin
(12) if V2 is in all the itemsets then begin
(13) Let percent sameV2be the percentage of connections that share the same V2 value
as the current connection;(14) F = F ∪ {percent sameV2
};(15) end else if F2 is a numerical attribute then begin
(16) Let averageF2be the average of the F2 values of the connections;
(17) F = F ∪ {averageF2};
end
end
end
Figure 2: Constructing Features from Frequent Episode
additional features into the connection records, usingthe algorithm in Figure 2. This procedure parsesa frequent episode and uses three operators, count,percent, and average, to construct statistical features.These features are also temporal since they measureonly the connections that are within a time windoww and share the same reference attribute value. Theintuition behind the feature construction algorithm
comes from the straightforward interpretation of afrequent episode. For example, if the same attributevalue appears in all the itemsets of an episode, thenthere is a large percentage of records (i.e., the originaldata) that have the same value. We treat the“essential” and “non-essential” attributes differently.The “essential” attributes describe the anatomy ofan intrusion, for example, “the same service (i.e.,
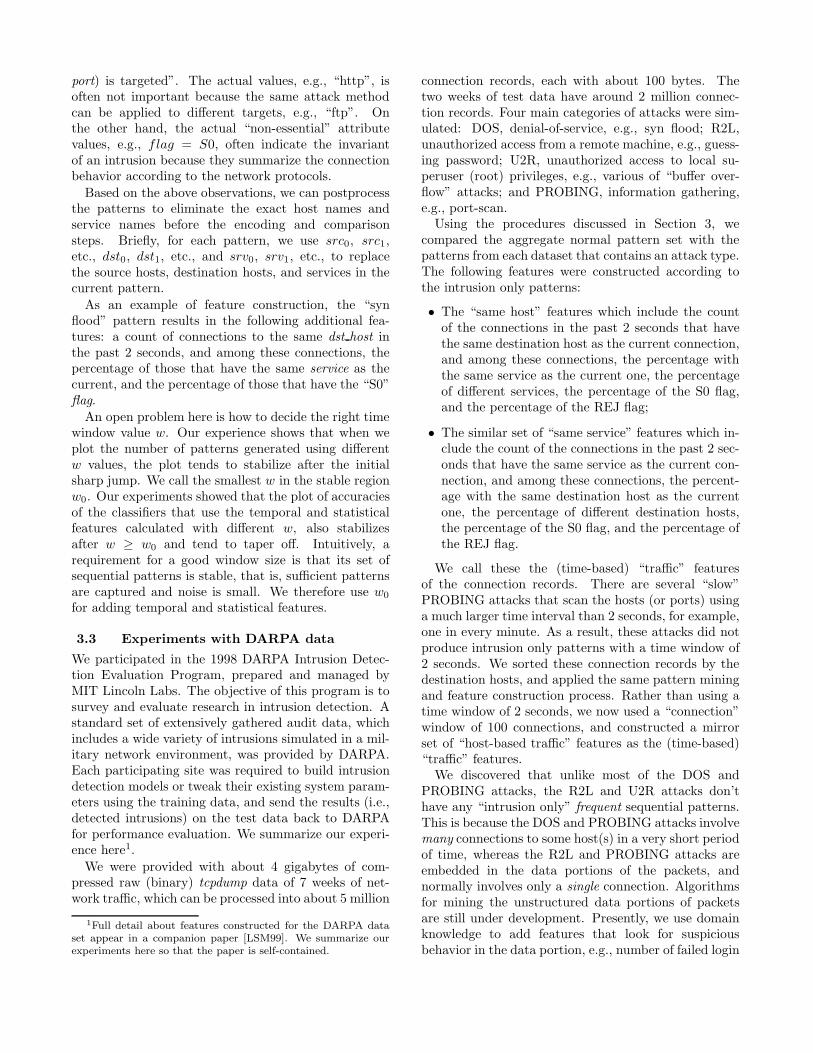
port) is targeted”. The actual values, e.g., “http”, isoften not important because the same attack methodcan be applied to different targets, e.g., “ftp”. Onthe other hand, the actual “non-essential” attributevalues, e.g., flag = S0, often indicate the invariantof an intrusion because they summarize the connectionbehavior according to the network protocols.
Based on the above observations, we can postprocessthe patterns to eliminate the exact host names andservice names before the encoding and comparisonsteps. Briefly, for each pattern, we use src0, src1,etc., dst0, dst1, etc., and srv0, srv1, etc., to replacethe source hosts, destination hosts, and services in thecurrent pattern.
As an example of feature construction, the “synflood” pattern results in the following additional fea-tures: a count of connections to the same dst host inthe past 2 seconds, and among these connections, thepercentage of those that have the same service as thecurrent, and the percentage of those that have the “S0”flag.
An open problem here is how to decide the right timewindow value w. Our experience shows that when weplot the number of patterns generated using differentw values, the plot tends to stabilize after the initialsharp jump. We call the smallest w in the stable regionw0. Our experiments showed that the plot of accuraciesof the classifiers that use the temporal and statisticalfeatures calculated with different w, also stabilizesafter w ≥ w0 and tend to taper off. Intuitively, arequirement for a good window size is that its set ofsequential patterns is stable, that is, sufficient patternsare captured and noise is small. We therefore use w0
for adding temporal and statistical features.
3.3 Experiments with DARPA data
We participated in the 1998 DARPA Intrusion Detec-tion Evaluation Program, prepared and managed byMIT Lincoln Labs. The objective of this program is tosurvey and evaluate research in intrusion detection. Astandard set of extensively gathered audit data, whichincludes a wide variety of intrusions simulated in a mil-itary network environment, was provided by DARPA.Each participating site was required to build intrusiondetection models or tweak their existing system param-eters using the training data, and send the results (i.e.,detected intrusions) on the test data back to DARPAfor performance evaluation. We summarize our experi-ence here1.
We were provided with about 4 gigabytes of com-pressed raw (binary) tcpdump data of 7 weeks of net-work traffic, which can be processed into about 5 million
1Full detail about features constructed for the DARPA dataset appear in a companion paper [LSM99]. We summarize ourexperiments here so that the paper is self-contained.
connection records, each with about 100 bytes. Thetwo weeks of test data have around 2 million connec-tion records. Four main categories of attacks were sim-ulated: DOS, denial-of-service, e.g., syn flood; R2L,unauthorized access from a remote machine, e.g., guess-ing password; U2R, unauthorized access to local su-peruser (root) privileges, e.g., various of “buffer over-flow” attacks; and PROBING, information gathering,e.g., port-scan.
Using the procedures discussed in Section 3, wecompared the aggregate normal pattern set with thepatterns from each dataset that contains an attack type.The following features were constructed according tothe intrusion only patterns:
• The “same host” features which include the countof the connections in the past 2 seconds that havethe same destination host as the current connection,and among these connections, the percentage withthe same service as the current one, the percentageof different services, the percentage of the S0 flag,and the percentage of the REJ flag;
• The similar set of “same service” features which in-clude the count of the connections in the past 2 sec-onds that have the same service as the current con-nection, and among these connections, the percent-age with the same destination host as the currentone, the percentage of different destination hosts,the percentage of the S0 flag, and the percentage ofthe REJ flag.
We call these the (time-based) “traffic” featuresof the connection records. There are several “slow”PROBING attacks that scan the hosts (or ports) usinga much larger time interval than 2 seconds, for example,one in every minute. As a result, these attacks did notproduce intrusion only patterns with a time window of2 seconds. We sorted these connection records by thedestination hosts, and applied the same pattern miningand feature construction process. Rather than using atime window of 2 seconds, we now used a “connection”window of 100 connections, and constructed a mirrorset of “host-based traffic” features as the (time-based)“traffic” features.
We discovered that unlike most of the DOS andPROBING attacks, the R2L and U2R attacks don’thave any “intrusion only” frequent sequential patterns.This is because the DOS and PROBING attacks involvemany connections to some host(s) in a very short periodof time, whereas the R2L and PROBING attacks areembedded in the data portions of the packets, andnormally involves only a single connection. Algorithmsfor mining the unstructured data portions of packetsare still under development. Presently, we use domainknowledge to add features that look for suspiciousbehavior in the data portion, e.g., number of failed login

Model Feature set Intrusion # of features # of rules # of featurescategories in records used in rules
content “intrinsic” + U2R, R2L 22 55 11“content”
traffic “intrinsic” + DOS, PROBING 20 26 4+9
“traffic”host traffic “intrinsic” + Slow PROBING 14 8 1+5
“host traffic”
Table 4: Model Complexities
attempts, the behavior of suid programs, etc. We callthese features the “content” features.
We then built three specialized models, using RIP-PER, that each has a different set of features and de-tects different categories of intrusions. For example, forthe “content” model, each connection record containsthe “intrinsic” features and “content” features, and theresultant RIPPER rules detect U2R and R2L attacks.A meta-classifier was used to combine the predictionsof the three base models when making a final predic-tion to a connection record. Table 4 summarizes thesemodels. The numbers in bold, for example, 9, indicatethe number of automatically constructed temporal andstatistical features being used in the RIPPER rules. Wesee that for both the “traffic” and host-based “traffic”models, our feature construction process contributes themajority of the features actually used in the rules.
We report here the performance of our detectionmodels as evaluated by MIT Lincoln Labs. We trainedour intrusion detection models, i.e., the base modelsand the meta-level classifier, using the 7 weeks of labeleddata, and used them to make predictions on the 2 weeksof unlabeled test data. The test data contains a totalof 38 attack types, with 14 types in the test data only(i.e., they are “new” to our models).
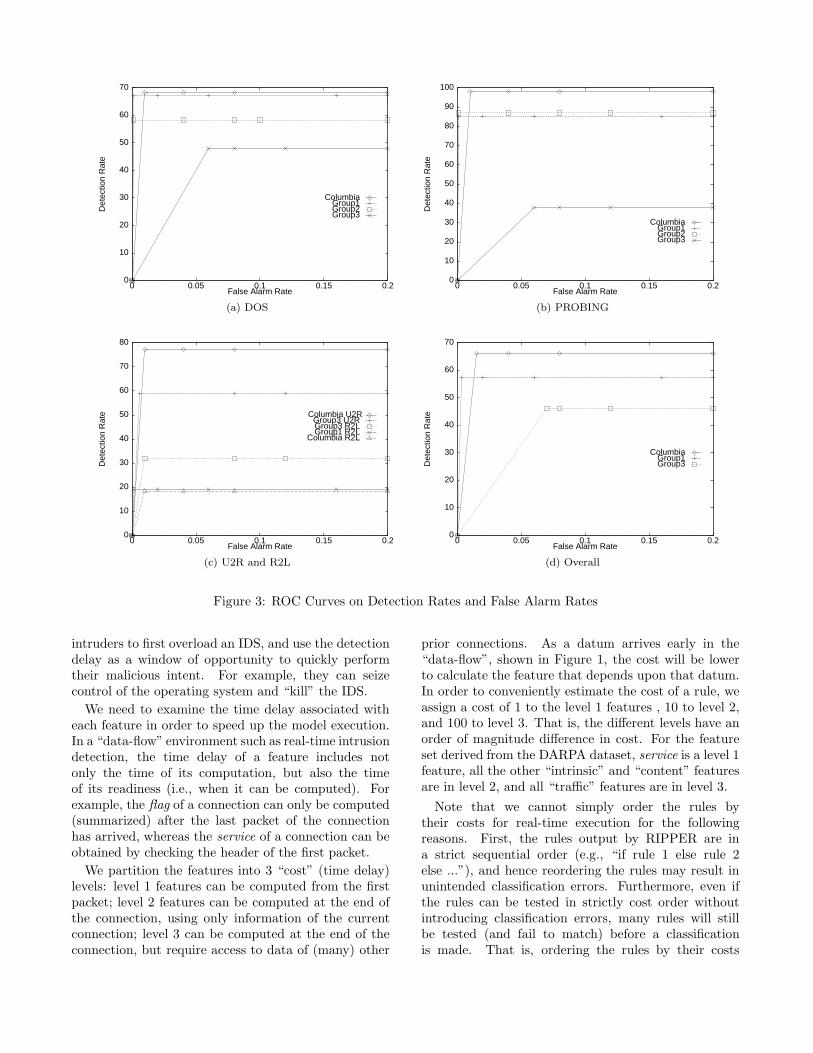
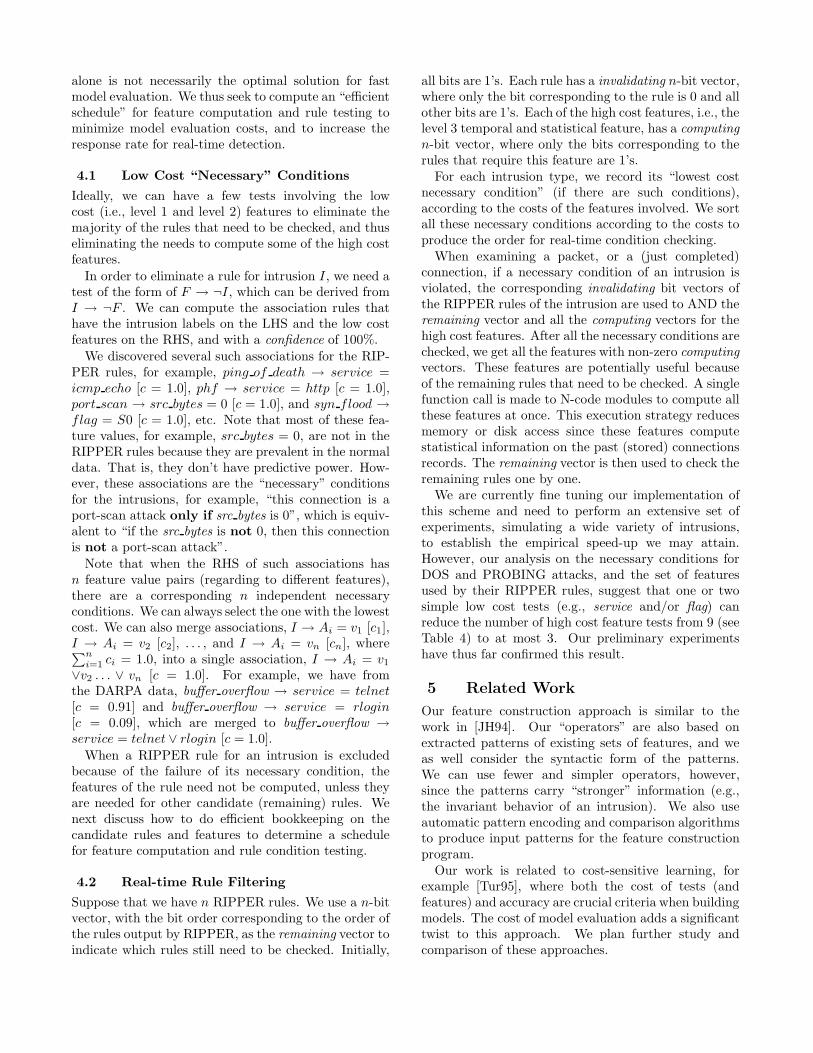
Figure 3 shows the ROC curves of the detectionmodels by attack categories as well as on all intrusions.In each of these ROC plots, the x-axis is the falsealarm rate, calculated as the percentage of normalconnections classified as an intrusion; the y-axis is thedetection rate, calculated as the percentage of intrusionsdetected (since the models produced binary outputs,the ROC curves are not continuous). We compare hereour models with other participants (denoted as Group1 to 3) in the DARPA evaluation program2. Thesegroups used knowledge engineering approaches to buildtheir intrusion detection systems. We can see from thefigure that our detection models have the best overallperformance, and in all but one attack category, ourmodel is one of the best two.
2These plots are duplicated from the presentation slides ofa report given by Lincoln Labs in a DARPA PI meeting. Theslides can be viewed on line via http://www.cs.columbia.edu/
~sal/JAM/PROJECT/MIT/mit-index.html.
We discussed the Evaluation results with some re-searchers of other participating groups. It is agreedthat the (manual) knowledge engineering approach suf-fers from the difficulties of dealing with large amountof data, and the inabilities to generalize the (oftentoo-specific) hand-coded models. Our procedures forautomatic construction features from mined patternsworked well with the large dataset. Using inductiveclassification rules also provides better performance onthe “new” attacks. However, as the results on R2Lshows, all models performed poorly when there are verylarge varieties of attack methods (of the same intrusioncategory). Much research is still needed in network in-trusion detection.
4 Efficient Execution of Learned
Rules
Our intrusion detection models are produced off-line.Effective intrusion detection should be in real-time tominimize security compromises. We therefore needto study how our models perform in a real-timeenvironment. We are working on translating RIPPERrules into real-time detection modules in NFR (NetworkFlight Recorder) [NFR], a system that includes a packetcapturing engine and N-code programming support forspecifying packet “filtering” logic.
In our first implementation, we essentially triedto follow the off-line analysis steps in a real-timeenvironment. A connection is not inspected (classifiedusing the rules) until its connection record is completelyformulated, that is, all packets of the connectionhave arrived and summarized, and all the temporaland statistical features are computed. This schemefailed miserably. When there is a large volume ofnetwork traffic, the amount of time taken to processthe connection records within the past 2 seconds andcalculate the statistics is also very large. Many ensuingconnections may have terminated (and thus completedwith attack actions) when the current connection isfinally inspected by the RIPPER rules. That is, thedetection of intrusions is severely delayed. Ironically,DOS attacks, which typically generate a large amountof traffic in a very short period time, are often used by
0
10
20
30
40
50
60
70
0 0.05 0.1 0.15 0.2
Det
ectio
n R
ate
False Alarm Rate
Columbia Group1 Group2 Group3
(a) DOS
0
10
20
30
40
50
60
70
80
90
100
0 0.05 0.1 0.15 0.2
Det
ectio
n R
ate
False Alarm Rate
Columbia Group1 Group2 Group3
(b) PROBING
0
10
20
30
40
50
60
70
80
0 0.05 0.1 0.15 0.2
Det
ectio
n R
ate
False Alarm Rate
Columbia U2RGroup3 U2R Group3 R2L Group1 R2L
Columbia R2L
(c) U2R and R2L
0
10
20
30
40
50
60
70
0 0.05 0.1 0.15 0.2
Det
ectio
n R
ate
False Alarm Rate
Columbia Group1 Group3
(d) Overall
Figure 3: ROC Curves on Detection Rates and False Alarm Rates
intruders to first overload an IDS, and use the detectiondelay as a window of opportunity to quickly performtheir malicious intent. For example, they can seizecontrol of the operating system and “kill” the IDS.
We need to examine the time delay associated witheach feature in order to speed up the model execution.In a “data-flow” environment such as real-time intrusiondetection, the time delay of a feature includes notonly the time of its computation, but also the timeof its readiness (i.e., when it can be computed). Forexample, the flag of a connection can only be computed(summarized) after the last packet of the connectionhas arrived, whereas the service of a connection can beobtained by checking the header of the first packet.
We partition the features into 3 “cost” (time delay)levels: level 1 features can be computed from the firstpacket; level 2 features can be computed at the end ofthe connection, using only information of the currentconnection; level 3 can be computed at the end of theconnection, but require access to data of (many) other
prior connections. As a datum arrives early in the“data-flow”, shown in Figure 1, the cost will be lowerto calculate the feature that depends upon that datum.In order to conveniently estimate the cost of a rule, weassign a cost of 1 to the level 1 features , 10 to level 2,and 100 to level 3. That is, the different levels have anorder of magnitude difference in cost. For the featureset derived from the DARPA dataset, service is a level 1feature, all the other “intrinsic” and “content” featuresare in level 2, and all “traffic” features are in level 3.
Note that we cannot simply order the rules bytheir costs for real-time execution for the followingreasons. First, the rules output by RIPPER are ina strict sequential order (e.g., “if rule 1 else rule 2else ...”), and hence reordering the rules may result inunintended classification errors. Furthermore, even ifthe rules can be tested in strictly cost order withoutintroducing classification errors, many rules will stillbe tested (and fail to match) before a classificationis made. That is, ordering the rules by their costs
alone is not necessarily the optimal solution for fastmodel evaluation. We thus seek to compute an “efficientschedule” for feature computation and rule testing tominimize model evaluation costs, and to increase theresponse rate for real-time detection.
4.1 Low Cost “Necessary” Conditions
Ideally, we can have a few tests involving the lowcost (i.e., level 1 and level 2) features to eliminate themajority of the rules that need to be checked, and thuseliminating the needs to compute some of the high costfeatures.
In order to eliminate a rule for intrusion I, we need atest of the form of F → ¬I, which can be derived fromI → ¬F . We can compute the association rules thathave the intrusion labels on the LHS and the low costfeatures on the RHS, and with a confidence of 100%.
We discovered several such associations for the RIP-PER rules, for example, ping of death → service =icmp echo [c = 1.0], phf → service = http [c = 1.0],port scan → src bytes = 0 [c = 1.0], and syn flood →flag = S0 [c = 1.0], etc. Note that most of these fea-ture values, for example, src bytes = 0, are not in theRIPPER rules because they are prevalent in the normaldata. That is, they don’t have predictive power. How-ever, these associations are the “necessary” conditionsfor the intrusions, for example, “this connection is aport-scan attack only if src bytes is 0”, which is equiv-alent to “if the src bytes is not 0, then this connectionis not a port-scan attack”.
Note that when the RHS of such associations hasn feature value pairs (regarding to different features),there are a corresponding n independent necessaryconditions. We can always select the one with the lowestcost. We can also merge associations, I → Ai = v1 [c1],I → Ai = v2 [c2], . . . , and I → Ai = vn [cn], where∑n
i=1ci = 1.0, into a single association, I → Ai = v1
∨v2 . . . ∨ vn [c = 1.0]. For example, we have fromthe DARPA data, buffer overflow → service = telnet
[c = 0.91] and buffer overflow → service = rlogin
[c = 0.09], which are merged to buffer overflow →service = telnet ∨ rlogin [c = 1.0].
When a RIPPER rule for an intrusion is excludedbecause of the failure of its necessary condition, thefeatures of the rule need not be computed, unless theyare needed for other candidate (remaining) rules. Wenext discuss how to do efficient bookkeeping on thecandidate rules and features to determine a schedulefor feature computation and rule condition testing.
4.2 Real-time Rule Filtering
Suppose that we have n RIPPER rules. We use a n-bitvector, with the bit order corresponding to the order ofthe rules output by RIPPER, as the remaining vector toindicate which rules still need to be checked. Initially,
all bits are 1’s. Each rule has a invalidating n-bit vector,where only the bit corresponding to the rule is 0 and allother bits are 1’s. Each of the high cost features, i.e., thelevel 3 temporal and statistical feature, has a computing
n-bit vector, where only the bits corresponding to therules that require this feature are 1’s.
For each intrusion type, we record its “lowest costnecessary condition” (if there are such conditions),according to the costs of the features involved. We sortall these necessary conditions according to the costs toproduce the order for real-time condition checking.
When examining a packet, or a (just completed)connection, if a necessary condition of an intrusion isviolated, the corresponding invalidating bit vectors ofthe RIPPER rules of the intrusion are used to AND theremaining vector and all the computing vectors for thehigh cost features. After all the necessary conditions arechecked, we get all the features with non-zero computing
vectors. These features are potentially useful becauseof the remaining rules that need to be checked. A singlefunction call is made to N-code modules to compute allthese features at once. This execution strategy reducesmemory or disk access since these features computestatistical information on the past (stored) connectionsrecords. The remaining vector is then used to check theremaining rules one by one.
We are currently fine tuning our implementation ofthis scheme and need to perform an extensive set ofexperiments, simulating a wide variety of intrusions,to establish the empirical speed-up we may attain.However, our analysis on the necessary conditions forDOS and PROBING attacks, and the set of featuresused by their RIPPER rules, suggest that one or twosimple low cost tests (e.g., service and/or flag) canreduce the number of high cost feature tests from 9 (seeTable 4) to at most 3. Our preliminary experimentshave thus far confirmed this result.
5 Related Work
Our feature construction approach is similar to thework in [JH94]. Our “operators” are also based onextracted patterns of existing sets of features, and weas well consider the syntactic form of the patterns.We can use fewer and simpler operators, however,since the patterns carry “stronger” information (e.g.,the invariant behavior of an intrusion). We also useautomatic pattern encoding and comparison algorithmsto produce input patterns for the feature constructionprogram.
Our work is related to cost-sensitive learning, forexample [Tur95], where both the cost of tests (andfeatures) and accuracy are crucial criteria when buildingmodels. The cost of model evaluation adds a significanttwist to this approach. We plan further study andcomparison of these approaches.
In DC-1 (Detector Constructor) [FP97], a sequenceof operations for constructing features (indicators)is needed before a cellular phone fraud detector (aclassifier) is constructed. We have a harder problemhere because there is no standard record format forconnection records (we had to invent our own). We alsoneed to construct temporal and statistical features notjust for “individual accounts”, but also over differentconnections and services. That is, we are modelingdifferent logical entities that take on different roles andwhose behavior is recorded in great detail. Extractingthese from a fast and overwhelming stream of packetdata adds considerable complexity to the problem.
6 Conclusions and Future Work
We described the challenges as well as opportunitiesfor KDD in a “data-flow” environment. Using networkintrusion detection as a concrete case study, we showedthat the “expert-intensive” feature construction process(which is part of data preprocessing) can be guided andsupported by data mining programs. Our approach is toencode and compare the frequent patterns mined fromthe normal and intrusion datasets, and automaticallyconstruct statistical and temporal features that describethe anatomy and invariant behavior of the attacks.The results from the DARPA evaluation show that theintrusion detection models produced using our methodoutperformed other “knowledge-engineered” systems.We also pointed out that it is critical to consider thecost (time delay) of real-time execution of a model. Wedevised a simple scheme that aims to use a few low costtests to filter out a large portion of the high cost featurecomputations.
As for future work, we will continue our research onoptimizing learned rules for real-time execution. Wewill also study the issues of network anomaly detection,which is the only possible means to detect new attacksthat are completely different in nature than any of theknown intrusions.
7 Acknowledgment
This research is supported in part by grants fromDARPA (F30602-96-1-0311) and NSF (IRI-96-32225and CDA-96-25374). We would like to thank ForsterProvost of Bell Atlantic, and William Cohen of AT&Tfor helpful discussion.
References
[AIS93] R. Agrawal, T. Imielinski, and A. Swami.Mining association rules between sets ofitems in large databases. In Proceedings of the
ACM SIGMOD Conference on Management
of Data, pages 207–216, 1993.
[Coh95] W. W. Cohen. Fast effective rule induction.In Machine Learning: the 12th International
Conference, Lake Taho, CA, 1995. MorganKaufmann.
[CS93] P. K. Chan and S. J. Stolfo. Toward paralleland distributed learning by meta-learning. InAAAI Workshop in Knowledge Discovery in
Databases, pages 227–240, 1993.
[FP97] T. Fawcett and F. Provost. Adaptive frauddetection. Data Mining and Knowledge
Discovery, 1:291–316, 1997.
[FPSS96] U. Fayyad, G. Piatetsky-Shapiro, andP. Smyth. The KDD process of extract-ing useful knowledge from volumes of data.Communications of the ACM, 39(11):27–34,November 1996.
[JH94] N. Japkowicz and H. Hirsh. Towards a boot-strapping approach to constructive induc-tion. In Working Notes of the Workshop on
Constructive Induction and Change of Rep-
resentation, 1994.
[JLM89] V. Jacobson, C. Leres, and S. McCanne.tcpdump. available via anonymous ftp toftp.ee.lbl.gov, June 1989.
[LSM98] W. Lee, S. J. Stolfo, and K. W. Mok. Min-ing audit data to build intrusion detectionmodels. In Proceedings of the 4th Interna-
tional Conference on Knowledge Discovery
and Data Mining, New York, NY, August1998. AAAI Press.
[LSM99] W. Lee, S. J. Stolfo, and K. W. Mok. Adata mining framework for building intrusiondetection models. In Proceedings of the 1999
IEEE Symposium on Security and Privacy,May 1999.
[MTV95] H. Mannila, H. Toivonen, and A. I. Verkamo.Discovering frequent episodes in sequences.In Proceedings of the 1st International Con-
ference on Knowledge Discovery in Databases
and Data Mining, Montreal, Canada, August1995.
[NFR] Network Flight Recorder Inc. Network flightrecorder. http://www.nfr.com, 1997.
[Tur95] P. D. Turney. Cost-sensitive classification:Empirical evaluation of a hybrid geneticdecision tree induction algorithm. Journal of
Artificial Intelligence Research, 2(1995):369–409, 1995.