An FPGA-Based Network Intrusion Detection Architecture
15
118 IEEE TRANSACTIONS ON INFORMATION FORENSICS AND SECURITY, VOL. 3, NO. 1, MARCH 2008 An FPGA-Based Network Intrusion Detection Architecture Abhishek Das, Student Member, IEEE, David Nguyen, Joseph Zambreno, Member, IEEE, Gokhan Memik, Member, IEEE, and Alok Choudhary, Fellow, IEEE Abstract—Network intrusion detection systems (NIDSs) mon- itor network traffic for suspicious activity and alert the system or network administrator. With the onset of gigabit networks, current generation networking components for NIDS will soon be insufficient for numerous reasons; most notably because the existing methods cannot support high-performance demands. Field-programmable gate arrays (FPGAs) are an attractive medium to handle both high throughput and adaptability to the dynamic nature of intrusion detection. In this work, we design an FPGA-based architecture for anomaly detection in network transmissions. We first develop a feature extraction module (FEM) which aims to summarize network information to be used at a later stage. Our FPGA implementation shows that we can achieve significant performance improvements compared to existing soft- ware and application-specific integrated-circuit implementations. Then, we go one step further and demonstrate the use of principal component analysis as an outlier detection method for NIDSs. The results show that our architecture correctly classifies attacks with detection rates exceeding 99% and false alarms rates as low as 1.95%. Moreover, using extensive pipelining and hardware parallelism, it can be shown that for realistic workloads, our architectures for FEM and outlier analysis achieve 21.25- and 23.76-Gb/s core throughput, respectively. Index Terms—Feature extraction, field-programmable gate ar- rays (FPGA), network intrusion detection system (NIDS), prin- cipal component analysis (PCA). I. INTRODUCTION T RADITIONALLY, intrusion detection techniques fall into two categories: 1) signature detection and 2) anomaly detection. Signature detection, or misuse detection, searches for well-known patterns of attacks and intrusions by scanning for preclassified signatures in TCP/IP packets. This model of network monitoring has extremely low false-alarm rates but cannot detect new attacks. String matching [10] is an example of a signature-based method for detecting suspicious Manuscript received May 5, 2006; revised September 7, 2007. This work was supported in part by the National Science Foundation (NSF) under Grants NSF-ITR CCR-0325207, CNS-0406341, CNS-0551639, IIS-0536994, and CCR-0325207, in part by the Air Force Office of Scientific Research (AFOSR) Award FA9550-06-1-0152 and in part by the Department of Energy (DoE) under CAREER Award DE-FG02-05ER25691. The associate editor coordi- nating the review of this manuscript and approving it for publication was Prof. Klara Nahrstedt. A. Das, G. Memik, and A. Choudhary are with the Electrical Engineering and Computer Science Department, Northwestern University, Evanston, IL 60208 USA (e-mail: [email protected]; [email protected]; [email protected]). D. Nguyen is with SanDisk Corporation, Milpitas, CA 95035 USA. J. Zambreno is with the Electrical and Computer Engineering Science Dept., Iowa State University, Ames, IA 50011-2010 USA (e-mail: zambreno@iastate. edu). Digital Object Identifier 10.1109/TIFS.2007.916288 payloads in packets. Rule-based intrusion detection systems such as Bro [8] or Snort [33] use known rules to identify known attacks in packet payloads, such as requests for nonexisting services, strange flag combinations, or virus attack signatures or malicious strings. A number of software and hardware im- plementations have been proposed in this area, some of which utilized reconfigurable hardware architectures [30], [32], [34]. The second category of intrusion detection, anomaly detec- tion, is used to capture behavior that deviates from the norm. This method takes as input training data to build normal net- work behavior models. Alarms are raised when any activity de- viates from the normal model. Although anomaly detection can detect new intrusions, it may suffer from false alarms, including both raised alarms for normal activity (false positives) and quiet alarms during actual attacks (false negatives). Despite this ob- vious drawback, the high rate of increase in new attacks and change in the pattern of old attacks has made anomaly detection an indispensable technique in NIDSs. Since network line speeds have reached Gigabit rates and anomaly detection is computa- tion intensive, software-based techniques are inadequate. Re- configurable hardware solutions exhibit an attractive implemen- tation choice for anomaly detection due to their inherent paral- lelism, pipelining characteristics, and adaptability. As more so- phisticated methods are designed, algorithms and methods can be tailored specifically to their implementation environment. Although researchers have started working on hardware imple- mentations of data mining methods, such as the apriori algo- rithm [6], to the best of our knowledge, there are no hardware ar- chitectures specifically tailored to PCA or network anomaly de- tection. Fig. 1 gives an overview of a network detection system using both signature and outlier detection. A key point in this figure is the use of feature extraction modules to obtain concise information from a live packet stream. In this paper, we propose a new architecture for building an efficient NIDS using FPGAs. Particularly, we focus on anomaly detection. Our work is comprised of a new feature extraction module (FEM) which summarizes the network behavior. It also incorporates an anomaly detection mechanism using principal component analysis (PCA) as the outlier detection method. Both these modules are implemented on reconfigurable hard- ware and can handle the gigabit throughput demands by modern networks. The principal advantage of our technique is the high detection rate of network intrusions. The rest of this paper is organized as follows. Section II gives an overview of our intrusion detection architecture. Section III presents the FEM architecture and its components. Section IV describes PCA in detail. The implementation details and simu- lation results are illustrated in Section V. Section VI presents the 1556-6013/$25.00 © 2008 IEEE
Transcript of An FPGA-Based Network Intrusion Detection Architecture

118 IEEE TRANSACTIONS ON INFORMATION FORENSICS AND SECURITY, VOL. 3, NO. 1, MARCH 2008
An FPGA-Based Network IntrusionDetection Architecture
Abhishek Das, Student Member, IEEE, David Nguyen, Joseph Zambreno, Member, IEEE,Gokhan Memik, Member, IEEE, and Alok Choudhary, Fellow, IEEE
Abstract—Network intrusion detection systems (NIDSs) mon-itor network traffic for suspicious activity and alert the systemor network administrator. With the onset of gigabit networks,current generation networking components for NIDS will soonbe insufficient for numerous reasons; most notably because theexisting methods cannot support high-performance demands.Field-programmable gate arrays (FPGAs) are an attractivemedium to handle both high throughput and adaptability to thedynamic nature of intrusion detection. In this work, we designan FPGA-based architecture for anomaly detection in networktransmissions. We first develop a feature extraction module (FEM)which aims to summarize network information to be used at alater stage. Our FPGA implementation shows that we can achievesignificant performance improvements compared to existing soft-ware and application-specific integrated-circuit implementations.Then, we go one step further and demonstrate the use of principalcomponent analysis as an outlier detection method for NIDSs.The results show that our architecture correctly classifies attackswith detection rates exceeding 99% and false alarms rates as lowas 1.95%. Moreover, using extensive pipelining and hardwareparallelism, it can be shown that for realistic workloads, ourarchitectures for FEM and outlier analysis achieve 21.25- and23.76-Gb/s core throughput, respectively.
Index Terms—Feature extraction, field-programmable gate ar-rays (FPGA), network intrusion detection system (NIDS), prin-cipal component analysis (PCA).
I. INTRODUCTION
TRADITIONALLY, intrusion detection techniques fall intotwo categories: 1) signature detection and 2) anomaly
detection. Signature detection, or misuse detection, searchesfor well-known patterns of attacks and intrusions by scanningfor preclassified signatures in TCP/IP packets. This modelof network monitoring has extremely low false-alarm ratesbut cannot detect new attacks. String matching [10] is anexample of a signature-based method for detecting suspicious
Manuscript received May 5, 2006; revised September 7, 2007. This workwas supported in part by the National Science Foundation (NSF) under GrantsNSF-ITR CCR-0325207, CNS-0406341, CNS-0551639, IIS-0536994, andCCR-0325207, in part by the Air Force Office of Scientific Research (AFOSR)Award FA9550-06-1-0152 and in part by the Department of Energy (DoE)under CAREER Award DE-FG02-05ER25691. The associate editor coordi-nating the review of this manuscript and approving it for publication was Prof.Klara Nahrstedt.
A. Das, G. Memik, and A. Choudhary are with the Electrical Engineering andComputer Science Department, Northwestern University, Evanston, IL 60208USA (e-mail: [email protected]; [email protected];[email protected]).
D. Nguyen is with SanDisk Corporation, Milpitas, CA 95035 USA.J. Zambreno is with the Electrical and Computer Engineering Science Dept.,
Iowa State University, Ames, IA 50011-2010 USA (e-mail: [email protected]).
Digital Object Identifier 10.1109/TIFS.2007.916288
payloads in packets. Rule-based intrusion detection systemssuch as Bro [8] or Snort [33] use known rules to identify knownattacks in packet payloads, such as requests for nonexistingservices, strange flag combinations, or virus attack signaturesor malicious strings. A number of software and hardware im-plementations have been proposed in this area, some of whichutilized reconfigurable hardware architectures [30], [32], [34].
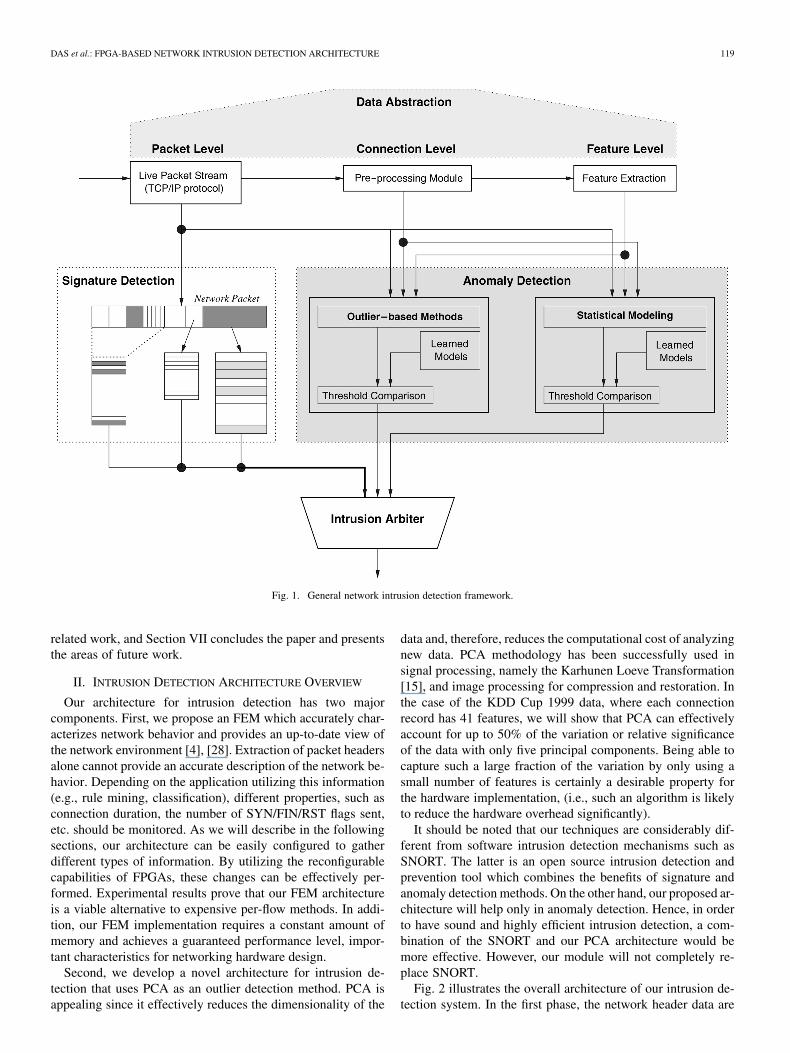
The second category of intrusion detection, anomaly detec-tion, is used to capture behavior that deviates from the norm.This method takes as input training data to build normal net-work behavior models. Alarms are raised when any activity de-viates from the normal model. Although anomaly detection candetect new intrusions, it may suffer from false alarms, includingboth raised alarms for normal activity (false positives) and quietalarms during actual attacks (false negatives). Despite this ob-vious drawback, the high rate of increase in new attacks andchange in the pattern of old attacks has made anomaly detectionan indispensable technique in NIDSs. Since network line speedshave reached Gigabit rates and anomaly detection is computa-tion intensive, software-based techniques are inadequate. Re-configurable hardware solutions exhibit an attractive implemen-tation choice for anomaly detection due to their inherent paral-lelism, pipelining characteristics, and adaptability. As more so-phisticated methods are designed, algorithms and methods canbe tailored specifically to their implementation environment.Although researchers have started working on hardware imple-mentations of data mining methods, such as the apriori algo-rithm [6], to the best of our knowledge, there are no hardware ar-chitectures specifically tailored to PCA or network anomaly de-tection. Fig. 1 gives an overview of a network detection systemusing both signature and outlier detection. A key point in thisfigure is the use of feature extraction modules to obtain conciseinformation from a live packet stream.
In this paper, we propose a new architecture for building anefficient NIDS using FPGAs. Particularly, we focus on anomalydetection. Our work is comprised of a new feature extractionmodule (FEM) which summarizes the network behavior. It alsoincorporates an anomaly detection mechanism using principalcomponent analysis (PCA) as the outlier detection method.Both these modules are implemented on reconfigurable hard-ware and can handle the gigabit throughput demands by modernnetworks. The principal advantage of our technique is the highdetection rate of network intrusions.
The rest of this paper is organized as follows. Section II givesan overview of our intrusion detection architecture. Section IIIpresents the FEM architecture and its components. Section IVdescribes PCA in detail. The implementation details and simu-lation results are illustrated in Section V. Section VI presents the
1556-6013/$25.00 © 2008 IEEE
DAS et al.: FPGA-BASED NETWORK INTRUSION DETECTION ARCHITECTURE 119
Fig. 1. General network intrusion detection framework.
related work, and Section VII concludes the paper and presentsthe areas of future work.
II. INTRUSION DETECTION ARCHITECTURE OVERVIEW
Our architecture for intrusion detection has two majorcomponents. First, we propose an FEM which accurately char-acterizes network behavior and provides an up-to-date view ofthe network environment [4], [28]. Extraction of packet headersalone cannot provide an accurate description of the network be-havior. Depending on the application utilizing this information(e.g., rule mining, classification), different properties, such asconnection duration, the number of SYN/FIN/RST flags sent,etc. should be monitored. As we will describe in the followingsections, our architecture can be easily configured to gatherdifferent types of information. By utilizing the reconfigurablecapabilities of FPGAs, these changes can be effectively per-formed. Experimental results prove that our FEM architectureis a viable alternative to expensive per-flow methods. In addi-tion, our FEM implementation requires a constant amount ofmemory and achieves a guaranteed performance level, impor-tant characteristics for networking hardware design.
Second, we develop a novel architecture for intrusion de-tection that uses PCA as an outlier detection method. PCA isappealing since it effectively reduces the dimensionality of the
data and, therefore, reduces the computational cost of analyzingnew data. PCA methodology has been successfully used insignal processing, namely the Karhunen Loeve Transformation[15], and image processing for compression and restoration. Inthe case of the KDD Cup 1999 data, where each connectionrecord has 41 features, we will show that PCA can effectivelyaccount for up to 50% of the variation or relative significanceof the data with only five principal components. Being able tocapture such a large fraction of the variation by only using asmall number of features is certainly a desirable property forthe hardware implementation, (i.e., such an algorithm is likelyto reduce the hardware overhead significantly).
It should be noted that our techniques are considerably dif-ferent from software intrusion detection mechanisms such asSNORT. The latter is an open source intrusion detection andprevention tool which combines the benefits of signature andanomaly detection methods. On the other hand, our proposed ar-chitecture will help only in anomaly detection. Hence, in orderto have sound and highly efficient intrusion detection, a com-bination of the SNORT and our PCA architecture would bemore effective. However, our module will not completely re-place SNORT.
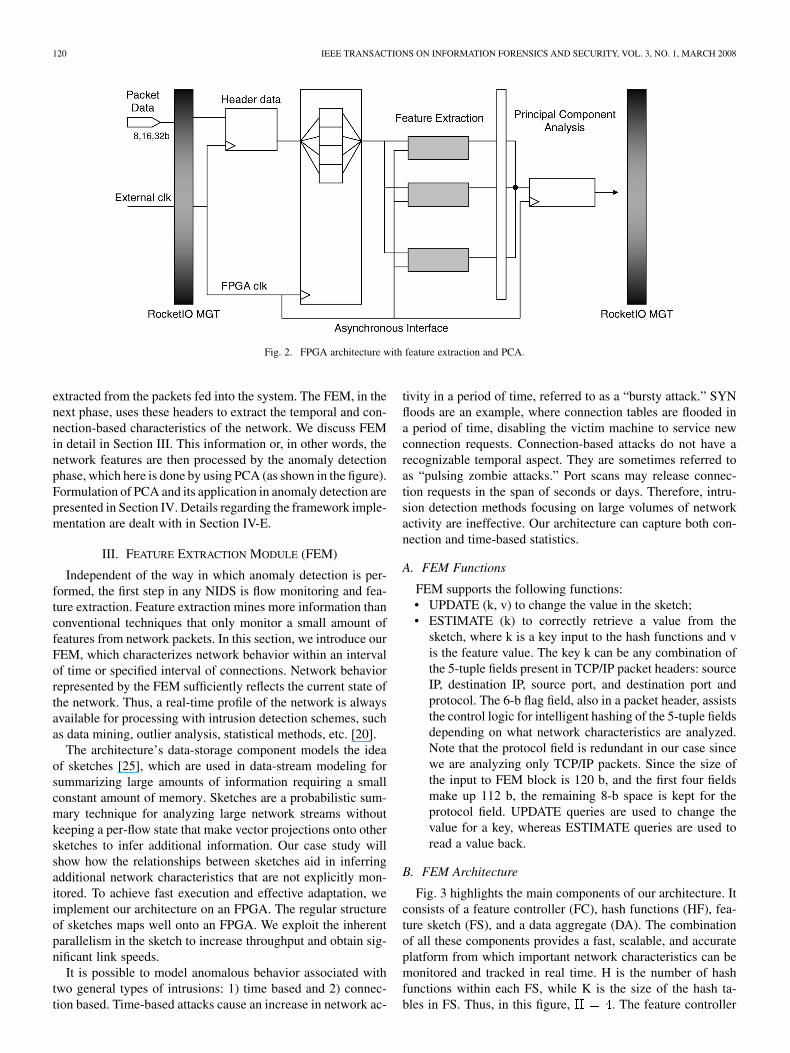
Fig. 2 illustrates the overall architecture of our intrusion de-tection system. In the first phase, the network header data are
120 IEEE TRANSACTIONS ON INFORMATION FORENSICS AND SECURITY, VOL. 3, NO. 1, MARCH 2008
Fig. 2. FPGA architecture with feature extraction and PCA.
extracted from the packets fed into the system. The FEM, in thenext phase, uses these headers to extract the temporal and con-nection-based characteristics of the network. We discuss FEMin detail in Section III. This information or, in other words, thenetwork features are then processed by the anomaly detectionphase, which here is done by using PCA (as shown in the figure).Formulation of PCA and its application in anomaly detection arepresented in Section IV. Details regarding the framework imple-mentation are dealt with in Section IV-E.
III. FEATURE EXTRACTION MODULE (FEM)
Independent of the way in which anomaly detection is per-formed, the first step in any NIDS is flow monitoring and fea-ture extraction. Feature extraction mines more information thanconventional techniques that only monitor a small amount offeatures from network packets. In this section, we introduce ourFEM, which characterizes network behavior within an intervalof time or specified interval of connections. Network behaviorrepresented by the FEM sufficiently reflects the current state ofthe network. Thus, a real-time profile of the network is alwaysavailable for processing with intrusion detection schemes, suchas data mining, outlier analysis, statistical methods, etc. [20].
The architecture’s data-storage component models the ideaof sketches [25], which are used in data-stream modeling forsummarizing large amounts of information requiring a smallconstant amount of memory. Sketches are a probabilistic sum-mary technique for analyzing large network streams withoutkeeping a per-flow state that make vector projections onto othersketches to infer additional information. Our case study willshow how the relationships between sketches aid in inferringadditional network characteristics that are not explicitly mon-itored. To achieve fast execution and effective adaptation, weimplement our architecture on an FPGA. The regular structureof sketches maps well onto an FPGA. We exploit the inherentparallelism in the sketch to increase throughput and obtain sig-nificant link speeds.
It is possible to model anomalous behavior associated withtwo general types of intrusions: 1) time based and 2) connec-tion based. Time-based attacks cause an increase in network ac-
tivity in a period of time, referred to as a “bursty attack.” SYNfloods are an example, where connection tables are flooded ina period of time, disabling the victim machine to service newconnection requests. Connection-based attacks do not have arecognizable temporal aspect. They are sometimes referred toas “pulsing zombie attacks.” Port scans may release connec-tion requests in the span of seconds or days. Therefore, intru-sion detection methods focusing on large volumes of networkactivity are ineffective. Our architecture can capture both con-nection and time-based statistics.
A. FEM Functions
FEM supports the following functions:• UPDATE (k, v) to change the value in the sketch;• ESTIMATE (k) to correctly retrieve a value from the
sketch, where k is a key input to the hash functions and vis the feature value. The key k can be any combination ofthe 5-tuple fields present in TCP/IP packet headers: sourceIP, destination IP, source port, and destination port andprotocol. The 6-b flag field, also in a packet header, assiststhe control logic for intelligent hashing of the 5-tuple fieldsdepending on what network characteristics are analyzed.Note that the protocol field is redundant in our case sincewe are analyzing only TCP/IP packets. Since the size ofthe input to FEM block is 120 b, and the first four fieldsmake up 112 b, the remaining 8-b space is kept for theprotocol field. UPDATE queries are used to change thevalue for a key, whereas ESTIMATE queries are used toread a value back.
B. FEM Architecture
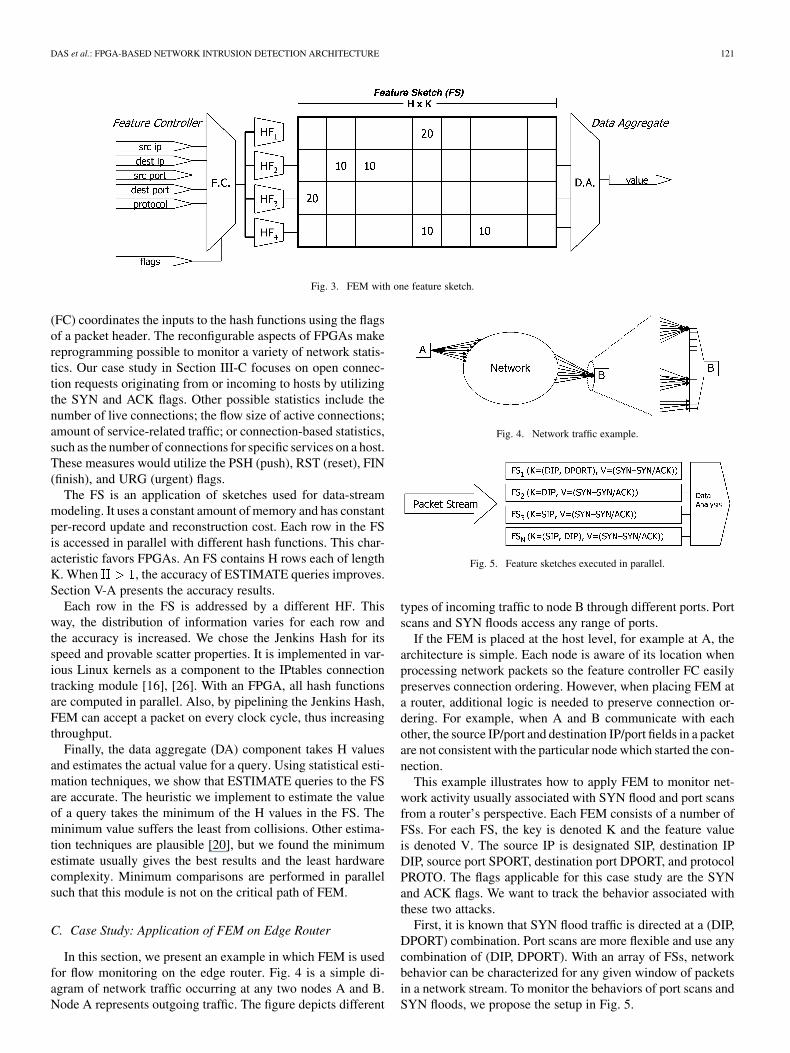
Fig. 3 highlights the main components of our architecture. Itconsists of a feature controller (FC), hash functions (HF), fea-ture sketch (FS), and a data aggregate (DA). The combinationof all these components provides a fast, scalable, and accurateplatform from which important network characteristics can bemonitored and tracked in real time. H is the number of hashfunctions within each FS, while K is the size of the hash ta-bles in FS. Thus, in this figure, . The feature controller
DAS et al.: FPGA-BASED NETWORK INTRUSION DETECTION ARCHITECTURE 121
Fig. 3. FEM with one feature sketch.
(FC) coordinates the inputs to the hash functions using the flagsof a packet header. The reconfigurable aspects of FPGAs makereprogramming possible to monitor a variety of network statis-tics. Our case study in Section III-C focuses on open connec-tion requests originating from or incoming to hosts by utilizingthe SYN and ACK flags. Other possible statistics include thenumber of live connections; the flow size of active connections;amount of service-related traffic; or connection-based statistics,such as the number of connections for specific services on a host.These measures would utilize the PSH (push), RST (reset), FIN(finish), and URG (urgent) flags.
The FS is an application of sketches used for data-streammodeling. It uses a constant amount of memory and has constantper-record update and reconstruction cost. Each row in the FSis accessed in parallel with different hash functions. This char-acteristic favors FPGAs. An FS contains H rows each of lengthK. When , the accuracy of ESTIMATE queries improves.Section V-A presents the accuracy results.
Each row in the FS is addressed by a different HF. Thisway, the distribution of information varies for each row andthe accuracy is increased. We chose the Jenkins Hash for itsspeed and provable scatter properties. It is implemented in var-ious Linux kernels as a component to the IPtables connectiontracking module [16], [26]. With an FPGA, all hash functionsare computed in parallel. Also, by pipelining the Jenkins Hash,FEM can accept a packet on every clock cycle, thus increasingthroughput.
Finally, the data aggregate (DA) component takes H valuesand estimates the actual value for a query. Using statistical esti-mation techniques, we show that ESTIMATE queries to the FSare accurate. The heuristic we implement to estimate the valueof a query takes the minimum of the H values in the FS. Theminimum value suffers the least from collisions. Other estima-tion techniques are plausible [20], but we found the minimumestimate usually gives the best results and the least hardwarecomplexity. Minimum comparisons are performed in parallelsuch that this module is not on the critical path of FEM.
C. Case Study: Application of FEM on Edge Router
In this section, we present an example in which FEM is usedfor flow monitoring on the edge router. Fig. 4 is a simple di-agram of network traffic occurring at any two nodes A and B.Node A represents outgoing traffic. The figure depicts different
Fig. 4. Network traffic example.
Fig. 5. Feature sketches executed in parallel.
types of incoming traffic to node B through different ports. Portscans and SYN floods access any range of ports.
If the FEM is placed at the host level, for example at A, thearchitecture is simple. Each node is aware of its location whenprocessing network packets so the feature controller FC easilypreserves connection ordering. However, when placing FEM ata router, additional logic is needed to preserve connection or-dering. For example, when A and B communicate with eachother, the source IP/port and destination IP/port fields in a packetare not consistent with the particular node which started the con-nection.
This example illustrates how to apply FEM to monitor net-work activity usually associated with SYN flood and port scansfrom a router’s perspective. Each FEM consists of a number ofFSs. For each FS, the key is denoted K and the feature valueis denoted V. The source IP is designated SIP, destination IPDIP, source port SPORT, destination port DPORT, and protocolPROTO. The flags applicable for this case study are the SYNand ACK flags. We want to track the behavior associated withthese two attacks.
First, it is known that SYN flood traffic is directed at a (DIP,DPORT) combination. Port scans are more flexible and use anycombination of (DIP, DPORT). With an array of FSs, networkbehavior can be characterized for any given window of packetsin a network stream. To monitor the behaviors of port scans andSYN floods, we propose the setup in Fig. 5.
122 IEEE TRANSACTIONS ON INFORMATION FORENSICS AND SECURITY, VOL. 3, NO. 1, MARCH 2008
Four FSs are accessed and updated in parallel with a streamof packets. Each FS monitors a different network characteristic.Our architecture favors FPGA implementation since the fea-ture controller can be reprogrammed and easily placed back intothe network without any modification to the core architecture.Section V-B details the FPGA implementation and performanceof a FEM module with one FS. Since multiple FSs are accessedin parallel, the width of the FEM has a minor impact on perfor-mance.
aids in SYN flood detection by monitoring the numberof unserviced SYN requests for specific services. When a ma-chine services SYN requests, it responds with a packet havingthe SYN and ACK flags set. For an SYN packet, a count valueis incremented. For a SYN/ACK response, the count is decre-mented. By placing FS1 at an edge router, connection orderingrelative to the DIP is easily preserved by checking the flags in thepacket. All connections in FS1 are candidates for SYN floodsand we denote this set as SYNFLOODset.
monitors hosts with a large number of partially com-pleted SYN requests. This activity indicates vertical scans orSYN floods. Notice is a superset of . contains alltypes of traffic at a particular IP. By querying both FSs with ES-TIMATE, we can approximate the percentage of types of trafficat any DIP. Removing SYNFLOODset from leaves candi-dates for vertical scans, VSCANset.
observes the traffic from any SIP that causes incompleteSYN requests. This measure includes vertical, horizontal, andblock scans. To differentiate this activity, is implementedto oversee the amount of traffic between any two hosts.
For an , if there is a and FS3 re-turns a value greater than a threshold (predetermined by other in-trusion detection algorithms), we claim is vertically scan-ning . If not, may be horizontally or block scanningon the network. Using both and , we are able charac-terize additional network behavior.
The main difference between each FS is how the FC coor-dinates address each FS. As described, the flags SYN and ACKare used to intelligent configure each FEM. Nonetheless, our ar-chitecture is general enough to measure other network charac-teristics. Using SYN/FIN relationships for opening and closingnetwork connections, it is possible to keep an FS updated withtraffic flow sizes.
FEM can be employed at both the edge routers or on specifichosts. Our example contains extra logic for router implemen-tation (connection ordering). Host implementation would actu-ally be simpler because the perspective of network traffic is nar-rower.
IV. PRINCIPAL COMPONENT ANALYSIS
Once the features are extracted, the resulting values are fedinto an outlier detection scheme in order to capture the attacks.Our outlier detection architecture is based on PCA. PCA is suit-able for highly dimensional problems. It reduces the amountof dimensions required to classify new data. At its core, PCAproduces a set of principal components, which are orthonormaleigenvalue/eigenvector pairs. In other words, it projects a newset of axes which best suit the data. In our implementation, thesesets of axes represent the normal connection data. Outlier detec-
tion occurs by mapping live network data onto these “normal”axes and calculating the distance from the axes. If the distanceis greater than a certain threshold, then the connection is classi-fied as an attack. This section introduces PCA and begins withthe notion of calculating distance in a high dimensional space.
A. Distance Calculation
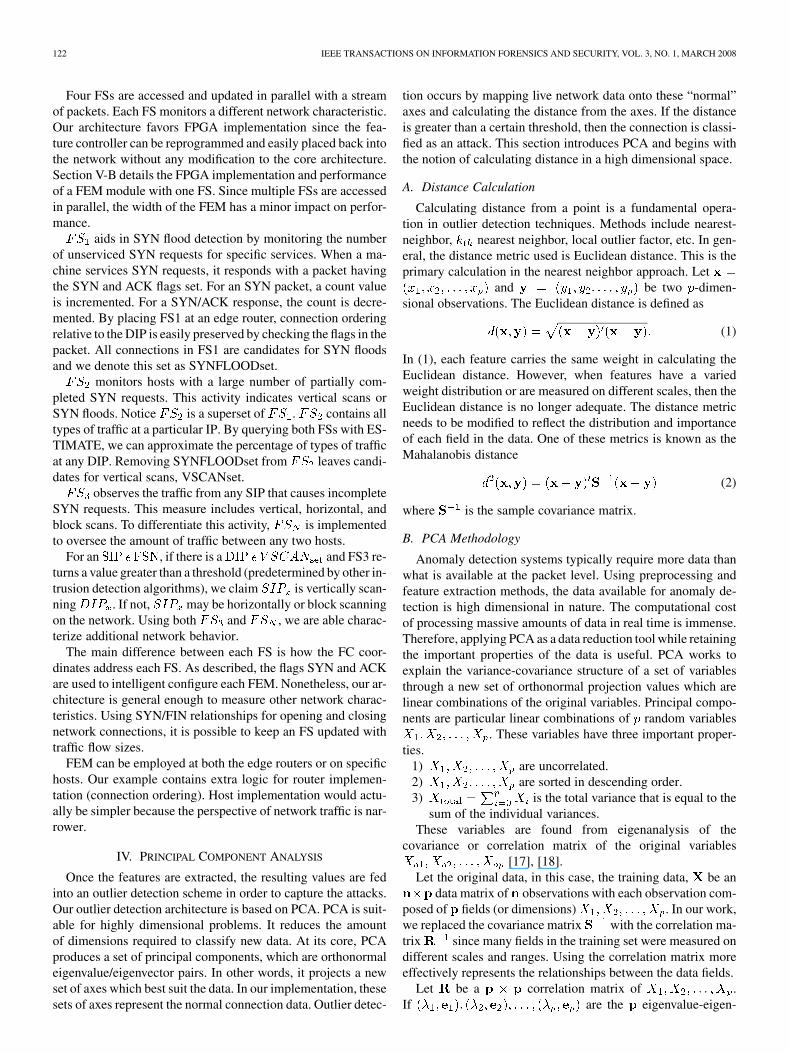
Calculating distance from a point is a fundamental opera-tion in outlier detection techniques. Methods include nearest-neighbor, nearest neighbor, local outlier factor, etc. In gen-eral, the distance metric used is Euclidean distance. This is theprimary calculation in the nearest neighbor approach. Let
and be two -dimen-sional observations. The Euclidean distance is defined as
(1)
In (1), each feature carries the same weight in calculating theEuclidean distance. However, when features have a variedweight distribution or are measured on different scales, then theEuclidean distance is no longer adequate. The distance metricneeds to be modified to reflect the distribution and importanceof each field in the data. One of these metrics is known as theMahalanobis distance
(2)
where is the sample covariance matrix.
B. PCA Methodology
Anomaly detection systems typically require more data thanwhat is available at the packet level. Using preprocessing andfeature extraction methods, the data available for anomaly de-tection is high dimensional in nature. The computational costof processing massive amounts of data in real time is immense.Therefore, applying PCA as a data reduction tool while retainingthe important properties of the data is useful. PCA works toexplain the variance-covariance structure of a set of variablesthrough a new set of orthonormal projection values which arelinear combinations of the original variables. Principal compo-nents are particular linear combinations of random variables
. These variables have three important proper-ties.
1) are uncorrelated.2) are sorted in descending order.3) is the total variance that is equal to the
sum of the individual variances.These variables are found from eigenanalysis of the
covariance or correlation matrix of the original variables[17], [18].
Let the original data, in this case, the training data, be andata matrix of observations with each observation com-
posed of fields (or dimensions) . In our work,we replaced the covariance matrix with the correlation ma-trix since many fields in the training set were measured ondifferent scales and ranges. Using the correlation matrix moreeffectively represents the relationships between the data fields.
Let be a correlation matrix of .If are the eigenvalue-eigen-
DAS et al.: FPGA-BASED NETWORK INTRUSION DETECTION ARCHITECTURE 123
vector pairs of the correlation matrix , then the th principalcomponent is
where;
is the th eigenvector;is the observed data along the vari-
ables ;is the sample mean vector of the
observation data.The th principal component has a sample variance and
the sample covariance/correlation of any pair of principal com-ponents is equal to zero. This satisfies that PCA produces a setof independent variables. Thus, the total variance of a sample isthe sum of all the variances accounted for by the principal com-ponents. The correlation between any two variables and iscalculated by
(3)
where is the standard deviation of over the sample data.The principal components from the sample correlation ma-
trix have the same properties as principal components from asample covariance matrix. As all principal components are un-correlated, the total variance in all of the principal componentsis
(4)
The principal components derived from the covariance matrixare usually different from the principal components generatedfrom the correlation matrix. When some values are much largerthan others, then their corresponding eigenvalues have largerweights. Since the KDD cup data has many items with varyingscales and ranges, the correlation matrix is utilized.
C. Applying PCA to Outlier Detection
This section outlines how PCA is applied as an outlier detec-tion method. In applying PCA, there are two main issues: howto interpret the set of principal components, and how to calcu-late the notion of distance.
First, each eigenvalue of a principal component correspondsto the relative amount of variation it encompasses. The larger theeigenvalue is, the more significant its corresponding projectedeigenvector should be. Therefore, the principal components aresorted from most to least significant. If a new data item is pro-jected along the upper set of the significant principal compo-nents, it is likely that the data item can be classified withoutprojecting along all of the principal components. In other fields,such as DSP and image compression and restoration, this is auseful property.
Second, eigenvectors of the principal components representaxes which best suit a data sample. If the data sample is thetraining set of normal network connections, then those axes areconsidered normal. Points which lie at a far distance from these
axes would exhibit abnormal behavior. Outliers measured usingthe Mahalanobis distance are presumably network connectionsthat are anomalous. Using a threshold value , any networkconnection with a distance greater than the threshold is consid-ered an outlier. In our work, an outlier is implied to be an attack.
Consider the sample principal components ofan observation where
The sum of squares of the partial principal component scoresis equal to the principal component score
(5)
equating to the Mahanobolis distance of the observation fromthe mean of the normal sample data set [17].
D. PCA Framework
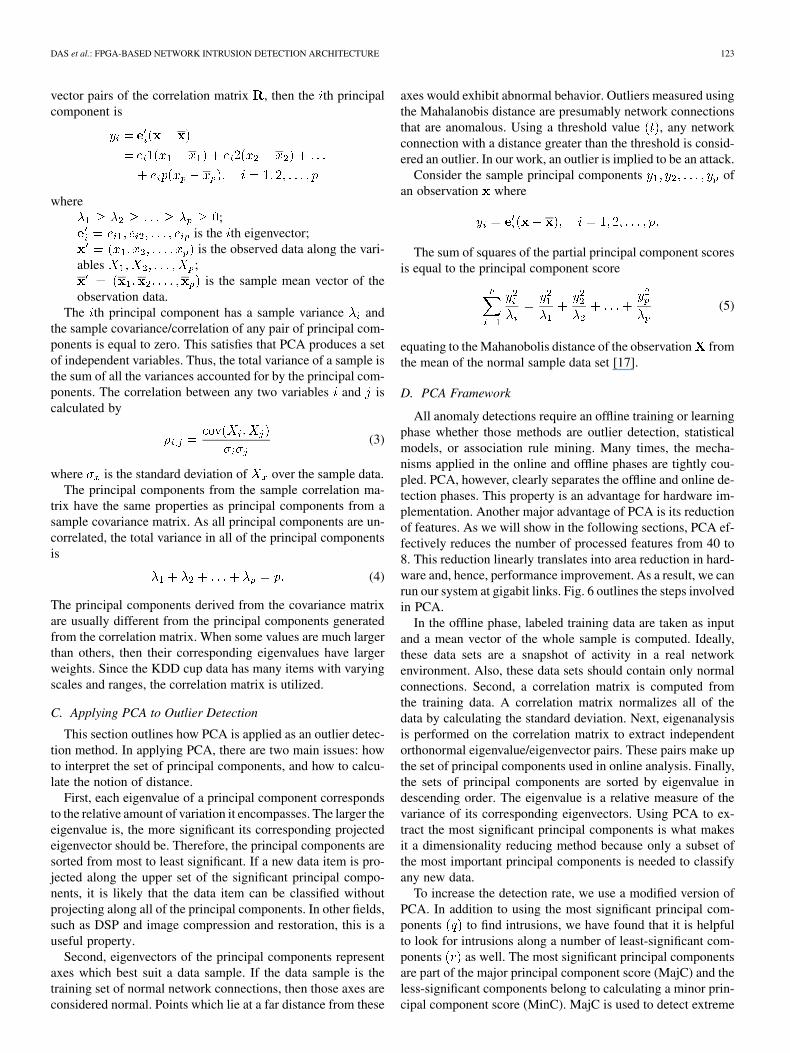
All anomaly detections require an offline training or learningphase whether those methods are outlier detection, statisticalmodels, or association rule mining. Many times, the mecha-nisms applied in the online and offline phases are tightly cou-pled. PCA, however, clearly separates the offline and online de-tection phases. This property is an advantage for hardware im-plementation. Another major advantage of PCA is its reductionof features. As we will show in the following sections, PCA ef-fectively reduces the number of processed features from 40 to8. This reduction linearly translates into area reduction in hard-ware and, hence, performance improvement. As a result, we canrun our system at gigabit links. Fig. 6 outlines the steps involvedin PCA.
In the offline phase, labeled training data are taken as inputand a mean vector of the whole sample is computed. Ideally,these data sets are a snapshot of activity in a real networkenvironment. Also, these data sets should contain only normalconnections. Second, a correlation matrix is computed fromthe training data. A correlation matrix normalizes all of thedata by calculating the standard deviation. Next, eigenanalysisis performed on the correlation matrix to extract independentorthonormal eigenvalue/eigenvector pairs. These pairs make upthe set of principal components used in online analysis. Finally,the sets of principal components are sorted by eigenvalue indescending order. The eigenvalue is a relative measure of thevariance of its corresponding eigenvectors. Using PCA to ex-tract the most significant principal components is what makesit a dimensionality reducing method because only a subset ofthe most important principal components is needed to classifyany new data.
To increase the detection rate, we use a modified version ofPCA. In addition to using the most significant principal com-ponents to find intrusions, we have found that it is helpfulto look for intrusions along a number of least-significant com-ponents as well. The most significant principal componentsare part of the major principal component score (MajC) and theless-significant components belong to calculating a minor prin-cipal component score (MinC). MajC is used to detect extreme
124 IEEE TRANSACTIONS ON INFORMATION FORENSICS AND SECURITY, VOL. 3, NO. 1, MARCH 2008
Fig. 6. PCA for network intrusion detection.
deviations with large values on the original features. These ob-servations follow the correlation structure of the sample data.However, some attacks may not follow the same correlationmodel. MinC is used to detect those attacks. As a result, twothresholds are needed to detect attacks. If the principal compo-nents are sorted in descending order, then is a subset of thehighest values and is a subset of the smallest components. TheMajC threshold is denoted while the MinC threshold is re-ferred to as . An observation is an attack if
or (6)
The online portion takes major principal componentsand minor principal components and maps online data intothe eigenspace of those principal components. There are twoparallel pipelines—one for calculating the major componentvariability score (MajC) and one for the minor (MinC). Thesimulations show that adding the MinC pipeline increasesthe detection ability and decreases the false alarm rate ofusing PCA for anomaly detection. For hardware design, themost computationally expensive portion of PCA is performingeigenvector calculations and sorting. The process of calculatingeigenvectors is sequential and difficult to parallelize. However,this task is part of the offline phase. We are primarily concernedwith accelerating online intrusion detection using PCA. For thissegment, the most important bottleneck is computing the PCscore. Fortunately, this task can be parallelized as we describein Section V-D.
E. NIDS Framework Implementation
The reprogrammability of FPGAs is an important advantagein our framework because our architecture tracks differenttypes of network characteristics and modifies itself accordingto the selected features. The design can be implemented in aparameterizable ASIC which will provide better performance;however, there is no need for this extra performance improve-ment. Moreover, it would be extremely costly to develop a fixedarchitecture that tracks the same type of network characteris-tics. Using RocketIO multigigabit transceivers (MGT) available
on new Virtex FPGA chips, it is possible to stream packetsstraight into the FPGA without suffering any slowdown. TheRocketIO transceivers can be used in conjunction with gigabitEthernet ports. As packets stream through the MGT in 1-,2-,or 4-B chunks, a state machine is used to extract the relatedheader fields from the packet. The logic in the state machine iscomprised of layer 2 (data-link layer) protocols and managingoffsets to extract certain data fields of variable length (8, 16, 48b).
The feature extraction modules hash tuples of values (e.g.,SIP,DIP, SPORT, DPORT), but the packet data are streamedthrough the FPGA in specified chunks. Therefore, an asyn-chronous interface between the MGT and the feature extractionmodules is required. These interfaces are highlighted on thesystem overview shown in Fig. 2. Once all of the requiredheader fields are ready, handshaking is commenced and thedata tuple is shipped off to the next state of processing.
In some rare cases, the number of cycles to determine whethera packet is malicious may exceed the time (in cycles) to processthe whole just before it is routed. In this situation, the packetmay get routed even before the intrusions are detected. However,this type of race condition will never occur in our architecturesince it takes more cycles to process a complete packet than ittakes to extract header fields (which are usually at the head of thepacket) and ship them to the feature extraction module, which isa stall-free pipelined design. After a data tuple is finished beingprocessed in the feature extraction module, it has the option ofbeing characterized by using PCA or having its data sent out ofthe FPGA in the form of UDP packets to be processed usingother software-based methods.
At the feature extraction/PCA boundary, there is no need foran asynchronous interface because the feature extraction mod-ules run in parallel and, hence, FEM and PCA modules can bedirectly tied to each other. Therefore, they all complete at thesame time and the results can be sent to the PCA in parallel as afeature vector. However, if the hash functions for different fea-ture extraction modules are not identical, then an asynchronousinterface is required.
Altogether, it is possible to implement this outlier detectionframework featuring PCA on an FPGA using RocketIO trans-ceivers. It is possible to also send data out the MGT as UDP
DAS et al.: FPGA-BASED NETWORK INTRUSION DETECTION ARCHITECTURE 125
Fig. 7. Effect of FS row length(K) on accuracy.
packets for additional software processing. The interfaces be-tween each level of processing allows for the insertion of moreadvanced feature extraction methods or other outlier detectionalgorithms.
V. RESULTS
This section is divided into two main subsections presentingthe FPGA implementation and simulation results of the FEMand PCA framework, respectively. First, we investigate theaccuracy of using feature sketches by testing different FS sizes.For implementing FEM, we arbitrarily chose six days of tracesfrom the 1999 DARPA Intrusion Detection Evaluation [24].Half of the traces contain labeled attacks and the other half donot. Nonetheless, FS should accurately represent the networkenvironment. Then, we examine the performance of our PCAarchitecture for outlier detection. We use the modified PCA forthree reasons: to increase the detection rate, to decrease thefalse alarm rate, and because it can be tailored to FPGA design.The following subsections discuss them in detail.
A. Simulations Results for FEM
In this section, we investigate the accuracy of using featuresketches by testing different FS sizes. There are no knownbenchmarks specifically compiled for feature extraction, so wearbitrarily choose six days of traces from the 1999 DARPAIntrusion Detection Evaluation [24].
We simulate an FS ( ,). Our test on the FS is more inten-
sive because more connections are simultaneously tracked. Byvirtue of design, FS is constantly updating; so we stream in 24 hof network activity and query the FS afterwards to compare theFS estimate with exact per-flow results.
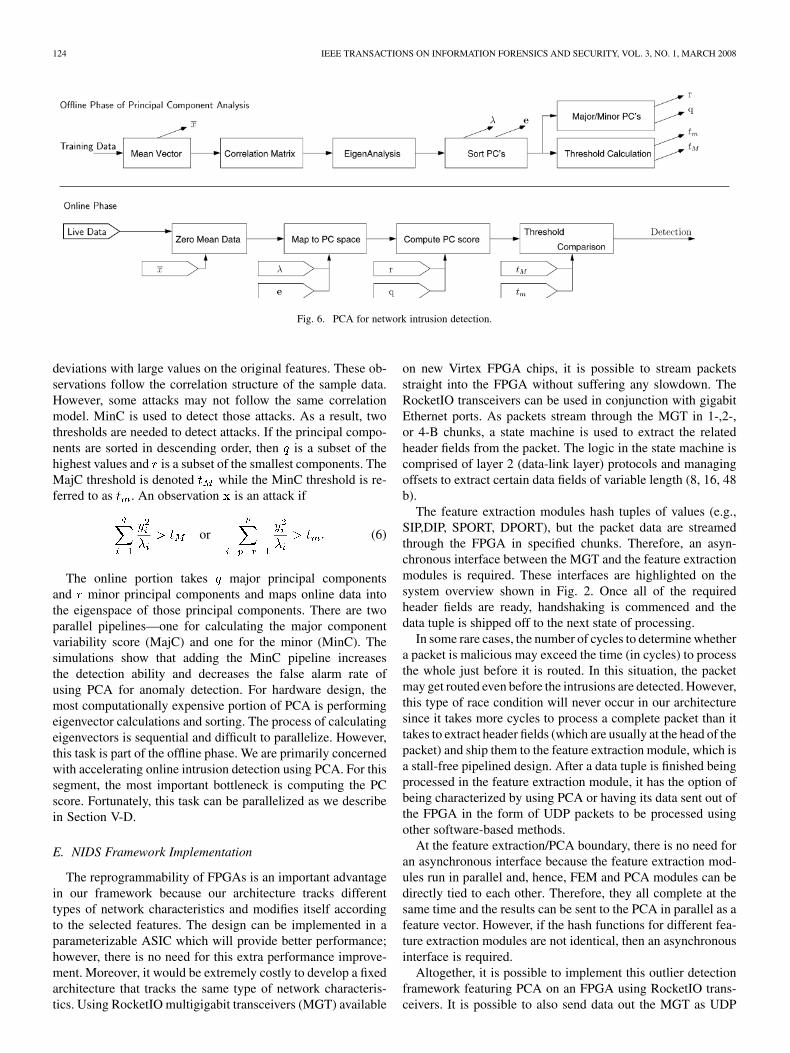
Fig. 7 presents the accuracy of using an FS. H represents thenumber of rows in the FS and K represents the size of eachrow. The accuracy is measured as the percentage of preciselyestimated flows (i.e., where the estimated value is equal to theactual value) out of all flows in the DARPA traces. The resultsof all six days are averaged together. For multiple hash functionresults , we use the Jenkins Hash with different seedvalues.
TABLE ICONSTANT TOTAL K = 16384 ENTRIES
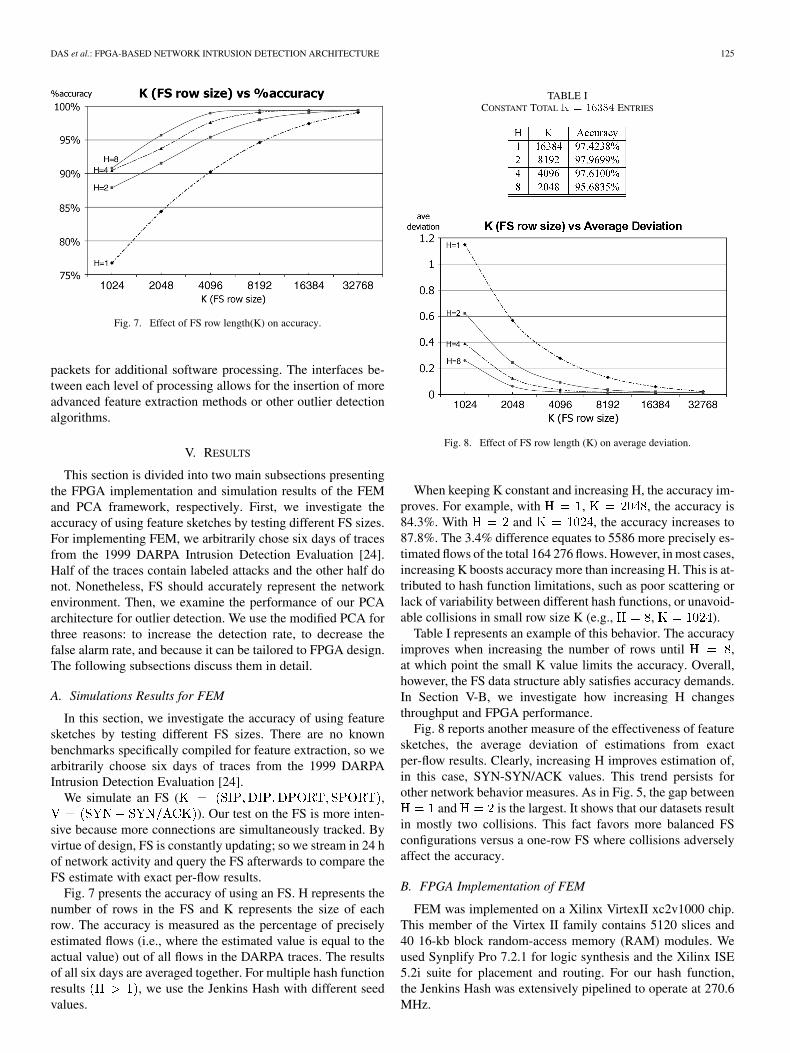
Fig. 8. Effect of FS row length (K) on average deviation.
When keeping K constant and increasing H, the accuracy im-proves. For example, with , , the accuracy is84.3%. With and , the accuracy increases to87.8%. The 3.4% difference equates to 5586 more precisely es-timated flows of the total 164 276 flows. However, in most cases,increasing K boosts accuracy more than increasing H. This is at-tributed to hash function limitations, such as poor scattering orlack of variability between different hash functions, or unavoid-able collisions in small row size K (e.g., , ).
Table I represents an example of this behavior. The accuracyimproves when increasing the number of rows until ,at which point the small K value limits the accuracy. Overall,however, the FS data structure ably satisfies accuracy demands.In Section V-B, we investigate how increasing H changesthroughput and FPGA performance.
Fig. 8 reports another measure of the effectiveness of featuresketches, the average deviation of estimations from exactper-flow results. Clearly, increasing H improves estimation of,in this case, SYN-SYN/ACK values. This trend persists forother network behavior measures. As in Fig. 5, the gap between
and is the largest. It shows that our datasets resultin mostly two collisions. This fact favors more balanced FSconfigurations versus a one-row FS where collisions adverselyaffect the accuracy.
B. FPGA Implementation of FEM
FEM was implemented on a Xilinx VirtexII xc2v1000 chip.This member of the Virtex II family contains 5120 slices and40 16-kb block random-access memory (RAM) modules. Weused Synplify Pro 7.2.1 for logic synthesis and the Xilinx ISE5.2i suite for placement and routing. For our hash function,the Jenkins Hash was extensively pipelined to operate at 270.6MHz.
126 IEEE TRANSACTIONS ON INFORMATION FORENSICS AND SECURITY, VOL. 3, NO. 1, MARCH 2008
TABLE IIFEATURE SKETCH PLACE AND ROUTE
Table II contains the performance and area metrics for FEMimplemented for edge routers. The performance results are sim-ilar for host-level implementation since the additional logic inthe feature controller (FC) is not on the critical path of the FEM.We test configurations for , 2, and 4. Throughput, clockfrequency, and slices are reported for three overall row sizes
, 16384, and 32768. The throughput value is cal-culated from the 5-tuple data {source IP, destination IP, sourceport, destination port, protocol} and the 6-b flag field is used toconfigure the FC.
It is clear that for a given memory size, increasing H increasesthroughput because it reduces the memory size and, hence, re-duces the access times. Similarly, for a constant H, reducing thetotal memory amount (K) also increases the throughput. Amongthe simulated configurations, the best throughput of 23.81 Gb/sis achieved for and . However, note that thisconfiguration has a relatively low accuracy of 94.1%. Hence,when one considers the “ ” product, thebest configuration is and , which can extractinformation at 21.25 Gb/s.
Note that the increase in the number of slices is mostly a resultof using multiple hash functions in parallel. Replicating the hashfunctions allows higher throughput and frequency at the expenseof area. If there are area constraints, however, one could use onehash function implementation for multiple FS rows, providingthe values to each of them at consecutive cycles. This wouldresult in decreased throughput but also a reduced area require-ment. Since the Jenkins Hash is pipelined, mapping a hash func-tion to multiple rows would not introduce extra-long delays.
In conclusion, the simulations show that feature sketches areeffective data structures for network behavior characterization.The simulation results demonstrate the gains in accuracy andestimation ability of feature sketches. FPGAs take advantage ofmultiple FS rows to satisfy gigabit throughput demands. Con-sequently, feature sketches, the main components of FEM, areattractive data structures for FPGAs to exploit parallelism.
C. Simulation Results for PCA
To measure the effectiveness of PCA, we use data sets fromthe KDD Cup 1999 repository [19], used for the Third Inter-national Knowledge Discovery and Data Mining Tools Com-petition. Both training and testing data sets are provided. Thetraining data sets contain records of network connections la-beled either as normal or attack. Each connection record is madeup of 41 different features related to the connection. The 41 fea-tures are divided into three categories: basic features of TCP
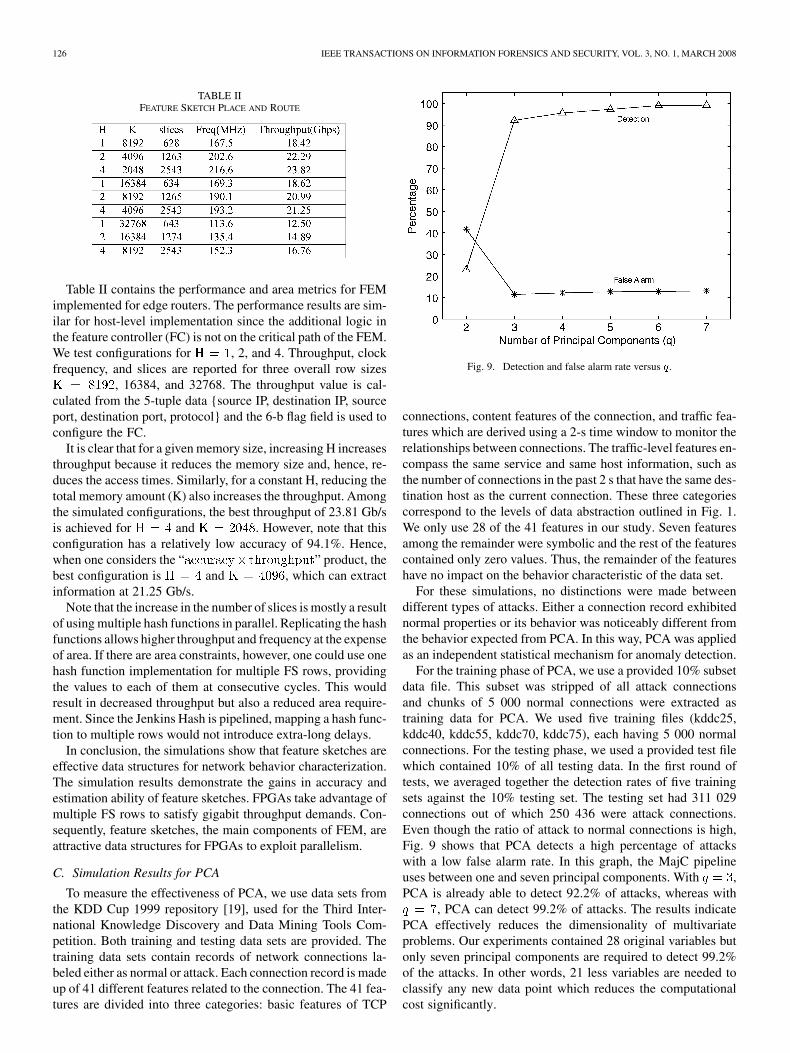
Fig. 9. Detection and false alarm rate versus q.
connections, content features of the connection, and traffic fea-tures which are derived using a 2-s time window to monitor therelationships between connections. The traffic-level features en-compass the same service and same host information, such asthe number of connections in the past 2 s that have the same des-tination host as the current connection. These three categoriescorrespond to the levels of data abstraction outlined in Fig. 1.We only use 28 of the 41 features in our study. Seven featuresamong the remainder were symbolic and the rest of the featurescontained only zero values. Thus, the remainder of the featureshave no impact on the behavior characteristic of the data set.
For these simulations, no distinctions were made betweendifferent types of attacks. Either a connection record exhibitednormal properties or its behavior was noticeably different fromthe behavior expected from PCA. In this way, PCA was appliedas an independent statistical mechanism for anomaly detection.
For the training phase of PCA, we use a provided 10% subsetdata file. This subset was stripped of all attack connectionsand chunks of 5 000 normal connections were extracted astraining data for PCA. We used five training files (kddc25,kddc40, kddc55, kddc70, kddc75), each having 5 000 normalconnections. For the testing phase, we used a provided test filewhich contained 10% of all testing data. In the first round oftests, we averaged together the detection rates of five trainingsets against the 10% testing set. The testing set had 311 029connections out of which 250 436 were attack connections.Even though the ratio of attack to normal connections is high,Fig. 9 shows that PCA detects a high percentage of attackswith a low false alarm rate. In this graph, the MajC pipelineuses between one and seven principal components. With ,PCA is already able to detect 92.2% of attacks, whereas with
, PCA can detect 99.2% of attacks. The results indicatePCA effectively reduces the dimensionality of multivariateproblems. Our experiments contained 28 original variables butonly seven principal components are required to detect 99.2%of the attacks. In other words, 21 less variables are needed toclassify any new data point which reduces the computationalcost significantly.
DAS et al.: FPGA-BASED NETWORK INTRUSION DETECTION ARCHITECTURE 127
TABLE IIIVARIATION (%) VERSUS Q
TABLE IVDETECTION AND FALSE ALARM RATES UTILIZING MinC AND MajC PIPELINES
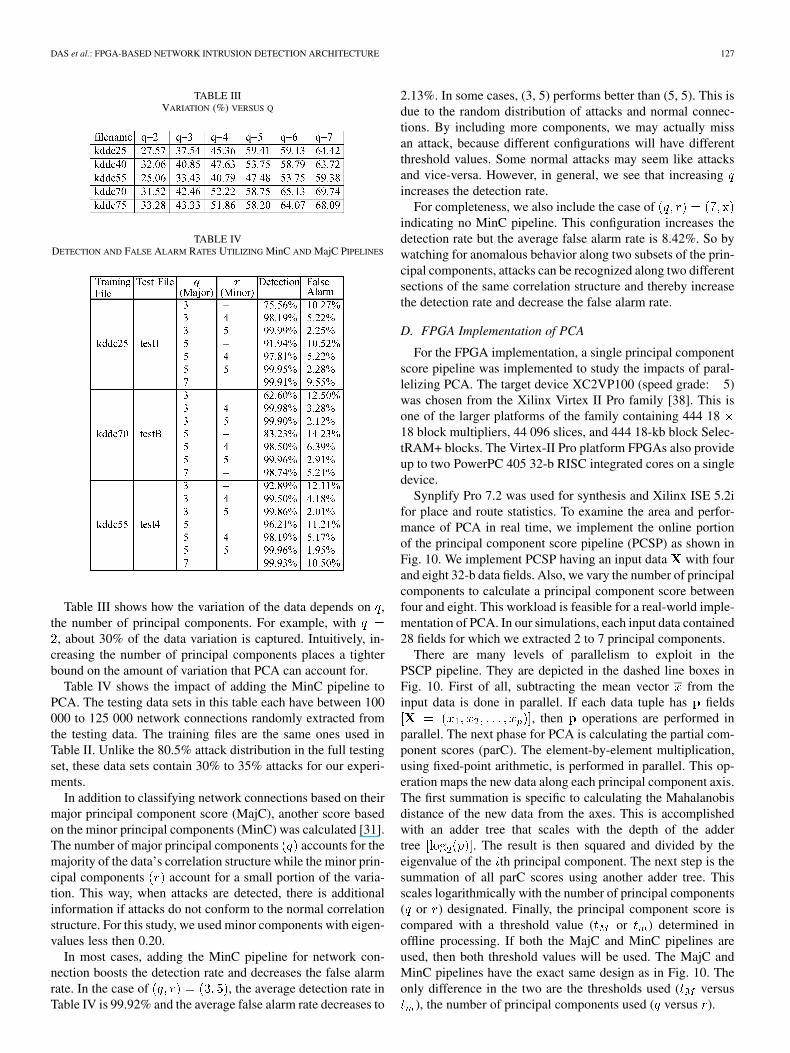
Table III shows how the variation of the data depends on ,the number of principal components. For example, with
, about 30% of the data variation is captured. Intuitively, in-creasing the number of principal components places a tighterbound on the amount of variation that PCA can account for.
Table IV shows the impact of adding the MinC pipeline toPCA. The testing data sets in this table each have between 100000 to 125 000 network connections randomly extracted fromthe testing data. The training files are the same ones used inTable II. Unlike the 80.5% attack distribution in the full testingset, these data sets contain 30% to 35% attacks for our experi-ments.
In addition to classifying network connections based on theirmajor principal component score (MajC), another score basedon the minor principal components (MinC) was calculated [31].The number of major principal components accounts for themajority of the data’s correlation structure while the minor prin-cipal components account for a small portion of the varia-tion. This way, when attacks are detected, there is additionalinformation if attacks do not conform to the normal correlationstructure. For this study, we used minor components with eigen-values less then 0.20.
In most cases, adding the MinC pipeline for network con-nection boosts the detection rate and decreases the false alarmrate. In the case of , the average detection rate inTable IV is 99.92% and the average false alarm rate decreases to
2.13%. In some cases, (3, 5) performs better than (5, 5). This isdue to the random distribution of attacks and normal connec-tions. By including more components, we may actually missan attack, because different configurations will have differentthreshold values. Some normal attacks may seem like attacksand vice-versa. However, in general, we see that increasingincreases the detection rate.
For completeness, we also include the case ofindicating no MinC pipeline. This configuration increases thedetection rate but the average false alarm rate is 8.42%. So bywatching for anomalous behavior along two subsets of the prin-cipal components, attacks can be recognized along two differentsections of the same correlation structure and thereby increasethe detection rate and decrease the false alarm rate.
D. FPGA Implementation of PCA
For the FPGA implementation, a single principal componentscore pipeline was implemented to study the impacts of paral-lelizing PCA. The target device XC2VP100 (speed grade: 5)was chosen from the Xilinx Virtex II Pro family [38]. This isone of the larger platforms of the family containing 444 1818 block multipliers, 44 096 slices, and 444 18-kb block Selec-tRAM+ blocks. The Virtex-II Pro platform FPGAs also provideup to two PowerPC 405 32-b RISC integrated cores on a singledevice.
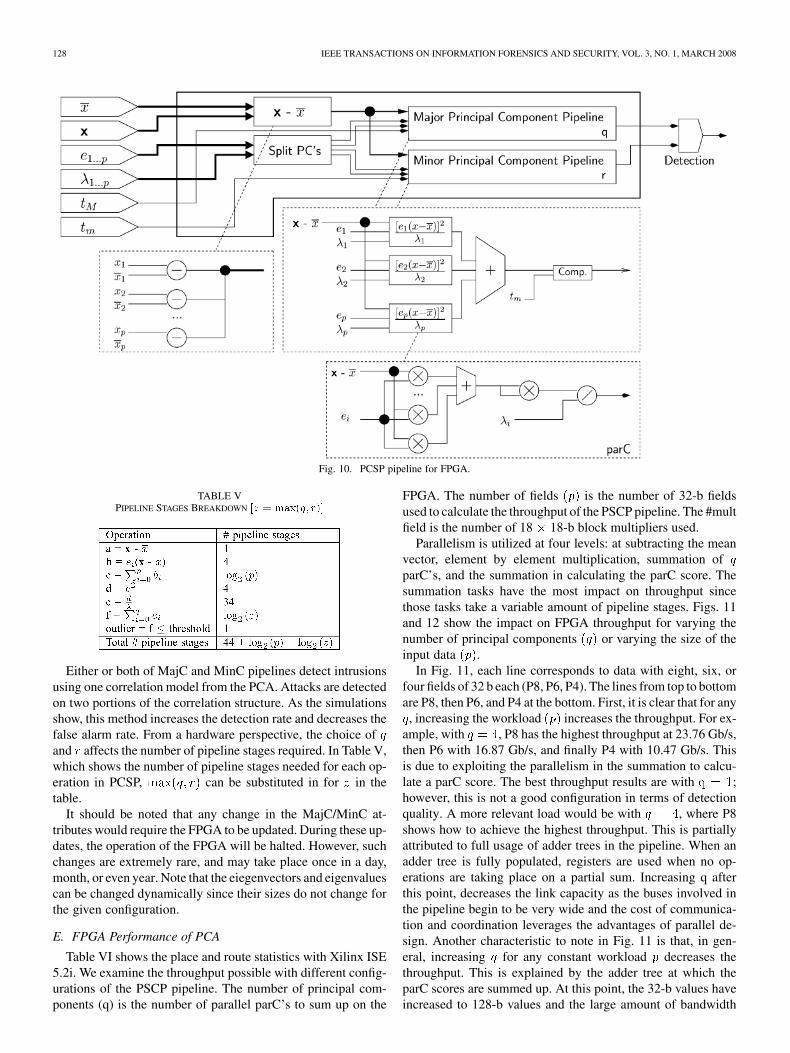
Synplify Pro 7.2 was used for synthesis and Xilinx ISE 5.2ifor place and route statistics. To examine the area and perfor-mance of PCA in real time, we implement the online portionof the principal component score pipeline (PCSP) as shown inFig. 10. We implement PCSP having an input data with fourand eight 32-b data fields. Also, we vary the number of principalcomponents to calculate a principal component score betweenfour and eight. This workload is feasible for a real-world imple-mentation of PCA. In our simulations, each input data contained28 fields for which we extracted 2 to 7 principal components.
There are many levels of parallelism to exploit in thePSCP pipeline. They are depicted in the dashed line boxes inFig. 10. First of all, subtracting the mean vector from theinput data is done in parallel. If each data tuple has fields
, then operations are performed inparallel. The next phase for PCA is calculating the partial com-ponent scores (parC). The element-by-element multiplication,using fixed-point arithmetic, is performed in parallel. This op-eration maps the new data along each principal component axis.The first summation is specific to calculating the Mahalanobisdistance of the new data from the axes. This is accomplishedwith an adder tree that scales with the depth of the addertree . The result is then squared and divided by theeigenvalue of the th principal component. The next step is thesummation of all parC scores using another adder tree. Thisscales logarithmically with the number of principal components( or ) designated. Finally, the principal component score iscompared with a threshold value ( or ) determined inoffline processing. If both the MajC and MinC pipelines areused, then both threshold values will be used. The MajC andMinC pipelines have the exact same design as in Fig. 10. Theonly difference in the two are the thresholds used ( versus
), the number of principal components used ( versus ).
128 IEEE TRANSACTIONS ON INFORMATION FORENSICS AND SECURITY, VOL. 3, NO. 1, MARCH 2008
Fig. 10. PCSP pipeline for FPGA.
TABLE VPIPELINE STAGES BREAKDOWN [z = max(q; r)]
Either or both of MajC and MinC pipelines detect intrusionsusing one correlation model from the PCA. Attacks are detectedon two portions of the correlation structure. As the simulationsshow, this method increases the detection rate and decreases thefalse alarm rate. From a hardware perspective, the choice ofand affects the number of pipeline stages required. In Table V,which shows the number of pipeline stages needed for each op-eration in PCSP, can be substituted in for in thetable.
It should be noted that any change in the MajC/MinC at-tributes would require the FPGA to be updated. During these up-dates, the operation of the FPGA will be halted. However, suchchanges are extremely rare, and may take place once in a day,month, or even year. Note that the eiegenvectors and eigenvaluescan be changed dynamically since their sizes do not change forthe given configuration.
E. FPGA Performance of PCA
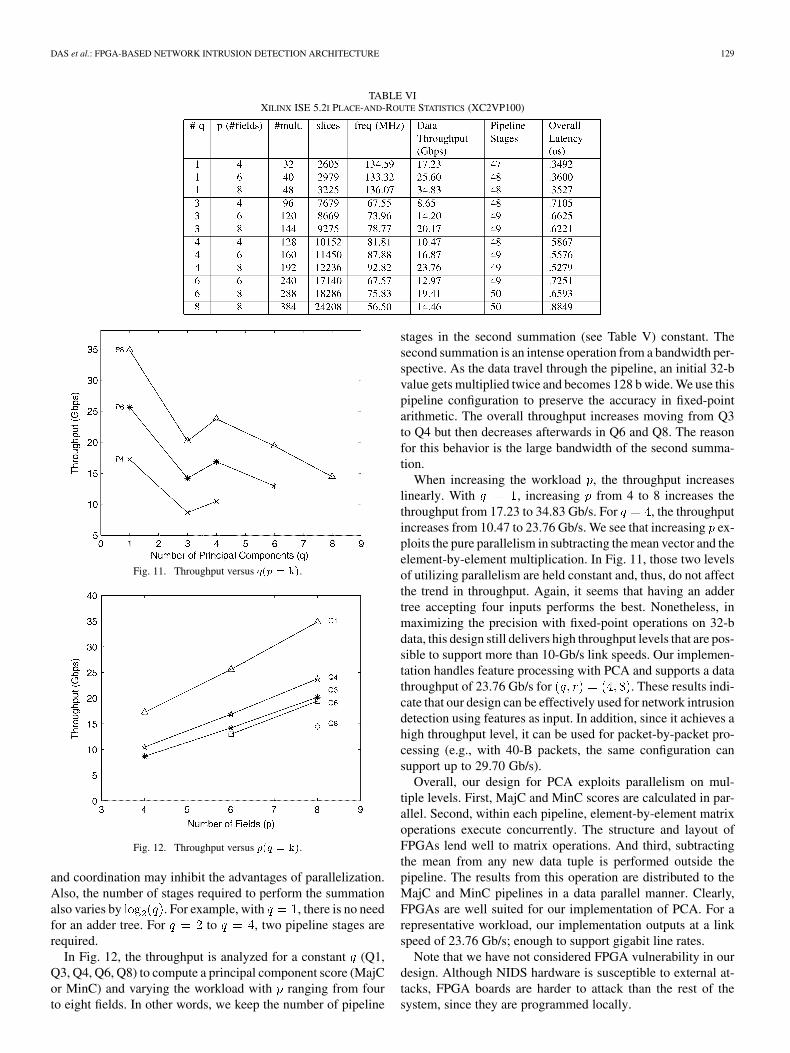
Table VI shows the place and route statistics with Xilinx ISE5.2i. We examine the throughput possible with different config-urations of the PSCP pipeline. The number of principal com-ponents (q) is the number of parallel parC’s to sum up on the
FPGA. The number of fields is the number of 32-b fieldsused to calculate the throughput of the PSCP pipeline. The #multfield is the number of 18 18-b block multipliers used.
Parallelism is utilized at four levels: at subtracting the meanvector, element by element multiplication, summation ofparC’s, and the summation in calculating the parC score. Thesummation tasks have the most impact on throughput sincethose tasks take a variable amount of pipeline stages. Figs. 11and 12 show the impact on FPGA throughput for varying thenumber of principal components or varying the size of theinput data .
In Fig. 11, each line corresponds to data with eight, six, orfour fields of 32 b each (P8, P6, P4). The lines from top to bottomare P8, then P6, and P4 at the bottom. First, it is clear that for any, increasing the workload increases the throughput. For ex-
ample, with , P8 has the highest throughput at 23.76 Gb/s,then P6 with 16.87 Gb/s, and finally P4 with 10.47 Gb/s. Thisis due to exploiting the parallelism in the summation to calcu-late a parC score. The best throughput results are with ;however, this is not a good configuration in terms of detectionquality. A more relevant load would be with , where P8shows how to achieve the highest throughput. This is partiallyattributed to full usage of adder trees in the pipeline. When anadder tree is fully populated, registers are used when no op-erations are taking place on a partial sum. Increasing q afterthis point, decreases the link capacity as the buses involved inthe pipeline begin to be very wide and the cost of communica-tion and coordination leverages the advantages of parallel de-sign. Another characteristic to note in Fig. 11 is that, in gen-eral, increasing for any constant workload decreases thethroughput. This is explained by the adder tree at which theparC scores are summed up. At this point, the 32-b values haveincreased to 128-b values and the large amount of bandwidth
DAS et al.: FPGA-BASED NETWORK INTRUSION DETECTION ARCHITECTURE 129
TABLE VIXILINX ISE 5.2I PLACE-AND-ROUTE STATISTICS (XC2VP100)
Fig. 11. Throughput versus q(p = k).
Fig. 12. Throughput versus p(q = k).
and coordination may inhibit the advantages of parallelization.Also, the number of stages required to perform the summationalso varies by . For example, with , there is no needfor an adder tree. For to , two pipeline stages arerequired.
In Fig. 12, the throughput is analyzed for a constant (Q1,Q3, Q4, Q6, Q8) to compute a principal component score (MajCor MinC) and varying the workload with ranging from fourto eight fields. In other words, we keep the number of pipeline
stages in the second summation (see Table V) constant. Thesecond summation is an intense operation from a bandwidth per-spective. As the data travel through the pipeline, an initial 32-bvalue gets multiplied twice and becomes 128 b wide. We use thispipeline configuration to preserve the accuracy in fixed-pointarithmetic. The overall throughput increases moving from Q3to Q4 but then decreases afterwards in Q6 and Q8. The reasonfor this behavior is the large bandwidth of the second summa-tion.
When increasing the workload , the throughput increaseslinearly. With , increasing from 4 to 8 increases thethroughput from 17.23 to 34.83 Gb/s. For , the throughputincreases from 10.47 to 23.76 Gb/s. We see that increasing ex-ploits the pure parallelism in subtracting the mean vector and theelement-by-element multiplication. In Fig. 11, those two levelsof utilizing parallelism are held constant and, thus, do not affectthe trend in throughput. Again, it seems that having an addertree accepting four inputs performs the best. Nonetheless, inmaximizing the precision with fixed-point operations on 32-bdata, this design still delivers high throughput levels that are pos-sible to support more than 10-Gb/s link speeds. Our implemen-tation handles feature processing with PCA and supports a datathroughput of 23.76 Gb/s for . These results indi-cate that our design can be effectively used for network intrusiondetection using features as input. In addition, since it achieves ahigh throughput level, it can be used for packet-by-packet pro-cessing (e.g., with 40-B packets, the same configuration cansupport up to 29.70 Gb/s).
Overall, our design for PCA exploits parallelism on mul-tiple levels. First, MajC and MinC scores are calculated in par-allel. Second, within each pipeline, element-by-element matrixoperations execute concurrently. The structure and layout ofFPGAs lend well to matrix operations. And third, subtractingthe mean from any new data tuple is performed outside thepipeline. The results from this operation are distributed to theMajC and MinC pipelines in a data parallel manner. Clearly,FPGAs are well suited for our implementation of PCA. For arepresentative workload, our implementation outputs at a linkspeed of 23.76 Gb/s; enough to support gigabit line rates.
Note that we have not considered FPGA vulnerability in ourdesign. Although NIDS hardware is susceptible to external at-tacks, FPGA boards are harder to attack than the rest of thesystem, since they are programmed locally.
130 IEEE TRANSACTIONS ON INFORMATION FORENSICS AND SECURITY, VOL. 3, NO. 1, MARCH 2008
VI. RELATED WORK
Previous works show that many networking applicationshave found their way into hardware implementations [39].For example, FPGAs have been used in developing plat-forms for the experimentation of active networks [12] forservices, such as detection of denial-of-service (DoS) attacks,real-time load balancing for e-commerce servers, real-timenetwork-based speed recognition servers for v-commerce, etc.Also, high-speed front-end filters and security-managementapplications for ATM firewalls have found their way ontoFPGAs to reduce performance penalties at the IP level [23].Also, the TCP/IP splitter [29] has been implemented as part ofthe field-programmable port extender (FPX ) project to performflow classification, checksums, and packet routing, but thisimplementation is limited to 3-Gb/s monitoring. Prior researchhas been conducted in this area to develop a flow-size monitorsimilar to FEM [21]. However, the design was not capableof being updated when connections were completed. Thislimitation prevented achieving an accurate representation of thenetwork. Nguyen et al. have proposed a hardware architecturefor FPGAs that is effective in capturing network characteristicsand can handle gigabit throughput [28]. Other studies [14] agreethat per-flow methods will not suffice and propose intelligentalgorithms and multistage filters using multistage hash tables toincrease accuracy over Cisco’s NetFlow (which uses samplingto characterize network traffic).
In anomaly detection, two prominent methods are used. Thefirst type is based on a set of rules or specifications of what isregarded to as normal behavior while the second type learns thebehavior of a system under normal operation. The first relieson manual intervention and is essentially a short extension ofsignature detection-based IDSs. Rule-based intrusion detectionsystems, such as Bro [8] or Snort [33], use known rules to iden-tify known attacks, such as requests for nonexistent services orvirus attack signatures or malicious strings in packet payloads.Anomaly detection systems, such as ALAD [22], SPADE [35],and NIDES [3] compute statistical models for normal networktraffic and generate alarms when there are large differences fromthe normal model. These methods apply statistical tests to de-termine whether the observed activities greatly deviate from thenormal profile. These statistical-based schemes assume somesort of multivariate distribution of data points. The Canberratechnique is another multivariate statistical metric for anomalydetection. This method does not suffer from assumptions aboutdata distribution [13]. Yet this technique does not perform wellunless network attacks occur in bunches. In the case of port scanmalicious activity, which occurs over a long period of time, theCanberra technique may not be as effective as it would be forSYN flood and DoS attacks.
Many reconfigurable architectures have been implementedfor intrusion detection. Baker and Prasanna were able to imple-ment a version of the Apriori [2] algorithm using systolic arrays[6] and also look into efficient pattern matching [5] as a sig-nature-based method. Sidhu and Prasanna also implemented apattern matching architecture for FPGAs [32]. Attig and Lock-wood proposed a framework for rule processing on FPGAs [4].Many packet processing architectures for FPGA have been im-plemented. The scope of these applications ranges from string
matching, payload processing, packet classification, and TCPflow processing [11], [30], [34].
The Karhunen–Lo’eve Transform, which uses the concepts ofPCA, has been mapped to FPGAs in the past [15] for use withmultispectral imagery suitable for remote-sensing applications.However, this application does not decouple the eigenanalysisstep from the main PCSP pipeline which we accelerate for net-work intrusion detection. Former works show that PCA has beenused as an outlier detection method in NIDSs [27].
Other systems employ outlier detection methods, suchas local outlier factor (LOF) [7], which is a density-basedapproach, or th nearest neighbor by calculating distances be-tween connections. Aggarwal and Yu [1] studied the behaviorof projections from a data set to find outliers. Lazarevic, et al.performed a survey on multiple outlier detection schemes, in-cluding nearest neighbor and LOF on the 1998 DARPA data set[9] and showed that LOF performs favorably as a density-basedapproach [21]. The 1998 DARPA data set is composed oftcpdump traces over four weeks of simulated network activityincluding network attacks. Each connection record in the 1998DARPA data set is comprised of many variables extracted usingtcpdump [36] and tcptrace [37] utilities.
Shyu, et al. [31] uses PCA on the KDD CUP 1999 data set[19]. We use a similar PCA methodology as Shyu and, in ourtests, we verify that PCA is an effective outlier detection methodfor network intrusion detection. PCA compares favorably toLOF, nearest-neighbor, and the Canberra metrics and achieveshigh detection rates with low false alarm rates. For any falsealarm rates, PCA is still detects up to 99% of attacks. However,these studies did not consider hardware implementations of thealgorithms or their applicability to hardware implementation.
VII. CONCLUSION
Future generation network intrusion detection systems willmost likely employ both signature detection and anomaly de-tection modules. Anomaly detection methods process a largeamount of data in order to recognize anomalous behavior or newattacks which signature detection cannot. The previous workmostly concentrated on accelerating signature detection tech-niques. However, hardware implementations of anomaly detec-tion methods have not been proposed. Some reasons include thecomplexity and high computational cost associated with thesealgorithms. In any case, current software methods fail to keepup the high-link speeds. Signature detection can be performedlive, but live anomaly detection requires a comprehensive pic-ture of the network environment. Our feature extraction moduleprovides this functionality using feature sketches, which mapwell onto reconfigurable hardware. Many network behavior pa-rameters can be monitored using our architecture by makingsmall modifications to the design. These characteristics includeflow size, number of open connections, number of unservicedconnection requests, etc. For the intrusion detection part, wehave used PCA as an effective way of outlier analysis. PCA isparticularly useful because of its ability to reduce data dimen-sionality into a smaller set of independent variables from whichnew data can be classified. We used a modified version of PCA
DAS et al.: FPGA-BASED NETWORK INTRUSION DETECTION ARCHITECTURE 131
to scan for strange behavior on two regions of a single corre-lation structure. As a result, PCA can detect up to 99% of at-tacks and only suffer a 1.95% false alarm rate for the KDD Cup1999 data sets. A general hardware architecture was proposedfor FEM and the online portion of PCA and implemented onthe Xilinx Virtex-II family of FPGAs. In order to increase thethroughput of the whole system, pipelining and inherent paral-lelism FPGAs were used extensively. Parallelism was exploitedfor many element-by-element matrix operations and summa-tions were achieved through adder trees. For a constant numberof principal components , increasing the data input sizealso increased the throughput of the system. Our architecture forFEM shows a high percentage (97.61%) accuracy with a verylow estimation error (0.0365 packets), thus making the overallthroughput as high as 21.25 Gb/s for a 16-K entry FEM. ThePCA part of our design clocks at 92.82 MHz on a Virtex-II Proand achieves 23.76-Gb/s data throughput and would be able tosupport 29.07 Gb/s for 40-B packets.
ACKNOWLEDGMENT
The authors would like to thank Prof. S. Ögrenci Memik forher helpful comments and suggestions pertaining to this work.
REFERENCES
[1] C. C. Aggarwal and P. S. Yu, “Outlier detection for high dimensionaldata,” presented at the ACM SIGMOD Conf., Santa Barbara, CA, May2001.
[2] R. Agrawal, T. Imielinski, and A. Swami, “Mining association rulesbetween sets of items in large databases,” in Proc. ACM SIGMOD Int.Conf. Management Databases, 1993, pp. 207–216.
[3] D. Anderson, T. Lunt, H. Javits, A. Tamaru, and A. Valdes, “Detectingunusual program behavior using the statistical components of NIDES,”May 1995.
[4] M. E. Attig and J. Lockwood, “A framework for rule processing inreconfigurable network systems,” presented at the IEEE Symp. Field-Programmable Custom Computing Machines, Napa, CA, Apr. 2005.
[5] Z. K. Baker and V. K. Prasanna, “Time and area efficient patternmatching on FPGAs,” presented at the ACM Int. Symp. Field-Pro-grammable Gate Arrays (FPGA), Monterey, CA, 2004.
[6] Z. K. Baker and V. K. Prasanna, “Efficient hardware data mining withthe apriori algorithm on FPGAs,” presented at the IEEE Symp. FieldProgrammable Custom Computing Machines, Napa, CA, 2005.
[7] M. M. Breunig, H.-P. Kriegel, R. T. Ng, and J. Sander, “LOF: Iden-tifying density-based local outliers,” presented at the ACM SIGMODConf., Dallas, TX, May 2000.
[8] Bro, Bro Intrusion Detection System 2002.[9] DARPA Intrusion Detection Evaluation. [Online]. Available:
http://www.ll.mit.edu/IST/ideval. 1998[10] S. Dharmapurikar, M. Attig, and J. W. Lockwood, “Design and imple-
mentation of a string matching system for network intrusion detectionusing FPGA-based bloom filters” 2004.
[11] S. Dharmapurikar, P. Krishnamurthy, T. Sproull, and J. W. Lockwood,“Deep packet inspection using parallel bloom filters,” presented at theSymp. High Performance Interconnects, Stanford, CA, Aug. 2003.
[12] A. Dollas, D. Pnevmatikatos, N. Asianides, S. Kawadias, E. Sotiri-ades, S. Zogopoulos, and K. Papademetriou, “Architecture and applica-tions of PLATO, a reconfigurable active network platform,” presentedat the IEEE Symp. Field-Programmable Custom Computing Machines,Rohnert Park, CA, 2001.
[13] S. M. Emran and N. Ye, “Robustness of Canberra metric in computerintrusion detection,” presented at the IEEE Workshop on InformationAssurance and Security, West Point, NY, 2001, U.S. Military Academy.
[14] C. Estan and G. Varghese, “New directions in traffic measurement andaccounting,” presented at the ACM SIGCOMM Conf. Applications,Technologies, Architectures, Protocols for Computer Communication,Pittsburgh, PA, 2002.
[15] M. Fleury, B. Self, and A. C. Downton, “A fine-grained parallelpipelined Karhunen-Loeve transform,” presented at the Int. Paralleland Distributed Processing Symp., Nice, France, Apr. 2003.
[16] B. Jenkins, Jenkins, Hash Functions and Block Ciphers.[17] J. D. Jobson, Applied Multivariate Data Analysis, Volume II: Categor-
ical and Multivariate Methods. New York: Springer-Verlag, 1992.[18] I. T. Jolliffe, Principal Component Analysis. New York: Springer-
Verlag, 2002.[19] KDD Cup 1999 data. [Online]. Available: http://www.kdd.ics.uci.edu/
databases/kddcup99/kddcup-99.html. Aug. 1999[20] B. Krishnamurthy, S. Sen, Y. Zhang, and Y. Chen, “Sketch based
change detection: Methods, evaluation, and applications,” presented atthe ACM SIGCOMM Internet Measurement Conf., Miami, FL, 2003.
[21] A. Lazarevic, L. Ertoz, V. Kumar, A. Ozgur, and J. Srivastava, “A com-parative study of anomaly detection schemes in network intrusion de-tection,” presented at the SIAM Conf. Data Mining, Minneapolis, MN,May 2003.
[22] M. V. Mahoney and P. K. Chan, “Learning nonstationary models ofnormal network traffic for detecting novel attacks,” presented at theACM SIGKDD Int. Conf. Knowledge Discovery and Data Mining, AB,Canada, Jul. 2002.
[23] J. McHenry, P. W. Dowd, F. A. Pellegrino, T. M. Carrozzi, and W. B.Cocks, “An FPGA-based coprocessor for ATM firewalls,” presented atthe IEEE Symp. FCCM, Napa, CA, Apr. 1997.
[24] MIT Lincoln Laboratory, DARPA Intrusion Detection Evaluation.[25] S. Muthukrishnan, Data streams: Algorithms and applications 2003.[26] NetFilter/IPtables: Firewalling, NAT and Packet Mangling for Linux
2.4.[27] D. Nguyen, A. Das, G. Memik, and A. Choudhary, “A reconfigurable
architecture for network intrusion detection using principal componentanalysis,” presented at the IEEE Symp. Field-Programmable CustomComputing Machines, Napa, CA, Apr. 2006.
[28] D. Nguyen, G. Memik, S. Memik, and A. Choudhary, “Real-time fea-ture extraction for high speed networks,” presented at the Int. Conf.Field Programmable Logic and Applications, Monterey, CA, 2005.
[29] D. V. Schuehler and J. W. Lockwood, “TCP splitter: A TCP/IP flowmonitor in reconfigurable hardware,” presented at the Hot Intercon-nects 10 (HotI-10), Stanford, CA, 2002.
[30] D. V. Schuehler, J. Moscola, and J. W. Lockwood, “Architecture fora hardware-based, TCP/IP content-processing system,” IEEE Micro.,vol. 24, no. 1, pp. 62–69, Jan./Feb. 2004.
[31] M. Shyu, S. Chen, K. Sarinnapakorn, and L. Chang, “A novel anomalydetection scheme based on principal component classifier,” in Proc.IEEE Foundations New Directions of Data Mining Work., in Conjunc-tion With 3rd IEEE Int. Conf. Data Mining, 2003, pp. 172–179.
[32] R. Sidhu and V. Prasanna, “Fast regular expression matching usingFPGAs,” presented at the IEEE Symp. Field-Programmable CustomComputing Machines, Rohnert Park, CA, Apr. 2001.
[33] SNORT, SNORT: The open source network intrusion detection system2002.
[34] H. Song and J. W. Lockwood, “Efficient packet classification for net-work intrusion detection using FPGA,” presented at the Int. Symp.Field-Programmable Gate Arrays, Monterey, CA, Feb. 2005.
[35] SPADE, Stealthy Portscan Intrusion Correlation Engine 2002.[36] Tcpdump Utility. [Online]. Available: http://www.tcpdump.org.[37] Tcptrace Utility. [Online]. Available: http://www.jarok.cs.ohiou.edu/
software/tcptrace/index.html.[38] Xilinx Virtex-IIPro-Datasheet [Online]. Available: http://www.direct.
xilinx.com/bvdocs/publications/ds083.pdf.[39] V. Yegneswaran, P. Barford, and J. Ullrich, “Internet intrusions: Global
characteristics and prevalence,” presented at the ACM SIGMETRICS,San Diego, CA, 2003.
Abhishek Das (S’06) received the B.Tech. (Hons.)degree in computer science and engineering from theIndian Institute of Technology, Kharagpur, India, in2005 and is currently pursuing the Ph.D. degree inelectrical engineering and computer science at North-western University, Evanston, IL.
Currently, he is a Graduate Research Assistant inthe Center for Ultra Scale Computing and Informa-tion Security at Northwestern University. In 2007,he was with the Digital Enterprise Group (DEG) atIntel Corporation, Hillsboro, OR, where he worked
on platform security of Intel’s business platforms. His research interests includepower-aware and reliable computer architecture, reconfigurable computing, andhardware–software co-design.
132 IEEE TRANSACTIONS ON INFORMATION FORENSICS AND SECURITY, VOL. 3, NO. 1, MARCH 2008
David Nguyen received the B.S. degree in com-puter engineering from Northwestern University,Evanston, IL, in 2002 and the M.S. degree in com-puter engineering from Northwestern University in2005.
Currently, he is with SanDisk Corp. Milpitas, CA,a consumer electronics storage solutions companyspecializing in NAND flash-storage technology,focusing on modeling and evaluating new systemcontroller features as well as NAND memoryfeatures. Previously, he was with Sandia National
Laboratories, working in the network security group designing FPGA-basednetwork security solutions in 2005. His research interests are in applica-tion-specific architectures with an emphasis on embedding security and drivingperformance and reliability in NAND flash storage. He is the author of variousconference publications in reconfigurable network security.
Mr. Nguyen was the recipient of the Walter P. Murphy Fellowship in 2002.
Joseph Zambreno (M’02) received the B.S. degree(Hons.) in computer engineering in 2001, the M.S.degree in electrical and computer engineering in2002, and the Ph.D. degree in electrical and com-puter engineering from Northwestern University,Evanston, IL, in 2006.
Currently, he is an Assistant Professor in the De-partment of Electrical and Computer Engineering atIowa State University, Ames, where he has been since2006. His research interests include computer archi-tecture, compilers, embedded systems, and hardware/
software co-design, with a focus on run-time reconfigurable architectures andcompiler techniques for software protection.
Dr. Zambreno was a recipient of a National Science Foundation GraduateResearch Fellowship, a Northwestern University Graduate School Fellowship,a Walter P. Murphy Fellowship, and the Electrical Engineering and ComputerScience Department Best Dissertation Award for his Ph.D. dissertation “Com-piler and Architectural Approaches to Software Protection and Security.”
Gokhan Memik (M’03) received the B.S. degree incomputer engineering from Bogazici University, Is-tanbul, Turkey, in 1998 and the Ph.D. degree in elec-trical engineering from the University of Californiaat Los Angeles (UCLA) in 2003.
Currently, he is the Wissner-Slivka Junior Chairin the Electrical Engineering and Computer ScienceDepartment of Northwestern University. He was withBimtek, a startup company that provided Internet so-lutions, from 1997 to 2000, and BlueFront Defenses,a startup company that designs hardware-based
network security solutions, from 2000 to 2002. His research interests are incomputer architecture with an emphasis on networking hardware design andphysical-aware microarchitectures. He is the author of two book chapters andmore than 70 journal and refereed conference publications in these areas. He isalso the co-author of NetBench and MineBench, two widely used benchmarkingsuites for networking and data-mining applications, respectively.
Dr. Memik has been in the program committees of 20 workshops and con-ferences, was the Co-Chair for the Advanced Networking and CommunicationsHardware Workshop (ANCHOR) held in conjunction with ISCA between 2004and 2006, and is the Program Co-Chair for the 2007 International Symposiumon Microarchitecture (MICRO). He was the recipient of the Department of En-ergy CAREER Award in 2005, Searle Teaching Excellence Fellowship in 2004,Henry Samueli Excellence in Teaching Award in 2002, and the Henry SamueliFellowship in 2001.
Alok Choudhary (F’05) received the B.E. (Hons.)degree from the Birla Institute of Technology andScience, Pilani, India, in 1982, the M.S. degreefrom the University of Massachusetts, Amherst, in1986, and the Ph.D. degree in electrical and com-puter engineering from the University of Illinois,Urbana-Champaign, in 1989.
From 1989 to 1996, he was on the faculty of theElectrical and Computer Engineering Departmentat Syracuse University, Syracuse, NY. Currently,he has is a Professor of Electrical and Computer
Engineering at Northwestern University, Evanston, IL, where he also holdsan adjunct appointment with the Kellogg School of Management in theMarketing and Technology Innovation Departments, Northwestern University.His research interests are in high-performance computing and communicationsystems, power-aware systems, information processing, and the design andevaluation of architectures and software systems.
Prof. Choudhary’s career has been highlighted by many honors and awards,including the National Science Foundation Presidential Young InvestigatorAward, an IEEE Engineering Foundation award, an IBM Faculty Developmentaward, and an Intel Research Council Award.