mining boom, structural changes and the dynamics of labour ...
24
ww.tjprc.org [email protected] MINING BOOM, STRUCTURAL CHANGES AND THE DYNAMICS OF LABOUR MARKET TRANSITIONS IN BELLARY REGION OF KARNATAKA BASANTH KOMMADATH 1 & BINAYAK RATH 2 1 Research Scholar, IIT Kanpur, Uttar Pradesh, India 2 Former Professor of Economics, IIT Kanpur, Uttar Pradesh, India 2 Visiting Professor, NISER, Bhubaneswar, Odisha, India ABSTRACT The neo-liberal economic policy of structural changes not only improve economic development, but are expected to raise many other development indicators that are necessary for sustaining economic growth. One of the most common consequences of structural change that have been observed historically around the world is a shift in share of GDP from agriculture to industry and then to services. Simultaneously, there will be shifts in the labour market behaviour which needs to be investigated in the context of structural change in India. It has been further observed that within the primary sector, the mining and quarrying activities, which are generally labour intensive, has undergone a significant change owing to the mining boom during the first decade of the millennium. However, natural resource booms create complicated problems in macroeconomic management that are challenging even in economies with good governance and capable institutions, and much more so in economies like India. Such structural changes are expected to include changes in the real wage, labour mobility, shrinking manufacturing sector compared to the natural resource sector and a rise in the service sector. In this paper an attempt is made to fill this gap by conducting a study of the recent mining boom, associated structural changes and the dynamics of the labour market transitions occurred in India in general and Bellary region of Karnataka state in particular. The impacts of recent mining boom in the labour market of the country with a focus on one of the hot spots in mining, viz. Bellary region in Karnataka have been examined with the help of field investigation. The co-integration between the key sectors of the economy have been analysed with the help of different statistical tools to measure the contribution of each sector to the growth and employment and then to understand the impact this structural changes on the households. Finally we have tried to identify the drivers of structural change over the years and to predict the future drivers for the purpose of policy making. Our results have established that the economy of India and Bellary region have experienced a sectoral shift in share of GDP from agriculture to industry and then to services due to the recent mining boom. However in Bellary the services and mining industries gained relatively more importance compared to the other sectors. The study of the labour market of Bellary shows dynamic growth in employment in mines, as well as in ancillary activities like construction, hotels and restaurants, trade, transport etc. It has been observed that the increased export of iron ore due to the mining boom has strengthened the primary sector of Bellary, the iron ore sector popped during the boom has strengthened the secondary 1 Research Scholar, IIT Kanpur, 2 Former Professor of Economics, IIT Kanpur and at present Visiting Professor, NISER, Bhubaneswar ** The paper presented in the 53rd Annual Conference of The Indian Society of Labour Economics, held at M.S. University, Udaipur, Rajastan, December 17-19.2012 International Journal of Economics, Commerce and Research (IJECR) ISSN(P): 2250-0006; ISSN(E): 2319-4472 Vol. 5, Issue 2, Apr 2015, 1-24 © TJPRC Pvt. Ltd
-
Upload
khangminh22 -
Category
Documents
-
view
0 -
download
0
Transcript of mining boom, structural changes and the dynamics of labour ...
ww.tjprc.org [email protected]
MINING BOOM, STRUCTURAL CHANGES AND THE DYNAMICS OF LABOUR
MARKET TRANSITIONS IN BELLARY REGION OF KARNATAKA
BASANTH KOMMADATH 1 & BINAYAK RATH 2 1Research Scholar, IIT Kanpur, Uttar Pradesh, India
2Former Professor of Economics, IIT Kanpur, Uttar Pradesh, India 2Visiting Professor, NISER, Bhubaneswar, Odisha, India
ABSTRACT
The neo-liberal economic policy of structural changes not only improve economic development, but are expected
to raise many other development indicators that are necessary for sustaining economic growth. One of the most common
consequences of structural change that have been observed historically around the world is a shift in share of GDP from
agriculture to industry and then to services. Simultaneously, there will be shifts in the labour market behaviour which
needs to be investigated in the context of structural change in India. It has been further observed that within the primary
sector, the mining and quarrying activities, which are generally labour intensive, has undergone a significant change owing
to the mining boom during the first decade of the millennium. However, natural resource booms create complicated
problems in macroeconomic management that are challenging even in economies with good governance and capable
institutions, and much more so in economies like India. Such structural changes are expected to include changes in the real
wage, labour mobility, shrinking manufacturing sector compared to the natural resource sector and a rise in the service
sector. In this paper an attempt is made to fill this gap by conducting a study of the recent mining boom, associated
structural changes and the dynamics of the labour market transitions occurred in India in general and Bellary region of
Karnataka state in particular. The impacts of recent mining boom in the labour market of the country with a focus on one
of the hot spots in mining, viz. Bellary region in Karnataka have been examined with the help of field investigation.
The co-integration between the key sectors of the economy have been analysed with the help of different statistical tools to
measure the contribution of each sector to the growth and employment and then to understand the impact this structural
changes on the households. Finally we have tried to identify the drivers of structural change over the years and to predict
the future drivers for the purpose of policy making.
Our results have established that the economy of India and Bellary region have experienced a sectoral shift in
share of GDP from agriculture to industry and then to services due to the recent mining boom. However in Bellary the
services and mining industries gained relatively more importance compared to the other sectors. The study of the labour
market of Bellary shows dynamic growth in employment in mines, as well as in ancillary activities like construction, hotels
and restaurants, trade, transport etc. It has been observed that the increased export of iron ore due to the mining boom has
strengthened the primary sector of Bellary, the iron ore sector popped during the boom has strengthened the secondary
1 Research Scholar, IIT Kanpur,
2 Former Professor of Economics, IIT Kanpur and at present Visiting Professor, NISER, Bhubaneswar ** The paper presented in the 53rd Annual Conference of The Indian Society of Labour Economics, held at M.S. University, Udaipur, Rajastan, December 17-19.2012
International Journal of Economics, Commerce and Research (IJECR) ISSN(P): 2250-0006; ISSN(E): 2319-4472 Vol. 5, Issue 2, Apr 2015, 1-24 © TJPRC Pvt. Ltd
2 Basanth Kommadath & Binayak Rath
Impact Factor (JCC): 4.2234 Index Copernicus Value (ICV): 3.0
sector and has also accelerated the growth of sectors like transport, construction, hotels and restaurants etc, and made a
very strong tertiary sector. Contrary to the trend of sectoral transformation in other regions of the country where service
sector is growing at the cost of primary and secondary sector, our study of the Bellary region have established that all three
sectors are growing simultaneously after the mining boom period, which is a confirmation of the “three speed economic
growth model” for the region in conformity of the trend as was observed in developed countries like Australia and Canada.
KEYWORDS: Mining Boom, Structural Changes, Dynamics of Labour Market Transitions in Bellary
INTRODUCTION
Structural changes play a critical role in the process of economic growth of a developing economy and bring
transformations in the standard of living of the people. Structural changes not only aid economic growth, but also expected
to raise many other development indicators required for sustaining economic growth. One of the most common
consequences of structural changes that have been observed historically around the world is the shifts in the share of Gross
Domestic Product (GDP) and employment generated from agriculture to industry and then to services, i.e., a shift of
employment from primary sector towards secondary and tertiary sectors. In view of the possible shifts in the labour market
which have wider ramifications, one has to examine such possible shifts in the context of structural changes in India over
time. It is further argued that within the primacy sector, particularly the mining and quarrying activities, which are
generally labour intensive, undergo a significant change during primary sector boom, if any. However, natural resource
booms generally create complicated problems in macroeconomic management that are challenging even in economies with
good governance and capable institutions. Such structural changes include stagnating manufacturing sector compared to
natural resource sector and a growing service sector, which are expected to influence real wage and labour mobility.
In view of very few studies available in dealing with mining boom’s impact on labour market and labour mobility in India,
in this paper an attempt is made to examine such changes by conducting a study of the recent mining boom, associated
structural changes and the dynamics of the labour market transitions that occurred in India in general and in a typical
region, namely, Bellary of Karnataka state in particular, which is one of the hot spots in carrying out mining and quarrying
activities in the new millennium. The justification to choose Bellary region is based on the fact that while Karnataka
contributes about one-fourth of the country’s annual iron ore production, around 60 per cent of this comes from the Bellary
region, which is situated on the eastern side of Karnataka State and shares its border with Andhra Pradesh.
Accordingly, we have set our objectives in terms of examining the impact of recent mining boom on the labour
market with a focus on one of the hot spots in mining, viz. Bellary region in Karnataka. The main aim of this study has
been to examine the structural change owing to mining boom and its impact on the labour market as well as labour
mobility in a typical region of the country with particular reference to the impact on primary sector, secondary sector like
mining based industries and the services sector.
To accomplish these objectives, the focus of this study has been two-fold: to understand the labour market
changes in recent years in backdrop of the mining boom, and to gauge the performances of households in relation to these
structural changes. Furthermore, with the help of various theories of structural change, we have examined the validity and
significance of the widely held view that economic progress is generally associated with certain distinct, necessary and
predictable changes in occupational distribution, i.e., in terms of movement from primary sector to tertiary activities.
The relationship of each of these sectors to growth and employment are investigated in terms of extent of shift,
Mining Boom, Structural Changes and the Dynamics of Labour 3 Market Transitions in Bellary Region of Karnataka
ww.tjprc.org [email protected]
flexibility and elasticity of the labour market; the drivers of structural change over the years and the expected changes over
the next decade. We have also investigated the cointegration between these sectors and the contribution of each sector to
the growth and employment. By utilising the primary survey data collected from the typical area of the country, the impact
of the mining boom and resultant structural changes on the households over the period of mining boom and non boom are
estimated with the help of quantitative techniques.
THEORIES OF STRUCTURAL CHANGES
The causes of structural transformations have been widely debated and there are varied emphasis laid on different
factors by different economists. The main broad line of reasoning was advanced by pioneers like Fisher and Clark followed
by some elaborations and modifications by later economists. Allen Fisher (1939) was the first economists to investigate
structural changes. Fisher divided economy into three broad sectors, viz, the ‘primary sector’ comprising of mainly natural
resource based sectors including: agriculture, fishing, mining , quarrying, and forestry; ‘secondary sector’ comprising of
manufacturing , electricity, gas, water, construction and housing; finally the ‘tertiary sector’ includes service oriented
activities mainly composed of wholesale and retail trade, hotels and restaurants, transport and communication, finance, real
estate, and government services. Through his study, Fisher had demonstrated that the structural change was there due to the
saturation of demand for manufactured goods and high income elasticity of demand for services. Clark (1940) agreeing
with Fisher’s view later added that the shift of labour force takes place due to productivity differences of these sectors.
These arguments were developed into the Fisher-Clark ‘three-stage’ theory of growth. On the other hand, Kuznets
(1957, 1966, and 1971) had recognised the elasticity and productivity approaches and further added that the technological
as well as institutional factors also play an important role in accelerating these changes. The response of structural change
would vary depending on the trade openness of a country and also on their comparative advantages. Stephen Broadberry
(1998) had conducted a quantitative shift share analysis and concluded that Germany and the United States overtook
Britain in terms of aggregate labour productivity largely by shifting resources out of agriculture and by improving
comparative labour productivity in services rather than by improving comparative labour productivity in manufacturing.
The process of economic growth and development thus is connected with systematic structural change. As per
capita income rises, the primary sector loses in importance, while the manufacturing sector initially gains momentum but
eventually surpassed by the constantly growing service sector. This trend is observed all over the world and the service
sector is becoming the largest sector in terms of rising share in GDP and employment in smost developing countries.
However, the services sector in these countries is highly diverse and is increasingly seen as a means to promote economic
development and reduce poverty. From the perspective of social sustainability it is also worth recalling that some services
like education, health and social services directly affect the standards of living.
As regards the recent natural resource booms, it is observed that these booms have created complicated problems
in macroeconomic management. Such structural changes are expected to include changes in the real wage, labour mobility,
shrinking manufacturing sector compared to the natural resource sector and a rise in the service sector. In order to study the
impact of boom on the sectoral changes, Corden and Neary (1982) had typically modelled the economy into three sectors;
i.e., the natural resource sector, the tradable sector (usually understood as agriculture and manufacturing), and the non
tradable sector (including services and construction). Though we have adopted this model in our study, we have fine tuned
it by keeping the iron ore resource boom of a typical region in mind. The framework we have adopted is a small open
economy producing two goods which are traded at exogenously at given world prices, and a third non-traded good,
4 Basanth Kommadath & Binayak Rath
Impact Factor (JCC): 4.2234 Index Copernicus Value (ICV): 3.0
the price of which moves flexibly to equalize domestic supply and demand.
In principle, economic activity and growth can foster improvements in social conditions by direct creation of jobs,
with corresponding flows of income and wealth accumulation. Economic growth may also allow more resources to be used
for social services such as, health, education and welfare, both through private and public spending in turn increasing
community liveability. Since our study has attempted to examine the impact of mining on sustainability, first of all we
have hypothesised that as a result of mining boom there will be injections of economic stimulus into the regional economy
with dominance of mining and it will help to maintain regional employment. It will result in spread effects and those
effects can be summarised as:
• The Spending Effect, where increased domestic income flowing from the booming natural resource sector would
generate higher spending opportunities on domestic goods, leading to higher prices of goods and higher output in
the non-tradable sector. Wages in the economy would tend to rise, and thereby squeezing profits in the
internationally tradable sectors, such as, manufacturing those are not based on natural resources. With increased
inflation in non-tradable prices, there would be an appreciation of the real exchange rate and an output contraction
would take place in the non-resource-tradable sectors like manufacturing.
• The Resource Movement Effect, which takes place when a boom in the natural resource sector attracts capital and
labour from other parts of the economy, tending to reduce output in the rest of the economy. In particular, reduced
output in the non tradable sector causes the price of non tradable to rise relative to those of tradable, whose prices
are set in the world market
MINING BOOM IN INDIA IN THE NEW MILLENNIUM & STRUCT URAL CHANGES
In the wake of the new millennium, the commodity sector, particularly the mineral resources in India had
experienced an upswing owing to massive economic expansion both in China and in India. There had been increased
demand and consequently the levels of prices of several commodities, including oil and metals and alloys like iron, steel,
aluminium, etc had gone up. As we know that in a natural resource owned economy like ours, mining occupies a
paramount place in enhancing the GDP as well as employment. In the wake of the new millennium, mining that constitutes
the basic feedstock for industrial growth in India had experienced a boom in the last decade. In fact, two factors paved the
way for the mining boom; a) changes in India’s mining policy in 1993 by which land meant exclusively for mining by
public sector units were de-reserved for private entities, and b) the increase in the demand of mineral resources, specially
iron ore by China. China began importing huge quantities of iron ore to prepare for the 2008 Olympic Games, as a result of
which the price of iron ore soared from Rs. 1,200 per tonne in 2000 and crossed Rs. 5,000 per tonne in 2003 and again to
6000 in 2006 (of course, the price of iron ore in world market grew 118.5 % between 2002 – 2005) and the rates hovered
around 6,800- 7,000 by 2008
India with its significant reserves of iron ore (25 billion tonnes) had emerged as a major exporter taking advantage
of the burgeoning Chinese demand. Exports of iron ore from India increased from 50 million tons in 2002 to more than 117
million tons in 2009 (details of export are given in Table 1). Indeed, India had emerged as the 3rd largest exporter of iron
ore next to Brazil and Australia. Almost entire iron ore production in India can be attributable to hematite ore, compared to
magnetite.
As per available statistics there were 319 iron ore mines in 2010 with an estimated cumulative production capacity
Mining Boom, Structural Changes and the Dynamics of Labour 5 Market Transitions in Bellary Region of Karnataka
ww.tjprc.org [email protected]
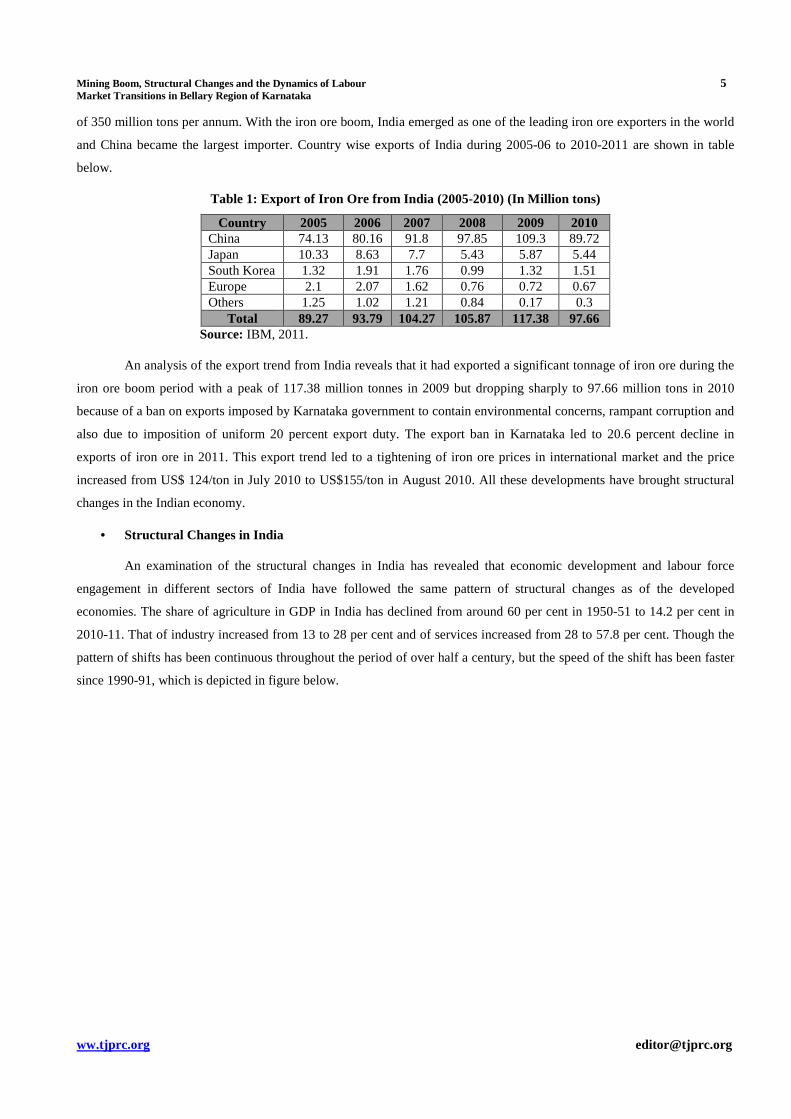
of 350 million tons per annum. With the iron ore boom, India emerged as one of the leading iron ore exporters in the world
and China became the largest importer. Country wise exports of India during 2005-06 to 2010-2011 are shown in table
below.
Table 1: Export of Iron Ore from India (2005-2010) (In Million tons)
Country 2005 2006 2007 2008 2009 2010 China 74.13 80.16 91.8 97.85 109.3 89.72 Japan 10.33 8.63 7.7 5.43 5.87 5.44 South Korea 1.32 1.91 1.76 0.99 1.32 1.51 Europe 2.1 2.07 1.62 0.76 0.72 0.67 Others 1.25 1.02 1.21 0.84 0.17 0.3
Total 89.27 93.79 104.27 105.87 117.38 97.66 Source: IBM, 2011.
An analysis of the export trend from India reveals that it had exported a significant tonnage of iron ore during the
iron ore boom period with a peak of 117.38 million tonnes in 2009 but dropping sharply to 97.66 million tons in 2010
because of a ban on exports imposed by Karnataka government to contain environmental concerns, rampant corruption and
also due to imposition of uniform 20 percent export duty. The export ban in Karnataka led to 20.6 percent decline in
exports of iron ore in 2011. This export trend led to a tightening of iron ore prices in international market and the price
increased from US$ 124/ton in July 2010 to US$155/ton in August 2010. All these developments have brought structural
changes in the Indian economy.
• Structural Changes in India
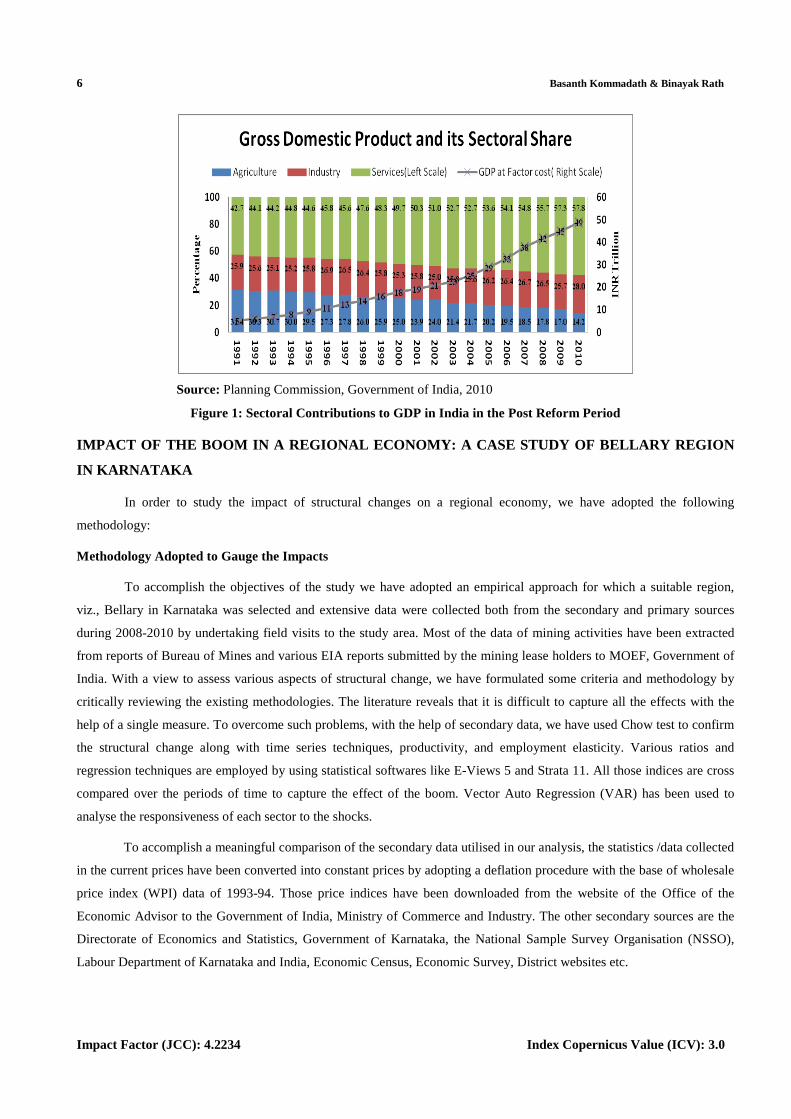
An examination of the structural changes in India has revealed that economic development and labour force
engagement in different sectors of India have followed the same pattern of structural changes as of the developed
economies. The share of agriculture in GDP in India has declined from around 60 per cent in 1950-51 to 14.2 per cent in
2010-11. That of industry increased from 13 to 28 per cent and of services increased from 28 to 57.8 per cent. Though the
pattern of shifts has been continuous throughout the period of over half a century, but the speed of the shift has been faster
since 1990-91, which is depicted in figure below.
6 Basanth Kommadath & Binayak Rath
Impact Factor (JCC): 4.2234 Index Copernicus Value (ICV): 3.0
Source: Planning Commission, Government of India, 2010
Figure 1: Sectoral Contributions to GDP in India in the Post Reform Period
IMPACT OF THE BOOM IN A REGIONAL ECONOMY: A CASE ST UDY OF BELLARY REGION
IN KARNATAKA
In order to study the impact of structural changes on a regional economy, we have adopted the following
methodology:
Methodology Adopted to Gauge the Impacts
To accomplish the objectives of the study we have adopted an empirical approach for which a suitable region,
viz., Bellary in Karnataka was selected and extensive data were collected both from the secondary and primary sources
during 2008-2010 by undertaking field visits to the study area. Most of the data of mining activities have been extracted
from reports of Bureau of Mines and various EIA reports submitted by the mining lease holders to MOEF, Government of
India. With a view to assess various aspects of structural change, we have formulated some criteria and methodology by
critically reviewing the existing methodologies. The literature reveals that it is difficult to capture all the effects with the
help of a single measure. To overcome such problems, with the help of secondary data, we have used Chow test to confirm
the structural change along with time series techniques, productivity, and employment elasticity. Various ratios and
regression techniques are employed by using statistical softwares like E-Views 5 and Strata 11. All those indices are cross
compared over the periods of time to capture the effect of the boom. Vector Auto Regression (VAR) has been used to
analyse the responsiveness of each sector to the shocks.
To accomplish a meaningful comparison of the secondary data utilised in our analysis, the statistics /data collected
in the current prices have been converted into constant prices by adopting a deflation procedure with the base of wholesale
price index (WPI) data of 1993-94. Those price indices have been downloaded from the website of the Office of the
Economic Advisor to the Government of India, Ministry of Commerce and Industry. The other secondary sources are the
Directorate of Economics and Statistics, Government of Karnataka, the National Sample Survey Organisation (NSSO),
Labour Department of Karnataka and India, Economic Census, Economic Survey, District websites etc.
Mining Boom, Structural Changes and the Dynamics of Labour 7 Market Transitions in Bellary Region of Karnataka
ww.tjprc.org [email protected]
Moreover, in order to examine the impact of the boom on households, primary data have been collected from six
different villages of Bellary-Hospet-Sandur belt comprising of 5 villages of Bellary district of Karnataka and one village of
Anantapur district of Andrapradesh. The required primary data have been collected from the field by developing a
comprehensive interview schedule. With the help of those primary data, we have analysed the trend of income,
consumption, savings and assets possessed by households for cultivators, agricultural labours, mining labours, and people
engaged in services and the other workers across three periods, viz. before mining, during the boom and post boom period.
Various ratio analysis and relative changes in percentage terms have been used for a comparative analysis.
Using these methodologies, the study has explored and assessed the structural changes due to mining in the
Bellary region. The structure of the labour market, and structure of industrialisation are investigated in order to formulate
proper polices to assist sustainable development. The rapid changes in the employment patterns are analysed to portray the
existing socio-economic condition and status of labours in the context of the changing developmental scenario of Bellary
region.
Physical and Socio-Economic Features of Bellary Region
Bellary region, located on India’s southern plateau, is blessed with fertile soil and minerals. It is situated in the
northern dry agro-climatic (arid) zone of Karnataka and has a total geographical area of 8420 sq. km. (8, 45,000 hectares),
constituting 4.99 percent of the area of the State. Forest area covers 1, 37,852 hectares of the geographical area (i.e., 16.3
per cent) of the region. Bellary having an arid climate also comes under hottest region in the state of Karnataka. It is known
for its blistering summer and dry weather for a major part of the year. The region is drought prone and has been afflicted
by famine in the past. Furthermore, the black cotton soil of the region has a tendency to break and leave large cracks during
summer and it make hard even grass to grow.
• Demographic Features of Bellary Region
Official Census of India, 2011 details Bellary’s population as 2,532,383, of which male and female are 1,280,402
and 1,251,981 respectively. It is observed that there is change of 24.92 percent in the population compared to 2001. In the
previous census of India 2001 also, Bellary recorded an increase of 22.41 percent to its population compared to 1991.
Density of population of Bellary also increased in 2011 and recorded 300 people per square km. against 240 per square km.
in 2001. Average literacy rate of Bellary in 2011 has improved to 67.85 compared from 57.40 of 2001. The male and
female literacy of the region improved to 77.24 and 58.28 respectively as compared to 69.20 and 45.28 in 2001.
With regard to sex ratio in Bellary, it stood at 978 per 1000 male compared to 2001 census figure of 969. Out of the total
Bellary population for 2011 census, 36.30 percent lives in urban region.
• Socio Economic Conditions of Bellary Region before Mining Boom
Bellary, a land-locked region, located 304 kilometres away from the capital city, of Bangalore in Karnataka state
and shares its border with Andhra Pradesh. Archaeological explorations show that it is a region inhabited from time
immemorial. The region has witnessed troughs and crests of economic well being over age’s, viz., its splendour during
Vijayanagara Empire and economic downturn after its downfall until minerals were explored in the region.
Bellary in its present administrative structure was formed in 1997, when some of the taluks were made part of
Andhra Pradesh which was formed on linguistic basis. At present the region comprises of seven taluks, viz., Bellary,
Hospet, Sandur, Siruguppa, Kudligi, H.Hadagali, and H B Halli. In spite of having rich mineral resources, Bellary region
8 Basanth Kommadath & Binayak Rath
Impact Factor (JCC): 4.2234 Index Copernicus Value (ICV): 3.0
was known as one of the backward areas of Karnataka. As a result of skewed development, Bellary remained as one of the
backward regions of Karnataka, ranking 18 among 27 districts in terms of human development in 2001 (HDR, GoK, 2006).
Until the period of mining boom (2003-2008), agriculture was the major occupation of Bellary region, providing livelihood
for 67 percent of the labour force. But geographical and climatic conditions of Bellary were not so friendly for agricultural
development. The rainfall is not only scanty but also capricious and uncertain; the variations in the annual rainfall from
year to year are very large. Due to the scarcity of rains and lack of proper irrigation facilities, agriculture in some taluks,
particularly the western parts has been severely affected. Moreover, excessive salt content in the soil has resulted in poor
yield and made the area unsuitable for good irrigation.
• Mines and Minerals Sector of Bellary before the Boom
Increase in the mining activities in the area has a remarkable development. It has imparted special significance in
the economic life of the people and contributed considerably to raise total income of the State. Bellary region slowly
earned its name for its exports of agricultural and mineral produce. The principal trade is related to cereals and millets
which are largely grown in the area. The rich black cotton soil in the eastern part of the region with irrigation facilities
from Tungabhadra project accounts for the growth of cotton trade and subsequently promoted a large number of
cotton-ginning factories. Bellary region also exports groundnut, jaggery, garments carpets, blankets along with iron and
manganese ore.
Mining is now the emblematic trait of Bellary as the region is well endowed with wide variety of minerals, both
metallic and non-metallic out of which iron and manganese are major ones. The metallic minerals include iron, manganese,
red oxide, gold, copper and lead. The non-metallic minerals include asbestos, corundum, clay, dolomite, limestone,
graphite, moulding sand, quartz, satellite, sop stone, granite yellow ochre, red ochre, decorate and ornamental stones.
The metallic minerals especially iron ore is abundant in three taluks, viz., Sandur, Hospet and Bellary in the order of their
mining intensity.
Bellary region witnessed mining for decades and iron ore reserves found in Bellary, Hospet and Sandur regions in
Karnataka have a mining history of over 100 years. Mining activities were undertaken on a very small scale right from
1800’s by British government and earlier to that by local kings for their weaponry and other domestic products
(www.mmpindia.org). But the commercial exploitation of iron ore started in 1906 with the mining license granted to
G.S.M. Company that continued the mining operation till 1953. However, iron ore production by the state and private mine
owners started in 1953 and the Bellary district mine owners association was established in the same year with an initial
membership of 42 members (www.bellary.nic.in). Till a decade ago, mining companies of the region were struggling with
small profits due to low iron ore price both in domestic and international markets. However, mining activity began to be
considered an important economic sector since 1995 when Government owned National Mineral Development Corporation
(NMDC) started its exploration activities along with the increased domestic demand from Jindal Steels Works (JSW) that
started their steel plant at Toranagallu in Sandur taluk of Bellary. Further, in the turn of the present century the export
demand from China, Korea and other countries gave a boost to the iron ore production.
To sum up, the economy of the region is sustained primarily by the intensive use of agricultural land, exploitation
of minerals, agro based industries, garment, iron and steel, manufacturing related large scale industries. Trading and
commercial activities also have a stabilising effect on the region’s economy because of the good transport and
communication system.
Mining Boom, Structural Changes and the Dynamics of Labour 9 Market Transitions in Bellary Region of Karnataka
ww.tjprc.org [email protected]
Analysis of the Structural Change in the Bellary Region
Before examining the structural changes in the Bellary region, we have analysed the structural changes that have
taken place in the state of Karnataka. In tune with the national trend, Karnataka’s economy has exhibited structural changes
over the years. When the State was formed in 1956, its economy was predominantly agrarian, but this has now altered.
The primary sector, which contributed about 60 per cent of the GSDP in 1960- 61 has reduced to18.9 per cent in 2006-07.
In the same period, the share of secondary sector has increased from 15.2 per cent to 26 per cent and the share of tertiary
sector has more than doubled from 24.8 per cent to 55.1 per cent. The mining boom followed by service sector boom since
the 1990s has boosted the State’s economic growth. The manufacturing sector which lagged behind for some time has
grown well due to mining boom but it has remained steady.
As regards the impact of the boom on Bellary region, analysis of the secondary data collected from the field has
revealed that mining boom has brought structural changes in the region. It has raised the Net District Domestic Product
(NDDP) of Bellary from Rs.33, 032 million, and per capita NDDP of Rs.15, 770 in 2003-04 to Rs.9, 19,799 million
(i.e., more than 26 times rise in NDDP) and Rs.41, 857 (170% rise) in 2007-08 respectively. In contrast to the state level
trend, the sectoral contributions of NDDP has undergone a significant change. The primary sector’s contribution which
was 60.6 % in 1960 came down to 19.76% in 2003. But with mining boom its share has gone up to 35.11% in 2010. On the
other hand, the secondary sector’s share increased from 14.8 % in 1960 to 35.94% in 2003; however, by 2010 its share
declined to 23.16%. The tertiary sector has steadily increased from 24.6% in 1960 to 45.21% in 2003 and slightly declined
to 41.73% in 2010.
It is further established that mining boom and the resultant structural change experienced by Bellary are different
from the national and state scenario. It has shown that all the three sectors of Bellary have grown over time till the export
boom to China. It can also be seen that the tertiary sector has grown consistently and the primary sector growth is related to
the mining boom in 2003. The secondary sector also started growing when the trickledown effect of the mining prompted
the sector in the form of iron and steel industries and sponge iron firms. To find out the significances of each sector to the
NDDP of Bellary over the years, we have conducted an ordinary linear regression by using the times series data of the last
decade. We have converted it to a log form to find out the growth. The regression results are as follows:
( 4.36) (0.001) ( 4.28) (0.003) ( 5.87) (0.002)
2 2
0.06069 + 1.001 0.85 1.05
R 0.9995 , R 0.9979
t t t tNDDP P S T− −
= + +
= =
Figures in the parenthesis are t- values and p>|t| values respectively. The results show that the tertiary sector
contributes more to the NDDP followed by the primary and secondary sectors respectively. Again the interesting point to
be noted is that even after the boom and the resultant structural change, all the sectors of Bellary are contributing positively
to its income. This is different from the state and national trend where the share of primary sector has declined significantly
with a near stagnant manufacturing sector and a rising service sector.
• Impact of Boom on Mining and Mineral based Industries
As mentioned above, Bellary is endowed with rich natural resources both metallic and non-metallic mineral
deposits. As per estimates in 2008, the iron ores with a capacity of 1,000 million tonnes in the region were considered to be
among the highest grades in the world. At present there are 99 mining-leases of which 63 are operational and 33 mines are
10 Basanth Kommadath & Binayak Rath
Impact Factor (JCC): 4.2234 Index Copernicus Value (ICV): 3.0
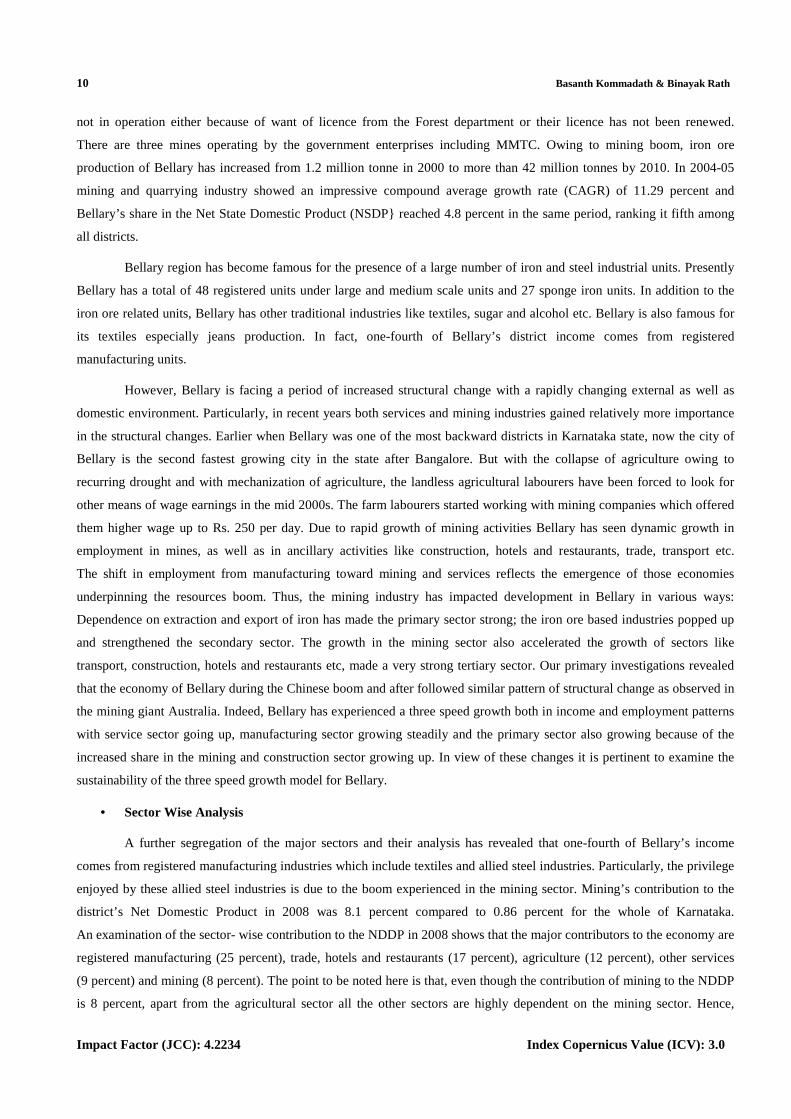
not in operation either because of want of licence from the Forest department or their licence has not been renewed.
There are three mines operating by the government enterprises including MMTC. Owing to mining boom, iron ore
production of Bellary has increased from 1.2 million tonne in 2000 to more than 42 million tonnes by 2010. In 2004-05
mining and quarrying industry showed an impressive compound average growth rate (CAGR) of 11.29 percent and
Bellary’s share in the Net State Domestic Product (NSDP} reached 4.8 percent in the same period, ranking it fifth among
all districts.
Bellary region has become famous for the presence of a large number of iron and steel industrial units. Presently
Bellary has a total of 48 registered units under large and medium scale units and 27 sponge iron units. In addition to the
iron ore related units, Bellary has other traditional industries like textiles, sugar and alcohol etc. Bellary is also famous for
its textiles especially jeans production. In fact, one-fourth of Bellary’s district income comes from registered
manufacturing units.
However, Bellary is facing a period of increased structural change with a rapidly changing external as well as
domestic environment. Particularly, in recent years both services and mining industries gained relatively more importance
in the structural changes. Earlier when Bellary was one of the most backward districts in Karnataka state, now the city of
Bellary is the second fastest growing city in the state after Bangalore. But with the collapse of agriculture owing to
recurring drought and with mechanization of agriculture, the landless agricultural labourers have been forced to look for
other means of wage earnings in the mid 2000s. The farm labourers started working with mining companies which offered
them higher wage up to Rs. 250 per day. Due to rapid growth of mining activities Bellary has seen dynamic growth in
employment in mines, as well as in ancillary activities like construction, hotels and restaurants, trade, transport etc.
The shift in employment from manufacturing toward mining and services reflects the emergence of those economies
underpinning the resources boom. Thus, the mining industry has impacted development in Bellary in various ways:
Dependence on extraction and export of iron has made the primary sector strong; the iron ore based industries popped up
and strengthened the secondary sector. The growth in the mining sector also accelerated the growth of sectors like
transport, construction, hotels and restaurants etc, made a very strong tertiary sector. Our primary investigations revealed
that the economy of Bellary during the Chinese boom and after followed similar pattern of structural change as observed in
the mining giant Australia. Indeed, Bellary has experienced a three speed growth both in income and employment patterns
with service sector going up, manufacturing sector growing steadily and the primary sector also growing because of the
increased share in the mining and construction sector growing up. In view of these changes it is pertinent to examine the
sustainability of the three speed growth model for Bellary.
• Sector Wise Analysis
A further segregation of the major sectors and their analysis has revealed that one-fourth of Bellary’s income
comes from registered manufacturing industries which include textiles and allied steel industries. Particularly, the privilege
enjoyed by these allied steel industries is due to the boom experienced in the mining sector. Mining’s contribution to the
district’s Net Domestic Product in 2008 was 8.1 percent compared to 0.86 percent for the whole of Karnataka.
An examination of the sector- wise contribution to the NDDP in 2008 shows that the major contributors to the economy are
registered manufacturing (25 percent), trade, hotels and restaurants (17 percent), agriculture (12 percent), other services
(9 percent) and mining (8 percent). The point to be noted here is that, even though the contribution of mining to the NDDP
is 8 percent, apart from the agricultural sector all the other sectors are highly dependent on the mining sector. Hence,
Mining Boom, Structural Changes and the Dynamics of Labour 11 Market Transitions in Bellary Region of Karnataka
ww.tjprc.org [email protected]
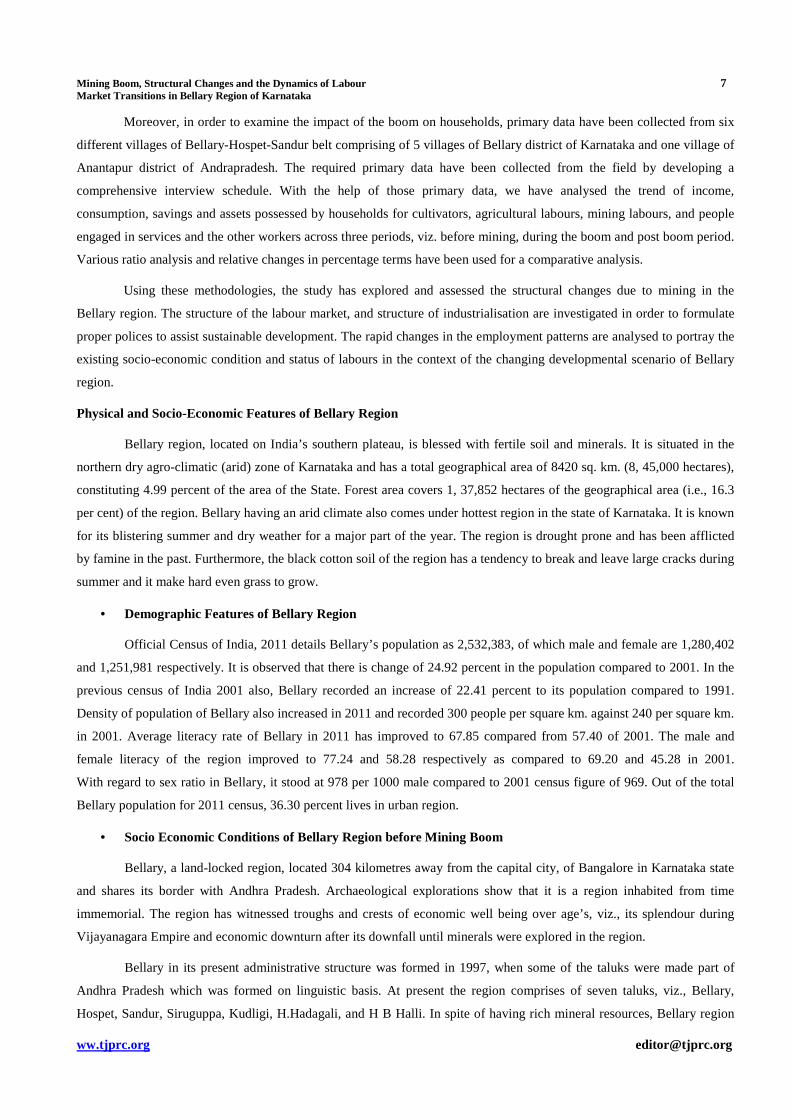
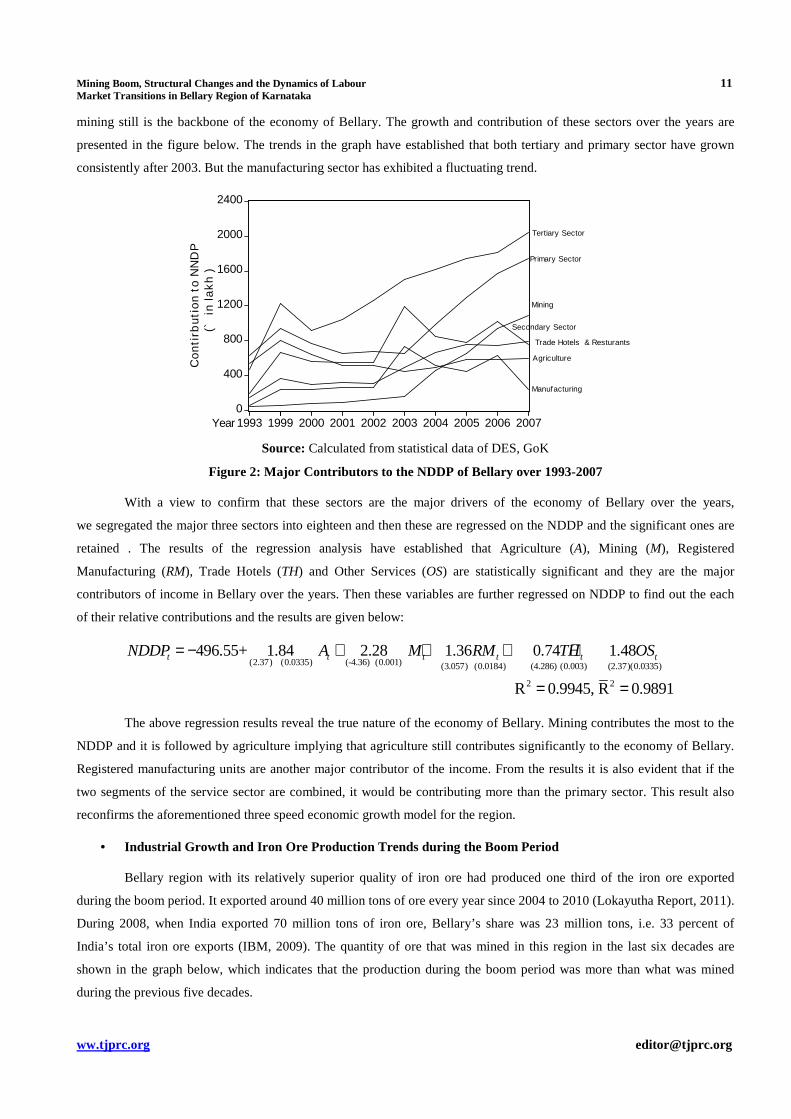
mining still is the backbone of the economy of Bellary. The growth and contribution of these sectors over the years are
presented in the figure below. The trends in the graph have established that both tertiary and primary sector have grown
consistently after 2003. But the manufacturing sector has exhibited a fluctuating trend.
0
400
800
1200
1600
2000
2400
1993 1999 2000 2001 2002 2003 2004 2005 2006 2007
Co
nti
rbu
tio
n t
o N
ND
P
(`
in l
ak
h )
Year
Agriculture
Manufacturing
Primary Sector
Tertiary Sector
Mining
Secondary Sector
Trade Hotels & Resturants
Source: Calculated from statistical data of DES, GoK
Figure 2: Major Contributors to the NDDP of Bellary over 1993-2007
With a view to confirm that these sectors are the major drivers of the economy of Bellary over the years,
we segregated the major three sectors into eighteen and then these are regressed on the NDDP and the significant ones are
retained . The results of the regression analysis have established that Agriculture (A), Mining (M), Registered
Manufacturing (RM), Trade Hotels (TH) and Other Services (OS) are statistically significant and they are the major
contributors of income in Bellary over the years. Then these variables are further regressed on NDDP to find out the each
of their relative contributions and the results are given below:
(2.37) (0.0335) (-4.36) (0.001) (3.057) (0.0184) (4.286) (0.003) (2.37)(0.0335)
496.55+ 1.84 2.28 1.36 0.74 1.48
t t t t t tNDDP A M RM TH OS= − + + + +
2 2 R 0.9945, R 0.9891 = =
The above regression results reveal the true nature of the economy of Bellary. Mining contributes the most to the
NDDP and it is followed by agriculture implying that agriculture still contributes significantly to the economy of Bellary.
Registered manufacturing units are another major contributor of the income. From the results it is also evident that if the
two segments of the service sector are combined, it would be contributing more than the primary sector. This result also
reconfirms the aforementioned three speed economic growth model for the region.
• Industrial Growth and Iron Ore Production Trends du ring the Boom Period
Bellary region with its relatively superior quality of iron ore had produced one third of the iron ore exported
during the boom period. It exported around 40 million tons of ore every year since 2004 to 2010 (Lokayutha Report, 2011).
During 2008, when India exported 70 million tons of iron ore, Bellary’s share was 23 million tons, i.e. 33 percent of
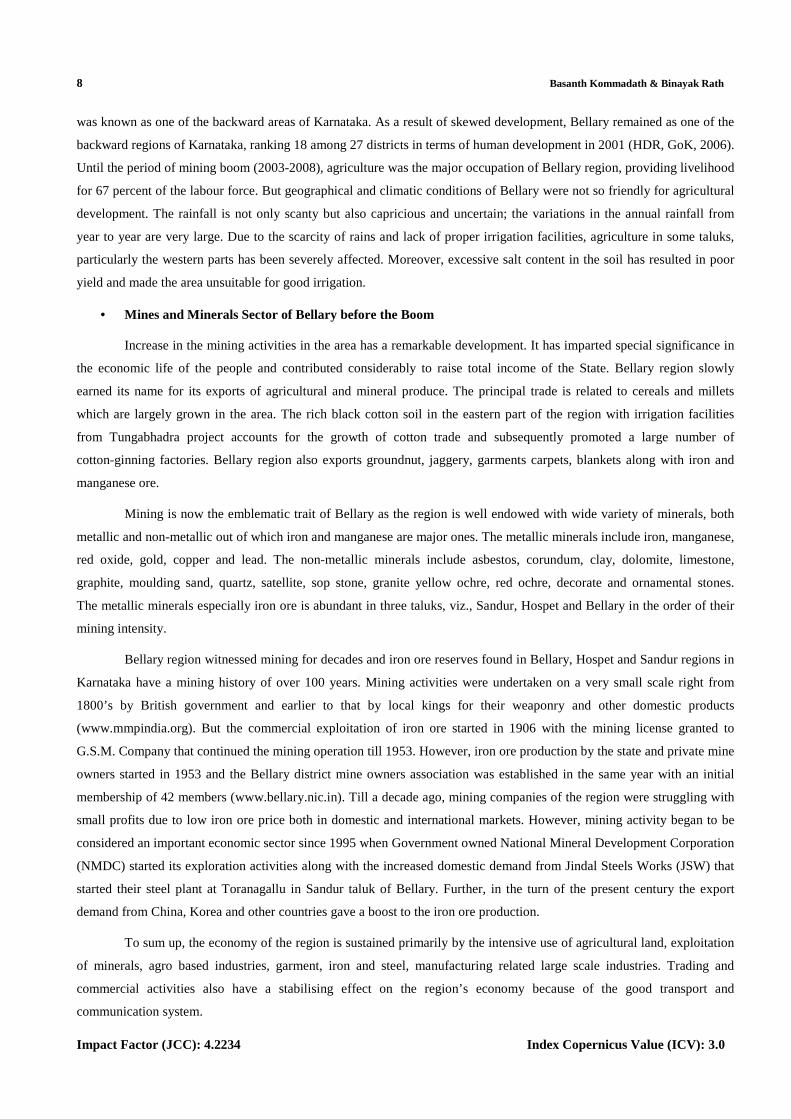
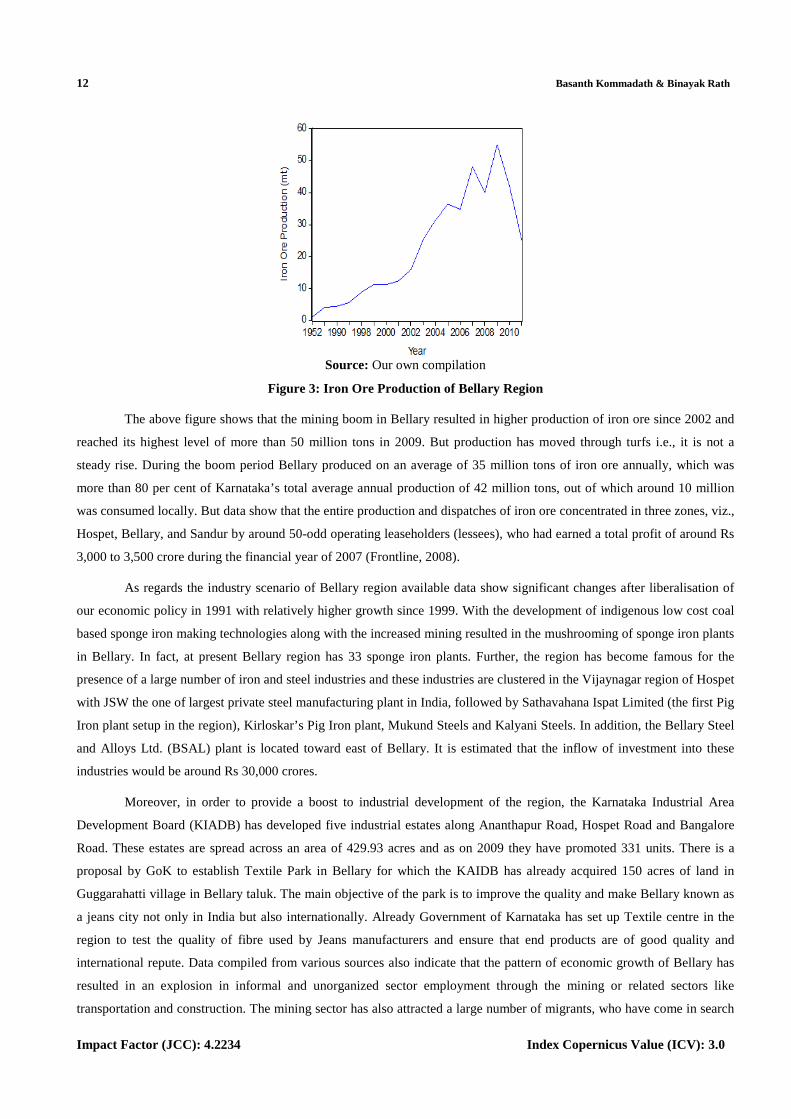
India’s total iron ore exports (IBM, 2009). The quantity of ore that was mined in this region in the last six decades are
shown in the graph below, which indicates that the production during the boom period was more than what was mined
during the previous five decades.
12 Basanth Kommadath & Binayak Rath
Impact Factor (JCC): 4.2234 Index Copernicus Value (ICV): 3.0
Source: Our own compilation
Figure 3: Iron Ore Production of Bellary Region
The above figure shows that the mining boom in Bellary resulted in higher production of iron ore since 2002 and
reached its highest level of more than 50 million tons in 2009. But production has moved through turfs i.e., it is not a
steady rise. During the boom period Bellary produced on an average of 35 million tons of iron ore annually, which was
more than 80 per cent of Karnataka’s total average annual production of 42 million tons, out of which around 10 million
was consumed locally. But data show that the entire production and dispatches of iron ore concentrated in three zones, viz.,
Hospet, Bellary, and Sandur by around 50-odd operating leaseholders (lessees), who had earned a total profit of around Rs
3,000 to 3,500 crore during the financial year of 2007 (Frontline, 2008).
As regards the industry scenario of Bellary region available data show significant changes after liberalisation of
our economic policy in 1991 with relatively higher growth since 1999. With the development of indigenous low cost coal
based sponge iron making technologies along with the increased mining resulted in the mushrooming of sponge iron plants
in Bellary. In fact, at present Bellary region has 33 sponge iron plants. Further, the region has become famous for the
presence of a large number of iron and steel industries and these industries are clustered in the Vijaynagar region of Hospet
with JSW the one of largest private steel manufacturing plant in India, followed by Sathavahana Ispat Limited (the first Pig
Iron plant setup in the region), Kirloskar’s Pig Iron plant, Mukund Steels and Kalyani Steels. In addition, the Bellary Steel
and Alloys Ltd. (BSAL) plant is located toward east of Bellary. It is estimated that the inflow of investment into these
industries would be around Rs 30,000 crores.
Moreover, in order to provide a boost to industrial development of the region, the Karnataka Industrial Area
Development Board (KIADB) has developed five industrial estates along Ananthapur Road, Hospet Road and Bangalore
Road. These estates are spread across an area of 429.93 acres and as on 2009 they have promoted 331 units. There is a
proposal by GoK to establish Textile Park in Bellary for which the KAIDB has already acquired 150 acres of land in
Guggarahatti village in Bellary taluk. The main objective of the park is to improve the quality and make Bellary known as
a jeans city not only in India but also internationally. Already Government of Karnataka has set up Textile centre in the
region to test the quality of fibre used by Jeans manufacturers and ensure that end products are of good quality and
international repute. Data compiled from various sources also indicate that the pattern of economic growth of Bellary has
resulted in an explosion in informal and unorganized sector employment through the mining or related sectors like
transportation and construction. The mining sector has also attracted a large number of migrants, who have come in search
Mining Boom, Structural Changes and the Dynamics of Labour 13 Market Transitions in Bellary Region of Karnataka
ww.tjprc.org [email protected]
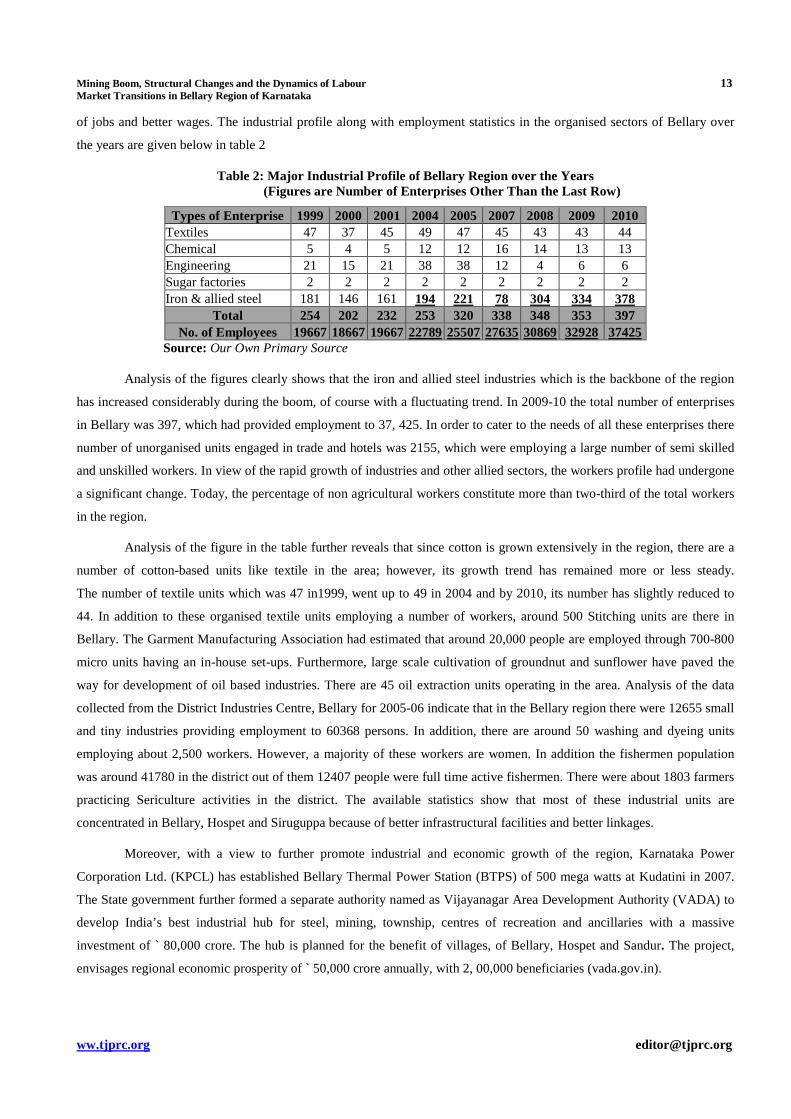
of jobs and better wages. The industrial profile along with employment statistics in the organised sectors of Bellary over
the years are given below in table 2
Table 2: Major Industrial Profile of Bellary Region over the Years (Figures are Number of Enterprises Other Than the Last Row)
Types of Enterprise 1999 2000 2001 2004 2005 2007 2008 2009 2010 Textiles 47 37 45 49 47 45 43 43 44 Chemical 5 4 5 12 12 16 14 13 13 Engineering 21 15 21 38 38 12 4 6 6 Sugar factories 2 2 2 2 2 2 2 2 2 Iron & allied steel 181 146 161 194 221 78 304 334 378
Total 254 202 232 253 320 338 348 353 397 No. of Employees 19667 18667 19667 22789 25507 27635 30869 32928 37425
Source: Our Own Primary Source
Analysis of the figures clearly shows that the iron and allied steel industries which is the backbone of the region
has increased considerably during the boom, of course with a fluctuating trend. In 2009-10 the total number of enterprises
in Bellary was 397, which had provided employment to 37, 425. In order to cater to the needs of all these enterprises there
number of unorganised units engaged in trade and hotels was 2155, which were employing a large number of semi skilled
and unskilled workers. In view of the rapid growth of industries and other allied sectors, the workers profile had undergone
a significant change. Today, the percentage of non agricultural workers constitute more than two-third of the total workers
in the region.
Analysis of the figure in the table further reveals that since cotton is grown extensively in the region, there are a
number of cotton-based units like textile in the area; however, its growth trend has remained more or less steady.
The number of textile units which was 47 in1999, went up to 49 in 2004 and by 2010, its number has slightly reduced to
44. In addition to these organised textile units employing a number of workers, around 500 Stitching units are there in
Bellary. The Garment Manufacturing Association had estimated that around 20,000 people are employed through 700-800
micro units having an in-house set-ups. Furthermore, large scale cultivation of groundnut and sunflower have paved the
way for development of oil based industries. There are 45 oil extraction units operating in the area. Analysis of the data
collected from the District Industries Centre, Bellary for 2005-06 indicate that in the Bellary region there were 12655 small
and tiny industries providing employment to 60368 persons. In addition, there are around 50 washing and dyeing units
employing about 2,500 workers. However, a majority of these workers are women. In addition the fishermen population
was around 41780 in the district out of them 12407 people were full time active fishermen. There were about 1803 farmers
practicing Sericulture activities in the district. The available statistics show that most of these industrial units are
concentrated in Bellary, Hospet and Siruguppa because of better infrastructural facilities and better linkages.
Moreover, with a view to further promote industrial and economic growth of the region, Karnataka Power
Corporation Ltd. (KPCL) has established Bellary Thermal Power Station (BTPS) of 500 mega watts at Kudatini in 2007.
The State government further formed a separate authority named as Vijayanagar Area Development Authority (VADA) to
develop India’s best industrial hub for steel, mining, township, centres of recreation and ancillaries with a massive
investment of ` 80,000 crore. The hub is planned for the benefit of villages, of Bellary, Hospet and Sandur. The project,
envisages regional economic prosperity of ` 50,000 crore annually, with 2, 00,000 beneficiaries (vada.gov.in).
14 Basanth Kommadath & Binayak Rath
Impact Factor (JCC): 4.2234 Index Copernicus Value (ICV): 3.0
Because of these economic activities associated with mining, the Bellary region has now transformed from one of
the most backward region in Karnataka state to second fastest growing area after the state capital Bangalore. With the iron
ore mining boom, there has been a big rush of industrialists, traders, transporters, miners and labourers from far and near to
Bellary region. The three-year drought that lasted till 2005 also brought thousands of agricultural workers from villages in
Karnataka, Andhra Pradesh, Tamil Nadu and even parts of Maharashtra to work in mines. Bellary in a sense also supported
its neighbouring regions; there were large migrants from the poor neighbouring regions like Raichur. At present, town of
Bellary is an important trade, industrial and educational centre in the state of Karnataka. The region, which has a
population of around two million, became rich enough in terms of Per Capita Gross District Domestic Product, which is
Rs 53,289 at current prices, well above the average per capita income of Karnataka.
Labour Market Dynamics of Bellary
After analysing the sectoral distribution and dynamics of structural change of the economy of Bellary, we have
analysed its impact on the labour market. Though such exercise is always constrained due to non availability of a
consistent time series data, an attempt has been made to collect all relevant information from the published and
unpublished materials, by undertaking personal visits to various departments, holding discussions with the local
knowledgeable persons and with the officers in the field as well as with other stakeholders. The population census data of
1981, 1991, and 2001, and Economic Census of 1998 and 2005 are used by us in addition to publications and records of
the Department of Industries and Commerce, District Employment Exchange, Labour department and that of Bellary
Urban Development Authority (BUDA).
Analysis of those data have revealed that though tertiary sector is the major contributor to the net district domestic
product but the labour market is primary sector oriented. Agriculture continued to be the mainstay of employment although
employment levels in this sector are gradually decreasing. Agricultural labour, accounts for 40 per cent of the rural
population and nearly 60 per cent of these is women. It is observed that there is considerable decrease in cultivators during
the last two decades, indicating more and more drift towards non-agriculture activities. For a better understanding of the
contribution of labours from the each sector to the net domestic product we conducted a regression analysis by using net
district domestic product as the dependent variable and the growth of workforce in each sector as the independent variables
and obtained the following results.
(0.04) (0.003) (0.026)
2 2
2.35+ 0.04 0.09 S 0.13
R 0.8563, R 0.7432
NDDP P T= + +
= =
From the above results it is evident that the service sector is the major contributor of labour market in Bellary over
the years, followed by secondary sector and primary sector respectively. This implies that once prominent primary sector
workforce which was mainly agriculture dependent is losing its importance and the workforce is gradually moving to
secondary and tertiary sector as well as to mining activities over the years utilising the boom created structural changes.
• Labour Market in the Mining Sector
Mining activities being labour intensive generates a lot of employment opportunities directly and indirectly.
Indeed, the indirect linkage multiplier effects of mining are likely to be more significant owing to more spread effects.
As regards the direct employment in the organised sector, the Regional Labour Commissioner (Central) of Bellary who
Mining Boom, Structural Changes and the Dynamics of Labour 15 Market Transitions in Bellary Region of Karnataka
ww.tjprc.org [email protected]
keeps accounts of those sectors had estimated in 2006 that the 50 functional mines had employed around 8000 regular male
workers in the region. But it is reported that the actual figures were higher than this estimate when one takes into
consideration the employment in illegal mines, at stockyards, loading points, trucks, tippers and other machinery.
According to an estimate by a labour union, there are 20,000 workers involved in mining work in the region with 5432
permanent workers both in public and private sector mines. On the other hand, unofficial estimates claim that around 1.5-2
lakh people are attached to allied industries like steel mills, sponge iron manufacturing facilities, transport sector and
hundreds of heavy vehicle workshops.
But as we know that mining activities are generally undertaken for about eight months in a year as the mines are
closed down during the monsoon season. The activities in the iron ore mines consist of extraction of ore, breaking of rocks
into small stones and pebbles and into fine powder, which are labour intensive usually employ migrant labour force from
the surrounding districts and from other states like Andrapradesh. The owners of mines prefer migrant workers over local
workers in the mines on daily wage basis. In fact, 70-80 percent, of the labours are from the dalit and tribal (sugali)
communities who are brought by some middlemen/supervisors to the mine sites and one of the major source of
employment of labour is the transport vehicles like trucks, lorries and tippers. It is estimated that there are more than
18,000 lorries in Bellary district and in the Sandur taluk alone there are nearly 8000 trucks and 8000 tippers which employ
about 70,000 workers. However, there are at around 1.5 lakh casual workers engaged in the transportation related work the
three taluks dominated for mining activities, namely, Bellary, Sandur and Hospet.
• Workforce Participation Rate
In a developing economy, it is natural for the magnitude of the workforce to change along with the changes in
population. While workforce participation rate (WPR) in India increased from 37 percent in 1991 to 39 percent in 2001,
the corresponding WPR for Karnataka was 42 percent to 45 percent respectively. But in the Bellary region, the WPR
remained relatively high at 45 percent and remained unchanged during the period of the mining boom, indicating that
employment generation in the district was not commensurate with the growth in population. However, during the reference
period the proportion of female workers to total population in Bellary was higher than the state and national averages.
Bellary was among the top ten districts in Karnataka in terms of employment of female workers as agricultural labourers
which was 60 percent compared to 43 percent in the state as a whole.
Analysis of the available data had further shown that the work participation rates of the cultivators and
agricultural labours had been adversely affected by the mining boom and as far as other sectors are concerned the
participation rate had increased owing to variations in wage rates over the period of time. Though there has been a rise in
wage rate for all categories of workers, but the rise has been relatively higher for non-agricultural labours. In the case of
mining labours there are different types of complex wage employment systems. The large companies like NMDC have had
permanent and daily wage labour.
• Level of Unemployment in Bellary Region
The level of unemployment is another indicator of measuring impact of the mining boom in the labour market and
a decrease in unemployment, no doubt, is a positive indicator of the impact. In our attempt to gauge the level of
unemployment, we tried to extract it from different sources, particularly from the NSS rounds. But we found that the NSS
series reports only for the state and not for a region. Hence for unemployment data for the Bellary region, we had collected
16 Basanth Kommadath & Binayak Rath
Impact Factor (JCC): 4.2234 Index Copernicus Value (ICV): 3.0
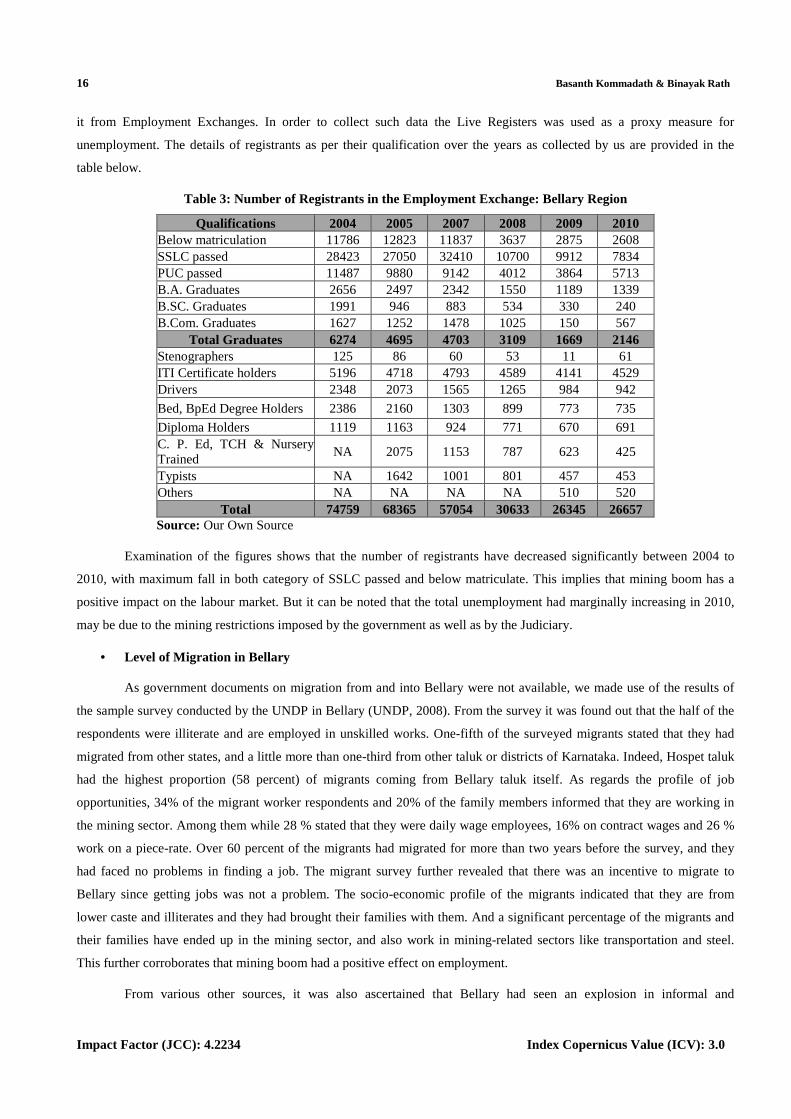
it from Employment Exchanges. In order to collect such data the Live Registers was used as a proxy measure for
unemployment. The details of registrants as per their qualification over the years as collected by us are provided in the
table below.
Table 3: Number of Registrants in the Employment Exchange: Bellary Region
Qualifications 2004 2005 2007 2008 2009 2010 Below matriculation 11786 12823 11837 3637 2875 2608 SSLC passed 28423 27050 32410 10700 9912 7834 PUC passed 11487 9880 9142 4012 3864 5713 B.A. Graduates 2656 2497 2342 1550 1189 1339 B.SC. Graduates 1991 946 883 534 330 240 B.Com. Graduates 1627 1252 1478 1025 150 567
Total Graduates 6274 4695 4703 3109 1669 2146 Stenographers 125 86 60 53 11 61 ITI Certificate holders 5196 4718 4793 4589 4141 4529 Drivers 2348 2073 1565 1265 984 942
Bed, BpEd Degree Holders 2386 2160 1303 899 773 735
Diploma Holders 1119 1163 924 771 670 691 C. P. Ed, TCH & Nursery Trained
NA 2075 1153 787 623 425
Typists NA 1642 1001 801 457 453 Others NA NA NA NA 510 520
Total 74759 68365 57054 30633 26345 26657 Source: Our Own Source
Examination of the figures shows that the number of registrants have decreased significantly between 2004 to
2010, with maximum fall in both category of SSLC passed and below matriculate. This implies that mining boom has a
positive impact on the labour market. But it can be noted that the total unemployment had marginally increasing in 2010,
may be due to the mining restrictions imposed by the government as well as by the Judiciary.
• Level of Migration in Bellary
As government documents on migration from and into Bellary were not available, we made use of the results of
the sample survey conducted by the UNDP in Bellary (UNDP, 2008). From the survey it was found out that the half of the
respondents were illiterate and are employed in unskilled works. One-fifth of the surveyed migrants stated that they had
migrated from other states, and a little more than one-third from other taluk or districts of Karnataka. Indeed, Hospet taluk
had the highest proportion (58 percent) of migrants coming from Bellary taluk itself. As regards the profile of job
opportunities, 34% of the migrant worker respondents and 20% of the family members informed that they are working in
the mining sector. Among them while 28 % stated that they were daily wage employees, 16% on contract wages and 26 %
work on a piece-rate. Over 60 percent of the migrants had migrated for more than two years before the survey, and they
had faced no problems in finding a job. The migrant survey further revealed that there was an incentive to migrate to
Bellary since getting jobs was not a problem. The socio-economic profile of the migrants indicated that they are from
lower caste and illiterates and they had brought their families with them. And a significant percentage of the migrants and
their families have ended up in the mining sector, and also work in mining-related sectors like transportation and steel.
This further corroborates that mining boom had a positive effect on employment.
From various other sources, it was also ascertained that Bellary had seen an explosion in informal and
Mining Boom, Structural Changes and the Dynamics of Labour 17 Market Transitions in Bellary Region of Karnataka
ww.tjprc.org [email protected]
unorganized sector employment including employment of women and children. But migrant workers have been the
mainstay of the employment growth during the boom period. However, growth of employment has been slow, and most of
the employment generated has been in the informal/unorganised sectors linked up with mines and mineral activities
including sectors like transportation and construction.
HOUSEHOLD IMPACT ASSESSMENT FROM THE FIELD SURVEY
As discussed earlier the iron ore mining belt of Bellary region of Karnataka was selected for the study because of
concentration of iron ore mining activity. This region which is spread in three taluks of Bellary, Hospet and Sandur of
Bellary district of Karnataka and a part of Anathpur district of Andhra Pradesh occupies an important place in the mineral
resource map of India. This entire belt is endowed with several surface iron ore and manganese ore mines of varying
qualities. Annual production of iron ore from different mines is varying from meagre production level at small mines to
few million tonnes at big mines. Lease areas of different mines are also varying from less than hundred hectares to more
than thousand hectares. In the entire area different clusters of mines are located depending on deposits of iron ore below
the surface.
In the above mentioned sections we have examined the regional level impact of the mining boom, however, to
verify those impacts at the micro level of the households, we had undertaken a primary survey of selected households of
few villages drawn from from each taluk of Bellary–Hospet–Sandur mining belt. The villages and households from each
taluk were chosen on the basis of intensity of mining activities, number of mines, distance to mines and area of mining.
Accordingly, we selected six sample villages systematically to ensure sufficient variation and representation of the diverse
characteristics of the entire mining belt. As such two villages were chosen from Hospet taluk, namely, Kallanahalli and
Rajapura, three from Sandur in which two villages, viz., Bavihalli and Ramgad near private mines and one village
Donamali nearer to the government owned mine of NMDC. The Bellary iron ore belt, though located in Karnataka, crosses
the state border and spreads in 200 hectares into Anantapur region of Andhra Pradesh. But this deposit lies in the Bellary
reserve forest. So we selected one village, Obulapuram from that area as this comes under the iron ore belt and also shares
the border of Bellary and Anantpur.
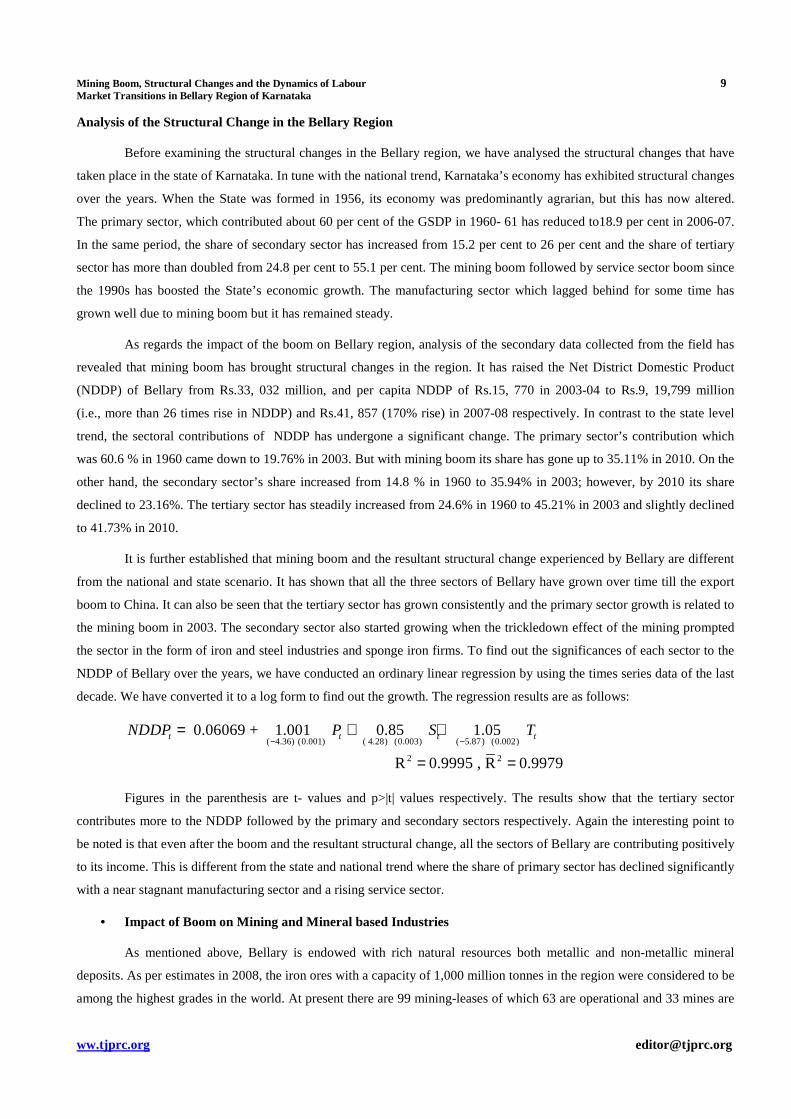
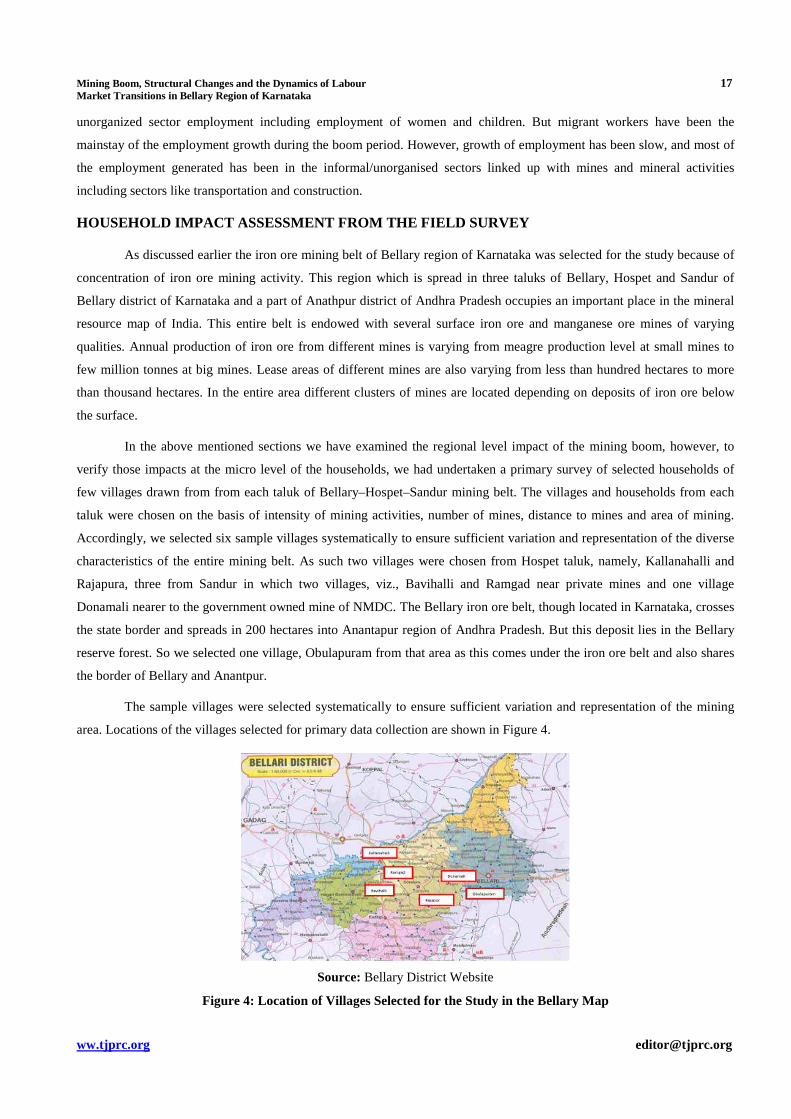
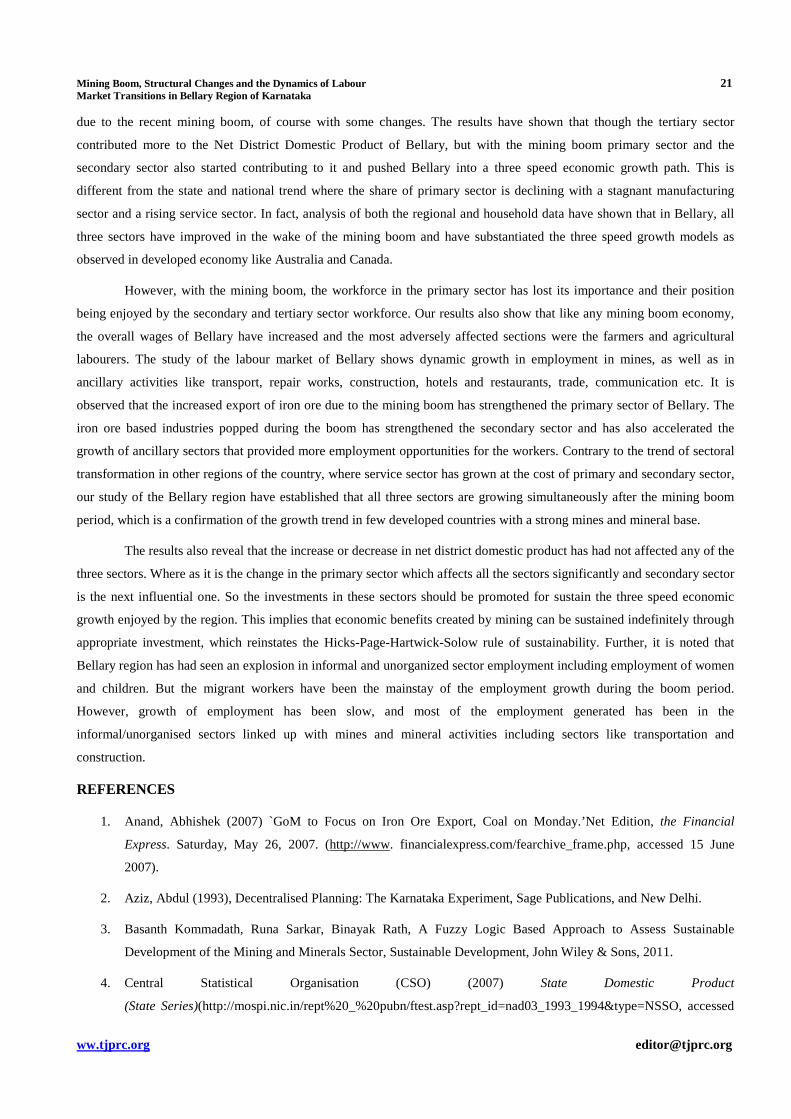
The sample villages were selected systematically to ensure sufficient variation and representation of the mining
area. Locations of the villages selected for primary data collection are shown in Figure 4.
Source: Bellary District Website
Figure 4: Location of Villages Selected for the Study in the Bellary Map
18 Basanth Kommadath & Binayak Rath
Impact Factor (JCC): 4.2234 Index Copernicus Value (ICV): 3.0
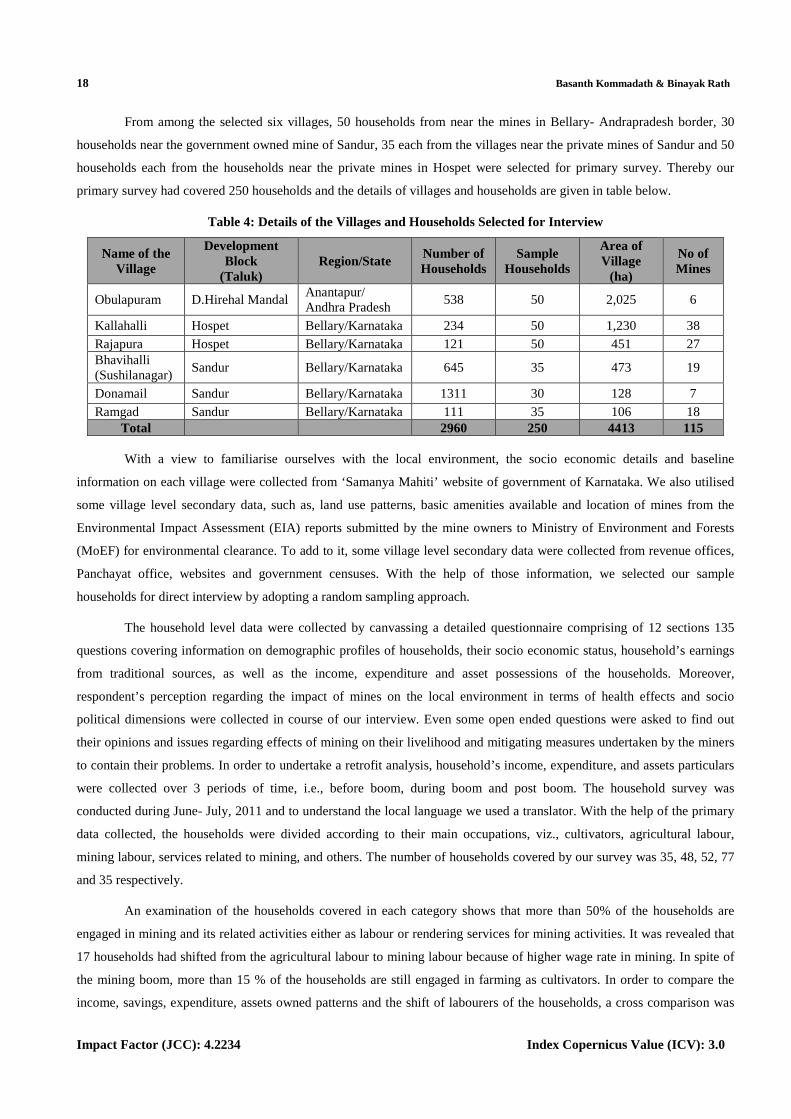
From among the selected six villages, 50 households from near the mines in Bellary- Andrapradesh border, 30
households near the government owned mine of Sandur, 35 each from the villages near the private mines of Sandur and 50
households each from the households near the private mines in Hospet were selected for primary survey. Thereby our
primary survey had covered 250 households and the details of villages and households are given in table below.
Table 4: Details of the Villages and Households Selected for Interview
Name of the Village
Development Block
(Taluk) Region/State
Number of Households
Sample Households
Area of Village
(ha)
No of Mines
Obulapuram D.Hirehal Mandal Anantapur/ Andhra Pradesh
538 50 2,025 6
Kallahalli Hospet Bellary/Karnataka 234 50 1,230 38 Rajapura Hospet Bellary/Karnataka 121 50 451 27 Bhavihalli (Sushilanagar)
Sandur Bellary/Karnataka 645 35 473 19
Donamail Sandur Bellary/Karnataka 1311 30 128 7 Ramgad Sandur Bellary/Karnataka 111 35 106 18
Total 2960 250 4413 115 With a view to familiarise ourselves with the local environment, the socio economic details and baseline
information on each village were collected from ‘Samanya Mahiti’ website of government of Karnataka. We also utilised
some village level secondary data, such as, land use patterns, basic amenities available and location of mines from the
Environmental Impact Assessment (EIA) reports submitted by the mine owners to Ministry of Environment and Forests
(MoEF) for environmental clearance. To add to it, some village level secondary data were collected from revenue offices,
Panchayat office, websites and government censuses. With the help of those information, we selected our sample
households for direct interview by adopting a random sampling approach.
The household level data were collected by canvassing a detailed questionnaire comprising of 12 sections 135
questions covering information on demographic profiles of households, their socio economic status, household’s earnings
from traditional sources, as well as the income, expenditure and asset possessions of the households. Moreover,
respondent’s perception regarding the impact of mines on the local environment in terms of health effects and socio
political dimensions were collected in course of our interview. Even some open ended questions were asked to find out
their opinions and issues regarding effects of mining on their livelihood and mitigating measures undertaken by the miners
to contain their problems. In order to undertake a retrofit analysis, household’s income, expenditure, and assets particulars
were collected over 3 periods of time, i.e., before boom, during boom and post boom. The household survey was
conducted during June- July, 2011 and to understand the local language we used a translator. With the help of the primary
data collected, the households were divided according to their main occupations, viz., cultivators, agricultural labour,
mining labour, services related to mining, and others. The number of households covered by our survey was 35, 48, 52, 77
and 35 respectively.
An examination of the households covered in each category shows that more than 50% of the households are
engaged in mining and its related activities either as labour or rendering services for mining activities. It was revealed that
17 households had shifted from the agricultural labour to mining labour because of higher wage rate in mining. In spite of
the mining boom, more than 15 % of the households are still engaged in farming as cultivators. In order to compare the
income, savings, expenditure, assets owned patterns and the shift of labourers of the households, a cross comparison was
Mining Boom, Structural Changes and the Dynamics of Labour 19 Market Transitions in Bellary Region of Karnataka
ww.tjprc.org [email protected]
undertaken among the cultivators, agricultural labours, mining labours, persons engaged in service sector and the other
workers across three periods, namely, before mining, during the boom period and the recent periods.
• Monthly Income Patterns of the Households:
After compilation of the primary data, we have drawn the trend in growth of monthly income of the households
according to their professions, which are given in the following table.
Table 5: Monthly Income of Households by their Occupation (Figures in Rupees)
Category of Households Before Boom
During Boom
Post Boom
Cultivators (CU) 5512 6337 6826 Agricultural labourers (AL) 2740 3281 2906 Mining labourers (ML) 2406 3632 1985 Service related to mining (SM) 3269 4922 2992 Others (OT) 3603 4441 3985
A cross examination of income of households according to their occupation when compared over the three
reference periods has revealed that the monthly income of all categories had gone up during the boom period with the
maximum gain for the mining labour and those engaged in services related to mining. Their monthly income had gone up
by more than 50% due to the boom. Even all other categories like cultivators, agricultural labours and others had gained in
terms of monthly income by 15%, 19.7% and 23.2% respectively during the boom period. This trend re-establishes the
three speed growth model in operation in the Bellary region. However, after the boom period, the monthly income of all
categories other than the cultivators has gone down. While the income of the cultivators has gone up by 8% in the post
boom period, the maximum fall of 45% has been observed for mining labour, followed by 35% decline for the service
related group of workers. Hence, it is established that those who had reaped maximum benefits of mining boom are those
who are adversely affected in the post boom period.
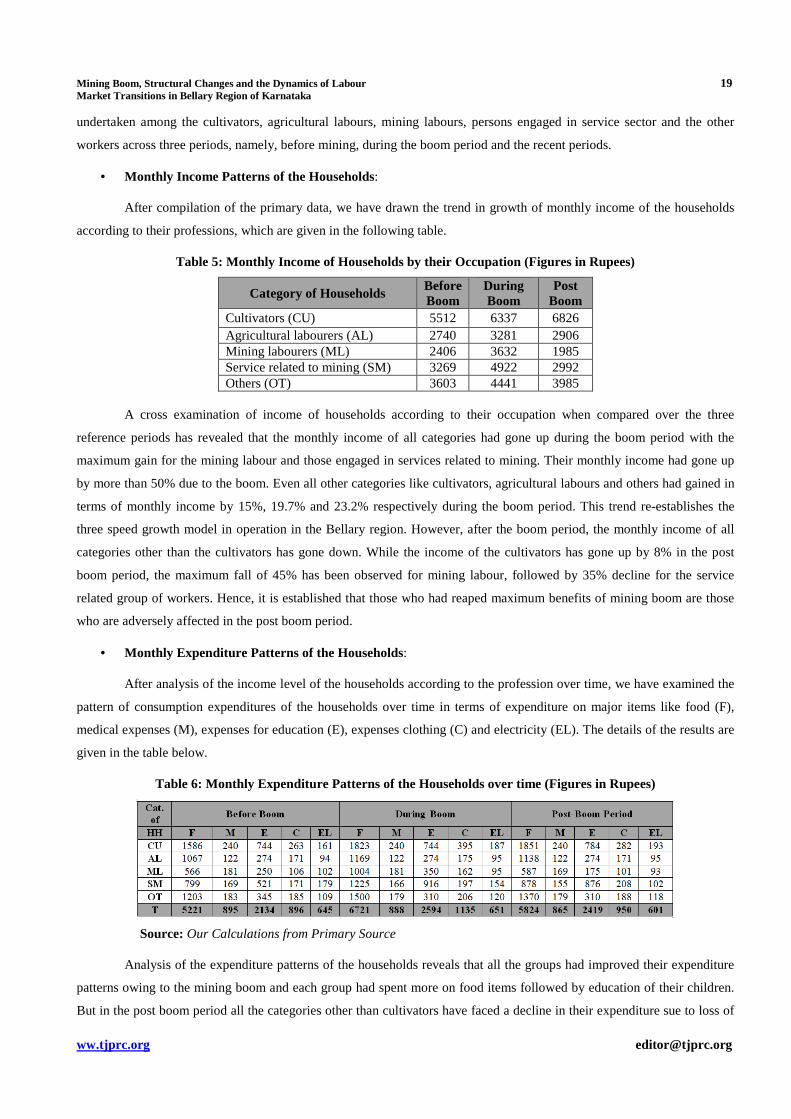
• Monthly Expenditure Patterns of the Households:
After analysis of the income level of the households according to the profession over time, we have examined the
pattern of consumption expenditures of the households over time in terms of expenditure on major items like food (F),
medical expenses (M), expenses for education (E), expenses clothing (C) and electricity (EL). The details of the results are
given in the table below.
Table 6: Monthly Expenditure Patterns of the Households over time (Figures in Rupees)
Source: Our Calculations from Primary Source
Analysis of the expenditure patterns of the households reveals that all the groups had improved their expenditure
patterns owing to the mining boom and each group had spent more on food items followed by education of their children.
But in the post boom period all the categories other than cultivators have faced a decline in their expenditure sue to loss of
20 Basanth Kommadath & Binayak Rath
Impact Factor (JCC): 4.2234 Index Copernicus Value (ICV): 3.0
their income. Thus, their standard of living has gone down. In fact, a maximum loss is noted in case of the mining labour
class and the service related mining workers.
It is also observed that most of the labour groups are spending major part of their income on food items and it
reconfirms the common trend of the subsistence living style of the agricultural labourers all aver the developing countries.
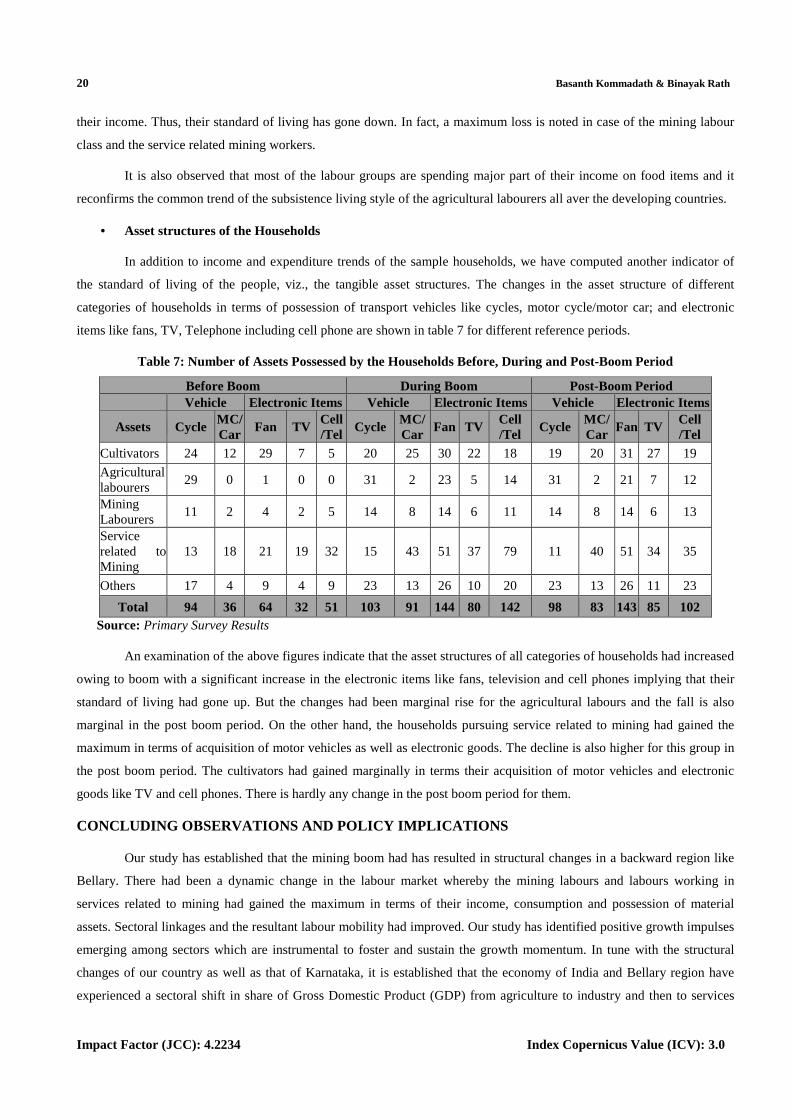
• Asset structures of the Households
In addition to income and expenditure trends of the sample households, we have computed another indicator of
the standard of living of the people, viz., the tangible asset structures. The changes in the asset structure of different
categories of households in terms of possession of transport vehicles like cycles, motor cycle/motor car; and electronic
items like fans, TV, Telephone including cell phone are shown in table 7 for different reference periods.
Table 7: Number of Assets Possessed by the Households Before, During and Post-Boom Period
Before Boom During Boom Post-Boom Period
Vehicle Electronic Items Vehicle Electronic Items Vehicle Electronic Items
Assets Cycle MC/Car
Fan TV Cell /Tel
Cycle MC/Car
Fan TV Cell /Tel
Cycle MC/Car
Fan TV Cell /Tel
Cultivators 24 12 29 7 5 20 25 30 22 18 19 20 31 27 19
Agricultural labourers
29 0 1 0 0 31 2 23 5 14 31 2 21 7 12
Mining Labourers
11 2 4 2 5 14 8 14 6 11 14 8 14 6 13
Service related to Mining
13 18 21 19 32 15 43 51 37 79 11 40 51 34 35
Others 17 4 9 4 9 23 13 26 10 20 23 13 26 11 23
Total 94 36 64 32 51 103 91 144 80 142 98 83 143 85 102 Source: Primary Survey Results
An examination of the above figures indicate that the asset structures of all categories of households had increased
owing to boom with a significant increase in the electronic items like fans, television and cell phones implying that their
standard of living had gone up. But the changes had been marginal rise for the agricultural labours and the fall is also
marginal in the post boom period. On the other hand, the households pursuing service related to mining had gained the
maximum in terms of acquisition of motor vehicles as well as electronic goods. The decline is also higher for this group in
the post boom period. The cultivators had gained marginally in terms their acquisition of motor vehicles and electronic
goods like TV and cell phones. There is hardly any change in the post boom period for them.
CONCLUDING OBSERVATIONS AND POLICY IMPLICATIONS
Our study has established that the mining boom had has resulted in structural changes in a backward region like
Bellary. There had been a dynamic change in the labour market whereby the mining labours and labours working in
services related to mining had gained the maximum in terms of their income, consumption and possession of material
assets. Sectoral linkages and the resultant labour mobility had improved. Our study has identified positive growth impulses
emerging among sectors which are instrumental to foster and sustain the growth momentum. In tune with the structural
changes of our country as well as that of Karnataka, it is established that the economy of India and Bellary region have
experienced a sectoral shift in share of Gross Domestic Product (GDP) from agriculture to industry and then to services
Mining Boom, Structural Changes and the Dynamics of Labour 21 Market Transitions in Bellary Region of Karnataka
ww.tjprc.org [email protected]
due to the recent mining boom, of course with some changes. The results have shown that though the tertiary sector
contributed more to the Net District Domestic Product of Bellary, but with the mining boom primary sector and the
secondary sector also started contributing to it and pushed Bellary into a three speed economic growth path. This is
different from the state and national trend where the share of primary sector is declining with a stagnant manufacturing
sector and a rising service sector. In fact, analysis of both the regional and household data have shown that in Bellary, all
three sectors have improved in the wake of the mining boom and have substantiated the three speed growth models as
observed in developed economy like Australia and Canada.
However, with the mining boom, the workforce in the primary sector has lost its importance and their position
being enjoyed by the secondary and tertiary sector workforce. Our results also show that like any mining boom economy,
the overall wages of Bellary have increased and the most adversely affected sections were the farmers and agricultural
labourers. The study of the labour market of Bellary shows dynamic growth in employment in mines, as well as in
ancillary activities like transport, repair works, construction, hotels and restaurants, trade, communication etc. It is
observed that the increased export of iron ore due to the mining boom has strengthened the primary sector of Bellary. The
iron ore based industries popped during the boom has strengthened the secondary sector and has also accelerated the
growth of ancillary sectors that provided more employment opportunities for the workers. Contrary to the trend of sectoral
transformation in other regions of the country, where service sector has grown at the cost of primary and secondary sector,
our study of the Bellary region have established that all three sectors are growing simultaneously after the mining boom
period, which is a confirmation of the growth trend in few developed countries with a strong mines and mineral base.
The results also reveal that the increase or decrease in net district domestic product has had not affected any of the
three sectors. Where as it is the change in the primary sector which affects all the sectors significantly and secondary sector
is the next influential one. So the investments in these sectors should be promoted for sustain the three speed economic
growth enjoyed by the region. This implies that economic benefits created by mining can be sustained indefinitely through
appropriate investment, which reinstates the Hicks-Page-Hartwick-Solow rule of sustainability. Further, it is noted that
Bellary region has had seen an explosion in informal and unorganized sector employment including employment of women
and children. But the migrant workers have been the mainstay of the employment growth during the boom period.
However, growth of employment has been slow, and most of the employment generated has been in the
informal/unorganised sectors linked up with mines and mineral activities including sectors like transportation and
construction.
REFERENCES
1. Anand, Abhishek (2007) `GoM to Focus on Iron Ore Export, Coal on Monday.’Net Edition, the Financial
Express. Saturday, May 26, 2007. (http://www. financialexpress.com/fearchive_frame.php, accessed 15 June
2007).
2. Aziz, Abdul (1993), Decentralised Planning: The Karnataka Experiment, Sage Publications, and New Delhi.
3. Basanth Kommadath, Runa Sarkar, Binayak Rath, A Fuzzy Logic Based Approach to Assess Sustainable
Development of the Mining and Minerals Sector, Sustainable Development, John Wiley & Sons, 2011.
4. Central Statistical Organisation (CSO) (2007) State Domestic Product
(State Series)(http://mospi.nic.in/rept%20_%20pubn/ftest.asp?rept_id=nad03_1993_1994&type=NSSO, accessed
22 Basanth Kommadath & Binayak Rath
Impact Factor (JCC): 4.2234 Index Copernicus Value (ICV): 3.0
1 May 2007).
5. Corden, W. M. and Neary, J. P. (1982), "Booming Sector and De industrialisation in a Small Open Economy",
Economic Journal 92 (December), 825-48.
6. Directorate of Economics and Statistics, Agricultural Census: Karnataka 2001, 2003, Bangalore.
7. Directorate of Economics and Statistics, an Economic-cum-Purpose Classification of the Karnataka Government
Budget 2000-01, Bangalore.
8. Directorate of Economics and Statistics, State Domestic Product 1993-2007, Bangalore.
9. District Census Handbook, 2001, Bellary.
10. District Industrial Development Plan 2006-11- Bellary district, Department of Industries & Commerce,
Bangalore, 2007.
11. Economic Census in Karnataka, Directorate of economics & statistics Bangalore, Karnataka, 2005 Master Plan
(Revision-I)-2021 (Provisional) Bellary-Sandur Local Planning Area.
12. Fargher, J.D., Howard, B.M., Burnside, D.G. and Andrew, M.H. (2003) the economy of Australia’s
rangelands – myth or mystery? The Rangeland Journal, 25(2), pp. 140-156.Fertility from India’s 2001 Census’
Economic and Political Weekly 37(7): 655-672.
13. Fisher, A.G.B. (1935) the Clash of Progress and Security. London: MacMillan & Co. Ltd.
14. Government of India (2006), Karnataka Administrative Atlas: Census of India 2001, Directorate of Census
Operations, Karnataka, Bangalore.
15. Government of Karnataka (GoK) (1999) Human Development in Karnataka 1999, Planning Department,
Government of Karnataka, Bangalore.
16. Government of Karnataka (GoK) (2002) High Power Committee for the Redressal of Regional Imbalances: Final
Report, Government of Karnataka, Bangalore.
17. Government of Karnataka (GoK) (2004) `Mining and Quarrying’ in State of the Environment Report 2003,
Department of Ecology and Environment, Bangalore.
18. Government of Karnataka (GoK) (2005) Economic Survey 2004-05. Department of Edition, Tuesday, March 28,
2006, Bangalore. (http://www.hindu.com/2006/03/28/
19. Government of Karnataka (GoK) (2006) Karnataka Human Development Report 2005, Planning and Statistics
Department, Government of Karnataka, Bangalore.
20. Indian Bureau of Mines (IBM) (1999) Indian Minerals Yearbook 1998 and 1999. Controller General, Indian
Bureau of Mines, Nagpur.
21. Indian Bureau of Mines (IBM) (2005) Indian Minerals Yearbook 2004, Controller General, Indian Bureau of
Mines, Nagpur.
22. Indian Bureau of Mines (IBM) (2006) Indian Minerals Yearbook 2005, Controller General, Indian Bureau of
Mining Boom, Structural Changes and the Dynamics of Labour 23 Market Transitions in Bellary Region of Karnataka
ww.tjprc.org [email protected]
Mines, Nagpur.
23. Indian Bureau of Mines, Annual Report, 2008 – IBM
24. Iyengar N S, M.B Nanjappa and P Sudarshan (1981), a note on Inter District Differentials in Karnataka
Development, Journal of Income and Wealth, Vol 15(1), pp79-83.
25. Karnataka Human Development Report 2005,Planning and Statistics Department
26. Koutsoyiannis, 1996. The theory of Econometrics. Macmillan Press Ltd. Great Britain
27. Kuznets, Simon. (1957). `Quantitative Aspects of the Economic Growth of Nations: Industrial Distribution of
National Product and Labor Force', Journal of Development Economic and Cultural Change 5(4).
28. Kuznets, Simon. (1966), Modern Economic Growth, Yale University Press, New Haven.
29. Kuznets, Simon. (1971), Economic Growth of Nations, Harvard University Press, Cambridge. London:
MacMillan & Co. Ltd.
30. Mahila Samakhya-Karnataka (2002) Vulnerabilities of Young Women to STIs / HIV in Bellary District,
Karnataka: A District Situation Assessment. Draft (2) for discussion. MSK, Bangalore.
31. Ministry of Mines (2004) National Mineral Policy 1993. (http://mines.nic.in/nmp.html, accessed, 2 August 2007)
32. Mrugai, Rinku, M H Suryanarayana and Salman Zaidi (2003) “Measuring Poverty in Karnataka: The Regional
Dimension.” Economic and Political Weekly 38(4): 404- 408.
33. Planning and Statistics Department, “Inter-State Economic Indicators”, Plan Finance and Resource division,
Bangalore.
34. Planning and Statistics Department, Human Development in Karnataka 1999, Bangalore
35. Planning and Statistics Department, Women In Karnataka, Manpower and Employment Division, Bangalore,
March 2002.
36. Planning Commission (2002) National Human Development Report 2001. New Delhi.
37. Planning Commission (2006) National Mineral Policy: Report of the High Level Committee.
38. Planning Commission (2007) Karnataka Development Report. Academic Foundation, New Delhi.
39. Registrar General of India (1991) Census of India 1991, Primary Census Abstract RGI, New Delhi.
40. Registrar General of India, Census of India 2001: Final Population Totals: Karnataka, Director of Census of
Operations, 2004, Karnataka, Bangalore.
41. Registrar General of India, Census of India, 1981, New Delhi.
42. Registrar General of India, Census of India, 1991, New Delhi.
43. Registrar General of India, Census of India, 2001, New Delhi.
44. Registrar General of India, Sample Registration System Bulletin, Volume 31 No.1, New Delhi, 2005.
24 Basanth Kommadath & Binayak Rath
Impact Factor (JCC): 4.2234 Index Copernicus Value (ICV): 3.0
45. Stephen Broadberry. ... A Sectoral Analysis of Comparative Productivity Levels, 1870-1990”, Journal of
Economic History, 58 (1998): 375-407.
46. The Times of India (2006) `Illegal Mining under Control in Bellary.’ The Times of India, Bangalore.
(http://timesofindia.indiatimes.com/articleshow/1827024.cms, accessed 23 July 2007).
47. Women Mineworkers in Bellary District: A Case Study of the Vulnerable Groups of Mineworkers in Southwest
India (www.asmasiapacific.org /download_file.php?uid=98