Multifidelity Design Optimization of Low-Boom Supersonic Jets
Upload
khangminh22Category
view
0download
0
Before and After the BoomEstonian Housing Market
: Changes in the
ANGELIKA KALLAKMAA-KAPSTA
P R E S S
THESIS ON ECONOMICS H32

Dissertation was accepted for the defence of the degree of Doctor of Philosophy inEconomics on February 27, 2013.
Supervisor:
Opponents:
Defence of the thesis:
Prof. Em. Ene Kolbre, PhDTallinn School of Economics and Business Administration,Tallinn University of Technology, Estonia
Prof. Paddy Gray, PhD,University of Ulster, Belfast
Prof. Toomas Haldma, PhD,Faculty of Economics and Business Administration,University of Tartu, Estonia
April 4, 2013
Declaration:Hereby I declare that this doctoral thesis, my original investigation and achievement,submitted for the doctoral degree at Tallinn University of Technology has not beensubmitted for any academic degree.
/Angelika Kallakmaa-Kapsta/
(publication)(PDF)
Copyright: Angelika Kallakmaa-Kapsta, 2013ISSN 1406-4782ISBN 978-9949-23-442-4ISBN 978-9949-23-443-1
TALLINN UNIVERSITY OF TECHNOLOGYTallinn School of Economics and Business Administration
Department of Business Administration
MAJANDUS H32
Muutused Eesti eluasemeturulenne ja pärast buumi
ANGELIKA KALLAKMAA-KAPSTA


5
Contents INTRODUCTION ..................................................................................................... 6 Abbreviations .......................................................................................................... 12 Symbols ................................................................................................................... 13 1. THEORY AND LITERARY OVERVIEW ........................................................ 14
1.1. Housing market development ...................................................................... 14 1.2. Housing affordability ................................................................................... 16 1.3. Quality of housing ....................................................................................... 18
2. METHODOLOGY .............................................................................................. 21 2.1. Market analysis ............................................................................................ 21 2.2. Housing affordability and regulatory framework ........................................ 24 2.3 Assessment of housing quality ...................................................................... 26 2.4 The main aspects and methods ..................................................................... 27
3. RESULTS AND IMPLICATIONS ..................................................................... 29 3.1. Housing market development in Estonia ..................................................... 29 3.2. Housing affordability in Estonia .................................................................. 31 3.3. Housing quality and hierarchy of quality factors ......................................... 35
4. CONCLUSIONS ................................................................................................. 37 REFERENCES ........................................................................................................ 41 ABSTRACT ............................................................................................................ 55 KOKKUVÕTE ........................................................................................................ 57 Curriculum Vitae ..................................................................................................... 61 Elulookirjeldus ........................................................................................................ 66 Appendix 1 Living space per capita m² ................................................................... 71 Appendix 2 Estonian Housing Market: Searching for Origins of the Boom ......... 72 Appendix 3 Estonian housing market: affordability problem and regulatory framework ............................................................................................................... 92 Appendix 4 Real Estate Quality Assessment for Valuation in the Estonian Real Estate Market ........................................................................................................ 115

6
"The measurement of house prices poses significant conceptual and practical problems, mainly because dwellings are heterogeneous assets whose prices can only be observed when they are sold”
(Wood, 2005)
INTRODUCTION A house is the largest single asset of most households, and assets whose value is linked to residential real estate represent an important component of the aggregate portfolio of financial intermediaries (Tsatsaronis and Zhu, 2004). For most households the house itself is the main part of their wealth and is usually mortgage related. Changes in housing prices have essential effects for households (Campbell, 2006) and their financial behaviour. A sharp rise in prices can generate a situation where households may get affordability problems. During housing boom times first buyers commonly cannot afford a new home and on account of this it is very important to investigate the reasons of housing booms. The Estonian housing market has a short, but already remarkable history with skyrocketing housing prices, a housing bust period and a slowdown in recent years. These rapid changes have a serious effect on the housing demand, especially on housing affordability and also housing quality issues. A housing boom is deeply related with mortgage lending (Duca, et al., 2012; Muellbauer, 2010) and rapid growth of household debt level. On the macroeconomic level the bust of the housing bubble can reveal a reallocation of resources, unemployment and economic recessions. How to evaluate the signs of the creation of housing booms – why and how do they arise? How to define housing affordability and are there any possibilities to avoid the boom situations? These questions are important for households, the financial sector and the real estate sector, but also for the public sector, which is responsible for the regulatory framework creation. Research regarding housing booms and busts has become a topicality in the recent decades. Nevertheless there continues to be significant gaps in understanding the reasons why boom situations initiate and insufficient analyses of their consequences and impacts. The literature is mostly focused on situations in advanced economies (Case and Schiller, 2003; Bordo, 2003; Muellbauer and Murphy, 1997; Burnside et al., 2011; Gabriel et al., 2005; Belsky et al., 2005; Whitehead, 1991; Maclennan and Gibb, 1993; Duca et al., 2012; Tang, 2012 etc.), leaving a shortage in studies that analyse emerging markets. There is very little academic research about the Estonian housing market (Lamine, 2009; Balàzs and Dubravko, 2007). However, the problems with data availability and too short time series are common for all CEE countries. Widely used methodologies for researching housing market movements are not usable for such situations and it explains the simplified approach in researching emerging markets (Igan and Loungani, 2012; Krušinskas, 2012).

7
Kolbre and Kallakmaa (2006) analysed the housing market development and changes in the Estonian economic environment, also the factors that are influencing the housing market from demand and also from the supply side, compared with those of Latvia and Lithuania, two countries with similar historical backgrounds as Estonia. They found that methods used in analysing the economies in advanced markets are not suitable to allow them to be used in housing market analysis where an owners’ market prevails as the result of privatizing households. There is a need to fill the gap in emerged market academic writings; as the historical background and economical development in these markets are different from advanced economies. The purpose of the current Doctoral Thesis is to assess from various aspects the Estonian housing market development with an aim to identify whether, and to what extent, the ratios and models used for real estate market analyses in developed countries can be used in transition economies – and if necessary, adjust them according to the Estonian housing market conditions. The housing market developments are investigated in this study from three main aspects. First, to find an answer whether large increases in price in the housing market can be defined as a housing boom and what kind of factors have held the most significant influence to the average price of housing in Estonia. The housing market’s developments before the housing boom and after the bubble was burst were assessed (based on the first article “Estonian Housing Market: Searching for Origins of the boom”, Appendix 2). Secondly, to find out how to evaluate affordability of housing in the Estonian market and how to assess the regulatory framework decisions’ impact on the housing market in Estonia. Questions have been raised on what kind of indicators can be used to monitor the affordability situation while taking into consideration the problem with data availability (based on the second article “Estonian housing market: affordability problem and regulatory framework”, Appendix 3). Thirdly, the thesis seeks to address the following questions: whether and to what extent real estate valuers attach importance to real estate quality assessment, how does the valuers’ new quality rating system meet their needs, and what is the hierarchy of the factors influencing the quality grade and changes in hierarchy factors after a housing boom (based on the third article “Real Estate Quality Assessment for Valuation in the Estonian Real Estate Market”, Appendix 4). The contribution of this Doctoral Thesis in theoretical and practical terms lies in the following. Theoretical value – according to the author’s knowledge there is no previous research in this field about the Estonian housing market cyclical development, affordability problems and quality issues. Different methods used by housing market researches analysing the well-developed markets are often not appropriate for researching emerged economy markets. This thesis offers

8
possible solutions on how to elaborate and adapt frequently used methodologies (e.g. Poterba model, Tobin q, P/E – ratio, P/I - ratio etc.) for investigating developing housing markets using the Estonian market as an example. The practical and methodological problems identified in the paper might be interesting for people studying similar issues in other emerging markets. This thesis also provides new approaches for researching the housing market movements in Estonia. A housing affordability index (HAI), constructed by the author, is a new methodological tool for investigating the affordability situation in the Estonian market. The proposed index is also suitable for assessing other markets’ affordability situations from a credit repayment capability aspect. This thesis is focused on the Estonian housing market, but the developed methodologies and proposed new methodological tools enable to research other housing markets, where there is a high level of owners, underdeveloped rental market and problems with data availability. Practical value – the housing affordability index (HAI), previously mentioned, is new for the Estonian market, also the use of aggregated loan to value (LTV) - ratio. By using these proposed methods and by regular monitoring it is possible to make economical and political decisions. A new Estonian real estate quality rating system was worked out, which is applicable for the real estate valuation process according to: Property Valuation Standard in Estonia (EVS 875). The Estonian government has made many decisions that have influenced the real estate market, especially the housing market, mostly with the purpose to improve accesses to the housing market. But no research has been done in trying to find an answer for the affordability problem in the housing market in Estonia, nor to assess the impact of the regulatory framework. The method worked out by the author is possible to use for future market monitoring and the proposed method can be used for assessing other markets affordability situations. The paper is structured as follows. The first section presents the literature overview, which is divided into the three main research aspects. The second section introduces commonly used methodologies for analysing housing markets and suggests methods for investigating Estonian market dynamics, for evaluating the housing affordability situations and also quality issues. The third part presents the results of the three investigated topics. Finally the summary concludes the main results of this thesis. The thesis is based on three academic papers. All papers are co-authored. 1. Kolbre, E.; Kallakmaa-Kapsta, A.; Ojala, T. (2009). Estonian Housing Market: Searching for Origins of the boom. Research in Economics and Business: Central and Eastern Europe, 1(2), 59 – 76 (Published, ETIS 1.2). 2. Kallakmaa-Kapsta, A.; Kolbre, E. (2013). Estonian housing market: affordability problem and regulatory framework, International Journal of Housing Markets and Analysis, Emerald Housing, Volume 6, Issue 2 (Forthcoming, accepted, ETIS 1.2).

9
3. Kolbre, E.; Kallakmaa-Kapsta, A.; Ilsjan, V. (2011). Real Estate Quality Assessment for Valuation in the Estonian Real Estate Market. G. Prause (Ed.). University-Business Cooperation. (63). Berlin: Beriner Wissenschafts-Verlag (Published, ETIS 3.1). Author’s contribution Paper 1. The author of this thesis defined the framework of the economic assessment based on scientific literature. The author of this thesis organised data collection and made the calculations. Paper 2. The author of this thesis designed an assessment method of affordability (housing affordability index) based on theoretical literature and made the calculations and also the overview of recent regulatory framework and policies and proposed using LTV ratio. The author was responsible for writing the manuscript. Paper 3. The author carried out a literary overview. The author of this thesis took active part in the preparation of the questionnaire and analysis process and implementation of research results about the final evaluation of hierarchy factors. Overview of the approval of research results 1. The results of the research about Baltic housing market development were presented by the author at the Scientific Conference ERES 2006 in Weimar “Housing market development in Estonia: is the real estate boom expected”. 2. Early version of research paper about Estonian housing market movements was presented by the author at the scientific seminar in Tallinn University of Technology April of 11, 2007, Tallinn. 3. The research paper about Estonian housing market quantitative and qualitative analyses were presented by author at the Scientific Conference ERES 2007 in London. 4. The paper „Estonian Real Estate Market – The Day after Housing boom“ was presented by author at the 16th Annual European Real Estate Society Conference ERES 2009 July Stockholm. 5. The results of the research paper “Real Estate Quality Assessment Problems In The Estonian Real Estate Market“ co-authored with Prof. Kolbre were presented at the Scientific Conference ERES 2010, June, Milan. 6. The research paper "Estonian Housing Market - Before Euro Adoption" was presented by the author at the Scientific Conference ERES 2010, June, Milan. 7. The paper about “Lessons from housing boom in Estonia” was presented by author (as invited speaker) at the scientific conference „Macroeconomic risks resulting from massive foreign exchange lending to household sector” in Warszawa, 20.October 2010.

10
8. The survey results about the paper “What kind of demands does a new real estate growth make on real estate quality in Estonia?” were presented by co-author Prof. Kolbre at the 18th Annual Conference ERES 2011, Eindhoven (Netherlands). 9. The results of the research paper “Estonian housing market: affordability problem and regulatory framework” were presented by the author at the 18th Annual Conference ERES 2011, Eindhoven (Netherlands). 10. The results of the research about Estonian housing market development (“Estonian housing market: after housing boom“) were presented by the author at the 55th IFHP World Congress “The impact of housing and planning on the economic environment” 2011, Tallinn. 11. The results of the research about housing affordability in Estonia were presented by author at scientific seminar in Tallinn University of Technology April, 2012. 12. The results of the research paper “Estonian housing market after crisis: Searching for Origins of the demand Changes” were presented with co-author at the 19th Annual Conference ERES 2012, 13th-16th June 2012 in Edinburgh, Scotland.

11
Acknowledgments The author is grateful to:
• Professor Ene Kolbre, thesis supervisor, for support and excellent cooperation.
• Professor Kaie Kerem, Head of Department of Finance and Economics.
• Professor Urve Venesaar and participants of research seminars for useful feedback.
• Professor Jaan Alver for useful feedback. • Anonymous referees appointed by “International Journal of Housing
Markets and Analysis”, especially for specific comments from one of the referees.
• ERES PhD Committee. • My family for their support - my husband Veikko and my daughter
Katrina. I appreciate their profound understanding and support that helped me to reach the set goal.
• All other persons whose bigger and smaller efforts have contributed to the final outcome.

12
Abbreviations AHP – Analytic Hierarchy Process AHURI – Australian Housing and Urban Research Institute AML – average mortgage loan BREEAM – Building Research Establishment Environmental Assessment Method CASBEE – Comprehensive Assessment System for Built Environment Efficiency CEE – Central and Eastern Europe DGNB – Deutsche Gesellschaft für Nachhaltiges Bauen ERES – European Real Estate Society EVS 875 – Property Valuation Standard in Estonia EVS 875-10:2008 – Property valuation Part: Inspection of Property and Data Collection HAI – Housing affordability index IFHP – International Federation of Housing and Planning HOI – Wells Fargo Housing Opportunity Index HIA – Housing industries association limited (HIA-Commonwealth Bank Housing Affordability Index) LEED – Leadership in Energy and Environmental Design LTV – Loan to value ratio NAR – National Association of Realtors NBER – The National Bureau of Economic Research PaM – European Property and Market Rating P/I – Price to Income ratio P/E – Price to Earnings ratio PRICEA – average purchase –sale price of 2-room apartments EEK/m2 in Tallinn PSV – average purchase –sale value of dwellings RICS – The Royal Institution of Chartered Surveyors sqm – square meter TEGoVA – The European Group of Valuers Association UC – user cost

13
Symbols cg – expected capital gains I – average full time income i – interest rate m – mortgage rate MR – average mortgage N – population P, PH – housing price Qd – housing demand QS – housing supply R – rental price V – market value of housing W – wealth Wn – annual net wages Y – income Өd – other demand shifters ӨS – other supply shifters τ, τy – income tax τp – property taxes δ – depreciation costs π – inflation rate

14
1. THEORY AND LITERARY OVERVIEW Housing is an unusual good in three dimensions: heterogeneity, durability, and immobility (Kiel and Zabel, 2004). Heterogeneity - two houses are never exactly the same, there are many characteristics (number of rooms, facilities, neighbours etc.) and each house is a unique combination of them. Each house stands on the market for a long time and is not a movable asset. The first chapter gives an overview of the literature in housing market development analysis, affordability and quality issues.
1.1. Housing market development
Research in the real estate market, including the housing market, has been topical for a long time. The studies have covered the impact of the economic environment on demand and supply and on real estate value in old, developed real estate markets (e.g. Gallin, 2006; Maclennan and Gibb, 1993) and in recent years also in new CEE markets (Kucharska-Stasiak and Matysiak, 2004; Balázs and Dubravko, 2007; etc). Tobin’s q concept has often been used to analyse supply and long-term changes in housing markets (Barot and Yang, 2002; Malpezzi, 1999; Mayes, 1979; Meen, 2001; etc.), as well as in real estate related studies (Schulz and Werwatz, 2005). Market studies rely mostly on two analytical techniques: 1) bringing out development trends, analysing the factors affecting it and projecting trends for the future (Garratt, 2001; Case and Shiller, 2003; Gallin, 2006; Adair et al., 2009) and 2) using econometric models. Econometric models are widely used in large and well-developed real estate markets such as the USA (Kohn and Bryant, 2010) and the UK (Muellbauer and Murphy, 1997; Baddeley, 2005). These models are mainly used to investigate the demand side; as it is complicated to build a model for the supply side because of the secondary residential market (Leishman, 2003). For the Estonian real estate market the use of econometric models is limited by the short history of the real estate market. Terms like “boom” and “bubble” are often used to characterise the situation prevailing in the market. One of the authors most frequently referred to when defining the term “bubble” is Charles Poor Kindleberger. Kindleberger (1987) defines a bubble as a sharp increase in real estate prices that result from the expectations of a further price rise, thus making the property more tempting to new purchasers (especially speculators), who are hoping to cash in on the rise. According to Camerer (1989), a bubble is an object that is growing until it bursts. Garber (2000) reckons that a bubble is a part of asset price dynamics that cannot be explained by key indicators. The term ‘‘housing bubble’’ is widely used but rarely clearly defined (Case and Shiller, 2003). French (2006) agrees, admitting that a bubble is a situation where it is impossible to fully explain the changes in some prices by means of economic

15
indicators. Bubbles tend to burst at some point and bring about greater problems. Usually, bubbles have a negative after-effect on the economy. Skyrocketing economic growth, increasing money supply, low interest rates and easy credit conditions has led to credit boom in Estonia. During good times agents get careless and take too high risks. A “Minsky moment” (Minsky, 1992) is the economic phenomenon that occurs when over-indebted investors are forced to sell good assets to pay back their loans. The “Minsky moment” arrives, when over-indebted investors are forced to sell their investments to make good on their loans, sparking sharp declines in financial markets (Lahart, 2007). Recessions associated with credit crunches and house price busts appear to be deeper and last longer than other recessions do. The durations of credit crunches and house price busts tend to be longer than those of typical recessions, while the dynamics of the main components of domestic absorption around these events are similar to those observed during recessions. In terms of their impact on investment and the unemployment rate, credit crunches and house price busts are more costly than equity price busts are, and equity price busts appear to be less consistently associated with real sector outcomes (Claessens et al., 2008). The problems of housing boom and burst of the bubble have been analysed by Muellbauer and Murphy (1997), Bordo (2003), Angell and Williams (2005), Helbing (2005), Hilbers et al. (2001) among many others. One can find many ways to define a “housing boom” in literature. Angell and Williams (2005) define a housing boom as a “30% or greater increase in inflation adjusted home prices during any three-year period.” Some booms in housing prices are followed by busts. Others are not. In either case it is difficult to find observable fundamentals that are correlated with price movements. Harrison and Kreps (1978), Scheinkman and Xiong (2003), Acemoglu, Chernozhukov and Yildiz (2007) and Geanakoplos (2010) found that agents in our economy have heterogeneous beliefs about fundamentals. Some agents believe that housing fundamentals will improve while others do not. Agents have heterogeneous expectations about long-run fundamentals, but change their views because of “social dynamics”. Agents meet randomly and those with tighter priors are more likely to convert other agents to their beliefs (Burnside et al., 2011). Boom-bust episodes are pervasive in housing markets. They occur in different countries and in different time periods. These episodes are hard to understand from the perspective of conventional models in which agents have homogeneous expectations (Burnside et al., 2011). According to Minsky (1992) asset bubbles are driven by credit cycles. In his view periods of economic and financial stability lead to a lowering of investors’ risk aversion and a process of releveraging. Investors start to borrow excessively and push up asset prices excessively high. The other problem pointed by Minsky is the loosening of credit standards during the credit boom time.

16
Real estate cycles may occur without a banking crisis. And banking crises may occur without real estate cycles, but these two phenomena are correlated (Herring and Wacter, 1999). Real estate prices are very cycle-sensitive and it is difficult for banks to follow more prudent policies during an economic upturn, especially in a highly competitive environment. The supervisory pressure on banks seems also to be procyclical. Episodes of credit crunches, house price and equity price busts last much longer than recessions do. For example, a credit crunch episode typically lasts two-and-a-half years and is associated with nearly a 20 percent decline in credit. A housing bust tends to persist even longer – four-and-a-half years with a 30 percent fall in real house prices (Claessens et al., 2008). Booms and busts can be generated by assuming that agents first receive increasingly positive signals about future fundamentals and then increasingly negative signals. But the problem with this approach is that for many episodes it is difficult to find observable fundamentals that are correlated with house price movements. Glaeser and Gyourko (2006) argue that it is difficult to explain the large changes in housing prices over time with changes in incomes, amenities or interest rates. A considerable amount of literature has been published about housing market research and the literature gives many approaches and methods on how to investigate the housing market movements in advanced economies, but in the case of Estonia we can see a fast growing emerging market with a very short history. Taking into account the Estonian historical background and the problems with data availability there is a need to adapt commonly used methodologies.
1.2. Housing affordability The term “housing affordability” has come into popular usage in the last two decades, replacing “housing need”, and is at the centre of debate regarding the provision of adequate housing for all (Whitehead, 1991; Swartz and Miller, 2002). Affordability’ is connected with securing some given standard of housing (or different standards) at a price or rent that does not impose, in the eyes of a third party (usually the government), an unreasonable burden on household incomes (Maclennan and Williams,1990). Housing affordability issues are well researched in Australia (Gabriel et al., 2005; Yates, 2007; Berry, 2006; Wood et al., 2005 etc.), in the USA (Belsky et al., 2005; Jewkes et al., 2010 etc.) and in the UK (Gibb, 2011; Gurran and Whitehead, 2011 etc.). According to Mostafa et al. (2006) housing affordability is a condition when people have the potential to save a certain portion of their income to buy a house, as well as to pay other expenditures in their working period.

17
Decisions of policymakers also have considerable influence on the housing market, but sometimes this impact can also be indisposed. Abelson (2009) found that “the Australian government's proposed national housing and rental affordability funds were poorly defined and likely to be ineffective”. Increasing concerns over rising levels of homelessness, housing costs, mortgage defaults and foreclosures, the trap of ‘negative equity’ experienced by households, declining neighbourhoods, and over-heated housing markets have concertedly pushed housing affordability into the centre of the housing policy discourse since the early 1990s (Ndubueze, 2007). The housing affordability is an endemic and structural problem that will not be improved without adjustments to existing policies and additional action by governments at all levels (Yates and Milligan, 2007). Housing is defined as affordable if households can both pay for adequate accommodation and afford the other necessities of life. Affordability therefore depends not only on rents and incomes, but also on the benefit system and housing standards (Marshall et al., 2000). The housing affordability problem for renters has been largely income-driven; were as, for owners changes in affordability have been related to changes in mortgage costs (Kutty, 2007). Freeman et al. (1997) asserted that housing affordability concentrates on the relationship between housing expenditure and household income and defines a (relative or absolute) standard in terms of that income above which housing is regarded as unaffordable. The concept of housing affordability cannot and should not be analysed by using one concept, measure or definition (McCord et al., 2011). It will not be possible to incorporate all relevant concerns in simple affordability measures (Gabriel et al., 2005). Some measures of housing affordability are based on whether or not a household can qualify for a mortgage (Linneman and Megbolugbe, 1992), because without a mortgage as leverage most households could not be able to purchase a house (Jewkes et al., 2010). Affordability considers not just housing, but also what quality of housing that is consumed and whether the household has enough income remaining for other necessities of life after offsetting their housing cost (Ndubueze, 2007). The distribution of housing prices, the distribution of housing quality, the distribution of income, the ability of households to borrow, public policies affecting housing markets, conditions affecting the supply of new or refurbished housing and the choices that people make about how much housing to consume relative to other goods. This mixture of issues raises difficulties in interpreting even basic facts about housing affordability (Quigley and Raphael, 2004). On the one hand, we can see purchase affordability, which considers whether a household is able to borrow enough funds to purchase a house. On the other hand of affordability, there is the repayment affordability, which considers the burden imposed on a household of repaying the mortgage. Gan and Hill (2008) found that there is a distinction between purchase and repayment affordability. By studying the Sydney prime mortgage market from 1996 to 2006, they showed that "repayment affordability deteriorated very

18
significantly while purchase affordability remained quite stable". The disparity was linked to the possible role relaxed mortgage market credit constraints had on driving up house prices. The experience of other countries reveals that the availability of financing is the critical factor for the housing market. Credit availability and credit conditions are effecting housing market price movements. Credit is also a major and significant determinant of house price booms (Borgy at al., 2011). Historically the housing in many countries was financed by local lenders (In the UK by building Societies, in Germany by Bausparkassen). The UK Building Society Act of 1986 resulted in these institutions offering competitive banking services (Green and Wachter, 2007). In these days financial intermediation has been more globalised. Agnello and Schuknecht (2011) find that domestic credit and interest rates have a significant influence on the probability of booms and busts occurring. Moreover, international liquidity plays a significant role for the occurrence of housing booms. The estimations show that a large part of the credit growth in new EU member states can be explained by the catching-up process, and, in general, credit/GDP ratios are below the levels consistent with macroeconomic fundamentals. The study finds that credit growth in Latvia and Estonia can be considered as potentially the most risky, beyond any plausible adjustment (Kiss et al., 2006). Household’s behaviour is difficult to measure and they are not always fully rational when they are making financial decisions (Campell, 2006). Housing affordability problems arise when a household’s income is insufficient to pay the various non-housing costs. During an economic boom the financial sector is inclined to strengthen the impact of the business cycle through intensifying lending activity and vice versa. This bundle of problems is well researched in advanced economies (Muellbauer, 2010; Ortalo-Magné and Rady, 2006 etc.). However, far too little attention has been paid to the housing affordability problems in emerging markets in CEE. Housing affordability is also essentially concerned with the quality of housing and its appropriateness to the households living in it (King, 1994 and Karmel, 1995). There is an increasing need for practical tools with the help of which to assess and compare buildings and their sustainability attributes (Din et al., 2001).
1.3. Quality of housing
Different market participants have different interests in respect to development, construction, obtaining and maintaining of buildings. A building maintenance organisation may aspire toward a better image, lower costs, healthier work environment and increased satisfaction of personnel. A real estate investor, on the other hand, may seek greater real estate value, better image for the firm, lower ownership costs and lower vacancy rates (Schleich et al., 2010).

19
Alongside different interests, the role of environmental sustainability has considerably increased in the real estate sector over the past 20 years (Keeping, 2000; Hart 2007; Myers et al., 2007; Lorenz et al., 2008 etc.). The real estate sector has started to realise its increasing importance and has therefore introduced the concept of sustainable buildings and energy saving principles to the participants in the real estate market. Many systems for the assessment of real estate quality and sustainability have been developed for different purposes. The best known quality grade based sustainability assessment tools, developed to assess the impact of buildings on the environment and users, are: BREEAM, created in 1990 in the United Kingdom (Building Research Establishment Environmental Assessment Method) (BREEAM, 2011); LEED (Leadership in Energy and Environmental Design), established in 1998 in the United States to assess the conformity of design and construction of buildings to sustainable development objectives (LEED… 2008); DGNB (Deutsche Gesellschaft für Nachhaltiges Bauen), a certification system developed in Germany in 2007 (DGNB International… 2010); and CASBEE (Comprehensive Assessment System for Built Environment Efficiency), a certification system developed in 2001 in Japan that considers building’s life cycle costs (CASBEE for..., 2009). The European Group of Valuers Association designed the European Property and Market Rating (PaM) system to measure the sustainable quality of a property in its relevant market (TEGoVA, 2003). The PaM system assesses property on the basis of five criteria classes (Market, Location, Property, Quality of Property Cash Flow and Development Risks and Chances) that are broken down into 29 individual criteria. The Royal Institution of Chartered Surveyors (RICS) has issued a guide on how to assess sustainability in the commercial property context, which to a certain extent is also applicable to housing. The guide identifies many fundamental aspects of sustainability that influence property and its potential value (Valuation Information... 2009). Lützkendorf and Lorenz (2006) have pointed out that the valuation typologies used for the valuation of buildings’ sustainability differ from each other mainly by the applicability and effect of the following aspects:
- involvement of sustainability dimensions (environment, economy, social, technical);
- number of life cycle phases of the building (a certain time frame or whole life cycle);
- integrated design and valuation; - content of valuation (qualitative, quantitative or combined); - level of detail or extent of aggregation (summed up or aggregated
results); - content of results (in what form information is provided – mark, score,
passport); - applicability to existing buildings.

20
Real estate valuers and market analysts in Estonia used various indicators to characterise the quality of real estate. Until the year 2009, Estonia had no uniform real estate quality rating system that would have covered all types of real estate. The need to harmonise and ensure unambiguousness of the quality rating led to working out a new quality rating system for real estate valuation, which takes into account sustainability of property and specific features of the local market. The Estonian real estate quality rating system for property valuation was elaborated based on the principle that also takes into account functional and technological aspects, which was presented by Lorenz. These dimensions are:
- functional and technical aspects (maximisation of functionality, adaptability and serviceability; aesthetic quality);
- environmental aspects (reduction of land and resource use, closing of material flows, reduction of hazardous substances, emissions and environmental impact);
- social and cultural aspects (health and comfort, social integration); - economic aspects (minimization of life cycle operating costs, value
stability, protection of capital and material goods) (Lorenz, 2010).
These four dimensions are taken into account via factors influencing three attributes (location and plot; construction quality and real estate management) that characterise the total quality rating. The object of research in this thesis is the Estonian real estate quality rating system, its content, suitability and applicability to real estate valuation and the hierarchy of factors influencing the quality (based on Kolbre, Kallakmaa and Ilsjan, 2011).

21
2. METHODOLOGY
2.1. Market analysis
The first step in analysing the Estonian housing market is analysis of the economic environment, as changes in the economic environment affect both demand and supply. The factors that influence the level of demand in the housing market on the basis of previous studies (Gallin, 2006) are as follows: age composition of households, household income, credit conditions, demographic factors, price of substitute units, ownership costs and expectations for the future. The analysis is based on a simple demand model of housing, Qd, that is expressed as follows: Qd = D(Y, N, W, UC, Өd), where Y – income; N – population; W – wealth; UC – user cost; Өd – other demand shifters. The user cost of capital, in turn, depends on the price of housing, P; mortgage rates, m; income and property taxes, τy and τp; respectively, maintenance and depreciation costs, δ; and expected capital gains, cg: UC = P[(1 – τy)(m + τp) + δ− cg] Since the number of population in Estonia has not changed during the period (2000-2007) of our analysis, property tax is imposed on land only and is therefore very small, and income tax rates were diminishing, then in the current study the following indicators have been used to study the economic impact on the housing market: real GDP, real private consumption, real wage and nominal credit growth, total volume of housing loans, interest rates and unemployment rate. Real estate market development is described with the notarised purchase-sale contracts of registered immovables with residential buildings and apartment ownership, and value of contracts. Many analysts claim that in the long term a stable relationship is formed between the real household incomes and housing prices (Malpezzi, 1999; Ortalo-Magné and Rady, 2006; etc.). This relationship is measured with the aid of the price-to-income ratio (P/I) – the share of the average (median) price of an apartment/house in the average (median) total annual net household income, measured in real values and adjusted for inflation (CPI). According to Meen (2003), the most frequently used method for estimating long-term price developments is the empirical rule combined with the P/I ratio. There is also the possibility to measure price to income ratio (P/I) as the share of the average price of 1 sqm of apartment in the average monthly wage. The most common way to analyse a bubble in the housing market is to look at changes in the price-to-earnings (P/E) ratio, which is the price of the house

22
divided by the current yearly rent that the house could earn, after adjusting for maintenance costs (Stephansen and Koster, 2005; Eschker and Messner-Zidell, 2005). In his analysis of real estate prices Poterba (1991) further developed the measurement of the P/E ratio. In equilibrium the expenditures on renting and buying a dwelling have to be equal. Poterba defined such balance of the user cost of owner occupied housing as follows:
Hp PmiR ×−+++= )( πδτ ,
where; R – rental price, i – interest rate, τp – property tax rate, m – maintenance cost rate, δ – depreciation rate, π – inflation rate and PH – the housing price. Poterba’s main aim in compiling this model was to estimate the effect of tax allowances on the market. This model can also be used to estimate the effects of changes in interest rates. When interest rates rise the housing prices should fall to keep the equilibrium. Housing prices in market equilibrium would be:
)( πδτ −+++=
mi
RP
pH
As the market of rental housing is underdeveloped in Estonia and cannot be adequately assessed (a large portion of rental agreements are not reflected in the public data) and comparison with rental costs does not provide a trustworthy result, we will modify the Poterba model for further implementation in the Estonian housing market. Considering the peculiarities of the housing and borrowing markets in Estonia we shall proceed from the following in using the model: 1. The real estate tax levied in Estonia, which is only land tax, has so far been
very low. As we are dealing only with the housing market, the expenditures on taxes are close to zero in cost analysis and therefore we will leave the factor of real estate tax out of the model.
2. For the level of maintenance costs and depreciation rate we shall use the fixed level suggested by Poterba – both 2%. In this case the value of housing will be depreciated in 50 years, which is probably quite close to the average maximum use of the same dwelling by a private person. Considering the average expenditures on housing according to the data of the Statistics Estonia and adding to these estimated renovation costs, 2% is also adequate under Estonian conditions.
3. The inflation rate in 2002-2007 is used as the value of π. The expected changes in the real estate prices are not taken into consideration here because we are interested primarily in the owner’s expenditures as compared to average incomes and not in the economic profitability of investments in real estate. In this case it is reasonable to consider the inflation rate as a rate of adjusting current expenditures.
4. According to the data published by commercial banks, in Estonia in half of the cases two private persons (the persons living together as a married or an

23
unmarried couple) take a real estate loan together. Therefore we multiply the average wages by 1.5 to get a correct ratio of the owner’s expenditures to wages.
5. Deductions are made from interest payments in the amount of an income tax incentive, since persons who have a housing loan get an income tax incentive.
Proceeding from the Poterba model let us consider the ratio of owner costs to average net incomes (c) in the Estonian housing market and follow its dynamics, primarily as the interest rates change. This ratio, c, can be expressed as follows:
[ ]nW
miPc
πδτ −++−= )1(,
where; τ – income tax rate, i – interest rate on housing loans and Wn – annual net wages. The economic variables that affect the supply side of the new construction market are (The Appraisal.., 2001): the prices of the factors of production used in the construction process; productivity of the factors of production and technology; number of builders in the market and builders’ expectations for sales in the near future. In the resale market, supply is not a function of production-oriented variables such as input prices, number of builders etc. It is a function of non-production-related, economic and demographic variables (Carn et al., 1998). Gallin, (2006) presents the supply model QS as: QS = S(P,C, ӨS), where; P – price of housing, C – cost of new construction, ӨS – other supply shifters. To analyse the supply, the dynamics of the volume of construction, the number of granted building permits and completed dwellings have been presented and Tobin’s q for the Estonian and Tallinn apartment market has been calculated. Tobin (1969) formulated a theory of investment that relies on the ratio of marginal asset values to replacement costs − Tobin’s q. This means that Tobin´s q is a ratio of firm value to replacement cost of the assets owned by the firm:
Market Value of the Firm q = --------------------------------------
Replacement Value of Assets The following relationship has been used to find Tobin’s q for the analysis of housing markets (Schulz and Werwatz, 2005):
q = V/ C,

24
where; V – market value of housing and C – housing replacement costs. In steady state real estate prices should be equal to replacement costs, or q should be equal to 1. Real estate developers are not interested in offering new housing if q < 1, since the selling price will not cover the construction costs and the price of land. At the same time, reduced demand for land, building materials and labour might involve a decrease in construction costs and the price of land. If q > 1, then the real estate developers can get additional profit by offering new housing. However, developers’ growing demand for vacant land, building materials and labour may increase construction costs. Both developments conduct the market toward equilibrium (Poterba, 1991).
2.2. Housing affordability and regulatory framework So far, however, there has been little discussion about the problem of housing affordability in Estonia. The housing boom and bust period shows the importance of this theme and the question remains whether a person with an average income is able to afford a home or to repay the mortgage loan? The Housing Affordability Index (HAI) normally measures the degree to which a typical family can afford the monthly mortgage payments on a typical home. Different institutions (US National Association of Realtors, BIS Shrapnel Australia, US NAHB and Wells Fargo, HIA-Commonwealth Bank etc.) have measured it in a variety of ways, but it is not possible to adapt the formerly mentioned indexes as the initial data about the Estonian market, used for calculating the indexes, is not accessible. To answer the question whether Estonian households can take household loans, a new index should be constructed that could assess the situation of the Estonian market. HAI index is constructed after the following formula: HAI = MR/ I where; MR – average mortgage loan repayment for housing purposes I – average full time income The HAI index, calculated on the basis of an average net income should show the present market situation more suitably, but taking into account the theoretical possibility of changes in the current tax law, an index that bases itself on the data concerning the gross income shows a clearer picture of the potential state of the market. Supposing that AML = PSV x 2/3*

25
where; AML – average mortgage loan; PSV – average purchase – sale value of dwellings * Average mortgage loan should not be more than 2/3 of real estate value. and; MR = AML/ A A is calculated as follows:
N
i,N
11
(1+i)A
i
−
=
where; i – average housing loan interest rate (Bank of Estonia) N – number of periods (average housing loan period 25 years) Agnello and Schuknecht (2011) find that the deregulation of financial markets has strongly magnified the impact of the domestic financial sector on the occurrence of booms. Wong et al. (2011) analyzed the effectiveness and drawbacks of maximum loan-to-value (LTV) ratios as a macro prudential tool using the panel data from 13 economies and found out, that LTV policy is effective in reducing systemic risk associated with boom and bust cycles in property markets (Wong et al., 2011). The law on credit institutions contained a limitation (LTV ratio) for all mortgage loans until 2002, according to which banks could not issue loans larger than 2/3 of the market price of the collateral real estate in the case of utilizing the real estate as collateral. The government decided to waive the limitation in 2002. Could the relinquishment of the limitation prescribed by law affect the operation of credit institutions, and what were the concurrent changes in the household market? To find an answer there will be calculated an aggregated LTV ratio for the whole Estonian housing market. Loan-To-Value Ratio (LTV) calculated as:
housing loan turnover in yearLoan to value ratio =
value of housing purchase - sale transactions in year

26
2.3 Assessment of housing quality In the Estonian valuation standards, quality grade for a real estate object is determined on the basis of its income potential, taking into consideration the sustainability of the object, i.e. every factor has to be assessed based on the principles of sustainable development and saving use. Income potential is evaluated on the basis of the following attributes: location and use of the plot, quality of construction and real estate management. Valuation of each attribute is based on the factors that influence the respective attribute (EVS 875). The questionnaire based on the Likert scale was used to find out the opinion of valuers about the necessity of determining the quality grades and methods of determining the quality grades based on the Estonian valuation standards EVS 875:10. A five-point scale with diminishing firmness of statement was used: Completely agree, rather agree, rather disagree, completely disagree, cannot say. On the basis of the questionnaire results, the most important factors that influence the quality rating were selected. To evaluate the hierarchy of the factors influencing the quality grade, and the changes in the hierarchy the Analytic Hierarchy Process (AHP) method is used, which was elaborated by Thomas L. Saaty in the 1970s. The method is intended to organise those systems whose operation is based on subjective assessments (Saaty, 1980). Saaty’s method enables to model a sophisticated decision-making problem with the help of a hierarchical structure, which is comprised of goal, criteria, sub-criteria, and alternatives. The advantage of this method is the possibility to handle both qualitative as well as quantitative objects; the output of this method is a mathematically correct quantitative judgement of the alternatives (Forman, 1983). The main idea of Saaty’s method is to free the decision-makers from the need to provide absolute scales to evaluate objects (scales of weight). Instead they use a pair-wise comparison of criteria and identify the dominant criterion and the strength of its dominance (Saaty, 1994). To compare the criteria to each other, the so-called Saaty’s scale is used with the following values (Saaty, 1980):
Intensity Definition 1 Equal importance 3 Moderate advantage or importance 5 Strong advantage or importance 7 Very strong advantage or importance 8 Absolutely more important 2,4,6,8 Compromise between two slightly differing judgements
With n criteria a1, a2, ..., an, the relative importance (relative weights) of which is k1, k2, ..., kn, respectively, matrix A is formed, where the rows are ratios of the

27
respective criterion’s relative weight to the relative weight of the other criterion (Võhandu, 1998): a1 a2 ... an a1 k1/k1 k1/k2 k1/kn a2 k2/k1 k2/k2 k2/kn ... an kn/k1 kn/kn Multiplying the ratios’ matrix A by the vector of relative weights we get n-fold vector of relative weights. In order to normalise the vector of weights let’s divide its components by the sum of components. We can denote the matrix A also as follows: A=(aij), aij=ki/kj , where i,j=1,..., n. This matrix has positive elements and it satisfies the so-called inverse condition: aji=1/aij. Also applicable is the relationship ajk=aik/aij. In order to evaluate the hierarchy of the factors influencing real estate’s quality rating and changes in that hierarchy depending on whether the quality grade factor is evaluated from the aspect of property user, valuer or developer, first the hierarchy of the factors is determined with the help of Saaty’s method for each attribute: location and use of plot, quality of construction and management of real estate. Then it is evaluated how the relative weight of these attributes changes depending on whether the quality grade is calculated from the aspect of user, valuer or developer, and the factors of influence are evaluated.
2.4 The main aspects and methods The next table (Table 1) concludes the main topics of research questions and used methods with some literature samples.
Table 1 The main aspects and methods Purpose Method References, Authors Whether large price increases in the housing market can be defined as a housing boom?
price-to-income ratio price-to-earnings ratio
Garratt (2001), Case and Shiller (2003), Gallin, (2006) Malpezzi (1999), Ortalo-Magné and Rady (2006), Karmel (1995), Chaplin and Freeman (1999) etc. Stephansen and Koster (2005), Eschker and Messner-Zidell (2005)

28
Poterba model Tobin’s q
Poterba (1991), Stein (1995) Tobin (1969) Tobin’s q concept has often been used to analyse supply and long-term changes in housing markets (Barot and Yang, 2002; Malpezzi, 1999; Mayes, 1979; Meen, 2001; etc.) as well as in real estate related studies (Schulz and Werwatz, 2005)
What kinds of factors have had the most significant influence to the average price of housing in Estonia?
Regression analysis Kohn and Bryant (2010); Muellbauer and Murphy (1997) etc.
How to evaluate affordability of housing in the Estonian market?
House price index HAI Amenity –based HAI Rent - to - income ratio
Case and Shiller (2003); Zabel (1999) Whitehead (1991); Gabriel et al. (2005); Jewkes and Delgadillo (2010) Fisher et al (2007) Ndubueze (2007); Tang (2012)
Regulatory framework decisions’ impact on the housing market in Estonia?
Aggregated LTV ratio
Wong et al. (2011); Amior and Halket, (2012)
Whether and to what extent real estate valuers attach importance to real estate quality assessment? What is the hierarchy of the factors influencing the housing quality grade?
Structured questionnaire Likert scale Structured interviews Analytic Hierarchy Process (AHP)
EVS875:10 Essa et al. (2007) Saaty, (1980) Lee and Chan (2007)
29
3. RESULTS AND IMPLICATIONS This chapter concentrates on the results of housing market analysis, affordability and quality issues. The results as well as theoretical and methodological implications of the conducted studies will be introduced here.
3.1. Housing market development in Estonia
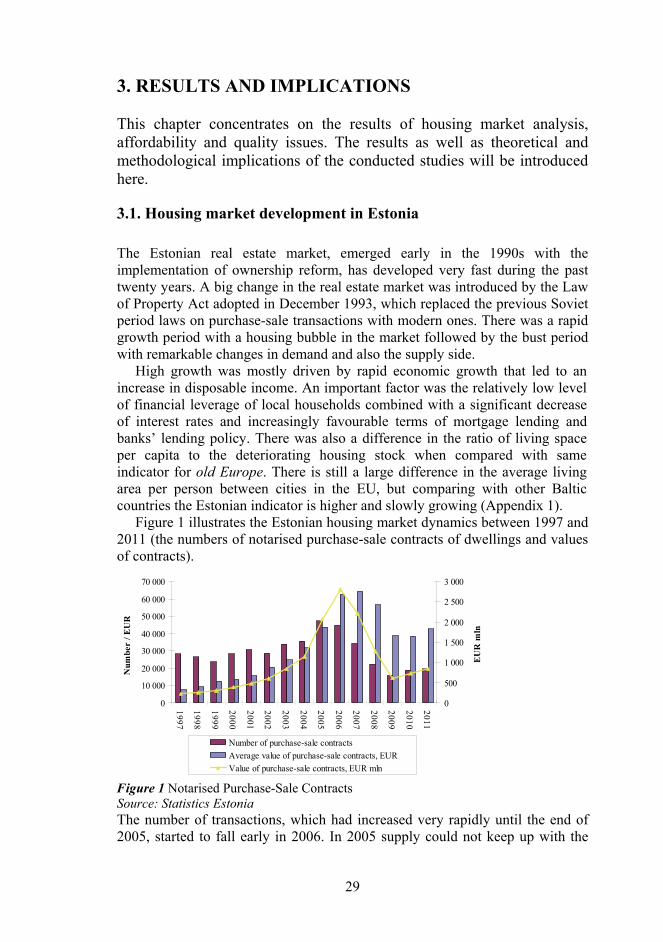
The Estonian real estate market, emerged early in the 1990s with the implementation of ownership reform, has developed very fast during the past twenty years. A big change in the real estate market was introduced by the Law of Property Act adopted in December 1993, which replaced the previous Soviet period laws on purchase-sale transactions with modern ones. There was a rapid growth period with a housing bubble in the market followed by the bust period with remarkable changes in demand and also the supply side. High growth was mostly driven by rapid economic growth that led to an increase in disposable income. An important factor was the relatively low level of financial leverage of local households combined with a significant decrease of interest rates and increasingly favourable terms of mortgage lending and banks’ lending policy. There was also a difference in the ratio of living space per capita to the deteriorating housing stock when compared with same indicator for old Europe. There is still a large difference in the average living area per person between cities in the EU, but comparing with other Baltic countries the Estonian indicator is higher and slowly growing (Appendix 1). Figure 1 illustrates the Estonian housing market dynamics between 1997 and 2011 (the numbers of notarised purchase-sale contracts of dwellings and values of contracts).
0
10 000
20 000
30 000
40 000
50 000
60 000
70 000
1997
1998
1999
2000
2001
2002
2003
2004
2005
2006
2007
2008
2009
2010
2011
Num
ber
/ EU
R
0
500
1 000
1 500
2 000
2 500
3 000
EU
R m
ln
Number of purchase-sale contracts
Average value of purchase-sale contracts, EUR
Value of purchase-sale contracts, EUR mln
Figure 1 Notarised Purchase-Sale Contracts Source: Statistics Estonia The number of transactions, which had increased very rapidly until the end of 2005, started to fall early in 2006. In 2005 supply could not keep up with the

30
general demand, which raised the average price levels. In 2007 the situation in the housing market stabilised, as characterised by a low growth rate of prices and differentiation of prices across regions and objects, lengthening of the sales periods and an active rent market. Average price of dwellings changed from 9410 EUR in 1998 to 64 544 EUR in 2007 and back to 38 523 EUR in 2010 (the average gross monthly wage was 264 EUR in 1998, 725 EUR in 2007 and 788 EUR in 2010). The total value of notarised purchase-sale contracts of registered immovable residential buildings and ownership of dwellings had increased from 223 million euros in 1997 to 2809 million euros in 2006, and decreased to 835 million euros by 2011. The average price of 1 sqm in October 2012 in Tallinn was 1115 euro, in Vilnius 1190 euro and 989 in Riga (Ober-Haus Real Estate Advisors). According to Eurostat in 2009 41.8 % of the EU -27 populations lived in flats, 34.4 % in detached houses and 23.0 % in semi-detached houses. The share of persons living in flats was highest in Latvia (66.2 %), Estonia (65.1 %) and Spain (64.6 %). Most of purchase-sale transactions in the Estonian housing market were made in Tallinn, the capital city, and this is the reason for using the Tallinn apartments’ market data for calculating the P/I ratio (Figure 4). The average dwelling in Tallinn is a 2-room apartment (approximately 35 sqm). After 2002 P/I ratio shows decidedly the evolving of a housing boom and the same indicator also expresses the purchase affordability of housing that is described in Chapter 3.2. Favourable conditions for real estate development in Tallinn ended in 2007; when the loan conditions became more and more strict, interests on loans increased and quite many unfinished housing development projects were accumulated in Tallinn. To analyse the supply on the basis of Tobin´s q, the average selling prices and replacement costs of apartments per 1 sqm were calculated for the whole of Estonia and just for Tallinn, which includes the construction cost and the price of land on the basis of the Estonian Land Board’s transactions’ database. Results are shown that the investments into apartment development projects were not profitable until the year 2003. The period 2003-2006 was extremely favourable for the development of apartment houses: the value of q was between 1.03 and 1.76 in Estonia as a whole, and 1.26-2.20 in Tallinn. P/E ratio (Figure 2) was also calculated, but because of available data and significance of the housing market, this indicator has been calculated for major towns where most of the transactions take place, i.e. Tallinn and Tartu.

31
Figure 2 P/E ratio of the Tallinn and Tartu Housing Market (2-room Apartments) Source: Statistics Estonia and author’s calculations The P/E ratio was growing fast until 2006; when it achieved its maximum. The difference between Tallinn and Tartu was quite small throughout the period 2002-2006, the time of the high price rise, until 2007. Taking the share market as an alternative investment opportunity for a lessor, for example, most probably a P/E ratio higher than 15 (additional earnings from rising real estate prices are not included) is not an attractive level for a real estate owner in the long term. Hence, the potential scenarios for the future are a significant rise in rental prices, which cannot be regarded as very realistic considering the income level, and a possibility that current tenants buy a dwelling, which is a more likely scenario considering the declining trend of housing prices. The results show that equilibrium prices on the basis of the Poterba model should be significantly higher (with the exception of Tartu in 2006). Unfortunately the results cannot be regarded as realistic for several reasons. An important factor in the Poterba model is the rental rate, which cannot be adequately assessed in the Estonian housing market. Fast growth in the housing market in 2002-2006 occurred (due to the favourable borrowing conditions) only in the sales sector; as the rental market was mostly underdeveloped. The econometric model that was constructed in the housing boom peak time in 2007, by using 8 different economic indicators for describing their influence to the price of a 2-room apartment in Tallinn between 2000-2006, shows that only 2 of them – money supply and interest rate – were significant indicators to price changes of the housing market in Estonia (Kolbre, Kallakmaa, Paadam 2007).
3.2. Housing affordability in Estonia It is becoming increasingly difficult to ignore the problem, that financial and housing markets are related. Credit and its availability is a significant factor influencing housing market movements. The Estonian loan market is divided mostly between four major foreign owned banks that capture, in total, 92% of the loan market. Swedbank accounts for the biggest share – 41% of the aggregate loan portfolio. SEB Pank follows it with 23%, Nordea Bank Finland Estonian Branch with 19% and Danske Bank Estonian Branch with 9 %. The

32
rest (8%) of the market is divided between 12 market participants (Finantsinspektsioon, 30.06.2012). Figure 3 illustrate the sudden growth of housing loans.
0
1000
2000
3000
4000
5000
6000
7000
1997
1998
1999
2000
2001
2002
2003
2004
2005
2006
2007
2008
2009
2010
2011
EU
R m
ln
0
2
4
6
8
10
12
14
Per
cent
Stock of housing loans (EUR million) Turnover of housing loans (EUR million)
Stock of overdue housing loans (EUR million) Interest rates of housing loans
Stock of housing loans/GDP
Figure 3 Stock and turnover of housing loans Source: Bank of Estonia The results of a questionnaire in April 2010, with the purpose to evaluate the access to bank loans during the housing boom time and expectations about real estate market movements, indicate that it is common in Estonia to own your living space, not to rent it and access to bank credit was too easy during the real estate boom (Kallakmaa and Kolbre, 2010). It confirms the expectations that there was the procyclical effect in the lending activity and the credit risk was underestimated in the boom time. P/I ratio (Figure 4) shows the evolving of the housing boom, but it also indicates how many months one person with an average income should work so he/she could buy one square metre of an average dwelling. This is an indicator that illustrates purchase affordability in the housing market. If the price - to - income ratio is 1, then it is the so-called equilibrium point for the housing market, and a person with an average income can afford to buy an average home. Before 2000 was the equilibrium point for an individual person and in 2001 for the average household. P/I reached the maximum in 2006, which indicates the housing bubble in Estonia. The P/I ratio shows that one person with average net income cannot afford the average flat in Tallinn. The situation is improved using household income data. For a household the index was lower than one in 2000/2001 and again in 2009. The Indicator shows that since 2009 an average household can afford to buy an average flat in Tallinn.

33
Figure 4 P/I ratio for Estonian and Tallinn housing market Source: Statistics Estonia, Bank of Estonia, author’s calculation Despite results that the P/I ratio indicates improved purchase affordability in recent years; there is still the question about repayment affordability. Most dwellings are financed with mortgage loans. According to Eurostat in 2009 73,5 % of the EU -27 population owned their homes and 36,9 % of owners had a mortgage loan. Figure 5 illustrates the repayment affordability situation in 1997 – 2010, and the dotted line is added as the mortgage payment restriction – 30% of gross income. The standard practice is to count any household that spends more than 30% of its pre-tax income on housing as having an affordability problem (Belsky et al., 2005). The results confirm that at the housing boom peak in 2005-2007, the repayment affordability situation was the worst. The average purchase – sale prices were too high for average housing buyers, and they could not afford the mortgage payments. The situation started to normalise in 2008 and continued after that, but we must consider that housing prices have fallen faster than incomes. The HAI shows repayment affordability improvement in 2009-2010. The index shows the aggregated data, but it does not consider all movements in the labour market. The high unemployment rate was a factor that influenced the housing loans repayment affordability. Also it is not possible to judge how many housing loan clients have repayment difficulties.

34
0,00
0,10
0,20
0,30
0,40
0,50
0,60
1997
1998
1999
2000
2001
2002
2003
2004
2005
2006
2007
2008
2009
2010
2011
HAI (gross income) Mortgage payment restriction (net income)HAI (net income)
Figure 5 HAI index for Estonian market Source: Statistics Estonia, Bank of Estonia, author’s calculation
It must be considered, that the constructed index is only one measure that indicates the affordability situations, which does not cover all the factors influencing the affordability situation. There is the need for future research in this field with the purpose to assess other components. Jewkes and Delgadillo (2010), in their conceptual review of three commonly used affordability indexes in the US, find that there is a need to better determine individual household’s ability to afford housing. Historically, a number of countries have used limits on the LTV ratio; some of them have validated it recently. According to the IMF Global Financial Stability report of 2011, LTV in Austria, Denmark, Italy, and Germany is 80 %, in USA 100 % +, UK 110 %, Spain 100 %, etc. (IMF, 2011). However, the findings of the current study demonstrate the importance of LTV ratio, see Figure 6.
Figure 6 Aggregated LTV ratios for Estonian market Source: Statistics Estonia, Bank of Estonia, author’s calculation
0,0%
20,0%
40,0%
60,0%
80,0%
100,0%
120,0%
1997
1998
1999
2000
2001
2002
2003
2004
2005
2006
2007
2008
2009
2010
2011
Aggregated LTV ratio Housing loans/GDP

35
After restriction elimination in 2002 in Estonia the constructed aggregated LTV ratio skyrocketed and in 2008 it was possible to get housing loans at more than the real estate market value. This situation cannot be sustainable for any lengthy period of time.
3.3. Housing quality and hierarchy of quality factors
All the respondents to the questionnaire found that it is important to calculate the quality-rating grade for real estate objects in real estate valuation. Differences in opinions were caused by the method of valuation. According to the valuation standards, the quality must be determined on the basis of three attributes (location and use of plot; quality of construction, and real estate management), with each of them containing several factors. 42% of the valuers completely agreed with this valuation method and 43% rather agreed; 15% answered either rather disagree or disagree. The last group was almost entirely comprised of valuers without a professional certificate or with a short employment. Quality rating factors were assessed for living space and for comparison for office space as well. On the basis of both, the questionnaire and Saaty’s method, the most important factor influencing the quality of living space as well as office space is the location within the region. The next two factors that influence the quality rating of living space on the basis of location of plot the most, in the opinion of valuers as well as on the basis of Saaty’s method, are the supply of utilities on the plot and infrastructure for public services in the vicinity (schools, kindergartens, shops etc). The quality rating of living space according to the questionnaire is less influenced by security, passing traffic, light-traffic roads and public recreation grounds, size and shape of the plot and pollution of the air. The quality rating of office space according to the questionnaire is less influenced by light-traffic roads and public recreation grounds, pollution of the air, size and shape of the plot, noise and security. The factors that influence the quality rating of living space most on the basis of construction quality, in the opinion of valuers, are the condition of structures and the condition of technical installations in the building, based on both methods. The factors that most influence the quality rating of office space on the basis of construction quality are functionality of the building and condition of the structures. The factor that in the opinion of valuers influenced the quality rating of living and office space the most on the basis of real estate management was utility service costs (energy, water, heating expenses measures in cash). The ranking of other factors differs on the basis of the questionnaire results and Saaty’s methods. The quality attribute that is valued very highly is location and plot; whereas, the significance of real estate management is very small for both real estate types. To find the co-effect of every attribute and factor on the real estate quality rating, we get the weighting of every factor in the quality rating of the

36
real estate object as a whole by multiplying the weightings of attributes found with Saaty’s method by weightings of factors. As a co-effect, the hierarchy of the first five factors for office space is as follows: location within the region, passing traffic and visibility, supply of utilities on the plot, parking facilities, conformity to the building right of the plot, which are all related with the attribute ‘location and plot’. The hierarchy of the factors co-influencing living space is also related mainly with location, one factor also with construction: location within the region, condition of structures, supply of utilities on the plot, parking facilities, conformity to the building right of the plot. In 2012 repeated research of the living space quality rating factors showed changes in the hierarchy of the factors using Saaty´s method (Kolbre and Kallakmaa, 2012). The importance in the hierarchy has reordered the factors as follows: greenery and maintenance of the plot, infrastructure for public services in the region, condition of structures, condition of technical installations, electricity saving measures as a result which energy expenses are lower and utility service costs. At the same time diminished importance of such factors as location within the region, homogeneity and solvency of the property users and management of a property.

37
4. CONCLUSIONS This thesis explores the housing market development in Estonia from three different aspects. The first aspect was the investigation of factors that had influenced the price movements in the Estonian housing market. The second was the determination of the housing affordability situation and also appraising the possible effect of the regulatory framework. The third aspect relates to the real estate quality issues, especially of the hierarchy of the quality rating factors. Different factors, from demand and also from supply side, are influencing the average housing price. The housing boom in Estonia was mostly driven by a large credit supply and favourable loan conditions (Kolbre, Kallakmaa, Paadam 2007). Changes in credit market architecture are an important but unobservable structural influence on economic activity (Muellbauer and Williams, 2011). Many other emerging market countries are dealing with the same problems as Estonia. The results of this thesis are applicable for researching emerged market economies. The thesis is based on three academic papers. The first paper, “Estonian Housing Market: Searching for Origins of the Boom”, is focused on housing market development in Estonia. Evolving housing price booms and a worsening affordability situation are strongly correlated. It is very important to monitor the indicators that pointed out the possibility that the prices are far from fundamentals. Even in this situation, there is difficulty in finding observable fundamentals that are correlated with price movements, we can use some indicators, as proposed in this thesis, as P/I (using average monthly data) or P/E (adopted version Poterba model) for the Estonian market to identify a real estate boom and bubble. A rise in the P/I ratio to more than 1 indicates a price bubble. P/I ratio reached the maximum in 2006. The results of P/I and P/E ratio analysis allows to state that the fast price rise caused a bubble in the housing market. The P/E ratio was growing fast until 2006 when it achieved its maximum. Taking into consideration the specific features of the Estonian housing market (the underdeveloped rental market, inadequate statistics on rental earnings and mostly functioning purchases and sales market, which is greatly affected by loan conditions) the Poterba (1991) model was correspondingly developed and the share of owner’s costs in net wages was found. If the Estonian housing rental market statistics are more adequate in the future, it will be possible to develop the model similarly to the method provided by Poterba (1991). Tobin’s q calculations for the Estonian housing market showed that the most challenging period for property developers on the supply side was in 2003−2007, when Tobin´s q ranged from 1.02 to 1.76. The results of analysis confirm, that there was a housing boom. The average housing price in Estonia was mostly influenced by the large credit supply and the fast economic growth resulting in increased household income and too unrealistic expectations for rise in housing prices in the future. The second paper, “Estonian housing market: affordability problem and regulatory framework”, discusses the framework influences and the housing

38
affordability problem. Determination of housing affordability is a new issue for the Estonian market. The HAI index, proposed by the author, could be calculated regularly and it could be used as a possible indicator to evaluate the capability of the population to take on household loans in the Estonian household market as a whole. And there is also the suggestion for households to pay more attention on the household’s credibility to avoid unrealistic expectations. This study has also shown the importance on regulatory decisions, which in our case were the waiving of limitations for all mortgage loans in 2002. The recommendation is for the government to change the Law of Credit Institutions and reinstate the restriction for mortgage loans (LTV ratio). Duca et al. (2012) find that “swings in credit standards played a major role in the recent boom and bust in US house prices” and they made the recommendation for financial institutions – the same as the author of this thesis – to use maximum LTV ratio for mortgage lending. A recent study by Amior and Halket (2012) find that higher price levels explain the lower homeownership, while higher risk explains the lower LTV in high land-value cities. But this was not the case in Estonia. Controversially, despite the high price level, demand was higher than supply in the housing boom period and it is still common to own the dwelling instead of renting. The foreign owned financial sector took increasing risks and it was possible to get housing loans without the self-financing amount. Credit institutions underestimated the collateral liquidity risk and did not follow LTV limitations. In order to prevent future crises, some researches call for an enlargement of macro-political instruments; see Blanchard et al. (2010). It is also proposed that central banks should behave contrary to market trends; see e.g. Bordo and Jeanne (2002). The financial sector must attempt to avoid the so-called Minsky moment. The third paper, “Real Estate Quality Assessment for Valuation in the Estonian Real Estate Market”, examines the housing quality assessment problems. The research findings about quality ratings demonstrated that in the opinion of all valuers it is essential to award a quality grade rating for real estate objects by taking into consideration their sustainability, with 85% of the respondents to the questionnaire confirming it is important to award a quality grade based on all three attributes described in the valuation standard (location and use of plot; construction quality; real estate management). Although the real estate quality rating system treats all quality attributes (location and plot, construction quality and management) as equal, the research showed that in practice valuers attach extremely great importance to the attribute ‘location and plot’ and little significance to factors under the attribute ‘management’. From the aspect of sustainability, however, energy, water, heating expenses and waste disposal, which are under the attribute ‘management’, have a significant role. A reason why valuers do not attach importance to energy saving problems may be that the Estonian real estate market reacts to rising energy costs with a time lag and consumers were not yet

39
ready to value energy saving when the research was conducted. In 2012 repeated research (Kolbre and Kallakmaa, 2012) has shown that energy consumption and utility service costs became more important. As other studies show, the real estate sector is, to a very great extent, associated with sustainability. For example, buildings are responsible for 40–50% of final energy consumption and 40% of total amount of disposable waste. Buildings also consume 16% of fresh water and 40% of raw materials. Moreover, 25% of timber felling is for buildings (Wilkinson et al., 2008). These statistics clearly show that the overall environmental impact of buildings is big; it is essential to pay attention to its reduction and take to a greater extent into consideration in real estate quality rating and value. The problem with data availability and an underdeveloped rental market has limited the use of some well-known methodologies for investigating Estonian housing market developments. Considering the shortage of disclosure research about the housing markets in CEE countries this thesis proposes new theoretical and practical approaches. This thesis offers possible theoretical solutions on how to elaborate and adapt frequently used methodologies (e.g. Poterba model, Tobin q etc.) and also gives new approaches for investigation in the emerged economies housing markets. The Poterba model is not an applicable method for investigating housing markets in emerged economies, where there is a high level of owners caused by privatization, underdeveloped rental market and a large portion of rental agreements that are not reflected in the public data. Emerged economies with similar historical and economical backgrounds usually have the same problems with data availability. The Poterba model modified by the author is suitable for investigating other similar housing markets. The index (HAI) worked out by the author is a new methodological tool for assessing the housing affordability situation in the Estonian market and the proposed index can be used for assessing other housing markets affordability situations from a credit repayment capability aspect. The new method proposed by the author is the use of aggregated LTV ratio, which is commonly used for individual households or persons. The proposed solution is applicable not only for emerged economies, but also suitable for analysing advanced economies. There is limited use of economic analysis for guiding policy decisions. The proposed theoretical framework also has practical value as a set of tools for future market monitoring which allows making economical and political decisions based on the proposed indicators. Results of this thesis are applicable for researching other housing markets. The practical value of this thesis is a diverse analysis on the housing market that gives an overview of the changes in the housing market sector before and after the boom. Market trends and factors affecting it were brought out in the thesis. Assessment of the supply and demand balance in the market and the changes associated with housing affordability and the factors affecting the quality of the property will provide important information for decision-making

40
for housing market participants on both the demand and the supply side. Of particular importance is the on-going monitoring and evaluation of housing affordability situation on the market, so it would be possible to take measures to prevent the market overheating in the future. From a practical point of view, the quality of the property assessment system is important and it has to take into account the sustainability of real estate, design and incorporating it into the real estate appraisal standards, thereby significantly increasing the quality of the real estate appraisal. Analysis of housing affordability with the analysis of the factors affecting the housing quality hierarchy provides investors with important information related to housing development projects. This research has cast different questions in need of further investigation. There is a need to repeat the regression analyses, which were done by Kolbre and Kallakmaa (2007), using a longer time period to find out the factors that are influencing the average housing prices in Estonia during the entire cycle. If the person with average monthly income cannot afford to pay for an average home (which in the Estonian case is the flat) there is the affordability problem. One of the author’s recommendations is to monitor HAI index movements in the Estonian market, but this proposed index is only one tool to measure the affordability situation. There is a need for future investigation of the housing affordability problems and more research with the purpose to find solutions for different types of households.

41
REFERENCES Abelson, P. (2009) Affordable Housing: Concepts and Policies, Economic Papers, 2009, vol. 28, issue 1, pages 27-38. Acemoglu, D., Chernozhukov, V. and Yildiz, M., (2007), Learning and Disagreement in an Uncertain World, http://economics.mit.edu/faculty/acemoglu/paper (10.04.2012). Adair, A., Berry, J., Haran, M., Lloyd, G., McGreal, S. (2009) The Global Financial Crisis: Impact on Property Markets in the UK and Ireland, Report by the University of Ulster Real Estate Initiative Research Team. Agnello, L., Schuknecht, L. (2011) Booms and busts in housing markets: Determinants and implications, Journal of Housing Economics, volume 20, Issue 3, Pages 171-190. Amior, M., Halket, M. (2012) Do Households Use Homeownership To Insure Themselves? Evidence Across U.S. Cities, University of Essex, Discussion Paper Series. No. 718 July 2012, ISSN 1755-5361, http://www.essex.ac.uk/economics/discussion-papers/Papers-text/dp718.pdf (19.09.2012). Angell, C. and Williams, N. (2005) February 10. U.S. Home Prices: Does Bust Always Follow Boom? Retrieved from FDIC website: http://www.fdic.gov/bank/analytical/fyi/2005/021005fyi.html (14.04.2006) 5th Annual Demography International Housing Affordability Survey (2009). Baddeley, M. (2005), Housing bubbles, herds and frenzies: evidence from British housing market, Michelle Gonville & Caius College, Cambridge UK, CEPP Policy Brief NO. 02/05. Balázs, É. and Dubravko, M. (2007) Determinants of House Prices in Central and Eastern Europe – BIS Working Papers, No. 236, pp. 1-26. Baltic Property Expert (2007) Real Estate Market Review. Tallinn: Baltic Property Expert. Baltic Property Market Report (2006) Lithuania, Latvia, Estonia, Re&Solution, PricewaterhouseCoopers, LAWIN. Bank of Estonia, http://www.eestipank.info/frontpage/et/. Bank of Latvia, http://www.bank.lv/.
42
Bank of Lithuania, http://www.lbank.lt/home/default.asp?lang=e. Barot, B. and Yang, Z. (2002) House Prices and Housing Investment in Sweden and the UK:Econometric Analysis for the Period 1970–1998. - Review of Urban & Regional Development Studies, Vol. 14, No. 2, pp. 189-216. Belsky, E. S., Goodman, J., and Drew, R. (2005) Measuring the nation’s rental housing affordability problems. The Joint Center for Housing Studies, Harvard University. http://www.jchs.harvard.edu/publications/rental/rd05-1_measuring_rental_affordability05 (10.February 2012). Benito, A. (2007). Housing equity as a buffer: evidence from UK households, Bank of England Working Paper 324. Berry, M. (2006) Housing affordability and the economy: A review of macroeconomic impacts and policy issues, National Research Venture 3: Housing Affordability for Lower Income Australians, Research Paper 4, ISBN: 1 921201 07 X. BIS Shrapnel, www.bis.com.au (25.04.2011). Blanchard, O., Dell’Ariccia, G., Mauro, P. (2010) Rethinking macroeconomic policy, Journal of Money, Credit and Banking, Volume 42, Issue Supplement s1, pages 199–215. Bordo, M. D., and Jeanne, O. (2002) Boom-Busts in Asset Prices, Economic Instability and Monetary Policy. National Bureau of Economic Research, Cambridge, MA, NBER Working Paper 8966. http://www.nber.org/papers/w8966 Bordo, IMF (2003) http://www.imf.org/external/pubs/ft/weo/2003/01/pdf/chapter2.pdf. Borgy, V., Clerc, L., Renne, J.-P. (2011) Measuring Aggregate Risk: Can we robustly identify Asset-price boom-bust cycles?, SUERF/Deutsche Bundesbank/IMFS Conference 2011, Berlin. Borio, C., Shim, I. (2007) What can prudential Policy do to support monetary policy, BIS Working Paper no. 242. Bramley, G and Karley, N.K. (2005) How Much Extra Affordable Housing is Needed in England? – Housing Studies Vol. 20, No. 5, September 2005, 685–715.

43
BREEAM 2011 http://www.breeam.org/filelibrary/Technical%20Manuals/SD5073_ BREEAM_2011_New_Construction_Technical_Guide_ISSUE_2_0.pdf (14.07.2011) Burnside, G., Eichenbaum, M., Rebelo, S. (2011) Understanding booms and busts in housing markets, NBER Working Paper 16734 http://www.nber.org/papers/w16734 Calculating the National Association of Realtors Housing Affordability Index, http://www.realtor.org/Research.nsf/files/Formulas_HAI.pdf/$FILE/Formulas_HAI.pdf (10.04.2011). California Association of Realtors, http://www.car.org/ (25.04.2011). Camerer, C. (1989) Bubbles and Fads in Asset Markets: A Review of Theory and Evidence, Journal of Economic Surveys, 3, 1989, 3-38. Campbell, J. (2006) Household Finance, The Journal of Finance, Volume 61, Issue 4, pages 1553–1604. Carn, N., Rabianski, J., Raster, R., Seldin, M. (1998) Real Estate Market Analysis, Prentice-Hall Inc. European Economy. 2006. No 2, Office for Official Publications of EC. Luxemburg KC-AR-06-002-EN-C. CASBEE for Property Appraisal. http://www.ibec.or.jp/CASBEE/english/method (15.07.2011) Case, K. E., Schiller, R. J. (2003) Is There a Bubble in the Housing Market? Brookings Papers on Economic Activity, No. 2, pp. 299-342. Chaplin, R., Freeman, A. (1999) Towards an accurate description of affordability, Urban Studies, Vol. 36 No.1, pp.1949-57. Claessens, S., Kose A., Terrones. S. (2008) What Happens During Recessions, Crunches and Busts?, IMF Working Paper, Research Department, December. Daron,A., Chernozhukov, V. and Yildiz, M. (2007) Learning and Disagreement in an Uncertain World, National Bureau of Economic Research Working Paper, No. 12648. DGNB International 2010. http://www.dgnb-international.com/international/_fileadmin/PPT_und_PDF/DGNB_International.pdf

44
Demography international 2011, International Housing Affordability Survey: 2011. Din, A., Hoesli, M. and Bender, A. (2001) Environmental Variables and Real Estate Prices. Urban Studies, 38 (11): 1989–2000. Dreger, C., Kholodilin, K. (2011) Speculative Bubble on Housing Markets: Elements of an Early Warning System, DIW (The German Institute for Economic Research) Economic Bulletin 4. Duca, J., Muellbauer,J., Murphy,A., (2012), “Credit Standards and the Bubble in US House Prices: New Econometric Evidence,” in Property Markets and Financial Stability, pp. 83-89, BIS paper no. 64, March 2012. http://www.bis.org/publ/bppdf/bispap64n.pdf (12.10.2012) Dübel, H. J. (2009) Contractual savings for Housing, in Housing Finance Policy in Emerging Markets, ed.by Loļc Chiquier and Michael Lea (Washington: World Bank). Dynan, K., Johnson, K., Pence, K. (2003) Recent Changes to a Measure of U.S. Household Debt Service, US Federal Reserve Bulletin October 2003. Dynan, K., Kohn, D. (2007) The Rise in U.S. Household Indebtedness: Causes and Consequences, Finance and Economics Discussion Series, Federal Reserve Board, Washington, D.C. 2007. Eschker, E. and Messner-Zidell, S. (October 2005) Is There a Housing Bubble in Humboldt County? The Housing Market in a Rural California Region, 1989-2004 – Executive Summary.Humboldt County Research. Retrieved from Humbholdt State University website: http://www.humboldt.edu/~indexhum/projects/housing_summary.pdf. (10.05.2009) Essa, R., Fortune, C., Carter, K. (2007). Sustainable housing projects in the UK: a pilot study, International Conference on Whole Life Urban Sustainability and its Assessment, School of the Built Environment, Heriot-Watt University, Edinburgh, http://download.sue-mot.org/Conference-2007/Papers/Essa.pdf (15.09.2012) Estonian Land Board. http://www.maaamet.ee/index.php?lang_id=2&page_id=164&menu_id EVS 875-10:2008. Property valuation Part: Inspection of Property and Data Collection (Kolbre, E.,Ilsjan, V., Tiits, T., Tomson, A.). Estonian Centre for Standardisation, Tallinn. 2008.
45
Faruqui, U. (2008) Indebtedness and the Household Financial Health: An Examination of the Canadian Debt Service Ratio Distribution, Bank of Canada Working Paper 2008-46. Finantsinspektsioon. http://www.fi.ee. Fisher, L., Pollakowski, H., Zabel J. (2007) Amenity-Based Housing Affordability Indexes http://web.mit.edu/cre/research/hai/pdf/FPZ_021207.pdf. (12.05.2011). Forman, E. H. (1983) The Analytic Hierarchy Process as a Decision Support System, Proceedings of the IEEE Computer Society. Freeman, A., Chaplin, R., Whitehead, C. (1997) Rental Affordability: A Review of International Literature, DISCUSSION PAPER 88, Property Research Unit, Department of and Economy, University of Cambridge. French, D. (2006) The Dutch Monetary Environment during Tulipmania. Quarterly Journal of Austrian Economics. 9 (spring): 3-14. Gabriel, M., Jacobs, K., Arthurson, K., Burke, T., Yates, Y. (2005) Conceptualising and measuring the housing affordability problem, AHURI Reseach Paper 1, http://www.ahuri.edu.au/publications/download/nrv3_research_paper_1 (21.01.2012) Gallin, J. (2006) The Long-Run Relationship Between House Prices and Income: Evidence from Local Housing Markets. Real Estate Economics, Vol. 34, No.3, pp. 417-438. Gan, Q., Hill, R. (2008) Measuring Housing Affordability: Looking Beyond the Median, School of Economics Discussion Paper: 2008/09, Australian School of Business. Garber, Peter M. (2000) Famous First Bubbles: The Fundamentals of Early Manias, Cambridge: MIT Press, ISBN 0-262-07204-1. Garratt, D (2001) London’s Housing Market, Housing Finance, No. 49. Geanakoplos, John (2010) The Leverage Cycle,.NBER Macroeconomics Annual 24, 1.66. Gibb, K. (2011) Delivering new affordable housing in the age of austerity: housing policy in Scotland, International Journal of Housing Markets and Analysis, ISSN: 1753-8270, Vol. 4 Iss: 4, pp.357 – 368.

46
Glaeser, E.L. and Joseph Gyourko, J. (2006) Housing Dynamics,.National Bureau of Economics Research Working Paper No. 12787. Global Property Guide (6 January 2008) Northern Europe leads 2006 house price boom. Green, R., Wachter S. (2007) The housing finance revolution Article provided by Federal Reserve Bank of Kansas City in its journal Proceedings. Gurran, N., Whitehead, C. (2011) Planning and affordable housing in Australia and the UK: a comparative perspective. Housing studies, 26 (7-8). pp. 1193-1214. ISSN 0267-3037. Haldane, A., Madouros, V. (2012) „The dog and the frisbee“, Bank of England, Given at the Federal Reserve Bank of Kansas City’s 36th economic policy symposium, “The Changing Policy Landscape”, Jackson Hole, Wyoming, 31.August 2012, http://www.bankofengland.co.uk/publications/Documents/speeches/2012/speech596.pdf (09.09.2012). Hancock, K. E. (1993) Can Pay? Won't Pay? or Economic Principles of Affordability. – Urban Studies, February, 30, 127-145. ISSN: 00420980 Harrison, J. M., Kreps, D. (1978) Speculative Investor Behavior in a Stock Market with Heterogeneous Expectations,. The Quarterly Journal of Economics 92 (2, May), 323.336. Hart, S. (2007) Defining 'Sustainability' Takes Energy. National Real Estate Investor, 49 (6): 6-10. Helbing, T.F. (2005) Housing Price Bubbles – A Tale Based on Housing Price Booms and Busts. BIS Papers, No. 21, pp. 30-41. Retrieved from Bank for International Settlements website: http://www.bis.org/publ/bppdf/bispap21d.pdf. Herring, R., Wachter, S. (1999) Real Estate Booms and Banking Busts: An International Perspective, The Wharton Financial Institutions Centre, University of Pennsylvania , Working Papers, 1999. Hilbers, P., Lei, Q. and Zacho, L. (2001) Real Estate Market Developments and Financial Sector Soundness. IMF Working Paper, No. WP/01/129. Hou, Y. Housing price bubbles in Beijing and Shanghai? A multi-indicator analysis. International Journal of Housing Markets and Analysis Vol. 3 No. 1, 2010 pp. 17-37.

47
Hoyt, W., Rosenthal, S. (1997) Household Location and Tiebout: Do Families Sort According to Preferences for Locational Amenities," Journal of Urban Economics 42: 159-178. Igan, D. and Loungani, P. (2012). Global Housing Cycles, IMF Working Paper, WP/12/217. IMF (2011), Global Financial Stability report of 2011. IMF (2003) ,World and Economic and Financial Surveys. World Economic Outlook. Growth and Institutions, pp. 61-94. Retrieved from IMF website: http://www.imf.org/external/pubs/ft/weo/2003/01/pdf/chapter2.pdf Jewkes, M., Delgadillo, L. (2010) Weaknesses of Housing Affordability Indices Used by Practitioners, Journal of Financial Counseling and Planning, 21. 1 (2010): 43-52. Kain, J., Quigley, J.M. (1970) Measuring the value of housing quality, Journal of American Statistical Assotsation Volume 65, Issue 330, June 1970, JSTOR. Kallakmaa, A., Kolbre, E. (2010) Estonian Housing Market - Before Euro Adoption, Scientific Conference ERES 2010, June, Milan. Kallakmaa-Kapsta, A. (2007). Factors influencing developments in the real estate market. Kroon & Economy (6 - 17). Eesti Pank. Karmel, R., (1995) Measuring Financial Housing Stress, welfare division working paper No. 8, Australian Institute of Health and Welfare, Caberra. Keeping, M. (2000) What about the demand? Do investors want sustainable buildings? London: RICS Research Foundation. Kiel, K. Zabel, J.( 2004), Location, Location, Location: The 3L Approach to House Price Determination,Working Papers 04-06, Center for Economic Studies, U.S. Census Bureau, http://ideas.repec.org/p/cen/wpaper/04-06.html (13.08.2012). Kindleberger, C.P. (1987), "Bubbles", in The New Palgrave. A Dictionary of Economics, edited by J.Eatwell, M. Milgate and P. Newman, MacMillan, London. Kindleberger, Charles P. and Aliber, Robert (2005 [1978]), Manias, Panics and Crashes. A History of Financial Crises, New York, ISBN 0-465-04389-1,p. 16.

48
King, A., (1994) Towards Indicators of Housing Stress, MONOGRAPH SERIES, No. 2,Department of Housing and Regional Development, Canberra. Kiss G., Nagy, M., Vonnak B. (2006), “Credit growth in Central and Eastern Europe:Convergence or Boom?”, Magyar Nemzeti Bank Working paper, 2006/10. Kohn, J., Bryant, S. (2010), Modeling the U.S. housing bubble: an econometric analysis, Shippensburg University of Pennsylvania, Research in Business and Economics Journal, Vol. 2, ISSN:1941-3424, http://www.aabri.com/rbej.html (24.08.2012). Kolbre, E. and Kallakmaa-Kapsta, A. (2006) Housing Market Development in Estonia: Is There a Real Estate Boom? Working Papers in Economics (TUTWPE), Vol. 20, pp. 27-46. Kolbre, E., Kallakmaa-Kapsta, A. (2012) Estonian housing market after crisis: Searching for Origins of the demand Changes, ERES 2012 Edinburgh, http://eres.scix.net/cgi- bin/works/Search?search=kolbre+kallakmaa+housing+market&paint=1&_form=AdvancedSearchForm Kolbre, E., Kallakmaa- Kapsta, A., Paadam, K. (2007) Estonian housing market analysis: quantitative and qualitative insights, ERES 2007 London, http://eres.scix.net/cgi-bin/works/Search?search=kolbre+kallakmaa+housing+market&paint=1&_form=AdvancedSearchForm. Krušinskas, R. (2012). Research on Housing Bubbles in the Capitals of the Baltic and Central Europe, Economics and Management 2012. 17(2), ISSN 2029-9338. Kucharska-Stasiak, E. and Matysiak, G. (2004) The Transition of the Polish Real Estate Market Within a Central and Eastern European Context. Real Estate & Planning Working Papers, No. 16. Kutty, N. (2007) Affordability in the United States: Income and Price Contributors, SSRN-id1002249, http://papers.ssrn.com/sol3/papers.cfm?abstract_id=1002249 (15.05.2012) Lahart, J. (2007) In Time of Tumult, Obscure Economist Gains Currency Mr. Minsky Long Argued Markets Were Crisis Prone; His 'Moment' Has Arrived, Wall Street Journal, August 18.

49
Lamine, B. (2009), Estonia: analysis of a housing boom, ECFIN Country Focus, Volume VI, Issue 07, 17.07.2009, http://ec.europa.eu/economy_finance/publications/publication15590_en.pdf, (15.09.2012). Lee, G.K., Chan, E.H. W.(2007) The Analytic Hierarchy Process (AHP) Approach for Assessment of Urban Renewal Proposals, Soc Indic Res (2008) 89:155–168DOI 10.1007/s11205-007-9228-x, Springer Science+Business Media B.V. 2007. LEED for Existing Buildings (2008) Operations & Maintenance Green Building Rating System. U.S. Green Building Council. Leishman, C. (2003), Real Estate Market Research and Analysis. Basingstoke; New York: Palgrave Macmillan, 2003. 232 pp. Linneman, P. D. Megbolugbe, I. F. (1992) Housing affordability: Myth or reality? Urban Studies, 29(3), pp. 369-392. Lithuanian Department of Statistics, http://www.std.lt/lt. Lorenz, D. (2010), Property Valuation & Sustainability: The Role of Valuation Professionals. Sustainability and Its Impact on Real Estate. 6 December 2010. Lorenz, D., and Lützkendorf, T. (2008) Sustainability in Property Valuation: Theory and Practice. Journal of Property Investment & Finance, 26 (6): 482 –521. Lützkendorf, T. and Lorenz, D. (2006) Using an Integrated Performance Approach in Building Assessment Tools. Building Research & Information, 2006, 34(4):334-356. Maclennan, D., Gibb, K.(1993) Housing indicators and research for policy from the persepctive of applied economies, Journal of housing and built environment, Volume 8, Number 1, pp. 49-60,DOI:10.1007/BF02503147. Maclennan, D. and Williams, P. (1990) Affordable Housing in Britain and America, Joseph Rowntree Foundation, York. Maclennan, D., Williams, P. (1990) Housing Finance and Subsidy Systems: accommodating International Experience, Urban Studies December 1990 27, pp.781-784. Malpezzi, S. (1999). A simple Error Correction Model of House Prices. Journal of Housing Economics, Vol. 8, No. 1, pp. 27-62.

50
Marshall, D., Lyall Grant F., Freeman, A. and Whitehead (2000) Getting Rents Right? The place of affordability in the rent setting process: A Summary Report, Discussion Paper 2 Published by Cambridge Housing and Planning Research, University of Cambridge, ISBN 1 86190 204 2. Mayes, D.G. (1979) The Property Boom: The Effects of Building Society Behaviour on House Prices. Oxford: Martin Robertson. McCord, M., McGreal, S., Berry, J.,Haran, M. and Davis, P. (2011) The implications of mortgage finance on housing market affordability." International Journal of Housing Markets and Analysis 4:4 2011: pp.394-417. McParland, C. ,McGreal,S., Adair, A. (2000) Concepts of price, value and worth in the United Kingdom - Towards a European perspective, Emerald, Journal of Property Investment & Finance, Vol. 18, No. 1, pp. 84-102. Meen, G.P. 2001. Modelling Spatial Housing Markets. Theory, Analysis and Policy. Advances in Urban and Regional Economics. Boston, Dordrecht, London: Kluwer Academic Publishers. Meen, G.P. (2003) Housing, Random Walks, Complexity and the Macroeconomy. In: T. O'Sullivan and K. Gibb (Eds), Housing Economics and Public Policy, pp. 90-110. London: Blackwell Publishing. Mengjie, L., Reed, R., Wu, H. (2008) Challenges facing housing affordability in Beijing in the twenty-first century, International Journal of Housing Markets and Analysis Vol1, No 3 (2008), pp. 275-287. Ministry of Finance of the Republic of Estonia, www.fin.ee. Ministry on Finance of the Republic of Latvia, http://www.fm.gov.lv/index.php?id=8. Ministry of Finance of the Republic of Lithuania, http://www.finmin.lt/finmin/lang.do?language=en. Minsky, H (1992) The financial instability hypothesis, Jerome Levy Economics Institute Working Paper, no 74, May. Prepared for P Arestis, M Sawyer and E Elgar (eds), Handbook of radical political economy, 1993. Mostafa, A., Wong, F., and Hui, C. (2006) Relationship between Housing Affordability and Economic Development in Mainland China—Case of Shanghai. J. Urban Plann. Dev., 132(1), 62–70. ISSN (print): 0733-9488.

51
Muellbauer, J., (2010) Household decisions, credit markets and the macroeconomy: implications for the design of central bank models, BIS Working Papers No 306. Muellbauer, J., Murphy, A. (1997) Booms and Busts in the UK Housing Market. – The Economic Journal, No 107, pp.1701-1727. Muellbauer, J.,Williams, D. (2011), “Credit Conditions and the Real Economy: The Elephant in the Room,” CEPR discussion paper no. 8386, Centre for Economic Policy Research, London. Myers, G., Reed, R. and Robinson, J. (2007) The Relationship between Sustainability and the Value of Office Buildings. [WWW] http://www.prres.net/papers/Myers_Reed_Robinson_The_Relationship_Between_Sustainability.pdf (02.03.2010). National Association of Realtors. Economics and Research Division. http://www.realtor.org/research.nsf/pages/HousingInx?OpenDocument (10.04. 2011). Ndubueze (2007) Measuring Housing Affordability: A Composite Approach, Centre for Urban and Regional Studies (CURS), University of Birmingham. Ober-Haus Real Estate Advisors, http://www.ober-haus.com/more-services/market-research/market-reports Ortalo-Magné, F., Rady, S. (2006) Housing Market Dynamics: On the Contribution of Income Shocks and Credit Constraints. Review of Economic Studies, No. 73, pp. 459–485. Poterba, J. M. (1991) Taxation and Housing Markets: Preliminary Evidence on the Effects of Recent Tax Reforms. NBER Working Papers, No. 3270. Quigley, J. , Raphael, S. (2004) Is Housing Unaffordable? Why Isn’t It More Affordable? Journal of Economic Perspectives—Volume 18, Number 1—Winter 2004—Pages 191–214. Saaty, T.L. (1980) The Analytic Hierarchy Process. McGraw Hill, New York, NY. Saaty, T.L. (1994) Fundamentals of Decision Making and Priority Theory with the Analytic Hierarchy Process, RWS Publications, Pittsburgh, Pennsylvania. Scheinkman, J. and Xiong, W., (2003) Overconfidence and Speculative Bubbles, The Journal of Political Economy Vol 111 (6, Dec.), pp.1183- 1219.

52
Schleich, H., Lindholm, A., L. and Falkenbach H. (2010) Environmental Sustainability – Drivers for the Real Estate Investor. Journal of Real Estate Literature, 18 (2): 201–223. Schulz, R. and Werwatz, A. (2005) Real Estate Valuation and Tobin's Q: An Empirical Analysis. ERES Conference Proceedings, June 15-18, 2005, Dublin. Stein, J. (1995) Prices and trading volume in the housing market: A model with down-payment effects. Quarterly Journal of Economics 110, 379–406. Stone, M. (1993) Shelter Poverty: New Ideas on housing Affordability. – Temple University Press. Philadelphia. Statistics Estonia. www.stat.ee. Stephansen, K., Koster, M. (2005) Housing Valuations: No Bubble Apparent. BIS Papers No. 21,pp. 112-123. Retrieved from Bank for International Settlements website:http://www.bis.org/publ/bppdf/bispap21i.pdf. Swartz, R. and Miller, B. (2002) Welfare Reform and Housing POLICY BRIEF, No 16, The Welfare Reform & Beyond initiative, The Brookings Institution, Washington D.C., March. Zabel, J.E. (1999) Controlling for quality in house price indices. Journal of Real Estate Finance and Economics 19: 223-241. Tang, C. (2012) Measuring the affordability of housing association rents in England: a dual approach, International Journal of Housing Markets and Analysis, Vol. 5 Iss: 3, pp.218 – 234. The Appraisal of Real Estate. Twelfth Edition. (2001) Chicago: Appraisal Institute. The European Group of Valuers Associations (2003) European Property and Market Rating: A Valuer´s Guide, TEGoVA, Brussels. Tobin, J. (1969) A General Equilibrium Approach to Monetary Theory. Journal of Money, Credit, and Banking.Vol. 1, No. 1, pp. 15-29. Tsatsaronis, K., Zhu, H. (2004) What drives housing price dynamics: cross-country evidence. BIS Quarterly Review, March. Uus Maa Real Estate Market Review, http://www.uusmaa.ee/est/pages/kasulik-info/turuulevaated.

53
Valuation Information Paper No 13. Sustainability and Commercial Property Valuation (2009). Royal Institution of Chartered Surveyors (RICS), London. Võhandu, L. (1998) Subjektiivsetest hinnangutest objektiivsete tulemusteni, TTÜ Informaatikainstituut. White, W. (2006) Measured wealth, real wealth and illusion of saving, IFC Bulletin No.26, pp. 1- 11. Whitehead, C. (1991) From need to affordability: An analysis of UK housing Objectives, URBAN STUDIES, Vol. 28, No. 6, pp.871-887. Wilcox, S. (2005) Affordability and the intermediate housing market. Local measures for all local authority areas in Great Britan, Joseph Rowntree Foundation, 2005. Wilcox, Steve (2007) Can’t Buy: Can Rent - The affordability of private housing in Great Britain – summary report, Hometrack 2007. Wilkinson, S. and Reed, R. (2008) Property Development. 5th ed. Routledge. London. Wong, E., Fong, T., Li, K. and Choi, H. (2011) Loan-to-value ratio as a macro prudential tool – Hong Kong’s experience and cross-country evidence, Hong Kong Monetary Authority, Working Paper 01/2011. Wood, R., A. (2005) Comparison of UK Residential House Price Indices. BIS, April, http://www.bis.org/publ/bppdf/bispap21p.pdf. Wood G.A., Forbes M., Gibb K., (2005) Direct subsidies and housing affordability in Australian private rental markets, Environment and Planning C: Government and Policy 23(5) 759 – 783. Yates, J. (2007) Affordability and access to home ownership: past, present and future?, Research Report No. 10, Australian Housing and Urban Research Institute Sydney Research Centre , ISBN: 1 921201 67 3. Yates, J., Milligan, V. (2007) Housing affordability: a21st century problem, National Research Venture 3: Housing affordability for lower income Australians, AHURI, Final Report No. 105, ISSN: 1834-7223 ISBN: 1 921201 72 X.

54
This thesis is based on the following published articles: 1. Kolbre, E.; Kallakmaa-Kapsta, A.; Ojala, T. (2009). Estonian Housing Market: Searching for Origins of the boom. Research in Economics and Business: Central and Eastern Europe, 1(2), 59 – 76. 2. Kallakmaa-Kapsta, A.; Kolbre, E. (2013). Estonian housing market: affordability problem and regulatory framework, International Journal of Housing Markets and Analysis, Emerald Housing, Volume 6, Issue 2 (Forthcoming, accepted). 3. Kolbre, E.; Kallakmaa-Kapsta, A.; Ilsjan, V. (2011). Real Estate Quality Assessment for Valuation in the Estonian Real estate Market. G. Prause (Ed.). University-Business Cooperation. (63). Berlin: Beriner Wissenschafts-Verlag (Published).

55
ABSTRACT Before and after the boom: changes in the Estonian housing market Changes in housing prices have essential effects for households and their financial behaviour. A sharp rise in prices can generate a situation where households may face affordability problems. Research regarding housing booms and busts has become a topicality in the recent years. Nevertheless there continues to be significant gaps in understanding the reasons why boom situations initiate and insufficient analyses of their consequences and impacts. The literature is mostly focused on situations in advanced economies (Case and Schiller, 2003; Bordo, 2003; Muellbauer and Murphy, 1997; Burnside et al., 2011; Gabriel et al., 2005; Belsky et al., 2005; Whitehead, 1991; Duca et al. etc.). Historical background and economical development in emerged markets are different from advanced economies and there is a need to fill the gap in academic writings. The purpose of the current Doctoral Thesis is to assess various aspects from the Estonian housing market development, with an aim to identify whether and to what extent the ratios and models used for real estate market analyses in developed countries can be used in transition economies and if necessary, adjust them according to the Estonian housing market conditions. This study investigates the housing market developments from three main aspects – market analyse, housing affordability and quality of housing. The first section presents the theory and literature overview about the basic characteristics of the housing market, relationship between financial and housing markets and on concepts of housing affordability, along with housing quality issues. The second part focus on commonly used methodologies for analysing housing markets and suggests methods for investigating Estonian market dynamics. Part three presents the main results of this thesis. The practical and methodological problems identified in the paper might be interesting for people studying similar issues in other emerging markets. Theoretical contribution - this thesis offers possible solutions on how to elaborate and adapt frequently used methodologies (e.g. Poterba model, Tobin q, P/E - ratio, P/I - ratio, index for measuring housing affordability situation etc.) for investigating developing housing markets using the Estonian market as an example. The Estonian government has made many decisions that have influenced the real estate market, especially the housing market, mostly with the purpose to improve accesses to the housing market. But no research has been done in trying to find an answer for the affordability problem in the housing market in Estonia and also to assess the impact of the regulatory framework. The method worked out by the author is possible to use for future market monitoring. The HAI index is new for the Estonian market, also the use of aggregated LTV ratio.

56
Different factors influence the average housing price, from demand to the supply side. Tobin’s q calculations for the Estonian housing market showed that the most challenging period for property developers on the supply side was in 2003−2007. The housing boom in Estonia was mostly driven by a large credit supply and favourable loan conditions. Evolving housing price booms and a worsening affordability situation are strongly correlated. It is very important to monitor the indicators that point out the possibility that prices are far from fundamentals. Even in this situation, it is difficult to find observable fundamentals that are correlated with price movements. We can use some indicators, according from the purpose of this thesis, as P/I (using average monthly data) or P/E (adopted version Poterba model) for the Estonian market in order to identify a real estate boom and bubble. The P/E ratio was growing fast until 2006, when it achieved its maximum. Taking into consideration the specific features of the Estonian housing market (the underdeveloped rental market, inadequate statistics on rental earnings and a mostly functioning purchases and sales market, which is greatly affected by loan conditions) the Poterba model was correspondingly developed and the share of an owner’s costs in net wages was found. If the Estonian housing rental market statistics are more adequate in the future, it will be possible to develop the model similarly to the method provided by Poterba. Although the real estate quality rating system treats all quality attributes (location and plot, construction quality and management) as equal, the research showed that in practice valuers attach extremely great importance to the attribute ‘location and plot’ and little significance to factors under the attribute ‘management’. From the aspect of sustainability; however, energy, water, heating expenses and waste disposal, which are under the attribute ‘management’, has a significant role. In 2012 repeated research shows that energy consumption and utility service costs became more important. This study has also shown the importance on regulatory decisions, which in our case was the waiving of limitations for all mortgage loans in 2002. The recommendation is for the government to change the law of credit institutions and reinstate the restrictions for mortgage loans (LTV ratio). It is also suggested for households to pay more attention on the household’s credibility to avoid unrealistic expectations. The problem with data availability and underdeveloped rental market has limited the use of some well-known methodologies for investigating Estonian housing market developments. Considering the shortage of disclosure research about the housing markets in CEE countries this thesis proposes new theoretical and practical approaches. This research has cast different questions in need of further investigation. If the person with average monthly income cannot afford to pay for an average home (which in the Estonian case is the flat) there is the affordability problem. There is a need of future investigation of housing affordability problems and more research with purpose to find solutions for different types of households.

57
KOKKUVÕTE Muutused Eesti eluasemeturul enne ja pärast buumi Kinnisvarahindade järsk tõus, buumide ja mullide tekkimine ning sellele järgnevate langusperioodide analüüsimine on kirjanduses viimastel aastakümnetel palju käsitlemist leidnud (Case ja Schiller, 2003; Bordo, 2003; Muellbauer ja Murphy, 1997; Burnside et al., 2011 etc.). Kinnisvaraturu, sealhulgas eluasemeturu, arengu eri aspekte on põhjalikult uuritud just arenenud majandusega riikide näidete varal (Gabriel et al., 2005; Belsky et al., 2005; Whitehead, 1991; Maclennan ja Gibb, 1993; Duca et al., 2012; Tang, 2012 etc.). Tunduvalt vähem on käsitlemist leidnud vähemarenenud turud ning sealsed probleemid (Kucharska-Stasiak ja Matysiak, 2004; Balázs ja Dubravko, 2007; etc). Enamasti on põhjuseks analüüsi aluseks olevate algandmete puudumine, nende mittetäielikkus või isegi ebausaldusväärsus. 1990-ndate erastamisprotsessiga alguse saanud Eesti eluasemeturu ajalugu on lühike, kuid tänaseks on juba jõutud läbida hinnamulliga kulmineerunud ülikiire kasvu periood ning sellele järgnev langusperiood, mis on tänaseks asendunud turu rahulikuma arenguga. Eesti eluasemeturg on suhteliselt noor võrreldes arenenud riikide turgudega ning seetõttu on sel turul ka oma eripära. Samuti iseloomustab Eesti turgu erastamisprotsessi tulemusel tekkinud koduomanike suur osakaal võrreldes eluaseme üürijatega. Kui varasemalt räägiti eluasemete vajadusest ning selle vajaduse rahuldamisest, siis tänaseks on kirjanduses kasutusele võetud uus termin, milleks on eluaseme kättesaadavus ehk taskukohasus. Kinnisvara hindade järsk tõus, millele järgnes kinnisvaramulli tekkimine ning selle lõhkemine, tõi kaasa vajaduse pöörata senisest enam tähelepanu hinnatõusu mõjutavate tegurite väljaselgitamisele ning hinnatõusuga kaasnevate mõjude uurimisele. Doktoritöös on uuritud Eesti eluasemeturu arenguid erinevatest aspektidest lähtuvalt eesmärgiga leida metoodikad, mis sobiksid kasutamiseks nii Eesti eluasemeturu kui ka teiste arenevate turgude analüüsimisel. Uurimisülesandeks on leida vastuseid eluasemeturu arengut mõjutavate tegurite kohta; hinnata eluaseme kättesaadavust ja regulatiivse raamistiku võimalikku mõju ning hinnangu andmine eluasemete kvaliteedile ja kvaliteeti mõjutavate tegurite hierarhiale. Töö koosneb kolmest osast. Esimene peatükk käsitleb teoreetilist tausta ning samuti on antud kirjanduse ülevaade, teine osa tutvustab kasutatavaid metoodikaid ning teise osa viimases alapeatükis on tabeli kujul antud koondülevaade töö uurimiseesmärkidest koos eesmärkide saavutamiseks kasutatavate metoodikate ning ka mõningate kirjanduslike algallikatega. Kolmas osa tutvustab töö tulemusi. Töö baseerub lisades 2-4 toodud kolmel artiklil (millest kaks on eelnevalt avaldatud ning kolmas ilmub 2013. aastal). Töös leiavad käsitlemist mitmed teemad, mille kohta varasemad uuringud puuduvad (eluaseme kättesaadavuse temaatika, regulatiivse raamistiku mõju hindamine, hinnangute andmine kvaliteeti mõjutavate tegurite hierarhiale jne).

58
Esimene artikkel “Estonian Housing Market: Searching for Origins of the Boom” keskendub Eesti eluasemeturu arengute hindamisele. Turu dünaamikat analüüsitakse nii nõudluse kui ka pakkumise poole pealt. Tulenevalt Eesti eluasemeturu arengustaadiumist, eripärast ning andmete kättesaadavusest ei ole võimalik rakendada mitmeid arenenud turgude analüüsimisel kasutatavaid metoodikaid ning seetõttu on autor välja pakkunud lahendusi olemasolevate metoodikate (P/E, Poterba mudel) modifitseerimiseks. Eluasemete hinna ja majapidamiste sissetulekute suhte analüüs tõestas selgelt kinnisvarabuumi tekkimist Eesti eluasemeturul ning pakkumist iseloomustava Tobin q (Tobin, 1969) arvutused näitasid, et parim aeg kinnisvara arendajatele oli Eesti turul vahemikus 2003−2007, kui Tobin q muutus 1.02-lt 1.76-le. Modifitseeritud P/E näitaja kasvas buumi ajal ning saavutas maksimumi 2006. aastal. Poterba mudeli (Poterba, 1991) modifikatsiooni kasutades otsiti võimalikku tasakaaluhinda Tartu ja Tallinna eluasemeturu näitel, mis mudeli kohaselt osutusid kõrgemaks kui reaalsed tehinguhinnad. Poterba mudeli tulemuste tõlgendamisel peab arvestama eluasemete rendituru vähese arenguga ning ametliku statistika ebapiisavusega. Teine artikkel „Estonian housing market: affordability problem and regulatory framework” käsitleb finants- ja kinnisvaraturgude vahelisi seoseid. Krediit ja selle kättesaadavus on üks tähtsamaid eluasemeturgu mõjutavaid tegureid. Madalad laenuintressid ning pankade ekspansiivne laenupoliitika olid ühed olulisemad põhjused, mis tingis kinnisvara hindade järsu tõusu perioodil 2002–2006. Ka ei saa mainimata jätta regulatiivse raamistiku võimalikku mõju ning autori hinnangul võib pidada üheks mulli tekkimise põhjuseks ka krediidiasutuste seadusest kinnisvara tagatisel antavate laenude maksimaalmäära piirangu kaotamist 2002. aastal. Buumi ajal ning hinnamulli tekkimise korral võivad majapidamised sattuda raskustesse eluaseme soetamisel ning juba eluaset omavad majapidamised ei pruugi olla enam suutelised laenumakseid tasuma. Seetõttu on oluline uurida võimalike buumide teket ning seda, millal on oht, et keskmise eluaseme soetamine võib muutuda keskmise sissetulekuga isikule ülejõukäivaks. Eluaseme kättesaadavust ehk taskukohasust on erinevad autorid väga erinevalt defineerinud, ka on antud probleemil palju erinevaid tahke (Gabriel et al., 2005; Yates, 2007; Berry, 2006; Wood et al., 2005,Belsky et al., 2005; Jewkes et al., 2010,Gibb, 2011; Gurran and Whitehead, 2011). Taskukohasust on võimalik hinnata väga erinevatest vaatenurkadest (McCord et al., 2011). Doktoritöös hinnati keskmise eluaseme kättesaadavust Eesti turul kahest seisukohast (ostujõu aspekt ning suutlikkus tasuda eluasemelaenu), kuid tulevikus vajaks see teema kindlasti edasiarendamist, sest mainitud metoodikad ei arvesta majapidamiste tehtavaid muid kulutusi. Uudse lahendusena saab välja tuua autori koostatud indeksi, mille abil on võimalik hinnata eluaseme kättesaadavust Eesti turul, lähtudes suutlikkusest tasuda eluasemelaenu makseid. Indeksi kohaselt oli eluaseme kättesaadavus halvim perioodil 2005–2008 ning olukord hakkas parenema pärast 2009. aastat. Antud indeksit saab kasutada ka teiste arenevate turgude analüüsil, kus on

59
probleeme algandmete kättesaadavusega. Majapidamise ostujõudu eluaseme soetamiseks väljendava näitaja kohaselt on keskmist sissetulekut omaval isikul olnud raskusi eluaseme ostmisel juba alates aastast 2002. Regulatiivse raamistiku võimaliku mõju hindamiseks on autor kasutanud agregeeritud LTV näitajat, mille abil hinnatakse finantsturu ja eluasemeturu vahelist proportsiooni, ning arvutuste kohaselt hakkas agregeeritud LTV näitaja kasvama peale 2002. aastat ning näiteks 2008. aastal oli Eestis väljastatud eluasemelaenude maht suurem kui samal perioodil soetatud eluasemete väärtus. Agregeeritud LTV kasutamine on uus lähenemine, sest traditsiooniliselt väljendab mainitud näitaja majapidamisele või isikule antava laenu ja tagatiseks oleva kinnisvara turuväärtuse suhet. Kolmas artikkel „Real Estate Quality Assessment for Valuation in the Estonian Real Estate Market” analüüsib juba eluaseme kättesaadavuse probleemi käsitlemisel üles kerkinud eluaseme kvaliteedi ja selle võimaliku hindamise temaatikat. Eluaseme kvaliteedi hindamise küsimus on muutunud aktuaalsemaks just pärast hinnamulli lõhkemist. Kvaliteeti mõjutavate tegurite hierarhia hindamiseks on kasutatud Saaty meetodit (Saaty, 1980). Kvaliteedi hindamiseks on välja töötatud kompleksnäitaja, mis sisaldab kolme põhilist väärtust mõjutavat tegurit: asukoht, ehitise kvaliteet ja tegevuskulude tase (tegus juhtimise kvaliteet). Olulise aspektina tuleb silmas pidada seost finantsturgudel toimuvaga ning ka arvestada valitsuse võimaliku sekkumise küsimusega. Finantsvahenduses tuleks tulevikus rohkem tegeleda võimalike protsükliliste mõjude vähendamisega ning seadusandluse poole pealt oleks mõistlik uuesti kehtestada krediidiasutuste seaduses maksimaalne laenusumma piirmäär kinnisvaraga tagatud laenudele või vähemalt rakendada seda eluasemelaenude puhul. Doktoritöö tulemused omavad nii teoreetilist kui ka praktilist tähtsust. Töö teoreetiliseks panuseks on uute metoodikate kasutuselevõtmine (indeks eluaseme kättesadavuse hindamiseks, agregeeritud LTV suhte kasutamine, kvaliteedi hindamise kompleksnäitaja väljatöötamine) ning ka mitmete arenenud majandusega riikide eluasemeturgudel kasutusel olevate metoodikate edasiarendamine (näiteks Poterba mudel) eesmärgiga muuta need sobivaks kasutamiseks Eesti eluasemeturu analüüsimisel. Praktilise poole pealt on pakutud mitmeid lahendusi, mis aitavad uurida Eesti eluasemeturul toimuvat ning mille alusel oleks võimalik teha eluasemepoliitikat puudutavaid otsuseid. Töös esitatud metoodikaid on võimalik kasutada Eesti eluasemeturu arengute hindamisel ning nad on sobilikud kasutamiseks sarnaste turgude analüüsimisel, nagu seda on teised Ida-Euroopa eluasemeturud, mille tekkimine ja areng on sarnane Eestiga. Autori soovitus on tulevikus senisest enam pöörata tähelepanu kinnisvaraturul toimuva analüüsimisele ning selleks saab kasutada töös välja pakutud metoodikaid ning näitajaid, mis on kohandatud Eesti eluasemeturu analüüsimiseks. Töö kirjutamisel oli takistuseks algandmete kättesaadavus, mis raskendas oluliselt mitme metoodika kasutamist (näiteks usaldusväärsed andmed Eesti üürituru kohta puuduvad). Ka tuleb arvestada asjaoluga, et

60
analüüsi aluseks olevad aegread on suhteliselt lühikesed. Tulevikus on plaanis regressioonianalüüsi kasutades uurida keskmise eluaseme hinda mõjutavaid tegureid pikema ajaperioodi vältel ning täiendavalt uurida ka eluaseme kättesaadavust, võttes arvesse majapidamiste poolt tehtavaid kulutusi.

61
Curriculum Vitae 1. Personal data Name: Angelika Kallakmaa-Kapsta Date and place of birth: March 17, 1966, Tartu, Estonia Citizenship: Estonian 2. Contact information Address: Tallinn University of Technology,
Akadeemia tee 3,Tallinn 12618 Phone: +372 620 4057 E-mail: [email protected] 3. Education
4. Language competence/skills (fluent, average, basic skills) Language Level
Estonian Fluent
German Fluent
English Average
Russian Average
French Basic skills
5. Special Courses Period Educational or other organisation 1997 Schünemann Stiftung grant, University of Göttingen 1994 Rotary grant, Deutsche Bank AG, Göttingen, Germany
Educational institution Graduation year
Education (field of study/degree)
Tallinn University of Technology Expected 2013
PhD
University of Tartu 1993-1996 Postgraduate study in banking (MA)
University of Tartu 1989 Diploma in economic cybernetics (equivalent to MA)
Tartu 10. Keskkool 1984 Secondary School

62
6. Professional Employment Period Organisation Position 2004 - … Tallinn University of
Technology Lecturer
2002 - … Tallinn City Government, Tallinn City Council
Adviser, consultant
1999 - 2001 Ministry of Finance Estonia Adviser in economic and budget policy
1998 - 2005 Estonian Business School Lecturer (1998-2001) 1997 - 1998 Hansapank Project manager
(working out strategies for private persons)
1995 - 1999 Tartu University, Chair of Banking
Lecturer
1995 - 1997 Tartu New Enterprise Centre
Managing director
1993 - 1995 AS Primex Mentor Project manager and lecturer, organizing cooperation projects between Estonia and Germany
1989 - 1990 Chair of economics, Estonian Agriculture Academy
Assistant
7. Scientific work Administrative and other duties 2006 – 2011 Coordinator of euro adoption commission and process
in Tallinn City Government 1998 – 2001 Estonian Business School, acting head of Chair of
Economics 1999 – 2002 Member of Committee State orders from Universities 2000 – 2002 NDP (National Development Plan) for Estonia, editor 1999 – 2000 Member of Foundations Reforming Committee 1999 – 2000 Member of Social-economic Board of Estonia 1999 – 2002 Member of Government Delegation in Negotiation with
Trade-unions 1999 – 2001 Member of Workgroup for preparing new State Budget
Law in Estonia 2002 – 2004 Board member of new Financing Model for City
Government Tallinn 2002 – 2004 Member of Risk Management Committee Tallinn

63
2002 – … Member of negotiation Committee between the Government and Local Governments in Estonia, Vice Chairman of financing Committee 2002-2008
Public and social activities 2002 – … Member of Society of Estonian Economists 2003 – … Member of SUERF (Société Universitaire Européenne de
Recherches Financières) Publications: Kallakmaa-Kapsta, A.; Kolbre, E. (2013). Estonian housing market: affordability problem and regulatory framework, Emerald, “International Journal of Housing Markets and Analysis “Emerald Housing, Volume 6, Issue 2 (Forthcoming, accepted). Kolbre, E.; Kallakmaa-Kapsta, A. (2012). Estonian housing market after crisis: Searching for Origins of the demand Changes. 19th Annual Conference ERES 2012, 13th-16th June 2012 in Edinburgh, Scotland, 2012. Kallakmaa, A.; Kolbre, E. (2011). Estonian housing market: affordability problem and regulatory framework. In: ERES 2011 18th Annual Conference, Eindhoven (Netherlands), 15- 18 June 2011. Kallakmaa, A. (2011). Estonian housing market: after housing boom. 55th IFHP World Congress “The impact of housing and planning on the economic environment” 11-14th September 2011 in Tallinn, Estonia, 2011. Kolbre, E.; Kallakmaa-Kapsta, A.; Ilsjan, V. (2011). Real Estate Quality Assessment for Valuation in the Estonian Real estate Market. G.Prause (Toim.). University-Business Cooperation. (197 - 213). Berlin: Beriner Wissenschafts-Verlag. Kolbre, E.; Kallakmaa, A. (2011). What kind of demands does a new real estate growth make on real estate quality in Estonia? In: ERES 2011 18th Annual Conference, Eindhoven (Netherlands), 15.-18. June 2011. Kallakmaa, A. (2010). Lessons from housing boom in Estonia. “Macroeconomic risks resulting from massive foreign exchange lending to household sector” (Warszawa) 20. October 2010. Kolbre, E.; Kallakmaa, A.; Mihkleson, P. (2010). Real Estate Quality Assessment Problems In The Estonian Real Estate Market . ERES 2010, Milan 23.-26. June 2010.

64
Kallakmaa, A.; Kolbre, E. (2010). Estonian Housing Market - Before Euro Adoption. In: ERES 2010, Milan 23.-26. June 2010. Kolbre, E.; Kallakmaa-Kapsta, A.; Ojala, T. (2009). Estonian Housing Market: Searching for Origins of the boom. Research in Economics and Business: Central and Eastern Europe, 1(2), 59 - 76. Kallakmaa-Kapsta, A.; Kolbre, E. (2009). Estonian Real Estate Market - The Day After Housing Boom. 16th Annual European Real Estate Society Conference, Stockholm, July 11-14 2009. ERES Digital Library at http://eres.scix.net, 2009. Kolbre, E.; Kallakmaa-Kapsta, A.; Paadam, K. (2007). Estonian Housing market analysis: quantitative and qualitative insights. In: abstract book: 14th Annual European Real Estate Society Conference, London, 27- 30 June 2007. Kallakmaa-Kapsta, A. (2007). Factors influencing developments in the real estate market. Kroon & Economy (6 - 17). Eesti Pank. Kallakmaa, A. (2007). Kinnisvaraturu arengut mõjutavad tegurid. Kroon ja majandus (6 - 17). Eesti Pank. Kolbre, E.; Kallakmaa-Kapsta, A. (2006). Housing market development in Estonia: is the real estate boom expected. In: Abstract book: 13th Annual European Real Estate Society Conference, Weimar, June 7-10 2006. Kolbre, E.; Kallakmaa-Kapsta, A. (2006). Housing Market Development in Estonia: Is There a Real Estate Boom? Working papers in economics (TUTWPE) (27 - 46). Tallinn: Tallinn University of Technology. Kallakmaa, A. (2002). Raha ja pangandus. Tallinn: EBS Print. Kallakmaa, A. (2002). Avaliku sektori ökonoomika (loengukonspekt). Tallinn: EBS Print. Kallakmaa, A. (2002). Raha ja panganduse loengukonspekt (täiendatud trükk). Tallinn: EBS Print. Kallakmaa, A. (2002). Finantsvahendus. Tallinn: EBS Print. Kallakmaa, A. (2001). Õppevahend "Raha ja pangandus". Tallinn: EBS Print. Kallakmaa, A. (2000). Raha ja pangandus. Tallinn: EBS Print.

65
Kallakmaa, Angelika (2000). Financing Local Governments. EBS review, 11, 43 - 44. Kallakmaa, A. (1999). Üliõpilaste kirjalike tööde koostamise juhend. Tallinn: EBS Print. Kallakmaa, Angelika (1999). Pangandusmarketing – teooria ja selle rakendamise võimalused. Teadustegevus IV, Tallinn (14 - 16). EBS Print. Kallakmaa, A. (1997). Eraisikute säästmise ergutamine pangahoiuste vahendusel. Eesti Vabariigi majanduspoliitika ja integreerumine Euroopa Liiduga : teadus- ja koolituskonverentsi ettekanded-artiklid (78 - 81). Mattimar OÜ. Kallakmaa, A. (1995). Deposit policy. Mart Sõrg (Toim.). Financial issues of transition economies: proceedings of the second academic conference, Tartu, April 27-28, 1995 (96). Tartu, Tartu Ülikooli kirjastus: Tartu Ülikool. 8. Defended theses Angelika Kallakmaa, Traumatismi majanduslik resultaat, University of Tartu, 1989. Supervisor Helje Kaldaru (University of Tartu), opponent Alari Purju (Tallinn University of Technology). This paper received a research award from the University of Tartu (June 23, 1989). 9. Main areas of scientific work / Current research topics: Real Estate Market; Financial Intermediation and Public Finance 10. Other research projects: Financial analyses of educational institutions in the local government of Viimsi (2009).

66
Elulookirjeldus 1. Isikuandmed Ees- ja perekonnanimi: Angelika Kallakmaa-Kapsta Sünniaeg ja -koht: 17.03.1966 Tartu Kodakondsus: Eesti Vabariik
2. Kontaktandmed Aadress: Tallinna Tehnikaülikool, Akadeemia tee 3,Tallinn 12618 Telefon : +372 620 4057 E-posti aadress: [email protected]
3. Hariduskäik
4. Keelteoskus (alg-, kesk- või kõrgtase) Keel Tase Eesti Kõrgtase Saksa Kõrgtase Inglise Kesktase Vene Kesktase Prantsuse Algtase
5. Täiendusõpe Õppimise aeg Täiendusõppe teema ja õppe korraldaja
1997 Schünemann Stiftung stipendium, Göttingeni ülikool, Saksamaal, külalisuurija
1994 Göttingeni Rotary klubi stipendium, Deutsche Bank AG Göttingeni filiaal, praktika
Õppeasutus (nimetus lõpetamise ajal)
Lõpetamise aeg
Haridus (eriala/kraad)
Tallinna Tehnikaülikool, majandusteaduskond
Oodatav 2013
Filosoofiadoktor
Tartu Ülikool, majandusteaduskond
1993-96 MA programm (raha ja pangandus)
Tartu Ülikool, majandusteaduskond
1989 Diplom (MA vastav kraad) majandusteadlane-matemaatik (majandusküberneetika eriala)
Tartu 10. Keskkool 1984 Gümnaasium/keskkool

67
6. Teenistuskäik Töötamise aeg Tööandja nimetus Ametikoht 2004 - … Tallinna Tehnikaülikool Lektor 2002 - … Tallinna Linnavolikogu,
Tallinna Linnavalitsus Nõunik, konsultant
1999 - 2001 Rahandusministeerium Nõunik, majanduspoliitika talitluse juhataja
1998 - 2005 Estonian Business School Lektor, majanduseteooria õppetooli juhataja kt. (1998 - 2001)
1997 - 1998 Hansapank Eraisikute teenindamise projektijuht
1995 - 1999 Tartu Ülikool, majandusteaduskond, raha ja panganduse õppetool
Lektor
1995 - 1997 Tartu Uusettevõtluskeskus Tegevdirektor 1993 - 1995 AS Primex Mentor Saksakeelsete
projektide projektijuht 1990 - 1992 lapsehoolduspuhkus 1989 - 1990 Eesti Põllumajanduse
akadeemia Majanduse üldteooria kateeder, assistent
7. Teadustegevus: Administratiivne ja muu tegevus 2002 - ... Kohalike Omavalitsuste Koostöökogu liige, läbirääkimiste rahanduse töörühma liige 2006 - 2011 Eurole ülemineku ettevalmistamise koordineerimine Tallinna linnavalitsusese ametites ja hallatavates asutustes 2002 - 2004 Tallinna linna finantsriskide juhtimise komitee liige 2002 - 2004 Tallinna linna finantsjuhtimise mudeli juurutamise juhtgrupi liige 2000 - 2002 Maailmapanga projekti "Building Local Government Capacity in Support of Fiscal Decentralization of Estonia" ekspertgrupis 2000 - 2002 Riikliku arengukava NDP (National Development Plan) koostamine, toimetaja 1999 - 2002 Sotsiaalmajandusnõukogu liige 1999 - 2002 Riikliku koolitustellimuse komisjoni liige 1999 - 2002 Vabariigi Valitsuse delegatsiooni liige läbirääkimistel TALO-ga 1999 - 2001 Riigieelarve baasseaduse töögrupp 1999 - 2000 Eesti Vabariigi Sihtasutuste reformi töögrupp

68
Kuulumine teadusorganisatsioonidesse 2002 - … Eesti Majandusteaduste Seltsi liige 2003 - … rahvusvahelise finantsistide organisatsiooni SUERF (Société Universitaire Européenne de Recherches Financières) liige Publikatsioonid: Kallakmaa-Kapsta, A.; Kolbre, E. (2013). Estonian housing market: affordability problem and regulatory framework, Emerald, “International Journal of Housing Markets and Analysis “Emerald Housing”, Volume 6, Issue 2 (Forthcoming, accepted). Kolbre, E.; Kallakmaa-Kapsta, A. (2012). Estonian housing market after crisis: Searching for Origins of the demand Changes. 19th Annual Conference ERES 2012, 13th-16th June 2012 in Edinburgh, Scotland, 2012. Kallakmaa, A.; Kolbre, E. (2011). Estonian housing market: affordability problem and regulatory framework. In: ERES 2011 18th Annual Conference, Eindhoven (Netherlands), 15- 18 June 2011. Kallakmaa, A. (2011). Estonian housing market: after housing boom. 55th IFHP World Congress “The impact of housing and planning on the economic environment” 11-14th September 2011 in Tallinn, Estonia. Kolbre, E.; Kallakmaa-Kapsta, A.; Ilsjan, V. (2011). Real Estate Quality Assessment for Valuation in the Estonian Real estate Market. G.Prause (Toim.). University-Business Cooperation. (197 - 213). Berlin: Beriner Wissenschafts-Verlag. Kolbre, E.; Kallakmaa, A. (2011). What kind of demands does a new real estate growth make on real estate quality in Estonia? In: ERES 2011 18th Annual Conference, Eindhoven (Netherlands), 15.-18. June 2011. Kallakmaa, A. (2010). Lessons from housing boom in Estonia. „Macroeconomic risks resulting from massive foreign exchange lending to household sector” (Warszawa) 20. October 2010. Kolbre, E.; Kallakmaa, A.; Mihkleson, P. (2010). Real Estate Quality Assessment Problems In The Estonian Real Estate Market . ERES 2010, Milan 23.-26. June 2010. Kallakmaa, A.; Kolbre, E. (2010). Estonian Housing Market - Before Euro Adoption. In: ERES 2010, Milan 23.-26. June 2010.

69
Kolbre, E.; Kallakmaa-Kapsta, A.; Ojala, T. (2009). Estonian Housing Market: Searching for Origins of the boom. Research in Economics and Business: Central and Eastern Europe, 1(2), 59 - 76. Kallakmaa-Kapsta, A.; Kolbre, E. (2009). Estonian Real Estate Market - The Day After Housing Boom. 16th Annual European Real Estate Society Conference, Stockholm, July 11-14 2009. ERES Digital Library at http://eres.scix.net, 2009. Kolbre, E.; Kallakmaa-Kapsta, A.; Paadam, K. (2007). Estonian Housing market analysis: quantitative and qualitative insights. In: abstract book: 14th Annual European Real Estate Society Conference, London, 27- 30 June 2007. Kallakmaa-Kapsta, A. (2007). Factors influencing developments in the real estate market. Kroon & Economy (6 - 17). Eesti Pank. Kallakmaa, A. (2007). Kinnisvaraturu arengut mõjutavad tegurid. Kroon ja majandus (6 - 17). Eesti Pank. Kolbre, E.; Kallakmaa-Kapsta, A. (2006). Housing market development in Estonia: is the real estate boom expected. In: Abstract book: 13th Annual European Real Estate Society Conference, Weimar, 7-10 June 2006. Kolbre, E.; Kallakmaa-Kapsta, A. (2006). Housing Market Development in Estonia: Is There a Real Estate Boom? Working papers in economics (TUTWPE) (27 - 46). Tallinn: Tallinn University of Technology. Kallakmaa, A. (2002). Raha ja pangandus. Tallinn: EBS Print. Kallakmaa, A. (2002). Avaliku sektori ökonoomika (loengukonspekt). Tallinn: EBS Print. Kallakmaa, A. (2002). Raha ja panganduse loengukonspekt (täiendatud trükk). Tallinn: EBS Print. Kallakmaa, A. (2002). Finantsvahendus. Tallinn: EBS Print. Kallakmaa, A. (2001). Õppevahend "Raha ja pangandus". Tallinn: EBS Print. Kallakmaa, A. (2000). Raha ja pangandus. Tallinn: EBS Print. Kallakmaa, Angelika (2000). Financing Local Governements. EBS review, 11, 43 - 44.

70
Kallakmaa, A. (1999). Üliõpilaste kirjalike tööde koostamise juhend. Tallinn: EBS Print. Kallakmaa, Angelika (1999). Pangandusmarketing- teooria ja selle rakendamise võimalused. Teadustegevus IV, Tallinn (14 - 16).EBS Print. Kallakmaa, A. (1997). Eraisikute säästmise ergutamine pangahoiuste vahendusel. Eesti Vabariigi majanduspoliitika ja integreerumine Euroopa Liiduga : teadus- ja koolituskonverentsi ettekanded-artiklid (78 - 81).Mattimar OÜ. Kallakmaa, A. (1995). Deposit policy. Mart Sõrg (Toim.). Financial issues of transition economies : proceedings of the second academic conference, Tartu, April 27-28, 1995 (96). Tartu, Tartu Ülikooli kirjastus: Tartu Ülikool. 8. Kaitstud lõputööd Angelika Kallakmaa, Traumatismi majanduslik resultaat, Tartu Ülikooli majandusteaduskond, majandusteadlase matemaatiku eriala, 1989. Juhendaja Helje Kaldaru (Tartu Ülikool), oponent Alari Purju (Tallinna Tehnikaülikool). Antud töö sai Tartu Ülikooli majandusteaduskonna teadustööde konkursil teise auhinna (23. juuni 1989). 9. Teadustöö põhisuunad Kinnisvara- ja finantsökonoomika, avaliku sektori rahastamine. 10. Teised uurimisprojektid Viimsi valla haridusasutuste finantsanalüüs (2009).

71
Appendix 1 Living space per capita m²
0
5
10
15
20
25
30
35
1997
1998
1999
2000
2001
2002
2003
2004
2005
2006
2007
2008
2009
2010
2011
2012
Estonia
Latvia
Lithuania
Source: Statistics Estonia, Latvia, Lithuania

72
Appendix 2 Estonian Housing Market: Searching for Origins of the Boom Ene Kolbre Tallinn School of Economics and Business Administration, Tallinn University of Technology Akadeemia tee 3, 12618 Tallinn, Estonia Phone: +372 6203 952, e-mail: [email protected]
Angelika Kallakmaa-Kapsta Tallinn School of Economics and Business Administration, Tallinn University of Technology Akadeemia tee 3, 12618 Tallinn, Estonia Phone: +372 6204 057, e-mail: [email protected]
Taavi Ojala Tallinn School of Economics and Business Administration, Tallinn University of Technology Akadeemia tee 3, 12618 Tallinn, Estonia Phone: +372 6203 952, e-mail: [email protected]
Abstract This paper studies the Estonian housing market, which, being the market with fastest growing prices in CEE, has undergone a rapid growth that has been often explained solely by an active convergence process to more advanced European countries. The study seeks to discuss the effects of changes in the economic environment on the Estonian housing market; outline the dynamics of the housing market development and assess this using ratio analysis and the Poterba model. Considering the specific features of the Estonian housing market, the paper further develops the Poterba model. The main question addressed in the study is whether the large price increases in the Estonian housing market can be interpreted as a housing boom. The research results confirm the presence of a price bubble in the housing market, which burst in 2007. The practical and methodological problems identified in the paper might be interesting for people studying similar issues on other emerging markets. JEL classification codes: L85, R22; R31 Keywords: housing market, Estonia 1. Introduction Research of real estate market, including housing market, has been topical for a long time. The studies have covered the impact of economic environment on demand and supply and on real estate value in old, developed real estate markets (e.g. Gallin, 2003) and in recent years also in new CEE markets (Kucharska-Stasiak and Matysiak, 2004; Balázs and Dubravko, 2007; etc). Tobin’s q concept has often been used to analyse supply and long-term changes

73
in housing markets (Barot and Yang, 2002; Malpezzi, 1999; Mayes, 1979; Meen, 2001; etc.) as well as in real estate related studies (Schulz and Werwatz, 2005).
In a dynamic analysis of housing prices in the long term, many analysts (Garratt, 2001; Case and Shiller, 2003; Gallin, 2006; etc.) attribute the greatest significance to real household incomes (household incomes adjusted for inflation) and claim that in the long term a stable relationship is formed between real household incomes and housing prices.
The problems of housing boom and burst of the bubble have been analysed by Angell and Williams (2005), Helbing (2005), Hilbers et al. (2001) among many others. One can find many ways to define a “housing boom” in literature. Angell and Williams (2005) define a housing boom as a 30% or greater increase in inflation adjusted (real) home prices during any three-year period. Helbing (2005) concluded in his research of real estate cycles in 14 countries during 1970-2002 that the market is booming when the price rise in two years is at least 32% corrected with inflation. In his opinion the boom does not always mean overheating of the market or formation of a so-called bubble. He defined the bubble as a situation where the property prices are considerably higher than their justified value.
Key economic factors believed to show the possibility of a boom are fast economic growth and loan volume growth, liberalised loan conditions, taking larger credit risks, low interest rates, overpriced properties and positive expectations for the future (Hilbers et al., 2001). It has been identified that asset price bubbles are difficult to identify in real time and are thus often only identified ex post. However, there appear to be a number of tools that can help to identify the emergence of bubbles (ECB, 2005). Housing price busts occur on average approximately once every 20 years, last about 4 years, and involve price declines of about 30 percent. While only about one fourth of the equity price booms have been followed by busts, about 40 percent of housing price booms have ended in a bust (IMF, 2003). Housing price busts have been associated with more severe macroeconomic and financial developments than equity price busts (ibid.).
The Estonian real estate market, being the smallest among Central and Eastern European (CEE) real estate markets, started to grow rapidly in 2000. The biggest (60% of the value of transactions) and most active (70% of the number of transactions) part of the real estate market is the housing market. The price rise in the housing market was the biggest across all real estate market sectors, not only in Estonia but among all CEE countries in 2002-2006. The Estonian housing market studies so far have been focused mainly on identifying the market trends and comparing them to changes in the economic background system (Kolbre and Kallakmaa-Kapsta, 2006). Also, the real estate market has been modelled by several authors (Randveer and Rell, 2000; Matsik, 2006). However, there are no studies conducted to assess the development of the Estonian housing market from both supply and demand side, using

74
simultaneously different ratios and models, on the basis of which to identify the roots of overpricing of real estate.
The purpose of the current study is to assess from various aspects the Estonian housing market development. The housing market developments have been investigated in this study from three main aspects. First, the development of and changes in Estonian economic environment are evaluated and links to the general development of the whole real estate market and especially of housing market are provided. Secondly, in greater detail the demand and factors influencing demand in the housing market are analysed. Thirdly, the supply of the housing market and the factors that facilitate and inhibit its development are investigated. In order to find an answer to the main question of the study, whether large price increases in the housing market can be defined as a housing boom, the market condition is assessed additionally with the help of such indicators as price-to-income ratio, price-to-earnings ratio, Tobin’s q and Poterba model. The aim of this paper is also to identify whether and to what extent the ratios and models used for real estate market analyses in developed countries can be used in transition economies and, if necessary, adjust them according to the Estonian housing market conditions.
Such a research would provide new information for market actors, first of all developers and investors active in the Estonian real estate market as well as market analysts and market participators in other CEE countries who evaluate the market situation in new, rapidly growing real estate markets.
The outline of the paper is as follows. The next section provides an economic background to housing market development in Estonia. The third section provides an overview of the theoretical and empirical literature on the determinants of demand, supply and prices of living space and the methods used in this research. The fourth section assesses the market condition using different ratios and Poterba model. The last section presents the estimation results and concluding remarks. 2. Economic Background and Housing Market Development in Estonia 2.1 Economic Factors Influencing the Housing Market The annual economic growth in Estonia was very fast in 2000−2006. The growth was encouraged by favourable investment legislation and loan conditions, and low interest rates. However, the growth rate has been declining since the end of 2007.
The annual growth of private consumption peaked in 2006 at 12.8% (with remarkable growth in the fourth quarter of 2005). The largest contributors to the growth of private consumption were the rapid growth rates of employment and salaries, the decrease in the income tax rate and the increasing debt burden of households. Domestic demand also continued its rapid growth in the first months of 2007. Although income growth was still quick in 2007, private consumption started to decline at the end of the year. This was revealed

75
in a less moderate growth of retail sales and the slowing down of income growth. Instability has been increased by inflation, which has lowered the consumers’ purchasing power. Inflation gathered momentum at the end of 2007 and early 2008, amounting to 11 percent in January 2008. The main reason for that was the larger than expected rise in the prices of foodstuffs and fuel in the world market. The employment rate was high and unemployment continued to fall until the second half of 2007. The growth of employment was remarkable in construction and in the related sectors. In 2008, however, the unemployment rate started to rise and is projected to be approximately 14% in 2010.
Average monthly gross wages and salaries increased from 393 euros in 2002 to 784 euros in 2007. Disposable income was rising fast, not only because of the rapid rise in wages but also because of the drop in income tax rates. In 2006-2007, the real wage growth exceeded 11%, in 2008 the wage growth slowed down considerably and in 2009 started to fall.
Table 1. Economic Indicators 2004-2008 and Forecast 2009-2011
2004 2005 2006 2007 2008 2009 2010 2011 Real GDP growth (%)
7.2 9.4 10.4 6.3 -3.6 -12.3 0.2 4.7
Real private consumption growth (%)
6.7 10.6 12.8 7.8 -4.0 -9.5 -1.7 4.7
Unemployment rate (%)
9.7 7.9 5.9 4.7 5.5 12.8 13.7 12.5
Real wage growth (%)
5.2 6.1 11.6 11.6 3.3 -4.7 -3.2 3.7
Nominal credit growth (%)
33.8 35.6 51.6 30.2 7.3 -7.5 -0.5 4.9
Source: Bank of Estonia
In 2005 and 2006, the growth rate of expenditure per household
member was also induced by increase in incomes, as well as by larger loans taken by people − in 2005, loan amounts were about 60% higher compared to 2004 and in 2006 63% higher than in 2005. The impeding factors were the growth of investments in real estate (by more than two thirds) and increase in repayment of loans compared to the previous year (Statistics Estonia).
The total volume of housing loans increased as a result of low interest rates and sharp competition in the banking sector. The annual growth of housing loans was more than 40% in 2005−2006. More than half of the Estonian banks’ loan portfolios have been given to real estate companies or to households for housing purposes and 70% of these are secured by a mortgage.
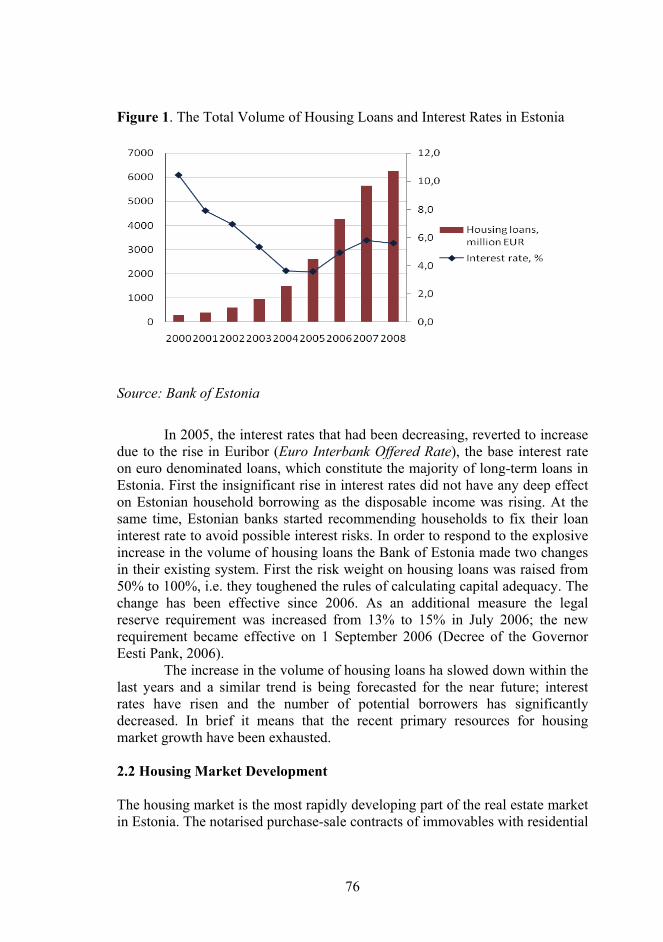
76
Figure 1. The Total Volume of Housing Loans and Interest Rates in Estonia
Source: Bank of Estonia
In 2005, the interest rates that had been decreasing, reverted to increase due to the rise in Euribor (Euro Interbank Offered Rate), the base interest rate on euro denominated loans, which constitute the majority of long-term loans in Estonia. First the insignificant rise in interest rates did not have any deep effect on Estonian household borrowing as the disposable income was rising. At the same time, Estonian banks started recommending households to fix their loan interest rate to avoid possible interest risks. In order to respond to the explosive increase in the volume of housing loans the Bank of Estonia made two changes in their existing system. First the risk weight on housing loans was raised from 50% to 100%, i.e. they toughened the rules of calculating capital adequacy. The change has been effective since 2006. As an additional measure the legal reserve requirement was increased from 13% to 15% in July 2006; the new requirement became effective on 1 September 2006 (Decree of the Governor Eesti Pank, 2006).
The increase in the volume of housing loans ha slowed down within the last years and a similar trend is being forecasted for the near future; interest rates have risen and the number of potential borrowers has significantly decreased. In brief it means that the recent primary resources for housing market growth have been exhausted. 2.2 Housing Market Development The housing market is the most rapidly developing part of the real estate market in Estonia. The notarised purchase-sale contracts of immovables with residential

77
buildings and ownership of dwellings accounted for 75% of the total number of transactions in 2007.
Upswing in the housing market started in the year 2000 due to increased borrowing and the related higher purchasing power. Figure 2 illustrates the number of notarised purchase-sale contracts of registered immovables with residential buildings and apartment ownership and value of contracts.
Figure 2. Notarised Purchase-Sale Contracts of Registered Immovables with Residential Buildings and Apartment Ownership
Source: Statistics Estonia
The year 2005 was characterised by significant price increases, which started after the first quarter and the growing number of transactions in the standard apartment market in Tallinn and Harju County. The price increases were driven by a general rise in the standard of living of the residents of Tallinn. The average gross salary in Tallinn increased by 8% and the average interest rates of mortgage loans remained between 3.6 and 4.0%. At the same time, supply could not keep up with the general demand, which raised the average price levels. A comparison of the average price levels of the Soviet time standard apartments shows that the prices went up by 25-30% during the year. The prices were also continuously adjusted upwards in the market of new apartments where demand significantly exceeded supply. At the beginning of 2006, the price rise slowed down and the sales periods of apartments increased in Tallinn. In other cities the growth continued until the first two months of that same year. The number of transactions, which had increased very rapidly at the end of 2005, started to fall early in 2006. The number of transactions in the second quarter of 2006 was approximately 12% lower than in the same period in 2005. The number of apartment transactions increased slightly in the third quarter, but was smaller than the number of transactions in the same quarter in the previous year. Compared to the fourth quarter of 2005, there were approximately 10% less transactions with apartments in the last quarter of 2006,

78
but the value of the transactions increased by approximately 15%, implying that average prices of apartments rose (Uus Maa, 2007).
During 2006, the total value of apartment transactions and average transaction prices, at the same time, showed a general rising trend. Despite the declining number of buyers in the market, most of the sellers were not willing to lower prices; due to that the sales periods became longer and the number of apartment sale offers increased. The fast rise in the price of standard apartments was followed by a recovery and a sharp rise in the prices of one-family houses and residential land, as the prices of standard apartments had achieved the level where buying a private house was an alternative. The price of residential land in the more desirable locations increased even 100% or more in 2006 (Baltic Property Expert, 2007).
Early in 2007, the situation in the housing market stabilised, characterised by a low growth rate of prices and differentiation of prices across regions and objects, lengthening of the sales periods and an active rental market. In the second half of 2007, transactions in the housing market diminished further as buyers were waiting for prices to fall and sellers were not willing to lower prices. Dwelling prices started to fall at the end of 2007 and continued to fall at 2008. At the end of 2008, the prices of apartments had fallen 40-45% from the peak prices of 2007, those of one-family houses and residential land 35-40%. Housing market prices continued falling in 2009, and a stabilisation of the market is expected in the first half of 2010.
Table 2 outlines nominal growth rate of Estonian house prices to those in other CEE countries. A particularly fast growth rate of Estonian house prices can be noted. Table 2. Nominal Growth of House Prices in National Currency Units (Average of Quarterly Percentage Changes) 1990s–2001 2002–2006 Poland (2000) 9.1 2.3
Croatia (1997) 2.7 8.7
Czech Republic (2000) 16.7 9.8
Slovenia (1996) 6.1 9.9
Hungary (1998) 8.0 11.9
Bulgaria (2001) ... 23.5
Lithuania (2000) 4.9 23.8
Estonia (1995) 13.8 36.4
Note: Initial years for country data samples are shown in parentheses. Source: Balàzs and Dubravko, 2007

79
3. Methods The first step in analysing the Estonian housing market is analysis of the economic environment, as changes in the economic environment affect both demand and supply. The factors that influence the level of demand in the housing market on the basis of previous studies (Gallin, 2006) are as follows: age composition of households, household income, credit conditions, demographic factors; price of substitute units, ownership costs and expectations for the future. The analysis is based on a simple demand model of housing, Qd, that is expressed as follows Qd = D(Y, N, W, UC, Өd), where Y – income; N – population; W – wealth; UC – user cost; Өd – other demand shifters. The user cost of capital, in turn, depends on the price of housing, P; mortgage rates, m; income and property taxes, τy and τp; respectively, maintenance and depreciation costs, δ; and expected capital gains, cg: UC = P[(1 – τy)(m + τp) + δ− cg]
Since the number of population in Estonia has not changed during the period of our analysis, property tax is imposed on land only and is therefore very small, and income tax rates were diminishing, then in the current study the following indicators have been used to study the economic impact on housing market: real GDP, real private consumption, real wage and nominal credit growth, total volume of housing loans, interest rates and unemployment rate. Real estate market development is described with the notarised purchase-sale contracts of registered immovables with residential buildings and apartment ownership, and value of contracts.
Many analysts claim that in the long term a stable relationship is formed between the real household incomes and housing prices (Malpezzi, 1999; Ortalo-Magné and Rady, 2006; etc.). This relationship is measured with the aid of the price-to-income ratio (P/I) – the share of the average (median) price of an apartment/house in the average (median) total annual net household income, measured in real values and adjusted for inflation (CPI). According to Meen (2003), the most frequently used method for estimating long-term price developments is the empirical rule combined with the P/I ratio, but, particularly after 1990, the estimates of price developments in the United Kingdom, especially in the short term and based only on the value of the P/I ratio, were unreliable.
The most common way to analyse a bubble in the housing market is to look at changes in the price-to-earnings (P/E) ratio, which is the price of the house divided by the current yearly rent that the house could earn, after

80
adjusting for maintenance costs (Stephansen and Koster, 2005; Eschker and Messner-Zidell, 2005).
In his analysis of real estate prices Poterba (1991) further developed the measurement of the P/E ratio. In equilibrium the expenditures on renting and buying a dwelling have to be equal. Poterba defined such balance of the user cost of owner occupied housing as follows:
Hp PmiR ×−+++= )( πδτ ,
where R – rental price, i – interest rate, τp – property tax rate, m – maintenance cost rate, δ – depreciation rate, π – inflation rate and PH – the housing price. Poterba’s main aim in compiling this model was to estimate the effect of tax allowances on the market. This model can also be used to estimate the effects of changes in interest rates. When interest rates rise the housing prices should fall to keep the equilibrium. Housing prices in market equilibrium would be:
)( πδτ −+++=
mi
RP
pH
As the market of rental housing is underdeveloped in Estonia and cannot be adequately assessed (a large portion of rental agreements are not reflected in the public data) and comparison with rental costs does not provide a trustworthy result, we will modify the Poterba model for further implementation in the Estonian housing market.
Considering the peculiarities of the housing and borrowing markets in Estonia we shall proceed from the following in using the model:
1. The real estate tax levied in Estonia, which is only land tax, has so far been very low. As we are dealing only with the housing market, the expenditures on taxes are close to zero in cost analysis and therefore we will leave the factor of real estate tax out of the model.
2. For the level of maintenance costs and depreciation rate we shall use the fixed level suggested by Poterba – both 2%. In this case the value of housing will be depreciated in 50 years, which is probably quite close to the average maximum use of the same dwelling by a private person. Considering the average expenditures on housing according to the data of the Statistics Estonia and adding to these estimated renovation costs, 2% is also adequate under Estonian conditions.
3. The inflation rate in 2002-2007 is used as the value of π. The expected changes in the real estate prices are not taken into consideration here because we are interested primarily in the owner’s expenditures as compared to average incomes and not in the economic profitability of investments in real estate. In this case it is reasonable to consider the inflation rate as a rate of adjusting current expenditures.
4. According to the data published by commercial banks, in Estonia in half of the cases two private persons (the persons living together as a married or an unmarried couple) take a real estate loan together.
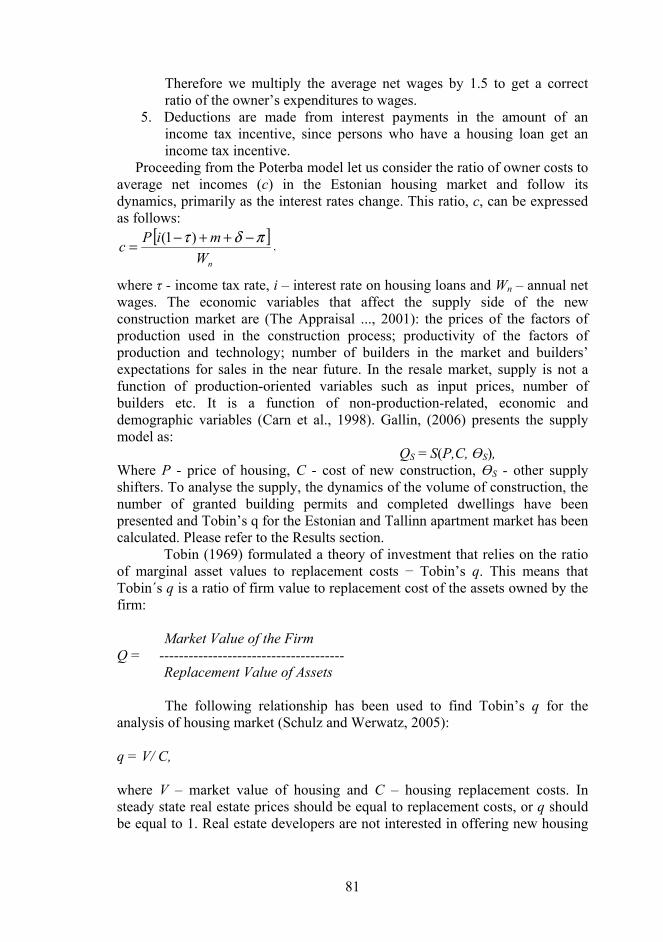
81
Therefore we multiply the average net wages by 1.5 to get a correct ratio of the owner’s expenditures to wages.
5. Deductions are made from interest payments in the amount of an income tax incentive, since persons who have a housing loan get an income tax incentive.
Proceeding from the Poterba model let us consider the ratio of owner costs to average net incomes (c) in the Estonian housing market and follow its dynamics, primarily as the interest rates change. This ratio, c, can be expressed as follows:
[ ]nW
miPc
πδτ −++−= )1(,
where τ - income tax rate, i – interest rate on housing loans and Wn – annual net wages. The economic variables that affect the supply side of the new construction market are (The Appraisal ..., 2001): the prices of the factors of production used in the construction process; productivity of the factors of production and technology; number of builders in the market and builders’ expectations for sales in the near future. In the resale market, supply is not a function of production-oriented variables such as input prices, number of builders etc. It is a function of non-production-related, economic and demographic variables (Carn et al., 1998). Gallin, (2006) presents the supply model as:
QS = S(P,C, ӨS), Where P - price of housing, C - cost of new construction, ӨS - other supply shifters. To analyse the supply, the dynamics of the volume of construction, the number of granted building permits and completed dwellings have been presented and Tobin’s q for the Estonian and Tallinn apartment market has been calculated. Please refer to the Results section.
Tobin (1969) formulated a theory of investment that relies on the ratio of marginal asset values to replacement costs − Tobin’s q. This means that Tobin´s q is a ratio of firm value to replacement cost of the assets owned by the firm:
Market Value of the Firm
Q = -------------------------------------- Replacement Value of Assets The following relationship has been used to find Tobin’s q for the
analysis of housing market (Schulz and Werwatz, 2005):
q = V/ C, where V – market value of housing and C – housing replacement costs. In steady state real estate prices should be equal to replacement costs, or q should be equal to 1. Real estate developers are not interested in offering new housing

82
if q < 1, since the selling price will not cover the construction costs and the price of land. At the same time, reduced demand for land, building materials and labour might involve a decrease in construction costs and the price of land. If q > 1, then the real estate developers can get additional profit by offering new housing. However, developers’ growing demand for vacant land, building materials and labour may increase construction costs. Both developments conduct the market toward equilibrium (Poterba, 1991).
Primary research data are from the database of Statistics Estonia, Estonian Land Board transactions register, publications of the Bank of Estonia and real estate firms. 4. Results 4.1 Price Developments in the Housing Market The indicator to evaluate price developments over a longer period of time is the ratio of price per square metre to personal income (P/I ratio). In Estonia, because of data available and significance of the housing market, this indicator has been calculated for major towns where most of the transactions take place, i.e. Tallinn and Tartu. The weakness of using P/I ratio is that the calculations have been made with average property prices and average incomes. At the same time it is known that different target groups have different interests and housing affordability. It was very easy for low income people to get a loan to finance the purchase of housing in Estonia but the average includes both different incomes and different types of housing.
Figure 3 illustrates the P/I ratio for the housing market in Tallinn and Tartu in the period from 2000 to 2008. The ratio reached a maximum in 2006 and it has always been higher in Tallinn, which the authors consider to be an expected result as in the world in general the housing prices in major cities (where a country’s business life has been concentrated to) are higher compared to average income. A rise in the P/I ratio to more than 1, in 2004, indicates a price bubble followed by continued increases in 2005-2006. In 2007, the P/I ratio started to fall and the fall continued into 2008, which, from the aspect of market equilibrium, could be considered a positive development. Figure 3. P/I Ratio of the Tallinn and Tartu Housing Market (Based on the Price of 2- and 3-Room Apartments)
Source: Statistics Estonia and author’s calculations

83
4.2 Supply Development in the Housing Market The real estate market supply had increased at a growing rate during 2004-2006, especially residential construction (Figure 4). During the period 2000-2006, the total volume of residential construction increased 10.7 fold. The share of apartment buildings in total construction increased at a fast rate: in 2000 it was 46%; in 2007 it was 63%. The construction of apartment dwellings increased 15.7 fold in the same period. Figure 4. Construction of Residential Buildings in Estonia at Current Prices,
EEK in Millions
Source: Statistics Estonia
The amount of unfinished buildings increased significantly over 2005-2006. The number of granted building permits exceeded the number of completed dwellings in 2005 about 2.5 fold and in 2006 about 3.3 fold, which means that a large amount of new living space will be added in the short term. However, the number of building permits has dropped since the beginning of 2007, caused by an increasingly conservative attitude of city governments and municipalities toward new projects; additionally, fewer applications were handed in for building permits under the changed economic and market situation. Issuing permits for use is expected to stay active for some time, but issuing building permits will probably continue to decline further still.
Although it might seem that the construction growth has been enormous, the floor area of dwellings for which building permits had been granted in 2007 accounted for 2.6% of the total dwelling stock, i.e. stayed within the limit of 2-3%, which is considered a natural depreciation rate for immovable property. The new dwelling completions accounted for only 1.5% of the dwelling stock in 2006. Additionally, while the European Union average square metres per capita is 32.8 sqm, in Estonia it was 28.9 sqm (slightly higher than in Latvia and Lithuania). The same indicator in more advanced European countries is 36.6 sqm. In addition to the square metres we should also take into account the quality of the dwellings (year of construction or renovation, provision with modern utility systems etc.). In this respect Estonia also lags

84
behind the developed European countries. Estonia’s dwelling stock has lower quality compared to the advanced European Union member states – dwellings in Estonia are smaller, in some cases with less modern utilities, and the share of apartments is higher. At the same time, it should be mentioned that construction activity in Estonia, like real estate transactions, has concentrated into Tallinn and its vicinity where the granted building permits evidently account for a high share of the dwelling stock. Figure 5. Number of Granted Building Permits and Completed Dwellings (New Construction), Floor Area of Dwellings in 1000 sqm
Source: Statistics Estonia
To analyse the supply on the basis of Tobin´s q, we calculated the average selling prices and replacement costs of apartments per 1 sqm for the whole Estonia and for Tallinn, which include the construction cost and the price of land on the basis of the Estonian Land Board’s transactions database (see Table 3).
Until the year 2003, investment into apartment development projects was not profitable in Estonia as a whole. However, it was expedient in a few regions, first of all in Tallinn and other major towns where incomes were large enough to create demand for new apartments. This is also revealed in the faster growth of q of the apartment market in Tallinn. The period 2003-2006 was extremely favourable for the development of apartment houses: the value of q was between 1.03 and 1.76 in Estonia as a whole, and 1.26-2.20 in Tallinn.
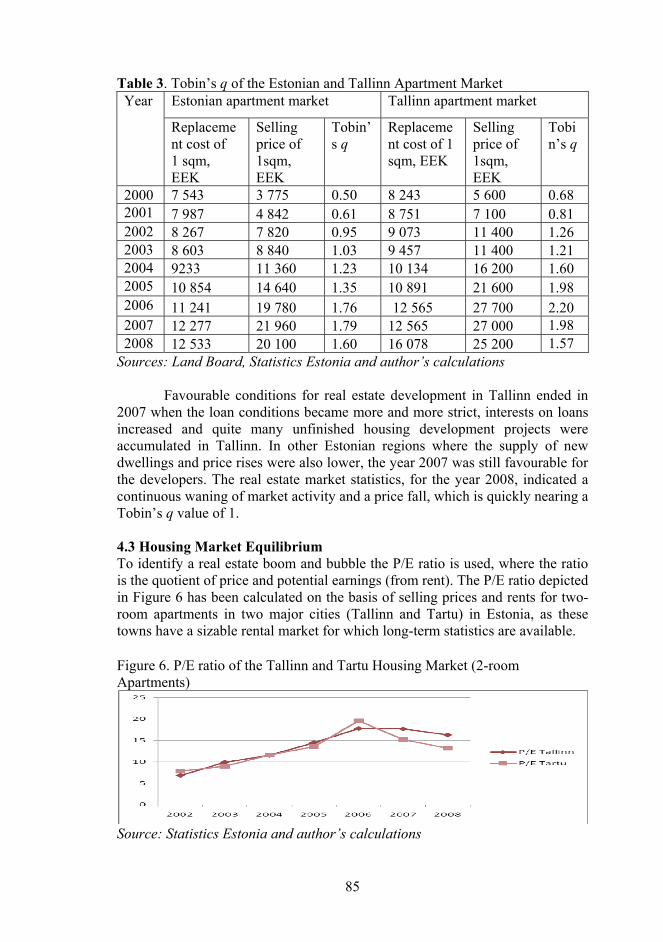
85
Table 3. Tobin’s q of the Estonian and Tallinn Apartment Market Year Estonian apartment market Tallinn apartment market
Replacement cost of 1 sqm, EEK
Selling price of 1sqm, EEK
Tobin’s q
Replacement cost of 1 sqm, EEK
Selling price of 1sqm, EEK
Tobin’s q
2000 7 543 3 775 0.50 8 243 5 600 0.68 2001 7 987 4 842 0.61 8 751 7 100 0.81 2002 8 267 7 820 0.95 9 073 11 400 1.26 2003 8 603 8 840 1.03 9 457 11 400 1.21 2004 9233 11 360 1.23 10 134 16 200 1.60 2005 10 854 14 640 1.35 10 891 21 600 1.98 2006 11 241 19 780 1.76 12 565 27 700 2.20 2007 12 277 21 960 1.79 12 565 27 000 1.98 2008 12 533 20 100 1.60 16 078 25 200 1.57
Sources: Land Board, Statistics Estonia and author’s calculations Favourable conditions for real estate development in Tallinn ended in
2007 when the loan conditions became more and more strict, interests on loans increased and quite many unfinished housing development projects were accumulated in Tallinn. In other Estonian regions where the supply of new dwellings and price rises were also lower, the year 2007 was still favourable for the developers. The real estate market statistics, for the year 2008, indicated a continuous waning of market activity and a price fall, which is quickly nearing a Tobin’s q value of 1. 4.3 Housing Market Equilibrium To identify a real estate boom and bubble the P/E ratio is used, where the ratio is the quotient of price and potential earnings (from rent). The P/E ratio depicted in Figure 6 has been calculated on the basis of selling prices and rents for two-room apartments in two major cities (Tallinn and Tartu) in Estonia, as these towns have a sizable rental market for which long-term statistics are available. Figure 6. P/E ratio of the Tallinn and Tartu Housing Market (2-room Apartments)
Source: Statistics Estonia and author’s calculations

86
The P/E ratio was growing fast until 2006 when it achieved its maximum. The difference between Tallinn and Tartu was quite small throughout the period 2002-2006. At the time of the high price rise until 2007, the rental earnings accounted for a relatively small share of the lessor’s total earnings (rental income plus real estate price rise). Owing to the slowing price rise, the significance of rental earnings for the owner has increased and the growth has been greater in Tartu.
Taking the share market as an alternative investment opportunity for a lessor, for example, most probably a P/E ratio higher than 15 (additional earnings from rising real estate prices are not included) is not an attractive level for a real estate owner in the long term. Hence, the potential scenarios for the future are a significant rise in rental prices, which cannot be regarded very realistic considering the income level, and a possibility that current tenants buy a dwelling, which is a more likely scenario considering the declining trend of housing prices.
Table 4 presents prices per 1 sqm of housing on the Tallinn and Tartu housing markets calculated using the Poterba model. Real estate tax was not taken into consideration in the calculations as in Estonia the tax is levied only on the land and the tax rate is very low. For interest and inflation rates the average levels of the years 2002-2007 were used (to level out the high volatility) and for both maintenance costs and depreciation rate 2% a year was applied. Table 4. Equilibrium Price According to the Poterba Model, EEK/sqm
Year Actual price in
Tallinn (EEK/m2)
Price according to
model (EEK/m2)
Actual price in Tartu
(EEK/m2)
Price according to
model (EEK/m2)
2002 8 300 11 112 4 700 7 481 2003 12 300 14 857 6 700 8 857 2004 15 000 18 116 9 500 11 302 2005 18 500 21 781 11 300 14 178 2006 25 800 26 304 19 300 17 826 2007 28 500 34 213 19 300 27 064 Source: Statistics Estonia and author’s calculations.
The results show that equilibrium prices on the basis of the Poterba model should be significantly higher (with the exception of Tartu in 2006). Unfortunately the results cannot be regarded as realistic for several reasons. An important factor in the Poterba model is the rental rate, which cannot be adequately assessed in the Estonian housing market. Fast growth in the housing market in 2002-2006 occurred, due to the favourable borrowing conditions, only in the sales sector and the rental market was almost underdeveloped. The residential rental market was extremely small; very few transactions compared to the sales market were made. Also the official statistics on rental rates was

87
inadequate, as only the transactions by real estate firms were covered. The Poterba model also does not work in the conditions where the inflation rate is higher than the total of interest rate, property tax rate, maintenance cost rate and depreciation rate, as the result would be a negative rental price.
Table 5 presents the results of the calculations where the Poterba model, which was adopted by the authors to be implemented in the Estonian housing market, was used. Instead of the equilibrium price, the share of owner’s costs in net wages has been calculated based on the justification given in section 3. The results show that the costs of owning a dwelling have varied greatly by years both in Tallinn and Tartu. The analysis of the dynamics of both cities shows that 2006 was the peak year when probably the price bubble also reached its peak. Thanks to the rapid increase of incomes, inflation, lowering of income tax level and halting of price increase an important correction occurred in 2007 − revealed as dropping owner’s costs. Another important conclusion is that the housing price in Tartu has been clearly more favourable than in Tallinn from the standpoint of owner’s costs.
Table 5. The Percentage of Owner’s Costs to Net Wages on the Tallinn and Tartu Housing Markets
Year The percentage of owner’s
costs to net wages on the Tallinn housing market, %
The percentage of owner’s costs to net wages on the Tartu
housing market, % 2002 31.3 18.5 2003 32.5 23.4 2004 31.0 24.1 2005 29.1 21.9 2006 32.3 27.9 2007 22.5 19.6 Source: Statistics Estonia and author’s calculations.
The fact that the costs of owning a dwelling decreased in 2007 could be expected due to the falling selling prices of housing, since there was less interest in buying an apartment because of the toughened investment and borrowing conditions, and so the number of purchase–sales aimed at the owners actually living in the dwelling fell. Simultaneously, in 2007, the renting market developed notably. The weakness of the model is that an average housing loan taker need not earn the average wages of an Estonian inhabitant. The average wage was used as banks could not disclose data about their clients so there was some possibility of error as the average wages of owners might actually have been somewhat higher than the Estonian net average wage. Another problem with this model appeared in 2008; when the rate of inflation was exceptionally high (10.4%) and higher than the sum of interest rates on housing loans, depreciation and maintenance cost rates (9.8%). In these conditions the share of owner’s costs is negative, which is not realistic.

88
5. Discussion and Conclusions The presence of a boom and the probability of a crisis on the Estonian housing market were forecasted by the following indicators: rapid growth in loan volumes, liberalised terms for loans, taking high risk loans, low interest rates, fast economic growth, overvalued properties, positive expectations for future and large foreign capital inflow. The expectation of interest growth and the lack of possibility to control the interest rates at the local level are an obvious threat to Estonian economy as a whole. Actually, the Bank of Estonia lacks appropriate instruments and majority of the housing loan portfolio comprises loans with floating interest rates, the level of which, in turn, depends on the economic situation in Europe.
The dynamics of the housing market prices and turnover showed that high deal activity increased the prices and, on the contrary, a decrease in the number of deals lowered the prices. Such relation would be very illogical in a customary market situation. Buying interest should be lower at a higher price level and contrariwise at a low price level. The logic which is prevailing in Estonian housing market proves that it was a market where due to favourable loan terms demand constantly exceeded supply, and changes in prices had, first and foremost, an impact on the suppliers’ behaviour. Two more specific circumstances which caused the long time pressure of demand in the Estonian housing market can be considered as local peculiarities − obsolescent housing stock and less floor space per capita in square metres than the average in the EU countries.
The results of price-to-income ratio (P/I) and price-to-earnings ratio (P/E) analysis allow to state that the fast price rise caused a bubble in housing market, which peaked at the end of 2006 and at the beginning of 2007. It is difficult to tell when exactly the bubble developed, as the analysis of possible overvaluation of real estate prices in Estonia is complicated due to the status of transition economy where a nominal and real convergence should be accompanied by a growth of real estate prices, the more so that the initial price level of residential property was very low.
For analysing equilibrium prices using the Poterba model, housing prices should be even higher in order to create economically reasonable option in favour of renting, which, however, is unrealistic. The findings allow only drawing a conclusion that during the period under review (2002-2007) owning a dwelling was economically more beneficial than renting it both in Tallinn and in Tartu (excluding Tartu in 2006). The reasons why the Poterba model cannot be used for calculating the equilibrium price in the Estonian housing market are as follows: an undeveloped rental market and inadequate statistics on rental rates. Additionally, the model does not work with a very high rate of inflation, as was the case in Estonia in 2008. When the rate of inflation is higher than the sum of interest rate, property tax rate, maintenance cost rate and depreciation rate, the result would be a negative rental rate.
Taking into consideration the specific features of the Estonian housing market (the underdeveloped rental market, inadequate statistics on rental

89
earnings and mostly functioning purchases and sales market, which is greatly affected by loan conditions) the Poterba model was correspondingly developed and the share of owner’s costs in net wages was found. The results showed that both in Tallinn and in Tartu the costs of owning a home had been different year-over-year, but 2006 was the peak year of the bubble in both cities. Thanks to the rapid growth in incomes, inflation, tax rate decrease and stopped increase in prices, actually a significant correction occurred in 2007, which was revealed in decreased owner’s expenditure. The second important conclusion is that in recent years the housing price in Tartu had been clearly more favourable in the light of owner’s expenditure. However, problems may also arise in using the owner’s expenditure model in high inflation conditions, as in the case of the Poterba model. Namely, when the rate of inflation is higher than the sum of interest rate, property tax rate, maintenance cost rate and depreciation rate the result would be a negative share of owner’s expenditure in net wages.
If the Estonian housing rental market statistics are more adequate in the future, it will be possible to develop the model similarly to the method provided by Poterba, i.e. to compare the ratio of the rental expenses and owner’s expenditure to the housing price. Furthermore, it will be very easy to include the real estate tax rate in the model if it should significantly increase compared to the present level and have impact on the result. At present a tax is levied only on land in Estonia and the tax rate is very low.
Tobin’s q calculations for the Estonian housing market showed that the most challenging period for property developers on the supply side was in 2003−2007, when Tobin´s q ranged from 1.02 to 1.76.
To sum up, it can be said that the fast price rise and bubble in the Estonian housing market were caused by: 1) fast economic growth, resulting in increased household income; 2) relatively low level of households’ tax burden in the environment of
significantly falling interest rates and increasingly more favourable loan conditions for the borrower and the banks’ extremely aggressive financing policies;
3) foreign investors’ great interest in housing for investment purposes; 4) relatively small housing floor space per capita (28.9 sqm in 2006) compared
to developed European countries (36.6 sqm) coupled with the obsolescent housing stock;
5) supply not keeping up with demand due to the limited capacity of the construction sector and problems with planning.
Due to the last year’s developments (price rise stopped and was replaced by decline) a part of this bubble has disappeared by now but prices will continue to fall. One reason for that is still too large supply (development projects that were started earlier are finished), which under small demand compels to correct prices downwards. Other reasons are stricter loan conditions and rise of interest rates.
As economic forecast for the following years are pessimistic, there is no clear understanding at the moment of how long the market depression would

90
last. A new market recovery definitely cannot occur in the conditions of economic decline. It is difficult to estimate how deep the decline might ultimately be but the Estonian housing market is far from the “equilibrium point”. References Angell, C. and Williams, N. 2005, February 10. U.S. Home Prices: Does Bust
Always Follow Boom? Retrieved from FDIC website: http://www.fdic.gov/bank/analytical/fyi/2005/021005fyi.html.
Balázs, É. and Dubravko, M. 2007. Determinants of House Prices in Central and Eastern Europe. - BIS Working Papers, No. 236, pp. 1-26.
Bank of Estonia. http://www.eestipank.info/frontpage/et/. Barot, B. and Yang, Z. 2002. House Prices and Housing Investment in Sweden
and the UK: Econometric Analysis for the Period 1970–1998. - Review of Urban & Regional Development Studies, Vol. 14, No. 2, pp. 189-216.
Carn, N., Rabianski, J., Raster, R. and Seldin, M. 1998. Real Estate Market Analysis. New Jersey: Prentice-Hall Inc.
Case, K. E., Schiller, R. J. (2003), “Is There a Bubble in the Housing Market?” Brookings Papers on Economic Activity, No. 2, pp. 299-342.
Decree of the Governor of Eesti Pank No 6, 14 July 2006 Amendments to eesti Pank Governor´s Decree No 4 of 2 February 2006 “Establishment of procedure for calculating and compying with the reserve requirement” http://www.eestipank.ee/pub/en/dokumendid/publikatsioonid/seeriad/aastaaruanne/_2006/index.html?ok=1
Eschker, E. and Messner-Zidell, S. October 2005. Is There a Housing Bubble in Humboldt County? The Housing Market in a Rural California Region, 1989-2004 – Executive Summary.Humboldt County Research. Retrieved from Humbholdt State University website: http://www.humboldt.edu/~indexhum/projects/housing_summary.pdf.
Estonian Land Board. http://www.maaamet.ee/index.php?lang_id=2&page_id=164&menu_id
Gallin, J. 2006. The Long-Run Relationship Between House Prices and Income: Evidence from Local Housing Markets. Real Estate Economics, Vol. 34, No.3, pp. 417-438.
Garratt, D. 2001. London’s Housing Market, Housing Finance, No. 49 Helbing, T.F. 2005. Housing Price Bubbles – A Tale Based on Housing Price
Booms and Busts. BIS Papers, No. 21, pp. 30-41. Retrieved from Bank for International Settlements website: http://www.bis.org/publ/bppdf/bispap21d.pdf.
Hilbers, P., Lei, Q. and Zacho, L. 2001. Real Estate Market Developments and Financial Sector Soundness. IMF Working Paper, No. WP/01/129
International Monetary Fund (IMF). 2003. World and Economic and Financial Surveys. World Economic Outlook. Growth and Institutions, pp. 61-94.

91
Retrieved from IMF website: http://www.imf.org/external/pubs/ft/weo/2003/01/pdf/chapter2.pdf
Kolbre, E. and Kallakmaa-Kapsta, A. 2006. Housing Market Development in Estonia: Is There a Real Estate Boom? Working Papers in Economics (TUTWPE), Vol. 20, pp. 27-46.
Kucharska-Stasiak, E. and Matysiak, G. (2004). The Transition of the Polish Real Estate Market Within a Central and Eastern European Context. Real Estate & Planning Working Papers, No. 16.
Malpezzi, S. 1999. A simple Error Correction Model of House Prices. Journal of Housing Economics, Vol. 8, No. 1, pp. 27-62.
Matsik, M. 2006. Ökonomeetriliste mudelite kasutamine elamispinnaturu analüüsimisel Eestis. Bakalaureusetöö, Tallinn: TTÜ majandusteaduskond.
Mayes, D.G. 1979. The Property Boom: The Effects of Building Society Behaviour on House Prices. Oxford: Martin Robertson.
Meen, G.P. 2001. Modelling Spatial Housing Markets. Theory, Analysis and Policy. Advances in Urban and Regional Economics. Boston, Dordrecht, London: Kluwer Academic Publishers.
Meen, G.P. 2003. Housing, Random Walks, Complexity and the Macroeconomy. In: T. O'Sullivan and K. Gibb (Eds), Housing Economics and Public Policy, pp. 90-110. London: Blackwell Publishing.
Ortalo-Magné, F., Rady, S. 2006. Housing Market Dynamics: On the Contribution of Income Shocks and Credit Constraints. Review of Economic Studies, No. 73, pp. 459–485.
Poterba, J. M. 1991. Taxation and Housing Markets: Preliminary Evidence on the Effects of Recent Tax Reforms. NBER Working Papers, No. 3270.
Randveer, M. and Rell, M. 2000. Varade hindade kujunemine. Tallinn: Eesti Pank.
Baltic Property Expert. 2007. Real Estate Market Review. Tallinn: Baltic Property Expert.
Schulz, R. and Werwatz, A. 2005. Real Estate Valuation and Tobin's Q: An Empirical Analysis. ERES Conference Proceedings, June 15-18, 2005, Dublin.
Statistics Estonia. www.stat.ee. Stephansen, K. and Koster, M. 2005. Housing Valuations: No Bubble Apparent.
BIS Papers No. 21, pp. 112-123. Retrieved from Bank for International Settlements website: http://www.bis.org/publ/bppdf/bispap21i.pdf
The Appraisal of Real Estate.Twelfth Edition. 2001. Chicago: Appraisal Institute
Tobin, J. 1969. A General Equilibrium Approach to Monetary Theory. Journal of Money, Credit, and Banking.Vol. 1, No. 1, pp. 15-29.
Uus Maa. 2007. Real Estate Market Review.

This article is © Emerald Group Publishing and permission has been granted for this version to appear here (www.emeraldinsight.com). Emerald does not grant permission for this article to be further copied/distributed or hosted elsewhere without the express permission from Emerald Group Publishing Limited.
92
Appendix 3 Estonian housing market: affordability and regulatory framework Angelika Kallakmaa-Kapsta Tallinn School of Economics and Business Administration, Tallinn University of Technology Akadeemia tee 3, 12618 Tallinn, Estonia Phone: +372 6204 057, e-mail: [email protected] Ene Kolbre Tallinn School of Economics and Business Administration, Tallinn University of Technology Akadeemia tee 3, 12618 Tallinn, Estonia Phone: +372 6203 952, e-mail: [email protected]
„Although the problem of declining affordability has been widely discussed in the media, the theoretical underpinnings of the concept of affordability have received rather less attention from academics“
(Gan, Hill, 2008) Introduction Early in the 1990s the real estate market was relatively passive and the price levels were low. The low activity in the early 1990s was primarily due to the low purchasing power and inaccessibility/expensiveness of loans and the privatisation process itself. In 2011 96 % of the dwellings in Estonia were owned by private sector (Statistics Estonia).An upturn in the housing market started with the economic growth and with the activation of the borrowing process for housing purposes after 1999 (Figure 1). The rapid economic growth was reflected in the growth rate of household income and expenditure. Low interest rates and strong investment demand sparked an exceptionally rapid credit growth. Housing prices started to rise rapidly in 2005, and the price rise turned into a decline after 2007 when the housing prices had reached their maximum. Average price of dwellings changed from 9410 EUR in 1998 to 64 544 EUR in 2007 and back to 38 523 EUR in 2010 (the average gross monthly wage was 264 EUR in 1998, 725 EUR in 2007 and 788 EUR in 2010). In a dynamic analysis of housing prices in a long term, many analysts (Garratt, 2001; Case and Shiller, 2003; Gallin, 2006; etc.) attribute the greatest significance to the real household incomes (household incomes adjusted for inflation) and claim that during a long term a stable relationship is formed between the real household incomes and the housing prices.

This article is © Emerald Group Publishing and permission has been granted for this version to appear here (www.emeraldinsight.com). Emerald does not grant permission for this article to be further copied/distributed or hosted elsewhere without the express permission from Emerald Group Publishing Limited.
93
Figure 1 Notarised Purchase-Sale Contracts
0
5000
10000
15000
20000
25000
30000
35000
1998
1999
2000
2001
2002
2003
2004
2005
2006
2007
2008
2009
2010
Num
ber
0
500
1000
1500
2000
2500
EUR
mln
Number of purchase-sale contracts of land with residential buildings*
Number of purchase-sale contracts of ownership of dwellings**
Value of contracts of land with residential buildings, EUR mln
Value of contracts of ownership of dwellings, EUR mln
Source: Statistics Estonia, * Residential building — a building, of which all or at least half of the area is intended for permanent residence (one-family dwelling, two-family dwelling, terraced house or any other multifamily house); ** Dwelling – apartment In a previous work we estimated that there was a bubble in the Estonian real estate market (Kolbre, Kallakmaa 2006) and the total volume of housing loans had increased as a result of low interest rates (an average housing loan interest rate was 3,45 % in 2005) and tight competition in the banking sector. The econometric model that was constructed in 2007 by using 8 different economic indicators for describing their influence to the price of a 2-room apartment in Tallinn shows that only 2 of them – money supply and interests rate – were significant indicators to price changes of the housing market in Estonia (Kolbre, Kallakmaa 2007). The effect of the increase of money supply is bigger than the impact of the housing loan interest rate increase since 2005 (ibid). Credit is a major and significant determinant of house price booms (Borgy, Clerc 2011). The rise in the Estonian housing market was mostly driven by consumers’ expectations and easy access to credit. Increasing house prices resulted in greater housing wealth and also made it possible for households to borrow more using housing wealth as collateral.
This article is © Emerald Group Publishing and permission has been granted for this version to appear here (www.emeraldinsight.com). Emerald does not grant permission for this article to be further copied/distributed or hosted elsewhere without the express permission from Emerald Group Publishing Limited.
94
The housing loan market in Estonia is mostly shared by four credit institutions, which in all account for 91% of the total market. The largest market share is held by Swedbank with 41% of the total consolidated loan portfolio, followed by SEB Bank at 23%, the Estonian branch of Nordea Bank at 17 % and the Estonian branch of Danske Bank at 10 % (Finantsinspektsioon 30.06.2011). Estonian labour market indicators have strengthened the potential for household financing. In the third quarter of 2011 the employment rate was 61% which is 8.6% higher than in 2010 and is the highest level since the start of 2009. Due to the growth in employment the number of unemployed as well as economically inactive persons decreased in 2011 (Statistics Estonia). The Estonian government has made many decisions that have influenced the real estate market, especially the housing market, mostly with the purpose to improve accesses to the housing market. But no research has been done in trying to find an answer for the affordability problem in the housing market in Estonia. Also there are no analyses about the impact of the regulatory framework on the housing market – whether the government goals to improve the housing affordability are achieved or not. The housing affordability is an endemic and structural problem that will not be improved without adjustments to existing policies and additional action by governments at all levels (Yates, Milligan et al 2007). Mengjie et al (2008) analysed the affordability situation in Beijing (China) and this research shows both the necessity and the importance for the government to further investigate into the housing market, aiming at effective evaluation and policies for a healthy property market. The experience of other countries reveals that the availability of financing is the critical factor for the housing market. Historically the housing in many countries was financed by local lenders (In the UK by building Societies, in Germany by Bausparkassen). The UK Building Society Act of 1986 resulted in these institutions’ offering competitive banking services (Green, Wachter, 2007). Until the mid-1980s, the Central Bank of Spain controlled the housing finance system by setting savings and borrowing rates for local savings banks. Directed credit supplied by contractual savings schemes and state-regulated mortgage banks declined and was replaced by commercial banks’ lending (ibid). Decisions of policymakers also have considerable influence on the housing market, but sometimes this impact can also be indisposed. Abelson (2009)

This article is © Emerald Group Publishing and permission has been granted for this version to appear here (www.emeraldinsight.com). Emerald does not grant permission for this article to be further copied/distributed or hosted elsewhere without the express permission from Emerald Group Publishing Limited.
95
found that “the Australian government's proposed national housing and rental affordability funds were poorly defined and likely to be ineffective”. An important source of information for the housing market is the affordability of the average priced house or dwelling. Although widely used affordability models are normally focused on the relationships between house prices and the same demand factors: for example, price/income ratio or price to mortgage payments ratio. Affordability’ is connected with securing some given standard of housing (or different standards) at a price or rent which does not impose, in the eyes of a third party (usually the government), an unreasonable burden on household incomes (Maclennan and Williams,1990). Gabriel et al (2005) found, that there is a growing recognition across OECD countries of the need for a broad and more encompassing understanding of housing affordabilty. On the one hand, we can see purchase affordability, which considers whether a household is able to borrow enough funds to purchase a house. On the other side of affordability, there is the repayment affordability, which considers the burden imposed on a household of repaying the mortgage. Gan and Hill (2008) found that there is a distinction between purchase and repayment affordability. “In the Sydney prime mortgage market over the period 1996 to 2006, repayment affordability deteriorated very significantly while purchase affordability remained quite stable. This difference can be attributed to the loosening of credit constraints in the mortgage market which it seems has carried through primarily into higher house prices”. Gan and Hill (2008) also found that the standard measure of income affordability – the median house-price to - income ratio – tends to significantly understate the extent of the income affordability problem. The purpose of this study was – first, to find out how to evaluate affordability of housing in Estonian market and, second, to asses the regulatory framework decisions’ impact on the housing market in Estonia.

This article is © Emerald Group Publishing and permission has been granted for this version to appear here (www.emeraldinsight.com). Emerald does not grant permission for this article to be further copied/distributed or hosted elsewhere without the express permission from Emerald Group Publishing Limited.
96
Methods Housing affordability has various definitions, and in this part of the article we are looking at suitable methods by which to evaluate the movements of affordability in the Estonian housing market. Traditionally used indicators to evaluate affordability The concept of housing affordability cannot and should not be analysed by using one concept, measure or definition (McCord et al 2011). It will not be possible to incorporate all relevant concerns in simple affordability measures (Gabriel et al 2005). Some measures of housing affordability are based on whether or not a household can qualify for a mortgage (Linneman, Megbolugbe, 1992) because without a mortgage as leverage, most households could not be able to purchase a house (Jewkes et al.2010). The Housing Affordability Index measures the degree to which a typical family can afford the monthly mortgage payments on a typical home. The US National Association of Realtors (NAR) affordability index measures whether or not a typical family could qualify for a mortgage loan on a typical home. A typical home is defined as the national median-priced, existing, single-family home as calculated by the NAR. The typical family is defined as one earning the median family income as reported by the U.S. Bureau of the Census. NAR affordability index does not take into account total housing costs including property taxes, insurance etc. The Australian BIS Shrapnel index also measures the ratio of mortgage repayments on a typical housing loan to average full-time male earnings. To be exact, the BIS Shrapnel Home Loan Affordability Index shows the proportion of full-time male average earnings needed to meet the mortgage repayments on a “typical” housing loan. A typical housing loan is assumed to be a 25-year loan for 75 per cent of the median house price. A decrease in the BIS Shrapnel indicator represents improved affordability. Both indexes focus on repayment affordability. A second approach in assessing housing affordability is to measure the percentage of household disposable income taken up by monthly mortgage repayments. Again, when prices (and interest rates) are relatively low by historical standards, potential home buyers will be attracted into the market in the expectation that they can comfortably keep up with their mortgage commitments. Mortgage as Percentage of Income is a ratio of the actual

This article is © Emerald Group Publishing and permission has been granted for this version to appear here (www.emeraldinsight.com). Emerald does not grant permission for this article to be further copied/distributed or hosted elsewhere without the express permission from Emerald Group Publishing Limited.
97
monthly cost of the mortgage to take-home family income. Average monthly salary is used to estimate family income. The household debt service ratio (DSR) is an estimate of the ratio of debt payments to disposable personal income. Debt payments consist of the estimated required payments on outstanding mortgage and consumer debt. The US Federal Reserve (Dynan et al., 2003) made a revision of the debt service ratio and created a broader measure of household liabilities - FOR (financial obligations ratio) and analysed household debt about the US market. Faruqui (2008) compares the DSR distribution for Canada and the US. A third indicator is the Median Multiple, which measures the ratio of the median house price to the median annual household income. This measure has historically hovered around a value of 3.0 or less, but in recent years has risen dramatically, especially in markets with severe public policy constraints on land and development. The Demographia International Housing Affordability Survey uses the Median Multiple in its reports. They calculate median price-to-income ratios for 227 regions in Australia, Canada, Ireland, New Zealand, the UK, and the US. The Demographia index therefore measures purchase affordability. A widely used indicator to evaluate price developments and affordability over a longer period of time is the ratio of a price per square metre to personal income P/I (price-to-income ratio) (Malpezzi, 1999, Ortalo-Magné and Rady 2006, etc). House Price to Income Ratio is the basic affordability measure for housing in a given area. Price-to-income ratio measures purchase affordability. These indicators should help to get an answer to whether households are able to buy houses and whether they are able to pay the average mortgage payments from gross income. The method for measuring affordability in the Estonian housing market. Repayment affordability. In researching the Estonian market, it is not possible to adapt the formerly mentioned indexes as the initial data about the Estonian market, used for calculating the indexes, is not accessible. For example, there is no database for calculating the NAR index. Basically, it could be possible to research the market using the databases of credit institutions, but the given data is under the protection of banking confidentiality, and hence it is not possible to use micro-level data to find suitable solutions. However, it is possible to use aggregated data and the income figures collected by Statistics Estonia. To answer the question whether Estonian households can take household loans, a new index

This article is © Emerald Group Publishing and permission has been granted for this version to appear here (www.emeraldinsight.com). Emerald does not grant permission for this article to be further copied/distributed or hosted elsewhere without the express permission from Emerald Group Publishing Limited.
98
can be constructed that could assess the situation of the Estonian market. The method for calculating the Australian BIS Sharpnel index adapted for Estonian market has been taken as the basis for constructing the new index. HAI (housing affordability index) construction for the Estonian market HAI index is constructed after followed Formula: HAI = MR/ I where, MR – average mortgage loan repayment for housing purposes I – average full time income Only the credit institutions are in possession of accurate initial data for mortgage loans, and these databases are not available for public use. However, it is possible to use the databases of the Bank of Estonia and Statistics Estonia. In creating the index we have considered the assumption that the amount of an average mortgage loan should be two thirds of the average price of a house. The given principle of the relationship between the amount of a possible mortgage loan and the price of a house and the question of evaluation of the effects of this principle will be analysed in the part of the article that deals with the evaluation of the possible influence of the regulative framework. Additionally, we have presumed that an annuity formula is to be used for calculating the MR because most of the loans issued by the credit institutions have been issued on the basis of the annuity graph. The average household loan interest used in the formula has been taken from the statistical database of the Bank of Estonia. The BIS Sharpnel index that was used as the basis of composing the index used 25 years as the time of an average loan period, and the same time period has been used in creating the model for the Estonian market. Unfortunately, there is no accurate initial data for household loan periods; however, different expert opinions of the employees of financial institutions have been used, according to which an average loan in current market conditions is issued for 25 years. Using the given formula, it is possible to create 2 different variations of the index varying the data concerning net and gross incomes, and this has been done by the authors of the current article. The HAI index, calculated on the basis of an average net income should show the present market situation more suitably, but taking into account the theoretical possibility of changes in the current tax law, an index that bases

This article is © Emerald Group Publishing and permission has been granted for this version to appear here (www.emeraldinsight.com). Emerald does not grant permission for this article to be further copied/distributed or hosted elsewhere without the express permission from Emerald Group Publishing Limited.
99
itself on the data concerning the gross income shows a clearer picture of the potential state of the market. We supposed that AML = PSV x 2/3* where AML – average mortgage loan; PSV- average purchase –sale value of dwellings * Average mortgage loan should be not more then 2/3 of real estate value and MR = AML/ A A is calculated as follows:
N
i,N
11
(1+i)A
i
−
=
where i – average housing loan interest rate (Bank of Estonia) N – number of periods (average housing loan period 25 years) Using the proposed methodology we calculate two housing affordability indexes, one by using net income data and the other with gross income data. Purchase affordability The previously constructed HAI model helps to describe housing loan repayment capability in the Estonian housing market. To assess the purchase affordability we are using the P/I ratio (ratio of a price per square metre to personal income ratio). P/I ratio indicates how many months one person with average income should work so he/she could buy one square metre of average dwellings. If the price- to- income ratio is 1, then it is the so called equilibrium point for the housing market, and a person with average income can afford to buy houses. Most purchase-sale transactions of dwellings (approximately 50 %) in Estonia are
This article is © Emerald Group Publishing and permission has been granted for this version to appear here (www.emeraldinsight.com). Emerald does not grant permission for this article to be further copied/distributed or hosted elsewhere without the express permission from Emerald Group Publishing Limited.
100
made in the capital city Tallinn. To compare the situation in Estonia, the P/I ratio will be calculated for our capital city and also for Riga (capital city of Latvia), which has a similar historical background. Regulatory framework. Government activities have also affected the real estate market. The impact of the regulatory framework is difficult to measure, but we cannot underestimate its influence on the housing loan decision making process and also on the housing market as a whole. The Estonian Income Tax Act adopted in 1993 already provided for the possibility of deducting housing loan interest from taxable income. Interference of the public sector at a time when loan interests are high may be considered justified. The above Act, however, created a situation where households with higher incomes who could purchase more expensive real estate benefited the most from the state support. At the time of implementing this measure, loan interest rates were relatively high, and thus the state support to people purchasing real estate with loan money was considerable. The positive impact of this Act was that it helped to boost the emerging real estate and construction market. Initially, no restrictions were established on the amount of money deductible from taxable income. In 1999, a provision was added to the Act that the loan or capital lease interests could be deducted from taxable income for only one dwelling at a time. In 2001, an additional restriction was added: the maximum amount deductible from taxable income was 6391 euro per one taxpayer. The last decision in that respect was adopted in 2003 but entered into force only at the beginning of 2005. The maximum deductible amount now stood at 3196 euro per one taxpayer. The Estonian Government also established a support system to eliminate market failures through the state foundation KredEx. In 1999, Hansapank made a proposal to the Government to partly guarantee the down payment of loans within the framework of the housing program for young families. This enabled the bank to reduce the required down payment rate to 10 %, which at the time accounted for 30% of the loan sum. KredEx implemented the support scheme in 2000. Such a decision was very favorable for credit institutions and, at first glance, for borrowers as well. From the borrowers’ point of view, however, that part of the loan that was bearing the interest increased and often also the maturity was extended. Naturally, finding the required 30% down payment was a serious

This article is © Emerald Group Publishing and permission has been granted for this version to appear here (www.emeraldinsight.com). Emerald does not grant permission for this article to be further copied/distributed or hosted elsewhere without the express permission from Emerald Group Publishing Limited.
101
challenge for young families. But even when the down payment rate has decreased thanks to the state guarantee, at the end it is still the young family that must pay back the whole loan amount together with interest, and not the state. In any case, the introduction of such a guarantee scheme increased access to loans also for those who could not have afforded a loan without the state support scheme. Moreover, with this decision the Government provided security to banks and enabled them to earn more interest income on the larger loan amounts issued. As of the end of the year 2010, the volume of the KredEx housing loan guarantee portfolio reached 559.4 million kroons (35.7 million Euros). The average loan amount with the KredEx guarantee in 2010 was 729,000 kroons (46,592 Euros). In 2010, the housing loan guarantee was used mainly to buy an apartment (81%) or a house (14%); the rest included renovation or building of living premises. (KredEx) The Kredex housing loan guarantee scheme had mostly a psychological impact on the housing market. If we look at the housing loans portfolios, then we can see that the share of housing loans with KredEx guarantees was 9.4 % of the total volume of housing loans issued in Estonia in 2010 (loans with KredEx guarantees 35,7 mln EUR and total housing loans 381,7 mln EUR). The most important legal act that regulated the activity of credit institutions in Estonia is the Credit Institutions Act. Until 2002 there was the restriction on the maximum amount of a mortgage loan – the maximum mortgage loan amount should be not more then 2/3 of the real estate market value. This restriction was annulled in 2002 with the explanation that Estonia is adopting the Law of Property Act. The regulative framework and changes in the legislation have a direct or indirect effect on household loans and on the household market as a whole. At the same time, it is complicated to evaluate the causality of these changes and the changes of the market. However, it is possible to calculate some indicators, observe their dynamics, and evaluate the movements caused by them. One of the possibilities is to use the LTV ratio that describes the connection between loans already issued by the credit institutions and the prices of houses. Wong et al (2011) analyzed the effectiveness and drawbacks of maximum loan-to-value (LTV) ratios as a macro prudential tool using the panel data from 13 economies and found out, that LTV policy is effective in reducing systemic risk associated with boom and- bust cycles in property markets (Wong et al 2011).

This article is © Emerald Group Publishing and permission has been granted for this version to appear here (www.emeraldinsight.com). Emerald does not grant permission for this article to be further copied/distributed or hosted elsewhere without the express permission from Emerald Group Publishing Limited.
102
Statistics that discloses information on foreign financing in purchasing households is absent. Taking into account that the purchase of a house is one of the largest investments in the life of a private person, the calculations have presumed that all the annual house purchases have been made with the help of credit institutions’ loans. The law on credit institutions contained a limitation (LTV ratio) for all mortgage loans until 2002, according to which banks could not issue loans larger than 2/3 of the market price of the collateral real estate in the case of utilizing the real estate as collateral. The government decided to waive the limitation in 2002. Could the relinquishment of the limitation prescribed by law affect the operation of credit institutions, and what were the concurrent changes in the household market? To find an answer there will be calculated an aggregated LTV ratio for the whole housing market in Estonia. Loan-To-Value Ratio (LTV). Calculated as:
housing loan turnover in yearLoan to value ratio =
value of housing purchase - sale transactions in year
Taking into account the former, we presume that L / V ≤ ⅔ where, L- housing loan turnover in year (using the data from Bank of Estonia) V- value of housing purchase-sale transactions in year (Statistics Estonia) The hypothesis is that the maximum mortgage loan amount for the purpose of housing should not exceed the ⅔ of housing transactions values and the purpose of it is to monitor if and how the restriction has been taken into account.
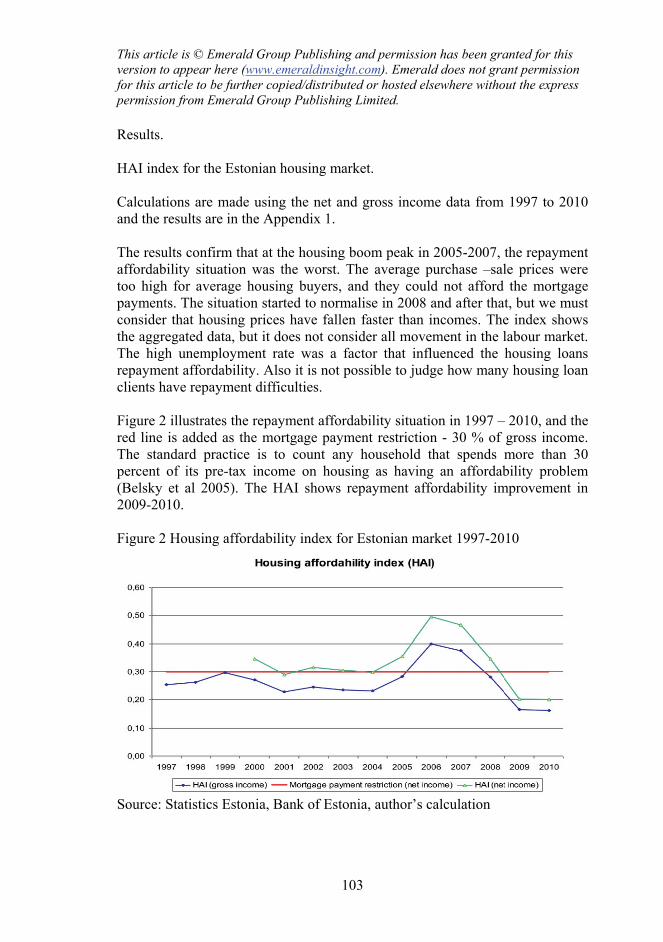
This article is © Emerald Group Publishing and permission has been granted for this version to appear here (www.emeraldinsight.com). Emerald does not grant permission for this article to be further copied/distributed or hosted elsewhere without the express permission from Emerald Group Publishing Limited.
103
Results. HAI index for the Estonian housing market. Calculations are made using the net and gross income data from 1997 to 2010 and the results are in the Appendix 1. The results confirm that at the housing boom peak in 2005-2007, the repayment affordability situation was the worst. The average purchase –sale prices were too high for average housing buyers, and they could not afford the mortgage payments. The situation started to normalise in 2008 and after that, but we must consider that housing prices have fallen faster than incomes. The index shows the aggregated data, but it does not consider all movement in the labour market. The high unemployment rate was a factor that influenced the housing loans repayment affordability. Also it is not possible to judge how many housing loan clients have repayment difficulties. Figure 2 illustrates the repayment affordability situation in 1997 – 2010, and the red line is added as the mortgage payment restriction - 30 % of gross income. The standard practice is to count any household that spends more than 30 percent of its pre-tax income on housing as having an affordability problem (Belsky et al 2005). The HAI shows repayment affordability improvement in 2009-2010. Figure 2 Housing affordability index for Estonian market 1997-2010
Source: Statistics Estonia, Bank of Estonia, author’s calculation

This article is © Emerald Group Publishing and permission has been granted for this version to appear here (www.emeraldinsight.com). Emerald does not grant permission for this article to be further copied/distributed or hosted elsewhere without the express permission from Emerald Group Publishing Limited.
104
Using the same methodology and loan conditions HAI indexes were calculated also for Latvia (similar historical background with Estonia) and Denmark (developed Nordic country). HAI index shows the stable housing affordability situation in Denmark and rapid changes in Latvian housing market (Figure 3). The housing affordability situation in Latvia is even worse than in the Estonian market. Figure 3 Housing affordability index for Estonia, Latvia and Denmark
0,00
0,10
0,20
0,30
0,40
0,50
0,60
1997 1998 1999 2000 2001 2002 2003 2004 2005 2006 2007 2008 2009 2010Estonia Latvia Denmark
Source: Statistics Estonia, Latvia and Denmark, Bank of Estonia, Bank of Latvia, Danmarks Nationalbank, author’s calculation. Purchase affordability. Most transactions were made in the Estonian capital city Tallinn, and the ratio was also calculated for the Tallinn housing market (due to a problem in data availability). Considering the peculiarities of the housing market in Estonia, the price per square metre of a 2 room apartment, which is the average dwelling in Tallinn, and the net monthly income data are used. Figure 4 illustrates purchase affordability in the Tallinn housing market. Assuming that the average household’s net income is the average net income multiplied by 1.5 (average number of employed household members), the P/I for average households in Tallinn is also calculated.

This article is © Emerald Group Publishing and permission has been granted for this version to appear here (www.emeraldinsight.com). Emerald does not grant permission for this article to be further copied/distributed or hosted elsewhere without the express permission from Emerald Group Publishing Limited.
105
Figure 4 P/I ratio for Tallinn housing market (2 room apartments).
Source: Statistics Estonia, Bank of Estonia, author’s calculation The equilibrium point for one person was before 2000 and for the average household in 2001. P/I reached the maximum in 2006, which indicates the housing bubble in Estonia. The P/I ratio shows that one person with average net income cannot afford the average flat in Tallinn. The situation is better using household income data. For a household the index was lower than one in 2000/2001 and again in 2009. The Indicator shows that since 2009 an average household can afford to buy an average flat in Tallinn. Comparing the Estonian indicators with the Latvian ones, we can see that the affordability situation in Riga between 2004 - 2006 was better than in Tallinn (Figure 5). After 2007 the P/I ratio shows the same situation for households with average income in Tallinn and in the capital city of Latvia. Figure 5 P/I ratio for Tallinn and Riga housing market

This article is © Emerald Group Publishing and permission has been granted for this version to appear here (www.emeraldinsight.com). Emerald does not grant permission for this article to be further copied/distributed or hosted elsewhere without the express permission from Emerald Group Publishing Limited.
106
Source: Statistics Estonia, Bank of Estonia, Central Statistical Bureau of Latvia, author’s calculation. The ratio of prices to income by itself is not a sufficient metric by which to evaluate housing affordability. It is an average measure that covers the whole population, whereas housing prices are determined in a market where specific groups of sellers and buyers have different and likely a higher income than the average income in the population. Regulatory impact. Results of regulatory impact analysis are more understandable from Figure 6, which is compiled using data from 1997 until 2010 (Appendix 2) and the year 2002 is marked with a dotted line because of the restriction’s ending.

This article is © Emerald Group Publishing and permission has been granted for this version to appear here (www.emeraldinsight.com). Emerald does not grant permission for this article to be further copied/distributed or hosted elsewhere without the express permission from Emerald Group Publishing Limited.
107
Figure 6 Aggregated LTV ratios for Estonian market.
0,0%
20,0%
40,0%
60,0%
80,0%
100,0%
120,0%
1997
1998
1999
2000
2001
2002
2003
2004
2005
2006
2007
2008
2009
2010
Aggregated LTV ratio Housing loans/GDP
Source: Statistics Estonia, Bank of Estonia, author’s calculation We can see the sharp changes after the elimination of mortgage loan restrictions. The situation changed dramatically after 2002, but we should also agree that the methodology employed cannot give the answer to whether it was the only reason. Housing loan statistics show that housing portfolios skyrocketed after 2002, and our model shows that there could also be a situation where it was possible to get housing loans without the self – financing amount. Therefore there is a need for constringing the credit standards. The result for 2008 shows the anomalies that were caused by the sharp decline in housing prices. There is also the possibility that a portion of housing loans was given for housing renovation purposes. Historically, a number of countries have used limits on the LTV ratio; some of them have validated it recently. According to the IMF Global Financial Stability report of 2011, LTV in Austria, Denmark, Italy, Germany is 80 %, in USA 100 % +, UK 110 %, Spain 100 %, etc. (IMF 2011). Discussion The sharp rise in the housing market started after the elimination of the mortgage loan amount restriction in 2002, which also caused the worsening of affordability issues. The worst affordability situation was from 2005 to 2009.
This article is © Emerald Group Publishing and permission has been granted for this version to appear here (www.emeraldinsight.com). Emerald does not grant permission for this article to be further copied/distributed or hosted elsewhere without the express permission from Emerald Group Publishing Limited.
108
There was a credit boom, but the real estate bubble in Estonia bursted before the Lehman crises. Political decisions might have been made with the purpose of ensuring better access for households to the loan market, but at the same time not taking into account its impact on the real estate market and also on households’ capability of loan repayment. Governments have used different methods to provide affordable housing for its citizens, including social housing. The German system (bausparen) contributes a household’s savings activity. The French and German systems are slightly different, but both require a longer term savings requirement (Dübel 2009). The political decision in Estonia was to build up the housing loan guarantee system, to provide better access to the loan market. Results of the constructed HAI model that characterised the repayment affordability for the Estonian market shows that the situation has improved in 2009-2010. However, as the unemployment rate in Estonia is still high and the inflation rate is rising, it must be considered that this model does not cover all the factors. The 2011 household debt restructuring act could also introduce new problems; hopefully it does not have a negative effect on households' repayment disciplines. There is need for further research that also considers the households’ repayment affordability. HAI index for Latvian market shows the similar trends but the affordability situation is even worse than in Estonia. Denmark has a more stable HAI index compared to the Estonian and Latvian indexes which fluctuate more. The HAI index shows faster improvement in the repayment affordability situation compared to that of the purchase affordability index. The P/I ratio shows that the situation has improved since the real estate bubble burst. The purchase affordability situation before 2007 in Estonia was even worse than in Latvia, but the trend was the same, and at the moment the P/I ratios in Tallinn and Riga are approximately at the same level. But as we mentioned earlier, this ratio also does not cover all factors that have influenced housing purchase affordability. Because of data availability problems, some of the indicators are not evaluated in this paper (DSR, Median Multiple, etc.). Conclusion The problem of housing affordability is very important for all households, and there is a need to continue with research in this field. Some households cannot buy a house, some have loan repayment problems. On one hand, there is a need

This article is © Emerald Group Publishing and permission has been granted for this version to appear here (www.emeraldinsight.com). Emerald does not grant permission for this article to be further copied/distributed or hosted elsewhere without the express permission from Emerald Group Publishing Limited.
109
for tightening of credit conditions, but on other hand, if credit conditions tighten, there will be harder for new homebuyers. The HAI index, proposed by the authors, could be calculated regularly and it could be used as a possible indicator to evaluate the capability of the population to take on household loans in the Estonian household market as a whole. The evaluations of credit institutions about loan taking capacity originate from the bank’s database and are not public. Still, the topic at hand needs further research as the current article does not cover the issue of the capacity of repayment of loans by persons that have already received a household loan. Government activity has helped to make housing loans affordable for households, but it has only amended households’ purchase affordability. The high debt burden has weakened households’ financial position and brings the loan repayment affordability problem to the forefront. After elimination of the mortgage loan restriction, the situation in the housing loan market changed dramatically, and we should agree with hypothesis that the maximum mortgage loan amount for housing purpose should be no bigger than ⅔ of the housing transaction value. There are many possibilities for the government to influence households’ financial behaviour. One solution for the Estonian market is to adopt the German Bausparen system, which helps to activate a household’s savings activity. Policymaking is often more of a form of art, than science, but there is a need for long-term thinking. References: Abelson, (2009), Affordable Housing: Concepts and Policies, Economic Papers, 2009, vol. 28, issue 1, pages 27-38. 5th Annual Demographia International Housing Affordability Survey, 2009. Bank of Estonia, http://www.bankofestonia.info/frontpage/en/. Bank of Latvia, http://www.bank.lv/. Belsky, E. S., Goodman, J., & Drew, R. (2005). Measuring the nation’s rental housing affordability problems. The Joint Centre for Housing Studies, Harvard University.
This article is © Emerald Group Publishing and permission has been granted for this version to appear here (www.emeraldinsight.com). Emerald does not grant permission for this article to be further copied/distributed or hosted elsewhere without the express permission from Emerald Group Publishing Limited.
110
Benito, Andrew (2007), „Housing equity as a buffer: evidence from UK households“, Bank of England Working Paper 324, 2007. BIS Shrapnel, www.bis.com.au (25.April 2011). Borgy, V., Clerc, L., Renne, J.-P. (2011), measuring Aggregate Risk: Can we robustly identify Asset-price boom-bust cycles?, SUERF/Deutsche Bundesbank/IMFS Conference 2011, Berlin. Borio, C., Shim, I. (2007), What can prudential Policy do to support monetary policy, BIS Working Paper n 242. Calculating the National Association of Realtors Housing Affordability Index, http://www.realtor.org/Research.nsf/files/Formulas_HAI.pdf/$FILE/Formulas_HAI.pdf (10.April 2011). California Association of Realtors, http://www.car.org/ (25. April 2011). Campell , J. (2006), Household Finance, The Journal of Finance, August 2006. Case, K. E., Schiller, R. J. (2003), “Is There a Bubble in the Housing Market?” Brookings Papers on Economic Activity, No. 2, pp. 299-342. Central Statistical Bureau of Latvia. Danmarks Nationalbank, http://www.nationalbanken.dk/. Demographia international 2011 International Housing Affordability Survey: 2011. Dynan, K., Johnson, K.Pence, K. (2003), Recent Changes to a Measure of U.S. Household Debt Service, US Federal Reserve Bulletin October 2003. Dynan, Karen; Kohn, Donald (2007), The Rise in U.S. Household Indebtedness: Causes and Consequences, Finance and Economics Discussion Series, Federal Reserve Board, Washington, D.C. 2007. Dübel H., J. (2009), Contractual savings for Housing, in Housing Finance Policy in Emerging Markets, ed.by Loļc Chiquier and Michael Lea (Washington: World Bank).

This article is © Emerald Group Publishing and permission has been granted for this version to appear here (www.emeraldinsight.com). Emerald does not grant permission for this article to be further copied/distributed or hosted elsewhere without the express permission from Emerald Group Publishing Limited.
111
Faruqui, U. (2008), Indebtedness and the Household Financial Health: An Examination of the Canadian Debt Service Ratio Distribution, Bank of Canada Working Paper 2008-46. Finantsinspektsioon, http://www.fi.ee (5. November 2011). Gabriel, M., Jacobs, K., Arthurson, K., Burke, T., Yates, Y. (2005), Conceptualising and measuring the housing affordability problem, AHURI Reseach Paper 1, http://www.ahuri.edu.au/publications/download/nrv3_research_paper_1 (21.Jan 2012) Gallin, J. 2006. The Long-Run Relationship Between House Prices and Income: Evidence from Local Housing Markets. Real Estate Economics, Vol. 34, No.3, pp. 417-438. Gan, Q., Hill, R., (2008) Measuring Housing Affordability: Looking Beyond the Median, School of Economics Discussion Paper: 2008/09, Australian School of Business. Garratt, D. 2001. London’s Housing Market, Housing Finance, No. 49 Global Financial Stability Report (2011), IMF. Global Property Guide, 6 January 2008, Northern Europe leads 2006 house price boom. Green, R., Wachter S. (2007), The housing finance revolution Article provided by Federal Reserve Bank of Kansas City in its journal Proceedings. Herring, Richard, Wachter, Susan (1999), “Real Estate Booms and Banking Busts: An International Perspective”, The Wharton Financial Institutions Centre, University of Pennsylvania , Working Papers, 1999. Jewkes, Melanie D; Delgadillo, Lucy M., (2010), Weaknesses of Housing Affordability Indices Used by Practitioners, Journal of Financial Counselling and Planning, 21. 1 (2010): 43-52. Kredex, http://www.kredex.ee/2 (24.April 2011). Krediidiasutuste seadus, Riigi Teataja

This article is © Emerald Group Publishing and permission has been granted for this version to appear here (www.emeraldinsight.com). Emerald does not grant permission for this article to be further copied/distributed or hosted elsewhere without the express permission from Emerald Group Publishing Limited.
112
Linneman, P. D. Megbolugbe, I. F. (1992). Housing affordability: Myth or reality? Urban Studies, 29(3), pp.369-392. Maclennan, D. and Williams, P. (1990) Affordable Housing in Britain and America, Joseph Rowntree Foundation, York. Maclennan, D., Williams, P. (1990), Housing Finance and Subsidy Systems: accommodating International Experience, Urban Studies December 1990 27, pp.781-784 McCord, M., McGreal, S., Berry, J.,Haran, M. and Davis, P. (2011), The implications of mortgage finance on housing market affordability." International Journal of Housing Markets and Analysis 4:4 2011: pp.394-417 Malpezzi, S. 1999. A simple Error Correction Model of House Prices. Journal of Housing Economics, Vol. 8, No. 1, pp. 27-62. Mengjie, Liu; Reed, Richard; Wu, Hao (2008), Challenges facing housing affordability in Beijing in the twenty-first century, International Journal of Housing Markets and Analysis Vol1, No 3 (2008), pp. 275-287. Muellbauer, J. (2007), Housing, credit and consumer expenditure, "Proceedings, Federal Reserve Bank of Kansas City, pages 267- 33. Muellbauer, J., (2010), Household decisions, credit markets and the macroeconomy: implications for the design of central bank models, BIS Working Papers No 306. National Association of Realtors. Economics and Research Division. http://www.realtor.org/research.nsf/pages/HousingInx?OpenDocument (10.April 2011) Ndubuedze (2007) Measuring Housing Affordability: A Composite Approach, Centre for Urban and Regional Studies (CURS), University of Birmingham. Ortalo-Magné, F., Rady, S. 2006. Housing Market Dynamics: On the Contribution of Income Shocks and Credit Constraints. Review of Economic Studies, No. 73, pp. 459–485. Statistics Denmark, http://www.dst.dk/en.aspx Statistics Estonia, http://www.stat.ee/?lang=en

This article is © Emerald Group Publishing and permission has been granted for this version to appear here (www.emeraldinsight.com). Emerald does not grant permission for this article to be further copied/distributed or hosted elsewhere without the express permission from Emerald Group Publishing Limited.
113
“Trends in California Real Estate.” (2004), California Association of Realtors, Volume 25, Number 2, February 2004. White, W. (2006), “Measured wealth, real wealth and illusion of saving”, IFC Bulletin No. 26, pp. 1- 11. Wilcox, Steve (2005), “Affordability and the intermediate housing market” Local measures for all local authority areas in Great Britan, Joseph Rowntree Foundation, 2005. Wilcox, Steve (2007), “Can’t Buy: Can Rent - The affordability of private housing in Great Britain” – summary report, Hometrack 2007. Wong, E., Fong, T., Li, K. and Choi, H. (2011), Loan-to-value ratio as a macro prudential tool – Hong Kong’s experience and cross-country evidence ,Hong Kong Monetary Authority, Working Paper 01/2011 Yates, J., Milligan , V. (2007),Housing affordability: a21st century problem, National Research Venture 3: Housing affordability for lower income Australians, AHURI, Final Report No. 105, ISSN: 1834-7223 ISBN: 1 921201 72 X Appendix 1 HAI index for Estonian housing market 1997-2010 Year HAI (using gross income data) HAI (using net income data)
1997 0,25 1998 0,26 1999 0,30 2000 0,27 0,35 2001 0,23 0,29 2002 0,24 0,31 2003 0,24 0,31 2004 0,23 0,30 2005 0,28 0,36 2006 0,40 0,50 2007 0,38 0,47 2008 0,28 0,35 2009 0,16 0,20 2010 0,16 0,20 Source: Statistics Estonia, Bank of Estonia, author’s calculation

This article is © Emerald Group Publishing and permission has been granted for this version to appear here (www.emeraldinsight.com). Emerald does not grant permission for this article to be further copied/distributed or hosted elsewhere without the express permission from Emerald Group Publishing Limited.
114
Appendix 2 Purchase-sale contracts and housing loan turnover
Value of purchase-sale contracts, EUR mln
Housing loan turnover, EUR mln
Number of purchase-sale contracts
1997 223 77 28 319 1998 249 63 26 510 1999 301 87 23 669 2000 392 120 28 494 2001 486 176 30 700 2002 594 301 28 622 2003 845 508 33 901 2004 1 143 806 35 784 2005 2 067 1 471 47 215 2006 2 809 2 339 44 858 2007 2 206 2 136 34 171 2008 1 278 1 433 22 527 2009 612 446 15 706 2010 730 419 18 938 Source: Statistics Estonia, Bank of Estonia, author’s calculation

115
Appendix 4
Real Estate Quality Assessment for Valuation in the Estonian Real Estate Market
Ene Kolbre, Angelika Kallakmaa-Kapsta, Veronika Ilsjan
Tallinn School of Economics and Business Administration Akadeemia Rd 3, 12618 Tallinn,Estonia
Abstract During the boom years, 2001−2006, not much attention was paid to the real estate quality and its assessment in the Estonian real estate market because demand in the market was considerably higher than supply. The market decline and depression after the boom raised the need for real estate quality assessment. To solve the problem, a new Estonian real estate quality rating system was worked out with the participation of the authors of this paper, which is designated for valuation of real estate.
This research seeks to identify 1) whether and to what extent real estate valuers attach importance to real estate quality assessment, 2) how does the valuers’ new quality rating system meet their needs, and 3) what is the hierarchy of the indicators preferred by them. A questionnaire based on the Likert scale and the Analytic Hierarchy Process (AHP) method was used to find answers to the questions.
The results of the survey confirm that real estate quality assessment based on the methods worked out is relevant for real estate valuation and taking account of the hierarchy of the factors influencing the quality enables to present a more accurate assessment of the real estate quality.
Keywords: real estate, quality rating, valuation, Estonia
1. Introduction
In the valuation of real estate quality it is important to take into account the real estate sustainability and sustainable development. The role of environmental sustainability has considerably increased in the real estate sector over the past decade. The real estate sector has started to realise its important role and has therefore introduced the concept of sustainable buildings and energy saving principles to the participants in the real estate market. There is also an increasing need for practical tools with the help of which to assess and compare buildings and their sustainability attributes (Din 2001 1994).
Sustainability and sustainable development have been defined in different ways. The most well known of them is the definition in the Report of the World Commission on Environment and Development, UN Our Common Future, which is more widely known as the Brundtland Report. The definition in that

116
document is as follows: “Sustainable development is development that meets the needs of the present without compromising the ability of future generations to meet their own needs” (Wilkinson et al. 2008, 309).
Another notable definition comes from the World Business Council for Sustainable Development saying: „Sustainable development rests on three fundamental pillars: economic growth, ecological balance, and social progress.” (WBCSD, 2011).
To a great extent, all definitions of sustainability and sustainable development contain the following (Wilkinson et al. 2008, 309):
- understanding of the relationships between the economy, environment and society,
- fair distribution of resources and opportunities, - living within the constraints. It has been argued often that sustainable development is broken onto three
constituent parts: environment, society and economy. All these three parts are related to the future – to preserve limited resources for future generations to use and none of these should be preferred to the others. Hence the environmental problems are only one third of those we should deal with when thinking about the future, both in the real estate sector and everywhere else (Keeping et al. 2000, 2). Stuart Hart has said: „Unless sustainability builds shareholder value, it's unsustainable. Sustainability has to be financially justified” (2007, 6).
Myers et al. has written that it is difficult to define precisely what makes a building sustainable when they should be looked at simply as buildings that have reduced impact on the environment and which at the same time provide greater satisfaction to owners and users (Myers et al. 2007, 3).
Although sustainability is today interpreted usually as a general goal to achieve a constant balance between economy, environment and society, sustainable development still means a continuous process aimed at achieving this goal. Taking responsibility for the society and environment can be regarded as a precondition and a measure for applying principles of sustainable development and a socially responsible investment represents a significant means in this sphere (Lorenz et al. 2008, 484).
Many systems for the assessment of real estate quality and sustainability have been developed for different purposes by now. The best known quality grade based sustainability assessment tools, developed to assess the impact of buildings on the environment and users, are BREEAM, created in 1990 in the United Kingdom (Building Research Establishment Environmental Assessment Method) (BREEAM, 2011); LEED (Leadership in Energy and Environmental Design), established in 1998 in the United States to assess the conformity of design and construction of buildings to sustainable development objectives (LEED… 2008, 6); DGNB (Deutsche Gesellschaft für Nachhaltiges Bauen), a certification system developed in Germany in 2007 (DGNB International… 2010: 10−11); CASBEE (Comprehensive Assessment System for Built Environment Efficiency), a certification system developed in 2001 in Japan that considers building’s life cycle costs (CASBEE for..., 2009).

117
The European Group of Valuers Association designed the European Property and Market Rating (PaM) system to measure the sustainable quality of a property in its relevant market (TEGoVA, 2003). PaM system assesses property on the basis of five criteria classes (Market, Location, Property, Quality of Property Cash Flow and Development Risks and Chances) that are broken down into 29 individual criteria.
The Royal Institution of Chartered Surveyors (RICS) has issued a guide how to assess sustainability in the commercial property context, which to a certain extent is also applicable to housing. The guide identifies many fundamental aspects of sustainability that influence property and its potential value (Valuation Information... 2009: 3).
Lützkendorf and Lorenz have pointed out that the valuation typologies used for the valuation of buildings’ sustainability differ from each other mainly by the applicability and effect of the following aspects:
• involvement of sustainability dimensions (environment, economy, social, technical);
• number of life cycle phases of the building (a certain time frame or whole life cycle);
• integrated design and valuation; • content of valuation (qualitative, quantitative or combined); • level of detail or extent of aggregation (summed up or aggregated results); • content of results (in what form information is provided – mark, score,
passport); • applicability to existing buildings (Lützkendorf and Lorenz 2006, 335).
Valuation specialists and the process of valuation have an important role for the achievement of a more extensive market penetration of sustainable construction. Extensive acceptance of sustainable buildings in the market is caused both by their environmental and social advantages, and by increasing demand of market participants for such buildings due to their economic advantages.
Real estate valuation, on the one hand, represents an important mechanism for levelling economic profit with the help of environmental and social activities and thereby showing and communicating advantages and benefits of sustainable buildings. On the other hand, it is assumed that gradual changes in the attitudes of market participants in favour of sustainable buildings must be reflected in the process of real estate valuation and assessment of the involved risks (otherwise the valuers would make misleading assessments). The above might lead to a positive feedback chain: when market participants see solid advantages of sustainable buildings in real estate valuation reports (for instance, energy efficiency), this encourages them to grow more sustainable in order to achieve a higher price for the real estate they either own or plan to sell (Lorenz et al. 2008, 485).
It should be considered also that different market participants have different interests in respect to development, construction, obtaining and maintaining of sustainable buildings. A building maintenance organisation may aspire toward a

118
better image, lower costs, healthier work environment and increased satisfaction of personnel. A real estate investor, on the other hand, may seek greater real estate value, better image for the firm, lower ownership costs and lower vacancy rates (Schleich et al. 2010, 204).
Real estate valuers and market analysts in Estonia used various indicators to characterise the quality of real estate, and even those were mainly for offices and commercial real estate. Until the year 2009, Estonia had no uniform real estate rating system that would have covered all types of real estate. The need to harmonise and ensure unambiguousness of the quality rating led to working out a new quality rating system for real estate valuation which takes into account sustainability of property and specific features of the local market. The authors of this paper participated in the group working out the Real Estate Quality Rating System and the findings are published in: EVS 875-10:2008 Property Valuation. Part 10: Inspection of Property and Data Collection.
The Estonian Real Estate Quality Rating System was elaborated based on the principle that for the assessment of real estate sustainability it is appropriate to observe four dimensions which, unlike other approaches, take into account also functional and technological aspects, which was presented by Lorens. These four dimensions are:
• functional and technical aspects (maximisation of functionality, adaptability and serviceability; aesthetic quality);
• environmental aspects (reduction of land and resource use, closing of material flows, reduction of hazardous substances, emissions and environmental impact);
• social and cultural aspects (health and comfort, social integration); • economic aspects (minimization of life cycle operating costs, value
stability, protection of capital and material goods) (Lorenz 2010, 7). These four dimensions are taken into account via factors influencing three
attributes that characterise total quality rating. This paper seeks to clarify: 1) whether and to what extent real estate valuers
attach importance to real estate quality assessment; 2) how does the valuers’ new quality rating system, taking into consideration the sustainability, meet their needs, and 3) what is the hierarchy of the indicators influencing the quality grade. 2. Data and Methodology The object of research in this paper is the Estonian real estate quality rating system, its content, suitability and applicability to real estate valuation and the hierarchy of factors influencing the quality.
2.1. Estonian Real Estate Quality Rating System
Quality grade serving as the basis for the new rating system shows the competitiveness of the real estate object to be attractive for similar types of

119
lessees or buyers. Quality grade is a complex indicator that represents a combination of factors (rent, building materials, finishing, standards and efficiency of technical systems, amenities, location, access etc) that characterise the income potential and value of the real estate and market expectations for these indicators (EVS 875:10, 2009). As market demand is the main factor influencing income potential and sustainability of the real estate, the quality grade is determined on the basis of market demand principle.
Quality grade for a real estate object is determined on the basis of its income potential, taking into consideration the sustainability of the object, i.e. every factor has to assessed based on the principles of sustainable development and saving use. Income potential is evaluated on the basis of the following attributes:
− location and use of the plot, − quality of construction, − real estate management. For determining the real estate quality grade, a rating will be given
separately to each attribute in a three point system (A, B and C where A is the highest and C the lowest) and aggregate rating of the real estate is the evaluation result of the three attributes (for example, ABB; BBC).
Valuation of each attribute (location and use of plot, quality of construction, and management of real estate) is based on the factors (see table 1) that influence the respective attribute, which are also evaluated in A, B, C system.
Table 1: The factors that influence the respective attribute
Attribute Factors Location and use of plot
Location within the region, general plan and usage of the object, infrastructure for public services in the vicinity, services provided in the region, greenery and maintenance of the region, pollution of the air, noise, security, maintenance of local roads, light traffic roads and public recreation grounds, parking facilities, conformity to the building right of the plot, shape and size of the plot, greenery and maintenance of the plot, supply of utilities on the plot, water regime on the plot, passing traffic and visibility
Quality of construction
Architectural solution, functionality of the building, condition of structures, condition of technical installations in the building, exterior finishing of the building, quality of the interior finishing and fixed interior fittings in the building

120
Management of real estate
Management of property, homogeneity and solvency of the property users, rental rate, use/non-use of electricity saving measures as a result of which energy expenses are lower, energy consumption of the building (kWh/m²/y), waste disposal and assortment, utility service costs (energy, water, heating expenses measured in cash)
Source: EVS875:10; 2009 The choice of factors influencing the attributes depends on the type of object to be valued, i.e. residential, office, commercial, and storage and production properties.
The factors are evaluated using a relative measure (for example, lower than average – average − higher than average; satisfies elevated standards − satisfies medium standards − satisfies low standards etc). The final rating of the attribute is calculated as a sum of grades of individual elements on the basis of dominating valuation results, taking into consideration their influence on the object’s value. The calculated final grade is based on expert’s experiences, knowledge and logical arguments rather than mathematical calculations.
Every real estate object, as a rule, shall be awarded one quality grade rating. In case there is more than one building on the plot, each important building shall be awarded a separate rating of the construction quality grade and a common weighted rating of the object as a whole, taking into consideration the contribution of individual buildings to the value of the object.
For determining the quality grade for parts of building (apartments), the real estate object shall be valued as a whole and additionally quality grades are determined separately for apartments. The quality grade for an apartment is determined on the basis of a separate group of factors (quality of interior and fittings). The quality grade symbol for a part of building shall be added to the quality grade of the real estate as a whole in the form of a lower-case letter (a, b, c) affixed to the building’s quality grade symbol, for example, ABbC.
2.2. Study Design We used a questionnaire based on the Likert scale to find out the opinion of valuers about the necessity of determining the quality grades and methods of determining the quality grades based on the Estonian quality standards EVS 875: 10. A five-point scale with diminishing firmness of statement was used: Completely agree, rather agree, rather disagree, completely disagree, cannot say. On the basis of the questionnaire results, the most important factors that influence the quality rating were selected.
To evaluate the hierarchy of the factors influencing the quality grade, and the changes in the hierarchy, depending on whether the quality rating factor is evaluated from the aspect of property users, valuers or developers the Analytic Hierarchy Process (AHP) method is used, which was elaborated by Thomas L. Saaty in the 1970s. The method is intended to organise those systems whose operation is based on subjective assessments (Saaty 1980).

121
Saaty’s method enables to model a sophisticated decision-making problem with the help of a hierarchical structure, which is comprised of goal, criteria, sub-criteria, and alternatives. The advantage of this method is the possibility to handle both qualitative as well as quantitative objects; the output of this method is a mathematically correct quantitative judgement of the alternatives (Forman 1983).
The main idea of Saaty’s method is to free the decision-makers from the need to provide absolute scales to evaluate objects (scales of weight). Instead they use a pair-wise comparison of criteria and identify the dominant criterion and the strength of its dominance (Saaty 1994b). To compare the criteria to each other, the so-called Saaty’s scale is used with the following values (Saaty 1980):
Intensity Definition 1 Equal importance 3 Moderate advantage or importance 5 Strong advantage or importance 7 Very strong advantage or importance 8 Absolutely more important 2,4,6,8 Compromise between two slightly differing
judgements With n criteria a1, a2, ..., an, the relative importance (relative weights) of
which is k1, k2, ..., kn., respectively, matrix A is formed, where the rows are ratios of the respective criterion’s relative weight to the relative weight of the other criterion (Võhandu 1998):
a1 a2 ... an a1 k1/k1 k1/k2 k1/kn a2 k2/k1 k2/k2 k2/kn
... an kn/k1 kn/kn
Multiplying the ratios’ matrix A by the vector of relative weights we get n-
fold vector of relative weights:
1 2 1 2( , ... ) ( , ... ),or n nA k k k n k k k A k n k× = × × = ×
In order to normalise the vector of weights let’s divide its components by the sum of components. We can denote the matrix A also as follows:
A=(aij), aij=ki/kj , where i,j=1,..., n.
This matrix has positive elements and it satisfies the so-called inverse condition: aji=1/aij. Also applicable is the relationship ajk=aik/aij.
In order to evaluate the hierarchy of the factors influencing real estate’s quality rating and changes in that hierarchy depending on whether the quality grade factor is evaluated from the aspect of property user, valuer or developer, first the hierarchy of the factors is determined with the help of Saaty’s method

122
for each attribute: location and use of plot, quality of construction and management of real estate. Then it is evaluated how the relative weight of these attributes changes depending on whether the quality grade is calculated from the aspect of user, valuer or developer, and the factors of influence are evaluated.
3. Results
3.1. Quality Rating System The questionnaire survey of valuers regarding the need for quality rating and the quality rating methods based on the Estonian valuation standard EVS 875: 10 was conducted electronically between 3 and 18 May 2010. Questionnaires were sent to 60 members of the Estonian Association of Appraisers; 35 of them responded, which makes the response rate 58. Most of the respondents have been active in real estate valuation for over 10 years (37%), 31% 6−10 years, 26% 3−5 years and only 6% shorter than 3 years. Most of the respondents (60%) had the highest (V level) professional certificate of property valuer; 11% had the 4th level professional certificate and 29% had no certificate.
All the respondents found that it is important to calculate the quality rating grade for real estate objects in real estate valuation. Differences in opinions were caused by the method of valuation. According to the valuation standards, the quality must be determined on the basis of three attributes (location and use of plot; quality of construction, and real estate management), and each of them contains several factors. 42% of the valuers completely agreed with this valuation method and 43% rather agreed; 15% answered either rather disagree or disagree. The last group comprised valuers without a professional certificate or with a short employment.
3.2 Hierarchy of Quality Factors
To evaluate the importance of the factors while analysing the questionnaire results we calculated the arithmetic mean of the factors. The answers „completely agree” were replaced by grade 4; „rather agree” − 3; „rather disagree” by 2 and „completely disagree“ by 1. The answers „can’t say” were missing.
To use the method of analytical hierarchies structured interviews were conducted with ten real estate valuers who had the highest professional certificate. For building a location and use of plot attribute hierarchy 12 most important factors were selected from among 16 factors presented in the standard based on the questionnaire results. The number of factors for other attributes corresponds to that provided in the valuation standard. Valuation results of quality rating factors on the basis of the location of object and use of plot, according to the questionnaire results and Saaty’s method, are presented in Table 2.
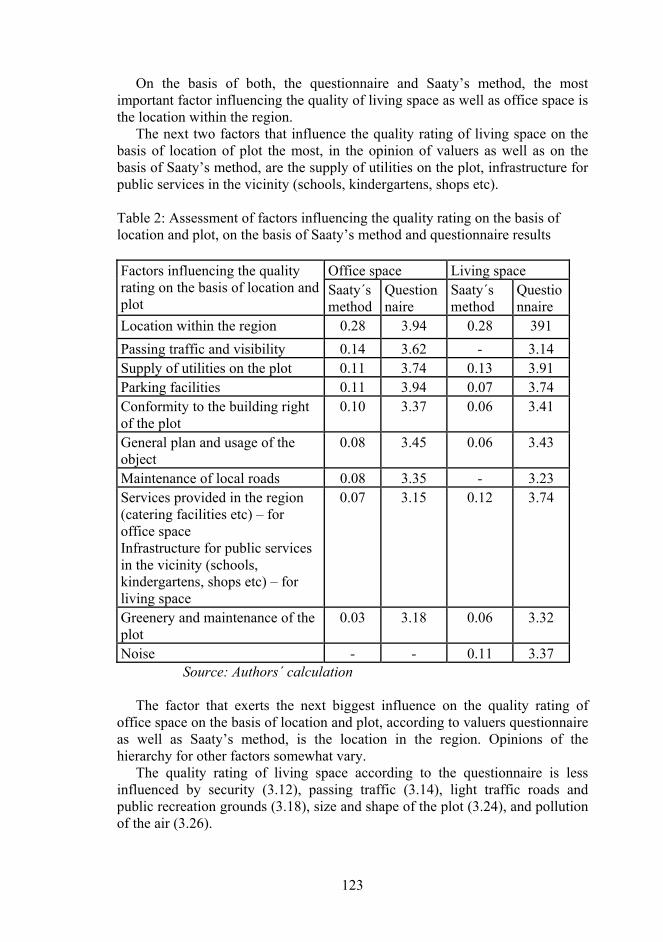
123
On the basis of both, the questionnaire and Saaty’s method, the most important factor influencing the quality of living space as well as office space is the location within the region.
The next two factors that influence the quality rating of living space on the basis of location of plot the most, in the opinion of valuers as well as on the basis of Saaty’s method, are the supply of utilities on the plot, infrastructure for public services in the vicinity (schools, kindergartens, shops etc).
Table 2: Assessment of factors influencing the quality rating on the basis of location and plot, on the basis of Saaty’s method and questionnaire results Factors influencing the quality rating on the basis of location and plot
Office space Living space Saaty´s method
Questionnaire
Saaty´s method
Questionnaire
Location within the region 0.28 3.94 0.28 391
Passing traffic and visibility 0.14 3.62 - 3.14 Supply of utilities on the plot 0.11 3.74 0.13 3.91 Parking facilities 0.11 3.94 0.07 3.74 Conformity to the building right of the plot
0.10 3.37 0.06 3.41
General plan and usage of the object
0.08 3.45 0.06 3.43
Maintenance of local roads 0.08 3.35 - 3.23 Services provided in the region (catering facilities etc) – for office space Infrastructure for public services in the vicinity (schools, kindergartens, shops etc) – for living space
0.07 3.15 0.12 3.74
Greenery and maintenance of the plot
0.03 3.18 0.06 3.32
Noise - - 0.11 3.37 Source: Authors´ calculation
The factor that exerts the next biggest influence on the quality rating of
office space on the basis of location and plot, according to valuers questionnaire as well as Saaty’s method, is the location in the region. Opinions of the hierarchy for other factors somewhat vary.
The quality rating of living space according to the questionnaire is less influenced by security (3.12), passing traffic (3.14), light traffic roads and public recreation grounds (3.18), size and shape of the plot (3.24), and pollution of the air (3.26).

124
The quality rating of office space according to the questionnaire is less influenced by light traffic roads and public recreation grounds (2.34), pollution of the air (2.88), size and shape of the plot (2.94), noise (2.94) and security (2.97). The factors influencing the quality rating of living space and office space the least have been omitted from analysis with Saaty’s method since the large number of factors does not always enable to identify the shares of factors.
Assessment results of the factors influencing the quality rating on the basis of construction quality, relying on the questionnaire and Saaty’s method, are presented in Table 3.
The factors that influence the quality rating of living space most on the basis of construction quality, in the opinion of valuers, are the condition of structures and the condition of technical installations in the building, based on both methods. Table 3: Factors influencing the quality rating on the basis of construction quality, on the basis of Saaty’s method and the questionnaire: Factors influencing the quality
rating on the basis of construction quality
Office space Living space
Saaty´s method
Questionnaire
Saaty´s method
Questionnaire
Condition of structures 0.28 3.79 0.31 3.89
Functionality of the building 0.20 3.91 0.19 3.66
Condition of technical installations in the building
0.17 3.73 0.20 3.86
Architectural solution 0.15 3.65 0.12 3.57 Exterior finishing of the building
0.11 3.50 0.07 3.60
Quality of the interior finishing and fixed interior fittings in the building
0.09 3.68 0.10 3.66
Source: Authors´ calculation The factors that influence most the quality rating of office space on the basis
of construction quality are functionality of the building and condition of the structures.
Not one factor influencing the quality rating of living and office space can be regarded as unimportant, as the mode of all factors was 4. The factors influencing quality rating on the basis of real estate management quality, based on the questionnaire results and Saaty’s method, are presented in Table 4.

125
Table 4: Factors influencing the quality rating on the basis of real estate management, according to Saaty’s method and the questionnaire Factors influencing the quality rating on the basis of real estate management
Office space Living space Saaty´s method
Questionnaire
Saaty´s method
Questionnaire
Rental rate 0.29 3.76 - - Management of a property 0.16 3.62 0.29 3.29 Homogeneity and solvency of the property users 0.15 3.32 0.16 2.97 Utility service costs (energy, water, heating expenses measured in cash) 0.15 3.62 0.06 3.51 Energy consumption of the building (kWh/m²/y) 0.12 3.39 0.15 3.29 Use/non-use of electricity saving measures as a result of which energy expenses are lower 0.07 3.26 0.15 3.21 Waste disposal and assortment 0.05 2.65 0.12 2.62
Source: Authors´ calculation The factor that in the opinion of valuers influenced the quality rating of living space the most on the basis of real estate management was utility service costs (energy, water, heating expenses measures in cash). The ranking of other factors differs on the basis of the questionnaire results and Saaty’s methods.
The factors that influenced the quality rating of office space the most on the basis of real estate management are rental rates, utility service costs and management of the property and less important are waste disposal and assortment and use/non-use of electricity saving measures that lower the energy expenses, on the basis of both the questionnaire and Saaty’s method.
3.3. Hierarchy of quality attributes
The quality attributes that are valued very highly are location and plot whereas the significance of real estate management is very small for both of the real estate types. The hierarchy of the quality rating attributes is depicted on Figure1.

126
Figure 1: Weightings of attributes Source: Authors´calculations To find the co-effect of every attribute and factor on the real estate quality rating the weightings of attributes found with Saaty’s method are multiplied by weightings of factors, we get the weighting of every factor in the quality rating of the real estate object as a whole. The hierarchy of factors formed at the combined influence of attributes and factors is presented in Annex 1. As a co-effect, the hierarchy of the first five factors for office space is as follows: location within the region, passing traffic and visibility, supply of utilities on the plot, parking facilities, conformity to the building right of the plot, which are all related with the attribute ‘location and plot’. The hierarchy of the factors co-influencing living space is also related mainly with location, one factor also with construction: location within the region, condition of structures, supply of utilities on the plot, parking facilities, conformity to the building right of the plot. 4. Conclusions The research findings demonstrated that in the opinion of all valuers it is essential to award a quality grade rating for real estate objects taking into consideration their sustainability: 85% of the respondents to the questionnaire found it is important to award a quality grade based on all three attributes described in the standard (location and use of plot; construction quality; real estate management). Those who did not agree were mainly valuers who had no professional certificate or a short past employment. Acknowledgement of sustainability by valuers is compatible with the tendency growing in all the world according to what the role of environmental sustainability has considerably increased. Hence it can be concluded on the basis of the results that the indicator suggested by the Estonian Association of Appraisers to characterise real estate quality shows well the reality and the three attributes selected for the valuation provide a comprehensive picture of the object’s quality.
The research also identified that it is justified to characterise the quality rating as a three-letter combination since the real estate market participants

127
attach different value to different attributes and therefore a three-letter quality rating provides needful information for all market participants.
The questionnaire survey results suggested that one of the factors had significantly higher weighting than others in every attribute. On the basis of location and use of plot, the valuers think the most important factor both for office and for living space is the location within the region. From the aspect of building quality the most important for living space is the condition of structures. The most important for office space in the opinion of valuers is the functionality of the building. The highest weighted factor in real estate management is the rental rate for office space and utility service costs for living space.
Since the selection of comparison data is extremely important for the precision of real estate valuation it is essential that the objects to be compared were comparable also in terms of quality and the factors that influence the quality. For conducting a comparison the objects are made as similar to the object to be valued as possible; when the factors that influence the quality are incompatible these differences are transmitted to the object valued. This, however, affects the accuracy of valuation. Therefore the valuer when selecting comparable objects or data, must pay attention also to the ranking of factors within the attribute and not only look at the quality rating as a whole. To increase the precision of valuation it is essential to assess precisely the factors of influence of every attribute separately for the quality rating.
Although the real estate quality rating system treats all quality attributes (location and plot, construction quality and management) as equal, the research showed that in practice valuers attach extremely great importance to the attribute ‘location and plot’ and little significance to factors under the attribute ‘management’. From the aspect of sustainability, however, energy, water, heating expenses and waster disposal, which are under the attribute ‘management’, have a significant role. A reason why valuers do not attach importance to energy saving problems may be that the Estonian real estate market reacts to rising energy costs with a time lag and consumers were not yet ready to value energy saving when the research was conducted.
As other studies show, the real estate sector is to a very great extent associated with sustainability. For example, buildings are responsible for 40–50% of final energy consumption and 40% of total amount of disposable waste. Buildings also consume 16% of fresh water and 40% of raw materials. Moreover, 25% of timber felling is for buildings (Wilkinson et al. 2008, 317). This statistics shows clearly that the overall environmental impact of buildings is big; it is essential to pay attention to its reduction and take to a greater extent into consideration in real estate quality rating and value.
Interviews with valuers showed that no problems arise in valuation practice when valuing quality rating factors of contemporary buildings that satisfy demands for contemporary conveniences; however, it is more complicated to value older buildings where factors are not clear and therefore it is also more complicated to provide an aggregate assessment of the attributes. Although the

128
real estate quality rating method points out that the weighted aggregate quality rating is based on expert experiences, knowledge and logical arguments rather than mathematical calculations and the valuation is based on prevailing majority of the valuation results of the factors of influence considering their impact on the object’s value, the standard does not provide which factors are more important for the rating. Research results, based on the Analytic Hierarchy Process method, however, showed a clear hierarchic distinction of the factors influencing the quality rating in case of every quality attribute both for living and for office space.
Using the results of analysis and valuers’ practical experiences in quality rating assessment, the methods of quality rating assessment should be amended by the hierarchy of factors that influence quality rating across different property types. Also the procedure for revising the hierarchy of factors of influence should be added since the hierarchy of factors is changing over time. By ranking the factors influencing the quality rating we can increase the precision of real estate valuation since it enables to check the conformity between different objects or data and give more accurate information to all market participants which factors the market values. References Din, A., Hoesli, M. and Bender, A. (2001). Environmental Variables and Real
Estate Prices. Urban Studies, 38 (11): 1989–2000. BREEAM (2011)
http://www.breeam.org/filelibrary/Technical%20Manuals/SD5073_ BREEAM_2011_New_Construction_Technical_Guide_ISSUE_2_0.pdf. (14.07.2011)
CASBEE for Property Appraisal. http://www.ibec.or.jp/CASBEE/english/method (15.07.2011) DGNB International, 2010. [http://www.dgnbinternational. com/international/_fileadmin/PPT_und_PDF/DGNB_International.pdf]. (15.07.2011)
EVS 875-10:2008. Property valuation Part: Inspection of Property and Data Collection (Kolbre, E.; Ilsjan, V.; Tiits, T.; Tomson, A.). Estonian Centre for Standardisation, Tallinn.
Forman, E.H. (1983). The Analytic Hierarchy Process as a Decision Support System, Proceedings of the IEEE Computer Society
Hart, S. (2007). Defining 'Sustainability' Takes Energy. National Real Estate Investor, 49 (6): 6-10.
Keeping, M. (2000). What about the demand? Do investors want sustainable buildings? London: RICS Research Foundation.
LEED for Existing Buildings (2008). Operations & Maintenance Green Building Rating System. U.S. Green Building Council.

129
Lorenz, D., and Lützkendorf, T. (2008). Sustainability in Property Valuation: Theory and Practice. Journal of Property Investment & Finance, 26 (6): 482 –521.
Lorenz, D. Property Valuation & Sustainability: The Role of Valuation Professionals. Sustainability and Its Impact on Real Estate. 6 December 2010,
104 RICS Denmark. 32 p. http://www.rics.org/site/download_feed.aspx?fileID= 8393&fileExtension= PDF 15.06.11.
Lützkendorf, T. and Lorenz, D. (2006). Using an Integrated Performance Approach in Building Assessment Tools. Building Research & Information, 2006, 34(4):334-356.
Myers, G., Reed, R. and Robinson, J. (2007). The Relationship between Sustainability and the Value of Office Buildings. [WWW]
http://www.prres.net/papers/Myers_Reed_Robinson_The_Relationship_Between_Sustainability.pdf (02.03.2010)
Saaty, T.L. (1980). The Analytic Hierarchy Process. McGraw Hill, New York, NY.
Saaty, T.L. (1994). Fundamentals of Decision Making and Priority Theory with the Analytic Hierarchy Process, RWS Publications, Pittsburgh, Pennsylvania.
Schleich, H., Lindholm, A., L. and Falkenbach H. (2010). Environmental Sustainability – Drivers for the Real Estate Investor. Journal of Real Estate Literature, 18 (2): 201–223.
The European Group of Valuers Associations. (2003). European Property and Market Rating: A Valuer´s Guide, TEGoVA, Brussels
Valuation Information Paper No 13. Sustainability and Commercial Property Valuation (2009). Royal Institution of Chartered Surveyors (RICS), London.
http://www.joinricsineurope.eu/uploads/files/VIP13deutschebersetzungfinal.pdf Võhandu, L. (1998). Subjektiivsetest hinnangutest objektiivsete tulemusteni,
TTÜ Informaatikainstituut. WBCSD. Corporate Social Responsibility. (2011). http://www.wbcsd.org/
templates/TemplateWBCSD5/layout.asp?type=p&MenuId=MTE0OQ (5.07.2011)
Wilkinson, S. and Reed, R. (2008). Property Development. 5th ed. Routledge. London.

130
APPENDIX 1 Weighting factors influencing the quality rating on the basis of location and plot
Factors Office space Living space
Location within the region 0.20 0.14 Passing traffic and visibility 0.10 0.00 Supply of utilities on the plot 0.08 0.06 Parking facilities 0.08 0.06 Conformity to the building right of the plot
0.07 0.05
General plan and usage of the object 0.06 0.04 Maintenance of local roads 0.06 0.00 Services provided in the region (catering facilities etc)
0.05 0.04
Greenery and maintenance of the plot 0.02 0.02
Weighting factors influencing the quality rating on the basis of construction quality Factors Office space Living space Condition of structures 0.06 0.07 Functionality of the building 0.04 0.01 Condition of technical installations 0.03 0.01 Architectural solution 0.03 0.01 Exterior finishing of the building 0.02 0.02 Quality of the interior finishing 0.02 0.00
Weighting factors influencing the quality rating on the basis of real estate management Factors Office space Living space
Rental rate 0.023 − Management of a property 0.013 0.003 Solvency of the property users 0.012 0.003 Utility service costs 0.012 0.003 Energy consumption (kWh/m²/y) 0.010 0.002 Electricity saving measures 0.006 0.001 Waste disposal and assortment 0.004 0.001

131
DISSERTATIONS DEFENDED AT TALLINN UNIVERSITY OF TECHNOLOGY ON
ECONOMICS
1. August Aarma. Segmented Analysis of Bank Customers and Banking Information: Estonian Case. 2001.
2. Enn Listra. The Development and Structure of Banking Sector: Retail Banking in Estonia. 2001.
3. Tatyana Põlajeva. The Comparative Analysis of Market’s Attractiveness. 2001.
4. Tuuli Tammeraid. Modeling Flow of Funds for Estonia. 2002.
5. Ivo Karilaid. The Choice in General Method for Investment and Performance Evaluation. 2002.
6. Hele Hammer. Strategic Investment Decisions: Evidence from Survey and Field Research in Estonia. 2003.
7. Viljar Jaamu. The Methods and Instruments for Solving the Banking Crisis and Development of the Banking Sector in Estonia. 2003.
8. Katri Kerem. From Adoption to Relationships: Internet Banking in Estonia. 2003.
9. Ly Kirikal. Productivity, the Malmquist Index and the Empirical Study of Banks in Estonia. 2005.
10. Jaanus Raim. The PPP Deviations between Estonia and Non-Transitional Countries. 2006.
11. Jochen Sebastian Heubischl. European Network Governance – Corporate Network Systematic in Germany, the United Kingdom and France: an Empirical Investigation. 2006.
12. Enno Lend. Transpordiühenduse ja logistikasüsteemi interaktsioon (Saaremaa ja Hiiumaa näitel). 2007.
13. Ivar Soone. Interrelations between Retail Service Satisfaction and Customer Loyalty: A Holistic Perspective. 2007.
14. Aaro Hazak. Capital Structure and Dividend Decisions under Distributed Profit Taxation. 2008.
15. Laivi Laidroo. Public Announcements’ Relevance, Quality and Determinants on Tallinn, Riga, and Vilnius Stock Exchanges. 2008.
16. Martti Randveer. Monetary Policy Transmission Channels, Flexibility of the Economy and Future Prospects of the Estonian Monetary System. 2009.

132
17. Kaire Põder. Structural Solutions to Social Traps: Formal and Informal Institutions. 2010.
18. Tõnn Talpsepp. Investor Behavior and Volatility Asymmetry. 2010.
19. Tarmo Kadak. Creation of a Supportive Model for Designing and Improving the Performance Management System of an Organisation. 2011.
20. Jüri Kleesmaa. Economic Instruments as Tools for Environmental Regulation of Electricity Production in Estonia. 2011.
21. Oliver Parts. The Effects of Cosmopolitanism on Estonian and Slovenian Consumer Choice Behavior of Foreign versus Domestic Products. 2011.
22. Mart Nutt. Eesti parlamendi pädevuse kujunemine ja rakendamine välissuhetes. 2011.
23. Igor Novikov. Credit Risk Determinants in the Banking Sectors of the Baltic States. 2011.
24. Mike Franz Wahl. Kapitaliühingute lõppomanike alusväärtuste ja tahte uurimine ning omanikkonna tüpoloogia konstrueerimine. 2011.
25. Tobias Wiebelt. Impact of Lease Capitalization on the Development of Accounting Standards: A Theoretical Research. 2012.
26. Sirje Pädam. Economic Perspectives on Environmental Policies: The Costs and Benefits of Environmental Regulation in Estonia. 2012.
27. Juhan Värk. Venemaa positiivse hõlvamise poliitika ja teiste välispoliitiliste liinide mõjud Eesti-Vene suhetele aastail 1991–2011. 2012.
28. Mari Avarmaa. Implications of Capital Structure and Credit Constraints for Company Performance: A Comparative Study of Local and Multinational Companies in the Baltics. 2012.
29. Fabio Filipozzi. The Efficiency of Interest Rate and Foreign Exchange Markets in the Euro Area and Central and Eastern Europe. 2012.
30. Aleksei Netšunajev. Developments and Determinants of Intra-Industry Trade in the Baltic States. 2012.
31. Aleksandr Miina. Critical Success Factors of Lean Thinking Implementation in Estonian Manufacturing Companies. 2012.
Copyright © 2022 FDOKUMEN