Institute of Experimental and Clinical Medicine Estonian Drug Monitoring Centre Estonian National...
88
1 Institute of Experimental and Clinical Medicine Estonian Drug Monitoring Centre Estonian National Focal Point ESTONIA DRUG SITUATION 2002 Katri Abel Ave Talu Aljona Kurbatova Andri Ahven Gleb Denissov January 2003 Tallinn
-
Upload
independent -
Category
Documents
-
view
3 -
download
0
Transcript of Institute of Experimental and Clinical Medicine Estonian Drug Monitoring Centre Estonian National...

1
Institute of Experimental and Clinical MedicineEstonian Drug Monitoring Centre
Estonian National Focal Point
ESTONIADRUG SITUATION 2002
Katri AbelAve Talu
Aljona KurbatovaAndri Ahven
Gleb Denissov
January 2003Tallinn

2
CONTENTS
CONTENTS
SUMMARY …………………………………………………………………………… 5
MAIN TRENDS AND DEVELOPMENTS
PART 1
NATIONAL STRATEGIES: INSTITUTIONAL & LEGAL FRAMEWORK
1. Developments in drug policy and responses. ………………………. 8
1.1 Political framework in the drug field……………………………….81.2 Legal framework ……………………………………………….81.3 Implementation of legal acts…………………………………..91.4 Developments in public attitudes and debates………………….101.5 Budget and funding arrangements (in 2001)……………………10
________________________________________________________________
PART 2
EPIDEMIOLOGICAL SITUATION
2. Prevalence, patterns and developments in drug use………12
2.1 Main developments and emerging trends……………………..12
3. Health consequences…………………………………………………...14
3.1 Drug treatment demand………………………………………….143.2 Drug-related mortality…………………………………………….183.3 Drug-related infectious diseases………………………….……..203.4 Other drug-related morbidity……………………………….…….26
4. Social and legal implications and consequences………………….29
4.1 Social problems……………………………………………..…….294.2 Drug offences and drug-related crimes…………………………33
4.2.1 Characteristics of drug offenders……………………….354.2.2 Drug trafficking……………………………………………364.2.3 Drug-related crimes………………………………………37
4.3 Social and economic costs of drug consumption………………38

3
CONTENTS
5. Drug markets……………………………………………………………38
5.1 Availability and supply………………………………………….385.2 Seizures………………………………………………………….395.3 Price, purity………………………………………………………42
6. Trends per drug…………………………………………………………43
7. Discussion………………………………………………………………..44
7.1 Consistency between indicators………………………………..447.2 Methodological limitations and data quality……………………..45
________________________________________________________________PART 3
DEMAND REDUCTION INTERVENTIONS
8. Strategies in demand reduction at the national level…………………….46
8.1 Major strategies and activities………………………………468.2 Approaches and new developments……………………….46
9. Prevention……………………………………………………………………….47
9.1 School programmes…………………………………………479.2 Youth programmes outside school………………………...489.3 Family and childhood………………………………………..489.4 Other programmes…………………………………………..52
10. Reduction of drug-related harm…………………………………………..55
10.1 Description of interventions……………………………….6210.2 Standards and evaluation…………………………………63
11. Treatment………………………………………………………………..……64
11.1 Drug-free treatment and health care at national level….6511.2 Substitution and maintenance programmes…………….6611.3 After-care and re-integration………………………………67
12 Interventions in the criminal justice system…………………………….68
12.1 Assistance to drug users in prisons………………………6912.2 Alternatives to prison for drug dependent offenders……7212.3 Evaluation and training…………………………………….73
13.Quality assurance………………………………………………………………74________________________________________________________________

4
CONTENTS
PART 4
KEY ISSUES
14. Demand reduction expenditures on drugs in 1999………………….75
15. Drug and alcohol use among young people aged 12-18…………...76
16. Social exclusion and re-integration…………………………………….7816.1 Definitions and concepts………………………………………………7816.2 Drug use patterns and consequences observed among the sociallyexcluded population………………………………………………………….8116.3 Relationship between social exclusion and drug use………………8116.4 Political issues and reintegration programmes……………………...81
________________________________________________________________
REFERENCES
ÿ Bibliography…………………………………………………………..….84ÿ Data bases/software/Internet addresses……………………………..85
ANNEX
ÿ List of figures used in the text……………………………………………86ÿ List of tables used in the text……………………...……………………..86ÿ List of abbreviations used in the text……………………………………88
5
SUMMARY
SUMMARY
The National Report on the Drug Situation in Estonia has been drafted by the
Estonian Drug Monitoring Centre for the submission to the Ministry of Social Affairs
of Estonia and the European Monitoring Centre for Drugs and Drug Addiction
(EMCDDA). All EU REITOX National Focal Points of the Central and Eastern Europe
(CEEC) countries are subject to reporting responsibility and have been submitting an
annual report since 2001. The present report is the second report, which gives an
overview of the drug situation in Estonia in 2001. The structure of the report is based
on the EMCDDA Guidelines for National Reports, which are the same for all EU and
CEEC countries. This report provides an outline of the political and legal framework,
epidemiological situation and demand reduction interventions in Estonia in 2001.
The data presented in the report is key information to be used by the Ministry of
Social Affairs of Estonia and the European Monitoring Centre for Drugs and Drug
Addiction. Every year the EMCDDA outlines specific key issues national reports have
to focus on; demand reduction expenditures, drug use among young people aged 12-
18, social exclusion and re-integration have been defined as key issues in 2002.
Situation of drug information
From May 2001 the Estonian National Drug Monitoring Centre (EDMC) has been
responsible for the collection and analysis of epidemiological and statistical data in
the drug field. EDMC was established in the Institute of Experimental and Clinical
Medicine (IECM) and is functioning as the National Focal Point (NFP) for the
EMCDDA. The EDMC is collecting information from different institutions related to
the drug field. The main information channels are the same as in the previous
reporting period (Figure 1).

6
SUMMARY
Figure 1. Collaborates of the Estonian Drug Monitoring Centre
Estonian Drug Monitoring CentreJANSAD, ELDD, monitoring of drug situation, responses, strategy and policy and their impact to the drug situation
Statistical Office of Estonia (Drug-related deathand mortality)
Bureau of Medical Statistics in the Ministry ofSocial Affairs (Drug-related morbidity)
Institute of International and Social Studies(Population survey, ESPAD, other surveys) Estonian Hospitals (drug overdoses and drug
treatment demand)
Estonian Health Education Centre (Training,prevention, treatment of uninsured patients) Ministry of Education (Drug prevention in schools)
AIDS Prevention Centre (harm reduction)Health Protection Inspectorate (Drug- related
infectious diseases)
State Agency of Medicine (Data on precursorscontrol) Ministry of Justice (Court , prison and probation
statistics)
Ministry of Internal Affairs * (Drug-relatedoffences, prevention of drug related crime,
availability of illicit drugs at street level, nationaldrug legislation )*
Ministry of Finance .Customs Board (drugrelated offences)
*Subordinated institutions of the Ministry of Internal Affairs are the following: the Police Board, Department ofInformation and Analysis, Drug Unit of National Criminal Investigation Department, the Board of Boarder Guard,Estonian Police Forensic Service Centre.

7
SUMMARY
The report is based on the data collected by the National Focal Point from the
information channels specified above (Figure 1.). We are very grateful to our
collaborators Ms. Ene Orumaa, Ms. Aire Trummal and Ms. Liilia Lõhmus
(Estonian Health Education Centre), Mr. Kuulo Kutsar (Health Protection
Inspectorate, expert of drug-related infectious diseases), Ms. Nelli Kalikova (AIDS
Prevention Centre), Ms. Anu Neuman and Mr. Peep Rausberg (Police Forensic
Centre), Rait Kuuse, Katrin Mänd, Elo Liebert, Marika Truumure (Ministry of
Justice) who have provided us with background information and useful comments
and/or contributed to the drafting of these chapters.
8
PART I NATIONAL STRATEGIES
PART 1: NATIONAL SRATEGIES: INSTITUTIONAL AND LEGAL FRAMEWORK
1. Developments in drug policy and response
1.1 Political framework of the drug field
The Estonian Health Education Centre has been responsible for the implementation
of the Estonian Alcohol and Drug Abuse Prevention Programme 1997-2007 (ADAPP)
since 2000. The main priorities of the ADAPP are drug prevention, monitoring and
data collection and fight against drug-related crime. Drafting of a new multi-
disciplinary national strategy was initiated by the Ministry of Social Affairs in close
cooperation with the Phare Twinning project in September 2001 to enhance the
development of the national strategy and insure the correspondence of the strategy
to the EU acquis. The Ministry of Social Affairs of Estonia and Ministry for Labour,
Health and Social Affairs and Ministry of Interior of Schleswig-Holstein, Germany
entered into a contract with the purpose of contributing to the development of the
administrative capacity in the field of supply and demand reduction. New multi-
disciplinary national strategy focusing on the co-operation between all relevant
institutions to fight against drugs will be completed by the end of the year 2002. The
strategy will be then submitted to the Government for approval.
1.2 Legal framework
Estonia has ratified the main international drug control conventions:
The United Nations Single Convention on Narcotic Drugs (1961);
The United Nations Convention on Psychotropic Substances (1971);
The United Nations Convention Against Illicit Trafficking in Narcotic Drugs and
Psychotropic Substances (1988);
The Council of European Convention on Laundering, Search, Seizure and Confiscation
of the Proceeds from Crime (1990).
Estonia is signatory to Riga Declaration on Money Laundering (1996).

9
PART I NATIONAL STRATEGIES
The provisions of the above named conventions and their supplementary schedules on
narcotic drugs, psychotropic substances and precursors have been integrated into the
Estonian drug legislation.
Estonia has adopted following drug-related legal acts:
Narcotic Drugs and Psychotropic Substances Act (NDPSA) (1997);
Administrative Code and the Criminal Code (CC) – (valid until August 31, 2002 (incl.);
Penal Code (entered into force on September 1, 2002);
Mental Health Act (1997);
Money Laundering Prevention Act (1998);
Forensic Examination Act (2002);
Public Health Act (1995; lastly amended in 2002).
The Forensic Examination Act provides legal basis for setting up a Chemistry and
Biology Department in the Forensic Service Centre with the purpose of conducting
forensic examinations of substances, and a Technical Department to carry out
forensic examinations of the technical aspects of drug manufacturing.
1.3 Implementation of legal acts
New Penal Code was approved by Riigikogu in June 2001 and entered into force on
September 1, 2002. It replaced the Criminal Code and a part of the Administrative
Code. The Administrative Code was repealed and its provisions were transferred into
or replaced by other legal acts.
Currently the Penal Code stipulates that repeated use of illicit drugs or possession of
a small amount of illicit drugs for personal use (except the use of drugs in prison and
a house of detention) is decriminalized, i.e. excluded from the criminal law. Criminal
punishments (fine, arrest or imprisonment) no longer exist in terms of drug offence,
and the only sanctions available are either an administrative fine or an administrative
arrest. The sanctions for drug offences provided in the Administrative Code were
integrated into Narcotic Drugs and Psychotropic Substances Act (NDPSA).

10
PART I NATIONAL STRATEGIES
§53 of the new Penal Code contains a section providing that if a person has been
convicted of a criminal offence and imposed imprisonment of more than three years
the convicted offender may be imposed a supplementary punishment according to
which the convicted offender has to pay an amount up to the extent of the total value
of all his/her assets. This section is applicable, inter alia, in case of unlawful handling
of large quantities of drugs (§184), and provision of premises for the purposes of
unlawful activities, including consumption of narcotic drugs (§268), as well as in case
of membership or recruitment of organized criminal groups (§255-256).
Regulation of the Minister of Social Affairs No 20 of March 18, 1998 on Detoxification
and Substitution Treatment of Drugs Addicts in Different Health Care Phases, which
provided the procedure for methadone detoxification treatment and regulated long-
term substitution treatment with medicaments that contain opiates, was repealed in
2002. The Ministry of Social Affairs acknowledged that the majority of the medical
institutions were unable to meet the unrealistically high criteria set by the Ministry for
the provision of substitution treatment. At present substitution treatment is not
regulated.
1.4. Developments in the attitude of the general public
No data available.
1.5 Budget and funding arrangements
The Ministry of Social Affairs financed the Alcoholism and Drug Abuse Prevention
Programme in 2001. The financial resources allocated for the Estonian Foundation
of Drug Prevention (EFPDA) within the annual budget of the ADAPP in 2001 were
smaller compared to the resources of 2000. In 2000 the EFPDA was allocated EUR
399 719 compared to EUR 280 417 in 2001 (Ref. National Report on Drug Situation
in Estonia 2001, Chapter 1.4). Table 1. provides the use of the appropriations of the
ADAPP.

11
PART I NATIONAL STRATEGIES
Table 1. The use of the appropriations of the ADAPP allocated for the financial year
2001 by EUR .
EUR
Prevention projects 99 359
Development projects of treatment and rehabilitation 91 026
Treatment and rehabilitation 50 000
Coordination of the Drug Information Centre 16 026
Organising of a drug conference 4 808
Drug prevention in prisons 12 788
First treatment database 6 410
280 417
See also Chapter 14. Demand reduction expenditures in 1999.

12
PART II EPIDEMIOLOGICAL SITUATION
PART II
EPIDEMIOLOGICAL SITUATION
2.1 Main developments and emerging trends
The preliminary data of next population survey and ESPAD will be available in 2004
(Chapter 2.2 of the National Report on Drug Situation in 2001).
To date only few studies on special risk groups have been conducted. A study
“Ecstasy and Young People” (2001) carried out by the World Health Organization
(WHO) involved the sample group of ecstasy users that were mostly students and
schoolchildren living with their parents1. According to the study young people start to
use ecstasy at an early age and consume it mainly at the weekends. During the last
3 months about one sixth of the sample group used ecstasy once a week; about one
third of the sample group 2-3 times a month. The results of the study revealed that
young people who used ecstasy were most likely polydrug users – they used various
drug combinations including some of the following substances: alcohol, cannabis,
amphetamine, GHB, cocaine and ketamine. An important finding was that half of the
respondents in the sample group fulfilled the criteria of dependency, but their access
to information, counselling and other measures, such as counselling and treatment
was very limited. The results of the study showed that those young people were
exposed to a lot of harm due to their (poly)drug use. The high dependence rate
suggests that there is an urgent need for setting up a service system for synthetic
drug users (Talu, 2001).
There is a clear indication that synthetic drugs will become a problem in younger age
groups (See also Chapter 2.2 Report 2001), thus, appropriate prevention measures
have to be taken immediately to respond to the problem. At the moment specific
prevention or intervention programmes targeted at young people using drugs in
recreational settings are not available (Sub-chapter 10.1).
1 A study, “Ecstasy and Young People” was conducted within the framework of WHO Global Research Programmeon Amphetamine Type Stimulants (ATS) in 2001 to examine Ecstasy use among young people aged 16-25. Totalsample size was 100.

13
PART II EPIDEMIOLOGICAL SITUATION
A study “Children and Adolescents Involved in Drug Use and Trafficking”: A Rapid
Assessment” (2002) revealed that the majority of interviewed children who were
involved in drug trafficking were drug users themselves experimenting with the
substances they were selling. A high proportion of the sample group contributed to
school dropouts. Though some of them lived on the streets, most of them have
permanent places of residence and live with one or both parents. The families’
financial status varied from wealthy to very poor, which, on the basis of this study,
allows for the statement that the family’s financial status does not substantially
influence child’s involvement in drug trafficking and prostitution in the targeted
communities.
This study shows that children tend to start trafficking at the same time they start
using drugs, between the ages of 13 and 16. Once the child or adolescent gets
involved in drug distribution or prostitution, s/he may stay connected until s/he
reaches adulthood and beyond.
The most widespread reasons for children getting involved in drug trafficking are the
influence of close friend and peers who are already involved, the desire to become
rich, the lack of other income and the need for free drugs.

14
PART II EPIDEMIOLOGICAL SITUATION
3. Health Consequences
3.1 Drug treatment demand
In Estonia drug addiction is treated on a voluntary basis pursuant to the procedure
prescribed in the Mental Health Act (1997).
Only few methods of treatment for drug addicts are available: detoxification with
methadone, medicines–free therapy, (drug–free) therapy, counselling and support.
According to the treatment demand data collected by the Estonian Foundation for
Prevention of Drug Addiction (EFPDA) short–term detoxification with methadone is
still the most widely used treatment method: more than 80 % of the patients have
been provided with access to detoxification. Availability of treatment – outpatient as
well as inpatient treatment facilities – has not been assessed by scientific methods,
but the problem is obvious. According to the estimation of medical doctors and the
treatment demand indicator a considerable number of drug addicts are seeking
treatment for their drug use. The role of general practitioners (GPs) is insignificant.
The role of NGOs and low–threshold services in the treatment and rehabilitation
system of drug addicts is crucial (Drug Situation in Estonia 2001, 2002).
According to the data of the Database of First Treatment Demand, the number of
persons who have sought treatment for their drug problems has grown very rapidly
over the past years2. In 1999 812 and in 2000 1431 persons were seeking drug
treatment, while in 2001 the number of persons seeking treatment was already 2034.
The rate of new cases among total number of drug addicts seeking treatment shows
a growing tendency and was very high already in 2001 (59%). The use of injected
heroine or home–made poppy products is the biggest problem among Russian-
speaking - population. The majority of clients who applied for treatment for their drug
problems in 2000 were from Tallinn (54.4 %), followed by Narva (29.3 %) and
Kohtla–Järve (9.7 %). The situation changed slightly by 2001, when the share of
treated persons increased to a certain extent in Tallinn (to 57.7 %) and fell in Narva
(18.3 %) and Kohtla –Järve (7.8 %).
2 Data on Treatment Demand in Estonia, collected by the Estonia Foundation for Prevention of Drug Addiction, coveronly special treatment facilities, and do not cover GP’s, NGOs and low - threshold services. TDD collection wassupported from ADAPP budget in 2001.

15
PART II EPIDEMIOLOGICAL SITUATION
Socio-demographic characteristics of the clients reveal that most of the treated drug
users are relatively young, a considerable proportion of them are 15 to 24 years old.
It is remarkable that in 2000 more than half of the treated drug users were 15-19
years old (53,9%), followed by 20-24–year old young adults (26,3%). By 2001 the
share of 20–24–year old adolescents had increased (39%) and the share of
15–19–year olds had decreased substantially (32%). In 2001, similarly to the
previous year, mostly the Russian–speaking population applied for treatment (80% in
1999, 83% in 2000; 82% in 2001). Only a small proportion of treated persons were
Estonians. The share of non-citizen clients decreased from 28.3% in 1999 to 19.3%
in 2000 and increased again to 26% in 2001. The unemployment rate among the
clients was highest in 1999 (53.7%), it fell slightly in 2000 (50.8%) and increased a
little again in 2001 (51.7%).
Opiates are the illegal substances still most commonly used among persons seeking
treatment. Increasing treatment demand of opiate users and long waiting–lists
indicate that there is an urgent need for the development and modification of the
current treatment system and establishment of an effective rehabilitation system. The
share of patients seeking treatment for stimulants use decreased from 11.8% in 1999
to 6.8% in 2000 and increased substantially to 18.4 % in 2001. Other indicators
(drug-related crime, data on seizures, results of studies) confirm the hypothesis that
stimulants, particularly amphetamines, are a growing problem in Estonia and the
share of patients seeking treatment for their stimulants use will increase rapidly in the
nearest future. An appropriate treatment system has to be set up to respond to such
need. Within the next years quality assessment of treatment services for drug users
must become an inseparable part of treatment management in order to improve the
planning and to expand the methods of treatment and provide opiate and other drug
users in particular with better services.
16
PART II EPIDEMIOLOGICAL SITUATION
The share of clients having used the same syringe over the last month increased
from 7.9% in 1999 to 22.4% in 2000 and was the highest in 2001 (26.5 %). High
proportion of current injecting drug-users (78.6 % in 1999; 84.4 % in 2000; 83.8 % in
2001) suggests that more attention has to be paid to the implementation of
appropriate harm reduction measures. Support to and development of present
low–threshold and rehabilitation service providers should be a priority. Revision and
assessment of the treatment system must be carried out.
Assessment of the provision of drug treatment services is a prerequisite for the
introduction of changes in the treatment system.

17
PART II EPIDEMIOLOGICAL SITUATION
Table 2. Characteristics of treated clients 1999- 2001
Characteristics 1999(%)
2000(%)
2001
(%)NationalityRussians 80.3 82.6 81.6Estonians 13.8 11.3 12Russians (male clients) 80 83 82Russians (female clients) 81.9 79.3 79.6Treated clients bycitizenshipEstonian citizens 35 39.4 40.7Russian citizens 6 8.7 9.2Clients without citizenship 19.3 28.3 26.0AgeAverage age of all clients 23.3 28.3 2115- 19 years old 30 53.9 4220- 24 years old 39 37 36Treated clients by place ofresidenceClients from Tallinn 63.5 54.4 57.7Clients from Narva 7.1 20.3 18.4Clients from Kohtla – Järve 12.8 9.7 7.8Labour statusUnemployed 53.7 50.8 51.7Regular employment 20.9 24.2 28.8Drug-related informationHeroine as the primary drug(incl. home-made poppyproducts, morphine,unspecified opioids)
53.8 69.9 53.8
Stimulants as primary drugs 11.8 6.8 18.6Previously treated 39.2 42.2Use of the same syringe lastmonth
7.9 22.4 26.5
Current injecting 78.6 84.4 83.8Lifetime injecting 57.1 53.8 53.8
Source: Database of First Treatment Demand 1990- 2001

18
PART II EPIDEMIOLOGICAL SITUATION
3.2 Drug-related mortality
Significant improvement of the quality of data denotes the most important development of
this field in 2001. The share of cases with known toxicology grew from 16% in 2000 to
47% in 2001. This is primarily the result of structural changes in the forensic system: the
Bureau of Forensic Medicine became a government agency of the Ministry of Justice and
an increased amount of funds were allocated for forensic investigations. On the other
hand, the Statistical Office replaced the three-character ICD-10 codes used in 1997-2000
with four-character ICD-10 codes. Thus, two key institutions have improved their work in
terms of statistics on drug-related deaths. However the quality of the data on drug
–related death still depends on further improvements in forensic examination practice and
notification procedure.
In 2001 the number of cases of drug-related deaths in combination with other factors
decreased compared to the year 2000, e.g. in 2000 there were 13 cases in combination
with F11 (Mental and behavioral disorders due to opioids use), 8 cases of accidental drug
poisonings with unspecified narcotic drug (X42-T40); in 2001 only two cases of drug-
related deaths in combination with F11 were registered, one of them accidental poisoning
with opium (X42-T40). The combination of X42-T40 and F11 on a death certificate means
suspected overdose, used in cases when it is not possible to carry out a toxicological test
because of insufficient funds or for other reasons. Issuing of such certificates in a reduced
number is a positive sign.
Figure 2. Number of direct drug-related deaths with known toxicology, 1997-2001
0
10
20
30
40
50
1997 1998 1999 2000 2001 year
Source: Estonian Statistical Office, 2002
19
PART II EPIDEMIOLOGICAL SITUATION
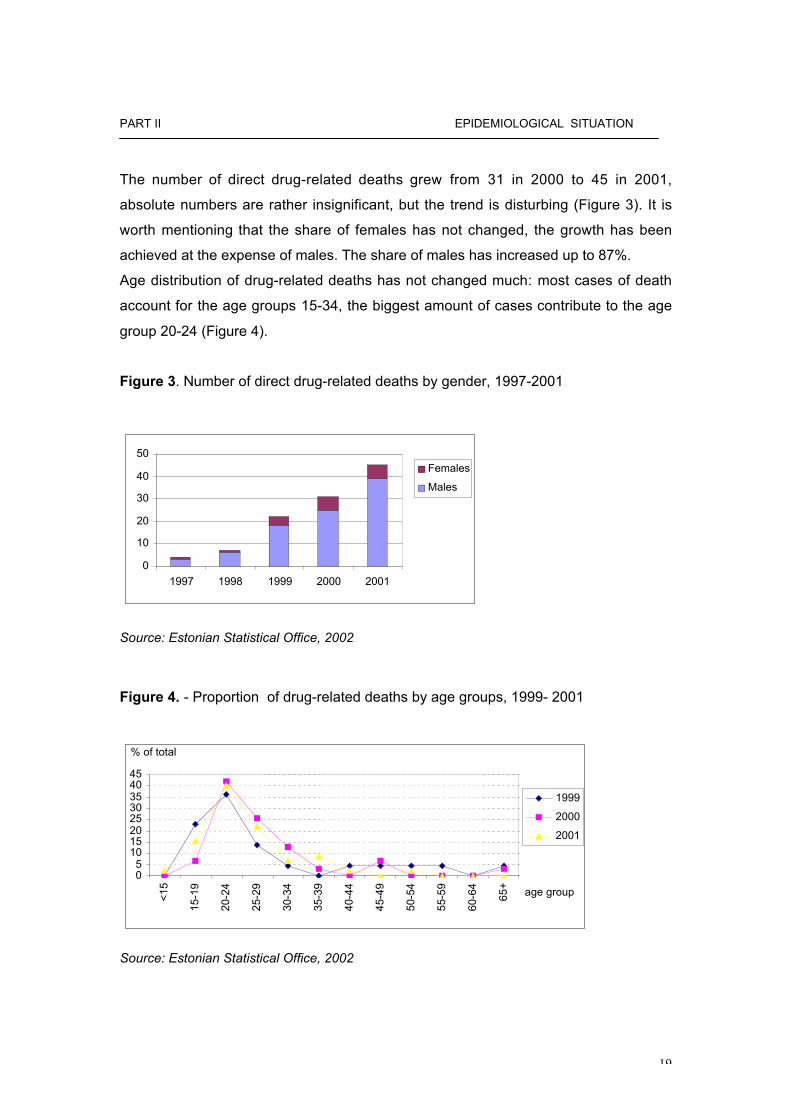
The number of direct drug-related deaths grew from 31 in 2000 to 45 in 2001,
absolute numbers are rather insignificant, but the trend is disturbing (Figure 3). It is
worth mentioning that the share of females has not changed, the growth has been
achieved at the expense of males. The share of males has increased up to 87%.
Age distribution of drug-related deaths has not changed much: most cases of death
account for the age groups 15-34, the biggest amount of cases contribute to the age
group 20-24 (Figure 4).
Figure 3. Number of direct drug-related deaths by gender, 1997-2001
0
10
20
30
40
50
1997 1998 1999 2000 2001
Females
Males
Source: Estonian Statistical Office, 2002
Figure 4. - Proportion of drug-related deaths by age groups, 1999- 2001
05
1015202530354045
<
15
1
5-19
2
0-24
2
5-29
3
0-34
3
5-39
4
0-44
4
5-49
5
0-54
5
5-59
6
0-64
65+
1999
2000
2001
age group
% of total
Source: Estonian Statistical Office, 2002

20
PART II EPIDEMIOLOGICAL SITUATION
3.3 Drug-related infectious diseases
Drug-related infectious diseases have transmitted very rapidly over the last years
in Estonia. The population of Estonia was shocked when 390 new HIV positive
cases were reported in 2000. Due to the rapid growth of HIV incidence the
Estonian Ministry of Social Affairs classified the situation as concentrated
HIV/AIDS epidemic according to the UNAIDS/ WHO classification in February
2001. In 2001 the number of HIV cases increased further, the data of the Health
Protection Inspectorate was complemented by 1474 newly diagnosed HIV
positive cases (Figure 5), of which 382 were detainees. The incidence rate of HIV
positives was 107,8 cases per 100,000 of the population. The number of male
and female HIV positives was 1132 and 342, respectively. 2 cases of AIDS (both
male) were registered in 2001. As at December 31, 2001 there were 1898 HIV
positives in Estonia altogether, 7 AIDS cases included. The distribution of HIV
positive cases by months is shown in Figure 6. The most critical areas in Estonia
were Tallinn (528 cases), Narva (409 cases) and Ida-Virumaa county (454
cases). Table 3 gives the breakdown of HIV positives by age groups in 2001.
No baseline studies or surveys on HIV prevalence have been carried out.
According to the data on HIV infection surveys collected by the Health Protection
Inspectorate, 13,1% of intravenous drug users were diagnosed as HIV positives
in 2001(272 HIV positive cases out of 2078 tested IDU-s). In 2001 in total 4892
persons have been tested in anonymous cabinets. The number of tested drug
addicts in anonymous cabinets was 1022. Incidence rate of HIV-positive among
tested drug addicts was 41% (423 / 1022). Incidence rate of drug addicts among
HIV positives was 91% (423/ 465).

21
PART II EPIDEMIOLOGICAL SITUATION
Figure 5. Number of HIV positive cases in 1996-2001
0200400600800
1000120014001600
1996 1997 1998 1999 2000 2001
Year
Num
ber
of c
ases
HIV positives
Source: Health Protection Inspectorate, 2002
Figure 6. Number of HIV positive cases by month in 2001
0
20
40
60
80
100
120
140
160
180
Janu
ary
Ferru
ary
Mar
chApr
ilM
ayJu
ne July
Augus
t
Septe
mbe
r
Octobe
r
Novem
ber
Decem
ber
Month
Num
ber
of c
ases
HIV positives
Source: Health Protection Inspectorate, 2002

22
PART II EPIDEMIOLOGICAL SITUATION
Table 3. Number of HIV positive cases by age group and gender in 2001
Age Men Women
0 0 3
10-14 24 7
15-19 351 177
20-24 474 119
25-29 176 22
30-34 55 9
35-39 24 6
40-44 14 4
45-49 2 0
50-54 2 0
Unspecified quantity 5 0
All 1127 374
Source: Health Protection Inspectorate, 2002
The rate of hepatitis B has also increased over the reporting period. 449 cases of
hepatitis B were registered in 2001. The estimated incidence rate of hepatitis B
was 32,8 cases per 100,000 inhabitants. The number of males and females
infected with hepatitis B was 306 and 143 , respectively.
The risk factors of hepatitis B infection were identified by means of questioning
300 infected people. The following risk factors were specified: intravenous use of
drugs with needle sharing (257 answers), sexual intercourse (23 answers),
medical procedures (13 answers), blood transfer (4 answers) and tattooing (3
answers). 3,777 infected persons were hospitalised, 27,528 people were
vaccinated (25,628 children, 102 youngsters, 1,798 adults) in 2001.
The prevalence of hepatitis C infection has shown a decreasing tendency, 350
cases of hepatitis C infection were reported in 2000 and 306 cases in 2001. The
estimated incidence rate of hepatitis C infection was 22,5 cases per 100,000
inhabitants. The number of males and females infected with the hepatitis C virus

23
PART II EPIDEMIOLOGICAL SITUATION
was 220 and 86, respectively. The following risk factors of hepatitis C infection
have been identified: needle sharing, sexual intercourse and tattooing. 203
infected persons needed hospitalisation.
With regard to tuberculosis the situation became worse in 1993 when morbidity
increased by 32% compared to 1992. In 1994 the increase continued, 34,3 new
cases of tuberculosis per 100,000 inhabitants were diagnosed. In 1995 the
situation stabilised to some extent, the estimated rate of morbidity being
34,4/100,000. At the same time, incidence of tuberculosis among children and
juveniles increased. In 1992 and 1993 4 children fell ill with tuberculosis, in 1994
9 children and in 1995 the respective number was already 18. Tuberculosis
infection in Estonia is often characterized by secretion of tuberculosis generators
and the occurrence of caverns in lungs, 75% and 66% of new cases respectively.
Figure 7 demonstrates the incidence rate of active tuberculosis per 100,000
inhabitants over the past years.

24
PART II EPIDEMIOLOGICAL SITUATION
Figure 7. Incidence rate of tuberculosis per 100,000 inhabitants in 1997-2001
Source: Estonian Statistical Yearbook 2001
Rise in morbidity and deteriorating epidemiological situation are closely related to
socio-economic changes in the society. As a result of the implementation of
health care reforms and rearrangement of the inpatient and outpatient treatment
system, people with low incomes and without insurance have been deprived of
the possibility of getting treatment in inpatient institutions. Also, the current
number of beds does not enable to arrange rehabilitation of patients. Thus, a
certain social group in the community is deprived of social benefits and will not be
admitted to treatment in hospitals (care homes), the more so, an appropriate law
providing mandatory hospitalisation and treatment of persons with infectious
diseases being dangerous to the rest of the community, does not exist
(Programme on tuberculosis treatment in Estonia 1998-2003).
As to the relationship between tuberculosis and the drug problem, only data on
patients infected with HIV and tuberculosis are available. HIV infection is one of
the most important TB risk factors in the world. Currently higher morbidity of TB
among HIV positives has not been observed in Estonia. As a result of the
increase in the number of persons with tuberculosis infection in the last years we
can expect an increase of TB infected people among HIV positives. Total of 17
such cases have been recorded in the TB registry (30.04.2002).
Incidence rate per 100,000 inhabitants
39
40
41
42
43
44
45
46
47
48
1997 1998 1999 2000 2001
Year
Inci
denc
e ra
te p
er 1
00,0
00
inha
bita
nts
Incidence rate per100,000 inhabitants

25
PART II EPIDEMIOLOGICAL SITUATION
HIV infected males accounted for 15 cases of tuberculosis and HIV infected
females for 2 cases of tuberculosis in the age group of 18-55. The mean age of
the patients was 32,5 years.
1997 - 1 case
1999 - 1 case
2000 -1 case
2001 - 7 cases
2002 (I quarter) - 7 cases
Distribution of reported HIV/TB cases by place of residence: Tallinn 5, Harjumaa
2, Ida-Virumaa 5 and Central Prison Hospital 5 cases.
At the moment 8 patients are under treatment, 2 have deceased, 3 terminated
their treatment on their own will (Tuberculosis incidence in Estonia, 2000).
26
PART II EPIDEMIOLOGICAL SITUATION
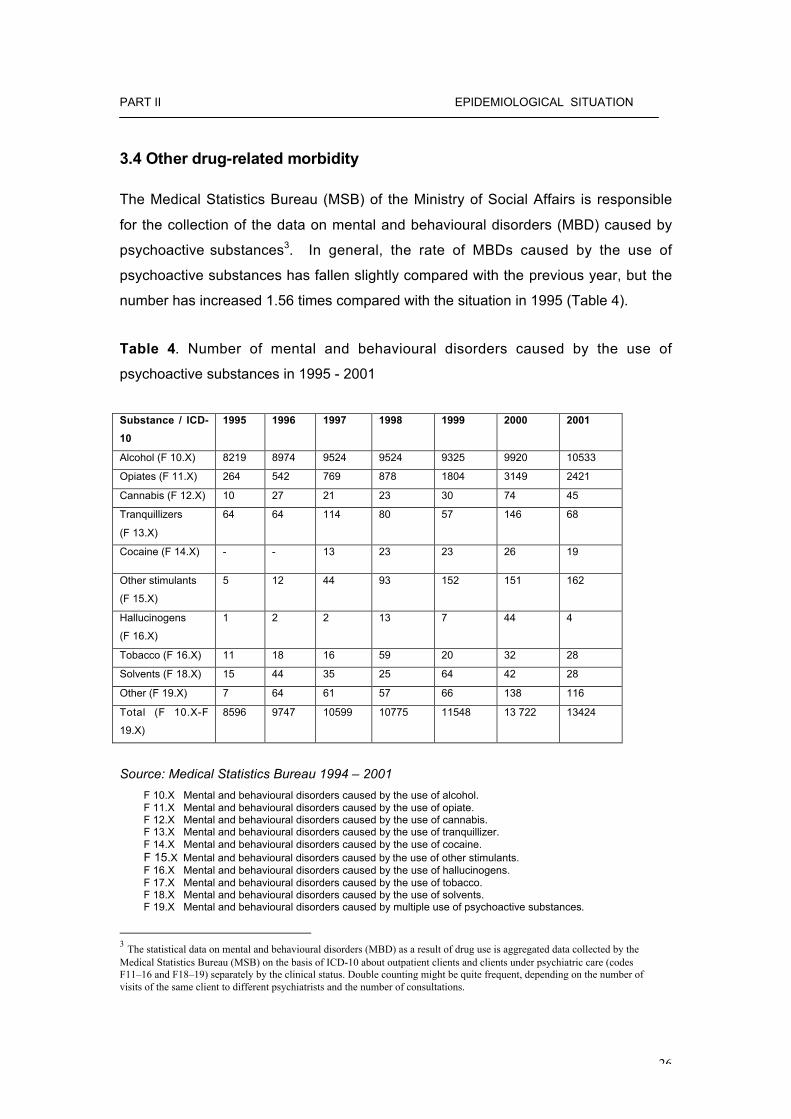
3.4 Other drug-related morbidity
The Medical Statistics Bureau (MSB) of the Ministry of Social Affairs is responsible
for the collection of the data on mental and behavioural disorders (MBD) caused by
psychoactive substances3. In general, the rate of MBDs caused by the use of
psychoactive substances has fallen slightly compared with the previous year, but the
number has increased 1.56 times compared with the situation in 1995 (Table 4).
Table 4. Number of mental and behavioural disorders caused by the use of
psychoactive substances in 1995 - 2001
Substance / ICD-
10
1995 1996 1997 1998 1999 2000 2001
Alcohol (F 10.X) 8219 8974 9524 9524 9325 9920 10533
Opiates (F 11.X) 264 542 769 878 1804 3149 2421
Cannabis (F 12.X) 10 27 21 23 30 74 45
Tranquillizers
(F 13.X)
64 64 114 80 57 146 68
Cocaine (F 14.X) - - 13 23 23 26 19
Other stimulants
(F 15.X)
5 12 44 93 152 151 162
Hallucinogens
(F 16.X)
1 2 2 13 7 44 4
Tobacco (F 16.X) 11 18 16 59 20 32 28
Solvents (F 18.X) 15 44 35 25 64 42 28
Other (F 19.X) 7 64 61 57 66 138 116
Total (F 10.X-F
19.X)
8596 9747 10599 10775 11548 13 722 13424
Source: Medical Statistics Bureau 1994 – 2001
F 10.X Mental and behavioural disorders caused by the use of alcohol.F 11.X Mental and behavioural disorders caused by the use of opiate.F 12.X Mental and behavioural disorders caused by the use of cannabis.F 13.X Mental and behavioural disorders caused by the use of tranquillizer.F 14.X Mental and behavioural disorders caused by the use of cocaine.F 15.X Mental and behavioural disorders caused by the use of other stimulants.F 16.X Mental and behavioural disorders caused by the use of hallucinogens.F 17.X Mental and behavioural disorders caused by the use of tobacco.F 18.X Mental and behavioural disorders caused by the use of solvents.F 19.X Mental and behavioural disorders caused by multiple use of psychoactive substances.
3 The statistical data on mental and behavioural disorders (MBD) as a result of drug use is aggregated data collected by theMedical Statistics Bureau (MSB) on the basis of ICD-10 about outpatient clients and clients under psychiatric care (codesF11–16 and F18–19) separately by the clinical status. Double counting might be quite frequent, depending on the number ofvisits of the same client to different psychiatrists and the number of consultations.

27
PART II EPIDEMIOLOGICAL SITUATION
The number of registered mental and behavioural disorders caused by the use of
opiates (F 11.X), cannabis (F 12.X), tranquilliser (F 13.X), cocaine (F 14.X),
hallucinogens (F 16.X), Solvents (F 18.X) has decreased compared with the previous
year.
The decrease of mental and behavioural disorders due to drug use in 2001 could
have been related with an increase in MBDs caused by alcohol use - from 9920
cases in 2000 to 10333 cases in 2001. At the same time the, the total number of
cases of MBDs due to other stimulants (F 15.X) has increased. Comparing the year
1995 with the year 2001, a considerable increase in the cases of MBD can be
observed due to the use of other stimulants and multiple use of psychoactive
substances – 32,4 and 18,9 times, respectively.
The majority of the cases of MBDs caused by the use of psychoactive substances
were diagnosed as an addiction or misuse (See table 5). 65.7% of the cases of MBD
caused by opiate use, 45.1% of cases of MBD caused by stimulants use, 86.8% of
the cases of MBD caused by tranquilliser use were diagnosed as an addiction. The
proportion of MBD due to the use of stimulants has increased very rapidly over the
last years, most likely because of the growing popularity of the use of stimulants in
recreational settings (See also Chapter 2.1).

28
PART II EPIDEMIOLOGICAL SITUATION
Table 5. Number of mental and behavioural disorders caused by the use of
psychoactive substances in 2001.
ICD-10 Intoxication Misuse Addiction Condition ofestrange-ment
Deliriumofestrangement
Otherpsychosis
Other Permanent
interference
Total
F 10.X 131 1218 4883 2857 433 620 391 10533
F 11.X 9 36 1590 780 2 2 2 2421
F 12.X 1 28 10 1 5 45
F 13.X 4 59 5 68
F 14.X 11 8 19
F 15.X 9 37 73 23 1 12 7 162
F 16.X 1 2 1 4
F 18.X 4 8 8 1 7 28
F 19.X 12 50 38 2 5 7 2 116
Total 167 1392 6698 3670 441 647 409 13424
Source: Medical Statistics Bureau 2002

29
PART II EPIDEMIOLOGICAL SITUATION
4. Social and legal implications and consequences
Social background
According to the censuses the population size decreased by 12.5 % within the period of
1989 to 2000. As at January 1, 2002 the population size of Estonia was 1,361,242. At the
beginning of 2002, the estimated population size in Tallinn, the capital of Estonia was
398,434 and 177,471 in Ida – Virumaa county (incl. Narva and Kohtla – Järve) (Estonian
Statistical Office 2002).
The birth rate has sharply decreased over the past decade. Since 1991, the rate of
mortality has been higher than the rate of birth, consequently, the size of population has
decreased due to negative natural population growth by approximately 54,000 people, i.e.
3.4 %. In 2001 the rate of birth was 1,34, which was less than the average in Europe
(WHO, 2001). The birth rate has shown a slight decrease compared to the previous year
(9,3 births per 1,000 inhabitants in 2001). Total of 12,629 children were born in 2001,
which was 439 children less than a year earlier. 18,516 deaths were registered in Estonia
in 2001.
The share of illegitimate births has been continuously increasing. In 2001 56.2% of
children were born outside marriage, which is 1.7% more than in 2000, being a reflection
of the situation where cohabitation is preferred to marriage (The Statistical Yearbook of
Estonia, 2002). 5,647 marriages and 4,312 divorces were registered in Estonia in 2001.
Due to a small number of births and the age structure of the population having developed
over the previous years, the proportion of young people has decreased and the share of
old people among the population has increased. At the beginning of 2002, 18.7% of the
population was less than 16 years and 15.5% were over 64 years old. In 2001 these
indicators were 19.3% and 15.2%, respectively. According to the data of the population
censuses in 1989 and 2000 the ethnic composition has not changed significantly. In the
year 2000 6790 Estonians were registered per 10,000 inhabitants, followed by 2,564
Russians per 10,000 inhabitants, 212 Ukrainians per 10,000 inhabitants and 126
Belarussians per 10,000 inhabitants (Yearbook of Estonian Statistical Office, 2002).
30
PART II EPIDEMIOLOGICAL SITUATION
4.1 Social problems
Social problems in Estonia have not changed over the reporting period (see previous
report 2001, chapter 4.1). However, the employment situation shows some signs of
improvement. The falling trend in the number of the labour force, characteristic of the
nineties, stopped in 2000. When compared with 1999, the number of labour force
(sum of the employed and unemployed) increased slightly. The unemployment rate
started to increase at the end of 1998 due to the economic crisis in Russia and
reached its peak (13,5%) in 2000. In 2001 the unemployment rate decreased to
12,6%, which is the most significant decline in unemployment since Estonia regained
independence (Estonian Statistical Yearbook, 2002). The rate of unemployment
varies from region to region, the most problematic region is still North-Eastern
Estonia, where the unemployment rate is 18%.
According to the data of the Estonian Statistical Office, the unemployment rate
among young people, aged 15 – 24, has increased most over the last years and
reached 23.8% in 2000. The employment rate of the young population fell to 22.2%
in 2001. The reason for the high unemployment rate of the young is connected with
education. The current education system does not meet the demands of the labour
market, the vocational and higher education reform has not given remarkable results
yet (Statistical Yearbook of Estonia, 2002).
The share of the Estonian population having obtained formal education is notably
high. In all age groups of the working population the proportion of persons having
obtained only primary or basic education is more than two times lower than the
average level of the European Union. The prospects of people with primary or basic
education for finding employment do not differ much by ethnic groups. However, the
youngest age group (15-24) is clearly in the least favourable situation. The rate of
dropout from basic schools is currently quite high: during the school year 1998/99
nearly 1400 young persons terminated their studies at basic school (Annus et al.
2000).
Since the figure has remained stable, at around 1300- 1400 over the last five years, it
has in fact a cumulative impact, i.e. each year the number of young people without
basic education increases by more than 1000. Until recently, basic school dropouts

31
PART II EPIDEMIOLOGICAL SITUATION
had no place in the education system. They could not get even minimum vocational
training, because the previous Vocational Educational Institutions Act restricted
access of persons without basic or even secondary education to such schools. On
June 13, 2001, the Riigikogu adopted an amendment to the law, providing young
people, up to 25 years of age, not having obtained basic education, with access to
preliminary vocational training. Such young people can now acquire basic education
in parallel with vocational education. Since 2001 180 young people without basic
education have been provided with an opportunity to obtain preliminary vocational
training, but this is probably not enough since the age group of 17-25 currently
includes more than 20,000 young people without basic education. At the same time,
it is not certain whether this would solve the employment problem, as the young
people with lower educational level have increasing difficulties in breaking out of the
vicious circle – as the educational level of those of the same age is improving, which
means that the young population with lower educational level will still experience
problems with entering the labour market or pursuing their education.
The most problematic area in Estonia is still Narva. Narva is the fourth largest
Estonian city. As of May 2000 the population of Narva was 71,370, Estonians
account for 4% of the population of Narva. The most important areas of activity have
traditionally been associated with industry. In the last years several large enterprises
have been totally or partially shut down. Inhabitants of Narva are of the opinion that
unemployment and poverty are mostly caused by worker layoffs and low salaries,
rather than shutting down local enterprises.
The language spoken in the named region is mostly Russian; it is also spoken well
by the Estonians living there. Russian-speaking residents of Narva, however, have
rather poor Estonian language skills. Compared with non-ethnic Estonians residing in
Tallinn, the Estonian language skills of those living in Narva are much worse. While
nearly half of the Russian-speaking inhabitants of Tallinn are of the opinion that they
are able to communicate in Estonian at a good or average level and only 16% cannot
communicate in Estonian at all. In Narva and Sillamäe 66% of the adults are not able
to communicate in Estonian and only 13% claim that they speak good or average
Estonian (Proos 2000: 37).

32
PART II EPIDEMIOLOGICAL SITUATION
In general, the economic situation in Ida-Virumaa is very difficult, both subjective
evaluations and objective indicators give evidence of poverty. In 2000 the average
net income per family member in Estonia was 2,183 kroons. While in Tallinn, for
example, the average income per family member was 2,744 kroons and 2,860
kroons in Harju county , in Ida-Viru county it was only 1,630 kroons. Accordingly, the
average income in Ida-Viru county accounted for 75% of the average income per
family member in Estonia, which is a little less than in the previous year (Estonian
Human Development Report 2001).

33
PART II EPIDEMIOLOGICAL SITUATION
4.2 Drug -related crimes
Over the last few years, the number of registered drug offences (both criminal and
administrative offences) has increased rapidly. The number of criminal offences
(multiple drug abuse, drug possession with intent to supply, drug trafficking, etc.)
registered by the police increased from 297 in 1999 to 2301 in 2001 (Figure 8). The
number of detected administrative offences (illegal possession of small quantities of
narcotic drugs or unauthorized use of narcotic drugs – first offence only) increased
from 468 in 1999 to 3157 in 2001. The share of drug-related criminal offences of the
total of police registered criminal offences increased from 0.6% in 1999 to 3,9% in
2001.
During the year 2001, total of 5458 drug offences (criminal as well as administrative
offences) were registered that exceeded more than seven times the respective figure
in 1999 (765 offences). About 57% of all drug offences were registered in Tallinn and
27% in Ida-Viru county (including Narva). Significant increase in the number of drug
offences reflects to a certain degree an increased capability of the police in tackling
drug crime. However, the actual drug use and drug trafficking have also increased
substantially.
Combating drug offences, especially drug trafficking, has been one of the priority
tasks of the police since 2000. Specialized drug divisions have been established in
all police prefectures and the number of full-time drug officers has been increased.
Since 2000, training for more than 800 police officers has been carried out. Their
improved knowledge on drugs has been one of the essential factors that has resulted
in an increase in the number of detected drug offences. The increase has been most
significant in Tallinn, Narva and Ida-Viru Police Prefectures, especially with regard to
offences related to illegal possession of small quantities of narcotic drugs or
unauthorized use of narcotic drugs – including both administrative and criminal
offences (Administrative Code §158 and Criminal Code §2025). Registration of such
offences has also increased in the majority of other regions, particularly in Tartu,
Harju, Viljandi, Pärnu and Lääne-Viru Police Prefectures.

34
PART II EPIDEMIOLOGICAL SITUATION
Figure 8. Police registered drug-related criminal offences and convicted offenders,1991-2001
1991 1992 1993 1994 1995 1996 1997 1998 1999 2000 2001Registeredcriminal offences
20 24 27 33 51 115 114 235 297 1581 2301
Convicted drugoffenders
4 23 7 10 15 59 54 65 144 324 606
Sources: Police Board (data on registered crime offences), Ministry of Justice (data on convicteddrug offenders) 2002
Table 6. Police registered drug-related administrative offences*, 1997-2001
1997 1998 1999 2000 2001Registeredadministrativeoffences5
191 382 468 2305 3157
Source: Police Board 2002
In 2001, drug-related criminal offences associated with the use or possession of
narcotic drugs without the intent of trafficking (Criminal Code §2025 and §2101)
accounted for about 71% of all police registered drug crimes (Table 9). Possession
with intent to supply and drug-trafficking offences (Criminal Code §2102) accounted
for 27% of registered drug-related criminal offences.
0
500
1000
1500
2000
2500
1991 1992 1993 1994 1995 1996 1997 1998 1999 2000 2001
Registered criminaloffences
Convicted offenders

35
PART II EPIDEMIOLOGICAL SITUATION
Table 7. Police registered drug-related criminal offences by types of offences, 2000-2001
Criminal Code paragraph 2000 2001§ 2022. Inducing minors to use narcotic drugs or psychotropic substances 7 14§ 2023. Inducing a person to use narcotic drugs or psychotropic substances 1 55 § 2025. Unlawful acquisition or storage of [small quantities]* of narcotic drugs or
psychotropic substances, or use of narcotic drugs or psychotropic substanceswithout doctor’s recommendation (first offence; second similar offence during the last12 months is punishable according to the Criminal Code § 2025). 1096 1556
§ 2092. Violation of requirements for manufacture, production, acquisition, storage,recording, issue, transport or delivery of narcotic drugs or psychotropic substances 1 1§ 2101. Illegal manufacture, [acquisition, storage,]* [reprocessing,]** transport ordelivery of narcotic drugs or psychotropic substances without intent of trafficking 161 72§ 2102. Illegal manufacture, [reprocessing,]** acquisition, storage, transport, [or]**delivery [or trafficking]* of narcotic drugs or psychotropic substances [with intent oftrafficking]** 306 628
§ 2103. Theft or robbery or narcotic drugs or psychotropic substances 2 2§ 2104. Illegal sowing or growing of opium poppy, cannabis [or coca**] 7 22TOTAL 1581 2301
* Was in force until 10.03.2001** Entered into force 10.03.2001*** Entered into force 17.04.2000
Source: Police Board 2002
4.2.1 Characteristics of drug offenders
The number of men charged for drug-related criminal offences increased from 157 in
1999 to 863 in 2001, and the number of females from 37 in 1999 to 156 in 2001. In
2001, total of 1019 persons were charged for drug-related criminal offences, and the
share of females contributed to 15%. Data on gender of the persons arrested for
administrative offences are not available.
In 2001, there were 184 (18%) Estonians and 835 non-Estonians (82%) among the
drug offenders charged for criminal offences. The share of Estonians of all offenders
has declined after 1997 (39%). In 2001, 513 (50%) drug offenders did not have
permanent citizenship, 424 (42%) were Estonian citizens, 72 (7%) Russian citizens,
4 Ukrainian citizens, 2 persons from other CIS countries, 2 Lithuanian citizens, and 1
Finnish citizen. During the last years the total number of drug offenders has
substantially increased in all main population groups (Estonians and non-Estonians;
Estonian citizens, persons without citizenship and foreign citizens).

36
PART II EPIDEMIOLOGICAL SITUATION
Table 8. Number of definitively sentenced persons by types of drug crimes, 2000-2001
Criminal Code paragraph* 2000 2001
§ 2022. Inducing minors to use narcotic drugs or psychotropic substances 0 0§ 2023. Inducing a person to use narcotic drugs or psychotropic substances 2 2§ 2025. Unlawful acquisition or storage of [small quantities]* of narcotic drugs orpsychotropic substances, or use of narcotic drugs or psychotropic substanceswithout doctor’s recommendation 203 370§ 2092. Violation of requirements for manufacture, production, acquisition, storage,recording, issue, transport or delivery of narcotic drugs or psychotropic substances 0 1§ 2101. Illegal manufacture, [acquisition, storage,]* [reprocessing,]** transport ordelivery of narcotic drugs or psychotropic substances without intent of trafficking 50 49§ 2102. Illegal manufacture, [reprocessing,]** acquisition, storage, transport, [or]**delivery [or trafficking]* of narcotic drugs or psychotropic substances [with intent oftrafficking]** 65 183§ 2103. Theft or robbery or narcotic drugs or psychotropic substances 0 0§ 2104. Illegal sowing or growing of opium poppy, cannabis [or coca**] 4 3TOTAL 324 608
* Was in force until 10.03.2001** Entered into force 10.03.2001*** Entered into force 17.04.2000
Source: Ministry of Justice 2002
4.2.2 Drug trafficking
Drug trafficking through and from Estonia has increased since the late 1990-ies.
Smuggling of heroin and synthetic drugs has increased most significantly. Local
production of cannabis herb (marijuana) has also increased in recent years. The
majority of locally produced illicit synthetic drugs are targeted at Nordic countries. At
the same time, smuggling of cannabis resin (hashish) through Estonia has
decreased, as Estonia is not situated at the main smuggling routes.

37
PART II EPIDEMIOLOGICAL SITUATION
The main routes of illicit trafficking of drugs through or from Estonia in the recent
years have been the following:
• opium (raw and prepared) from Central Asia via Russia or Latvia and Estonia to
Finland and other Nordic countries;
• heroin from Central Asia via Russia and Estonia to Finland and other Nordic
countries;
• amphetamine and methamphetamine from Poland via Latvia and Estonia to
Finland and other Nordic countries;
• ecstasy from the Netherlands and Belgium via Estonia to Nordic countries and
Russia, or from Estonia (local production) to Nordic countries and Russia;
• cocaine from South and Central America via Estonia to Russia or Nordic
countries.
Estonian criminal groups have also participated in smuggling of marijuana and
hashish from Spain via Western Europe to Nordic countries. A new route of
smuggling drugs has appeared: there have been cases of smuggling raw opium from
Central Asia and marijuana from Africa through Estonia to the United Kingdom.
4.2.3 Drug-related crimes
A significant proportion of thefts and robberies is committed by drug abusers in order
to get money for buying drugs. The statistics of Tallinn Police Prefecture show that
about 25% of all cleared crimes in 2000 were committed by offenders who had been
sentenced for at least one administrative drug offence (i.e. drug abuse or possession
of a small amount of drug) in the past. According to some estimates the actual share
of offences committed by drug abusers may even account for 40-50% of all thefts
and robberies. The most common types of crimes committed by drug abusers are
street crimes (thefts from cars, pick-pocketing, robberies) and shoplifting

38
PART II EPIDEMIOLOGICAL SITUATION
4.3 Social and economic costs of drug consumption
Studies on social and economic costs of drug consumption have not been conducted
in Estonia.
5. Drug market
5.1 Availability and supply
The most common drugs until 1997-1998 were home-made poppy products and
cannabis. Heroine appeared on the market in 1997-1998, and became quickly
widespread. Simultaneously, the popularity of home-made poppy products has been
declining since 1999. Supply (both import and local production) of synthetic drugs
has increased substantially since the late 1990s. Production and availability of GHB
has increased since 2000.
In 2001, as a result of the decrease in heroin quality (purity) due to the situation in
Afghanistan, the total amount of heroine smuggled into Estonia increased. At the
same time, due to the difficulties in obtaining heroin and its poor quality (for example,
portions of less than 10% of purity have been found), some heroin addicts have
started to use poppy products again.
The number of detected cannabis plants and the share of cannabis herb produced in
local plantations increased substantially in 2001, due to the development of
cultivation technology. Total of 13 cannabis plantations were found in 9 counties out
of 15. According to the police assessment, the majority of locally produced cannabis
is consumed in Estonia. Amphetamine and ecstasy continued to gain popularity
among drug abusers in 2001.

39
PART II EPIDEMIOLOGICAL SITUATION
5.2 Seizures
According to the statistical data of the Estonian Police Forensic Service Centre, the
quantity of seized drugs and the number of drug seizures have increased since mid-
1990s in terms of all major drug types (opium, cannabis, cocaine, synthetic drugs)
(see Table 9 and Figure 9). The main part of seized drugs in 1997-2001 involved
opiates (home-made poppy products, heroin, methadone, morphine), followed by
cannabis and synthetic drugs (amphetamines, ecstasy).
Table 9. Number of drug tests carried out in the Police Forensic Service Centre, 1994-2000
1994 1995 1996 1997 1998 1999 2000 2001TOTAL drug tests 75 148 248 346 605 677 983 1020Tests with a positive result 75 113 209 275 538 565 741 807of which the main drugs:- Home-made poppy products 22 73 98 149 393 186 44 70- Heroin 2 18 129 249 295- Morphine 3 4 4 7- Methadone 5 10 12 6- Cannabis 28 25 52 75 147 205 281 337- Cocaine 2 5 4 12 35 26 22 42- Amphetamine 2 28 42 111 123 181 297- Metamphetamine 1 15 41 26 1- MDMA (ecstasy) 12 17 15 30 40 124- LSD 1 2 3 2- Benzodiazepines 1 4 24 34 35 54 45- GHB 1 5 19 23
Source: Police Forensic Service Centre 2002
Heroine seizures accounted for the most significant increase in terms of drug
seizures within the period of 1997-2001. Also, the number of cannabis, amphetamine
and ecstasy seizures has increased several times. The number of GHB seizures
increased rapidly in 2000-2001.
A decline in the number of seizures of home-made poppy products was observed in
1999-2000, but an increase took place again in 2001. The number of
methamphetamine seizures has decreased since 2000.

40
PART II EPIDEMIOLOGICAL SITUATION
Figure 9. Number of seizures for main types of drugs, 1995-2001
0
50
100
150
200
250
300
350
400
Cannabis Home-madepoppy products
Heroin Amphet.,metamph.
MDMA (ecstasy) Cocaine
1995 1996 1997 1998 1999 2000 2001
Source: Police Forensic Service Centre 2002
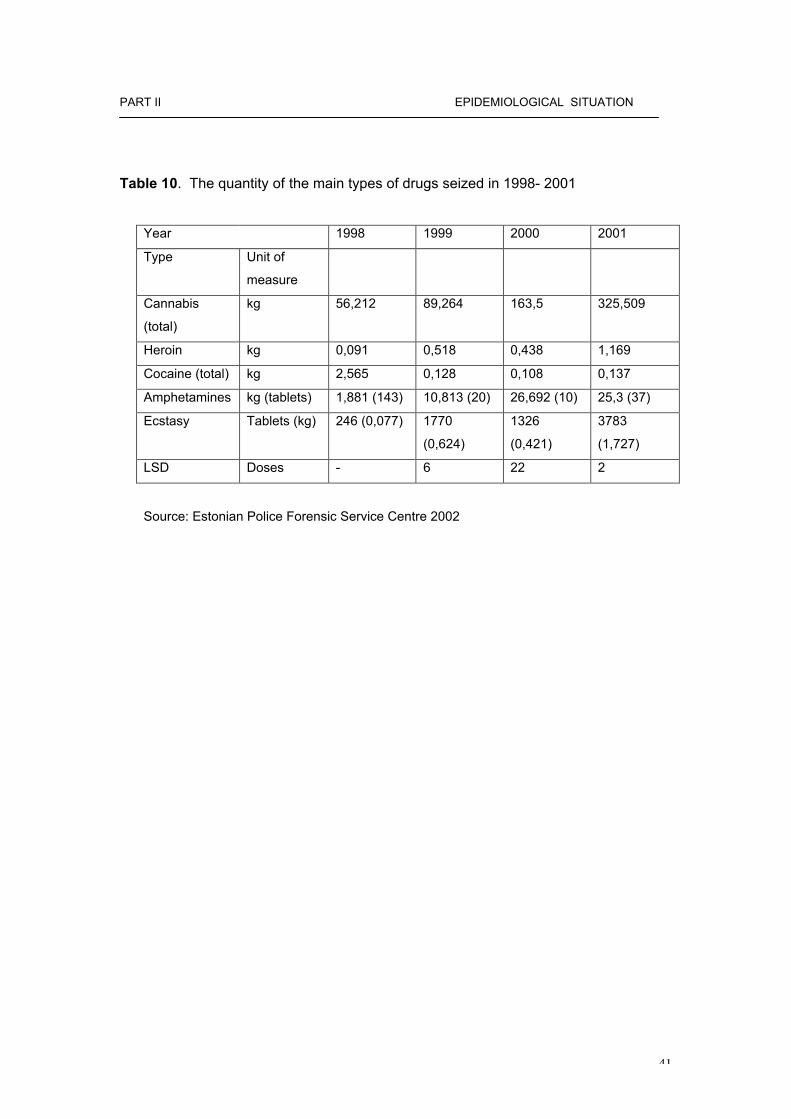
In recent years, the quantity of seized drugs has increased considerably with respect
to the majority of drugs.
Compared to the year 2000, 2.7 times more heroin was seized in 2001 (because of
low purity, the seized quantity of pure heroine increased only 28%). In the same
period, the amount of seized ecstasy increased 4.3 times and the amount of seized
amphetamine about 60%. The quantity of seized marijuana increased 2.6 times and
the quantity of cannabis herbs 2.8 times. 12 times more GHB was seized in 2001
than in 2000. Quantities of the main types of seized drugs are shown in the table 10.
In 2001, no clandestine laboratories for producing synthetic drugs were found by the
police.
41
PART II EPIDEMIOLOGICAL SITUATION
Table 10. The quantity of the main types of drugs seized in 1998- 2001
Year 1998 1999 2000 2001
Type Unit of
measure
Cannabis
(total)
kg 56,212 89,264 163,5 325,509
Heroin kg 0,091 0,518 0,438 1,169
Cocaine (total) kg 2,565 0,128 0,108 0,137
Amphetamines kg (tablets) 1,881 (143) 10,813 (20) 26,692 (10) 25,3 (37)
Ecstasy Tablets (kg) 246 (0,077) 1770
(0,624)
1326
(0,421)
3783
(1,727)
LSD Doses - 6 22 2
Source: Estonian Police Forensic Service Centre 2002

42
PART II EPIDEMIOLOGICAL SITUATION
5.3 Price, purity
The estimated prices provided by the Central Criminal Police are given in table
11. During the reporting period the price of drugs increased. The only difference
can be observed with respect to amphetamine type powders, the price of which
decreased.
Table 11. Street prices of illegal substances in EUROS in 2000-2001
2000 2001
Size of sample Min Max Average Min Max Average
Cannabis resin
(per gram)
7,98 9,58 8,87 12,78 15,97 14,38
Cannabis leaves
(per gram)
4,47 9,58 7,02 8,31 9,58 8,95
Heroin brown
(per gram)
51,12 95,85 146,96
Heroin white
(per gram)
63,91 76,69 70,3 51,12 95,85 73,48
Cocaine powder
(per gram)
51,13 76,69 63,91 76,68 95,85 86,26
Amphetamines powder
(per gram)
12,78 15,97 14,37 6,39 12,78 9,58
Ecstasy (per tablet) 4,47 7,98 6,22 5,75 7,67 6,39
LSD (per dose) 6,39 6,39 12,78 15,97 14,38
Source: Central Criminal Police 2002
The purity of seized substances is different, however, on the basis of the
statistical data of the Estonian Police Forensic Service Centre it can be stated
that in general the purity of substances decreased in 2001 (Table 12).

43
PART II EPIDEMIOLOGICAL SITUATION
Table 12. The purity of tested substances (%), 1999- 2001
1999 2000 2001
Min Max Average Min Max Average Min Max Average
Heroin 16 100 45 1 100 58 3 100 21
Cocaine 20 100 47 26 99 60 8,5 83 40
Amphetamines 11 100 60 10 100 28 2 100 23
Source: Estonian Police Forensic Service Centre 2002
6. Trends per drug
In Estonia population survey data on the year 2001 is not available and we cannot
make any conclusions regarding the prevalence of the use of certain types of drugs
among the general population.
Trends of drug use in the Estonian society can only be observed on the basis of the
data on drug seizures, quantities of drugs, crime statistics, qualitative studies and
treatment demand database.
The last population survey dates back to 1998 and cannot form the basis for the
identification of trends of 2001, but already the results of the ESPAD Survey 1999
indicated that synthetic drugs are gaining popularity in Estonia (See Chapter 15).
According to the drug treatment database the proportion of patients having sought
treatment for stimulants use has increased by 63% in the reporting period. Other
indicators (drug-related crime, number of seizures, study results) confirm that
stimulants are a growing problem in Estonia.

44
PART II EPIDEMIOLOGICAL SITUATION
6 Discussion
6.1 Consistency between indicators
Due to the lack of updated population survey data , it is difficult to make data-
based decisions. Consistency between the indicators of drug treatment
demand, drug-related deaths and infectious diseases is apparent. The data of
drug treatment demand suggest that there is an urgent need for the
establishment of an appropriate treatment and rehabilitation system. Opiates
are the main reason for seeking treatment and there is a need for the
development of treatment possibilities. The proportion of clients having used
the same syringe increased in 2001 (See Chapter 3.1). As to drug-related
infectious diseases the situation has got worse compared to the previous
years. According to the data of the Health Protection Inspectorate data the
new HIV positive cases reported in 2001 were almost 74% higher than the
previous year. According to the data of anonymous AIDS cabinets the
incidence rate of drug addicts among HIV positives was 91% (See Chapter
3.3). In terms of mortality the number of direct drug-related deaths grew from
31 in 2000 to 45 in 2001.
Consistency of indicators is apparent, however, new population survey data
and prevalence study to estimate the number of problematic drug users in
Estonia are needed.

45
PART II EPIDEMIOLOGICAL SITUATION
6.2 Methodological limitations and data quality
The main limitations with respect to the methodology are related to lack of data
sources, different methods of data recording, lack of concrete definitions on the
national level and qualitative data, especially on intervention issues. Appropriate
definitions and concepts have not been agreed upon on the national level yet. The
new National Drug Strategy for the year 2003-2012 will include agreed definitions,
thus, they will be available in the next report.
There have been some changes in the quality of drug data in Estonia since the last
reporting period, however, in some cases updated data is not available about the
year 2001, data of the next population survey as well as the ESPAD Survey will be
available in 2004.
The quality of data with respect to drug-related deaths has improved. The Statistical
Office has switched from three-character ICD-10 codes used in 1997-2000 to four-
character ICD-10 codes to adhere to the EMCDDA guidelines with regard to
reporting the level of mortality and indicating the causes of death.
Reliable information on HIV / AIDS prevalence in Estonia is not available, especially
with respect to IDU-s. Anonymous reporting can only give information on diagnosed
infectious diseases by age groups and gender also the registration system enables to
identify injecting drug use. In 2001 a discussion regarding the improvement of the
current reporting system of infectious diseases was held. As a result of acquiring a
new Programme of HIV / AIDS, the Surveillance System of HIV / AIDS and other
STD should be improved at the beginning of 2003, Estonia will have appropriate data
available by risk groups on drug treatment, needle exchange, STD clinics, pregnant
women screening, hospitals and arrests.
Harm reduction data and data on the drug use in prisons is neither collected
systematically nor according to any defined method. Data on drug use in prison is
available about one prison only, but is doubtful because of the lack of data recording
method In order to improve registration system in prisons some efforts should be
made to set up clear concepts and definitions.
46
PART III DEMAND REDUCTION INTERVENTIONS
PART 3
DEMAND REDUCTION INTERVENTIONS
7 Strategies in demand reduction at national level
7.1 Major strategies and activities
The main activity regarding demand reduction on the national level was setting up
county drug councils. In July 2001 the Estonian Health Education Centre (EHEC)
entered into contracts with all 15 counties with the purpose of setting up drug
councils. The aim of the established drug councils is to improve prevention activities
on the local level. County drug councils should be able to collect more detailed
information about local needs within next few years and thus, act more operatively.
As at autumn 2001 all county councils were established, their responsibilities defined
and county drug prevention development plans composed.
7.2 Approaches and new developments
In 2001the focus was on improvement of the quality of drug prevention and
availability of drug treatment. Within the framework of prevention work in schools
and counties seminars were organised to improve the knowledge and skills in setting
targets and initiating activities to meet the overall goals of the prevention work.
With respect to increasing the access to drug treatment, the purpose was to improve
the availability of drug treatment to both, insured and uninsured patients, and
improve the overall quality and coverage of drug treatment. Several trainings were
carried out (see Chapter 9.4) with the aim of improving the efficiency of drug
prevention activities.
In 2001 assessment of the ADAPP was undertaken. The purpose of the assessment
was to improve the quality and efficiency of the programme as well as develop the
quality criteria of the programme. Within the framework of this assessment
procedure, five subordinate projects of the ADAPP were assessed.
47
PART III DEMAND REDUCTION INTERVENTIONS
9. Prevention
Prevention work was carried out in the form of project work in Estonia in 2001. The
aim of the prevention projects was drafting of prevention plans and cooperation
plans, development of prevention networks and arrangement of secondary
prevention in risk groups. Almost 10,000 young people, parents and teachers took
part in the prevention work in Estonia in 2001. 15 prevention projects were submitted
to ADAPP by NGO-s from 6 counties of Estonia, 7 by county governments and local
governments and 10 projects by schools. One project was implemented in the form
of a TV program, which focused on the impact of drug use on the behaviour of an
individual as well as on everyday habits of the risk groups of the young population.
Expenditures of the prevention work are shown in Chapter 14.
9.1 School programmes
There are 700 municipal and 100 state schools in Estonia.
From the year 2002 prevention work is carried out as a part of the school
curriculum in Estonia. In the last report it was mentioned that Estonian experts in
cooperation with the UNDCP were developing study materials of the drug
prevention programme to be included in the curricula of the grades 4-6. The
programme was tested in 2001 and included in the school curriculum in 2002.
The main methods of the study material comprise active learning and acquisition
of social skills. The material of the programme is divided into eight parts among
which are prevalence of drug use among the young population, prevention of
drug use in schools, drugs in school, drugs and levels of drug addiction, active
learning. Drug prevention lessons take place as a part of human and health
study.
48
PART III DEMAND REDUCTION INTERVENTIONS
Prevention work in schools is also carried out within the framework of prevention
projects. 4 school projects out of ten were undertaken in primary schools, 1 was
conducted in an elementary school, 3 in special schools, 1 in a gymnasium and 1
in a vocational school. Those projects were mostly aiming at performance of
alternative activities and acquisition of social skills and theoretical knowledge (in
the form of seminars, lectures and training) about drugs. Students of Tapa
special school were provided with individual counselling.
Also, the projects of local governments and NGOs were focusing on prevention
work in schools involving trainings and seminars for students and teachers (Table
13).
9.2 Youth programmes outside school
A few projects of the total of 33 prevention projects involved out-of-school activities
targeted mostly at youngsters and involving such alternative activities as organising
camps or trips or sports events. All programmes implemented outside schools
covered also active learning, which was carried out by means of seminars or lectures
(Table 13.). (See also Chapter 10.1 Harm reduction).
9.3 Family and childhood
In 2001 drug prevention projects hardly took in the family and the child. A couple of
projects included a few lectures for parents. In Paide some prevention activities were
targeted at children aged 5-6 (Table13).

49
PART III DEMAND REDUCTION INTERVENTIONS
Table13. Projects implemented in 2001
No Applicant Activity
1 Ida-Viru county,
Rehabilitation Centre
You will not Be Left
Alone
Prophylactic training for school children aged 12-17
2 Tartu, Konguta
Elementary School
Active learning providing with knowledge about drug
addiction and prevention.
3 Lääne-Viru county, City
Government of Kunda
Informative lectures, seminars and training about drug
addiction.
4 Põltsamaa, Young
Union JUVENTUS
Questionnaire about prevalence of drugs, tobacco and
alcohol and knowledge of AIDS. Development of
leisure activities to respond to drug use.
5 Põlva county,
Gymnasium of Kanepi
Leisure activities for students.
6 Saare county, Tornimäe
Primary School
Questionnaire to evaluate the situation with respect to
the response to drug use; development of alternative
activities and trainings.
7 Tallinn, Estonian TV A TV program about the impact of drug use on
individual behaviour .
8 Rapla county, Vana-
Vigala Technical and
Production School
Study camp in Hobulaid, a drug prevention week for
students, incl. an essay-writing contest.
9 Viljandi, Puiatu Special
School
Outside school activities for students, an essay-writing
and painting contest to help to give meaning and
motivation to life, provide possibilities for the
development of necessary skills for leading a life free
from drugs and criminal offence.
10 Tartu, Kaagvere Special
School
Prevention of addiction. A follow-up program for the
continuation of activities of the previous year.
11 Rapla County
Government
Leisure activities, improvement of training and
counselling possibilities.
12 Võrumaa, Estonian
Health Promotion
Union, Võru Department
Group work in schools (grades 4-9) facilitated by a
counsellor having undergone special training. Training
in counselling for students; printing of information
material.
13 Lääne-Viru county,
NGO Rutja Vocational
Centre
Organisation of a camp (8 shifts) including lectures and
group work.

50
NGO Rutja Vocational
Centre
group work.
14 Narva City Government Setting up and launching of a prophylaxis centre of
drug addiction.
15 Hiiu county, Hiiumaa
Municipality
Sniffing dog raids, organisation of an international
seminar, trainings and a performance.
16 Ida-Viru county, NGO
Regional Centre of Drug
Addiction Prevention.
Sports and work camps; establishment of sports clubs
in the housing area.
17 Võru county, Mõniste
Primary School
Provision of theoretical knowledge and organisation of
leisure activities.
18 Harju county, Harku
municipality government
Provision of children and teachers of the educational
institutions of the local municipality with possibilities for
active learning. Development of possibilities for leisure
activities in the local municipality.
19 Järva county, Paide City
Government
Trainings for children aged 5-6, young people aged 7-
29 and teachers. Questionnaires, a drug tent and a
sniffing dog.
20 Valga county, Patküla
Primary School
Implementation of a training and counselling
programme involving three local schools.
21 Viljandi, Settlement
Foundation “Trust”
Prevention classes in Viljandi schools, grades 3 and 7.
Trainings for parents.
22 Lääne- Viru county,
Simuna Ladies` Club
Round table meetings and publishing of information
material.
23 Lääne county, Haapsalu
City Government
A work and leisure camp (7 shifts) for city youngsters
aged 8-16.
24 Ida-Viru county, Kohtla
Primary School
Interactive learning, organising of trips, excursions and
performances.
25 Tartu, NGO “Owl” Organizing a camp for 20 children aged 10-15.
26 Tartu, Tartu Children
Support Centre
A four-day camp for 50 children from risk families and
their support persons.
27 Saare County
Government
Setting up a system of sending problem letters,
organisation of a party to youngsters, organisation of
an international seminar, trainings and other seminars.
28 Harjumaa, Social
Centre of Keila
Organisation of a campaign week including an
audiovisual contest, forum, lectures and movies.
29 Viljandi, NGO “Develop
Karksi”
Organising of trainings, health weeks and information
days for prevention workers.
30 Tallinn, Union of
Gymnastic Teachers
6-day international prevention course for teachers of
gymnastics from Estonia and Finland.
31 Tallinn, Probation
Supervision Department
of Tallinn City Court
7-day camp involving lectures, group work and
individual counselling. The target group of this camp is
youngsters having committed a misdemeanour.
32 Lääne-Virumaa, Tapa
Special School
Individual counselling, seminars, a camp for drug
abusers and information days for parents.

51
Special School abusers and information days for parents.
33 Harjumaa, NGO
“Persona”
Leisure activities
Source: Estonian Health Education Centre 2002

52
PART III DEMAND REDUCTION INTERVENTIONS
9.4 Other programmes
Trainings
The Estonian Health Promotion Centre launched several trainings and seminars in
the year 2001.
• In-service training in drug prevention for the teachers of general and
vocational schools. The purpose of the training was to improve the
knowledge of teachers and administration of prevention work. Another
aim of the training was to compile prevention material for the teachers of
vocation schools. Total of 365 teachers participated in 7 seminars, which
were organised within the framework of trainings in 35 schools.
• Two complex drug prevention trainings were carried out within the
framework of the establishment of prevention network in local
municipalities in Ida- Viru and Järva counties. The purpose of the trainings
was development of a training model for the prevention work in local
settings. Total of 376 persons from Järva and Ida- Viru county
participated in three-stage trainings in both counties. The seminars
concentrated on the collection of information on the availability of drugs
and the current situation regarding drugs, prevention methods and
trainings needs of the areas where the trainings were about to take place.
Also, information on activities necessary for efficient functioning of the
network and the principles of networking was disseminated.
• Drug prevention training for social workers and health care professionals.
The purpose of the training was to improve prevention work skills of health
care professionals (see Chapter 9.4). Total of 53 social workers, 72 health
care professionals, 9 child welfare workers, 51 municipality workers, 30
local government workers, 2 journalists, 6 representatives of the church
and 37 managers of different institutions participated in the training.
• Drug prevention training in prison. Training in drug intoxication diagnostics
was carried out in prison. Total of 282 prison workers participated in the
training. According to the report on the training 240 participants completed
the training successfully.

53
PART II EPIDEMIOLOGICAL SITUATION
• Drug prevention trainings for police officers. Total of 28 police officers
from local governments were participating in the trainings.
• Drug prevention trainings for the representatives of mass media. The
purpose of the training was to initiate discussions about drug issues in
media. Trainings focused on the problem of presenting drug issues in the
media in the correct way. Trainings took part in the form of seminars in
Tartu and Tallinn.
• Drug prevention training for project managers. The purpose of the training
was to improve the quality of projects. It was a two-stage training, 14
participants took part in the first part of the training and 17 in the second
part of the training; 10 of them participated in both seminars. The main
subject was assessment of the efficiency of projects.
Internet
Up to 2001 a special drug information website providing information on drug issues
and promoting drug prevention did not exist. According to the international study
“Global E commerce Report 2002” Estonia is one of the most rapidly developing
information society in the Central and Eastern Europe, in 2001 33% and in 2002 39%
of the whole population in Estonia used the Internet. According to the study about
81% of the population under 20 years of age and 68 % of people aged 20 – 29 are
internet users, thus, it is evident that there is a great need for launching an Internet
website giving adequate drug-related information targeted at wider public, parents,
families and professionals of the drug filed. Also, the website should include other
important topics such as implementation of the national strategy and drug information
action plan, monitoring of drug situation, drug policy and response to drug use on the
national as well as local level, and innovative drug programmes targeted, first and
foremost, at young people.

54
PART III DEMAND REDUCTION INTERVENTIONS
At the moment the accessible Internet websites include limited amount of information on
drugs, non-governmental and governmental services regarding alcohol and drug use,
however, websites targeted at specific target groups, such as a young people, are not
available. Also, specific information about the effects and consequences of drug and
alcohol (chronic) use, dependency and harm reduction measures, is not available on the
Internet. The website of the Estonian Health Education Centre (http://www.tervis.ee/)
provides an overview of the National of Alcohol and Drug Abuse Prevention Programme.
The publication of the Ministry of Internal Affairs of Estonia ”Drugs in Estonia:
Legislation and Statistics on Drug-related Offences” is available on their website
(http://www.sisemin.gov.ee/sisejulgeolek/ylevaated.html) .
The homepage of the Estonian AIDS Prevention Centre provides access to their
publication, which provides information about drugs, addiction and possible contacts
of help. (http://www.aids.ee/est/narkomaania/narkomaania.html).
Also, counties provide information on drug-related issues on the local level. Põlva
county (ht tp: / / terv is .polvamaa.ee/narko_areng.html) and Hiiu coun ty
(http://www.mv.hiiumaa.ee/info/narko.html) are among the few counties having made
drug information available on the Internet. Despite all, it is obvious that provision of
drug information should be more systematic. Efforts should be made to improve the
coverage as well as quality of information provided via Internet

55
PART III DEMAND REDUCTION INTERVENTIONS
10. Reduction of drug-related harm
It is not possible to give a comprehensive quantitative overview of drug-related harm
reduction in Estonia. The history of harm reduction in Estonia is very short and
experience is limited. Outreach work has not been defined in the ADAPP and in the
National HIV/AIDS Prevention Programme as an activity performed with the purpose
of reducing drug-related harm. The most common method of funding harm reduction
activities has been direct state funding. Since 2001 certain local authorities have also
been providing finances for certain outreach projects. Financial, legal and human
resources for the performance of harm reduction activities targeted at IDU-s are still
insufficient (Chapter 14). Harm reduction used to play a minor role in the national
drug strategy and policy, however, the importance of harm reduction has increased
as a result of rapid transmission of HIV/AIDS since 2000, consequently, the activities
have been focusing on the IDU-s. In the year 2000, when the HIV infection was
transmitting very extensively - about 90% of the incidents of HIV were related with
IDU-s (Estonian National Report 2001) - the Government started to pay more
attention to the implementation of harm reduction measures and allocated more
funds to needle exchange, HIV testing and distribution of condoms.
It was decided that harm reduction must form an integral part of the new comprehensive
multi- disciplinary national drug strategy, which was being drafted by the Ministry of Social
Affairs and ministry of Internal Affairs in close co- operation with the Phare – Twinning
Project.
The Ministry of Social Affairs coordinated the National HIV/AIDS/STDs Prevention
Programme up to 2001 and continues to do so. The Programme Council for the Fight
Against AIDS was established in 1998 and consisted of representatives of various
ministries, government agencies and NGOs. The Council is responsible for the
implementation of the National AIDS Programme, it coordinates the activities of
different sectors and ministries and monitors the fulfilment of the time-schedule and
the management of finances.

56
PART III DEMAND REDUCTION INTERVENTIONS
At the beginning of 1990’s only some NGOs were active in the filed of harm
reduction. The AIDS Prevention Centre (APC)4 was established in May 1996 as a
non-profit government agency. Since 2000 the APC has been the most powerful
institution on national level responsible for the implementation of the National
HIV/AIDS Prevention Programme in 2001. The APC is responsible for the
implementation of the projects and tasks initiated within the framework of the
National AIDS Programme and coordination of the cooperation between government
agencies and NGOs.
The number of full-time employees in the APC has increased from 9 to 10, including:
a managing director, five project managers, a social worker and three specialists of
the anonymous testing sites located in Tallinn, Tartu and Narva. Another anonymous
cabinet was set up in Pärnu in 2001. Also, 20 – 30 voluntary workers belong to the
APC team: office volunteers assist the office staff and outreach volunteers work in
the streets, distribute information material etc.
4 Since 2000 the APC is governed by the Health Protection Inspectorate, which is a government agencyresponsible for the surveillance system.

57
PART II EPIDEMIOLOGICAL SITUATION
Distribution of roles between different organizations is shown in Table14.
Table 14. Distribution of roles between different organizations in 2001
Institutions Address Main tasksMinistry ofSocial Affairs
Gonsiori 29, 15027 TallinnE-mail: [email protected]: +372 626 9700Fax: +372- 699 2209
1. Coordination of the national HIV / AIDS /STDProgramme.2. Coordination of the national Alcohol andDrug Abuse Prevention Programme.
Estonian AIDSPreventionCentre (APC)
1.Main office: Narva 48,Tallinn 10150Phone: (372) 6273 500;Fax: (372) 6273 510http://www.aids.eeE - mail: [email protected]
2. Tiigi 1-1, Tartu, 51004Phone: +372-7427611
3. Karja 6, Narva, 20306Phone: +372-3548344
1. Planning and implementation of HIV/AIDSprevention measures in Estonia.2. Preparation and provision of information andinformation material (seminars, lectures,discussions, etc).3. Provision of health teachers with uniformprogrammes of HIV, safer sex and drug abuse,and carrying out respective seminars.3. Anonymous testing in Tallinn, Tartu, Narvaand Pärnu.4. Organisation and implementation ofcampaigns, charity concerts and World AIDSDays.5. Collection and dissemination of data aboutHIV/AIDS/STDs, both locally andinternationally.6. Analysis of the data on HIV/AIDS/STDs andmaking estimates for the future.7.Provision of media with updated information.8. Conducting research and studies about thebehaviour of the Estonian and Russian youthwith the purpose of making informed decisionswithin the framework of other appropriateprojects.
AIDS SupportandInformationCentre
1. Erika 5a, 10416, TallinnPhone +372-6603636E-mail: [email protected]
2. IDU Subsidiary in TallinnKopli 32, 10412 TallinnPhone/fax +372 6413165e-mail: [email protected]
3. IDU Subsidiary in TartuPhone: +372-76276114. IDU Subsidiary in NarvaPhone: +372-5542814
1.HIV/AIDS prevention work targeted at riskgroups (sex workers, marginalized youth,IDUs).2. Methadone treatment programme.3. Needle exchange programme.
Ministry ofEducation
Tartu, Munga 18, 50088. 1. Improvement of the efficiency of sexualeducation within the framework of schoolcurricula and trainings for health educationteachers.

58
Education E- mail: [email protected]: +372+0735022
education within the framework of schoolcurricula and trainings for health educationteachers.
EstonianHealthEducationCentre
Rüütli 24, 10130,TallinnPhone: (+372) 627 9280Fax: (+372) 627 9281
E- mail:
http://www.tervis.ee
1. Implementation and coordination of theADAPP, National HIV/AIDS PreventionProgramme on the national level.2. Dissemination of information on local level.2. Dissemination of information betweendifferent organisations on national andinternational level.
Estonian Anti-AIDSAssociation
Paldiski 62, 11617, TallinnPhone: + 3726514360Fax: + 372-6706814E- mail: [email protected];[email protected]
1. Dissemination of information on HIV/AIDSamong the youth. 2. Distribution of prevention material. 3. Organisation of lectures and seminars.
Estonian HIV-PositivesSociety,ESPO
Tallinn, Narva 48, 10412E-mail: Phone +372 627 3505Fax: +372 627 3510E-mail:[email protected]
1. Psycho-social support to people infectedwith HIV, as well as to their relatives (self –help groups).2. Setting up self-help groups for peopleinfected with HIV/AIDS, participation of suchgroups in prevention work (lectures, outreachwork, volunteers, etc.).3. Government`s AIDS policy.
Parentsagainst Drugs
Kahu 4, Tallinn, 13619Phone: +372-6328814; +372-328819
1. Dissemination of information among thepublic.2. Implementation of measures to ensuredevelopment and application of innovativemethods in drug abuse prevention bygovernment agencies; counselling of theparents of drug users.
“Living forTomorrow"
Narva mnt. 48, Tallinn 10150,EstoniaTel. (+372) 6273 500, (+372)52 87376E-mail: [email protected]
1. Prevention of the transmission of HIV/AIDSusing gender approach.2. Carrying out youth programmes targeted atEstonian and Russian adolescents.
EstonianUnion AgainstSexuallyTransmittedInfectiousDiseases
Ujula 76, 51008, TartuPhone: +372-5058949
1. Cooperation of specialists of various fieldsinterested in changing the existing outdatedstereotypes in diagnosing, treatment andprevention of infectious diseases.
59
PART III DEMAND REDUCTION INTERVENTIONS
In 2001 the Ministry of Social Affairs established a working group with the purpose of
drafting an updated National HIV/AIDS Programme for 2002 – 2006 and find the best
solutions for the increasing HIV/AIDS problems in Estonia. The main objectives of the
national programme are to increase the awareness of the risk groups, especially the
young population, of HIV/AIDS and other STD and prevention methods, to ensure access
of all interested persons to counselling and HIV testing and HIV/AIDS prevention
activities; provide HIV infected persons with possibilities for treatment. It was decided that
the surveillance system set up for the monitoring and analysis of the transmission of HIV
would be reviewed and updated and a more effective system for the assessment of the
efficiency of the HIV/AIDS Prevention Programmes would be established.

60
PART II EPIDEMIOLOGICAL SITUATION
The key objective of harm reduction is to minimize drug-related harm to the society as
well as to the individual by means of ensuring application of appropriate prevention
measures, provision of counselling and HIV testing to risk groups. Previous harm
reduction policy was mostly oriented towards the “hidden” groups of the population. The
main target group of the programme were IDU-s, as well as other vulnerable groups such
as young people, mainly adolescents with risk behaviour, prostitutes, and homosexuals.
Later on, in 2001, the risk group was extended as the surveillance data indicated that only
a small proportion of HIV infected were IDU-s (Chapter 3.3). The new target groups
included bisexuals and men with risk behaviour, persons suffering from sexually
transmitted diseases and pregnant women etc. Due to extensive transmission of HIV
among the prison population since 2000, detainees and prisoners were also defined as a
risk group.

61
PART III DEMAND REDUCTION INTERVENTIONS
Expenditures allocated to reduction of drug related harm
In 2001 the total budget for HIV/AIDS Prevention Programme was 4,850,000 EEK
(310 897.4 Euros). The AIDS Prevention Centre is mainly financed from the state
budget. In addition, the APC has applied for and received several international grants
which have been used for the financing of specific projects, e.g. harm reduction
projects targeted at injecting drug users, projects on the prevention of
HIV/AIDS/STDs among sex-workers, the project on the inclusion of drug prevention
in the school curriculum, a couple of publications, etc
In 2001 EEK 2 million (128 205.1 Euros) was allocated for the combined antiretroviral
therapy with 3 medicaments for 31 patients already receiving treatment, which
covered the expenses of the medicaments for 7.5 months. In the second half-year
the AIDS Prevention Centre was allocated an additional EEK 700,000 (44 871.8
Euros) from the state budget, providing a possibility for continuing the treatment of
the patients with 2 medicaments up to the end of the year. According to the
calculations total of EEK 4,530,000 (290 3845.6 Euros) is needed to cover the
expenses of combined treatment of 31 patients with 3 medicaments and until 10 new
patients treatment. EEK 800,000 (51282.05 Euros) were allocated from the state
budget for the testing of HIV, including EEK 150,000 (9615.4 Euros) was allocated
for anonymous testing, which has turned out to be a very effective method. In 2000
total of 3582 HIV tests were made in the anonymous cabinets of the AIDS Prevention
Centre in Tallinn, Tartu, Narva and Pärnu. The cost of a test is EEK 50 (includes
routine testing for syphilis). According to the estimations the number of HIV tests
could increase to 4982 in 2001 .

62
PART III DEMAND REDUCTION INTERVENTIONS
10. 1 Description of interventions
It is difficult to define outreach work, as a nationally accepted definition of outreach work
has not been provided. Different types of activities, which can be identified as outreach
work, have been carried out. Unfortunately, information on outreach interventions is not
available in a structured, systematic and standardized form. Involvement of volunteers
has been important for the maintaining of contact with IDU-s and other risk groups, as
there is shortage of full – time professional staff. The most widely used model in the field
of harm reduction has been the Catching Clients Model. The staff of the needle exchange
points and the volunteers have been actively seeking contact with IDU-s, to encourage
the target group to contact with needle exchange and condom distribution points,
treatment and rehabilitation institutions and NGO’s working in this filed. The use of the
Public Health Model was initiated as a result of extensive transmission of HIV in Estonia
in 1994. The main aim of the model was to reduce drug-related harm through safer drug
use (needle exchange) and safer sex (condom distribution). The APC is responsible for
the prevention of infectious diseases by means of implementation of agreed preventive
measures and for the application of comprehensive HIV/AIDS and other STD prevention
measures on the national level as well as for the coordination of prevention work on the
local level. APC carried out the media campaign in 2001.
Common agreement on the methods of outreach work in recreational settings has not
been reached on the national level. In 2000 the EFPDA published leaflets on the safe use
of drugs in recreational setting targeting the information at recreational drug users. The
leaflets were criticized and in 2001 similar projects were not initiated.
63
PART III DEMAND REDUCTION INTERVENTIONS
In 2000 the EFPDA prepared a campaign targeted at drug users in recreational setting.
The campaign was aiming at 3 main aspects. The main aim of the campaign was to avoid
overdoses and give adequate information about club drugs such as amphetamine,
ecstasy and cannabis. Another objective was to provide information about the adverse
impacts of drug use and special attention was paid to female club – goers.
Prevention of overdoses was the main purpose of the project launched by the EFPDA.
Dissemination of information material in clubs to prevent young people from taking
overdoses has been the main activity in this field. Data on trainings in safe drug use are
not available. APC is the main organization carrying out a peer-to-peer outreach project
(“Living for Tomorrow”).
10.2 Standards and evaluation
No data available.

64
PART III DEMAND REDUCTION INTERVENTIONS
11. Treatment
Estonia has been reforming the health care system for more than 10 years. Planning
and management of health care services is the responsibility of the Ministry of Social
Affairs of Estonia. The first two significant reforms were carried out within the period
of 1992-1994 aiming at decentralisation of planning and provision of health care
services and revision of the financing of health insurance system. A licensing system
for hospitals was established in 1994. The third reform was initiated in 1997 to
develop a system of family practitioners and public health services. The latest reform
aimed at improving the quality of hospital services by centralising acute inpatient care
and making use of the latest technological developments in medicine, as well as
creating a modern and comprehensive system of supportive health care.
The Health Insurance Act adopted in 1992, established a basis for the financing of
national health care system, which covers ca 95% of the general population.
Organization of public health system is legally regulated by the Public Health Act,
approved by the Riigikogu in 1995.The latest amendments to the Public Health Act
entered into force in 2002. The Public Health Act provides a legal basis for the
National Alcohol and Drug Abuse Prevention Programme 1997 - 2007, National
HIV/AIDS Prevention Programme 2001 and later on National HIV/AIDS Prevention
Programme 2002-2006 etc.
Financing of services is co-ordinated by the health insurance system. Health
insurance is a state-guaranteed system for the payment of the costs related to
preserving the health of residents of Estonia, the costs related to their temporary
incapacity for work and their medical treatment as a result of illness or injury, and
benefits in the event of pregnancy and childbirth, also care allowance for caring of a
sick dependant, and compensation for the cost of pharmaceuticals for some
categories of insured persons5.
5 Those persons not covered by compulsory or voluntary health insurance must pay medical expenses themselves. State budgetresources have been allocated for those with financial needs to cover the expenses of emergency medical care. These resourcesare distributed through local authorities and they pay for the medical services provided to those in need on the basis of guaranteeletters.

65
PART III DEMAND REDUCTION INTERVENTIONS
11.1 Drug – free treatment and health care on national level
Treatment of drug addicts is a part of psychiatric care, regulated by the Mental Health Act
(Chapter 3.1). In most cases, treatment of drug addicts takes place in inpatient psychiatric
treatment institutions, which also provide treatment for other kind of psychiatric disorders.
There are only a few specialised hospitals / departments specialised in treatment of drug
addiction.
Treatment of uninsured patients is covered by the Health Insurance Fund and directly
from the budget of ADAPP.
In the background of an increasing demand for treatment, availability of treatment facilities
is limited (Jänes, 2001). Assessment of the current treatment system and services for
drug addicts is the prerequisite for the revision of the drug treatment system.
According to the data provided by medical doctors, there is a long waiting list of persons
seeking treatment for drug problems, but access to treatment services is limited. Drug
treatment facilities are divided into two main categories: in-patient and out-patient
treatment institutions. Psychiatric care hospitals provide drug addicts with all basic types
of treatment: detoxification with methadone, medicines– free therapy (drug – free)
therapy, counselling and support. However, substitution treatment is not available. Short
– term detoxification with methadone is still most widely used treatment method for opiate
addicts: more then four fifth of the treated patients have received detoxification. Drug free
treatment has not been systematically recorded in Estonia, thus, according to treatment
demand data only a very low proportion of drug addicts have received drug – free
treatment.
Only a limited number of in- and out-patient treatment centres (some of them are NGOs),
provide drug – free treatment: NGO A- Kliinik in Tartu, Narva hospital, the policlinic of
Ahtme hospital, Ahtme hospital, department of psychiatrics in Pärnu hospital. Some of the
other NGOs active in this field are SA Anti Liew & Hingehooldus and NGO “Sind ei jäeta
üksi” in Narva. Several treatment centres in Ida – Virumaa use the Minnesota model of
treatment.

66
PART III DEMAND REDUCTION INTERVENTIONS
Establishment of a new treatment centre in Tartu and rehabilitation centres in Sillamäe
and Loksa were initiated in 2001. Training of the staff started in autumn 2001 in close
cooperation with the Phare Twinning Programme team. Sillamäe and Loksa centres
should be fully operational by the end of 2002. Tartu Rehabilitation Centre is expected to
launch its activities in the middle of the year 2003.
Estonian experts drafted “Guidelines for Drug Treatment” within the framework of the
Council of Europe Pompidou Group Drug Demand Reduction Staff Training Project
(DRSTP II). The above-mentioned guidelines were approved and published by the
Estonian Psychiatric Association.
Data on the evaluation of treatment and rehabilitation services is not available.
11.2. Substitution and maintenance programmes
In Estonia short – term methadone treatment is the only widely used detoxification
method. Methadone treatment is not allowed in case of children under 18. Short –
term detoxification is provided in most psychiatric hospitals and in a few NGOs. The
AIDSs Support and Information Centre in Tallinn (Erika 5a) was the first NGO, which
started to provide short – term methadone detoxification. The Centre treated heroin
addicts for more that 4 years also using volunteers in their everyday work.
Similar kind of treatment was provided in Narva (Karja 6a), at the Rehabilitation
Centre for Drug Addicts and Alcoholics.
The AIDS Support and Information Centre also launched a reintegration programme
for persons who were participating in the programme of the Rehabilitation Centre,
located in Ida – Viru county. There are only 8 treatment slots in the Rehabilitation
Centre and regarding to that small number of patients was possible for the patients to
participate in the Estonian language and driver’s courses in Rakvere. The AIDS
Support and Information Centre and the parents of the patients of the rehabilitation
centre covered the expenses of the courses. Also, the centre organised a parents`
support group, which used to have meetings in Tallinn (Karu St 4).
67
PART III DEMAND REDUCTION INTERVENTIONS
11.3 After – care and reintegration
After – care and rehabilitation is a responsibility of local government as described by
the Social Welfare Act (1995). After –care and the building of the network around the
clients is rather poorly developed in Estonia. Currently only few NGOs – the AIDS
Support and Information Centre, Rehabiliation Centre in Narva for Drug Addicts and
Alcoholics have launched a reintegration programme for persons who were
participating in the rehabilitation programmes. The programme is directed to former
drug addicts and the main goal is to integrate them into normal every day life.

68
PART III DEMAND REDUCTION INTERVENTIONS
12. Interventions concerning the system of criminal justice
Prisons are government agencies governed by the Ministry of Justice. The main task of
the Prison Department of the Ministry of Justice is to organize the work of prisons, places
of preliminary detention and extradition camps, as well as supervision, execution of pre –
trial investigation of prison crimes and surveillance work. In 2000 the Ministry of Justice
elaborated a development plan of the prison system until the year 2003. As the first step
in reforming the prison system, the administration and control of prisons were brought
under the direct responsibility of the Ministry of Justice.
The Imprisonment Act (RT I 2000, 58, 376) stipulates the procedure for and organization
of deprivation of liberty, arrest and administrative arrest and preliminary detention, as well
as the definition and conditions of prison service. The Imprisonment Act provides
regulations for 2 types of prisons in Estonia – closed and open type prisons. The
Imprisonment Act emphasizes the establishment of the resocialisation system of
prisoners aimed at successful social adaptation of convicts. In Estonia there are total of 9
prisons (4 prisons are of closed type, 3 of semi – closed and 2 institutions for young
offenders).
The Probation Supervision Act stipulates conditions for alternative measures of
imprisonment (Sub-chapter 12.2).
The Minors Sanctions Act entered into force in September 1998 and act provides a
possibility to implement alternative sanctions in case of a minor offender.
According to the Health Service Act (01.01.2002) the Health Care system in prison is a
part of the national Health Care System, financed by the state budget. All persons are
subject to routine health control.
Access to psychological support is guaranteed in every prison and at the moment there
are 21 psychologists working in different detention facilities. In addition, it has been
planned to train 12 psychologist and social workers within the framework of the Phare
project “Crime Prevention”; in 2003 a programme “Motivational Interviewing” will be
launched. A health unit and social work unit have been set up in all Estonian prisons. The
size of health and social teams is different depending on the capacity of a prison.

69
PART III DEMAND REDUCTION INTERVENTIONS
The Social Welfare Act (1995, RT 21, 323, 723 – 736) regulates the provision of
social assistance to different risk groups with special needs. Social services are
provided and other support measures are taken to assist persons with special social
needs such as children, disabled persons, the elderly, persons released from penal
institutions and other persons in need.
12. 1 Assistance for drug users in prison
New developments in the field of intervention are focused on IDU-s and rapid
transmission of HIV / AIDS and other STDs in prison since 2001.
In 2001 total of 2087 inmates were tested in all prisons, 485 from which were HIV
positives (about 23% of all tested persons).
The transmission of HIV did not follow the same pattern in all prisons (Figure 10).
Figure 10. Number of HIV positive cases of all tests made in prison in 2001
0
500
1000
1500
All HIV testsPositive HIV tests
All HIV tests 240 10 117 316 148 34 44 1024 154
Positive HIV tests 6 1 6 71 0 0 0 405 2
Murru Ämari Tallinn Maardu Pärnu Viljandi Harku Central Central
Source: Ministry of Justice, 2002

70
PART III DEMAND REDUCTION INTERVENTIONS
Almost all cases of HIV infection were related to intravenous drug use prior to
imprisonment and only 2 persons had got the infection in prison.
According to the ADAPP the establishment of a drug-free programme in juvenile prison
was a task of the Ministry of Justice for the 3rd quarter of 1998. The number of drug – free
departments in the prison system has not increased compared to 1999, when the first
separate drug- free department were established in Viljandi Prison6. At the moment a
drug – free department is being set up in Harku Prison. The costs related to the
establishment of such department, including renovation of the rooms, are covered from
the ADAPP budget. Short- and long – term programmes have been prepared for the
inmates with addiction problems, as well as for prisoners not using drugs to protect them
from the influence of drug-using inmates. Establishment of the drug free unit enabled the
prison officers and doctors to identify the inmates with a dependency problem and provide
them with assistance, as well as exercise more efficient control over them. Inmates stay
in the drug – free department on a voluntary basis. An inmate has to sign a contract
providing that he/she agrees to stay in a drug – free department and accepts the
conditions therein (e.g. to give regularly a urine sample).
The first measures in the Estonian prison system to reduce the risks related to
HIV/AIDS and other STDs were undertaken in 2000. The directive of the Minister of
Justice on the Guidelines for the Identification of Potentially HIV Infected and the
Treatment of HIV Infected Imprisoned Persons entered into force on December 13,
2000. According to the directive of the Minister all HIV infected inmates are separated
from other inmates. In October 2001 a separate department was established in the
Central Prison for the HIV infected imprisoned persons.
6 Since December 1, 2001 there are 100 places for 13 – 21- year-old convicted minors and adolescents in ViljandiPrison.

71
PART III DEMAND REDUCTION INTERVENTIONS
The AIDS Prevention Centre (APC) is one of the main institutions responsible for the
prevention of HIV and other STD’s in prisons in Estonia. In 2000 the Ministry of Justice
published a brochure “A Prison Officer and Risks” targeted at the prison staff. In close
cooperation with the AIDS Prevention Centre Ministry of Justice translated and
published the booklet “Protect Yourself” aimed at imprisoned persons. In August 2001
the Government allocated EEK 250,000 (EUR 16025.6) for HIV testing in prisons. In
December 2001 440 prisons officers were vaccinated against hepatitis B. Voluntary HIV
testing has been available in all prisons since October 2001.
In January 2001 the Open Society Foundation allocated EEK 549,100 (EUR
35198.7) to the AIDS Information and Support Centre for the implementation of the
HIV prevention programme in prisons. The main aim of the programme was to
prevent transmission of HIV among inmates, provide inmates with information about
the adverse effects of unprotected sex and used needles, to raise the knowledge of
the prisons` medical staff, officers and inmates of drug-related issues. In addition, the
project supported distribution of condoms among prison inmates. Currently needle
exchange projects have not been carried out in Estonian prisons.
Within the framework of the programme total of 660 prison officers and 4000 inmates
were provided with training. 3 medical doctors of the Central Prison participated in the
work of the project.
In addition to the establishment of a surveillance system of HIV infection, similar
system must be set up with respect to hepatitis. Provision of the prison personnel,
especially the medical staff, social workers and psychologists with regular
appropriate training is of utmost importance in terms of ensuring adequate
attendance of the problems of drug use and drug-related infectious diseases in
prisons.

72
PART III DEMAND REDUCTION INTERVENTIONS
12.2 Alternatives to prison for drug dependent offenders
According to the Probation Supervision Act (RT I 1998, 4, 62) in probation
supervision, the behaviour of probationers and their performance of obligations
imposed on them by a court are monitored and probationers are assisted in social
adjustment with a view to deterring them from committing criminal offences.
The Probation and Crime Prevention Divisions in the Ministry of Justice deal with issues
related to the administration of the probation system and co-ordination between probation
departments of courts of the first instance, as well as crime prevention issues. 13
probation supervision departments have been set up in county and city courts all over the
Estonia. Probation officers are appointed to office on the basis of public competitions.
The Act provides strict criteria with respect to the access of an offender to alternative
measures.
According to the study “The Need of Probationers for Social Services and the
Possibilities for Meeting Such Needs” there is an urgent need for the development of
treatment and rehabilitation services for drug addicted persons (the score of the
importance us 6.9 in the 10 point scale system). The need for solving problems with
respect to drug treatment and rehabilitation is very high in Ida- Viru, Järva, Põlva and
Pärnu counties, services for drug addicts are not available in 2 counties. Also, a need
for the development of a drug treatment and rehabilitation system for persons under
probation in all Estonian regions has been identified. Rehabilitation services are in
most cases provided by NGO-s (Ojasoon 2001).
One of the biggest problems in Estonia is repeated crime – in 2001 75% of the
detainees were in prison for the second time or had been in prison several times
already. This explains the difficulty in resocialisation of detainees in the society (The
Yearbook of Prison System 221 / 2002, 221).

73
PART III DEMAND REDUCTION INTERVENTIONS
12. 3 Training and evaluation
In 2001 prison workers were regularly trained in drug-related issues within the
framework of the subproject of the ADAPP “Evaluating the Scope of Drug Use in
Prisons” (Chapter 9.4). The Ministry of Justice organised additional training targeted
at inmates working together with HIV infected inmates. In May 2001 the NGO Social
Rehabilitation Centre carried out a project “Sexual Health Programme”. The main aim
of the programme was to raise the knowledge of inmates on HIV/AIDS and other
STDs and to increase tolerance towards HIV positive inmates. In October 2001 a
training for the medical staff of prisons was carried out in close cooperation with
Swedish partners. The training was organized by Stockholm Kronberg Prison and
implemented by the doctors of Huddinge University Clinic. Four doctors from the
Central Prison participated in those trainings. In 2000 the Ministry of Justice
organized a training for 110 probation officers in the form of a summer school. In
2001 the Ministry of Justice did not organize any special training concerning
probation, however, training courses for total of 95 crime probation officers were
carried out within the framework of a Twinning project between the Netherlands and
Estonia. Probation departments organized courses for 44 probation officers.
Results of the project evaluation were not available in 2001 yet.
74
PART III DEMAND REDUCTION INTERVENTIONS
13. Quality Assurance
The Estonian Drug Monitoring Centre (EDMC) is responsible for the
establishment and maintenance of the drug information network with the aim of
providing the EMCDDA and local policy makers and public organisations with
adequate drug – related information comparable at the European level. The
Minister of Social Affairs has nominated legal correspondents and experts for the
EMCDDA. The following legal correspondents have been appointed: a
correspondent of the European Legal Database on Drugs, a legal correspondent
of the Joint Action on New Synthetic Drugs and experts of four key-indicators:
drug-related death and mortality, drug use in general population, drug-related
infectious diseases and demand for treatment. The legal experts have received
training and are harmonizing the indicators with the European key-indicators
according to the EMCDDA guidelines. Improvements have already been made
with regard to drug-related deaths (Chapter 7.2). In some cases, however,
appropriate information sources are still not available and access to the
necessary data on the national level is extremely limited. Also, problems are
encountered with geographical coverage of the data. In some cases good
databases are available on institutional level but similar data on the national level
does not exist, therefore, comprehensive overview of the situation cannot be
provided. Development of drug information network is still one of the most
important priorities in Estonia. Identification of appropriate data sources to
ensure improvement of the collection of necessary data on key issues on the
national level is the most urgent task to be performed.
75
PART IV KEY ISSUES
PART 4
KEY ISSUES
14. Demand reduction expenditures in 1999
It is very difficult to get a reliable overview of the expenditures for prevention. The
only overview of expenditures on drug demand reduction on the national level has
been made available by the ADAPP governed by the Ministry of Social Affairs. In
1999 the EFPDA was responsible for carrying out prevention activities on the
national level and was allocated total of EEK 1,896,452 (EUR 121,567) for the
organisation of prevention work targeted at youth and children. In 1999 most of the
demand reduction activities carried out by NGOs and other institutions in Estonia
were financed from the state budget and the national government budget.
Finances allocated for demand reduction activities in 2000 were more substantial.
The EFPDA received total of EEK 3,361,755 (EUR 215,497) for prevention activities
from the state budget. EEK 1,400,000 (EUR 89,743) were allocated for the
prevention work targeted at the young population, EEK 1,611,755 (EUR 103,318) for
the prevention work carried out in local governments and EEK 350,000 (EUR 22 435)
for the prevention work in prison. In terms of international projects, information is
available only about one project "Exchanging the Experience and Knowledge in
Substance Abuse Prevention” carried out in 2000 by the EFPDA and supported by
the Nordic Council of Ministers Grant Scheme with the total budget of EUR 25 575.
In 2001 the EFPDA was allocated total of EEK 1,555,000 (EUR 99,679,5) from the
budget of the Alcohol and Drug Abuse Prevention Programme to carry out prevention
projects in Estonia. Also, EFPDA was allocated EEK 199,500 (EUR 12,788,5 ) for
prevention projects to be implemented in Estonian prisons. In 2001 40 % of the total
budget of the EFPDA was used for carrying out projects aimed at the prevention of
drug addiction in Estonia.

76
PART IV KEY ISSUES
15. Drug use among young people aged 12-18
The ESPAD 1999 is the only reliable study, which gives information about drug
use among the age group of 12-18 in Estonia. The sample of the ESPAD
consisted only of the age group of 15-16. In the year 2003 studies on school
children will be carried out, hopefully the studies will give more information about
the prevalence of drug use among children.
At the moment, only the ESPAD 1999 study is available. According to the study,
a higher proportion of students reported recent prevalence of alcohol use in
Estonia in 1999, compared to the average of other ESPAD countries (89% and
83%, respectively). According to the ESPAD survey in 1999 (ESPAD report
2000) the proportion of students who reported lifetime experience of smoking was
slightly higher in Estonia than the average of the European countries (74% and
69%, respectively). The number of students who reported lifetime experience of
illegal drug use had doubled by 1999 compared to the results of the ESPAD
survey 95 (12% and 23%, respectively). The number of students reporting
lifetime experience of ecstasy, amphetamine and cannabis use had also
increased as shown in the table 16.
Table 16. Lifetime prevalence of drug use among students in 1995 and 1999
1995 1999
Amphetamines 0,4% 6,8%
Ecstasy 0,1% 3,0%
Cannabis 7,2% 12,7%
Source: ESPAD Survey 1995 and 1999
Some information with regard to drug use among children is provided in the
UNICEF opinion survey “Young Voices” which gives the opinion of children and
young people. It is a scientific, quantitative opinion survey conducted in 35
countries using the same methodology and questionnaire. Children subject to
interviews were selected according to their age (9-17), gender, geographical
region and area of the country they lived in.

77
PART IV KEY ISSUES
Total of 400 children aged 9-17 were interviewed in Estonia in 2000- 2001. Two
questions of that survey were about illicit drugs, which provided us with some
information about the prevalence of illicit drugs. The answers to the questions
about lifetime experience of drug use and addiction provided by the sample group
about their friends and acquaintances gave an idea of the drug situation among
the school population in Estonia. 76% of the respondents reported that their
friends or acquaintances had tried tobacco, 63% reported lifetime experience of
alcohol use, 14% reported sniffing of harmful substances and 17% reported
lifetime prevalence of the use of illegal substances. The situation was different
concerning children and youngsters. 93% of the youngsters (14-17) and 61% of
the children (9-13) reported having lifetime experience of the use of tobacco. The
same applied to lifetime experience of the use of alcohol and illegal substances:
87% of youngsters and 43% of children had tried alcohol and 35% of youngsters
and 10% of children had tried illegal substances. The question about friends or
acquaintances addicted to harmful substances gave the following results: 39%
reported addiction to tobacco, 10% addiction to alcohol, 3% addiction to sniffing
harmful substances and 4% reported addiction to illegal substances. The share of
youngsters addicted to harmful substances was higher than the share of addicted
children aged 9-13 (Young Voices 2001).
In 2001 a survey on schoolchildren within the framework of the project “Drug
Prevention in Schools of Tallinn” was conducted. The target group was students
of the 5th, 7th and 9th grade and the purpose was to identify the prevalence of drug
use and attitudes towards drugs among schoolchildren. Another purpose was to
analyse the relation between health and environment. This survey was carried
out at the end of 2001 and at the beginning of 2002 thus, the results will be
available in the next report.

78
PART IV KEY ISSUES
16. Social exclusion and re-integration
16.1 Definitions and concepts
Social exclusion is seen as disappearance of social cohesion and it finds
expression in the disability of the population to use available resources and to
adapt to the changes in the society. The consequences of social exclusion
include drastic decrease in the involvement in community activities, disablement,
increase of disappointment in and withdrawal from community life. Social
exclusion and concurrent alienation is caused by the decrease in income, loss of
employment a person’s dissatisfaction with his or her economic and social
situation. Social exclusion as a social problem is characterized by subjective and
objective conditionality. Objective causes may include rapid and multidimensional
changes in the society and changes in the social security system; subjective
causes are related to the difficulties of a human being to adapt to those changes
(Estonian Human Development report 1997).
The relationship between social exclusion and drug use has not been considered
an issue of importance in Estonia. Conferences have been organised and several
discussions conducted on social exclusion, however, they have not been related
to drug use issues.
Theoretically we know that poverty generates social exclusion, which is a
favourable ground for drug addiction on the other hand, drug addiction is one of
the prerequisites for social exclusion. Also, we can assume that this is the case
with respect to heroine users in certain regions. At the same time, another type of
drug use can be identified – recreational drug use in big cities, especially the use
of synthetic drugs. Hence the need for the differentiation of drug addicts and
recreational drug users. Today, recreational users obviously form the largest
group of drug users. They are people who lead a normal everyday life and use
drugs mostly at the weekends or even less frequently. Another important
difference between recreational drug users and addicts is related to the
disapproval of the community. In case of recreational drug users, such weekend
habit is usually unknown to most of the people they communicate with during
weekdays.

79
PART IV KEY ISSUES
Addicts, especially heroin addicts, are not able to hide their drug use for a long
time and thus, become subject to condemnation by the community. They lose
contacts with people who are not drug users and spend most of their time in a
group where drug use is the main activity (Allaste, Lagerspetz 2002).
Some information about the background of drug addicts could be found in two
surveys, one was conducted in Narva in 2000 and the other in Ida-Viru county
and Tallinn in 2002. The survey about drug use and risk behaviour of young non-
Estonians conducted in Narva in 2000 was referred to in the last Estonian
National Report (page 59), the second survey was an ILO (International Labour
Organization) survey on Children and Adolescents Involved in Drug Use and
Drug Trafficking: a Rapid Assessment.
Those surveys are not directly connected with social exclusion and drug use
issues, however, we can draw some conclusions. The factors that might in
certain circumstances cause social exclusion are the following: nationality
(minorities), education (lack of education), poverty and unemployment, which, at
the same time are often related to drug use.
The Narva survey indicates that Russian-speaking population, the minority in
Estonia, especially non-citizens not provided with social benefits, consider
themselves as being in an unfavourable condition with respect to employment. A
number of young people of Narva feel that they are treated unfairly and they have
been deprived of benefits they must be subject to, thus, it has developed
bitterness and disappointment in life, causing, in turn, a considerable amount of
problems. The biggest problem is the increase in the rate of criminal offences. A
number of families live in poverty, i.e. their living standard is under the poverty
limit, and they often choose to solve their problems by means of criminal activities
(Allaste 2000).
ILO survey provides some information about the social background of young drug
users. One important issue is educational background. Truancy and dropping out
of school are just a few examples of the problematic behaviour of the young
people in Estonia. Compared to the Soviet period, when school attendance was
strictly monitored by the state, young people of today enjoy more liberties and
opportunities to stay away from school. Secondary education used to be
compulsory in Estonia, but today, only basic education or school attendance until
the age of 16 has been made compulsory (Narusk 1997).
80
PART IV KEY ISSUES
There are several reasons for truancy and dropping out. Most frequently, it is the
“street children” who tend to drop out. A child can also drop out of school due to
various social and economic problems, which may develop in the family.
Sometimes the unemployment of parents and poor economic situation of the
family make a child give up school and concentrate on earning money. Also, low
salaries of parents may give a child the impression that education acquired at
school does not necessarily guarantee good life. Out of 40 children interviewed
during the above named survey, 16 answered negatively when asked if they
attended school (Kalikova, Kurbatova, Talu 2002).
Children who drop out because they are not willing to study or because of
economic hardship often spend their time in street gangs instead of going to
school. In the streets some of them become drug addicts or thieves or they may
get involved in other types of criminal activity (Tiit & Eglon 2000).
Based on a recent study carried out by the AIDS Prevention Centre, a drug user
is often a 20-25-year-old Russian-speaking male from Ida-Viru county or Tallinn
who has used drugs intravenously for a couple of years. The majority of long-
term addicts never work, they earn their own living by committing crimes. 56% of
the injecting drug users started to inject at the age of 14-20, the most vulnerable
age in terms of drug addiction is 17. Although alcoholism and ethnic aspects are
not interrelated, relevance of the ethnic aspect is obvious with respect to drug
addicts in Estonia. 81,6% of drug addicts admitted to treatment in 2001 were
Russians, Estonians accounted for 12% of treated patients (Chapter 3.1).
According to the data of NGOs 98% of intravenous drug addicts are Russians
(AIDS Prevention Centre). Narcotic drugs are mostly used in big cities, primarily
in Tallinn and in three towns of Ida-Viru county. One 15-16-year-old student out
of four in Kohtla-Järve has reported lifetime experience of illegal drug use. The
same applies to the students in Sillamäe and Narva (Estonian National Human
Development Report 2000). In Estonia socially excluded young people are
exposed to the risk of drug use most of all. For instance, heroin is widely used in
Ida-Viru county where the rate of unemployment is the highest and the standard
of living the lowest (Estonian Statistical Office 2002).
81
PART IV KEY ISSUES
To conclude with, we can state that drug use and social exclusion are most likely
interrelated. Hopefully in the future we can present data on surveys about the
interdependence of drug use from social exclusion in Estonia.
16.2 Drug use patterns and consequences observed among the
socially excluded population
No data available.
16.3 Relationship between social exclusion and drug use
No data available.
16.4 Political issues and reintegration programmes
The Estonian Ministry of Social Affairs is responsible for the social welfare system. The
social security system of Estonia comprises pension insurance, health insurance, family
benefits scheme, unemployment benefits, funeral grant and social benefits for disabled
persons. However, the actual sums of money provided as benefits are insufficient and
have not increased significantly over the years. Therefore, the social security system is
not able to prevent poverty and social exclusion.
Drug-related social reintegration programmes to prevent social exclusion have not
been developed in Estonia. Only general information is available on social exclusion
issues. Vulnerability and low competitiveness on the labour market are most
commonly discussed aspects of social exclusion and drug addiction. On the basis of
the aforementioned the following risk factors can be identified: lack of professional
education or qualification, the status of a non-Estonian not knowing the state
language, youngsters having dropped out of school and/or lost their work.
In the background of the named risk factors and reintegration of socially excluded
persons it should be mentioned that language-study programmes are available for
those not speaking the Estonian language (within the framework of integration
programmes) and efforts have been made for the development of vocational
education.
82
PART IV KEY ISSUES
Implementation of the national programme “Integration in Estonian Society 2000-
2007” continues. The priorities of the programme are linguistic-communicative, legal -
political and socio-economic integration.
In autumn 2001, the second EU PHARE Programme “Social Integration in the
Estonian Society and Language Teaching Programme for non-Estonian-speaking
Population” for the years 2001-2003 was launched. The programme is the
continuation of the first three-year EU PHARE programme of the Estonian language
training, which was successfully completed at the end of 2000. The programme
contributes to the achievement of the medium-term objectives set forth in the
National Integration Programme, focusing specifically on the linguistic-communicative
and social- economic spheres of integration.
In 2002 Norway, Finland, United Kingdom, Sweden and Estonia signed an
agreement “Integrating Estonia 2002-2004” to support the integration-related
activities in Estonia. The project activities are mainly targeted at the younger
generation. The project provides support to the Estonian language training as well as
aims at increasing the number of informal contacts between the Estonian- and
Russian-speaking youth and enhancing the cooperation between the Estonian and
Russian schools. It contributes to the strengthening of the linguistic and professional
competitiveness of non- Estonians on the labour market and in vocational schools,
involves non- Estonians in the Estonian media sector and increases the knowledge
and motivation of non- Estonians in applying for citizenship.
The abovementioned projects as well as other on-going programmes such as
Estonian-Canadian-Finnish joint project “Language Immersion as a Key to
Integration” for the years 2000-2004 and support from the governments of the USA
and the Netherlands are administrated by the Non- Estonian Integration Foundation
(EU Progress Report, June 2002).
Measures and programmes targeted at the development of vocational education and
training reflect the needs of the society. Most of the programmes were not of
preventive character, the activities carried out by NGOs in the form of projects were
mainly interventions targeted at street children, mistreated children and dropouts.
The aim of the projects was to provide rehabilitation to dropouts, school truants,
wayward children, mistreated children and young people as well as the unemployed.

83
PART IV KEY ISSUES
For example, one project implemented by an NGO was targeted at young men aged
17 and over without any vocational education. The aim of the project was to provide
rehabilitation to young men, who were neither employed nor attending any courses,
with the purpose of providing them with vocational skills and working habits, as well
as motivation and perspectives concerning independent working life.
The National Criminal Prevention Programme was initiated by the Ministry of
Education in 1999 and the main aims of the programme were restoration of the
motivation of children for studying and decreasing the cases of truancy and dropouts
by means of improving the connection between school and home.
The Ministry of Education in close cooperation with the Ministry of Social Affairs has
launched a project on the establishment of vocational centres for the young people.
The aim of the project is to monitor the activities of basic school graduates under 17
years of age and improve the vocational skills of the unemployed young people aged
17-25.

84
REFERENCES
REFERENCES
Allaste. A. A & Lagerspetz. M. (2002). Recreational Drug Use in Estonia: the Context
of Club Culture. Contemporary Drug Problems 29/Spring 2002. 183-200.
Annus, T. (2000). The Labour Market and Education as the Basis for Social
Sustainability. Estonian Human Development Report 2001. Open Estonian
Foundation. 2001. 54-59.
Estonian Human Development Report 1997. Open Estonian Foundation. 1997
Estonian Human Development Report 2001. Open Estonian Foundation. 2001
EU Progress Report. June 2002 .
Global E Commerce Report 2002. http://www.transsoferes.com/ger2002/home.sfm
Highlights on Health in Estonia (2001). World Health Organization
Jänes, V. (2001). National Report on Drug situation in Estonia 2001.
Kalikova. N., Kurbatova. A., Talu. A. (2002). Children and Adolescents Involved in
Drug Use and Trafficking: a Rapid Assessment. ILO. 2002.
Narusk. A. (1997). Estonian Report on the Human Dignity and Social Exclusion
Initiative. Council of Europe. Strasbourg. 1997.
Ojasoon. A (2002) The Need of Probationers for Social Services and the Possibilities
for Meeting Such Needs (2001) http://www.just.ee/files/krimh_sotsiaalteenused.pdf
Proos. I. (2000). Social Problem Areas in Estonian Society. Opportunities in Estonian
Society for the Russian-speaking Young People of Ida-Virumaa. Estonian Human
Development Report 2001. Open Estonian Foundation. 2001. 50-53.

85
REFERENCES
Social Sector in Figures 2001(2001). Ministry of Social Affairs of Estonia.
Statistical Yearbook of Estonia 2002. Statistical Office of Estonia. 2002.
The Yearbook of Prison System. 221 / 2002, 22.
Tiit, E-M & Eglon, A. (2000). Children and Education. Children in Estonia. Kutsar.D.
(ed..) pp 19-22 Tallinn: ÜRO (In Estonian)
The 1999 ESPAD Report. The European School Survey Project on Alcohol and
Other Drugs. Pompidou Group. 2000.
The Young Voices. Opinion Survey of Children and Young People in Europe and
Central Asia. Opinions of the Estonian Young People. UNICEF. 2001.
Talu. A., Hammer- Pratka. K. (2002) Ecstasy Use Among Young People in Estonia:
Implications of Harm Reduction. Abstract A816. 2002. Paper approved in the 13th
C o n f e r e n c e o n t h e R e d u c t i o n o f D r u g - r e l a t e d H a r m .
http://www.ihrc2002.net/ABSTRACTS15.HTML
Links
Riigi Teataja (official website of legal acts in Estonian): http://www.riigiteataja.ee .
Estonian Legal Translation Centre (selected legal acts in English):http://www.legaltext.ee .
86
ANNEX
TABLES AND FIGURES
FIGURES
Figure 1. Collaborates of the Estonian Drug Monitoring Centre
Figure 2. Number of direct drug-related deaths with known toxicology, 1997-2001
Figure 3. Number of direct drug-related deaths, 1997-2001
Figure 4. Proportion of drug-related deaths by age groups, 1999- 2001
Figure 5. Number of HIV positive cases in 1996-2001
Figure 6. Number of HIV- positive cases by months in 2001
Figure 7. Incidence rate of tuberculosis per 100,000 inhabitants in 1997-2001
Figure 8. Police registered drug related criminal offences and convicted offenders
1991- 2001.
Figure 9. Number of seizures for main types of drugs, 1995-2001
Figure 10. Number of HIV positive cases of all tests made in prison in 2001
TABLES
Table 1. The use of the appropriations of the ADAPP allocated for the financial year
2001 by EUR
Table 2. Characteristics of treated clients 1999- 2001
Table 3. Number of HIV positive cases by age groups and gender in 2001
Table 4. Number of mental and behavioural disorders caused by the use of
psychoactive substances in 1995-2001
Table 5. Number of mental and behavioural disorders caused by the use of
psychoactive substances in 2001
Table 6. Police registered drug related administrative offences, 1997-2001
Table 7. Police registered drug related criminal offences by types of offences, 2000-
2001
Table 8. Number of definitively sentenced persons by types of drug crimes, 2000-
2001

87
TABLES AND FIGURES
Table 9. Number of drug tests carried out in the Police Forensic Service Centre,
1994-2000
Table 10. The quantity of the main types of drugs seized in 1998-2001
Table 11. Street prices of illegal substances in EUROS in 2000-2001
Table 12. The purity of tested substances (%), 1999-2001
Table 13. Projects implemented in 2001
Table 14. Distribution of roles between different organizations in 2001
Table 15. Lifetime prevalence of drug use among students in 1995 and 1999

88
ANNEX
LIST OF ABSERVATIONS
ADAPP - Alcoholism and Drug Abuse Prevention Programme for 1997-2007
AIDS - Acquired Immunodeficiency Syndrome
APC- AIDS Prevention Centre
CC - Criminal Code
CEEC – Central and Eastern - Europe Countries
EDMC – Estonian Drug Monitoring Centre
EFPDA- Estonian Foundation of Drug Prevention
EHEC - Estonian Health Education Centre
EMCCDA - European Monitoring Centre for Drugs and Drug Addiction
ESPAD - European School Survey Project on Alcohol and Other Drugs
GHB- Gammahydroxybutyrate
GP- General practitioners
HIV- Human Immunodeficiency Virus
IDU - Injecting Drug User
ILO- International Labour Organization
IECM - Institute of Experimental and Clinical Medicine
LSD - Lysergic acid diethyl amide
MCDP - Ministers Committee on Drug Policy
MBD- Mental and behavioural disorders
MDA - 3,4 Methylenedioxyamphetamine
MDEA - 3,4 Methylenedioxythylamphetamine
MDMA- 3, 4 Methylenedioxymethamphetamine
MSB- The Medical Statistics Bureau
NADPP - National Alcoholism and Drug Prevention Programme
NDPSA - Narcotic Drug and Psychotropic Substances Act
NFP - National Focal Point
STD- Sexually transmitted diseases
TB- Tuberculosis
UNDCP - United Nations Drug Control Programme
UNISEF- United Nations Children´s Fund
WHO - World Health Organization