Estonia - https: //rm. coe. int
45
GDP: *ICT calculations are described in the Part 5. ICT and national data collection system and in more details in Annex 5 - IT Calculation methodology Efficiency Information and communication technology Judiciary at glance Estonia Professionals General data Number of judges per 100 000 inhabitants Number of non-judge staff per 100 000 inhabitants Number of lawyers per 100.000 inh. Number of mediators per 100.000 inh. 16,884 € 21,163 € Average annual salary: Population: 1,324,820 17.29 60.54 81.22 NAP 24.48 57.49 121.32 14.33 EU median EU median 2.85 3.73 2.43 2.83 2.02 4.05 1.77 3.57 0 1 2 3 4 5 Judge at the beginning of career Judge on highest instance Prosecutor at the beginning of career Prosecutor at highest instance Gross salaries / average annual gross salary in the country Gross salaries of judges and prosecutors vs average annual salary in the country Estonia EU Median 0 0.5 1 1.5 2 2.5 3 2012 2013 2014 2015 2016 2017 2018 2019 EU median Incoming and resolved cases per 100 inh. Evolution of number of civil and commercial litigious cases Incoming Resolved Pending 31 Dec 17.3 24.5 60.5 57.5 3.50 3.3 0 1 2 3 4 5 0 10 20 30 40 50 60 70 Estonia EU median Non-judge staff per judge per 100 000 inhabitants Professional judges, non-judge staff and their ratio (Q46, Q52) Professional judges Non-judge staff Non-judge staff per judge 147 136 130 92 72 147 0 50 100 150 200 250 300 350 400 Civil and commercial litigious Administrative Disposition time (n days) Disposition time by instance and by matter 1st instance 2nd instance Supreme Court 0.0 0.5 1.0 1.5 2.0 2.5 3.0 3.5 4.0 2014 2015 2016 2017 2018 2019 Evolution of sub-fields of the ICT index* Case management systems Court statistics tools Submit a case electronicaly Monitor stages of judicial proceeding online E-communication courts - lawyers Videoconferencing with users
-
Upload
khangminh22 -
Category
Documents
-
view
2 -
download
0
Transcript of Estonia - https: //rm. coe. int

GDP:
*ICT calculations are described in the Part 5. ICT and national data collection system and in more details in Annex 5 - IT Calculation methodology
Efficiency
Information and communication technology
Judiciary at glance
Estonia
Professionals
General data
Number of judges per 100 000 inhabitants Number of non-judge staff per 100 000 inhabitants Number of lawyers per 100.000 inh. Number of mediators per 100.000 inh.
16,884 €21,163 € Average annual salary:Population: 1,324,820
17.29 60.54 81.22 NAP
24.48 57.49 121.32 14.33EU median EU median
2.85
3.73
2.432.83
2.02
4.05
1.77
3.57
0
1
2
3
4
5
Judge at thebeginning of
career
Judge on highestinstance
Prosecutor atthe beginning of
career
Prosecutor athighest instance
Gros
s sal
arie
s / a
vera
ge a
nnua
l gro
ss sa
lary
in th
e co
untr
y
Gross salaries of judges and prosecutors vs average annual salary in the country
Estonia EU Median
0
0.5
1
1.5
2
2.5
3
2012 2013 2014 2015 2016 2017 2018 2019 EUmedianIn
com
ing
and
reso
lved
cas
es p
er 1
00 in
h.
Evolution of number of civil and commercial litigious cases
Incoming Resolved Pending 31 Dec
17.324.5
60.5 57.5
3.50 3.3
0
1
2
3
4
5
0
10
20
30
40
50
60
70
Estonia EU median
Non
-judg
e st
aff p
er ju
dge
per 1
00 0
00 in
habi
tant
s
Professional judges, non-judge staff and their ratio (Q46, Q52)
Professional judges Non-judge staff Non-judge staff per judge
147 136
13092
72 147
050
100150200250300350400
Civil and commerciallitigious
Administrative
Disp
ositi
on ti
me
(n d
ays)
Disposition time by instance and by matter
1st instance 2nd instance Supreme Court
0.0
0.5
1.0
1.5
2.0
2.5
3.0
3.5
4.0
2014 2015 2016 2017 2018 2019
Evolution of sub-fields of the ICT index*
Case management systems
Court statistics tools
Submit a case electronicaly
Monitor stages of judicial proceedingonlineE-communication courts - lawyers
Videoconferencing with users

2019
2012-2019 2014-2016 2016-2018 2017-2018 2018-2019
Population 1,286,479 1,315,819 1,313,271 1,315,944 1,315,635 1,315,635 1,319,133 1,324,820 3.0% 0.2% 0.3% 0.3% 0.4%
GDP per capita 13,495 € 14,218 € 15,186 € 15,405 € 16,034 € 17,926 € 19,737 € 21,163 € 56.8% 5.6% 23.1% 10.1% 7.2%
Exchange rate (local currency needed to obtain 1€) NAP NAP NAP NAP NAP NAP NAP NAP NAP NAP NAP NAP NAP
Average annual salary 10,644 € 12,060 € 13,752 € 15,612 € 16,884 € 58.6% 14.0% 13.5% 8.1%
169,321,550
Resources 2012 2013 2014 2015 2016 2017 2018 2019 2012-2019 2014-2016 2016-2018 2017-2018 2018-2019
Professional judges per 100 000 inhab. 17.7 17.2 17.6 17.8 17.6 17.3 17.7 17.3 -2.5% 0.3% 0.2% 2.4% -2.1%
Non-judge staff per 100 000 inhab. 74.4 75.2 77.4 73.3 66.7 64.3 62.1 60.5 -18.6% -13.9% -6.9% -3.4% -2.5%
Lawyers per 100 000 inh. 65.8 66.7 71.1 73.7 75.5 77.8 78.9 81.2 23.5% 6.1% 4.6% 1.4% 2.9%
Mediators NAP NAP NAP NAP NAP NAP NAP NAP NAP NAP NAP NAP NAP
Availability of the Case Management System (4 max) 4.0 4.0 4.0 4.0 4.0 0.0% 0.0% 0.0%
Availability of tools for court statistics (4 max) 4.0 4.0 4.0 4.0 4.0 0.0% 0.0% 0.0%
First instance incoming cases per 100 inhab. 2012 2013 2014 2015 2016 2017 2018 2019 2012-2019 2014-2016 2016-2018 2017-2018 2018-2019
Litigious civil (and commercial) cases 1.270 1.349 1.277 1.154 1.247 1.228 1.166 1.396 10.0% -2.4% -6.5% -5.1% 19.8%
Non-litigious civil (and commercial) cases 3.431 3.884 3.568 3.375 3.323 1.066 3.652 3.970 15.7% -6.9% 9.9% 242.7% 8.7%
Non-litigious land registry cases 7.1 7.1 7.4 5.5 8.2 9.2 8.5 8.5 19.7% 9.7% 3.6% -8.4% 0.4%
Non-litigious business registry cases 8.6 6.8 5.5 7.6 11.8 8.6 9.1 8.7 0.5% 112.1% -22.5% 6.1% -5.1%
Administrative law cases 0.222 0.2 0.3 0.256 0.225 0.227 0.188 0.191 -13.8% -22.1% -16.4% -17.2% 1.8%
First instance performance indicators (Clearence
Rate)2012 2013 2014 2015 2016 2017 2018 2019 2012-2019 (in
points)2014-2016 (in
points)2016-2018 (in
points)2017-2018 (in
points)2018-2019 (in
points)
CR litigious civil (and commercial) cases 112% 108% 104% 102% 98% 99% 101% 94% -18.22 -6.68 3.04 1.31 -6.36
CR non-litigious civil (and commercial) cases 104% 100% 92% 104% 101% 100% 96% 101% -3.78 9.05 -5.14 -4.43 4.93
CR non-litigious land registry cases 101% 99% 100% 225% 99% 99% 101% 100% -0.44 -0.73 1.74 2.17 -0.61
CR non-litigious business registry cases 123% 101% 99% 101% 96% 111% 102% 100% -22.49 -3.18 6.35 -8.88 -1.49
CR administrative law cases 106% 91% 90% 105% 106% 99% 100% 94% -11.26 15.26 -5.69 0.60 -5.68
First instance performance indicators (Disposition
Time)2012 2013 2014 2015 2016 2017 2018 2019 2012-2019 2014-2016 2016-2018 2017-2018 2018-2019
DT litigious civil (and commercial) cases (days) 167 130 125 136 139 140 143 147 -11.9% 11.4% 2.8% 1.9% 2.7%
DT non-litigious civil (and commercial) cases (days) 91 84 78 61 61 51 90 83 -9.0% -21.9% 47.9% 77.5% -8.1%
DT non-litigious land registry cases (days) 12 15 14 39 13 14 12 14 19.6% -10.4% -5.8% -17.8% 18.4%
DT non-litigious business registry cases (days) 32 7 5 11 42 14 7 6 -82.3% 704.7% -83.3% -49.9% -19.6%
DT administrative law cases (days) 108 139 141 117 108 108 119 136 26.2% -23.9% 10.5% 9.8% 14.4%
First instance pending cases per 100 inhab. on 31 dec. 2012 2013 2014 2015 2016 2017 2018 2019 2012-2019 2014-2016 2016-2018 2017-2018 2018-2019
Litigious civil (and commercial) cases 0.65 0.52 0.46 0.44 0.46 0.47 0.46 0.53 -18.8% 1.8% -0.9% -2.0% 15.2%
Non-litigious civil (and commercial) cases 0.89 0.89 0.70 0.59 0.56 0.15 0.86 0.90 1.5% -20.1% 54.2% 481.5% 5.1%
Non-litigious land registry cases 0.23 0.29 0.29 1.34 0.28 0.36 0.28 0.33 42.6% -2.4% -0.6% -23.0% 18.1%
Non-litigious business registry cases 0.92 0.12 0.08 0.23 1.30 0.37 0.18 0.13 -85.4% 1552.1% -86.2% -51.1% -24.8%
Administrative law cases 0.07 0.08 0.10 0.09 0.07 0.07 0.06 0.07 -2.9% -30.7% -12.6% -8.5% 9.8%
Second instance performance indicators (Clearence
Rate)2012 2013 2014 2015 2016 2017 2018 2019 (in points) (in points) (in points) (in points) (in points)
CR litigious civil (and commercial) cases 100% 91% 107% 100% 106% 97% 97% 97% -2.50 -1.04 -8.84 0.43 0.14
CR administrative law cases 93% 107% 100% 95% 106% 108% 111% 103% 9.15 5.92 5.29 3.13 -8.37
Second instance performance indicators (Disposition
Time)2012 2013 2014 2015 2016 2017 2018 2019 2012-2019 2014-2016 2016-2018 2017-2018 2018-2019
DT litigious civil (and commercial) cases (days) 107 136 100 113 95 111 119 130 21.2% -4.5% 25.4% 7.0% 9.2%
DT administrative law cases (days) 199 176 143 154 130 102 81 92 -53.9% -8.8% -37.6% -20.2% 13.0%
Supreme Court performance indicators (Clearence
Rate)2012 2013 2014 2015 2016 2017 2018 2019 2012-2019 (in
points)2014-2016 (in
points)2016-2018 (in
points)2017-2018 (in
points)2018-2019 (in
points)
CR litigious civil (and commercial) cases 102% - 98% 105% 93% 107% 98% 101% -1.47 -4.42 4.62 -8.49 2.61
CR administrative law cases 84% - 110% 95% 96% 110% 95% 117% 32.70 -13.96 -1.04 -15.39 22.14
Supreme courtperformance indicators (Disposition
Time)2012 2013 2014 2015 2016 2017 2018 2019 2012-2019 2014-2016 2016-2018 2017-2018 2018-2019
DT litigious civil (and commercial) cases (days) 70 - 114 88 132 85 66 72 3.2% 15.6% -49.9% -22.1% 9.9%
DT administrative law cases (days) 154 - 126 162 173 150 207 147 -4.4% 37.3% 19.3% 37.4% -28.9%
EstoniaVariations 2012-2019
201920182017
Synthesis table of main indicators for:
2012Economic and demographic data 2016201520142013
Page 1 / 1

1. Presentation of the functioning of the judicial system in Estonia
Number of courts
(geographic locations)
First instance general
jurisdiction(legal entities)
First instance specialised jurisdiction
(legal entities)2012 22 4 22013 22 4 22014 22 4 22015 22 4 22016 21 4 22017 22 4 22018 21 4 22019 21 4 2
Estonia has 17 courthouses of county courts (first instance courts), 4 courthouses of administrative courts (first instance courts), 2 courthouses of appellate courts (second instance courts) and 1 courthouse of the Supreme Court (highest instance court), all together 24 courthouses. However, as some of the courts are situated in the same house (e.g Tallinn Administrative Court and Tallinn Circuit Court) and taking into account the fact that Pärnu County Court has a courthouse that is divided between two locations, there are 21 actual geographical locations of Estonian courts. A small courthouse was adjoined with another small courthouse. The distance between them was less than 50 km.
0
5
10
15
20
25
2012 2013 2014 2015 2016 2017 2018 2019
Number of courts(geographic locations)
First instance general jurisdiction(legal entities)
First instance specialisedjurisdiction(legal entities)

First instance general courts4 67%First instance specialised courts2 33%Total 6 100%
Specialised courtsTotal 2
Commercial courts (excluded insolvency courts) NAP
Insolvency courts NAPLabour courts NAPFamily courts NAPRent and tenancies courts NAPEnforcement of criminal sanctions courts NAP
Fight against terrorism, organised crime and corruptionNAPInternet related disputes NAPAdministrative courts 2Insurance and / or social welfare courts NAPMilitary courts NAPOther specialised 1st instance courts NAP
[Comment QALL 043] In Estonia, there are no specialized first instance courts, other than administrative courts. All the cases are dealt with by ordinary courts of first instance. The two administrative courts of first instance are situated in Tallinn and Tartu. Nevertheless, for guaranteeing wider access to justice, these two courts have several court buildings in other cities, namely in Pärnu and Jõhvi, where judges and their supporting legal staff work.
67%
33%
Percentage of first instance specialised courts
First instance general courts
First instance specialised courts
2. Resources of justice and courts framework in Estonia
● Budget allocated to the whole justice system (Q15-1):
This budget includes the following budgetary elements:
◦ Court budget ◦ Legal aid budget ◦ Public prosecution services budget ◦ Prison system ◦ Probation services ◦ Council of the judiciary ◦ Constitutionnal court◦ Judicial management body◦ State advocacy◦ Enforcement services◦ Notariat◦ Forensic services ◦ Judicial protection of juveniles◦ Functioning of the Ministry of Justice ◦ Refugees and asylum seekers service◦ Immigration services◦ Some police services◦ Other services
● Human resources
Judges
Evolution of the number of professional judges since 2012 (Q46)
Year Absolute numberPer 100 000 inhabitants
Male Female
2012 228 17.72 36.4% 63.6%2013 226 17.18 36.7% 63.3%2014 231 17.59 37.2% 62.8%2015 234 17.78 36.8% 63.2%2016 232 17.63 36.6% 63.4%2017 227 17.25 36.6% 63.4%2018 233 17.66 37.3% 62.7%2019 229 17.29 37.6% 62.4%
Implemented: Approved
According to 2019 data, the total number of professional judges sitting in courts (all instances) in Estonia is 229 which is 1,7% less than in previous cycle.
More precisely, in Estonia, in 2019 there are 17,3 professional judges per 100 000 inhabitants (this figure is below the EU median of 24,5 judges per 100 000 inhabitants) and about 3,5 non-judge staff per judge (in previous cycle this ratio was at 3,5 non-judge staff per judge).
169,321,550 € 157,473,650 €
17.72 17.18 17.59 17.78 17.63 17.25 17.66 17.29
0.002.004.006.008.00
10.0012.0014.0016.0018.0020.00
2012 2013 2014 2015 2016 2017 2018 2019
Evolution of the number of professional judges since 2012 (Q46)

Absolute number of professional judges by instance and gender
2019
Total number of
professional judges
Male Female
1st instance courts 164 49 115
2nd instance courts 46 22 24
Supreme courts 19 15 4
Total 229 86 143
Distribution of professional judges by instance and gender
2019
Total number of
professional judges
Male Female
1st instance courts 71.6% 29.9% 70.1%
2nd instance courts 20.1% 47.8% 52.2%
Supreme courts 8.3% 78.9% 21.1%
EU Median 72.62% 23.95% 4.04%
In Estonia, training of judges requirements are broken down as follows:Compulsory Optional
◦ Initial training: ◦ General in-service training: ◦ In-service training for specialised judicial functions: ◦ In-service training for management functions of the court: ◦ In-service training for the use of computer facilities in courts:
Number of training courses orgnised are:
1. Only for judges2. Only for prosecutors3. Only for other non-judge staff4. Only for other non-prosecutor staff5. Other common training
It should be noted that many courses are available online, but there's no separate data.
Number of training courses in days
organised, without e-learning
Online training courses available
during the reference year (e-learning)
Total NA68
NA0
6210NANA
As regards the distribution male/female, it should be noticed that the number of female judges is higher than the number of male judges. However, the higher is the level of the court, the lower is the number of women working as professional judges.
The total number of judges is distributed among the different judicial instances in the following way: 164 are sitting in first instance courts (among which 115 are female); 46 are sitting in second instance courts (among which 24 are female) and 19 are sitting in Supreme Court (among which 4 are female).
11
NANA
The total number of female professional judges (all instances), in this cycle is 143 which represents 62,4% of the total number of judges.
29.9%47.8%
78.9%
70.1%52.2%
21.1%
0%
20%
40%
60%
80%
100%
1st instance courts2nd instance courtsSupreme courts
Professional judges by gender per instance
Female
Male
71.6%
20.1%8.3%
72.62%
23.95%
4.04%0%
20%
40%
60%
80%
100%
1st instance courts 2nd instance courts Supreme courts
Distribution of professional judges per instance
Estonia EU Median

Non-judge staff
Year Total Rechtspfleger
Non-judge staff
assisting the judge
Staff in charge of
administrative tasks
Technical staff Other
2012 957 63 220 489 138 47
2013 990 54 239 501 149 47
2014 1,017 51 684 78 161 43
2015 965 71 652 87 111 44
2016 877 51 615 82 88 41
2017 846 51 596 80 81 38
2018 819 51 583 77 73 35
2019 802 51 569 79 72 31
In this cycle, the non-judge staff is broken down as follows:
◦ 79 staff in charge of different administrative tasks and of the court management (among which 58 are women);◦ 72 technical staff (among which 21 are women);◦ 31 other (among which 29 are women);
Regarding number of courts staff, it is also interesting to mention that a pilot project has been introduced in 2013 in one county court consisting in providing each judge with a personal legal assistant. After the first year of the pilot project, the average proceeding times in civil cases in that particular court dropped from 201 days to 160 days; after the second year the average proceeding times dropped further to 132 days. In 2015, the project has been extended to all first and second instance courts.
In Estonia, in this cycle there are 802 non-judge staff (among which 680 females). Comparisson with previous cycle reveals a decrease of 2,1%.
During the same period, the number of judges per 100 000 inhabitants decreases from 17,7 judges per 100 000 inhabitants in 2018 to 17,3 in 2019.
◦ 51 Rechtspfleger (or similar bodies) with judicial or quasi-judicial tasks having autonomous competence and whose decisions could be subject to appeal (among which 46 are women);◦ 569 non-judge staff whose task is to assist the judges such as registrars (among which 526 are women);
In the light of the data relevant for the judges, it is possible to notice that in 2019 the number of non-judge staff per 100 000 inhabitants has decreased (from 62,1 in 2018 to 60,5 in 2019).
The differences in figures in the sub-categories between 2010 and the following years are due to the different categorisation of court staff.It should be also noted that court interpreters are in the category "other non-judge staff".
6.4%
70.9%
9.9%
9.0%
3.9%
Non-judge staff
Rechtspfleger
Non-judge staff assisting the judge
Staff in charge of administrative tasks
Technical staff
Other
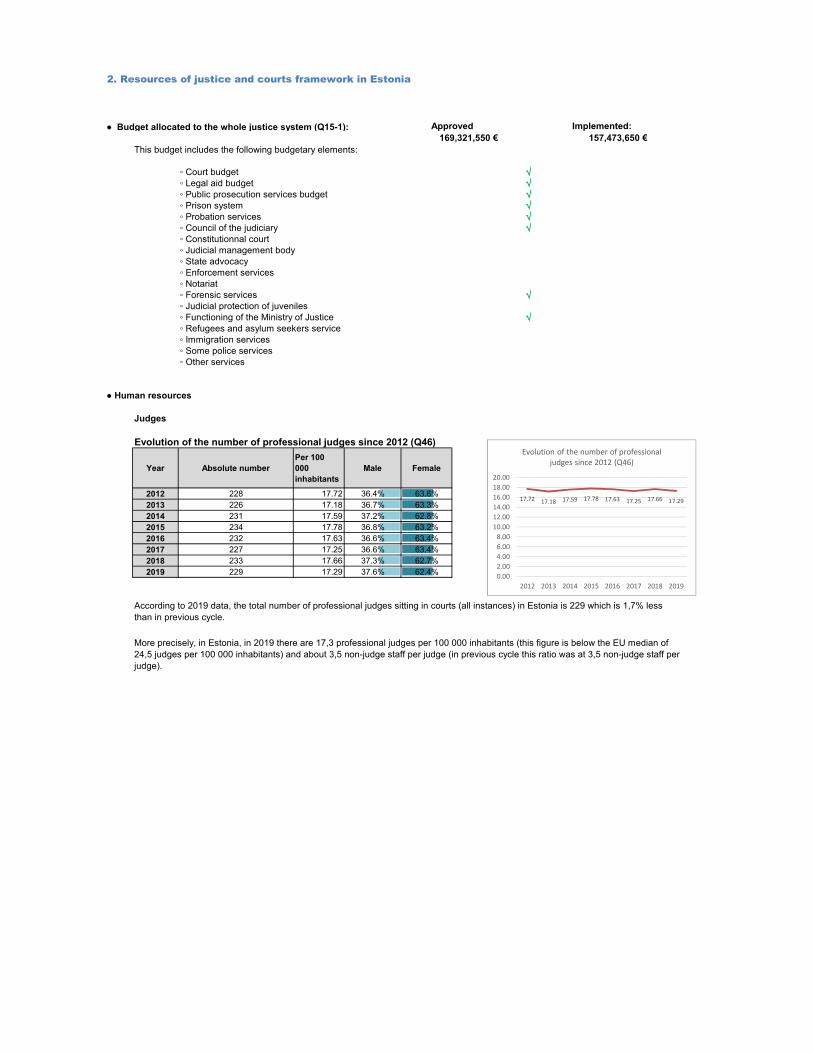
Professional judges, non-judge staff and their ratio (Q46, Q52)
Estonia EU median
Professional judges 17.3 24.5
Non-judge staff 60.5 57.5
Non-judge staff per judge 3.50 3.3
Evolution of the ratio between professional judges and non-judge staff (Q46, Q52)
Ratio2012 4.20
2013 4.38
2014 4.40
2015 4.12
2016 3.78
2017 3.73
2018 3.52
2019 3.50EU median 2019 3.32
Average gross annual
salary in €
Average net annual
salary in €
Ratio with the annual
gross salary EU Median Salaries of judges and prosecutors in
First instance professional judge at the beginning of his/her career
48,112 € 37,104 € 2.85 2.02
at the beginning of a career
48112
Judge of the Supreme Court or the Highest Appellate Court
62,916 € 48,520 € 3.73 4.05at the highest instance
62916
Public prosecutor at the beginning of his/her career 40,968 € 31,584 € 2.43 1.77
at the beginning of a career
40968
Public prosecutor of the Supreme Court or the Highest Appellate Instance
47,786 € 36,852 € 2.83 3.57
at the highest instance
47786
Judge
Since 2010 the salary of prosecutors depends of the salary of the President and is indexed by 1 April of each calendar year. In 2018 the salary system of public prosecutors changed and with that the smallest salaries increased the most.
Prosecutor
Salaries of professional judges and prosecutors at beginning of a career and at the highest instance (Q132, Q4)
4.20 4.38 4.40 4.123.78 3.73 3.52 3.50 3.32
00.5
11.5
22.5
33.5
44.5
5
2012 2013 2014 2015 2016 2017 2018 2019 EUmedian
2019
Evolution of the ratio between professional judges and non-judge staff per instance (Q46, Q52)
2.85
3.73
2.432.83
2.02
4.05
1.77
3.57
0
1
2
3
4
5
Judge at thebeginning of
career
Judge onhighestinstance
Prosecutor atthe beginning
of career
Prosecutor athighestinstance
Gro
ss s
alar
ies
/ av
erag
e an
nual
gro
ss s
alar
y in
the
coun
try
Gross salaries of judges and prosecutors vs average annual salary in the country
Estonia EU Median
17.324.5
60.5 57.5
3.50 3.3
0
1
2
3
4
5
0
10
20
30
40
50
60
70
Estonia EU median
Non
-judg
e st
aff p
er ju
dge
per 1
00 0
00 in
habi
tant
s
Professional judges, non-judge staff and their ratio (Q46, Q52)
Professional judges Non-judge staff Non-judge staff per judge
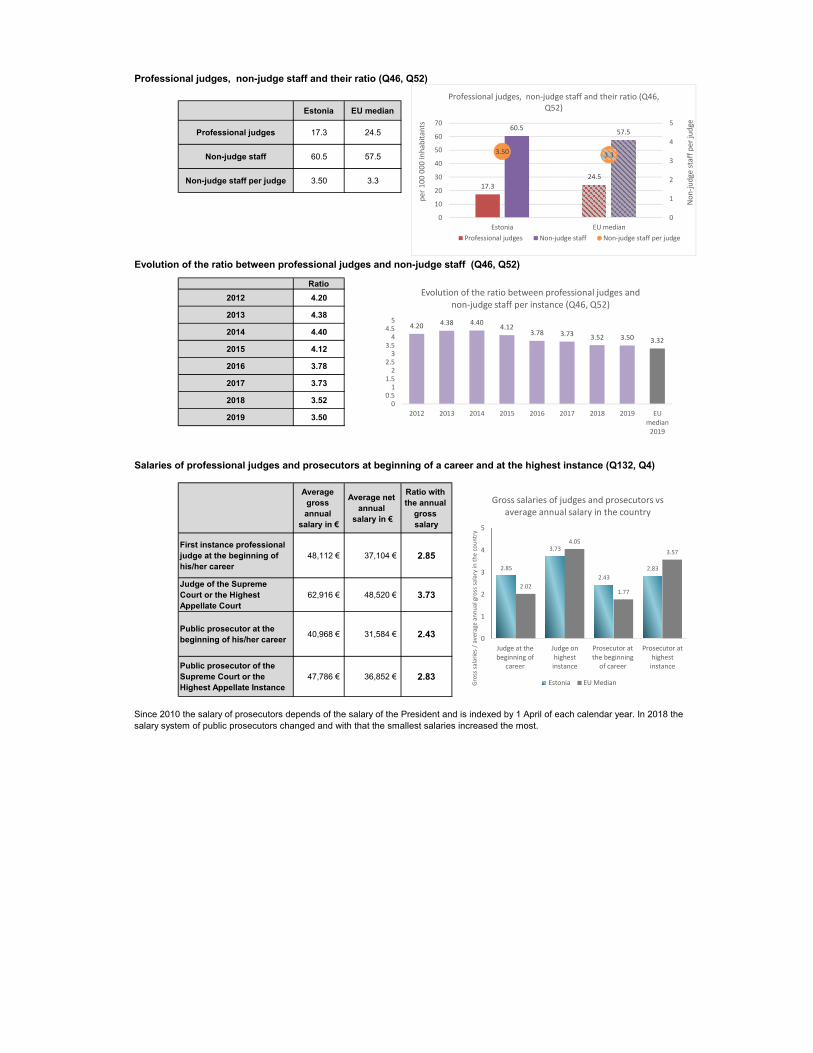
Number of Lawyers
Year Absolute number
Per 100 000 inhabitants
2012 846 65.76
2013 878 66.73
2014 934 71.12
2015 970 73.71
2016 993 75.48
2017 1,024 77.83
2018 1,041 78.92
2019 1,076 81.22
EU median 2019 121.32
In 2019, there are 1 076 lawyers, which is 3,4% more than in 2018.
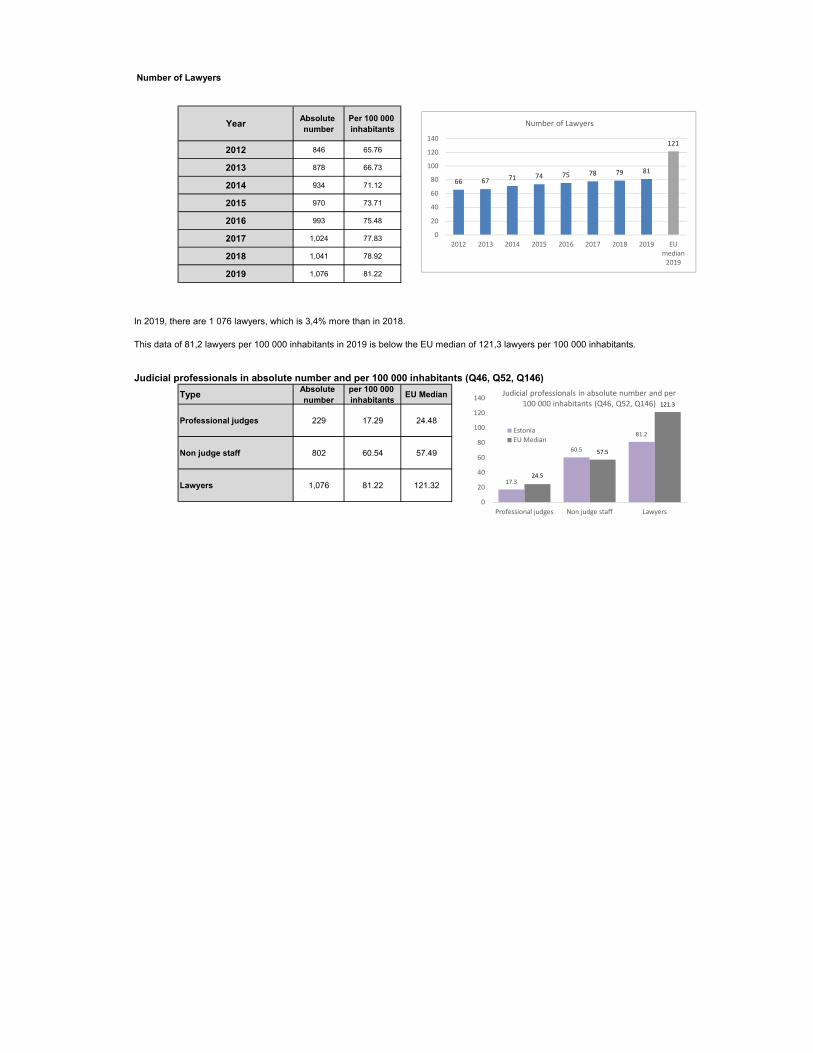
Judicial professionals in absolute number and per 100 000 inhabitants (Q46, Q52, Q146)Type Absolute
numberper 100 000 inhabitants EU Median
Professional judges 229 17.29 24.48
Non judge staff 802 60.54 57.49
Lawyers 1,076 81.22 121.32
This data of 81,2 lawyers per 100 000 inhabitants in 2019 is below the EU median of 121,3 lawyers per 100 000 inhabitants.
17.3
60.5
81.2
24.5
57.5
121.3
0
20
40
60
80
100
120
140
Professional judges Non judge staff Lawyers
Judicial professionals in absolute number and per 100 000 inhabitants (Q46, Q52, Q146)
EstoniaEU Median
66 67 71 74 75 78 79 81
121
0
20
40
60
80
100
120
140
2012 2013 2014 2015 2016 2017 2018 2019 EUmedian
2019
Number of Lawyers

3. Access to justice
◦ Legal aid
The total annual implemented public budget to legal aid is 3 603 944 € (2,7 € per capita).
In Estonia, legal aid is avaiable for :Criminal cases Other than criminal cases
◦ Representation in court: ◦ Legal advice, ADR and other legal services:
In criminal cases:
Accused individuals are not free to chose their lawyers in the frame of legal aid system
Victims are not free to chose their lawyers in the frame of legal aid system
◦ Court fees
Litigants have to pay taxes to start a proceeding in other than criminal matters.
Amount of court fees to commence an action for 3000€ debt recovery is 275€
The total annual approved public budget to legal aid is 3 603 944 € (3603 944 € per capita).
The distribution of the total annual approved public budget allocated to legal aid cannot be carried out in respect of criminal and other than criminal cases, as well as cases brought to court and cases not brought to court.
Based on an agreement of the advocate providing state legal aid and the receiver of such aid, it is possible for another advocate to start providing legal aid to the person in the same matter if the new advocate agrees with the transfer of obligation to provide state legal aid to the person. It is therefore possible to replace advocates based on an agreement of the receiver of legal aid, the current legal counsellor and the new advocate. If this trilateral agreement has been reached an application for the replacement of advocates should be submitted to the court, the prosecutor’s office or the investigative body.A recipient of state legal aid has the right to apply for the appointment of a new provider of state legal aid upon exclusion of the current advocate providing state legal aid from the Bar Association or their disbarment or upon suspension of the professional activities or long-term incapacity for work or the death of an advocate, and in other cases provided by law.A recipient of state legal aid is also legally entitled to apply for the court to remove an advocate from the provision of state legal aid by a ruling if the advocate has demonstrated incompetence or negligence.
Legal aid cannot be granted for fees related to the enforcement of judicial decisions (except for representing a person in enforcement proceedings), but procedural assistance can be granted to release a person from all or a part of the expenses related to enforcement proceedings.
Partial or full coverage of the costs related to the enforcement of judicial decisions (incl. fees of an enforcement agent) depends on the financial situation of the claimant. The advance payment of enforcement costs shall not be demanded by the bailiff from the claimant who is a natural person and who has received legal aid for the payment of procedural costs (incl court fees) as well as in case of collection of compensation for damage caused by a criminal offence as well as in case of collection of maintenance support.
◦ for fees related to enforcement of judicial decisions as fees for enforcement agents. (Q18):
◦ Other costs than above. (Q19):

3. Efficiency and quality of the judicial system
◦ Clearance Rate (CR) and Disposition Time (DT)
First instance cases◦ Total other than criminal cases
Incoming Resolved Pending 31 Dec20.62225656 22.98319677 2.763978269
NA NA18.1172812 17.78589491 1.61824939417.95137179 25.07013976 2.67701361224.71407343 24.15236749 2.66624101720.34781683 21.16894123 1.41042158322.5773292 22.69452739 1.83643347622.70210293 22.71334974 1.961775939
7.22 7.27 2.84
Other than criminal cases CR (%) DT (days)
2012 111.4% 442013 NA NA2014 98.2% 332015 139.7% 392016 97.7% 402017 104.0% 242018 100.5% 30
2019 100.0% 32EU median
● Court performance
The number of incoming cases in 2019 in Estonia (22,70 per 100 inhabitants) is well above the EU median (7,22 per 100 inhabitants);as for the number of resolved cases, which is 22,71 per 100 inhabitants compared to the EU median of 7,27 per 100 inhabitants.
However, the number of pending cases at the end of 2019 in Estonia (1,96 per 100 inhabitants) is below the EU median (2,84 per 100 inhabitants).
The Clearance Rate shows the capacity of a judicial system to deal with the incoming cases. A Clearance Rate of 100% and higher does not generate backlog.
The Disposition Time determines the maximum estimated number of days necessary for a pending case to be solved in a court.
With a Clearance Rate calculated at 100,0% in 2019 Estonia seems to be able to deal with its other than criminal cases.
Between 2018 and 2019, the Clearance Rate has decreased by 0,5% points.
In 2019, other than criminal cases are solved in approximately 32 days, which is significantly below the EU median of 111 days.
Analysis of the 2018 - 2019 period reveals a 6,7% increase of the Disposition Time.
Moreover, differences in the horizontal consistency may be explained by the fact that during the proceedings some cases are joined and some are disjoined.
It is noteworthy that the discrepancies that can be observed between the number of pending cases indicated for December of one year and the number of pending cases communicated for January of the next year, are due to the fact that the statistic system is alive and courts are entitled to modify and up-date data at any time.
111%98%
140%
98% 104% 101% 100%
0%
20%
40%
60%
80%
100%
120%
140%
160%
2012 2013 2014 2015 2016 2017 2018 2019
CR (%)44
3339 40
2430 32
05
101520253035404550
2012 2013 2014 2015 2016 2017 2018 2019
DT (days)
0
5
10
15
20
25
30
2012 2013 2014 2015 2016 2017 2018 2019 EUmedianIn
com
ing
and
reso
lved
cas
es p
er 1
00 in
h.
Evolution of number of all other than criminal cases
Incoming Resolved Pending 31 Dec

◦ Civil (and commercial) litigious cases
1.269822516 1.427928478 0.6524008551.348589738 1.451263434 0.5177003831.277344889 1.331484515 0.4561891641.154228447 1.178165636 0.4382405331.247154416 1.216674838 0.4644145221.228228194 1.219411159 0.4693551021.166068926 1.172967396 0.4600749131.396491599 1.315876874 0.529958787
1.92 1.73 1.10
Civil (and commercial)
litigious casesCR (%) DT (days)
2012 112.5% 1672013 107.6% 1302014 104.2% 1252015 102.1% 1362016 97.6% 1392017 99.3% 1402018 100.6% 1432019 94.2% 147
EU median
Between 2018 and 2019, the Clearance Rate has decreased by 6,4 points.
In 2019, the civil and commercial litigious cases are solved in approximately 147 days, which is below EU median of 213 days.
Analysis of the 2018 - 2019 period reveals a 2,7% increase of the Disposition Time.In Estonia, there are 359 civil and commercial litigious cases older than 2 years. This is 5,1% of the total number of pending cases at the end of the year.
The number of incoming cases in 2019 in Estonia (1,40 per 100 inhabitants) is below the EU median (1,92 per 100 inhabitants); as for the number of resolved cases, which is 1,32 per 100 inhabitants compared to the EU median of 1,73 per 100 inhabitants.Moreover, the number of pending cases at the end of 2019 in Estonia (0,53 per 100 inhabitants) is significantly below the EU median (1,10 per 100 inhabitants).
With a Clearance Rate calculated at 94,2% in 2019, Estonia seems to face some difficulties in dealing with its civil and commercial litigious cases.
112%
108%
104%102%
98%99% 101%
94%
85%
90%
95%
100%
105%
110%
115%
2012 2013 2014 2015 2016 2017 2018 2019
CR (%)167
130 125136 139 140 143 147
0
20
40
60
80
100
120
140
160
180
2012 2013 2014 2015 2016 2017 2018 2019
DT (days)
0
1
2
3
2012 2013 2014 2015 2016 2017 2018 2019 EUmedianIn
com
ing
and
reso
lved
cas
es p
er 1
00 in
h.
Evolution of number of civil and commercial litigious cases
Incoming Resolved Pending 31 Dec

◦ Administrative cases
The number of incoming cases in 2019 in Estonia (0,19 per 100 inhabitants) is below the EU median (0,25 per 100 inhabitants).
Moreover, the number of resolved cases in 2019 in Estonia (0,18 per 100 inhabitants) is also below the EU median (0,31 per 100 inhabitants).
Administrative cases CR (%) DT (days)
2012 105.5% 108
2013 90.9% 139
2014 90.4% 141
2015 104.5% 117
2016 105.6% 108
2017 99.4% 108
2018 100.0% 119
2019 94.3% 136
◦ Insolvency
Insolvency cases CR (%) DT (days)
2012
2013 98.5% 69
2014 96.9% 73
2015 100.1% 67
2016 101.5% 61
2017 97.5% 67
2018 94.9% 63
2019 98.7% 96
With a Clearance Rate calculated at 94,3% in 2019, Estonia seems to face some difficulties in dealing with its administrative cases.
Between 2018 and 2019, the Clearance Rate has decreased by 5,7 points.
Finally, the number of pending cases at the end of 2019 in Estonia (0,07 per 100 inhabitants) is significantly below EU median (0,19 per 100 inhabitants).
In 2019, insolvency cases are solved in approximately 96 days,which is significantly below the EU median of 258 days.
In 2019, the administrative cases are solved in approximately 136 days, which is significantly below EU median of 284 days.
Analysis of the 2018 - 2019 period reveals a 14,4% increase of the Disposition Time.
In Estonia, there are 30 administrative law cases older than 2 years. This is 3,4% of the total number of pending cases at the end of the year.
The Clearance Rate was calculated at 98,7% in 2019 for insolvency cases, Estonia seems to face some difficulties in dealing with its insolvency cases.
Between 2018 and 2019, the Clearance Rate has increased by 3,8 points.
Analysis of the 2018 - 2019 period reveals a 52,2% increase of the Disposition Time.
98%
97%
100%102%
97%
95%
99%
90%
92%
94%
96%
98%
100%
102%
104%
2013 2014 2015 2016 2017 2018 2019
CR (%)
6973
6761
67 63
96
0
20
40
60
80
100
120
2013 2014 2015 2016 2017 2018 2019
DT (days)
106%
91% 90%
105% 106%
99% 100%
94%
80%
85%
90%
95%
100%
105%
110%
2012 2013 2014 2015 2016 2017 2018 2019
CR (%)
108
139 141
117108 108
119
136
0
20
40
60
80
100
120
140
160
2012 2013 2014 2015 2016 2017 2018 2019
DT (days)

Overall efficiency by instance and by case matterCR (%) DT (days)
1st instance 2nd instance Supreme Court 1st instance 2nd instance Supreme Court
94% 97% 101% 147 130 72 94% 103% 117% 136 92 147
As regards overall efficiency in Estonia, it should be noted that all DT levels are well below EU median values. In respect of civil and commercial litigious cases, first instance courts seem to be the less efficient instance, while the Supreme court appears as the fastest instance. As regards administrative cases, the second instance seem to be the fastest, while the highest instance seems to face some difficulties when it comes to the efficiency. Total DT is at similar level for these two groups of cases, with different distribution of time in second and third instances. Civil and commercial litigious cases require more time to be resolved in the second instance, while administrative cases have the longest duration in the third instance.
Civil and commercial litigious
Administrative
CR (%) DT (days)
147 136
130 92
72 147
- 50
100 150 200 250 300 350 400
Civil and commercial litigious Administrative
Disp
ositi
on ti
me
(n d
ays)
Disposition time by instance and by matter
1st instance 2nd instance Supreme Court

Ordered by the court, the judge, the public prosecutor or a public authority in the course of a judicial proceeding
In 2019, individual courts are required to prepare an annual activity report.
◦ The reporting is more frequent than annual
A regular monitoring system of court activities is in place concerning:
number of incoming caseslength of proceedings (timeframes)number of resolved casesnumber of pending casesbacklogsproductivity of judges and court staffsatisfaction of court staffsatisfaction of users (regarding the services delivered by the courts)number of appealsappeal ratioclearance ratedisposition timeother (please specify):
In Estonia, there is a system to evaluate regularly the activity of each court.◦ The reporting is more frequent than annual
number of incoming caseslength of proceedings (timeframes)number of resolved casesnumber of pending casesbacklogsproductivity of judges and court staffsatisfaction of court staffsatisfaction of users (regarding the services delivered by the courts)clearance ratedisposition time
● Systems for measuring and evaluating the court performance
It is done Quarterly.
The scope of the monitoring system is extended to the results of proceedings; the categories of cases; the number of decisions appealed and revoked, fully or partially. The waiting time and the 'age' of pending (not solved) cases are also monitored. It is worthy of mention that every year all the courts and the Ministry of Justice enter into an agreement according to which courts should aim to carry out structural changes and to make changes in case-flow management that will ultimately ensure efficient proceedings. The content of the agreement has changed since 2017. The goals are more general and the same for all the courts (except The Supreme Court).
●Alternative dispute resolutions
The court related mediation system in Estonia provides mandatory court related mediation.
The judicial system in Estonia provides court related mediation.
It is done four times a year.A system to evaluate regurlarly the activity of each court (in terms of performance and output) exists and performance and quality indicators are defined at the court level.
The evaluation of the court activity is not used for the later allocation of means in this court.
Estonia has developed a quality system consisting of 3 parts. The first part contains the quality standards (good practice) for the management of the court that describe activities related to the chairman of the court. The second part contains the quality standards for the administration of courts and is focused on the different roles of the parties involved in the administration of courts: directors, Ministry of Justice, Council for the Administration of Courts. The third part contains quality standards for the court proceedings and is addressed to all the judges. All of the three parts of the quality standards have been discussed and approved by the Council for Administration of Courts, respectively in 2012, 2013 and 2015.

5. ICT and national data collection system
points (up to 4)3.5
Case management systems 4.0
Tools of producing courts activity statistics 3.04.0
Possibility to submit a case by electronic means 4.0 Possibility to monitor the stages of an online judicial proceeding 4.0
Electronic communication between courts and lawyers 4.0 Videoconferencing with users 4.0
◦ Administration and management ;
◦ Communication between court and users.
The calculation of this index for each field is an average of the values of the sub-fields included. The calculation of the sub-field depends on each question and the combination of different modalities of the answers.
The details of the calculation are given in Annex 5 - IT calculations
Note; Index is modified each cycle depending on the new modalities included in the questionnaire that show more precise details on the ICT situation that can make the index drop even if there is no real change.
●The ICT tools of courts and for court users
The result by area may be summarized in these graphics, where each field has been evaluated from 0 to 4 points.
The use of ICT in courts had been evaluated in 2 fields and 5 sub-fields within those fields in :2019 (graphics below):
4.00 4.00 4.00 4.00
3.50 3.50
4.00 4.00 4.00 4.00
3.75
4.00
3.2
3.3
3.4
3.5
3.6
3.7
3.8
3.9
4.0
2014 2015 2016 2017 2018 2019
Evolution of fields of the ICT index*
Administration and management of courts
Communication between courts and users
0.0
0.5
1.0
1.5
2.0
2.5
3.0
3.5
4.0
2014 2015 2016 2017 2018 2019
Evolution of sub-fields of the ICT index*
Case management systems
Court statistics tools
Submit a case electronicaly
Monitor stages of judicialproceeding onlineE-communication courts -lawyersVideoconferencing with users

Statistical data
◦ Only internaly (on intranet)
In Estonia, there is a centralised institution that is responsible for collecting statistical data regarding the functioning of the courts and judiciary.The Ministry of Justice collects statistical data on 1st and 2nd instance courts, while the Supreme Court collects data on the Supreme Court.
These reports are distributed:
This institution publish statistics of each court on internet.
Individual courts are required to prepare an activity report.
2012-2019
2012-2013
2013-2014
2014-2015
2015-2016
2016-2017
2017-2018
2018-2019
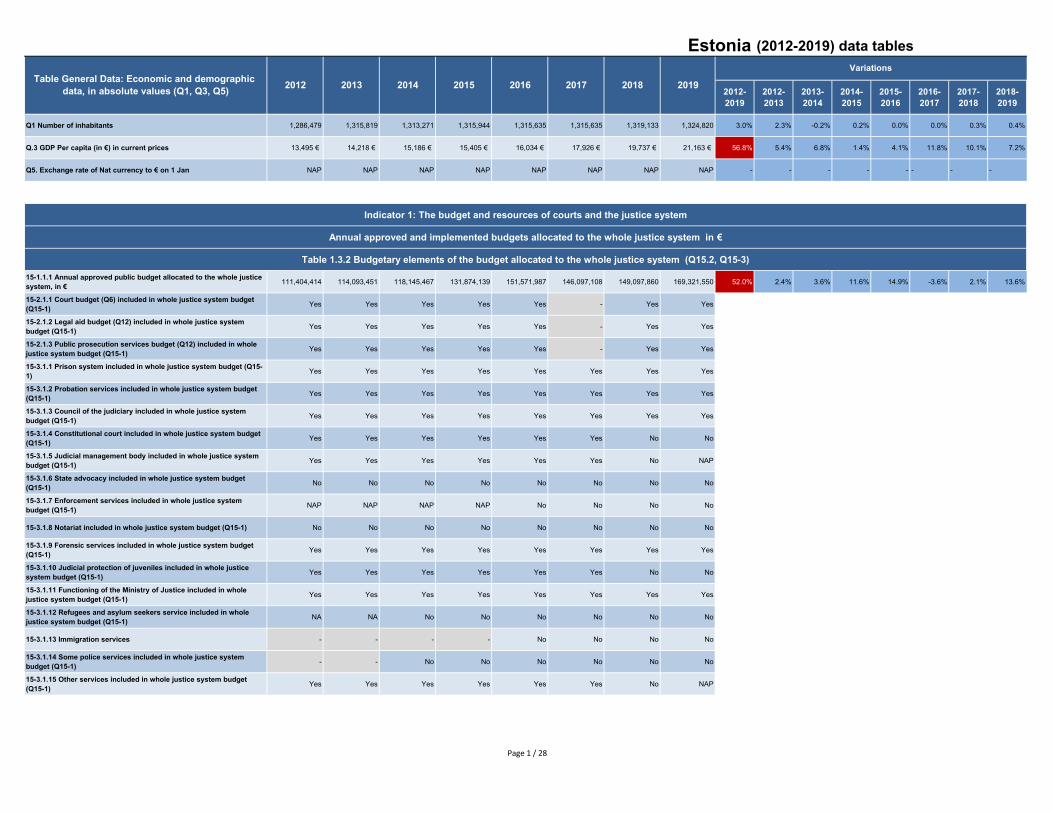
Q1 Number of inhabitants 1,286,479 1,315,819 1,313,271 1,315,944 1,315,635 1,315,635 1,319,133 1,324,820 3.0% 2.3% -0.2% 0.2% 0.0% 0.0% 0.3% 0.4%
Q.3 GDP Per capita (in €) in current prices 13,495 € 14,218 € 15,186 € 15,405 € 16,034 € 17,926 € 19,737 € 21,163 € 56.8% 5.4% 6.8% 1.4% 4.1% 11.8% 10.1% 7.2%
Q5. Exchange rate of Nat currency to € on 1 Jan NAP NAP NAP NAP NAP NAP NAP NAP - - - - - - - -
Indicator 1: The budget and resources of courts and the justice system
Annual approved and implemented budgets allocated to the whole justice system in €
Table 1.3.2 Budgetary elements of the budget allocated to the whole justice system (Q15.2, Q15-3)15-1.1.1 Annual approved public budget allocated to the whole justice system, in € 111,404,414 114,093,451 118,145,467 131,874,139 151,571,987 146,097,108 149,097,860 169,321,550 52.0% 2.4% 3.6% 11.6% 14.9% -3.6% 2.1% 13.6%
15-2.1.1 Court budget (Q6) included in whole justice system budget (Q15-1) Yes Yes Yes Yes Yes - Yes Yes
15-2.1.2 Legal aid budget (Q12) included in whole justice system budget (Q15-1) Yes Yes Yes Yes Yes - Yes Yes
15-2.1.3 Public prosecution services budget (Q12) included in whole justice system budget (Q15-1) Yes Yes Yes Yes Yes - Yes Yes
15-3.1.1 Prison system included in whole justice system budget (Q15-1) Yes Yes Yes Yes Yes Yes Yes Yes
15-3.1.2 Probation services included in whole justice system budget (Q15-1) Yes Yes Yes Yes Yes Yes Yes Yes
15-3.1.3 Council of the judiciary included in whole justice system budget (Q15-1) Yes Yes Yes Yes Yes Yes Yes Yes
15-3.1.4 Constitutional court included in whole justice system budget (Q15-1) Yes Yes Yes Yes Yes Yes No No
15-3.1.5 Judicial management body included in whole justice system budget (Q15-1) Yes Yes Yes Yes Yes Yes No NAP
15-3.1.6 State advocacy included in whole justice system budget (Q15-1) No No No No No No No No
15-3.1.7 Enforcement services included in whole justice system budget (Q15-1) NAP NAP NAP NAP No No No No
15-3.1.8 Notariat included in whole justice system budget (Q15-1) No No No No No No No No
15-3.1.9 Forensic services included in whole justice system budget (Q15-1) Yes Yes Yes Yes Yes Yes Yes Yes
15-3.1.10 Judicial protection of juveniles included in whole justice system budget (Q15-1) Yes Yes Yes Yes Yes Yes No No
15-3.1.11 Functioning of the Ministry of Justice included in whole justice system budget (Q15-1) Yes Yes Yes Yes Yes Yes Yes Yes
15-3.1.12 Refugees and asylum seekers service included in whole justice system budget (Q15-1) NA NA No No No No No No
15-3.1.13 Immigration services - - - - No No No No
15-3.1.14 Some police services included in whole justice system budget (Q15-1) - - No No No No No No
15-3.1.15 Other services included in whole justice system budget (Q15-1) Yes Yes Yes Yes Yes Yes No NAP
2017 2018 2019
Variations
Estonia (2012-2019) data tables
2016Table General Data: Economic and demographic data, in absolute values (Q1, Q3, Q5) 2012 2013 2014 2015
Page 1 / 28

2012-2019
2012-2013
2013-2014
2014-2015
2015-2016
2016-2017
2017-2018
2018-2019
2017 2018 2019
Variations
Estonia (2012-2019) data tables
2016Table General Data: Economic and demographic data, in absolute values (Q1, Q3, Q5) 2012 2013 2014 2015
Figure 1.4 Correlation between the GDP per capita and the approved whole justice system budget in 2019 (Q1, Q3, Q15-1)
Q1. Number of inhabitants 1,286,479 1,315,819 1,313,271 1,315,944 1,315,635 1,315,635 1,319,133 1,324,820 3.0% 2.3% -0.2% 0.2% 0.0% 0.0% 0.3% 0.4%
Q.3 GDP Per capita (in €) in current prices 13,495 € 14,218 € 15,186 € 15,405 € 16,034 € 17,926 € 19,737 € 21,163 € 56.8% 5.4% 6.8% 1.4% 4.1% 11.8% 10.1% 7.2%
15-1.1.1 Annual approved public budget allocated to the whole justice system, in € 111,404,414 114,093,451 118,145,467 131,874,139 151,571,987 146,097,108 149,097,860 169,321,550 52.0% 0 € 3.6% 11.6% 14.9% -3.6% 2.1% 13.6%
15-1.2.1 Annual implemented public budget allocated to the whole justice system, in € - - 124,344,738 127,607,708 143,028,913 136,166,916 140,192,635 157,473,650 - - - 2.6% 12.1% -4.8% 3.0% 12.3%
Figure 1.7 Evolution of revenues from court taxes and fees in 2010, 2012,and 2015 in € (Q1, Q9)
Table 1.8 Participation of the annual income of court taxes and fees in the budget of the whole justice system from 2012 to 2019 in € (Q1, Q9, Q15-1)
Q1. Number of inhabitants 1,286,479 1,315,819 1,313,271 1,315,944 1,315,635 1,315,635 1,319,133 1,324,820 3.0% 2.3% -0.2% 0.2% 0.0% 0.0% 0.3% 0.4%
15-1.1.1 Annual approved public budget allocated to the whole justice system, in € 111,404,414 114,093,451 118,145,467 131,874,139 151,571,987 146,097,108 149,097,860 169,321,550 52.0% 2.4% 3.6% 11.6% 14.9% -3.6% 2.1% 13.6%
Q9. Annual income of court taxes or fees received by the state 7,219,348 - 13,801,463 14,161,498 10,014,384 16,752,981 18,754,345 19,228,507 166.3% - - 2.6% -29.3% 67.3% 11.9% 2.5%
Figure 1.9 Court fees and taxes (Q8-1, Q8-2)Q8-2. Amount of court fees to commence an action for 3000 Euro debt recovery - - - - 275 275 275 275 - - - - - 0.0% 0.0% 0.0%
Indicator 2: The judicial organisation
Tables 2.1 and 2.1b Number of first instance courts (general and specialised) as legal entities and number of all courts (first, appeal and high courts) as geographic locations (Q42)
Table 2.3 (EC) Variation of the absolute number of all courts (geographic locations) (Q42)
Q1. Number of inhabitants 1,286,479 1,315,819 1,313,271 1,315,944 1,315,635 1,315,635 1,319,133 1,324,820 3.0% 2.3% -0.2% 0.2% 0.0% 0.0% 0.3% 0.4%
42.1.1 First instance courts of general jurisdiction 4 4 4 4 4 4 4 4 0.0% 0.0% 0.0% 0.0% 0.0% 0.0% 0.0% 0.0%
42.1.2 Specialised first instance courts 2 2 2 2 2 2 2 2 0.0% 0.0% 0.0% 0.0% 0.0% 0.0% 0.0% 0.0%
42.1.3 All the courts (geographic locations) 22 22 22 22 21 22 21 21 -4.5% 0.0% 0.0% 0.0% -4.5% 4.8% -4.5% 0.0%
Page 2 / 28
2012-2019
2012-2013
2013-2014
2014-2015
2015-2016
2016-2017
2017-2018
2018-2019
2017 2018 2019
Variations
Estonia (2012-2019) data tables
2016Table General Data: Economic and demographic data, in absolute values (Q1, Q3, Q5) 2012 2013 2014 2015
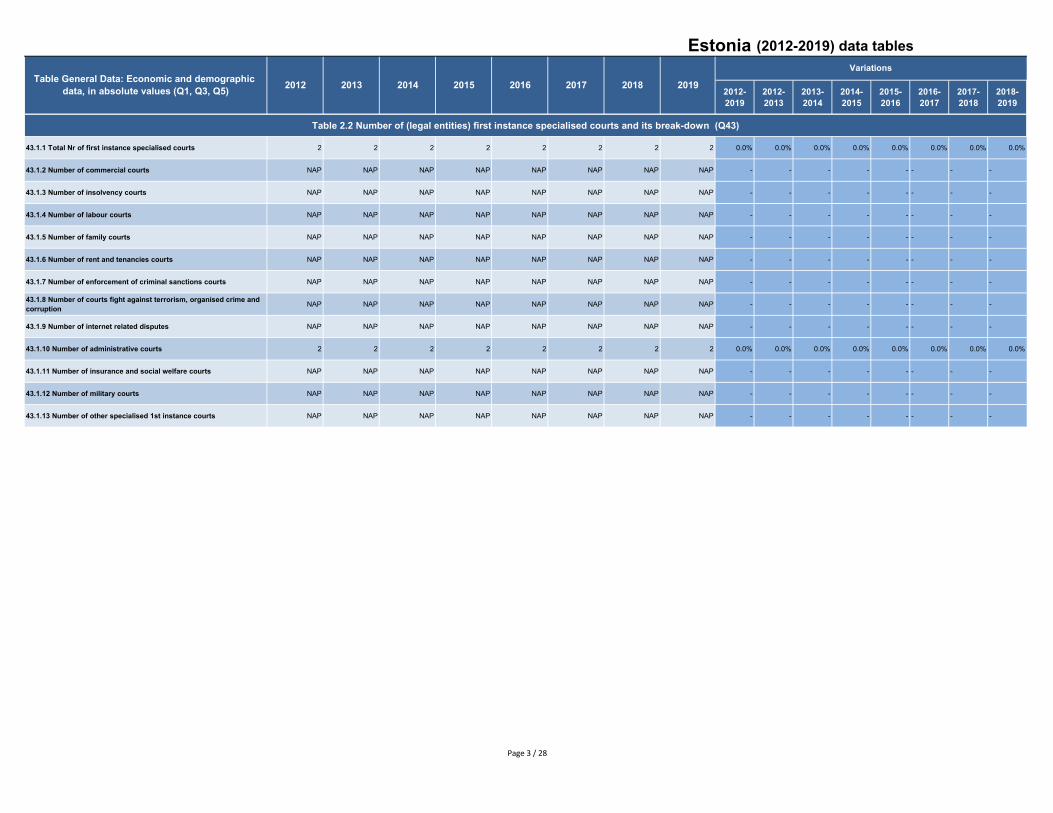
Table 2.2 Number of (legal entities) first instance specialised courts and its break-down (Q43)
43.1.1 Total Nr of first instance specialised courts 2 2 2 2 2 2 2 2 0.0% 0.0% 0.0% 0.0% 0.0% 0.0% 0.0% 0.0%
43.1.2 Number of commercial courts NAP NAP NAP NAP NAP NAP NAP NAP - - - - - - - -
43.1.3 Number of insolvency courts NAP NAP NAP NAP NAP NAP NAP NAP - - - - - - - -
43.1.4 Number of labour courts NAP NAP NAP NAP NAP NAP NAP NAP - - - - - - - -
43.1.5 Number of family courts NAP NAP NAP NAP NAP NAP NAP NAP - - - - - - - -
43.1.6 Number of rent and tenancies courts NAP NAP NAP NAP NAP NAP NAP NAP - - - - - - - -
43.1.7 Number of enforcement of criminal sanctions courts NAP NAP NAP NAP NAP NAP NAP NAP - - - - - - - -
43.1.8 Number of courts fight against terrorism, organised crime and corruption NAP NAP NAP NAP NAP NAP NAP NAP - - - - - - - -
43.1.9 Number of internet related disputes NAP NAP NAP NAP NAP NAP NAP NAP - - - - - - - -
43.1.10 Number of administrative courts 2 2 2 2 2 2 2 2 0.0% 0.0% 0.0% 0.0% 0.0% 0.0% 0.0% 0.0%
43.1.11 Number of insurance and social welfare courts NAP NAP NAP NAP NAP NAP NAP NAP - - - - - - - -
43.1.12 Number of military courts NAP NAP NAP NAP NAP NAP NAP NAP - - - - - - - -
43.1.13 Number of other specialised 1st instance courts NAP NAP NAP NAP NAP NAP NAP NAP - - - - - - - -
Page 3 / 28

2012-2019
2012-2013
2013-2014
2014-2015
2015-2016
2016-2017
2017-2018
2018-2019
2017 2018 2019
Variations
Estonia (2012-2019) data tables
2016Table General Data: Economic and demographic data, in absolute values (Q1, Q3, Q5) 2012 2013 2014 2015
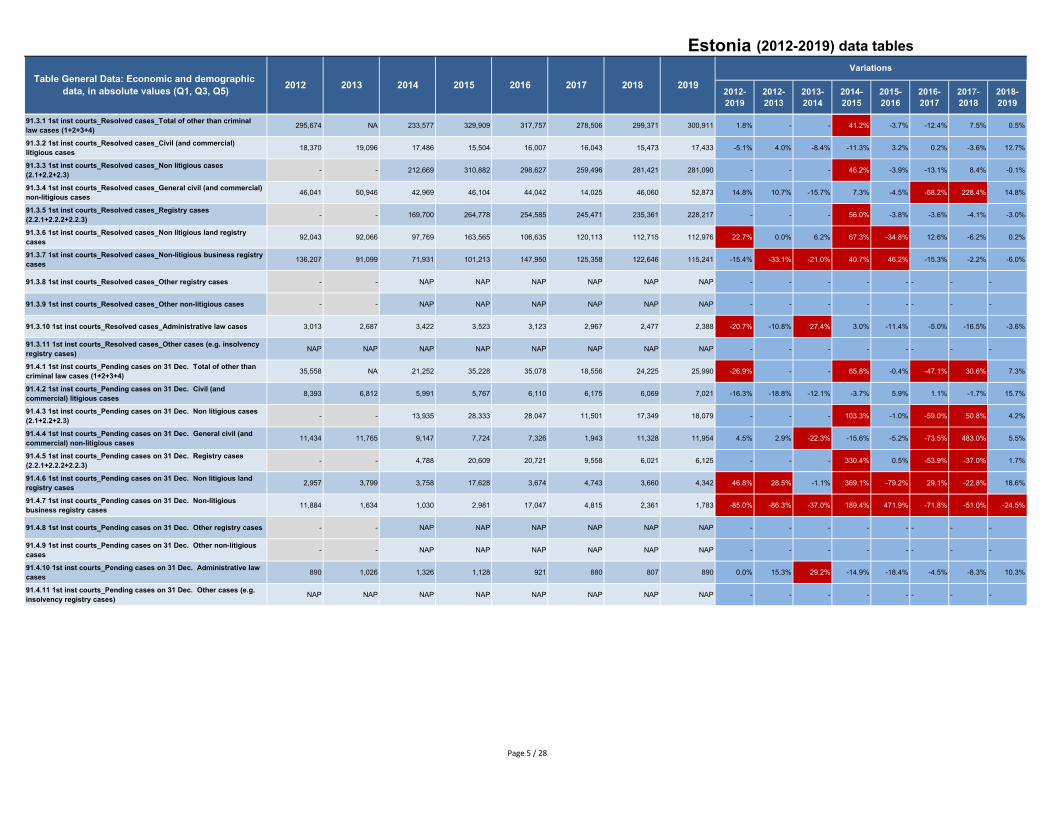
Indicator 3: The performance of courts at all stages of the proceedings
Tables 3.1.1.1 to 3.1.1.4 (all years) and 3.1.1.5 First instance courts: Number of other than criminal cases (Q91)
Table 3.9.1 and 3.9.2 (all years) Fist instance courts: Caseload in the EU of other than criminal cases pe 100 inhabitants (Q1, Q91)
Table 3.9.3 to 3.9.4 Fist instance courts: Variation of caseload in the EU of other than criminal cases (Q1, Q91)
Q1. Number of inhabitants 1,286,479 1,315,819 1,313,271 1,315,944 1,315,635 1,315,635 1,319,133 1,324,820 3.0% 2.3% -0.2% 0.2% 0.0% 0.0% 0.3% 0.4%
91.1.1 1st inst courts_Pending cases on 1 Jan. Total of other than criminal law cases (1+2+3+4) 66,242 NA 24,107 23,838 28,828 29,923 26,056 25,371 -61.7% - - -1.1% 20.9% 3.8% -12.9% -2.6%
91.1.2 1st inst courts_Pending cases on 1 Jan. Civil (and commercial) litigious cases 10,418 8,412 6,803 6,116 5,845 6,193 6,280 6,157 -40.9% -19.3% -19.1% -10.1% -4.4% 6.0% 1.4% -2.0%
91.1.3 1st inst courts_Pending cases on 1 Jan. Non litigious cases (2.1+2.2+2.3) - - 16,282 16,392 21,836 22,802 18,884 18,394 - - - 0.7% 33.2% 4.4% -17.2% -2.6%
91.1.4 1st inst courts_Pending cases on 1 Jan. General civil (and commercial) non-litigious cases 13,554 11,553 11,323 9,510 7,727 2,039 9,294 11,338 -16.3% -14.8% -2.0% -16.0% -18.7% -73.6% 355.8% 22.0%
91.1.5 1st inst courts_Pending cases on 1 Jan. Registry cases (2.2.1+2.2.2+2.2.3) - - 4,959 6,882 14,109 20,763 9,590 7,056 - - - 38.8% 105.0% 47.2% -53.8% -26.4%
91.1.6 1st inst courts_Pending cases on 1 Jan. Non litigious land registry cases 3,782 3,033 3,843 3,125 3,682 3,674 4,775 4,717 24.7% -19.8% 26.7% -18.7% 17.8% -0.2% 30.0% -1.2%
91.1.7 1st inst courts_Pending cases on 1 Jan. Non-litigious business registry cases 37,335 2,777 1,116 3,757 10,427 17,089 4,815 2,339 -93.7% -92.6% -59.8% 236.6% 177.5% 63.9% -71.8% -51.4%
91.1.8 1st inst courts_Pending cases on 1 Jan. Other registry cases - - NAP NAP NAP NAP NAP NAP - - - - - - - -
91.1.9 1st inst courts_Pending cases on 1 Jan. Other non-litigious cases - - NAP NAP NAP NAP NAP NAP - - - - - - - -
91.1.10 1st inst courts_Pending cases on 1 Jan. Administrative law cases 1,153 891 1,022 1,330 1,147 928 892 820 -28.9% -22.7% 14.7% 30.1% -13.8% -19.1% -3.9% -8.1%
91.1.11 1st inst courts_Pending cases on 1 Jan. Other cases (e.g. insolvency registry cases) NAP NAP NAP NAP NAP NAP NAP NAP - - - - - - - -
91.2.1 1st inst courts_Incoming cases_Total of other than criminal law cases (1+2+3+4) 265,301 NA 237,929 236,230 325,147 267,703 297,825 300,762 13.4% - - -0.7% 37.6% -17.7% 11.3% 1.0%
91.2.2 1st inst courts_Incoming cases_Civil (and commercial) litigious cases 16,336 17,745 16,775 15,189 16,408 16,159 15,382 18,501 13.3% 8.6% -5.5% -9.5% 8.0% -1.5% -4.8% 20.3%
91.2.3 1st inst courts_Incoming cases_Non litigious cases (2.1+2.2+2.3) - - 217,368 217,670 305,783 248,558 279,965 279,728 - - - 0.1% 40.5% -18.7% 12.6% -0.1%
91.2.4 1st inst courts_Incoming cases_General civil (and commercial) non-litigious cases 44,136 51,112 46,864 44,407 43,717 14,020 48,177 52,590 19.2% 15.8% -8.3% -5.2% -1.6% -67.9% 243.6% 9.2%
91.2.5 1st inst courts_Incoming cases_Registry cases (2.2.1+2.2.2+2.2.3) - - 170,504 173,263 262,066 234,538 231,788 227,138 - - - 1.6% 51.3% -10.5% -1.2% -2.0%
91.2.6 1st inst courts_Incoming cases_Non litigious land registry cases 91,218 92,832 97,704 72,800 107,351 121,455 111,522 112,455 23.3% 1.8% 5.2% -25.5% 47.5% 13.1% -8.2% 0.8%
91.2.7 1st inst courts_Incoming cases_Non-litigious business registry cases 110,756 90,012 72,800 100,463 154,715 113,083 120,266 114,683 3.5% -18.7% -19.1% 38.0% 54.0% -26.9% 6.4% -4.6%
91.2.8 1st inst courts_Incoming cases_Other registry cases - - NAP NAP NAP NAP NAP NAP - - - - - - - -
91.2.9 1st inst courts_Incoming cases_Other non-litigious cases - - NAP NAP NAP NAP NAP NAP - - - - - - - -
91.2.10 1st inst courts_Incoming cases_Administrative law cases 2,855 2,957 3,786 3,371 2,956 2,986 2,478 2,533 -11.3% 3.6% 28.0% -11.0% -12.3% 1.0% -17.0% 2.2%
91.2.11 1st inst courts_Incoming cases_Other cases (e.g. insolvency registry cases) NAP NAP NAP NAP NAP NAP NAP NAP - - - - - - - -
Page 4 / 28
2012-2019
2012-2013
2013-2014
2014-2015
2015-2016
2016-2017
2017-2018
2018-2019
2017 2018 2019
Variations
Estonia (2012-2019) data tables
2016Table General Data: Economic and demographic data, in absolute values (Q1, Q3, Q5) 2012 2013 2014 2015
91.3.1 1st inst courts_Resolved cases_Total of other than criminal law cases (1+2+3+4) 295,674 NA 233,577 329,909 317,757 278,506 299,371 300,911 1.8% - - 41.2% -3.7% -12.4% 7.5% 0.5%
91.3.2 1st inst courts_Resolved cases_Civil (and commercial) litigious cases 18,370 19,096 17,486 15,504 16,007 16,043 15,473 17,433 -5.1% 4.0% -8.4% -11.3% 3.2% 0.2% -3.6% 12.7%
91.3.3 1st inst courts_Resolved cases_Non litigious cases (2.1+2.2+2.3) - - 212,669 310,882 298,627 259,496 281,421 281,090 - - - 46.2% -3.9% -13.1% 8.4% -0.1%
91.3.4 1st inst courts_Resolved cases_General civil (and commercial) non-litigious cases 46,041 50,946 42,969 46,104 44,042 14,025 46,060 52,873 14.8% 10.7% -15.7% 7.3% -4.5% -68.2% 228.4% 14.8%
91.3.5 1st inst courts_Resolved cases_Registry cases (2.2.1+2.2.2+2.2.3) - - 169,700 264,778 254,585 245,471 235,361 228,217 - - - 56.0% -3.8% -3.6% -4.1% -3.0%
91.3.6 1st inst courts_Resolved cases_Non litigious land registry cases 92,043 92,066 97,769 163,565 106,635 120,113 112,715 112,976 22.7% 0.0% 6.2% 67.3% -34.8% 12.6% -6.2% 0.2%
91.3.7 1st inst courts_Resolved cases_Non-litigious business registry cases 136,207 91,099 71,931 101,213 147,950 125,358 122,646 115,241 -15.4% -33.1% -21.0% 40.7% 46.2% -15.3% -2.2% -6.0%
91.3.8 1st inst courts_Resolved cases_Other registry cases - - NAP NAP NAP NAP NAP NAP - - - - - - - -
91.3.9 1st inst courts_Resolved cases_Other non-litigious cases - - NAP NAP NAP NAP NAP NAP - - - - - - - -
91.3.10 1st inst courts_Resolved cases_Administrative law cases 3,013 2,687 3,422 3,523 3,123 2,967 2,477 2,388 -20.7% -10.8% 27.4% 3.0% -11.4% -5.0% -16.5% -3.6%
91.3.11 1st inst courts_Resolved cases_Other cases (e.g. insolvency registry cases) NAP NAP NAP NAP NAP NAP NAP NAP - - - - - - - -
91.4.1 1st inst courts_Pending cases on 31 Dec. Total of other than criminal law cases (1+2+3+4) 35,558 NA 21,252 35,228 35,078 18,556 24,225 25,990 -26.9% - - 65.8% -0.4% -47.1% 30.6% 7.3%
91.4.2 1st inst courts_Pending cases on 31 Dec. Civil (and commercial) litigious cases 8,393 6,812 5,991 5,767 6,110 6,175 6,069 7,021 -16.3% -18.8% -12.1% -3.7% 5.9% 1.1% -1.7% 15.7%
91.4.3 1st inst courts_Pending cases on 31 Dec. Non litigious cases (2.1+2.2+2.3) - - 13,935 28,333 28,047 11,501 17,349 18,079 - - - 103.3% -1.0% -59.0% 50.8% 4.2%
91.4.4 1st inst courts_Pending cases on 31 Dec. General civil (and commercial) non-litigious cases 11,434 11,765 9,147 7,724 7,326 1,943 11,328 11,954 4.5% 2.9% -22.3% -15.6% -5.2% -73.5% 483.0% 5.5%
91.4.5 1st inst courts_Pending cases on 31 Dec. Registry cases (2.2.1+2.2.2+2.2.3) - - 4,788 20,609 20,721 9,558 6,021 6,125 - - - 330.4% 0.5% -53.9% -37.0% 1.7%
91.4.6 1st inst courts_Pending cases on 31 Dec. Non litigious land registry cases 2,957 3,799 3,758 17,628 3,674 4,743 3,660 4,342 46.8% 28.5% -1.1% 369.1% -79.2% 29.1% -22.8% 18.6%
91.4.7 1st inst courts_Pending cases on 31 Dec. Non-litigious business registry cases 11,884 1,634 1,030 2,981 17,047 4,815 2,361 1,783 -85.0% -86.3% -37.0% 189.4% 471.9% -71.8% -51.0% -24.5%
91.4.8 1st inst courts_Pending cases on 31 Dec. Other registry cases - - NAP NAP NAP NAP NAP NAP - - - - - - - -
91.4.9 1st inst courts_Pending cases on 31 Dec. Other non-litigious cases - - NAP NAP NAP NAP NAP NAP - - - - - - - -
91.4.10 1st inst courts_Pending cases on 31 Dec. Administrative law cases 890 1,026 1,326 1,128 921 880 807 890 0.0% 15.3% 29.2% -14.9% -18.4% -4.5% -8.3% 10.3%
91.4.11 1st inst courts_Pending cases on 31 Dec. Other cases (e.g. insolvency registry cases) NAP NAP NAP NAP NAP NAP NAP NAP - - - - - - - -
Page 5 / 28

2012-2019
2012-2013
2013-2014
2014-2015
2015-2016
2016-2017
2017-2018
2018-2019
2017 2018 2019
Variations
Estonia (2012-2019) data tables
2016Table General Data: Economic and demographic data, in absolute values (Q1, Q3, Q5) 2012 2013 2014 2015
Table 3.2.1.1 to 3.2.1.1 (all years) First instance courts: Clearance rate and disposition time in different type of other than criminal cases (Q91)
Table 3.2.2.1 and 3.2.2.3 First instance courts: Variation of clearance rate and disposition time in different type of other than criminal cases (Q91)
Table 3.10.1 (EC) to 3.10.6 (EC) First instance courts: Disposition time and clearance rate for other than criminal cases, litigious civil and commercial cases and administrative cases (Q91)
CR Total of other than criminal law cases 111.4% NA 98.2% 139.7% 97.7% 104.0% 100.5% 100.0% -10.2% - - 42.3% -30.0% 6.5% -3.4% -0.5%
CR Civil (and commercial) litigious cases 112.5% 107.6% 104.2% 102.1% 97.6% 99.3% 100.6% 94.2% -16.2% -4.3% -3.1% -2.1% -4.4% 1.8% 1.3% -6.3%
CR Non litigious cases (2.1+2.2+2.3) - - 97.8% 142.8% 97.7% 104.4% 100.5% 100.5% - - - 46.0% -31.6% 6.9% -3.7% 0.0%
CR General civil (and commercial) non-litigious cases 104.3% 99.7% 91.7% 103.8% 100.7% 100.0% 95.6% 100.5% -3.6% -4.4% -8.0% 13.2% -3.0% -0.7% -4.4% 5.2%
CR Registry cases (2.2.1+2.2.2+2.2.3) - - 99.5% 152.8% 97.1% 104.7% 101.5% 100.5% - - - 53.5% -36.4% 7.7% -3.0% -1.1%
CR Non litigious land registry cases 100.9% 99.2% 100.1% 224.7% 99.3% 98.9% 101.1% 100.5% -0.4% -1.7% 0.9% 124.5% -55.8% -0.4% 2.2% -0.6%
CR Non-litigious business registry cases 123.0% 101.2% 98.8% 100.7% 95.6% 110.9% 102.0% 100.5% -18.3% -17.7% -2.4% 2.0% -5.1% 15.9% -8.0% -1.5%
CR Other registry cases - - NAP NAP NAP NAP NAP NAP - - - - - - - -
CR Other non-litigious cases - - NAP NAP NAP NAP NAP NAP - - - - - - - -
CR Administrative law cases 105.5% 90.9% 90.4% 104.5% 105.6% 99.4% 100.0% 94.3% -10.7% -13.9% -0.5% 15.6% 1.1% -5.9% 0.6% -5.7%
CR Other cases (e.g. insolvency registry cases) NAP NAP NAP NAP NAP NAP NAP NAP - - - - - - - -
DT Total of other than criminal law cases 44 NA 33 39 40 24 30 32 -28.2% - - 17.4% 3.4% -39.6% 21.5% 6.7%
DT Civil (and commercial) litigious cases 167 130 125 136 139 140 143 147 -11.9% -21.9% -4.0% 8.6% 2.6% 0.8% 1.9% 2.7%
DT Non litigious cases (2.1+2.2+2.3) - - 24 33 34 16 23 23 - - - 39.1% 3.1% -52.8% 39.1% 4.3%
DT General civil (and commercial) non-litigious cases 91 84 78 61 61 51 90 83 -9.0% -7.0% -7.8% -21.3% -0.7% -16.7% 77.5% -8.1%
DT Registry cases (2.2.1+2.2.2+2.2.3) - - 10 28 30 14 9 10 - - - 175.9% 4.6% -52.2% -34.3% 4.9%
DT Non litigious land registry cases 12 15 14 39 13 14 12 14 19.6% 28.4% -6.8% 180.4% -68.0% 14.6% -17.8% 18.4%
DT Non-litigious business registry cases 32 7 5 11 42 14 7 6 -82.3% -79.4% -20.2% 105.7% 291.2% -66.7% -49.9% -19.6%
DT Other registry cases - - NAP NAP NAP NAP NAP NAP - - - - - - - -
DT Other non-litigious cases - - NAP NAP NAP NAP NAP NAP - - - - - - - -
DT Administrative law cases 108 139 141 117 108 108 119 136 26.2% 29.3% 1.5% -17.4% -7.9% 0.6% 9.8% 14.4%
DT Other cases (e.g. insolvency registry cases) NAP NAP NAP NAP NAP NAP NAP NAP - - - - - - - -
Table 3.3.1 (all years) First instance courts, number of cases for specific case categories i(litigious divorce, employment dismissal and insolvency cases) (Q101)
Page 6 / 28

2012-2019
2012-2013
2013-2014
2014-2015
2015-2016
2016-2017
2017-2018
2018-2019
2017 2018 2019
Variations
Estonia (2012-2019) data tables
2016Table General Data: Economic and demographic data, in absolute values (Q1, Q3, Q5) 2012 2013 2014 2015
101.1.1 Pending cases on 1 Jan. Litigious divorce case 263 172 280 300 240 163 168 194 -26.2% -34.6% 62.8% 7.1% -20.0% -32.1% 3.1% 15.5%
101.1.2 Pending cases on 1 Jan. Employment dismissal case 283 306 277 232 218 222 193 191 -32.5% 8.1% -9.5% -16.2% -6.0% 1.8% -13.1% -1.0%
101.1.3 Pending cases on 1 Jan. Insolvency 289 267 235 237 230 226 193 440 52.2% -7.6% -12.0% 0.9% -3.0% -1.7% -14.6% 128.0%
101.2.1 Incoming cases_Litigious divorce case 652 691 912 814 828 829 805 855 31.1% 6.0% 32.0% -10.7% 1.7% 0.1% -2.9% 6.2%
101.2.2 Incoming cases_Employment dismissal case 331 451 375 386 446 356 282 291 -12.1% 36.3% -16.9% 2.9% 15.5% -20.2% -20.8% 3.2%
101.2.3 Incoming cases_Insolvency 1,152 1,306 1,331 1,145 1,194 1,314 1,522 1,635 41.9% 13.4% 1.9% -14.0% 4.3% 10.1% 15.8% 7.4%
101.3.1 Resolved cases_Litigious divorce case 598 585 873 876 900 823 778 860 43.8% -2.2% 49.2% 0.3% 2.7% -8.6% -5.5% 10.5%
101.3.2 Resolved cases_Employment dismissal case 320 432 382 390 389 364 277 290 -9.4% 35.0% -11.6% 2.1% -0.3% -6.4% -23.9% 4.7%
101.3.3 Resolved cases_Insolvency 1,099 1,286 1,290 1,146 1,212 1,281 1,444 1,613 46.8% 17.0% 0.3% -11.2% 5.8% 5.7% 12.7% 11.7%
101.4.1 Pending cases on 31 Dec. Litigious divorce case 316 275 319 238 166 169 194 189 -40.2% -13.0% 16.0% -25.4% -30.3% 1.8% 14.8% -2.6%
101.4.2 Pending cases on 31 Dec. Employment dismissal case 277 277 228 213 222 192 187 178 -35.7% 0.0% -17.7% -6.6% 4.2% -13.5% -2.6% -4.8%
101.4.3 Pending cases on 31 Dec. Insolvency 312 242 258 209 201 236 250 425 36.2% -22.4% 6.6% -19.0% -3.8% 17.4% 5.9% 70.0%
Table 3.4.1 (all years) First instance courts: Clearance rate and disposition time (litigious divorce, employment dismissal and insolvency cases) (Q101)
Table 3.4.2 First instance courts: Variation of clearance rate and disposition time between years (litigious divorce, employment dismissal and insolvency cases) (Q101)
CR Litigious divorce cases 91.7% 84.7% 95.7% 107.6% 108.7% 99.3% 96.6% 100.6% 9.7% -7.7% 13.1% 12.4% 1.0% -8.7% -2.6% 4.1%
CR Employment dismissal cases 96.7% 95.8% 101.9% 101.0% 87.2% 102.2% 98.2% 99.7% 3.1% -0.9% 6.3% -0.8% -13.7% 17.2% -3.9% 1.5%
CR Insolvency cases 95.4% 98.5% 96.9% 100.1% 101.5% 97.5% 94.9% 98.7% 3.4% 3.2% -1.6% 3.3% 1.4% -4.0% -2.7% 4.0%
DT Litigious divorce cases 193 172 133 99 67 75 91 80 -58.4% -11.0% -22.3% -25.6% -32.1% 11.3% 21.4% -11.9%
DT Employment dismissal cases 316 234 218 199 208 193 246 224 -29.1% -25.9% -6.9% -8.5% 4.5% -7.6% 28.0% -9.1%
DT Insolvency cases 104 69 73 67 61 67 63 96 -7.2% -33.7% 6.3% -8.8% -9.1% 11.1% -6.0% 52.2%
Page 7 / 28
2012-2019
2012-2013
2013-2014
2014-2015
2015-2016
2016-2017
2017-2018
2018-2019
2017 2018 2019
Variations
Estonia (2012-2019) data tables
2016Table General Data: Economic and demographic data, in absolute values (Q1, Q3, Q5) 2012 2013 2014 2015
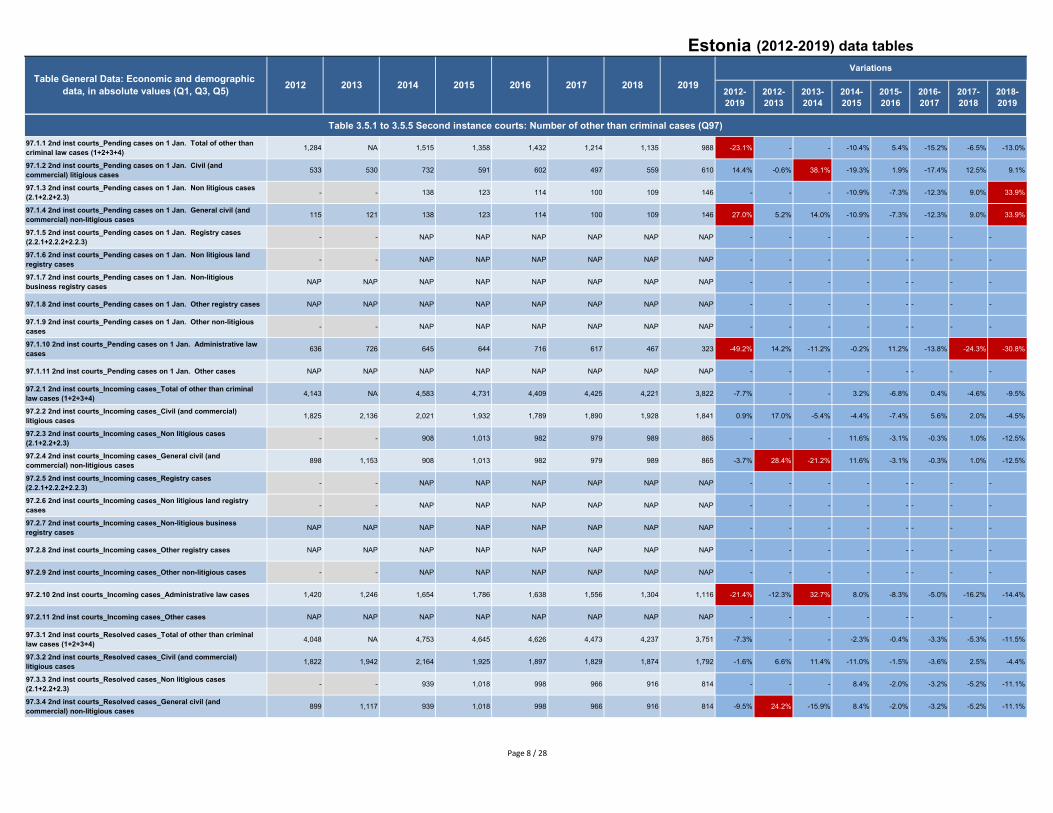
Table 3.5.1 to 3.5.5 Second instance courts: Number of other than criminal cases (Q97)97.1.1 2nd inst courts_Pending cases on 1 Jan. Total of other than criminal law cases (1+2+3+4) 1,284 NA 1,515 1,358 1,432 1,214 1,135 988 -23.1% - - -10.4% 5.4% -15.2% -6.5% -13.0%
97.1.2 2nd inst courts_Pending cases on 1 Jan. Civil (and commercial) litigious cases 533 530 732 591 602 497 559 610 14.4% -0.6% 38.1% -19.3% 1.9% -17.4% 12.5% 9.1%
97.1.3 2nd inst courts_Pending cases on 1 Jan. Non litigious cases (2.1+2.2+2.3) - - 138 123 114 100 109 146 - - - -10.9% -7.3% -12.3% 9.0% 33.9%
97.1.4 2nd inst courts_Pending cases on 1 Jan. General civil (and commercial) non-litigious cases 115 121 138 123 114 100 109 146 27.0% 5.2% 14.0% -10.9% -7.3% -12.3% 9.0% 33.9%
97.1.5 2nd inst courts_Pending cases on 1 Jan. Registry cases (2.2.1+2.2.2+2.2.3) - - NAP NAP NAP NAP NAP NAP - - - - - - - -
97.1.6 2nd inst courts_Pending cases on 1 Jan. Non litigious land registry cases - - NAP NAP NAP NAP NAP NAP - - - - - - - -
97.1.7 2nd inst courts_Pending cases on 1 Jan. Non-litigious business registry cases NAP NAP NAP NAP NAP NAP NAP NAP - - - - - - - -
97.1.8 2nd inst courts_Pending cases on 1 Jan. Other registry cases NAP NAP NAP NAP NAP NAP NAP NAP - - - - - - - -
97.1.9 2nd inst courts_Pending cases on 1 Jan. Other non-litigious cases - - NAP NAP NAP NAP NAP NAP - - - - - - - -
97.1.10 2nd inst courts_Pending cases on 1 Jan. Administrative law cases 636 726 645 644 716 617 467 323 -49.2% 14.2% -11.2% -0.2% 11.2% -13.8% -24.3% -30.8%
97.1.11 2nd inst courts_Pending cases on 1 Jan. Other cases NAP NAP NAP NAP NAP NAP NAP NAP - - - - - - - -
97.2.1 2nd inst courts_Incoming cases_Total of other than criminal law cases (1+2+3+4) 4,143 NA 4,583 4,731 4,409 4,425 4,221 3,822 -7.7% - - 3.2% -6.8% 0.4% -4.6% -9.5%
97.2.2 2nd inst courts_Incoming cases_Civil (and commercial) litigious cases 1,825 2,136 2,021 1,932 1,789 1,890 1,928 1,841 0.9% 17.0% -5.4% -4.4% -7.4% 5.6% 2.0% -4.5%
97.2.3 2nd inst courts_Incoming cases_Non litigious cases (2.1+2.2+2.3) - - 908 1,013 982 979 989 865 - - - 11.6% -3.1% -0.3% 1.0% -12.5%
97.2.4 2nd inst courts_Incoming cases_General civil (and commercial) non-litigious cases 898 1,153 908 1,013 982 979 989 865 -3.7% 28.4% -21.2% 11.6% -3.1% -0.3% 1.0% -12.5%
97.2.5 2nd inst courts_Incoming cases_Registry cases (2.2.1+2.2.2+2.2.3) - - NAP NAP NAP NAP NAP NAP - - - - - - - -
97.2.6 2nd inst courts_Incoming cases_Non litigious land registry cases - - NAP NAP NAP NAP NAP NAP - - - - - - - -
97.2.7 2nd inst courts_Incoming cases_Non-litigious business registry cases NAP NAP NAP NAP NAP NAP NAP NAP - - - - - - - -
97.2.8 2nd inst courts_Incoming cases_Other registry cases NAP NAP NAP NAP NAP NAP NAP NAP - - - - - - - -
97.2.9 2nd inst courts_Incoming cases_Other non-litigious cases - - NAP NAP NAP NAP NAP NAP - - - - - - - -
97.2.10 2nd inst courts_Incoming cases_Administrative law cases 1,420 1,246 1,654 1,786 1,638 1,556 1,304 1,116 -21.4% -12.3% 32.7% 8.0% -8.3% -5.0% -16.2% -14.4%
97.2.11 2nd inst courts_Incoming cases_Other cases NAP NAP NAP NAP NAP NAP NAP NAP - - - - - - - -
97.3.1 2nd inst courts_Resolved cases_Total of other than criminal law cases (1+2+3+4) 4,048 NA 4,753 4,645 4,626 4,473 4,237 3,751 -7.3% - - -2.3% -0.4% -3.3% -5.3% -11.5%
97.3.2 2nd inst courts_Resolved cases_Civil (and commercial) litigious cases 1,822 1,942 2,164 1,925 1,897 1,829 1,874 1,792 -1.6% 6.6% 11.4% -11.0% -1.5% -3.6% 2.5% -4.4%
97.3.3 2nd inst courts_Resolved cases_Non litigious cases (2.1+2.2+2.3) - - 939 1,018 998 966 916 814 - - - 8.4% -2.0% -3.2% -5.2% -11.1%
97.3.4 2nd inst courts_Resolved cases_General civil (and commercial) non-litigious cases 899 1,117 939 1,018 998 966 916 814 -9.5% 24.2% -15.9% 8.4% -2.0% -3.2% -5.2% -11.1%
Page 8 / 28
2012-2019
2012-2013
2013-2014
2014-2015
2015-2016
2016-2017
2017-2018
2018-2019
2017 2018 2019
Variations
Estonia (2012-2019) data tables
2016Table General Data: Economic and demographic data, in absolute values (Q1, Q3, Q5) 2012 2013 2014 2015
97.3.5 2nd inst courts_Resolved cases_Registry cases (2.2.1+2.2.2+2.2.3) - - NAP NAP NAP NAP NAP NAP - - - - - - - -
97.3.6 2nd inst courts_Resolved cases_Non litigious land registry cases - - NAP NAP NAP NAP NAP NAP - - - - - - - -
97.3.7 2nd inst courts_Resolved cases_Non-litigious business registry cases NAP NAP NAP NAP NAP NAP NAP NAP - - - - - - - -
97.3.8 2nd inst courts_Resolved cases_Other registry cases NAP NAP NAP NAP NAP NAP NAP NAP - - - - - - - -
97.3.9 2nd inst courts_Resolved cases_Other non-litigious cases - - NAP NAP NAP NAP NAP NAP - - - - - - - -
97.3.10 2nd inst courts_Resolved cases_Administrative law cases 1,327 1,327 1,650 1,702 1,731 1,678 1,447 1,145 -13.7% 0.0% 24.3% 3.2% 1.7% -3.1% -13.8% -20.9%
97.3.11 2nd inst courts_Resolved cases_Other cases NAP NAP NAP NAP NAP NAP NAP NAP - - - - - - - -
97.4.1 2nd inst courts_Pending cases on 31 Dec. Total of other than criminal law cases (1+2+3+4) 1,374 NA 1,341 1,434 1,209 1,139 1,116 1,109 -19.3% - - 6.9% -15.7% -5.8% -2.0% -0.6%
97.4.2 2nd inst courts_Pending cases on 31 Dec. Civil (and commercial) litigious cases 536 723 590 598 494 558 612 639 19.2% 34.9% -18.4% 1.4% -17.4% 13.0% 9.7% 4.4%
97.4.3 2nd inst courts_Pending cases on 31 Dec. Non litigious cases (2.1+2.2+2.3) - - 106 118 98 113 182 182 - - - 11.3% -16.9% 15.3% 61.1% 0.0%
97.4.4 2nd inst courts_Pending cases on 31 Dec. General civil (and commercial) non-litigious cases 114 157 106 118 98 113 182 182 59.6% 37.7% -32.5% 11.3% -16.9% 15.3% 61.1% 0.0%
97.4.5 2nd inst courts_Pending cases on 31 Dec. Registry cases (2.2.1+2.2.2+2.2.3) - - NAP NAP NAP NAP NAP NAP - - - - - - - -
97.4.6 2nd inst courts_Pending cases on 31 Dec. Non litigious land registry cases - - NAP NAP NAP NAP NAP NAP - - - - - - - -
97.4.7 2nd inst courts_Pending cases on 31 Dec. Non-litigious business registry cases NAP NAP NAP NAP NAP NAP NAP NAP - - - - - - - -
97.4.8 2nd inst courts_Pending cases on 31 Dec. Other registry cases NAP NAP NAP NAP NAP NAP NAP NAP - - - - - - - -
97.4.9 2nd inst courts_Pending cases on 31 Dec. Other non-litigious cases - - NAP NAP NAP NAP NAP NAP - - - - - - - -
97.4.10 2nd inst courts_Pending cases on 31 Dec. Administrative law cases 724 640 645 718 617 468 322 288 -60.2% -11.6% 0.8% 11.3% -14.1% -24.1% -31.2% -10.6%
97.4.11 2nd inst courts_Pending cases on 31 Dec. Other cases NAP NAP NAP NAP NAP NAP NAP NAP - - - - - - - -
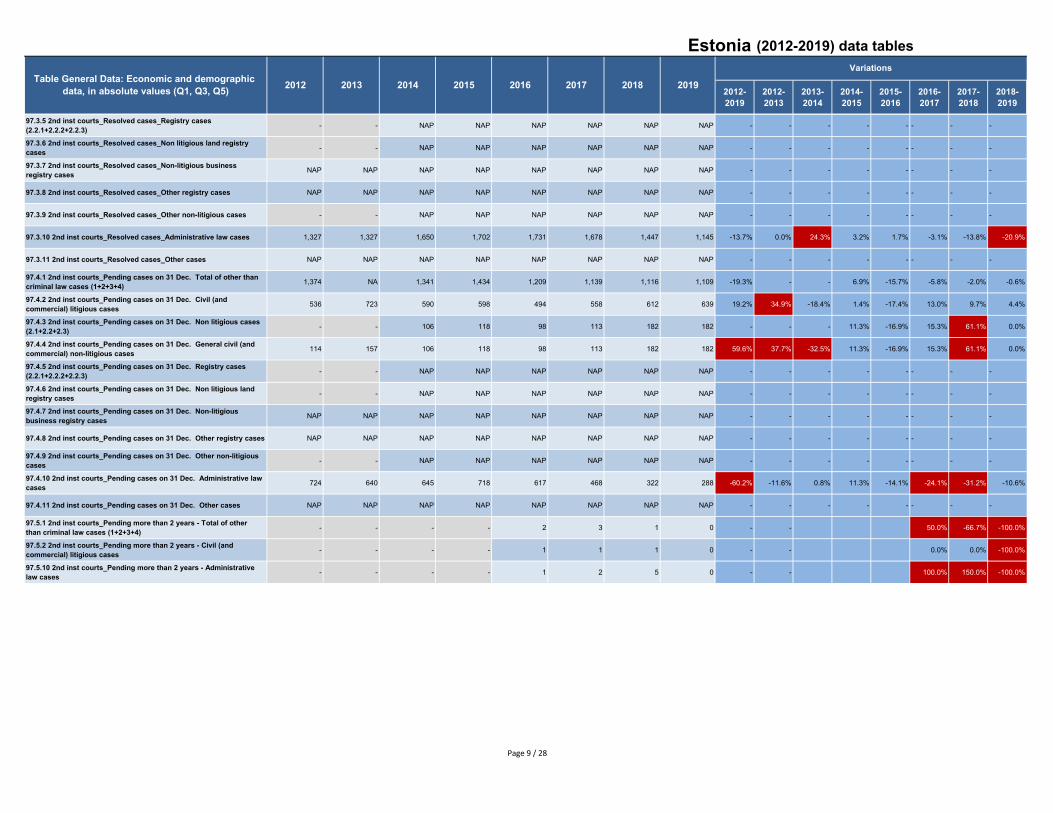
97.5.1 2nd inst courts_Pending more than 2 years - Total of other than criminal law cases (1+2+3+4) - - - - 2 3 1 0 - - 50.0% -66.7% -100.0%
97.5.2 2nd inst courts_Pending more than 2 years - Civil (and commercial) litigious cases - - - - 1 1 1 0 - - 0.0% 0.0% -100.0%
97.5.10 2nd inst courts_Pending more than 2 years - Administrative law cases - - - - 1 2 5 0 - - 100.0% 150.0% -100.0%
Page 9 / 28

2012-2019
2012-2013
2013-2014
2014-2015
2015-2016
2016-2017
2017-2018
2018-2019
2017 2018 2019
Variations
Estonia (2012-2019) data tables
2016Table General Data: Economic and demographic data, in absolute values (Q1, Q3, Q5) 2012 2013 2014 2015
Table 3.6.1: Second instance courts, clearance rate of other than criminal law cases (Q97)
Table 3.6.2: Second instance courts, disposition time of other than criminal law cases (Q97)
CR Total of other than criminal law cases 97.7% NA 103.7% 98.2% 104.9% 101.1% 100.4% 98.1% 0.4% - - -5.3% 6.9% -3.7% -0.7% -2.2%
CR Civil (and commercial) litigious cases 99.8% 90.9% 107.1% 99.6% 106.0% 96.8% 97.2% 97.3% -2.5% -8.9% 17.8% -6.9% 6.4% -8.7% 0.4% 0.1%
CR Non litigious cases (2.1+2.2+2.3) - - 103.4% 100.5% 101.6% 98.7% 92.6% 94.1% - - - -2.8% 1.1% -2.9% -6.1% 1.6%
CR General civil (and commercial) non-litigious cases 100.1% 96.9% 103.4% 100.5% 101.6% 98.7% 92.6% 94.1% -6.0% -3.2% 6.7% -2.8% 1.1% -2.9% -6.1% 1.6%
CR Registry cases (2.2.1+2.2.2+2.2.3) - - NAP NAP NAP NAP NAP NAP - - - - - - - -
CR Non litigious land registry cases - - NAP NAP NAP NAP NAP NAP - - - - - - - -
CR Non-litigious business registry cases NAP NAP NAP NAP NAP NAP NAP NAP - - - - - - - -
CR Other registry cases NAP NAP NAP NAP NAP NAP NAP NAP - - - - - - - -
CR Other non-litigious cases - - NAP NAP NAP NAP NAP NAP - - - - - - - -
CR Administrative law cases 93.5% 106.5% 99.8% 95.3% 105.7% 107.8% 111.0% 102.6% 9.8% 14.0% -6.3% -4.5% 10.9% 2.0% 2.9% -7.5%
CR Other cases (e.g. insolvency registry cases) NAP NAP NAP NAP NAP NAP NAP NAP - - - - - - - -
DT Total of other than criminal law cases 124 NA 103 113 95 93 96 108 -12.9% - - 9.4% -15.3% -2.6% 3.4% 12.2%
DT Civil (and commercial) litigious cases 107 136 100 113 95 111 119 130 21.2% 26.6% -26.8% 13.9% -16.2% 17.2% 7.0% 9.2%
DT Non litigious cases (2.1+2.2+2.3) - - 41 42 36 43 73 82 - - - 2.7% -15.3% 19.1% 69.9% 12.5%
DT General civil (and commercial) non-litigious cases 46 51 41 42 36 43 73 82 76.3% 10.8% -19.7% 2.7% -15.3% 19.1% 69.9% 12.5%
DT Registry cases (2.2.1+2.2.2+2.2.3) - - NAP NAP NAP NAP NAP NAP - - - - - - - -
DT Non litigious land registry cases - - NAP NAP NAP NAP NAP NAP - - - - - - - -
DT Non-litigious business registry cases NAP NAP NAP NAP NAP NAP NAP NAP - - - - - - - -
DT Other registry cases NAP NAP NAP NAP NAP NAP NAP NAP - - - - - - - -
DT Other non-litigious cases - - NAP NAP NAP NAP NAP NAP - - - - - - - -
DT Administrative law cases 199 176 143 154 130 102 81 92 -53.9% -11.6% -18.9% 7.9% -15.5% -21.8% -20.2% 13.0%
DT Other cases (e.g. insolvency registry cases) NAP NAP NAP NAP NAP NAP NAP NAP - - - - - - - -
Page 10 / 28

2012-2019
2012-2013
2013-2014
2014-2015
2015-2016
2016-2017
2017-2018
2018-2019
2017 2018 2019
Variations
Estonia (2012-2019) data tables
2016Table General Data: Economic and demographic data, in absolute values (Q1, Q3, Q5) 2012 2013 2014 2015
Table 3.7.1 to 3.7.5: Supreme courts, number of other than criminal law cases (Q99)99.1.1 High inst courts_Pending cases on 1 Jan. Total of other than criminal law cases (1+2+3+4) 58 - 96 93 91 99 108 73 25.9% - - -3.1% -2.2% 8.8% 9.1% -32.4%
99.1.2 High inst courts_Pending cases on 1 Jan. Civil (and commercial) litigious cases 41 - 54 58 49 57 62 29 -29.3% - - 7.4% -15.5% 16.3% 8.8% -53.2%
99.1.3 High inst courts_Pending cases on 1 Jan. Non litigious cases (2.1+2.2+2.3) - - NA NAP NAP NAP NAP NAP - - - - - - - -
99.1.4 High inst courts_Pending cases on 1 Jan. General civil (and commercial) non-litigious cases NA - NA NAP NAP NAP NAP NAP - - - - - - - -
99.1.5 High inst courts_Pending cases on 1 Jan. Registry cases (2.2.1+2.2.2+2.2.3) - - NAP NAP NAP NAP NAP NAP - - - - - - - -
99.1.6 High inst courts_Pending cases on 1 Jan. Non litigious land registry cases - - NAP NAP NAP NAP NAP NAP - - - - - - - -
99.1.7 High inst courts_Pending cases on 1 Jan. Non-litigious business registry cases NAP - NAP NAP NAP NAP NAP NAP - - - - - - - -
99.1.8 High inst courts_Pending cases on 1 Jan. Other registry cases NAP - NAP NAP NAP NAP NAP NAP - - - - - - - -
99.1.9 High inst courts_Pending cases on 1 Jan. Other non-litigious cases - - NAP NAP NAP NAP NAP NAP - - - - - - - -
99.1.10 High inst courts_Pending cases on 1 Jan. Administrative law cases 17 - 42 35 42 42 46 44 158.8% - - -16.7% 20.0% 0.0% 9.5% -4.3%
99.1.11 High inst courts_Pending cases on 1 Jan. Other cases (e.g. insolvency registry cases) NAP - NAP NAP NAP NAP NAP NAP - - - - - - - -
99.2.1 High inst courts_Incoming cases_Total of other than criminal law cases (1+2+3+4) 273 - 290 289 285 259 238 210 -23.1% - - -0.3% -1.4% -9.1% -8.1% -11.8%
99.2.2 High inst courts_Incoming cases_Civil (and commercial) litigious cases 183 - 190 194 184 182 158 140 -23.5% - - 2.1% -5.2% -1.1% -13.2% -11.4%
99.2.3 High inst courts_Incoming cases_Non litigious cases (2.1+2.2+2.3) - - NA NAP NAP NAP NAP NAP - - - - - - - -
99.2.4 High inst courts_Incoming cases_General civil (and commercial) non-litigious cases NA - NA NAP NAP NAP NAP NAP - - - - - - - -
99.2.5 High inst courts_Incoming cases_Registry cases (2.2.1+2.2.2+2.2.3) - - NAP NAP NAP NAP NAP NAP - - - - - - - -
99.2.6 High inst courts_Incoming cases_Non litigious land registry cases - - NAP NAP NAP NAP NAP NAP - - - - - - - -
99.2.7 High inst courts_Incoming cases_Non-litigious business registry cases NAP - NAP NAP NAP NAP NAP NAP - - - - - - - -
99.2.8 High inst courts_Incoming cases_Other registry cases NAP - NAP NAP NAP NAP NAP NAP - - - - - - - -
99.2.9 High inst courts_Incoming cases_Other non-litigious cases - - NAP NAP NAP NAP NAP NAP - - - - - - - -
99.2.10 High inst courts_Incoming cases_Administrative law cases 90 - 100 95 101 77 80 70 -22.2% - - -5.0% 6.3% -23.8% 3.9% -12.5%
99.2.11 High inst courts_Incoming cases_Other cases (e.g. insolvency registry cases) NAP - NAP NAP NAP NAP NAP NAP - - - - - - - -
99.3.1 High inst courts_Resolved cases_Total of other than criminal law cases (1+2+3+4) 263 - 296 293 269 279 231 223 -15.2% - - -1.0% -8.2% 3.7% -17.2% -3.5%
99.3.2 High inst courts_Resolved cases_Civil (and commercial) litigious cases 187 - 186 203 172 194 155 141 -24.6% - - 9.1% -15.3% 12.8% -20.1% -9.0%
99.3.3 High inst courts_Resolved cases_Non litigious cases (2.1+2.2+2.3) - - NA NAP NAP NAP NAP NAP - - - - - - - -
99.3.4 High inst courts_Resolved cases_General civil (and commercial) non-litigious cases NA - NA NAP NAP NAP NAP NAP - - - - - - - -
Page 11 / 28
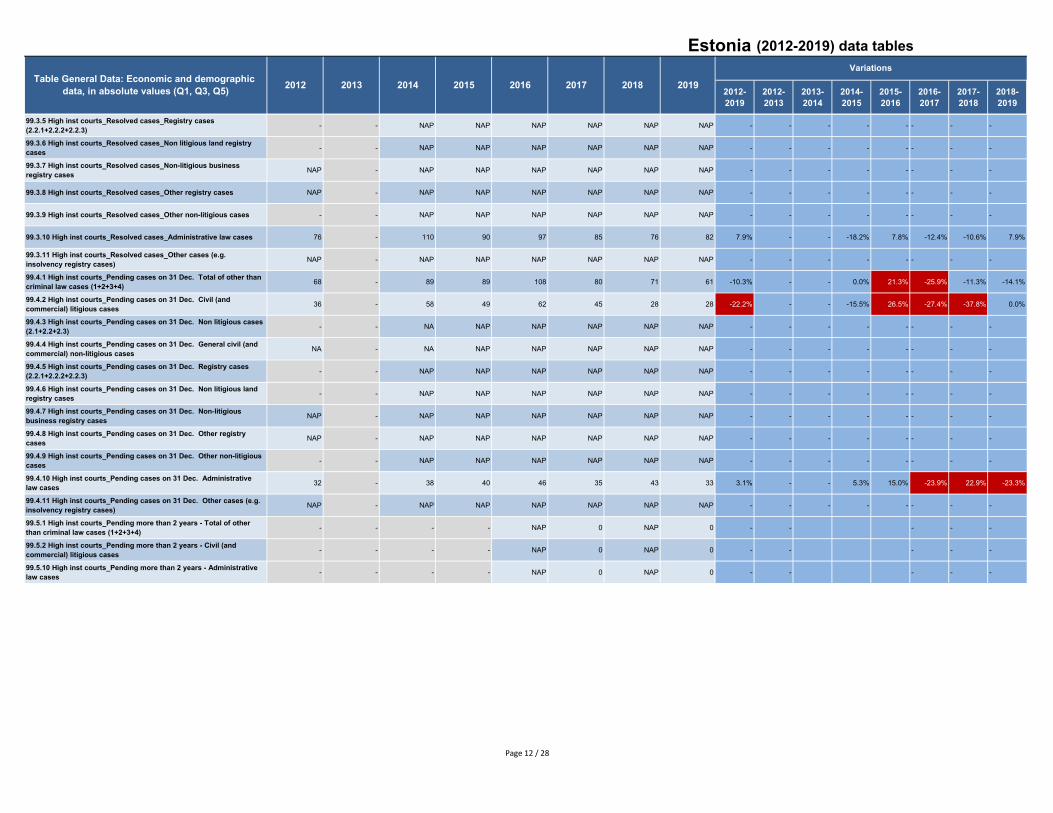
2012-2019
2012-2013
2013-2014
2014-2015
2015-2016
2016-2017
2017-2018
2018-2019
2017 2018 2019
Variations
Estonia (2012-2019) data tables
2016Table General Data: Economic and demographic data, in absolute values (Q1, Q3, Q5) 2012 2013 2014 2015
99.3.5 High inst courts_Resolved cases_Registry cases (2.2.1+2.2.2+2.2.3) - - NAP NAP NAP NAP NAP NAP - - - - - - - -
99.3.6 High inst courts_Resolved cases_Non litigious land registry cases - - NAP NAP NAP NAP NAP NAP - - - - - - - -
99.3.7 High inst courts_Resolved cases_Non-litigious business registry cases NAP - NAP NAP NAP NAP NAP NAP - - - - - - - -
99.3.8 High inst courts_Resolved cases_Other registry cases NAP - NAP NAP NAP NAP NAP NAP - - - - - - - -
99.3.9 High inst courts_Resolved cases_Other non-litigious cases - - NAP NAP NAP NAP NAP NAP - - - - - - - -
99.3.10 High inst courts_Resolved cases_Administrative law cases 76 - 110 90 97 85 76 82 7.9% - - -18.2% 7.8% -12.4% -10.6% 7.9%
99.3.11 High inst courts_Resolved cases_Other cases (e.g. insolvency registry cases) NAP - NAP NAP NAP NAP NAP NAP - - - - - - - -
99.4.1 High inst courts_Pending cases on 31 Dec. Total of other than criminal law cases (1+2+3+4) 68 - 89 89 108 80 71 61 -10.3% - - 0.0% 21.3% -25.9% -11.3% -14.1%
99.4.2 High inst courts_Pending cases on 31 Dec. Civil (and commercial) litigious cases 36 - 58 49 62 45 28 28 -22.2% - - -15.5% 26.5% -27.4% -37.8% 0.0%
99.4.3 High inst courts_Pending cases on 31 Dec. Non litigious cases (2.1+2.2+2.3) - - NA NAP NAP NAP NAP NAP - - - - - - - -
99.4.4 High inst courts_Pending cases on 31 Dec. General civil (and commercial) non-litigious cases NA - NA NAP NAP NAP NAP NAP - - - - - - - -
99.4.5 High inst courts_Pending cases on 31 Dec. Registry cases (2.2.1+2.2.2+2.2.3) - - NAP NAP NAP NAP NAP NAP - - - - - - - -
99.4.6 High inst courts_Pending cases on 31 Dec. Non litigious land registry cases - - NAP NAP NAP NAP NAP NAP - - - - - - - -
99.4.7 High inst courts_Pending cases on 31 Dec. Non-litigious business registry cases NAP - NAP NAP NAP NAP NAP NAP - - - - - - - -
99.4.8 High inst courts_Pending cases on 31 Dec. Other registry cases NAP - NAP NAP NAP NAP NAP NAP - - - - - - - -
99.4.9 High inst courts_Pending cases on 31 Dec. Other non-litigious cases - - NAP NAP NAP NAP NAP NAP - - - - - - - -
99.4.10 High inst courts_Pending cases on 31 Dec. Administrative law cases 32 - 38 40 46 35 43 33 3.1% - - 5.3% 15.0% -23.9% 22.9% -23.3%
99.4.11 High inst courts_Pending cases on 31 Dec. Other cases (e.g. insolvency registry cases) NAP - NAP NAP NAP NAP NAP NAP - - - - - - - -
99.5.1 High inst courts_Pending more than 2 years - Total of other than criminal law cases (1+2+3+4) - - - - NAP 0 NAP 0 - - - - -
99.5.2 High inst courts_Pending more than 2 years - Civil (and commercial) litigious cases - - - - NAP 0 NAP 0 - - - - -
99.5.10 High inst courts_Pending more than 2 years - Administrative law cases - - - - NAP 0 NAP 0 - - - - -
Page 12 / 28

2012-2019
2012-2013
2013-2014
2014-2015
2015-2016
2016-2017
2017-2018
2018-2019
2017 2018 2019
Variations
Estonia (2012-2019) data tables
2016Table General Data: Economic and demographic data, in absolute values (Q1, Q3, Q5) 2012 2013 2014 2015
Table 3.8.1: Supreme courts, clearance rate of other than criminal law cases (Q97)
Table 3.8.2: Supreme courts, disposition time of other than criminal law cases (Q97)
CR Total of other than criminal law cases 96.3% - 102.1% 101.4% 94.4% 107.7% 97.1% 106.2% 10.2% - - -0.7% -6.9% 14.1% -9.9% 9.4%
CR Civil (and commercial) litigious cases 102.2% - 97.9% 104.6% 93.5% 106.6% 98.1% 100.7% -1.4% - - 6.9% -10.7% 14.0% -8.0% 2.7%
CR Non litigious cases (2.1+2.2+2.3) - - NA NAP NAP NAP NAP NAP - - - - - - - -
CR General civil (and commercial) non-litigious cases NA - NA NAP NAP NAP NAP NAP - - - - - - - -
CR Registry cases (2.2.1+2.2.2+2.2.3) - - NAP NAP NAP NAP NAP NAP - - - - - - - -
CR Non litigious land registry cases - - NAP NAP NAP NAP NAP NAP - - - - - - - -
CR Non-litigious business registry cases NAP - NAP NAP NAP NAP NAP NAP - - - - - - - -
CR Other registry cases NAP - NAP NAP NAP NAP NAP NAP - - - - - - - -
CR Other non-litigious cases - - NAP NAP NAP NAP NAP NAP - - - - - - - -
CR Administrative law cases 84.4% - 110.0% 94.7% 96.0% 110.4% 95.0% 117.1% 38.7% - - -13.9% 1.4% 14.9% -13.9% 23.3%
CR Other cases (e.g. insolvency registry cases) NAP - NAP NAP NAP NAP NAP NAP - - - - - - - -
DT Total of other than criminal law cases 94 - 110 111 147 105 112 100 5.8% - - 1.0% 32.2% -28.6% 7.2% -11.0%
DT Civil (and commercial) litigious cases 70 - 114 88 132 85 66 72 3.2% - - -22.6% 49.3% -35.7% -22.1% 9.9%
DT Non litigious cases (2.1+2.2+2.3) - - NA NAP NAP NAP NAP NAP - - - - - - - -
DT General civil (and commercial) non-litigious cases NA - NA NAP NAP NAP NAP NAP - - - - - - - -
DT Registry cases (2.2.1+2.2.2+2.2.3) - - NAP NAP NAP NAP NAP NAP - - - - - - - -
DT Non litigious land registry cases - - NAP NAP NAP NAP NAP NAP - - - - - - - -
DT Non-litigious business registry cases NAP - NAP NAP NAP NAP NAP NAP - - - - - - - -
DT Other registry cases NAP - NAP NAP NAP NAP NAP NAP - - - - - - - -
DT Other non-litigious cases - - NAP NAP NAP NAP NAP NAP - - - - - - - -
DT Administrative law cases 154 - 126 162 173 150 207 147 -4.4% - - 28.7% 6.7% -13.2% 37.4% -28.9%
DT Other cases (e.g. insolvency registry cases) NAP - NAP NAP NAP NAP NAP NAP - - - - - - - -
Page 13 / 28
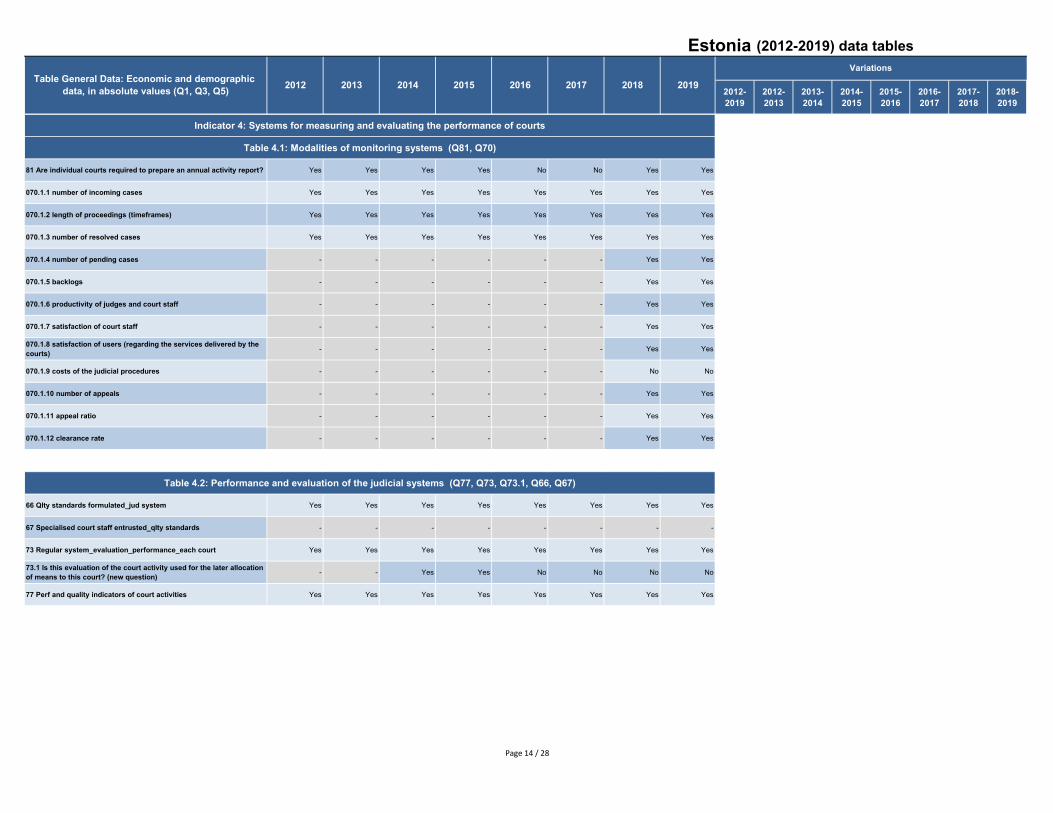
2012-2019
2012-2013
2013-2014
2014-2015
2015-2016
2016-2017
2017-2018
2018-2019
2017 2018 2019
Variations
Estonia (2012-2019) data tables
2016Table General Data: Economic and demographic data, in absolute values (Q1, Q3, Q5) 2012 2013 2014 2015
Indicator 4: Systems for measuring and evaluating the performance of courts
Table 4.1: Modalities of monitoring systems (Q81, Q70)
81 Are individual courts required to prepare an annual activity report? Yes Yes Yes Yes No No Yes Yes
070.1.1 number of incoming cases Yes Yes Yes Yes Yes Yes Yes Yes
070.1.2 length of proceedings (timeframes) Yes Yes Yes Yes Yes Yes Yes Yes
070.1.3 number of resolved cases Yes Yes Yes Yes Yes Yes Yes Yes
070.1.4 number of pending cases - - - - - - Yes Yes
070.1.5 backlogs - - - - - - Yes Yes
070.1.6 productivity of judges and court staff - - - - - - Yes Yes
070.1.7 satisfaction of court staff - - - - - - Yes Yes
070.1.8 satisfaction of users (regarding the services delivered by the courts) - - - - - - Yes Yes
070.1.9 costs of the judicial procedures - - - - - - No No
070.1.10 number of appeals - - - - - - Yes Yes
070.1.11 appeal ratio - - - - - - Yes Yes
070.1.12 clearance rate - - - - - - Yes Yes
Table 4.2: Performance and evaluation of the judicial systems (Q77, Q73, Q73.1, Q66, Q67)
66 Qlty standards formulated_jud system Yes Yes Yes Yes Yes Yes Yes Yes
67 Specialised court staff entrusted_qlty standards - - - - - - - -
73 Regular system_evaluation_performance_each court Yes Yes Yes Yes Yes Yes Yes Yes
73.1 Is this evaluation of the court activity used for the later allocation of means to this court? (new question) - - Yes Yes No No No No
77 Perf and quality indicators of court activities Yes Yes Yes Yes Yes Yes Yes Yes
Page 14 / 28

2012-2019
2012-2013
2013-2014
2014-2015
2015-2016
2016-2017
2017-2018
2018-2019
2017 2018 2019
Variations
Estonia (2012-2019) data tables
2016Table General Data: Economic and demographic data, in absolute values (Q1, Q3, Q5) 2012 2013 2014 2015
Indicator 5: Legal aid
Table 5.1: Type of legal aid (other than criminal cases) (Q16)
16.1.1 Legal aid applies to representation in court (criminal cases) Yes - Yes Yes Yes Yes Yes Yes
16.1.2 Legal aid applies to legal advice (criminal cases) Yes - Yes Yes Yes Yes Yes Yes
16.2.1 Legal aid applies to representation in court (other than criminal cases) Yes - Yes Yes Yes Yes Yes Yes
16.2.2 Legal aid applies to legal advice (other than criminal cases) Yes - Yes Yes Yes Yes Yes Yes
Table 5.2: Legal aid coverage (Q17)17 Legal aid included the coverage of or the exemption from court fees - - - - Yes Yes Yes Yes
Table 5.3.1 Annual approved public budget allocated to legal aid by type (Q12)
Table 5.4 Total annual approved public budget allocated to legal aid (absolute number and per inhabitant) (Q1, Q12)
Q1. Number of inhabitants 1,286,479 1,315,819 1,313,271 1,315,944 1,315,635 1,315,635 1,319,133 1,324,820 3.0% 2.3% -0.2% 0.2% 0.0% 0.0% 0.3% 0.4%
12 Annual approved public budget allocated to legal aid (in €) - Total (12.1 + 12.2) 3,835,000 3,835,000 3,835,000 3,838,326 3,835,000 3,934,000 4,131,000 3,603,944 -6.0% 0.0% 0.0% 0.1% -0.1% 2.6% 5.0% -12.8%
12.1 Annual approved public budget allocated to legal aid (in €) for cases brought to court - Total NA NA NA NA NA NA NA NA - - - - - - - -
12.2 Annual approved public budget allocated to legal aid (in €) for non-litigious cases or cases not brought to court - Total NA NA NA NA NA NA NA NA - - - - - - - -
12 Annual approved public budget allocated to legal aid (in €) - Total criminal cases (12.1 + 12.2) - - NA NA NA NA NA NA - - - - - - - -
12.1 Annual approved public budget allocated to legal aid (in €) for cases brought to court - Total criminal cases NA NA NA NA NA NA NA NA - - - - - - - -
12.2 Annual approved public budget allocated to legal aid (in €) for non-litigious cases or cases not brought to court - Total criminal cases
- - NA NA NA NA NA NA - - - - - - - -
12 Annual approved public budget allocated to legal aid (in €) - Total other than criminal cases (12.1 + 12.2) - - NA NA NA NA NA NA - - - - - - - -
12.1 Annual approved public budget allocated to legal aid (in €) for cases brought to court - Total other than criminal cases NA NA NA NA NA NA NA NA - - - - - - - -
12.2 Annual approved public budget allocated to legal aid (in €) for non-litigious cases or cases not brought to court - Total other than criminal cases
- - NA NA NA NA NA NA - - - - - - - -
Page 15 / 28

2012-2019
2012-2013
2013-2014
2014-2015
2015-2016
2016-2017
2017-2018
2018-2019
2017 2018 2019
Variations
Estonia (2012-2019) data tables
2016Table General Data: Economic and demographic data, in absolute values (Q1, Q3, Q5) 2012 2013 2014 2015
Table 5.3.2 Annual implemented public budget allocated to legal aid by type (Q12-1)12 Annual implemented public budget allocated to legal aid (in €) - Total (12.1 + 12.2) - - 3,989,764 3,838,326 3,835,000 3,603,108 4,090,000 3,603,944 - - - -3.8% -0.1% -6.0% 13.5% -11.9%
12.1 Annual implemented public budget allocated to legal aid (in €) for cases brought to court - Total - - 3,941,329 NA NA NA NA NA - - - - - - - -
12.2 Annual implemented public budget allocated to legal aid (in €) for non-litigious cases or cases not brought to court - Total - - 48,435 NA NA NA NA NA - - - - - - - -
12 Annual implemented public budget allocated to legal aid (in €) - Total criminal cases (12.1 + 12.2) - - 2,833,852 NA NA NA NA NA - - - - - - - -
12.1 Annual implemented public budget allocated to legal aid (in €) for cases brought to court - Total criminal cases - - NA NA NA NA NA NA - - - - - - - -
12.2 Annual implemented public budget allocated to legal aid (in €) for non-litigious cases or cases not brought to court - Total criminal cases
- - NA NA NA NA NA NA - - - - - - - -
12 Annual implemented public budget allocated to legal aid (in €) - Total criminal other than criminal cases (12.1 + 12.2) - - 1,155,912 NA NA NA NA NA - - - - - - - -
12.1 Annual implemented public budget allocated to legal aid (in €) for cases brought to court - Total other than criminal cases - - NA NA NA NA NA NA - - - - - - - -
12.2 Annual implemented public budget allocated to legal aid (in €) for non-litigious cases or cases not brought to court - Total other than criminal cases
- - NA NA NA NA NA NA - - - - - - - -
Table 5.6: Court fees required to start a proceeding at a court of general jurisdiction in (Q8)
8.1.1 Have litigants to pay taxes to start a proceeding - Criminal cases No - No No No No No No
8.1.2 Have litigants to pay taxes to start a proceeding - Other cases Yes - Yes Yes Yes Yes Yes Yes
Table 5.7 (EC): Coverage of legal aid (other than criminal cases) (Q16, Q17, Q18, Q19)
16.1.1 Legal aid applies to representation in court (criminal cases) Yes - Yes Yes Yes Yes Yes Yes
16.1.2 Legal aid applies to legal advice (criminal cases) Yes - Yes Yes Yes Yes Yes Yes
16.2.1 Legal aid applies to representation in court (other than criminal cases) Yes - Yes Yes Yes Yes Yes Yes
16.2.2 Legal aid applies to legal advice (other than criminal cases) Yes - Yes Yes Yes Yes Yes Yes
17 Legal aid included the coverage of or the exemption from court fees - - - - Yes Yes Yes Yes
Page 16 / 28

2012-2019
2012-2013
2013-2014
2014-2015
2015-2016
2016-2017
2017-2018
2018-2019
2017 2018 2019
Variations
Estonia (2012-2019) data tables
2016Table General Data: Economic and demographic data, in absolute values (Q1, Q3, Q5) 2012 2013 2014 2015
Indicator 6: The ICT tools of courts and for court users
Table 6.1 (EC) Possibility of online training (Q131-2)131-2.1.1 Number of training courses in days organised, without e-learning - - - - - - NA NA - - - - - - - -
131-2.2.1 Online training courses available during the reference year (e-learning) - - - - - - NA NA - - - - -
Table 6.2 (EC) Technologies used for court management and administration (Q63.1, Q63.2, Q63.7)
63.1 Is there a case management system? Yes Yes
63.1-1 CMS for civil matter (equipment rate) 100% 100%
63.1-1 CMS for criminal matter (equipment rate) 100% 100%
63.1-1 CMS for administrative matter (equipment rate) 100% 100%
63-1-1 Statistics in CMS civil matter Integrated Integrated
63-1-1 Statistics in CMS criminal matter Integrated Integrated
63-1-1 Statistics in CMS administrative matter Integrated Integrated
63-2 Computerised registries managed by courts - land registry 100% 100%
63-2 Computerised registries managed by courts - business registry 100% 100%
63-7.1 Measurement tools to assess the workload Yes Yes
63-7.1 workload of judges 100% 100%
63-7.1 workload of prosecutors 100% 100%
63-7.1 workload of non-judge and non-prosecutor staff 100% 100%
63-7.2 Monitoring on national level - judges Yes Yes
63-7.2 Monitoring on national level - prosecutors No No
63-7.2 Monitoring on national level - non-judge and non-prosecutor staff No No
63-7.3 Monitoring on court level - judges Yes Yes
63-7.3 Monitoring on court level - prosecutors No No
63-7.3 Monitoring on court level - non-judge and non-prosecutor staff No No
Page 17 / 28

2012-2019
2012-2013
2013-2014
2014-2015
2015-2016
2016-2017
2017-2018
2018-2019
2017 2018 2019
Variations
Estonia (2012-2019) data tables
2016Table General Data: Economic and demographic data, in absolute values (Q1, Q3, Q5) 2012 2013 2014 2015
Table 6.3.1 (EC) Technologies used for electronic submission of cases, transmission of summons and online monitoring of proceedings (Q63.1, Q64.2, Q64.4)
064-2 - Possibility to submit a case to courts by electronic means Yes Yes
064-2 - Civil and/or commercial 100% 100%
064-2 - Criminal 100% 100%
064-2 - Administrative 100% 100%
064-2 - Submission in paper remains mandatory - civil No No
064-2 - Submission in paper remains mandatory - criminal No No
064-2 - Submission in paper remains mandatory - administrative No No
064-2 - Specific legislative framework - civil Yes Yes
064-2 - Specific legislative framework - criminal Yes YesCivil - Equipment rate
064-2 - Specific legislative framework - administrative Yes YesCivil - Summon in paper form remains mandatory
064-2 - Integrated/connected with the CMS - civil Yes YesCivil - Consent of the user to be notified by electronic means
064-2 - Integrated/connected with the CMS - criminal Yes YesCivil - SMS
064-2 - Integrated/connected with the CMS - administrative Yes YesCivil - E-mail
064-4 - Possibility to transmit summons to a judicial meeting or a hearing by electronic means Yes Yes
Civil - Specific computer application
064-4 - Summons produced by CMS- civil Yes YesCivil - Other
064-4 - Summons produced by CMS- criminal Yes Yes
064-4 - Summons produced by CMS- administrative Yes Yes
064-4 - Simultaneous summon in paper form remains mandatory- civil No No
Page 18 / 28
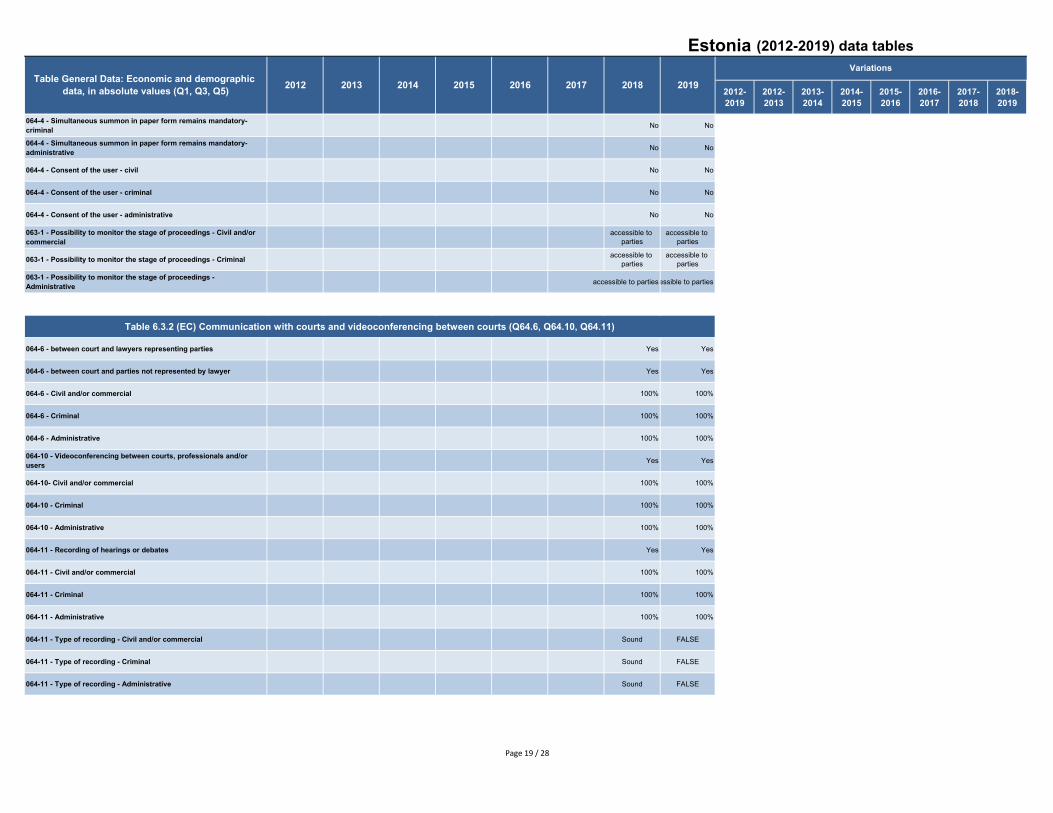
2012-2019
2012-2013
2013-2014
2014-2015
2015-2016
2016-2017
2017-2018
2018-2019
2017 2018 2019
Variations
Estonia (2012-2019) data tables
2016Table General Data: Economic and demographic data, in absolute values (Q1, Q3, Q5) 2012 2013 2014 2015
064-4 - Simultaneous summon in paper form remains mandatory- criminal No No
064-4 - Simultaneous summon in paper form remains mandatory- administrative No No
064-4 - Consent of the user - civil No No
064-4 - Consent of the user - criminal No No
064-4 - Consent of the user - administrative No No
063-1 - Possibility to monitor the stage of proceedings - Civil and/or commercial
accessible to parties
accessible to parties
063-1 - Possibility to monitor the stage of proceedings - Criminal accessible to parties
accessible to parties
063-1 - Possibility to monitor the stage of proceedings - Administrative accessible to partiesaccessible to parties
Table 6.3.2 (EC) Communication with courts and videoconferencing between courts (Q64.6, Q64.10, Q64.11)
064-6 - between court and lawyers representing parties Yes Yes
064-6 - between court and parties not represented by lawyer Yes Yes
064-6 - Civil and/or commercial 100% 100%
064-6 - Criminal 100% 100%
064-6 - Administrative 100% 100%
064-10 - Videoconferencing between courts, professionals and/or users Yes Yes
064-10- Civil and/or commercial 100% 100%
064-10 - Criminal 100% 100%
064-10 - Administrative 100% 100%
064-11 - Recording of hearings or debates Yes Yes
064-11 - Civil and/or commercial 100% 100%
064-11 - Criminal 100% 100%
064-11 - Administrative 100% 100%
064-11 - Type of recording - Civil and/or commercial Sound FALSE
064-11 - Type of recording - Criminal Sound FALSE
064-11 - Type of recording - Administrative Sound FALSE
Page 19 / 28

2012-2019
2012-2013
2013-2014
2014-2015
2015-2016
2016-2017
2017-2018
2018-2019
2017 2018 2019
Variations
Estonia (2012-2019) data tables
2016Table General Data: Economic and demographic data, in absolute values (Q1, Q3, Q5) 2012 2013 2014 2015
Table 6.4.2 Websites for judicial information (Q28)
028.1.1 - Websites with legal texts - - Yes - - - Yes Yes
028.1.2 - Websites with case-law of the higher court/s - - Yes - - - Yes Yes
028.1.3 - Websites with other documents - - Yes - - - Yes Yes
Table 6.4.2 Existence and modalities of online submission of request for legal aid in 2019 (Q64.3)064-3 - Is it possible to request for granting legal aid by electronic means? Yes Yes
064-3 - Equipment rate 100% 100%
064-3 - Request in paper mandatory No No
064-3 - Specific legislative framework Yes Yes
064-3 - Granting LA is also electronic Yes Yes
064-3 - Information available in CMS Yes Yes
Table 6.5 Technologies used for communication between courts and enforcement agents in 2018 (Q64.7)
064-7 - Equipment rate 100% 100%
064-7 - Modality - Email Yes Yes
064-7 - Modality - Specific computer application Yes Yes
064-7 - Modality - Other No No
064-7 - Specific legislative framework Yes Yes
Page 20 / 28
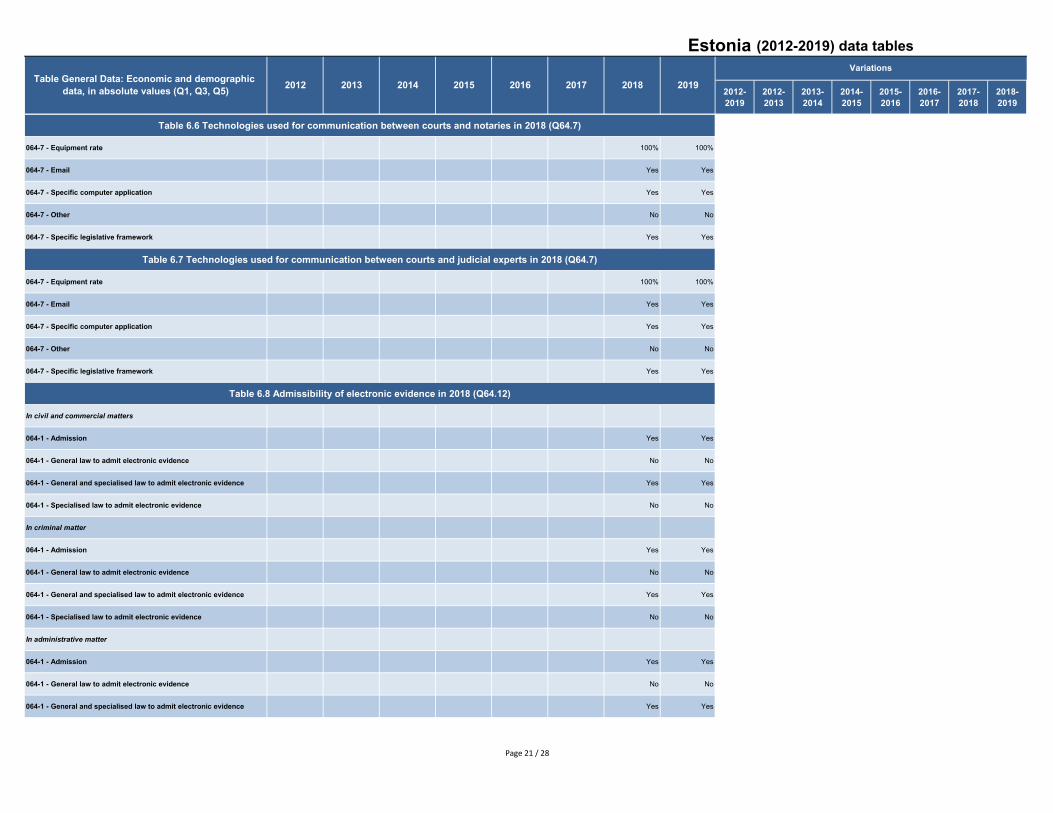
2012-2019
2012-2013
2013-2014
2014-2015
2015-2016
2016-2017
2017-2018
2018-2019
2017 2018 2019
Variations
Estonia (2012-2019) data tables
2016Table General Data: Economic and demographic data, in absolute values (Q1, Q3, Q5) 2012 2013 2014 2015
Table 6.6 Technologies used for communication between courts and notaries in 2018 (Q64.7)
064-7 - Equipment rate 100% 100%
064-7 - Email Yes Yes
064-7 - Specific computer application Yes Yes
064-7 - Other No No
064-7 - Specific legislative framework Yes Yes
Table 6.7 Technologies used for communication between courts and judicial experts in 2018 (Q64.7)
064-7 - Equipment rate 100% 100%
064-7 - Email Yes Yes
064-7 - Specific computer application Yes Yes
064-7 - Other No No
064-7 - Specific legislative framework Yes Yes
Table 6.8 Admissibility of electronic evidence in 2018 (Q64.12)
In civil and commercial matters
064-1 - Admission Yes Yes
064-1 - General law to admit electronic evidence No No
064-1 - General and specialised law to admit electronic evidence Yes Yes
064-1 - Specialised law to admit electronic evidence No No
In criminal matter
064-1 - Admission Yes Yes
064-1 - General law to admit electronic evidence No No
064-1 - General and specialised law to admit electronic evidence Yes Yes
064-1 - Specialised law to admit electronic evidence No No
In administrative matter
064-1 - Admission Yes Yes
064-1 - General law to admit electronic evidence No No
064-1 - General and specialised law to admit electronic evidence Yes Yes
Page 21 / 28

2012-2019
2012-2013
2013-2014
2014-2015
2015-2016
2016-2017
2017-2018
2018-2019
2017 2018 2019
Variations
Estonia (2012-2019) data tables
2016Table General Data: Economic and demographic data, in absolute values (Q1, Q3, Q5) 2012 2013 2014 2015
064-1 - Specialised law to admit electronic evidence No No
Table 6.9 Other aspects of the ICT systems in courts in 2018 (Q65.4)065-4 - Measuring actual benefits resulting of the use of one or several components of your information system Yes Yes
065-4 - Impact on Business processes Yes Yes
065-4 - Impact on Workload Yes Yes
065-4 - Impact on Human resources Yes Yes
065-4 - Impact on Costs Yes Yes
065-4 - Impact on Other No No
Table 6.10 Existance of online processing devices of specialised litigation (Q64-9)
064-9 - Existance of online processing devices of specialised litigation Yes Yes
Indicator 7: Career and status of judges
Table 7.1 (EC): Trainings for judges (Q127)127.1.1 Initial training (e.g. attend a judicial school, traineeship in the court) Compulsory Compulsory Compulsory Compulsory Compulsory
OptionalCompulsory
Optional Compulsory Compulsory
127.1.2 General in-service training Compulsory Compulsory Compulsory Compulsory Optional Optional Optional Optional
127.1.3 In-service training for specialised judicial functions (e.g. judge for economic or administrative issues) Compulsory Compulsory Compulsory Compulsory Optional Optional Optional Optional
127.1.4 In-service training for management functions of the court (e.g. court president) Optional Optional Optional Optional Optional Optional Optional Optional
127.1.5 In-service training for the use of computer facilities in courts Optional Optional No training offered Optional Optional Optional Optional Optional
127.1.6 In-service training on ethics Optional Optional
Page 22 / 28

2012-2019
2012-2013
2013-2014
2014-2015
2015-2016
2016-2017
2017-2018
2018-2019
2017 2018 2019
Variations
Estonia (2012-2019) data tables
2016Table General Data: Economic and demographic data, in absolute values (Q1, Q3, Q5) 2012 2013 2014 2015
Indicator 8: The existence and use of alternative dispute resolution methods
Table 8.1 Number of accredited or registered mediators (absolute values and per 100 000 inhabitants) (Q1, Q166)166 Number of accredited or registered mediators who practice judicial mediation: NAP NAP NAP NAP NAP NAP NAP NAP - - - - - - - -
Table 8.2: Availability of court-related mediation procedure (Q163)
Table 8.3(EC) Number of court related mediation procedures (absolute values) (Q167)
Table 8.4 Number of court related mediation procedures (per 100 000 inhabitants) (Q1, Q167)163-1.1 Provision of mandatory mediation procedures_before going to court! No - No - False False False False - - - - - - - -
163-1.2 Provision of mandatory mediation procedures_ordered by a judge in a course of jud. proc.! Yes - Yes - True True True True - - - - - - - -
167. Total number started NA - - - NA NA NA NA - - - - -
167. 1. Civil and commercial cases - started NA - - - NA NA NA NA - - - - -
167. 2. Family cases - started NA - - - NA NA NA NA - - - - -
167. 3. Administrative cases - started NA - - - NA NA NA NA - - - - -
167. 4. Labour cases including employment dismissal cases - started NA - - - NA NA NA NA - - - - -
167. 5. Criminal cases - started NA - - - NA NA NA NA - - - - -
167. 6. Consumer cases - started - - - - - - NA NA - - - - -
Table 8.5: Providers of court-related mediation procedure (Q164)
164. Civil and commercial cases - Private mediator Yes - Yes - Yes Yes Yes Yes
164. Civil and commercial cases - Public authority (other than the court) Yes - Yes - Yes Yes Yes Yes
164. Civil and commercial cases - Judge No - No - Yes Yes Yes Yes
164. Civil and commercial cases - Public prosecutor No - No - No No No No
164. Family law cases - Private mediator Yes - Yes - Yes Yes Yes Yes
164. Family law cases - Public authority (other than the court) Yes - Yes - Yes Yes Yes Yes
164. Family law cases - Judge No - No - Yes Yes Yes Yes
164. Family law cases - Public prosecutor No - No - No No No No
164. Administrative cases - Private mediator No - No - Yes Yes Yes Yes
164. Administrative cases - Public authority (other than the court) No - No - No No No Yes
Page 23 / 28

2012-2019
2012-2013
2013-2014
2014-2015
2015-2016
2016-2017
2017-2018
2018-2019
2017 2018 2019
Variations
Estonia (2012-2019) data tables
2016Table General Data: Economic and demographic data, in absolute values (Q1, Q3, Q5) 2012 2013 2014 2015
164. Administrative cases - Judge Yes - Yes - Yes Yes Yes Yes
164. Administrative cases - Public prosecutor No - No - No No No No
164. Employment dismissals - Private mediator Yes - Yes - Yes Yes No Yes
164. Employment dismissals - Public authority (other than the court) Yes - Yes - Yes Yes Yes Yes
164. Employment dismissals - Judge No - No - No No No No
164. Employment dismissals - Public prosecutor No - No - No No No No
164. Criminal cases - Private mediator No - No - No No No No
164. Criminal cases - Public authority (other than the court) Yes - Yes - Yes Yes Yes Yes
164. Criminal cases - Judge No - No - No No No No
164. Criminal cases - Public prosecutor No - No - No No No No
164. Consumer cases - Private mediator - - - - - - No No
164. Consumer cases - Public authority (other than the court) - - - - - - Yes No
164. Consumer cases - Judge - - - - - - Yes No
164. Consumer cases - Public prosecutor - - - - - - No No
Table 8.6: Availability of legal aid for court-related mediation (Q165)
Table 8.7: Availability of ADR other than court related mediation (Q168)
165 Availability of legal aid for court related mediation Yes - Yes - Yes Yes Yes Yes
168 Avaialability of ADR - Mediation other than court-related mediation Yes Yes Yes Yes Yes - Yes Yes
168 Avaialability of ADR - Arbitration Yes Yes Yes Yes Yes - Yes Yes
168 Avaialability of ADR - Conciliation Yes Yes Yes Yes Yes - Yes Yes
168 Avaialability of ADR - Other Yes Yes No No No - No No
Page 24 / 28

2012-2019
2012-2013
2013-2014
2014-2015
2015-2016
2016-2017
2017-2018
2018-2019
2017 2018 2019
Variations
Estonia (2012-2019) data tables
2016Table General Data: Economic and demographic data, in absolute values (Q1, Q3, Q5) 2012 2013 2014 2015
Indicator 9: Professionals of justiceTable 9.1.1 and 9.1.2 Number of professional judges (absolute number, per 100 000 inhabitants and variations) (Q1, Q46)
Table 9.1.3 and 9.1.3b Distribution of professional judges by instances and per 100 000 inhabitants (Q46)
Table 9.1.4 to 9.1.7 Distribution of male and female professional judges within the total number of professional judges in first instance in 2010 and 2012 (Q46)
Table 9.5.1 (EC) Number of professional judges sitting in courts per 100 000 inhabitants (Q1, Q46)
Table 9.2.1 to 9.2.3 Total number of non-judge staff (absolute number and per 100 000 inhabitants) and its distribution per category (Q1, Q52)
Table 9.2.4 Number of non-judge staff vs professional judges (values per 100 000 inhabitants) (Q1, Q46, Q52)
Q1. Number of inhabitants 1,286,479 1,315,819 1,313,271 1,315,944 1,315,635 1,315,635 1,319,133 1,324,820 3.0% 2.3% -0.2% 0.2% 0.0% 0.0% 0.3% 0.4%
46.1.1 Total Number of professional judges 228 226 231 234 232 227 233 229 0.4% -0.9% 2.2% 1.3% -0.9% -2.2% 2.6% -1.7%
46.1.2 Number of 1st inst professional judges 167 165 169 170 168 163 169 164 -1.8% -1.2% 2.4% 0.6% -1.2% -3.0% 3.7% -3.0%
46.1.3 Number of 2nd inst professional judges 42 43 44 45 45 45 45 46 9.5% 2.4% 2.3% 2.3% 0.0% 0.0% 0.0% 2.2%
46.1.4 Number of Supreme court professional judges 19 18 18 19 19 19 19 19 0.0% -5.3% 0.0% 5.6% 0.0% 0.0% 0.0% 0.0%
46.2.1 Number of professional judges_males 83 83 86 86 85 83 87 86 3.6% 0.0% 3.6% 0.0% -1.2% -2.4% 4.8% -1.1%
46.2.2 Number of 1st instance professional judges_males 49 50 51 51 51 49 52 49 0.0% 2.0% 2.0% 0.0% 0.0% -3.9% 6.1% -5.8%
46.2.3 Number of 2nd instance professional judges_males 17 17 20 20 20 20 20 22 29.4% 0.0% 17.6% 0.0% 0.0% 0.0% 0.0% 10.0%
46.2.4 Number of Supreme court professional judges_males 17 16 15 15 14 14 15 15 -11.8% -5.9% -6.3% 0.0% -6.7% 0.0% 7.1% 0.0%
46.3.1 Number of professional judges_females 145 143 145 148 147 144 146 143 -1.4% -1.4% 1.4% 2.1% -0.7% -2.0% 1.4% -2.1%
46.3.2 Number of 1st inst professional judges_females 118 115 118 119 117 114 117 115 -2.5% -2.5% 2.6% 0.8% -1.7% -2.6% 2.6% -1.7%
46.3.3 Number of 2nd inst professional judges_females 25 26 24 25 25 25 25 24 -4.0% 4.0% -7.7% 4.2% 0.0% 0.0% 0.0% -4.0%
46.3.4 Number of Supreme court professional judges_females 2 2 3 4 5 5 4 4 100.0% 0.0% 50.0% 33.3% 25.0% 0.0% -20.0% 0.0%
52.1.1 Total Number of non judge staff who are working in courts 957 990 1,017 965 877 846 819 802 -16.2% 3.4% 2.7% -5.1% -9.1% -3.5% -3.2% -2.1%
52.1.2 Number of Non judge staff (Rechtspfleger) 63 54 51 71 51 51 51 51 -19.0% -14.3% -5.6% 39.2% -28.2% 0.0% 0.0% 0.0%
52.1.3 Number of Non-judge staff assisting the judges 220 239 684 652 615 596 583 569 158.6% 8.6% 186.2% -4.7% -5.7% -3.1% -2.2% -2.4%
52.1.4 Number of Staff in charge of administrative tasks 489 501 78 87 82 80 77 79 -83.8% 2.5% -84.4% 11.5% -5.7% -2.4% -3.8% 2.6%
52.1.5 Number of Technical staff 138 149 161 111 88 81 73 72 -47.8% 8.0% 8.1% -31.1% -20.7% -8.0% -9.9% -1.4%
52.1.6 Number of Other non judge staff 47 47 43 44 41 38 35 31 -34.0% 0.0% -8.5% 2.3% -6.8% -7.3% -7.9% -11.4%
52.2.1 Total Number of non judge staff who are working in courts(men) - - 126 146 128 130 122 122 - - - 15.9% -12.3% 1.6% -6.2% 0.0%
Page 25 / 28

2012-2019
2012-2013
2013-2014
2014-2015
2015-2016
2016-2017
2017-2018
2018-2019
2017 2018 2019
Variations
Estonia (2012-2019) data tables
2016Table General Data: Economic and demographic data, in absolute values (Q1, Q3, Q5) 2012 2013 2014 2015
52.2.2 Number of Non judge staff (Rechtspfleger)(men) - - 4 20 5 5 5 5 - - - 400.0% -75.0% 0.0% 0.0% 0.0%
52.2.3 Number of Non-judge staff assisting the judges(men) - - 39 40 42 43 43 43 - - - 2.6% 5.0% 2.4% 0.0% 0.0%
52.2.4 Number of Staff in charge of administrative tasks(men) - - 14 17 16 22 21 21 - - - 21.4% -5.9% 37.5% -4.5% 0.0%
52.2.5 Number of Technical staff(men) - - 65 64 60 56 51 51 - - - -1.5% -6.3% -6.7% -8.9% 0.0%
52.2.6 Number of Other non judge staff(men) - - 4 5 5 4 2 2 - - - 25.0% 0.0% -20.0% -50.0% 0.0%
52.3.1 Total Number of non judge staff who are working in courts(women) 828 865 891 819 749 716 697 680 -17.9% 4.5% 3.0% -8.1% -8.5% -4.4% -2.7% -2.4%
52.3.2 Number of Non judge staff (Rechtspfleger)(women) 58 49 47 51 46 46 46 46 -20.7% -15.5% -4.1% 8.5% -9.8% 0.0% 0.0% 0.0%
52.3.3 Number of Non-judge staff assisting the judges(women) 186 210 645 612 573 553 540 526 182.8% 12.9% 207.1% -5.1% -6.4% -3.5% -2.4% -2.6%
52.3.4 Number of Staff in charge of administrative tasks(women) 466 483 64 70 66 58 56 58 -87.6% 3.6% -86.7% 9.4% -5.7% -12.1% -3.4% 3.6%
52.3.5 Number of Technical staff(women) 75 81 96 47 28 25 22 21 -72.0% 8.0% 18.5% -51.0% -40.4% -10.7% -12.0% -4.5%
52.3.6 Number of Other non judge staff(women) - 42 39 39 36 34 33 29 - - -7.1% 0.0% -7.7% -5.6% -2.9% -12.1%
Table 9.3.1 Number of lawyers* (absolute number, per 100 000 inhabitants and variations) (Q1, Q146, Q147)
Table 9.5.2 (EC) Number of lawyers per 100 000 inhabitants (Q1, Q146)
Table 9.3.3 Number of lawyers vs professional judges (values per 100 000 inhabitants) (Q1, Q146, Q52)
Q1. Number of inhabitants 1,286,479 1,315,819 1,313,271 1,315,944 1,315,635 1,315,635 1,319,133 1,324,820 3.0% 2.3% -0.2% 0.2% 0.0% 0.0% 0.3% 0.4%
146 Total number of lawyers practising in your country. 846 878 934 970 993 1,024 1,041 1,076 27.2% 3.8% 6.4% 3.9% 2.4% 3.1% 1.7% 3.4%
147 Does this figure include “legal advisors” who cannot represent their clients in court (for example, some solicitors or in-house counsellors)?
No - No No No No No No - - - - - - - -
52.1.1 Total Number of non judge staff who are working in courts 957 990 1,017 965 877 846 819 802 -16.2% 3.4% 2.7% -5.1% -9.1% -3.5% -3.2% -2.1%
52.1.2 Number of Non judge staff (Rechtspfleger) 63 54 51 71 51 51 51 51 -19.0% -14.3% -5.6% 39.2% -28.2% 0.0% 0.0% 0.0%
52.1.3 Number of Non-judge staff assisting the judges 220 239 684 652 615 596 583 569 158.6% 8.6% 186.2% -4.7% -5.7% -3.1% -2.2% -2.4%
Page 26 / 28

2012-2019
2012-2013
2013-2014
2014-2015
2015-2016
2016-2017
2017-2018
2018-2019
2017 2018 2019
Variations
Estonia (2012-2019) data tables
2016Table General Data: Economic and demographic data, in absolute values (Q1, Q3, Q5) 2012 2013 2014 2015
52.1.4 Number of Staff in charge of administrative tasks 489 501 78 87 82 80 77 79 -83.8% 2.5% -84.4% 11.5% -5.7% -2.4% -3.8% 2.6%
52.1.5 Number of Technical staff 138 149 161 111 88 81 73 72 -47.8% 8.0% 8.1% -31.1% -20.7% -8.0% -9.9% -1.4%
52.1.6 Number of Other non judge staff 47 47 43 44 41 38 35 31 -34.0% 0.0% -8.5% 2.3% -6.8% -7.3% -7.9% -11.4%
52.2.1 Total Number of non judge staff who are working in courts(men) - - 126 146 128 130 122 122 - - - 15.9% -12.3% 1.6% -6.2% 0.0%
52.2.2 Number of Non judge staff (Rechtspfleger)(men) - - 4 20 5 5 5 5 - - - 400.0% -75.0% 0.0% 0.0% 0.0%
52.2.3 Number of Non-judge staff assisting the judges(men) - - 39 40 42 43 43 43 - - - 2.6% 5.0% 2.4% 0.0% 0.0%
52.2.4 Number of Staff in charge of administrative tasks(men) - - 14 17 16 22 21 21 - - - 21.4% -5.9% 37.5% -4.5% 0.0%
52.2.5 Number of Technical staff(men) - - 65 64 60 56 51 51 - - - -1.5% -6.3% -6.7% -8.9% 0.0%
52.2.6 Number of Other non judge staff(men) - - 4 5 5 4 2 2 - - - 25.0% 0.0% -20.0% -50.0% 0.0%
52.3.1 Total Number of non judge staff who are working in courts(women) 828 865 891 819 749 716 697 680 -17.9% 4.5% 3.0% -8.1% -8.5% -4.4% -2.7% -2.4%
52.3.2 Number of Non judge staff (Rechtspfleger)(women) 58 49 47 51 46 46 46 46 -20.7% -15.5% -4.1% 8.5% -9.8% 0.0% 0.0% 0.0%
52.3.3 Number of Non-judge staff assisting the judges(women) 186 210 645 612 573 553 540 526 182.8% 12.9% 207.1% -5.1% -6.4% -3.5% -2.4% -2.6%
52.3.4 Number of Staff in charge of administrative tasks(women) 466 483 64 70 66 58 56 58 -87.6% 3.6% -86.7% 9.4% -5.7% -12.1% -3.4% 3.6%
52.3.5 Number of Technical staff(women) 75 81 96 47 28 25 22 21 -72.0% 8.0% 18.5% -51.0% -40.4% -10.7% -12.0% -4.5%
52.3.6 Number of Other non judge staff(women) - 42 39 39 36 34 33 29 - - -7.1% 0.0% -7.7% -5.6% -2.9% -12.1%
Indicator 10: The methods, sources and efficiency of national data collection
Table 10.1: Centralised institution responsible for collecting statistical data regarding the functioning of the courts and judiciary (Q80)
Page 27 / 28

2012-2019
2012-2013
2013-2014
2014-2015
2015-2016
2016-2017
2017-2018
2018-2019
2017 2018 2019
Variations
Estonia (2012-2019) data tables
2016Table General Data: Economic and demographic data, in absolute values (Q1, Q3, Q5) 2012 2013 2014 2015
80.1 Centralised instit resp_collecting data_func_C&J Yes Yes Yes Yes True Yes Yes No
Table 10.2: Publication of statistics on the functioning of each court on the internet (Q80.1)
80-1 Published statistics on the functioning of each court Yes Yes Yes, on internet Yes, on internet Yes on Internet Yes on Internet Yes on Internet Yes on Internet
Table 11.1: Existance of specific provisions for facilitating gender equality in recruiting (Q61-2)
Judges No No
Prosecutors No No
Non-judge staff No No
Lawyers No NoNotaries No NoEnforcement agents No No
Table 11.2: Existance of specific provisions for facilitating gender equality in promotion in 2018 (Q61-2)Judges No NoProsecutors No NoNon-judge staff No NoLawyers No NoNotaries No NoEnforcement agents No No
Table 11.3: Availability of national programme to promote gender equality in 2018 (Q61-5)
National programme for gender equality No No
Table 11.4: Existance of person/institution specifically dedicated to ensure the respect of gender equality in 2018 (Q61-7)In courts (judges) No NoIn public prosecution services (prosecutors) No NoFor courts’ non-judge staff No No
Key: Variation of more than (+ -) 20%
Page 28 / 28