State of Health in the EU · Estonia - European Commission
24
State of Health in the EU Estonia Country Health Profile 2019
-
Upload
khangminh22 -
Category
Documents
-
view
5 -
download
0
Transcript of State of Health in the EU · Estonia - European Commission

State of Health in the EU
EstoniaCountry Health Profile 2019
EE
2 State of Health in the EU · Estonia · Country Health Profile 2019
The Country Health Profile series
The State of Health in the EU’s Country Health Profiles provide a concise and policy-relevant overview of health and health systems in the EU/European Economic Area. They emphasise the particular characteristics and challenges in each country against a backdrop of cross-country comparisons. The aim is to support policymakers and influencers with a means for mutual learning and voluntary exchange.
The profiles are the joint work of the OECD and the European Observatory on Health Systems and Policies, in cooperation with the European Commission. The team is grateful for the valuable comments and suggestions provided by the Health Systems and Policy Monitor network, the OECD Health Committee and the EU Expert Group on Health Information.
Contents
1. HIGHLIGHTS 32. HEALTH IN ESTONIA 43. RISK FACTORS 74. THE HEALTH SYSTEM 95. PERFORMANCE OF THE HEALTH SYSTEM 12
5.1. Effectiveness 125.2. Accessibility 165.3. Resilience 19
6. KEY FINDINGS 22
Data and information sources
The data and information in the Country Health Profiles are based mainly on national official statistics provided to Eurostat and the OECD, which were validated to ensure the highest standards of data comparability. The sources and methods underlying these data are available in the Eurostat Database and the OECD health database. Some additional data also come from the Institute for Health Metrics and Evaluation (IHME), the European Centre for Disease Prevention and Control (ECDC), the Health Behaviour in School-Aged Children (HBSC) surveys and the World Health Organization (WHO), as well as other national sources.
The calculated EU averages are weighted averages of the 28 Member States unless otherwise noted. These EU averages do not include Iceland and Norway.
This profile was completed in August 2019, based on data available in July 2019.
To download the Excel spreadsheet matching all the tables and graphs in this profile, just type the following URL into your Internet browser: http://www.oecd.org/health/Country-Health-Profiles-2019-Estonia.xls
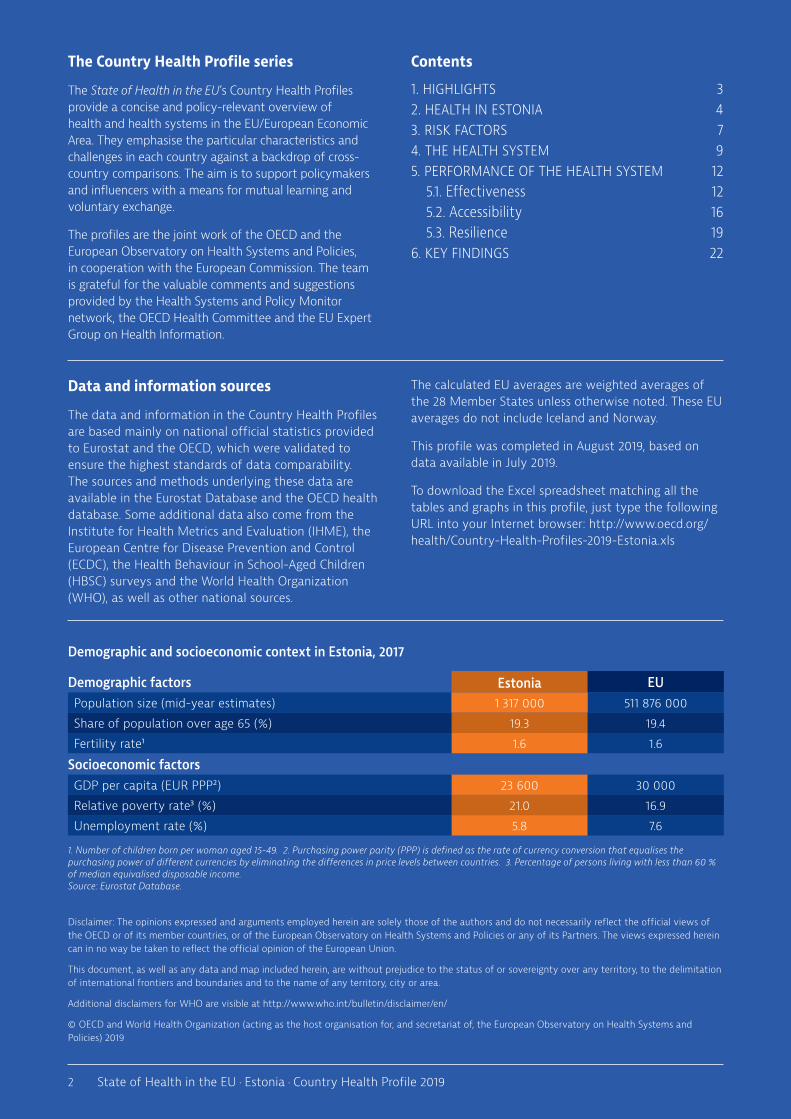
Demographic factors EUPopulation size (mid-year estimates) 1 317 000 511 876 000
Share of population over age 65 (%) 19.3 19.4
Fertility rate¹ 1.6 1.6
Socioeconomic factorsGDP per capita (EUR PPP²) 23 600 30 000
Relative poverty rate³ (%) 21.0 16.9
Unemployment rate (%) 5.8 7.6
1. Number of children born per woman aged 15-49. 2. Purchasing power parity (PPP) is defined as the rate of currency conversion that equalises the purchasing power of different currencies by eliminating the differences in price levels between countries. 3. Percentage of persons living with less than 60 % of median equivalised disposable income. Source: Eurostat Database.
Disclaimer: The opinions expressed and arguments employed herein are solely those of the authors and do not necessarily reflect the official views of the OECD or of its member countries, or of the European Observatory on Health Systems and Policies or any of its Partners. The views expressed herein can in no way be taken to reflect the official opinion of the European Union.
This document, as well as any data and map included herein, are without prejudice to the status of or sovereignty over any territory, to the delimitation of international frontiers and boundaries and to the name of any territory, city or area.
Additional disclaimers for WHO are visible at http://www.who.int/bulletin/disclaimer/en/
© OECD and World Health Organization (acting as the host organisation for, and secretariat of, the European Observatory on Health Systems and Policies) 2019
Demographic and socioeconomic context in Estonia, 2017
Estonia
3State of Health in the EU · Estonia · Country Health Profile 2019
ESTO
NIA
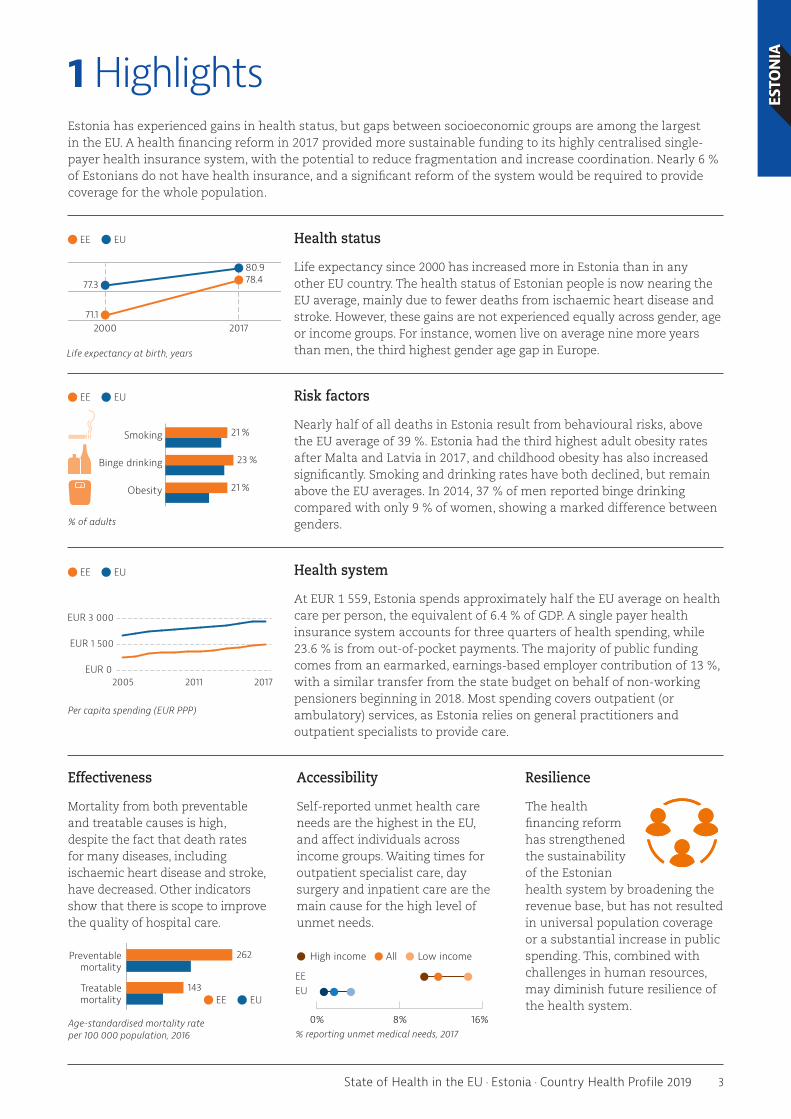
1 HighlightsEstonia has experienced gains in health status, but gaps between socioeconomic groups are among the largest in the EU. A health financing reform in 2017 provided more sustainable funding to its highly centralised single-payer health insurance system, with the potential to reduce fragmentation and increase coordination. Nearly 6 % of Estonians do not have health insurance, and a significant reform of the system would be required to provide coverage for the whole population.
Health status
Life expectancy since 2000 has increased more in Estonia than in any other EU country. The health status of Estonian people is now nearing the EU average, mainly due to fewer deaths from ischaemic heart disease and stroke. However, these gains are not experienced equally across gender, age or income groups. For instance, women live on average nine more years than men, the third highest gender age gap in Europe.
Risk factors
Nearly half of all deaths in Estonia result from behavioural risks, above the EU average of 39 %. Estonia had the third highest adult obesity rates after Malta and Latvia in 2017, and childhood obesity has also increased significantly. Smoking and drinking rates have both declined, but remain above the EU averages. In 2014, 37 % of men reported binge drinking compared with only 9 % of women, showing a marked difference between genders.
Health system
At EUR 1 559, Estonia spends approximately half the EU average on health care per person, the equivalent of 6.4 % of GDP. A single payer health insurance system accounts for three quarters of health spending, while 23.6 % is from out-of-pocket payments. The majority of public funding comes from an earmarked, earnings-based employer contribution of 13 %, with a similar transfer from the state budget on behalf of non-working pensioners beginning in 2018. Most spending covers outpatient (or ambulatory) services, as Estonia relies on general practitioners and outpatient specialists to provide care.
Effectiveness
Mortality from both preventable and treatable causes is high, despite the fact that death rates for many diseases, including ischaemic heart disease and stroke, have decreased. Other indicators show that there is scope to improve the quality of hospital care.
Accessibility
Self-reported unmet health care needs are the highest in the EU, and affect individuals across income groups. Waiting times for outpatient specialist care, day surgery and inpatient care are the main cause for the high level of unmet needs.
Resilience
The health financing reform has strengthened the sustainability of the Estonian health system by broadening the revenue base, but has not resulted in universal population coverage or a substantial increase in public spending. This, combined with challenges in human resources, may diminish future resilience of the health system.
EE EU
EUR 0
EUR 1 500
EUR 3 000
2005 20172011
Per capita spending (EUR PPP)
70
76
82
%01
71.1
78.4
%01
77.3
80.9
CountryEU
20172000
EE EU
Life expectancy at birth, years
161
93
EU
262
143
Country
Treatablemortality
Preventablemortality
EE EU
Age-standardised mortality rate per 100 000 population, 2016
17
22
21Obesity
Binge drinking
Smoking
21 %
23 %
21 %
EUCountry
Obesity
Binge drinking
Smoking
% of adults
EE EU
0% 8% 16%
High income All Low income
EEEU
% reporting unmet medical needs, 2017
4 State of Health in the EU · Estonia · Country Health Profile 2019
ESTO
NIA
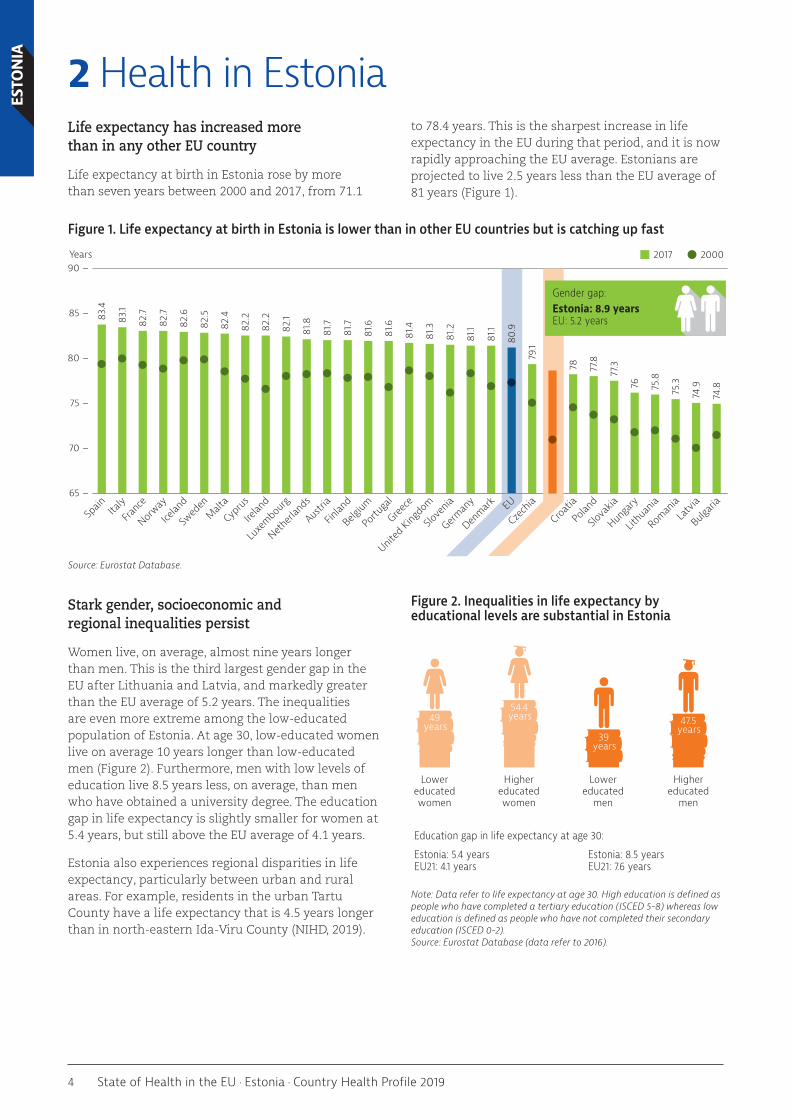
2 Health in EstoniaLife expectancy has increased more than in any other EU country
Life expectancy at birth in Estonia rose by more than seven years between 2000 and 2017, from 71.1
to 78.4 years. This is the sharpest increase in life expectancy in the EU during that period, and it is now rapidly approaching the EU average. Estonians are projected to live 2.5 years less than the EU average of 81 years (Figure 1).
Figure 1. Life expectancy at birth in Estonia is lower than in other EU countries but is catching up fast
Source: Eurostat Database.
Stark gender, socioeconomic and regional inequalities persist
Women live, on average, almost nine years longer than men. This is the third largest gender gap in the EU after Lithuania and Latvia, and markedly greater than the EU average of 5.2 years. The inequalities are even more extreme among the low-educated population of Estonia. At age 30, low-educated women live on average 10 years longer than low-educated men (Figure 2). Furthermore, men with low levels of education live 8.5 years less, on average, than men who have obtained a university degree. The education gap in life expectancy is slightly smaller for women at 5.4 years, but still above the EU average of 4.1 years.
Estonia also experiences regional disparities in life expectancy, particularly between urban and rural areas. For example, residents in the urban Tartu County have a life expectancy that is 4.5 years longer than in north-eastern Ida-Viru County (NIHD, 2019).
Figure 2. Inequalities in life expectancy by educational levels are substantial in Estonia
Note: Data refer to life expectancy at age 30. High education is defined as people who have completed a tertiary education (ISCED 5-8) whereas low education is defined as people who have not completed their secondary education (ISCED 0-2). Source: Eurostat Database (data refer to 2016).
Years
65 –
70 –
75 –
80 –
85 –
90 –
83.4
83.1
82.7
82.7
82.6
82.5
82.4
82.2
82.2
82.1
81.8
81.7
81.7
81.6
81.6
81.4
81.3
81.2
81.1
81.1
80.9
79.1
78.4
78 77.8
77.3
76 75.8
75.3
74.9
74.8
Bulgari
aLa
tvia
Roman
ia
Lithu
ania
Hunga
ry
Slova
kia
Polan
d
Croatia
Esto
nia
Czec
hiaEU
Denmark
German
y
Slove
nia
United
Kingdo
mGree
ce
Portu
gal
Belgium
Finlan
d
Austri
a
Netherl
ands
Luxe
mbourg
Irelan
d
Cypr
usMalt
a
Swed
en
Icelan
d
Norway
Franc
eIta
lySp
ain
2017 2000
Gender gap:Estonia: 8.9 yearsEU: 5.2 years
Estonia: 5.4 yearsEU21: 4.1 years
Education gap in life expectancy at age 30:
Estonia: 8.5 yearsEU21: 7.6 years
49years
54.4years
39years
47.5years
Lowereducatedwomen
Highereducatedwomen
Lowereducated
men
Highereducated
men

5State of Health in the EU · Estonia · Country Health Profile 2019
ESTO
NIAMortality rates for some cancers have risen but
deaths from ischaemic heart disease are higher
In 2016, ischaemic heart disease represented one fifth of all deaths in Estonia (3 120 deaths), but the mortality rate decreased by more than 50 % between 2000 and 2016 (Figure 3). The decrease in mortality can be mainly attributed to reductions in important risk factors such as smoking, particularly among men, and improvements in the quality of health care (see
Sections 3 and 5.1). The mortality rate from ischaemic heart disease in Estonia (252 deaths per 100 000 population) is more than twice the EU average of 118.8. However, Estonia compares favourably to Latvia and Lithuania, which have the highest death rates from ischaemic heart disease in the EU. The death rate from strokes has also decreased markedly, from 309 to 74 per 100 000 population between 2000 and 2016, dropping below the EU average of 79.8.
Figure 3: Ischaemic heart disease is still by far the main cause of death in Estonia
Note: The size of the bubbles is proportional to the mortality rates in 2016. Source: Eurostat Database.
Lung cancer is the most frequent cause of death by cancer among Estonians, and the third highest cause of death overall at 51 deaths per 100 000 population. The rate in Estonia is lower than the EU average (54 deaths per 100 000 population) and has fallen by 12 % since 2000 due to reductions in smoking rates (Section 3). Yet, in recent years, some cancer has emerged as new health issues in Estonia. Deaths from prostate and colorectal cancer have increased since 2000. Mortality from chronic liver disease is among the highest in the EU.
Self-reported health status varies widely across age and income groups
In 2017, only slightly more than half of the Estonian population (53 %) reported being in good health, compared with two thirds across the whole EU. Self-perceived health varies dramatically by age – 81.5 % of the population aged between 16 and 44 report good health, compared to only 17.6 % of the population 65 years and older. Disparities across income groups are similarly substantial. More than three quarters of people in the highest income quintile consider themselves to be in good health compared with only one third in the lowest income quintile. This is the largest gap across income groups in all EU countries (Figure 4).
Figure 4. Inequalities in self-rated health by income level are very large in Estonia
Note: 1. The shares for the total population and the population on low incomes are roughly the same. Source: Eurostat Database, based on EU-SILC (data refer to 2017).
100 150 200 250 300
100
50
0
-50
-100
% change 2000-16 (or nearest year)
Age-standardised mortality rate per 100 000 population, 2016
Liver diseaseProstate cancer
Chronic obstructive pulmonary disease
Stroke
Colorectal cancer
Pneumonia
Breast cancer
Stomach cancer
Lung cancer
Ischaemic heart disease
0% of adults who report being in good health
20 40 60 80 100
High incomeTotal populationLow income
LithuaniaLatvia
PortugalEstoniaPoland
HungaryCroatiaCzechia
SloveniaGermanyBulgariaSlovakia
FranceEU
FinlandAustria
Romania1Luxembourg
DenmarkGreece1
SpainBelgium
United KingdomMalta
IcelandNetherlands
SwedenItaly1
NorwayCyprusIreland
6 State of Health in the EU · Estonia · Country Health Profile 2019
ESTO
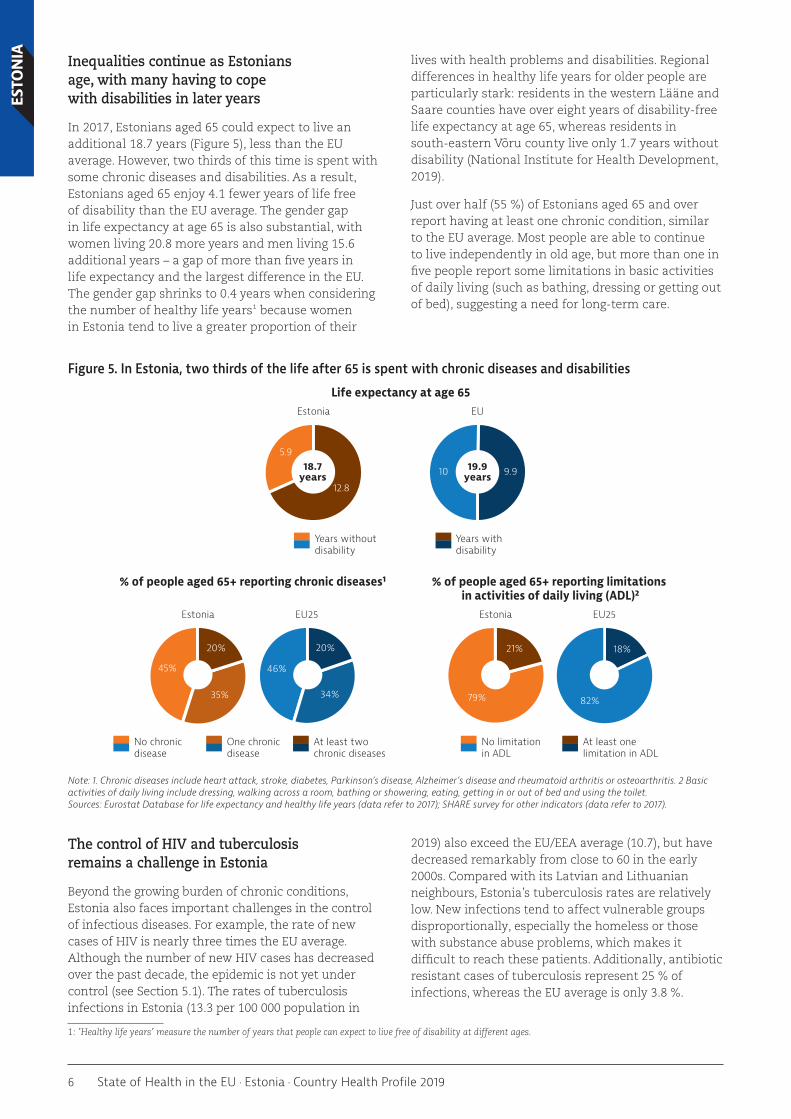
NIA Inequalities continue as Estonians
age, with many having to cope with disabilities in later years
In 2017, Estonians aged 65 could expect to live an additional 18.7 years (Figure 5), less than the EU average. However, two thirds of this time is spent with some chronic diseases and disabilities. As a result, Estonians aged 65 enjoy 4.1 fewer years of life free of disability than the EU average. The gender gap in life expectancy at age 65 is also substantial, with women living 20.8 more years and men living 15.6 additional years – a gap of more than five years in life expectancy and the largest difference in the EU. The gender gap shrinks to 0.4 years when considering the number of healthy life years1 because women in Estonia tend to live a greater proportion of their
1: ’Healthy life years’ measure the number of years that people can expect to live free of disability at different ages.
lives with health problems and disabilities. Regional differences in healthy life years for older people are particularly stark: residents in the western Lääne and Saare counties have over eight years of disability-free life expectancy at age 65, whereas residents in south-eastern Võru county live only 1.7 years without disability (National Institute for Health Development, 2019).
Just over half (55 %) of Estonians aged 65 and over report having at least one chronic condition, similar to the EU average. Most people are able to continue to live independently in old age, but more than one in five people report some limitations in basic activities of daily living (such as bathing, dressing or getting out of bed), suggesting a need for long-term care.
Figure 5. In Estonia, two thirds of the life after 65 is spent with chronic diseases and disabilities
Note: 1. Chronic diseases include heart attack, stroke, diabetes, Parkinson’s disease, Alzheimer’s disease and rheumatoid arthritis or osteoarthritis. 2 Basic activities of daily living include dressing, walking across a room, bathing or showering, eating, getting in or out of bed and using the toilet. Sources: Eurostat Database for life expectancy and healthy life years (data refer to 2017); SHARE survey for other indicators (data refer to 2017).
The control of HIV and tuberculosis remains a challenge in Estonia
Beyond the growing burden of chronic conditions, Estonia also faces important challenges in the control of infectious diseases. For example, the rate of new cases of HIV is nearly three times the EU average. Although the number of new HIV cases has decreased over the past decade, the epidemic is not yet under control (see Section 5.1). The rates of tuberculosis infections in Estonia (13.3 per 100 000 population in
2019) also exceed the EU/EEA average (10.7), but have decreased remarkably from close to 60 in the early 2000s. Compared with its Latvian and Lithuanian neighbours, Estonia’s tuberculosis rates are relatively low. New infections tend to affect vulnerable groups disproportionally, especially the homeless or those with substance abuse problems, which makes it difficult to reach these patients. Additionally, antibiotic resistant cases of tuberculosis represent 25 % of infections, whereas the EU average is only 3.8 %.
% of people aged 65+ reporting depression symptoms3
Estonia EU11
18% 29 %
5.9
12.8
45%
35%
20%
46%
34%
20%
79%
21%
18.7years
19.9years
82%
18%
Estonia
Life expectancy at age 65
% of people aged 65+ reporting chronic diseases1 % of people aged 65+ reporting limitations in activities of daily living (ADL)2
EU
Estonia EU25
Years without disability
Years with disability
One chronic disease
No chronic disease
At least two chronic diseases
Estonia EU25
No limitationin ADL
At least onelimitation in ADL
10 9.9

7State of Health in the EU · Estonia · Country Health Profile 2019
ESTO
NIA
3 Risk factorsBehavioural risk factors account for almost half of all deaths
Estimates show that almost half of all deaths in Estonia (7 300 deaths) – above the EU average of 39 % of deaths – can be attributed to behavioural risk factors, including dietary risks (4 000 deaths),
tobacco smoking (2 300 deaths), alcohol consumption (1 500 deaths) and low physical activity (480 deaths) (Figure 6). Dietary risks include low fruit and vegetable intake and high sugar and salt consumption. Deaths attributed to dietary risks make up 26 % of all deaths in Estonia, higher than the EU average of 18 %.
Figure 6. About half of all deaths in Estonia can be attributed to modifiable lifestyle risk factors
Note: The overall number of deaths related to these risk factors (7 300) is lower than the sum of each taken individually (8 357) because the same death can be attributed to more than one factor. Dietary risks include 14 components such as low fruit and vegetable consumption and high sugar-sweetened beverage consumption. Source: IHME (2018), Global Health Data Exchange (estimates refer to 2017).
Unhealthy diet is a major public health issue in Estonia
Nutrition in Estonia can be improved in many different ways, including by reducing sugar, salt and fat (and in particular trans-fat) consumption and increasing fruit and vegetables consumption. Nearly half of the adult population (40-45 %) report that they do not eat fruit or vegetables every day, compared with one in three people in the EU on average.
One in five adults are obese, the third highest rate in the EU after Malta and Latvia. Overweight and obesity rates are also a growing issue in children as the rates have increased substantially over the last two decades, reaching 16 % and in 2013–14, close to the EU average of 17 %. Estonians are less physically active than the EU average, with 60 % of adults doing at least 150 minutes of moderate physical activity per week compared with the EU average of 64 %. Along with increasing physical activity, improving diet would allow Estonia to compare more favourably with other EU countries (Figure 7).
Dietary risksEstonia: 26%EU: 18%
TobaccoEstonia: 15%EU: 17%
AlcoholEstonia: 10%EU: 6%
Low physical activityEstonia: 3%EU: 3%

8 State of Health in the EU · Estonia · Country Health Profile 2019
ESTO
NIA Figure 7. Obesity and tobacco consumption are public health concerns in Estonia
Note: The closer the dot is to the centre, the better the country performs compared to other EU countries. No country is in the white ‘target area’ as there is room for progress in all countries in all areas. Sources: OECD calculations based on ESPAD survey 2015 and HBSC survey 2013-14 for children indicators; and EU-SILC 2017, EHIS 2014 and OECD Health Statistics 2019 for adults indicators.
2: Binge drinking is defined as consuming six or more alcoholic drinks on a single occasion for adults, and five or more alcoholic drinks for children.
More than one fifth of the adult population smoke daily
Tobacco consumption is still a major public health concern in Estonia, particularly among men, even though smoking rates have decreased since 2000. One in four men still reported smoking daily in 2018, and men are twice as likely as women to be daily smokers. On a more positive note, regular tobacco consumption in children has decreased over the past decade and is now below the EU average.
Men report substantially more binge drinking than women
In 2014, nearly one in four adults (23 %) reported binge drinking2 at least once a month, which is above the EU average (20 %). Similar to many other risk factors, the difference between men and women is very marked, with 37 % of men binge drinking and only 9 % of women. More than one third of 15-to 16-year-old adolescents in Estonia reported at least one episode of binge drinking during the past month in 2015 – similar to the EU average. While past policy efforts aimed to curb alcohol consumption, the new government elected in 2019 has softened one of these measures (see Section 5.1).
Socioeconomic inequality, particularly education, has a large impact on health risks
Lower educated Estonians are more likely to smoke, which in turn contributes to reduced health and life expectancy. Almost one third of adults (31 %) who had not completed their secondary education smoked daily in 2014, the highest rate of any country in the EU. This is 11 percentage points higher than the EU average (20 %) and more than twice as high as Estonians with a tertiary education (14 %). Comparing smoking across income groups presents a similar picture, but is not as extreme: 28 % of Estonians in the lowest income quintile smoke compared to 19 % in the highest income quintile.
6Vegetable consumption (adults)
Fruit consumption (adults)
Physical activity (adults)
Physical activity (children)
Obesity (adults)
Overweight and obesity (children)
Binge drinking (adults)
Binge drinking (children)
Smoking (adults)
Smoking (children)
Select dots + Effect > Transform scale 130%
9State of Health in the EU · Estonia · Country Health Profile 2019
ESTO
NIA
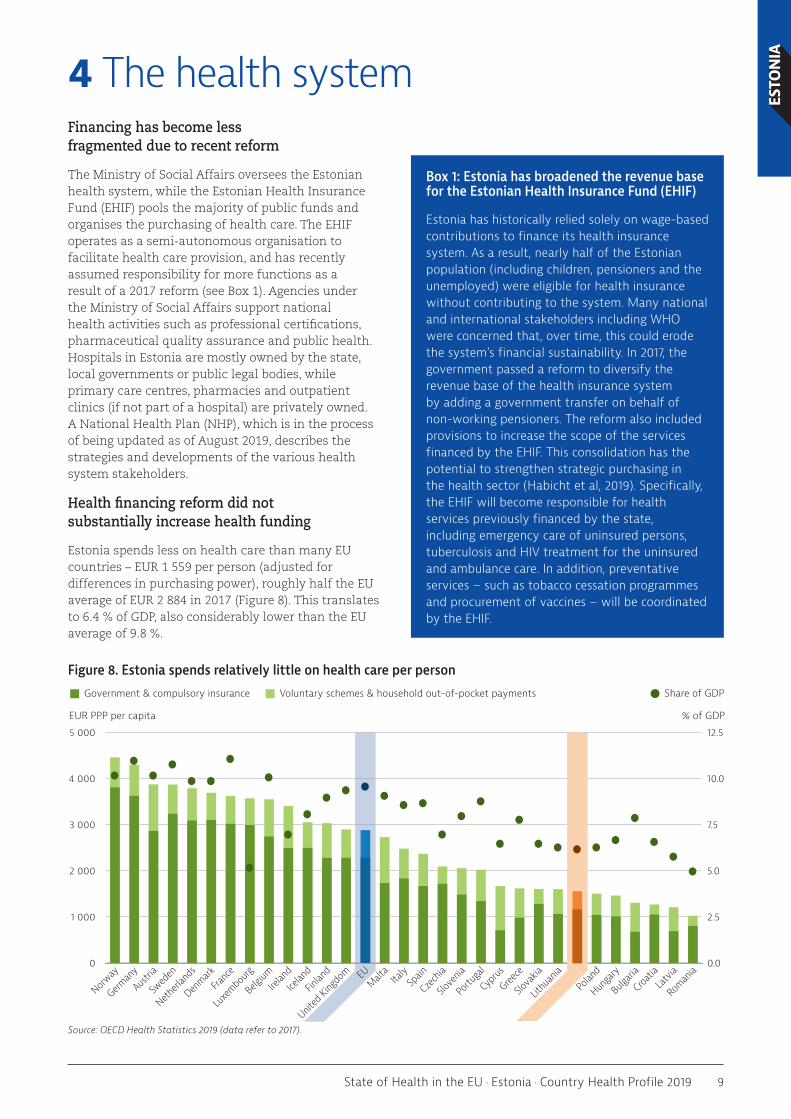
4 The health systemFinancing has become less fragmented due to recent reform
The Ministry of Social Affairs oversees the Estonian health system, while the Estonian Health Insurance Fund (EHIF) pools the majority of public funds and organises the purchasing of health care. The EHIF operates as a semi-autonomous organisation to facilitate health care provision, and has recently assumed responsibility for more functions as a result of a 2017 reform (see Box 1). Agencies under the Ministry of Social Affairs support national health activities such as professional certifications, pharmaceutical quality assurance and public health. Hospitals in Estonia are mostly owned by the state, local governments or public legal bodies, while primary care centres, pharmacies and outpatient clinics (if not part of a hospital) are privately owned. A National Health Plan (NHP), which is in the process of being updated as of August 2019, describes the strategies and developments of the various health system stakeholders.
Health financing reform did not substantially increase health funding
Estonia spends less on health care than many EU countries – EUR 1 559 per person (adjusted for differences in purchasing power), roughly half the EU average of EUR 2 884 in 2017 (Figure 8). This translates to 6.4 % of GDP, also considerably lower than the EU average of 9.8 %.
Figure 8. Estonia spends relatively little on health care per person
Source: OECD Health Statistics 2019 (data refer to 2017).
Box 1: Estonia has broadened the revenue base for the Estonian Health Insurance Fund (EHIF)
Estonia has historically relied solely on wage-based contributions to finance its health insurance system. As a result, nearly half of the Estonian population (including children, pensioners and the unemployed) were eligible for health insurance without contributing to the system. Many national and international stakeholders including WHO were concerned that, over time, this could erode the system’s financial sustainability. In 2017, the government passed a reform to diversify the revenue base of the health insurance system by adding a government transfer on behalf of non-working pensioners. The reform also included provisions to increase the scope of the services financed by the EHIF. This consolidation has the potential to strengthen strategic purchasing in the health sector (Habicht et al, 2019). Specifically, the EHIF will become responsible for health services previously financed by the state, including emergency care of uninsured persons, tuberculosis and HIV treatment for the uninsured and ambulance care. In addition, preventative services – such as tobacco cessation programmes and procurement of vaccines – will be coordinated by the EHIF.
Share of GDP
EUR PPP per capita % of GDP
Voluntary schemes & household out-of-pocket paymentsGovernment & compulsory insurance
0.0
2.5
5.0
7.5
10.0
12.5
0
1 000
2 000
3 000
4 000
5 000
Roman
iaLa
tvia
Croatia
Bulgari
a
Hunga
ry
Polan
d
Eston
ia
Lithu
ania
Slova
kia
Greece
Cypru
s
Portu
gal
Slove
nia
Czech
iaSp
ainItaly
MaltaEU
United
Kingdo
mFin
land
Icelan
dIre
land
Belgium
Luxe
mbourg
Franc
e
Denmark
Netherl
ands
Swed
en
Austri
a
German
y
Norway

10 State of Health in the EU · Estonia · Country Health Profile 2019
ESTO
NIA Three quarters of Estonian health spending comes
from the single payer health insurance system, while 25.3 % of spending is from household out-of-pocket (OOP) payments, mostly in the form of co-payments for medicines and dental care (Section 5.2). Public funding comes from an earmarked earnings-based employer contribution of 13 % and, since reforming the revenue base for health system financing, a state budget transfer on behalf of non-working pensioners. The budget transfer started in 2018 at 7 % of the total pension reimbursements and will increase to 13 % in 2022, matching the contribution rate from wages.
Estonia’s health system does not guarantee universal population coverage
The health insurance system managed by the EHIF covers about 94 % of the population. Until a financing reform in 2017, nearly half of the insured population (46.6 %), including children and pensioners, did not pay for health insurance, which shows strong solidarity in the system. Since the reform, most contributions come from the employed and from the state on behalf of non-working pensioners, which combined represent over 70 % of the population. As part of the reform, the EHIF has taken over financing of emergency care available to the uninsured population. This is the first time that the EHIF is responsible for financing health services for the entire population, prompting national discussions about achieving universal health coverage (Section 5.2).
Many services are provided in outpatient settings, leading to high outpatient spending
Estonians access the health system through a primary care network of independent general practitioners (GPs). Secondary health care is available at hospitals and outpatient care clinics, which can be either publicly or privately owned. Estonia’s two largest hospitals, located in Tallinn and Tartu, account for 50 % of specialist services. In 2016, only 53 of the approximately 1 400 health care institutions were classified as hospitals, a remarkable decrease from 120 hospitals in 1991, yet still high for Estonia’s population of 1.3 million people. The number of hospital beds, at 4.7 per 1 000 population, is lower than the EU average of 5 per 1 000 population.
As a result of these developments, Estonia uses most of its health spending on outpatient care (including dental care) and proportionally has the second highest ratio of outpatient to inpatient spending of any EU country after Portugal. In this respect, the spending patterns across the types of services in Estonia differ substantially from its Baltic neighbours, Latvia and Lithuania, which devote the majority of resources to pharmaceuticals and hospital care. All three countries are below the EU average for spending on long-term care (Figure 9), which can lead to barriers to access for elderly populations (Section 5.2).
Figure 9. Estonia’s high spending on outpatient care contrasts with its Baltic neighbours
Notes: Administration costs are not included. 1. Includes curative–rehabilitative care in hospital and other settings; 2. Includes home care; 3. Includes only the health component; 4. Includes only the outpatient market. Sources: OECD Health Statistics 2019, Eurostat database (data refer to 2017).
EU structural funds have supported infrastructure investments
While reimbursements from the EHIF are designed to cover infrastructure costs, many health care facilities
rely on funding from the state budget and European Structural and Investment Funds to support these investments. From 2014 to 2020, the EU will invest EUR 85 million to modernise or rebuild at least 35 primary health care facilities by 2023. Other EU
LithuaniaLatviaEstoniaPercentage point difference from the EU average
-15
-10
-5
0
5
10
15
PreventionPharmaceuticalsand medical devices4
Long-term care3Outpatient care2Inpatient care1
-3.0-1.4
1.0
13.0
2.3
-0.8
-10.4 -11.4
-7.9
2.6
13.010.9
0.1
-0.7 -0.9

11State of Health in the EU · Estonia · Country Health Profile 2019
ESTO
NIAinvestments from 2014-20 aim to improve access
to primary care, increase children’s health services, support community-based care and promote eHealth, and will total EUR 140.8 million (ESIF for Health, 2016).
Too few doctors and nurses are being trained to meet future needs
Estonia has fewer doctors (3.5 per 1 000 population) and nurses (6.2 per 1 000 population) than the EU average (Figure 10). The ratio of nurses to doctors
(1.8) is also below the EU average (2.3). According to estimates from the Ministry of Social Affairs, medical schools should admit 200 students and nursing schools should admit 700-800 students per year in order to cover future needs. However, the admission quota for publicly funded training positions was set at 185 in 2018 for medical schools and 517 in 2020 for nursing schools. The low number of nurses is exacerbated by low number of other skilled health professionals, including nutritionists and physiotherapists, thereby reducing the options for task shifting.
Figure 10. The number of doctors and nurses in Estonia is below EU averages
Note: In Portugal and Greece, data refer to all doctors licensed to practise, resulting in a large overestimation (e.g. of around 30 % in Portugal). In Austria and Greece, the number of nurses is underestimated as it only includes those working in hospitals. Source: Eurostat Database (data refer to 2017 or the nearest year).
The Estonian Health Insurance Fund offers incentives to providers
The benefits covered by the EHIF are defined through a list of products and services with a reimbursement price for each. After approval by the government, EHIF contracts with providers, which receive reimbursements for services provided, with mechanisms including fee-for-service, per-diems and diagnosis-related groups (DRGs). Additional payments are given to GPs who employ a family nurse to oversee care for patients with chronic diseases, or who practice more than 20 km from the nearest hospital.
GPs are also compensated for the number of patients who are registered with them and are eligible for
financial incentives, including lump sum payments and pay-for-performance to encourage certain activities. For example, using patient satisfaction surveys, eHealth services and staying open outside of normal office hours are examples of activities that can result in bonus payments for GPs. The EHIF sets strategic goals for doctors within the pay-for-performance system, and in 2018, 68 % of GP practices achieved a performance bonus, above the 61 % goal (EHIF, 2019). In combination, these incentives aim to increase the attractiveness of working and provisioning in primary care, broaden the scope of care, improve quality and balance financial risks between purchaser and provider (European Commission, 2019).
2 3 4 5 6 6.55.54.53.52.50
2
4
6
8
10
12
14
16
18
20
Practicing nurses per 1 000 population
Practicing doctors per 1 000 population
EU average: 8.5
EU average: 3.6Doctors High
Nurses Low
Doctors HighNurses High
Doctors LowNurses Low
Doctors LowNurses High
NO
DK
BE
CZ
MT LT
LU
IE
FRSI
UKRO
PL
EE
SKLV
ITES
CY BG
SE
DE
EL
IS
ATPT
FI
HU HR
EU
NL

12 State of Health in the EU · Estonia · Country Health Profile 2019
ESTO
NIA
5 Performance of the health system5.1. EffectivenessEstonia has room to improve mortality from preventable and treatable causes
While deaths that are avoidable through more effective health care and public health policies have decreased for many diseases, including ischaemic heart disease and stroke, Estonia still has higher rates
of mortality from both preventable and treatable causes than the EU average (Figure 11). Apart from ischaemic heart disease, which is the leading treatable cause of death, alcohol and tobacco consumption as well as accidental deaths are leading causes of preventable mortality.
Figure 11. Mortality from preventable and treatable causes are high in Estonia
Note: Preventable mortality is defined as death that can be mainly avoided through public health and primary preventive interventions. Mortality from treatable (or amenable) causes is defined as death that can be mainly avoided through health care interventions, including screening and treatment. Both indicators refer to premature mortality (under age 75). The data are based on the revised OECD/Eurostat lists. Source: Eurostat Database (data refer to 2016).
0 50 100 150 200 250 300 350
LithuaniaLatvia
HungaryRomania
EstoniaSlovakiaBulgariaCroatiaPoland
CzechiaSloveniaFinland
EUAustria
DenmarkGermanyBelgium
United KingdomGreece
PortugalLuxembourg
IcelandIreland
NetherlandsFrance
NorwaySweden
SpainMalta
ItalyCyprus
0 50 100 150 200 250
RomaniaLithuania
LatviaBulgariaHungarySlovakiaEstoniaCroatiaPoland
CzechiaGreece
EUUnited Kingdom
PortugalMalta
GermanyIreland
SloveniaAustriaFinland
DenmarkBelgiumCyprus
LuxembourgNetherlands
SwedenSpainItaly
FranceNorwayIceland100
110115118121129133134138139140140141
154155158161161161166
184195
218232232
244262
310325332336
626263676768697171717677788080
878789909395
128130
140143
168176
194203206208
Alcohol-related diseasesIschaemic heart diseasesAccidents (transport and others)
Lung cancer
Age-standardised mortality rates per 100 000 populationAge-standardised mortality rates per 100 000 population
Hypertensive diseasesOthers
Ischaemic heart diseasesHypertensive diseasesColorectal cancer
StrokeBreast cancerOthers
Preventable causes of mortality Treatable causes of mortality

13State of Health in the EU · Estonia · Country Health Profile 2019
ESTO
NIANot all policies aimed at disease
prevention have taken root
Estonia has implemented several policies to reduce smoking, contributing to a decline in the prevalence of this risky behaviour (Section 3). In addition to increased taxes on cigarettes, Estonia has adopted advertising bans for tobacco products, including banning advertisements at point of sale displays. Smoking is restricted in indoor public areas and workplaces, as well as in restaurants, bars and nightclubs (although it is still allowed in specially designated smoking rooms).
Former governments took strong action to reduce alcohol consumption, but the new government has relaxed one of these measures by reducing excise taxes on alcohol from July 2019. Despite climbing overweight and obesity rates, not much action has been taken on the issue, although the current government’s working programme includes the Green Paper on nutrition and physical activity, with a due date of November 2019.
Immunisation coverage for children has dropped below the EU averages
All the vaccines in Estonia’s national immunisation schedule are publicly funded but vaccination is voluntary. GPs and school nurses are responsible for vaccinating children (Rechel, Richardson & McKee, 2018). Estonia’s vaccination rates for children do not meet the WHO recommended target of 95 % and are declining. In 2007, two-year-olds had vaccination rates of 96 % for measles and 95 % for hepatitis B, diphtheria, tetanus and pertussis. However, in 2018, the rates for diphtheria, tetanus and pertussis declined to 92 %, the hepatitis B vaccination rate dropped to 93 % and the measles vaccination rate fell to only 87 % (Figure 12). The change in measles vaccination rates is especially concerning, as it dropped six percentage points in one year.
Estonia has the second lowest influenza vaccination rate among people aged 65 and over in the EU: 5 % compared to an EU average of 44 % and far below the WHO recommendation of 75 %. The vaccine is not part of the immunisation schedule and is not covered by statutory health insurance. Two pilot programmes began in 2019 to address the low influenza vaccination rates (Box 2).
Figure 12. Influenza vaccination rates among people aged 65 and over are extremely low
Note: Data refer to the third dose for diphtheria, tetanus, pertussis and hepatitis B, and the first dose for measles. Sources: WHO/UNICEF Global Health Observatory Data Repository for children (data refer to 2018); OECD Health Statistics 2019 and Eurostat Database for people aged 65 and over (data refer to 2017 or nearest year).
Box 2: New pilots aim to tackle low influenza vaccination rates
In response to low vaccination rates, Estonia developed two initiatives aimed at improving immunisation coverage for influenza. First, starting in 2019, the seasonal influenza vaccine will be available for people living in nursing homes, with costs covered by the state. Additionally, a pilot in October and November 2018 allowed Estonians to receive the influenza vaccine at pharmacies from trained health care workers. During this time, Estonia ran a marketing campaign to increase awareness and encourage citizens to protect themselves from the influenza virus.
EU
Diphtheria, tetanus, pertussisAmong children aged 2
%
%
%
%
94 %
94 %
93 %
44 %
MeaslesAmong children aged 2
Hepatitis BAmong children aged 2
InfluenzaAmong people aged 65 and over
92
87
93
5
Estonia

14 State of Health in the EU · Estonia · Country Health Profile 2019
ESTO
NIA Investments in primary care
resulted in decreasing levels of avoidable hospital admissions
Avoidable hospital admissions in Estonia are among the lowest in Europe for asthma and chronic obstructive pulmonary disease (COPD), and around average for diabetes and congestive heart failure (Figure 13). An Estonian study suggests that primary care has contributed to the reduction of avoidable
hospital admissions (Atun et al, 2016). Nevertheless, a government assessment indicates that nearly half (49 %) of patients seeking emergency care could have received care from their GP (National Audit Office, 2018). Overall, further efforts could be made to prevent hospital admissions and increase the coordination of care.
Figure 13. Estonia has lower avoidable admissions than the EU average
Source: OECD Health Statistics 2019 (data refer to 2017 or nearest year).
Government actions have led to dramatic decreases in newly reported HIV cases
For many years, Estonia had the highest rate of newly reported HIV cases in the EU, with infection rates in the mid-2000s close to 50 per 100 000 population, but the rate has declined in recent years to 17 per 100 000 population in 2017 (Figure 14). In December 2017, the National HIV Action Plan for 2017-2025 was
introduced to continue progress on the HIV epidemic, with the goal of halving the number of new HIV infections by 2025. The plan is supported by budget increases for both HIV prevention and treatment. The EHIF will assume responsibility of procuring HIV medications as part of the health financing reform, in an effort to increase efficiency in purchasing.
Figure 14. The number of newly reported cases of HIV has declined in Estonia
Source: ECDC & WHO Regional Office for Europe, HIV/AIDS Surveillance in Europe 2017.
Asthma and COPD Congestive heart failure Diabetes
Age-standardised rate of avoidable admissions per 100 000 population aged 15+
0
200
400
600
800
1 000
Lithu
ania
Hunga
ry
Polan
d
Slova
kia
German
yMalt
a
Czec
hia
Austri
aEU
21
Belgium
Finlan
dFra
nce
Denmark
Irelan
d
Norway
Swed
en
Esto
nia
United
Kingdo
m
Slove
nia
Netherl
ands
Icelan
dSp
ainItaly
Portu
gal
0
10
20
30
40
50EULithuaniaLatviaEstonia
2017201620152014201320122011201020092008200720062005
Notification rate per 100 000 population

15State of Health in the EU · Estonia · Country Health Profile 2019
ESTO
NIAMortality rates after hospital admission suggest
scope to improve quality of hospital care
The 30-day mortality rates after hospital admission provide an indication of hospital care quality and the effectiveness of medical interventions. In Estonia, 12 patients per 100 000 population died from heart attack and 17 died from stroke within 30 days from being admitted to hospital. This is higher than the EU average, although lower than in Latvia and Lithuania (Figure 15).
Cancer care outcomes are improving despite low levels of screening
Although cancer screening rates in Estonia are improving, they remain low by EU standards. In 2017, only 56 % of women aged 50-69 had been screened for breast cancer within the preceding two years and only around 50 % of women aged 20-69 had been screened for cervical cancer over the same period, compared with an EU average of over 60 % in both cases.
However, the quality of cancer care has improved over the past decade, and Estonians are seeing progressively higher survival rates of lung, breast, prostate and colon cancers. Five-year survival rates after diagnosis for most forms of cancer are approaching those elsewhere in the EU (Figure 16).
Figure 15. Deaths from heart attack and stroke after hospital admission exceed EU averages
Note: Figures are based on patient data and have been age–sex standardised to the 2010 OECD population aged 45+ admitted to hospital for AMI and ischaemic stroke. Source: OECD Health Statistics 2019 (data refer to 2017 or nearest year).
Figure 16: Cancer five-year survival rates have improved and are near EU averages
Note: Data refer to survival five years after diagnosis for people diagnosed between 2010 and 2014. Source: CONCORD programme, London School of Hygiene and Tropical Medicine.
EU26: 15 %
Lung cancer
EU26: 83 %
Breast cancer
EU26: 60 %
Colon cancer
EU26: 87 %
Prostate cancerEstoniaEstoniaEstonia Estonia : %: %: %: % 177786 58
30
25
20
15
10
5
0
30-day mortality rate per 100 hospitalisations
EU17
AMI Stroke
EU16EE
EE

16 State of Health in the EU · Estonia · Country Health Profile 2019
ESTO
NIA 5.2. Accessibility
Estonia has the highest level of unmet needs in the EU, mainly due to long waiting lists
Across all income levels, 11.8 % of Estonians report that their health needs are not met, compared to an EU average of 1.7 % (Figure 17). While unmet needs due to financial barriers are lower in Estonia (0.7 %) than the EU average (1.0 %), unmet needs due to distance are higher at 0.6 % (0.1 % EU average). However, waiting lists account for most of the
self-reported unmet needs in Estonia, with 10.5 % of the population reporting this as the major factor compared to the EU average of 0.7 %. While to some extent this may reflect higher expectations from the population in comparison to other Baltic countries, it does point to a serious problem with waiting times.
Figure 17. Estonians face the highest level of unmet needs in the EU
Note: Data refer to unmet needs for a medical examination or treatment due to costs, distance to travel or waiting times. Caution is required in comparing the data across countries as there are some variations in the survey instrument used. Source: Eurostat Database, based on EU-SILC (data refer to 2017).
The health system struggles to meet waiting time limits
The EHIF sets maximum waiting times for different types of care, including acute primary care, non-acute primary care, specialised outpatient care, day surgery and inpatient care. While appointments for primary care generally comply with the maximum waiting times, this is not the case for other categories of care. The EHIF defines a maximum waiting times of six weeks for a specialised outpatient care appointment; however, only 55 % of patients have appointments within this time frame (although the rate is up from 50 % in 2013). These access problems may be attributed to incentives that reward moving from primary care to specialised care, to limited services provided in primary care and/or to insufficient gatekeeping.
The trends in day care, which refers to day surgery and some types of non-surgical day care (e.g., chemotherapy, dialysis), and inpatient care are more worrying. Both have a maximum waiting times of eight months, but the health system’s ability to meet this target has declined since 2013 (Figure 18). In 2013, 98 % of patients waiting for day care and 90 % of patients waiting for inpatient care were able to have appointments within eight months, but this has decreased to 83 % and 73 %, respectively, in 2017. Given the already high levels of self-reported unmet needs due to waiting times, a continuation of these trends could further exacerbate the challenges Estonians face in accessing timely care (Kadarik, Masso & Võrk, 2018).
High income% reporting unmet medical needs Total population Low income
20
15
10
5
0
Netherl
ands
Spain
Malta
German
y
Austri
a
Luxe
mbourg
Czec
hia
Franc
e
Hunga
ry
Denmark
Norway
Swed
en
Lithu
ania
Cypr
us
CroatiaEUIta
ly
Bulgari
a
Belgium
Portu
gal
Slova
kia
Irelan
d
Icelan
d
United
Kingdo
mPo
land
Slove
nia
Finlan
d
Roman
iaLa
tvia
Greece
Esto
nia

17State of Health in the EU · Estonia · Country Health Profile 2019
ESTO
NIAFigure 18. Patients are unable to obtain appointments within EHIF-set waiting times
Source: EHIF data on waiting times, 2019.
Every year, the EHIF records people’s satisfaction with the accessibility of health care. In 2018, only 52 % of Estonians were satisfied with access, down from a high of 60 % in 2007 (EHIF, 2019). The NHP maintains a target of 68 % of the population being satisfied with access to care, which is unlikely to be achieved if current trends continue.
Barriers to access are experienced particularly by individuals needing long-term care
Individuals requiring both social and health care, particularly older people, face challenges in accessing the care they need. In Estonia, around 42 % of the population aged 65 and older are at risk of poverty and social exclusion compared to the EU average of 15 % in 2017 (Council of the European Union, 2019). Long-term care spending in Estonia (5.9 % of health spending) is below the EU average (16.3 %) and organised at the municipal level with a heavy reliance on informal caregivers and OOP spending. Additionally, medical care is not provided in long-term care facilities, which leads to uneven, and often insufficient, social and health care services for older populations. Investments in this area, including propagation of new care coordinator roles (see Section 5.3), could improve accessibility for this group.
Significant structural changes would be needed to achieve universal health coverage
Only 94 % of Estonians are covered by health insurance, and recent evidence from a 2018 study uncovered more information about the gaps in coverage (Koppel et al, 2018, Box 3). In November 2017, only 86 % of the working-age population were insured throughout the whole year, and many experienced temporary periods of not being insured. Uninsured
Estonians have access to emergency care only – not to preventative services, primary health care, medicines or non-emergency specialist care – resulting in significant health disparities.
Box 3. Understanding the uninsured in Estonia
Until 2018, no comprehensive review presented a clear picture of who made up the uninsured in Estonia. A PRAXIS study has found that since health coverage in Estonia is linked to employment, individuals with part-time work, unstable jobs or informal employment may experience insecure coverage. Furthermore, different legislation describes over 50 criteria defining eligibility for health insurance, which makes it difficult for Estonian citizens to navigate the system and avoid falling through the cracks. In general, the non-Estonian speaking population (which account for approximately a quarter of the population) and those with lower income levels are more likely to be uninsured.
The study also found that if Estonia were to make changes within the framework of its existing system, it could only expect to see an increase of the insured population by one percentage point. Therefore, a larger investment would be required to achieve universal population coverage. With the consolidation of functions as part of the health financing reform, the EHIF has taken over services for the uninsured from the Ministry of Social Affairs, and is now responsible for the entire population. This has spurred the conversation about universal population coverage in Estonia but so far, no commitment to this issue has surfaced.
40
50
60
70
80
90
100
Inpatient careDay care
Specialised outpatient carePrimary care: non-acute casesPrimary care: acute cases
20172016201520142013
% of patients with appointments within the maximum time

18 State of Health in the EU · Estonia · Country Health Profile 2019
ESTO
NIA Pharmaceuticals and dental care contribute
most to out-of-pocket spending
Estonia spends 23.6 % of health expenditure on OOP spending, above the EU average of 15.8 % but below the target of 25 % stated in the Estonian National Health Plan. Pharmaceuticals and dental care make up the largest part of OOP spending and are both above EU averages (Figure 19). Estonia has updated the level of reimbursements for both pharmaceuticals and dental care in recent years with the aim of limiting OOP spending.
During the recession, Estonia dropped adult dental coverage in order to save costs, but has reintroduced it more recently. Starting in 2017, Estonia made available a new dental care benefit package that covers the essential dental care for all adults as well as a 50 % co-insurance up to a EUR 40 annual maximum reimbursement for basic dental services (or a 15 % co-insurance up to EUR 85 for more vulnerable individuals). However, the EHIF reimbursements to dentists often fall below market rates, especially in cities, so some dentists have
abstained from signing EHIF contracts in favour of continuing private practice. As a result, more time is needed to determine how the reform in dental coverage will influence Estonians’ access to, and OOP spending on, dental care.
Estonia has also introduced reforms to lower OOP spending on pharmaceuticals dispensed outside hospitals. After recent reforms, if an individual’s total expenditure on prescription medications in a year is more than EUR 100, the EHIF automatically reimburses 50 % of the OOP cost between EUR 100-300 (from 2018); and if it is above EUR 300, it reimburses 90 % of the OOP cost (since 2015).
First results show that the reform has considerably increased the number of beneficiaries of reimbursed pharmaceuticals who receive additional cost reductions. In 2017, 0.7 % of beneficiaries received additional benefits at an average of EUR 129 per person – this increased sharply to 15.6 % with an average of EUR 77 per person in 2018. Consequently, the average OOP expenditure per prescription decreased from EUR 6.83 in 2017 to EUR 6.31 in 2018 (EHIF, 2019).
Figure 19. Estonia’s out-of-pocket expenditure is higher than the EU average
Source: OECD Health Statistics 2019 (data refer to 2017).
Inpatient 0.4%
Pharmaceuticals 8.5%
Dental care 7.4%
Long-term care 2.1% Others 1.9%
Outpatient medical care 3.2%
Inpatient 1.4%
Pharmaceuticals 5.5%
Dental care 2.5%
Long-term care 2.4%
Others 0.9%
Outpatient medical care 3.1%
OOP15.8%
Distribution of OOP spending by type of activities
Overall share of health spending
Distribution of OOP spending by type of activities
Overall share of health spending
Estonia
EU
OOPNot OOP
OOP23.6%
19State of Health in the EU · Estonia · Country Health Profile 2019
ESTO
NIA5.3. Resilience3
3: Resilience refers to health systems’ capacity to adapt effectively to changing environments, sudden shocks or crises.
The health financing reform made the EHIF less vulnerable but challenges remain
The reform to broaden Estonia’s revenue base for health insurance to include non-working pensioners in addition to the working population (Section 4) will increase the financial sustainability of the health system. The previous reliance on wage-earning individuals as the sole stream of income posed a serious risk to the Estonian health system, but this has now been eliminated. In addition, the reform pools resources under the EHIF and strengthens the purchasers’ role in the health system. More time is needed to determine whether these changes will improve access, increase care coordination and enhance efficiency.
The reform is not expected to substantially increase the currently low health spending in Estonia; therefore, it may not provide sufficient funds to support the medical needs of the ageing population and increasing prevalence of chronic diseases. Nor is it likely to support universal population coverage, as more structural reforms will be required in order to insure all Estonians. Moreover, it will not provide sufficient resources to fund infrastructure costs, as Estonia relies heavily on investments from EU Structural and Investment Funds to modernise its health infrastructure. While the EHIF does have accumulated reserves, structural changes, as well as increased funding, may be required to ensure the long-term financial sustainability of the health system.
Skill mix arrangements will be difficult to change until workforce challenges are resolved
Human resources shortages, particularly among nurses, continue to challenge the resilience of the Estonian health system (Section 4). The number of nursing graduates decreased from 467 in 2013 to 426 in 2016, and estimates predict that 700-800 nursing school graduates are needed to support future health care needs.
Health professionals are increasingly concentrated in the two cities of Tartu and Tallinn. Rural areas have become less attractive for health professionals due to a lack of financial incentives, heavy workloads in primary care and limited availability of technology and clinical expertise in specialist care. Moreover, non-health system factors, including educational opportunities for children, access to services and employment opportunities for spouses, are less prevalent in rural areas.
Additionally, trained professionals, including physiotherapists, care coordinators, nutritionists and dietitians, will be required to care for an increasingly older and overweight population, but incentives to practise in these disciplines remain limited. Without more trained health care professionals, objectives related to task shifting will be difficult to achieve.
More positively, Estonia is in the process of piloting a new approach for patients with complex care needs by introducing a care coordinator role in several municipalities. These care coordinators are tasked with bridging the gap between GPs and social workers in order to organise care in a more patient-centred way. The full results from this pilot are expected in the autumn of 2019. Additionally, Estonia has introduced a new model for primary health care centres which use group practices and an extended team to provide more integrated care.
Estonia generally has an efficient health system with a sharpened focus on outpatient care
A basic insight into the cost-effectiveness of the Estonian health system can be gained by relating mortality from treatable causes to health spending. While Estonia compares favourably in outcomes with some EU Member States with similar health expenditure, including Lithuania and Hungary, other countries such as Croatia and Poland spend less than Estonia on health and have lower mortality from treatable causes (Figure 20). This indicator suggests that Estonia has some potential efficiency gains within its health system.
Estonia’s focus on moving away from inpatient care is reflected in key indicators. The average length of stay for inpatient care has fallen from 9.2 days in 2000 to 7.6 days in 2017, slightly less than the EU average (7.9 days). Inpatient care discharges are also lower in Estonia (16 640 per 100 000 population) than the EU average (17 230 per 100 000), while the number of beds has declined from over 7 to 4.7 per 1 000 population between 2000 and 2017, compared with the EU average of 5.0. Given the considerable reduction in the number of hospital beds, Estonia’s occupancy rate has remained fairly stable: between 68 % and 72 % since 2004.
Other efficiency indicators reflect the trend of increased use of outpatient care and day surgery. As described in Section 4, Estonia has one of the highest ratios of outpatient to inpatient spending among EU Member States, reflecting a system-wide emphasis on ambulatory procedures. This includes cataract

20 State of Health in the EU · Estonia · Country Health Profile 2019
ESTO
NIA surgery, where 99 % of patients leave on the same day
of treatment, one of the highest percentages in the EU.
The EHIF uses incentives in its contracts to encourage specialist outpatient procedures, and evidence
suggests these incentives work and should continue. However, this may inadvertently contribute to waiting lists and unmet needs in specialist care, which (as described in Section 5.2) pose a considerable problem in Estonia.
Figure 20. Some EU countries with similar spending levels are more successful in treating patients
Sources: Eurostat Database; OECD Health Statistics 2019.
Health technology assessment informs reimbursement decisions
The EHIF defines the benefit package and price list for health services, pharmaceuticals and medical products and uses a systematic approach to add new benefits. The price list contains over 2 000 items with a range of payment mechanisms, and is updated at least once a year. Most hospital and outpatient medical care is covered by the EHIF, with pharmaceuticals, dental care and therapeutic appliances often using elements of cost-sharing (Section 5.2). The Ministry of Social Affairs and the EHIF use health technology assessment to assess the cost-effectiveness of new treatment measures, procedures and pharmaceuticals, providing a systematic decision-making tool for policymakers and the EHIF to determine reimbursement. Estonia’s advancements in eHealth similarly facilitate clinical outcomes, as described in Box 4.
Box 4. Estonia has advanced eHealth services
Estonia has advanced in digital innovation in health, and provides many health tools and services online. These include electronic health records, national image archiving, ePrescriptions, eReferrals, eAmbulance and eConsultations. Most recently, Estonia has introduced a central system for booking appointments, beginning in specialist ambulatory care but with plans to expand to GPs and dental care. A data exchange system allows linkages between various eServices in both the public and private sectors, and more than 96 % of Estonians hold an ID card that allows for digital authentication and access to eServices via the Internet. Additionally, the EHIF has used electronic billing data since the late 1990s, ahead of many other EU Member States.
The high level of digitisation in Estonia can potentially lead to better health outcomes. For example, doctors can access a patient’s full prescription history online, which helps prevent adverse medication interactions. However, some challenges in interoperability remain, especially relating to integrating eHealth solutions to care processes, outcome measurements and clinical decision-making.
500 1 000 1 500 2 000 2 500 3 000 3 500 4 000
250
200
150
100
50
0
Treatable mortality per 100 000 population
Health expenditure (long-term care excluded), EUR PPP per capita
NO
DK
NL
CZ
IEMT
LT
LU
FR
SI
RO
PLEE
SK
LV
ITESCY
BG
DEEL
IS
AT
PT
FI
HU
HR
EU UK
SEBE

21State of Health in the EU · Estonia · Country Health Profile 2019
ESTO
NIAEstonia can further increase its use of generics
Estonia’s use of generics has increased to 36 % of total pharmaceutical volume in 2017, up from 29 % in 2007 (Figure 21). However, this rate falls below the EU as a whole (50 %) and neighbouring Latvia has a generics volume of 74 %. Estonia also spends less of its total pharmaceutical spending on generics (16 %) than the EU average (23 %). Estonia could increase its use of policy mechanisms including mandatory generic substitution and awareness campaigns to increase the use of generic medicines.
The existing National Health Plan does not contain accountability mechanisms
The first NHP, covering 2009–20, set broad health goals but did not introduce effective strategic planning measures or accountability mechanisms. As a result, Estonia did not meet some of the targets of the NHP, including patient satisfaction indicators. The new NHP will contain three pillars: healthy choices, supportive environment for health and person-centred health care system, and is expected to be supported by more detailed operational plans. As of August 2019, the new NHP has gone through public consultation and according to the government’s working plan, it should be adopted by the end of the year.
Figure 21. Estonia uses fewer generic medicines than other EU countries
Note: Data refer to the share of generics in volume. Source: OECD Health Statistics 2019.
0%
10%
20%
30%
40%
50%
60%
EU17FinlandEstonia
2017201620152014201320122011201020092008200720062005
EU17FinlandEstonia

22 State of Health in the EU · Estonia · Country Health Profile 2019
ESTO
NIA
6 Key findings• The life expectancy of the Estonian people
continues to rise, and rapidly approaches the EU average of 80.9 years. Estonia has experienced the highest increase in life expectancy in the EU between 2000 and 2017 – from 71.1 up to 78.4 years. However, wide inequalities exist across gender, regional, income, and educational groups. Three out of four Estonians in the highest income quintile consider themselves to be in good health compared with only one in three in the lowest income quintile, the highest gap in Europe.
• Unhealthy lifestyle factors, including smoking, binge drinking, poor diet and lack of physical activity, result in nearly half of all deaths being attributed to these risk factors, a proportion that is higher than the EU average of 39 %. Estonia has the third highest adult obesity rate in Europe, with worrisome trends in children. Although smoking rates and alcohol consumption have declined, the higher prevalence of these risky behaviours among men contributes to their life expectancy being nine years lower on average than that of women. Recent policies on smoking and drinking and a lack of policies to curb the rise in obesity may not do enough to reach the population and especially more vulnerable groups.
• Health spending per capita in Estonia is approximately half the EU average, at EUR 1 559 in 2017. Three quarters of health spending comes from government and compulsory insurance schemes, while 24 % of spending consists of out-of-pocket payments, largely in the form of co-payments for outpatient medicines and dental care. A large part of spending is allocated to outpatient services, as Estonia relies on general practitioners and outpatient specialists to provide the primary point of care.
• Many Estonians report that their health needs are not met, with 11.8 % of them experiencing unmet needs compared to an EU average of 1.7 %. This is largely due to waiting lists: Estonians are 15 times more likely to report unmet needs due to waiting lists than the EU average. Waiting lists are most common in specialist care, although day surgery and inpatient care are increasingly provided outside the time frames set by the health insurance system.
• In 2017, the Estonian government passed a reform to diversify the revenue base of its single-payer health insurance system. Previously, financing came from an earmarked earnings-based employer contribution on wages. Starting from 2018, the government has added a contribution on behalf of pensioners to improve the fiscal sustainability of the health system. In effect, this change also increases the scope of the Estonian Health Insurance Fund to purchase health services for the entire population and not only the 94 % who have insurance. Although this reform will improve fiscal sustainability, the currently low spending level in the health system is not expected to increase substantially.
• Targeted investments in key areas, including health technology assessment, primary health care and eHealth, offer promising opportunities to increase the resilience of the health system in the future. However, insufficient supply of newly trained doctors and especially nurses may compromise the health system in the upcoming years, particularly in light of the increasing prevalence of chronic diseases and the subsequent need for more integrated care. Generally low levels of spending on health, as well as an excessive reliance on EU Structural and Investment Funds for capital investments, may threaten broader goals, including universal health coverage.

23State of Health in the EU · Estonia · Country Health Profile 2019
Key sourcesHabicht T et al. (2018), Estonia: Health system review. Health Systems in Transition, 20(1):1–193.
OECD, EU (2018), Health at a Glance: Europe 2018: State of Health in the EU Cycle. OECD Publishing, Paris, https://www.oecd.org/health/health-at-a-glance-europe-23056088.htm
ReferencesAtun R et al. (2016), Shifting chronic disease management from hospitals to primary care in Estonian health system: Analysis of national panel data. Journal of Global Health, 6(2):020701.
Council of the European Union (2019), Council Recommendation on the 2019 National Reform Programme of Estonia, http://data.consilium.europa.eu/doc/document/ST-10159-2019-INIT/en/pdf
EHIF (2019), Eesti elanike hinnangud tervisele ja arstiabile 2018 [Estimates of Estonian residents’ health and medical care 2018]. Estonian Health Insurance Fund, Tallinn.
ESIF for Health (2016), Mapping of the use of European Structural and Investment Funds in health in the 2007-2013 and 2014-2020 Programming Periods. ESIF for Health.
European Commission (2019), Joint report on health care and long-term care systems and fiscal sustainability – Country documents 2019 update. Institutional Paper 105. European Commission, Brussels.
Habicht T et al. (2019), The 2017 reform to improve financial sustainability of national health insurance in Estonia: Analysis and first lessons on broadening the revenue base, Health Policy, 123(8):695-99.
Kadarik I, Masso M, Võrk A (2018), ESPN Thematic Report on Inequalities in access to healthcare: Estonia 2018. European Commission Directorate-General for Employment, Social Affairs and Inclusion, Brussels.
Koppel K et al., (2018), Ravikindlustus valitutele või ravikaitse kõigile – kuidas täita lüngad Eesti ravikindlustuses? [Health insurance for electives or health care for all – How to fill gaps in Estonian health insurance?]. Poliitikauuringute Keskus Praxis [Praxis Center for Policy Studies], Tallinn.
National Audit Office (2018), Emergency Medicine. Does the department of emergency medicine treat primarily patients whose health condition requires emergency care? Report of the National Audit Office of Estonia to Parliament (Riigikogu). National Audit Office, Tallinn.
NIHD (2019), Health Statistics and Health Research Database. National Institute for Health Development, Tallinn, http://pxweb.tai.ee/PXWeb2015/index_en.html
Rechel B, Richardson E, McKee M, eds. (2018), The organization and delivery of vaccination services in the European Union. European Observatory on Health Systems and Policies and European Commission, Brussels, http://www.euro.who.int/__data/assets/pdf_file/0008/386684/vaccination-report-eng.pdf?ua=1
Country abbreviations
Austria ATBelgium BEBulgaria BGCroatia HRCyprus CYCzechia CZ
Denmark DKEstonia EEFinland FIFrance FRGermany DEGreece EL
Hungary HUIceland ISIreland IEItaly ITLatvia LVLithuania LT
Luxembourg LUMalta MTNetherlands NLNorway NO Poland PLPortugal PT
Romania ROSlovakia SKSlovenia SISpain ESSweden SEUnited Kingdom UK

State of Health in the EUCountry Health Profile 2019
The Country Health Profiles are an important step in the European Commission’s ongoing State of Health in the EU cycle of knowledge brokering, produced with the financial assistance of the European Union. The profiles are the result of joint work between the Organisation for Economic Co-operation and Development (OECD) and the European Observatory on Health Systems and Policies, in cooperation with the European Commission.
The concise, policy-relevant profiles are based on a transparent, consistent methodology, using both quantitative and qualitative data, yet flexibly adapted to the context of each EU/EEA country. The aim is to create a means for mutual learning and voluntary exchange that can be used by policymakers and policy influencers alike.
Each country profile provides a short synthesis of:
· health status in the country
· the determinants of health, focussing on behavioural risk factors
· the organisation of the health system
· the effectiveness, accessibility and resilience of the health system
The Commission is complementing the key findings of these country profiles with a Companion Report.
For more information see: ec.europa.eu/health/state
Please cite this publication as: OECD/European Observatory on Health Systems and Policies (2019), Estonia: Country Health Profile 2019, State of Health in the EU, OECD Publishing, Paris/European Observatory on Health Systems and Policies, Brussels.
ISBN 9789264289208 (PDF) Series: State of Health in the EU SSN 25227041 (online)