European Energy Industry from Boom to Crisis and ...
21
1 Facing the Climate and Digital Challenge: European Energy Industry from Boom to Crisis and Transformation Alte Midttun 1 and Proadpran Boonprasurd Piccini 2 Abstract Our study shows how leading European energy companies (electricity and gas) that staged extraordinary growth in the mid-2000s experienced serious setbacks after the 2008 financial crisis. Not only did they lose share value dramatically, they have also retained depressed share value long after the general economy embarked on an upward trend. The dramatic shift in energy industry’s value creation has been taking place in a period of transformative policy change, involving European Union ever-stronger climate policy on top of its previous policy for deregulation. Concurrently, information technology has opened up avenues for new sharing economy and customer-centric green energy ‘prosumership’ which challenges conventional electricity industry based on a centralised generation model. Based on nine case studies, this report explores business models and strategic trajectories behind this development, and finds that companies have moved in several directions with fairly different results. While a group of large players has retained the most depressed share prices, several medium sized companies have done substantially better. Engagement in renewable generation appears to have a positive effect on share prices. Green spinoffs from two energy incumbents, which have done far better than their mother companies, provide evidence which points in the same direction. Suppliers of renewable energy technology such as wind turbine manufacturers have done remarkably better, although their share value has oscillated far more than conventional energy industry. The solar technology supplier, however, has done worse than the conventional energy industry. Finally, the study examines some of the emerging customer-centric approaches, and shows how they are ‘invading’ the conventional energy sector with new business models that challenge energy industry both at the product, business and industry levels. Based on this analysis, the study presents perspectives on future positioning of a sustainable European energy industry. 1 Email: [email protected] 2 Email: [email protected]
-
Upload
khangminh22 -
Category
Documents
-
view
0 -
download
0
Transcript of European Energy Industry from Boom to Crisis and ...

1
Facing the Climate and Digital Challenge: European Energy Industry from Boom to
Crisis and Transformation
Alte Midttun1 and Proadpran Boonprasurd Piccini2
Abstract
Our study shows how leading European energy companies (electricity and gas) that staged
extraordinary growth in the mid-2000s experienced serious setbacks after the 2008 financial crisis.
Not only did they lose share value dramatically, they have also retained depressed share value long
after the general economy embarked on an upward trend.
The dramatic shift in energy industry’s value creation has been taking place in a period of
transformative policy change, involving European Union ever-stronger climate policy on top of its
previous policy for deregulation. Concurrently, information technology has opened up avenues for
new sharing economy and customer-centric green energy ‘prosumership’ which challenges
conventional electricity industry based on a centralised generation model.
Based on nine case studies, this report explores business models and strategic trajectories behind
this development, and finds that companies have moved in several directions with fairly different
results. While a group of large players has retained the most depressed share prices, several medium
sized companies have done substantially better. Engagement in renewable generation appears to
have a positive effect on share prices. Green spinoffs from two energy incumbents, which have done
far better than their mother companies, provide evidence which points in the same direction.
Suppliers of renewable energy technology such as wind turbine manufacturers have done
remarkably better, although their share value has oscillated far more than conventional energy
industry. The solar technology supplier, however, has done worse than the conventional energy
industry.
Finally, the study examines some of the emerging customer-centric approaches, and shows how they
are ‘invading’ the conventional energy sector with new business models that challenge energy
industry both at the product, business and industry levels. Based on this analysis, the study presents
perspectives on future positioning of a sustainable European energy industry.
1 Email: [email protected] 2 Email: [email protected]

2
1 Overview
European Energy Industry has seen a dramatic change in the first one and a half decades of the 21st
century. Business strategies that were widely acclaimed and worked excellently up until 2008
seemingly ran out of steam and never regained their momentum after the financial crisis. Gradually,
a new generation of business models has emerged, with radically different focus and composition.
The focus of the central energy incumbents at the turn of the millennium was generally based on the
economics of scale and scope, which had traditionally played a central role in the energy industry.
The customer was typically supplied with reliable delivery of energy, gas, electricity, and sometimes
supplemented with water and waste disposal. De-regulation in the 1990s and early 2000s typically
brought these sectors under competitive pressure, although the grid-infrastructure remained under
natural monopoly regulation. For both the competitive and monopoly segments, the focus was on
classical arguments of cost advantage gained due to size, scale of operation and co-production
(Bersanko et al 2013; Gaughan 2002).
The period following the financial crisis has seen the emergence of new business strategies,
characterised by green transition, de-centralisation, digitalisation and network economics. Motivated
by the need to meet the climate challenge, extensive public funding has brought considerable
volumes of renewable energy on the market, some of which was installed by consumers, leading to a
trend of self-supply ‘prosumership’ in many EU countries. Over time, this has come to constitute a
sizeable de-centralised supplement to the traditional centralised electricity industry (Schleicher-
Tappeser 2012). As digital technologies are increasingly applied to energy infrastructure (Bughin and
Manyika 2012), roles and relations in energy industry have started to be redefined (WEF 2016) and
integrated into new types of entrepreneurship.
Our study also investigates responses from new green and digital competitors, as they move into the
market. Relating to this dynamic technological and commercial setting, we concur with Chesbrough
and Rosenbloom (2002) in their argument for adding a strong emphasis on the technological
dimension of the business model, which thus becomes a focusing device that mediates between
technology development and economic value creation.
As Henry Mintzberg (1985) has pointed out, disruptive changes in technologies, business models and
industrial configuration raise a fundamental dilemma in business strategy: On the one hand,
deliberate strategising, emphasising central direction and hierarchy, as well as goal-oriented
planning, may be highly efficient under stable development with only incremental innovation. On the
other hand, transitory situations call for emergent strategies with open, flexible, responsive and
learning oriented management. Mintzberg argues that the latter is especially important when an
environment is too unstable or complex to comprehend, or too imposing to defy. Similarly,
researchers like Sarasvathy (2009) and Reis (2011) argue for trial and error based on user
requirements and as opposed to planning and bureaucratic processes as efficient strategies to meet
disruptive transition. Probing into Mintzberg’s strategic dilemma, our study explores how central
actors in European energy industry have framed their strategic outlook as they experienced the
challenge of moving from strategising under scale and scope to new unchartered terrain under de-
centralised green and digital transition.

3
2 Methodology
The study was based on a longitudinal comparative analysis of nine European energy incumbents,
spanning 2000 - 2016. To supplement our research, the analysis of incumbents was compared to
developments in the following three other groups of companies: 1) Green spinoffs from major
European companies, 2) Renewable technology suppliers and 3) Emerging new actors in the
European energy market.
The group of energy incumbents consisted of the following energy and utilities companies: Enel, ENGIE (former GDF Suez), EDF, E.ON, RWE and Iberdrola, representing the largest European players based on power sales (Statista 2016)3. We also included SSE, based on Forbes calculation of market capitalisation, assets, sales and profit (Power Technology 2016). We added two additional players to the group of incumbents: Verbund – the Austrian hydropower company, and Fortum – the Finnish energy company. Verbund was added as a traditional renewables based player, while Fortum was added because of its relatively high success in spite of operating in a low price Nordic energy market.
The green electricity generators included Enel Green Power – the spin-off from the Italian Enel, and EDP Renovaveis – the spin-off from the Portuguese EDP. The group of European renewable technology suppliers consisted of the Danish Vestas Wind System - the world’s largest manufacturer of wind turbines, followed by its German peer Nordex. The last player was SolarWorld - the German solar panel manufacturer. We also briefly surveyed a group of emerging new actors in the energy market in order to bring in radically different business models. This included companies such as Sungevity (decentralized solar power), Techem (real estate comfort and energy management), Quivicon (internet based smart home platform), and Kiwigrid (internet based energy systems management company).
The analysis was explorative and combined qualitative and quantitative approaches. It did so by
coupling a pragmatic textual analysis of strategic framing with a statistical analysis of economic and
resource indicators. This allowed us to study the commercial trajectories, through analysing the
underlying business models and how they have evolved over time, as well as to learn potential
factors affecting conventional generators and the European electricity energy industry as a whole. A
main source of information for top management’s framing of company strategy was their investor
communication in annual reports, particularly in the letters to the shareholders. This overview of
strategies and business models was juxtaposed with economic data (e.g. EBIT, net profit, dividend,
various financial ratios and share price development, and installed and production capacity, etc.) and
resource data (energy sources mix in generation), all computed from 2000 or as long as they have
existed. The main sources for the quantitative data were the companies’ publications, Financial
Times and Bloomberg’s databases (FT 2016; Bloomberg 2016). The limited number of cases restricted
how far the statistical analysis could be taken, and also dictated fairly simple statistical techniques
such as Pearson Correlation analysis and ANOVA group comparisons.
Redefining strategies and business models in the energy industry involves reinventing business
configurations across sectors and value chains. To structure our analysis of energy industry’s complex
strategic transition, we shall outline the strategic ‘opportunity space’ in a two-dimensional format
(figure 2.1).
3 Swedish Vattenfall, which would have been included by the size-criterion, had to be excluded from the analysis since the company is not listed on a stock exchange market.

4
Figure 2.1. The Opportunity Space for Business Configuration of Energy Industry
In this format, the sectors within
the circle indicate the sections of
the economy that are potentially
relevant to energy-related business
reconfiguration, such as electricity,
water/sewage, ICT and telecom,
building, engineering and
petroleum. Each sector is
subsequently divided along a value-
chain dimension into ‘upstream’
resource related activities towards
the periphery to ‘downstream’
customer related
activities in the centre.
3 Results
3.1 European Electricity Industry in Transition
3.1.1 E.ON and RWE from Supernovas to Black Holes
Golden Age of Success: Consolidating Scale and Scope
We started our research with the major German incumbents E.ON and RWE as core cases. Both E.ON
and RWE began their 21st century on a merger and acquisition spree as part of an accelerating
consolidation in the electric-utility industry following the deregulation in the late 1990s.
Figure 3.1. E.ON and RWE Benchmarked against DAX and DJI 2000-2007 The massive upscaling of both
companies took place against
the background of impressive
economic success. Markets
picked up in 2003 after the
burst of the dot com bubble.
Following the increase in
electricity prices, both
companies saw an extensive
upswing in share prices
(figure 3.1), featuring growth
many times higher than
industry at large (E.ON 2016;
Source: Financial Times (2016) RWE 2000a).
When it comes to the green dimension, neither E.ON nor RWE started the new millennium by
reframing themselves as green pioneers. With a critical attitude to German green energy policy, they
saw themselves as conventional actors aimed at moving slowly towards a green agenda with
conventional low-carbon solutions like natural gas, playing a major role (E.ON 2001; RWE 2000a).

5
Nevertheless, both companies gradually revised their harsh critique of government greening policies
and took on board part of the green agenda, but predominantly in line with conventional energy
supply (E.ON 2005; RWE 2006).
By 2007, both E.ON and RWE could note great successes. The two companies had built up their broad
and integrated energy supply chains through ambitious mergers and acquisitions. They had also
consolidated their business focus through sales of non-core business, thereby generating financial
assets that allowed further expansion. Both companies maintained a broad engagement along the
whole energy value chain including competencies from generation, transmission, wholesale trading,
distribution and retailing. Long standing supply-partnerships with major multi-engineering companies
such as Siemens allowed them to supplement internal competencies with highly qualified external.
Financially, the “golden age of success” was highly profitable for both companies. Electricity prices
were rising, and energy industry shares grew at a much higher rate than the rest of the economy.
Shared utilisation of organisations, expertise and customer bases allowed RWE and E.ON to reap
advantages of scale and scope. The business model was strengthened by value feedback from the
stock market, boosting E.ON and RWE stocks far beyond the industrial average. This development
and a similar boom in profit rates made it hard to question business as usual.
Crisis and Transition: New Emergent Models
The financial crisis and the following slowdown of the European economy offered a serious blow to
the profitability of the two German incumbents, leading to a massive drop in share value, under
declining electricity prices. As opposed to the German economy as a whole, the share value of E.ON
and RWE do not pick up, but rather continues on a downward trend (figure 3.2).
Figure 3.2. E.ON, RWE Benchmarked against DAX and DJI 2008-2016 In this period, E.ON and RWE
have undertaken a major
reframing of their strategic
outlook. The first step was to
emphasise efficiency and
consolidation as core foci in
meeting what was seen to be
a temporary economic
downturn. A second step in
reframing was to gradually
introduce green energy as a
more substantive area of
focus, thus aligning more with
public energy policy.
In a final and more dramatic move, the incumbents accepted that the challenge to its business was of
deeper and structural nature, and hence has to be met with more fundamental strategic rethinking.
At the beginning, E.ON started responding to the unfamiliar downturn by strengthening its focus on
efficiency. Gradually the company was also pushed to downscale, and stepped up divestment to
secure its financial solidity (E.ON 2008a). The economic setback was seen as a blow against its
traditional strategy and the downgrading of conventional generation went together with an
upgrading of renewables (E.ON 2012). The shifting priorities from conventional to renewables and
Source: Financial Time (2016); Base year = 0%

6
from centralised to de-centralised customer focused strategy came in 2014, when E.ON announced
its dramatic turnaround by splitting the company into two companies (E.ON 2014).
RWE initially took a more upbeat position than E.ON in its response to the economic downturn. It has
also met the economic crisis with a strengthened focus on efficiency, while aggressively continuing
its expansive investment and its merger and acquisition programme from the golden age (RWE 2008;
RWE 2009; RWE 2011). However, a more pessimistic outlook was adopted and the expansive plans
were reversed in 2013 (RWE 2013). RWE has gradually developed its green agenda, and in 2014
renewable energy was defined as one of the three growth areas, while the other two were networks
and supply. The company thereby recognized that the epoch of expanding large-scale central stations
had come to an end (RWE 2014).
Over the years following the financial crisis, both E.ON and RWE have moved towards more dualistic
business models. The contours of the customer-centric business model have been introduced, but
are less clearly defined. The concept has been mentioned, but the business model remains under-
developed at this point, as illustrated in figure 3.3.
Figure 3.3. E.ON and RWE’ dual Structures
Old, Dominant Models New Emergent Models
3.1.2 Other European Incumbents with Share Value Losses
E.ON and RWE’s pattern was followed by many other incumbent energy utilities. The Italian Enel, the
French ENGIE, the French nuclear champion EDF and the Austrian hydropower based VERBUND had
seen massive rise in their share value under the ‘golden age’.
Figure 3.4. Major European Energy Companies with Share Value Losses 2000 -2016
However, by 2016 all the
gains had evaporated and
they found themselves
with net value losses
compared to 2000, or for
EDF and ENGIE to 2005
when their shares were
noted on the stock
exchange (figure 3.4). Yet
in spite of their common
experience, the strategies
to meet the crisis vary.
Source: Financial Times (2016)

7
3.1.3 Other European Incumbents with Share Value Gains
In spite of the share value losses, there are incumbents that performed clearly above the industrial
average (figure 3.5).
Figure 3.5. European Incumbents with Share Value Gains 2000 – 2016
The Finnish Fortum and
the British incumbent
Scottish & Southern
Energy (SSE) both had a
share price growth of
more than 200% in the
beginning of 2016
compared to 2000. This
was more than twice the
share price increase in the
general economy.
Source: Financial Times (2016)
Iberdrola is another energy major that had a positive share price development, particularly after
2012.
3.2 Indicators under the Transition The large variation in business models and strategic configuration, as well as our limited sample,
makes it hard to find clear patterns that reveal the factors behind success. The business strategies
behind our incumbent cases are quite diverse: On the one hand, Iberdrola, Enel and ENGIE have
attributed much of their success to revenue from extensive engagement in external growth markets.
On the other hand, SSE has boosted its share price through strong engagement in the home market.
While SSE, for instance, has highlighted its broad engagement across generation, transmission and
distribution, and even into telecom, Fortum has highlighted its concentration of production and
sales, and its divestment of distribution, as a reason for success. Iberdrola has chosen the opposite
strategy and engaged strongly in the regulated grid and renewables sectors.
Nevertheless, in our statistical analysis, three indicators stand out as factors behind share value
success of our nine case studies: 1) the energy mix, 2) the business size and 3) financial performance
3.2.1 The energy source effect
As indicated in table 3.1, the change in wind and renewable output in the companies’ energy mix
correlates positively with the share price. Companies that have scaled up renewables, especially wind
power, have done significantly better in the period after the financial crisis (2008-2016). The fact that
the renewables and wind effect comes only in the second period may be indicative of the change in
energy policy outlook, and guaranteed feed-in tariffs for renewables, in contrast to brutal markets
for conventional generation.

8
Table 3.1. Correlations between Energy Source Mix and Change in Share Price (2000-2016)
Share price 00 – 07 (%)
Share price 08 – 16 (%)
% Wind power 2015
Pearson Correlation -,068 ,770*
Sig. (2-tailed) ,874 ,025
N 8 8
RE_Output change '00-'15(%)
Pearson Correlation ,067 ,821*
Sig. (2-tailed) ,874 ,012
N 8 8
RE_Proportional change '08-'15(%)
Pearson Correlation ,055 ,763*
Sig. (2-tailed) ,888 ,017
N 9 9
RE_Proportional change '00-'15(%)
Pearson Correlation -,284 ,781*
Sig. (2-tailed) ,495 ,022
N 8 8
Wind_Proportional change '08-'15(%)
Pearson Correlation -,056 ,804*
Sig. (2-tailed) ,895 ,016
N 8 8
Wind_Proportional change '00-'15(%)
Pearson Correlation -,181 ,802*
Sig. (2-tailed) ,698 ,030
N 7 7 **Correlation is significant at the 0.01 level (2-tailed); *Correlation is significant at the 0.05 level (2-tailed).
Source: Bloomberg (2016); E.ON (2000, 2006,2008b,c, 2015); EDF (2003,2007a,b, 2008a,b,c,2015); Enel (2000b, 2008a,b, 2009,2015); ENGIE (2008,2015); Financial Times (2016); Fortum (2001, 2007,2008, 2015b,2016); Iberdrola (2000, 2009, 2015, 2016); RWE (2000b, 2007, 2008, 2015); SHE & SE (2001); SSE (2009, 2015); Verbund (2000, 2007, 2008, 2015)
3.2.2 The size effect
Our other significant finding is a negative size effect on share price development. As indicated in
table 3.2, this effect only appears in the first period (2000 – 2007), when scale and scope were
strategic foci. The negative effect on share price may perhaps indicate that the dramatic merger and
acquisition spree of the largest companies, like E.ON and RWE, entailed very large investments,
which in turn may have negatively affected their liquidity. In the second period, this effect may have
drowned in general financial duress.
Table 3.2. Correlations between Installed Capacity and Share Price (2000 – 2016)
Share price 00 – 07 (%)
Share price 08 – 16 (%)
2008 Installed capacity (MW)
Pearson Correlation -,678* -,400
Sig. (2-tailed) ,045 ,286
N 9 9
2015 Installed capacity (MW)
Pearson Correlation -,714* -,295
Sig. (2-tailed) ,031 ,440
N 9 9
**Correlation is significant at the 0.01 level (2-tailed); *Correlation is significant at the 0.05 level (2-tailed). Source: E.ON (2000, 2006,2008b,c, 2015); EDF (2003,2007b, 2008b, 2015); Enel (2000b, 2008b, 2009,2015); ENGIE (2008,2015); Financial Times (2016); Fortum (2001, 2007,2008,2016); Iberdrola (2000, 2009, 2015); RWE (2007, 2008, 2015); SHE & SE (2001); SSE (2009, 2015); Verbund (2000, 2007, 2008, 2015)
3.2.3 The financial performance effect
Financial performance has also an effect on share price development, particularly in the second
period when challenges to the energy industry create clearer distinctions between winners and
losers. As shown in table 3.3, indicators of sound economic management, such as Return on Equity
(ROE), have a substantially positive share price effect. Liquidity indicators such as interest coverage

9
ratio4 also correlate significantly with share price in the second period. Companies with high liquidity
have been rewarded by the stock market, presumably because they had credibility in serving their
debt. Dividend payment also affects the share price positively.
Table 3.3: Correlations between Financial indicators and Share Price (2000 – 2016)
Share price 00 - 07(%) Share price 08 - 16(%)
Div. change '08-'15 (%)
Pearson Correlation ,438 ,694*
Sig. (2-tailed) ,239 ,038
N 9 9
ROE 2015
Pearson Correlation ,055 ,809**
Sig. (2-tailed) ,889 ,008
N 9 9
CFO pre W/C Interest Coverage 2015
Pearson Correlation ,189 ,698*
Sig. (2-tailed) ,626 ,037
N 9 9
**Correlation is significant at the 0.01 level (2-tailed); *Correlation is significant at the 0.05 level (2-tailed). Source: Bisset et al (2014); Bloomberg (2016); E.ON (2000,2007,2008b,2015); EDF (2000,2008b, 2009,2015); Enel (2000a,2008a,2015); ENGIE (2008,2009,2015); Financial Times (2016); Fortum (2001,2008,2015a); Iberdrola (2000,2008,2016); Investopedia (2016); RWE (2000b,2007,2008,2015); SSE (2001,2008,2015); Verbund (2000, 2008,2015)
3.3 Renewables, A Safe Haven? Given the extensive focus on climate change and the need for green transition, renewables would
appear to be a secure bet, and companies with a pure green profile should likely become market
winners. Our initial study of green spinoffs and green energy technology providers indicates that
these expectations are justified, although not without exceptions.
3.3.1 Green Spinoffs from Incumbents
The two green spinoff cases included Enel Green Power (EGP) and EDP Renovaveis (EDPR). EGP - the
spinoff from Enel Group - engages in a broad spectrum of renewable technologies, while the green
Portuguese spinoff – EDPR – focuses mainly on wind energy, with a small stake in solar power. As
indicated in figure 3.6 and table 3.4, both have been fairly successful and more lucrative than their
mother companies.
Figure 3.6. EDP Renovaveis and Enel Green Power Benchmarked Against their Mother Companies
Source: Financial Time (2016)
4 The Interest Coverage Ratio is measured by cash flow from operations before changes in working capital (CFO pre W/C) as practiced in Moody’s rating methodology for unregulated utilities and unregulated power companies

10
Table 3.4. EDP Renovaveis and Enel Green Power Benchmarked Against their Mother Companies
Share Price (€) 2010
(Nov.01,2010) 2016
(feb.10, 2016) Change
2010-2016 (%) Renewables in Energy
Mix 2015 (%)
Enel Green Power* 1,60 1,70 6,2 100,0 Enel 4,08 3,53 -13,5 31,4 EDP Renovaveis 4,15 6,60 59,0 100,0 EDP 2,75 2,88 4,7 58,0
*First trading record Nov. 01, 2010
Source: EDP (2015); EDPR (2016); Enel (2015); Financial Times (2016)
Enel Green Power (2016b) has managed to grow profitably, despite the challenging macroeconomic
context in Italy and the stagnation in consumption in the wake of the financial crisis. By focusing on
engagement in selected geographical areas and in renewables with attractive support programs, the
company achieved a strong and profitable growth with prospects for further development globally.
Following its success, the Enel Group decided to reintegrate EGP to the company’s core renewable
energy unit in 2016 (EGP 2016a).
EDP RENOVAVEIS (2016) engages actively in wind energy in many markets around the world. The
company has built up a sustainability profile by positioning itself on the FTSE4Good and Dow Jones
Sustainability indexes (EDPR 2011). In 2013, the company delineated a tipping point where
renewables is about to become the new mainstream and depicts a bright future, where not only
cost-competitiveness but also numerous positive side effects enhances their success (EDPR 2013).
3.3.2 Green Equipment Suppliers
Another group of pure green players in our study was the renewable technology suppliers. This group
included Vestas and Nordex, the wind turbine producers, and solar panel producers SolarWorld. All
companies saw a fabulous growth in share prices between 2005 and 2008, exceeding 650% value
growth. However, their share prices were hit hard by the financial crisis and lost much value between
2010 and 2012 (figure 3.7).
Figure 3.7. Share price development of green equipment suppliers 2005 – 2016
Nevertheless, after
organisational and
strategic reform, Vestas
and Nordex have been
able to note a positive
growth in share value
from 2012. By contrast,
SolarWorld has lagged far
behind and its share price
has not picked up.
Perhaps, this reflects the
strong competitive
challenge in solar cell.
Source: Financial Times (2016) production.
11
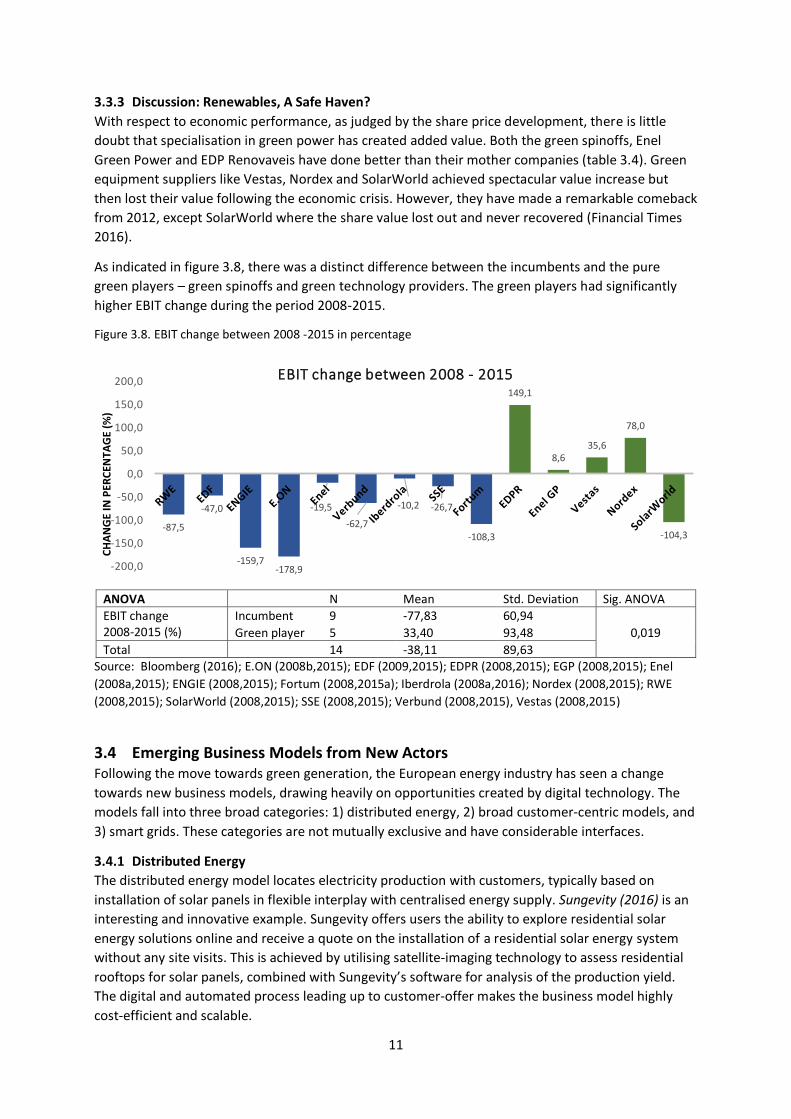
3.3.3 Discussion: Renewables, A Safe Haven?
With respect to economic performance, as judged by the share price development, there is little
doubt that specialisation in green power has created added value. Both the green spinoffs, Enel
Green Power and EDP Renovaveis have done better than their mother companies (table 3.4). Green
equipment suppliers like Vestas, Nordex and SolarWorld achieved spectacular value increase but
then lost their value following the economic crisis. However, they have made a remarkable comeback
from 2012, except SolarWorld where the share value lost out and never recovered (Financial Times
2016).
As indicated in figure 3.8, there was a distinct difference between the incumbents and the pure
green players – green spinoffs and green technology providers. The green players had significantly
higher EBIT change during the period 2008-2015.
Figure 3.8. EBIT change between 2008 -2015 in percentage
ANOVA N Mean Std. Deviation Sig. ANOVA
EBIT change 2008-2015 (%)
Incumbent 9 -77,83 60,94
0,019 Green player 5 33,40 93,48
Total 14 -38,11 89,63 Source: Bloomberg (2016); E.ON (2008b,2015); EDF (2009,2015); EDPR (2008,2015); EGP (2008,2015); Enel
(2008a,2015); ENGIE (2008,2015); Fortum (2008,2015a); Iberdrola (2008a,2016); Nordex (2008,2015); RWE
(2008,2015); SolarWorld (2008,2015); SSE (2008,2015); Verbund (2008,2015), Vestas (2008,2015)
3.4 Emerging Business Models from New Actors Following the move towards green generation, the European energy industry has seen a change
towards new business models, drawing heavily on opportunities created by digital technology. The
models fall into three broad categories: 1) distributed energy, 2) broad customer-centric models, and
3) smart grids. These categories are not mutually exclusive and have considerable interfaces.
3.4.1 Distributed Energy
The distributed energy model locates electricity production with customers, typically based on
installation of solar panels in flexible interplay with centralised energy supply. Sungevity (2016) is an
interesting and innovative example. Sungevity offers users the ability to explore residential solar
energy solutions online and receive a quote on the installation of a residential solar energy system
without any site visits. This is achieved by utilising satellite-imaging technology to assess residential
rooftops for solar panels, combined with Sungevity’s software for analysis of the production yield.
The digital and automated process leading up to customer-offer makes the business model highly
cost-efficient and scalable.
-87,5
-47,0
-159,7-178,9
-19,5
-62,7
-10,2 -26,7
-108,3
149,1
8,635,6
78,0
-104,3
-200,0
-150,0
-100,0
-50,0
0,0
50,0
100,0
150,0
200,0
CH
AN
GE
IN P
ERC
ENTA
GE
(%)
EBIT change between 2008 - 2015

12
With the prosumer concept, Sungevity and other similar companies challenges the conventional
business model of electricity industry at the customer interface. The prosumer model takes
advantage of the government authorised opportunity to establish de-centralised supplementary
green power. Exploiting existing centralised generation and grid-infrastructure, prosumers may count
on the right to sell surplus power to the incumbent electricity industry, and to buy supplementary
power in case of insufficient local generation. The economic attractiveness of the prosumer model is
that, while the costs of balancing supply and demand may be externalised, the use of advanced
satellite imaging and meteorological data allows for estimation of production potential and
associated financial offers at very low cost.
3.4.2 Broad Customer Centric Models
The broad customer-centric model attempts to integrate energy into a wider smart home platform,
across different manufacturers, brands and devices. According to sector analysts, the global smart
home market is growing exponentially, attracting an array of service providers, including technology
giants and startups to major media players, device makers, big-box retailers, home improvement
companies, utilities and telecom network operators (Markets and Markets, 2016). Deutsche
Telecom’s Qivicon (2016) is an interesting and innovative example. Qivicon and its partners have
been developing an ecosystem that covers not only energy efficiency at home but also the areas of
security, convenience and health. To achieve this, Qivicon has chosen a vendor-neutral solution that
enables users to combine different brands of Smart Home solutions (Hauptfleisch 2014; Rodrigues
2014). The platform’s technical control unit is connected to the Internet via a broadband connection
in the house or apartment. Qivicon partners’ devices can be controlled and monitored via various
applications on smartphones, tablets and PCs (Lösel 2014).
While the Telecommunication companies are moving into the ‘smart home’ space from internet and
mobile communication platforms, other actors have moved in from different positions. The German
energy service provider, Techem (2016) is a case in point. Techem is a leading provider of energy
services operating through two divisions. The first division, Energy Services, provides sub-metering
services of measuring heating use and water consumption of individual housing units, and
supplementary services such as smoke detector installation and maintenance and legionella analysis
in drinking water. The second division, Energy Contracting, offers a holistic management of clients'
energy consumption through planning, financing, construction and operation of heat stations,
boilers, cooling equipment and combined heating and power units (Moody’s 2016; Techem 2016).
Techem’s home or estate management system is linked up to a radio technology for remote reading,
which forms the basis for Techem’s added-value services for all aspects of energy, water and cost
savings. This offers customer advantages such as prompt billing, permanent supervision with
automated device monitoring, and retrieving of reading values, allowing for transparent
consumption and cost overviews. It also allows automatic control of heating systems with a saving
potential (Techem 2016).
3.4.3 Smart grids
The smart grid resembles the smart home in its ambition to link up several functions to a common
platform that allows for holistic management. However, while the smart home targets the individual
household, the smart Grid concept penetrates deeper into the supply chain and includes producers,
distributors and consumers. The recent German startup KIWIGRID (2016) is an interesting case. The
company has developed a system that offers a flexible and adaptable platform solution to equipment
manufacturers and energy utilities. It allows them to manage, monitor and control distributed energy
resources like generators, storage, energy consumers and e-mobility, as well as to manage their
interface with the electricity grid and centralised electricity supply.

13
Kiwigrid seeks to offer an intermediary platform between home appliance-integrators and de-
centralised generation on the one side, and the centralised energy system on the other. The
company business model thrives on the complexity of the modern energy system in Europe. The
extensive inputs of de-centralised generation makes the type of coordinated management, that
Kiwigrid facilitates, more and more necessary.
3.4.3 Emerging Business Models – What Do They Bring To The Table?
Most of the emerging business models circle around the customer-interface where various digital
solutions allow more flexible interplay between consumption and production of energy, and/or
between several service alternatives to fulfill basic needs for customer home-comfort. Seen from an
energy-sector perspective, they represent introduction of new platforms for service bundling, where
energy is one of the core elements. These platforms are controlled by new entrants from other
sectors, and energy incumbents are potentially reduced to one of many service providers that the
platform can combine in various ways tailored to customer needs (figure 3.9).
The prosumer model introduces de-centralised energy production at the consumption site in
competition with established centralised systems. It capitalises on flexible grid-access, often with
net-metering mandated by new regulation. This allows the prosumer model to balance off
intermittent production against flexible complementary supply from the central system without costs
beyond regular charge for the net consumption. When this model is complemented with an efficient
online exploration of residential solar energy solutions and a simple and understandable contractual
model, it becomes a highly attractive alternative. The prosumer model, Sungevity style, has the
advantage enabling unilateral implementation without partnering with complementary actors.
Figure 3.9. Emerging customer-centric models, a summary
The new digitally based model, which is closest aligned with traditional energy industry, is the smart
grid model. The model allows the conventional electricity grid to expand its scope by adding on a
flexible and adaptable platform solution for energy utilities, and to manage, monitor and control new
distributed energy resources like generators, storage, energy consumers and e-mobility. This is done
in conjunction with their management of the conventional energy system, so as to develop synergies
and integrated solutions.
The building comfort and home system management represent digital platforms that transfer
extensive control over the energy services to other actors with platform control. While the ICT

14
companies are moving into the ‘smart home’ space from internet and mobile telecommunication
platforms, other actors are building up ‘smart home’ solutions from positions as holistic management
of client’s technical systems. Either way, the electricity supply will be integrated in and subsumed
under more general management systems, where it will be more systematically exposed to
competition from alternative solutions and loose the direct customer- interface.
4. Conclusion Much of energy industry now exists in a dualist limbo, between conventional and emerging new
business strategies. From strategies of scale, scope and oligopolistic power based on conventional
technologies preceding the financial crisis, energy industry is moving into new unchartered terrain
characterised by greening, digitalisation, de-centralisation and disruptive innovation (figure 4.1).
Figure 4.1. From Technological to Industrial Reconfiguration
Elaboration inspired by Hammel (2000)
The strategic configuration during the ‘golden age’ focused on incremental product innovation to
drive energy efficiency, together with gas for coal substitution. Companies reinforced a multi-utility
and/or a multi energy model, and consolidated industrial concentration, accompanied with cautious
digital modernisation within established business practice. The strategic configuration in the next
period has been reshaping the industry, and redefining markets, products and customer relations
towards green energy, digital multi-functionality and de-centralised prosumer models. In this period,
digital platform providers have position themselves at the customer interface and bundled energy
into broader home management, or estate management systems. In addition come digital
communication and payment systems that have facilitate establishment of such platforms without
the need for massive investments in the hardware of the underlying infrastructures that characterise
the traditional grid-based energy supply.
As a consequence of the above disruptive transformation, energy industry in advanced European
markets is now searching for novel business models. While the first ‘golden age’ of scale and scope
competition of a mature industry invited strategic orientation geared at long term systematic
planning, the transition to the second emerging new industrial field has invited a more process
oriented strategic perspective.

15
With respect to products and services, the shifts have entailed engagement in renewables
generation, very often with government guarantees. They also involve a move away from exclusive
energy products towards broader services management, with an opening up of traditional sectoral
domains into broader customer-interfaces.
The network-logic of the new emerging business models entails a race for positioning as the
dominant platform provider acquires market control. The attractiveness of holding platform control
is that it allows the actors to dominate the customer-interface, as well as to set the standards for
industrial suppliers, while charging both sides (Baldwin and Clark 2000). There are therefore many
contenders for platform control, including attempts at commercial repositioning from energy-
incumbents.
Telecoms could, in many ways, be seen as a harbinger of the transition challenges that European
energy industry is currently going through. Compared to the telecoms sector, electricity has for a
long time been technologically and commercially stable. The competitive challenge was seen to lie in
scale and scope along a well-developed technological trajectory. The telecoms sector was in the
same period exposed to several technological quantum leaps - from fixed to wireless; from
specialised telecoms platforms to general internet etc., with dramatic consequences for leading
players like Ericsson and Nokia. With de-centralised green energy combined with digitalisation, the
world of energy in advanced European markets has entered a period of dramatic transformative
innovation, whose outcome is as exciting as it is unknown.
16
References
Baldwin, Carliss Y. and Clark, Kim B (2000) Design Rules, Volume 1: The Power of Modularity.
Cambridge, MA: MIT Press.
Besanko, David; Dranove, David; Schaefer, Mark; Shanley, Mark (2013) Economics of Strategy 6th
Edition. Wiley, USA.
Bisset, Niel; Solomon, Scott; Bilodeau, Augustin; Sherman, Franklin (2014) “Unregulated Utilities and
Unregulated Power Companies”, in Moody’s Rating Methodology. Report No. 172784. Moody’s
Investors Service, New York.
Bloomberg (2016) ‘Professional financial data’. Bloomberg Terminal.
http://www.bloomberg.com/professional/?utm_source=bloomberg-
menu&utm_medium=terminal&bbgsum=DG-WS-CORE-bbgmenu. Accessed 5 April 2016.
Bughin, Jacques and Manyika, James (2012) ‘Internet Matters Essays in Digital Transformation’.
http://www.mckinsey.com/business-functions/business-technology/our-insights/essays-in-digital-
transformation. Accessed 3 June 2016.
Chesbrough, H. W. and Rosenbloom, R. S. (2002) “The Role of the Business Model in Capturing Value
from Innovation: Evidence from Xerox Corporation’s Technology Spin-off Companies”. Industrial
and Corporate Change 11: 533–4.
E.ON (2000) 2000 Annual Report. Düsseldorf. http://www.eon.com/content/dam/eon-
com/en/downloads/e/EON_Annual_Report_2000.pdf. Accessed 9 March 2015.
E.ON (2001) 2001 Annual Report. Düsseldorf. http://www.eon.com/content/dam/eon-
com/en/downloads/e/EON_Annual_Report_2001.pdf. Accessed 9 March 2015.
E.ON (2005) 2005 Annual Report. Düsseldorf. http://www.eon.com/content/dam/eon-
com/en/downloads/e/EON_Annual_Report_2005.pdf. Accessed 9 March 2015.
E.ON (2006) Corporate Social Responsibility 2006. Düsseldorf.
http://www.eon.com/content/dam/eon-com/en/downloads/c/CSR_US_2006.pdf
E.ON (2007) 2007 Annual Report. Düsseldorf. http://www.eon.com/content/dam/eon-
com/en/downloads/e/EON_Annual_Report_2007.pdf. Accessed 9 March 2015.
E.ON (2008a) Annual Report Part I/II: 2008 Company Report. Düsseldorf.
http://www.eon.com/content/dam/eon-com/en/downloads/e/EON_Company_Report2008.pdf.
Accessed 9 March 2015.
E.ON (2008b) Annual Report Part II/II: 2008 Financial Report. Düsseldorf.
http://www.eon.com/content/dam/eon-com/en/downloads/e/EON_FB_US_2008.pdf. Accessed 9
March 2015.
E.ON (2008c) E.ON CR Reporting 2008. Düsseldorf. http://www.eon.com/content/dam/eon-
com/en/downloads/0/090616_CR08_Online_Report_2008-en.pdf. Accessed 9 March 2015.
E.ON (2012) 2012 Annual Report. Düsseldorf. http://www.eon.com/content/dam/eon-com/ueber-
uns/GB_2012_US_eon.pdf. Accessed 9 March 2015.
E.ON (2014) 2014 Annual Report. Düsseldorf. http://www.eon.com/content/dam/eon-com/ueber-
uns/publications/150312_EON_Annual_Report_2014_EN.pdf. Accessed 11 March 2015.
E.ON (2015) 2015 Annual Report. Düsseldorf. http://www.eon.com/content/dam/eon-com/ueber-
uns/publications/EON_Annual_Report_2015_EN.pdf. Accessed 14 April 2016.
E.ON (2016) ‘E.ON History’. http://www.eon.com/en/about-us/profile/history.html. Accessed 14
April 2016.
EDF (2000) Annual Report 2000. Paris.
EDF (2003) Annual Report 2003. Paris.

17
EDF (2007a) 2007 Document de Reference. Paris.
https://www.edf.fr/sites/default/files/contrib/finance/document-de-reference/ddr_2007_va.pdf.
Accessed 3 September 2015.
EDF (2007b) 2007 Sustainable Development Report. Paris.
https://www.edf.fr/sites/default/files/contrib/finance/Annual%20Report%20VA/2007/SDI/ra200
7DD_full_va.pdf. Accessed 3 September 2015.
EDF (2008a) 2008 Annual Report. Paris.
https://www.edf.fr/sites/default/files/contrib/finance/Annual%20Report%20VA/2008/Report/ra2
008Corp_full_va.pdf. Accessed 3 September 2015.
EDF (2008b) 2008 Document de Reference. Paris.
https://www.edf.fr/sites/default/files/contrib/finance/document-de-
reference/ddr_2008c_va.pdf. Accessed 3 September 2015.
EDF (2008c) 2008 Sustainable Development Report. Paris.
https://www.edf.fr/sites/default/files/contrib/finance/Annual%20Report%20VA/2008/SDI/ra200
8DD_full_va.pdf. Accessed 3 September 2015.
EDF (2009) 2009 Document de référence. Paris.
https://www.edf.fr/sites/default/files/contrib/finance/document-de-
reference/edf_ddr2009_va.pdf. Accessed 3 September 2015.
EDF (2015) Reference Document 2015 Annual Financial Report. Paris.
https://www.edf.fr/sites/default/files/contrib/groupe-edf/espaces-dedies/espace-finance-
en/financial-information/regulated-information/reference-document/edf-ddr_2015-va.pdf.
Accessed 3 June 2016.
EDP (2015) Annual Report 2015. Lisboa.
http://www.edp.pt/en/Investidores/publicacoes/Last%20Publications/Annual%20Report%202015
.pdf. Accessed 26 May 2016.
EDPR (2008) 2008 Institutional and Financial Report – Part II. Oviedo.
http://www.edpr.com/investors/reports-and-results/company-reports/?date=2008. Accessed 11
January 2016.
EDPR (2011) Annual Report 2009. Oviedo. http://www.edpr.com/investors/reports-and-
results/company-reports/?date=2011. Accessed 11 January 2016.
EDPR (2013) Annual Report 2009. Oviedo. http://www.edpr.com/investors/reports-and-
results/company-reports/?date=2014. Accessed 11 January 2016.
EDPR (2015) Annual Accounts 2015. Oviedo. http://www.edpr.com/investors/reports-and-
results/company-reports/?date=2016. Accessed 4 April 2016.
EDPR (2016) http://www.edpr.com/. Accessed 4 April 2016.
EGP (2008) Combined Financial Statement 2008. Rome. https://www.enelgreenpower.com/en-
gb/documents/media_investor/reports/2008/FS_DEC_2008_english.pdf. Accessed 4 April 2016.
EGP (2015) Annual Report 2013. Rome. https://www.enelgreenpower.com/en-
gb/Documents/media_investor/reports/2015/Annual_Report_2015.pdf. Accessed 4 April 2016.
EGP (2016a) ‘Press Release’ (undated). Rome.
https://servizi.enel.it/eWCM/salastampa/comunicati_eng/1664793-2_PDF-1.pdf. Accessed 7 May
2016.
EGP (2016b) https://www.enelgreenpower.com/en-gb/company. Accessed 8 May 2016.
Enel (2000a) Annual Report 2000. Rome. https://www.enel.com/en-
gb/Documents/FinancialReports/report2000/consolidato2000.pdf. Accessed 15 May 2015.
Enel (2000b) Form 20-f Annual Report Pursuant to Section 13 or 15(d) of the Securities Exchange Act
of 1934. Rome. https://www.enel.com/en-gb/Documents/FinancialReports/report2000/20-
F_2000.pdf. Accessed 15 May 2015.

18
Enel (2008a) Annual Report 2008. Rome. https://www.enel.com/en-
gb/Documents/FinancialReports/report2008/Annual_Report_ing.pdf. Accessed 15 May 2015.
Enel (2008b) “2007 Results and 2008 – 2012 Plan: Consolidation, Growth and Financial Stability”.
Investor Relations Presentation, March 13, London. https://www.enel.com/en-
gb/investors/annual_presentations/2008_02. Accessed 15 May 2015.
Enel (2009) “2008 Results and 2008 – 2013 Plan: Solid strategy and strong performance in unsteady
times". Investor Relations Presentation, March 12, Rome. https://www.enel.com/en-
gb/investors/annual_presentations/2009_01. Accessed 15 May 2015.
Enel (2015) Annual Report 2015. Rome. https://www.enel.com/en-
gb/Documents/FinancialReports/report2015/Annual_Report_2015.pdf. Accessed 27 April 2016.
ENGIE (2008) GDF Suez Reference Document 2008. Paris. http://www.engie.com/wp-
content/uploads/2012/05/gdf-suez-ddr08-vus-interactif1.pdf. Accessed 16 September 2015.
ENGIE (2009) GDF Suez Reference Document 2009. Paris. http://www.engie.com/wp-
content/uploads/2012/06/ddr-2009-en.pdf. Accessed 16 September 2015.
ENGIE (2015) Registration Document 2015. Paris. http://library.engie.com/uid_75ee14f2-7c97-41be-
82ed-8578be0e7487/beevirtua/beevirtua.html?#app=3d20&9557-
source=xmlConfs/init.xml&adf3-lang=en&ccb3-pageId=0. Accessed 25 April 2016.
Financial Times (2016) ‘Interactive Charting’. http://markets.ft.com/research/Markets/Interactive-
chart. Accessed 5 April 2016.
Fortum (2001) Annual Report 2001. Fortum.
http://www.fortum.com/Lists/ArchiveLibraryList/Final_2001_ENG.pdf. Accessed 2 September
2015.
Fortum (2007) Annual Report 2007. Fortum.
http://www.fortum.com/Lists/ArchiveLibraryList/Annual%20Report%202007/Fortum_Review_of_
Operations_07_eng.pdf. Accessed 2 September 2015.
Fortum (2008) Annual Report 2008. Fortum.
http://www.fortum.com/Lists/ArchiveLibraryList/Annual%20Report%202008/Fortum_AR08_eng.
pdfAccessed 2 September 2015. Accessed 2 September 2015.
Fortum (2015a) Financial Statement 2015. Fortum.
http://apps.fortum.fi/gallery2/Fortum_Financials_2015.pdf. Accessed 4 May 2016.
Fortum (2015b) Sustainability 2015. Fortum.
http://apps.fortum.fi/sustainability/Fortum_Sustainability_2015_V2.pdf. Accessed 4 May 2016.
Fortum (2016) “Investor / Analyst Material”. Investor Relations Presentation, February, Fortum.
http://apps.fortum.fi/gallery/Fortum%20investor%20presentation%20February%202016.pdf.
Accessed 22 February 2016.
Gaughan, Patrick A. (2002) Mergers, Acquisitions and Corporate Restructuring. Wieley. New York
Hammel, Gary (2000) Leading the Revolution. Harvard Business School Press, Harvard.
Hauptfleisch, Klaus (2014) “Smart Home erobert den Massenmarkt”. Computerwoche.de. March, 25.
Iberdrola (2000) Annual Report 2000. Bilbao.
Iberdrola (2008) Consolidated Financial Statements 2008. Bilbao.
https://www.iberdrola.es/webibd/gc/prod/en/doc/CuentasConsolidadas2008.pdf. Accessed 15
February 2016.
Iberdrola (2009) Information Supplemental to the 2009 Sustainability Report. Bilbao.
https://www.iberdrola.es/webibd/gc/prod/en/doc/IA_Anexo_InformeSostenibilidad09.pdf.
Accessed 27 May 2015.
Iberdrola (2015) Information Supplementary to the Sustainability Report 2015. Bilbao.
https://www.iberdrola.es/webibd/gc/prod/en/doc/IA_Anexo_InformeSostenibilidad15.pdf.
Accessed 27 May 2015.

19
Iberdrola (2016) Integrated Report February 2016. Bilbao.
https://www.iberdrola.es/webibd/gc/prod/en/doc/IA_InformeIntegrado16.pdf. Accessed 27 June
2016.
Investopedia (2016) ‘Compound Annual Growth Rate’.
http://www.investopedia.com/calculator/cagr.aspx. Accessed 18 April 2016.
Kiwigrid (2016) http://www.kiwigrid.com/en/. Accessed 11 January 2016.
Lösel, Sylvia (2014). “Eno baut den Bereich Smart Home aus”. It-business.de. March, 25.
Markets and Markets (2016) ‘Smart Home Market by Product (Lighting Control (Timer, Daylight
Sensor, Occupancy Sensor), Security & Access Control, HVAC, Entertainment, Home Healthcare
and Smart Kitchen), Software & Service (Behavioral, Proactive), and Geography - Global Forecast
to 2022’. http://www.marketsandmarkets.com/Market-Reports/smart-homes-and-assisted-living-
advanced-technologie-and-global-market-121.html. Accessed 30 May 2016.
Mintzberg, Henry (1985) “Of Strategies, Deliberate and Emergent”. Strategic Management Journal,
Volume 6. No. 3
Moody’s Investor Service (2016) ‘Rating Action: Moody's assigns a B1 Corporate Family Rating to
Techem with stable outlook’. https://www.moodys.com/research/Moodys-assigns-a-B1-
Corporate-Family-Rating-to-Techem-with--PR_254928. Accessed 18 May 2016.
Nordex (2008) Annual Report 2008. Hamburg. http://www.nordex-
online.com/fileadmin/MEDIA/Geschaeftsberichte/Nordex_GB_2008_EN.pdf. Accessed 15 March
2016.
Nordex (2015) Annual Report 2015. Hamburg. http://www.nordex-
online.com/fileadmin/MEDIA/Geschaeftsberichte/Nordex_GB2015_EN.pdf. Accessed 22 March
2016.
Power Technology (2016) ‘The top 10 biggest power companies of 2014’. http://www.power-
technology.com/features/featurethe-top-10-biggest-power-companies-of-2014-4385942/.
Accessed 3 June 2016.
Qivicon (2016) https://www.qivicon.com/en/. Accessed 7 January 2016.
Ries, E (2011) The Lean Startup: How Today's Entrepreneurs Use Continuous Innovation to Create
Radically Successful Businesses. Random House, New York.
Rodrigues, Stéphane (2014) “Des opérateur télécoms se diversifient dans le marché de l’énergie‘”.
Cleantechrepublic.com. March, 6.
RWE (2000a) Annual report 1999/2000. Essen.
http://www.rwe.com/web/cms/mediablob/en/1030430/data/289712/1/rwe/investor-
relations/reports/archive/Annual-Report-1999-2000.pdf. Accessed 31 August 2015.
RWE (2000b) Annual Report 2000/01. Essen.
http://www.rwe.com/web/cms/mediablob/en/1030420/data/289712/1/rwe/investor-
relations/reports/archive/blob.pdf. Accessed 31 August 2015.
RWE (2006) Annual Report 2006. Essen.
http://www.rwe.com/web/cms/mediablob/en/283532/data/280474/1/rwe/investor-
relations/reports/archive/2006/blob.pdf. Accessed 31 August 2015.
RWE (2007) Annual Report 2007. Essen.
http://www.rwe.com/web/cms/mediablob/en/114618/data/280350/3/rwe/investor-
relations/reports/archive/2007/en-geschaeftsbericht-2007.pdf. Accessed 31 August 2015.
RWE (2008) Annual Report 2008. Essen.
http://www.rwe.com/web/cms/mediablob/en/204612/data/280318/1/rwe/investor-
relations/reports/archive/2008/Annual-report-2008-PDF-Download-.pdf. Accessed 31 August
2015.
20
RWE (2009) Annual Report 2009. Essen.
http://www.rwe.com/web/cms/mediablob/en/387728/data/239998/8/rwe/investor-
relations/reports/archive/2009/Annual-report-2009.pdf. Accessed 31 August 2015.
RWE (2011) Annual Report 2011. Essen.
http://www.rwe.com/web/cms/mediablob/en/1299140/data/634422/12/rwe/investor-
relations/reports/2011/RWE-annual-report-2011.pdf. Accessed 31 August 2015.
RWE (2013) Annual Report 2013. Essen.
http://www.rwe.com/web/cms/mediablob/en/2320248/data/1838136/5/rwe/investor-
relations/reports/2013/RWE-Annual-Report-2013.pdf. Accessed 31 August 2015.
RWE (2014) Annual Report 2014. Essen.
http://www.rwe.com/web/cms/mediablob/en/2696788/data/2331574/6/rwe/investor-
relations/reports/2014/RWE-Annual-Report-2014.pdf. Accessed 31 August 2015.
RWE (2015) Annual Report 2015. Essen.
http://www.rwe.com/web/cms/mediablob/en/2974774/data/2705502/7/rwe/investor-
relations/reports/2015/RWE-Annual-Report-2015.pdf. Accessed 14 April 2016.
Sarasvathy, Saras D. (2009). Effectuation: Elements of Entrepreneurial Expertise. Northampton, MA:
Edward Elgar Publishing.
Schleicher-Tappeser, Ruggero (2012) “How renewables will change electricity markets in the next five
years” Energy Policy. Vol. 48, p64-75.
Scottish Hydro-Electric & Southern Electric (SHE & SE) (2001) Regulatory Accounting Statement.
Perth.
SolarWorld (2008) Annual group Report 2008. Bonn.
http://www.solarworld.de/fileadmin/sites/sw/ir/pdf/finanzberichte/en/ar2008.pdf. Accessed 17
March 2016.
SolarWorld (2015) Annual group Report 2015. Bonn.
http://www.solarworld.de/fileadmin/sites/sw/ir/pdf/finanzberichte/2015/annual_report_sustain
ability_detail_2015_web.pdf. Accessed 3 May 2016.
SSE (2001) Annual Report and Accounts 2001. Perth.
SSE (2008) Annual Report 2008. Perth.
http://sse.com/media/108185/2008AnnualReportAndAccounts.pdf. Accessed 2 September 2015.
SSE (2009) Annual Report 2009. Perth.
http://sse.com/media/108215/2009AnnualReportAndAccounts.pdf. Accessed 2 September 2015.
SSE (2015) Annual Report 2015. Perth.
http://sse.com/media/332715/SSE_AR2015_6Aug_UPDATE.pdf. Accessed 15 January 2016.
Statista (2016) ‘Largest European electric utilities in 2014, based on power sales (in billion kilowatt
hours)’. http://www.statista.com/statistics/267066/largest-european-electric-utilities-based-on-
power-sales/. Accessed 3 June 2016.
Sungevity (2016) http://www.sungevity.com/. Accessed 4 January 2016.
Techem (2016) http://www.techem.com/. Accessed 5 January 2016.
Verbund (2000) Annual Report 2000. Vienna: Verbund.
Verbund (2007) Annual Report 2007. Vienna. http://www.verbund.com/cc/en/investor-
relations/financial-reports#tabbed-9. Accessed 7 September 2015.
Verbund (2008) Annual Report 2008. Vienna. http://www.verbund.com/cc/en/investor-
relations/financial-reports#tabbed-8. Accessed 7 September 2015.
Verbund (2015) Integrated Annual Report 2015. Vienna. http://www.verbund.com/cc/en/investor-
relations/financial-reports#tabbed-1. Accessed 22 April 2016.

21
Vestas (2008) Annual Report 2008. Aarhus N.
https://www.vestas.com/~/media/vestas/investor/investor%20pdf/financial%20reports/2008/20
08_ar_uk.pdf. Accessed 29 November 2015.
Vestas (2015) Annual Report 2015. Aarhus N.
https://www.vestas.com/~/media/vestas/investor/investor%20pdf/financial%20reports/2015/fy/
160209_ca_uk_annual%20report%202015.pdf. Accessed 25 April 2016.
WEF - World Economic Forum (2016) ‘Digital Transformation of Industries’.
http://reports.weforum.org/digital-transformation-of-industries/digital-trends-in-the-electricity-
industry/. Accessed 3 June 2016.
Keyword set
European energy industry, incumbents, business models, crisis, transition, transformation, green
energy, renewables, digital challenge, customer-centric model, de-centralisation, prosumership
![“BOOM, BOOM, BOOOOOM! Notes on a Giant [neoliberal] Implosion” in Ibraaz Magazine. Issue 8th. January 2015](https://static.fdokumen.com/doc/165x107/63459845596bdb97a909007a/boomboom-booooom-notes-on-a-giant-neoliberal-implosion-in-ibraaz-magazine.jpg)