The climate crisis is a child rights crisis - UNICEF
128
The climate crisis is a child rights crisis Introducing THE CHILDREN’S CLIMATE RISK INDEX
-
Upload
khangminh22 -
Category
Documents
-
view
2 -
download
0
Transcript of The climate crisis is a child rights crisis - UNICEF

The climate crisis is a child rights crisisIntroducing THE CHILDREN’S CLIMATE RISK INDEX

.
Published by UNICEFDivision of Communication3 United Nations PlazaNew York, NY 10017, USA
Contact: [email protected]
Website: www.unicef.org
Suggested citation. The Climate Crisis is a Child Rights Crisis:: Introducing the Children’s Climate Risk Index. New York: United Nations Children’s Fund (UNICEF), 2021.
ISBN: 978-92-806-5276-5
© United Nations Children’s Fund (UNICEF), August 2021
The findings, interpretations and conclusions expressed in this report are those of the authors and do not necessarily reflect the policies or views of UNICEF or the United Nations. The designations and maps used do not reflect a position by UNICEF on the legal status of any country or territory or of its authorities, or the delimitation of any frontiers.
This report presents the Children’s Climate Risk Index (CCRI). This is the Beta version of the Index, and will continue to be adjusted, modified and new datasets added, including projection analysis, together with partners, including the Data for Children Collaborative and Save the Children International.
This Index does not include Small Island Developing States (SIDS) that have a land area less than 20,000sq/km due to data availability limitations. Many SIDS face serious and existential threats due to climate change that are not adequately reflected in the data, and not captured appropriately in a multi-hazard index. As such, they have been not been considered in this edition. Future versions of the Index will aim to address the data requirements for these contexts.
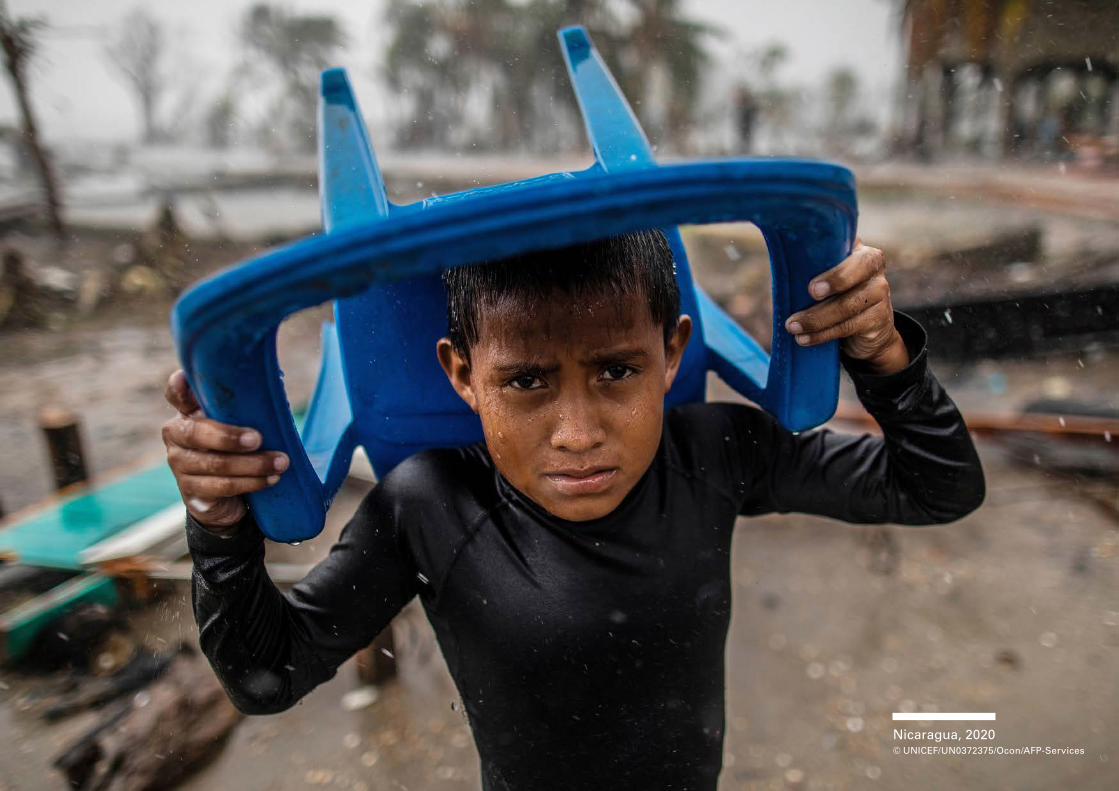
Cover photo A girl returning home from a temporary shelter after the
passage of Hurricane Iota in Nicaragua, November 16, 2020.
© UNICEF/UN0372373/Ocon/AFP-Services

The climate crisis is a child rights crisisIntroducing the Children’s Climate Risk Index
Acknowledgments
Production and Authorship: Nicholas Rees (Lead Author and Project Manager), Margaretha Barkhof (Data Analysis, CCRI Methodology), Jan Burdziej (Data Analysis, Geographical Information Systems), Sophie Lee (Research and Analysis), Harriet Riley (Promising Ideas).
Overall Leadership and Guidance: Gautam Narasimhan (Climate, Energy, Environment & Disaster Risk Reduction) and Toby Wicks (Data Use)
Special thanks to Genevieve Boutin, Paloma Escudero, Vidhya Ganesh, Mark Hereward, Kelly Ann Naylor, Valentina Otmacic, Sanjay Wijesekera.
Internal Contributions and Review
UNICEF Technical Expertise: Hanoch Barlevi, Lars Bernd, Seon Mi Choi, Julia Da Silva, Solrun Engilbertsdottir, Anne Grandjean, Tarik Hassan, Laura Healy, Krishna Krishnamurthy, Bethlehem Girma Mamo, Desiree Raquel Narvaez, Kenneth Russell, Abheet Solomon, Jen Stephens, David Stewart, Rakshya Thapa, Fiona Ward, Amy Wickham.
UNICEF Data Analysis: Jan Beise, Danzhen You, Viviana Rocio Canon, Robert Bain, Claudia Cappa, Enrique Delamónica, Attila Hancioglu, Chika Hayashi, Suguru Mizunoya, Jennifer Requejo, Tom Slaymaker, Yanhong Zhang.
UNICEF Communications and Advocacy: Sara AlHattab, Ahmed Alnaqshbandi, Alex Del Castello, Maud Combier-Perben, Kurtis Cooper, Yasmine Hage, Selma Hamouda, Teresa Ingram, Baishalee Nayak, Carlos Perellon, Maria Jose Ravalli, Charlotte Rutsch, Thomas Sayers, Leah Selim, Jeremy Sprigge, Georgina Thompson, Samantha Wauchope, Ruthia Yi, Eric Zuehlke.
External Contributions and Review
We are extremely thankful to the following colleagues in the Data for Children Collaborative with UNICEF for their technical guidance and expert support, including in conducting data and statistical analysis, methodology and literature review: Alex Hutchison (Data for Children Collaborative), Fraser Macdonald (Data for Children Collaborative), Craig Hutton (University of Southampton), Massimo
Bollasina (University of Edinburgh), Julia Branson (University of Southampton), Irena Connon (University of Stirling), Joseph Crispell (Office for National Statistics and Foreign, Commonwealth & Development Office Data Science Hub) Lena Dominelli (University of Stirling), Alessandra Fassio (Data for Children Collaborative), Andrew Harfoot (University of Southampton), Sian Henley (University of Edinburgh), Mark Inall (Scottish Association for Marine Science), Charlotte Marcinko (University of Southampton), James Mollard (University of Edinburgh), Kate Sargent (University of Edinburgh), Gary Watmough (University of Edinburgh) and Tom Wilkinson (Office for National Statistics and Foreign, Commonwealth & Development Office Data Science Hub).
We are also very thankful for review and collaboration with colleagues at Save the Children International, including: Christophe Belperron, Oliver Fiala, Rajib Ghosal, Yolande Wright.

Contents
Acknowledgments .............................. i
Foreword Fridays for Future ...............................4
Foreword UNICEF Executive Director Henrietta Fore ....................................6
Executive Summary ............................9
Chapter 1 Introduction ..................................... 19
Chapter 2 Children’s exposure to climate and environmental hazards, shocks and stresses .........................27
Extreme temperatures ........................................................ 27Water scarcity ........................................................................ 31Riverine flooding ................................................................... 37Coastal flooding ................................................................... 39Cyclone exposure ................................................................ 41Disease vector exposure ....................................................43Air pollution ..........................................................................48Soil and water pollution ...................................................... 52The threat of overlapping hazards .................................... 54
Chapter 3 Children’s vulnerability to climate and environmental hazards, shocks and stresses ..........57
Inadequate water, sanitation and hygiene ....................... 58Inadequate health and nutrition ........................................ 61Inadequate education and learning ..................................64Poverty and lack of social protection ................................ 68Exposures exacerbate vulnerabilities, vulnerabilities exacerbate exposures ......................................................... 71
Chapter 4 The Children’s Climate Risk Index ....73
Chapter 5 Responding to the risks ...................84
Building resilience and reducing exposure: Sensitivity testing by modelling changes in risk ............84The CCRI in the Context of Environmental Sustainability and Disaster Risk Reduction Measures .... 90The CCRI in the context of fragility, governance and displacement ................................................................. 97
Chapter 6 CCRI methodology ......................... 101
Pillar 1 ................................................................................... 102Pillar 2 ................................................................................... 102
Chapter 7 The climate crisis is a child’s rights crisis ......................109
A crisis on many fronts ..................................................... 109A crisis infringing on many rights ....................................111States’ obligations towards children ...............................112Children’s right to claim their rights .................................112
Chapter 8 Creating an environment fit for children ................................ 117
Annex CCRI rank and emissions by country ....................................... 120

Foreword Fridays for Future
Three years ago, with a lone protest by a single child, Fridays for Future began. Within months, that lone protester would grow to over a million in more than 120 countries. Young people, from all corners of the globe, uniting in a global call to save the planet, and save their future.
Climate change is the greatest threat facing the world’s children and young people. We have known this for some time – based on what science told us, what the stories we heard from around the world have illustrated, and what we have witnessed with our own eyes – but today, we have the first analysis of climate risk from the most important perspective on this crisis – ours.
UNICEF’s Children’s Climate Risk Index reveals that 1 billion children are at ‘extremely high risk’ of the impacts of climate change. That is nearly half of all children. And it is happening today.
Children bear the greatest burden of climate change. Not only are they more vulnerable than adults to the extreme weather, toxic hazards and diseases it causes, but the planet is becoming a more dangerous place to live.
Increasingly catastrophic droughts, fires and storms are forecast to become even worse as our planet continues to warm. Important food and water systems will fail and entire cities are expected to succumb to destructive floods.
Climate change is the greatest threat facing the world’s children and young people. And so we too are rising.
In Bangladesh, exposure to cyclones, droughts, floods, salinity and river erosion moved Tahsin to action. He is raising awareness of waterways choked by plastic waste and dangerous erosion at river edges.
In the Philippines, Mitzi is leading youth in the fight for climate justice. Recently, she spent two dark days in a house without power separated from her family during a typhoon – not knowing whether her home had been consumed by the floods, or if her mother was safe.
In Zimbabwe, Nkosi wants to know how he can be expected to attend school “under a scorching sun”. He has been a vocal climate activist for years but fears his efforts might be in vain.

Foreword 5
We all share this fear. Governments said they would protect us, but they are not doing nearly enough to stop climate change from devastating our lives and our futures.
In 1989, virtually every country in the world agreed children have rights to a clean environment to live in, clean air to breathe, water to drink and food to eat. Children also have rights to learn, relax and play. But with their lack of action on climate change, world leaders are failing this promise.
Our futures are being destroyed, our rights violated, and our pleas ignored. Instead of going to school or living in a safe home, children are enduring famine, conflict and deadly diseases due to climate and environmental shocks. These shocks are propelling the world’s youngest, poorest and most vulnerable children further into poverty, making it harder for them to recover the next time a cyclone hits, or a wildfire sparks.
The Children’s Climate Risk Index ranks countries based on how vulnerable children are to environmental stresses and extreme weather events. It finds children in the Central African Republic, Chad, Nigeria, Guinea, and Guinea-Bissau are the most at risk.
And yet these countries are among those least responsible for creating the problem, with the 33 extremely high-risk countries collectively emitting just 9 per cent of global CO2 emissions. In contrast, the 10 highest emitting countries collectively account for nearly 70 per cent of global emissions. Only one of these countries is ranked as extremely high-risk in the index.
We cannot allow this injustice to continue. It is immoral that the countries that have done the least are suffering first and worst.
Governments and businesses urgently need to work to tackle the root causes of climate change by reducing greenhouse gas emissions in line with the Paris Agreement.
This report comes ahead of the November 2021 United Nations Climate Change Conference in Glasgow. There is still time for countries to commit to preventing the worst, including setting the appropriate carbon budgets to meet Paris targets, and ultimately taking the drastic action required to shift the economy away from fossil fuels.
While we do that, we must also find solutions to build resilience and help those already in trouble. This crisis is happening now.
We will strike again and again until decision-makers change the course of humanity. We have a duty to urgently raise awareness and demand action. What began on a Friday three years ago, has continued every Friday since, including today. We have a duty to each other and to the children that are too small to hold a pen or a microphone, but that will experience even greater challenges than we are. Movements of young climate activists will continue to rise, continue to grow and continue to fight for what is right because we have no other choice.
We must acknowledge where we stand, treat climate change like the crisis it is and act with the urgency required to ensure today’s children inherit a liveable planet.
Signed,
Adriana Calderón, Mexico,
Farzana Faruk Jhumu, Bangladesh,
Eric Njuguna, Kenya,
Greta Thunberg, Sweden.
FRIDAYS FOR FUTURE

Foreword UNICEF Executive Director Henrietta Fore
The climate crisis is a child rights crisis. Recent record heat waves, wildfires and flooding in many countries portend a challenging ‘new normal’. The impacts of climate change are clear. So are the solutions. It is unconscionable that today’s children and young people face an uncertain future.
Around the world, through protests, social media activity and community and civic engagement, children and young people are loud and clear in demanding change. The old ways of doing things are not good enough.
This report provides the first comprehensive view of children’s exposure and vulnerability to the impacts of climate change through the Children’s Climate Risk Index (CCRI).
It is already clear that children are more vulnerable to climate and environmental shocks than adults. However, this report examines for the first time exactly how many children live in areas that experience multiple, overlapping climate and environmental risks that trigger, reinforce and magnify each other combined with data
on the availability and quality of essential services such as healthcare, education and water and sanitation to give a true insight into the impact of the climate crisis on children.
Almost every child on earth is exposed to at least one climate and environmental hazard, shock or stress such as heatwaves, cyclones, air pollution, flooding and water scarcity. But a record-breaking 850 million – approximately one-third of all children – are exposed to four or more stresses, creating incredibly challenging environments for children to live, play and thrive.
Globally, approximately 1 billion children – nearly half of the world’s children – live in countries that are at an ‘extremely high-risk’ from the impacts of climate change, according to the CCRI. These children face a deadly combination of exposure to multiple shocks with high vulnerability resulting from a lack of essential services. The survival of these children is at imminent threat from the impacts of climate change.
Addressing the climate crisis requires every part of society to act. Governments need to ensure that environmental policies are child-sensitive. Businesses must ensure their practices are protective of the natural environment on which children depend. Greenhouse gas emissions and environmental pollutants must be reduced dramatically. Services for children need to incorporate climate resilience and environmental sustainability. Schools need to be educating for green skills. And children and young people need to be recognized and listened to as agents of change.
In 2022, UNICEF will embark upon its next five-year Strategic Plan, which will guide all our work in over 190 countries and territories. In consultations with over 200,000 young people while developing the priorities and processes that UNICEF will focus on into the next decade, young people boldly demanded more urgent action around climate change. As a young person in Barbados said, “Even though the older [generation]

Foreword 7
may have caused this to happen, we are the ones at risk, we have to step up. We deserve the same opportunities as the person who lived before us to breathe fresh air.”
While the outlook is very concerning, there is room for action and optimism. As this report emphasizes, there are a range of solutions in front of us. Each solution can help prioritize action for those most at risk. Ultimately, we can ensure today’s children inherit a liveable planet. Every action we take now can leave children a step ahead to prevent worse challenges in the future. As we commemorate UNICEF’s 75th year, let us collectively reimagine an environment fit for every child together.
Every child deserves a liveable planet.
Henrietta Fore
UNICEF Executive Director
Bolivia, 2020 © UNICEF/UN0364364/Aliaga Ticona

INTRODUCING THE CHILDREN’S CLIMATE RISK INDEX 8
Burundi, 2021 © UNICEF/UN0436094/Prinsloo

Executive Summary
The climate crisis is the defining human and child’s rights challenge of this generation, and is already having a devastating impact on the well-being of children globally. Understanding where and how children are uniquely vulnerable to this crisis is crucial in responding to it. The Children’s Climate Risk Index provides the first comprehensive view of children’s exposure and vulnerability to the impacts of climate change to help prioritize action for those most at risk and ultimately ensure today’s children inherit a liveable planet.
We are up against, and crossing, key planetary boundaries.
We are crossing key boundaries in the Earth’s natural system, including climate change, biodiversity loss, and increasing levels of pollution in the air, soil, water and oceans.Climate and environmental hazards, shocks and stresses are already having devastating impacts on the well-being of children globally. As these boundaries are breached, so too is the delicate natural balance that human civilization has depended upon to grow and thrive. The world’s children can no longer count on these conditions, and must make their way in a world that will become far more dangerous and uncertain in the years to come.
And as a result, the climate crisis is creating a child’s rights crisis. It is creating a water crisis, a health crisis, an education crisis, a protection crisis and a participation crisis. It is threatening children’s very survival. In all these ways, it is infringing on children’s rights – as outlined in the United Nations Convention on the Rights of the Child.
Unfortunately, this is only the beginning. According to the IPCC, global greenhouse gas emissions need to be halved by 2030 and cut to zero by 2050 to avoid the worse impacts, but most countries are not on track to meet these targets. Only with such truly transformative action will we bequeath children a liveable planet.

INTRODUCING THE CHILDREN’S CLIMATE RISK INDEX 10
2 billion children (almost 90 per cent of children
globally) are currently highly exposed to air
pollution that exceeds 10µg/m3. This is likely to
get worse unless there is a reduction in fossil fuel combustion that causes air pollution.
815 million children (over one-third of children globally) are currently highly exposed to lead pollution due to exposures in contaminated air, water, soil and food. This is likely to get
worse without more responsible production, consumption and recycling of lead-containing products.
820 million children (over one third of children globally) are currently highly exposed to heatwaves. This is likely to worsen as global average temperatures increase and weather patterns become more erratic. 2020 was tied for the hottest year on record.
MAP 3
400 million children (nearly 1 in 6 children globally) are currently highly exposed to cyclones. This is likely to get worse as high-intensity cyclones (i.e categories 4 and 5) increase in frequency, rainfall intensity grows, and cyclone patterns shift.
MAP 13
330 million children (1 in 7 children globally) are currently highly exposed to riverine flooding. This is likely to worsen as glaciers melt, and precipitation increases due to higher water-content in the atmosphere as a result of higher average temperatures.
240 million children (1 in 10 children globally) are currently highly exposed to coastal flooding. This is likely to worsen as sea levels continue to rise, with the effects magnified considerably when combined with storm surges.
MAP 12 MAP 21
MAP 11
Sudden and moderately
sudden onset events
Slower-onset changes
Environmental degradation and stresses
920 million children (over one-third of children globally) are currently highly
exposed to water scarcity. This is likely to worsen as climate change increases
frequency and severity of droughts, water stress, seasonal and interranual variability,
contamination – and demand and competition for water increases, resulting in
depletion of available water resources.
MAP 5
600 million children (over 1 in 4 children globally) are currently
highly exposed to vector-borne diseases, such as malaria and dengue, among others. This is
likely to worsen as temperature suitability and climatic conditions
for mosquitos and pathogens that transmit these diseases
spreads.
MAP 20
MAP 14
Utilizing high-resolution geographical data, this report provides new global evidence on how many children are currently exposed to a variety of climate and environmental hazards, shocks and stresses
Executive summary 11
Children are more vulnerable to climate and environ-mental shocks than adults for a number of reasons:
• They are physically more vulnerable, and less able to withstand and survive shocks such as floods, droughts, severe weather and heatwaves.
• They are physiologically more vulnerable. Toxic substances, such as lead and other forms of pollution, affect children more than adults, even at lower doses of exposure.
• They are more at risk of death compared with adults from diseases that are likely to be exacerbated by climate change, such as malaria and dengue.
• They have their whole life ahead of them – any deprivation as a result of climate and environmental degradation at a young age can result in a lifetime of lost opportunity.
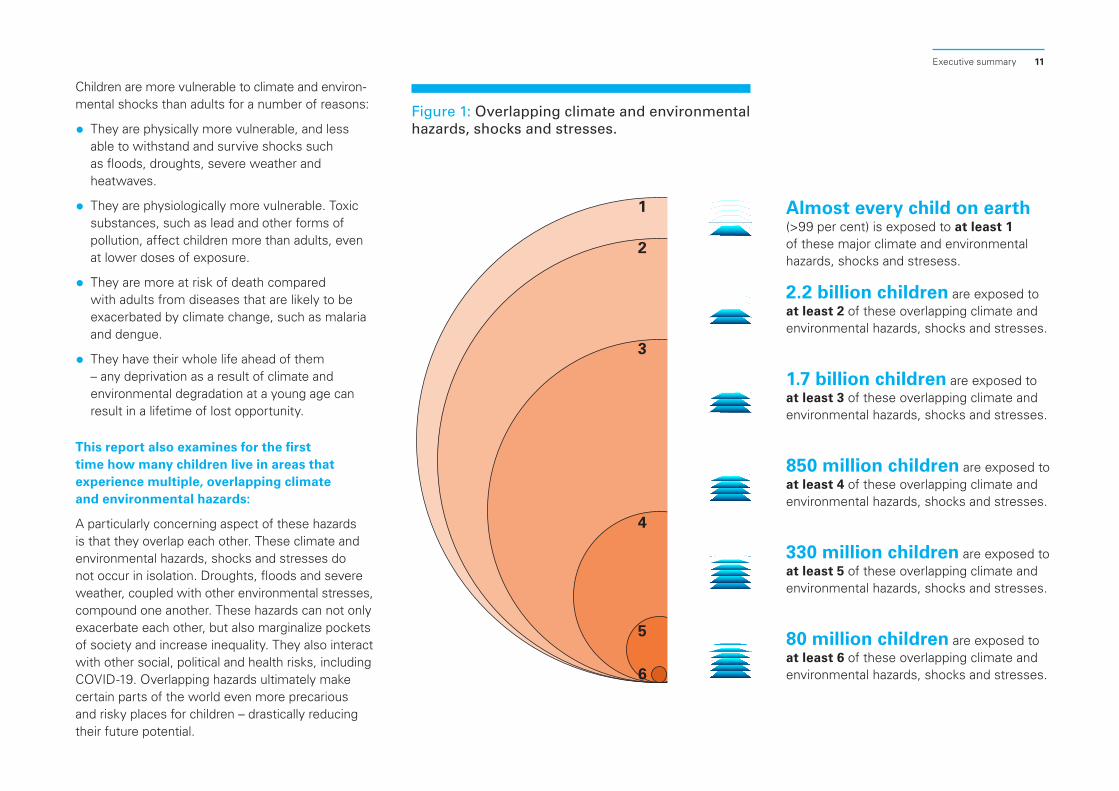
This report also examines for the first time how many children live in areas that experience multiple, overlapping climate and environmental hazards:
A particularly concerning aspect of these hazards is that they overlap each other. These climate and environmental hazards, shocks and stresses do not occur in isolation. Droughts, floods and severe weather, coupled with other environmental stresses, compound one another. These hazards can not only exacerbate each other, but also marginalize pockets of society and increase inequality. They also interact with other social, political and health risks, including COVID-19. Overlapping hazards ultimately make certain parts of the world even more precarious and risky places for children – drastically reducing their future potential.
Figure 1: Overlapping climate and environmental hazards, shocks and stresses.
Almost every child on earth (>99 per cent) is exposed to at least 1 of these major climate and environmental hazards, shocks and stresess.
2.2 billion children are exposed to at least 2 of these overlapping climate and environmental hazards, shocks and stresses.
1.7 billion children are exposed to at least 3 of these overlapping climate and environmental hazards, shocks and stresses.
850 million children are exposed to at least 4 of these overlapping climate and environmental hazards, shocks and stresses.
330 million children are exposed to at least 5 of these overlapping climate and environmental hazards, shocks and stresses.
80 million children are exposed to at least 6 of these overlapping climate and environmental hazards, shocks and stresses.6
5
4
3
2
1

INTRODUCING THE CHILDREN’S CLIMATE RISK INDEX 12
Map 1: Overlapping Climate and Environmental Hazards, Shocks and Stresses
Source: This map combines data from: the World Resources Institute (WRI); United Nations Environment (UNEP); The Global Assessment Report, UNDRR; The Center for International Earth Science Information Network (CIESIN); The Malaria Atlas Project; Messina et al.; Kraemer et al.; The Climate Research Unit, University of East Anglia; The Atmospheric Composition Analysis Group; and UN World Population Prospects (2019 revision). See methodology for full details
Number of Hazards, Shocks or Stresses
Extremely High (≥5)
High (4)
Medium–High (3)
Low–Medium (2)
Low (1)

Executive summary 13
Children’s lack of access to essential services, such as in health, nutrition, education and social protection, makes them particularly susceptible.
Not only do climate and environmental hazards negatively affect children’s access to key essential services, but children’s lack of access to key essential services also reduces their resiliency and adaptive capacity, further increasing their vulnerability to climate and environmental hazards. Thus, a vicious cycle is created, pushing the most vulnerable children deeper into poverty at the same time as increasing their risk of experiencing the worst and most life-threatening effects of climate change.
The only long-term solution to the climate crisis is a reduction of emissions to safe levels – reaching net-zero by 2050 in order to stay on course for warming that does not exceed 1.5oC. However,
climate dynamics are such that mitigation efforts will take decades to reverse the impacts of climate change, and for the children of today, this will be too late. Unless we invest heavily in adaptation and resilience of social services for the 4.2 billion children born over the next 30 years, they will face increasingly high risks to their survival and well-being. Any adaptations must be based on a careful assessment of both the type and nature of the climate and environmental hazard, shock or stress, as well as the degree to which children are vulnerable. Understanding children’s vulnerability is critical to understanding the full extent to which climate and environmental hazards are likely to impact their well-being, and even their very survival. This report provides a conceptual framework, a tool and an initial assessment at a global level of children’s exposure and vulnerability to climate and environmental hazards, shocks and stresses – in order to help prioritize action for those most at risk.
Introducing the Children’s Climate Risk Index (CCRI): This report combines this growing body of new evidence with data on children’s vulnerability to introduce the first comprehensive view of climate risk from a child’s perspective.
Globally, approximately 1 billion children (nearly half of the world’s children) live in extremely high-risk countries, according to the CCRI.

INTRODUCING THE CHILDREN’S CLIMATE RISK INDEX 14
Map 2: The Children’s Climate Risk Index (CCRI)
Source: The CCRI is composed of many indicators across climate and environmental hazards, shocks and stresses, as well as child vulnerability, see Chapter 6: Methodology
Severity
Extremely High
High
Medium–High
Low–Medium
Low
No data

Executive summary 15
The only long-term solution to climate change is reducing greenhouse gas emissions. However, there are also many actions that reduce children’s exposure and vulnerabilities that can greatly reduce their overall level of climate risk, for example:
Investments that improve access to resilient water, sanitation and hygiene (WASH) services can considerably reduce overall climate risk for 415 million children.*
Improving access to resilient WASH services could include, for example, comprehensive assessments of water resources, investing in diversifying water sources, using renewable energy, and working with local markets and the private sector to ensure that water and sanitation services have been constructed incorporating climate risks. It can also include increasing water storage facilities at household level, as well as multiple-use water schemes which provide water for domestic and livelihood needs. At a subnational and national level it includes comprehensive management, protection and monitoring of water resources. The resilience of a community is strongly related to the resilience of their WASH services.
Only 40 per cent of the extremely high-risk countries have mentioned children and/or youth in the their Nationally Determined Contributions (NDCs).
The extremely high-risk countries received only US$9.8 billion in terms of global financial flows, mostly in the form of ODA, on clean energy research, development and production.
Most (28 out of 33) of the extremely high-risk countries have very low coverage of ground-level air quality monitoring stations – less than 10 per cent of the child population lives within 50 km of a monitoring station.
Moreover:
The highest-risk places on Earth contribute least to the causes of climate change – the 33 extremely
high-risk countries emit less than 10 per cent of global
greenhouse gas emissions The 10 most extremely high-risk countries emit only 0.5 per cent of global emissions.
Almost all (29 out of 33) of the extremely high-risk countries are also considered fragile contexts.
One quarter (8 out of 33) of extremely high-risk countries have very high levels of displacement – with more than 5 per cent of the population displaced.
None of the extremely high-risk countries have a high (>80 per cent) score on the adoption and implementation of the national DRR strategies in line with the Sendai Framework. * 'Investments' are modeled as improving component score
by 50%. 'Considerably' defined as at least a 0.5 point drop in Children's Climate Risk Index

INTRODUCING THE CHILDREN’S CLIMATE RISK INDEX 16
Investments that improve educational outcomes can considerably reduce overall climate risk for 275 million children.*
Investing in sustainability education has a tremendous multiplier effect. Improved education which builds knowledge and skills will contribute to improved sustainability practices and a reduction in emissions at the individual, institutional and communal levels. Improving educational outcomes could include, for example, investing in infrastructure that is resilient to disasters to reduce long-term disruption to children’s learning process, as well as solutions that increase access, such as digital learning, as well as equity. Equity in access is important from a gender perspective, from a life cycle perspective (from early childhood through to adolescence), as well as for children with disabilities who are often marginalized. Improving educational outcomes could also mean ensuring quality learning, such as providing safe, friendly environment, qualified and motivated teachers, and instruction in languages students can understand. This means both mainstreaming the latest knowledge and science on climate change into national curricula and also ensuring that children gain the skills they need to be successful in life. These are skills that are relevant for the future of work, including the growing green economy and for livelihoods that are less susceptible to the impacts of a changing climate
and degrading environment. Skills-based learning is also essential to empower children, adolescents and teachers to participate in climate mitigation, adaptation and climate-resilience activities in schools, to encourage children to become part of the solution to climate change.
Investments that improve access to health and nutrition services can considerably reduce overall climate risk for 460 million children.*
Improving access to health services could include, for example, investing in quality maternal and newborn care services, sustaining immunization programmes, and supporting preventive, promotive and curative services for pneumonia, diarrhoea, malaria and other child health conditions. It also includes identifying the changing health threats that children face as a result of climate and environmental factors and prioritizing health responses accordingly. It could also include supporting adolescent health and well-being and providing age-specific health information. Moreover, it requires strengthening health systems to deliver integrated services for children.
Investments that improve access to social protection and reducing poverty can considerably reduce overall climate risk for 310 million children.*
Improving access to social protection requires working towards universal coverage of child and family benefits as well as ensuring that social protection systems provide connections to other vital services in health, education and nutrition as well as the social welfare workforce. Improving the climate-responsiveness of social protection systems is crucial so they are better able to adjust to the rapidly changing nature of shocks and stresses. This requires understanding the ever-growing impacts of climate change faced by children and their caregivers and adapting social protection responses to be able to rapidly respond. From the perspective of children and their families, this can result in a climate shock being a temporary disruption rather than pushing families into long-term poverty.
* 'Investments' are modeled as improving component score by 50%. 'Considerably' defined as at least a 0.5 point drop in Children's Climate Risk Index

Executive summary 17
Mozambique, 2021 © UNICEF/UN0407024/Franco
The climate crisis is creating a child’s rights crisis.
It is creating a water crisis … a health crisis … an education crisis … a protection crisis … and a participation crisis. It is threatening children’s very survival. In all these ways, it is infringing on children’s rights – as outlined in the United Nations Convention on the Rights of the Child.
Unfortunately, this is only the beginning. According to the IPCC, global greenhouse gas emissions need to be halved by 2030 and cut to zero by 2050 to avoid the worse impacts, but most countries are not on track to meet these targets. Improving the resiliency of services that children need will be necessary no matter what the future holds: even if global emissions stopped today, global temperatures would continue to increase – hurting those most vulnerable first and foremost. We need to accelerate actions that protect children from impacts, as well as reduce emissions – urgently. There are many promising solutions to draw from – including nature-based solutions. One of the most sustainable solutions is the transition towards an economic model which decouples economic growth from fossil fuel consumption and thus reduces emissions to safe levels. Another is consulting directly with children themselves – children and young people have important ideas about the world they want and need to thrive. Only with such truly transformative action will we bequeath children a liveable planet.

Viet Nam, 2020 © UNICEF/UN0355655/Viet Hung
Introduction
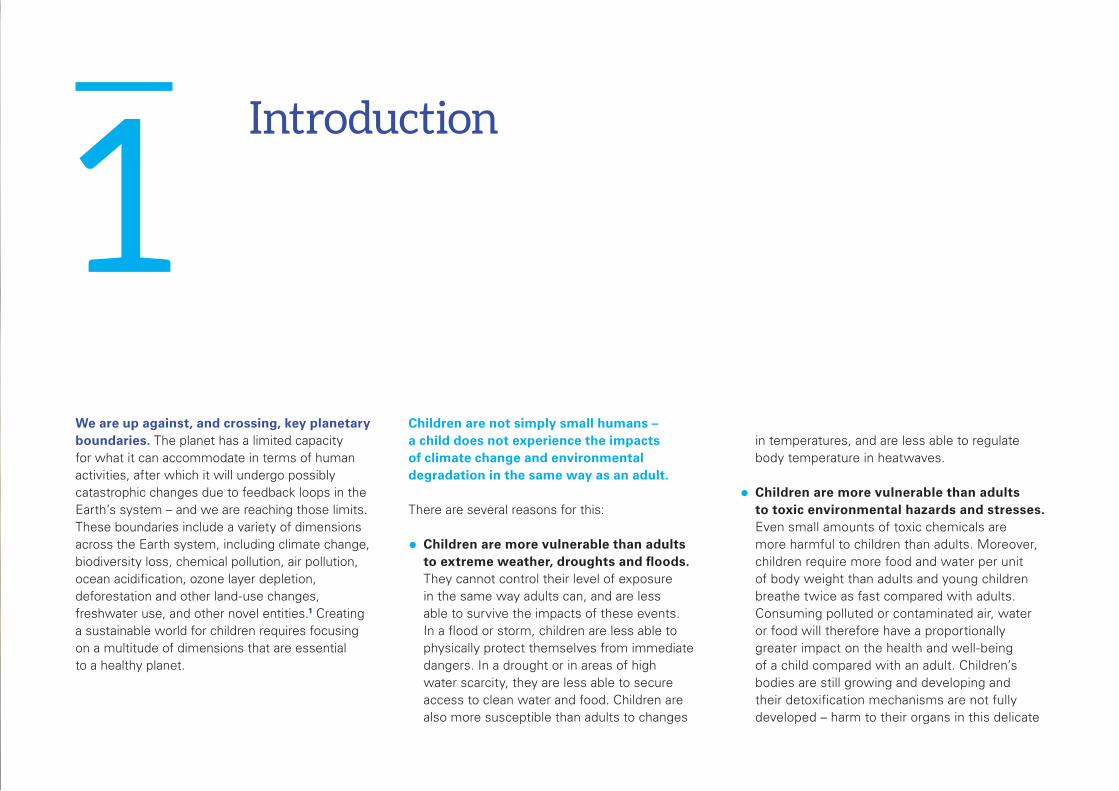
We are up against, and crossing, key planetary boundaries. The planet has a limited capacity for what it can accommodate in terms of human activities, after which it will undergo possibly catastrophic changes due to feedback loops in the Earth’s system – and we are reaching those limits. These boundaries include a variety of dimensions across the Earth system, including climate change, biodiversity loss, chemical pollution, air pollution, ocean acidification, ozone layer depletion, deforestation and other land-use changes, freshwater use, and other novel entities.1 Creating a sustainable world for children requires focusing on a multitude of dimensions that are essential to a healthy planet.
Children are not simply small humans – a child does not experience the impacts of climate change and environmental degradation in the same way as an adult.
There are several reasons for this:
• Children are more vulnerable than adults to extreme weather, droughts and floods. They cannot control their level of exposure in the same way adults can, and are less able to survive the impacts of these events. In a flood or storm, children are less able to physically protect themselves from immediate dangers. In a drought or in areas of high water scarcity, they are less able to secure access to clean water and food. Children are also more susceptible than adults to changes
1in temperatures, and are less able to regulate body temperature in heatwaves.
• Children are more vulnerable than adults to toxic environmental hazards and stresses. Even small amounts of toxic chemicals are more harmful to children than adults. Moreover, children require more food and water per unit of body weight than adults and young children breathe twice as fast compared with adults. Consuming polluted or contaminated air, water or food will therefore have a proportionally greater impact on the health and well-being of a child compared with an adult. Children’s bodies are still growing and developing and their detoxification mechanisms are not fully developed – harm to their organs in this delicate

INTRODUCING THE CHILDREN’S CLIMATE RISK INDEX 20
and critical stage can have lifelong implications. For example, lung damage in early childhood due to air pollution can be irreparable and affect lung capacity through to adulthood. Children’s brains are also growing at their fastest rate – exposure to harmful toxins such as lead and mercury can affect their cognitive development, decrease IQ, and create a range of mental disabilities.
• Children are also more susceptible than adults to diseases that will proliferate with climate change, such as malaria and dengue. Nearly 90 per cent of the global burden of disease associated with climate change is borne by children under the age of five. They are also highly susceptible to waterborne diseases and pathogens that emerge as a result of floods and contamination of water supplies. Every year 525,000 children die from diarrhoea, often caused by contaminated water.
• Children have their whole life ahead of them. Not only will the planet be a more dangerous place to live in their lifetime, but they also will bear the full costs of lost opportunities throughout their lives. For example, disruptions to education as a result of climate impacts will negatively affect a child’s ability to learn – affecting their future careers, and potential. Climate change causes more frequent disasters, and repeated disruptions greatly increase chances that education is stopped for good.
While children currently bear the greatest burden of impacts of climate change, they contribute least to the cause of the problem. The science suggests that to live within our straining climate boundaries children must make do with only one-eighth of the carbon emissions of someone born in 1950. In particular, children in developing countries who often face the most severe consequences of climate change contribute the least to its causes. For example, while the carbon footprint of a person in a high-income country is on average 10.3 metric tonnes of CO2
annually, a person in a low-income country is estimated to produce as little as 0.2 metric tonnes of CO2 annually.
Moreover, the effects of climate change will not be felt equally – the most vulnerable children will bear the greatest burden. For example, while climate change will impact agricultural systems globally – the effects will be most acute where the dominant source of income relies on the natural environment, where families spend the majority of their incomes on food, and where the nutritional status of children is insufficient to withstand changes in the price and quality of food. Similarly, while climate change will affect the health of children all around the world – the effects will be most acute where disease vectors become more prevalent and widespread, and where there are no universal health systems in place to protect all children from the shocks. Reducing risks associated with climate change must be based upon the local context, including: a) the type of hazard, shock or stress that children are likely to face; and b) where their access to key social services is insufficient.
It is these children – the most vulnerable children – that are not being heard. Young activists in developing countries have been tackling the climate crisis for years, and it is time their voices are heard. A combination of poor internet access, reduced capacity for travel to overseas conferences and events, low media coverage, and silencing from those in power are some of the key reasons why children’s voices from the most vulnerable countries are not heard and acted on in global conversations. However, this has not stopped activists from all over the globe taking a stance. To tackle the climate crisis effectively, the needs and demands of young people who will face the brunt of climate change impacts need to be voiced and addressed. In particular, girls, disabled young people, and people of colour are disproportionately affected by environmental hazards, so their perspectives are even more vital.
Listening and responding to the perspectives of ALL children and young people on climate change is critical. Decision-makers need to work harder to incorporate the views and experiences of children and young people in the design and content of climate policies and related processes. Not doing so not only undermines their rights to be heard and participate, but also the efficacy, strength and power of policies and the response to the climate crisis itself. If children and young people are heard, policies will change. They will change not only in the scope of their ambition, but also in the nature of their focus. They will better address children’s needs, as well as aspirations. Children’s voice and agency is critical to their potential capacity to respond and adapt to the impacts of climate change. Children should be provided with the resources they need to tackle climate change in the future – they cannot be starved of future resources due to our choices today.

Introduction 21
Decision-makers need to respond to children and young people’s concerns – not by paying lip service, or through tokenistic engagements, but with the scale and force that is commensurate with the magnitude of the issue at hand. Responding appropriately to climate change will require big decisions and changes to our entire economic system – it requires addressing how progress is measured and how stakeholders are held accountable. It will require bequeathing to children and young people a liveable planet together with an economic model that is sustainable.
Yet, while the outlook is dire, there is room for optimism and hope: we can reimagine an environment fit for children.
Increasing the resilience and delivery of social services is a critical way to improve the chances of many of the most vulnerable children. Research shows that improving social services like health care, education, agricultural productivity, social safety nets and disaster risk reduction are key ways to build a more resilient and inclusive economy which can mitigate the worst impacts of climate change. Recent World Bank estimates suggest that up to 132 million people will be pushed into extreme poverty as a result of climate change by the end of this decade.2 Health aspects (malaria, diarrhoea, and stunting) and food prices account for the bulk of the impact. However, with adequate investments in key social services, increased access to health care and clean water, and improved social safety nets and disaster risk reduction measures, that number could be significantly reduced. Meeting the Sustainable Development Goals could halve the number in extreme poverty.
Moreover, large-scale changes on the horizon will tip the scales in favour of green solutions. The cost of renewable energy continues to fall and it is becoming more reliable. Renewables are expected to account for 95 per cent of the net growth in global power capacity between now and 2025. Technologies for forecasting climate impacts and more effective water management continue to improve. Investing in resilient infrastructure has benefit–cost ratios of 4:1; spending US$800 million on early warning systems in developing countries would not only save lives but also help avoid losses of US$3–16 billion per year. The financial system is increasingly recognizing the risks that a degrading climate poses and the importance of valuing and promoting resilience.
Climate action can have a tremendously positive impact on GDP. Adopting climate adaptation and mitigation measures will boost economic growth in the medium and long term. For example, recent research has shown that the economic benefits of avoiding climate change impacts such as flooding or storm damage include a net increase of GDP of 5 per cent for
G20 countries by 2050. Therefore, it is essential that countries adopt pro-environmental policies in their economic agendas, in order to support the transition towards green growth. This includes integrating climate policies such as carbon pricing with supportive economic policies to promote growth focused on low-emission, energy efficient and climate-resilient infrastructure.
Nature-based solutions are also critical. These help address societal challenges, such as key infrastructure for children, while simultaneously protecting, managing and restoring ecosystems and biodiversity. These solutions address both mitigation and adaptation goals, and have co-benefits that extend across social, economic and environmental dimensions. Examples include wetland restoration, mangroves, marshes and oyster reefs, to help prevent coastal erosion as a result of sea level rise. These can significantly reduce wave impacts, both in terms of height and intensity, during storms. Co-benefits extend to carbon sequestration and water quality improvement and habitat preservation, as well as positive impacts for tourism and recreation.
“We have a moral obligation to ensure that the trillions of dollars for COVID-19 recovery – money that we are borrowing from future generations – does not leave them burdened by a mountain of debt on a broken planet.”
António Guterres, United Nations Secretary-General

INTRODUCING THE CHILDREN’S CLIMATE RISK INDEX 22
Somalia, 2021 © UNICEF/UN0405633/Taxta
Examples also include green roofs, rain gardens, and urban tree canopies – which serve to reduce the effects of high temperatures and to cool buildings (cutting average temperatures in urban areas by up over 2oC), reduce and control run-off and flooding during episodes of high precipitation (they capture and release rain more slowly, helping to control flood surges), improve water quality and reduce air pollution. These interventions can also have economic benefits – such as reduced air conditioning costs, lower water treatment costs, and savings associated with improved public health. These solutions recognize and address the full set of interactions within an ecosystem, and work across sectors to promote sustainable management. They can also help restore the structure, function and composition of ecosystems.
There is hope because it is not just governments, but also businesses and communities that are leading the way in rethinking and innovating their supply chains and operations to reduce greenhouse gas emissions in ways that maximize efficiency as well as their bottom lines. Revolutions in how we produce food and eat are also helping to reduce emissions. We are learning and applying ways of growing food so that it does not damage the environment, and using less fertilizers and precious resources like water. Many people are also altering consumption habits to incorporate more plant-based products, not only to improve health but also because it can have a positive impact on the environment compared with diets that include a lot of meat and dairy. Scaling up these solutions is needed at a global scale.

Introduction 23
One of the biggest reasons for hope is the power of children and young people. In recent years, children and young people have taken to the streets to demand action on climate change, and throughout the COVID-19 pandemic they have continued their protest online. They have risen to the challenge, demanding that the world recognize that climate change is now the defining human rights challenge of this generation. They have revealed the depth of frustration that they feel at this intergenerational form of injustice, as well as their courage and willingness to challenge the status quo, and their role as key stakeholders in addressing the climate crisis.
Children are not afraid – and nor should they be – to demand that adults do everything they can to protect their future home. However, while these children and young people may be the future leaders and innovators who will do what is necessary to protect the planet, it might be too late. What we do now is imperative to at least give children the best chance they can get.
COVID-19 has added a new dimension to this challenge, but the recovery process is also an opportunity to reimagine. COVID-19 has revealed the depth of what can go wrong if we do not listen to science and act rapidly in the face of a global crisis. It has laid bare the inequality that cuts across and within countries – the most vulnerable are often propelled further into poverty due to multiple risk factors, including poor access to vaccines, creating vicious cycles that are difficult to escape.
Madagascar, 2021 © UNICEF/UN0475050/Ralaivita
But this crisis is also presenting us with an opportunity to reimagine a world fit for children. It has taught us that we need to better understand both the scale and scope of children’s vulnerabilities in order to come up with solutions that make sense and can be scaled up in a variety
of contexts – and where the impacts are very heterogeneous. We can harness this chance, while responding to and recovering from COVID-19, to also address climate change challenges that have been too often ignored – because for children, going back to the old normal is not good enough.

INTRODUCING THE CHILDREN’S CLIMATE RISK INDEX 24
A Promising Idea: Educating every child on climate change
Climate change is the defining challenge of the next generation and any chance of addressing it requires that boys and girls develop the knowledge and skills required to care for the environment and climate. But not all education systems teach climate change, and where they do, what children are taught about climate change might not be relevant for their context – including how to prepare and respond to certain types of disasters. Poor climate change education and the increased availability of misinformation online make it harder for children and young people to distinguish between fact and fiction.
Despite the recognition of the importance of global climate change education, only 26 per cent of NDCs referenced education as a strategy for increasing the knowledge, skills, and capacity of primary and secondary school children to adapt or mitigate climate change. Urgent action is needed to ‘climate proof’ the education sector and to produce information that is accurate and empowers children to become climate-conscious citizens who are actively involved in climate adaptation and mitigation. According to recent research, if only 16 per cent of high school pupils in high- and middle-income nations received climate change education, carbon dioxide emissions would be reduced by approximately
19 gigatons by 2050.5 Ensuring that all children receive accurate and appropriate information about climate change, and the skills and training necessary to contribute creatively and find meaningful jobs in the growing green economy, will be crucial to address the climate crisis.
Educating all children on climate change could include focused resources on:
• The science – How the planet works, and how human activity is affecting the climate. The lessons would strengthen Science, Technology, Engineering and Mathematics (STEM) education, and address not just the science behind solar panels and sea level rise, but topics like climate equity, intersectionality and the role of civic participation in solving problems.
• Disaster response – What to do in case of flood, fire, hurricane, etc. Elements of the curriculum should be adapted to local contexts (e.g., disaster preparedness modules relevant in a specific locality) and for different age groups. This includes school risk management and school safety programmes.
• Environmental challenges – Understanding the relationship between the climate crisis and biodiversity loss, plastics, the hole in the ozone layer, etc.
• Solutions and action – Policies, processes and technologies; green skills; how to make change at home, in your wider community and around the world. This could also include extracurricular activities focused on reforestation and environmental protection and school-to-community linkages that also build civic responsibility and social cohesion.
A universal curriculum could create a common language for the next generation to discuss climate change, making it easier for them to communicate with one another. In this way, learning together helps foster a sense of solidarity between the children and young people to address climate change together.
INTRODUCING THE CHILDREN’S CLIMATE RISK INDEX 24

Introduction 25Introduction 25
Campaigning for climate justice in a COVID-19 worldIt was a rainy night in November. I had just finished doing a protest action in time for the Finance in Common Summit. A lot of Filipinos were still reeling from the devastation brought about by the strongest typhoon on the planet this year, which crashed into the Philippines barely a week before.
“Have we posted our infographics about the Finance in Common Summit and the Asia Climate Rally? How about our calls for donations?” I asked my friend as we were huddled under an umbrella when my phone suddenly rang. It was my mother
– she told me how the river in our city was starting to rise, how another typhoon had come, and suggested I go home because the roads were starting to get flooded. I had to sit in the dark for two days, not knowing if my house was consumed by the floods or even if my mother was okay.
This is the reality in the Philippines, and I am still one of the more privileged ones. So as soon as we heard about the typhoons, we jumped into action. My organization, Youth Advocates for Climate Action Philippines – the Fridays for Future of the Philippines – immediately prepared to help the most impacted communities.
We set up a donation drive and planned relief operations, spending several weekends travelling from one community to another to help and talk to them.
As we were going to the evacuation centres, we saw how big groups of people were squeezed into small rooms, how there was literally no space for social distancing. That’s what makes this situation so difficult – it’s not just climate that we’re facing, because like the rest of the world, we are in the throes of the COVID-19 pandemic.
Looking into both the COVID-19 and climate crisis more closely, it is the marginalized sectors of society that are most impacted, and that is something we must always consider in our fight for climate and social justice.
All this has made climate activism even harder. It’s difficult to respond to the need of communities impacted when so many of us are not allowed to go outside due to health concerns.
The Philippines’ lockdown has made campaigning and organizing challenging. That’s the thing about activism – it’s not just about the powerful massive strikes and creative actions seen on media. It’s not just about going out on the streets and yelling out chants. Most of it is hours and hours of planning, tiring Zoom calls, strengthening the bonds between our members, and tirelessly convincing people of the need to act and demand change even when it all seems hopeless.
The Filipino youth are fighting for climate justice, and we have a global youth movement fighting for the same thing. This gives me so much hope, the knowledge that on almost every continent, we have a friend also calling for urgent climate action. We are fighting with the people, leading the way alongside the most marginalized sectors of society, and history has shown us that as long as we fight for justice and peace, we will always win.
Youth perspectives: Mitzi, Philippines
Philippines, 2021
© UNICEF/UN0411242/
INTRODUCING THE CHILDREN’S CLIMATE RISK INDEX 26
Caption here Caption here Caption here Caption here Caption here Caption here Caption here Caption here. CREDIT
Nicaragua, 2020 © UNICEF/UN0372375/Ocon/AFP-Services

Children’s exposure to climate and environmental hazards, shocks and stresses
To identify effective solutions, we need to understand how children are uniquely vulnerable. We also need to better understand the multiple risk factors, as well as the interplay between those risk factors.
Extreme temperatures
Globally, 2020 was the hottest year on record, effectively tying with 2016, the previous hottest year on record. The last six years have been the hottest six years on record. Global average temperatures have risen approximately 1ºC since the 1880s. Approximately 820 million children (over one-third of children globally) are currently highly exposed to heatwaves.
Children are affected more than adults, as they adjust more slowly to changes in environmental temperature and are more vulnerable to heat-related health risks. During heatwaves, children under 12 months old are particularly vulnerable. Infants and small children are more likely to die or suffer from heatstroke because they are unable or lack agency to regulate their body temperature and control their surrounding environment. Exposure to abnormal or prolonged heat and humidity without relief or adequate fluids can cause various types of heat-related illnesses. It is also likely to cause children to miss school; for example, in South-East Asia exposure to higher-than-average temperatures during early years has been linked to children attending fewer years of schooling. In addition, warm environments (without proper ventilation) can make the classroom uncomfortable, leading to lower learning outcomes.
The health effects of heatwaves include heat rash as well as heat-related cramps, exhaustion and stroke. Dehydration can also occur as a result of extreme heat stress, which inhibits perspiration. In babies and young children, this is a prevalent cause of hyperthermia and mortality. Heat-related mortalities can also be increased by factors that cause excessive fluid loss, such as diarrhoea.
2The last six years have been the hottest six years on record. 2020 was the hottest, effectively tying with 2016.

INTRODUCING THE CHILDREN’S CLIMATE RISK INDEX 28
Map 3: Heatwave exposure per year
Source: Cowtan, Kevin & National Center for Atmospheric Research Staff (Eds). “The Climate Data Guide: Global surface temperatures: BEST: Berkeley Earth Surface Temperatures.” Retrieved from https://climatedataguide.ucar.edu/climate-data/global-surface-temperatures-best-berkeley-earth-surface-temperatures. Calculated by the Data for Children Collaborative with UNICEF.
Annual Average Frequency (2000–2020)
Extremely High (8–10)
High (6–8)
Medium–High (4–6)
Low–Medium (2–4)
Low (0–2)
N O RT H PA C I F I CO C E A N
S O U T H PA C I F I CO C E A N
S O U T H AT L A N T I CO C E A N
N O RT H AT L A N T I CO C E A N
I N D I A NO C E A N
S O U T H E R N O C E A N
N O RT H PA C I F I CO C E A N

Children’s exposure to climate and environmental hazards, shocks and stresses 29
Map 4: Temperature anomaly (2000–2020 compared with 1951–1990)
Source: Cowtan, Kevin & National Center for Atmospheric Research Staff (Eds). “The Climate Data Guide: Global surface temperatures: BEST: Berkeley Earth Surface Temperatures.” Retrieved from https://climatedataguide.ucar.edu/climate-data/global-surface-temperatures-best-berkeley-earth-surface-temperatures. Calculated by the Data for Children Collaborative with UNICEF.
Annual Average Temperature Anomaly (Degrees Celsius)
2.1–10
1.7–2
1.3–1.6
0.81–1.2
0.41–0.8
0.01–0.4
-0.39–0
-0.64– -0.4
<-0.65
INTRODUCING THE CHILDREN’S CLIMATE RISK INDEX 30
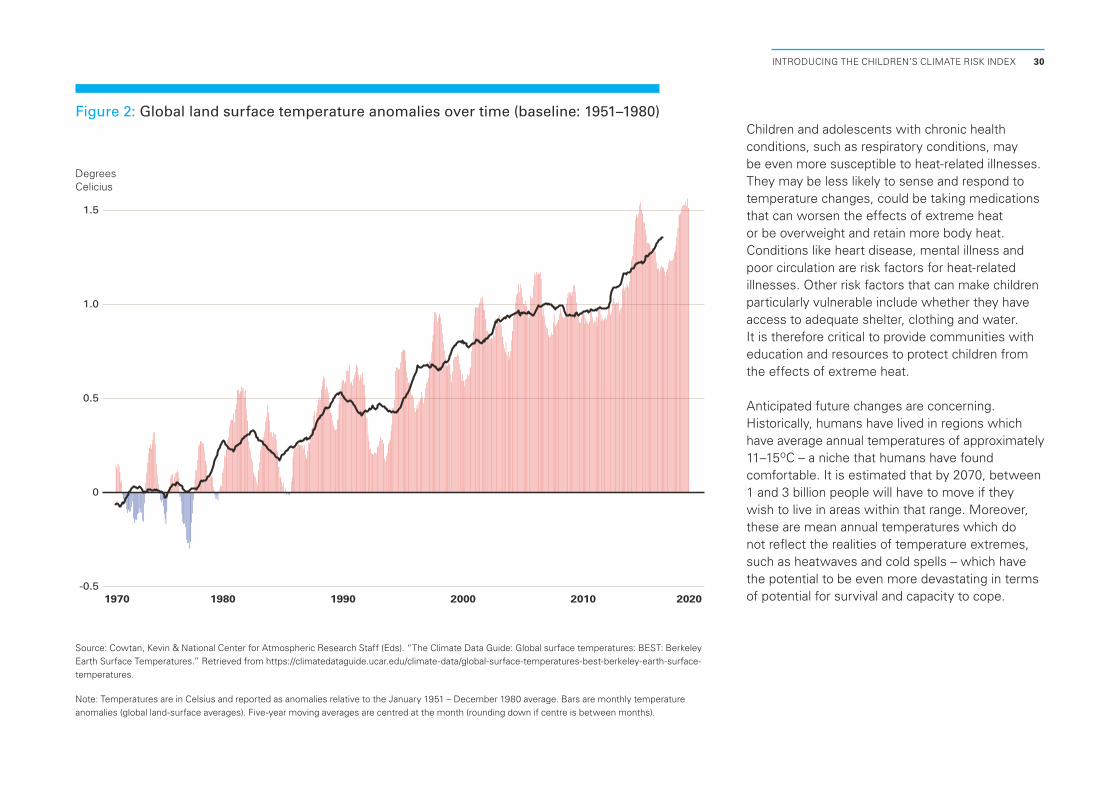
Children and adolescents with chronic health conditions, such as respiratory conditions, may be even more susceptible to heat-related illnesses. They may be less likely to sense and respond to temperature changes, could be taking medications that can worsen the effects of extreme heat or be overweight and retain more body heat. Conditions like heart disease, mental illness and poor circulation are risk factors for heat-related illnesses. Other risk factors that can make children particularly vulnerable include whether they have access to adequate shelter, clothing and water. It is therefore critical to provide communities with education and resources to protect children from the effects of extreme heat.
Anticipated future changes are concerning. Historically, humans have lived in regions which have average annual temperatures of approximately 11–15oC – a niche that humans have found comfortable. It is estimated that by 2070, between 1 and 3 billion people will have to move if they wish to live in areas within that range. Moreover, these are mean annual temperatures which do not reflect the realities of temperature extremes, such as heatwaves and cold spells – which have the potential to be even more devastating in terms of potential for survival and capacity to cope.
Figure 2: Global land surface temperature anomalies over time (baseline: 1951–1980)
-0.5
0
0.5
1.0
1.5
2.0
1970 1980 1990 2000 2010 2020
Source: Cowtan, Kevin & National Center for Atmospheric Research Staff (Eds). “The Climate Data Guide: Global surface temperatures: BEST: Berkeley Earth Surface Temperatures.” Retrieved from https://climatedataguide.ucar.edu/climate-data/global-surface-temperatures-best-berkeley-earth-surface-temperatures.
Note: Temperatures are in Celsius and reported as anomalies relative to the January 1951 – December 1980 average. Bars are monthly temperature anomalies (global land-surface averages). Five-year moving averages are centred at the month (rounding down if centre is between months).
Degrees Celicius

Children’s exposureto climate and environmentalhazards, shocks and stresses 31
Water scarcity
Water scarcity is defined as the lack of available water resources to meet the demands of a specific population. Water scarcity can be experienced by a community, region or country and may be temporary (for example over several months of the year), or increase and decrease over time. Water scarcity can either be physical or economic. Globally, water scarcity and droughts are becoming longer and more severe, and covering wider areas. Only about 2.5 per cent of the world’s water resources consist of fresh water, of which around two-thirds is trapped in ice and glaciers, leaving very little for human consumption. Around 0.3 per cent of fresh water is in lakes and rivers.
Physical water scarcity, as shown in map 5, comprises the following:
1. Baseline water stress, which measures the ratio of total water withdrawals to available renewable surface and groundwater supplies.
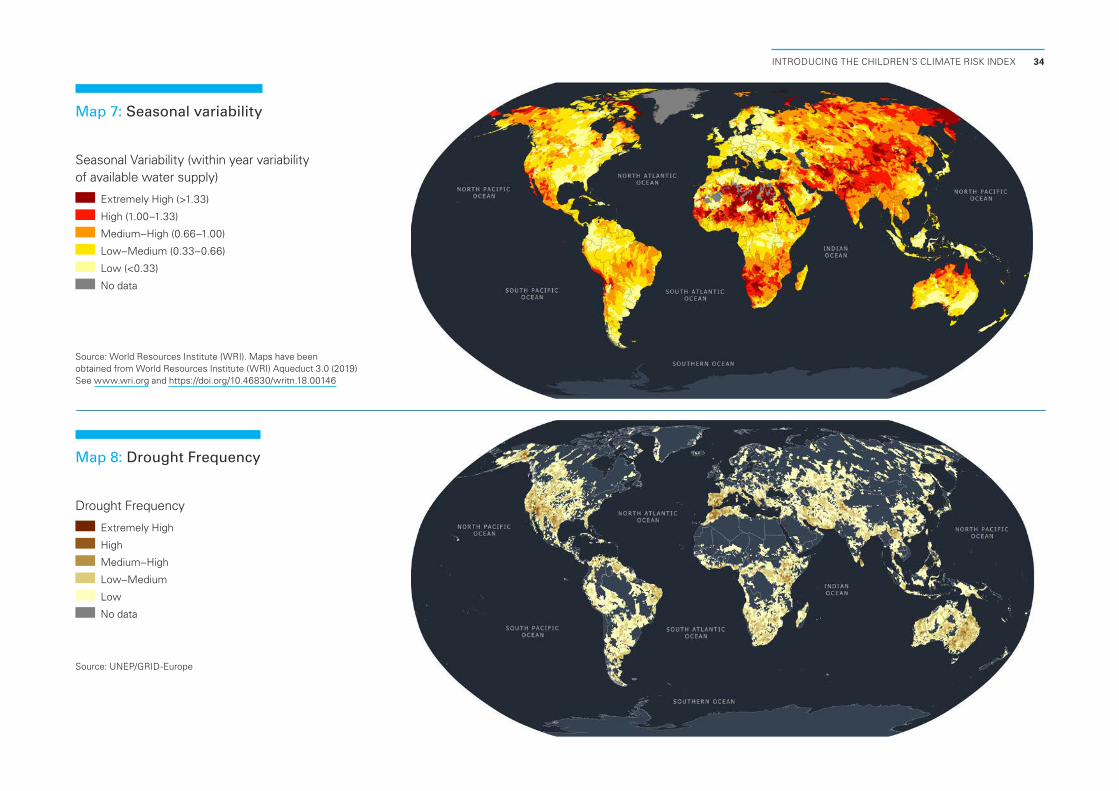
2. Drought events, which is an estimate of global drought annual repartition based on the Standardized Precipitation Index – where monthly precipitation is lower than 50 per cent of the median value during at least three consecutive months.
3. Interannual variability, which measures the average between-year variability of available water supply, including both renewable surface and groundwater supplies.
4. Seasonal variability, which measures the average within-year variability of available water supply.
5. Groundwater table decline, which measures the average decline of the groundwater table.
Water scarcity is caused by low rates of recharge, as well as decades of misuse, poor management, overextraction of groundwater and contamination of freshwater supplies. Most droughts are slow onset, but can be more acute if they occur in arid zones or in combination with heatwaves. As temperatures rise, more moisture evaporates from land and water, leaving less water for human consumption. Simultaneously, higher temperatures lead to increasing demand, which is already rising due to population growth, urbanization and increasing water needs from sectors including agriculture, industry and energy.
Water scarcity and droughts can have multiple effects on poor families and communities. Crops fail, livestock die and income drops, leading to food insecurity as well as rising food prices. Inequitable access to these necessities can also result in social disorder.
Cambodia, 2019 © UNICEF/UN0290932/Llaurado
For children, water is life.

INTRODUCING THE CHILDREN’S CLIMATE RISK INDEX 32
Map 5: Water Scarcity
Source: The Water Scarcity Index was created using water risk data from the World Resources Institute (WRI) and drought events data from the Global Data Risk Platform of the United Nations Environment Programme (UNEP)
Severity
Extremely High
High
Medium–High
Low–Medium
Low

Children’s exposureto climate and environmentalhazards, shocks and stresses 33
Children need to consume more food and water per unit of body weight than adults. These deprivations can have both immediate and lifelong impacts. Undernutrition contributes to the severity of a range of diseases, and is responsible for nearly half of the deaths of children under five. Undernutrition which is untreated during the first two years of life can lead to irreversible stunting. Approximately 144 million children worldwide under five are stunted. This affects both physical and cognitive development, which has implications for the rest of a child’s life – including schooling, health and livelihood.
Water scarcity can also increase the incidence of a range of diseases. A reduction in the availability of fresh water for drinking and hygiene places children at an increased exposure to diseases such as cholera, typhoid, acute respiratory infections and measles. Waterborne infections can also cause diarrhoea – which in itself is one of the biggest killers of children globally. A decrease in water volume can also lead to an increase in the concentration of biological and chemical contaminants, which can harm children.
When crops fail, livestock dies and income drops, food insecurity and food prices rise. Inequitable access to these necessities can also result in social disorder. Families and children may also lose access to health care when food and water prices strain family budgets; and health services may become disrupted if health-care workers are forced to leave areas due to drought.
Additionally, overcrowding, resulting from displacement of populations and high demand for the limited water available, can also affect water consumption and sanitation conditions.
Maps 6–10: Unpacking Water Scarcity
Map 6: Baseline water stress
Source: World Resources Institute (WRI). Maps have been obtained from World Resources Institute (WRI) Aqueduct 3.0 (2019) See www.wri.org and https://doi.org/10.46830/writn.18.00146
Baseline Water Stress (Ratio of total water withdrawals to available renewable surface and groundwater supplies)
Extremely High (≥80%)
High (40–80%)
Medium–High (20–40%)
Low–Medium (10–20%)
Low (<10%)
Arid and Low Water Use
INTRODUCING THE CHILDREN’S CLIMATE RISK INDEX 34
Map 7: Seasonal variability
Source: World Resources Institute (WRI). Maps have been obtained from World Resources Institute (WRI) Aqueduct 3.0 (2019) See www.wri.org and https://doi.org/10.46830/writn.18.00146
Seasonal Variability (within year variability of available water supply)
Extremely High (>1.33)
High (1.00–1.33)
Medium–High (0.66–1.00)
Low–Medium (0.33–0.66)
Low (<0.33)
No data
Map 8: Drought Frequency
Source: UNEP/GRID-Europe
Drought Frequency
Extremely High
High
Medium–High
Low–Medium
Low
No data

Children’s exposureto climate and environmentalhazards, shocks and stresses 35
Map 9: Interannual variability
Source: World Resources Institute (WRI). Maps have been obtained from World Resources Institute (WRI) Aqueduct 3.0 (2019) See www.wri.org and https://doi.org/10.46830/writn.18.00146
Interannual Variability (average between-year variability of available water supply)
Extremely High (>1.00)
High (0.75–1.00)
Medium–High (0.50–0.75)
Low–Medium (0.25–0.50)
Low (<0.25)
No data
Map 10: Groundwater table decline
Source: World Resources Institute (WRI). Maps have been obtained from World Resources Institute (WRI) Aqueduct 3.0 (2019) See www.wri.org and https://doi.org/10.46830/writn.18.00146
Groundwater Table Decline (average decline per year)
Extremely High (>8 cm/y)
High (4–8 cm/y)
Medium–High (2–4 cm/y)
Low–Medium (0–2 cm/y)
Low (<0 cm/y)
Insignificant Trend
No data

INTRODUCING THE CHILDREN’S CLIMATE RISK INDEX 36
Girls are often affected more than boys – and have to travel further, often in unsafe conditions, to reach water and bring it home; women and girls collect 80 per cent of water for households globally. They are also often the first to be removed from school to help support their families in times of crisis.
The risks to children from water scarcity and droughts extend beyond threats to their physical well-being and protection. Children also experience emotional distress, including fear of family separation, the impacts of water-related conflict, mounting tensions and pressures within households, a lack of emotional support, and increased workloads.
The impact of water scarcity on children’s health, development and safety jeopardizes decades of progress made in child survival and sustainable development. It is posing a threat to children’s lives in the present, and children of the future will face even greater consequences.
Angola, 2019 © UNICEF/UNI336753/Louzada
Children’s exposureto climate and environmentalhazards, shocks and stresses 37
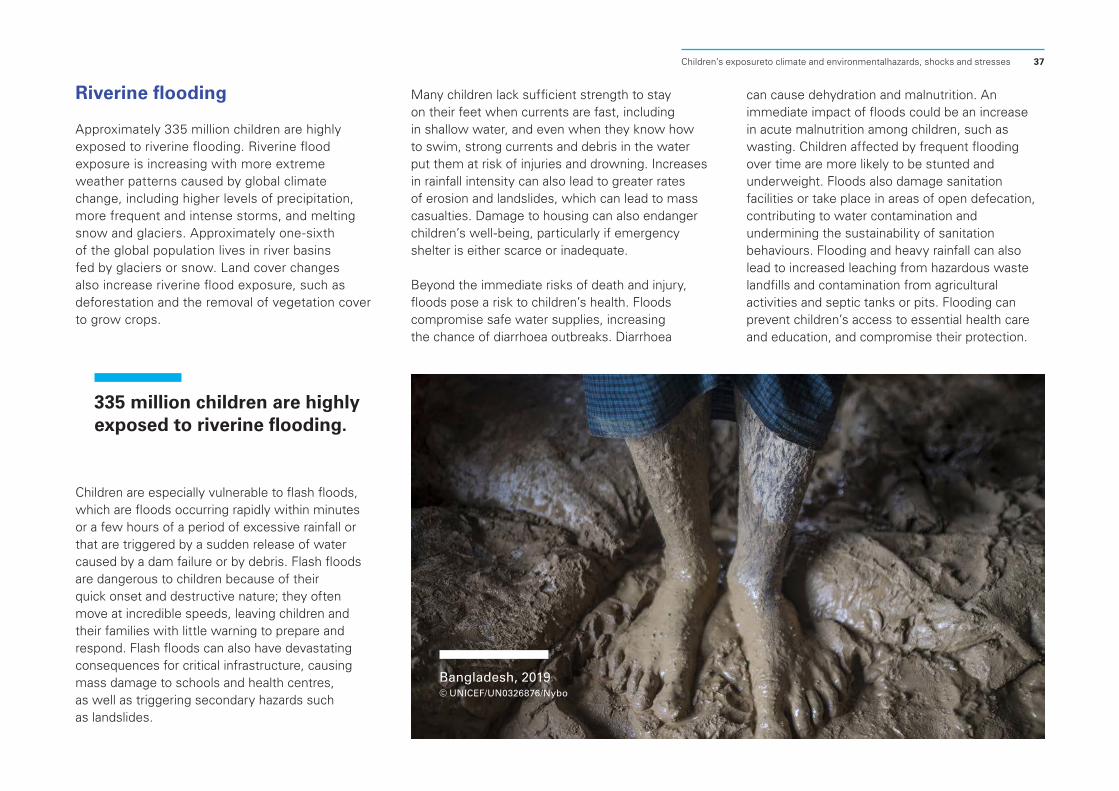
Riverine flooding
Approximately 335 million children are highly exposed to riverine flooding. Riverine flood exposure is increasing with more extreme weather patterns caused by global climate change, including higher levels of precipitation, more frequent and intense storms, and melting snow and glaciers. Approximately one-sixth of the global population lives in river basins fed by glaciers or snow. Land cover changes also increase riverine flood exposure, such as deforestation and the removal of vegetation cover to grow crops.
Children are especially vulnerable to flash floods, which are floods occurring rapidly within minutes or a few hours of a period of excessive rainfall or that are triggered by a sudden release of water caused by a dam failure or by debris. Flash floods are dangerous to children because of their quick onset and destructive nature; they often move at incredible speeds, leaving children and their families with little warning to prepare and respond. Flash floods can also have devastating consequences for critical infrastructure, causing mass damage to schools and health centres, as well as triggering secondary hazards such as landslides.
Bangladesh, 2019 © UNICEF/UN0326876/Nybo
335 million children are highly exposed to riverine flooding.
Many children lack sufficient strength to stay on their feet when currents are fast, including in shallow water, and even when they know how to swim, strong currents and debris in the water put them at risk of injuries and drowning. Increases in rainfall intensity can also lead to greater rates of erosion and landslides, which can lead to mass casualties. Damage to housing can also endanger children’s well-being, particularly if emergency shelter is either scarce or inadequate.
Beyond the immediate risks of death and injury, floods pose a risk to children’s health. Floods compromise safe water supplies, increasing the chance of diarrhoea outbreaks. Diarrhoea
can cause dehydration and malnutrition. An immediate impact of floods could be an increase in acute malnutrition among children, such as wasting. Children affected by frequent flooding over time are more likely to be stunted and underweight. Floods also damage sanitation facilities or take place in areas of open defecation, contributing to water contamination and undermining the sustainability of sanitation behaviours. Flooding and heavy rainfall can also lead to increased leaching from hazardous waste landfills and contamination from agricultural activities and septic tanks or pits. Flooding can prevent children’s access to essential health care and education, and compromise their protection.

INTRODUCING THE CHILDREN’S CLIMATE RISK INDEX 38
Source: UNDRR Global Risk Assessment 2015: GVM and IAVCEI, UNEP, CIMNE and associates and INGENIAR, FEWS NET and CIMA Foundation. Map is based on a 50-year return period.
Map 11: Riverine flooding
Riverine flooding
Extremely High Low

Children’s exposureto climate and environmentalhazards, shocks and stresses 39
Coastal flooding
Approximately 240 million children are highly exposed to coastal flooding. Coastal flood risk is caused by rising sea levels as well as storm surges and cyclones due to the increasing frequency and severity of severe weather associated with climate change. Higher global temperatures also cause thermal expansion of water, increasing coastal flood risk.
Between 1901 and 2010, global sea levels rose by 19 cm – an average of about 1.7 mm per year. In recent decades the rate of sea level rise has been increasing; between 2006 and 2015, sea levels rose 3.6 mm per year.6 The range of global average sea level rise is projected to be between 26 cm and 82 cm, depending on the level of emissions that are released into the atmosphere over the coming decades.7 These impacts will happen gradually, but will nevertheless have major implications. The impact of rising sea levels will
be even more acute when combined with extreme weather events, such as tropical cyclones.
Sea level rise will have a disproportionate impact on children living in low-lying coastal areas who will be increasingly exposed to coastal flooding. For example, rising sea levels and increased flooding can increase coastal erosion, with waves extending further up and along shorelines. Both flooding and erosion puts ports, homes, infrastructure, agricultural land and ecosystems at increased potential of exposure. Such risks are particularly critical in low-lying and densely populated coastal zones.
Coastal flooding also salinates freshwater aquifers and arable land, which millions of people depend on for drinking water and agriculture. Salinization occurs due to the vertical and lateral intrusion of seawater via coastal aquifers and affects both the quality and quantity of freshwater resources, making water unsafe for human consumption and threatening livelihoods, public health, agriculture, aquaculture, infrastructure and coastal ecosystems.
Bangladesh, 2018 © UNICEF/UN0159763/Nybo
240 million children are highly exposed to coastal flooding.

INTRODUCING THE CHILDREN’S CLIMATE RISK INDEX 40
Source: World Resources Institute (WRI). Maps have been obtained from World Resources Institute (WRI) Aqueduct 3.0 (2019) See www.wri.org and https://doi.org/10.46830/writn.18.00146
Map 12: Coastal flooding
Coastal flooding
Extremely High
High
Medium–High
Low–Medium
Low

Children’s exposureto climate and environmentalhazards, shocks and stresses 41
Cyclone exposure
Approximately 400 million children globally live in areas that are highly exposed to tropical cyclones. Tropical cyclones (known as typhoons, hurricanes and cyclones depending on their location) are rapidly rotating low-pressure storms which form over tropical or subtropical oceans. Cyclones encompass a number of different hazards including flooding, storm surges, extreme winds and lightning.
While the relationship between climate change and cyclone frequency is complex, with some projecting a decrease in frequency, there is agreement that warmer ocean temperatures and rising sea levels are likely to increase the frequency of high-intensity cyclones, such as Category 4 or 5 tropical cyclones. Moreover, increased temperatures can also mean increased levels of precipitation – for every 1oC increase, the atmosphere can hold 7 per cent more moisture. More severe cyclones will be more costly in terms of deaths and damage, especially in coastal areas. The zone in which cyclones occur is also shifting poleward as the tropics expand with increased global temperatures.
Tropical cyclones pose grave and immediate risks to children including serious injuries and death, the breakdown and destruction of essential services such as health, water and sanitation, and widespread population displacement. In 2019, 1.1 million children were affected by cyclones Kenneth and Idai in Mozambique and 10 million children were reportedly in the path of tropical cyclone Fani, India.
Tropical storms, including but not limited to cyclones, often result in extensive damage to infrastructure (roads, railways, bridges, power lines, communication and coastal protection), buildings (homes, schools and health clinics), agriculture, forestry and coastline erosion; this
can affect economic development, social stability and the rule of law. Such impacts pose grave risks to children’s well-being and development, with vulnerable children facing the most devastating impacts.
A range of other types of severe weather are linked to climate change, including desert storms/sandstorms, tornadoes, hail and tropical depressions. The map below only considers cyclones and not other types of severe weather, which may be more prominent across a range of geographies. This topic should be subject to further consideration and analysis.
Vanuatu, 2015 © UNICEF/UN055824/Sokhin
400 million children globally live in areas that are highly exposed to tropical cyclones.

INTRODUCING THE CHILDREN’S CLIMATE RISK INDEX 42
Source: UNDRR Global Risk Assessment 2015: GVM and IAVCEI, UNEP, CIMNE and associates and INGENIAR, FEWS NET and CIMA Foundation. Map is based on a 100-year return period..
Map 13: Cyclone wind exposure
Severity (average windspeed)
> 208km/h
178 – 208km/h
153 – 178km/h
119 – 153km/h

Children’s exposureto climate and environmentalhazards, shocks and stresses 43
Disease vector exposure
The extent of lethal and debilitating diseases, including malaria and dengue, is highly susceptible to changes in the climate. In 2019, there were an estimated 229 million malaria cases worldwide, with over 409,000 fatalities. Children under the age of five accounted for 67 per cent of global malaria deaths in 2019. Dengue fever is the most rapidly spreading mosquito-borne arboviral disease in the world. It is estimated that 3.9 billion people are potentially exposed to dengue and children especially vulnerable.
Climate change will affect the spread of diseases that predominantly kill children.
South Sudan, 2020 © UNICEF/UN0360007/Naftalin
Changes in temperature, precipitation patterns and humidity have a direct effect on the reproduction and survival of the mosquitoes that transmit these vector-borne diseases. Warmer temperatures also increase bite rates and transmission. Moreover, rising temperatures are associated with reductions in a mosquito’s virus incubation periods, leading to higher mosquito proliferation, faster mosquito oviposition cycles and egg laying, and alterations in mosquito feeding habits.
With increasing temperatures and shifting agro-ecological zones, the geographic prevalence of many of these diseases is changing and spreading into higher altitudes. For example, tropical highland zones such as in Eastern Africa, are likely to see higher rates of malaria transmission as temperatures rise. This makes population groups who may have not yet adopted practices to protect themselves and their children from malaria particularly vulnerable.
The environmental and social changes that often follow disasters, such as infrastructure destruction, contaminated drinking water (leading to makeshift water storage), and people sleeping in temporary outdoor shelters, can result in higher levels of exposure too. They can also influence the spread of other deadly diseases such as cholera and meningococcal meningitis and other food-borne diseases.

INTRODUCING THE CHILDREN’S CLIMATE RISK INDEX 44
Source: This map combines data from Gething, PW, et al. (2011); Gething PW, et al. (2012); Messina, J, et al. (2016); Messina, J.P (2019); & Kraemer et al. (2015).
Map 14: Disease vector exposure
Transmission Potential
Extremely High
High
Medium–High
Low–Medium
Low

Children’s exposureto climate and environmentalhazards, shocks and stresses 45Children’s exposureto climate and environmentalhazards, shocks and stresses 45
Each day millions of young people live to face the harsh climate reality. Has anyone ever imagined the impact of this changing climate in 30 years? What the lives of young people cutting across all cultural diversities will be like? What keeps me on the frontline for climate justice is the notion that I don’t only represent my nation but my entire generation because climate justice concerns our future.
I have dedicated my voice as a voice of the voiceless, to call for immediate action and there is no better time for acting than now. Take a closer look at the unpredictability and uncertainty of weather patterns, the rise in sea levels, frequent cyclones, hot temperatures and heatwaves – honestly, how am I expected to attend school under a scorching sun?
Since I was 10, I have always strived to lift up my voice just to get even a single moment’s attention from a decision-maker. I say: ‘Trust me, I live climate change, my friends and family live it too.’ ‘Someone do something!’ Above all I am the one being affected by the changing climate. We are here, we are smart, and we have the solutions. I am young but climate change has put more on my plate; more is expected out of me.
I imagine a world where every child is included in crucial decision-making. I would imagine a world where every household uses clean energy. But the painful part of all this is that this might just be imaginations which will never come to pass. If there is a fear in me, it’s that I have dedicated my time to advocate for change and yet as I grow older each year nothing convincing gives me hope that the future is green. Someone must do something and that someone is none other than you, I have started the change I want, you can also do something to save the future and there is no better time for doing that than now.
Youth perspectives: Nkosi, Zimbabwe
Spain, 2019 © UNICEF/UNI240662/Herrero

INTRODUCING THE CHILDREN’S CLIMATE RISK INDEX 46
Map 15: Plasmodium Falciparum Malaria
Source: Gething, P. W., Patil, A. P., Smith, D. L., Guerra, C. A., Elyazar, I. R., Johnston, G. L., Tatem, A. J., … Hay, S. I. (2011). A new world malaria map: Plasmodium falciparum endemicity in 2010. Malaria journal, 10, 378doi:10 .1186/1475-2875-10-378
Transmission Stability
Unstable
Stable
Map 16: Plasmodium Vivax Malaria
Source: Gething, P. W., Elyazar, I. R., Moyes, C. L., Smith, D. L., Battle, K. E., Guerra, C. A., Patil, A. P., Tatem, A. J., Howes, R. E., Myers, M. F., George, D. B., Horby, P., Wertheim, H. F., Price, R. N., Müeller, I., Baird, J. K., … Hay, S. I. (2012). A long neglected world malaria map: Plasmodium vivax endemicity in 2010. PLoS neglected tropical diseases, 6(9), e1814. doi: 10.1371/journal.pntd.0001814
Transmission Stability
Unstable
Stable
Maps 15–19: Unpacking Disease Vector Exposure
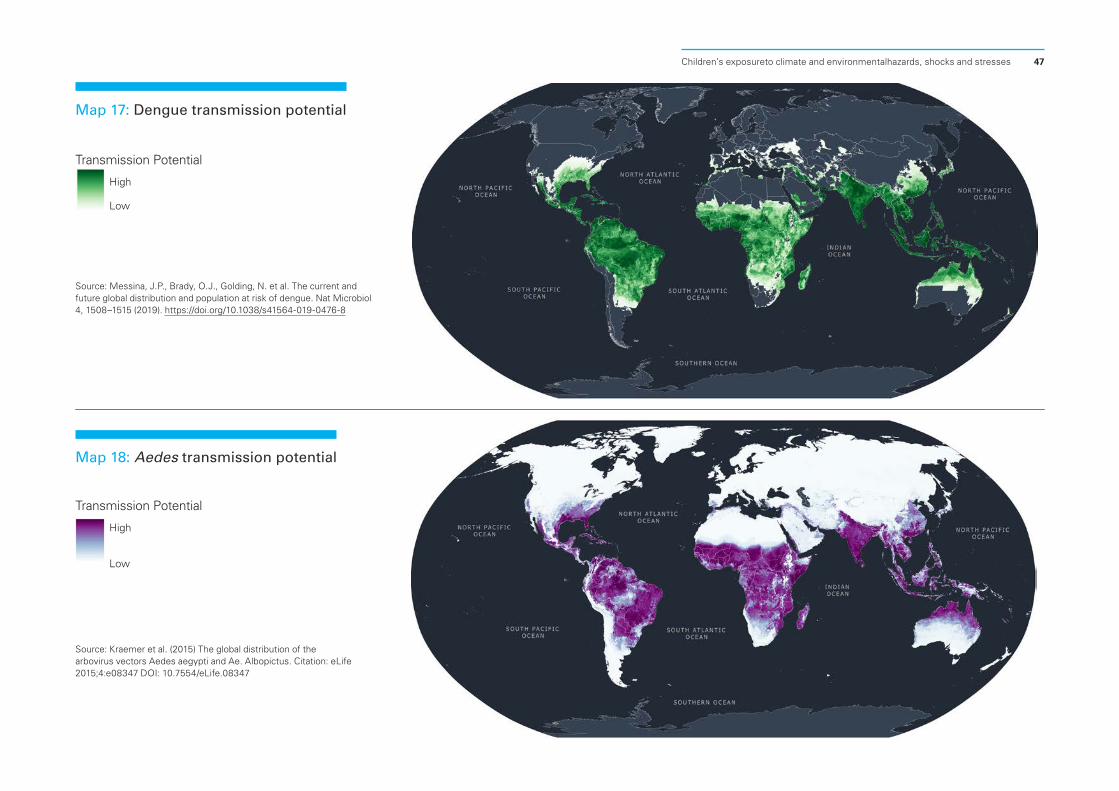
Children’s exposureto climate and environmentalhazards, shocks and stresses 47
Map 17: Dengue transmission potential
Source: Messina, J.P., Brady, O.J., Golding, N. et al. The current and future global distribution and population at risk of dengue. Nat Microbiol 4, 1508–1515 (2019). https://doi.org/10.1038/s41564-019-0476-8
Transmission Potential
High Low
Map 18: Aedes transmission potential
Source: Kraemer et al. (2015) The global distribution of the arbovirus vectors Aedes aegypti and Ae. Albopictus. Citation: eLife 2015;4:e08347 DOI: 10.7554/eLife.08347
Transmission Potential
High Low

INTRODUCING THE CHILDREN’S CLIMATE RISK INDEX 48
Map 19: Zika transmission potential
Source: Messina, Jane; Kraemer, Moritz; Brady, Oliver; Pigott, David; Shearer, Freya; Weiss, Daniel; et al. (2016): Environmental suitability for Zika virus transmission. figshare. Dataset. https://doi.org/10.6084/m9.figshare.2574298.v1
Air pollution
Around 90 per cent of the world’s children breathe poisonous air every day and air pollution is associated with some of the biggest killers of children, such as pneumonia. Approximately 600,000 children died in 2016 from acute lower respiratory illnesses caused by contaminated air. Children’s lungs and their immune systems are still developing, making them especially vulnerable to polluted air, and their respiratory airways are smaller than adult airways, so infections are more likely to cause blockages than in adults. Children breathe twice as fast, taking in more air per unit of body weight, compared to adults.
Exposure to air pollution during childhood can harm the healthy functioning of children’s lungs, and this sometimes has lifelong implications. Approximately two billion children live in areas where air pollution levels exceed the baseline standards (of 10µg/m3) set by the World Health Organization (WHO). A large number of children live within polluted environments that exceed these thresholds many times over:
• 2 billion children live in areas where air pollution (PM2.5) exceeds WHO air quality guidelines (of 10µg/m3)
• 1.7 billion children (three quarters of children globally) are currently highly exposed to air pollution that exceeds 15µg/m3 – corresponding with WHO Interim Target-3 (IT-3) of 15µg/m3
• 1.3 billion children (nearly two thirds globally) are currently highly exposed to air pollution that exceeds 25µg/m3 – corresponding with WHO Interim Target-2 (IT-2) of 25µg/m3
• 1 billion children (almost half of children globally) are currently highly exposed to air pollution that exceeds 35µg/m3– corresponding with WHO Interim Target-1 (IT-1) of 35µg/m3
Transmission Potential
High Low

Children’s exposureto climate and environmentalhazards, shocks and stresses 49
Source: Hammer, M. S.; van Donkelaar, A.; Li, C.; Lyapustin, A.; Sayer, A. M.; Hsu, N. C.; Levy, R. C.; Garay, M. J.; Kalashnikova, O. V.; Kahn, R. A.; Brauer, M.; Apte, J. S.; Henze, D. K.; Zhang, L.; Zhang, Q.; Ford, B.; Pierce, J. R.; and Martin, R. V., 'Global estimates and long-term trends of fine particulate matter concentrations (1998–2018)', Environmental Science & Technology 2020 54 (13), 7879-7890, doi: 10.1021/acs.est.0c01764.
Map 20: Air pollution (Average Annual Concentration)
Air Pollution Levels (PM2.5 µg/m3)
Extremely High (≥IT-1, 35µg/m3)
Very High (≥IT-2, 25µg/m3)
High (≥IT-3, 15µg/m3)
Above WHO Guidelines (≥ 10g/m3)
Below WHO Guidelines (≤ 10µg/m3)

INTRODUCING THE CHILDREN’S CLIMATE RISK INDEX 50
Air pollution can cause morbidity, and is linked with asthma, bronchitis and other respiratory infections and diseases, which can be debilitating, force children to miss school, and even cause long-lasting damage to their health and well-being. Some studies have shown that air pollution might affect cognitive development, as inhaled ultrafine particles are so small that they can enter the bloodstream and eventually lead to oxidative stress and neuroinflammation in the brain. Pregnant mothers are particularly at risk – studies have shown an association between high levels of air pollution and foetal loss, pre-term delivery, lower birthweight and infertility.
Air pollution can have lifelong health implications for a child. Studies have shown that the lung capacity of children living in polluted environments can be reduced – similar to the effect of growing up in a home with secondhand cigarette smoke. Studies have also shown that adults who were exposed to chronic air pollution as children tend to have respiratory problems later in life.
Air pollution exceeds safe levels for nearly 2 billion children. It is exceedingly high for over 1 billion children, with a 15 per cent higher chance of death.
Bangladesh, 2020 © UNICEF/UN0400938/Haque
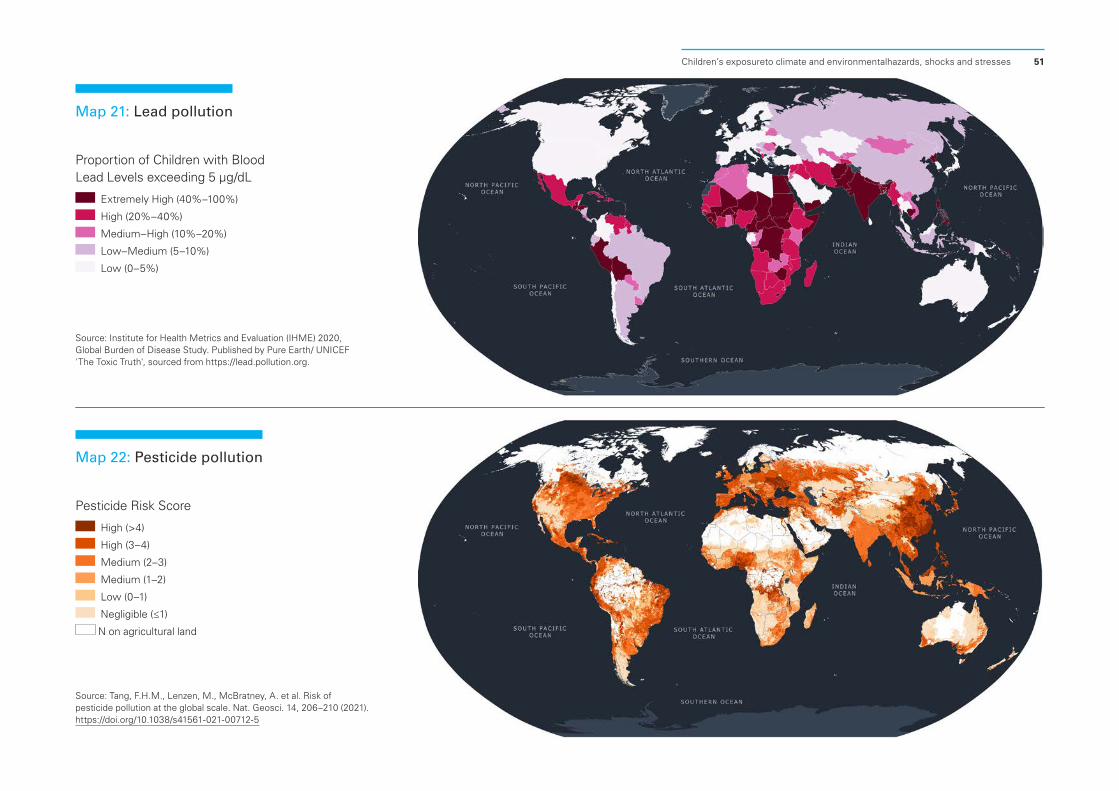
Children’s exposureto climate and environmentalhazards, shocks and stresses 51
Map 21: Lead pollution
Source: Institute for Health Metrics and Evaluation (IHME) 2020, Global Burden of Disease Study. Published by Pure Earth/ UNICEF 'The Toxic Truth', sourced from https://lead.pollution.org.
Proportion of Children with Blood Lead Levels exceeding 5 µg/dL
Extremely High (40%–100%)
High (20%–40%)
Medium–High (10%–20%)
Low–Medium (5–10%)
Low (0–5%)
Map 22: Pesticide pollution
Source: Tang, F.H.M., Lenzen, M., McBratney, A. et al. Risk of pesticide pollution at the global scale. Nat. Geosci. 14, 206–210 (2021). https://doi.org/10.1038/s41561-021-00712-5
Pesticide Risk Score
High (>4)
High (3–4)
Medium (2–3)
Medium (1–2)
Low (0–1)
Negligible (≤1)
N on agricultural land

INTRODUCING THE CHILDREN’S CLIMATE RISK INDEX 52
Soil and water pollution
Other toxic hazards include lead pollution, which is often found in soil and water. Around 1 in 3 children – up to approximately 815 million globally – have blood lead levels at or above 5 micrograms per decilitre (µg/dL). Lead is a potent neurotoxin that, with even low-level exposure, is associated with a reduction in IQ scores, shortened attention spans and potentially violent and even criminal behaviour later in life. Children under five are most vulnerable, due to the critical window of brain development. Studies show that exposure levels above 5µg/dL may result in a 3–5 point lower score on intelligence tests. These reductions in IQ undermine children’s future potential and diminish their prospects. The impact of lead is not limited to children. It is estimated that over 900,000 premature deaths per year can be attributed to lead exposure.
One of the most common routes of childhood exposure to lead pollution is through contamination in the soil, water and air from unsafe lead-acid battery recycling operations and open-air smelters, which are increasingly prevalent in many low- and middle-income countries. Exposure can also occur as a result of ingesting lead from peeling and cracking lead-based paint; eating food contaminated by lead due to lead-glazed pottery and lead in spices; drinking water from leaded pipes; and playing in lead-laced electronic waste dumps. Lead can also be found in some cosmetics, ayurvedic medicines, toys and other consumer products. Parents whose occupations involve working with lead often bring contaminated dust home on their clothes, hair, hands and shoes, thus inadvertently exposing their children to it.
Pollution from pesticides, which can often be found in soil and water, can affect children’s skin, eyes, nervous system, cardiovascular system, gastrointestinal tract, liver, kidneys, reproductive system, endocrine system, blood and immune system, and has been linked with cancer including childhood leukaemia. It can also cause developmental delays, and can impact brain and behaviour development. Ninety-nine per cent of the deaths linked to pesticides are in developing countries, although they use only 25 per cent of the world’s pesticides. Child exposure can be significantly reduced with the sound management of chemicals.
Exposure to pesticide pollution is exacerbated by many of the other climate and environmental hazards. During storms and floods, for example, there is the potential that pesticides can leach into previously uncontaminated areas. Conversely, pesticide pollution can reduce biodiversity and ecosystem functionality, which subsequently
reduces the capacity for resilience and restoration when there are droughts and storms. Pesticide use may increase in many areas as farmers need to adjust to new types of pests associated with changing temperatures and a reduction in biodiversity. Impacts can be worsened in areas that are water-stressed or rich in biodiversity; further straining natural boundaries.
Toxic chemicals and heavy metals are threatening children’s health and cognitive development, in addition to destroying ecosystems that are critical to a healthy environment.
Philippines, 2006 © UNICEF/UNI45432/Pirozzi

Children’s exposureto climate and environmentalhazards, shocks and stresses 53Children’s exposureto climate and environmentalhazards, shocks and stresses 53
A promising idea: Scaling-up proven early warning systems paired with evidence-based prevention
We now understand more about the projected long-term changes and trends that will result from climate change in the form of increasing global temperatures, sea-level rise, changes in precipitation, and overall an increase in the intensity and frequency of climate-and hydro-related disasters globally. Regional and national downscaling of impact scenarios and contingency / preparedness plans, along with evidence-based and financed climate change adaptation plans help governments and stakeholders have the big picture and calibrate development pathways to a changing climate. When it comes to climate and hydro-meteorological disasters, it is not a question of “if” but “when” (repeatedly), and decades of experience has proven the benefit of “no regrets” actions. Early warning systems have benefits that are at least 10 times their cost. A 24-hour notice of an impending storm or heatwave can reduce financial damages by 30 per cent and spending US$800 million on such systems might prevent losses of US$3–16 billion each year in developing nations.
Preparedness and early warning systems are part and parcel of a larger necessary agenda for climate risk management, and must also be paired with efforts and investments in risk prevention. Utilizing the same risk information and impact scenarios used for preparedness plans can also guide prevention efforts and identify gaps in technology and capacities needed.
Mozambique, 2021 © UNICEF/UN0403973/Franco

INTRODUCING THE CHILDREN’S CLIMATE RISK INDEX 54
The threat of overlapping hazards
Different regions face different combinations of hazard exposure factors. But it is where hazards overlap that is particularly worrying:
Globally,
• Over 99% of children are currently exposed to at least 1 of the above climate and environmental hazards, shocks and stresses.
• 2.2 billion children l are currently exposed to at least 2 of the above climate and environmental hazards, shocks and stresses.
• 1.7 billion children are currently exposed to at least 3 of the above climate and environmental hazards, shocks and stresses.
• 850 million children are currently exposed to at least 4 of the above climate and environmental hazards, shocks and stresses.
• 330 million children are currently exposed to at least 5 of the above climate and environmental hazards, shocks and stresses.
• 80 million children are currently exposed to at least 6 of the above climate and environmental hazards, shocks and stresses.
Why is exposure to overlapping hazards so worrying?
Because they can trigger, reinforce and magnify each other – with the outcomes being worse than the sum of their parts. For example, severe weather and cyclones, combined with sea level rise, can create storm surges. High levels of air pollution combined with drought and lack of precipitation can worsen air pollution, as rain can help clear the air and offer children temporary relief. Air pollution can also affect immune systems, increasing propensity to future disease – including ones that are climate and environmentally related. Moreover, flooding in areas of high exposure to lead toxicity can cause lead pollution in the ground or contaminated sites to leach into waterways and find its way to children. Furthermore, pesticide use can damage ecosystems, which reduces capacity for resilience and increases potential for water scarcity, air pollution, and even disease vectors.
Because they make it harder for children to recover and build resilience. Families hit by one crisis may be able to absorb the shock provided the crisis is not too severe. However, when families are hit by multiple shocks consecutively, their coping mechanisms and access to resources can be restricted. Institutional policies and assistance can become exhausted, too. Cumulative shocks also add complexities to situations, which make them much more dangerous. These complexities can strain the foundations of cultural traditions and lifestyles, which undermine capacities for resilience and recovery.
Because they exacerbate inequalities. Cumulative shocks can exacerbate inequalities. Poorer children who already face economic disadvantage are further impacted when climatic events increase overall risk. They are less able to access key resources – such as safe water and sanitation, food and health facilities – when crises occur. This pushes them further into poverty. Wealthier children, meanwhile, may have access to these resources even if crises negatively impact them. The end result is that gaps between the poor and the rich grow as the impacts of climate change become more frequent and severe.

Children’s exposureto climate and environmentalhazards, shocks and stresses 55Children’s exposureto climate and environmentalhazards, shocks and stresses 55
Africa
Water scarcity
Cyclones
Soil and waterpollution
Riverineflooding
Diseasevectors
Air pollution
HeatwavesCoastalflooding
Asia
Water scarcity
Cyclones
Soil and waterpollution
Riverineflooding
Diseasevectors
Air pollution
HeatwavesCoastalflooding
Europe
Water scarcity
Cyclones
Soil and waterpollution
Riverineflooding
Diseasevectors
Air pollution
HeatwavesCoastalflooding
Oceania
Water scarcity
Cyclones
Soil and waterpollution
Riverineflooding
Diseasevectors
Air pollution
HeatwavesCoastalflooding
Latin America and the Caribbean
Water scarcity
Cyclones
Soil and waterpollution
Riverineflooding
Diseasevectors
Air pollution
HeatwavesCoastalflooding
North America
Water scarcity
Cyclones
Soil and waterpollution
Riverineflooding
Diseasevectors
Air pollution
HeatwavesCoastalflooding
100%
80%
60%
40%
20%
0%
100%
80%
60%
40%
20%
0%
100%
80%
60%
40%
20%
0%
100%
80%
60%
40%
20%
0%
100%
80%
60%
40%
20%
0%
100%
80%
60%
40%
20%
0%
Figure 3: Climate and Environmental Hazards by Region

INTRODUCING THE CHILDREN’S CLIMATE RISK INDEX 56
Nicaragua, 2020 © UNICEF/UN0372370/Ocon/AFP-Services

Children’s vulnerability to climate and environmental hazards, shocks and stresses
All children face challenges associated with climate change and a degrading natural environment. Some children, however, are more vulnerable to the impacts of climate change than others – depending largely on the availability, quality, equity and sustainability of key and essential services for children, such as water and sanitation, health care, nutrition and education, among others. Similarly, some countries have mechanisms in place that help make children more resilient and able to address the negative effects of climate change.
A recent World Bank study found that up to 132 million people could be pushed into extreme poverty by 2030 as a result of climate change – 44 million due to its impact on health, 33.5 million due to the impact on food prices and 18.2 million due to the impact of disasters. It indicated that climate change impacts the number of people falling into extreme poverty through several mechanisms: climate change affects both agricultural incomes
and food prices, and so both farmers and consumers (particularly those who spend a high proportion of their incomes on food) are at greater risk of being pushed into poverty. Climate change also impacts climate-related diseases such as malaria, diarrhoea and child stunting to the point that even families with higher incomes cannot absorb the health-related shock – making a strong case for universal health care to better protect people from falling into extreme poverty.
The effects vary by region, too. In sub-Saharan Africa and South Asia, food prices are the dominant driver of people falling into extreme poverty as a result of climate change; in Latin America and East Asia, the dominant drivers are health considerations. This is in large part due to the higher effect of climate change on rising food prices in sub-Saharan Africa and South Asia, as well as the higher average proportion of a household’s monthly expenditures going towards food in those regions.
Key essential services for children will be paramount in the fight against climate change. This is especially true in the near term – millions of children will be impacted over the coming two decades; much of the warming we are experiencing now and in the near term is due to emissions that have already been emitted. Health and nutrition, water and sanitation, education and social protection are essential to reduce the impact of climate change and prevent millions of children and their families from slipping into extreme poverty by 2030.
3A lack of essential services increases child vulnerability to climate change.

INTRODUCING THE CHILDREN’S CLIMATE RISK INDEX 58
Inadequate water, sanitation and hygiene
Safe water, sanitation and hygiene (WASH), including potable water supplies, effective drainage systems and working latrines can mean all the difference in the ability to cope with the impacts of climate change. For example, communities with poor sewage and drainage systems are more likely to be affected by climate-induced flooding, with the contamination of local water sources far worse in these areas.
Moreover, children without access to adequate WASH provisions have a reduced capacity to respond to, and treat, climate-related diseases. Climate change will impact the spread not only
Map 23: WASH CCRI Component Score
Source: See CCRI Methodology for details. Drinking water service level and basic handwashing facilities data from: WHO/UNICEF Joint Monitoring Programme (JMP) for Water Supply, Sanitation and Hygiene.
A child who lacks access to safe water, sanitation and hygiene (WASH) services is more vulnerable to climate and environmental hazards, shocks and stresses.
Severity Very High
High
Medium
Low
Very Low
No data
of vector-borne diseases but also water-related ones which are among the biggest killers of children, such as diarrhoea. As evident from the COVID-19 pandemic, practice of effective sanitation and hygiene behaviours such as frequent hand-washing with soap are crucial to prevent disease transmission at the individual and wider community.
There are also important gender dimensions as a result of existing inequities in access to WASH that could make girls more vulnerable to climate and environmental hazards. For example, in Africa reduced school attendance can sometimes be associated with water fetching
duties, a burden which is mainly placed on women and girls. In Ethiopia, approximately 20 per cent of girls miss school to assist with water fetching, in comparison to just 5 per cent of boys. As climate change places increased strain on water resources, a young girl’s WASH responsibilities will only become more difficult to achieve.
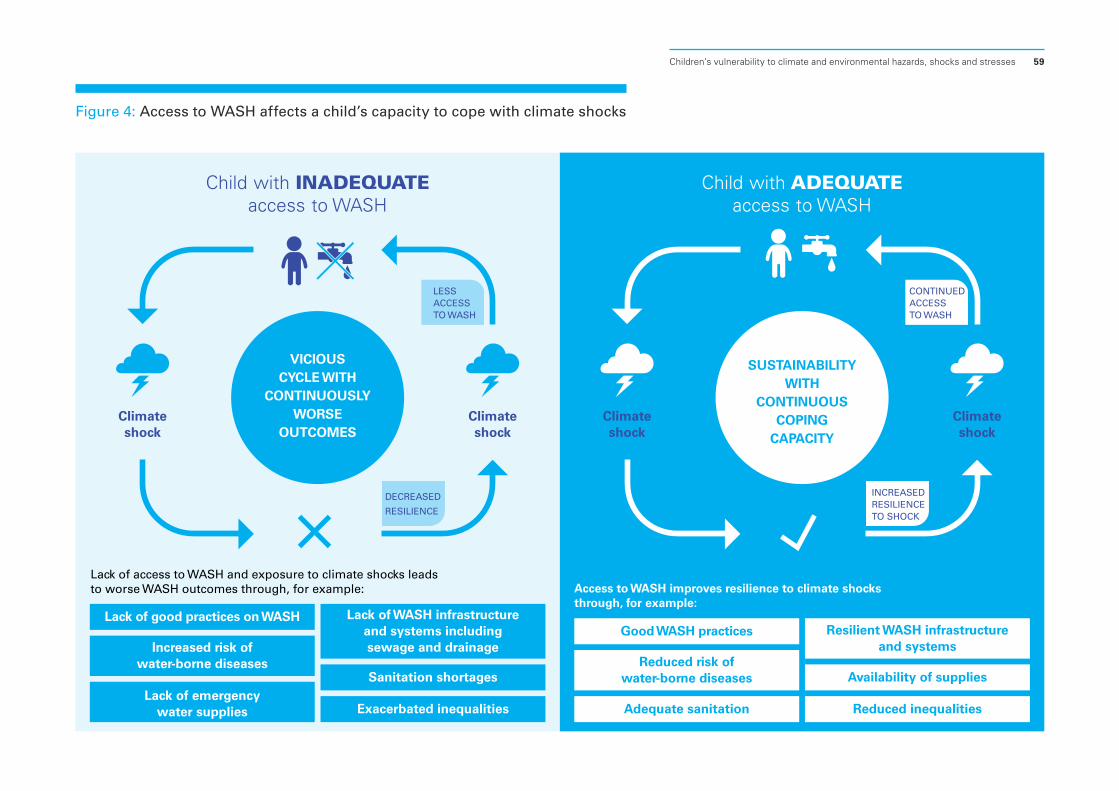
Children’s vulnerability to climate and environmental hazards, shocks and stresses 59
Figure 4: Access to WASH affects a child’s capacity to cope with climate shocks
Climateshock
Climateshock
Lack of access to WASH and exposure to climate shocks leads to worse WASH outcomes through, for example:
Lack of good practices on WASH
Increased risk ofwater-borne diseases
Lack of emergencywater supplies
Lack of WASH infrastructureand systems includingsewage and drainage
Sanitation shortages
Exacerbated inequalities
Climateshock
Climateshock
Access to WASH improves resilience to climate shocks through, for example:
Good WASH practices Resilient WASH infrastructureand systems
Reduced risk ofwater-borne diseases
Adequate sanitation
Availability of supplies
Reduced inequalities
VICIOUSCYCLE WITH
CONTINUOUSLYWORSE
OUTCOMES
SUSTAINABILITYWITH
CONTINUOUSCOPING
CAPACITY
Child with INADEQUATEaccess to WASH
Child with ADEQUATEaccess to WASH
CONTINUED ACCESS TO WASH
INCREASED RESILIENCE TO SHOCK
LESS ACCESS TO WASH
DECREASED
RESILIENCE

INTRODUCING THE CHILDREN’S CLIMATE RISK INDEX 60
In times of water scarcity, women and girls are forced to travel longer distances to fetch water, as seen in Central Africa where 90 per cent of Lake Chad has disappeared. This also exposes them to increased risks of gender-based violence. Moreover, up to 80 per cent of people displaced by climate change are female. Adequate WASH infrastructure and services can therefore help reduce WASH burdens on women and young girls, reducing inequities, which is essential as climate shocks intensify.
Similarly, a lack of WASH services for urban children increases susceptibility to climate hazards. In 2018, it was estimated that 300 million children were residing in urban slums, where there are huge disparities in WASH services, with the poorest urban children left behind, with little or no access to WASH services. Climate change is increasing migration from rural to urban areas; those with little resources are forced to live in the most vulnerable areas with the least services. Children in urban communities who lack WASH services will be the first to lose coping mechanisms for obtaining clean water for drinking and hygiene. They will be the first to be affected by overflowing sewage in city streets caused by flooding; they will have the least capacity to obtain necessary food and water when droughts hit; and they will be the first to suffer during extreme heatwaves, which tend to be even worse in urban centres – especially if they do not have access to water and sanitation to cool down and hydrate. The urgency to improve access to adequate WASH in urban spaces is therefore heightened in the context of climate change.
Increasing access to resilient WASH reduces the vulnerability to climate impacts. For example, improvements to community water safety and security planning in vulnerable communities in Fiji and Vanuatu have allowed these communities to recover more quickly from climatic shocks and changes. In Bangladesh, increasing access to resilient WASH facilities, while also making them climate-resilient through Managed Aquifer Recharge (MAR) technologies for safe water services, can reduce vulnerabilities to climate hazards and decrease the salinization
of community drinking water. When traditional water supplies are damaged due to climate hazards such as cyclones and floods, the MAR system supplies clean drinking water, thereby increasing the resilience of communities to climate change.
South Sudan, 2018 © UNICEF/UN0236844/Rich

Children’s vulnerability to climate and environmental hazards, shocks and stresses 61
Inadequate health and nutrition
Children require robust, resilient and inclusive health systems to thrive and survive. Areas of the world with weak health infrastructure, that already struggle to provide adequate health-care services, will experience even greater strains on resources with climate change.
Children with poor health status health are significantly more vulnerable to environmental change and stresses. For example, children with pre-existing health problems such as immunodeficiency disorders like HIV, are more vulnerable to infections and vector-borne diseases such as malaria and dengue, which are experiencing longer transmission
Map 24: Child Health and Nutrition CCRI Component Score
Sources: See CCRI Methodology for details. Child health, nutrition, and maternal health data from UN Inter-Agency Group for Child Mortality Estimation; UNICEF/WHO; UNICEF/WHO/World Bank Joint child malnutrition estimates (JME); UNICEF/WHO Low birthweight estimates; UNFPA/UNICEF/WHO/ World Bank/UN Population Division.
Severity
Very High
High
Medium
Low
Very Low
No data
A child who lacks adequate health and nutrition is more vulnerable to climate and environmental shocks and stresses.
seasons and a larger geographic range. This is a particular concern in sub-Saharan Africa, home to 88 per cent of children under the age of 15 living with HIV. In worst-case emission scenarios, climate models estimate that up to 48.2 million people could be at increased risk of seasonal malaria transmission and 62.1 million at an increased risk of endemic malaria transmission throughout Central, Eastern and Southern Africa by 2030.
Children with existing respiratory problems such as asthma, pneumonia and bronchitis, among others, are more likely to suffer as air pollution worsens with rapid urbanization and industrialization.
Two billion children live in areas where the air exceeds WHO guidelines – and 1 billion children live in areas where the air is extremely high, exceeding even the highest targets.
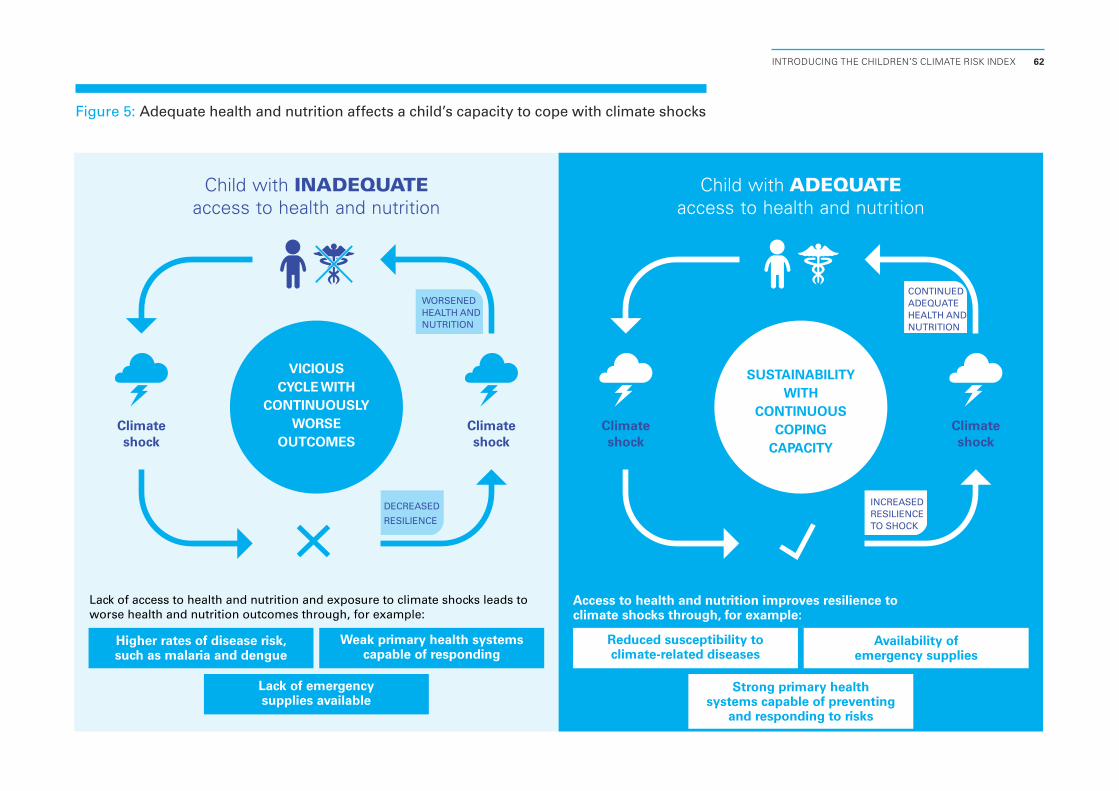
INTRODUCING THE CHILDREN’S CLIMATE RISK INDEX 62
Figure 5: Adequate health and nutrition affects a child’s capacity to cope with climate shocks
Higher rates of disease risk,such as malaria and dengue
Lack of emergencysupplies available
Weak primary health systemscapable of responding
Strong primary healthsystems capable of preventing
and responding to risks
Reduced susceptibility toclimate-related diseases
Availability ofemergency supplies
Lack of access to health and nutrition and exposure to climate shocks leads to worse health and nutrition outcomes through, for example:
Access to health and nutrition improves resilience to climate shocks through, for example:
Climateshock
Climateshock
Climateshock
Climateshock
VICIOUSCYCLE WITH
CONTINUOUSLYWORSE
OUTCOMES
SUSTAINABILITYWITH
CONTINUOUSCOPING
CAPACITY
CONTINUED ADEQUATEHEALTH AND NUTRITION
INCREASED RESILIENCE TO SHOCK
WORSENED HEALTH AND NUTRITION
DECREASED
RESILIENCE
Child with INADEQUATEaccess to health and nutrition
Child with ADEQUATEaccess to health and nutrition

Children’s vulnerability to climate and environmental hazards, shocks and stresses 63
Unvaccinated children will be at an increased risk of disease compared to vaccinated children as climate change occurs, demonstrating how inadequate health care can increase a child’s climate vulnerability. Every year, almost 20 million children are denied access to life-saving immunizations, with the poorest and most disadvantaged children, who are typically in most need of immunizations, being the least likely to receive them.
In addition, undernourished children will be hit harder by climate change, as environmental stressors place agricultural systems under increased pressure. Nearly 34 million more people, mostly in sub-Saharan Africa and South Asia, are expected to be pushed into extreme poverty as a result of increased food prices, in large part because a higher average proportion of a household’s monthly expenditures already goes towards food in those regions – the lack of capacity to withstand higher prices can result in falling into extreme poverty.
Children who lack adequate nutrition are more likely to face even more severe impacts as a result of climate impacts, such as stunting and wasting. Stunting is irreversible, and is caused by poor nutrition and/or repeated infections during the first 1,000 days of life It can have long-lasting effects throughout a child’s life.
Children who lack adequate health and nutrition will bear some of the greatest burdens of climate change, with existing health conditions, undernutrition, weak health-care infrastructure and poor maternal health as key indicators of a child’s
climate vulnerability. To give vulnerable children the best chance to thrive and survive the climate crisis, commitments to improve child health and nutrition are essential in all areas of the globe.
Madagascar, 2018 © UNICEF/UN0266999/Raoelison

INTRODUCING THE CHILDREN’S CLIMATE RISK INDEX 64
Inadequate education and learning
Children with lower levels of educational attainment are more vulnerable to environmental shocks and stresses – in fact, educational attainment levels are often a proxy for a wider range of vulnerabilities including where children live, resources to manage risks, among others. When confronted by climate shocks, educated children, families and communities are often more empowered and adaptive in their disaster preparedness, response and recovery. By contrast, in families with lower levels of education, children are more likely to be removed from school in order to work when disaster strikes.
Map 25: Education CCRI Component Score
Source: See CCRI Methodology for details. Out of school, youth literacy and education expenditure data from UNESCO
Severity Very High
High
Medium
Low
Very Low
No data
A child who lacks access to adequate education is more vulnerable to climate and environmental shocks and stresses.
The least educated children are also more likely to be displaced. Unfortunately, an overwhelming number of countries still have little or no disaster preparedness education in schools, making children especially vulnerable.
By contrast, educating and empowering children can also have transformative effects by expanding their adaptive capacity and reducing their vulnerability to climate change. It teaches children the skills necessary to manage risks whether they be climate, or economic or even conflict-related. It reduces children’s vulnerability
by improving prospects in the labor market when they are older, including access to a diversity of livelihood opportunities – reducing their dependence on single sectors, which could be hard-hit as a result of climate change.

Children’s vulnerability to climate and environmental hazards, shocks and stresses 65
Figure 6: Access to education affects a child’s capacity to cope with climate shocks
Reduced capacity torespond and adapt
Lack of access to criticalinformation on disaster
preparedness and school safety
Higher risk of othercompounding factors, suchas fragility or displacement
Being more empowered
Having a diversity of optionsfor future livelihoods
Higher capacity forinnovation and solutions
Having skills necessaryto respond and adapt
Lack of access to education and exposure to climate shocks leads to worse health and nutrition outcomes through, for example:
Access to education improves resilience to climate shocks through, for example:
Climateshock
Climateshock
Climateshock
Climateshock
VICIOUSCYCLE WITH
CONTINUOUSLYWORSE
OUTCOMES
SUSTAINABILITYWITH
CONTINUOUSCOPING
CAPACITY
CONTINUED ACCESS TO EDUCATION
INCREASED RESILIENCE TO SHOCK
LESS ACCESS TO EDUCATION
DECREASED
RESILIENCE
Child with INADEQUATEaccess to education
Child with ADEQUATEaccess to education

INTRODUCING THE CHILDREN’S CLIMATE RISK INDEX 66
Moreover, education that teaches children about climate and environmental hazards, as well as how to manage risks, further improves their adaptive capacity and empowers them as change agents in tackling climate change. Young people can play a key role in exercising their views and concerns, identifying and developing solutions and promoting environmentally sustainable living.
Mainstreaming environmental education into school curricula is essential to ensure children make informed choices about climate action and sustainability. According to research, if only 16 per cent of high school pupils in high- and middle-income nations received climate change education, carbon dioxide emissions would be reduced by approximately 19 gigatons by 2050. If all children received such education, it could be transformative: it would help develop a strong sense of agency and empowerment, impacting young people’s lifestyle choices and decision-making to reduce their carbon footprint, as well as improving their capacity to become pioneers in climate solutions. Teaching children the importance of protecting our ecosystems and planet today will ensure that they grow up into climate-conscious adults, who prioritize environmental sustainability, and contribute meaningfully towards, and benefit from, the growing green economy.
Congo, Democratic Republic of the, 2020 © UNICEF/UN0348871/Desjardins

Children’s vulnerability to climate and environmental hazards, shocks and stresses 67Children’s vulnerability to climate and environmental hazards, shocks and stresses 67
A promising idea: Feeding all children sustainably
In order to feed the world’s 2.3 billion children and ensure they have healthy diets and nutrition in a sustainable and climate-friendly way, a globally coordinated drive across public and private sectors for climate-friendly agriculture is needed, through the transfer of technology and practices to the communities that need them most. This would have the triple aim of: improving health and nutrition through food security; halting the climate and environmental impacts of agriculture; and reinvesting power in local communities.
Examples of specific actions include:
• Investing in climate-resilient technologies: Drought-resistant crops, water-saving irrigation, satellite mapping.
• Investing in sustainable agricultural practices: Stopping land clearances, soil restoration, protection of biodiversity, non-destructive fertilizers and pest control.
• Investing in healthy foods: High-nutrition crops (as opposed to just high-value crops) and variety over monoculture.
• Investing in community consultation and inclusion: ownership in the hands of farmers and communities, especially women.
There are other important dimensions to consider including school meals and education on healthy diets. But it is clear that the potential emissions reductions from more sustainable agriculture are immense.
Zimbabwe, 2020 © UNICEF/UNI296501/Prinsloo

INTRODUCING THE CHILDREN’S CLIMATE RISK INDEX 68
Poverty and lack of social protection
Across the world, around 1.2 billion children are multidimensionally poor, lacking access to necessities such as basic education, nutrition, health, housing and WASH. Further, children are twice as likely to live in extreme monetary poverty than adults, with an estimated 356 million children living in extreme poverty, being forced to survive on less than US$1.90 a day. And even in the richest countries, one in seven children live in poverty, with children twice as likely to become impoverished than adults.
Children in poverty are more vulnerable to environmental shocks and stresses, as they have the least resources and capacities to adapt. Recent research estimates that climate change on its own will force up to 132 million additional people into extreme poverty by 2030.
The poorest are particularly vulnerable for several reasons. They often:
• Depend on natural systems for livelihoods. Seventy per cent of the world’s poor are highly or directly dependent on natural resources for their livelihoods, such as through agriculture, hunting or fishing. Vulnerability is particularly high in rural areas without functioning markets. This dependence on agriculture makes them particularly vulnerable to environmental shocks and stresses. Additionally, those living in poverty commonly reside in ecologically fragile areas, where natural resources are depleting most rapidly, therefore intensifying their vulnerability.
• Have limited diversity and flexibility of livelihood options. Low economic diversification increases vulnerability, especially if there are no alternatives to rely on when shocks occur. For example, in Asia where the rural poor are often dependent on farming and agriculture, between 2008–2018 floods and storms have caused crop and livestock losses of US $11 billion and US $10 billion respectively. Those with greater opportunities to diversify their incomes such as wealthy people with better access to credit and financial services and that have more flexibility to apply those resources, such as through insurance, are better able to recover after floods and storms. Those who depended solely on farming suffer the greatest losses. In poorer areas, where economic diversification is low, opportunities to adapt to alternative livelihoods in response to climate change are therefore limited, potentially pushing people further into poverty.
• Lack assets and infrastructure critical to resilience. The same climate shock or hazard affects places and people differently. While wealthier people may lose more from climate related hazards such as floods, in absolute terms, poorer people tend to lose more in relative terms, as a result of the many vulnerabilities they are exposed to, including asset poverty and weak infrastructure. Poorer children in families who have fewer assets and less income from their own resources are less likely to be resilient to climate change and recover from shocks quickly. Adequate infrastructure can also make the difference between life and death in a disaster situation. Robust school buildings can save children’s lives
during earthquakes and minimize disruption to education, resilient transport infrastructure can enable people to flee from the danger of oncoming hurricanes or floods and adequate WASH infrastructure reduces the spread of waterborne diseases.
• Are forced to sell assets critical to their future resilience and recovery. In times of crisis, poor people are often forced to sell their livelihood assets such as land, livestock and farming tools in order to access basic services or resources such as food or shelter. These assets provide families with a safety net to fall back on during times of crisis and are critical to their resilience and recovery to future climate hazards. Possessing few or no assets severely reduces an individual’s ability to recover quickly from environmental shocks and stresses. Poorer people will also find it harder to replace these assets in the long term due to low income and socioeconomic resilience.
A child who is poor and lacks access to social protection is more vulnerable to climate and environmental shocks and stresses.

Children’s vulnerability to climate and environmental hazards, shocks and stresses 69
Social protection and financial inclusion are key to reducing vulnerability to climate change
Map 26: Poverty, Assets and Social Protection CCRI Component Score
Source: See CCRI Methodology for details. Poverty and inequaility, communication assets, social protection and economic empowerment data from: World Bank Global Poverty Working Group; World Bank Development Research Group; ITU, ICT, ILO, World Bank ASPIRE, World Bank Findex database
Severity
Very High
High
Medium
Low
Very Low
No data
A lack of social protection – policies and programmes to prevent or protect people against, poverty vulnerability and social exclusion – makes children more vulnerable to climate change. Examples of social protection include cash transfers and child grants, school meals, assistance connecting families to services such as health care, and nutritious food and education for their children. Two out of three children globally are not covered by any form of social protection, leaving them susceptible to economic hardship and social exclusion, which will only intensify with climate change.
Cash transfers help vulnerable children in several ways, including reducing monetary poverty, increasing the amount that can be spent on food, helping families pay school fees and strengthening the quality of homes following destruction or displacement. For example, in Ghana the Livelihood Empowerment against Poverty (LEAP) programme offers cash transfers to extremely poor households with vulnerable children. Households receive approximately US$7.50–14 (24–25 Ghanian cedi (GHS)) a month to help alleviate poverty and build sustainable livelihoods. Cash transfer programmes like LEAP are a successful way to help get children out of poverty, in turn reducing their vulnerability to
climate change, as they are provided with increased economic assets and capacities to adapt.
In emergencies, social protection is crucial to ensure that children and their families have access to the necessary resources to meet their needs and cope with environmental stresses without resorting to negative coping strategies which can have devastating medium and long term impacts. This requires social protection systems to be ready to respond to crisis, including through mechanisms which can identify potential shocks, operational systems that can react quickly, and contingency funding approaches that can allow for rapid scale up.

INTRODUCING THE CHILDREN’S CLIMATE RISK INDEX 70
Figure 7: Access to social protection affects a child’s capacity to cope with climate shocks
Lack of assets and infrastructurecritical to resilience
Limited diversity and flexibilityof livelihood options
Forced to sell assets critical tofuture resilience and recovery
Financial exclusionPoor access to social protectionpolicies or programmes
High dependenceon natural systems
Does not have to sellassets critical to resilience
Financial inclusion
Access to social protectionpolicies or programmes
Access to assetsand infrastructure
critical to resilience
Flexible and diverselivelihood options
Poverty and lack of access to social protection, combined with exposureto climate shocks, leads to worse outcomes due to, for example:
Reduced povertyand access to social protection improves resilience to climate shocks through, for example:
Climateshock
Climateshock
Climateshock
Climateshock
VICIOUSCYCLE WITH
CONTINUOUSLYWORSE
OUTCOMES
SUSTAINABILITYWITH
CONTINUOUSCOPING
CAPACITY
CONTINUED ACCESS TO SOCIAL PROTECTION
INCREASED RESILIENCE TO SHOCK
LESS ACCESS TO SOCIAL PROTECTION
DECREASED
RESILIENCE
Child with INADEQUATEaccess to social protection
Child with ADEQUATEaccess to social protection

Children’s vulnerability to climate and environmental hazards, shocks and stresses 71
Exposures exacerbate vulnerabilities, vulnerabilities exacerbate exposures
Unfortunately, not only does children’s lack of access to these key essential services (such as water, sanitation and hygiene, health, education and social protection) increase their vulnerability to climate change, but climate change is likely to make it more difficult for children to obtain access to those key essential services. Thus, a vicious cycle is created, pushing the most vulnerable children further into poverty at the same time as increasing their risk of experiencing the worst effects of climate change. Moreover, vulnerabilities and exposures also interact with each other, potentially magnifying the effects. This vicious cycle is further exacerbated by a lack of recognition of children’s voice and agency which undermines any capacity that children do have to try to respond and adapt.
Figure 8: Children caught in a vicious cycle of increasing exposures and vulnerabilities face an increase in their overall level of risk
Lack of WASH
Lack of health and nutrition
Conflict, fragility and
lack of governance
Lack of education
Poverty and lackof social protection
Cyclones
River flooding Coastal floodingWater scarcity
Diseases Air, soil and water pollution
Increasing vulnerabilityto climate shocks
Increasing exposureto climate shocks
Child
poor
est ch
ildren further into poverty
disp
arities in inequalities, pushing the
Th
e combined effect is likely to exacerbate

INTRODUCING THE CHILDREN’S CLIMATE RISK INDEX 72
Bangladesh, 2020 © UNICEF/UNI351915/Chakma
A Promising idea: Providing a climate safety net for all children
Climate change will increase the frequency and severity of shocks. These shocks will have an income-reducing effect, which will be particularly acute for the most vulnerable and poor families. However, in order to create climate-responsive social protection systems, we can expand, adapt and build on what already exists. We can create social protection systems so that they became not only stronger and reach more people, but are also more agile and responsive to climate shocks. We can tailor system responsiveness to take into account known climate hazards and vulnerabilities in their planning, analysis and related operations. We can identify new highly vulnerable groups, by assessing populations through the lens of exposure to climate and environmental hazards and shocks. Providing a social protection floor that not only helps prevent the poorest and most vulnerable children from slipping further into poverty, but also builds resilience, could transform their productive potential and management of the increasing frequency and severity of crises due to climate change.

The Children’s Climate Risk Index 4
PILLAR 2: Child vulnerabilityPILLAR 1: Exposure to climate andenvironmental shocks and stresses
Water scarcity
Riverine floods
Coastal floods
Tropical cyclones
Vector borne diseases
Heatwaves
Air pollution
Soil and water pollution
Child health and nutrition
Education
Water, sanitation andhygiene (WASH)
Poverty, communication assetsand social protection
Children’s Climate Risk Index (CCRI)This report presents new analyses and perspective on children’s exposure and vulnerability to climate change hazards, captured in the creation of the Children’s Climate Risk Index (CCRI). The CCRI is structured according to two central pillars:
Pillar 1) Exposure to climate and environmental hazards, shocks and stresses
Pillar 2) Child vulnerability
Across the two categories, the CCRI brings 57 variables together to measure risk across 163 countries. The combination of hazard, exposure and vulnerability aligns with the IPCC (2014) working definition of risk.8
Figure 9: CCRI conceptual model: Pillars and components

INTRODUCING THE CHILDREN’S CLIMATE RISK INDEX 74
Source: The CCRI is composed of many indicators across climate and environmental hazards, shocks and stresses, as well as child vulnerability, see Chapter 6: Methodology
Map 27: Global map of the Children’s Climate Risk Index
Severity
Very High
High
Medium
Low
Very Low
No data

The children’s climate risk index 75
The CCRI model is a composite index that helps to explain and measure the likelihood of climate and environmental shocks or stresses leading to the erosion of development progress, the deepening of deprivation and/or humanitarian situations affecting children or vulnerable households and groups. The CCRI index seeks to: a) Identify which countries or areas are at risk of deepening child deprivations and humanitarian situations affecting children as a result of their exposure to climate and environmental shocks or stresses; and b) Understand the underlying factors that could contribute to these risks.
It is important to note that these are just current risks, and that projections might alter risk factors – either positively or negatively. For example, droughts might become less severe if the area experiences more precipitation as a result of climate change; and floods might become less severe if there is less precipitation as a result of climate change. In addition, other changes such as economic growth or demographic change could affect future impacts both positively and negatively.
It is also important to note that this Index does not include Small Island States that have a land area less than 20,000sq/km, due to data availability limitations. Many Small Island States face serious and existential threats due to climate change that are not adequately reflected in the data, and not captured appropriately in a multi-hazard index. As such, they have been not been considered in this edition, however future versions of the Index will aim to address the data requirements for these contexts.
Figure 10: Overlapping geographical information systems
PILLAR 1 Exposure to climate and environmental hazards, shocks and stresses (Map 28)
PILLAR 2 Child vulnerability (Map 29)
CHILDREN’S CLIMATE RISK INDEX (CCRI)(Map 27)

INTRODUCING THE CHILDREN’S CLIMATE RISK INDEX 76
Source: See Chapter 6: Methodology
Map 28: Regions where climate and environmental shocks and stresses are predominant (Pillar 1 of the CCRI)
Severity Extremely High
High
Medium
Low
Very Low
No data

The children’s climate risk index 77
Source: See Chapter 6: Methodology
Map 29: Regions where child vulnerability is predominant (Pillar 2 of the CCRI)
Severity
Extremely High
High
Medium
Low
Very Low
No data

INTRODUCING THE CHILDREN’S CLIMATE RISK INDEX 78
What is new about the CCRI?
While indices of climate and environmental risks are not new, the CCRI incorporates more child-specific dimensions of vulnerability, including child health, education, nutrition, access to WASH, and social protection, and places at its core the evidence that resilient social services are key to protecting children from climate and environmental impacts. Moreover, the CCRI uses improved, higher-resolution climate and environmental hazard data that measure more localized effects due to enhanced GIS exposure methods, which allow indicators to be measured every square kilometre rather than at district or national boundaries. Finally, the CCRI is not restricted to climate hazards, but takes a holistic look at the broader environmental issues that children face – such as air pollution or exposure to other toxic stresses. This is important because broader environmental hazards often also have much more tangible and direct effects on children, increasing the set of factors that can have compounding effects on children’s vulnerability, and thus overall risk from climate change.
Fiji, 2021 © UNICEF/UN0396379/Stephen/Infinity Images

The children’s climate risk index 79
CCRI RANK COUNTRY
CLIMATE AND ENVIRONMENTAL
FACTORS
CHILD VULNERABILITY
CHILDREN’S CLIMATE RISK
INDEX
1 Central African Republic 6.7 9.8 8.7
2 Chad 7.0 9.4 8.5
2 Nigeria 8.8 8.1 8.5
4 Guinea 7.7 8.9 8.4
4 Guinea-Bissau 6.4 9.5 8.4
4 Somalia 7.0 9.3 8.4
7 Niger 7.3 8.9 8.2
7 South Sudan 6.8 9.2 8.2
9 Democratic Republic of the Congo 7.2 8.6 8.0
10 Angola 6.5 8.9 7.9
10 Cameroon 7.8 7.9 7.9
10 Madagascar 7.8 7.9 7.9
10 Mozambique 7.5 8.2 7.9
14 Pakistan 8.7 6.4 7.7
15 Afghanistan 7.3 7.9 7.6
15 Bangladesh 9.1 5.1 7.6
15 Benin 7.1 8.1 7.6
15 Burkina Faso 7.3 7.8 7.6
15 Ethiopia 7.1 8.1 7.6
15 Sudan 6.9 8.2 7.6
15 Togo 7.8 7.3 7.6
CCRI RANK COUNTRY
CLIMATE AND ENVIRONMENTAL
FACTORS
CHILD VULNERABILITY
CHILDREN’S CLIMATE RISK
INDEX
22 Côte d’Ivoire 7.2 7.7 7.5
22 Equatorial Guinea 5.1 8.9 7.5
22 Liberia 6.8 8.1 7.5
22 Senegal 7.9 7.1 7.5
26 India 9.0 4.6 7.4
26 Sierra Leone 6.9 7.9 7.4
26 Yemen 7.0 7.8 7.4
29 Haiti 6.7 7.8 7.3
29 Mali 7.0 7.5 7.3
31 Eritrea 5.5 8.3 7.1
31 Myanmar 8.3 5.4 7.1
31 Philippines 8.9 4.0 7.1
34 Papua New Guinea 5.1 8.3 7.0
35Democratic People’s Republic of Korea
8.2 5.0 6.9
35 Ghana 8.2 5.0 6.9
37 Gambia 6.5 7.1 6.8
37 Uganda 6.3 7.3 6.8
37 Viet Nam 8.8 3.0 6.8
40 China 9.0 2.0 6.7
40 Lao People’s Democratic Republic 7.5 5.8 6.7
40 Malawi 5.7 7.5 6.7
40 Mauritania 6.1 7.2 6.7
40 United Republic of Tanzania 6.2 7.2 6.7
45 Zambia 5.3 7.6 6.6
46 Cambodia 7.2 5.6 6.5
46 Indonesia 8.1 4.2 6.5
48 Congo 6.0 6.8 6.4
49 Kenya 6.2 6.4 6.3
50 Thailand 8.4 2.3 6.2
51 Burundi 4.3 7.4 6.1
51 Nepal 7.5 4.2 6.1
Countries where children are most at risk
Table 1:
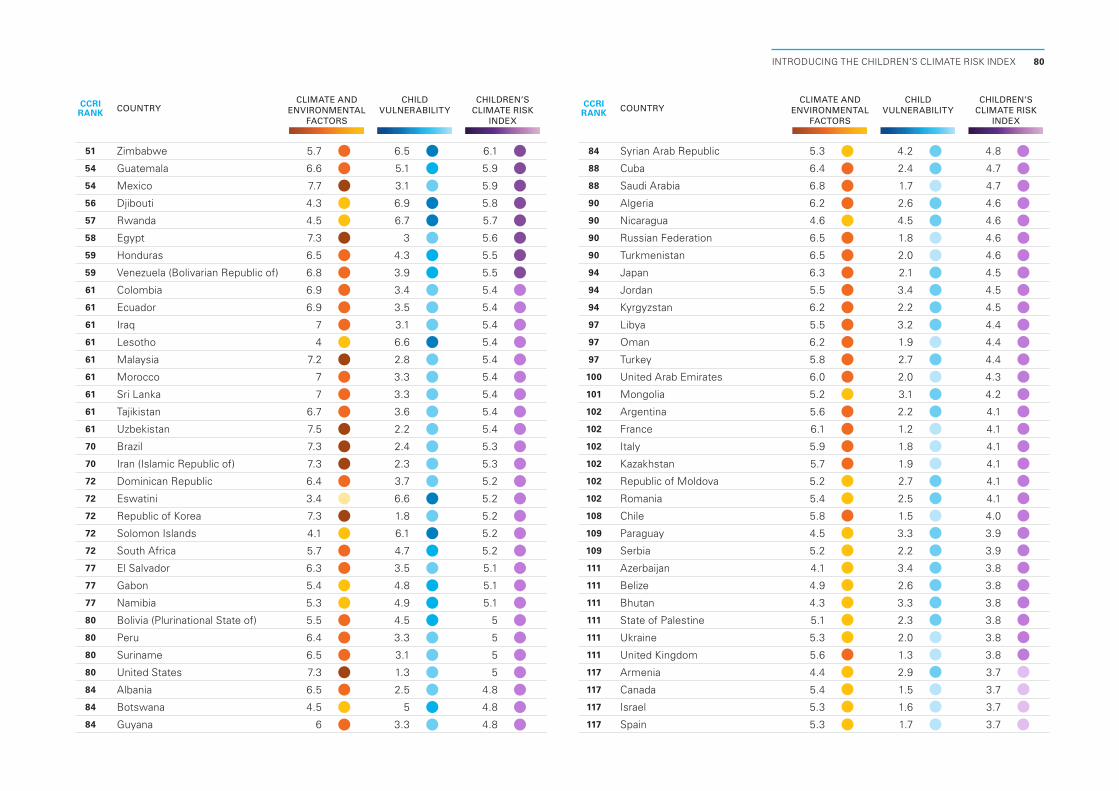
INTRODUCING THE CHILDREN’S CLIMATE RISK INDEX 80
CCRI RANK COUNTRY
CLIMATE AND ENVIRONMENTAL
FACTORS
CHILD VULNERABILITY
CHILDREN’S CLIMATE RISK
INDEX
51 Zimbabwe 5.7 6.5 6.1
54 Guatemala 6.6 5.1 5.9
54 Mexico 7.7 3.1 5.9
56 Djibouti 4.3 6.9 5.8
57 Rwanda 4.5 6.7 5.7
58 Egypt 7.3 3 5.6
59 Honduras 6.5 4.3 5.5
59 Venezuela (Bolivarian Republic of) 6.8 3.9 5.5
61 Colombia 6.9 3.4 5.4
61 Ecuador 6.9 3.5 5.4
61 Iraq 7 3.1 5.4
61 Lesotho 4 6.6 5.4
61 Malaysia 7.2 2.8 5.4
61 Morocco 7 3.3 5.4
61 Sri Lanka 7 3.3 5.4
61 Tajikistan 6.7 3.6 5.4
61 Uzbekistan 7.5 2.2 5.4
70 Brazil 7.3 2.4 5.3
70 Iran (Islamic Republic of) 7.3 2.3 5.3
72 Dominican Republic 6.4 3.7 5.2
72 Eswatini 3.4 6.6 5.2
72 Republic of Korea 7.3 1.8 5.2
72 Solomon Islands 4.1 6.1 5.2
72 South Africa 5.7 4.7 5.2
77 El Salvador 6.3 3.5 5.1
77 Gabon 5.4 4.8 5.1
77 Namibia 5.3 4.9 5.1
80 Bolivia (Plurinational State of) 5.5 4.5 5
80 Peru 6.4 3.3 5
80 Suriname 6.5 3.1 5
80 United States 7.3 1.3 5
84 Albania 6.5 2.5 4.8
84 Botswana 4.5 5 4.8
84 Guyana 6 3.3 4.8
CCRI RANK COUNTRY
CLIMATE AND ENVIRONMENTAL
FACTORS
CHILD VULNERABILITY
CHILDREN’S CLIMATE RISK
INDEX
84 Syrian Arab Republic 5.3 4.2 4.8
88 Cuba 6.4 2.4 4.7
88 Saudi Arabia 6.8 1.7 4.7
90 Algeria 6.2 2.6 4.6
90 Nicaragua 4.6 4.5 4.6
90 Russian Federation 6.5 1.8 4.6
90 Turkmenistan 6.5 2.0 4.6
94 Japan 6.3 2.1 4.5
94 Jordan 5.5 3.4 4.5
94 Kyrgyzstan 6.2 2.2 4.5
97 Libya 5.5 3.2 4.4
97 Oman 6.2 1.9 4.4
97 Turkey 5.8 2.7 4.4
100 United Arab Emirates 6.0 2.0 4.3
101 Mongolia 5.2 3.1 4.2
102 Argentina 5.6 2.2 4.1
102 France 6.1 1.2 4.1
102 Italy 5.9 1.8 4.1
102 Kazakhstan 5.7 1.9 4.1
102 Republic of Moldova 5.2 2.7 4.1
102 Romania 5.4 2.5 4.1
108 Chile 5.8 1.5 4.0
109 Paraguay 4.5 3.3 3.9
109 Serbia 5.2 2.2 3.9
111 Azerbaijan 4.1 3.4 3.8
111 Belize 4.9 2.6 3.8
111 Bhutan 4.3 3.3 3.8
111 State of Palestine 5.1 2.3 3.8
111 Ukraine 5.3 2.0 3.8
111 United Kingdom 5.6 1.3 3.8
117 Armenia 4.4 2.9 3.7
117 Canada 5.4 1.5 3.7
117 Israel 5.3 1.6 3.7
117 Spain 5.3 1.7 3.7

The children’s climate risk index 81
CCRI RANK COUNTRY
CLIMATE AND ENVIRONMENTAL
FACTORS
CHILD VULNERABILITY
CHILDREN’S CLIMATE RISK
INDEX
121 Australia 5.4 1.2 3.6
121 Bulgaria 4.1 3.0 3.6
121 Lebanon 4.4 2.7 3.6
121 Panama 3.7 3.4 3.6
121 Tunisia 4.5 2.5 3.6
126 Poland 5.0 1.7 3.5
127 North Macedonia 4.6 2.0 3.4
128 Greece 4.7 1.7 3.3
128 Kuwait 4.6 1.8 3.3
130 Belarus 4.7 1.3 3.2
130 Croatia 4.0 2.4 3.2
130 Hungary 4.4 1.8 3.2
133 Bahrain 3.9 2.3 3.1
133 Qatar 4.1 1.9 3.1
135 Bosnia and Herzegovina 3.8 2.2 3.0
135 Portugal 4.4 1.4 3.0
135 Uruguay 4.0 1.9 3.0
138 Costa Rica 3.5 2.2 2.9
138 Slovakia 3.7 2.0 2.9
140 Montenegro 3.4 1.9 2.7
140 Netherlands 4.1 1.0 2.7
142 Georgia 2.8 2.3 2.6
142 Germany 3.9 1.1 2.6
142 Latvia 3.3 1.9 2.6
145 Belgium 3.8 0.9 2.5
145 Cyprus 3.5 1.4 2.5
147 Brunei Darussalam 2.9 1.8 2.4
147 Czechia 3.2 1.6 2.4
147 Denmark 3.6 0.9 2.4
147 Lithuania 2.6 2.1 2.4
147 Switzerland 3.3 1.3 2.4
152 Slovenia 3.0 1.5 2.3
153 Liechtenstein 3.3 1.0 2.2
154 Austria 2.6 1.5 2.1
CCRI RANK COUNTRY
CLIMATE AND ENVIRONMENTAL
FACTORS
CHILD VULNERABILITY
CHILDREN’S CLIMATE RISK
INDEX
154 Ireland 2.3 1.8 2.1
154 Malta 2.9 1.2 2.1
154 Norway 3.3 0.8 2.1
158 Sweden 2.8 0.7 1.8
159 Estonia 2.1 1.2 1.7
159 Finland 2.6 0.7 1.7
161 New Zealand 2.4 0.8 1.6
162 Luxembourg 1.1 1.8 1.5
163 Iceland 1.0 0.9 1.0

INTRODUCING THE CHILDREN’S CLIMATE RISK INDEX 82
Benin, 2010 © UNICEF/UNI96737/Asselin
A Call for more and better data
There are a number of limitations to the CCRI. For example, there are a variety of climate and environmental hazards, shocks and stresses not captured in Pillar 1. These include other types of soil and water pollution, beyond lead and pesticide pollution; the full breadth of severe weather (beyond cyclones) that are likely to be experienced as a result of climate change; and the full impacts of sea level rise, which will be considerable and override many other factors. Moreover, this report presents where hazards overlap, but understanding the full impact of overlapping hazards requires more analysis.
There are also limitations to Pillar 2. A major limitation is the lack of subnational data for child vulnerabilities. With sub-national data, we could examine where specific climate and environmental hazards interact with child vulnerabilities. Another limitation is forward-looking analysis. The CCRI only examines the current and near term exposure of children to climate and environmental hazards, shocks and stresses as well as current child vulnerabilities – however how climate and environmental degradation and child vulnerabilities will change, and where they will change, over the coming decades is uncertain. And finally, availability of up-to-date national level data with sufficient country coverage has been a challenge too for the construction of the index (particularly for small island states and countries with humanitarian situations).
This is as much an attempt to present a unique and hopefully improved perspective on children’s climate and environmental risk, as it is a call for more and better data. Only with more and better data and evidence will we be able to truly understand the risks facing children, and respond to their needs accordingly.

Chad, 2021 © UNICEF/UN0469102/Dejongh

Responding to the risks
Responding to the risk factors identified in the CCRI can be done in various ways, including addressing the hazard exposure dimensions in Pillar 1; addressing the child vulnerability dimensions in Pillar 2; or broader instruments to increase environmental sustainability, reduce emissions, engage children and young people and solutions, and implement disaster risk reduction programmes and mechanisms that cut across both Pillar 1 and Pillar 2.
This chapter introduces modelling scenarios that estimate the number of children that might experience a considerable reduction in risk as a result of investments in reducing their exposure and vulnerability. It then takes a deeper look at the range of sustainability and disaster risk reduction mechanisms that are reported as a part of the SDGs, and how countries look according to their ranking on the CCRI.
Building resilience and reducing exposure: Sensitivity testing by modelling changes in risk
The following modelled scenarios estimate the number of children that would experience a considerable reduction in risk if countries invest in reducing their exposure to climate and environmental hazards, as well as reducing child vulnerability by improving access to key services.
Investments that reduced exposure or vulnerability are modelled as a 50 per cent improvement in the component score. ‘Considerable’ is defined as at least a 0.5 point drop in Children’s Climate Risk Index at a
national level. There are many ways to achieve the objectives of reducing hazard exposure and vulnerability, and the solutions, as well as their costs and challenges, will vary according to issue, sector and context.
The only long-term solution to climate change is reducing greenhouse gas emissions. However, there are also many actions to reduce exposure and vulnerabilities that can help save millions of children’s lives. Here are some examples:
5

Responding to the risks 85
Investments that reduce exposure to water scarcity can considerably reduce overall climate risk for 120 million children.*
Reducing children’s exposure to water scarcity could include, for example, avoiding water scarcity crises through water resource assessments, sustainable water withdrawal, efficient use, and early warning and action to prevent situations where there is a depletion of water supplies. Ensuring children’s access to water services
goes beyond addressing water scarcity. For every child to have access to water that is safe, reliable and affordable, and is resilient to threats from increasing water scarcity, climate shocks and extreme events, there must be water security. To ensure Water Security for All, a holistic approach is required. Such an approach requires interventions in four areas simultaneously: 1. Providing safe and affordable drinking water services; 2. Ensuring WASH services and communities are climate-resilient; 3. Water scarcity crises are prevented
through early action (including early warning systems and water resource management); and 4. Water cooperation for peace and stability.
Investments that reduce exposure to coastal flooding can considerably reduce overall climate risk for 525 million children.*
Reducing exposure to coastal flooding could include, for example, expanding mangroves, investing in solutions such as improving infrastructure along low-lying coastal areas, preserving freshwater supplies and reducing salinization.
Investments that reduce exposure heatwaves can considerably reduce overall climate risk for 160 million children.*
Reducing exposure to heatwaves could include installing shaded areas in places where children live, play and learn. This can also include nature-based solutions such as tree-planting. Green spaces in urban areas have been shown to reduce average temperatures. Reducing exposure to heatwaves may also require greater access to air conditioning and fans for cooling, as well as access to water for drinking and bathing in order to better regulate body temperature.
Fiji, 2020 © UNICEF/UN0400158/Stephen/Infinity Images
* 'Investments' are modeled as improving component score by 50%. 'Considerably' defined as at least a 0.5 point drop in Children's Climate Risk Index

INTRODUCING THE CHILDREN’S CLIMATE RISK INDEX 86
Investments that reduce exposure cyclones can considerably reduce overall climate risk for 30 million children.*
While it is not possible to prevent cyclones directly, protective measures can be put in place to reduce a child’s vulnerability. Reducing exposure to cyclones could include, for example, investing in effective cyclone warning systems and comprehensive disaster management strategies. Children also must be educated on disaster preparedness, so they know how to respond when a cyclone hits or is expected. Improvements to infrastructure to ensure essential buildings such as hospitals and schools are as cyclone resilient
as possible can also reduce children’s risks, preventing building collapse and damage so that children can seek medical care and their education is not disrupted in the long term.
Investments that reduce exposure to riverine flooding can considerably reduce overall climate risk for 85 million children.*
Reducing exposure to riverine flooding could include, for example, investing in solutions such as improving infrastructure and resilience of services that children need most. This could include nature-based solutions, such as restoration and preservation of wetlands, marshes
and rain gardens, which help to control run-off in high precipitation events, and improved spatial planning and water resource management at community and subnational levels. Improved disaster risk reduction training and guidance for communities on how to manage and protect themselves from riverine flooding would also reduce risk, as would ensuring that schools and clinics are in areas that can serve affected communities, but are also resilient to exposure of riverine flooding.
Investments that reduce exposure to climate-related disease vectors can considerably reduce overall climate risk for 10 million children.*
Reducing exposure to climate-related diseases, such as malaria and dengue, could include, for example, vector control, which focuses on blocking transmission of parasites from humans to mosquitos and then back to humans, for example by reducing risk factors such as stagnant water (mosquito breeding grounds), as well as the use of insecticide-treated mosquito nets. It could also include improved case management, which involves prompt diagnosis and treatment with appropriate antimalarial medicines. As disease vectors are likely to change and spread as a result of climate change, it ultimately means reducing emissions to prevent the worst impacts.
South Sudan, 2020 © UNICEF/UNI374959/Ryeng
* 'Investments' are modeled as improving component score by 50%. 'Considerably' defined as at least a 0.5 point drop in Children's Climate Risk Index

Responding to the risks 87
Investments that reduce exposure to air pollution can considerably reduce overall climate risk for 120 million children.*
Clean air solutions could include reducing the causes of air pollution from transport, power and national and transboundary sources, and transitioning rapidly towards sustainable energy sources. Within communities, better management of community resources, including safe waste disposal, transitioning from the use of solid fuels for cooking, better public transportation options, and advice on reducing pollution, is needed. Minimizing exposure can include providing better ventilation, as well as insulation, depending on the source of pollutants in homes. It can include advice on how to protect oneself and one’s family from air pollution. Reducing exposure can include better urban planning and ensuring that polluting sources are not built very close to schools and playgrounds. It could also include improving monitoring of air pollution and raising awareness of its harmful effects; greater awareness would encourage citizens to take action and advocate for change. The more that is known about air pollution, the more appropriate interventions can be put in place to protect children from its negative effects.
Investments that reduce exposure to soil and water pollution can considerably reduce overall climate risk for 55 million children.*
Reducing soil and water pollution requires a range of actions across different pollutants. Here, we have examined lead and pesticides, due to their particularly harsh impact on children. Addressing soil and water pollution will require improving
capacity for monitoring and reporting, including strengthening the role of the health sector in the prevention and diagnosis of childhood exposure. It will require improved management, treatment and remediation of toxic sites containing lead and pesticides – including improving standards for manufacturing and recycling of lead. It will require public awareness and behviour change, so that parents as well as children are made aware of toxic sites, and how to prevent exposure. It will
also require legislation and policy to reduce the risk of exposure in the first place – including enforcing regulations on chemical management. For lead, this includes implementing and enforcing environmental, health and safety standards for manufacturing and recycling of lead-acid batteries, e-waste and other substances that contain lead.
Fiji, 2016 © UNICEF/UN012959/Sokhin
* 'Investments' are modeled as improving component score by 50%. 'Considerably' defined as at least a 0.5 point drop in Children's Climate Risk Index

INTRODUCING THE CHILDREN’S CLIMATE RISK INDEX 88
A promising idea: Becoming air-aware
Improving monitoring of air pollution, starting in parts of the world where there is limited monitoring, can be the first catalyst for change. There are large gaps in terms of monitoring air quality. Targeted use of reference-grade air quality systems can help provide the public with informed public health communication and messaging on the state of the air, on a real-time basis. Similarly, a lot can be done with low-cost, mobile sensors. Reliable real-time air quality monitoring systems in maternal and newborn wards and schools, for example, will not only improve child-sensitive air quality monitoring but also enable engagement with caregivers to protect children from the effects of air pollution. Improving people’s awareness and understanding of the risks associated with poor air quality, will help them not only protect themselves, but also identify sources of pollution and advocate for a reduction in emissions which cause high levels of air pollution in the first place.
Mongolia, 2017 © UNICEF/UN0255483/Bayarsaikhan

Responding to the risks 89
Investments that improve access to resilient Water, Sanitation and Hygiene (WASH) services can considerably reduce overall climate risk for 415 million children.*
Improving access to resilient WASH services could include, for example, comprehensive assessments of water resources, investing in diversifying water sources, using renewable energy, and working with local markets and the private sector to ensure that water and sanitation services have been constructed incorporating climate risks. It can also include increasing water storage facilities at household level, as well as multiple-use water schemes which provide water for domestic and livelihood needs. At a subnational and national level it includes comprehensive management, protection and monitoring of water resources. The resilience of a community is strongly related to the resilience of their WASH services.
Investments that improve access to health and nutrition services can considerably reduce overall climate risk for 460 million children.*
Improving access to health services could include, for example, investing in quality maternal and newborn care services, sustaining immunization programmes, and supporting preventive, promotive and curative services for pneumonia, diarrhoea, malaria and other child health conditions. It also includes identifying the changing health threats that children face as a result of climate and environmental factors and prioritizing health
responses accordingly. It could also include supporting adolescent health and well-being and providing age-specific health information. Moreover, it requires strengthening health systems to deliver integrated services for children.
Investments that improve educational outcomes can considerably reduce overall climate risk for 275 million children.*
Investing in sustainability education has a tremendous multiplier effect. Improved education which builds knowledge and skills will contribute to improved sustainability practices and a reduction in emissions at the individual, institutional and communal levels. Improving educational outcomes could include, for example, investing in infrastructure that is resilient to disasters to reduce long-term disruption to children’s learning process, as well as solutions that increase access, such as digital learning, as well as equity. Equity in access is important from a gender perspective, from a life cycle perspective (from early childhood through to adolescence), as well as for children with disabilities who are often marginalized. Improving educational outcomes could also mean ensuring quality learning, such as providing safe, friendly environment, qualified and motivated teachers, and instruction in languages students can understand. This means both mainstreaming the latest knowledge and science on climate change into national curricula and also ensuring that children gain the skills they need to be successful in life. These are skills that are relevant
for the future of work, including the growing green economy and for livelihoods that are less susceptible to the impacts of a changing climate and degrading environment. Skills-based learning is also essential to empower children, adolescents and teachers to participate in climate mitigation, adaptation and climate-resilience activities in schools, to encourage children to become part of the solution to climate change.
Investments that improve access to social protection and reducing poverty can considerably reduce overall climate risk for 310 million children.*
Improving access to social protection requires working towards universal coverage of child and family benefits as well as ensuring that social protection systems provide connections to other vital services in health, education and nutrition as well as the social welfare workforce. Crucial is improving the climate-responsiveness of social protection systems, so that they better able to adjust to the rapidly changing nature of shocks and stresses. To do this requires understanding the ever growing impacts of climate change faced by children and their caregivers and adapting social protection responses to be able to rapidly respond. From the perspective of children and their families, this can result in a climate shock being a temporary disruption rather than pushing families into long term poverty.
* 'Investments' are modeled as improving component score by 50%. 'Considerably' defined as at least a 0.5 point drop in Children's Climate Risk Index

INTRODUCING THE CHILDREN’S CLIMATE RISK INDEX 90
The CCRI in the context of environmental sustainability and disaster risk reduction measures
Map 30: CO2 emissions (metric tonnes per capita)
Source: CO2 emissions data downloaded from World Bank WDI data catalogue, original source: Carbon Dioxide Information Analysis Center, Environmental Sciences Division, Oak Ridge National Laboratory, Tennessee, United States. Reference Year: 2018.
Extremely High (>10)
High (5–10)
Medium–High (2.5–5)
Low–Medium (1.25–2.5)
Low (0–1.25)
No data
Global emissions
Climate change is deeply inequitable. While the most vulnerable regions will be hardest hit by climate change, they contributed least to the problem. The extremely high risk countries according to the CCRI emit only 9.38 per cent of global greenhouse gas emissions (CO2). The 10 countries with the highest risk score on the CCRI only produced 0.55 per cent of global
greenhouse gas emissions. This underscores the importance of high-emitter countries in supporting the adaptive capacity of the most vulnerable children and countries.
Understanding the vulnerability and exposure to hazards, and thus risks, that children face due to climate change is key to understanding how to better protect them. However, overlaying the CCRI with key indicators on disaster risk reduction and environmental sustainability provides insight into some of the unique gaps that the global community is facing in assisting the poorest regions to better protect children.
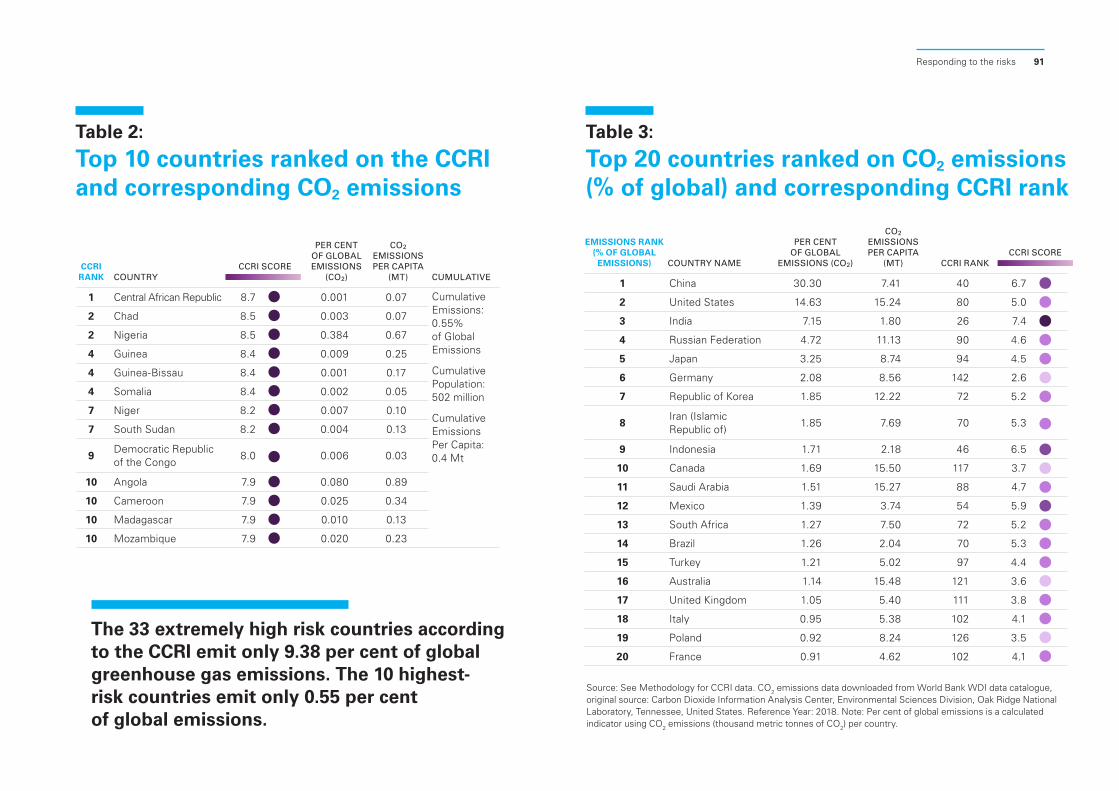
Responding to the risks 91
CCRI RANK COUNTRY
CCRI SCORE
PER CENT OF GLOBAL EMISSIONS
(CO2)
CO2 EMISSIONS PER CAPITA
(MT) CUMULATIVE
1 Central African Republic 8.7 0.001 0.07 Cumulative Emissions: 0.55% of Global Emissions
Cumulative Population: 502 million
Cumulative Emissions Per Capita: 0.4 Mt
2 Chad 8.5 0.003 0.07
2 Nigeria 8.5 0.384 0.67
4 Guinea 8.4 0.009 0.25
4 Guinea-Bissau 8.4 0.001 0.17
4 Somalia 8.4 0.002 0.05
7 Niger 8.2 0.007 0.10
7 South Sudan 8.2 0.004 0.13
9Democratic Republic of the Congo
8.0 0.006 0.03
10 Angola 7.9 0.080 0.89
10 Cameroon 7.9 0.025 0.34
10 Madagascar 7.9 0.010 0.13
10 Mozambique 7.9 0.020 0.23
EMISSIONS RANK (% OF GLOBAL EMISSIONS) COUNTRY NAME
PER CENT OF GLOBAL
EMISSIONS (CO2)
CO2
EMISSIONS PER CAPITA
(MT) CCRI RANKCCRI SCORE
1 China 30.30 7.41 40 6.7
2 United States 14.63 15.24 80 5.0
3 India 7.15 1.80 26 7.4
4 Russian Federation 4.72 11.13 90 4.6
5 Japan 3.25 8.74 94 4.5
6 Germany 2.08 8.56 142 2.6
7 Republic of Korea 1.85 12.22 72 5.2
8Iran (Islamic Republic of)
1.85 7.69 70 5.3
9 Indonesia 1.71 2.18 46 6.5
10 Canada 1.69 15.50 117 3.7
11 Saudi Arabia 1.51 15.27 88 4.7
12 Mexico 1.39 3.74 54 5.9
13 South Africa 1.27 7.50 72 5.2
14 Brazil 1.26 2.04 70 5.3
15 Turkey 1.21 5.02 97 4.4
16 Australia 1.14 15.48 121 3.6
17 United Kingdom 1.05 5.40 111 3.8
18 Italy 0.95 5.38 102 4.1
19 Poland 0.92 8.24 126 3.5
20 France 0.91 4.62 102 4.1
Table 2:
Top 10 countries ranked on the CCRI and corresponding CO2 emissions
Table 3:
Top 20 countries ranked on CO2 emissions (% of global) and corresponding CCRI rank
Source: See Methodology for CCRI data. CO2 emissions data downloaded from World Bank WDI data catalogue, original source: Carbon Dioxide Information Analysis Center, Environmental Sciences Division, Oak Ridge National Laboratory, Tennessee, United States. Reference Year: 2018. Note: Per cent of global emissions is a calculated indicator using CO2 emissions (thousand metric tonnes of CO2) per country.
The 33 extremely high risk countries according to the CCRI emit only 9.38 per cent of global greenhouse gas emissions. The 10 highest-risk countries emit only 0.55 per cent of global emissions.

INTRODUCING THE CHILDREN’S CLIMATE RISK INDEX 92
Table 4:
Top 20 countries ranked on CO2 emissions (per capita) and corresponding CCRI rank
CO2 EMISSIONS PER CAPITA RANK (MT) COUNTRY
CLIMATE AND ENVIRONMENTAL
SHOCKS (PILLAR 1)
CHILD VULNERABILITY
(PILLAR 2)
CHILDREN’S CLIMATE RISK INDEX (CCRI) CCRI
RANKCO2 EMISSIONS PER
CAPITA (MT)
1 Qatar 4.1 1.9 3.1 133 32.42
2 Kuwait 4.6 1.8 3.3 128 21.62
3 United Arab Emirates 6.0 2.0 4.3 100 20.80
4 Bahrain 3.9 2.3 3.1 133 19.59
5 Brunei Darussalam 2.9 1.8 2.4 147 16.64
6 Canada 5.4 1.5 3.7 117 15.50
7 Australia 5.4 1.2 3.6 121 15.48
8 Luxembourg 1.1 1.8 1.5 162 15.33
9 Saudi Arabia 6.8 1.7 4.7 88 15.27
10 United States 7.3 1.3 5.0 80 15.24
11 Oman 6.2 1.9 4.4 97 15.19
12 Turkmenistan 6.5 2.0 4.6 90 12.26
13 Republic of Korea 7.3 1.8 5.2 72 12.22
14 Estonia 2.1 1.2 1.7 159 12.10
15 Kazakhstan 5.7 1.9 4.1 102 12.06
16 Russian Federation 6.5 1.8 4.6 90 11.13
17 Czechia 3.2 1.6 2.4 147 9.64
18 Libya 5.5 3.2 4.4 97 8.83
19 Netherlands 4.1 1.0 2.7 140 8.77
20 Japan 6.3 2.1 4.5 94 8.74
Source: See Methodology for CCRI data. CO2 emissions data downloaded from World Bank WDI data catalogue, original source: Carbon Dioxide Information Analysis Center, Environmental Sciences Division, Oak Ridge National Laboratory, Tennessee, United States. Reference Year: 2018. Note: Per cent of global emissions is a calculated indicator using CO2 emissions (thousand metric tonnes of CO2) per country.

Responding to the risks 93
Financial flows on clean energy
A key element in helping vulnerable countries respond better to climate change is ensuring they receive the technical and financial support necessary to make greater use of clean energy, such as solar and wind. Unfortunately, global data indicate that ODA and other financial flows to the most vulnerable countries, both as a proportion of total financial flows on clean energy and in absolute terms, is limited. The most at-risk
Map 31: Financial flows on clean energy research, development and production
Source: SDG Indicator 7.a.1: International financial flows to developing countries in support of clean energy research and development and renewable energy production, including in hybrid systems (millions of constant US dollars)
Financial Flows (US$ millions constant 2017)
Extremely High (>$400)
High ($200–$400)
Medium–High ($100–$200)
Low–Medium ($50–$100)
Low ($0–$50)
No data
The extremely high-risk countries received only US$9.8 billion in terms of global financial flows, mostly in the form of ODA, on clean energy research, development and production.
countries have received only US$9 billion in international financial flows in support of clean energy research and development and renewable energy production, including in hybrid systems.

INTRODUCING THE CHILDREN’S CLIMATE RISK INDEX 94
Map 32: Children and/or youth in Nationally Determined Contributions (NDCs)
Source: UNICEF (2019) ‘Are climate change policies child-sensitive?’ by J. Pegram and C. Colon
Children and Youth Reflected in NDCs?
Yes
No
No data
Including children and young people in NDCs/NAPs
There is no such thing as a child-neutral policy. Whether intentionally or not, every policy positively or negatively affects the lives of children. Yet, despite the many ways climate change impacts them, children are consistently overlooked in the design and content of climate policies and related processes. Climate policy often does not address the specific risks that children face as a result of climate change. Children have a right to have their voices and perspectives heard and responded to on issues that affect them, as set out in the UN Convention on the Rights of the Child.
Only 40 per cent of the extremely high-risk countries have mentioned children and/or youth in their Nationally Determined Contributions (NDCs).*
Globally, only 42 per cent of all NDCs directly reference children or youth, while only 20 per cent mention children (under 18) specifically. Just three countries mention the rights of children, and a further five countries refer to human rights in the context of intergenerational equity or future generations. Almost one-quarter (23 per cent) of NDCs do not mention children or youth or child-relevant terms such as education at all.
Mentioning children and youth in NDCs is an impor-tant start – although it is not enough. NDCs should reflect the full impact of climate change on children,
and the actions taken should reflect the full scope of their needs and rights in the face of climate change.
* NDCs are being updated for COP26, and this does not reflect those updates as many are still under development. This analysis was conducted on NDCs that were available as of 2019, submitted as part of the Paris Agreement. This analysis will be updated once all updated NDCs become available.

Responding to the risks 95
Disaster risk-reduction (DRR) strategies
A comprehensive disaster risk reduction (DRR) strategy is an important component to better protect children from the impacts of climate change. Disaster risk reduction is a systematic approach to identifying, assessing and reducing that risk. The purpose of DRR is to minimize vulnerabilities and disaster risks throughout a society to avoid or limit the adverse impacts of natural hazards, as well as to facilitate sustainable development.
Map 33: Sendai Framework and Adoption Implementation Score
Source: SDG Indicator 1.5.3, 11.b.1, 13.1.2: Number of countries that reported having a National DRR Strategy which is aligned to the Sendai Framework
Extremely High (0.8–1)
High (0.6–0.8)
Medium–High (0.4–0.6)
Low–Medium (0.2–0.4)
Low (0–0.2)
No data
DRR strategies should ideally address the specific vulnerabilities of children and women, including those with disabilities and special needs. Families may not know where to turn for guidance, and it is crucial to strengthen information and awareness, as well as technical skills. The lack of child-sensitive DRR plans leaves children vulnerable to hazards. Monitoring, forecasting and early warning of natural hazards need to be matched sufficiently by DRR measures to equip communities with the knowledge and skills they need to protect themselves when a natural hazard strikes.
None of the extremely high-risk countries have an extremely high (>80 per cent) score on the adoption and implementation of the national DRR strategies in line with the Sendai Framework.

INTRODUCING THE CHILDREN’S CLIMATE RISK INDEX 96
Map 34: Proportion of children living within 50km of air pollution monitoring stations
Source: Global air monitoring stations sourced from https://waqi.info/; https://www.purpleair.com; http://airqo.net/. Population data from Gridded Population of the World version 4 (GPWv4)
Extremely High (80%–100%)
High (60%–80%)
Medium–High (40%–60%)
Low–Medium (20–40%)
Low (0–20%)
Air pollution monitoring
Ground-level real-time pollution monitoring helps to better capture daily – even hourly – fluctuations in air quality. These measurements are important to improve public awareness, helping people to adapt their behaviours and actions to both reduce air pollution and reuce their exposure to it. This monitoring is also useful in identifying sources of pollution, shaping public health policy, and informing community-level action and interventions that target the most affected.
Most (28 out of 33) of the extremely high-risk countries have very low coverage of ground-level air quality monitoring stations – less than 10 per cent of the child population lives within 50km of a monitoring station.

Responding to the risks 97
The CCRI in the context of fragility, governance and displacement
Fragile contexts
Humanitarian situations or crises are an incident or sequence of events in a country or region that causes severe disruption to society’s functioning, resulting in human, material or environmental losses, that surpass an affected population’s ability to cope using their own resources. Climate vulnerability is a cross-cutting issue that has been strongly linked to fragility.
Map 35: Fragile contexts
Source: OECD (2020), States of Fragility 2020, OECD Publishing, Paris, https://doi.org/10.1787/ba7c22e7-en
Non-Fragile
Fragile and Extremely Fragile
No data
Almost all (29 out of 33) out of the extremely high-risk countries are also considered fragile contexts.
Children who live in fragile states and/or are experiencing a humanitarian crisis are also among the most vulnerable to climate change. Children in these countries have limited ability to cope with hazards – given that an individual’s adaptive capacity depends on a state’s degree of civil order, political transparency, and strong economic management – and have poor resilience to recover after a disaster. Reducing fragility is therefore essential to protect the world’s most vulnerable children from the consequences of climate change.

INTRODUCING THE CHILDREN’S CLIMATE RISK INDEX 98
Map 36: Government effectiveness
Source: Kaufmann, Daniel and Kraay, Aart and Mastruzzi, Massimo, The Worldwide Governance Indicators: Methodology and Analytical Issues (September 2010). World Bank Policy Research Working Paper No. 5430, Available at SSRN: https://ssrn.com/abstract=1682130
Extremely High
High
Medium–High
Low–Medium
Low
No data
About 85 per cent (28 out of 33) of the extremely high-risk countries have very low governance scores.
Governance
Governance refers to the capacity of governments to deliver quality services effectively and inclusively, and to protect and empower vulnerable populations. Good governance is vital to uphold children’s rights and well-being, yet delivering effective and accountable governance remains a difficult task, owing to a combination of limited capacities and inadequate institutions, as well as changing social, political, technical and economic contexts. Quality of governance has a tremendous impact on a nation’s ability to develop quick and effective climate responses and solutions, and children in the most climate vulnerable countries
experience some of the lowest government scores. To safeguard the world’s most vulnerable children from climate change, improvements to governance are imperative.
Climate governance has become increasingly prominent in recent years. Climate governance refers to information and the decision-making processes relating to climate change made at both national and international levels, that are relevant to all sections of society. Climate decisions and policies must be sensitive to, and include, the perspectives of young people, who are important actors for climate action success. Local and national governments that are actively involved and
advocating for child-inclusive climate governance are more likely to implement climate action that reduces the vulnerability of children to climate change and upholds a child’s right to participate in climate decision-making.

Responding to the risks 99
Displacement
At the end of 2019 nearly 33 million children were forcefully displaced around the globe. It is unsurprising that so many of the extremely high risk countries also have very high levels of displacement. As hazards are becoming more severe and frequent with environmental change, climate-induced displacement is increasing rapidly. For example, in the Caribbean islands, internal displacement related to storms and flooding rose sixfold from 2014 to 2018 in comparison with 2009 to 2013. In some cases, climate change is also responsible for conflict-related displacement,
in situations where conflict arises over the fight for natural resources which are becoming scarcer with climate change.
In the context of displacement, children suffer a variety of increased risks, including those related to family separation, exploitation, violence and abuse, loss of education, increased vulnerability to physical and psychological trauma, amongst others. Such vulnerabilities put displaced children at an increased risk of the future impacts of climate change. How governments manage displacement is therefore integral to protect vulnerable children from climate impacts.
Map 37: Uprooted people
The total number of uprooted people is the sum of refugees and asylum-seekers (2020), returned refugees (2019), people internally displaced by conflict and violence (2019) and people internally displaced by disasters (2019). Data sources: United Nations High Commissioner for Refugees (UNHCR) and Internal Displacement Monitoring Centre (IDMC).
Uprooted people (%)
Extremely High (>15%)
High (10%–15%)
Medium–High (5%–10%)
Low–Medium (1%–5%)
Low (<1%)
Uprooted people (1000s)
1
10
100
1,000
10,000
One-quarter (8 out of 33) of extremely high-risk countries have very high proportions (%) of displacement – with more than 5 per cent of the population displaced.
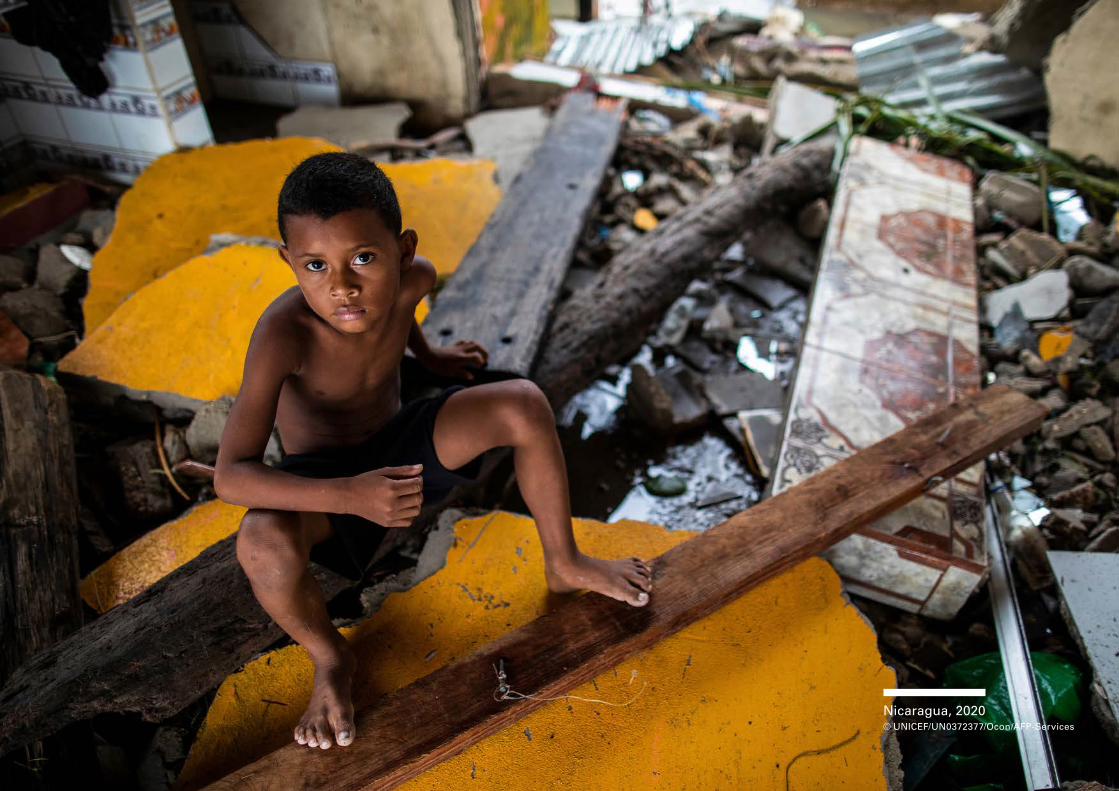
INTRODUCING THE CHILDREN’S CLIMATE RISK INDEX 100
Nicaragua, 2020 © UNICEF/UN0372377/Ocon/AFP-Services

Nicaragua, 2020 © UNICEF/UN0372377/Ocon/AFP-Services
CCRI methodology
This chapter presents the component selection for the two pillars of the CCRI model. A more detailed description of the methodology, including the different steps carried out for the construction of the index score and the aggregation rules applied for calculation of composite components in the different levels of the model, are described in the Methodology Paper.
The CCRI composite index is a multi-shock model that aims to capture the exposure of children to multiple climate and environmental shocks and stress. It is a multisectoral model that seeks to represent a balanced view of the different sectors involved in the well-being of children, focusing on aspects that could contribute to, or aggravate, child deprivation in the context of climate-related and environmental shocks and stresses.
The model has a multilayer structure, where the CCRI composite index is built by bringing together a set of indicators across two pillars:
• Pillar 1 measures exposure to climate and environmental shocks and stresses.
• Pillar 2 captures child vulnerability.
The CCRI approach adopts and allies with the IPCC risk framework (IPCC 2014) and as such considers risk as being composed of the key domains of hazards, exposure to identified hazards and vulnerability, where vulnerability has the components of both sensitivity (immediate impact of hazard) and adaptive capacity (ability to respond in the longer term). Thus, indicators are selected which reflect these key categorizations and, more
specifically, reflect them in relation to children’s risk from climate change. In the CCRI only components of sensitivity, immediately reflective of a child’s experience, are included; however, the index as a whole is then compared to metrics of adaptive capacity in order to elucidate any potential relationships between them. This approach is adopted to provide a specific policy relevance to the work.
Indeed, one of the key aims of this work is to identify a risk index that is specifically sensitive to the experience of children, and shows that not only are children uniquely vulnerable to environmental hazards, but they also need to be independently considered in regard to the response of decision makers tasked with tackling climate change. The Child Climate Risk Index (CCRI) can
6

INTRODUCING THE CHILDREN’S CLIMATE RISK INDEX 102
be used for the monitoring and evaluation of child climate vulnerability and exposure to specific hazards (risk), as well as to facilitate advocacy of climate response for the well-being of children at a global level.
Pillar 1
Pillar 1 examines climate and environmental hazards, shocks and stresses. It captures a range of climate and environmental hazards, shocks and stresses that are currently monitored and recorded. It is important to note that these are current hazards, shocks and stresses, and not future projections. See Figure 11 and Table 5 for components and sub-components.
Pillar 2
Pillar 2 examines child vulnerability and coping capacity, as reflected in children’s rights outlined in the Convention on the Rights of the Child. It captures child-specific dimensions that make children particularly susceptible to shock or stress (as indicated in Pillar 1). It also includes variables that relate to community, national or institutional abilities (strengths, performance) to manage the impacts of shocks and stresses (including capacity to deliver services). See Figure 12 and Table 6 for components and subcomponents.
Burundi, 2017 © UNICEF/UN0185046/Haro

Ccri methodology 103
COMPONENT INDICATOR DATA SET SOURCE*
Water scarcity exposure
Children exposed to water scarcity (absolute)
Drought events UNEP
Water stress WRI
Seasonal variability WRI
Children exposed to water scarcity (relative)
Interannual variability WRI
Groundwater table decline WRI
Riverine flood exposure
Children exposed to riverine floods – 50 years (absolute)
Riverine flood hazards,
50 years return period
GAR 2015
Children exposed to riverine floods – 50 years (relative)
Coastal flood risk
Children living in areas with coastal flood risk (absolute)
Coastal flood risk (high to very high)
WRI
Children living in areas with coastal flood risk (relative)
Tropical cyclone wind exposure
Children exposed to tropical cyclone winds – 100 years (absolute)
Tropical cyclone windspeed, 100 years return period (above 119 km/h and above 178 km/h)
GAR 2015
Children exposed to tropical cyclone winds – 100 years (relative)
Exposure to vector borne disease
Children at risk of Malaria (absolute)
Spatial limits of Plasmodium vivax malaria transmission (stable and unstable)
The Malaria Atlas Project
Children at risk of Malaria (relative)
Spatial limits of Plasmodium falciparum malaria transmission (stable and unstable)
Children exposed to Zika (absolute)
Environmental suitability for Zika Messina et al.
Children exposed to Zika (relative)
Children at risk of Aedes (absolute)
Probability of occurrence of Aedes
Kraemer et al.
Children at risk of Aedes (relative)
Children exposed to Dengue (absolute)
Environmental suitability for dengue
Messina et al.
Children exposed to Dengue (relative)
COMPONENT INDICATOR DATA SET SOURCE*
Heatwaves Children exposed to heatwaves (absolute)
Annual average number of heatwaves between 2000 and 2020
Berkeley Earth Surface TemperatureChildren exposed to
heatwaves (relative)
Air pollution Children exposed to outdoor fine particulate matter (absolute)
Exposure to ambient fine particulate matter (PM2.5)
Atmospheric Composition Analysis Group
Children exposed to outdoor fine particulate matter (relative)
Soil and water pollution
Children living in areas with pesticide pollution risk (absolute)
Pesticide risk (high to very high) Tang et al.
Children living in areas with pesticide pollution risk (relative)
Tang et al.
Children with blood lead levels (BLL) over 5 µg/dL (absolute)
Number of children (under 20) with blood lead levels (BLL) over 5 µg/dL
Percentage of total population by age group, both sexes (per 100 total population), 2019 estimate
IMHE
Children with blood lead levels (BLL) over 5 µg/dL (relative)
UN WPP 2019 revision
Common Total population count, both sexes combined
Gridded population of the world v4.11 (counts), UN Adjusted, 2020 estimate
CIESIN
Percentage of child population under 18, both sexes combined
Percentage of total population by broad age group, both sexes, 2020 estimate
UN WPP 2019 revision
Table 5: Components and indicators of pillar 1
* Refer to Methodology Paper for full sources

INTRODUCING THE CHILDREN’S CLIMATE RISK INDEX 104
Figure 11: Pillar 1 – Exposure to climate and environmental shocks and stresses
Exposure to climate and environmental shocks and stresses
Children U20 with blood lead levels (BLL) over 5 μg/dl (N)
Children U20 with blood lead levels (BLL) over 5 μg/dl (%)
Children U18 living in areas with pesticide pollution risk (N)
Children U18 living in areas with pesticide pollution risk (%)
Children U18 exposed to PM2.5 >= 10 μg/m3 (%)
Children U18 exposed to PM2.5 >= 25 μg/m3 (%)
Children U18 exposed to PM2.5 >= 10 μg/m3 (N)
Children U18 exposed to PM2.5 >= 25 μg/m3 (N)
Children U18 exposed to extensive cyclone winds – 100 yrp (%)
Children U18 exposed to intensive cyclone winds – 100 yrp (%)
Children U18 exposed to extensive cyclone winds – 100 yrp (N)
Children U18 exposed to intensive cyclone winds – 100 yrp (N)
See next page
Pesticide pollution
Lead pollution
Children U18 exposed to outdoor fine particulate matter (N)
Children U18 exposed to outdoor fine particulate matter (%)
Children U18 exposed to tropical cyclones (N)
Children U18 exposed to tropical cyclones (%)
Children U18 exposed to water scarcity (N)
Children U18 exposed to water scarcity (%)
Children U18 exposed to riverine floods – 50 yrp (N)
Children U18 exposed to riverine floods – 50 yrp (%)
Children U18 living in areas with coastal flood risk (N)
Children U18 living in areas with coastal flood risk (%)
Children U18 exposed to heatwaves (N)
Children U18 exposed to heatwaves (%)
Water scarcity
Riverine floods
Coastal floods
Vector borne diseases
Soil and water pollution
Heatwaves
Air pollution
Tropical cyclones
Geometic average
Arithmetric average (inverse)

Ccri methodology 105
Figure 11: Pillar 1 – continued
Exposure to shocks and stresses:Vector borne diseases
Exposure to Aedes
Exposure to Dengue
Exposure to Malaria
Exposure to Zika
Exposure to Plasmodium Vivax Malaria
Exposure to Plasmodium Falciparum Malaria
Exposure to PV Malaria (relative)
Exposure to PV Malaria (absolute)
Exposure to PF Malaria (absolute)
Exposure to PF Malaria (relative)
Exposed children U18 – stable transmission (N)
Exposed children U18 – unstable transmission (N)
Exposed children U18 – stable transmission (N)
Exposed children U18 – unstable transmission (N)
Exposed children U18 – stable transmission (N)
Exposed children U18 – unstable transmission (N)
Exposed children U18 – stable transmission (N)
Exposed children U18 – unstable transmission (N)
Exposed children U18 (N)
Exposed children U18 (%)
Exposed children U18 (N)
Exposed children U18 (%)
Exposed children U18 (N)
Exposed children U18 (%)
Vector borne diseases
Geometic average
Arithmetric average (inverse)

INTRODUCING THE CHILDREN’S CLIMATE RISK INDEX 106
Figure 12: Pillar 2 – Child vulnerability
Child vulnerability
DTP3 vaccine coverage
MCV2 vaccine coverage
PCV3 vaccine coverage
Child/family cash benefits
Social safety net spending
Ability to come upwith emergency funds
Access to financial services
Immunization
Child mortality
Prevalence of stunting
Low-birthweight
At least basic drinking water
Limited drinking water
Unimproved drinkingwater source
Surface water
Poverty headcount ratio
GINI index
Mobile cellular subscriptions
Access to electricity
Primary out-of-school rate
Lower secondaryout-of-school rate
Maternal mortality
Nurses and midwiferypersonnel density
Domestic health expenditure
Child health
Nutrition
Maternal health
Poverty and inequality
Communication assets
Out-of-school children
Youth literacy
Drinking water service level
Basic handwashing facilities
Education expenditure
Social safety nets
Financial inclusion
Social protection andeconomic empowerment
Arithmetic average
Weighted score
Child health and nutrition
Education
Water, sanitation, and hygiene
Poverty, communication assets,and social protection

Ccri methodology 107
COMPONENT SUB-COMPONENT
SUB-COMPONENT
INDICATOR (SHORT NAME)
SOURCE*
Child health and nutrition
Child health Under-five mortality
UN Inter-agency Group for Child Mortality Estimation, through World Bank WDI
Immunization DTP3 access WHO, UNICEF, through SDG
MCV2 access WHO, UNICEF, through SDG
PCV3 access WHO, UNICEF, through SDG
Nutrition Prevalence of stunting
UNICEF, WHO, World Bank: JME
Low-birthweight babies
UNICEF, WHO, through World Bank WDI
Maternal health Maternal mortality WHO, UNICEF, UNFPA, World Bank Group, and the United Nations Population Division, through World Bank WDI
Nursing and midwifery personnel density
WHO, through SDG
Health expenditure
WHO, through World Bank WDI
Education Out-of-School Out-of-school rate primary
UNESCO
Out-of-school rate lower secondary
UNESCO
Youth literacy rate, population 15–24 years, both sexes
UNESCO
Education expenditure
UNESCO, through World Bank WDI
COMPONENT SUB-COMPONENT
SUB-COMPONENT
INDICATOR (SHORT NAME)
SOURCE*
Water, sanitation, and hygiene
Drinking water service level
Improved drinking water source (within 30 minutes)
WHO/UNICEF JMP
Improved drinking water source (exceeding 30 minutes)
WHO/UNICEF JMP
Drinking water from an unprotected dug well or unprotected spring
WHO/UNICEF JMP
Drinking water from other unprotected sources
WHO/UNICEF JMP
Basic handwashing facilities
WHO/UNICEF JMP, through World Bank WDI
Poverty, communication assets, and Social protection
Poverty and inequality
Poverty headcount ratio
World Bank Global Poverty Working Group
GINI Index World Bank Development Research Group
Communication assets
Mobile cellular subscriptions
ITU, ICT, through World Bank WDI
Electricity access World Bank, through SDG
Social protection and economic empowerment
Social Safety Nets (SSN)
Child cash benefits
ILO, through SDG
SSN spending World Bank ASPIRE
Financial inclusion
Lacking emergency funds
World Bank Findex database
Access to money services
World Bank Findex database
Table 6: Components and indicators of Pillar 2
* Refer to Methodology Paper for full sources

INTRODUCING THE CHILDREN’S CLIMATE RISK INDEX 108
Caption here Caption here Caption here Caption here Caption here Caption here Caption here Caption here. CREDIT
Djibouti, 2018 © UNICEF/UN0199522/Noorani

The climate crisis is a child’s rights crisis
A crisis on many fronts
The climate crisis is creating a child’s rights crisis of unprecedented proportions. While on the one hand, children’s living standards and overall health and education have improved in recent decades, on the other hand they are also growing up in a world where they are faced with an increasing number of threats, hazards and risks – due to climate change and environmental degradation. These threats are not only compromising their futures, but also have the potential to undermine progress made.
For decades, countries have eroded the environment in pursuit of rapid economic growth. However, the environment has many important benefits, not just economically, but also for well-being of society as a whole – it provides us with many services that are critical to our very survival, including clean air, water and nutritious food. Well-functioning ecosystems and biodiversity are not only important in themselves, but they also enrich our experience with nature, and the value of what it can provide us, including, for example, opportunities for social and mental health, as well as the discovery of new medicines.
It is now clear that economic growth that comes at the expense of the environment is not a trade-off that can be considered in the ‘best interests of the child’.
Climate change and environmental degradation are creating:
• A water crisis: Droughts, floods, and severe weather associated with climate change stand to affect children’s access to safe drinking water and sanitation. Approximately 415 million children are living in areas of high or extremely high water vulnerability – where the risks of
7

INTRODUCING THE CHILDREN’S CLIMATE RISK INDEX 110
drought, groundwater table decline, water stress, and annual and inter-annaul seasonal variability intersect with low levels of access to water services.
• A health crisis: Around 26 per cent of deaths among children under five are due to modifiable environmental factors. Air pollution and environmental toxins are among the biggest killers of children globally, and climate change stands to exacerbate the myriad health risks that children face. Children are also particularly vulnerable to extreme heatwaves, as they have a reduced capacity to regulate their body temperature and protect themselves. Nearly 90 per cent of the global burden of disease associated with climate change is borne by children under five. Toxins, such as lead, that seep into the food children eat, the water they drink and the soil they play on, can harm children’s health and development. Climate change can also damage or disrupt access to essential health services and clinics. Most child health risks due to environmental factors are preventable.
• A nutrition crisis: Food security is linked directly to climate change. With increasing frequency and severity of droughts, floods and severe weather, food security stands to be compromised, threatening the level of nutrition children can access. The impact of climate change on poverty in sub-Saharan Africa, for example, will be primarily driven by rising food prices. Moreover, events such as these can damage critical infrastructure which prevents the adequate distribution of food to regions
which have been affected. Climate change will impact food security not only through these catastrophic events, but also through slow-onset changes to precipitation and temperature, which can alter agricultural practices that communities have relied on for generations.
• An education crisis: Climate change and environmental degradation affects children’s ability to go to school, through its impact on health and well-being of both students as well as teachers. Droughts, floods, even extreme events of air pollution and exposure to toxic chemicals, have the same potential to prevent children from accessing school as well as
negatively impacts their cognitive function and learning outcomes. Climate change is also affecting the relevance of the skills schools provide – education systems need to be reimagined so that they give children the skills and training they need to address the challenges of the future and the growing green economy.
• A social protection crisis: Climate change will strain the systems to accommodate the needs of the most vulnerable. The impetus for an overhaul of patchwork systems, and supporting the progressive realization of universal child benefits, will have a huge impact on addressing the far-reaching impacts of climate change.
Zimbabwe, 2020 © UNICEF/UNI296638/Prinsloo

The climate crisis is a child’s rights crisis 111
• A child protection crisis: As climate change disrupts institutional and protection systems and forces migration and displacement, climate change stands to put millions of children at risk from exploitation, labour and abuse. Children travelling alone or separated from their parents can be particularly at risk of emotional, physical and sexual violence.
• A participation crisis: Children’s views are often not heard and acted on by decision makers who are setting policies that directly affect how severe future impacts will become. Because children often don’t have the same legal and political standing as adults, they often do not have a platform to have their voices heard, or accountability mechanisms to ensure they are acted upon. They are reliant and dependent on adults, and suffer from power imbalances and a lack of knowledge, including on climate change.
A crisis infringing on many rights
The climate crisis affects or will affect all children, everywhere, in often significant, life-changing ways, throughout their lives. It undermines the effective enjoyment of the rights enshrined in the Convention on the Rights of the Child, to which all 196 eligible States parties have signed except the United States, including:
Article 3: The best interests of the child must be a top priority. Climate change works in opposition to the best interests of children, especially in vulnerable countries.
Article 6: Right to survival and development. Climate change directly threatens the survival and development of children, through increased risk of droughts, floods, disease and hunger.
Article 9–10: Family relations and not to be separated from one’s parents against one’s will. Climate change stands to displace millions of children living in vulnerable places, including forcing children to move across and within national boundaries.
Article 12: Right to voice. Children have a right to have their voices heard on issues that affect them. Climate change will affect future generations more than anyone. Limiting their opportunity to have a say on the ambition of climate action at local, national and international levels inhibits this right.
Article 24: Right to health. The bulk of global burden of disease associated with climate change affects children, especially young children. Climate change can also damage or disrupt access to essential health services and clinics.
Article 27: Right to adequate standard of living. Rising sea levels, storms and floods threaten to destroy housing and create unsafe living conditions for children.
Article 28: Right to education. Children are kept out of, or away from, school due to climate change related disasters, such as floods, storms or droughts.
Articles 19, 32 and 34–36: Right to freedom from any form of violence or exploitation. Climate change increases the risks of violence and exploitation, especially when children and their families are displaced. This can also increase risks of abduction and trafficking.
Article 30: Right to indigenous culture and language. Climate change threatens ecosystems which are instrinsically linked with indigenous culture and language.
Article 31: Right to recreation and play. Climate change stands to threaten the ability of children to access safe spaces for recreation and play, including through destruction or damage of schools as well as community spaces.
Because of the inter-connected and inter-related nature of rights, the realization of one right often depends, wholly or in part, upon the realization of others. The violation of one right often reinforces or leads to the violation of another. As a result, virtually all children’s rights may be affected by the climate crisis, potentially impacting the effective implementation of the Convention on the Rights of the Child as a whole.
The Committee on the Rights of the Child has identified climate change as one of the biggest threats to children’s health and has urged States parties to put children’s health concerns at the centre of their climate change adaptation and mitigation strategies. It has emphasized that States have a responsibility to protect children from environmental harms.
INTRODUCING THE CHILDREN’S CLIMATE RISK INDEX 112
States’ obligations towards children
States are the primary duty bearers of children’s rights, and they must comply with the above-mentioned international legal obligations to which they are signatories. The infringement of rights and negative impacts of the climate crisis on children trigger the obligations of all States to take action and protect children from current and foreseeable adverse effects. States also have to ensure that all decisions by their agents are made with the best interests of the child as a primary consideration, and are informed by an ante-facto assessment of their impact on child rights. States have a duty to ensure the realization of all rights for children in their country, but the Convention on the Rights of the Child also places obligations on countries to take action on upholding children’s rights internationally, with clear implications for transboundary environmental harm.
Although states are the primary duty bearers of rights, businesses have a responsibility to respect human rights and do no harm. In its General Comment No. 16, the Committee on the Rights of the Child provides a framework to ensure that businesses respect the right of the child, including effective legislation, regulation and enforcement, as well as policy, remedial, monitoring, coordination, and awareness-raising measures. States should require businesses to undertake child-rights due diligence and identify, prevent and mitigate their impact on the environment and children’s rights including across their business relationships and within global operations.
In addition to their obligations under international human rights law, States are also bound by their commitments to other multilateral agreements. The Paris Agreement calls on parties to respect, promote and consider their respective obligations on human rights, particularly the rights of children. As well, the 2030 Agenda for Sustainable Development, the Sendai Framework for Disaster Risk Reduction 2015–2030 and the Addis Ababa Action Agenda of the Third International Conference on Financing for Development all mention children and reaffirm State commitments to a human rights based approach to development and climate action.
Children’s right to claim their rights
Children have a right to have their voices heard on issues that affect them, including on climate change that will affect future generations more than anyone. Children also have the right to seek an effective remedy when they believe that their rights are violated.
But because children don’t have the same legal and political standing as adults, they often do not have a platform to have their voices heard, or accountability mechanisms to ensure they are acted upon, and are often not being heard. They have to rely and depend on adults and suffer from power imbalances and a lack of knowledge and access to information. Limiting their opportunity to have a say on the ambition of climate action at local, national and international levels inhibits their rights.
Where States fail to comply with the legal norms and standards enshrined in human rights instruments, children, and/or adults on their behalf, are entitled to institute proceedings for appropriate redress before a competent court or other adjudicator. However, the vast majority of children across the world face enormous obstacles in accessing justice – legal, financial, cultural, practical – meaning that prevention may be the best and often only means of ensuring access to an effective remedy.
Yet, despite the obstacles in their way, children are using street protests, online activism and lawsuits to call out government inaction on climate change. They are in many instances at the forefront of environmental movements and must be recognized as the agents of change and human rights defenders that they are. Children are also increasingly bringing complaints against their government for climate inaction, often obtaining victories compelling governments to act and inspiring others to follow.

The climate crisis is a child’s rights crisis 113The climate crisis is a child’s rights crisis 113
What are the impacts of climate change and environmental damage in Bangladesh?Bangladesh is one of the countries most vulnerable to the impact of climate change. People suffer from floods, cyclones, droughts, salinity and river erosion, and the poorer people feel this more than others.
A large part of the population is young, and since the future of Bangladesh is in the hands of these young people, it is important for us to be aware of climate change and take action. I am determined to work on this tirelessly, though it isn’t an easy task.
My activism: What inspired me to take action?As a little boy, I used to visit my grandfather’s home in a rural setting near a river. I felt that the river had been expanding day by day. My little mind started to take in how the people of the river erosion areas are surviving due to the impact of climate change. Then one day I read an article in a newspaper about the harmful aspects of climate change. This made me worried.
When I was 12, I started to publish a monthly magazine for children called Lal Sabuj. There, children of different ages started sending their problems and solutions in the form of reports or creative articles. At the beginning of each month, they would wait to collect the new copy of Lal Sabuj. Their interest inspired me.
In 2015, I established a youth organization called Lal Sabuj Society. Now I am creating opportunities for others, especially children at risk from the impacts of climate change in coastal areas, to practise journalism. In this way, they are able to present their situation directly to the world. Many of them are grown up and are interested in working in the mainstream media.
There are now 400 children and youth across Bangladesh who are working with me on climate change. We clean up public places like canals and tourist spots and separate the recyclable plastics, which we then sell at recycling centres. The money we get from this we spend on planting trees. We also try to inspire people to recycle plastics, for example through online competitions with rewards.
Tips for all my young friends1. Close the running tap when not needed.2. Turn off lights and save electricity as much as possible.3. Plant trees as much as you can so that we can get more oxygen.4. Reuse any plastic that you have already acquired. Recycle used plastic to
keep it out of the waste stream and reduce demand for new plastic. Taking these simple steps can help reduce plastic pollution and keep our planet clean and healthy.
5. Use a bicycle to travel. Bicycle riding uses minimal fossil fuels and is a pollution-free mode of transport.
6. As a youth you can play an important role in creating environmental and climate awareness. Especially nowadays through social media you can easily spread the message of climate change issues to everyone.
We need young activists to make the world more beautiful. You can start a school leadership group or find youth organizations in your area that are working for the community. Get involved and take responsibility as much as possible. Follow different organizations through social media so you can find out about different opportunities and get involved. Participate in the movement that is taking place in your country on climate change or any other issue. Never think that you are too young – look at Greta’s example!
The role of youth is most important for the present and future world. You have to come forward now to protect the climate. I would say to all young people, start taking action from your place right now. It’s our time!
Youth perspectives: Taasin, Bangladesh

INTRODUCING THE CHILDREN’S CLIMATE RISK INDEX 114
Additional Global Agreements, Agendas and Frameworks
The 2030 Agenda for Sustainable Development, the Paris Agreement, and the Sendai Framework for Disaster Risk Reduction 2015–2030 all reaffirm State commitments to a human rights-based approach to development and climate action.
The Paris Agreement“Acknowledging that climate change is a common concern of humankind, Parties should, when taking action to address climate change, respect, promote and consider their respective obligations on human rights, the right to health, the rights of indigenous peoples, local communities, migrants, children, persons with disabilities and people in vulnerable situations and the right to development, as well as gender equality, empowerment of women and intergenerational equity.”
The Agenda for Sustainable Development“Children and young women and men are critical agents of change and will find in the new Goals a platform to channel their infinite capacities for activism into the creation of a better world.” General Assembly resolution 70/1, paragraph 51.
Sendai Framework for Disaster Risk Reduction 2015–2030“Children and youth are agents of change and should be given the space and modalities to contribute to disaster risk reduction, in accordance with legislation, national practice and educational curricula;” Sendai Framework for Disaster Risk Reduction 2015–2030, Role of Stakeholders, 36(ii).
Uruguay, 2021 © UNICEF/UN0411235/

The climate crisis is a child’s rights crisis 115The climate crisis is a child’s rights crisis 115
A promising idea: Diversifying water sources
In a world where water scarcity will continue to be a global challenge, diversifying water sources not only helps manage uncertainty, but also hedges against the risk that a catastrophic event could damage the only water source available to a community. Water reuse, reducing leakage, storm water management and managed aquifer recharge/sub-surface dams can help improve the diversity of sources available, and improve resilience to the impacts of climate change. Reducing the volume of surface flow can reduce the risk of contamination to water services which may render existing sources unsafe and unusable. Aquifer recharge can also be used to create a buffer against the inflow of saline or brackish water, which is an increasing risk with climate change. Other solutions like water reuse can simultaneously reduce the risk of contamination due to untreated sewage, and conserve limited groundwater supplies. This is especially important as storms, floods, rising sea levels and other impacts of climate change heighten the risk of water supplies becoming contaminated. Furthermore, collecting and treating wastewater not only reduces the risk of contamination, it can also provide a safe alternative source of water which can be used for many reasons, including irrigation and cleaning, and conserves fresh water for more critical purposes.
Indonesia, 2020 © UNICEF/UN0353517/Ijazah
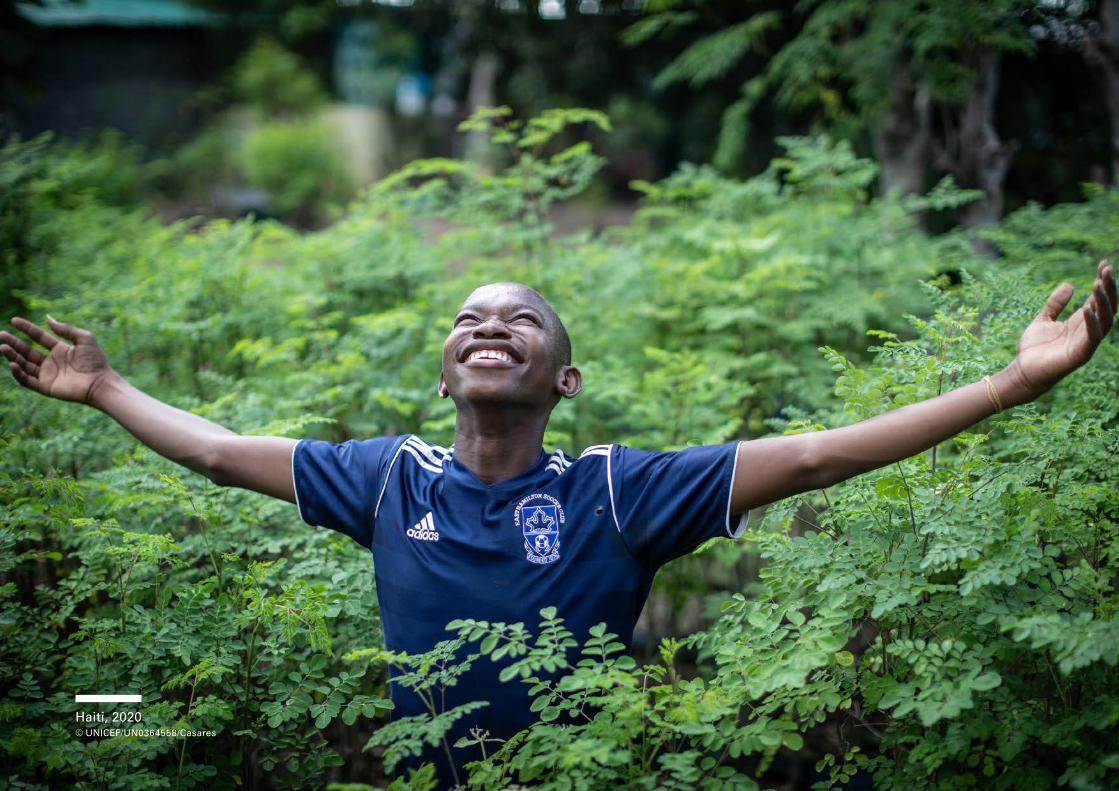
INTRODUCING THE CHILDREN’S CLIMATE RISK INDEX 116
Haiti, 2020 © UNICEF/UN0364558/Casares

Creating an environment fit for children8
From natural disasters to climate-related conflict to forced migration, climate change is already taking a toll on children’s safety, education and health. Nowhere is this more acute than the countries at the top of the Children’s Climate Risk Index (CCRI).
This is a tragic situation, but our actions now can prevent worse challenges in the future.
Every child and young person – 3.5 billion by 2030 – should be protected from the worst impacts of climate change and environmental degradation, as well as being part of the solution and the movement to heal the planet.
At its heart, addressing the climate crisis requires us to re-think how we value the future in our
current economic models. Our view of the future needs to be done from the perspective of the children of today and future generations who will have to live in a world marked by our decisions.
And in order to get action on this crisis immediately, we will need concrete solutions.
Climate change is perhaps one of the most intersectional challenges in history, having its causes and impacts deeply embedded in wider systems that also shape economic and social inequality. A good climate solution should help to resolve these other challenges. It should address multiple risk factors at the same time. A good climate solution should also cover immediate impacts, longer-term impacts, and intergenerational impacts.
Achieving an environment fit for children will require a whole-of-society response. It will require that we all:
• Increase investment in climate adaptation and resilience in key services for children. To protect children, communities and the most vulnerable from the worst impacts of the already changing climate, critical services must be adapted, including water, sanitation and hygiene systems, health and education services.
• Reduce greenhouse gas emissions. To avert the worst impacts of the climate crisis, comprehensive and urgent action is required. Countries must cut their emissions by at least 45% (compared to 2010 levels) by 2030 to keep warming to no more than 1.5 degrees Celsius.
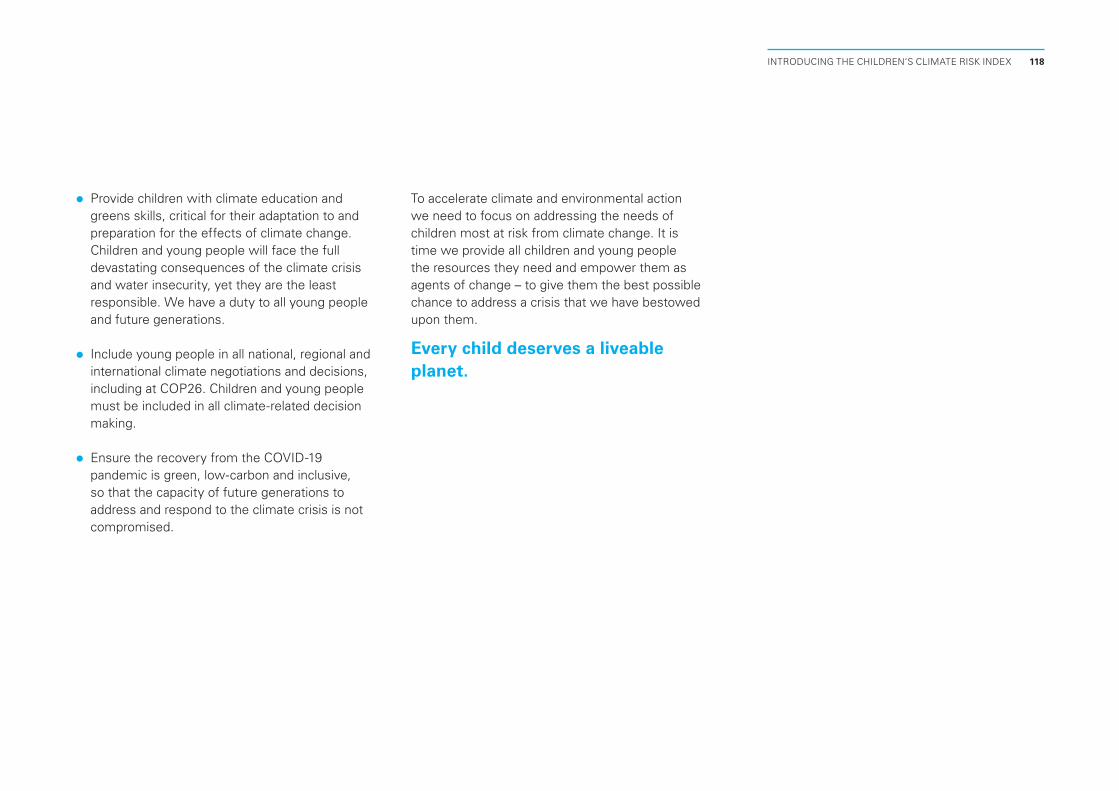
INTRODUCING THE CHILDREN’S CLIMATE RISK INDEX 118
• Provide children with climate education and greens skills, critical for their adaptation to and preparation for the effects of climate change. Children and young people will face the full devastating consequences of the climate crisis and water insecurity, yet they are the least responsible. We have a duty to all young people and future generations.
• Include young people in all national, regional and international climate negotiations and decisions, including at COP26. Children and young people must be included in all climate-related decision making.
• Ensure the recovery from the COVID-19 pandemic is green, low-carbon and inclusive, so that the capacity of future generations to address and respond to the climate crisis is not compromised.
To accelerate climate and environmental action we need to focus on addressing the needs of children most at risk from climate change. It is time we provide all children and young people the resources they need and empower them as agents of change – to give them the best possible chance to address a crisis that we have bestowed upon them.
Every child deserves a liveable planet.

Viet Nam, 2019 © UNICEF/UNI220514/Viet Hung

The Children’s Climate Risk Index (CCRI) and CO2 Emissions (by Country)
Annex
CCRI RANK
CCRI SCORE
COUNTRY NAME
C02
EMISSIONS (KT)
PER CENT OF GLOBAL
EMISSIONS (CO2)
EMISSIONS PER CAPITA
(MT)
1 8.7 Central African Republic 330 <0.01 0.07
2 8.5 Chad 1,070 <0.01 0.07
2 8.5 Nigeria 130,670 0.38 0.67
4 8.4 Guinea 3,120 0.01 0.25
4 8.4 Guinea-Bissau 310 <0.01 0.17
4 8.4 Somalia 690 <0.01 0.05
7 8.2 Niger 2,290 0.01 0.10
7 8.2 South Sudan 1,380 <0.01 0.13
9 8.0Democratic Republic of the Congo
2,200 0.01 0.03
10 7.9 Angola 27,340 0.08 0.89
10 7.9 Cameroon 8,620 0.03 0.34
10 7.9 Madagascar 3,370 0.01 0.13
10 7.9 Mozambique 6,640 0.02 0.23
14 7.7 Pakistan 208,370 0.61 0.98
CCRI RANK
CCRI SCORE
COUNTRY NAME
C02
EMISSIONS (KT)
PER CENT OF GLOBAL
EMISSIONS (CO2)
EMISSIONS PER CAPITA
(MT)
15 7.6 Afghanistan 7,440 0.02 0.20
15 7.6 Bangladesh 82,760 0.24 0.51
15 7.6 Benin 7,910 0.02 0.69
15 7.6 Burkina Faso 4,270 0.01 0.22
15 7.6 Ethiopia 16,280 0.05 0.15
15 7.6 Sudan 20,200 0.06 0.48
15 7.6 Togo 2,260 0.01 0.29
22 7.5 Côte d’Ivoire 9,910 0.03 0.40
22 7.5 Equatorial Guinea 6,670 0.02 5.10
22 7.5 Liberia 1,320 <0.01 0.27
22 7.5 Senegal 9,860 0.03 0.62
26 7.4 India 2,434,520 7.15 1.80
26 7.4 Sierra Leone 1,020 <0.01 0.13
26 7.4 Yemen 9,310 0.03 0.33
29 7.3 Haiti 3,330 0.01 0.30

Annex 121
CCRI RANK
CCRI SCORE
COUNTRY NAME
C02
EMISSIONS (KT)
PER CENT OF GLOBAL
EMISSIONS (CO2)
EMISSIONS PER CAPITA
(MT)
29 7.3 Mali 5,620 0.02 0.29
31 7.1 Eritrea 800 <0.01 0.23
31 7.1 Myanmar 32,520 0.10 0.61
31 7.1 Philippines 142,240 0.42 1.33
34 7.0 Papua New Guinea 7,460 0.02 0.87
35 6.9Democratic People’s Republic of Korea
18,120 0.05 0.71
35 6.9 Ghana 16,110 0.05 0.54
37 6.8 Gambia 570 <0.01 0.25
37 6.8 Uganda 6,130 0.02 0.14
37 6.8 Viet Nam 257,860 0.76 2.70
40 6.7 China 10,313,460 30.30 7.41
40 6.7Lao People’s Democratic Republic
18,790 0.06 2.66
40 6.7 Malawi 1,570 <0.01 0.09
40 6.7 Mauritania 4,000 0.01 0.91
40 6.7United Republic of Tanzania
11,580 0.03 0.21
45 6.6 Zambia 7,740 0.02 0.45
46 6.5 Cambodia 11,160 0.03 0.69
46 6.5 Indonesia 583,110 1.71 2.18
48 6.4 Congo 3,220 0.01 0.61
49 6.3 Kenya 18,400 0.05 0.36
50 6.2 Thailand 257,860 0.76 3.71
51 6.1 Burundi 590 <0.01 0.05
51 6.1 Nepal 12,030 0.04 0.43
51 6.1 Zimbabwe 12,270 0.04 0.85
54 5.9 Guatemala 18,210 0.05 1.11
54 5.9 Mexico 472,140 1.39 3.74
56 5.8 Djibouti 490 <0.01 0.51
57 5.7 Rwanda 1,080 <0.01 0.09
58 5.6 Egypt 246,260 0.72 2.50
CCRI RANK
CCRI SCORE
COUNTRY NAME
C02
EMISSIONS (KT)
PER CENT OF GLOBAL
EMISSIONS (CO2)
EMISSIONS PER CAPITA
(MT)
59 5.5 Honduras 9,770 0.03 1.02
59 5.5Venezuela (Bolivarian Republic of)
138,160 0.41 4.78
61 5.4 Colombia 79,490 0.23 1.60
61 5.4 Ecuador 39,530 0.12 2.31
61 5.4 Iraq 188,140 0.55 4.90
61 5.4 Lesotho 2,570 0.01 1.22
61 5.4 Malaysia 239,620 0.70 7.60
61 5.4 Morocco 66,680 0.20 1.85
61 5.4 Sri Lanka 21,630 0.06 1.00
61 5.4 Tajikistan 7,330 0.02 0.81
61 5.4 Uzbekistan 112,090 0.33 3.40
70 5.3 Brazil 427,710 1.26 2.04
70 5.3 Iran (Islamic Republic of) 629,290 1.85 7.69
72 5.2 Dominican Republic 25,120 0.07 2.36
72 5.2 Eswatini 1,090 <0.01 0.96
72 5.2 Republic of Korea 630,870 1.85 12.22
72 5.2 Solomon Islands 370 <0.01 0.57
72 5.2 South Africa 433,250 1.27 7.50
77 5.1 El Salvador 6,810 0.02 1.06
77 5.1 Gabon 4,610 0.01 2.18
77 5.1 Namibia 4,250 0.01 1.74
80 5.0Bolivia (Plurinational State of)
22,710 0.07 2.00
80 5.0 Peru 54,280 0.16 1.70
80 5.0 Suriname 2,080 0.01 3.61
80 5.0 United States 4,981,300 14.63 15.24
84 4.8 Albania 5,560 0.02 1.94
84 4.8 Botswana 8,210 0.02 3.64
84 4.8 Guyana 2,440 0.01 3.13
84 4.8 Syrian Arab Republic 27,910 0.08 1.65
88 4.7 Cuba 24,970 0.07 2.20

INTRODUCING THE CHILDREN’S CLIMATE RISK INDEX 122
CCRI RANK
CCRI SCORE
COUNTRY NAME
C02
EMISSIONS (KT)
PER CENT OF GLOBAL
EMISSIONS (CO2)
EMISSIONS PER CAPITA
(MT)
88 4.7 Saudi Arabia 514,600 1.51 15.27
90 4.6 Algeria 151,670 0.45 3.59
90 4.6 Nicaragua 5,210 0.02 0.81
90 4.6 Russian Federation 1,607,550 4.72 11.13
90 4.6 Turkmenistan 71,730 0.21 12.26
94 4.5 Japan 1,106,150 3.25 8.74
94 4.5 Jordan 24,700 0.07 2.48
94 4.5 Kyrgyzstan 11,000 0.03 1.74
97 4.4 Libya 58,940 0.17 8.83
97 4.4 Oman 73,370 0.22 15.19
97 4.4 Turkey 412,970 1.21 5.02
100 4.3 United Arab Emirates 200,300 0.59 20.80
101 4.2 Mongolia 21,320 0.06 6.73
102 4.1 Argentina 177,410 0.52 3.99
102 4.1 France 309,960 0.91 4.62
102 4.1 Italy 324,850 0.95 5.38
102 4.1 Kazakhstan 220,450 0.65 12.06
102 4.1 Republic of Moldova 8,590 0.03 3.17
102 4.1 Romania 74,880 0.22 3.85
108 4.0 Chile 86,620 0.25 4.62
109 3.9 Paraguay 8,420 0.02 1.21
109 3.9 Serbia 45,540 0.13 6.52
111 3.8 Azerbaijan 32,020 0.09 3.22
111 3.8 Belize 680 <0.01 1.78
111 3.8 Bhutan 1,380 <0.01 1.83
111 3.8 Ukraine 185,370 0.54 4.15
111 3.8 United Kingdom 358,800 1.05 5.40
117 3.7 Armenia 5,550 0.02 1.88
117 3.7 Canada 574,400 1.69 15.50
117 3.7 Israel 61,970 0.18 6.98
117 3.7 Spain 258,340 0.76 5.52
121 3.6 Australia 386,620 1.14 15.48
CCRI RANK
CCRI SCORE
COUNTRY NAME
C02
EMISSIONS (KT)
PER CENT OF GLOBAL
EMISSIONS (CO2)
EMISSIONS PER CAPITA
(MT)
121 3.6 Bulgaria 41,130 0.12 5.85
121 3.6 Lebanon 27,710 0.08 4.04
121 3.6 Panama 10,140 0.03 2.43
121 3.6 Tunisia 29,980 0.09 2.59
126 3.5 Poland 312,740 0.92 8.24
127 3.4 North Macedonia 7,370 0.02 3.54
128 3.3 Greece 65,290 0.19 6.08
128 3.3 Kuwait 89,460 0.26 21.62
130 3.2 Belarus 59,310 0.17 6.25
130 3.2 Croatia 16,580 0.05 4.06
130 3.2 Hungary 46,390 0.14 4.75
133 3.1 Bahrain 30,750 0.09 19.59
133 3.1 Qatar 90,170 0.26 32.42
135 3.0 Bosnia and Herzegovina 22,540 0.07 6.78
135 3.0 Portugal 49,780 0.15 4.84
135 3.0 Uruguay 6,520 0.02 1.89
138 2.9 Costa Rica 8,260 0.02 1.65
138 2.9 Slovakia 33,000 0.10 6.06
140 2.7 Montenegro 2,520 0.01 4.05
140 2.7 Netherlands 151,170 0.44 8.77
142 2.6 Georgia 9,460 0.03 2.54
142 2.6 Germany 709,540 2.08 8.56
142 2.6 Latvia 7,630 0.02 3.96
145 2.5 Belgium 93,470 0.27 8.18
145 2.5 Cyprus 7,230 0.02 6.08
147 2.4 Brunei Darussalam 7,140 0.02 16.64
147 2.4 Czechia 102,480 0.30 9.64
147 2.4 Denmark 33,380 0.10 5.76
147 2.4 Lithuania 11,590 0.03 4.14
147 2.4 Switzerland 37,480 0.11 4.40
152 2.3 Slovenia 14,050 0.04 6.77
153 2.2 Liechtenstein 140 0.00 3.69
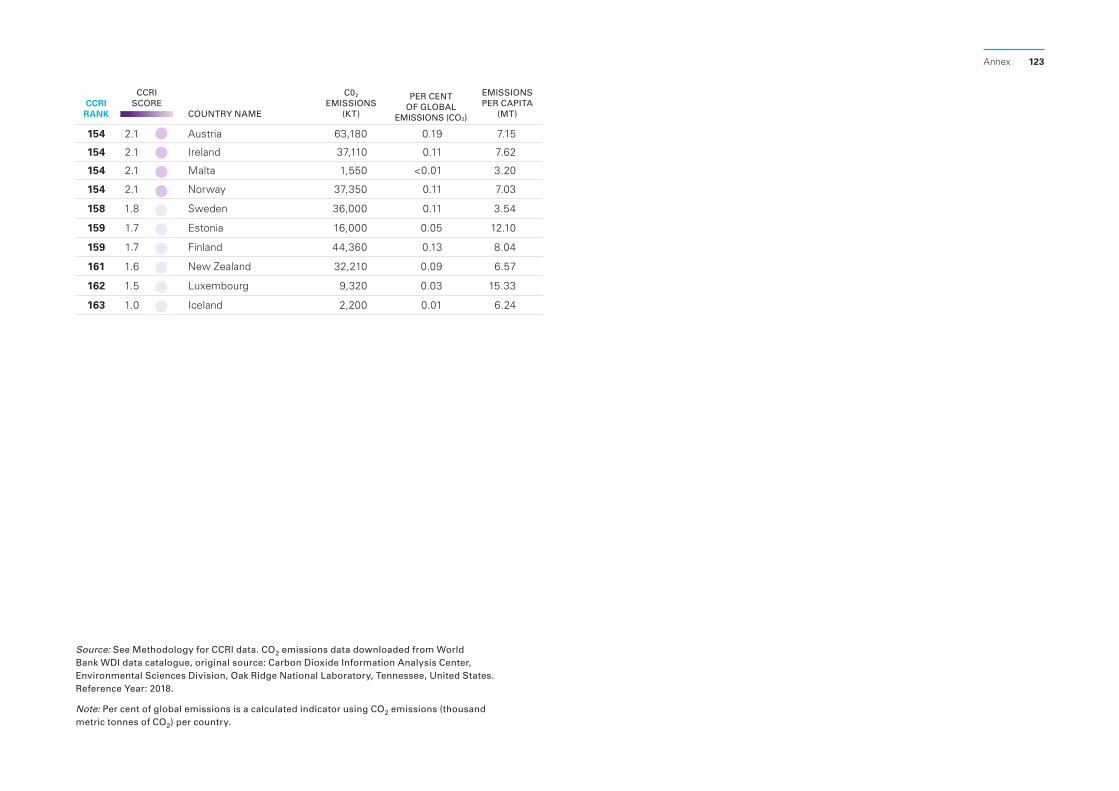
Annex 123
CCRI RANK
CCRI SCORE
COUNTRY NAME
C02
EMISSIONS (KT)
PER CENT OF GLOBAL
EMISSIONS (CO2)
EMISSIONS PER CAPITA
(MT)
154 2.1 Austria 63,180 0.19 7.15
154 2.1 Ireland 37,110 0.11 7.62
154 2.1 Malta 1,550 <0.01 3.20
154 2.1 Norway 37,350 0.11 7.03
158 1.8 Sweden 36,000 0.11 3.54
159 1.7 Estonia 16,000 0.05 12.10
159 1.7 Finland 44,360 0.13 8.04
161 1.6 New Zealand 32,210 0.09 6.57
162 1.5 Luxembourg 9,320 0.03 15.33
163 1.0 Iceland 2,200 0.01 6.24
Source: See Methodology for CCRI data. CO2 emissions data downloaded from World Bank WDI data catalogue, original source: Carbon Dioxide Information Analysis Center, Environmental Sciences Division, Oak Ridge National Laboratory, Tennessee, United States. Reference Year: 2018.
Note: Per cent of global emissions is a calculated indicator using CO2 emissions (thousand metric tonnes of CO2) per country.

Key References:
1. Rockström, J., W. L. Steffen, et al. (24 September 2009), 'A safe operating space for humanity', Nature, 461 (7263): 472–475.
2. Jafino, B. A., B. Walsh, J. Rozenberg, S. Hallegatte (2020), 'Revised estimates of the impact of climate change on extreme poverty by 2030' World Bank Policy Research Working Paper 9417.
3. Global Commission on Adaptation (2018), Adapt Now: A Global Call for Leadership on Climate Resilience'. Global Center on Adaptation and the World Resources Institute.
4. OECD (2017), Investing in Climate, Investing in Growth, OECD Publishing, Paris, https://doi.org/10.1787/9789264273528-en.
5. Cordero E. C., Centeno D., Todd, A. M. (2020), 'The role of climate change education on individual lifetime carbon emissions'. PLoS ONE 15(2): e0206266. https://doi.org/10.1371/journal.pone.0206266.
6. Oppenheimer, M., B. C. Glavovic, J. Hinkel, R. van de Wal, A. K. Magnan, A. Abd-Elgawad, R. Cai, M. Cifuentes-Jara, R. M. DeConto, T. Ghosh, J. Hay, F. Isla, B. Marzeion, B. Meyssignac, and Z. Sebesvari (2019), 'Sea level rise and implications for low-lying islands,
coasts and communities". In: IPCC, Special Report on the Ocean and Cryosphere in a Changing Climate [H.-O. Pörtner, D. C. Roberts, V. Masson-Delmotte, P. Zhai, M. Tignor, E. Poloczanska, K. Mintenbeck, A. Alegría, M. Nicolai, A. Okem, J. Petzold, B. Rama, N. M. Weyer (eds.)]. In press.
7. Church, J. A., P. U. Clark, A. Cazenave, J. M. Gregory, S. Jevrejeva, A. Levermann, M.A. Merrifield, G. A. Milne, R. S. Nerem, P. D. Nunn, A. J. Payne, W. T. Pfeffer, D. Stammer and A.S. Unnikrishnan (2013), 'Sea level change'. In: Climate Change 2013: The Physical Science Basis. Contribution of Working Group I to the Fifth Assessment Report of the Intergovernmental Panel on Climate Change [Stocker, T.F., D. Qin, G.-K. Plattner, M. Tignor, S.K. Allen, J. Boschung, A. Nauels, Y. Xia, V. Bex and P.M. Midgley (eds.)]. Cambridge University Press, Cambridge, UK and New York.
8. IPCC, 2014: Climate Change 2014: Synthesis Report. Contribution of Working Groups I, II and III to the Fifth Assessment Report of the Intergovernmental Panel on Climate Change [Core Writing Team, R. K. Pachauri and L. A. Meyer (eds.)]. IPCC, Geneva.
Please consult the authors for any further required references or citations.

Annex 125

Published by UNICEFDivision of Communication3 United Nations PlazaNew York, NY 10017, USA
Contact: [email protected]
Website: www.unicef.org
For every childWhoever she is.Wherever he lives.Every child deserves a childhood.A future.A fair chance.That’s why UNICEF is there.For each and every child.Working day in and day out.In more than 190 countries and territories. Reaching the hardest to reach.The furthest from help.The most excluded.It’s why we stay to the end.And never give up.
© United Nations Children’s Fund (UNICEF) August 2021