Better investment choice in crisis and after crisis condition
10
1 BETTER INVESTMENT CHOICE IN CRISIS AND AFTER CRISIS: STOCK VERSUS GOLD Eka Darmadi Lim International Business Networking Faculty of Business and Economics, University of Surabaya, Indonesia. Email: [email protected] Liliana Inggrit Wijaya Faculty of Business and Economic, University of Surabaya, Indonesia Email: [email protected] Abstract This research examines two types of investment in Indonesia, which are gold and stock, in two types of economic condition, in Crisis condition and after crisis condition. The purpose of this research is giving more information to investors about the better investment in crisis condition and better investment after crisis condition. In this study the factor are put into a model through statistical test as a normality test, stationarity test, analysis of variance, t-test, and hypothesis test to calculate the higher return between stock and gold in two different economic conditions. This research prove that in crisis condition gold as a better investment compared to stock and after crisis condition stock as a better investment compared to gold. Keywords: Investment, Stock, Gold, Crisis 1. Introduction Better investment choices in crisis and after crisis condition, both of crisis and after crisis conditions are commonly impact the country no matter big country or small country which impact of the crisis can affect countries of economic condition. In crisis condition, investors usually move from the stock investment to the gold investment, for gold known as a “safe haven” for stock. Investor invest money to gain more profit, and tools to help the investor, known as technical analysis especially for predicting the stock price by observing the stock form the stock price history (Fransis, 1988). BEI (Bursa Efek Indonesia) or IDX (Indonesian Stock Exchange) is the Indonesian stock center, IDX provide the regular updates for the investor, through digital media or printed media, to inform the investor about the current stock price in the market. In IDX Indices: LQ-45 (Liquid 45), JII (Jakarta Islamic Index), and KOMPAS 100, represent the overall stock performance in Indonesia Stock Exchange. Pure gold bar 24Carat as a good gold investment, and one of the most popular investment is the pure gold bar 24Carat, as a variety pure gold bar 100 grams, 500 grams, 1 Kilo. Gold as a hedge against the inflation, but gold have own inherent value that protect against the inflation. (Martin Feldstein, 2009). In crisis period, investor sees more value on gold when investors lose confidence of stock market (for stock market return in crisis is negative) (Lujia Wang, 2012). Indonesia economic overview, the statement come from BI (Bank Indonesia) says: the fallout from the crisis began to take hold towards the end of 2008, in Q3/2008. Based on prior research about Indonesian crisis, Indonesia suffers the impact of crisis start from October 2008 until July 2009. (Ristanti A, 2012). The problem of formulation, is stock a better investment in crisis period? Is gold a better investment in crisis period? Is stock a better investment after crisis period? Is gold a better
Transcript of Better investment choice in crisis and after crisis condition

1
BETTER INVESTMENT CHOICE IN CRISIS AND AFTER CRISIS:
STOCK VERSUS GOLD
Eka Darmadi Lim
International Business Networking
Faculty of Business and Economics, University of Surabaya, Indonesia.
Email: [email protected]
Liliana Inggrit Wijaya Faculty of Business and Economic, University of Surabaya, Indonesia
Email: [email protected]
Abstract
This research examines two types of investment in Indonesia, which are gold and stock, in two types
of economic condition, in Crisis condition and after crisis condition. The purpose of this research is
giving more information to investors about the better investment in crisis condition and better
investment after crisis condition. In this study the factor are put into a model through statistical test
as a normality test, stationarity test, analysis of variance, t-test, and hypothesis test to calculate the
higher return between stock and gold in two different economic conditions. This research prove that
in crisis condition gold as a better investment compared to stock and after crisis condition stock as a
better investment compared to gold.
Keywords: Investment, Stock, Gold, Crisis
1. Introduction
Better investment choices in crisis and after crisis condition, both of crisis and after crisis
conditions are commonly impact the country no matter big country or small country which impact of
the crisis can affect countries of economic condition. In crisis condition, investors usually move
from the stock investment to the gold investment, for gold known as a “safe haven” for stock.
Investor invest money to gain more profit, and tools to help the investor, known as technical
analysis especially for predicting the stock price by observing the stock form the stock price history
(Fransis, 1988).
BEI (Bursa Efek Indonesia) or IDX (Indonesian Stock Exchange) is the Indonesian stock
center, IDX provide the regular updates for the investor, through digital media or printed media, to
inform the investor about the current stock price in the market. In IDX Indices: LQ-45 (Liquid 45),
JII (Jakarta Islamic Index), and KOMPAS 100, represent the overall stock performance in Indonesia
Stock Exchange. Pure gold bar 24Carat as a good gold investment, and one of the most popular
investment is the pure gold bar 24Carat, as a variety pure gold bar 100 grams, 500 grams, 1 Kilo.
Gold as a hedge against the inflation, but gold have own inherent value that protect against the
inflation. (Martin Feldstein, 2009). In crisis period, investor sees more value on gold when investors
lose confidence of stock market (for stock market return in crisis is negative) (Lujia Wang, 2012).
Indonesia economic overview, the statement come from BI (Bank Indonesia) says: the
fallout from the crisis began to take hold towards the end of 2008, in Q3/2008. Based on prior
research about Indonesian crisis, Indonesia suffers the impact of crisis start from October 2008 until
July 2009. (Ristanti A, 2012).
The problem of formulation, is stock a better investment in crisis period? Is gold a better
investment in crisis period? Is stock a better investment after crisis period? Is gold a better
2
investment after crisis period? For the stock and gold performance is quite different (negative
correlation), if the stock price decreasing in crisis condition, the gold price moving in higher level,
but after the crisis condition, the stock price increasing and the gold price decreasing.
The purpose of this research, to give more evidence to the reader about stock and gold, how
to decide the better investment choice in crisis and after crisis for this research also discover about
how the stock performance in crisis and how the stock performance after crisis, also the pure gold
bar. The researcher compares the gold in crisis and the gold after crisis.
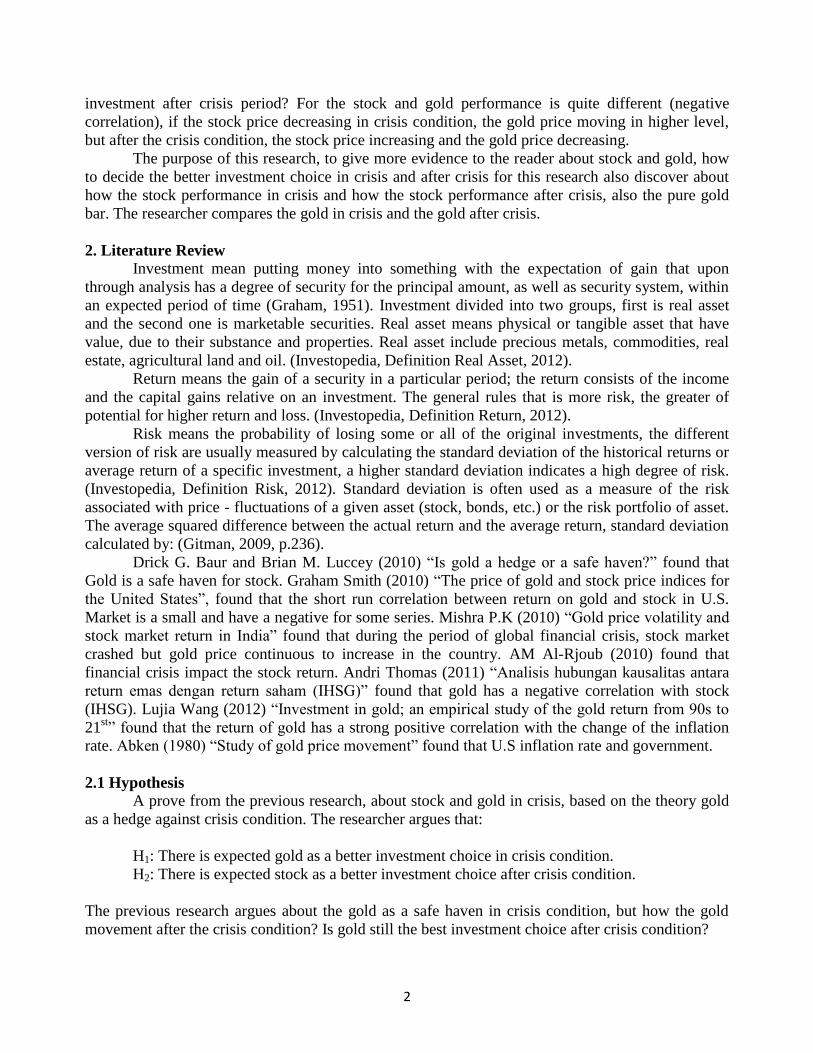
2. Literature Review
Investment mean putting money into something with the expectation of gain that upon
through analysis has a degree of security for the principal amount, as well as security system, within
an expected period of time (Graham, 1951). Investment divided into two groups, first is real asset
and the second one is marketable securities. Real asset means physical or tangible asset that have
value, due to their substance and properties. Real asset include precious metals, commodities, real
estate, agricultural land and oil. (Investopedia, Definition Real Asset, 2012).
Return means the gain of a security in a particular period; the return consists of the income
and the capital gains relative on an investment. The general rules that is more risk, the greater of
potential for higher return and loss. (Investopedia, Definition Return, 2012).
Risk means the probability of losing some or all of the original investments, the different
version of risk are usually measured by calculating the standard deviation of the historical returns or
average return of a specific investment, a higher standard deviation indicates a high degree of risk.
(Investopedia, Definition Risk, 2012). Standard deviation is often used as a measure of the risk
associated with price - fluctuations of a given asset (stock, bonds, etc.) or the risk portfolio of asset.
The average squared difference between the actual return and the average return, standard deviation
calculated by: (Gitman, 2009, p.236).
Drick G. Baur and Brian M. Luccey (2010) “Is gold a hedge or a safe haven?” found that
Gold is a safe haven for stock. Graham Smith (2010) “The price of gold and stock price indices for
the United States”, found that the short run correlation between return on gold and stock in U.S.
Market is a small and have a negative for some series. Mishra P.K (2010) “Gold price volatility and
stock market return in India” found that during the period of global financial crisis, stock market
crashed but gold price continuous to increase in the country. AM Al-Rjoub (2010) found that
financial crisis impact the stock return. Andri Thomas (2011) “Analisis hubungan kausalitas antara
return emas dengan return saham (IHSG)” found that gold has a negative correlation with stock
(IHSG). Lujia Wang (2012) “Investment in gold; an empirical study of the gold return from 90s to
21st” found that the return of gold has a strong positive correlation with the change of the inflation
rate. Abken (1980) “Study of gold price movement” found that U.S inflation rate and government.
2.1 Hypothesis
A prove from the previous research, about stock and gold in crisis, based on the theory gold
as a hedge against crisis condition. The researcher argues that:
H1: There is expected gold as a better investment choice in crisis condition.
H2: There is expected stock as a better investment choice after crisis condition.
The previous research argues about the gold as a safe haven in crisis condition, but how the gold
movement after the crisis condition? Is gold still the best investment choice after crisis condition?

3
3. Research Method
3.1 Sample
Sample were taken from Indonesian Stock Exchange (IDX) represented stock by three stock
indicates first LQ-45, JII (Jakarta Islamic Index) and KOMPAS 100, samples for gold category,
researcher pick pure gold bar 24 carat. LQ-45 Index consist of 45 most liquid common stock listed
on IDX that have been chosen and scrutinized the following criteria (1) the selection process started
by selecting top 60 common stock with highest average transactions value in regular market for the
last 12 months and many criteria. JII Index also known as Jakarta Islamic Index expected become a
benchmark of the performance of stock that related to Islamic law. KOMPAS 100 index is a share
index from 100 shares of a public company traded on Indonesia Stock Exchange. Gold is a chemical
element with the symbol Au and atomic number of 79, Gold is dense, soft, shiny metal and the most
malleable and ductile metal known.
3.2 Data Collection
Data were collected from the secondary data, the data of stock prices and gold prices
available in internet. Stock Index LQ45, JII, KOMPAS100 taken from (Yahoo! Finance) and GOLD
price taken from (gold.org). Stock Index and gold price interval of daily and day by day movement
time series model. Gold price from (gold.org) give the data of U.S. market (USD). Researcher
converts the USD to IDR by adding USD to IDR foreign exchange currency taken from
(oranda.com).
3.3 Analysis Method
Prologue of the test in this research, first normality test to test the data in this research as a
normal distributed data, after the data tested with normality test, stationarity test is needed in this
research for stationarity test needed in time series model, third test is analysis of variance to test the
different between group such as stock and gold, the last test is t-test to calculate the different
between two sample, t-test used to compare the actual difference between two means in relation to
the variation in the data. 3rd
party software such as: Eviews can be used for this research to calculate
the normality test and stationarity test, the other program SPSS can be used in this research to
calculate the ANOVA and t-test. ANOVA and t-test show significant value if sig < 5% (0.005).
Return in this research calculated with:
Rt = Return “Variable” during period t
Pt = Price (Value) of “Variable” at time t
P(t-1) = Price (Value) of “Variable” at time t – 1
ANOVA (Analysis of Variance) a logarithmic transformation the data use to non-parametric
statistic:
= Return (Stock and Gold)
= Constant
= Finding in this research

4
= Error
t-test formula:
√
= Average of return (Data 1)
= Average of return (Data 2)
= Research Question
= Standard Differentiation
= Number of data (Data 1)
= Number of data (Data 2)
3.4 Hypothesis Test
Hypothesis (1)
“There is expected Gold as a better investment choice in crisis condition”
Hypothesis (2)
“There is expected Stock as a better investment choice after crisis condition”
Criteria Not Rejected if Sig > 5%, Rejected if Sig < 5%
= Hypothesis one “There is expected gold as a better investment in crisis condition”
accepted if the Gold mean bigger compared to stock LQ-45 or JII or KOMPAS 100
= Hypothesis two “There is expected stock as a better investment in after crisis
condition” accepted if the stock mean bigger compared to gold. LQ-45 > Gold, or JII >
Gold, or KOMPAS 100 > Gold.
4. Result and Discussion
Number observation in this research were 350 observations, consist of 175 observations in
crisis condition and 175 observations after crisis condition. Crisis period in this research start from
October,06,2008 – July,31,2009 and after crisis period start from February,01,2010 –
November,22,2010.
4.1 Statistical Inferential
4.1.1 Normality Test
Table 1 show about the normality test in crisis period, using Jarque-Bera method shows the
number of LQ45: 7.8905; JII: 66.54468; KOMPAS100: 122.6809; GOLD: 111.78. Adding the
central limit theory by Gujarati, Central Limit Theorem can be shown by a large number (n>30) of
5
independent and identically distributed random variables and then with little expectation, the
distribution identically distributed of their sum tends to a normal distribution. (Gujarati, 1995).
Table 2 show about the normality test in after crisis period, using Jarque-Bera method shows
the number of LQ45: 9.4729; JII: 1027.601; KOMPAS100: 730.988; GOLD: 635.6497. Adding the
central limit theory by Gujarati, Central Limit Theorem can be shown by a large number (n> 30) of
independent and identically distributed random variables and then with little expectation, the
distribution identically distributed of their sum tends to a normal distribution. (Gujarati, 1995).
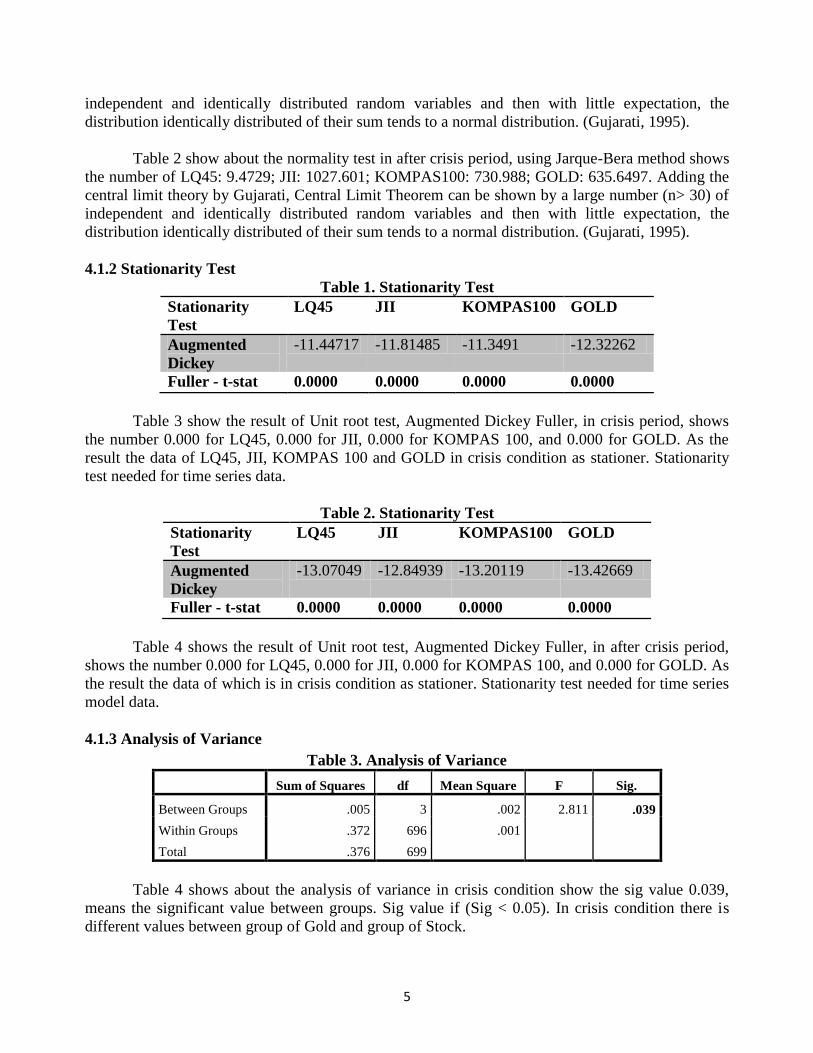
4.1.2 Stationarity Test
Table 1. Stationarity Test
Stationarity
Test
LQ45 JII KOMPAS100 GOLD
Augmented
Dickey
-11.44717 -11.81485 -11.3491 -12.32262
Fuller - t-stat 0.0000 0.0000 0.0000 0.0000
Table 3 show the result of Unit root test, Augmented Dickey Fuller, in crisis period, shows
the number 0.000 for LQ45, 0.000 for JII, 0.000 for KOMPAS 100, and 0.000 for GOLD. As the
result the data of LQ45, JII, KOMPAS 100 and GOLD in crisis condition as stationer. Stationarity
test needed for time series data.
Table 2. Stationarity Test
Stationarity
Test
LQ45 JII KOMPAS100 GOLD
Augmented
Dickey
-13.07049 -12.84939 -13.20119 -13.42669
Fuller - t-stat 0.0000 0.0000 0.0000 0.0000
Table 4 shows the result of Unit root test, Augmented Dickey Fuller, in after crisis period,
shows the number 0.000 for LQ45, 0.000 for JII, 0.000 for KOMPAS 100, and 0.000 for GOLD. As
the result the data of which is in crisis condition as stationer. Stationarity test needed for time series
model data.
4.1.3 Analysis of Variance
Table 3. Analysis of Variance
Sum of Squares df Mean Square F Sig.
Between Groups .005 3 .002 2.811 .039
Within Groups .372 696 .001
Total .376 699
Table 4 shows about the analysis of variance in crisis condition show the sig value 0.039,
means the significant value between groups. Sig value if (Sig < 0.05). In crisis condition there is
different values between group of Gold and group of Stock.
6
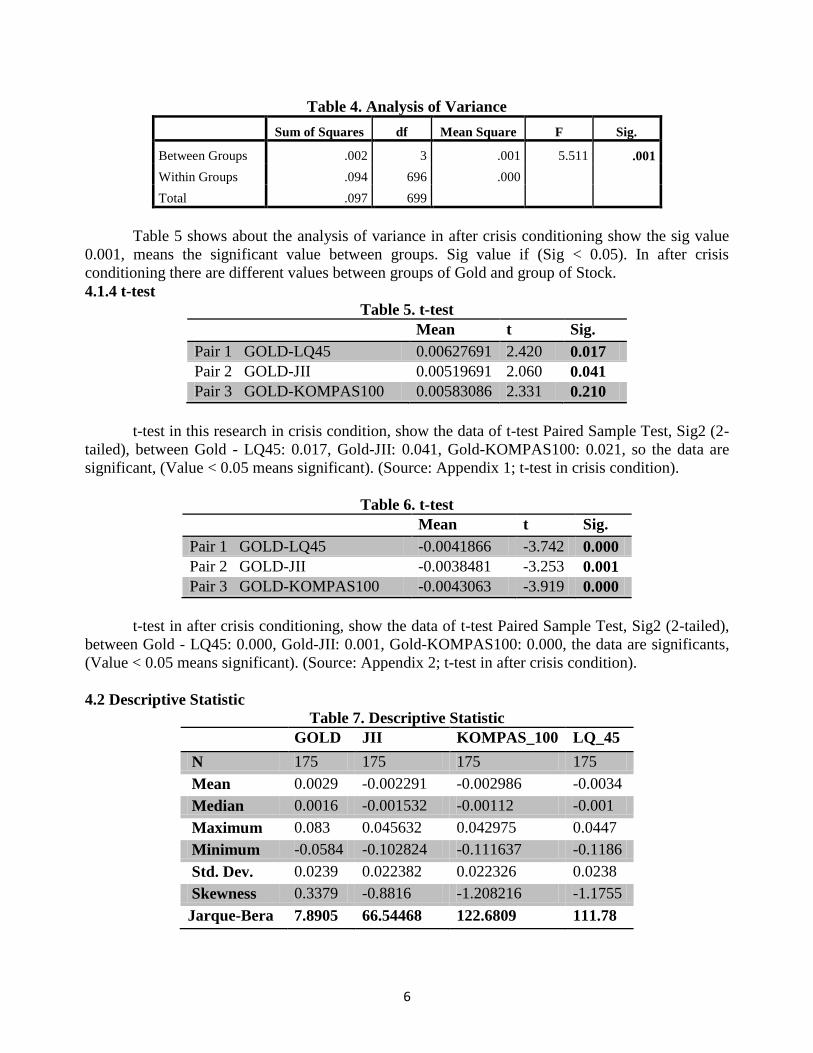
Table 4. Analysis of Variance
Sum of Squares df Mean Square F Sig.
Between Groups .002 3 .001 5.511 .001
Within Groups .094 696 .000
Total .097 699
Table 5 shows about the analysis of variance in after crisis conditioning show the sig value
0.001, means the significant value between groups. Sig value if (Sig < 0.05). In after crisis
conditioning there are different values between groups of Gold and group of Stock.
4.1.4 t-test
Table 5. t-test
Mean t Sig.
Pair 1 GOLD-LQ45 0.00627691 2.420 0.017
Pair 2 GOLD-JII 0.00519691 2.060 0.041
Pair 3 GOLD-KOMPAS100 0.00583086 2.331 0.210
t-test in this research in crisis condition, show the data of t-test Paired Sample Test, Sig2 (2-
tailed), between Gold - LQ45: 0.017, Gold-JII: 0.041, Gold-KOMPAS100: 0.021, so the data are
significant, (Value < 0.05 means significant). (Source: Appendix 1; t-test in crisis condition).
Table 6. t-test
Mean t Sig.
Pair 1 GOLD-LQ45 -0.0041866 -3.742 0.000
Pair 2 GOLD-JII -0.0038481 -3.253 0.001
Pair 3 GOLD-KOMPAS100 -0.0043063 -3.919 0.000
t-test in after crisis conditioning, show the data of t-test Paired Sample Test, Sig2 (2-tailed),
between Gold - LQ45: 0.000, Gold-JII: 0.001, Gold-KOMPAS100: 0.000, the data are significants,
(Value < 0.05 means significant). (Source: Appendix 2; t-test in after crisis condition).
4.2 Descriptive Statistic
Table 7. Descriptive Statistic
GOLD JII KOMPAS_100 LQ_45
N 175 175 175 175
Mean 0.0029 -0.002291 -0.002986 -0.0034
Median 0.0016 -0.001532 -0.00112 -0.001
Maximum 0.083 0.045632 0.042975 0.0447
Minimum -0.0584 -0.102824 -0.111637 -0.1186
Std. Dev. 0.0239 0.022382 0.022326 0.0238
Skewness 0.3379 -0.8816 -1.208216 -1.1755
Jarque-Bera 7.8905 66.54468 122.6809 111.78
7
Table 1 show, descriptive statistic for variable used in this research. Gold variable has
median 0.0029, JII has median -0.002291, KOMPAS100 has median -0.002986, and LQ45 has
median -0.0034. Table 1 show the condition of crisis period. Gold return has the bigger value in
skewness compared with other variable in crisis condition.
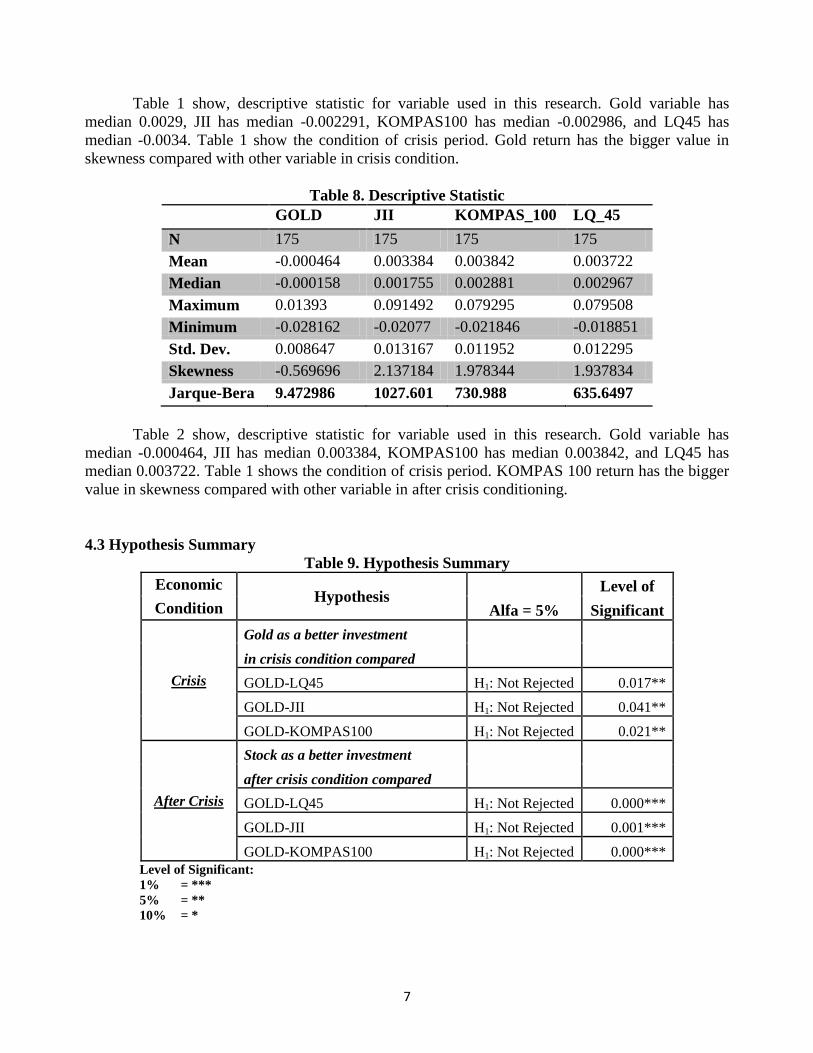
Table 8. Descriptive Statistic
GOLD JII KOMPAS_100 LQ_45
N 175 175 175 175
Mean -0.000464 0.003384 0.003842 0.003722
Median -0.000158 0.001755 0.002881 0.002967
Maximum 0.01393 0.091492 0.079295 0.079508
Minimum -0.028162 -0.02077 -0.021846 -0.018851
Std. Dev. 0.008647 0.013167 0.011952 0.012295
Skewness -0.569696 2.137184 1.978344 1.937834
Jarque-Bera 9.472986 1027.601 730.988 635.6497
Table 2 show, descriptive statistic for variable used in this research. Gold variable has
median -0.000464, JII has median 0.003384, KOMPAS100 has median 0.003842, and LQ45 has
median 0.003722. Table 1 shows the condition of crisis period. KOMPAS 100 return has the bigger
value in skewness compared with other variable in after crisis conditioning.
4.3 Hypothesis Summary
Table 9. Hypothesis Summary
Economic Hypothesis
Level of
Condition Alfa = 5% Significant
Crisis
Gold as a better investment
in crisis condition compared
GOLD-LQ45 H1: Not Rejected 0.017**
GOLD-JII H1: Not Rejected 0.041**
GOLD-KOMPAS100 H1: Not Rejected 0.021**
After Crisis
Stock as a better investment
after crisis condition compared
GOLD-LQ45 H1: Not Rejected 0.000***
GOLD-JII H1: Not Rejected 0.001***
GOLD-KOMPAS100 H1: Not Rejected 0.000***
Level of Significant:
1% = ***
5% = **
10% = *
8
4.4 Conclusion
According to the result, first gold as a better investment choice in crisis condition, based on
the research of return base on daily of stock (LQ-45, JII, KOMPAS 100) and world pure gold price
24 carat, the period from October, 06, 2008 until July, 27, 2009. Each of variable (LQ-45, JII,
KOMPAS 100, GOLD) researcher use 700 samples, LQ-45: 175 samples, JII: 175 samples,
KOMPAS 100: 175 samples, GOLD: 175 samples. In this research, researcher used Analysis of
Variance (ANOVA), t-test (paired-sample t-test), stationrarity test using Augmented Dicky Fuller
method, and normality test using Jarque-Bera test.
Normality test shows that the data of LQ-45, JII, KOMPAS 100, GOLD in crisis period from
October, 06, 2008 until July, 27, 2009, about 700 samples total, shows for each LQ-45, JII,
KOMPAS 100, GOLD is not normally distributed data, and the researcher used the Central Limit
Theorem to normalize the data distribution, and the result of the data normally distributed. The
result from ANOVA test in crisis period show the mean of return stock (LQ-45, JII, KOMPAS 100),
show the negative value, and gold return in crisis period show the positive value, ANOVA test sig
show 0.039 = significant. t-test, paired sample test sig (2-tailed) show the number between GOLD-
LQ45: 0.017, GOLD-JII: 0.41, GOLD-KOMPAS100: 0.21, the value < 0.05 = significant. And the
result proves gold as a better investment in crisis condition compared to the stock (LQ-45, JII,
KOMPAS 100). As a result form H1: not rejected.
Second conclusion stock ( LQ-45, JII, KOMPAS 100 ) as a better investment choice in after
crisis condition, based on the research of return base on daily of stock (LQ-45, JII, KOMPAS 100)
and world pure gold price 24 carat, the period from February, 01, 2010 until November, 22, 2010.
Each of variables (LQ-45, JII, KOMPAS 100, GOLD) researcher used 700 samples, LQ-45: 175
samples, JII: 175 samples, KOMPAS 100: 175 samples, GOLD: 175 samples. In this research, the
researcher use Analysis of Variance (ANOVA), t-test (paired-samples t-test), stationrarity test using
Augmented Dicky Fuller method, and normality test using Jarque-Bera test.
Normality test shows that the data of LQ-45, JII, KOMPAS 100, GOLD in crisis period from
February, 01, 2010 until November, 22, 2010, about 700 samples total, shows for each LQ-45, JII,
KOMPAS 100, GOLD is not normally distributed data, and the researcher use the Central Limit
Theorem to normalize the data distribution, and the result of the data normally distributed. The
result from ANOVA test after crisis period show the mean of return stock (LQ-45, JII, KOMPAS
100) show the positive value, and gold return after crisis period show the negative value, ANOVA
test sig show 0.001 = significant. t-test, paired samples test sig (2-tailed) show the number between
GOLD-LQ45: 0.000, GOLD-JII: 0.001, GOLD-KOMPAS100: 0.000, the value < 0.05 = significant.
So the result proves stock (LQ-45, JII, KOMPAS 100, GOLD) as a better investment after crisis
conditioning compared for gold investment. as a result from H1: not rejected.
References
AM AL-Rjoub, Hussam Azzam, 2010, Financial Crises, Stock Return and Volatility in an
Emerging Stock Market: The Case of Jordan, The Journal of Economic Studies, May
2010
Andri Thomas, 2011, Hubungan Kasualitas Antara Return Emas Dengan Return Saham
(IHSG) pada periode 2007 – Oktober 2011, unpublished, Universitas Surabaya.
Bank Indonesia, 2008 Economy Report on Indonesia, 2008, Book. Page 14
Drick G & Brian M, 2010, Is Gold a Hedge or a safe heaven? An analysis of Stock, Bonds and
Gold. The Journal of Economic.

9
Evrillia Devi, 2011, Prediktibilitas Ratio Keuangan Terhadap Peringkat Obligasi Korporasi,
unpublish, Universitas of Surabaya.
Fisher, N. I., & Hall, G. 1969, Risk and Corporate Rates of Return, Quarterly. Journal of
Economics, 83, 79-92.
Gitman, J Lawrence, Principles of Managerial Finance, 12th
Edition, Pearson International Edition,
p.228, Book.
Graham Smith, 2001, The Price of Gold and Stock Price Indices for the United States, Journal of
economic.
Gujarati, Damodar N, 1995, Basic Econometrics, 3rd
Edd, Mc Graw-Hill International Editions,
Book.
Indonesia Stock Exchange, 2010, Buku Panduan INDEKS HARGA SAHAM BURSA EFEK
INDONESIA, Book.
Lujia Wang, 2012, Investment in Gold (An Empirical Study of the Gold Return Form 90s
to 21st), Working Paper, Copenhagen Business School.
Mishra, P.K., Das J.R, Mishra S.K, 2010, Gold Price Volatility and Stock Market Returns in India,
Journal of Scientific Research, Siksha O Anusandhan University, India.
Ristanti A, 2012, Pengaruh Ekonomi Makro Indonesia Terhadap Pasar Modal Indonesia
Periode 2002 – 2009 sebelum dan saat krisis gobal, unpublish, University of Surabaya.
http://finance.yahoo.com/q?s=%5EJKLQ45 – Downloaded November, 05, 2012.
http://goldprice.org/gold-prices/ - Downloaded November, 05, 2012.

10