Better Everyday - JSW Steel
416
Better Everyday Integrated Report 2017-18
-
Upload
khangminh22 -
Category
Documents
-
view
0 -
download
0
Transcript of Better Everyday - JSW Steel

Better Everyday
Integrated Report 2017-18


Better Everyday. In Pursuit of Excellence.
1 About this Report
Corporate Overview2 Better Everyday. In Pursuit Of Excellence.
Best Ever Annual Performance
3 The Six Capitals Driving JSW Steel
6 Corporate Overview & Vision, Mission, Values
8 Value Chain
9 Geographic Presence
10 Product Portfolio
12 Project Showcase
14 Chairman and Managing Director’s Message
18 Key performance indicators
20 Value-Creation Model
22 Stakeholder Engagement and Materiality
24 Business Environment
26 Strategic Focus Areas and Enablers
30 Risk Management
32 Value-creation by the Capitals
34 Financial Capital
40 Manufactured Capital
46 Human Capital
54 Intellectual Capital
60 Social and Relationship Capital
66 Natural Capital
72 Board of Directors
76 Corporate Governance Framework
78 CSR @ JSW Steel
80 Assurance Statement
83 Business Responsibility Reports
86 Mapping the Principles of the National Voluntary Guidelines
89 Mapping the UN SDGs and the Capitals
90 GRI Index
Statutory Reports94 Management Discussion and Analysis
130 Directors' Report
184 Report of Corporate Governance
Financial Statements216 Standalone Financials
301 Consolidated Financials
About this ReportContents
JSW Steel Ltd. (JSW Steel) has been disclosing its financial and non-financial performance in accordance with leading national and global frameworks, both statutory and voluntary. These include reporting requirements under the Companies Act, 2013, Securities and Exchange Board of India (Listing Obligations and Disclosure Requirements), Indian Accounting Standard (IndAS), the Global Reporting Initiative (GRI) Standards, the National Voluntary Guidelines (NVGs) for Business Responsibility Reporting (BRR), UN Sustainable Development Goals (UN SDGs), Carbon Disclosure Project (CDP) and Worldsteel Association, among others. The financial year 2017-18 marks an important milestone in the Company’s corporate reporting journey as it has adopted Integrated Reporting to inform stakeholders about its value creation by focussing on the six ‘capitals’. With the aim to provide an insight into this value creation process, JSW Steel is pleased to present its maiden Integrated Report, which captures the Company’s performance in accordance with the Integrated Reporting framework for the period April 1, 2017, to March 31, 2018.
The content of the report has been reviewed by the Company’s Senior Management, under the guidance of the Board. This has ensured accuracy and completeness of the information disclosed in this report.
Reporting FrameworkThe non-financial section of the report is based on the Integrated
Reporting <IR> framework of the International Integrated Reporting
Council (IIRC) as well as the GRI Standards. The statutory and financial
section of the report is in line with the requirements of the Companies
Act, 2013 (including the rules made thereunder), Indian Accounting
Standards, the Securities and Exchange Board of India (Listing
Obligations and Disclosure Requirements) Regulations, 2015, and the
Secretarial Standards.
Reporting BoundaryThe information contained in this integrated report pertains to JSW Steel,
including its national and international subsidiaries, joint ventures and
associate companies. However, non-financial information is limited to
the Company’s major manufacturing operations in India.
Independent AssuranceThe financial statements presented in the report have been audited by S R B C & Co. LLP and the non-financial information disclosed under IR has been independently assured by Deloitte Haskins and Sells LLP.
Please find the online version at: www.jsw.in
For more information, please write to [email protected]

JSW Steel Limited | Integrated Report 2017-18
2
FY18: Best Ever Annual Performance
16.27 MnTCrude steel production – highest ever in a year
3%
14,794 ` CROREOperating EBITDA
22%
15.55 MnTSaleable steel sales
6%
6,113 ` CRORENet profit after tax
76%
71,503` CRORERevenue from operations
18%
25.71` Diluted earnings per share
76%
Better Everyday. In Pursuit of Excellence.Excellence is not a state, but a journey. It is the combination of relentless efforts to become
better and do better, every day.
At JSW steel Limited (JSW Steel), exploring newer and improved ways of maintaining
leadership across everything we do is intrinsic to us. Be it steel production, community
empowerment, environmental initiatives or continuous innovation, we achieve the best and
strive to make it better.
Over the years, JSW Steel has grown to be the market leader in the Indian steel industry,
with strategic international presence. We have overcome dynamic market conditions and
challenging demand-supply equations to lead from the front. This has been accomplished
through the over-arching guiding philosophy of the Group – that of becoming
‘Better Everyday’.
Looking ahead, we have planned a capex of ~H40,000 crore over FY19 and FY21 to increase
capacity to 24.7 MTPA, modernise and expand our downstream facilities and to facilitate
strategic backward integration projects to achieve cost reduction. Additionally, we will
pursue strategic growth across high-margin areas; further diversify our product suite
and customer base; achieve full integration across our business; drive optimum resource
utilisation; adopt prudent financial management; and ensure sustainability across all
functions of our business.
At JSW Steel, with a successful run at present and a positive outlook ahead, ‘Better Everyday’ is our motivation to race against ourselves in striving for excellence. It is our way of life.
y-o-y growth

Better Everyday. In Pursuit of Excellence. Corporate Overview Statutory Reports Financial Statements
3
91% Capacity Utilisation
Includes resources such as iron ore, coal and other minerals along with air, water, energy land and biodiversity, which are either utilised by the Company or impacted by its operations.
Natural Capital
2.59 TCO2/TCSSpecific Greenhouse Gas Emissions
Pertains to the facilities for steel production and processing, including the structures and equipment at the plants, along with supporting infrastructure for logistics, warehousing and sales.
Refers to the funds available to the Company to create value utilisation in asset creation and production processes, or funds generated by its operations. These include debt, equity, revenue, internal accruals and investments, among others.
Refers to the trust-based, mutually beneficial relationships of the Company with key stakeholders such as investors, customers, vendors, society and government, among others.
The Six Capitals Driving JSW Steel
Social and Relationship Capital
Given below is a brief introduction of the six capitals as applicable to JSW Steel
Financial Capital
16%ROCE
Manufactured Capital
61 ` CRORE CSR Expenditure
Better Everyday. In Pursuit of Excellence.
Page 66Page 60
Includes the skills, capabilities, experience, diversity and level of motivation of the on-roll and contractual employees along with their safety, wellbeing and the ability to align with the organisation’s vision.
Human Capital
37 Training Hours Per Employee
Page 46
Covers the knowledge base of the organisation, and includes the systems, processes, patents, trademarks, copyrights and new value-added products developed through R&D, improvement initiatives and collaboration with institutions.
16 New Patents Filed
Intellectual Capital
Page 54
Page 40Page 34
Includes the skills, capabilities, experience, diversity and level of motivation of the on-roll and contractual employees along with their safety, wellbeing and the ability to align with the organisation’s vision.
Human Capital
37 Training Hours Per Employee
Page 46

JSW Steel Limited | Integrated Report 2017-18
4
Corporate Overview & Vision, Mission, Values
JSW Steel at a Glance
Better Everyday. In Pursuit of Excellence. Corporate Overview Statutory Reports Financial Statements
5
Value Chain
Geographic Presence
Product Portfolio
ProjectPortfolio

JSW Steel Limited | Integrated Report 2017-18
6
Corporate Overview
JSW STEEL IS INDIA'S LEADING INTEGRATED STEELMANUFACTURER WITH A CAPACITY OF 18 MTPA
JSW Steel is the flagship company of the JSW Group, a
$13 billion-worth leading Indian conglomerate. It is the most efficient
steel producer in India and has the ability to expand capacities at
lower costs. The Company has one of the lowest conversion costs
in the steel industry and is constantly striving to further improve this
metric. JSW Steel is also among the fastest-growing companies in
India and has a strong track record on project execution.
The Company has maintained its leadership position in the country
by constantly enhancing its technological capabilities. It has a
diversified workforce of 11,619 permanent employees across all its
plants.
VISION
BRING POSITIVE TRANSFORMATION TO EVERY LIFE WE TOUCH
8,600+ Retail outlets till date
5 Iron ore mines owned ensuring seamless availability of raw material
PURPOSE
• BUILDING WORLD-CLASS INFRASTRUCTURE, PRODUCTS AND SOLUTIONS
• DEPLOYING WORLD-CLASS CAPABILITIES
• NURTURING OUR COMMUNITIES
• CONFIDENCE
VALUES
CONFIDENCE
COURAGE
COMMITMENT
COMPASSION
COLLABORATION
650,000 Beneficiaries of CSR activities
7 Manufacturing facilities in India

Better Everyday. In Pursuit of Excellence. Corporate Overview Statutory Reports Financial Statements
7
Transformational Journey to Market Leadership
World Steel Demand (MnT)
India Steel Demand (MnT)
Capacity (MTPA)
Production (MnT)
Revenue (H crore)
EBITDA (H crore)
Net Debt (H crore)
Net Debt to EBITDA
Net Worth (H crore)
Market Capitalisation (H crore)
CAGRFY18FY02
771 (CY 2001)
27
1.6
1.3
1,736
281
5,584
19.87
268
528
1,588 (CY 2017)
91
18
16.3
70,225
14,794
38,019
2.57
27,534
69,652
5%
8%
16%
17%
26%
28%
—
—
34%
132xincrease in market value (1)
(1) From March 31, 2002 to March 31, 2018

JSW Steel Limited | Integrated Report 2017-18
8
RawMaterials
Inbound Logistics
Value Chain
Manufacturing
Outbound Logistics
ProcessingUse
Recycling
• Optimise mix and sourcing of key inputs like iron ore and coal to weather a volatile pricing environment
• Explore various contract options like long-term/spot/indexing
• Backward integration through acquisition of iron ore mines
• Highly diversified portfolio
• Focus on innovation and new value-added product development
• Joint venture agreement with Marubeni-Itochu Steel Inc., Tokyo, to set up contemporary steel processing centres
• Recycling of steel scrap• Increase in recycling of water • Supply of recycled water for irrigation in water-starved regions around the operations
Reducing environmental footprint and demand for virgin resources
• Modal shift: 80% of finished products transported via rail/sea
• Centrally integrated• Last-mile connectivity
tracking using digital technologies
• Modal shift: 80% of raw material transported via rail/sea
• Centralised logistics cell to ensure end-to-end integration
• Optimisation of infrastructure spend
• State-of-the-art manufacturing facilities set up
• Installation of latest technology to reduce consumption of water in operations
• Energy management through waste heat and gas recovery
1st Phase 2nd Phase 3rd Phase
• Hot rolled steel: Construction and infrastructure, industrial and engineering, pipes and tubes, automotive and energy sectors
• Cold rolled steel: Automotive and, industrial and engineering sectors
• Electrical steel: Electric motors, generators, nuclear power stations and power plants, among others
• Galvanised steel: Construction and infrastructure and consumer durables sectors
• Colour coated steel: Construction and infrastructure, and consumer durables sectors
4th Phase5th Phase6th Phase
7th Phase
Capitals involved
Enabling production of steel at competitive rates, safeguarding and increasing market share, thereby generating value for shareholders
Developing 73 new grades with a 13% increase in sales of value-added and special products
Higher reliability in dispatching, better monitoring of logistics, cost optimisation and improved supply chain efficiencies
Forming the backbone of the Indian economy and enabling growth of core sectors
Improving reliability and cost of logistics network, helping conserve financial capital and mitigating climate change
Reducing costs, improving profitability and conserving natural resources
Better Everyday. In Pursuit of Excellence. Corporate Overview Statutory Reports Financial Statements
9
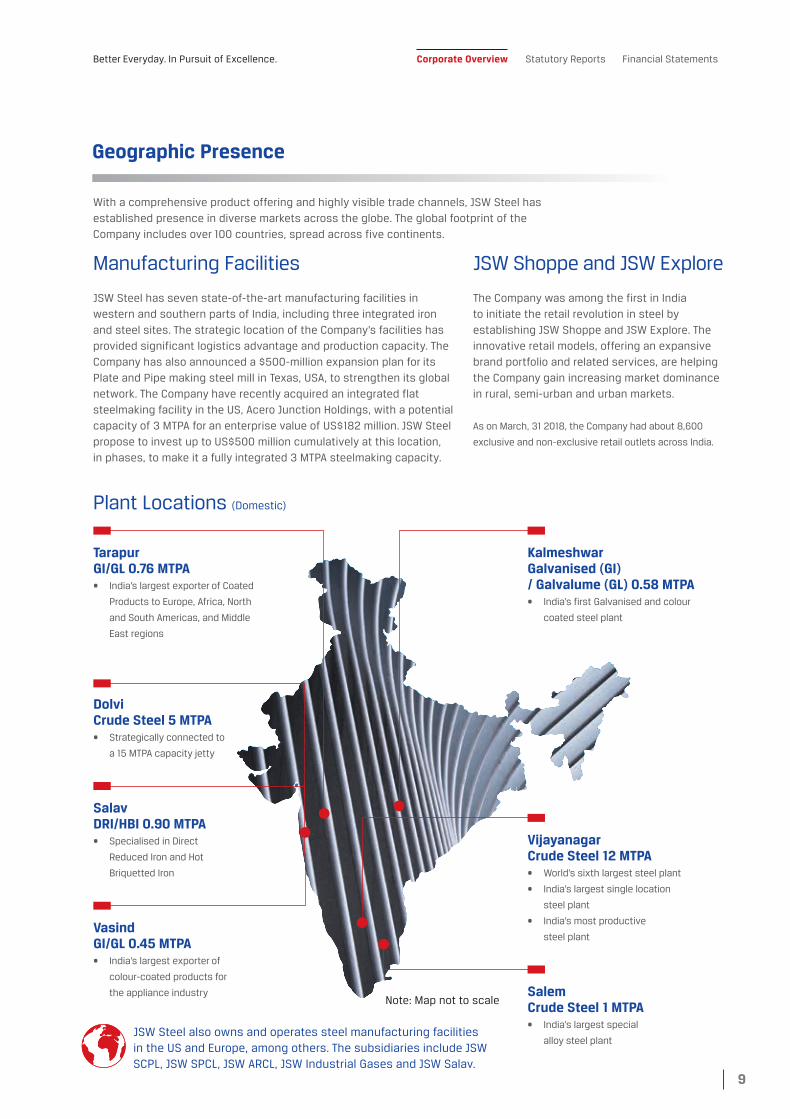
Geographic Presence
With a comprehensive product offering and highly visible trade channels, JSW Steel has established presence in diverse markets across the globe. The global footprint of the Company includes over 100 countries, spread across five continents.
Manufacturing Facilities
JSW Steel has seven state-of-the-art manufacturing facilities in western and southern parts of India, including three integrated iron and steel sites. The strategic location of the Company’s facilities has provided significant logistics advantage and production capacity. The Company has also announced a $500-million expansion plan for its Plate and Pipe making steel mill in Texas, USA, to strengthen its global network. The Company have recently acquired an integrated flat steelmaking facility in the US, Acero Junction Holdings, with a potential capacity of 3 MTPA for an enterprise value of US$182 million. JSW Steel propose to invest up to US$500 million cumulatively at this location, in phases, to make it a fully integrated 3 MTPA steelmaking capacity.
JSW Shoppe and JSW Explore
The Company was among the first in India to initiate the retail revolution in steel by establishing JSW Shoppe and JSW Explore. The innovative retail models, offering an expansive brand portfolio and related services, are helping the Company gain increasing market dominance in rural, semi-urban and urban markets.
As on March, 31 2018, the Company had about 8,600
exclusive and non-exclusive retail outlets across India.
VijayanagarCrude Steel 12 MTPA• World’s sixth largest steel plant
• India’s largest single location
steel plant
• India’s most productive
steel plant
DolviCrude Steel 5 MTPA• Strategically connected to
a 15 MTPA capacity jetty
SalemCrude Steel 1 MTPA• India’s largest special
alloy steel plant
SalavDRI/HBI 0.90 MTPA• Specialised in Direct
Reduced Iron and Hot
Briquetted Iron
KalmeshwarGalvanised (GI) / Galvalume (GL) 0.58 MTPA• India’s first Galvanised and colour
coated steel plant
TarapurGI/GL 0.76 MTPA• India’s largest exporter of Coated
Products to Europe, Africa, North
and South Americas, and Middle
East regions
Vasind GI/GL 0.45 MTPA• India’s largest exporter of
colour-coated products for
the appliance industry
Plant Locations (Domestic)
JSW Steel also owns and operates steel manufacturing facilities in the US and Europe, among others. The subsidiaries include JSW SCPL, JSW SPCL, JSW ARCL, JSW Industrial Gases and JSW Salav.
Note: Map not to scale

JSW Steel Limited | Integrated Report 2017-18
10
Product Portfolio
JSW Steel is globally recognised as a manufacturer of high-end, value-added steel. The Company has a large bouquet of flat and long products to meet diverse global needs. The Company is also strengthening its value-added product portfolio to address the rising demand for such types of steel.
APPLICATIONSHot Rolled
Cold Rolled
Galvanised
Colour Coated Products
Electrical Steel
• Cold rolling and galvanising• Drawing and press forming• Electrical stampings and forming• Welded tubes and pipes• Line pipes, structural and general
engineering• High tensile structural applications
Flat Products
• Automobile• White goods
• Roofing and cladding• Ducting• Boxes• Coolers• Furniture• Heat plates
• Solar heating panels• Electrical and light fittings• Agricultural equipment• Sandwich panels• Automotive
• White Goods• Roofing and Cladding• Sandwich Panels• Pre-engineered Buildings
• Electric motors• Power generation• Nuclear power stations• Domestic appliances• Transformers and automotive electricals
• Chequered sheets and plates for structural use
• HSLA grade for automobile and other engineering applications
• LPG cylinders, boiler tubes and pressure vessels
• Medium carbon steel• Corrosion resistant steel
• Cold formed sections• Drums and barrels• Furniture
Better Everyday. In Pursuit of Excellence. Corporate Overview Statutory Reports Financial Statements
11
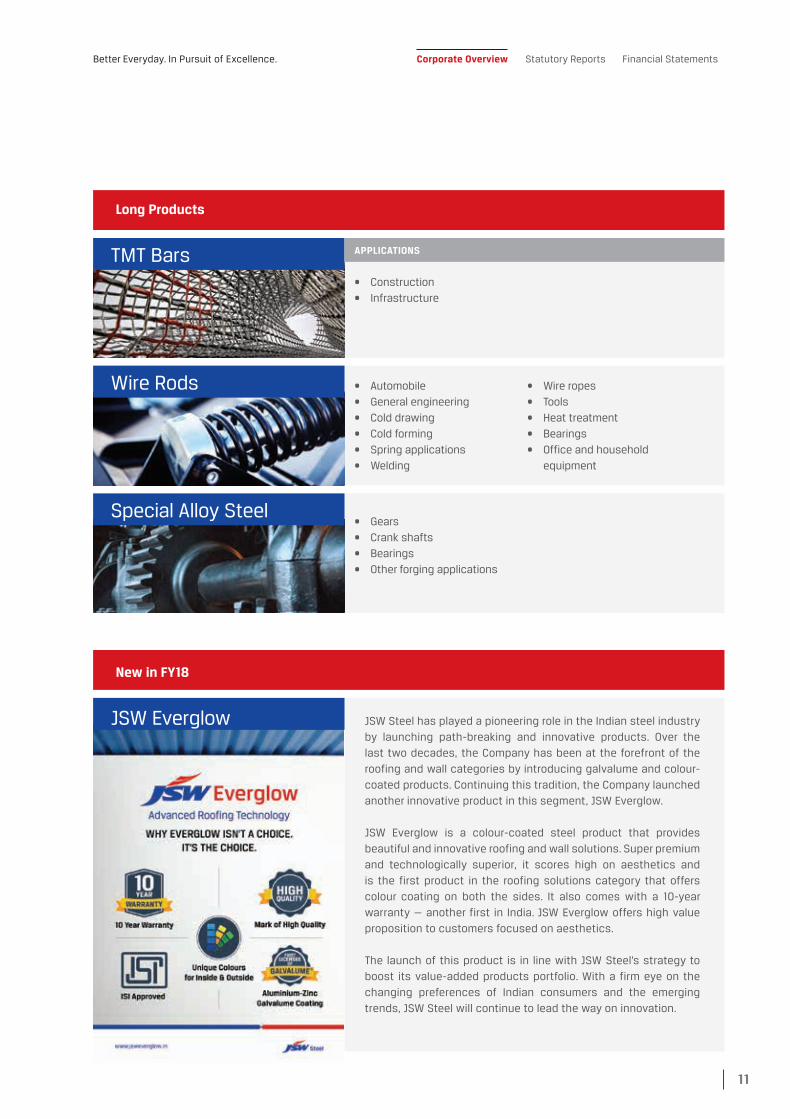
APPLICATIONSTMT Bars
JSW Everglow
Wire Rods
Special Alloy Steel
Long Products
New in FY18
• Construction• Infrastructure
• Automobile• General engineering• Cold drawing• Cold forming• Spring applications• Welding
• Wire ropes• Tools• Heat treatment• Bearings• Office and household
equipment
• Gears• Crank shafts• Bearings• Other forging applications
JSW Steel has played a pioneering role in the Indian steel industry by launching path-breaking and innovative products. Over the last two decades, the Company has been at the forefront of the roofing and wall categories by introducing galvalume and colour-coated products. Continuing this tradition, the Company launched another innovative product in this segment, JSW Everglow.
JSW Everglow is a colour-coated steel product that provides beautiful and innovative roofing and wall solutions. Super premium and technologically superior, it scores high on aesthetics and is the first product in the roofing solutions category that offers colour coating on both the sides. It also comes with a 10-year warranty — another first in India. JSW Everglow offers high value proposition to customers focused on aesthetics.
The launch of this product is in line with JSW Steel’s strategy to boost its value-added products portfolio. With a firm eye on the changing preferences of Indian consumers and the emerging trends, JSW Steel will continue to lead the way on innovation.

JSW Steel Limited | Integrated Report 2017-18
12
Other Marquee Projects
• Indira Gandhi Centre for Atomic Research, Kalpakkam
• ISRO Propulsion Complex (IPRC), Mahendragiri
• Kakrapar Atomic Power Station
• Satish Dhawan Space Centre (SHAR), Nellore
• Chhatrapati Shivaji International Airport,
Mumbai – Terminal 2• Air Traffic Control Tower,
Mumbai• Indira Gandhi International
Airport, Delhi
• Bharat Petroleum’s Kochi Refinery
• Renault-Nissan Automotive India Pvt. Ltd., Chennai
• Chennai Outer Ring Road• Eastern Freeway, Mumbai• Lucknow-Agra Expressway• Yamuna Expressway
STRATEGIC PROJECTS
AIRPORT PROJECTS
INDUSTRIAL PROJECTS
ROADS AND HIGHWAYS
• Supported by World Bank
• Will cover total distance of 1,839 kms
• The DFC will reduce greenhouse
gas emissions by 2.25 times over
next 30 years
ESTIMATED COMPLETION DATE – AUGUST 2018 (1ST PHASE)
1
JSW Steel Limited | Integrated Report 2017-18
Key Projects that the Company is Currently Partnering With
EASTERN DEDICATEDFREIGHT CORRIDOR (LUDHIANA-DELHI-KOLKATA)
JSW Steel has been an integral part of India’s multifaceted
infrastructural development and continues to deliver its
best in nation building.
1
1
4
1, 2
2, 3
JSW Steel: Building India
Note: Map not to scale
Better Everyday. In Pursuit of Excellence. Corporate Overview Statutory Reports Financial Statements
13
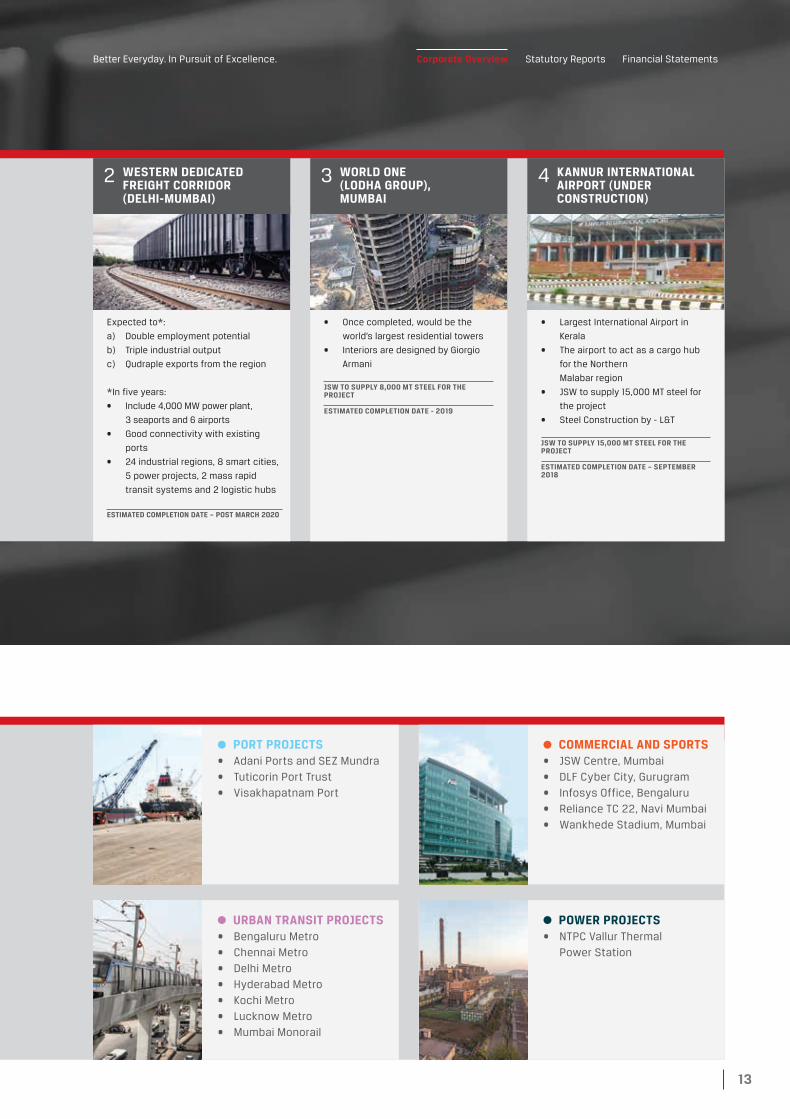
• Adani Ports and SEZ Mundra• Tuticorin Port Trust • Visakhapatnam Port
• Bengaluru Metro• Chennai Metro• Delhi Metro• Hyderabad Metro• Kochi Metro• Lucknow Metro• Mumbai Monorail
• JSW Centre, Mumbai• DLF Cyber City, Gurugram• Infosys Office, Bengaluru• Reliance TC 22, Navi Mumbai• Wankhede Stadium, Mumbai
• NTPC Vallur Thermal Power Station
PORT PROJECTS
URBAN TRANSIT PROJECTS
COMMERCIAL AND SPORTS
POWER PROJECTS
Expected to*:
a) Double employment potential
b) Triple industrial output
c) Qudraple exports from the region
*In five years:
• Include 4,000 MW power plant,
3 seaports and 6 airports
• Good connectivity with existing
ports
• 24 industrial regions, 8 smart cities,
5 power projects, 2 mass rapid
transit systems and 2 logistic hubs
ESTIMATED COMPLETION DATE – POST MARCH 2020
• Once completed, would be the
world’s largest residential towers
• Interiors are designed by Giorgio
Armani
JSW TO SUPPLY 8,000 MT STEEL FOR THE PROJECT
ESTIMATED COMPLETION DATE - 2019
• Largest International Airport in
Kerala
• The airport to act as a cargo hub
for the Northern
Malabar region
• JSW to supply 15,000 MT steel for
the project
• Steel Construction by - L&T
JSW TO SUPPLY 15,000 MT STEEL FOR THE PROJECT
ESTIMATED COMPLETION DATE – SEPTEMBER 2018
3
Better Everyday. In Pursuit of Excellence. Corporate Overview Statutory Reports Financial Statements
WORLD ONE (LODHA GROUP), MUMBAI
2 WESTERN DEDICATED FREIGHT CORRIDOR(DELHI-MUMBAI)
KANNUR INTERNATIONAL AIRPORT (UNDER CONSTRUCTION)
4

JSW Steel Limited | Integrated Report 2017-18
14
Chairman and Managing Director’s Message

Better Everyday. In Pursuit of Excellence. Corporate Overview Statutory Reports Financial Statements
15
Dear Stakeholders,
It is with great pride and pleasure that I report to you at the
end of a very successful financial year that saw us report
market-leading numbers, together with the triggering off of
multiple strategic initiatives aimed at realising our long-term
vision.
During the year, we launched our revamped Group brand
identity. Elucidated through the tagline, ‘Better Everyday’,
our new brand positioning is all about being ‘a bold and
unwavering transformer’. It demonstrates our drive to make
‘better’ every life we touch; be it our employees, our business
associates, our customers, the communities around our
plants and facilities, or the industry fraternity at large. And
we do so by following the principle of bettering ourselves,
time and again, continuously, with dynamic enthusiasm.
Further, to establish this culture and create a consistent brand
experience, both for our internal and external stakeholders,
we are adopting a personality that is optimistic, empathetic,
nationalistic and bold.
Thus, our credo borrows from the actions and outcomes we
have demonstrated. In JSW Steel too, we find resonance of
‘Better Everyday’, in the manner that we have performed, and
in the strategic focus we have outlined. We can only get better
if we pursue excellence across all facets of our business on a
daily basis, and therefore, this annual report highlights some
of the ways in which we are aiming for excellence.
This is our first Integrated Report. Creating value for all
stakeholders and providers of diverse capitals is inbuilt into
our strategy, and the way we measure our performance. Our
report now reflects the outcomes of our actions, as relevant
to different stakeholders, and the impact of our strategy and
integrated thinking. It is also in-line with our commitment to
the highest standards of governance and transparency.
An Encouraging Environment
FY18 was characterised by broad-based improvement in
global growth, rising industrial production, kick-starting of the
supply side reforms in China and uptick in global steel pricing
environment.
In 2017, global economy grew at 3.8% which is the fastest
since 2011. This growth was an outcome of a combination
of factors namely higher investments, favourable monetary
policies and buoyant global trade. The International Monetary
Fund (IMF) expects this momentum to continue and has
forecasted that global economy could grow by 3.9% in 2018 as
well as 2019.
The Indian economy too saw a strong rebound in demand,
especially in the second half, demonstrating a healthy
resilience to disruptions and structural changes. India’s
macro fundamentals, such as fiscal deficit and credit rating
are improving, and broad-based financial reforms are being
undertaken through initiatives such as relaxation of FDI rules,
enactment of the IBC and growth stemming from government
spending. Although the GDP growth at 6.7 per cent was a tad
lower than the 7.1 per cent achieved in the previous fiscal, it is
a remarkable achievement given the context of reform. Growth
is expected to rebound to 7.4% in fiscal 19, driven by multiple
internal and external factors.
For the first time in many years, elasticity of steel demand to
GDP growth exceeded 1x. Infrastructure received a big boost
in the form of budgetary allocation, and consumer sentiment,
too, is on the rise. We also crossed the GDP threshold of $2.5
trillion, there is likely to be a huge thrust on infrastructure
development, which is very positive for steel demand growth.
In addition, the introduction of GST, is a seminal reform, which
will help formalise the economy, introduce transparency and
go a long way in creating a level-playing field, besides weeding
out a lot of tertiary inefficiencies. We view this very positively.
Of particular importance are the initiatives around stressed
assets resolution, under the new Insolvency and Bankruptcy
code. JSW Steel is participating in strategic opportunities
under this process, and is hopeful that quality, efficiency and
governance will converge to make better utilisation of some of
the capacities that are financially encumbered.
THIS IS OUR FIRST INTEGRATED REPORT. CREATING VALUE FOR ALL STAKEHOLDERS AND PROVIDERS OF DIVERSE CAPITALS IS INBUILT INTO OUR STRATEGY, AND THE WAY WE MEASURE OUR PERFORMANCE.

JSW Steel Limited | Integrated Report 2017-18
16
Setting New Milestones
JSW Steel achieved a record performance in the year. With an
all-time high crude steel production of 16.27 million tonnes,
our shipments remained buoyant. Revival in domestic demand
in the second half of the year was a key catalyst of our
performance and was driven by improving prospects of the
auto, construction and capital goods sectors. Rising share
of value added products in the overall business was another
highlight of the year. These products contributed 58% to our
revenues as compared to 34% in FY17 and were instrumental in
boosting our realisations as well as profitability.
During the year, our Consolidated revenues grew 18.1%
- substantially outpacing the domestic industry steel
consumption growth of 8.1% and global consumption growth of
4.7%. Thus, we continued to further consolidate our leadership
position in the market.
Our consolidated EBITDA stood at H14,794 crore - an increase
of 21.5% over the previous year. Shift in product mix towards
high-margin value added products was a key enabler for this
growth.
We reported our highest ever profit after tax at H6,113 crore
- a growth of 76.3% over the previous year. Our relentless
efforts to enhance operational efficiencies are yielding rich
dividends as reflected in our robust return on capital employed
(ROCE) ratio of 16% - placing us among the top 5 ROCE steel
companies globally. De-leveraging was a key theme that played
out during the year. Consequently, our Net Debt to EBITDA fell
to 2.59 times as against 3.20 times in the previous year. The
cash flows freed up from the de-leveraging initiatives will be
deployed for capacity expansion and other capital intensive
projects, going forward.
An Exciting Future
We are very positive about the long-term growth potential
for steel consumption in the domestic market. Even if one
assumes a nominal rate of growth for the overall steel demand,
India will need to create at least 150 million tonnes of new steel
capacity in the next ten years. As one of the most competitive
and efficient players, naturally, JSW Steel, will be looking to
capitalise on this opportunity and invest in capacity expansion
and market share.
Our Board has approved additional capital expenditure
programmes to expand capacities at our plants in Vijayanagar
and Dolvi and also to modernise and expand capacities of our
downstream business. These expansions will further enhance
our efficiencies and generate superior returns at lower costs.
Inorganic growth has always been an integral part of our
growth journey and we will continue to explore strategic
opportunities – both in domestic and international markets.
In the domestic market, your Company has emerged as the
successful resolution applicant for acquiring Monnet Ispat and
Industries Limited, a 1.5 MTPA steelmaking facility in Raigarh,
Chhattisgarh. Located in close proximity to the mineral rich
belts of Chhattisgarh and Odisha, this acquisition will be
crucial in furthering our footprint in the central and eastern
markets of India.
DURING THE YEAR, OUR CONSOLIDATED REVENUES GREW 18.1% — SUBSTANTIALLY OUTPACING THE DOMESTIC INDUSTRY STEEL CONSUMPTION GROWTH OF 8.1% AND GLOBAL CONSUMPTION GROWTH OF 4.7%.
Capacity Expansions by March 2020PARTICULARS EXISTING CAPACITY
(MTPA)
TARGETED CAPACITY
(MTPA)
Total 18 24.7
Vijayanagar 12 13
Dolvi 5 10.7

Better Everyday. In Pursuit of Excellence. Corporate Overview Statutory Reports Financial Statements
17
JSW – Enriching Lives
The JSW Foundation has pioneered various programmes
to enrich the lives of over a million people with improved
education, healthcare and sustainable means of livelihood.
Continuing on this journey, in October 2017 your Company
partnered with the Government of Uttarakhand for
reconstruction and restoration of Kedarnath which was
impacted severely during the flash floods of 2013. JSW group
is playing a proactive role in reconstruction and restoration of
the Adi Shankaracharya Kutir along with a museum, Ghats on
River Saraswati and part reconstruction of the Teerth Purohit
(Priests) houses and other infrastructural facilities related to
the houses in Kedarpuri.
Through our flagship ‘Sports Excellence Program (SEP)’, we
have been very proactive in making India a ‘sporting nation’.
This Program supports 39 athletes from of Boxing, Track &
Field, Wrestling and Tennis. We own Bengaluru FC – one of the
most successful football clubs in India in recent times.
In Conclusion
I am confident of achieving higher peaks in the future. I would
like to extend a heart-felt gratitude to each and every member
of our team for their sustained, untiring efforts in making JSW
Steel a leading steel company in the world. I would also like to
thank all our stakeholders, Board, Bankers and the Government
for the support and assistance provided throughout our
journey.
I solicit your continued cooperation.
Sincerely, Sajjan Jindal
Limiting the Impact of Rising Protectionism
Global economies are increasingly stepping up protectionist
trade measures to safeguard the interest of their domestic
industries. While this trend could continue in the future, it
will not hinder our growth in the international markets. This is
because we have selectively pursued some value-accretive
acquisitions in the overseas markets during the year with
the objective of replicating our low capital cost model in a
relatively higher operating cost environment.
Accordingly, we have acquired an 100% stake in US-based steel
plant Acero Junction Holdings for $80.85 million (~H550 crore)
recently. This acquisition will further bolster our manufacturing
presence in the US market. Similarly, we are in the process of
acquiring the facilities of Italian steel maker Aferpi (erstwhile
Lucchini) for H440 crore. Through this acquisition, your
Company will get a stronger foothold in the European market
and can swiftly tap into the emerging opportunities in the
continent.
Favourable Policy Environment
The Government of India has put in place multiple policies to
support the domestic steel industry. Be it long term measures
such as the National steel Policy which aims to make India a
self-sufficient steel producing country by 2030; or shorter term
measures intended to provide a level playing field for importers
and domestic companies; the government has been rather
pro-active. We believe these measures could lead to healthy
growth of 5% in the domestic steel industry over the medium
term.
Against this backdrop, your Company will continue to make the
requisite investments needed to grow responsibly.
WE HAVE ACQUIRED AN 100% STAKE IN US-BASED STEEL PLANT ACERO JUNCTION HOLDINGS FOR $80.85 MILLION (~H550 CRORE) RECENTLY. THIS ACQUISITION WILL FURTHER BOLSTER OUR MANUFACTURING PRESENCE IN THE US MARKET.

JSW Steel Limited | Integrated Report 2017-18
18
Key Performance Indicators
Gross Turnover (` crore)
6%
Operating EBITDA Margin (%)
Earnings Per Share (`)
Operating EBITDA (` crore)
13%
Profit After Tax (` crore)
92%
Contribution to Government and Society
(` crore)
Profit & Loss Statements
2017-18
2016-17
2015-16
2014-15
2013-14
70,091
59,560
45,288
56,572
54,621
2017-18
2016-17
2015-16
2014-15
2013-14
14,794
12,174
6,401
9,402
9,165
2017-18
2016-17
2015-16
2014-15
2013-14
21.1
21.9
15.4
17.7
17.9
2017-18
2016-17
2015-16
2014-15
2013-14
6,113
3,467
(481)
1,797
452
2017-18
2016-17
2015-16
2014-15
2013-14
25.71
14.58
(1.4)
7.29
1.74
2017-18
2016-17
2015-16
2014-15
2013-14
10,308
5,198
4,777
4,574
4,507

Better Everyday. In Pursuit of Excellence. Corporate Overview Statutory Reports Financial Statements
19
Net Fixed Assets (` crore)
Crude Steel Production (MTPA)
Dividend Per Share (`)
31%
Net Debt Equity Ratio
Saleable Steel Sales (MT) Specific Water Consumption (m³/TCS)
Book Value Per Share (`)
Balance Sheet
Shareholder Metrics
Operational Metrics
CAGR growth
2017-18
2016-17
2015-16
2014-15
2013-14
57,141
57,858
55,185
50,591
45,484
2017-18
2016-17
2015-16
2014-15
2013-14
1.38
1.85
2.18
1.55
1.54
2017-18
2016-17
2015-16
2014-15
2013-14
3.20
2.25
0.75
1.10
1.10
2017-18
2016-17
2015-16
2014-15
2013-14
113.91
92.68
77.65
92.21
87.60
2017-18
2016-17
2015-16
2014-15
2013-14
16.27
15.8
12.56
12.63
12.17
2017-18
2016-17
2015-16
2014-15
2013-14
15.55
14.77
12.13
12.03
11.86
2017-18
2016-17
2015-16
2014-15
2013-14
4.14
3.61
4.52
4.57
4.89

JSW Steel Limited | Integrated Report 2017-18
20
Revenue from operations K71,503 croreProfit after tax K6,113 croreEBITDA K14,794 crore
Capacity utilisation of 91%Crude Steel production 16.27 MnTSaleable Steel sales 15.62 MT
Female employees in organisation 4.13%4.1% of women in management Attrition rate 4.65%
~K46 crore saved due to digitalisation73 new products developed16 patents filed
6 women-only BPOs (JSW Shakti)4 certified to ISO 27001 650,000 beneficiaries of CSRCustomer Satisfaction Index 3.76/5.0
3.3 MnT material recycled17.7 Mn m3 water recycled and reused3.1 MnGJ energy conserved96% waste off-gases utilised
OUTPUTS
Total equity K240.62 croreInterest bearing liabilities K39,620 croreCapital expenditure K4,690 crore
Plants in seven locations in IndiaCombined capacity of 18 MTPAAdded 47 new steel gradesSix key new projects in the pipeline
Number of employees 11,619Employee benefit expenditure K1,843 crore37 training man-days for employees
Expenditure on R&D K41 crore155 number of persons in R&D Technological collaborations with JFE Steel and Marubeni-Itochu
CSR spend K61 croreNumber of vendors and customers ~12,700 Stateholder mapping and engagement
448.6 MnGJ of energy consumed67.3 Mn m3 of freshwater intake31 MnT iron bearing materials17.2 MnT of coal used
INPUTS
Strong balance sheetNet worth K27,534 croreMarket cap K69,652 crore
Largest producer and exporter of steel in India6th rank in global steel companies (by World Steel Dynamics) Among the lowest conversion costs in the world
Diverse and professional work environmentTop management-led safety culture transformationCoaching and mentoring employees for leadership roles
Paradigm shift to digitalisation and automationDevelopment of value added and special products
Enabling mass awareness on climate changethrough the JSW-TOI Earth Care AwardsImproving quality of life in theneighbouring communitiesSupplier of choice in 100+ countriesacross sectors
Applying circular economy principle across value chainOperational excellence for resource conservation Restoring ecosystem
OUTCOMES
EXTERNALFACTORS
STRATEGICFOCUSAREAS
BUSINESSACTIVITIES
STRATEGIC GROWTH
DIVERSIFICATION
BACKWARD AND FORWARD INTEGRATION
RESOURCE OPTIMISATION
PRUDENT FINANCIAL PRINCIPLES
MAINSTREAMING SUSTAINABILITY
INDUSTRY CONSOLIDATION
SKILLS SHORTAGE
CLIMATE CHANGE
GROWING GLOBAL ECONOMY
RISING STEEL DEMAND AND PRICES
TRANSFORMATIONAL REFORMS OF GOVT.
HIGHER GOVT. SPENDING ON INFRASTRUCTURE
VISION
PURPOSE
VALUES
1. RAW MATERIALS 2. INBOUND LOGISTICS
4. PROCESSING 3. MANUFACTURING
5. OUTBOUND 6. USE LOGISTICS
7. RECYCLING
What makes a better everyday
(Read more on Pg 8)
(Read more on Pg 26-27)
Value-creation Model
ManufacturedCapital
FinancialCapital

Better Everyday. In Pursuit of Excellence. Corporate Overview Statutory Reports Financial Statements
21
Revenue from operations K71,503 croreProfit after tax K6,113 croreEBITDA K14,794 crore
Capacity utilisation of 91%Crude Steel production 16.27 MnTSaleable Steel sales 15.62 MT
Female employees in organisation 4.13%4.1% of women in management Attrition rate 4.65%
~K46 crore saved due to digitalisation73 new products developed16 patents filed
6 women-only BPOs (JSW Shakti)4 certified to ISO 27001 650,000 beneficiaries of CSRCustomer Satisfaction Index 3.76/5.0
3.3 MnT material recycled17.7 Mn m3 water recycled and reused3.1 MnGJ energy conserved96% waste off-gases utilised
OUTPUTS
Total equity K240.62 croreInterest bearing liabilities K39,620 croreCapital expenditure K4,690 crore
Plants in seven locations in IndiaCombined capacity of 18 MTPAAdded 47 new steel gradesSix key new projects in the pipeline
Number of employees 11,619Employee benefit expenditure K1,843 crore37 training man-days for employees
Expenditure on R&D K41 crore155 number of persons in R&D Technological collaborations with JFE Steel and Marubeni-Itochu
CSR spend K61 croreNumber of vendors and customers ~12,700 Stateholder mapping and engagement
448.6 MnGJ of energy consumed67.3 Mn m3 of freshwater intake31 MnT iron bearing materials17.2 MnT of coal used
INPUTS
Strong balance sheetNet worth K27,534 croreMarket cap K69,652 crore
Largest producer and exporter of steel in India6th rank in global steel companies (by World Steel Dynamics) Among the lowest conversion costs in the world
Diverse and professional work environmentTop management-led safety culture transformationCoaching and mentoring employees for leadership roles
Paradigm shift to digitalisation and automationDevelopment of value added and special products
Enabling mass awareness on climate changethrough the JSW-TOI Earth Care AwardsImproving quality of life in theneighbouring communitiesSupplier of choice in 100+ countriesacross sectors
Applying circular economy principle across value chainOperational excellence for resource conservation Restoring ecosystem
OUTCOMES
EXTERNALFACTORS
STRATEGICFOCUSAREAS
BUSINESSACTIVITIES
STRATEGIC GROWTH
DIVERSIFICATION
BACKWARD AND FORWARD INTEGRATION
RESOURCE OPTIMISATION
PRUDENT FINANCIAL PRINCIPLES
MAINSTREAMING SUSTAINABILITY
INDUSTRY CONSOLIDATION
SKILLS SHORTAGE
CLIMATE CHANGE
GROWING GLOBAL ECONOMY
RISING STEEL DEMAND AND PRICES
TRANSFORMATIONAL REFORMS OF GOVT.
HIGHER GOVT. SPENDING ON INFRASTRUCTURE
VISION
PURPOSE
VALUES
1. RAW MATERIALS 2. INBOUND LOGISTICS
4. PROCESSING 3. MANUFACTURING
5. OUTBOUND 6. USE LOGISTICS
7. RECYCLING
Natural Capital
Social AndRelationship Capital
IntellectualCapital
HumanCapital

JSW Steel Limited | Integrated Report 2017-18
22
Stakeholder Engagement and Materiality
JSW Steel’s overall business strategy and daily business decisions ensure that the interests of all its stakeholders are safeguarded. The Company has formal mechanisms to continually engage with its key stakeholders to understand their expectations and concerns. Formal engagement also helps the Company in sharing information on its approach and actions in areas of stakeholder interest. The Company is creating a ‘Better Everyday’ by generating sustained value for stakeholders.
CUSTOMERS EMPLOYEES COMMUNITY
• Large bouquet of high-quality products
• Meeting increasing demand for value-added and special products
• Enhanced experience through JSW Shoppe and JSW Explore
• Trained and motivated workforce
• Diversity promotion
• Social-economic development through CSR activities
• Empowering women through SHGs
GOVERNMENT
• Contribution to the exchequer
• ‘Make in India’ initiative promoted
INSTITUTIONS
• Collaborative technology
• Research and development
CIVIL SOCIETYAND INVESTORS
• Market leadership for shareholder value
• Accountability and disclosure of information
SUPPLIERS
• Enhanced capability
• Timely payments
BETTEREVERYDAY
value created for our stakeholders
Stakeholder Engagement

Better Everyday. In Pursuit of Excellence. Corporate Overview Statutory Reports Financial Statements
23
Current or potential impact on the Company
LOW M E D I U M H I G H
LOW
ME
DIU
MH
IGH
1. Key economic perameters of the Company
2. Impact of investments on the community
3, Adopt best-in-class procurement systems and processes
4. Engagement with local community
5. Compliance with laws and regulations
6. Talent development7. Input materials used in the
operations8. Energy management in the
organisation9. Water used and recycled by the
organisation10. Effluents and waste generated
due to the operations
11. Productive and motivated workforce
12. Ensuring health and safety of all employees at work
13. Promoting diversity and equal opportunity at all levels
14. Grievance redressal for all stakeholders
15. Emissions generated due to operations
Rela
tive
con
cern
s to
sta
keh
olde
rs
Material issues are those that have direct or indirect impact on an organisation’s ability to create, preserve or deplete economic, environmental and social value for itself, its stakeholders and the society. At JSW Steel, the identification of material issues goes beyond prioritising and addressing risks to helping the Company capitalise on emerging opportunities. Materiality assessment has been instrumental in ensuring the Company retains focus on aspects which enable it to create long-term sustained value.
The material issues for JSW Steel were identified based on their criticality to the Company’s business and importance to stakeholders. The Company believes deeper engagements with stakeholders significantly enhances
its knowledge and understanding on externalities that may impact its business environment. By focusing on the macro-level trends identified in these engagements, the Company is able to align its strategic focus areas with the emerging priorities.
JSW Steel conducted over 300 detailed interactions with internal and external stakeholders to understand their specific concerns, major risks and opportunities, along with justification for key issues raised and their potential impact on business. The stakeholders engaged included customers, employees, suppliers, community, government, civil society and investors and institutions. This year, the Company recalibrated its material issues through focussed interactions with internal stakeholders.
Materiality
Materiality Assessment

JSW Steel Limited | Integrated Report 2017-18
24
Global
Improving Growth of Global Economy
3.2
3.4
3.6
3.8
4.0
2016 2017 2018f 2019f
GLOBAL ECONOMIC GROWTH
%
SOURCE: INTERNATIONAL MONETARY FUND f: FORECAST
Opportunities
RECENT ACQUISITIONS BY JSW STEEL (INTERNATIONAL)
ACQUIRED COMPANY (COUNTRY) ACQUISITION VALUE
Acero Junction Holdings (US) I550 crore
Aferpi (Italy) I440 crore
COMMODITY PRICE INDEX
YEAR ENERGY METAL & MINERALS
2015 64.9 66.9
2016 55.0 63.0
2017 68.0 78.2
2018E 81.5 84.9
2019E 81.2 83.1
Availability of Good-quality Assets /Companies at Reasonable Valuations
Rebound in Economies of the US and EU; Stabilising Chinese Economy
20162016
20162017
20172017
2018f
2018f
2018f
ECONOMIC GROWTH
SOURCE: INTERNATIONAL MONETARY FUND f: FORECAST
WORLD BANK : APRIL '18 E: ESTIMATED
US
1.5%2.0%
6.7%
2.3%2.7%
6.9%
2.9%2.5%
6.6%
EU-28 CHINA
1.6161
1.8%
1.6267
0.7%
SOURCE: WORLD STEEL ASSOCIATION
Rising Steel Demand and Strong Commodity Prices
HEALTHY PROSPECTS FOR GLOBAL STEEL DEMAND
2018 2019
FORECASTED DEMAND (IN BILLION TONNES)
% GROWTH Y-O-Y
Higher Investments in the US Subsidiary Commodity Prices
Business Environment

Better Everyday. In Pursuit of Excellence. Corporate Overview Statutory Reports Financial Statements
25
India
India overtakes France to be the sixth-largest economy in the world and remains the fastest growing among major global economies.
Increasing Rural Demand and Continued Growth in Urban Demand
Insolvency Resolution through NCLT
Transformational Reforms and Policies of Government of India
Challenges
Industry ConsolidationLarge unpaid debt and increasing protectionist measures coupled with benefits of consolidation such as improved margins and stability are moving the global steel industry towards consolidation.
Increased RegulationDynamic regulatory environment with increased regulations covering export bans, royalties and taxes have the potential to impact raw material supply and increase price volatility.
Resource NationalismThis is aimed at ensuring retention of a fair share of the value of natural resources of a region through new laws aimed at increasing local participation, government oversight and taxation.
Climate ChangeAs a result of its energy intensive processes, the steel industry is increasingly facing direct and indirect effects of climate change like water stress, supply chain disruption, pressure to change energy mix, increased investor pressure and public scrutiny.
Skills ShortageShortage of talent with required skills and knowledge base is exacerbated by globalisation and introduction of disruptive technologies, leading to project delays, safety concerns, higher operational costs and reduction in productivity.
READ MORE ON THE OPPORTUNITIES AND CHALLENGES IN THE MD&A SECTION (PAGES 96-104)
India Meteorological Department 97% of long-period average
Skymet 100% of long-period average
(RAINFALL BETWEEN 96% AND 104% OF THE LPA IS DEFINED AS NORMAL)
Near Normal Monsoon Prediction
RAINFALL PROJECTIONS FOR 2018
• Rural steel demand• Housing demand • Automobiles• Renewable energy
525 corporates were undergoing insolvency resolution process at the end of March '18.
Key reforms implemented in the year:• Goods and Services Tax• Insolvency and Bankruptcy Code • RERA• National Steel Policy
FY18
FY17
CSO: Avg Ex. rate 2016-17 `67.09/$ & 2017-18 `64.45/$
CSO: Avg Ex. rate 2016-17 `67.09/$ & 2017-18 `64.45/$
Uptick in Exports
DOMESTIC
GROWTH% 14 10
EXPORTS
INDIA: UPTICK IN ECONOMY & EXPORTS($Bn)
3032,603
2762,274
Higher Government Spendingin Infrastructure
FY18 BUDGET
FY19 BUDGET
GOI SPENDING ON INFRASTRUCTURE
I4.94 lakh Cr I5.97 lakh Cr
India GDP stood at $2,597 trillion in FY18

JSW Steel Limited | Integrated Report 2017-18
26
Strategic Focus Areas and Enablers
The long-term success of a company depends on its ability to take a holistic view of its operations and the external environment. This is enabled by integrated thinking, which is achieved by breaking down silos, enhancing connectivity and building synergies within the organisation. Integrated thinking enables the development and implementation of an inclusive strategy and builds on internal strengths, while taking advantage of opportunities and overcoming challenges.
Rapidly evolving technologies, globalisation and the accelerating pace of change drives strategy at JSW Steel. The
philosophy of ‘Better Everyday’ has been the guiding force in the Company’s growth and will remain so for future endeavours. The Company is driven by a passion for growth and makes consistent efforts to achieve it every day. A triple bottom-line approach which integrates economic progress, environmental protection and community development is at the heart of this strategy and guides all decisions and imperatives.
JSW Steel has made big strides in each of the focus areas listed here and has also charted well-defined plans to achieve them.
Strategic Pillars
STRATEGIC FOCUS AREA
S1 STRATEGIC GROWTH
S2DIVERSIFICATION OF PRODUCT PROFILE AND CUSTOMER BASE
S3 BACKWARD & FORWARD INTEGRATION
ACTION PLAN
FY18 PROGRESS
OUTLOOK
• Commenced brownfield expansion at Dolvi to 10 MTPA at an investment of only H3,000 crore for every additional MTPA – an industry benchmark
• Initiated acquisition of Monnet Ispat and Acero Junction (steelmaking capacity of 1.5 MTPA), and Aferpi (downstream capacity of 1.32 MTPA)
• Value Added and Special Products (VASP) contributed 58% to overall sales volume
• 73 new grades developed/customised
• 8,600+ retail outlets catering to the nation
• Commenced capacity expansion of CRM-1 complex at Vijayanagar from 0.85 MTPA to 1.8 MTPA
• 0.25 MTPA Tin Plate capacity under construction
• Operationalised Tunga Iron Ore Mine in Karnataka
• Announced a $500 million expansion plan for Pipe and Plate making steel mill in Texas, USA, subject to necessary approvals
• Announced a $500 million investment in Acero to make it a fully integrated 3 MTPA steel making facility
• Capex of ~H19,800 crore planned in FY19-21 to achieve 24.7 MTPA capacity by 2021
• Continue to evaluate organic/inorganic growth opportunities to achieve 40 MTPA by 2030
• Continued focus on increasing the share of value-added products in the portfolio, to enhance margins
• Modernisation and capacity enhancement at Vasind and Tarapur by 1.5 MTPA by setting up PLTCM
• Set up 0.3 MTPA colour coated line in CRMI at Vijaynagar
• Install additional 0.25 MTPA Tin Plate facility at Tarapur
• Capacity enhancement of Pre-Painted Galvalume Line at Kalmeshwar by 0.22 MTPA
• All five iron ore mines in Karnataka to be operational by FY19
• Moitra coal block with reserves of
~30 million tonnes to be operational by FY20
• To participate in Government of India's iron ore and coal auctions for raw material security
• Maintain leadership through value-accretive organic and inorganic opportunities
• Undertake brownfield expansions at relatively low investment cost
• Increase proportion of high margin value-added products
• Enhance customer base, both within India and in international markets
• Continue to focus on fast-growing rural markets in India
• Raw material security by evaluating assets in India and abroad
• Targeting strategic tie-ups and investments
Capitals involved Capitals involved Capitals involved

Better Everyday. In Pursuit of Excellence. Corporate Overview Statutory Reports Financial Statements
27
profitability & growth
sourcing & processing people & community innovation energy, environmen
t & s
afet
y
com
plia
nce
& g
over
nanc
e
risks & opportunities
integratedthinking
JSW STEEL DEMONSTRATES INTEGRATED THINKING ACROSS THE VARIOUS FACETS OF THE ORGANISATION
Strategic Pillars
STRATEGIC FOCUS AREA
S4FOCUS ON RESOURCE OPTIMISATION
S5PRUDENT FINANCIAL MANAGEMENT
S6 MAINSTREAMING SUSTAINABILITY IN BUSINESS IMPERATIVES
ACTION PLAN
FY18 PROGRESS
OUTLOOK
• Energy intensity: 27.57 GJ/T
• Plant capacity utilisation of 91%
• Various cost savings projects implemented with a resultant savings of H495 crore
• 12 digital initiatives implemented and achieved cost savings of H46 crore
• Net debt reduction of H3,529 crore
• Net Debt to EBITDA down to 2.59x or 2.59x from 3.20x
• Net debt geared down to 1.27x from 1.53x
• Return on capital employed of 16%
• Number of Patents filed - 16
• Commenced preparations in Vijayanagar and Dolvi plants for achieving the Deming Award
• Material recycled: 3.3 MnT
• LTIFR: 0.42
• Continue to focus on improving resource efficiency of processes
• Phase 1 DCPL coke oven of 1.5 MTPA by FY19 to eliminate purchase of coke to reduce cost to be commissioned
• To operationalise Pipe Conveyor System, for transport of iron ore from the mines to Vijayanagar plant to optimise logistics cost
• To implement the identified 'Deep Drive Projects' with savings of H541 crore identified
• Digital initiative to be implemented in phases. Estimated savings of H463 crore
• Projects to be funded by a mix of debt
and internal accruals with the overall
leverage ratios within levels of 3.75x net
debt/EBITDA and 1.75x net debt/equity
• To diversify sourcing of funding by
way of right mix of rupee and foreign
currency debt
• Return on capital employed to become
one among the top five steel companies
globally
• Make conscious efforts to improve gender parity in employment, continue focus on quality management and improve HSE metrics
• To prepare for the Deming Prize for Vijayanagar and Dolvi units by FY20
• Focus on cost reduction
• Enhanced operational efficiency
• Adoption of digital technologies in the operations
• Continuously seek to improve financial profile
• Manage capacity expansion and debt profile to capture market opportunities without excessive risk
• Continuously seek to improve financial profile
• Manage capacity expansion and debt profile to capture market opportunities without excessive risk
Capitals involved Capitals involved Capitals involved

JSW Steel Limited | Integrated Report 2017-18
28
Market leader and well-placed to benefit from upcycle
Strong business profile and diversified by region, markets and products
Strong focus on operational efficiency with globally renowned operations
Robust financial profile and stable cash flows
Prudent financial management
• India’s largest producer and seller of steel by value and volume
• India’s largest exporter of steel• Planned capex and brownfield expansions to further
catalyse growth• Government emphasis via National Steel Policy and target
of 300 MT by 2030-31• Decreasing steel imports from China and improved margins
Enablers
• Geographically diversified with manufacturing facilities in South and West India
• Wide offering of flat and long products• Flexibility to adapt product mix to market demands• Continuously enriching product mix with value-added and
special products• Developing new products and capturing niche markets• Facilities well-connected to rail and road networks
• Focussed on sweating of assets• One of the lowest conversion costs in the industry due
to efficient operations, manpower productivity, strategic locations and state-of-the-art manufacturing facilities
• Production facilities backed by captive power plants• Ongoing cost-benefit initiatives• Raw material assets pursued continuously for raw
material security
• Strong track record of volume growth• Continued positive momentum in operating revenues• Robust EBITDA margin of 21.1%• Strong operating cash flows
• Focussed leverage management by way of target levels for Net Debt to Equity and Net Debt to EBITDA
• Diversification of funding sources• Continuous improvement in debt
maturity profile

Better Everyday. In Pursuit of Excellence. Corporate Overview Statutory Reports Financial Statements
29
Enablers
Proven track record of growth through organic and inorganic expansions
Skilled workforce led by an experienced management team
Adept at using a mix of technologies and flexible capabilities
Strong project execution capabilities
Agile organisational culture
• Combination of organic and inorganic growth
• Diverse skills in manufacturing, sales, marketing, finance and supply chain management
• Extensive experience and alignment to organisational strategy
• Continuous investment in building and enhancing competencies and encouragement to employees to participate in sponsored learning programmes
• Widest range of manufacturing technologies in India to lower cost of production
• Well-placed to use wide range of raw material blends
• Strong track record of successful project implementation by in-house team within planned timelines and highly experienced project management team supported by cross-functional teams
• Leveraging long-term relationship with key domestic and international suppliers
• Ability to perceive and convert opportunities into business gains with speed
• Agility to convert threats into opportunities• Flexibility to shift sales between domestic and international
markets based on market conditions• Flexibility built in business decisions to proactively address
challenges

JSW Steel Limited | Integrated Report 2017-18
30
Risk Management
In a fast changing world, it is imperative that an organisation proactively works towards identifying and managing the diverse risks that it faces or may face. New age risks like digital effectiveness and cyber risk along with conventional ones like regulatory risk and social licence to operate present a formidable challenge to organisations.
To effectively deal with these challenges and better its value creation ability, JSW Steel Ltd. follows the globally recognised Committee of Sponsoring Organisations of
RISK TYPE STRATEGIC RESPONSE CAPITALS IMPACTED
Competitive dynamics and industry cyclicality
Ability to market increasing volumes and changing portfolio
Raw material security
Infrastructure and logistics
• Tracking of macro-environment
• Better market intelligence
• Agile response to external environment
• Broader value-added product range
• Responsive credit and pricing policy
• Increasing domestic market share
• Enhancing export volumes
• Expanding downstream capacity
• Price competitiveness
• Participating in mine auctions
• Prioritising domestic sourcing over import
• Exploring contract options like long-term/spot/indexing
• Creating additional storage capacity
• Prioritising sea v/s rail v/s road
• Deploying higher capacity barges/carriers
• Enhancing infrastructure at jetties
• Creating additional storage capacities
the Treadway Commission (COSO) framework for risk management. The Company’s robust risk management framework identifies, evaluates and mitigates business risks to:
• Protect interests of key stakeholders • Achieve business objective and • Enable long-term sustainable growth
Strategic Risks
The key risks faced by JSW Steel and the strategies adopted to mitigate them, along with the capitals being affected, are explained or summarised in the table below.
Better Everyday. In Pursuit of Excellence. Corporate Overview Statutory Reports Financial Statements
31
RISK TYPE STRATEGIC RESPONSE CAPITALS IMPACTED
Water security
Energy security
Environment protection
Talent management
IT enablement
• Enhancing water storage capacities
• Enhancing efficiency of water management
• Optimising utilisation of waste off-gases
• Adding capacity of power transmission infrastructure
• Complying to increasingly stringent norms
• Adopting cleaner technologies
• Focussing on safe and sustainable products
• Promoting environmental stewardship and circular economy
• Attracting and retaining talent• Implementing inclusive policies and
processes• Succession planning• Providing learning and development
opportunities• Improving gender diversity
• Strengthening cyber security
• Developing disaster recovery site for SAP-ERP
RISK TYPE STRATEGIC RESPONSE CAPITALS IMPACTED
Occupational Health and Safety
• Enhancing behavioural safety
• Including safety performance in the variable pay of the senior management
• Conducting regular safety training and drills
• Providing medical facilities and health insurance benefits to all employees
Regulatory Risks
Operational Risks

JSW Steel Limited | Integrated Report 2017-18
32
Value-creation by The Capitals
KEY CAPITALS FinancialCapital
ManufacturedCapital

Better Everyday. In Pursuit of Excellence. Corporate Overview Statutory Reports Financial Statements
33
HumanCapital
IntellectualCapital
Social and Relationship Capital
NaturalCapital

JSW Steel Limited | Integrated Report 2017-18
34
UNDERTAKING ONE OF THE LARGEST CAPEX PROGRAMMES IN ITS HISTORY
A ~`40,000 crore capacity expansion drive to achieve manufacturing capability of 24.7 MTPA and build downstream facilities by FY21
Financial Capital

Better Everyday. In Pursuit of Excellence. Corporate Overview Statutory Reports Financial Statements
35

JSW Steel Limited | Integrated Report 2017-18
36
Making Cost Efficiency Better Everyday
JSW Steel has a strong pool of financial capital to sustain its growth.
Being in a capital-intensive industry, the Company's objective are to maintain a strong credit rating, healthy capital ratios and establish a capital structure that maximises returns to stakeholders through an optimum mix of debt and equity.
The Company’s capital requirement is mainly to fund capacity expansion, repayment of principal and interest on its borrowings and strategic acquisitions. The principle source of funding for the Company has been, and is expected to continue to be, cash generated from its operations supplemented by funds from bank borrowings and the capital markets.
The Company regularly considers other financing and refinancing opportunities to diversify its debt profile, reduce interest cost and elongate the maturity of its debt portfolio; and closely monitors the judicious allocation of the same amongst competing capital expansion projects and strategic acquisitions to capture market opportunities at minimum risk.
The Company monitors its capital using gearing ratio, which is net debt divided to total equity. Net debt includes interest-bearing loans and borrowings-less cash and cash equivalents, bank balances other than cash and cash equivalents and current investments.
Funds generated are utilised for operations of the business, government levies, dividend and funding growth and strategic investments.
During FY18, the global business cycle turnaround and structural factors provided fundamental support to steel demand. Supply reforms in China by way of continuing closure of inefficient production facilities and pollution-induced production curtailments, coupled with strong domestic demand in the country, led to lower exports. This discipline along with robust steel demand helped improve global steel demand-supply balance. Steel prices rebounded during the year due to resilient demand and improved steel demand-supply balance. Further, the improved steel spread coupled with higher volumes enabled the steel industry to deliver better results.
The Company delivered its highest-ever production volumes, sales, EBITDA and profit after tax during FY18. The Company also progressed well on several performance improvement initiatives, from diversified sourcing, optimisation of logistics costs, to digitalisation projects, thereby driving improvement in yields and productivity.
A detailed discussion on the financial and operational performance for FY18 is available in the Management Discussion and Analysis section.
Financial Performance
Interlinked Strategies (Pg 26-27) S1, S3, S5

Better Everyday. In Pursuit of Excellence. Corporate Overview Statutory Reports Financial Statements
37
• Robust financial profile and cash flows
— EBITDA margins: 21.1%, I14,974 crore
— Operating cash flow: I12,379 crore
— Capital investment cost: Less than $600/MT
• A strong balance sheet, indicating robust financial performance, achieved consistently over the years
— Reduction in Net Debt by I3,529 crore
— Net Worth of I27,534 crore
— Net Debt to EBITDA improved to 2.57x from 3.41x
— Net Debt to Equity down to 1.38x from 1.85x
• Diversified funding sources
— INR debt: 63%; Foreign currency debt: 37%
— Loans: 74%; Debentures and bonds: 26%
• Earnings per share of I25.85
• Highest-ever dividend of I3.20 per fully paid-up equity share of I1 each. The dividend pay-out ratio of 15% is based on the consolidated profit of the Company
Key Outputs and Outcomes
`27,534 croreNet Worth
21%EBITDA Margins
`71,670 crore Economic Value Generated
`63,193 crore Economic Value Distributed
`8,477 crore Economic Value Retained
Export Turnover (` crore)
2017-18
2016-17
2015-16
11,666
10,922
2,764
Domestic Turnover (` crore)
2017-18
2016-17
2015-16
53,380
45,322
37,590
Other Income (` crore)
2017-18
2016-17
2015-16
213
255
815
Economic Value Generated (` crore)
2017-18
2016-17
2015-16
71,670
56,499
41,169

JSW Steel Limited | Integrated Report 2017-18
38
In view of the finite resources at the Company’s disposal, it constantly strives to achieve higher efficiencies across the value chain of its operations. From sourcing of raw materials to delivering products to customers, it is persistently identifying ways to optimise costs and margins. Accordingly, a host of initiatives have been identified to achieve higher efficiencies across the Organisation.
A major step was the backward integration exercise in which iron ore mines were acquired to keep a lid on raw material costs and which will play a crucial role in making JSW Steel self-sufficient. Other measures include modifying the procurement strategy and sourcing raw material at costs better than the competitors, optimising coal blend with semi-hard and utilisation of low fe content iron ore to produce high-quality steel and keeping coke-making costs under check. In the year gone by, the Company did feel the heat from the sudden spike in prices of ferro alloys and electrodes. This is one area where there is scope to curtail costs significantly and the Company believes its efforts and investments on this front will yield results in FY19.
JSW Steel aspires to align with global benchmarks in the areas of energy management and use of environment-friendly inputs and processes, and will continue to set new milestones on these fronts. It is also taking initiatives to bring down logistics costs across the plants to optimise the process of transporting inputs as well as finished products.
It is no surprise then that the Company is constantly ranked among the top lowest-cost steel producers in the world. This is an outcome of relentless efforts to bring down conversion costs. The Company’s endeavours to boost cost optimisation are reflected adequately in its EBITDA margin which is above 20% in the last 2 years a feat achieved by only a handful of companies across the globe.
IT IS NO SURPRISE THEN THAT THE COMPANY IS CONSTANTLY RANKED AMONG THE TOP LOWEST-COST STEEL PRODUCERS IN THE WORLD. IT IS KNOWN TO UNDERTAKE SIZEABLE CAPACITY EXPANSIONS AT LOWER COST AND ITS CONVERSION COSTS ARE AMONG THE BEST IN THE INDUSTRY
CASE STUDY
Cost Optimisation

Better Everyday. In Pursuit of Excellence. Corporate Overview Statutory Reports Financial Statements
39
Adversities in the international steel market such as protectionism and demand crunch, or those in the domestic market such as liquidity crisis and import pressure, can limit the sales potential. As one of the largest steel producers in India with an export presence in over 100 countries, such scenarios have the potential to create significant effect on JSW Steel However, the Company’s flexibility to judiciously shift between domestic and international markets based on market conditions allows it to remain resilient in such situations. This is enabled by its extensive geographical presence in India and a nimble sales setup that is quick to realign sales efforts as per market conditions.
CASE STUDY
THE COMPANY’S FLEXIBILITY TO JUDICIOUSLY SHIFT BETWEEN DOMESTIC AND INTERNATIONAL MARKETS BASED ON MARKET CONDITIONS ALLOWS IT TO REMAIN RESILIENT IN ADVERSITIES
JSW Domestic Turnover as % of Total
JSW Export Turnover as % of Total
100%
90%
80%
70%
60%
50%
40%
30%
20%
10%
0%2007-08
2009-10
2010-11
2011-12
2015-16
2017-18
23
7785 84
7688
75
15 1624
12
25
Flexibility and Agility
Domestic and Exports Turnover as % of Total

JSW Steel Limited | Integrated Report 2017-18
40
ENSURING SUSTAINABLE RAW MATERIAL SUPPLY
All five iron ore mines won in the auctions to be operationalised in FY19
Manufactured Capital

Better Everyday. In Pursuit of Excellence. Corporate Overview Statutory Reports Financial Statements
41

JSW Steel Limited | Integrated Report 2017-18
42
Retaining Market Leadership by Being Better Everyday
Manufactured capital is part of the fabric of JSW Steel. It supports productivity, stimulates research and development, and guarantees investment for the future. Significant investments have been made in establishing efficient facilities at different locations across the country. Manufactured capital of the Company has the crucial role of an investor as well as a beneficiary of the Government of India's flagship 'Make in India' campaign.
Steel is the backbone of a developing economy like India and JSW Steel is a leading supplier to a variety of sectors: construction, infrastructure, automotive, industrial, engineering, energy and pipes and tubes. The Company can fulfil the requirements of the country with its dedicated investments under manufactured capital. Manufactured in the hot-
strip mills of its Vijayanagar (Karnataka) and Dolvi (Maharashtra) plants, a wide range of hot-rolled products are offered by JSW Steel essential for the manufacture of several white goods, the Company’s cold-rolled steel products are made in Vijayanagar plant.
Electrical steel products are manufactured in the modern facility at Vijayanagar Works. This steel has use across multiple sectors such as electric motors, generators, nuclear power stations, power generation plants and equipment, domestic appliances, transformers and automotive electricals.
Interlinked Strategies (Pg 26-27) S1, S2, S3, S6

Better Everyday. In Pursuit of Excellence. Corporate Overview Statutory Reports Financial Statements
43
JSW SCPL JSW SPCL JSW ARCL JSW
INDUSTRIAL
GASES
JSW SALAV
DIRECT ENERGY CONSUMPTION(IN '000 GJ)
2,202.9 0.4 46,742.7 175.0 9,507.1
INDIRECT ENERGY CONSUMPTION(IN '000 GJ)
1,009.9 15.1 952.5 2,389.0 0
SPECIFIC ENERGY CONSUMPTION(IN GJ/TONNES)
8.39 0.03 9.13 1,676 (GJ/MnNM3)
14.25
Note: This unit of measure is needed since the product is gases.
• Capacity utilisation: 91%
• Tunga Iron Ore Mines (Karnataka) made operational; another four iron ore mines to be made operational in FY19
• Highest ever crude steel production: 16.27 MnT
• Diverse product portfolio in the market (top 5):
— Hot rolled coils and sheets: 6.53 MnT
— Cold rolled coils and sheets: 2.07 MnT (up 6% y-o-y)
— Long rolled products: 3.55 MnT (up 16% y-o-y)
— Galvanised coils and sheets: 1.72 MnT (up 4% y-o-y)
— Prepainted Galvanised sheets: 0.62 MnT (up 3% y-o-y)
• Sales volume: 15.55 MnT (up 6% y-o-y)
— Value added and special products: 9 MnT (up 13% y-o-y)
• Pan-India reach through 8,600+ retail outlets and an export presence in over 100 countries, ensuring that the Company’s products enable people to lead a better quality of life
• Has one of the lowest conversion costs and low per tonne capacity addition cost, thereby ensuring maximum value creation for all stakeholders
• Reduction in energy consumption: 3.053 million GJ
Key Outputs and Outcomes
91%Capacity Utilisation
16.27 MTPAHighest Ever CrudeSteel Production
15.55 MTPA Sales Volume
Specific Energy Consumption (GJ/Tonne), JSW SL Capacity Utilisation (JSW SL) (%)
2017-18
2016-17
2015-16
91
89
81
2017-18
2016-17
2015-16
2014-15
27.57
26.33
28.11
32.27
Energy Consumption (Million GJ), JSW SL Share of Products in Total Sales (JSW SL)
Direct Energy
Indirect Energy
Value Added and Special Products
Other Products
2017-18
2016-17
2015-16
2014-15
385.463.1
376.6
405.37.5
354.915
39.5
2017-18
2016-17
2015-16
2014-15
2013-14
58%42%
34%66%
35%
33%67%
24%76%
65%

JSW Steel Limited | Integrated Report 2017-18
44
CASE STUDY
Debottle- necking SMS at Dolvi Works
In line with the Company’s ‘Better Everyday’ vision, the multiple manufacturing facilities of JSW Steel undergo continuous efficiency improvement drives. The case in point pertains to the debottlenecking exercise at the Steel Melting Shop (SMS) of JSW Steel Dolvi Works during the fourth quarter of FY18.
The process improvements taken up and the resulting benefits at the site were in four particular areas as elucidated below.
Improved launder utilisation for hot metal pouring
Benefits
• Reduction in refractory delays (Eccentric Bottom Tap-hole, i.e.
EBT Jam, Flapper Jamming, etc.)
• Increase in shell life
• Reduction in setup time by 6.3 minutes
Increase in oxygen blowing rate
Benefits
• Oxygen blowing flow increased by 15 Nm3/hr
• This has resulted in a decrease in blowing time by 2 min/heat
Preventive maintenance during EBT change and shell change
Benefits
• Proactive and preventive maintenance in the change process
• Reduction in delays caused earlier
Maximum hot metal usage
Benefits
• Hot metal usage was increased by 2.9%
• The arcing time has reduced by 3.2 min/heat
OVERALL, THIS DEBOTTLENECKING EXERCISE HAS RESULTED IN IMPROVED EFFICIENCY IN ASSET UTILISATION, REDUCED TIME CONSUMPTION AND LOWERED THE UNEXPECTED PROCESS DELAY RATES

Better Everyday. In Pursuit of Excellence. Corporate Overview Statutory Reports Financial Statements
45
JSW Steel is constantly ranked among the lowest-cost steel producers in the world. It is known to undertake sizeable capacity expansions at lower cost, with conversion costs that are among the best in the industry. For the last 10 years, the Company has been rated among the top 10 companies by World Steel Association. Guided by the philosophy of becoming 'Better Everyday', this is an outcome of the relentless efforts to improve performance, including those to bring down conversion costs.
CAPACITY ADDITION COST CONVERSION COST
$580 per tonne $116 per tonne
The agility of operations at JSW Steel has been the key source of strength and has helped it sail through numerous headwinds faced by the industry. It strives to be aware of the ground realities of the external environment and responds to them in a prompt and efficient manner. Owing to this proactiveness, the Company has been able to spot the power demand turnaround in the domestic market far ahead of its peers. Consequently, the Company embarked on a capacity expansion programme a few years ago and is now realising its potential.
Low Conversion and Capacity Addition Cost
CASE STUDY
WITH ADDITIONAL CAPACITIES IN PLACE, JSW STEEL IS AT THE FOREFRONT OF TAPPING INTO THE INCREMENTAL DEMAND IN THE DOMESTIC MARKET

JSW Steel Limited | Integrated Report 2017-18
46
A HAPPY AND ENGAGED WORKFORCE
Employee retention ratio of 95.35%
Human Capital

Better Everyday. In Pursuit of Excellence. Corporate Overview Statutory Reports Financial Statements
47

JSW Steel Limited | Integrated Report 2017-18
48
Nurturing Talent to be Better Everyday
In line with the vision to bring positive transformation to every life JSW Steel touches, the Company encourages individuals to explore their full potential and prepares them for greater responsibilities. The Company truly believes that improving everyday helps make 'better' happen for everyone, including employees. This is achieved by being empathetic and understanding what 'better' means to all stakeholders. A pre-requisite for this is to listen to all stakeholders without prejudice and use that learning to measure actions. This also enables JSW Steel to achieve one of the key purposes, 'Empowering Our People', which the Company does by adopting a participatory approach.
Interlinked Strategies (Pg 26-27) S6

Better Everyday. In Pursuit of Excellence. Corporate Overview Statutory Reports Financial Statements
49
Key Outputs and Outcomes
• Employee retention of 95+%, as a result of continuous
engagement with employees, welfare measures and
learning and development opportunities to create a
motivated workforce
• Learning & Development initiatives such as Project
Lakshya, Future Fit Leaders and IIM-A Executive
Education Programme enable employees to be better
prepared for the strategic pillar 'Build for Tomorrow'
• Online JSW Learning Academy to simplify and accelerate
training around three strategic pillars: career-based
capabilities, competency-based capabilities and
leadership
• Widening reach across leading campuses in
India through Summer Internship Programme and
Management Internship Programme to attract and retain
talent
• Human rights policy to ensure no discrimination and
demonstrating diversity enriches the Human Capital;
same benefits, training and skill enhancement for all
members of workforce - including contract workers and
differently-abled persons. Monitoring of compliance
with regulations as well as internal policies to ensure
nil complaints on child labour, forced labour and sexual
harassment at workplace.
• Promoting diversity by recruiting, developing, retaining
and advancing diverse talent, and initiatives such as
JSW Diversity and Inclusion - Springboard for women
employees
• Institutional mechanism to listen to employees through
interactions, tool-box talks, town halls and joint safety
committees. Also, Candid Conversation as a platform
for employees to have meaningful and free-flowing
interaction with the leadership team
• Addressing corruption through: biometric attendance
system and direct transfer of wages to the bank account
of contract employees
• Emphasis on safety at the workplace with Near-Miss
Reporting going up three-fold from FY17, increase in
safety training, linking of safety performance with the
variable pay of senior management (including executive
director) including executive director and safety audit by
the top management
95.35%Employee Retention
Total Employees, JSW SL
Training Hours Per Employee, JSW SL
Workforce Turnover by Age, JSW SL Injuries, JSW SL
Lost Time Injuries Rate, JSW SL
Management
Non-management
Contractual
Less than 30 years
30 - 50 years
More than 50 years
2017-18
2016-17
2015-16
20,4816,557
5,062
4,6096,783
5,1946,710
28,425
25,890
Management
Non-management
Contractual
2017-18
2016-17
2015-16
634
11
4837
4344
17
34
2017-18
2016-17
2015-16
51115
289
403202
506163
52
90
2017-18
2016-17
2015-16
77
50
83
Lost Day Rate, JSW SL
2017-18
2016-17
2015-16
0.42
0.36
0.50
2017-18
2016-17
2015-16
15.20
0.06
30.80

JSW Steel Limited | Integrated Report 2017-18
50
11,619Permanent Employees
Management 5,062
Non-management 6,557
Women 480
Differently-abled 19
< 30 years 3,764
30-50 years 6,120
> 50 years 989
Employees at Sites (segmented by age)
Permanent Employees 37
Management 11
Non-management 34
Permanent Female Employees 17
Temporary/contractual employees 6
Average Hours of Training Per Employee
28Permanent Workforce Represented through Recognised Employee Association (%)
< 30 years 305
30-50 years 123
> 50 years 78
Reported Injuries 77
Fatalities 5
LTI 72
LTIFR 0.42
Fatality Rate 0.03
Lost Day Rate 15.2
Temporary/Contractual 20,481
New Employee Hires 638
Resigned Employees 506
Employees Separated(segmented by age)
100%Percentage of employees receiving regular performance and career development reviews
Occupational Health & Safety

Better Everyday. In Pursuit of Excellence. Corporate Overview Statutory Reports Financial Statements
51
JSW
SCPL
JSW
SPCL
JSW
ARCL
JSW
INDUSTRIAL
GASES
JSW
SALAV
PERMANENT EMPLOYEES
1,978 26 213 33 155Management 759 8 160 22 98
Non-management 1,219 18 53 11 57
Male Employees 1,950 26 209 32 153
Female Employees 28 0 4 1 2
CONTRACTUAL EMPLOYEES
1,885 199 394 5 190NEW EMPLOYEE HIRES
22 0 0 1 0RESIGNED EMPLOYEES
63 1 8 2 23
EMPLOYEES AT SITES(SEGMENTED BY AGE)
< 30 Years 113 15 70 8 7
30-50 Years 1,278 9 129 22 83
> 50 Years 587 2 14 3 65
AVERAGE HOURS OF TRAININGPER EMPLOYEE
Permanent Employees 10.67 24.64 11.62 35.71 3.75
Management 3.83 3.69
Non-management 19.52 3.78
Permanent Female Employees 1.00 3.81
Temporary/Contractual Employees 2.01 3.29 12.9 3.81
PERCENTAGE OF EMPLOYEES RECEIVING REGULAR PERFORMANCE & CAREER DEVELOPMENT REVIEWS
100 100 100 100 100
OCCUPATIONAL HEALTH & SAFETY
Reported Injuries 9 0 5 0 1
LTI 9 0 5 0 1
LTIFR 0.15 0 0.264 0 0.10
Lost Day Rate 16.06 0 44.76 0 2.43

JSW Steel Limited | Integrated Report 2017-18
52
JSW Steel places great importance on its human capital and firmly believes that human rights of every individual need to be respected. The Company’s Guidelines and Code of Conduct are in harmony with the UN Declaration on Human Rights as well as the ILO (International Labour Organisation) Conventions. The policies address human rights issues across the supply chain.
The Company’s human rights policy is complemented by other specific policies such as occupational health and safety, environment, anti-corruption, etc. It articulates the Company’s stand on human rights, including non-discrimination, prohibition of child and enforced labour, and freedom of association and the right to engage in collective bargaining. Further, officers of security agencies are trained to act in a manner that respects human rights at all times and to comply with all the applicable national, state and local laws.
The Company contributes to the fulfilment of human rights through compliance with local human rights legislation, wherever it has operations, as well as through its policies, programmes and grievance redressal mechanisms.
JSW Steel is one of the six pioneering companies to sign up for the Business for Human Rights (Biz4HR) initiative of the Confederation of Indian Industry (CII) that intends to improve the human rights record in the value chain.
THESE STEPS PROVIDE A SAFE AND SECURE WORK ENVIRONMENT FOR ALL THE EMPLOYEES, LEADING TO GREATER PRODUCTIVITY AND WORK SATISFACTION
CASE STUDY
Human Rights are Fundamental to All Human Beings

Better Everyday. In Pursuit of Excellence. Corporate Overview Statutory Reports Financial Statements
53
Pre-retirement Workshops
Driven by 'Better Everyday', the Company has initiated pre-retirement workshops for its employees with the main objective of assisting them in preparing for the changes that takes place at retirement. These workshops explore the opportunities that the change in lifestyle makes available to them and makes them aware of the possible issues that become important while leading a retired life. These workshops that are held for the retiring employees and their spouses, cover the following core areas:
CASE STUDY
Health Preparedness
Psychological Preparedness
Social Preparedness
Financial Preparedness

JSW Steel Limited | Integrated Report 2017-18
54
STAYING AHEAD OF THE CURVE WITH ROBUST R&D INITIATIVES
Filed 16 patents across product and process categories in FY18
IntellectualCapital

Better Everyday. In Pursuit of Excellence. Corporate Overview Statutory Reports Financial Statements
55

JSW Steel Limited | Integrated Report 2017-18
56
Innovating for a Future that will be Better Everyday
Intellectual capital is critical to enhance the value proposition through development of unique and sustainable products and service solutions. The drive to better serve the growing infrastructure needs of India has spurred the adoption of new and improved technologies. The Company understands the importance of R&D and innovation and makes constant efforts to evolve and adapt to the changing needs. Resources to the tune of H41 crore are made available to a dedicated team of 155 persons constantly working to address these requirements. Intellectual capital helps the Company to realise its vision to 'Bring positive transformation to every life we touch'.
The Company believes that there is virtually no limit to becoming 'better' – be it related to products, processes, infrastructure or the surrounding world.
Building on the core strength of efficiency, the Company is driven to achieve excellence through innovation, expertise, quality and operational efficiency. This is demonstrated by numerous improvement initiatives in the Company.
Intellectual capital also enables the Company to engage with the consumers, giving it an opportunity to learn about the evolving needs, as well as to communicate the advantages of using superior quality steel at manufacturing sites. The product, JSW Neosteel, helps achieve this objective.
The Company believes that it is important to deliver the product of choice to the consumer. Through JSW Shoppes and JSW Explore, the Company is combining sales and services for providing the desired product to the end consumer.
Interlinked Strategies (Pg 26-27) S2, S4, S5, S6
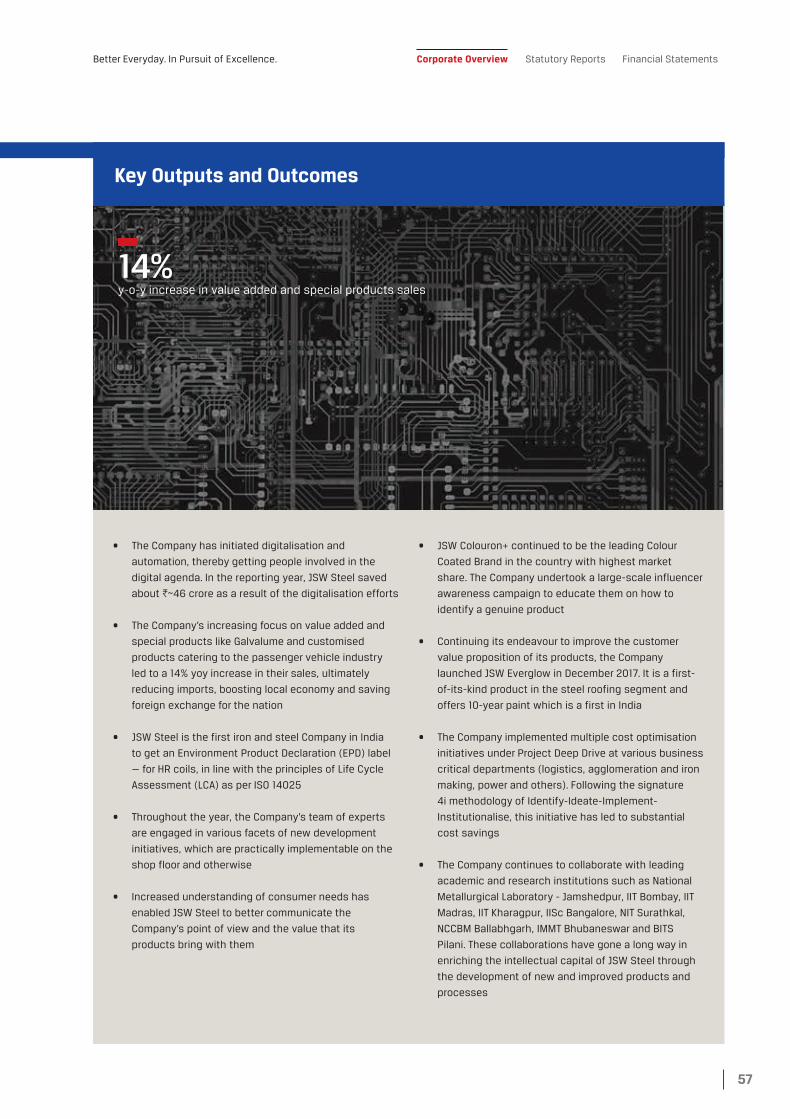
Better Everyday. In Pursuit of Excellence. Corporate Overview Statutory Reports Financial Statements
57
Key Outputs and Outcomes
• The Company has initiated digitalisation and
automation, thereby getting people involved in the
digital agenda. In the reporting year, JSW Steel saved
about H~46 crore as a result of the digitalisation efforts
• The Company’s increasing focus on value added and
special products like Galvalume and customised
products catering to the passenger vehicle industry
led to a 14% yoy increase in their sales, ultimately
reducing imports, boosting local economy and saving
foreign exchange for the nation
• JSW Steel is the first iron and steel Company in India
to get an Environment Product Declaration (EPD) label
— for HR coils, in line with the principles of Life Cycle
Assessment (LCA) as per ISO 14025
• Throughout the year, the Company’s team of experts
are engaged in various facets of new development
initiatives, which are practically implementable on the
shop floor and otherwise
• Increased understanding of consumer needs has
enabled JSW Steel to better communicate the
Company’s point of view and the value that its
products bring with them
• JSW Colouron+ continued to be the leading Colour
Coated Brand in the country with highest market
share. The Company undertook a large-scale influencer
awareness campaign to educate them on how to
identify a genuine product
• Continuing its endeavour to improve the customer
value proposition of its products, the Company
launched JSW Everglow in December 2017. It is a first-
of-its-kind product in the steel roofing segment and
offers 10-year paint which is a first in India
• The Company implemented multiple cost optimisation
initiatives under Project Deep Drive at various business
critical departments (logistics, agglomeration and iron
making, power and others). Following the signature
4i methodology of Identify-Ideate-Implement-
Institutionalise, this initiative has led to substantial
cost savings
• The Company continues to collaborate with leading
academic and research institutions such as National
Metallurgical Laboratory - Jamshedpur, IIT Bombay, IIT
Madras, IIT Kharagpur, IISc Bangalore, NIT Surathkal,
NCCBM Ballabhgarh, IMMT Bhubaneswar and BITS
Pilani. These collaborations have gone a long way in
enriching the intellectual capital of JSW Steel through
the development of new and improved products and
processes
14%y-o-y increase in value added and special products sales

JSW Steel Limited | Integrated Report 2017-18
58
The highly-competitive sector has begun witnessing a range of digitalisation efforts. JSW Steel is applying these to all critical areas of manufacturing operations, supply chain, and sales and marketing; and is collaborating with global firms to facilitate the journey. This process began with the identification of projects under Wave 1, and thereafter the implementation of the same. These helped the Company establish the power of analytics and automation, while simultaneously getting people involved in the digital agenda. Since the Company was able to identify the potential for value addition from these projects, several other new ones have been identified and are currently being implemented.
A DIGITAL CENTRE OF EXCELLENCE AND GOVERNANCE HAS HELPED IDENTIFY, PRIORITISE, MONITOR AND REVIEW PROJECTS THAT ARE CURRENTLY BEING IMPLEMENTED
CASE STUDY
Digitalisation at JSW Steel

Better Everyday. In Pursuit of Excellence. Corporate Overview Statutory Reports Financial Statements
59
THE CoRe TEAM PARTICIPATED IN THE FROST & SULLIVAN PERP AWARD 2017 AND WAS RECOGNISED AS THE FIRST RUNNER UP IN THE CATEGORY OF COST LEADERSHIP
CoRe Programme
Continuous Optimisation to Realise Excellence or CoRe was launched in FY17 as a breakthrough improvement methodology focusing on cost management. The purpose of the initiative was to generate ideas by involving every employee in the plant, besides suppliers and functional experts who were working at the site in other functions. The initiative was a KPI-based improvement approach, applying concepts of compressible, semi-compressible and incompressible costs. The scope included generation of ideas, evaluation of ideas, preparation of an action plan for implementation along with responsibility and target dates, and handover of the file to the respective HODs for implementation. The programme yielded benefits of about H227 crore in the last two years.
CASE STUDY

JSW Steel Limited | Integrated Report 2017-18
60
EXPANDING STAKEHOLDER CONNECT AND BRAND PRESENCE
22,000+ influencers contacted through 3,000 meets
Social & RelationshipCapital

Better Everyday. In Pursuit of Excellence. Corporate Overview Statutory Reports Financial Statements
61

JSW Steel Limited | Integrated Report 2017-18
62
Building Better Relationships Everyday
JSW Steel engages continuously with its diverse external stakeholders in a variety of ways. All along its development from a humble beginning to becoming a leading corporate citizen over the last two and a half decades, the Company has made incessant efforts to improve the quality of life in the neighbouring community. The Company reinforces relationships through regular engagement and partnerships with its key stakeholders: employees, customers, suppliers, community, financial and research institutions, government bodies and the civil society. Initiating meaningful changes, the Company has deployed a strategic inclusive development approach for its neighbouring communities.
On behalf of the Company, JSW Foundation has led the efforts over the years to identify and implement initiatives on seven thematic areas for social and community development prioritised after needs assessment. They encompass water, sanitation, environment, health, nutrition, education, skills, livelihoods, sports and art, culture and heritage, along with:1. Over 200,000 persons benefitted from various
health and nutrition initiatives, with malnutrition down by 35% and 22% in Vijayanagar and Tarapur, respectively.
2. In Vijayanagar, 1,063 farmers working on 923 hectares of farm land under soil improvement and moisture retention project have reported doubling of profitability, and 500 women were empowered economically through livelihood initiatives.
3. The OP Jindal Centres and JSW Skill Schools provide government-affiliated, state-of-the-art certificate vocational courses on topics such as metallurgical engineering, electrician, apparel-making and safety. Further, entrepreneurship training is imparted to over 450 women through 35 new self-help groups with credit linkages of `2.93 crore.
4. Over 10 million m3 of additional water storage capacity is being created through water-holding structures, restoring moisture in the soil and increasing ground-water level, resulting in prevention of migration of farmers.
5. Preserving national heritage6. Promoting sports7. Contributing to Swachh Bharat Abhiyaan (Clean India Mission)
These initiatives at all the manufacturing sites are regularly reviewed and their impacts assessed to serve as inputs for further engagement and better quality of lives in the community.
JSW Steel believes engaging effectively with all stakeholders constitute a fundamental part of its business operations, and the resources of the Company are utilised to benefit the society at large. While the Company is dependent on domestic as well as international suppliers for meeting its raw material requirement, it prioritises domestic sourcing over import wherever possible. A testimony to this is the fact that about 85% of the iron ore procured by the Company in FY18 was from domestic sources. Not only do the suppliers and vendors of the Company agree to abide by its Code of Conduct covering ethical, social and environmental aspects, it also subscribes to similar requirements from its customers. As a responsible corporate citizen, the Company complies with all regulatory and legal requirements, has not been subject to any penalties on account of the same, and also not been subject to any cases filed by any stakeholder relating to unfair trade practices, irresponsible advertising or anti-competitive behaviour.
Interlinked Strategies (Pg 26-27) S2, S3

Better Everyday. In Pursuit of Excellence. Corporate Overview Statutory Reports Financial Statements
63
• JSW Steel has been committing and consistently spending
resources beyond the statutory requirement of 2% of the
profits for CSR initiatives, even before the regulation was
created
• The Company engages with the government for policy
advocacy through leading apex and sector industry
bodies such as CII, FICCI, ASSOCHAM and Indian Steel
Association, among others
• Responds to queries from investors and rating agencies
across the world and engages with them to share insights
and experiences
• Design and implementation of an integrated water
management plan across all locations to ensure water
security for all, with about 200,00 m3 of water conserved
around the plants
• Creating plantations to enhance local ecosystems;
400,000 mangroves have been planted
• Engaging with the adjacent communities to provide them
healthcare in areas such as Palghar, Vijayanagar and
Ballari, among others enabling them to lead a better life.
Some sample results include about 8,000 community
and individual toilets were built, neurological and
ophthalmologic support was provided to 5,500 persons,
and a 20% reduction in malnutrition cases in Vijayanagar.
• Improving the quality of education by enabling access
to improved infrastructure and advanced methods such
as digital learning at a total cost of H21 crore, benefitting
45,000 children
• Empowering women to make the whole household 'better';
400+ self-help groups created and employment provided
to 430 women in BPOs, generating a revenue of H2.4 crore
• Ensuring food security and encouraging environmental
stability through the 'Zero-till Agriculture' and 'Salboni hi-
tech agriculture project’, in partnership with Jain Irrigation,
that has benefitted 3,500+ farmers in the last two years.
• JSW Foundation selected as training partner for the
new Skill Enhancement Scheme of Government of
Maharashtra, to improve employability of youth; 810
persons benefitted from these skill enhancement
initiatives while over H1.15 crore was spent on village
transformation
• Dedicated efforts have been directed towards restoration
of art, culture and heritage, thereby bringing them back to
their ancient glory
Key Outputs and Outcomes
20%Reduction in malnutrition cases in Vijayanagar

JSW Steel Limited | Integrated Report 2017-18
64
CASE STUDY
Adhering to the Principles of Ethics, Transparency and Accountability
JSW Steel believes in pursuing its business objectives ethically, transparently and with accountability to its stakeholders across the value chain. The Company is committed to promoting integrated responsible behaviour and value for social and environmental wellbeing. To this end, it has a policy on business conduct that is applicable to all its employees and value chain partners. JSW Steel is committed to not only continuing to allocate resources towards special corpus for Corporate Social Responsibility as per the categories of the Companies Act, 2013, but also to:
Assess the programmes and their impact through external agencies for culling out learnings along with continually evolving its own monitoring processes
Continue its stakeholder engagement in a mutually respectful manner and through social processes that help identify essential needs of the community for its overall growth of the same
Spread the culture of volunteerism through the process of social engagement
Align its actions to achieve not only the desired results at the grassroots level, but also to contribute towards the attainment of the UN Sustainable Development Goals
In line with the above, JSW Steel engages with leading industry bodies and organisations such as the World Steel Association, CII, FICCI, ASSOCHAM, Indian Steel Association, GRI, DJSI, CDP, UN Global Compact, Bangalore Chamber of Industry & Commerce, Karnataka Iron & Steel Manufacturing Association, Indian Institute of Metals, American Society of Metals, Association of Iron & Steel Technology (USA), Iron and Steel Institute of Japan, PMS (Metal Society of USA), Indian Chamber of Commerce and Bengal Chamber of Commerce & Industry. These engagements provide an opportunity for the Company to partner with the government for policy advocacy and work towards the collective welfare of the society, thereby enhancing value for all.

Better Everyday. In Pursuit of Excellence. Corporate Overview Statutory Reports Financial Statements
65
Customer Engagement at JSW Steel
CASE STUDY
JSW Steel's focus is to add value to its customers and remain a supplier of choice in all markets, while improving the wellbeing of customers and the society. The Company is committed to operating processes and conducting marketing promotions in a transparent and responsible manner by sharing product information.
JSW Steel strives to ensure an efficient customer feedback mechanism and conducts regular customer satisfaction surveys to understand their expectations and concerns.
To enable this, the Company has portals for customers and suppliers. While this facilitates procurement and delivery, it also provides opportunity to gauge evolving customer requirements and supplier capabilities. With some customers and suppliers, the Company even collaborates and co-creates. This type of innovation has helped in mutual profitability, while also reducing emissions and use of energy and other resources. Additionally, a grievance redressal mechanism is available to all stakeholders. Besides resolving the grievances seamlessly, this also provides an opportunity to engage more closely with the entire value chain. JSW Steel conducts customer satisfaction surveys through a third party. The survey captures customer expectations on the following attributes:
Product Quality
Order Servicing
Customer Relationship
Company Personnel
Customer Loyalty
IN FY18, THE COMPANY RECEIVED 1,145 COMPLAINTS FROM CUSTOMERS, OF WHICH 99% WERE RESOLVED

JSW Steel Limited | Integrated Report 2017-18
66
MOVING TOWARDS A GREENER FUTURE
1 million trees planted at Dolvi Works
NaturalCapital

Better Everyday. In Pursuit of Excellence. Corporate Overview Statutory Reports Financial Statements
67

JSW Steel Limited | Integrated Report 2017-18
68
Minimising Environmental Footprint to be Better Everyday
Natural resources such as iron ore, coal and other minerals are critical to the operations of JSW Steel. The Company realises that natural resources are indispensable, and continued and serious efforts are required to ensure they are not depleted. The objective of minimising the environmental footprint is essential for all business operations. The Company has adopted processes and developed products which are not only unique, but also environment friendly. To tackle concerns such as climate change and diminishing natural resources, the Company has a policy on Conservation and Preservation of the Environment which extends to the entire value chain. Through significant investment in natural capital, all plants of JSW Steel exceed compliance requirements.
JSW Steel has spearheaded several initiatives for the conservation of flora and fauna. The Company was among the pioneers to sign up and commit to the Indian Business and Biodiversity Initiative set up by the Confederation of Indian Industry (CII) in partnership with India's Ministry of Environment, Forests & Climate Change.
Metrics for JSW Steel # ITEM UNIT QUANTITY
1. Recycled Input Materials Million Tonnes 3.3
2. GHG Emission Intensity tCO2/ Tonnes 2.59
3. Emissions from Ozone Depleting Substances (ODS)
KG 2,150.3
4. Water Discharge by Quality and Destination
kL Zero discharge
Coal
Iron Bearing Material
Fluxes
Specific Material Consumption (T/T of crude steel), JSW SL
2017-18
2016-17
2015-16
2014-15
0.51.80
0.491.84
1.06
1.05
1.031.77
1.021.91
0.6
0.57
Interlinked Strategies (Pg 26-27) S3, S4, S6
Specific Water Consumption (m3/T of crude steel), JSW SL
2017-18
2016-17
2015-16
2014-15
4.13
4.57
3.61
4.52
Total Water Recycled & Reused ('000 KI), JSW SL
2017-18
2016-17
2015-16
2014-15
17,741
10,397
20,071
13,449
Specific material consumption reported for iron bearing materials in previous
years was for iron ore fines + lumps: 1.97, 1.64, 1.56 and 1.59 for 2014-15, 2015-16,
2016-17 and 2017-18

Better Everyday. In Pursuit of Excellence. Corporate Overview Statutory Reports Financial Statements
69
Key Outputs and Outcomes
• While 4.49 million GJ of energy was consumed, there was
also 3.05 million GJ of energy reduction due to efficiency
measures and conservation efforts
• While 67.32 million m3 of water was taken in, 17.74 million
m³ water was recycled or reused, and nearly 0.2 million m³
of water was conserved
• While 17.24 million tonnes of coal and 25.89 million tonnes
of iron ore was used as inputs, 3.30 million tonnes of
material was recycled
• 75 – kg paper recycling plant at Vijayanagar
• 42.15 million tonnes of GHG emissions, with specific GHG
emissions of 2.59
• The Company has worked closely with the Forest
Department, Government of Karnataka to protect and
enhance awareness on the endangered sloth bears at
Daroji Bear Sanctuary
3.05 million GJ of energy consumption reduced
• Working to ensure water security in tandem with various
government schemes such as Jal Yukta Shivar Abhiyan
(Maharashtra) and NABARD watershed development
programme (Tamil Nadu)
• Supported JSW Foundation in the JSW-Times of India Earth
Care Awards since 2007 to create mass awareness and also
to recognise excellence in addressing climate change
• Reduced waste being generated and sent to landfills
through initiatives such as Waste to Wealth for the recycling
of paper. Further, reduction in biodegradable waste being
disposed at all sites and townships has been undertaken
through the installation of composting equipment
• The Company sold 113% of the total slag generated for use
as input material in cement companies
DISCLOSURE JSW SCPL JSW SPCL JSW ARCL JSW INDUSTRIAL GASES JSW SALAV
Total Water Consumed ('000 m3) 1,169 4.287 2,446 1,047 2,644
Specific Water Consumption (m3/t of finished product)
1.450 0.01 0.47 684.58 M3/MnNM3 of finished product
3.96
Specific Emissions of NOx 0.038 Kg/t of finished product
- 0.012 Kg/t of finished product
0.399 kg/MnNM3 of finished product
0.049 Kg/t of finished product
Specific Emissions of SOx 0.089 Kg/t of finished product
- 0.016 Kg/t of finished product
0.304 kg/MnNM3 of finished product
0.016 Kg/t of finished product
Specific Emissions of SPM 0.058 Kg/t of finished product
- 0.059 Kg/t of crude steel
0.011 kg/MnNM3 of finished product
0.069 Kg/t of finished product
Hazardous Waste Generated 59 ‘000 t (+ 21,766 drums)
12.01 t 1,790 t + 10 m3
3,295 t 28.91 L
Non-hazardous Waste Generated 163 '000 t 73.17 t 10,720 t - 495 t
GHG Emissions ('000 TC02e), JSW SL
Other Emissions (Kg/T of crude steel), JSW SL
Total Waste Generated ('000 Tonnes), JSW SL
Direct
Indirect
NOx
SOx
SPM
Non Hazardous
Hazardous
2017-18
2016-17
2015-16
2014-15
41,528626
36,611
31,440661
26,8164,157
1,885
2017-18
2016-17
2015-16
2014-15
1.60.98
1.24
0.91.06
1.411.24
2.1
0.91.8
1.5
1.2
2017-18
2016-17
2015-16
2014-15
12,6621,572
12,385
8,1031,336
9,6621
119

JSW Steel Limited | Integrated Report 2017-18
70
Development of Low-cost, Accelerated Weathering Technology for Steel Slag
CASE STUDY
Mangrove Restoration at Dolvi
JSW Steel proactively gets involved multiple initiatives to enhance natural capital as it benefits the society. In line with this thought and with the knowledge that mangroves help reduce the impact of climate-related coastal hazards, the Company undertook an extensive mangrove restoration initiative at Dolvi. The phase-wise project, initiated in 2016, will be carried out over three years. Following are the key highlights of the project, implemented in association with Gram Panchayats and self-help groups:
5Villages Covered
7,817Fishermen and Farmers Benefitted
34Mangroves Working Self-Help Groups (SHGs) (345 Members)
26Meetings Conducted with Villagers
1,05,435Total Nursery Plants Developed and Planted
7Trainings Conducted for Mangroves Nursery
5,000 haLand Impacted
Progress so far:
June 2016 Laboratory trials completed
Feb 2017 Field trial starts with pilot projects
Nov 2016 Laboratory testing of aggregates completed
Mar 2017 Development of self-weathering method indigenously
Mar 2018 Discussion on with technology provider
Steel slag disposal is one of the major areas of concern for the steel industry, mainly because of its toxicity and slow weathering characteristic.

Better Everyday. In Pursuit of Excellence. Corporate Overview Statutory Reports Financial Statements
71
A Leader in Environment Protection
CASE STUDY
As a responsible producer of high-quality steel, the Company has undertaken a number of initiatives to improve the environment and help build a greener world. Select initiatives are listed below:
Installation of 71 dust analysers on stacks, 8 gas monitors on stacks, 6 AAQMS, 22 CCTVs and 6 effluent monitors across the steel complex
Installation of CO2 injection system at SMS-2: A unique project having the potential of saving 1,000 m³ of water daily, with a resultant reduction in the downtime of scrubbers from 72 hrs in a year to 36 hrs
GHG emissions at Dolvi Works is the lowest amongst steel plants in India
Installation of water sprinkler/wind net, dry fog and wet fog system in the raw material handling areas at Salem to reduce the fugitive emissions
2,023 tonnes of granulated blast furnace slag, 33,302 tonnes of slag sand, 178,575 tonnes of dry pit slag and 60,617 tonnes of steel slag is sold for road-making (NHAI project; Ballari-Hospet) under the the 'green highway' initiative
Introduction of low-cost alternate coals and semi-soft coal in coal blend

JSW Steel Limited | Integrated Report 2017-18
72
MRS. SAVITRI DEVI JINDALChairperson EmeritusMrs. Jindal was on the Board of the Company from May 2005 to October 2011. She is a visionary, renowned industrialist and the matriarch of O.P. Jindal Group. She was appointed Chairperson Emeritus of the Company w.e.f. October 21, 2011, upon the cessation of her role as its Director and Chairperson.
From left to right:Dr. Vinod Nowal, Mr. Seshagiri Rao M.V.S., Mr. Malay Mukherjee, Mr. Kannan Vijayaragavan, Dr. Vijay Kelkar,Mr. Sajjan Jindal, Dr. (Mrs.) Punita Kumar Sinha, Mr. Seturaman Mahalingam, Mr. Hiroyuki Ogawa, Mr. Jayant Acharya
MR. SAJJAN JINDAL Chairman & Managing Director,Non-Independent Executive Director Mr. Jindal holds a bachelor’s degree in mechanical engineering from Bangalore University. He is also the principal promoter of the Company. His dedication to the cause of a self-reliant India is reflected in the technological innovations that define and set apart each JSW company. Under his leadership, JSW Group has expanded into other core sectors of the economy, such as steel, power, infrastructure-building and cement. Today, the Group runs some of the most energy-efficient and eco-friendly manufacturing facilities in the country. Mr. Jindal serves as council member of Indian Institute of Metals and is a member of the Executive Committee as well as the Chairman of the Sustainability Committee of World Steel Association, and the former President of Institute of Steel Development and Growth. In 2007, he was named Ernst and Young ‘Entrepreneur of the Year’ in the manufacturing category. In 2009, he was honoured with Willy Korf Ken Iverson Steel Vision Award by American Metal Market & World Steel Dynamics.
Board of Directors
Better Everyday. In Pursuit of Excellence. Corporate Overview Statutory Reports Financial Statements
73
Mr. Haigreve Khaitan Mr. N. Jayaram
Not in group photo
MR. SESHAGIRI RAO M.V.S. Joint Managing Director & Group CFO,Non-Independent Executive Director Mr. Rao is the Joint Managing Director & Group CFO of JSW Steel, responsible for overall operations of JSW Steel, including strategy formulations related to business development, expansion of existing businesses, joint ventures, mergers and acquisitions, and cost management. He possesses a rich experience spanning over three decades in the steel sector and in the areas of corporate finance and banking. He joined JSW Group in 1997 as Chief Financial Officer and has played an active role in growth strategies of JSW Group since then. He has been involved in all the strategic decision-making within the Group and has grown with JSW Steel, progressively shouldering higher responsibilities. Prior to joining JSW Steel, he has worked with reputed organisations in various capacities. Mr. Rao is a member of Institute of Cost and Works Accountants of India and a licentiate member of Institute of Company Secretaries of India. He is also a certified associate of Indian Institute of Bankers and a diploma holder in business finance awarded by Institute of Chartered Financial Analysts of India.
DR. VINOD NOWAL Deputy Managing Director,Non-Independent Executive Director Dr. Nowal was appointed Director (Commercial) in April 2007 and redesignated as Director & Chief Executive Officer in April 2009. He was subsequently redesignated as Deputy Managing Director of JSW Steel in May 2013. He has been associated with the Group since 1984. He is currently the President of Karnataka Iron and Steel Manufacturers’ Association. He has also served as the President of Bangalore Chamber of Industry and Commerce and Tarapur Industrial Manufacturers Association, along with being the Chairman of Manufacturing Task Force Southern Region at ASSOCHAM, member of Manufacturing Task Force constituted by Government of Karnataka, member of a committee under Chief Minister of Karnataka for Employment in the manufacturing sector, member of Governing Body of M.S. Ramaiah Institute of Technology, Bangalore, advisory member on Board of T. John College, Bangalore, and member of Advisory Committee of Center of Excellence in Steel Technology (COEST) at IIT-Bombay. Dr. Nowal holds a master’s degree in business administration and a doctorate in inventory management. He has also acquired Advanced Management Program (AMP), a comprehensive executive leadership programme from the prestigious Harvard Business School, Boston, USA.
MR. JAYANT ACHARYA Director (Commercial & Marketing),Non-Independent Executive Director Mr. Acharya was appointed Director (Sales & Marketing) in May 2009 and was redesignated as Director (Commercial & Marketing) in April 2010. He is also the Co-Chair of the Committee on Steel & Non-Ferrous Metals for Federation of Indian Chamber of Commerce and Industry. Mr. Acharya holds a bachelor’s degree in chemical engineering and a master’s degree in physics from Birla Institute of Technology & Science, Pilani. He also holds a master’s in business administration from Indore University. He has over two decades of experience in the steel industry spanning the entire range of flat and long steel products.
MR. HIROYUKI OGAWANominee Director, JFE Steel Corporation, JapanMr. Ogawa holds a master’s degree in engineering from the Department of Mechanical Engineering, Graduate School of Engineering, The University of Tokyo. Mr. Ogama is Senior Vice President, Corporate Planning Department, Vietnam FHS Project Team, Mexico CGL Project Team, Technical Cooperation Dept. Prior to that he was Vice President, General Superintendent, West Japan Works, Fukuyama and Assistant General Superintendent, West Japan Works-Kurashiki. He joined Kawasaki Steel Corporation in 1985.
Commitees
Audit Committee Nomination and Remuneration CommitteeStakeholder Relationship CommitteeRisk Management Committee

JSW Steel Limited | Integrated Report 2017-18
74
MR. N. JAYARAM, IASNominee Director, KSIIDC A postgraduate from Bangalore University, Mr. Jayaram joined the Indian Administrative Service (IAS) in 2004. He has rich experience of working with the state government and various corporate bodies. He is presently the Managing Director of Karnataka State Industrial & Infrastructure Development Corporation Limited (KSIIDC) and is responsible for spearheading the implementation of infrastructure projects, including those on public-private partnership basis. He is also the Chief Executive Officer and executive member of Karnataka Industrial Areas Development Board (KIADB), which is developing and maintaining industrial areas, estates and industrial nodes along with corridors throughout the state.
MR. MALAY MUKHERJEE Independent Non-Executive DirectorMr. Mukherjee has over 40 years of experience in a range of technical, commercial and managerial roles in the mining and steel industry. Between October 2009 to 2011, Mr. Mukherjee served as the CEO of Essar Steel Global, a large integrated steel company in India. Before joining Essar Steel, Mr. Mukherjee was a member of the Board of Directors at Arcelor Mittal between 2008 and 2009. Between 2006 and 2008, Mr. Mukherjee served as the Senior Executive Vice President at Arcelor Mittal and a member of the Group Management Board. He was in charge of mines and operations in Africa, Asia, southern Europe (Bosnia, Macedonia), CIS, Ukraine and Kazakhstan and also responsible for stainless steel, pipes and tubes and technology. He also served as the COO of Mittal Steel Company between 2004 and 2006. He served as Executive Director of Works at Bhilai steel plant of Steel Authority of India Limited between 1991 and 1992. Mr. Mukherjee is a recipient of MECON Award from Indian Institute of Metals. Mr. Mukherjee holds a master's degree in mining from the USSR State Commission in Moscow and a BSc degree from Indian Institute of Technology in Kharagpur. Mr. Mukherjee is a member of Academy of Natural Sciences Kazakhstan and life member of Indian Institute of Metals. He was awarded a letter of appreciation from the President of Kazakhstan for work rendered in Kazakhstan from 1995 to 1999.
DR. (MRS.) PUNITA KUMAR SINHA Independent Non-Executive Director Dr. (Mrs.) Sinha was appointed to the Board of Directors in October 2012. She is the founder and Managing Partner, Pacific Paradigm Advisors, an independent investment advisory and management firm. Prior to founding Pacific Paradigm Advisors in 2012, she was Senior Managing Director of Blackstone Group, leading Blackstone Asia Advisors as the business unit head and Chief Investment Officer. Dr. (Mrs.) Sinha was also the Senior Portfolio Manager for The India Fund (NYSE: IFN), the largest Indian fund in the US for almost 15 years and The Asia Tigers Fund (NYSE: GRR), and The Asia Opportunities Fund L.P. Dr. (Mrs.) Sinha has more than 20 years of experience in fund management in international and emerging markets. She has a PhD and a master's in finance from Wharton School, University of Pennsylvania. She received her undergraduate degree in chemical engineering with distinction from Indian Institute of Technology, New Delhi. She also has an MBA and is a CFA Charter holder. Dr. (Mrs.) Sinha is a member of Boston Security Analysts Society and the Council on Foreign Relations. She is a Charter Member and Board Member of TIE-Boston.
MR. HAIGREVE KHAITANIndependent Non-Executive Director Mr. Khaitan, LLB, is a partner at Khaitan & Co. since 1995 and heads the firm's M&A and private equity practice. Mr. Khaitan began his career in litigation and moved on to specialise in corporate law. He has rich experience in all aspects of mergers and acquisitions – due diligence, structuring, documentation involving listed companies, cross-border transactions, medium and small businesses, etc., in restructuring, such as advice and documentation involving creditors restructuring, sick companies, demerger spinoffs and sale of assets and foreign investment, joint ventures and foreign collaborations. He advises a range of large Indian conglomerates and multinational clients in various business sectors, including infrastructure, power, telecom, automobiles, steel, software and information technology, retail, etc.

Better Everyday. In Pursuit of Excellence. Corporate Overview Statutory Reports Financial Statements
75
DR. VIJAY KELKAR Independent Non-Executive Director Dr. Kelkar was appointed on the Board of Directors in January 2010. He has held several key posts in the Government of India, including as advisor to the Minister of Finance, as Finance Secretary, Secretary of Ministry of Petroleum & Natural Gas, Chairman of 13th Finance Commission and Chairman of India Development Foundation in the rank of a Union cabinet minister. He has also previously served on several Government Task Forces, including as Chairman of the Tariff Commission, Chairman of the Implementation of the Fiscal Responsibility and Budget Management Act. He has served as the Chairman of NSE, and as Chairman (Elect.), Forum of Federations, Ottawa, Canada. He has also represented the Government of India on global forums as Executive Director for India, Sri Lanka, Bangladesh and Bhutan at International Monetary Fund, Washington D.C., USA, and has previously served as Director at the United Nations Conference on Trade and Development. Dr. Kelkar holds a BSc degree from University of Pune and MSc degree from the University of Minnesota (USA). He also holds a doctorate of philosophy in development economics from the University of California at Berkeley, USA. He is the recipient of the prestigious Padma Vibhushan award in 2011 for his exemplary service to India.
MR. SETURAMAN MAHALINGAM Independent Non-Executive Director Mr. Mahalingam, a chartered accountant by qualification, began his career as an IT consultant and thereafter played a major role in marketing Tata Consultancy Services (TCS) across the globe, developing processes and creating large software development centres for the company. He has held key positions such as Executive Director and Chief Financial Officer of TCS. Mr. Mahalingam retired from TCS in February 2013 after serving the company for over 42 years. Prior to becoming the Chief Financial Officer in February 2003, Mr. Mahalingam has managed many of the key functions in TCS, including marketing, operations, education and training, as well as human resources. He managed the Company’s operations in London and New York in the early days of TCS’ global journey. Mr. Mahalingam has also been the President of Computer Society of India and the Chairman of southern region of Confederation of Indian Industry (CII). He was also the President of Institute of Management Consultants of India. Mr. Mahalingam is the Chairman of CII National Council Task Force on Sector Skills Councils & Employment and was a member of the Tax Administration Reform Commission (TARC) set up by the Government of India under the chairmanship of Dr. Parthasarathi Shome. Mr. Mahalingam was chosen as the ‘Best CFO’ in various years by Business Today, International Market Assessment (IMA), CNBC TV18, CFO Innovation, Finance Asia and Institutional Investors. In 2012, Treasury & Risk, a US-based magazine, named him as one of the 16 most influential CFOs globally.
MR. KANNAN VIJAYARAGAVAN Independent Non-Executive Director Mr. Vijayaraghavan is a fellow member of Institute of Chartered Accountants of India, a certified management consultant and fellow of Institute of Management Consultants. He is the chairman and founder of Sathguru Management Consultants Pvt. Ltd., Hyderabad, a large consultancy and policy advisory firm founded in 1985. He is also a partner at DFK International, a worldwide firm of accountants and business advisors, a visiting fellow and faculty, Executive Education, Cornell University, Ithaca, NY, and a regional coordinator for Cornell University Research Programs in South Asia and South East Asian region. Over the last 26 years, he has handled over 300 assignments in the areas of strategic planning, mergers and acquisitions and organisational growth in emerging market related environment. He also has wide exposure to overseas environment with consulting exposure to large multinational and emerging national companies. Global companies consulted include 20 Fortune 500 companies, about 100 mid-cap enterprises and NASDAQ listed companies. He is a member of the International Advisory Committee of AUTM and honorary President of the Society for Technology Management (STEM), Indian Association of Technology Management Professionals.
Commitees
Audit Committee Nomination and Remuneration CommitteeStakeholder Relationship CommitteeRisk Management Committee

JSW Steel Limited | Integrated Report 2017-18
76
core principles of corporate governance
transparency and openness
management reporting to the board
executive committee
operat ions committee
board of directors
balanced board of execut ive and non-executive independent d irectors WITH DIVERSE RANGE OF EXPERTISE AND EXPERIENCE
provides strategic d irect ion and
elaluates overall performance
ensures the long-term interest of
the stakeholders are be ing served
under the guidance of the board and its committees, the company drives
performance by adopt ing various pol ic ies on key domains, such as corporate
governance, sustainabil ity and corporate social responsib il ity . these are
ava ilable at jsw. in/ investors/ investor-relat ions-steel
audit nomination& remuneration
business responsib il ity / sustainabil ity
reporting
stakeholder relationship
riskmanagement
project review
corporate social
responsib il ity
hedgingpolicyreview
employeestock option
ownership plan
finance
shareallotment
share/debenture transfer
code of conduct
implementation
board committees
finance risk operations sustainabil ity sales & marketing
legal informationtechnology
safety human resources
commercial
key corporate functions
Corporate Governance Framework

Better Everyday. In Pursuit of Excellence. Corporate Overview Statutory Reports Financial Statements
77

JSW Steel Limited | Integrated Report 2017-18
78
CSR at JSW Steel
Community and Social DevelopmentJSW Steel’s commitment to nation-building is also reflected in its CSR policy which is led by the philosophy of working closely with communities living contiguous to the Company’s operations and beyond. All the activities in the seven priority areas are carried out by the JSW Foundation on behalf of JSW Steel, and have benefitted over 650,000 persons. The financial year registered the best-ever performance for the Company, and the expenditure for CSR was `61 crore.
Health and Nutrition• Real-time growth tracking of children aged
below six years• Administration of spirulina• Institutional child-births• Mobile phone based updates for pre-and post-
natal care• Focus sites: Vijayanagar, Vasind and Tarapur• Cases of malnutrition down by 35% in
Vijayanagar and by 22% in Tarapur• Rural health camps, such as eye care• Upgradation of primary health care
infrastructure across sites.• Salem: eye care for students in government
schools• Vasind: cataract in tribal population (Shahapur
taluka, Thane district).• Vasind: Free physiotherapy for senior citizens
by experts from the Neurology Foundation of Bombay Hospital
• Vijayanagar, Dolvi and Salem: Continued awareness campaigns, check-up, counselling and referral on HIV-AIDS for truck drivers.
• Over 2,00,000 beneficiaries
Education and Learning• Continued emphasis on upgrading infrastructure of
government-run “anganwadis” (day-care centres) and schools across sites
• Computer-aided learning, digital classrooms and remedial classes for rural students
• Bellary and Palghar: Continued funding mid-day meals in rural schools
• Bellary: Shifting of Tamanna School for children with special needs to a new building with a capacity to house over 100 children
• Vasind and Salav: Mini science labs in government schools
• Over 230,000 beneficiaries
Agriculture • Vijayanagar: 923 hectares of farmland under soil
improvement and moisture-retention projects led to doubling of profit for 1,063 farmers and empowered over 500 women
• Palghar: over 3,500 farmers benefitted through the watershed initiatives to irrigate farms and scientific inputs from ICRISAT
• Palghar: training in bee-keeping to over 40 farmers• Palghar: Facilitated signing of farm-to-market agreements
for over 100 farmers

Better Everyday. In Pursuit of Excellence. Corporate Overview Statutory Reports Financial Statements
79
Water and Environment • Retain rainwater by constructing water-holding
structures, restoring moisture in the soil and increasing the ground water level
• Vijayanagar and Salem: water conservation efforts have led to increase of ground water level, resulting in water availability in peak summer
• Palghar: efforts to strengthen watershed in order to arrest migration of farmers
• Expect to increase over 10 million m3 of additional water storage capacity
Sports• Palghar: over 1,500 youths received training in
football and encouraged to participate in various state-level and district-level tournaments
• Salav: 182 girls trained in karate in association with the district karate association
Skill Enhancement• OP Jindal Centres (OPJCs) and JSW Skill
Schools committed to provide state-of-the-art government-affiliated certificate vocational courses to students.
• Vijayanagar: OPJC enrolled 216 students for courses such as metallurgical engineering and safety
• Vijayanagar: 75 persons certified electricians and apparel makers under the Pradhan Mantri Kaushal Vikas Yojana
• Vasind: 543 students enrolled in JSW Skills School for certificate courses that would help in gaining employment in topics such as basic automotive servicing, domestic electrician, and arc and gas welding. These are under the state government’s Pramod Mahajan Kaushalya Vikas Yojna
• Vasind: Beautician training course for girls at the OPJC
• Vijayanagar: 49 trained women started their own enterprises in embroidery, candle-making, jewellery and fashion designing, goat farming, etc.
• 35 new SHGs created for over 450 women; `2.93 crore credit linkages
Rural BPO• Women-only rural BPO; renamed JSW Shakti• New fourth Centre inaugurated at Dolvi in January 2018• Current employment in four BPOs: 430• Combined revenue `2.4 crore; surplus of `38 lakh.• Three BPOs certified to ISO 27001• MoUs signed with District Administration of West
Medinipur (West Bengal) and Ogawa Society, Nagpur (Maharashtra) to set up 2 additional women-only BPOs
• Aisha Begum, a BPO operator at Vijayanagar took a flight for the first time in her life to receive an award from Bureaucracy Today at Delhi in “Women Empowerment” category
Summary of Site-wise BeneficiariesVijayanagar: 2,00,000+ Tarapur: 1,00,000+ Salav: 5,000+ Kalmeshwar: 40,000+ Vasind: 75,000+ Salem: 15,000+ Dolvi: 2,00,000+

JSW Steel Limited | Integrated Report 2017-18
80
Assurance Statement
Independent Limited Assurance Statement on sustainability related performance indicator disclosures in the Integrated Report of JSW Steel Limited for the Financial Year Ended March 31, 2018
To The Board of Directors of JSW Steel Limited We have been engaged by the Management of JSW Steel Limited, to provide an independent Limited Assurance Statement on sustainability related performance indicators ('SPIs') described below and presented as per the “GRI Sustainability Reporting Standards (‘In accordance’ - Core)” issued by the Global Reporting Initiative ('the GRI Standards') in the Integrated Report of JSW Steel Limited ('JSW Steel/The Company') for the year ended March 31, 2018 ('the Report') covering - JSW Steel, JSW Steel Coated Products Limited ('JSW SCPL'), JSW Steel Processing Centre Limited ('JSW SPCL') , Amba River Coke Limited ('ARCL'), JSW Steel (Salav) Limited ('JSW Salav'), and JSW Industrial Gases Private Limited ('JSW Industrial Gases').
Subject MatterWe are required to provide limited assurance on the following SPIs reported in numerical figures, specific to the period from April 1, 2017 to March 31, 2018 in the Report in accordance with the GRI Standards for the year ended March 31, 2018.
The scope of work includes the following:
Natural Capital:
UNIT OF MEASURE/INDICATORS GRI STANDARD
TOPIC
DISCLOSURE
SCOPE OF COVERAGE
Coal 301: Materials JSW Steel
Iron Ore
Fluxes
Recycled Input Materials
Energy Consumption within Organization: Direct 302: Energy JSW Steel, JSW SCPL, JSW SPCL, JSW ARCL, JSW Industrial Gases, JSW SalavEnergy Consumption within Organization: Indirect
Total Energy
Energy Intensity
Reduction in Energy Consumption JSW Steel
Water withdrawal by source 303: Water JSW Steel, JSW SCPL, JSW SPCL, JSW ARCL, JSW Industrial Gases, JSW Salav
Water recycled & reused JSW Steel
Direct Scope 1 GHG emissions 305: Emissions
JSW Steel
Indirect Scope 2 GHG emissions JSW Steel
GHG emission intensity JSW Steel
Ozone depleting substances (ODS) JSW Steel
Non GHG emissions (SOx, NOx and TPM/SPM) JSW Steel, JSW SCPL, JSW SPCL, JSW ARCL, JSW Industrial Gases, JSW Salav
Water Discharge 306: Waste and Effluents
306: Waste and Effluents
Waste by type disposal: Hazardous JSW Steel, JSW SCPL, JSW SPCL, JSW ARCL, JSW Industrial Gases, JSW SalavWaste by type disposal: Non-Hazardous

Better Everyday. In Pursuit of Excellence. Corporate Overview Statutory Reports Financial Statements
81
Human Capital:
UNIT OF MEASURE/INDICATORS GRI STANDARD
TOPIC
DISCLOSURE
SCOPE OF COVERAGE
Permanent Employees 405: DIVERSITY & EQUAL
OPPORTUNITY
JSW Steel, JSW SCPL, JSW SPCL, JSW ARCL,
JSW Industrial Gases, JSW Salav
Management
Non-Management
Women
New Employees hires 401: EMPLOYMENTEmployees Resigned
Employees (segmented by age)
Employees Separated (segmented by age)
Average hours of Training per employee 404: TRAINING AND
EDUCATION
Reported Injuries 403: OCCUPATIONAL
HEALTH AND SAFETY
Fatalities
LTI
LTIFR
Lost Day Rate
Project BoundarySustainability Reporting boundary covers the following operations:• JSW Steel Limited - Operations specific to Vijayanagar,
Dolvi, and Salem• JSW Steel Coated Products Limited - Operations specific
to Kalmeshwar, Tarapur and Vasind• JSW Steel Processing Centres Limited• Amba River Coke Limited• JSW Steel (Salav) Limited and• JSW Industrial Gases Private Limited
Responsibility of the ManagementThe Company’s management is responsible for content of the report, identification of key issues, engagement with stakeholders, the identification and presentation of information including the responsibility for establishing and maintaining relevant and appropriate performance management systems and internal control framework to facilitate collection, calculation, aggregation and validation of the data with respect to the GRI Standards based SPIs, included in the Report and reported to us for obtaining assurance.
Our Independence, Ethical Requirements and Quality ControlWe have complied with independence policies of Deloitte Haskins and Sells LLP, which address the requirements of the International Federation of Accountants ('the IFAC') Code of Ethics for Professional Accountants in the role as independent auditors. We have complied with the relevant applicable requirements of the International Standard on Quality Control (ISQC) 1, Quality Control for Firms that Perform Audits and Reviews of Historical Financial Information, and Other Assurance and Related Services Engagements.
We also confirm that we have maintained our independence in the Report and there were no events or prohibited services related to the Assurance Engagement which could impair our independence.
Our ResponsibilityOur responsibility is to express a limited assurance conclusion on the SPIs, set out in the scope of work paragraph, as disclosed in the Report based on the procedures we have performed and the evidene we have obtained. We conducted our limited assurance in accordance with International Standard on Assurance Engagement ISAE 3000 (Revised) Assurance Engagements Other than Audits or Reviews of Historical Financial Information ('ISAE 3000') issued by the IFAC. This standard requires us to comply with ethical requirements and to plan and perform our limited assurance engagement to obtain sufficient appropriate evidence about whether the KPIs are free from material misstatement.
A limited assurance engagement is substantially less in scope than a reasonable assurance engagement in relation to both risk assessment procedures, including an understanding of internal controls, and the procedures performed in response to the assessed risks. The procedures we performed were based on our professional judgement and included inquiries, observation of process followed, inspection of documents, analytical procedures, evaluating appropriateness of quantification methods, agreeing or reconciling with underlying data.
In performing the procedures listed above we:• Interviewed key personnel including senior executives
at respective plant locations and at the corporate office to understand the governance, systems and controls in place during the reporting period; and

JSW Steel Limited | Integrated Report 2017-18
82
• Carried out site visits at the respective operational locations as specified in the project boundary in order to:
o Test data, perform analytical procedures, review of records and review of relevant documentations submitted by the Company, to arrive at the data presented in their Report; and
o Analyse and review key structures, systems, processes, procedures relating to collation, aggregation, validation and reporting of the selected SPIs on sample basis.
We have relied on the information, documents, records and explanations provided by the Company for the purpose of our review.
The procedures performed in a limited assurance engagement vary in nature from, and are less in extent than for, a reasonable assurance engagement. As a result, the level of assurance obtained in a limited assurance engagement is substantially lower than the assurance that would have been obtained had a reasonable assurance engagement been performed. Accordingly, we do not express a reasonable assurance opinion about whether the SPIs have been presented, in all material respects, in accordance with GRI Standards.
Further, a limited assurance engagement does not constitute an audit or review of any of the underlying information in accordance with International Standards on Auditing or International Standards on Review Engagements and accordingly, we do not express an audit opinion or review conclusion.
Our ObservationsWe believe our work provides an appropriate basis for our observations, which are mentioned below:• The companies can improve on bringing uniformity in
reporting of SPIs across locations;• Good practices adopted in certain plants can be
replicated across all the other plants;• Companies may undertake actions to understand the
biodiversity near the operational sites;• Make provision to include human rights discrimination
and environmental issues as areas of concern under grievances handling mechanism across all locations;
• Provision of more focused training on human rights policies to employees, associates and security staff; and
• Make provision to undertake supplier assessments for reporting indicators on supplier environmental assessment.
Areas of further improvement wherever identified have been brought before the attention of the management of the Company. Site-specific observations and recommendations have been provided in the management letter, which shall be submitted to the Company separately.
Our ConclusionsThe procedures we have performed and the documents and records that were made available to us and according to the information and explanations provided to us by the Company in connection to the review of the SPIs disclosed in the Report provides an appropriate basis for our conclusion as per ISAE 3000 (Revised).
Based on the procedures performed and the evidence we have obtained obtained, nothing has come to our attention that causes us to believe that the SPIs set out in the subject matter paragraph for the year ended March 31, 2018, are not prepared, in all material respects, in accordance with the GRI Standards.
Other MattersThe assurance scope excludes:• The Company’s financial performance;• The Company’s statements that describe or report data
pertaining to market share assessment; opinion; beliefs; future performance plans/strategies;
• Any comparison in any form of performance related to any of the SPIs of the financial year 2017-18 with the SPIs of other Financial Years; and
• Design standards or features or technical assessment of the capacity, efficiency and efficacy of the technologies or utilities of the Company.
Restriction on Use and DistributionOur work has been undertaken to enable us to express a limited assurance conclusion on the SPI disclosures in the Report to the Directors of the Company in accordance with the terms of our engagement, and for no other purpose. We do not accept or assume liability to any party other than the Company, for our work, for this report, or for the conclusion we have reached.
For DELOITTE HASKINS & SELLS LLPChartered Accountants
(Firm’s Registration No. 117366W/W-100018)
Pratiq ShahPartner
(Membership No. 111850)Place: MumbaiDate: July 4, 2018

Better Everyday. In Pursuit of Excellence. Corporate Overview Statutory Reports Financial Statements
83
Business Responsibility Report (2017-18)
Section A: General Information about the CompanyDISCLOSURE ITEM RESPONSE
1 Corporate Identity Number (CIN) of the Company L27102MH1994PLC152925
2 Name of the Company JSW Steel Limited
3 Registered address JSW CentreBandra Kurla ComplexBandra East, Mumbai - 400 051.Maharashtra India.Tel: +91 22 4286 1000Fax: +91 22 4286 3000
4 Website www.jsw.in
6 Financial Year reported 2017-18
7 Sector(s) that the Company is engaged in (industrial activity code-wise)
Manufacture of Iron and Steel
Industrial Group Description
071 Mining of iron ores
241 Manufacture of basic iron and steel
243 Casting of metals
259 Manufacture of other fabricated metal products; metalworking service activities
8 List three key products/services that the Company manufactures/provides (as in balance sheet)
1. Hot rolled coils2. Cold rolled coils3. Galvanised steel
9 Total number of locations where business activity is undertaken by the Company
i. Number of International Locations (Provide details of major 5) Through subsidiaries:a. USA (Texas, near Houston): Plate and pipe millb. USA (West Virginia): Coking coal minesc. Chile (North Caldera): Iron ore mines under care &
maintenanced. Mozambique: Mining operations under care &
maintenancee. Georgia (Rustavi): Steel plant (Joint Venture)
ii. Number of National Locations In India, JSW Steel Ltd. has three main operational integrated iron and steel manufacturing locations, at Vijayanagar (Karnataka), Dolvi (Maharashtra) and Salem (Tamil Nadu).
10 Markets served by the Company - Local/State/National/International/
JSW Steel is India’s leading integrated iron and steel producer, with a pan-India presence and exports to over 140 countries. Nearly 23% of the total sales are carried out through retail network of more than 8,300 outlets in across 575 districts. The focus geographic areas of the company are south and west, but it serves a variety of customers in various market segments.

JSW Steel Limited | Integrated Report 2017-18
84
Section B: Financial Details of the CompanyDISCLOSURE ITEM RESPONSE
1 Paid up capital (`) 241.72 crore
2 Total turnover (`) 71,670 crore
3 Total profit after taxes (`) 6,113 crore
4 Total spending on corporate social responsibility (CSR) as percentage of profit after tax (`) (%)
61 crore (This is 3.8% of average PAT of previous 3 financial years)
5 List of activities in which expenditure in # 4 above has been incurred.
The Company’s efforts have focused on five areas - Nutrition & Healthcare, Water & Sanitation, Education, Skill Development, Art Culture & Sports - and expenditure has been under the following heads:
a. Improving living conditions
b. Promoting social development
c. Addressing social inequalities
d. Addressing environmental issues
e. Preserving national heritage
f. Promotion of sports
g. Rural development projects
h. Clean India Mission (Swachh Bharat Abhiyaan)
i. Project Management Cost
Section C: Other Details DISCLOSURE ITEM RESPONSE
1 Does the Company have any Subsidiary Company/Companies? Yes
2 Do the Subsidiary Company/Companies participate in the BR Initiatives of the parent company? If yes, then indicate the number of such subsidiary company(s)
Yes. Some of the major subsidiaries of JSW Steel Ltd. are:a. JSW Steel Coated Products Ltd.b. JSW Steel Processing Centres Ltd.c. Amba River Coke Ltd.d. JSW Steel (Salav) Ltd.e. JSW Industrial Gases Pvt. Ltd.
3 Do any other entity/entities (e.g. suppliers, distributors etc.) that the Company does business with/participate in the BR initiatives of the Company? If yes, then indicate the percentage of such entity/entities (less than 30%, 30-60%, more than 60%).
JSW Steel’s value chain partners (e.g., suppliers and contractors) are encouraged to contribute to its CSR initiatives. However, with the expansive nature of JSW Steel’s value chain, currently less than 30% of the entities directly partner with JSW Steel in its BR initiatives.
Section D: BR Information 1. Details of Director/Directors Responsible for BR
# NAME DIN TELEPHONE EMAIL ID
1 Mr. Malay MukherjeeChairman & Independent Director
02861065 (91) 11 4103 2905 [email protected]
2 Mrs. Punita Kumar SinhaIndependent Director
5229262 (91) 98333 63533 [email protected]
3 Mr. K. VijayaraghavanIndependent Director
00544730 (91) 40 2335 0586 [email protected]
4 Mr. Seshagiri Rao M.V.S.Executive Director
00029136 (91) 22 4286 1000 [email protected]
5 Dr. Vinod Nowal Executive Director
00046144 (91) 22 4286 1000 [email protected]
6 Mr. Jayant Acharya Executive Director
00106543 (91) 22 4286 1000 [email protected]
NAME DESIGNATION TELEPHONE EMAIL ID
Dr. S. Majumdar Chief Sustainability Officer, JSW Group (91) 22 4286 1000 [email protected]

Better Everyday. In Pursuit of Excellence. Corporate Overview Statutory Reports Financial Statements
85
2. Principle-wise (as per the National Voluntary Guidelines) BR policy/policies (Reply in Y/N)
# DISCLOSURE ITEM RESPONSE
QUESTIONS P1 P2 P3 P4 P5 P6 P7 P8 P9
1 Do you have a policy/policies for: Yes Yes Yes Yes Yes Yes Yes Yes Yes
2 Has the policy been formulated in consultation with relevant stakeholders?
Yes Yes Yes Yes Yes Yes Yes Yes Yes
3 Does the policy conform to any international/national standards? If yes, specify? (50 words)
Yes ref. A, F, G
Yes ref. B, F
Yes ref. C, F
Yes ref. B, F
Yes ref.B, F
Yes ref. A, D, F, G
Yes ref. E, F
Yes ref. A, F
Yes ref. A, F
A: National Voluntary Guidelines on Social, Environmental and Economic Responsibilities of BusinessB: ILO Convention on Human RightsC: Report on Affirmative Action by CIID: National Action Plan on Climate Change, National Environmental PolicyE: UN Sustainable Development GoalsF: Global Reporting InitiativeG: Carbon Disclosure Project (CDP)H: Dow Jones Sustainability Index (DJSI)
4 Has the policy been approved by the Board? Yes Yes Yes Yes Yes Yes Yes Yes Yes
Is yes, has it been signed by MD/owner/CEO/appropriate Board Director? Yes Yes Yes Yes Yes Yes Yes Yes Yes
5 Does the company have a specified committee of the Board/Director/Official to oversee the implementation of the policy?
Yes Yes Yes Yes Yes Yes Yes Yes Yes
6 Indicate the link for the policy to be viewed online?
http://www.jsw.in/investors/investor-relations-steel(under section “Sustainability Policies”)
7 Has the policy been formally communicated to all relevant internal and external stakeholders?
Yes Yes Yes Yes Yes Yes Yes Yes Yes
8 Does the company have in-house structure to implement the policy/policies?
Yes Yes Yes Yes Yes Yes Yes Yes Yes
9 Does the Company have a grievance redressal mechanism related to the policy/policies to address stakeholders’ grievances related to the policy/policies?
Yes Yes Yes Yes Yes Yes Yes Yes Yes
10 Has the company carried out independent audit/evaluation of the working of this policy by an internal or external agency?
Yes Yes Yes Yes Yes Yes Yes Yes Yes
2a If answer to S. No. 1 against any principle, is ‘No’, please explain why: (Tick up to 2 options)
QUESTIONS P1 P2 P3 P4 P5 P6 P7 P8 P9
1 The company has not understood the Principles
Not Applicable
2 The company is not at a stage where it finds itself in a position to formulate and implement the policies on specified principles
3 The company does not have financial or manpower resources available for the task
4 It is planned to be done within next 6 months
5 It is planned to be done within the next 1 year
6 Any other reason (please specify)
3. Governance Related to BR
1 Indicate the frequency with which the Board of Directors, Committee of the Board or CEO to assess the BR performance of the Company. Within 3 months, 3-6 months, Annually, More than 1 year
3-6 months
2 Does the Company publish a BR or a Sustainability Report? What is the hyperlink for viewing this report? How frequently it is published?
This Integrated Report for JSW Steel Ltd. acts as the Sustainability Report as well as the Business Responsibility Report for FY18 The hyperlink to view all the published reports: http://www.jsw.in/investors/investor-relations-steel
JSW Steel Limited | Integrated Report 2017-18
86
Current Location Disclosure Page No.
Principle 1
1. Does the policy relating to ethics, bribery and corruption cover only the company? Yes/ No. Does it extend to the Group/Joint Ventures/ Suppliers/Contractors/NGOs /Others?
Case study in Social & Relationship Capital
P1-1 64
2. How many stakeholder complaints have been received in the past financial year and what percent was satisfactorily resolved by the management? If so, provide details thereof, in about 50 words or so.
Social and Relationship Capital P1-2 62
Principle 2
1. List up to 3 of your products or services whose design has incorporated social or environmental concerns, risks and/or opportunities.
Key Intellectual Capital Outputs and OutcomesNatural Capital Introduction
P2-1 57, 68
2. For each such product, provide the following details in respect of resource use (energy, water, raw material etc.) per unit of product (optional).
Key Natural Capital Outputs and Outcomes
P2-2 68-69
3. Does the company have procedures in place for sustainable sourcing (including transportation)? If yes, what percentage of your inputs was sourced sustainably? Also, provide details thereof in 50 words or so.
JSW value chain: Logistics P2-3 8
4. Has the company taken any steps to procure goods and services from local & small producers, including communities surrounding their place of work? If yes, what steps have been taken to improve their capacity and capability of local and small vendors?
Social and Relationship Capital P2-4 62
5. Does the company have a mechanism to recycle products and waste? If yes, what is the percentage of recycling of products and waste (separately as <5%, 5-10%, >10%). Also, provide details thereof, in about 50 words or so.
JSW value chain: RecyclingNatural Capital
P2-5 8, 68-69
Principle 3
1. Please indicate the Total number of employees. Human Capital P3-1 49-51
2. Please indicate the total number of employees hired on temporary/contractual/casual basis.
Human Capital P3-2 49-51
3. Please indicate the Number of permanent women employees. Human Capital P3-3 49-51
4. Please indicate the Number of permanent employees with disabilities.
Human Capital P3-4 49-51
5. Do you have an employee association that is recognised by management?
Human Capital P3-5 49-51
6. What percentage of your permanent employees is members of this recognized employee association?
Human Capital P3-6 49-51
7. Please indicate the Number of complaints relating to child labour, forced labour, involuntary labour, sexual harassment in the last financial year and pending, as on the end of the financial year.
Human Capital P3-7 49
8. What percentage of your under mentioned employees were given safety & skill up-gradation training in the last year?
Human Capital P3-8 48-53
Principle 4
1. Has the company mapped its internal and external stakeholders? Yes/No
Stakeholder Engagement and MaterialitySocial and Relationship Capital
P4-1 22-23, 62-63
Mapping the Principles of the National Voluntary Guidelines

Better Everyday. In Pursuit of Excellence. Corporate Overview Statutory Reports Financial Statements
87
Mapping the Principles of the National Voluntary Guidelines
Current Location Disclosure Page No.
2. Out of the above, has the company identified the disadvantaged, vulnerable & marginalised stakeholders.
Social and Relationship Capital P4-2 62-63
3. Are there any special initiatives taken by the company to engage with the disadvantaged, vulnerable and marginalized stakeholders. If so, provide details thereof in 50 words or so.
Social and Relationship Capital P4-3 62-63
Principle 5
1. Does the policy of the company on human rights cover only the company or extend to the Group/ Joint Ventures/ Suppliers/ Contractors/ NGOs/ Others?
Key Human Capital Outputs and OutcomesCase study in Human Capital
P5-1 49, 52
2. How many stakeholder complaints have been received in the past financial year and what percent was satisfactorily resolved by the management?
Social and Relationship CapitalHuman Capital
P5-2 59, 62
Principle 6
1. Does the policy related to Principle 6 cover only the company or extends to the Group/Joint Ventures/Suppliers/Contractors/NGOs/others.
Natural Capital P6-1 68
2. Does the company have strategies/initiatives to address global environmental issues such as climate change, global warming, etc.? Y/N. If yes, please give hyperlink for webpage etc.
Natural Capital P6-2 68-71
3. Does the company identify and assess potential environmental risks? Y/N
Natural Capital P6-3 68-71
4. Does the company have any project related to Clean Development Mechanism? If so, provide details thereof, in about 50 words or so. Also, if Yes, whether any environmental compliance report is filed?
The Company does not have any project related to Clean Development Mechanism
P6-4 NA
5. Has the company undertaken any other initiatives on – clean technology, energy efficiency, renewable energy, etc. Y/N. If yes, please give hyperlink for web page etc.
Natural Capital P6-5 68-71
6. Are the Emissions/Waste generated by the company within the permissible limits given by CPCB/SPCB for the financial year being reported?
Social & Relationship Capital P6-6 62
7. Number of show cause/legal notices received from CPCB/SPCB which are pending (i.e. not resolved to satisfaction) as on end of Financial Year.
Social & Relationship Capital P6-7 62
Principle 7
1. Is your Company a member of any trade and chamber or association? If Yes, Name only those major ones that your business deals with.
Key Social and Relationship Capital Outputs and OutcomesSocial & Relationship Capital case study
P7-1 63-64

JSW Steel Limited | Integrated Report 2017-18
88
Mapping the Principles of the National Voluntary Guidelines
Current Location Disclosure Page No.
2. Have you advocated/lobbied through above associations for the advancement or improvement of public good? Yes/No; if yes specify the broad areas (Governance and Administration, Economic Reforms, Inclusive Development Policies, Energy security, Water, Food Security, Sustainable Business Principles, Others)
Key Social and Relationship Capital Outputs and OutcomesSocial & Relationship Capital case study
P7-2 63-64
Principle 8
1. Does the company have specified programmes/initiatives/projects in pursuit of the policy related to Principle 8 ? If yes details thereof
Social & Relationship Capital P8-1 62-63
2. Are the programmes/projects undertaken through in-house team/own foundation/external NGO/government structures/any other organization?
Social & Relationship Capital P8-2 62-63
3. Have you done any impact assessment of your initiative? Social & Relationship Capital P8-3 62-63
4. What is your company’s direct contribution to community development projects- Amount in INR and the details of the projects undertaken.
Performance Highlights for FY18Social & Relationship Capital
P8-4 3, 62-63
5. Have you taken steps to ensure that this community development initiative is successfully adopted by the community? Please explain in 50 words or so.
Social & Relationship Capital P8-5 62-63
Principle 9
1. What percentage of customer complaints/consumer cases are pending as on the end of financial year.
Social & Relationship Capital case study
P9-1 65
2. Does the company display product information on the product label, over and above what is mandated as per local laws? Yes/No/N.A./Remarks (additional information)
NA P9-2 NA
3. Is there any case filed by any stakeholder against the company regarding unfair trade practices, irresponsible advertising and/or anti-competitive behaviour during the last five years and pending as on end of financial year. If so, provide details thereof, in about 50 words or so.
Social & Relationship Capital P9-3 62
4. Did your company carry out any consumer survey/consumer satisfaction trends?
Social & Relationship Capital case study
P9-4 65
Better Everyday. In Pursuit of Excellence. Corporate Overview Statutory Reports Financial Statements
89
Mapping the UN SDGs and the Capitals
CAPITALSTARGETS
3.9 Reduce number of deaths and illnesses due to pollution PG 54-71
3.2 End preventable deaths of newborns and
children under 5 years of age PG 60-65
5.5 Ensure women’s full and effective participation and equal opportunities for leadership PG 46-53
6.3 Improve water quality PG 60-71
6.4 Increase water-use efficiency PG 66-71 6.6 Protect and restore water-related
ecosystems PG 60-71
7.3 Improve energy efficiency 40-45, 66-71
8.8 Protect labour rights and promote safe and secure working environment PG 46-53
9.2 Promote inclusive and sustainable industrialisation PG 40-45
9.4 Upgrade infrastructure and retrofit industries to make them sustainable PG 40-45, 54-59, 66-71
10.3 Equal opportunity and reduction in inequalities PG 46-53
12.2 Sustainable management and efficient use of natural resources PG 66-71
12.4 Environmentally sound management of chemicals and all wastes PG 66-71
12.5 Reduce waste generation PG 40-45, 66- 71
12.6 Adopt sustainable practices and integrate sustainability information into reporting PG 34-39, 46-53, 66-71
13.3 Education, awareness-raising and human and institu tional capacity on climate change PG 8, 20-21, 66-71
SDG
Ensure healthy lives and promote well-being for all at all ages
Achieve gender equality and empower all women and girls
Ensure availability and sustainable management of water and sanitation for all
Ensure access to affordable, reliable, sustainable and modern energy for all
Promote sustained, inclusive and sustainable economic growth, full and productive employment and decent work for all
Build resilient infrastructure, promote inclusive and sustainable industrialisation and foster innovation
Reduce inequality within and among countries
Ensure sustainable consumption and production patterns
Take urgent action to combat climate change and its impacts

JSW Steel Limited | Integrated Report 2017-18
90
GRI Content Index
GRI STANDARD NUMBER
GRI STANDARD TITLE DISCLOSURE NUMBER
DISCLOSURE TITLE PAGE NO.
GRI 102 General Disclosures 102-1 Name of the organization 1
GRI 102 General Disclosures 102-2 Activities, brands, products and services 6-13
GRI 102 General Disclosures 102-3 Location of headquarters Mumbai
GRI 102 General Disclosures 102-4 Location of operations 9
GRI 102 General Disclosures 102-5 Ownership and legal form 6
GRI 102 General Disclosures 102-6 Markets served 9
GRI 102 General Disclosures 102-7 Scale of the organization 20-21
GRI 102 General Disclosures 102-8 Information on employees and other workers 49-51
GRI 102 General Disclosures 102-9 Supply chain 8, 62
GRI 102 General Disclosures 102-10 Significant changes to the organization and its supply chain 8, 62
GRI 102 General Disclosures 102-11 Precautionary Principle or approach 8,22-23, 26-31, 56-59, 68-71
GRI 102 General Disclosures 102-12 External initiatives 1
GRI 102 General Disclosures 102-13 Membership of associations 64
GRI 102 General Disclosures 102-14 Statement from senior decision-maker 14-17
GRI 102 General Disclosures 102-16 Values, principles, standards and norms of behaviour 6
GRI 102 General Disclosures 102-18 Governance structure 72-77
GRI 102 General Disclosures 102-40 List of stakeholder groups 22-23
GRI 102 General Disclosures 102-41 Collective bargaining agreements 50, 52
GRI 102 General Disclosures 102-42 Identifying and selecting stakeholders 22-23
GRI 102 General Disclosures 102-43 Approach to stakeholder engagement 22-23
GRI 102 General Disclosures 102-44 Key topics and concerns raised 22-23
GRI 102 General Disclosures 102-45 Entities included in the consolidated financial statements 1
GRI 102 General Disclosures 102-46 Defining report content and topic Boundaries 1
GRI 102 General Disclosures 102-47 List of material topics 23
GRI 102 General Disclosures 102-48 Restatements of information NA
GRI 102 General Disclosures 102-49 Changes in reporting NA
GRI 102 General Disclosures 102-50 Reporting period 1
GRI 102 General Disclosures 102-51 Date of most recent report FY17
GRI 102 General Disclosures 102-52 Reporting cycle 1
GRI 102 General Disclosures 102-53 Contact point for questions regarding the report 1
GRI 102 General Disclosures 102-54 Claims of reporting in accordance with the GRI Standards 80
GRI 102 General Disclosures 102-55 GRI content index 90
GRI 102 General Disclosures 102-56 External assurance 80-82

Better Everyday. In Pursuit of Excellence. Corporate Overview Statutory Reports Financial Statements
91
GRI STANDARD NUMBER
GRI STANDARD TITLE DISCLOSURE NUMBER
DISCLOSURE TITLE PAGE NO.
Economic Performance
GRI 103 Management Approach
103-1103-2103-3
36-39
GRI 201 Economic Performance
201-1 Direct economic value generated and distributed 37
Indirect Economic Impacts
GRI 103 Management Approach
103-1103-2103-3
62-63
GRI 203 Indirect Economic Impacts
203-1 Infrastructure investments and services supported 62-63
GRI 203 Indirect Economic Impacts
203-2 Significant indirect economic impacts 62-63
Procurement Practices
GRI 103 Management Approach
103-1103-2103-3
62-65
GRI 204 Procurement Practices 204-1 Proportion of spending on local suppliers 62
Materials
GRI 103 Management Approach
103-1103-2103-3
68-69
GRI 301 Materials 301-1 Materials used by weight or volume 68-69
GRI 301 Materials 301-2 Recycled input materials used 68-69
Energy
GRI 103 Management Approach
103-1103-2103-3
68-69
GRI 302 Energy 302-1 Energy consumption within the organization 43
GRI 302 Energy 302-3 Energy intensity 43
GRI 302 Energy 302-4 Reduction of energy consumption 68-69
Water
GRI 103 Management Approach
103-1103-2103-3
68-69
GRI 303 Water 303-1 Water withdrawal by source 68-69
GRI 303 Water 303-3 Water recycled and reused 68-69
GRI Content Index

JSW Steel Limited | Integrated Report 2017-18
92
GRI STANDARD NUMBER
GRI STANDARD TITLE DISCLOSURE NUMBER
DISCLOSURE TITLE PAGE NO.
Emissions
GRI 103 Management Approach
103-1103-2103-3
68-69
GRI 305 Emissions 305-1 Direct (Scope 1) GHG emissions 68-69
GRI 305 Emissions 305-2 Energy indirect (Scope 2) GHG emissions 68-69
GRI 305 Emissions 305-4 GHG emissions intensity 68-69
GRI 305 Emissions 305-6 Emissions of ozone-depleting substances (ODS) 68-69
GRI 305 Emissions 305-7 Nitrogen oxides (NOX), sulfur oxides (SO
X), and other significant air
emissions68-69
Effluents and Waste
GRI 103 Management Approach
103-1103-2103-3
68-69
GRI 306 Effluents and Waste 306-1 Water discharge by quality and destination 68-69
GRI 306 Effluents and Waste 306-2 Waste by type and disposal method 68-69
Environmental Compliance
GRI 103 Management Approach
103-1103-2103-3
62-63
GRI 307 Environmental Compliance
307-1 Non-compliance with environmental laws and regulations 62
Employment
GRI 103 Management Approach
103-1103-2103-3
48-49
GRI 401 Employment 401-1 New employee hires and employee turnover 49-51
Occupational Health and Safety
GRI 103 Management Approach
103-1103-2103-3
48-49
GRI 403 Occupational Health and Safety
403-2 Types of injury and rates of injury, occupational diseases, lost days, and absenteeism, and number of work-related fatalities
49-51
Training and Education
GRI 103 Management Approach
103-1103-2103-3
48-51
GRI 404 Training and Education 404-1 Average hours of training per year per employee 49-51
GRI 404 Training and Education 404-2 Programs for upgrading employee skills and transition assistance programmes
49-53
GRI Content Index
Better Everyday. In Pursuit of Excellence. Corporate Overview Statutory Reports Financial Statements
93
GRI STANDARD NUMBER
GRI STANDARD TITLE DISCLOSURE NUMBER
DISCLOSURE TITLE PAGE NO.
Diversity and Equal Opportunity
GRI 103 Management Approach
103-1103-2103-3
48-49
GRI 405 Diversity and Equal Opportunity
405-1 Diversity of governance bodies and employees 49-51, 72-77
Local Communities
GRI 103 Management Approach
103-1103-2103-3
62-63
GRI 413 Local Communities 413-1 Operations with local community engagement, impact assessments, and development programmes
62-63
Socioeconomic Compliance
GRI 103 Management Approach
103-1103-2103-3
62-63
GRI 419 Socioeconomic Compliance
419-1 Non-compliance with laws and regulations in the social and economic area
62-63
GRI Content Index

94
JSW Steel Limited | Integrated Report 2017-18
Management Discussion & Analysis
JSW Steel, the flagship company of the JSW Group is one of India’s leading steel players with integrated steel manufacturing facilities. With an annual capacity of 18 MTPA, the Company has seven state-of-the-art manufacturing units spanning western and southern India and a strategic overseas presence, making it among the foremost integrated steel players in the world. The Company manufactures and markets a highly diversified portfolio of steel products.
An expansion pan-India reach (over 8,600 exclusive and non-exclusive retail outlets) and an export presence in over 100 countries, gives the Company the capability to customise offerings to varied market requirements. The Company is widely perceived as a preferred supplier of high-end and value-added steel.
In the preceding two-and-a-half decades, the Company has grown significantly with a deep and abiding commitment to nation-building. From a 1.6 MTPA capacity in 2002, it currently holds crude steel production capacity of 18 MTPA; and is on track to touch 40 MTPA in the next decade.
The Company has an extensive portfolio of flat and long products and is one of India’s leading producers and exporters of coated flat steel products.
Product Portfolio
• Hot rolled coils (HRC)• HR Sheets and plates• Cold rolled coils and sheets• Galvanised and galvalume products• Pre-painted galvanised and galvalume products• Thermo mechanically treated (TMT) bars• Wire rods and special steel bars• Rounds and blooms• Plates and pipes of various sizes • Cold rolled non-grain-oriented products
The Company’s integrated and enriched offerings fulfill the requirements of multiple industries, including construction, infrastructure, automotive, consumer durables and more. The Company meets these evolving needs by staying at the
JSW Steel – An overview

95
Better Everyday. In Pursuit of Excellence. Corporate Overview Statutory Reports Financial Statements
forefront of innovation in the steel sector. The Company has entered into technological collaboration with JFE Steel Corp. Japan for the manufacture of high-strength and advanced high-strength steel for the automobile sector.
The Company has also signed a joint venture agreement with Marubeni-Itochu Steel Inc., Japan, to set up contemporary steel processing centres. In addition, to strengthen its global network, the Company also operates a plate and pipe making steel mill, situated at Baytown, Texas in USA.
Further, as part of its backward integration strategy and with a focus to source iron ore locally, the company has acquired five iron ore mines in Karnataka. One of these mines became operational in February 2018 and the remaining four will be operationalised in the FY 19. Collectively they will provide 4.7 MTPA of iron ore, providing about 20% of the Company’s iron ore requirements at Vijayanagar.
While the Company’s downstream capacity of 3.6 MTPA serves as a strong risk mitigation strategy, it is well supported strong pipeline of new products. The Company also enhanced its focus on cold rolled, galvanised and galvanneal products for body panels of automobiles, a rising and attractive sector in the country. The Company has one of the largest colour coated facility to address construction, warehousing and roofing requirements, and Cold Rolled Non-grain Oriented (CRNO) steel plant facility to address domestic demand by substituting imports of high grade electrical steel.
The Company reduced its net debt on consolidated basis by ` 3529 crores in FY18, while diversifying funding sources. These have created a strong financial profile and cash flows:
• Strong Operating EBITDA margins of 21.1%• Capex spend of ` 4,700 crores• Industry leading ROCE of 16%
The Company has announced cumulative capex projects of ` 44,415 crores to expand the Company’s steel-making capacity from 18 MTPA to 24.7 MTPA by FY21 with downstream facilities and cost savings projects.
As a leading player with significant domestic and international exposure, JSW Steel’s operations are impacted by geopolitical developments, policy changes, demand-supply nuances and competition. Despite these challenges, the Company continues to sustain its market leadership, following a continuous growth trajectory. JSW Steel’s core strengths comprise:
• Agile operations• Rich product mix• Best-in-class technology
• Excellence in project execution• Sustainable sourcing, and • Consistent focus on employee engagement
The result of these is that Company has plant capacity utilisation of 91%, among the best the industry. JSW Steel also recorded the highest ever crude steel production of 16.27 million tonnes in FY18, up by 3%. With one of the lowest conversion costs producer, best-in-class return accretive investments in various steel facilities and prudent financial policies, the Company has created a sturdy and sustainable operating structure, coupled with a strong balance sheet and leverage matrices.
A measure of this operational excellence is that, in 2017, the Company was ranked sixth amongst top 36 world-class steelmakers according to World Steel Dynamics, based on a variety of factors. In particular, the Company achieved the highest rating (10 out of 10) on the following criteria:
• Conversion costs • Yields• Expanding capacity• Location in high-growth markets and labour costs
This ranking puts the Company ahead of all other steelmakers based in India.
Not the one to rest on its laurels, JSW Steel is constantly seeking new ways integrate sustainability into its operations, be a reliable partner in the country’s journey to self-reliance, and, in the process, revolutionise steelmaking.
The following sections eloborate further on the above dynamics and aspects.
As part of its backward integration strategy and
with a focus to source iron ore locally, the Company
has acquired five iron ore mines in Karnataka
`44,415 crores Cumulative capex plan till FY21

96
JSW Steel Limited | Integrated Report 2017-18
In terms of commodities, energy prices indices
grew by 24% in CY17 (y-o-y)
3.9% Expected global growth in 2018
1. Economic analysis
1.1. Global economy
According to the International Monetary Fund (IMF), the global economy is on the road to recovery and grew by 3.8% in CY17, a 0.6 percentage point increase over CY16. This is the highest rate of global GDP growth after CY11. The growth happened owing to an increase in manufacturing activity, private consumption, investments and global trade.
The growth was broad based, with growth increasing in more than half of the world’s economies aided by benign global financing conditions, revival in investment sentiment, accommodative monetary policies and higher commodity prices. The growth was higher as compared to the initial estimates with upside surprises in the second half of 2017 in advanced as well as emerging and developing countries. Two-thirds of countries accounting for about three-fourths of global output experienced faster growth in 2017 vis-à-vis previous year.
The advanced economies performed better than expected with a 0.6% growth in CY17 as compared to the previous year There was stronger gross fixed capital formation and an acceleration in stock building which contributed to the pickup in investment, with accommodative monetary policy, stronger balance sheets, and an improved outlook helping release pent-up demand for capital goods.
On the other hand, emerging economies saw an upswing by 0.4 percentage point, primarily led by private consumption. In economies like India and China, resurgent exports too facilitated growth. The commodity exporting countries were
largely benefitted by the global economic upswing during CY17, owing to firming up of prices of commodities.
After two years of uninspiring performance, global trade also picked up pace; and its impact was particularly pronounced in emerging markets. This happened owing to an improvement in investment growth.
In terms of commodities, energy prices indices grew by 24% in CY17 (y-o-y) while the non- energy indices grew by 6%. The metal price indices grew by 24%. Accelerated global growth lifted the demand for commodities while a number of commodities faced supply side contractions.
The global recovery offers a window of opportunity to strengthen policies and reforms that sustain the current upswing and raise medium-term growth for the benefit of all countries. According to the IMF, such policies should focus on reinforcing the potential for higher and more inclusive growth, building buffers to deal more effectively with future economic headwinds and fostering international cooperation.
1.1.1. Other Global Developments
a) Oil witnessed a sharp increase from the levels of $41 per barrel in 2016 to a four-year high at $54 per barrel in 2017, driven by production cuts administered by OPEC.
b) US monetary measures – US Dollar appreciated on the back of rising Federal Reserve rates from 0.75-1% in March 2017 to 1.50-1.75% in March 2018.
c) Landmark tax reforms in the US, reducing tax rates from 35% to 21% to bolster investment and employment.
1.1.2. Challenges
a) Rising oil pricesb) Increasing protectionism, rising trade barriersc) Geopolitical risksd) Escalating global debt and rising interest rates
1.1.3. Outlook
Global growth is on an upswing and is expected to reach 3.9% in 2018 supported by strong momentum, favourable market sentiment, accommodative financial conditions and the domestic and international effects of expansionary fiscal policies. The global GDP is expected to increase to $88 trillion. Both advanced economies and emerging markets are expected to see a rise in growth figures in the near term before stabilisation in the medium-term.
This growth rate is the outcome of faster economic expansion in the Euro area, Japan, China and the US. Advanced economies are projected to grow at 2.5% in

97
Better Everyday. In Pursuit of Excellence. Corporate Overview Statutory Reports Financial Statements
2018 as compared to 2.3% growth in 2017 primarily driven by improving domestic demand and industrial activities, private investment, moderate inflation and focus on domestic manufacturing activities. In China, growth is projected to soften slightly from 6.9% in 2017 to 6.6% in 2018. Over the medium term, the Chinese economy is projected to continue rebalancing away from investment toward private consumption and from industry to services. Growth in emerging market and developing economies is expected to increase further from 4.8% in 2017 to 4.9% in 2018 due to strong economic performance. This augers well and reflects improved prospects for commodity exporters after three years of weak economic acitivity.
There is also a positive momentum in global trade and it is expected to moderately improve with nominal trade escalation by $2.0 trillion to $19.5 trillion.
Global Growth
COUNTRY / REGION 2016 2017 2018 PROJECTION
(%) (%) (%)World 3.2 3.8 3.9
AMEs 1.7 2.3 2.5
EMEs 4.4 4.8 4.9
US 1.5 2.3 2.9
EU-28 2.0 2.7 2.5
China 6.7 6.9 6.6
Japan 0.9 1.7 1.2
Russia -0.2 1.5 1.7
Korea 2.8 3.1 3.0
India 7.1 6.7 7.4
Source: International Monetary Fund (IMF)
1.2. Indian economy
After a brief period that was dedicated to introducing economic reforms that would further formalise the economy and boost ease of doing business, India has achieved a growth of 6.7% in FY18 with a 7.1% growth in Q-4’18. India has bounced back as the fastest growing economy in the world during the third quarter for FY18.
The investment cycle exhibited a growth of 7.6% in FY18 and 14.4% in the Q-4’18. The FY18 is likely to see an improved growth of 7.5% due to transformative reforms undertaken by the Government.
India’s economic fundamentals continued to improve during the year. The Index of Industrial Production (IIP) touched 4.3% during the FY18 after a robust growth of 6.2% in the Q-4’18, which was 1.9% in Q-1’18. Inflation figures are also largely in control, with the Consumer Price Inflation reducing to 3.6% in FY18 from a level of 4.5% in FY17, keeping the food prices under control. Through the year, India’s foreign exchange reserves has also increased to more than US$420 billion. The eight key sectors rose to 3.4% year-on-year in FY18, with
cement, coal and electricity registering a growth of 13%, 9% and 6% respectively.
The Government of India has put in place multiple enablers to bolster the country’s consumption demand. Higher spending on social schemes such as NREGA, continued thrust on rural infrastructure projects, raising of minimum support prices, implementation of 7th Pay Commission pay hikes across states and One Rank, One Pension scheme are also likely to lead to robust disposable income leading to higher spend and consumption.
The major driver of India’s consumption economy is the country’s large population of youth (more than half of the population is below the age of 35). Two consecutive years of favourable monsoon, addition of young working population and rising urbanisation are other major growth drivers.
The 2018-19 Union Budget has emphasised on India’s infrastructural requirements and the allocation on roads, railways and rural infrastructure has been significant. The Budget also focussed considerably on health and education sectors, which are instrumental in developing a sustainable economy and society.
1.2.1. Outlook
During FY19, India is likely to record a robust GDP growth of 7.4% (Source: IMF). This growth will be driven by structural and wide ranging reforms such as the Goods and Services Tax (GST) to widen the indirect tax base, Insolvency and Bankruptcy Code to address asset quality of banks and formalisation and digitisation of the economy improving business ecosystem, thrust on infrastructure development, and a liberal FDI regime. Banking reforms through recapitialisation and the Insolvency and Bankruptcy Code are expected to resolve the stressed assets of over-leveraged corporates and restore lending support to these sectors.
To make the growth broad based and inclusive, there is a clear budgetary and policy focus on rural development to construct 3.17 lakh km of road, 51 lakh houses, 1.88 crores toilets and provide electricity connections to 1.75 crores new households. Rural employment too, is expected to improve with MNREGA budget expanded by ` 7,000 crores to ` 55,000 crores Further, the latest IMD forecast predicts a normal monsoon in 2018. Since over 65% of the nation is employed in the agricultural sector, this would boost the consumer expenditure resulting in improved demand prospects.
The strengthening global economy is also likely to stimulate exports. The country’s exports are expected to touch US$350 billion during 2018-19. Pick up in capital expenditure done by private corporate sector will also provide the necessary impetus to India’s GDP growth.

98
JSW Steel Limited | Integrated Report 2017-18
Global crude steel production grew by
5.3% or 63 million tonnes in 2017 to
1,691.2 million tonnes
1.59 billion tonnesGlobal steel consumption (2017)
2.1. Global Steel Sector
2017 saw an improvement in global steel consumption, which grew 4.7% to 1.59 billion tonnes in the year, after a subdued growth of 1% in 2016. A low base-effect of 2016, along with improved steel consumption in China and investment-led recovery in advanced economies were the key factors driving this momentum. The government’s stimulus measures and momentum in construction activities fuelled steel demand in China. Consumption in Europe (other than EU) too gathered pace in the year and grew ~2.5% with other countries like US with 6.4%, Brazil 5.3% Iran 4.5% follow the growth trajectory of rising global steel demand.
Global crude steel production grew by 5.3% or 63 million tonnes in 2017 to 1,691.2 million tonnes, as most economies registered good growth in steel production. Annual production grew between 4% and 6% for major economies of China, India, European Union and USA, among others. Turkey, South America and Brazil witnessed the highest growth in steel production at 13.1%, 8.7% and 9.9%, respectively.
China trimmed its capacities by eliminating Basic Oxygen Steelmaking (BOF) – Electric Arc Furnace (EAF) of 55 million tonnes in 2017. The world’s largest steel producing country also closed 140 million tonnes of inefficient induction furnace capacity. These initiatives uplifted market sentiments and bolstered pricing power and profitability of most steel producers in the World. Overall, steel exports from China fell by 30% to 75 million tonnes in the year.
Global steel prices remained buoyant in 2017 due to: a) falling exports from China as it continues to reduce excess capacities; b) firm iron ore prices; and c) improving demand from China following the upswing in the infrastructure and construction sectors. The global capacity utilisation ratio stood at 69.5% in December 2017 — up 1.8 percentage points, compared to December 2016 level.
In the preceding couple of months, trade actions across economies aggravated to arrest imports, threatening the possibility of trade diversion.
2. Industry analysis

99
Better Everyday. In Pursuit of Excellence. Corporate Overview Statutory Reports Financial Statements
2.1.1. Global Trade Actions(figures in million tonnes)
WORLD US SECTION
-232
EUROPE SAFEGUARD
TURKEY SAFEGUARD
TOTAL
Quantity 335* 35 40 10 85
(*) Global Steel trade net of EU-Intra-Trade @ 115-MnT
Global threat to 85 MnT or ~25% quantity of steel trade
Globally, iron and steel witnessed the highest number of trade actions
The US has imposed largest number of trade actions (252) with 44% of these actions imposed on iron and steel products
India has imposed second largest number of trade actions at 150 with only 14 actions on iron and steel products
Globally, Indian exports are subjected to 125 trade actions, including 53 actions on iron and steel
China faces highest number of trade actions at 63% of total 1,118 global actions.
In view of trade actions and counter actions, the export dependent economies viz. Japan, Korea, China, Russia have to either cut production or look for new markets. As india’s domestic demand is robust, the Indian steel industry should be watchful of any surge in import of steel into India from these countries.
2.1.2. Steel production of top 10 steel-producing countries
RANK COUNTRY 2017 (MILLION TONNES)
2016 (MILLION TONNES)
% CHANGE
1 China 831.7 807.6 3.02 Japan 104.7 104.8 -0.13 India 101.4 95.5 6.24 United States 81.6 78.5 4.05 Russia 71.3 70.5 1.36 South Korea 71.1 68.6 3.77 Germany 43.4 42.1 3.58 Turkey 37.5 33.2 13.19 Brazil 34.4 31.3 9.910 Italy 24.0 23.4 2.9
Source: World Steel Association
2.1.3. Outlook
World Steel Association estimates suggest that global steel demand is likely to touch 1,616 million tonnes in 2018, a growth of 1.8% vis-à-vis 2017. Continued strengthening of investments in advanced economies, improving manufacturing climate and recovery in commodity prices are expected to act as key catalysts to drive global steel demand.
A large part of this demand is likely to come from the emerging and developing economies (excluding China) with an estimated increase of 4.9% in steel demand in 2018. In the developed economies, steel demand is likely to grow by 1.8% in the current calendar year. Important downside risks to these estimates comprise rising wave of protectionism in global trade and higher interest rates in the US and the EU.
A large part of global steel demand is likely to emanate from the emerging and developing economies (excluding China) with an estimated increase of 4.9% in 2018.
2.1.3.1. Developed markets
The US economy is likely to grow at a rapid pace in 2018 on the back of strong consumption and investments, favourable monetary policy framework, robust corporate earnings (on the back of tax reforms) and a healthy construction sector. In the presence of these catalysts, steel demand is expected to remain robust in the US this year.
Strong private consumption, broad-based recovery across countries and healthy demand both in domestic and international markets are key growth drivers for the EU economy, going forward. A pick-up in non-residential construction and healthy improvement in manufacturing initiatives are other positives for the EU region. Steel demand from this region is likely to remain encouraging in the current year.
Steel demand in Japan will continue to remain muted on the back of an ageing population, which reduces the growth potential. Economic growth in Japan is expected to be sluggish in the coming years. Huge consumer debt, weak construction activity and a suffering shipbuilding sector are crucial challenges that may adversely impact steel demand in South Korea.
2.1.3.2. China
Chinese economy is likely to witness slower growth in 2018 on the back of weak investments, high debt levels for both corporates as well as local government, slowdown in construction activity and decline in automotive and home appliances sectors. The Government’s efforts to boost domestic consumption and growth of the machinery sector though could offset some of this pressure. Overall, steel demand is expected to remain flat in China in 2018. Steel exports from China are likely to remain under pressure due to trade actions against China by various countries and may have to accelerate the shutting down the excess steel capacities. China is expected to cut 30 million tonnes of excess steel capacity in 2018 – in continuation to its ongoing mandate to streamline Chinese steel industry. Increasing trade tensions, high inflationary pressures and tightening of monetary policies of developed economies could pose some challenges to steel companies, going forward.

100
JSW Steel Limited | Integrated Report 2017-18
2.1.3.3. Emerging economies (excluding China)
Emerging and developing economies (excluding China) are likely to lead from the front as far as global steel demand is concerned. Firming up of oil and other commodity prices and higher reconstruction activities may strengthen steel demand from the MENA region. The growth though could be higher, depending on how fast the region can attain geopolitical stability.
Steel demand is likely to remain stable in Turkey even as the minor improvement witnessed in Russia and Brazil is expected to continue. Monetary policy easing, improving credit growth and higher consumer and business confidence will drive growth in Russia. Higher investments in the infrastructure sector though will lead to robust growth in steel demand in the ASEAN-5 countries.
STEEL DEMAND FORECASTS MILLION TONNES Y-O-Y GROWTH RATES, %REGIONS 2017 2018 (F) 2019 (F) 2017 2018 (F) 2019 (F)European Union 162.3 165.6 166.9 2.5 2.0 0.8
Other Europe 42.3 44.2 46.1 4.1 4.5 4.4
CIS 52.8 54.0 55.0 6.1 2.3 1.8
NAFTA 140.7 145.0 147.3 6.4 3.0 1.6
Central and South America 40.9 43.5 45.6 3.8 6.2 4.9
Africa 35.1 36.6 38.3 -6.8 4.5 4.6
Middle East 53.3 55.7 57.8 0.4 4.6 3.7
Asia and Oceania 1060.1 1071.4 1069.7 5.5 1.1 -0.2
World 1587.4 1616.1 1626.7 4.7 1.8 0.7
World excl. China 850.6 879.3 904.6 1.8 3.4 2.9
Developed Economies 410.7 417.9 422.7 2.9 1.8 1.1
China 736.8 736.8 722.1 8.3 0.0 -2.0
Emerging and Developing Economies excl. China 439.9 461.4 481.9 0.8 4.9 4.5
ASEAN-5 70.3 74.9 79.8 -5.2 6.6 6.4
MENA 71.7 75.3 78.5 -1.1 5.0 4.2
f- forecast
Source: World Steel Association
2.1.4. Key sectors driving steel demand
2.1.4.1. Oil & Gas
Production cuts announced by the Organisation of the Petroleum Exporting Countries (OPEC) in 2017 lent support to crude oil prices and the good show is likely to continue, going forward. Strong demand and possibility of renewed US sanctions on Iran may lead to further escalation in crude oil prices from here on.
Improving prospects of crude oil will augur well for the sector, as it will lead to higher production by upstream oil and gas companies. This, in turn, will benefit downstream companies as well. Higher investments in the sector will positively impact steel demand.
2.1.4.2. Metals and Mining
Commodity prices trended northwards for large parts of 2017; and the trend is likely to continue in 2018 as well. Higher prices will elevate production growth in the year and strengthen investments and upstream activity in this sector.
2.1.4.3. Infrastructure
According to a report by Global Infrastructure Hub, every year investment worth US$3.7 trillion is required to be made in worldwide infrastructure to meet the demand of the rising global population. Asian economies will account for more than half of these investments. Thus, the infrastructure sector will continue to play a major role in driving demand for the global steel industry.
2.1.4.4. Capital Goods
Upswing in commodity prices, broad-based improvement in economic growth and positive outlook for automotive and construction sectors are likely to aid prospects of global capital goods companies. S&P Global Ratings expects the credit metrics of capital goods companies to improve on the strength of rising capital expenditure by private sector companies. Steel is the primary input to manufacture equipment and machinery; and hence stands to benefit from improving prospects of the capital goods sector.

101
Better Everyday. In Pursuit of Excellence. Corporate Overview Statutory Reports Financial Statements
Rising trade protectionism
In the past few months, adoption of trade restrictive measures by different countries has intensified as governments look to protect the interest of domestic metal makers. The US imposed a 25% duty on steel imports and a 10% tariff on aluminium imports, effective from 23 March 2018.
China, too, implemented similar measures to reduce US imports. Given that steel exports represent a miniscule 2% to India’s exports, such measures are unlikely to have significant impact on India. However India also may have to adopt similar measures to eliminate the import of steel at unfair prices that would cause injury to domestic industry.
India should remove Steel from all Free Trade Agreements (FTAs) prevailing in global trade. Consequent to the concessional duty under the FTAs for Japan, Korea and ASEAN regions, there is a price disparity of ~13.75%, equivalent to ~` 6,500 per tonne or a price impact of 15% on domestic ex-mill prices. This disparity should be addressed by swift action from India.
During 2017-18, imports increased 5.4% to 8.4 million tonnes and displaced 17% of flat steel demand and 9% of total Indian steel demand. The share of defective steel imports in our country increased from 3% of total imports in 2016-17 to 5% of total imports in 2017-18. Rising imports despite prevalence of trade measures prove that these measures are completely ineffective. Increasing imports due to lack of monitoring the BIS quality standards is a threat to the high number of jobs created directly and indirectly by the Indian steel industry.
The Government of India must implement stringent policies to curb these imports. This wave of trade protectionism is expected to continue for a long period of time.
The Company will focus on widening its presence in areas across major global markets. In such a scenario, its revenue from global markets will continue to grow; and will largely remain safeguarded from rising protectionism.
Growing global footprint will enable JSW Steel to evolve into an organisation with an ability to tap into emerging opportunities across the world.
2.2. Indian Steel Sector
India’s steel production grew 4.5% to its highest ever level of 102 million tonnes in FY18. The Government of India has been proactive in addressing the issues faced by domestic steel makers. It has taken major steps to stop unfair trade and to safeguard the interests of domestic players.
This has been accompanied by recovery in construction activity and shut down of excess capacities in China. China has phased out capacities to the tune of 115 million tonnes in the past two years; and is gearing up for another production cut of 30 million tonnes in 2018. Leading steel makers in India are well poised to benefit from this development.
Riding high on an all-round improvement in the growth of key sectors, namely automobiles, infrastructure, and capital goods, among others, India’s steel demand grew at a high rate of 7.9% to 91 million tonnes in FY18. This pace may accelerate further as domestic steel demand growth is pegged at 8.3% to 98.2 million tonnes in the current fiscal year (Source: JPC). In FY18, India’s per capita steel consumption grew 6.2% to 69 kg, while share of flats improved from 42% to 44%.
India’s construction activity, particularly in highways, bridges and metro lines has bolstered the demand for long steel products in recent times. Given their size, long steel
products are relatively difficult to ship and hence most contractors are sourcing them locally.
Domestic steel prices have started trending northwards since November 2017, owing to a surge in global prices, healthy recovery in domestic demand, and a weaker rupee. The prices though still trail international prices and hence there is a scope for further uptick in prices.
Governmental measures such as the National Steel Policy and extension of anti-dumping duty on steel products, imposition of quality standards are key facilitators for the growth of domestic steel sector in India. Additionally, the Government has earmarked ` 14.3 lakh crores towards infrastructure spending, which will also enhance steel demand in the domestic market.
2.2.1. Highlights of India’s Steel Industry
Achieved all-time high crude steel production in FY18 Third largest crude steel producer in the world in 2017 Third largest consumer of finished steel in the world
in 2017 Steel consumption grew at a multi-year high in FY18 Contributes nearly 2% to the country’s GDP Producer of world-class steel of all major varieties
and grades

102
JSW Steel Limited | Integrated Report 2017-18
Government’s wide-ranging reforms may aid the steel sector
Broad-based improvement in the growth of infrastructure, automobiles, capital goods, among others in FY18
2.2.2. Crude steel production (million tonnes)
PRODUCTION FY14 FY15 FY16 FY17 FY18Public Sector 16.8 17.2 17.9 18.5 19.8Private Sector 64.9 71.8 71.9 79.5 82.5Total 81.7 89.0 89.8 98.0 102.3
2.2.3. Steel consumption in India (million tonnes)
PRODUCTION FY14 FY15 FY16 FY17 FY18Public Sector 74.1 77.0 81.5 84.0 90.7
Source: Joint Plant Committee
2.2.4. Advantage India
The National Steel Policy, 2017 (NSP) aims to make India a self-sufficient steel producing nation by 2030. The Policy will promote the indigenous industry to eliminate steel imports in the country by 2030. Reduction in import dependence for procuring coking coal, emphasis on BF / BOF technology, sharper focus on pelletisation and installation of slurry pipelines and conveyors, promotion of domestically manufactured steel in government procurement and production of value-added steel indigenously are the key goals of this Policy.
To achieve these targets, some Indian companies have undertaken capacity expansions, which will drive their market shares further in the coming years. The acquisition of debt-laden steel companies will reduce the time for ramping up existing capacities. Investments worth US$210 billion would be required to achieve the targeted steel capacity of 300 million tonnes by 2030. Overall, the NSP will empower domestic steel makers by making them more competitive globally.
In the domestic market as well, there are multiple catalysts to drive steel industry growth. Relatively lower per capita steel consumption, healthy prospects of consumption demand on the back of buoyant infrastructure growth and strong growth in the automobile and railways sector being the prominent ones. Against this backdrop, it is expected domestic steel demand would grow by around 5% in the financial year 2018-19.
2.2.5. National Steel Policy, 2017 – Ushering in the next phase of steel growth in India
PARTICULARS FY18 ACTUALS
NCP TARGET BY 2030-31
Crude steel production (million tonnes)
102 300
Per capita steel consumption (kg)
69 160
Source: Joint Plant Committee
DEMAND ENABLERS RISING INVESTMENTS LOW-COST ADVANTAGE FAVOURABLE POLICIESDomestic growth to remain
buoyant
Investments worth
$210 billion required to
achieve steel capacity
of 300 million tonnes by
2030-31
India is the world’s
third-largest producer of crude
steel at globally competitive cost
100% FDI through the automatic
route is allowed
Healthy prospects of
infrastructure, automobiles,
consumer durables, oil and gas
sectors
301 MoUs signed with
various states for planned
capacity of 486.7 million
tonnes
Easy availability of skilled and
unskilled workforce
Large infrastructure projects in
the PPP mode are being formed
The National Steel Policy is a
major effort to make India a self-
sufficient steel-producing nation
by 2030-31
The Ministry of Steel plans
to set up Steel Research and
Technology Mission in India
Presence of abundant iron ore
reserves in India
Policy clarity and stability
expected in respect of
expediting auction of mining
leases and forest clearances
and operationalising these
mines.

103
Better Everyday. In Pursuit of Excellence. Corporate Overview Statutory Reports Financial Statements
Rural India is expected to reach a per capita
consumption from 12.11 kg to 14 kg for finished
steel by CY20.
5% Expected domestic steel demand in FY19
2.2.6. Union Budget 2018 Impetus
MEASURE 1 MEASURE 2 MEASURE 3Higher infrastructure spending through various
road projects under The Ministry of Road
(including NHAI) and Pradhan Mantri Gram
Sadak Yojana by 11% over the preceding year
Railway allocation increased by 22% with
focus on building infrastructure, stepping
up safety and improving maintenance
Measures aimed at enhancing farm income
will bolster demand for automobiles and
tractors. Improved prospects of automobile
sector to aid domestic steel consumption
2.2.7. Domestic growth enablers
Rural steel demand
Rural India is expected to reach a per capita consumption from 12.11 kg to 14 kg for finished steel by CY20. The policies like Food for Work Programme (FWP) and Indira Awaas Yojana, Pradhan Mantri Gram Sadak Yojana and Affordable Housing, among others are expected to drive the demand.
Housing demand
The allocation towards building houses in rural and urban areas under the PMAY scheme stood at ` 275 billion in the Union Budget 2018-19. Rising transparency in the real-estate sector following the implementation of The Real Estate (Regulation and Development) Act has bolstered the confidence of both investors and home buyers. In this scenario, housing demand is likely to accelerate going forward, leading to higher steel demand in the domestic market.
Renewable Energy
India aims to generate 275 GW of total renewable energy by CY27. Of the total pie, 72 GW will be from hydro-energy and 15 GW from nuclear energy. Nearly 100 GW is expected to come from ‘other zero emission’ sources. Both generation and transmission capacities are expected to raise steel demand from the sector.
Pegged at 5.5%, the domestic steel demand is likely to grow at a faster pace than global steel demand, which is likely to grow by 1.8% in 2018.
Strengthening of existing trade measures by changing the form of duty from Reference Price to Fixed Duty ($/tonne), coupled with the removal of the Lesser Duty Rule (LDR)
Increase the Basic Customs Duty to at least 25% across all steel and steel-intensive products
Higher emphasis on Quality Order compliance to arrest import of seconds and defective steel
Make the public procurement policy more effective and conducive in favour of domestically produced steel
Critical measures needed to bolster India’s Steel Industry

104
JSW Steel Limited | Integrated Report 2017-18
3. Business review
The Company grew with record numbers on multiple fronts in a year that began on a slow footing but ended on a high note. While growth was moderate during the first half of the year owing to sluggish demand, the second half saw the Company outperform its previous production and sales rates on the back of higher auto sector demand and recovery in construction and capital goods segment.
Overall, in FY18, the Company registered its highest ever yearly crude steel production at 16.27 million tonnes. During the year, the Company achieved a consolidated sale of 15.55 million tonnes, a y-o-y growth of 6%. This was driven by the highest ever domestic sales of 11.9 million tonnes with a south-west mix of nearly 84%. At a y-o-y level, the growth in domestic sales touched 9% compared to the domestic industry growth of 7.9%. Consequently, the Company’s market share also witnessed an increase.
The share of value-added and special product (VASP) sale went up to 58% during the year, driving up the Company’s margins. The total sale of VASP products stood at over 9 million tonnes, a 13% y-o-y growth.
During the year, the Company was prompt and agile to realign its sales based on the prevailing market conditions. It adopted the strategy to reduce exports to 23% of total sales, and focus on the faster growing and more attractive domestic market.
Domestic and exports sales ratio
YEAR DOMESTIC EXPORTSFY18 77% 23%FY17 74% 26%
3.1. Product performance
JSW Steel’s best-in-class technology and sustained R&D initiatives help deliver customised and innovative offerings. The Company focusses on expanding the share of the value-added products in its portfolio to enhance margins, resulting in industry-leading profitability.
3.1.1. Flats
JSW Steel produces flat sheet products that include slabs, hot-rolled coils, cold-rolled coils, coated products and others. Flats also remained the Company’s mainstay during the first half of the year, when demand for long products was low.
Continuing the trend from previous years, flat products occupied a significant proportion of the Company’s product portfolio at 71% and registered a y-o-y sales growth of 2%. Robust demand in the automobile sector increased domestic flat sales by 11% y-o-y.
Robust demand in the automobile sector increased
domestic flat sales by 11% y-o-y
71% Contribution of flat products to JSW Steel portfolio
Automobile
The automobile industry is estimated to grow by US$260-300 billion by 2026. With increasing capacity addition, steel demand is expected to be robust.
2.2.8. Outlook
According to the World Steel Association, consumption of finished steel products in India is estimated at 92 million tonnes in 2018 – a growth of 5.5% over 2017. Of the total incremental demand of 28.7 million tonnes in 2018 worldwide, India alone is likely to add steel demand of 4.8 million tonnes.
Pegged at 5.5%, the domestic steel demand is likely to grow at a faster pace than the global steel demand. Steel demand worldwide is likely to grow by 1.8% in 2018. The nation’s per capita steel consumption is likely to improve to 72-74 kgs in 2018-19. Clearly, Indian steel players are looking inwards to achieve higher growth. As China continues to trim its excess capacities in 2018 as well, and given the low-cost, higher quality products offered by Indian companies, opportunity to grow exports is also sizeable. Against this backdrop, Indian players having significant capacity expansions on the cards are well poised to tap into these opportunities over the next few years.

105
Better Everyday. In Pursuit of Excellence. Corporate Overview Statutory Reports Financial Statements
3.1.1.1. Hot Rolled
Manufactured in the Hot Strip Mills (HSMs) of Vijayanagar (Karnataka) and Dolvi (Maharashtra) plants, the Company offers a wide variety of Hot Rolled products.
Vijayanagar Works is home to the country’s widest HSM, occupied with sizing presses and an automatic line inspection facility, with a capacity of 3.2 MTPA and 5 MTPA for HSM-1 and HSM-2, respectively,
The capacity stands at 3.6 MTPA at Dolvi Works, where India’s first CONARC process was implemented for steel manufacturing. The name CONARC is a fusion of two processes (CONverter ARChing) and the science behind this process is based on the increased use of hot metal in the electric arc furnace. This technology aims to optimise energy recovery and maximise productivity.
During the year, Hot Rolled Coils (HRCs) comprised 39% of the Company’s product portfolio. Domestic sales of HRCs rose 8% y-o-y primarily in Southern and Western regions of India.
Key Sectors
JSW Steel is a leading steel supplier of HR products (HR) to multiple sectors such as Construction and Infrastructure, Industrial and Engineering, Pipes and Tubes, Automotive and Energy etc. that drive the economy.
The overall of sales of HR products grew by 4% during the year. While robust auto growth and a large number of infrastructure projects kept up the demand, the availability was somewhat restricted by factors such as higher consumption by downstream Cold Rolled and Galvanised units. The Company’s supply to auto segment grew 45% y-o-y against Commercial Vehicles production growth of 10% y-o-y.
3.1.1.2. Cold Rolled
Essential to the auto sector and several white goods, JSW Steel’s Cold Rolled (CR) steel products are manufactured at its state-of-the art Vijayanagar Works. CR products comprised 17% of the product portfolio in FY18. During the year, sales volume of Cold Rolled and Close Annealed (CRCA) grew 8% y-o-y with domestic growth of 20% y-o-y. CRCA sales grew 27% during the year and outpaced the growth of 15% posted by the automobile sector in India.
JSW Steel is the only steel producer with the capability of producing wider width and advanced high-strength steel grades. The Company’s CR products thus are well regarded due to their superior surface appearance, uniform mechanical properties and excellent drawability.
Key Sectors
India’s cold rolled products are primarily consumed by the automotive, industrial and engineering sectors.
a) Automotive sector
India’s auto sector grew 15% during the year, with an overall production of vehicles in India crossing the 29-million mark. For the first time, India’s passenger vehicle and utility vehicle production crossed the 4-million figure.
JSW Steel continues to focus on the automotive sector with sales growing 27% y-o-y during FY18. Quick and seamless approvals of the Company’s CR products from automotive companies resulted in a fast ramp up of automotive steel sales. The cold rolled coils and galvanised and galvannealed steel are supplied to automobile Original Equipment Manufacturers (OEMs), leading to commercialisation of different grades developed for auto makers.
The CRM 2 in Vijayanagar Works produces ultra-high strength steel for India’s automobile manufacturers. These steel products were earlier imported by auto majors, but are now being procured locally, giving a push for Make in India and the country’s self-reliance.
b) Packaging sector
JSW Steel’s CR products have received encouraging response in the packaging sector due to their superior surface, tight thickness tolerances and uniform mechanical properties.
3.1.1.3. Electrical Steel
Electrical steel products are manufactured at the Company’s state-of-the-art Vijayanagar Works facility. Electrical steel finds application across sectors such as electric motors, generators, nuclear power station, power generation plants, domestic appliances, transformers and automotive electricals.
During FY18, expedited customer approvals from clients resulted in rapid ramp-up of capacity utilisation. The Company’s exclusive service centres that provide ready-to-use electrical steel products also aided the growth.
JSW Steel continues to focus on the automotive
sector with sales growing 27% y-o-y during FY18
45% Growth in sales to auto sector

106
JSW Steel Limited | Integrated Report 2017-18
As a result, the sales in electrical steel increased 40% y-o-y, driven by the strengthening of domestic appliances demand and the receiving of approval for alternators, industrial motors and compressors with new customers.
Going forward, the Company is geared to participate in India’s journey towards energy efficiency and infrastructure development with expansion of its grade range to high silicon alloy content, development of customised and high permeability grades, and a wide range of insulation coatings.
3.1.1.4. Galvanised
JSW Steel is India’s largest manufacturer and exporter of galvanised steel, and the first supplier of products with higher coating (550 gsm) to the country’s solar sector. Four JSW Steel facilities manufacture galvanised coils and sheets – Vijayanagar, Vasind, Tarapur and Kalmeshwar.
Trusted globally, JSW Steel’s galvanised steel is high in strength, resistant to corrosion, eco-friendly, durable and lightweight. In the markets, JSW’s galvanised corrugated sheets, branded JSW VISHWAS, are the most sought after due to their unmatched resistance to weathering elements. Galvanised products comprised 11% of the product portfolio in FY18.
Key Sectors
India’s galvanised products are primarily consumed by construction, infrastructure and consumer durables sectors. These products are also used in the solar energy sector, and JSW Steel caters to the galvanised steel segment with a market share of 42%. Eco-friendly Zero Spangle Organic coated ROHS compliant GI produced at Vijayanagar Works has been well received and approved by all major appliance, panel and duct manufacturers.
3.1.1.5. Galvalume
JSW Steel is the first licensee Galvalume producer in India that uses technology from BIEC International Inc., USA. The technology licence qualifies the Company to continually access the latest product innovations and process refinements through BIEC and the ZAC Association. Surpassing the growth of 14% in the domestic market, the Company clocked a volume growth of 17% in its GL products during the year, driven by development initiatives in Solar & Construction sectors.
3.1.1.6. Colour coated
JSW Steel offers colour coated steel under the brands JSW Colouron, Colouron+, Pragati brands and Everglow. Produced at the Vasind, Tarapur and Kalmeshwar plants, a new facility is being set up at Vijayanagar Works as well.
JSW Steel caters to the galvanised steel segment
with a market share of 42%
40% Sales growth in electrical steel

107
Better Everyday. In Pursuit of Excellence. Corporate Overview Statutory Reports Financial Statements
Colour coated products comprised 4% of the Company’s product portfolio in FY18. During FY18, total sales volume of colour coated products increased 26% y-o-y.
JSW Steel has one of the largest colour coated facilities to address construction, warehousing and roofing requirements and a state-of-the-art colour coating line for appliance grade products used in consumer durables.
Key Sectors
The major consumers of colour coated products in India are the construction and Infra and Consumer durables sectors. The colour coated brands of JSW Steel enjoy high market share in semi-urban and rural areas, catering to the requirements of the Individual Home Builder (IHB) segment.
The overall growth of this segment is driven by the rural sector recovery, with the last year witnessing a subdued base due to demonetisation. Good monsoon, coupled with GST stabilisation, has resulted in overall demand growth. Accelerated growth in Q4 was largely due to the Company’s brand-building measures and a consumer education drive to identify original JSW coated sheets. The residential roofing and cladding segment grew 27% over Q3 and warehousing/PEB by 5%, while industrial roofing declined by 2%. With growth in the rural sector, the warehousing/PEB segments have grown 5% during the year.
The demand in consumer durables has grown by 14% y-o-y. The government initiative for rural electrification saw a thrust in Q4 FY18, compared to 9M FY18. Rural penetration of online retailing of appliances increased the demand for consumer durables. The major manufacturers of consumer durables have increased their capacity, expanding the market for the Company’s products.
3.1.2. Longs
Long products comprised 23% of the Company’s product portfolio in FY18. During the year, long product sales increased 15% y-o-y.
3.1.2.1. TMT
JSW Steel manufactures and markets JSW NEOSTEEL TMT bars that conform to domestic and international standards. Owing to their higher strength, ductility and shock resistance, this range of TMT bars have become a market favourite. The NEOSTEEL range has been deployed in multiple prestigious projects in India, such as metro rails, expressways and airports.
TMT Rebars are manufactured in Vijayanagar Works and Dolvi Works. They comprise 15% of the Company’s product portfolio. During the year, the total sales volume increased 17% y-o-y. JSW Neosteel has increased penetration in
semi-urban and rural areas with substantial business volumes from South India and West India.
Key Sectors
The Company is proud of being part of India’s growth story through supplying steel to metro rail projects in various cities.
JSW Neosteel was also used in major projects in the country from Indian Railway projects, aerospace, defence projects, port and airport projects, expressways and highways and critical atomic power projects. JSW Steel also caters to prominent educational institutions, hospitals, IT Parks and high-rise structures.
3.1.2.2. Wire rods
The electrode, CHQ and low, medium and high carbon wire rod grades are produced at Vijayanagar, while Salem Works produces alloy and special grade wire rods.
3.1.2.3. Special alloy steel
Alloy steel products are manufactured at JSW Steel’s Salem Works. The Company is the largest domestic producer of spring steel flats, alloy steel rounds and bars and alloy steel wire rods. In terms of technology upgradation, the Company has commissioned a new continuous caster, which can give blooms and billets with reduced macro segregation due to higher EMS current.
The rolling mill at Salem was upgraded with a sliding stand in the bar and rod mill, which accommodates higher reduction ratio for bar products. A contemporary atmosphere-controlled Bell annealing furnace was installed for spheroidised annealing of coils for delivering products to cold heading quality product customers and bright bar manufacturers. An additional automatic billet grinding facility was installed, which ensures the supply of bars with high-surface quality in the ‘as hot rolled’ condition.
Eight new grades of special steel were approved, which included high value alloyed and micro-alloyed steel for various components of automotive engine, transmission, bearings and suspension.
The Company launched JSW Everglow in December 2017, a first-of-its-kind product in the steel roofing segment. JSW Everglow offers a 10-year paint warranty to the consumer, which is a country-wide first. The product has a unique feature of matching colours at the bottom of sheet against the dull grey that is normally used. It has been launched in over nine states in FY 2017-18 and phased rollout is planned in FY19. The product has seen encouraging initial response from consumers.

108
JSW Steel Limited | Integrated Report 2017-18
3.2. Retail
The Company’s expansive India-wide retail network is the backbone of its growth story and continued success. The Company has over 8,600 exclusive and non-exclusive retail outlets, spanning 575 districts across India, making it one of the country’s largest steel retail networks. During FY18 the Company also engaged with 22,000+ influencers through 3,000+ meets.
The Company has three main retail formats: JSW Explore, JSW Shoppe and JSW Shoppe Connect, each catering to a different set of customers and geography.
3.2.1. Brand Building
The Company has been undertaking focussed brand building initiatives in JSW Neosteel (TMT Bars), JSW Colouron+ (Colour Coated) and JSW Everglow (Colour Coated).
In JSW Neosteel the focus was on further strengthening the engagement with the influencers and educating them about the benefits of using high-quality steel. Consumer meets at retail counters were also conducted across several districts of South India. The consumers were delighted to engage directly with the Company as a large proportion of them were unaware of benefits of using good quality steel.
JSW Shoppe is a one-of-its-kind network of stores launched in 2007, which run on a franchisee model. With over 400
outlets, these stores combine sales and services for making available the right product for the end consumer. Nearly half of this network is located in the country’s semi-urban and rural areas.
JSW Colouron+ continued to be the leading colour coated brand in India with the highest market share. The Company undertook large-scale influencer awareness campaign to educate them on how to identify genuine products. Advertisements across regional television channels were also used as a communication medium to create brand awareness.
3.2.2. Customer Relationship Management (CRM)
During the year, the Company started a project to enhance and improve relationships with its customers, putting them at the heart of its operations. The first phase has been launched, covering the following aspects:
1) Customer management2) Customer 360-degree view3) Pricing4) MoUs with customers
The second and third phases will include important elements like credit management, complaint management, a customer portal and customer visit planning and report generation.
JSW Colouron+ continued to be the leading colour
coated brand in India with the highest market share
8,600+ JSW Steel's exclusive and non-exclusive retail outlets

109
Better Everyday. In Pursuit of Excellence. Corporate Overview Statutory Reports Financial Statements
4.1. Standalone
Global manufacturing and construction activities have clearly improved year–on-year evidenced by macro growth numbers. Global crude steel production increased significantly in 2017 to a record 1,691 million tonnes, up 5.3% from 2016 reflecting the investment led pick up in growth and cyclical rebound in global trade. The Chinese steel exports continued to decline on the back of supply reforms in China, in terms of closure of inefficient production facilities and pollution induced curtailments and strong domestic growth and consumption. This discipline from China helped improve the global steel demand-supply balance. On the back of this strong demand growth and moderation in exports at unfair prices, the steel prices rebounded with increase in steel spreads. This improvement in steel spread during the year coupled with volume growth enabled the steel industry to deliver strong performance during the year.
India’s steel demand growth improved in the second half of the year post the gradual normalisation of the effects of demonetisation and GST. The Indian steel consumption grew at a healthy 7.9% on the back of government’s push for infrastructure spending and strengthening consumer demand. While steel imports into the country have moderated in recent months, YTD import of flat products increased by 16% y-o-y. Import of coated products continues at an elevated level, pressurising domestic manufacturers. Import of colour coated products increased by a staggering 250% y-o-y.
In this volatile environment, the Company continued to increase its market share in the domestic market. This robust demand growth, increased steel spreads, focussed cost reduction drive and value added steel product portfolio helped the Company deliver strong profitable performance during FY18.
4. Financial Review
4.1.1. Highlights FY18
` (in crore)
2017-18 2016-17 GROWTH % Revenue from operations 66,234 56,913 16
Other Income 213 255 -16
Operating EBITDA 13,741 11,544 19
EBITDA margin (%) 21.1% 22.1% -4
Depreciation and amortisation expense 3,054 3,025 1
Interest Expenses 3,591 3,643 -1
Profit before Exceptional Items 7,309 5,131 42
Exceptional Items 234 - -
PAT 4,625 3,577 29
Earning per share (diluted) (`) 19.14 14.80 29
The Company achieved a capacity utilisation of 91% and posted its highest ever production, shipments, revenue and EBITDA during the FY18.
For the year FY18, the Company reported a Crude Steel production of 16.27 million tonnes, a growth of 3% y-o-y. Production volumes in the first half were impacted due to water shortages and constrained iron ore availability and capacity utilisations increased to 94% in the second half of the year reflecting the steel demand growth and improvement in operational efficiencies.
During FY18, JSW Steel’s revenues increased by 16% from ` 56,913 crores to ` 66,234 crore. An increase in realisations and sales volumes were the primary drivers of this
performance. The Company’s saleable steel sales volume for the year grew by 6% y-o-y to 15.62 million tonnes owing to the Company liquidating excess inventory to meet demand growth.
JSW Steel continued its focus on pruning costs by improving yields and productivity and optimised the mix and sourcing of key inputs like iron ore and coal to withstand the volatile pricing environment. Further the JSW Steel commenced mining at one of its mines that was acquired as part of the mining auction in the State of Karnataka. The Company was able to achieve encouraging progress on key strategic initiatives like digitisation and logistics optimisation. This increase in steel product realisation and cost optimisation initiatives helped the Company report a operating EBITDA

110
JSW Steel Limited | Integrated Report 2017-18
of ` 13,741 crores for the year, which grew by 19% y-o-y to and EBIDTA margin stood at 21.1%. The Company registered a net profit after tax of ` 4,625 crore. In the senerio, it is not surprising that the Company registered industry leading ROCE of 16.4% in the year.
During the year JSW Steel continued to strengthen its balance sheet and reduced net consolidated debt by ̀ 3,529 crores. The Company’s total net debt gearing was at 1.27 as on 31 March 2018 (vis-à-vis 1.53, as on 31 March, 2017) and Net Debt to EBITDA stood at 2.59x as on 31 March 2018 (as against 3.20x as on 31 March 2017).
4.1.2. Revenue analysis` (in crores)
2017-18 2016-17 CHANGE CHANGE %Domestic Turnover 53,380 45,322 8,058 18Export Turnover 11,666 10,922 744 7Total Turnover 65,046 56,244 8,802 16Other Operating Revenues
1,188 669 519 78
66,234 56,913 9,321 16
Product wise quantity break-up (Mt)
PRODUCTS 2017-18 2016-17 % GROWTHRolled products - Flat 11.17 10.97 2Rolled products - Long 3.55 3.06 16Semis 0.90 0.74 22Total Saleable Steel 15.62 14.77 6
JSW Steel’s performance was relatively strong with the improvement in absolute volumes in the domestic market. The Company has also focussed on and increased VASP (Value Added and Special Products) sales. The total sales volume stood at 15.62 MnT, up by 6% vis-à-vis the previous year. JSW Steel also explored opportunities in the export market in addition to developing existing markets. The revenues were higher by 16% vis-à-vis the previous year on account of 6% volume growth and ~18% increase in sales realisations.
The other operating revenue was higher by ` 519 crores compared to the previous year. The growth in other operating revenue was primarily due to higher incentive benefits recognised attributed to upward revision in incentive rates and increase in regional sales and realisations.
Increase in rolled long products by 16% y-o-y on the back of strong demand
Product mix improved with value-added and special products sales, reaching 58% of total sales
4. 1.3. Other income` (in crores)
2017-18 2016-17 CHANGE CHANGE%
Other Income 213 255 (42) -16%
Other income for the year was lower primarily due to non-recognition of interest income on loans provided to certain subsidiaries due to uncertainty involved in its collectability as a result of losses incurred by these subsidiaries.
4. 1.4. Materials` (in crores)
2017-18 2016-17 CHANGE CHANGE %
Cost of material
consumed including
purchase & traded
goods and change in
inventories
37,470 27,955 9,515 34
The Company’s expenditure on material consumption increased by 34% from ` 27,955 crores in FY17 to ` 37,470 crores in FY18 primarily on account of increase in production volumes and increase in prices of input raw materials like iron ore and coal.
4. 1.5. Employee benefits expenses` (in crores)
2017-18 2016-17 CHANGE CHANGE %Employees Remuneration and Benefits
1,260 1,168 92 8
Employee benefits expenses increased by 8% to ` 1,260 crores in FY18 from ̀ 1,168 crores in FY17. This increase was largely due to annual increase in compensation for the employees. The Company employed about 11,619 employees as at 31 March 2018, vis-à-vis 11,861 employees as at the end of 31 March 2017.
4. 1.6. Manufacturing and other expenses` (in crore)
2017-18 2016-17 CHANGE CHANGE %Other Expenses 12,504 11,623 881 8
Manufacturing and other expenses increased by 8% from ` 11,623 crores in FY17 to ̀ 12,504 crores in FY18. The increase was primarily a result of increase in power and fuel cost and stores and spares consumed.
Power and fuel cost, a 16% increase amounting to ` 674 crores, rose on account of additional power purchases for increase in production volumes and hike in the rates of steam coal prices over the last year. Stores and spares consumption increased by 12% largely due to increase in prices of refractories and graphite.

111
Better Everyday. In Pursuit of Excellence. Corporate Overview Statutory Reports Financial Statements
4. 1.7. Finance cost` (in crores)
2017-18 2016-17 CHANGE CHANGE %
Finance Cost 3,591 3,643 (52) -1
Finance cost decreased by 1% to ` 3,591 crores in FY18 from ` 3,643 crores in the previous year. The decline was primarily due to lower interest costs on account of repayment of borrowings and reduction in rupee term loans and reduction in benchmark lending rates of various banks. The weighted average interest cost of debt was lower at 6.98% as on 31 March 2018 vis-à-vis 7.40% as on 31 March 2017.
4. 1.8. Depreciation and amortisation` (in crores)
2017-18 2016-17 CHANGE CHANGE %
Depreciation and
amortisation
3,054 3,025 29 1
Depreciation and amortisation increased by 1% to ` 3,054 crores in FY18 from ` 3,025 crores in FY17 due to additional depreciation on capitalisation of assets relating to projects and normal capex.
4.1.9. Exceptional items
During the year a subsidiary of the Company has surrendered one of its iron ore mine in Chile considering its economic viability and accordingly the Company has reassessed the recoverability of the loans given to and investments made in subsidiaries and recognised an impairment provision of ` 234 crores which has been disclosed as an exceptional item.
4.1.10. Tax Expense
The tax expense increased to ` 2,450 crores in FY 2017-18 from ` 1,554 crores in the previous year primarily on account of higher tax provision due to increase in profit before tax during the current year and higher effective tax rate. The effective tax rate was 34.62% during the current year as compared to 30.28% primarily due to discontinuance of additional tax incentives for investments in new plant and machinery and certain other disallowances.
4.1.11. Property, Plant and Equipment` (in crores)
2017-18 2016-17 CHANGE CHANGE %Tangible assets 49,503 50,215 (712) -1%Capital work-in-
progress
3,071 2,745 326 12%
Intangible assets 65 51 14 27%Intangible assets
under development
321 282 39 14%
Total 52,960 53,293 (333) -1%
The net block of Property, Plant and Equipment reduced by ` 712 crores during the year primarily on account of depreciation charge of ` 3,026 crores during the year offset by additions to the Property, Plant and Equipment to the extent of ` 2,403 crore. The capital work-in-progress increased by ` 326 crores primarily due to capital expenditure spend during the year offset by capitalisation of Property, Plant and Equipment
4. 1.12. Loans and advances` (in crores)
2017-18 2016-17 CHANGE CHANGE %Long-term loans and advances
5,165 2,771 2,394 86
Short-term loans and advances
158 121 37 30
Loan and advance on overall basis has increased primarily due to loans and advances provided to certain overseas subsidiaries to repay the borrowings guaranteed by the Company and other business needs of the subsidiaries.
4. 1.13. Current Assets` (in crores)
2017-18 2016-17 CHANGE CHANGE %Other Non-Current Assets
2,299 1,396 903 65
Other Current Assets 3,070 2,370 700 30
Other Non-Current Assets increased by ̀ 903 crores primarily due to increase in Capital Advances for upcoming projects.
Other Current Assets increased by ` 700 crores due to non-receipt of GST incentives and increase in supplier advances for iron ore.
4. 1.14. Inventories` (in crores)
2017-18 2016-17 CHANGE CHANGE %Raw Materials 4,918 3,590 1,328 37Work-in-progress 690 747 (57) -8Semi Finished/Finished Goods
2,826 3,702 (876) -24
Production Consumable and Stores & Spares
1,648 1,231 417 34
Total 10,082 9,270 812 9
The average inventory holding in terms of number of days as on 31 March 2018 for finished goods was 20 days vis-à-vis 33 days as on 31 March 2017. However overall inventory holding has came down to 72 days for FY18 vis-à-vis 83 days for FY17. The value of inventories increased by 9% predominantly due to higher cost of raw materials like coal and iron ore and spares as against the previous year. However, steel products inventory (SFG / FG) reduced by 1.47 lakh tonnes during FY18.

112
JSW Steel Limited | Integrated Report 2017-18
4. 1.15. Trade receivables` (in crores)
2017-18 2016-17 CHANGE CHANGE %Total Debtors 4,770 3,954 816 21Less: Provision for Doubtful debts
(78) (6) (72) 1,198
Trade Receivables 4,692 3,948 744 19
The average collection period in terms of the number of days as on 31 March 2018 was 26 days. There was no change in the average collection period as compared to the previous year. The increase is primarily on account of increase in steel prices during the year.
4.1.16. Borrowings` (in crores)
2017-18 2016-17 CHANGE CHANGE %Long-term borrowings 29,551 28,358 1,193 4Short-term borrowings
2,172 4,875 (2,703) -55
Current Maturity of
Long-Term Debt
4,099 4,703 (604) -13
Current Maturity of Finance Lease Obligations
359 337 22 7
Borrowings 36,181 38,273 2,092 5
Long-term borrowings (including current maturity of long term debt) increased by ` 611 crores mainly owing to availing new loans for capacity expansion projects during the year.
Short-term borrowings reduced by ` 2,703 crores during the year. This decrease was primarily due to repayment of working capital facilities.
4. 1.17. Trade payables` (in crores)
2017-18 2016-17 CHANGE CHANGE %Acceptances 8,098 8,415 (317) -4Other than Acceptances
5,890 3,189 2,701 85
Total Trade Payable 13,988 11,604 2,384 21
Trade payables increased by 21% mainly due to increase in creditors and material in transit for raw material due to increased volume of production and surge in raw material prices.
4. 1.18. Capital Employed Total capital employed increased by 2.5% from ` 64,375 crores as on 31 March 2017 to ` 65,986 crores as on 31 March 2018.
Return on capital employed was 16.4% for FY18.
4.1.19. Own Funds
Net worth increased from ` 24,098 crores as on 31 March 2017 to ` 27,907 crores as on 31 March 2018.
The book value per share was ` 115.45 as on 31 March 2018 as against ` 99.69 as on 31 March 2017.
4.2. Consolidated
The Company has reported consolidated revenue from operations, operating EBIDTA and net profit after tax of ` 71,503 crore, ` 14,794 crore, and ` 6,113 crore, respectively. The Company’s consolidated financial statements include the financial performance of the following subsidiaries, joint ventures and associates.
4.2.1. Subsidiaries
1. JSW Steel (Netherlands) B.V.2. JSW Steel Italy S.R.L.3. JSW Steel (UK) Limited4. Periama Holdings, LLC (w.e.f. 23 January 2017)5. JSW Steel (USA) Inc.6. Purest Energy, LLC7. Meadow Creek Minerals, LLC8. Hutchinson Minerals, LLC9. R.C. Minerals, LLC10. Keenan Minerals, LLC11. Peace Leasing, LLC12. Prime Coal, LLC13. Planck Holdings, LLC14. Rolling S Augering, LLC15. Periama Handling, LLC16. Lower Hutchinson Minerals, LLC17. Caretta Minerals, LLC18. JSW Panama Holdings Corporation19. Inversiones Eroush Limitada20. Santa Fe Mining21. Santa Fe Puerto S.A.22. JSW Natural Resources Limited23. JSW Natural Resources Mozambique Limitada24. JSW ADMS Carvao Limitada25. JSW Steel Processing Centres Limited26. JSW Bengal Steel Limited27. JSW Natural Resources India Limited28. JSW Energy (Bengal) Limited29. JSW Natural Resource Bengal Limited30. JSW Jharkhand Steel Limited31. JSW Steel Coated Products Limited32. Amba River Coke Limited33. Nippon Ispat Singapore (PTE) Limited34. Erebus Limited35. Arima Holdings Limited36. Lakeland Securities Limited

113
Better Everyday. In Pursuit of Excellence. Corporate Overview Statutory Reports Financial Statements
37. Peddar Realty Private Limited38. JSW Steel (Salav) Limited39. JSW Industrial Gases Private Limited (formerly known
as JSW Praxair Oxygen Private Limited) (w.e.f. 16 August 2016)
40. JSW Utkal Steel Limited (w.e.f. 16 November 2017)41. Hasaud Steel Limited (w.e.f. 13 February 2018)42. Milloret Steel Limited (w.e.f. 8 March 2018)43. Creixent Special Steel Limited (w.e.f. 27 February 2018)44. Dolvi Minerals & Metals Private Limited45. Dolvi Coke Projects Limited46. JSW Realty & Infrastructure Private Limited
4.2.2. Jointly controlled entities:
47. Vijayanagar Minerals Private Limited48. Rohne Coal Company Private Limited49. Geo Steel LLC50. JSW Severfield Structures Limited51. JSW Structural Metal Decking Limited52. Gourangdih Coal Limited53. JSW MI Steel Service Center Private Limited54. JSW Vallabh Tinplate Private Limited55. Accialtalia S.p.A. (w.e.f. 30 November 2016)
With rising spends in infrastructure projects,
the medium-term demand growth outlook is
quite constructive
91% Capacity Utilisation
5. Capital Expenditure Plan
FY18 marked a turning point for the domestic steel demand growth for the country, as elasticity of steel demand growth to GDP growth went back to >1x after more than 5 years. With rising spends in infrastructure projects, the medium term demand growth outlook is quite constructive. At the same time, with a 91% utilisation in FY18, there is an opportunity to expand capacity to participate in the strong India growth story.
With a strategic objective of augmenting the incremental capacity creation at a low specific investment cost so that they remain returns accretive, the Company has approved certain key new projects in addition to the existing capex pipeline to achieve the following:
Expand overall steelmaking capacity from 18 MTPA to 24.7 MTPA by March 2020.
Enrich the product mix with 3.2 MTPA additional downstream capacity.
Backward integration projects to achieve cost reduction.
The new projects that would be undertaken are explained in detail in the operational review section
The overall estimated capex plan of ` 26,815 crores announced last year, is expected to be enhanced by
~` 17,600 crores to implement the above new projects. Overall, the Company is now implementing a cumulative capex pipeline of ` 44,415 crores over a 4 year period between FY18 to FY21. With spend of about ` 4,700 crores in FY18, the Company plans to spend the balance ` 39,715 crores over the next 3 years. These projects are planned to be funded by a mix of debt and internal accruals in such a manner as to keep the overall leverage ratios within the targeted threshold levels of 3.75x Net Debt/EBITDA and 1.75x Net Debt/Equity. The Company’s capital investment cost is among the best in the industry at less than $600 per MT. The Company has a successful track record of executing project within the planned time-line as well as budget.

114
JSW Steel Limited | Integrated Report 2017-18
The Vijayanagar plant is counted among the world’s
most efficient steel production facilities in terms of
conversion cost
12 MTPA Capacity at Vijayanagar Works
6.1. Vijayanagar Works
Vijayanagar Works is the largest plant of JSW Steel with a total capacity of 12 million tonnes per annum. The facility is located 380 kilometres from Bengaluru at Toranagallu village in North Karnataka, in the Bellary-Hospet iron ore belt. It is well-connected to both Goa and Chennai ports. It is a fully integrated steel plant with a well-developed township. The Vijayanagar plant is counted among the world’s most efficient steel production facilities in terms of conversion cost. This plant manufactures a wide range of steel products in the flat and longs segments.
The Vijayanagar facility has been the first mover in India in many areas. It was the first integrated steel plant in India to:
a) Reach 12 MTPA capacity at a single locationb) Use Corex technology for hot metal productionc) Set up iron ore beneficiation facilityd) Implement pellet making technology based on both dry
and wet processe) Having combination of both non-recovery and recovery
types of coke ovens
Other distinctive features of the plant include:
a) Largest single location integrated steel plant in Indiab) Fastest growing steel plant in Indiac) Highest manpower productivity in Indiad) Highest growth rate in automotive steel sector in Indiae) Widest and largest hot strip mill in India
6.1.1. Capacity expansions roadmap and key projects
PARTICULARS CURRENT CAPACITY
(MTPA)
TARGETED CAPACITY
(MTPA)
TIMELINE
Ramp up total capacity
12 13 December – 2019
Product–category wise break-upFlat Products 8.2 8.8 December – 2019Long Products 2.8 4.0 July – 2019CRM1 complex capacity expansion
0.85 1.8 December – 2019
Colour Coating
line
- 0.3 October - 2019
6. Operational Review

115
Better Everyday. In Pursuit of Excellence. Corporate Overview Statutory Reports Financial Statements
Upstream Projects – Augmenting crude steel capacity at
Vijayanagar to 13 MTPA
The Company, in the last year, had announced a plan to revamp and up-grade capacity of Blast Furnace-3 at Vijayanagar, post which the higher cost BF-2 would have been ramped down keeping overall capacity at Vijayanagar at 12 MTPA. Considering the prospects of strong steel demand outlook, JSW Steel now plans to modify and enhance the capacities of Steel Making Shop and capacities of flat and long products mills with allied facilities to utilise the additional hot metal.
Capacity up gradation of SMS-3 at Vijayanagar Works from 1.4
MTPA TO 2.8 MTPA:
To handle the additional hot metal at the 13 MTPA stage, the SMS-3 would be upgraded up to 2.8 MTPA by adding associated facilities.
Capacity up gradation of HSM-1 at Vijayanagar Works to 3.8
MTPA:
HSM-1 at Vijayanagar works is to be revamped and upgraded to achieve 3.8 MPTA, by upgrading the reheating furnace and allied facilities.
New Wire Rod Mill No.2 at Vijayanagar Works:
To process additional Billets at the 13 MTPA stage, a new Wire Rod Mill of 1.2 MTPA capacity would be installed.
Cost reduction projects and manufacturing integration:
Setting up of 8 MTPA pellet plant and 1.5 MTPA coke oven plant at Vijayanagar: The Company has decided to set up an 8 MTPA pellet plant at Vijayanagar to strategically reduce the dependency on more expensive lump iron ore. The Company has also decided to set up a 1.5 MTPA coke oven plant at Vijayanagar to bridge the current and expected gaps in coke availability. Both these projects are expected to provide significant cost savings and are likely to be commissioned by March 2020.
6.1.2. Initiatives undertaken in FY18
a) Project Deep Drive
JSW Steel implemented multiple cost optimisation initiatives under ‘Project Deep Drive’ at various business critical departments (logistics, agglomeration and iron making, steelmaking, rolling mills, power and others) leading to substantial cost savings. Deep Drive follows the signature 4i methodology of ‘Identify-Ideate-Implement-Institutionalise’ to sweat out additional saving potentials in the system and trigger innovation.
b) Cost reduction using Overall Plant Effectiveness (OPE)
Loss Tree methodology
OPE Loss Tree was introduced in FY18 in key production units to capture various loss elements
due to lower availability, lower rate of production and poor quality. Specific cross-functional projects were taken up to address major loss elements. Improvement projects under the 0757 framework were also taken up to reduce various wastes and unearth cost benefits.
SR. NO.
MAJOR OPE IMPROVEMENT PROJECTS IN FY18
1 Modification of Green Mixture to improve
productivity of Sinter Plant 32 Reduce repair time of Noduliser of Sinter Plant 33 Increase finishing throughput of BRM1 and BRM2
for export rolling4 Reduction in baby coil scraps in CRM15 Decrease in roll change time in BRM2
c) Leveraging IT for cost management
IT has become an indispensable tool for informed and holistic decision-making. It further helps to improve visibility and provide the requisite information to the management. JSW Steel has implemented various IT modules to drive efficiencies across various functions ranging from optimising the raw material blend to elimination of manual intervention in roll change sequence, among others.
6.1.3. Highlights of FY18
This was the best year for Vijayanagar Works as the plant accomplished many firsts in terms of productivity.
Improved capacity utilisation of compared to earlier years
Operationalised the Tunga iron ore mines Added 47 new steel grades – 41 in flats products
(mostly automotive steel) and 6 in long products A pouring station of capacity 10,000 TPD at
SMS-1 for to handle torpedo and 140 T open-top ladles were commissioned to enhance steel melting shop productivity and casting capacity.
Movable KR station at SMS-1 for pre-treatment (desulphurisation) of hot metal as required for producing special steel grades and silicon steel was commissioned
HR Slitter line of 0.75 MTPA capacity at HSM-2 to cater to customer’s requirement of HR black, HRPO, HRSPO and BH grade steel in narrow width was commissioned
11 patents were filed – six being product-based and five process-based and four patents were granted
6.1.4. Priorities for FY19
Operationalisation of the remaining four mines (of the five acquired in the previous year in auction)
Setting up of Pipe conveyor system to enable the transportation of iron ore to the plant.

116
JSW Steel Limited | Integrated Report 2017-18
New water reservoir with a storage capacity of 32 million cubic meters, to meet the water requirement at Vijaynagar
Participation in Iron ore and coal mine auctions to ensure sustained raw material availability for manufacturing
6.2. Dolvi Works
Located on the Western coast in the state of Maharashtra, Dolvi is the second largest facility at JSW Steel. With a current 5 MTPA capacity, the plant is undergoing a ramp-up and in the next three years, this capacity will double to 10.7 MTPA. This strategically located plant is also connected to a jetty that has a cargo handling capacity of 15 MTPA. The facility is also the only primary producer of long products in Western India.
Substantial quantum of HR Coils produced in Dolvi is directed towards JSW’s downstream facilities for value addition. From automotive and industrial to consumer durables, Dolvi manufactures products that meet the needs of multiple sectors.
6.2.1. Highlights of the facility
a) Dolvi Works is India’s first to adopt a combination of Conarc Technology for both steel-making and compact strip production (CSP), aiding the production of hot rolled coils.
b) CO2 emissions at Dolvi Works is one of the lowest among
the steel plants in India. All the existing projects within the facility are compliant with the Indian standards for emissions.
c) Dolvi caters to JSW’s downstream facilities. 90% of its production is sold in Maharashtra The plant’s bar mill is the highest speed bar mill at a worldwide scale.
d) The plant is situated in close proximity to the Arabian Sea coast and this is a significant advantage for the Company. It provides easy access to the port, leading to cost reduction in logistics.
6.2.2. Capacity Expansion Roadmap and key projects
PARTICULARS CURRENT CAPACITY
(MTPA)
TARGETED CAPACITY
(MTPA)
TIMELINE
Ramp-up total capacity 5 10.7 December 2020*
Product-category wise break-up
Flat Products 3.5 8.5 December 2020*
*to be commissioned between March 2020 to December 2020.
Augmenting Crude Steel capacity at Dolvi to 10.7 MTPA
In beginning of the year, JSW Steel announced that steelmaking capacity at Dolvi Works would be increased from existing 5 MTPA to 10 MTPA. The major facilities included in the project are a 4.5 MTPA Blast furnace with 5 MTPA Steel Melt Shop, 5 MTPA Hot Strip Mill, 5.75 MTPA Sinter plant, 4 MTPA Pellet plant, and 4 Kilns of 600 TPD LCPs.
The expansion project at Dolvi to 10 MTPA is currently under implementation. In order to effectively utilise the steel making and casting capacity, the Company has decided to increase DRI capacity at Salav to 1.6 MTPA (from existing 0.9 MTPA) along with augmentation and modification of Steel Melting Shop at Dolvi for hot charging of DRI. This project is expected to be commissioned by March 2020. With this, the crude steel capacity at Dolvi would increase to 10.7 MTPA.
Phase-2 Coke Oven plant of 1.5 MTPA under DCPL:
The Company through its subsidiary, DCPL would set up a second phase of 1.5 MTPA coke oven plant along with CDQ facilities to cater to the additional coke requirement for the crude steel capacity expansion to 10.7 MTPA at Dolvi. This project is expected to be commissioned by June 2020.
Setting up 175 MW and 60 MW power plants at Dolvi:
The Company will set up power plants of 175 MW and 60 MW to effectively utilise flue gases and steam generated from CDQ, which will lead to savings in power costs. These power plants are expected to be commissioned in March 2020.
6.2.3 Key Initiatives during the year
a) Leveraging IT for driving plant and logistics efficiencies
Digitisation has been instrumental is driving efficiencies across the JSW value chain. At Dolvi Works, there were two focus areas for digitisation in FY18, as given below.
• Tracking of material movement between port and the facility – Using location-based tracking, the logistics movement to and from the plant and port can be monitored real time. Apart from bolstering diligence, this measure also results in identifying bottlenecks and safety issues that require immediate attention.
• Improving energy efficiency through real-time systems – Integrated steel plants like Dolvi Works require meticulously planned energy management systems. Efficient energy management helps ensure optimal production levels and lower costs. At Dolvi Works, technology-enabled systems assist in real-time monitoring and distribution of requisite energy to the multiple facilities at the plant.

117
Better Everyday. In Pursuit of Excellence. Corporate Overview Statutory Reports Financial Statements
b) Research and development (R&D)
During the year, five patents (three process and two product) were filed and one process patent filed earlier was granted.
6.2.4 Highlights for FY18
Installation of 500 TPD Vapour Pressure Swing Adsorption (VPSA) for increasing oxygen enrichment and ramp up hot metal production at blast furnace
Addition of the sixth strand billet caster to the existing machines to enhance the productivity
Waste heat recovery system installed at Sinter Plant-2 by utilising the waste heat from the sinter cooler by generating 20 TPH steam
Safety remains a priority area at Dolvi and FY18 saw a decline in the LTIFR. To further explore and improve safety practices in and around shop floor, the Company has entered into a partnership with global consultants DuPont
Developed/customised new 17 grades
Key sustainability projects
The Dolvi unit is handling two major and unique Corporate Social Responsibility projects as detailed below.
Mangrove restoration initiative – Mangroves act as the intermediate ecosystem between land and marine water. The buffer provided by the mangroves have been depleted in the recent past due to human-induced activities. This has caused flooding of the farmlands and destruction of the local ecosystem. As a socially committed organisation, JSW Steel has undertaken a large-scale initiative to restore mangroves to their pristine state with a project duration of three years. At present, over 5,000 hectares of land and over 7,800 people have been positively impacted. Over a lakh nursery plants have been developed and planted.
Large-scale afforestation initiative–To spread the green cover and foliage near the plant’s area of operations, JSW Steel has embarked on a journey of planting a million trees in Dolvi and surrounding areas. While the community can reap the benefits of increased plantation, the initiative also helps JSW Steel to ensure sustainable operations in the area.
Both these initiatives are aimed at restoring natural diversity and directly involve the local community
stakeholders in executing the projects and reaping their benefits.
6.2.5. Priorities for FY19
Conversion of the existing Lime Calcination Plant 1, 2 and 3 from pulverised coal to mixed gas (BFG + COG) to improve the productivity and quality of lime
Construction of new centralised stores with Automatic Storage Retrieval System to cater to the requirement of 10.7 MTPA
Construction of pellet-covered shed to guard the iron ore fines from monsoon to reduce moisture levels.
Mechanisation of coal yard by retrofitting with yard equipment and conveyor systems
Augmentation of pipe conveyor to railway siding for shifting the coke (0.6 MMTPA) to JSW Steel Vijayanagar by rake
Construction of coil storage shed for the storage and dispatch of hot-rolled coils and TMT bars
Laying of 1.1 metre diameter raw water pipeline from Nagothane intake pump house to Dolvi to cater to the requirement of 10 MTPA
Conversion of the existing slag grinding mill to coal mill for increasing coal injection in the blast furnace, which will result in cost savings by reduction in coke consumption
SMS Gas Cleaning Plant improvement by enhancing suction capacities and modification of bag house, which will improve productivity and control dust emissions
6.3. Salem Works
Salem Works is India’s largest special steel plant with 1 MTPA capacity and produces about 850 special grades of steel. It is distinguished as a leading virgin special steel producer with 100% waste utilisation. The plant is a major supplier to auto components and is a market leader for manufacturing special grade steel used in gears, crank shafts and bearings.
The strategic location of the Salem plant allows it to cater to the needs of the major auto hubs in southern India. Located nearly 340 km from Chennai and 180 km from Bengaluru, it is well connected through railways, highways and ports, which facilitates the transportation of raw materials and finished products.

118
JSW Steel Limited | Integrated Report 2017-18
6.3.1 Highlights for FY18
Caster III Project with 3 Strands commissioned successfully to handle casting sections.
Sliding Stand at BRM commissioned successfully to handle higher sections
Coil Annealing with capacity of 48,000 TPA has been commissioned for value added end products
Second Billet grinding machine has been set up during the year to improve quality of billets for Cold head quality and free cutting steels
Developed/ Customised 9 new grades mostly in automotive components
6.3.2 Priorities for FY19
Pre & Post Pickling Treatment with capacity of 84,000 TPA for BRM products
Bar Annealing with capacity 18,000 TPA for further value addition
CPP 3 with 30 MW is under erection Stove upgradation in BF 1 to improve Hot Blast
temperature Third Billet grinding machine
At JSW Steel, it is a constant endeavour of the team
to maximise the use of hot air and gases generated
during the various processes and to minimise the
consumption of fossil fuels.
48,000 TPA Coil annealing capacity commissioned
Power consumption is quite high in steel plants due to their various manufacturing processes. The steel manufacturing process comprises exothermic reactions, which generate significant heat that can be recycled and put to optimal utilisation. At JSW Steel, it is a constant endeavour of the team to maximise the use of hot air and gases generated during the various processes and to minimise the consumption of fossil fuels. This leads to significant savings in energy costs for the Company and helps reduce environmental footprint.
The outcome of such measures are explained below.
7.1. Vijayanagar Works
a) Burner replacement of captive power plants no. 3 and 4 to replace usage of coal with gas to reduce fuel consumption
b) Utilised of 100% gases generated in Corex
7. Energy Management

119
Better Everyday. In Pursuit of Excellence. Corporate Overview Statutory Reports Financial Statements
Raw materials and logistics continue to occupy the majority share of the steel industry’s cost and hence backward integration and raw material security are key components of the JSW Steel’s future strategy. JSW Steel believes that securing critical raw materials, either for sale on the global market or for direct use at its facilities, will help protect the Company from variations in raw material prices. Over the past few years, JSW Steel has instituted a strategy of diversifying its raw material sources. As a result, the Company believes it can strike the right balance between sourcing key raw materials and optimising input blend and cost.
During FY18, input costs witnessed a hike and JSW Steel neutralised the cost push partly owing to technology, continuous innovations and strategic procurement.
8.1. Iron ore
Iron ore is the key raw material for steel production. JSW Steel’s strategy is to participate in more iron ore mines auction to bolster backward integration.
Iron ore procurement remains a key area of focus. Given the Company’s upcoming capacity expansions, its requirement for iron ore is expected to grow. The Company procures iron ore from the third party sources through an optimum mix of domestic purchases and imports. In the case of Vijayanagar and Salem, the majority of the iron ore are sourced from within the State of Karnataka. The Dolvi’s iron ore requirements are met from iron ore sourcing from State of Odisha and imports.
Further to address uncertainties in iron ore supply, JSW Steel has relied on in-house beneficiation technology to transform low grade iron ore into higher grade usable inputs. In addition, a strategy of ensuring raw material supply security from various regions is being pursued.
At present, differential pricing maintained for the state of Karnataka relative to that of prevailing in Odisha, is a key issue for the JSW Steel as the Company’s largest plant (Vijayanagar Works) is situated in the state. During the year, the domestic prices were not in line with global levels and the benefits of competitive iron ore prices did not materialise for the Company.
Thus, to ensure the consistency of raw material supply and to maintain control over input costs, backward integration is adopted as the way forward for JSW Steel. JSW Steel will
7.2. Dolvi Worksa) Dolvi Works initiated the use of coke oven gas (COG)
in place of natural gas (NG) at following locations to improve energy/cost efficiency during FY18:
Partial replacement of NG for production of DRI, results in saving of 24,212 KNm3 NG
100% NG is replaced with COG at Tunnel Furnace for slab heating, leads to saving of 30,293 KNm3 NG
Commissioning of Bar Mill on mixed gas COG consumption in SMS ladle preheater in place
of NG resulted in saving of 1,040 ksm3/annum.
b) Implementation of online air fuel ratio logic at CPP, resulted in reduction of CPP heat rate by 2.8%.
c) Revamped Sinter plant # 1 for waste heat recovery boiler to generate 7 TPH steam
d) Installed waste heat recovery boiler at Sinter Plant 2 to generate 20 TPH steam
e) Reduced gaseous heat rate of Bar Mill from 0.45 Gcal/tp (in FY16/17) to 0.30 Gcal/tp
f) Increased power plant generation by 10.65% through usage of mixed gases.
7.3. Salem
Maximised steam generation through additional waste heat recovery boilers (WHRB # 4 and #5) resulting in reduction of coal consumption
Effective usage of hot metal production, by reducing the pig iron production resulted in savings of 0.12 Gcal/TCS
Minimised fuel, power and BF gas consumption at blast furnace through optimisation of production between Blast Furnace #1 & #2, and usage of higher sinter percentage
Optimised process at 150 TPD Air Separation plant resulting in savings of 45,000 kwh/month
Reduced power consumption in furnace -1 through installation of energy efficient motors with regenerative drive for EOT Crane, energy efficient motor with drive in hydraulic system, 6.6kv drive in ID fan motor resulted in savings of 1,59,000 Kwh/month
Saved energy in auxiliary cooling water pumps at CPP#2 through coating of pump internals resulted in savings of 8,300 Kwh/month
Utilised waste heat from Non-Recovery Coke Ovens effectively through waste heat recovery boilers
8. Procurement

120
JSW Steel Limited | Integrated Report 2017-18
continue to evaluate additional raw material assets that fit within its strategic criteria and intend to look for further opportunities in India and abroad to secure key raw material supplies and to reduce its cost of production by targeting strategic tie-ups and investments in new technologies to achieve further backward integration. JSW Steel believes this will further enhance the raw material security of the Company and lead to integrated and efficient operations.
Towards this effect, five mines in Karnataka were acquired in the previous fiscal pursuant to the auction conducted for iron ore mines in the State of Karnataka. One of these mines has become operational during the year and the remaining iron ore mines are expected to start functioning within the next financial year. These mines have an estimated reserves of ~111 million tonnes, which meets approximately 20% of the total requirements of iron ore at Vijayanagar.
8.2. Coal
Coal is another major raw material for steel manufacturers. During FY18, coal prices remained bullish for major part of the year, but it started to stabilise by the year end. There were not many weather disruptions throughout the year. JSW Steel was able to mitigate the impact of coal pricing to some extent owing to an optimal procurement strategy and blend management.
At JSW Steel, its in-house and state-of-the-art blend management system ensures that the Company’s dependence on premium coking coal is minimised. The process keeps the Company’s operating parameters at peak levels and blends semi-softs, anthracites and other lower-grade coals to be used in coke ovens in place of premium coking coal.
With the pricing mechanism in world coking coal markets shifting from annual to quarterly to monthly to index, JSW Steel has had to alter its buying pattern ratio of periodic and spot material to remain competitive. JSW Steel now analyses market dynamics to maximise cost benefits without compromising on technical specifications. Similar developments have been witnessed in sourcing thermal coal and other products. Some of the key strategies for coal procurement are as follows:
New sources of thermal coal reduced single source dependency and unit cost of power generation
Coal blend stabilisation: This was achieved by rationalising carbon bearing material and improving input quality in coke ovens. This has led to a significant reduction in the cost of production and decreases the overall consumption of coking coal
With the introduction of new sources of imported raw material, strategic sourcing has achieved goals such as uninterrupted production, controlled inventory levels, diversified risks, reduced costs and enhanced bargaining strength.
Further, the JSW Steel risk management policies attempt to protect business planning from adverse commodity price movements of iron ore and coal. Accordingly JSW Steel also hedges commodity price exposures. Commodity hedging is undertaken as a risk offsetting exercise.
The Company has secured the Moitra coking coal block via an auction process. This mine has total extractable coal reserve of around 30 MnT; and the coking coal mine is in advanced stage of development.
Quality is elemental to every activity at JSW Steel and consistent quality improvement has become a habit for the entire team. The Company periodically invests in cutting-edge technologies, people practices and process enhancements to enhance its quality and stay ahead of the peers.
9.1. TQM – Deming Journey
JSW Steel is on a Total Quality Management (TQM) journey for attaining quality excellence with all ISO-certified facilities and multiple plants applying for the coveted Deming prize.
JSW Steel’s Vijaynagar and Salem Works successfully qualified the TQM diagnosis in the July – September period of FY18. Moreover, the Company has submitted the application for Deming Challenge in March 2018 to Japanese Union of Scientists and Engineers (JUSE), Japan. Additionally, Dolvi Works has begun the Deming journey and aims to achieve the status by 2020.
9. Quality management

121
Better Everyday. In Pursuit of Excellence. Corporate Overview Statutory Reports Financial Statements
JSW Steel continues to build a meritocracy, ready to embrace new competencies for a sustainable future. The Company firmly believes that their strong employee base builds competitive advantage. The talent management team at JSW Steel aligns its policies with the refreshed Human Resource vision, values and purpose to transform boardroom strategies into business realities.
10.1. Learning & Development – People and Skills
Learning and development continue to be a key employee value proposition for JSW Steel, as it remains committed to implementing new training methodologies for its people. The Company imparts training across all departments through structured initiatives that revolve around the organisation’s ‘BUILD FOR TOMORROW – STRATEGIC PILLARS’.
During FY18, JSW Steel employees underwent systematic learning interventions focussing on the next role of capability building, leadership and enhancement of functional skills. These training sessions captured the learning needs of people from the annual performance management discussion, which is designed around three pillars of capabilities - career, competency, and leadership.
JSW Steel’s plants have end-to-end, cross-functional quality assurance system, which has become a true hallmark. The Company’s focus on quality has helped its multiple facilities achieve both internal and external recognitions such as the ICQC Award for quality and the CII EXIM Award for Business Process Model.
10. Talent Management
TQM FUNCTIONS
Tracking & review
Business Assessments
Project
& Training
TQM Governance
Approach
Solving & Task Achieving
Breakthrough Thinking
TQM VEHICLES
Policy Management
Daily Management
Employee Engagement
TQM METHODOLOGIES
TQM PRACTICES
BUSINESS EFFECTS
4-I Problem Solving Approach
Solving Projects- QIPs Year-On-Year
improvement of Performance & Sustainability Parameters
Management
Kaizen Format, OPLs, Poka Yoke
QC Story Approach
Horizontal
Superior Customer Engagement
Superior Employee Engagement
INPUT SIDE OUTPUT SIDE
Integrated Management System (IMS)
Integrated TQM framework at Vijayanagar Works
10.2. Project Lakshya
JSW Steel aims to inculcate a high-performance work culture across all levels of the organisation. It has thus initiated Project Lakshya, a learning intervention for workmen-level employees in all plants. The intervention includes topics like driving self-motivation, time management, building the right habits, power of thinking, communicating with purpose, effective communication skills, presentation skills and conflict management. The Company covered 1,500 employees across plants through Project Lakshya.
10.3. Future Fit Leaders
The Company has a robust framework to build a future-fit talent pool. It further endeavours to empower its team to take the organisation into the new level of growth and sustainability, while at the same time, driving career aspirations.
In FY18, the team identified 97 Future Fit Leaders (FFLs) from various business segments. A comprehensive capability development programme was designed and implemented for accelerating the progress of the FFLs. The development

122
JSW Steel Limited | Integrated Report 2017-18
programme comprised classroom learning from ivy-league schools and on-field assignments. Additionally, the Company also commissioned systematic development programmes for ~1,319 high performers who underwent training at the development centre.
10.4. The IIM-A Executive Education programme focus
The primary objective of JSW Steel’s IIM-A Executive Education programme is to prepare each participant for executing multi-faceted responsibilities of leadership roles at the Company. This programme provides a unique opportunity for both personal and professional growth. It allows the candidate to develop knowledge and insight and expand the breadth of perspective, cultivate leadership skills and inculcate strategic mindset.
10.5. JSW Springboard – Next Steps
1) Women Leadership Programme
The Company believes in promoting diversity at work and thus wants to encourage women leaders at JSW Steel. The Women Leadership Programme is a structured need-based development journey for high-performing female employees, which will be piloted by IIM Bangalore.
2) Gender Sensitisation Workshops
Gender sensitisation is a very important aspect in the Company’s vision to add more women leaders to the organisation. Gender sensitisation workshops will be conducted for the leadership team and all line managers with women employees in their teams. These workshops will address the concepts of diversity and inclusion for managers while focussing on behavioural changes.
3) Building & Strengthening Performance Conversation
At JSW Steel, process and performance improvements are priorities and the Company views performance conversation as a catalyst for overall performance improvement. The entire capability development programme was based on the Great Place to Work survey results and the manager feedback report. These workshops help participants develop essential skillsets for more effective leadership roles in the Company.
4) Candid Conversation – A Platform to interact with JSW Leaders
Face-to-face open discussions help build strong relationships and ensure lifelong connections. Keeping the same in mind, JSW Steel has created a two-way communication platform named ‘Candid Conversations’
to enable greater interaction between its employees and leaders.
5) Pre-Retirement Workshops
Driven by the philosophy of ‘Better Everyday’, JSW Steel is taking a step ahead in enhancing employee lives even post retirement. The Company launched pre-retirement workshops for its retiring employees and their spouses to prepare them for the changes during and after retirement. These workshops also encourage them to explore new opportunities post retirement.
10.6. Fresh Talent – JSW Campus Engagement
The Company is focussed on widening its footprints across India’s top college and university campuses through its Undergraduate Internship Programme, Summer Internship Programme and Management Internship Programme. JSW Steel has successfully established a strong presence among the Tier I engineering and management institutes, while its Undergraduate Internship Programme has gained significant traction among the most Tier I campuses. Interns absorbed through this programme further undergo the Graduate Rotation Programme comprising four months of training and two sets of rotations.
2018 Internship Programme
PROGRAMME DETAILS
SUMMER INTERNSHIP PROGRAMME
MANAGEMENT INTERNSHIP PROGRAMME
Campus Category Tier I Tier IDegree B.Tech/ B.A/ B.Com/ B.Sc/
B.A./ LLB
MBA
Number of
campuses
targeted
16 10
Campus List IIT-Delhi, IIT-Mumbai,
IIT-KGP, IIT-Kanpur, BHU,
Roorkee, Gandhinagar,
Madras, BITS Pilani, VJTI,
LSR, SRCC, St. Stephen’s,
FLAME, GLC, Symbiosis
IIM – Ahmedabad,
Bangalore,
Calcutta, Indore,
Lucknow;
MDI, IIFT, FMS,
JBIMS, XLRIBatch Size 33 23Internship
Duration
8 Weeks 8 Weeks
Applications
Received
3,500 and above 2,700 and above
10.7. Great Places to Work – Trust Impact Tool
Great Places to Work (GPTW) survey was completed at JSW Steel in December 2016. It provided deep insights into the pulse of the JSW Steel employees. The survey was conducted across the Group and covered more than 16,000 employees through both online and offline mode. The same led to discovery of various scores across demographics and

123
Better Everyday. In Pursuit of Excellence. Corporate Overview Statutory Reports Financial Statements
their relative comparison with Top 100 companies, as well as the best in manufacturing industry. Improvement areas were identified and the Company is working diligently on them to deliver desired results.
10.8. Employee Compensation & Benefits
10.8.1. Tenets of JSW Employee Remuneration Policy
JSW Steel is a performance driven organisation that recognises and rewards good performance while focussing on employee retention and career growth. The Company provides its people competitive remuneration and regularly conducts studies to understand the trends in executive and employee pay positioning in steel and related industries.
The Company’s remuneration programme is designed to attract, motivate and retain employees. It has a salary pay mix with appropriate performance incentives for managers and executives. At JSW Steel, employees share both risk and wealth creation with the Company in the form of long-term incentive plans. JSW Steel’s future focus will be to further strengthen its performance-based pay philosophy. The Company has also launched initiatives like flexible compensation, encouragement for participation in National Pension Scheme (NPS) and retiree health insurance.
Performance review is a three-step process in JSW Steel. It begins with the setting of organisational goals, aligning teams and individuals to the Company’s objectives, strategies and processes and includes monthly review of goals and achievements with corrective actions. The employee then selects the specific JSW competency, which he/she needs to build upon and finally chooses his/her individual development plan.
Intrinsic Value of the Role
Individual Performance
Market Competitive
Company Performance and Budgets
Legal Compliance
10.9. Performance Management
JSW Steel’s performance management process is a continuous journey to achieve the following four fundamentals
Driving Performance Culture
Fairness & Transparency
Feedback & Communication
Performance Differentiation
Driving Performance Culture for Greater Shareholder
value creation
Drive fairness & transparency by consistently communcating
and interacting with all the relevant stakeholders
Continuous feedback and communication (both formal
and informal) between manager and employee
Differentiation of Talent based on performance

124
JSW Steel Limited | Integrated Report 2017-18
10.10. JSW HR Digitisation
In the last few years, JSW Steel has adopted several collaborative initiatives to develop and connect various functions of the Company with its HR functions to facilitate improved decision-making.
During FY18, the Company adopted the following digitisation initiatives for HR:
i. Launched online learning module for all employees across the Group with support from the digitisation partners Success Factors while it conducted courses and training in association with Harvard Manage Mentor and Skillsoft.
ii. Installed contract workforce management, which is currently underway in partnership with an industry expert.
iii. Unveiled a single website with Single Sign On (SSO) access in the form of JSW intranet for all employees across the group.
iv. Shifted performance management system to more user-friendly and agile Success Factors system
v. Commenced work on digitising the compensation management system for all group companies across locations and for employee expense management system with our partners Success Factors and Expenzing.
Information technology (IT) is critical in integrating JSW Steel’s diverse operations and helps enhance the value proposition of the business. The Company has commissioned several projects to further strengthen and enhance IT penetration within its procedures, as IT facilitates disciplined processes and enables faster decision-making. The Company leverages ERP solutions for its business operations, which are based on the SAP platform that empowers smooth data collation, decision-making, MIS and data security.
JSW Steel persistently strengthens its IT architecture to implement important initiatives, and thereby aligns its business processes to dynamic sectoral and economic realities.
During FY18, the Company’s GST roll out was implemented successfully with entire set of systems reconfigured for the new tax regime. It further dynamically undertook subsequent modifications upon receiving change notifications.
11.1. IT-Business Initiatives
During FY18, the Company implemented several IT initiatives to enhance efficiencies, automation and digitisation of its core processes:
a) Modernised various MES systems phase-wise at different steel plants.
b) Enhanced customer-centricity and enabled all round customer focus through a leading customer relationship management solution that is being deployed, which will ensure the sales force is more responsive to customer needs.
c) Ensured two-way communication between the Company and its customers through a web- and app-based customer portal that is being developed.
d) Strengthened HR processes further with best-in-class solution for all employee processes from hire to retire (including recruitment, on boarding, performance management, e-learning, and exit); compensation management/career development and succession planning through IT-based processes is also underway for FY19.
e) Designed comprehensive contract workforce management system to efficiently manage the workforce; deployment for steel plants has already started and will end for all plants within FY19.
f) Digitised all mining processes using the most modern digital technologies — the digital mining processes will be extended to all mines as and when they are scheduled to get operational.
g) Approved the critical technical architecture initiative of migrating the base SAP platform and the process is currently on, which will be completed in FY19; an analytics platform will also be deployed along with it.
h) Reinforced cyber security through multiple projects, which are underway.
11. Information Technology

125
Better Everyday. In Pursuit of Excellence. Corporate Overview Statutory Reports Financial Statements
i) Created the architecture strategy for JSW Steel to migrate from SAP base platform to HANA, enabling SAP to become the digital core; the new architecture will be realised by the end of FY19 and multiple architecture projects are currently in progress.
j) Implemented the distributor management system for secondary sales in the retail segment.
k) Deployed multiple projects enhancing process efficiency and data visibility like exports and imports documentation management; Total Quality Systems and portals; advances planning and optimisation projects for providing delivery commitment to customers; order management solutions, legal case management solution and others — all in different stages of completion.
11.2. Digital Initiatives
During FY18, JSW Steel incorporated digitalisation in critical areas of manufacturing operations, supply chain, and sales and marketing. It collaborated with global firms to facilitate a smooth digital journey.
JSW Steel’s digital project has the following critical components:
a) Governance setup for digital projects
b) Establish a dedicated digital Centre of Excellence
c) Identification of projects in Wave 1 and Wave 2
The Company’s digital journey began with ‘the art of possibility’ where all improvement areas across the businesses were identified and consolidated. JSW Steel applied scientific criteria to shortlist projects and understand the applicability of digital levers, ROI, impact and delivery period. These projects went through an approval process and became digital projects for delivery and were named Wave 1 projects. Similarly, Wave 2 was run to arrive at further projects and ~35 such projects were identified having significant impact on the bottom line.
The projects will deploy Internet of Things, value in use, optimisation tools, data modelling and analytics to solve the business issues. The digital journey, at JSW Steel, will continue in FY19 with the addition of 2-3 critical processes to improve the bottom line.
The Company’s digital journey began with ‘the art of possibility’ where all improvement areas across the businesses were identified and consolidated.
~35 Projects identified in Wave 2
126
JSW Steel Limited | Integrated Report 2017-18
JSW Steel follows the globally recognised ‘COSO’ framework for risk governance. The Company is aware that recognising and identifying emerging risks to mitigate them is a critical business activity. It has a robust risk management framework that identifies and evaluates business risks and opportunities to:
a) Protect the interest of its shareholders and stakeholders
b) Achieve its business objective
c) Enable sustainable growth
12. Risk Governance Pursuant to the requirement of Regulation 21 of the Securities and Exchange Board of India (Listing Obligations and Disclosure Requirements) Regulations, 2015 and Clause 49 of the erstwhile Listing Agreement, the Company has constituted a sub-committee of Directors to oversee Enterprise Risk Management framework and ensure:
a) Execution of decided strategies with focus on action
b) Monitoring risks arising out of unintended consequences of decisions or actions related to performance, operations, compliance, incidents, processes, systems and the same are managed appropriately
Key risks and the Company’s response strategies are detailed below.
Strategic risk(s)
RISK TYPE MOVEMENT IMPACT RESPONSE STRATEGIES
Competitive dynamics & industry Cyclicality
The following can affect sales &
margin:
1) Adverse global and
domestic demand-supply
dynamics
2) Cyclical nature of steel
industry
3) Unfair trade practices
resulting into surge in
imports
4) Trade barriers imposed by
other countries like US,
Europe.
Company de-risks by -
1) In-house research team tracks macro environment with
help of reports of specialised agencies & interactions with
all concerned.
2) Due diligence review carried out before dealing with
unknown markets.
3) Better market intelligence with inputs from marketing team.
4) Widening and deepening customer reach in domestic &
international markets. This gives flexibility in switching over
from domestic to export market & vice versa.
5) Broadening product range like CRM, auto grade etc..
6) Increased Value-added products like galvanised,
galvalume.
7) Responsive credit & pricing policy so as to stay
competitive.
Marketing At present, global steelmaking
capacity exceeds global
consumption of steel products.
This often results lower
realisation & reduced margins.
Company’s capacity expansion
at Dolvi may be impacted due
to lack of market potential for
increased volumes.
1) Indian Steel demand expected to grow at 7+% CAGR.
The Company expects to increase its domestic market
presence & share.
2) Indian steel exports expected to grow due to improving
competitiveness in couple of years; which will help
Company to improve its exports volume.
3) Company’s downstream capacity is being expanded. This
will result in additional HR demand from its downstream
units.
4) Company’s price competitiveness is expected to help in
import substitution of HRC in Western region.

127
Better Everyday. In Pursuit of Excellence. Corporate Overview Statutory Reports Financial Statements
RISK TYPE MOVEMENT IMPACT RESPONSE STRATEGIES
Raw materialavailability & cost
Availability and cost of required
grade of Iron ore are impacted
by:
1) Global movement and parity of landed cost considering price, freight, tariff and exchange rates.
2) Domestic demand-supply gap, constraints & vendor actions.
3) Govt. Policies on mining, auction of mines and tariff.
1) Company has successfully participated in public auction
of mines & bagged 20 years leasing rights of 5 mines
(approximate 5 MTPA capacity). The production is expected
to start in FY19. This will reduce dependency on State
suppliers & other vendors.
2) During last year, company imported iron ore from Brazil &
Australia as the landed cost of imports is relatively lower
on the concept of value-in-use.
3) Regular tracking of Government policies & announcements
for future auctions & regulatory changes in sourcing
countries.
Infrastructure & Logistics
Company is in the process of brownfield expansion at its Dolvi plant.
Various factors can affect movement of enhanced quantity of inbound raw material & outbound goods like -
a) Port congestion, unloading/ loading infrastructure, rail connectivity, channel blockage.
b) Storage & material handling (RMHS) system to protect material from exposure to weather thereby its metallurgical property.
Various measures are being taken such as –
1) Additional gates being constructed for smooth movement of vehicular traffic.
2) the rail track length in Rail yard & HSM area is being increased.
3) higher capacity barges / Mini Bulk Carriers (MBCs) being procured for transportation of inbound raw material & outbound finished goods. This will also reduce pressure on road movement.
4) Improving infrastructure facilities at Dharamtar jetty like – increasing jetty length, dredging for deeper draft, additional barge unloaders.
5) Additional storage yards for iron ore fines & coal are being constructed to handle the enhanced volumes.
Operational risk(s)
RISK TYPE MOVEMENT IMPACT RESPONSE STRATEGIES
Availability of water for production
Shortage of water can affect
production.
1) Company is proactively developing water storage capacities at its plants to match the increasing water requirement due to capacity expansions.
2) Apart from this, to reduce water consumption, Company is investing in various technologies like-
a) Converting water condensers to Air condensers in captive power plant,
b) Setting up Zero liquid discharge plants, RO Plants, sewage treatment plants,
c) Water reduction in coke production through Coke Dry Quenching (CDQ) technology.
Availability of power for production
Company’s proposed expansion
at Dolvi would increase the power
requirement. Inadequate power
supply & network bandwidth may
lead to operational interruptions &
affect the production.
1) The power required would be met partly through captive from Coke oven / Blast Furnace gases and balance being sourced from JSW Energy, Ratnagiri & MSEDCL through open access.
2) In order to have network bandwidth, 200 KV additional transmission line of 20 kms is planned from Nagothane to Plant.

128
JSW Steel Limited | Integrated Report 2017-18
RISK TYPE MOVEMENT IMPACT RESPONSE STRATEGIES
Environment Steel making process involves
emission of CO2, dust & other
hazardous gases / waste.
These emissions pose risk to
environment & sustainable
growth.
India is also a part of Paris
agreement (COP 21) which
aims at reducing carbon
emissions.
1) Company ensures compliance with norms
through selecting right equipment, technology,
processes, inputs and regularly monitor
emissions.
2) Company regularly tracks changes in technology
& future norms; so as to plan in advance.
3) Company gives thrust on sustainable products
that are safe for consumers. Company has
developed products that are environment friendly
& safe for usage like high-strength low carbon
steel, lesser weight steel used in Auto sector
that makes the vehicle lighter which helps in
reducing the carbon footprint as well as safety of
travellers.
4) Last year, JSW Steel was 1st Indian steel
company to get an Environmental Product
Declaration (EPD) label for HR steel strip in line
with ISO 14025.
Human resource Human workforce with
required skillset & experience
is critical for maintaining
current level of operations
& upcoming expansions at
plants.
1) Senior leadership support helps in setting the
tone at the top.
2) Company has strong HR policies & processes in
place for hiring & retaining of talent.
3) Robust performance management system to
reward performers which helps attracting &
retaining the talent.
4) Adequate training & grooming for future-fit
leadership with specially designed courses from
IIM-Ahmedabad & Cornell university, USA.
5) Launched ’SKILLS 2020. programme where
in employees have to acquire 10 skills, as
suggested by World Economic Forum, through
online learning tool over next 2 years.
6) Gender diversity initiative ’SPRINGBOARD‘
launched for women leadership development.
Information systems
Absence of robust Information
security may lead to
compromise of confidentiality,
integrity & availability of
information
Company ensures strengthening cyber security
through –
1) Implementation of policies on IT security.
2) Deployment of antivirus / endpoint security at all
locations.
3) Creating security awareness amongst employees
through e-mails & regular communication.
4) Establishment of Disaster recovery site for SAP-
ERP & other critical applications/software.
5) Implementation of SAP-GRC control to ensure
segregation of duties & role based access to
information.

129
Better Everyday. In Pursuit of Excellence. Corporate Overview Financial Statements
Compliance risk(s)
RISK TYPE MOVEMENT IMPACT RESPONSE STRATEGIES
Health & Safety
Any safety lapses would result in damage to property, assets & human capital.
1) International consultant ’DuPont‘ has been engaged for rolling out their international safety standards.
2) All 14 standards are being implemented across all plant locations.
3) Safety has been added as Key Performance Indicator (KPI) for Managers. There is provision of disincentives for any safety breach incidents, accidents reported in the department.
4) Periodic safety training imparted to employees & associates.
5) Mandatory usage of safety gadgets such as safety shoes, helmets, hand gloves, masks on shop floor/plants.
6) Monthly apex safety meetings are held for review of safety aspect, fatal accidents/near miss accidents, if any.
7) Fire protection systems in place like fire extinguishers, fire tenders, periodic mock drills.
8) Medical facilities, Medi-claim policy cover for employees & their families; Group insurance policy for employees.
9) Strong Security arrangements like security check-post, entry pass / identity cards, access control system, CCTV at critical locations.
Forward-looking and Cautionary Statements:
Certain statements in this release concerning our future growth prospects are forward-looking statements, which involve a number of risks, and uncertainties that could cause actual results to differ materially from those in such forward-looking statements. The risks and uncertainties relating to these statements include, but are not limited to, risks and uncertainties regarding fluctuations in earnings, our ability to manage growth, intense competition within Steel Industry including those factors which may affect our cost advantage, wage increases in India, our ability to attract and retain highly skilled professionals, time and cost overruns on fixed-price, fixed-time frame contracts, client concentration, restrictions on immigration, our ability to manage our internal operations, reduced demand for steel, our ability to successfully complete and integrate potential acquisitions, liability for damages on our service contracts, the success of the companies in which – has made strategic investments, withdrawal of fiscal governmental incentives, political instability, legal restrictions on raising capital or acquiring companies outside India, unauthorised use of our intellectual property and general economic conditions affecting our industry. The Company does not undertake to update any forward-looking statements that may be made from time to time by or on behalf of the Company.
Statutory Reports
130
JSW Steel Limited | Integrated Report 2017-18
To the Members ofJSW STEEL LIMITED,
Your Directors take pleasure in presenting the First Integrated Report alongwith financial statements on the business and operational performance of the Company for the Financial year ended 31 March 2018.
1. FINANCIAL RESULTS(` in crores)
Standalone Consolidated
FY 2017-18 FY 2016-17 FY 2017-18 FY 2016-17
I Revenue from operations 66,234 56,913 71,503 60,536
II Other income 213 255 167 152
III Total income (I + II) 66,447 57,168 71,670 60,688
IV Expenses:
Cost of materials consumed 35,995 28,400 38,779 29,749
Purchases of stock-in-trade 1,063 945 2 -
Changes in inventories of finished goods, work-in-progress and stock-in-trade
412 (1,390) 244 (1,486)
Employee benefits expense 1,260 1,168 1,843 1,700
Finance costs 3,591 3,643 3,701 3,768
Depreciation and amortisation expense 3,054 3,025 3,387 3,430
Excise duty expense 1,259 4,623 1,278 4,932
Other expenses 12,504 11,623 14,563 13,467
Total expenses 59,138 52,037 63,797 55,560
V Profit/(loss) before exceptional items and tax (III - IV) 7,309 5,131 7,873 5,128
VI Exceptional items 234 - 264 -
VII Profit/(loss) before tax (V - VI) 7,075 5,131 7,609 5,128
VIII Tax expenses/(benefit):
Current tax 1,578 (53) 1,826 152
Deferred tax 872 1,607 (288) 1,522
2,450 1,554 1,538 1,674
IX Profit/(loss) for the year (VII - VIII) 4,625 3,577 6,071 3,454
X Share of (loss)/profit from an associate - (9)
XI Share of profit from joint ventures (net) 42 22
XII Total Profit/(loss) for the year (IX + X + XI) 4,625 3,577 6,113 3,467
XIII Other comprehensive income
A i) Items that will not be reclassified to profit or loss
a) Re-measurements of the defined benefit plans (3) (16) (5) (20)
b) Equity instruments through Other Comprehensive Income
82 (63) 92 (68)
ii) Income tax relating to items that will not be reclassified to profit or loss
1 6 2 7
Total (A) 80 (73) 89 (81)
Directors’ Report

131
Better Everyday. In Pursuit of Excellence. Corporate Overview Statutory Reports Financial Statements
The Company has adopted Indian Accounting Standard (referred to as ‘Ind AS’) with effect from 1 April 2016 and accordingly these financial results along with the comparatives have been prepared in accordance with the recognition and measurement principles stated therein, prescribed under Section 133 of the Companies Act, 2013 (“Act”) read with the relevant Rules framed thereunder and the other accounting principles generally accepted in India.
2. RESULTS OF OPERATIONS During the Financial Year 2017-18, the global business
cycle turnaround and structural factors provided fundamental support to steel demand. The cyclical upturn for steel broadened and firmed throughout the year leading to better than expected performance from both developed and developing economies.
The structural factors such as supply reforms in China by way of continuing closure of inefficient production facilities and pollution induced production curtailments coupled with strong domestic demand in China lead to lower exports from China. This discipline along with robust steel demand helped improve global steel demand-supply balance. During the year, the steel prices rebounded due to resilient demand and improved steel demand-supply balance.
The steel spread, calculated by subtracting iron ore and coking coal prices from the benchmark HRC price has been improving throughout the year. This improved steel spread coupled with higher volumes enabled the steel industry to deliver improved results in the current year.
Indian steel consumption grew by 7.9% and there was competitive pressure in the domestic market due to a surge in domestic steel production and an elevated level of imports specifically in coated products. Steel consumption grew largely in the second half of the year on the back of the Government’s push for infrastructure spending and strengthening consumer demand. In this competitive environment, the Company continued to increase its market share in the domestic market.
This robust domestic demand, focused cost reduction drive and value added special product portfolio helped the Company deliver strong profitable performance and consequently the Company’s profitability improved during FY 2017-18.
(A) Standalone Results Your Company delivered its highest ever production
volumes, sales volume, EBITDA and profit after tax during the FY 2017-18.
(` in crores) Standalone Consolidated
FY 2017-18 FY 2016-17 FY 2017-18 FY 2016-17
B i) Items that will be reclassified to profit or loss
a) The effective portion of gains and loss on hedging instruments
(341) 300 (401) 347
b) Changes in Foreign Currency Monetary Item Translation Difference account (FCMITDA)
(33) 297 (33) 297
c) Foreign Currency Translation Reserve (FCTR) - - 9 30
ii) Income tax relating to items that will be reclassified to profit or loss
130 (207) 150 (223)
Total (B) (244) 390 (275) 451
Total Other comprehensive income/(loss) (A+B) (164) 317 (186) 370
XIV Total comprehensive income/(loss) (XII + XIII) 4,461 3,894 5,927 3,837
Total Profit /(loss) for the year attributable to:
- Owners of the Company 6,214 3,523
- Non-controlling interests (101) (56)
6,113 3,467 Other comprehensive income/(loss) for the year attributable to: - Owners of the Company (184) 365
- Non-controlling interests (2) 5
(186) 370 Total comprehensive income/(loss) for the year attributable to: - Owners of the Company 6,030 3,888
- Non-controlling interests (103) (51)
5,927 3,837

132
JSW Steel Limited | Integrated Report 2017-18
The Company reported crude steel production growth of 3% y-o-y at 16.27 million tonnes for the full year FY 2017-18. Saleable steel sales volume for the year grew by 6% y-o-y to 15.62 million tonnes, driven by domestic sales.
Revenue from operations for FY 2017-18 stood at ` 66,234 crores, up 16% y-o-y.
This revenue was driven by sales volume growth of 6% y-o-y and higher realisations. The Company also progressed well on multiple performance improvement initiatives – from diversified sourcing, optimisation of logistics costs, digitalisation projects driving improvement of yields and productivity. As a result, the operating EBITDA for the year grew by 19% y-o-y to ` 13,741 crores. The Company posted a net profit of ` 4,625 crores for FY 2017-18 as compared to the net profit of ` 3,577 crores for FY 2016-17.
During the year, a subsidiary of the Company has surrendered one of its iron ore mines in Chile considering its economic viability. Accordingly, the Company reassessed the recoverability of the loans given to and investments made in these subsidiaries and recognised an impairment provision of ` 234 crores which has been disclosed as an exceptional item in the standalone financial statements.
The Company’s net worth increased to ` 27,907 crores as on 31 March 2018 as compared to ` 24,098 crores as on 31 March 2017. The Company’s gearing (Net Debt to Equity) at the end of the year stood at 1.27x (as against 1.53x as on 31 March 2017) and Net Debt to EBITDA stood at 2.59x (as against 3.20x as on 31 March 2017).
(B) Consolidated Results Revenue from operations on a consolidated
basis for FY 2017-18 stood at ` 71,503 crores. The operating EBITDA stood at ` 14,794 crores, registering an increase of 22% y-o-y. Sales of value-added products grew by 13% y-o-y to 9 million tonnes for FY 2017-18. The Company reported a net profit of ` 6,113 crores for FY 2017-18 as compared to the net profit of ` 3,467 crores for FY 2016-17.
The performance and financial position of the subsidiary companies and joint arrangements are included in the consolidated financial statement of the Company.
The operational performance at the US operations of both the Plate and Pipe mill at Baytown, as well as the US coal operations, have seen an improvement during the course of the year. In view of the improved operating performance and a strong economic outlook for the USA, the Company during the year ended 31 March 2018 has recognised a Deferred Tax Asset amount of ` 729 crores on the unutilised tax losses to the extent of temporary differences. Further during the year, pursuant to the enactment of Tax Cuts and Jobs Act by the USA on December 22, 2017, the corporate income tax rate in USA has been reduced to 21% resulting in a reversal of deferred tax liabilities amounting to ` 572 crores. Accordingly, the Company has recognised a Deferred Tax credit of ` 1,301 crores in the consolidated financial statements.
During the year, the Group has surrendered one of its iron ore mines in Chile considering its economic viability and accordingly has reassessed the recoverability of carrying amounts of Property, Plant and Equipment, Goodwill and advances pertaining to the said iron ore mine and recognised an impairment of ` 264 crores, which has been disclosed as an exceptional item in the consolidated financial statements.
The Company’s net worth increased to ` 27,534 crores as on 31 March 2018 as compared to ` 22,401 crores as on 31 March 2017. The Company’s gearing (Net Debt to Equity) at the end of the year stood at 1.38x (as against 1.85x as on 31 March 2017) and Net Debt to EBITDA stood at 2.57x (as against 3.41x as on 31 March 2017).
In terms of Section 134(3) (l) of the Companies Act, 2013, except as disclosed elsewhere in this Report, no material changes or commitments affecting the financial position of the Company have occurred between the end of the financial year and the date of this Report.
3. DIVIDEND The Board of Directors of the Company has approved
a Dividend Distribution Policy on 31 January 2017 in accordance with the Securities and Exchange Board of India (Listing Obligations & Disclosure Requirements) Regulations, 2015. The Policy is available on the Company’s website: www.jsw.in/investors/investor-relations-steel.
In terms of the Policy, Equity Shareholders of the Company may expect Dividend, if the Company is having surplus funds and after taking into consideration

133
Better Everyday. In Pursuit of Excellence. Corporate Overview Statutory Reports Financial Statements
relevant internal and external factors enumerated in the policy for declaration of dividend. The policy also enumerates that efforts will be made to maintain a dividend payout (including dividend distribution tax and dividend on preference shares, if any) in the range of 15% to 20% of the consolidated net profits of the Company after tax, in any financial year, subject to compliance of covenants stipulated by Lenders/Bond holders.
In line with the said policy, the Board has, subject to the approval of the Members at the ensuing Annual General Meeting, recommended:
- Dividend at the stipulated rate of 10% per share on the 10% Cumulative Redeemable Preference Shares of ` 10 each of the Company, i.e. (i) ` 1 (rupee one only) per share of ` 10 each (prior to its part redemption on 15.12.2017), (ii) ` 0.75 (paise seventy five only) per share of ` 7.50 each (face value post redemption on 15.12.2017) and (iii) ` 0.50 (paise fifty only) per share on the 10% Cumulative Redeemable Preference Shares of ` 5 each (face value post redemption on 15.03.2018), for the year ended 31 March 2018. The aggregate amount of Dividend per share works out to ` 0.91506849.
– Cumulative dividend starting from October 1, 2002 at the stipulated rate of 0.01% per share on the 0.01% Cumulative Redeemable Preference Shares of ` 10 each. The aggregate amount of Dividend per share works out to ` 0.015496.
– Dividend of ` 3.20/- (Rupees Three & Paise Twenty only) (320%) per fully paid-up Equity Share of ` 1 each of the Company, for the year ended 31 March 2018.
Together with Corporate Tax on dividend, the total outflow, on account of equity dividend, will be ` 932.5 crores, vis-à-vis ` 654.6 crores paid for FY 2016-17.
4. PROSPECTS A report on the Management Discussion and Analysis
covering prospects is provided as a separate Section in the Annual Report.
5. INTEGRATED REPORT The Securities and Exchange Board of India (SEBI),
in its circular dated 6 February 2017, has advised the top 500 listed companies (by market capitalisation) to voluntarily adopt Integrated Reporting (IR) from the financial year 2017-18.
Your Company believes in sustainable value creation while balancing utilisation of natural resources and social development in its business decisions. In continuation with this commitment we are delighted to present the first Integrated Report (IR) for the period ended 31 March 2018. The IR framework of the Company has been developed on the Guiding Principles and Content Elements as defined by the International Integrated Reporting Council (IIRC).
IR is a concept that better articulates the broader range of measures that contribute to an organisation’s long-term value creation. Central to this concept is the proposition that value is increasingly shaped by factors additional to financial performance, such as reliance on the environment, social reputation, human capital, innovation and others. This value creation concept is the backbone of IR and is the direction for future of corporate reporting. In addition to the financial capital, IR examines five additional capitals that should guide an organisation’s decision-making and long-term value creation. IR starts from the position that any value created as a result of a sustainable strategy will translate into performance, thereby impacting market value.
This IR articulates the Company’s unique approach to long-term value creation which is a paradigm shift from the traditional compliance based reporting to governance based value creation model.
6. PROJECTS AND EXPANSION PLANS FY 2017-18 marked a turning point for the domestic steel
demand growth for the country, as elasticity of steel demand growth to GDP growth went back to >1x after more than 5 years. With rising spends in infrastructure projects, the medium term demand growth outlook is quite constructive. At the same time, with a 91% utilisation in FY 2017-18, there is an opportunity to expand capacity to participate in the strong India growth story.
With a strategic objective of augmenting the incremental capacity creation at a low specific investment cost so that they remain returns accretive, the Board of Directors of the Company has approved certain key new projects in addition to the existing capex pipeline to achieve the following:
– expand overall steelmaking capacity from 18 MTPA to 24.7 MTPA by March 2020.
– enrich the product mix with 3.2 MTPA additional downstream capacity.
– backward integration projects to achieve cost reduction.

134
JSW Steel Limited | Integrated Report 2017-18
The major new projects so approved are:
(a) Upstream Projects – Augmenting crude steel capacity at Vijayanagar & Dolvi
i) The Company, in the last year, had announced a plan to revamp and up-grade capacity of Blast Furnace-3 at Vijayanagar, post which the higher cost BF-2 would have been ramped down keeping overall capacity at Vijayanagar at 12 MTPA. Considering the prospects of strong steel demand outlook, the Company now plans to modify and enhance the capacities of Steel Making Shop and capacities of flat and long products mills with allied facilities to utilise the additional hot metal at an estimated cost of ` 2,300 crores.
ii) The expansion project at Dolvi to 10 MTPA is currently under implementation. In order to effectively utilise the steel making and casting capacity, the Company has decided to increase DRI capacity at its subsidiary JSW Steel Salav Limited to 1.6 MTPA (from existing 0.9 MTPA) along with augmentation and modification of Steel Melting Shop at Dolvi for hot charging of DRI. This project is expected to be commissioned by March 2020 at an estimated cost of ` 1,375 crores. With this, the crude steel capacity at Dolvi would increase to 10.7 MTPA.
Post completion of both these projects, the Company’s overall crude steel making capacity will increase from 18 MTPA to 24.7 MTPA by March 2020.
(b) Enriching Product Mix The Company remains strategically focused on
enriching its product mix by increasing the volume and share of value added and special products in its portfolio. Considering the growth potential in these value added segments, the Company has decided to set up the following downstream facilities:
i) Setting up 0.3 MTPA colour coated line at CRM1 complex at Vijayanagar
ii) Modernisation and Capacity Enhancement at Vasind & Tarapur by 1.5 MTPA by setting up PLTCM instead of earlier planned 0.96 MTPA BCTM
iii) Installation of an additional Tin Plate line with capacity of 0.25 MTPA at Tarapur
iv) Capacity enhancement of Pre-Painted Galvalume Line (PPGL) at Kalmeshwar by 0.22 MTPA
These projects, in phases, are likely to be commissioned between September 2019 and
March 2020. The overall project cost for the above new projects is expected to be ` 1,470 crores.
(c) Cost reduction projects and manufacturing integration
i) Setting up of 8 MTPA pellet plant and 1.5 MTPA
coke oven plant at Vijayanagar:
The Company has decided to set up an 8 MTPA pellet plant at Vijayanagar to strategically reduce the dependency on more expensive lump iron ore. The Company has also decided to set up a 1.5 MTPA coke oven plant at Vijayanagar to bridge the current and expected gaps in coke availability. Both these projects are expected to provide significant cost savings and are likely to be commissioned by August 2019 and March 2020 respectively, at an estimated cost of ` 5,200 crores.
ii) Phase-2 Coke Oven plant of 1.5 MTPA under Dolvi
Coke Projects Limited (DCPL):
The Company through DCPL would set up a second phase of 1.5 MTPA coke oven plant along with CDQ facilities to cater to the additional coke requirement for the crude steel capacity expansion to 10.7 MTPA at Dolvi. This project is expected to be commissioned by June 2020 at an estimated cost of ` 2,050 crores.
iii) Setting up 175 MW and 60 MW power plants at
Dolvi:
The Company will set up power plants of 175 MW and 60 MW to effectively utilise flue gases and steam generated from CDQ, which will lead to savings in power costs. These power plants are expected to be commissioned in March 2020 at an estimated cost of ` 975 crores.
The overall estimated capex plan of ` 26,815 crores as approved by the Board of the Company at the start of FY 2018 is expected to be enhanced by ~` 17,600 crores to implement the above new projects. Overall, the Company is now implementing a cumulative capex pipeline of ` 44,415 crores over a four-year period between FY 2018 to FY 2021. With spend of about ` 4,700 crores in FY 2018, the Company plans to spend the balance ` 39,715 crores over the next 3 years. These projects are planned to be funded by a mix of debt and internal accruals in such a manner as to keep the overall leverage ratios within the targeted threshold levels of 3.75x Net Debt/ EBITDA and 1.75x Net Debt/ Equity.

135
Better Everyday. In Pursuit of Excellence. Corporate Overview Statutory Reports Financial Statements
VIJAYANAGAR I. Projects commissioned during FY 2017-18
The following projects were commissioned at the steel melting shop to enhance capacities and improve operational efficiencies:
A pouring station of capacity 10,000 TPD at SMS-1 to enhance melting shop productivity and casting capacity.
Movable KR station at SMS-1 for pre-treatment (desulphurisation) of hot metal as required for producing special steel grades and silicon steel.
HR Slitter line of 0.75 MTPA capacity at HSM-2 to cater to customer’s requirement of HR black, HRPO, HRSPO and BH grade steel in narrow width.
Installation of the sixth strand at SMS-3 to reduce the long casting time due to submerged casting speed and to match the Electric Arc Furnace (EAF) productivity enhancement in future.
New De-dusting systems at various areas of shops to control the level of emissions.
II. Projects under implementation
BF-3 at Vijayanagar works is to be revamped and upgraded from 3 MTPA to 4.5 MTPA, along with the associated auxiliary units.
Capacity expansion of the CRM-1 complex at Vijayanagar from 0.85 MTPA to 1.8 MTPA.
A pipe conveyor system is being set up with a capacity of 20 MTPA. This solution will be environment friendly and reduce transportation costs of iron ore to the plant.
A new water reservoir to ensure adequate supply of water for uninterrupted operations of the plant.
Coke drying unit for Blast Furnace-1 to utilise the waste heat of Sinter Plant-1 to reduce moisture in coke.
Maximised Emission Reduction of Sintering (MEROS) and Selective Waste Gas Recovery (SWGR) at sinter plants and installation of Bag filter with the provision for DeSOX after process ESP to meet emission norms.
Replacement of defective Primary Gas Coolers (PGCs) in Coke Oven-4 to improve operational efficiencies.
New Cut to Length (CTL) line is planned to be commissioned to cater to the demand of high-strength steel.
Efficiency, productivity improvement and cost-
reduction initiatives a) Edge and BAR heater at HSM-2 to enhance the
quality of Auto grade steels.
b) Tailing Beneficiation Project, envisaged to facilitate recovery of useful iron ore from medium-grade tailing rejects.
c) Waste heat recovery boiler for reheating furnace for HSM-1 and 2 to recover the heat from flue gases.
d) Debottlenecking of Beneficiation Plant-2 to handle feed rate of 50,000 TPD of low-grade iron ore.
DOLVI I. Projects commissioned during FY 2017-18 Installation of 500 TPD Vapour Pressure Swing
Adsorption (VPSA) for increasing oxygen enrichment and ramp up hot metal production at blast furnace.
Addition of the sixth strand billet caster to the existing machines to enhance the productivity with 130 X 130 Sections.
Waste heat recovery system installed at Sinter Plant-2 by utilising the waste heat from the sinter cooler.
II. Projects under implementation The steelmaking capacity at Dolvi Works will be
increased from existing 5 MTPA to 10 MTPA. The major facilities included in the project are 4.5 MTPA blast furnace, 5 MTPA steel melt shop and 5 MTPA hot strip mill.
SALEM I. Projects commissioned during FY 2017-18 Caster III Project with 3 Strands to handle
casting Sections of 220 x 220 mm, 250 x 250 mm and 280 x 370 mm
Sliding Stand at BRM to handle higher Sections
Coil Annealing with capacity of 48000 TPA for value added end products
Second Billet grinding machine to improve quality of billets for Cold head quality and free cutting steels.
II. Projects under implementation Pre & Post Pickling Treatment with capacity of
84000 TPA for BRM products
Bar Annealing of capacity 18000 TPA for further value addition
CPP 3 of 30 MW is to cater to the power requirements is under erection
Stove upgradation in BF 1 to improve Hot Blast temperature
Third Billet grinding machine

136
JSW Steel Limited | Integrated Report 2017-18
7. SUBSIDIARY, JOINT VENTURE (JV) AND ASSOCIATE COMPANIES
The Company had 46 direct and indirect subsidiaries and 9 JVs as on 31 March 2018. There has been no material change in the nature of the business of the subsidiaries.
During the year under review, the following 4 companies were formed as the subsidiaries of the Company:
1. JSW Utkal Steel Limited 2. Creixent Special Steels Limited 3. Hasaud Steel Limited 4. Milloret Steel Limited
As per the provisions of Section 129(3) of the Act, a statement containing the salient features of the financial statements of the Company’s subsidiaries (which include associate companies and JVs) in Form AOC-1 is attached to the financial statements of the Company.
As per the provisions of Section 136 of the Act, the standalone financial statements of the Company and consolidated financial statements along with relevant documents and separate audited accounts in respect of subsidiaries are available on the website of the Company. The Company would provide the annual accounts of the subsidiaries and the related detailed information to the shareholders of the Company on specific request made to it in this regard by the shareholders.
The details of major subsidiaries, JVs and associate companies are given below:
A. INDIAN SUBSIDIARIES 1. JSW STEEL COATED PRODUCTS LIMITED (JSW STEEL
COATED)
JSW Steel Coated Products Limited is the Company’s wholly-owned subsidiary. It has three manufacturing facilities in the State of Maharashtra at Vasind, Tarapur and Kalmeshwar. It is engaged in the manufacture of value-added flat steel products comprising of Galvanised and Galvalume Coils/Sheets and Colour-Coated Coils/Sheets. This Company caters to both domestic and international markets. JSW Steel Coated reported a production (Galvanising/Galvalume products) of 1.70 million tonnes, a decrease by 1% y-o-y. The sales volume grew by 20% y-o-y to 2.06 million tonnes during FY 2017-18, including traded goods.
The revenue from operations for the year under review was ` 12,553 crores. The operating EBITDA during FY 2017-18 was FY ` 638 crores as
compared to the EBITDA of ` 630 crores in FY 2016-17. The operating EBIDTA margin during FY 2017-18 was 5% as compared to 7% in FY 2016-17. The net profit after tax stood at ` 275 crores, compared to net profit after tax of ` 277 crores in FY 2016-17.
KEY NEW PROJECTS Tin Plate Mill: JSW Steel Coated Products Limited is setting
up a Tin Plate Mill and related facilities at its Tarapur Work to cater to the increasing demand for the tin plate. The estimated project cost is ` 650 crores and is expected to be commissioned in FY 2018-19.
Considering the potential growth in demand, it is decided to set up another Tin Plate Mill with capacity of 0.25 MTPA at an estimated cost of ` 419 crores.
Modernisation and Capacity Enhancement at Vasind & Tarapur by 1.5 MTPA by setting up PLTCM:
Additions/modifications will be carried out at Vasind and Tarapur for net capacity enhancement of cold rolling by 1 MTPA and other down stream facilities. The project cost is estimated at ` 1,729 crores and is expected to be commissioned in FY 2019-20.
2. AMBA RIVER COKE LIMITED (ARCL)
Amba River Coke Limited (ARCL) is a wholly-owned subsidiary of the Company. ARCL has set up a 1 MTPA coke oven plant and a 4 MTPA pellet plant. ARCL has produced 1.04 million tonnes of coke and 4.19 million tonnes of pellet during the FY 2017-18, registering an increase of 3% and 6%, respectively, as compared to FY 2016-17. The coke and pellets produced are primarily supplied to the Dolvi unit of the Company. The operating EBITDA during the FY 2017-18 was ` 431 crores as compared to the EBITDA of ` 369 crores in FY 2016-17.The profit after tax increased to ` 169 crores in FY 2017-18 as compared to ` 159 crores in FY 2016-17.
3. JSW STEEL (SALAV) LIMITED (JSW SALAV)
JSW Salav is a wholly-owned subsidiary of JSW Steel Ltd. JSW Salav has a DRI plant with a capacity of 0.9 MTPA, along with a captive jetty and railway siding.
During the year 2017-18, the unit has produced 0.67 MnT, an increase of 19% as compared to FY 2016-17. The profit after tax for FY 2017-18 was ` 35 crores.

137
Better Everyday. In Pursuit of Excellence. Corporate Overview Statutory Reports Financial Statements
JSW SALAV has decided to increase DRI capacity at Salav to 1.6 MTPA, from existing 0.9 MTPA.
4. JSW STEEL PROCESSING CENTRES LIMITED
(JSWSPCL)
JSW Steel Processing Centres Limited (JSWSPCL) is the Company’s wholly-owned subsidiary. JSWSPCL was set up as a steel service centre, comprising HR / CR slitter and cut-to-length facility, with an annual slitting capacity of 6.5 lakh tonnes. The Company processed 5.68 lakh tonnes of steel during FY 2017-18, compared to previous year’s 5.41 lakh tonnes. JSWSPCL registered a profit after tax for FY 2017-18 of ` 21 crores.
JSWSPCL’s Board has recommended a dividend of ` 20 per share (at 200%) for every share of ` 10 each to the equity shareholders for FY 2017-18.
5. PEDDAR REALTY PRIVATE LIMITED (PRPL)
Peddar Realty Private Limited (PRPL) is the Company’s wholly-owned subsidiary. Loss after tax for FY 2017-18 was ` 12 crores, compared to profit after tax of ` 3 crores in FY 2016-17.
6. JSW BENGAL STEEL LIMITED (JSW BENGAL), ITS
SUBSIDIARIES JSW NATURAL RESOURCES INDIA
LIMITED, JSW ENERGY (BENGAL) LIMITED (JSWEBL)
AND JSW NATURAL RESOURCES (BENGAL) LIMITED
(JSWNRBL)
As a part of the Company’s overall growth strategy, JSW Bengal Steel’s Salboni project was planned to set up a 10 MTPA capacity steel plant in phases. All enabling work to take up the implementation of the project is in place.
However, due to uncertainties in the availability of key raw materials such as iron ore and coal, post cancellation of allotted coal blocks, the implementation of the project is currently put on hold.
Auditors in their Audit report has put up an emphasis of matter on going concern of the project due to material uncertainties relating to allocation of Coal and iron ore mines to the Company and its consequential impact on the implementation of the project.
In the meantime, efforts are being made to secure long-term linkages of raw materials.
7. JSW JHARKHAND STEEL LIMITED JSW Jharkhand Steel Limited was incorporated
for setting up a 10 million tonnes (in phases) steel plant in Jharkhand. It is pursuing for various approvals and clearances for setting up the project.
8. JSW INDUSTRIAL GASES PRIVATE LIMITED (JIGPL)
(FORMERLY KNOWN AS JSW PRAXAIR OXYGEN
PRIVATE LIMITED)
JSW Industrial Gases Private Limited is a wholly owned subsidiary of the Company.The Company sources oxygen, nitrogen and argon gases from JIGPL for its Vijayanagar plant. The profit after tax was ` 33 crores in FY 2017-18 as compared to profit after tax of ` 21 crores in FY 2016-17.
JIGPL’s Board has recommended a dividend of ` 13.50 per share (at 135%) for every share of ` 10 each to the equity shareholders for the FY 2017-18.
9. DOLVI MINERAL & METALS PRIVATE LIMITED (DMMPL)
AND ITS SUBSIDIARY DOLVI COKE PROJECTS LIMITED
(DCPL)
The Company holds 39.996% stake in Dolvi Minerals & Metals Private Limited (DMMPL) and Dolvi Coke Projects Limited (DCPL) is a wholly-owned subsidiary of DMMPL.
The Company is setting up a 1.5 million tonnes per annum Coke Oven Plant (Phase-1) at Dolvi through DCPL. The total cost for this project will be about ` 2,000 crores and is expected to be commissioned during FY 2018-19.
DCPL has also commenced setting up of Phase II project comprising of a 1.5 MTPA coke oven plant and 2x190 TPH Coke Dry Quenching (CDQ) unit at an estimated cost of ` 2,133 crores during FY 2017-18.
Although the Company owns only 39.996% ownership interest, under Ind AS, the Company has concluded that it has the practical ability to direct the relevant activities of DMMPL and DCPL unilaterally and treated both these Companies as its subsidiaries and accordingly consolidated DMMPL and DCPL in its consolidated financial statements
10. JSW REALTY & INFRASTRUCTURE PRIVATE LIMITED
(JSWRIPL)
JSWRIPL primarily provides housing facilities to the employees of JSW Steel Limited and its

138
JSW Steel Limited | Integrated Report 2017-18
business associates at Vijayanagar plant of JSW Steel. JSW Steel holds 10% preference shares of ` 99.15 crores in JSWRIPL as on 31 March 2018.
Though the Company does not hold any ownership interest in JSWRIPL, the Company has concluded that it has the practical ability to direct the relevant activities of JSWRIPL under Ind AS and treated the same as subsidiary and accordingly consolidated JSWRIPL as part of its consolidated financial statements.
11. JSW Utkal Steel Limited
JSW Steel Limited has formed a wholly-owned subsidiary by the name ‘JSW Utkal Steel Limited’ for setting up of an Integrated Steel Plant (ISP) of 12 MTPA capacity and a 900 MW captive power plant in the state of Odisha in phases.
B. OVERSEAS SUBSIDIARIES 1. JSW STEEL (NETHERLANDS) B.V. (JSW NETHERLANDS)
JSW Steel (Netherlands) B.V. is a holding company for subsidiaries based in the US, the U.K., Chile and Italy. It also has 49% equity holding of Georgia-based Geo Steel LLC, incorporated under the laws of Georgia.
(a) PERIAMA HOLDINGS LLC AND ITS SUBSIDIARIES
VIZ. JSW STEEL (USA) INC. – PLATE AND PIPE
MILL OPERATION AND ITS SUBSIDIARIES –
WEST VIRGINIA, USA-BASED COAL MINING
OPERATION
Plate and pipe mill operation During FY 2017-18, the US plate and pipe
mill’s performance improved as compared to FY 2016-17 with better capacity utilisation. This unit produced 0.25 million net tonnes of plates and 0.05 million net tonnes of pipes with capacity utilisation of 26% and 9%, respectively.
Profit after tax for FY 2017-18 was ` 652 crores compared to loss after tax of ` 364 crores in FY 2016-17.
Coal mining operation Periama Holdings LLC has 100% equity
interest in coal mining concessions in West Virginia, US along with permits for coal mining. Periama also owns a 500 TPH coal-handling and preparation plant.
During the year, the coal-handling and preparation plant was operational and it has processed 0.09 million net tonnes of coal after procuring the same from the neighbouring mines.
Loss after tax of coal mining operations for FY 2017-18 was ` 81 crores, compared to loss after tax of ` 49 crores in FY 2016-17.
The operational performance at the US operations of both the Plate and Pipe mill at Baytown, as well as the US coal operations, have seen a consistent improvement during the course of the year. This has been supported by a strong economic outlook for the US. Consequently, the Company during the year ended 31 March 2018 has recognised a Deferred Tax Asset amount of ` 729 crores on the unused tax losses to the extent of temporary differences. Further during the year, pursuant to the enactment of Tax Cuts and Jobs Act by the USA on December 22, 2017, the corporate income tax rate in USA has been reduced to 21% resulting in a reversal of deferred tax liabilities amounting to ` 572 crores. Accordingly, the Company has recognised a Deferred Tax credit of ` 1,301 crores in the consolidated financial statements.
(b) JSW PANAMA HOLDINGS CORPORATION
(JPHC) AND CHILEAN SUBSIDIARIES, NAMELY
INVERSIONES EUROSH LIMITADA (IEL), SANTA
FE MINING (SFM) AND SANTA FE PUERTO S.A
(SFP)
Santa Fe Mining (SFM) in Chile is developing iron ore deposits in the Atacama region of Chile. The Company holds 70% equity interest in SFM.
SFM has developed the Bella Vista iron ore deposit, located 20 km from Copiapo, Chile. In 2010, SFM installed a 1 MTPA dry beneficiation plant.
These mines have been currently shut down for care and maintenance since May 2015 and the commencement of operations might be further delayed based on prevailing market conditions.
Loss after tax for FY 2017-18 was ` 143 crores, compared to ` 77 crores in FY 2016-17.
During the year, the Group has surrendered one of its iron ore mines in Chile considering its economic viability and accordingly has reassessed the recoverability of carrying amounts of Property, Plant and Equipment, Goodwill and advances pertaining to the said iron
139
Better Everyday. In Pursuit of Excellence. Corporate Overview Statutory Reports Financial Statements
ore mine and recognised an impairment of ` 264 crores, which has been disclosed as an exceptional item in the consolidated financial statements.
(c) JSW STEEL UK LIMITED AND ITS ASSOCIATE
ACCIATALIA S.P.A.
During the previous year, the Company has acquired 35% stake in Accitalia S.P.A. Accitalia S.P.A. which is currently in the process of voluntary liquidation.
The loss after tax was ` 34 crores for FY 2017-18.
2. JSW NATURAL RESOURCES LIMITED (JSWNRL)
AND ITS SUBSIDIARIES JSW NATURAL RESOURCES
MOZAMBIQUE LIMITADA (JSWNRML) AND JSW ADMS
CARVAO LIMITADA
JSW Natural Resources Limited formed a wholly-owned subsidiary – JSW Natural Resources Mozambique Limitada in Mozambique. This initiative was taken to acquire coal assets and engage in prospecting and exploring coal, iron ore and manganese. JSW Natural Resources Mozambique Limitada completed the exploration activities in Mutara district of the Tete province and is in the process of obtaining the necessary approvals for lease of certain mining assets.
JSW ADMS Carvão Limitada, a subsidiary of JSW Natural Resources Mozambique Limitada, has a coal mining licence in Zumbo district of the Tete province. The Company has completed exploration activities and it has received an award for mining concession during the year. Now, the Company is in the process of making various applications for obtaining the necessary approvals for mining operations.
3. NIPPON ISPAT SINGAPORE (PTE) LIMITED, EREBUS
LIMITED, ARIMA HOLDINGS LIMITED AND LAKELAND
SECURITIES LIMITED There were no significant operations during
the financial year.
4. JSW STEEL ITALY S.R.L.
JSW Steel Italy S.R.L. is a wholly-owned subsidiary through JSW Steel Netherlands B.V. The Company was formed mainly for trading in steel and steel-related products primarily to cater the European market.
The loss after tax was for FY 2017-18 was ` 9 crores as compared to ` 0.28 crores for FY 2016-17.
C. JOINT VENTURE COMPANIES 1. GEO STEEL LLC
Georgia-based JV, Geo Steel LLC, in which the Company holds 49% equity through JSW Steel (Netherlands) B.V., has set up a steel rolling mill in Georgia, with 175,000 tonnes production capacity. Geo Steel produced 1.58 lakh tonnes of rebars and 1.54 lakh tonnes of billets during FY 2017-18. Profit after tax for FY 2017-18 was ` 76 crores, compared to ` 41 crores in FY 2016-17.
2. ROHNE COAL COMPANY PRIVATE LIMITED
Rohne Coal Company Pvt. Ltd. is a JV for developing Rohne coal block. While Rohne coal block was under development, the Hon’ble Supreme Court of India cancelled the allocation of coal blocks by the Government of India to the state and private sectors during FY 2014-15. Consequently, the allocation of Rohne coal block to Rohne Coal Company Private Limited stood cancelled.
3. MJSJ COAL LIMITED (MJSJ)
The Company, along with other partners, agreed to participate in the 11% equity of MJSJ Coal Limited, Odisha. This was in accordance with the JV agreement to develop Utkal-A and Gopal Prasad (West) thermal coal block in Odisha.
The Hon’ble Supreme Court of India cancelled the allocation of coal blocks by the Government of India to the state and private sectors during FY 2014-15. Consequently, the allocation of coal block to MJSJ stood cancelled.
The Ministry of Coal, Government of India, has not yet commenced the auction of these coal blocks.
4. GOURANGDIH COAL LIMITED
Gourangdih Coal Ltd. (GCL) is a 50:50 JV between JSW Steel Limited and Himachal EMTA Power Corporation Ltd. (HEPL). It was incorporated to develop and mine coal from West Bengal’s Gourangdih, ABC thermal coal block. The Hon’ble Supreme Court of India cancelled the allocation of coal blocks by the Government of India to the state and private sectors during FY 2014-15. Consequently, the allocation of the coal block to GCL stood cancelled. The Gourangdih coal block has been re-allocated to West Bengal Mineral Development and Trading Corporation by the Ministry of Coal vide its notice dated March 16, 2016.

140
JSW Steel Limited | Integrated Report 2017-18
5. VIJAYANAGAR MINERALS PRIVATE LIMITED (VMPL)
According to the Hon’ble Supreme Court’s order to stop all mining operations in the Bellary district in Karnataka, activities from Thimmappanagudi Iron Ore Mines (TIOM), operated by VMPL, were halted since July 2011.
As per the Apex Court direction, the mines are being operated by Mysore Minerals Limited directly.
6. JSW SEVERFIELD STRUCTURES LIMITED AND ITS
SUBSIDIARY JSW STRUCTURAL METAL DECKING
LIMITED
JSW Severfield Structures Limited (JSSL) is operating a facility to design, fabricate and erect structural steel work and ancillaries for construction projects.
These projects have a total capacity of 55,000 TPA at Bellary, Karnataka. JSSL produced 46,385 tonnes during FY 2017-18. Its order book stood at ` 598 crores (53,953 tonnes), as on 31 March 2018. The profit after tax for FY 2017-18 was ` 11 crores, as compared to ` 1 crores in FY 2016-17.
JSW Structural Metal Decking Limited (JSWSMD), a subsidiary company of JSSL, is engaged in the business of designing and roll forming of structural metal decking and accessories such as edge trims and shear studs. The plant’s total capacity is 10,000 TPA. The profit after tax for FY 2017-18 was ` 0.1 crores, compared to ` 2 crores in FY 2016-17.
7. JSW MI STEEL SERVICE CENTRE PRIVATE LIMITED
(MISI JV)
JSW Steel and Marubeni-Itochu Steel signed a JV agreement on September 23, 2011, to set up steel service centres in India.
The JV Company had started the commercial operation of its steel service centre in western India (near Pune), with 0.18 MTPA initial installed capacity in March 2015. MISI JV has also started the project work for its steel service centre in Palval, Haryana, with 0.18 MTPA initial capacity. This facility is expected to be commissioned by end of May 2018. The service centre is equipped to process flat steel products, such as hot-rolled, cold-rolled and coated products. Such products offer just-in-time solutions to automotive, white goods, construction and other value-added segments.
MISI JV earned a profit after tax of ` 12 crores during FY 2017-18.
8. JSW VALLABH TINPLATE PRIVATE LIMITED (JSWVTPL)
JSW Steel holds 50% stake in JSWVTPL, which is into tin plate business and has a capacity of 1.0 lakh tonnes. JSWVTPL produced 0.85 lakh tonnes during FY 2017-18. Net loss after tax for FY 2017-18 was ` 2 crores.
D. COAL BLOCK The Company had entered into three separate JV
agreements for the development of Rohne Coal Block, Gopal Prasad (West) and Utkal (A) Coal Block and Gourangdih Coal Block. While the coal blocks were under development, the Hon’ble Supreme Court of India cancelled the allocation of coal blocks by the Government of India to the states and private sectors. Consequently, the allocation of coal blocks to these three JVs stood cancelled. Subsequently, the Government of India promulgated the Coal Mines (Special Provision) Act, 2015. As per the provisions of the Act, the investment made in the block by the prior allottee, to the extent permitted under the said provisions, will be reimbursed by the successful bidder of the coal block. The Company has made an assessment of recoverable amounts of investments and other assets, impacted by the said order. It has also recognised a provision of ` 32 crores as on 31 March 2018, (` 30 crores as on 31 March 2017) considering the principle of conservatism.
8. ACQUISITION Monnet Ispat & Energy Limited (MIEL)
The Company and Aion Investments Private II Limited (together as a consortium) had submitted a bid for Monnet Ispat & Energy Limited (MIEL) under the corporate insolvency process of the Insolvency and Bankruptcy code 2016. MIEL was referred to the National Company Law Tribunal (NCLT) under the Insolvency and Bankruptcy Code. MIEL has a steel plant in Chhattisgarh, with a steelmaking and rolling capacity of 1.5 MTPA when the facilities are fully commissioned. The Company proposes to hold a minority stake in their venture.
The consortium has been declared as a successful resolution applicant by the Committee of creditors of MIEL on 10 April 2018 and has received a Letter of Intent (LOI). The consortium has accepted the terms of the LOI.
The consortium has also received approval from the Competition Commission of India for the proposed acquisition of MIEL. The closure of the transaction is subject to obtaining necessary regulatory approval including the National Company Law Tribunal, which is in progress.

141
Better Everyday. In Pursuit of Excellence. Corporate Overview Statutory Reports Financial Statements
Acero Holdings Limited and its wholly-owned subsidiary Acero Junction Inc. (ACERO)
On 28 March 2018, the Company entered into a stock purchase agreement with JSM International Limited, Acero Junction Holdings Inc. and Acero Junction Inc. for acquisition of 100% shares of Delaware-based steel manufacturer, Acero Junction Holdings Inc. for a cash consideration of up to US$80.85 million.
The proposed acquisition is subject to the fulfilment of certain conditions precedent and other terms as per the stock purchase agreement with a long stop date of 31 May 2018. The Company expects that this acquisition will allow it to gain increased access to the North American steel market. The total enterprise value of the transaction is about US$ 180.35 million, with equity value of US$ 80.85 million and liabilities of US$ 99.50 million, subject to closing adjustments.
Acero Junction Inc. has a steel-manufacturing facility, which includes an Electric Arc Furnace of 1.5 million tonne per annum, a ladle metallurgy furnace, a slab continuous casting machine and a 3 million tonne per annum hot strip mill.
The Company has also planned an investment programme to complete backward integration project to restart the EAF and Caster, which will need an additional investment of up to US$50 million. On completion of this capital expenditure, estimated in about 6 months from completion of the transaction, there shall be a 1.5 MTPA fully integrated steel making facility, with HSM rolling capacity up to 3 MTPA.
9. TECHNICAL COLLABORATION WITH JFE STEEL CORPORATION, JAPAN (JFE)
The financial year under review was the 8th year of strategic collaboration between the Company and JFE Steel Corporation. During the year the Company has been able to enhance its business share in the Automotive and Electrical Steel segments.
The Strategic Technical collaboration with JFE Steel has added significant value to the Company, both in terms of products and services, thereby enriching the product mix of the Company. The Company has developed a wide range of steel for critical auto end use applications such as outer body panels, bumper beams and other crash resistant components with strength levels up to 980 mPA. The continuous support received from JFE in the form of technical assistance has resulted in expeditious resolution of issues observed during the commercial production/approval of stipulated licensed grades.
Our strategic collaboration agreement with JFE has added significant value to the Company in business processes, products and customers over the years.
The partnership has helped the Company achieve a “PREFERRED STEEL SUPPLIER STATUS” with certain major customers in the auto and electrical steel segments in India. The systems and methods that have been deployed under the guidance from JFE has enabled the Company to re-define customer relationship and has paved the way for a better understanding to meet customer expectations.
The Company by virtue of its partnership has been able to create a formidable position in the market place to take on the challenges of the future.
In addition to the technical assistance, JFE continues to provide key inputs to improve quality parameters at downstream facilities and for manufacture of Electrical steel.
10. RISK MANAGEMENT JSW Steel follows the globally recognised ‘COSO’
framework. The Company’s robust risk management framework identifies and evaluates business risks and opportunities.
The Company recognises that the emerging and identified risks need to be managed and mitigated to:
Protect its shareholders and other stakeholder’s interests
Achieve its business objective
Enable sustainable growth
The risk frame work is aimed at effectively mitigating the Company’s various business and operational risks, through strategic actions. Risk management is embedded in our critical business activities, functions and processes. The risks are reviewed for the change in the nature and extent of the major risks identified since the last assessment. It also provides control measures for risks and future action plans.
Pursuant to the requirement of Regulation 21 of the SEBI (Listing Obligations and Disclosure Requirements) Regulations, 2015 and Clause 49 of the erstwhile Listing Agreement, the Company has constituted a sub-committee of Directors to oversee the Enterprise Risk Management framework to ensure that execution of decided strategies with focus on action and monitoring risks arising out of unintended consequences of decisions or actions related to performance, operations, compliance, incidents, processes and systems and transactions are monitored and managed appropriately.
The Company believes that the overall risk exposure of present and future risks remains within risk capacity.

142
JSW Steel Limited | Integrated Report 2017-18
Key risks and response strategies Competitive dynamics and industrial cyclicality
– managed through widening and deepening customer reach and broadening product range.
Raw material availability and cost– broad–basing vendors from different geographies, exploring various contract options such as long term/ spot/ indexing and relationship management with vendors.
Logistics and infrastructure – a centralised logistics cell to ensure end-to-end integration, optimisation of infrastructure spend and digitisation initiatives such as last mile connectivity tracking.
Technology and operational disruptions – effective management of automation systems, spares management, maintenance scheduling, R & D infrastructure and insurance cover for plant interruptions and loss of profit.
Environment, health and safety – compliance with norms through the right selection of equipment, processes, inputs and tracking emissions; preserving bio-diversity in eco-sensitive area; tracking changing technology and future norms for advance planning and safety training and providing medical facilities and Mediclaim policy cover for employees and their families.
Manpower availability with desired skill-sets – manpower planning in line with growth strategy, on-the-job / online trainings to develop competencies and soft skills and leadership programmes to develop future fit leaders.
Reputation – value-driven leadership; adhering to the highest standards of governance and code of conduct, extending even to business partners.
Finance – proactive tracking of funding and covenants, regular review of hedging strategy, close monitoring of plant operations, cost optimisation, inventory, collections and vendor credit.
Confidentiality, integrity and security of data and systems - security policies and procedures, antivirus / endpoint security deployment, operationalisation of disaster recovery site and implementation of disaster recovery plan and regular training on IT security.
11. INTERNAL CONTROLS, AUDIT AND INTERNAL FINANCIAL CONTROLS
Overview
A robust system of internal control, commensurate with the size and nature of its business, forms an integral part of the Company’s corporate governance policies.
Internal control The Company has a proper and adequate system of internal
control, commensurate with the size and nature of its
business. Internal control systems are integral to JSW Steel’s corporate governance. Some significant features of the internal control systems are:
Adequate documentation of policies, guidelines, authorities and approval procedures covering all the important functions of the Company.
Deployment of an ERP system that covers most of its operations and is supported by a defined on-line authorisation protocol.
Ensuring complete compliance with laws, regulations, standards and internal procedures and systems.
De-risking the Company’s assets/ resources and protecting them from any loss.
Ensuring the integrity of the accounting system and a proper and authorised recording and reporting of all transactions.
Preparation and monitoring of annual budgets for all operating and service functions.
Ensuring a reliability of all financial and operational information.
Audit Committee, a sub-committee of the Board of Directors, comprising of Independent Directors. The Audit Committee regularly reviews audit plans, significant audit findings, adequacy of internal controls, compliance with Accounting Standards, etc.
A comprehensive Information Security Policy and continuous updation of IT systems.
The internal control systems and procedures are designed to assist in the identification and management of risks, the procedure-led verification of all compliances as well as an enhanced control consciousness.
Internal audit JSW Steel has an internal audit function that inculcates
global best standards and practices of international majors into the Indian operations. The Company has a strong internal audit department reporting to the Audit Committee comprising Independent Directors who are experts in their fields. The Company successfully integrated the COSO framework in its audit process to enhance the quality of its financial reporting, compatible with business ethics, effective controls and governance.
The Company extensively practices delegation of authority across its team, which creates effective checks and balances within the system to arrest all possible gaps. The internal audit team has access to all information in the organisation – this is largely facilitated by ERP implementation across the organisation.

143
Better Everyday. In Pursuit of Excellence. Corporate Overview Statutory Reports Financial Statements
Audit plan and execution The Internal Audit function prepares a risk-based audit
plan. The frequency of the audit is decided by risk ratings of areas/functions. The audit plan is carried out by the internal team and reviewed periodically to include areas that have assumed significant importance in line with the emerging industry trend and the aggressive growth of the Company. In addition, the audit committee also places reliance on internal customer feedback and other external events for inclusion into the audit plan.
Internal financial controls As per Section 134(5)(e) of the Companies Act, 2013, the
Directors have an overall responsibility for ensuring that the Company has implemented a robust system and framework of internal financial controls. This provides the Directors with reasonable assurance regarding the adequacy and operating effectiveness of controls with regards to reporting, operational and compliance risks. The Company has devised appropriate systems and framework, including proper delegation of authority, policies and procedures; effective IT systems aligned to business requirements; risk-based internal audits; risk management framework and a whistle blower mechanism.
The Company had already developed and implemented a framework for ensuring internal controls over financial reporting. This framework includes entity-level policies, processes and Standard Operating Procedures (SOP).
The entity-level policies include antifraud policies (such as code of conduct, conflict of interest, confidentiality and whistle blower policy) and other polices (such as organisation structure, insider trading policy, HR policy, IT security policy, treasury policy and business continuity and disaster recovery plan). The Company has also prepared SOP for each of its processes such as procure to pay, order to cash, hire to retire, treasury, fixed assets, inventory, manufacturing operations, etc.
During the year, controls were tested and no reportable material weakness in design and effectiveness was observed.
12. CREDIT RATING During the year, Moody’s Investors Service has upgraded
the Corporate Family Rating and Senior Unsecured Bond Rating due in 2019 and 2022, respectively, to Ba2 from Ba3 while maintaining the outlook at stable.
Also, Fitch Ratings retained the Company’s long-term Issuer Default Rating (IDR) and Senior Unsecured Bond rating due in 2019 and 2022, respectively, to BB, upgrading the outlook to stable from negative.
The domestic credit rating for long-term debt/ facilities/ Non-Convertible Debentures (NCDs) by Credit Analysis and Research Ltd. (CARE) and ICRA were retained at AA-, while the short-term debt/ facilities continues to be rated at the highest level of A1+. CARE has assigned a stable outlook on the long-term rating, while ICRA has upgraded the outlook to stable from negative. India Ratings has assigned a long-term issuer rating and rating for the outstanding NCDs of the Company is AA- while upgrading the outlook to stable from negative.
13. FIXED DEPOSITS The Company has not accepted any fixed deposits
from the public. Therefore, it is not required to furnish information in respect of outstanding deposits under Non-banking, Non-financial Companies (Reserve Bank) Directions, 1966 and Companies (Accounts) Rules, 2014.
14. SHARE CAPITAL The Company’s Authorised Share capital during the
financial year ended 31 March 2018 remained at ` 9015,00,00,000 (Rupees Nine Thousand Fifteen crores only) consisting of ` 6015,00,00,000 (Rupees Six Thousand Fifteen crores only) equity shares of ` 1/- (Rupee One only) each and 300,00,00,000 (Three Hundred crores) preference shares of ` 10/- (Rupees Ten only) each.
The Company’s paid-up equity share capital remained at ` 241,72,20,440 comprising of 241,72,20,440 equity shares of ` 1 each.
During the financial year, the Company partially redeemed its 27,90,34,907, 10% cumulative redeemable preference shares of ` 10 each fully paid-up, in two equal instalments of ` 2.5 per share on 15 December 2017 and 15 March 2018.
Thereby, the aggregate preference share capital as at the financial year ended 31 March 2018 is ` 624,93,20,575 comprising of 27,90,34,907, 10% cumulative redeemable preference shares of ` 5 each paid up and 48,54,14,604, 0.01% cumulative redeemable preference shares of ` 10 each fully paid up.
15. FOREIGN CURRENCY BONDS (FCBS) During FY 2014-15, the Company had allotted
2,500, 4.75% Fixed Rate Senior Unsecured Notes of US$2,00,000 each of the Company due 2019, aggregating to US$500 million, to eligible investors. In April 2017, the Company further allotted 2,500, 5.25% Fixed Rate Senior Unsecured Notes of US$2,00,000 each of the Company due 2022 aggregating to US$500 million, to eligible investors. These Bonds issued by the Company in the International Market are listed on the Singapore Exchange Securities Trading Limited (the “SGX-ST”).

144
JSW Steel Limited | Integrated Report 2017-18
16. CORPORATE GOVERNANCE
The Company constantly endeavours to follow the corporate governance guidelines and best practices sincerely and disclose the same transparently. The Board is conscious of its inherent responsibility to disclose timely and accurate information on the Company’s operations, performance, material corporate events as well as on the leadership and governance matters relating to the Company.
Your Company has complied with the requirements of Securities and Exchange Board of India (Listing Obligation and Disclosure Requirements) Regulations, 2015 regarding corporate governance. A report on the Corporate Governance practices and the Auditors’ Certificate on compliance of mandatory requirements thereof are given as an annexure to this report.
17. MANAGEMENT DISCUSSION & ANALYSIS A detailed report on the Management Discussion & Analysis
is provided as a separate Section in the Annual Report.
18. BUSINESS RESPONSIBILITY/ SUSTAINABILITY REPORTING JSW Steel Ltd. is committed to pursuing its business
objectives ethically, transparently and with accountability to all its stakeholders. The Company believes in demonstrating responsible behaviour while adding value to the society and the community, as well as ensuring environmental well-being with a long-term perspective.
The Business Responsibility Report (BRR) of the Company was being presented to the stakeholders as per the requirements of Regulation 34 of the Securities and Exchange Board of India (Listing Obligations and Disclosure Requirements) Regulations 2015 describing the environmental, social and governance initiatives taken by the Company. Further SEBI vide its circular dated 6 February 2017, has advised the top 500 listed companies (by market capitalisation) to voluntarily adopt Integrated Reporting (IR) from FY 2017-18.
As stated earlier in the report, the current financial year marks an important milestone in its corporate reporting journey as the Company is transitioning towards Integrated Reporting, focussing on the six ‘capitals’ in its imparatives of value creation. The Company’s maiden Integrated Report discloses performance as per the IR framework for the period 1 April 2017 to 31 March 2018.
The Company was recognised in 2018 as the ‘Industry Mover’ in the Dow Jones Sustainability Indices under their Corporate Sustainability Assessment for achieving the largest improvement in sustainability performance compared to the previous year. The Company also features in the Vigeo Eiris Emerging 70 group.
In FY 2017-18, among several other initiatives, the Company has put in significant efforts to ensure a positive impact on its surrounding flora and fauna that are part of the local ecosystems. The Company was among the pioneers to sign up and commit to the Indian Business and Biodiversity Initiative (IBBI), a pioneering effort by the Confederation of Indian Industry (CII) in partnership with India’s Ministry of Environment, Forest & Climate Change. This has helped to learn from peers about their efforts to manage biological diversity at their sites and to demonstrate to stakeholders the Company’s commitment and efforts towards a sustainable future.
The Company has also provided the requisite mapping of principles of the National Voluntary Guidelines to fulfill the requirements of the Business Responsibility Report as per the directive of SEBI, as well as between the Integrated Report and the Global Reporting Initiative (‘GRI’). The Report, along with all the related policies, can be viewed on the Company’s website (http://www.jsw.in/investors/investor-relations-steel).
19. DIRECTORS AND KEY MANAGERIAL PERSONNEL In accordance with the provisions of Section 152 of
the Companies Act, 2013 and in terms of the Articles of Association of the Company, Mr. Seshagiri Rao M.V.S. (DIN 00029136) retires by rotation at the forthcoming Annual General Meeting and, being eligible, offers himself for re-appointment.
Dr. (Mrs.) Punita Kumar Sinha (DIN 05229262) who was appointed as a Director of the Company in the category of Independent Director, holds office up to the conclusion of the ensuing Annual General Meeting of the Company (“first term” in terms of Sections 149(10) of the Companies Act, 2013). Your Company has received a notice under Section 160 of the Companies Act, 2013 from a shareholder of your Company proposing the re-appointment of Dr. (Mrs.) Punita Kumar Sinha for the Office of Director of your Company in the category of Independent Director for a second term of upto 23 July 2023 or upto the conclusion of the 29th Annual General Meeting (AGM) of the Company in the calendar year 2023, whichever is earlier. A brief profile of Dr. (Mrs.) Punita Kumar Sinha is given in the notice convening the 24th AGM, for the reference of the shareholders. The Board taking into account the recommendation of the Nomination and Remuneration Committee and on the basis of the report of performance evaluation of Independent Directors, has recommended the re-appointment of Dr. (Mrs.) Punita Kumar Sinha as a Director of the Company in the category of Independent Director, for the aforesaid term.
The proposals regarding the re-appointment of the aforesaid Directors are placed for your approval.

145
Better Everyday. In Pursuit of Excellence. Corporate Overview Statutory Reports Financial Statements
Mr. Vijay Kelkar and Mr. Kannan Vijayraghavan who were appointed as Independent Directors in the Company’s 20th Annual General Meeting held on 31 July 2014 would complete their term upon the conclusion of the ensuing 24th Annual General Meeting of the Company and having been on the Board for a tenure of 10 years and not being eligible for re-appointment in terms of the Company’s policy for appointment/re-appointment of Independent Directors, have not offered themselves for re-appointment.
Other changes in the Board of Directors of your Company, during the year under review, are as follows:
Karnataka State Industrial Infrastructure and Development Corporation Limited (KSIIDC) had nominated Mrs. P. Hemlatha, IAS (DIN 06537451) as its nominee on your Company’s Board in place of Mr. Naveen Raj Singh, IAS, (DIN 06854287) with effect from 20 April 2017. However, it withdrew the nomination of Mrs. P. Hemlatha, IAS and nominated, Mr. N. Jayaram, IAS (DIN 03302626) as its nominee on your Company’s Board with effect from 31 October 2017.
Your Directors place on record their deep appreciation of the valuable services rendered by Mr. Vijay Kelkar, Mr. Kannan Vijayaraghavan, Mr. Naveen Raj Singh, IAS and Mrs. P. Hemlatha, IAS during thier tenure as Directors of the Company.
There were no changes in the Key Managerial Personnel of the Company during the year under review.
POLICY ON DIRECTORS’ APPOINTMENT AND REMUNERATION Matching the needs of the Company and enhancing
the competencies of the Board are the basis for the Nomination and Remuneration Committee to select a candidate for appointment to the Board.
The current policy is to have a balanced mix of executive and non-executive Independent Directors to maintain the independence of the Board and separate its functions of governance and management. As at 31.03.2018, the Board of Directors comprises 12 Directors, of which eight are non-executive, including one woman director. The number of Independent Directors is six, which is one half of the total number of Directors.
The policy of the Company on directors’ appointment, including criteria for determining qualifications, positive attributes, independence of a director and other matters, as required under sub-section (3) of Section 178 of the Companies Act, 2013, is governed by the Nomination Policy read with the Company’s policy on appointment/re- appointment of Independent Directors. The remuneration paid to the directors is in accordance with the remuneration policy of the Company.
20. DECLARATION BY INDEPENDENT DIRECTORS
The Company has received necessary declaration from each of the independent directors, under Section 149(7) of the Companies Act, 2013, that he/she meets the criteria of independence laid down in Section 149(6) of the Companies Act, 2013 and Regulation 25 of Securities and Exchange Board of India (Listing Obligations and Disclosure Requirements) Regulations, 2015.
21. BOARD EVALUATION The Board carried out an annual performance
evaluation of its own performance, the performance of the Independent Directors individually as well as the evaluation of the working of the Committees of the Board. The performance evaluation of all the Directors was carried out by the Nomination and Remuneration Committee. The performance evaluation of the Chairman and the Non-Independent Directors was carried out by the Independent Directors. Details of the same are given in the Report on Corporate Governance annexed hereto.
22. AUDITORS AND AUDITOR’S REPORT STATUTORY AUDITORS
At the Company’s 23rd AGM held on 29 June 2017, M/s S R B C & CO LLP (324982E/E300003), Chartered Accountants, has been appointed as the Statutory Auditor of the Company for a term of 5 years (subject to ratification by members at every AGM if required under the prevailing law at that time), to hold office from the conclusion of the 23rd Annual General Meeting until the conclusion of the 28th Annual General Meeting of the Company.
Vide Section 40 of the Companies (Amendment) Act, 2017 notified by the Ministry of Corporate Affairs on 7 May 2018, the requirement for ratification of the appointment of Statutory Auditors by the members at every Annual General Meeting has been done away with. Accordingly, no resolution has been proposed for ratification of the Statutory Auditors, who were appointed in the 23rd Annual General Meeting held on 29 June 2017.
The Notes on financial statements referred to in the Auditors’ Report are self-explanatory and do not call for any further comments. The Auditors’ Report does not contain any qualification, reservation, adverse remark, or disclaimer.
No fraud has been reported by the Auditors under Section 143(12) of the Companies Act, 2013 requiring disclosure in the Board’s Report.
COST AUDITORS Pursuant to Section 148(2) of the Companies Act, 2013
read with the Companies (Cost Records and Audit) Amendment Rules, 2014, your Company is required to get its cost accounting records audited by a Cost Auditor.

146
JSW Steel Limited | Integrated Report 2017-18
Accordingly, the Board, at its meeting held on 16 May 2018, has on the recommendation of the Audit Committee, re-appointed M/s. Shome & Banerjee, Cost Accountants to conduct the audit of the cost accounting records of the Company for FY 2018-19 on a remuneration of `15 lakhs plus taxes as applicable and reimbursement of actual travel and out-of-pocket expenses. The remuneration is subject to the ratification of the Members in terms of Section 148 read with Rule 14 of the Companies (Audit and Auditors) Rules, 2014 and is accordingly placed for your ratification. The due date for filing the Cost Audit Report of the Company for the Financial Year ended 31 March 2017 was 30 September 2017 and the Cost Audit Report was filed in XBRL mode on 30 August 2017.
SECRETARIAL AUDITOR Pursuant to the provisions of Section 204 of the
Companies Act, 2013 and The Companies (Appointment and Remuneration of Managerial Personnel) Rules, 2014, the Company had appointed M/s. S. Srinivasan & Co., a firm of Company Secretaries in Practice, to undertake the Secretarial Audit of the Company. The Report of the Secretarial Audit carried out is annexed herewith as Annexure ‘C’. The Report does not contain any observation or qualification requiring explanation or comments from the Board under Section 134(3) of the Companies Act, 2013. During the period under review, the Company has complied with the applicable Secretarial Standards notified by the Institute of Company Secretaries of India.
The Board, at its meeting held on May 16, 2018, has re-appointed M/s. Srinivasan & Co., Practicing Company Secretaries, as Secretarial Auditor, for conducting Secretarial Audit of the Company for FY 2018-19.
23. RELATED PARTY TRANSACTIONS All Related Party Transactions (RPT) that were entered
into during the financial year were on an arm’s length basis and in the ordinary course of business.
The Company has obtained approval of the shareholders by way of a postal ballot on 17 December 2016 for RPT with JSW International Tradecorp Pte Limited (JITPL) for an aggregate value of US$7,480 million over a period of 36 months starting from 1 April 2016 for procuring iron ore, coking coal, coke and other raw materials being considered material in terms of the Securities and Exchange Board of India (Listing Obligations and Disclosure Requirements) Regulations 2015. Total value of raw material purchased from JITPL during FY 2017-18 was ` 16,369 crores.
The policy on dealing with RPT as approved by the Board is uploaded on the Company’s website (http://www.jsw.in/investors/steel/related-party-policy). The Policy intends
to ensure that proper reporting, approval and disclosure processes are in place for all transactions between the Company and Related Parties. This Policy specifically deals with the review and approval of RPT, keeping in mind the potential or actual conflicts of interest that may arise because of entering into these transactions. All RPT are placed before the Audit Committee for review and approval. Prior omnibus approval is obtained for RPT that are of repetitive nature and / or entered in the ordinary course of business and are at arm’s length. All RPT are subjected to independent review by a reputed accounting firm to establish compliance with the requirements of RPT under the Companies Act, 2013 and Regulation 23 of the Securities and Exchange Board of India (Listing Obligation and Disclosure Requirements) Regulations, 2015.
The disclosure of material RPT is required to be made under Section 134(3) (h) read with Section 188(2) of the Companies Act, 2013 in Form AOC 2. Accordingly, RPTs that individually or taken together with previous transactions during a financial year, that exceed 10% of the annual consolidated turnover as per the last audited financial statements, which were entered into during the year by your Company, are given in Annexure E to this Report.
Your Directors draw your attention to Note No. 8 to the Abridged Standalone financial statements and Note No. 44 to the Standalone financial statements, which set out related party disclosures.
24. EMPLOYEE STOCK OPTION PLAN (ESOP): The Board of Directors of the Company, at its meeting
held on 29 January 2016, formulated the JSWSL Employees Stock Ownership Plan – 2016 (ESOP Plan), to be implemented through the JSW Steel Employees Welfare Trust (Trust), with an objective of enabling the Company to attract and retain talented human resources by offering them the opportunity to acquire a continuing equity interest in the Company, which will reflect their efforts in building the growth and the profitability of the Company. The ESOP Plan involves acquisition of shares from the secondary market.
A total of 2,86,87,000 (Two Crores Eighty Six Lakhs Eighty Seven Thousand) options would be available for grant to the eligible employees of the Company and its director(s), excluding independent directors, and a total of 31,63,000 (Thirty One Lakh Sixty Three Thousand) options would be available for grant to the eligible employees of the Indian Subsidiaries of the Company and their director(s), excluding independent directors, under the ESOP Plan.
74,36,850 options have been granted under this plan by the JSWSL ESOP Committee in its meeting held on 17 May 2016 under the first grant to the eligible employees of the Company and its Indian Subsidiaries, including the Whole-time Directors of the Company. The grant of

147
Better Everyday. In Pursuit of Excellence. Corporate Overview Statutory Reports Financial Statements
ESOPs to the Whole-time Directors of the Company has been approved by the Nomination and Remuneration Committee and the Board. Mr. Seshagiri Rao M.V.S., Dr. Vinod Nowal and Mr. Jayant Acharya, Whole-time Directors of the Company, have been granted 1,92,680, 1,79,830 and 1,79,830 options, respectively, towards the first grant under the ESOP Plan.
51,18,977 options have been granted under this plan by the JSWSL ESOP Committee in its meeting held on May 16, 2017 under the second grant to the eligible employees of the Company and its Indian Subsidiaries, including the Whole-time Directors of the Company. The Grant of ESOPs to the Whole-time Directors of the Company has been approved by the Nomination and Remuneration Committee and the Board. Mr. Seshagiri Rao M.V.S, Dr. Vinod Nowal and Mr. Jayant Acharya, Whole-time Directors of the Company, have been granted 1,27,968, 1,27,968 and 1,19,436 options, respectively, towards the second grant under the ESOP Plan.
33,88,444 options have been granted under this plan by the JSWSL ESOP Committee in its meeting held on 15 May 2018 under the third and final grant to the eligible employees of the Company and its Indian Subsidiaries, including the Whole-time Directors of the Company. The Grant of ESOPs to the Whole-time Directors of the Company has been approved by the Nomination and Remuneration Committee and the Board. Mr. Seshagiri Rao M.V.S, Dr. Vinod Nowal and Mr. Jayant Acharya, Whole-time Directors of the Company, have been granted 87,841, 87,841 and 81,985 options, respectively, towards the third grant under the ESOP Plan.
As per the ESOP Plan, 50% of these options will vest at the end of the third year and the balance 50% at the end of the fourth year.
In terms of clause 4.2 of the “JSWSL Employees Stock Ownership Plan – 2012” (“ESOP-2012 Plan”) that came into force on the July 26, 2012, the ESOP-2012 Plan was terminated on the Closing Date of September 30, 2017 and any Stock Options that remained unexercised after the Closing Date, has automatically lapsed.
The applicable disclosures relating to the earlier ESOP–2012 Plan as well as the current ESOP plan of 2016, as stipulated under the ESOP Regulations, pertaining to the year ended 31 March 2018, is hosted on the Company’s website at http://www.jsw.in/investors/investor-relations-steel and forms a part of this Report.
Voting rights on the shares, if any, as may be issued to employees under the aforesaid ESOP Plans are to be exercised by them directly or through their appointed proxy; hence, the disclosure stipulated under Section 67(3) of the Companies Act, 2013 is not applicable.
There is no material change in the aforesaid ESOP Plans and the same are in compliance with the ESOP Regulations.
The Certificate from the Statutory Auditors of the Company certifying that the Company’s Stock Option Plans are being implemented in accordance with the ESOP Regulations and the resolution passed by the Members, would be placed at the AGM for inspection by Members.
25. CORPORATE SOCIAL RESPONSIBILITY INITIATIVES
The Company firmly believes that in order to be a responsible corporate citisen in its true sense, its role is much more than producing steel. As such, the Company aims to continuously foster inclusive growth and a value-based empowered society. For this, the Company engages through the JSW Foundation to carry out a consultative needs assessment, ascertain joint action with a range of stakeholders and bring in strategic partnerships.
The Company continues to strengthen its relationships with the communities in the Direct Influence Zone (DIZ) of its plant locations and beyond, through a meaningful and purposeful engagement, implementation of a range of programmes covering all important aspects of their lives from education, health and sanitation to skill development, livelihoods, environment and water management and augmenting arts and cultural heritage.
The Company is committed to not only continue to allocate resources towards special corpus for Corporate Social Responsibility (CSR) as per the categories of the Companies Act, 2013 but also to:
Assess the programmes and their impact through external agencies for culling out learnings and also continually evolve its own monitoring processes
Continue its stakeholder engagement in a mutually respectful manner and through social processes that help identify essential needs of the community for its overall growth
Spread the culture of volunteerism through the process of social engagement
Align its actions to achieve not only the desired results at the grassroots level but to also contribute towards the attainment of Sustainable Development Goals (SDGs)
STRATEGY The JSW Foundation administers the planning and
implementation of all the CSR interventions. It is guided by the CSR Committee appointed by the Board, which reviews the progress from time to time and provides guidance as necessary.

148
JSW Steel Limited | Integrated Report 2017-18
Taking a note of the importance of synergy and interdependence at various levels, the CSR programmes are carried out directly as well as through strategic partnerships and in close coordination with the concerned State Governments.
While priority is given to the villages in the immediate vicinity of the plant locations defined as DIZ, in order to get maximum effectiveness, at times, activities are also taken up in related villages too. This context is defined as Indirect Influence Zone (IIZ).
Convergence with Government schemes and programmes and regular dialogue with the functionaries is the cornerstone of the CSR activities of the Company.
The programmes are collated under various themes for bringing in best practices and the thematic heads at the head office of the Foundation regularly and closely work with the location-specific teams to achieve more focused results.
THEMATIC AREAS The Company has aligned its CSR programmes under
Education, Health & Nutrition, Agriculture, Environment & Water, Skill Enhancement, Rural Women’s BPO, Sports and Art & Culture. This helps the Company cover the following thematic interventions as per Schedule VII of the Companies Act, 2013:
Improving living conditions (eradication of hunger, poverty, malnutrition, etc.)
Promoting social development (education, skill development, livelihood enhancements, etc.)
Addressing social inequalities (gender equality, women empowerment. etc.)
Ensuring environmental sustainability
Promotion of sports
Swachh Bharat Mission
The disclosure as per Rule 9 of Companies (Corporate Social Responsibility Policy) Rules, 2014 is annexed to this Report as Annexure D.
26. ENVIRONMENTAL INITIATIVES Your Company is firmly committed to conservation
of natural resources; reduction of emissions and discharges to the environment and preservation of biodiversity in all its operations. The Company recognises the need to be proactive and integrate thoughts into processes, to reduce risks and harness opportunities, and set targets beyond compliance considering the future changes and carrying out the required changes in the processes focussing on social and environmental concerns to better manage the long term expectations of the stakeholders.
This approach demonstrates sensitivity to the environment in the areas of conserving resources such as water, energy and input materials; minimising waste while maximising recirculation, reuse and recycling and enhancing local biodiversity. The awareness of the environment complemented with decisions and actions that the Company take towards a responsible behaviour leads to innovation and value creation for the Company.
The following actions were taken in 2017-18 to improve environment:
Conservation of natural resources: Efficient operation as well as effective monitoring
of pollution control equipment ultimately leads to reduced wastage of materials. During the year, stack emission monitoring systems, dust analysers, gas monitors on stacks, CCTVs and effluent monitors were installed across the steel complex.
Enhancing steam generation through additional waste heat recovery boilers at Salem (WHRB #4 and #5) resulted in reduction of coal consumption (about 22,000 MT/Annum) in coal-based boilers, thereby minimising the fossil fuel consumption.
Water conservation: Water security is essential for un-interrupted operations of steel plant units. Vijayanagar & Salem plants are located in water scares areas. During the year several measures were taken to conserve water by improving water use efficiency; recycling treated waste water; treated sewage and recovering high quality water through reverse osmosis plants.
The following initiatives for water conversation has been carried out during the year:
Treatment of sewage and recovering quality water through reverse osmosis.
Installation of Roof-top rain water harvesting system at 12 plant buildings at Dolvi and the collected rain water is stored in nearby water utility system for reuse.
Increased the cycles of concentration in all cooling towers across all plant locations resulting in reduced waste water generation.
Installation of an RO system in the upstream water system instead of downstream (high TDS water), resulting in elimination of softening systems, which generates high Total Dissolved Solids (TDS) effluents and reduction in energy consumption.
Recycle of Solid Waste: Solid waste materials such as sludge and collected dust are generated during the operation of air and water pollution control system. During the year at Vijayanagar, Biogas plant for food

149
Better Everyday. In Pursuit of Excellence. Corporate Overview Statutory Reports Financial Statements
waste and sewage waste was installed. Gas produced in the process is being transferred to the central canteen and the solids generated were composted. Pilot trial for treatability study of ammonia and cyanide has been completed at Vijayanagar.
Slag sand: During the year, the Company sold 2.87 lakhs tonnes
of slag sand for use as fine aggregates in construction replacing natural river sand, thereby helping conserve the river beds. Granulated slag sold during the year was 45.6 lakhs tonnes. The Company has installed second line of granulated slag crusher of 40 TPH capacity resulting in doubling the daily production of slag sand.
Steel Slag: The Company has developed an innovative technology
which can convert the steel slag as a useful product as construction aggregate, especially in roads and pavements. The technology is being patented and is expected to increase steel slag utilisation substantially in the future years. 2023 tonnes of granulated BF slag, 33302 tonnes of slag sand, 1,78,575 tonnes of dry pit slag and 60,617 tonnes of steel slag was sold during the year for NHAI project Ballari-Hospet. This highway is termed as “Green Highway”.
Reduction of emissions and discharges: Air emissions: Owing to handling of large volume of
solid materials, emissions of dust remain a major area of concern in all integrated iron and steel plants. During the year, several measures were taken to reduce emissions by installing bag filters in high dust areas. Some of the other measures includes:
At Dolvi, 13 Dust Extraction (DE) systems at junction houses were installed to control fugitive emission during the material transfer through conveyors.
The Company also has established Pneumatic conveying for dust transfer to feeding bin and a new DE system at pellet discharge junction house. The other initiatives to reduce emissions include installation of Electro Static Precipitator for discharge end of the pellet making process and construction of 0.5 km of concrete road in the raw material handling area to minimise fugitive emission and easy vehicular movement.
Installation of water sprinklers / wind nets and dry fog and wet fog systems in the raw material handling areas to reduce the fugitive emission, which leads to improvement in ambient air quality in the plant premises.
Established two telescopic chutes and replacement of trucks with bulkers resulted in curbing the fugitive emissions during loading of GCP dust.
Zero Liquid Discharge: All the units of Company have installed requisite
facilities to maximise the utilisation of water. These include cascaded water use, recycling in less critical applications, use for greenery development etc. These actions has facilitated in ensuring zero liquid discharge from all the steel plants.
Biodiversity: The steel plant at Vijayanagar is in an arid area, with poor
rainfall and devoid of vegetation. With the continued efforts on tree plantation over the years by the Company and surrounding community, the micro climate in the surrounding area has improved substantially facilitating improved bio diversity.
With an effort to improve the greenery beyond the steel plant area, tree plantation has been carried out over an area of 450 acres belonging to the forest department at Vijayanagar. 4,29,497 sq. ft. area has been added under green cover inclusive of lawns, planting local species of trees, shrubs and herbs.
Million Trees Plantation Mission: The million tree plantation project has been initiated
in nearly 127 acres of degraded forest areas at Dolvi and Karav with a vision to plant 1 million trees by FY 2021-22.
27. AWARDS AND ACCOLADES Vijayanagar Works
1) Ranked sixth among the best operating steel plant in the world by World Steel Dynamics in June 2017.
2) Vijayanagar Works has been recognised as the second best integrated steel plant in the country for the performance. It was awarded the Steel Minister’s Trophy for the years 2014-15 and 2015-16.
3) JSW Steel (Vijayanagar Works) has been awarded the prestigious Ispat Suraksha Puraskar - 2017 by the Joint Committee on Safety, Health & Environment in the steel industry for zero fatalities during the calendar years 2015 and 2016 in the following zones:
Steel melting shops and continuous casting shops
Blast furnaces, slag granulation plant, sinter plants and the raw material department
4) Water Management Excellence Award 2017 by ASSOCHAM on 30 June 2017 at Hotel Le Meridian, New Delhi
5) National Sustainability Award-2017: First Prize among the Integrated Steel Plants Category by the Indian Institute of Metals

150
JSW Steel Limited | Integrated Report 2017-18
6) Winner of the International and Best CSR Practice award 2018 at International NGO and CSR Summit 28 February 2018, Bengaluru.
7) Awarded the India CSR Project of the Year award for Mission against Malnutrition (MAM) in the state of Karnataka on 26 May 2017
8) JSW Steel Ltd., Vijayanagar Works awarded as “MODEL EMPLOYER” felicitated by Ministry of Labour and Employment, Sri Bandaru Dattatreya 16 May 2017
Dolvi Works 1) PM’s Trophy 2013-14: Certificate of Appreciation for
Maximum Incremental Improvement amongst ISP
2) CII Exim Bank Award 2017 for Significant Achievement in Nov’17
3) CoRe programme stood 1st Runner up in Frost & Sullivan PERP 2017 Award in Dec’17
4) Ispat Suraksha Puraskar for zero fatal in 2018
Salem Works 1) Best ITI – Skill Development through the PPP Model:
JSW Steel Salem won the Silver Trophy by ASSOCHAM, India, in recognition of outstanding contribution in Best ITI – Skill Development
2) IIM Sustainability Award: Won the second prize in the alloy steel category by
the Indian Institute of Metals
28. DIRECTORS’ RESPONSIBILITY STATEMENT
Pursuant to the requirements under Section 134, sub-section 3(c) and sub-section 5 of the Companies Act, 2013, your Directors hereby state and confirm that:
a) In the preparation of the annual accounts, the applicable accounting standards have been followed, along with proper explanation relating to material departures.
b) Such accounting policies have been selected and applied consistently and judgements and estimates have been made that are reasonable and prudent to give a true and fair view of the Company’s state of affairs as on 31 March 2018 and of the Company’s profit or loss for the year ended on that date.
c) Proper and sufficient care has been taken for the maintenance of adequate accounting records, in accordance with the provisions of the Companies Act, 2013 for safeguarding the assets of the Company and for preventing and detecting fraud and other irregularities.
d) The annual financial statements have been prepared on a going concern basis.
e) Internal financial controls were laid down to be followed and that such internal financial controls were adequate and were operating effectively.
f) Proper systems were devised to ensure compliance with the provisions of all applicable laws and that such systems were adequate and were operating effectively.
29. DISCLOSURES NUMBER OF MEETINGS OF THE BOARD OF DIRECTORS During the year, eight Board Meetings were convened
and held, the details of which are given in the Corporate Governance Report. The intervening gap between the Meetings was within the period prescribed under the Companies Act, 2013 and Regulations 17 of the Securities and Exchange Board of India (Listing Obligation and Disclosure Requirements) Regulation, 2015.
AUDIT COMMITTEE The Audit Committee comprises of three Non-Executive
Directors, all of whom are Independent Directors. Mr. K. Vijayaraghavan is the Chairman of the Audit Committee. The Members possess adequate knowledge of Accounts, Audit, Finance, etc. The composition of the Audit Committee meets the requirements of Section 177 of the Companies Act, 2013 and Regulation 18 of the Securities and Exchange Board of India (Listing Obligation and Disclosure Requirements) Regulations, 2015.
There are no recommendations of the Audit Committee that have not been accepted by the Board.
EXTRACT OF ANNUAL RETURN In accordance with the provisions of Section 134(3)(a)
of the Companies Act, 2013, the extract of the annual return in Form No. MGT–9 is annexed (Annexure B) hereto and forms a part of this Report.
WHISTLE BLOWER POLICY / VIGIL MECHANISM The Company has a vigil mechanism named Whistle
Blower Policy / Vigil Mechanism to deal with instances of fraud and mismanagement, if any. Details of the same are given in the Corporate Governance Report.
PARTICULARS OF LOANS, GUARANTEES OR INVESTMENTS UNDER SEC. 186
Details of Loans, Guarantees and Investments covered under the provisions of Section 186 of the Companies Act, 2013 are given in the notes to the Financial Statements.

151
Better Everyday. In Pursuit of Excellence. Corporate Overview Statutory Reports Financial Statements
DETAILS OF SIGNIFICANT AND MATERIAL ORDERS PASSED BY THE REGULATORS OR COURTS OR TRIBUNALS IMPACTING THE GOING CONCERN STATUS AND COMPANY’S OPERATIONS IN FUTURE
There are no significant or material orders passed by the Regulators/ Courts/ Tribunals that could impact the going concern status of the Company and its future operations.
However, Members’ attention is drawn to the statement on contingent liabilities, commitments in the notes forming part of the Financial Statements.
PARTICULARS REGARDING CONSERVATION OF ENERGY, TECHNOLOGY ABSORPTION AND FOREIGN EXCHANGE EARNINGS AND OUTGO
Information in accordance with the provisions of Section 134(3)(m) of the Companies Act, 2013, read with Rule 8 of the Companies (Accounts) Rules, 2014 regarding conservation of energy, technology absorption and foreign exchange earnings and outgo, is given in the statement annexed (Annexure A) hereto and forms a part of this Report.
PARTICULARS OF EMPLOYEES AND RELATED DISCLOSURES The information required to be disclosed in the Directors’
Report pursuant to Section 197 of the Companies Act, 2013, read with Rule 5 of the Companies (Appointment and Remuneration of Managerial Personnel) Rules, 2014, is set out as Annexure F to this Report.
Having regard to the provisions of the first proviso to Section 136(1) of the Companies Act, 2013, an abridged version of the Annual Report, excluding the aforesaid information, is being sent to the members of the Company and others entitled thereto. For those persons who have registered their e-mail addresses with the Company, the full version of the Annual Report containing the aforesaid information is being sent to them electronically. Members and other entitled persons who have not registered their e-mail addresses with the Company may access the full version of the Annual Report up to the date of the ensuing AGM on the website of the Company; or by physically inspecting the full version of the Annual Report at the Registered Office of the Company on all working days of the Company, between 10.00 a.m. and 1.00 p.m.; or by requesting a physical copy by writing to the Company Secretary.
DISCLOSURE UNDER THE SEXUAL HARASSMENT OF WOMEN AT WORKPLACE (PREVENTION, PROHIBITION AND REDRESSAL) ACT, 2013
The Company has in place an Anti-Sexual Harassment Policy in line with the requirements of the Sexual Harassment of Women at Workplace (Prevention, Prohibition and Redressal) Act, 2013. An Internal Complaints Committee (ICC) has been set up to redress complaints received regarding sexual harassment. All employees (permanent, contractual, temporary and trainees) are covered under this policy. No complaints pertaining to sexual harassment were received during FY 2017-18.
OTHER DISCLOSURES / REPORTING Your Directors state that no disclosure or reporting is
required in respect of the following items as there were no transactions pertaining to these items during the year under review:
1. Details relating to deposits covered under Chapter V of the Companies Act, 2013.
2. Issue of equity shares with differential rights as to dividend, voting or otherwise.
3. Issue of shares (including sweat equity shares) to employees of the Company under any scheme save and except ESOPs referred to in this Report.
4. Neither the Managing Director nor the Whole-time Directors of the Company receive any remuneration or commission from any of its subsidiaries.
30. APPRECIATION Your Directors take this opportunity to express their
appreciation for the cooperation and assistance received from the Government of India; Republic of Chile, Mauritius, Mozambique, the US and the UK; the State Governments of Karnataka, Maharashtra, Tamil Nadu, West Bengal; Jharkhand and Odisha and the financial institutions, banks as well as the shareholders and debenture holders during the year under review. The Directors also wish to place on record their appreciation of the devoted and dedicated services rendered by all employees of the Company.
For and on behalf of the Board of Directors
Place: Mumbai Date: 16 May 2018
Sajjan Jindal
Chairman

152
JSW Steel Limited | Integrated Report 2017-18
INFORMATION IN ACCORDANCE WITH THE PROVISIONS OF SECTION 134(3)(M) OF THE COMPANIES ACT, 2013, READ WITH RULE 8 OF THE COMPANIES (ACCOUNTS) RULES, 2014 REGARDING CONSERVATION OF ENERGY, TECHNOLOGY ABSORPTION AND FOREIGN EXCHANGE EARNINGS AND OUTGO
A. ENERGY CONSERVATION The Company has always been a frontrunner in
continually improving its operational performance in all areas, like production, yield, plant utilisation and others, while reducing the consumption of fuel, power, stores and others. This is done by adopting an approach of continual improvement of process metrics across all energy consuming facilities.
The Energy departments renewed its efforts by carrying out energy benchmarking with the best-in-class steel players and adopting some of the relevant best practices. Energy conservation was taken up as a key improvement theme during the year and the new approach attempted to prioritise actions through a three-pronged strategy:
1. Higher Prevention/minimisation – i.e. Preventing wastage/minimisation of energy usage by relentless optimisation of process parameters to achieve lower values of fuel / energy consumption.
2. Improving Recovery – deploying innovative methods of recovering higher amount of unused fuel heat in various process exhausts / recovery systems.
3. Higher Re-use / Re-cycling – studying available potential of recovered energy from various sources and doing a cost-benefit analysis of practices required.
STEPS TAKEN FOR ENERGY CONSERVATION: VIJAYNAGAR
Interconnection of Blast furnace gas lines has been completed resulting into 2% specific fuel rate reduction.
Efficient monitoring and effective use of gases resulting in 3.5% reduction in Blast furnace gas flaring.
Utilisation of recovered waste heat at Sinter Plant-1 for drying of Coke to reduce moisture from 8% to 3% resulting in reduced specific fuel rate by 3%.
Strengthening of steam network resulting into enhancement of CPP#2 power generation by 2 MW.
Increased the LD gas recovery from 93 to 95 Nm3/Tls through improvised SOP’s.
Annexure ‘A’ to Directors’ Report
Gaseous heat rate at Pellet plant has been reduced by 7% y-o-y, by stabilising the mixed gas calorific value resulting into increased productivity.
Improved Sinter Fe% resulted into reduction of Blast Furnace fuel rate by 1% y-o-y.
DOLVI
Usage of Coke Oven gas / Mixed gas as a replacement of NG at following facilities:
a) Tunnel furnace heating, all ladle preheaters heating at SMS.
b) Heating of Bar Mill furnace with mixed gas.
Reduction in heat rate by 3% at Power plant through implementation of online air fuel ratio logic.
Power generation through Waste gas has increased by 11%.
Revamping of waste heat recovery boiler at Sinter plant # 1.
Installation & commissioning of waste heat recovery boiler at Sinter plant # 2.
Replacement of conventional lights with LED lights at plant area and achieved energy savings of 20,000 KWH.
SALEM
Reduction in fuel rate, power consumption, BF gas consumption at Blast furnace through optimisation of production between Blast furnace #1 & #2 and higher sinter usage resulted in savings of 0.18 Gcal/TCS.
Process optimisation at 150 TPD Air separation plant resulted in savings of 540000 kwh per annum.
Power consumption reduction in Energy optimising furnace-1 through installation of energy efficient motors with regenerative drive for EOT Crane, energy efficient motor with drive in hydraulic system and 6.6kv drive in ID fan motor. Energy savings of 1908000 Kwh per annum
Energy savings in an auxiliary cooling water pumps at CPP#2 through coating of pump internals resulted in savings of 99600 Kwh per annum.
THE STEPS TAKEN BY THE COMPANY FOR UTILISING ALTERNATE SOURCES OF ENERGY:
VIJAYNAGAR
30% Increase in by product gas supply y-o-y to power plants resulted in coal saving of 21 TPH.
HSM waste heat recovery for steam generation is under progress.

153
Better Everyday. In Pursuit of Excellence. Corporate Overview Statutory Reports Financial Statements
DOLVI
Usage of Coke Oven gas / Mixed gas at Dolvi as a replacement of NG at following facilities:
a) Tunnel furnace heating, all ladle preheaters heating at SMS.
b) Heating of Bar Mill furnace with mixed gas.
SALEM
Effective utilisation of waste heat from Non recovery Coke Ovens through waste heat recovery boilers.
EXPENDITURE ON ENERGY CONSERVATION PROJECT: VIJAYANAGAR
Capital expenditure of ` 34.60 crores was incurred on energy conservation projects, resulting in a reduction of 0.053 Gcal / tcs and a financial savings of ` 47.50 crores on annualised basis.
DOLVI
Capital expenditure of ` 27.22 crores was incurred on energy conservation projects, resulting in a reduction of 0.011 Gcal / tcs and a financial savings of ` 6.73 crores on annualised basis.
SALEM
Capital expenditure of ` 1.17 crores was incurred on conservation projects, resulting in a reduction of 0.01 Gcal / tcs and a financial savings of ` 0.62 crores on annualised basis.
RESEARCH AND DEVELOPMENT (R&D) 1. Specific areas in which R&D activities were carried
out by the Company Research and Development (R&D) activities
at the Company involve new Process and Product development, process improvements for maximisation of quality, cost and energy optimisation, waste utilisation and conservation of natural resources.
The key focus areas include:
Optimisation of resource utilisation.
Quality, productivity and cost optimisation through process efficiency improvements.
Product development, customisation and new applications.
Recycling and reuse of process waste and conservation of natural resources.
New application developments and promotion of slag usage in the country.
R&D is actively involved in Industry–Institute partnership and has initiated four collaborative projects in FY 2017-18 with leading academic and research institutes in India – IIT Bombay, IIT Madras, IIT Kanpur, NMDC and NITK Surathkal.
The Company is also pursuing an international collaborative research programme with BASF, Germany to develop special purpose reagents for iron ore beneficiation.
The Company has initiated and is associated with 3 Nos. of advanced research programmes with partial funding from Ministry of Steel and Ministry of Human Resource Development.
2. Benefits derived as a result of R&D efforts A) Vijayanagar Works
Process optimisation to facilitate usage of SMS sludge in pellet feed at PP#2 resulting in reduction in carbon consumption by 2 kg/T of pellets and improved CCS of fired pellets and cost savings in terms of reduced carbon and iron ore requirements in pellet making.
Development of Application of PS Balls (SMS-2 slag) as Filter Media and for shot blasting resulted in efficiency, quality improvement and cost savings.
Development of a new hydraulic bound mixtures (HBM) using BF slag, LD slag and Lime resulted in reduction in civil project costs, lower carbon emissions, extensive use of slag leading to conservation of natural resources.
Optimisation of cooling process parameters resulted in improved quality and productivity of special grade steels by elimination of Coil Collapsing in Medium Carbon and High Tensile Grades.
Development of a process for recovery of carbon from process wastes has lead to savings in fuel costs.
Other important developments carried out at R&D
Development of heat treatment process for improving life cycle of ladle turret lining plates at SMS.
Optimisation of usage of washed iron ore in sintering process.
Process optimisation to maximise iron bearing dust & sludge consumption in micro-pelletisation.

154
JSW Steel Limited | Integrated Report 2017-18
Process optimisation for improvement in sinter quality and productivity with high porosity iron ores.
Development of flux rich shell for pellets to reduce fugitive emissions and sticking during induration of pellets.
Process development to increase Sinter grade feed at BP2.
Development of beneficiation process for de-zincing of SMS and BF dust and sludge.
Optimisation of Drying cycle (DD Zone) at PP2 for improving pellet quality.
Development of operator guidance charts for identifying sliver defects in rolled products.
Process development for improving the coke reactivity.
New products developed / customised
Development of new generation high strength steels mainly for automotive and electrical applications have been the major focus at Vijayanagar works. The strategic development aims at providing solutions for high strength with low weight applications.
The new developments include incremental improvements in material properties to match the customer requirements and new grades for new applications.
A total of 47 numbers of new steel grades have been developed/customised consisting of flat and long rolled products.
B) Dolvi Works
Improvement in sinter quality yield through improving aerodynamics of pellet car by use of narrow grate bars in SP1 resulting in reduction of return fines generation by 1.5%.
Use of Calcium Carbide based deoxidant for reducing easily reducible oxides in slag, namely FeO and MnO, resulting in savings in Al consumption.
Optimisation of CSP process to improvement of DWTT properties in PP60ME grade resulting in customer satisfaction.
Optimisation of QST technology for reduction in Mn & Si of lower diameter TMT bars (<=25 mm) resulting in ferro-alloy cost saving of ` 210/MT.
Optimisation of process parameters for reduction in dissolved oxygen level at Billet
caster resulting in decrease in inclusions, mill cobbles and elimination of surface cracks in 12, 16 and 20 mm TMT bars.
Development of Fe500S grade through C-Mn route using QST technology
Other important developments carried out at R&D
Reduction of ferro-alloy cost in value added grade by alternative alloying strategy resulting in cost savings.
Process modification in use of ladle covering compound in CSP casted heats to reduce nitrogen pickup and improve castability.
Successful sinter making with use of lean iron ore fins with high volatile matter (LOI 9-10%).
Successful use of Pre blended coal in coke oven to reduce inventory of different type of coal and cost of procurement.
New products developed / customised
Development of high strength TMT rebar (Fe600) for weight reduction and seismic resistance TMT rebars (Fe 500S) has been the main focus area of Dolvi for FY 2017-18.
Dolvi R&D also developed/customised a total of 17 steel grades.
C) Salem Works:
The key focus areas include:
Cost reduction through process efficiency improvements.
Product development and customisation.
Waste management.
The following process and technology improvement projects have been completed:
Development of tire cord steel resulting in new product introduction in the market.
Optimisation of deoxidation process for elimination of macro inclusions in micro alloyed steels leading to quality improvement.
Development of polyurethane lining in the convolution of bellow resulting in improved life of bellow at BF#2.
Optimisation of blast burden charge with small sinter in blast furnaces resulting in effective utilisation of raw material and reduction in the cost of production.

155
Better Everyday. In Pursuit of Excellence. Corporate Overview Statutory Reports Financial Statements
Optimisation of process parameters for grade S53CG leading to improved steel cleanliness.
Optimisation of thermo-mechanical processing for improving mechanical properties of 10B35 grade steel.
Development of heat treatment process for improvement of mechanical properties of 52CrMoV4 grade.
Development of process for synthesizing gypsum from steelmaking slag.
Development of Cr-Mo Steel for High Tensile Fasteners.
Optimisation of Deoxidation process for Cr-Mo steel.
Optimisation of cooling parameters for peritectic steel grades resulting in reduction of surface cracks.
Development of continuous cast gear steel to replace ingot cast steel.
Development of Steel Grade for Leaf Spring Application.
New products developed / customised
A total of 9 new grades have been developed/ customised mostly for automotive components such as rear axle shaft, leaf spring, tire cord etc.
3. Expenditure on R&D (2017-18)
Item ` in crores
Capital 16
Revenue 25
Total 41
Total as % PAT 0.89%
B. TECHNOLOGY ABSORPTION, ADOPTION AND INNOVATION
Vijayanagar Works
Commissioning of 10,000 T/day pouring station at SMS-1, to handle torpedo and 140t open top ladles.
Commissioning of movable KR station at SMS-1, for pre-treatment of Hot metal for special steel grades and silicon steel.
Commissioning of HR Slitter line of 0.75mtpa capacity at HSM-2.
Installation of 6th strand billet caster at SMS-3.
Dolvi Works
Upgradation of online surface imaging system for HR coil.
Commissioning of 6th strand Billet Caster.
Commissioning of 500 TPD VPSA / Oxygen plant.
Commissioning of waste heat recovery system in Sinter Plant-2.
Salem Works
Installation of Simufact simulation software.
Commissioning of Instrumented Impact testing machine.
Commissioning of Sliding strand in Bar and Rod Mill.
Commissioning of annealing facility for coils.
Commissioning of CCM-3.
INTELLECTUAL PROPERTY1. PATENTS Vijayanagar Works
Patents Filed – 11 Nos.
1) Cold rolled high strength steel having excellent strain hardening property and method of manufacturing the same.
2) A process for cooling and weathering of steel slag.
3) A system for drying iron ore pellets in down draft zone of Induration furnace and method thereof.
4) Rephosphorised low carbon high strength cold rolled steel with resistance for secondary work embrittlement and good formability.
5) High strength cold rolled dual phase steel sheet having high yield ratio with excellent bend ability and phosphatability and a method of its production to continuous annealing route (780Y).
6) Rephosphorised low carbon high strength cold rolled steel having excellent weld ability, aging resistance and resistance for secondary work embrittlement and method of manufacturing the same (440R).
7) High yield ratio high strength cold rolled steel sheet with improved bending properties.
8) A process for sintering of iron ore blend involving pre-processing of porous iron ore to improve sinter quality and plant productivity.
9) Cold rolled ultra-high strength steel sheet with excellent stretch formability and method of manufacturing the same.
10) Flux coated iron ore pellets and the process of manufacturing the same.
11) Hyper-activated clay binder and formulation/ compositions thereof adopted to improve green properties of iron ore pellets through chemical doping.

156
JSW Steel Limited | Integrated Report 2017-18
Granted patents – 4 Nos.
1. 'A Method of Burden Distribution of Iron Oxide Ore as Pellet and Coke' - patent No. 294396.
2. 'A System for Effluent Treatment at Coke Oven Plant and a Method for Such Treatment' - patent no. 294402.
3. 'A Simulator System for Desulphurization of Coke Oven Gas and a Gas Treatment Method using such System' - patent no. 293702.
4. 'A System for Mixing of Corex and Blast Furnace Gas for Pre-Heating of BF Air' -patent no. 292421.
Dolvi Works Patents Filed – 5 Nos.
1. Low carbon HSLA steel with low YS/UTS ratio, reduced corner crack sensitivity, improved rollability through CSP route.
2. A belt rupture protection device for sinter plant.
3. A seismic resistance reinforced steel bar.
4. An automated system and method of delivery of high pressure liquor Ammonia (HPLA) to coke oven battery during charging operation by sensing flow in HPLA line to facilitate oven-to-oven gas transfer.
5. A Pellet Car Assembly for Induration System involving end grate bars with tilt arresting configuration.
Granted patents - 1 No.
1. An extension being attached in a casting apparatus for increasing metallurgical length of casting apparatus.
Publication of Technical Papers Vijayanagar Works
Total 13 publications have been published. 10 in International and 3 in National journals.
Dolvi Works
A total of 14 National and International conference publications and conference proceedings were published.
Salem Works
Total of 11 papers (5 journal papers and 6 papers in conference proceedings) have been published.
i) The benefits derived like product improvement, cost reduction, product development or import substitution.
The R&D developments in process improvement, energy optimisation and cost reduction have helped in substantial savings in operational costs and revenue generation due to product development.
ii) Information regarding Imported Technology (Imported during the last three years reckoned from the beginning of the financial year)
Innovation / Technology Year of Import Status
Vijayanagar Works
Continuous Annealing Line for CRM- 2 2015-16 Commissioned
Capacity augmentation of Blast Furnace No. 1 2015-16 Commissioned
Lime kiln-12 2015-16 Commissioned
Commissioning of Electrical Steel Complex (ACL) at CRM-1 to produce Cold Rolled Non-Grain Oriented (CRNGO)
2015-16 Commissioned
Commissioning of Slab Auto Scarfing for removing surface and sub-surface defects for auto grades and non-auto grades
2015-16 Commissioned
Commissioning of I-Shop to machine and fabricate precision components in-house
2015-16 Commissioned
Commissioning of Slab sizing press at HSM-2 2015-16 Commissioned
KR station at SMS-2 for desulphurisation of hot metal 2016-17 Commissioned
6th strand billet caster at SMS-3 2017-18 Commissioned
HR Slitter line of 0.75mtpa capacity at HSM-2 2017-18 Commissioned

157
Better Everyday. In Pursuit of Excellence. Corporate Overview Statutory Reports Financial Statements
Innovation / Technology Year of Import Status
Dolvi works
Capacity augmentation of Blast Furnace 2015-16 Commissioned
Sinter Plant II 2015-16 Commissioned
High temperature quenching system in GCP 2015-16 Commissioned
Ladle Furnace #5 2015-16 Commissioned
EMBR in CSP Caster #1 and Caster #2 2015-16 Commissioned
Metallurgical Length Extension of CSP Caster #1 2015-16 Commissioned
New Billet Caster 2015-16 Commissioned
Upgraded HSM Level 2 systems 2015-16 Commissioned
Bar Mill - II 2015-16 Commissioned
Section augmentation (130mmX130mm) in existing Billet Caster 2016-17 Commissioned
Upgradation of online surface imaging system for HR coil 2017-18 Commissioned
Commissioning of 6th strand Billet Caster 2017-18 Commissioned
Commissioning of 500 TPD VPSA / Oxygen plant 2017-18 Commissioned
Salem Works
Online Gauge Surface Defect Detection System 2016-17 Commissioned
Instrumented Impact testing machine 2017-18 Commissioned
Sliding strand in Bar and Rod Mill 2017-18 Commissioned
Annealing facility for coils 2017-18 Commissioned
CCM-3 (Continuous casting machine) 2017-18 Commissioned
C. FOREIGN EXCHANGE EARNINGS AND OUTGO:
Total Foreign exchange used and earned during the year:
(` In Crores)
FY 2017–18 FY 2016–17
Foreign Exchange earned 10,938 10,149
Foreign Exchange used 22,617 17,595

158
JSW Steel Limited | Integrated Report 2017-18
FORM NO. MGT- 9
EXTRACT OF ANNUAL RETURNAs on the financial year ended on 31.03.2018
[Pursuant to Section 92(3) of the Companies Act, 2013 and rule 12(1) of the Companies (Management and Administration) Rules, 2014]
I. REGISTRATION AND OTHER DETAILS:1. CIN L27102MH1994PLC152925
2. Registration Date 15.03.1994
3. Name of the Company JSW Steel Limited
4. Category / Sub-Category of the Company Iron & Steel Making Facilities.
5. Address of the Registered office and contact details JSW Centre, Bandra-Kurla Complex, Bandra (East), Mumbai 400 051
Tel. No.: 022 42861000
Fax No.: 022 42863000
Website: www.jsw.in
6. Whether listed company Yes / No Yes
7. Name, Address and Contact details of Registrar and Transfer Agent, if any
Karvy Computershare Private Limited
Karvy Selenium Tower B, Plot 31-32, Gachibowli, Financial District, Nanakramguda, Hyderabad – 500 008
Tel. No.: 040 67161500
Fax No.: 040 23001153
II. PRINCIPAL BUSINESS ACTIVITIES OF THE COMPANY: All the business activities contributing 10% or more of the total turnover of the Company shall be stated:-
Sl. No.
Name and Description of main products / services NIC Code of the Product/service
% to total turnover of the Company
1 Hot Rolled Steel Strips /Sheets/Plates
241
47.7
2 Bar & Rods 20.9
3 MS Cold Rolled Coils/Sheets 14.7
III. PARTICULARS OF HOLDING, SUBSIDIARY AND ASSOCIATE COMPANIES:Sl. No.
Name of the Company Address of the Company CIN/GLN % of Shares held
SUBSIDIARY [APPLICABLE SECTION: 2 (87) (II)]1 JSW Steel (UK) Limited Roxburghe House,273-283 Regent Street,
London WIB 2HA, UK.Not applicable 100%
2 JSW Natural Resources Limited, Mauritius
C/o, International Financial Limited, IFS Court, Twenty Eight Cybercity, Ebene Mauritius.
Not applicable 100%
3 JSW Natural Resources Mozambique Lda
3rd Floor, Rua Desidane No. 60, Opp. Polana Shopping Complex, Polana Cimento “A”, Maputo, Mozambique
Not applicable 100%
4 JSW ADMS Carvao Limitada 3rd Floor, Rua Desidane No. 60, Opp. Polana Shopping Complex, Polana Cimento “A”, Maputo, Mozambique
Not applicable 100%
5 JSW Steel (Netherlands) B.V. Hoogoorddreef, 15, 1101, BA, Amsterdam
Not applicable 100%
6 JSW Steel (USA) Inc. 5200 E, Mckinney Road, Baytown, Texas - 77523
Not applicable 90%
7 Periama Holdings, LLC 2711, Centreville Road, Suite 400, City of Wilminton Country of New Castle Delaware 19808.
Not applicable 100%
8 Purest Energy LLC 407 Prosperity Road, Prosperity, WV, 25909 Not applicable 100%
Annexure – B to Directors’ Report
159
Better Everyday. In Pursuit of Excellence. Corporate Overview Statutory Reports Financial Statements
Sl. No.
Name of the Company Address of the Company CIN/GLN % of Shares held
9 Planck Holdings, LLC 407 Prosperity Road, Prosperity, WV, 25909 Not applicable 100%
10 Prime Coal, LLC 407 Prosperity Road, Prosperity, WV, 25909 Not applicable 100%
11 Rolling S Augering, LLC 407 Prosperity Road, Prosperity, WV, 25909 Not applicable 100%
12 Caretta Minerals, LLC 407 Prosperity Road, Prosperity, WV, 25909 Not applicable 100%
13 Periama Handling, LLC 407 Prosperity Road, Prosperity, WV, 25909 Not applicable 100%
14 Lower Hutchinson Minerals, LLC 407 Prosperity Road, Prosperity, WV, 25909 Not applicable 100%
15 Meadow Creek Minerals, LLC 407 Prosperity Road, Prosperity, WV, 25909 Not applicable 100%
16 Keenan Minerals, LLC 407 Prosperity Road, Prosperity, WV, 25909 Not applicable 100%
17 Hutchinson Minerals, LLC 407 Prosperity Road, Prosperity, WV, 25909 Not applicable 100%
18 RC Minerals, LLC 407 Prosperity Road, Prosperity, WV, 25909 Not applicable 100%
19 Peace Leasing, LLC 407 Prosperity Road, Prosperity, WV, 25909 Not applicable 100%
20 JSW Panama Holding Corporation 48th East Street, Bella, Vista, P.O. Box No.: 0816-01832, Panama.
Not applicable 100%
21 Inversiones Eurosh Limitada Juan Francisco Gonzalez, 562, Sector Placilla, Morales Copiapo, Chile
Not applicable 100%
22 Santa Fe Mining Juan Francisco Gonzalez, 562, Sector Placilla, Morales Copiapo, Chile
Not applicable 70%
23 Santa Fe Puerto S.A. Juan Francisco Gonzalez, 562, Sector Placilla, Morales Copiapo, Chile
Not applicable 70%
24 JSW Steel Processing Centres Limited
JSW Centre, Bandra Kurla Complex, Bandra East, Mumbai 400 051
U01010MH2003PLC176595 100%
25 JSW Jharkhand Steel Limited JSW Centre, Bandra Kurla Complex, Bandra East, Mumbai 400 051
U27310MH2007PLC171405 100%
26 JSW Bengal Steel Limited JSW Centre, Bandra Kurla Complex, Bandra (E), Mumbai - 400 051
U27106MH2007PLC170160 98.68%
27 JSW Natural Resources India Limited
JSW Centre, Bandra Kurla Complex, Bandra (E), Mumbai - 400 051
U14200MH2007PLC173687 98.68%
28 JSW Energy (Bengal) Limited JSW Centre, Bandra Kurla Complex, Bandra (E), Mumbai - 400 051
U40300MH2010PLC199844 98.68%
29 JSW Steel Coated Proudcts Limited JSW Centre, Bandra Kurla Complex, Bandra (E), Mumbai - 400 051
U27100MH1985PLC037346 100%
30 Amba River Coke Limited JSW Centre, Bandra Kurla Complex, Bandra (E), Mumbai - 400 051
U23100MH1997PLC110901 100%
31 Peddar Realty Pvt Limited JSW Centre, Bandra Kurla Complex, Bandra (E), Mumbai - 400 051
U45200MH2002PTC137214 100%
32 Arima Holdings Ltd., 42 Hotels Street, 3rd Floor, Gfin Tower, CybercIty, Ebene, Mauritius
Not Applicable 100%
33 Lakeland Securities Ltd., 42 Hotels Street, 3rd Floor, Gfin Tower, CybercIty, Ebene, Mauritius
Not Applicable 100%
34 Erebus Limited 42 Hotels Street, 3rd Floor, Gfin Tower, CybercIty, Ebene, Mauritius
Not Applicable 100%
35 Nippon Ispat Singapore (Pte) Ltd., 17 Philip Street # 05-01 Grand Building, Singapore 048695.
Reg No.199303132W 100%
36 JSW Natural Resource Bengal Limited
JSW Centre, Bandra Kurla Complex, Bandra (E), Mumbai - 400 051
U10300MH2010PLC200871 98.68%
37 JSW Steel (Salav) Limited Welspun City, Village Versamedi, Taluka Anjar, Kutch, Anjar, Gujrat.
U27100GJ2008PLC064145 100%
38 JSW Industrial Gases Private Limited (formerly known as JSW Praxair Oxygen Private Limited)
JSW Centre, Bandra Kurla Complex, Bandra (E) Mumbai - 400 051
U85110KA1995PTC018868 100%
39 JSW Steel Italy S.R.L. Via Carlo D’ Adda, 9A, 20143 Milano, Italy. Not Applicable 100%
40 JSW Utkal Steel Limited JSW Centre, Bandra Kurla Complex, Bandra (E), Mumbai - 400 051
U27209MH2017PLC301887 100%

160
JSW Steel Limited | Integrated Report 2017-18
Sl. No.
Name of the Company Address of the Company CIN/GLN % of Shares held
41 Hasaud Steel Limited Grand Palladium, 6th Floor, 175, CST Road, Santacruz East, Mumbai - 400 098
U27209MH2018PLC305033 100%
42 Creixent Special Steel Limited QR No. 50-51,Park Avenue colony, Jindal Road, Dhimrapur, Raigarh, Chattisgarh 496 001
U27209OCT2018PLC008397 100%
43 Milloret Steel Limited QR No. 50-51,Park Avenue colony, Jindal Road, Dhimrapur, Raigarh, Chattisgarh 496 001
U2732OCT2018PLC008414 100%
Associates [Applicable Section 2(6)]
44 Dolvi Mineral & Metals Pvt. Ltd. JSW Centre, Bandra Kurla Complex, Bandra (E), Mumbai - 400 051
U51900MH2014PTC257483 39.996%
45 Dolvi Coke Projects Limited JSW Centre, Bandra Kurla Complex, Bandra (E), Mumbai - 400 051
U23209MH2014PLC254395 39.996%
IV. SHARE HOLDING PATTERN (EQUITY SHARE CAPITAL BREAKUP AS PERCENTAGE OF TOTAL EQUITY):1. Category-wise Share Holding: -
Category Code
Category of Shareholder
No. of Shares held at the beginning of the year 01.04.2017
No. of Shares held at the end of the year 31.03.2018
% Change during
the yearDemat Physical Total % of
total Shares
Demat Physical Total % of total
Shares
(I) (II) (III) (IV) (V) (VI) (VII) (VIII) (IX) (X) (XI)
(A) PROMOTER AND PROMOTER GROUP(1) INDIAN
(a) Individual /HUF 14504770 0 14504770 0.60 14510770 0 14510770 0.60 0.00
(b)Central Government/State Government(s)
9079520 0 9079520 0.38 9079520 0 9079520 0.38 0.00
(c) Bodies Corporate 932496350 0 932496350 38.58 935543350 0 935543350 38.70 0.12
(d)Financial Institutions / Banks
0 0 0 0.00 0 0 0 0.00 0.00
(e) Others 0 0 0 0.00 600 0 600 0.00 0.00
Sub-Total A(1): 956080640 0 956080640 39.55 959134240 0 959134240 39.68 0.13
(2) FOREIGN
(a)Individuals (NRIs/Foreign Individuals)
0 0 0 0.00 0 0 0 0.00 0.00
(b) Bodies Corporate 50021540 0 50021540 2.07 50021540 0 50021540 2.07 0.00
(c) Institutions 0 0 0 0.00 0 0 0 0.00 0.00
(d)Qualified Foreign Investor
0 0 0 0.00 0 0 0 0.00 0.00
(e) Others 0 0 0 0.00 0 0 0 0.00 0.00
Sub-Total A(2): 50021540 0 50021540 2.07 50021540 0 50021540 2.07 0.00
Total A=A(1)+A(2) 1006102180 0 1006102180 41.62 1009155780 0 1009155780 41.75 0.13
(B) PUBLIC SHAREHOLDING(1) INSTITUTIONS
(a) Mutual Funds /UTI 25629576 197670 25827246 1.07 58424736 152510 58577246 2.42 1.35
(b) Financial Institutions /Banks
7676928 25800 7702728 0.32 8592447 17650 8610097 0.36 0.04
(c) Central Government / State Government(s)
12375000 0 12375000 0.51 12375000 0 12375000 0.51 0.00
(d) Venture Capital Funds 0 0 0 0.00 0 0 0 0.00 0.00
(e) Insurance Companies 0 0 0 0.00 0 0 0 0.00 0.00
(f) Foreign Institutional Investors
482231835 117130 482348965 19.95 479964786 97750 480062536 19.86 -0.09
(g) Foreign Venture Capital Investors
0 0 0 0.00 0 0 0 0.00 0.00

161
Better Everyday. In Pursuit of Excellence. Corporate Overview Statutory Reports Financial Statements
Category Code
Category of Shareholder
No. of Shares held at the beginning of the year 01.04.2017
No. of Shares held at the end of the year 31.03.2018
% Change during
the yearDemat Physical Total % of
total Shares
Demat Physical Total % of total
Shares
(I) (II) (III) (IV) (V) (VI) (VII) (VIII) (IX) (X) (XI)
(h) Qualified Foreign Investor
0 0 0 0.00 0 0 0 0.00 0.00
(i) Others 0 0 0 0.00 0 0 0 0.00 0.00
Sub-Total B(1): 527913339 340600 528253939 21.85 559356969 267910 559624879 23.15 1.30
(2) NON-INSTITUTIONS
(a) Bodies Corporate 191850453 7315380 199165833 8.24 188421487 4993500 193414987 8.00 -0.24
(b) Individuals
(i) Individuals holding nominal share capital upto ` 2 lakh
97362861 27950380 125313241 5.18 94081643 19811708 113893351 4.71 -0.47
(ii) Individuals holding nominal share capital in excess of ` 2 lakh
149198809 0 149198809 6.17 124346201 0 124346201 5.14 -1.03
(c) Others
Employees Welfare Trust
0 40 40 0.00 0 0 0 0.00 0.00
Foreign Bodies Corporates
362583070 1660 362584730 15.00 362583070 1660 362584730 15.00 0.00
I E P F 0 0 0 0.00 12027406 0 12027406 0.50 0.50
Non Resident Indians 27028122 4261880 31290002 1.29 25241320 3530120 28771440 1.19 -0.10
Nri Non-Repatriation 878916 0 878916 0.04 2089524 0 2089524 0.09 0.05Overseas Corporate Bodies
0 10660 10660 0.00 0 9660 9660 0.00 0.00
Trusts 14235750 0 14235750 0.59 10988860 0 10988860 0.45 -0.14
Trusts 186120 220 186340 0.01 313622 0 313622 0.01 0.01
(d) Qualified Foreign Investor
0 0 0 0.00 0 0 0 0.00 0.00
Sub-Total B(2): 843324101 39540220 882864321 36.52 820093133 28346648 848439781 35.10 -1.42
Total B=B(1)+B(2): 1371237440 39880820 1411118260 58.38 1379450102 28614558 1408064660 58.25 -0.13
Total (A+B): 2377339620 39880820 2417220440 100.00 2388605882 28614558 2417220440 100.00 0.00
(C) SHARES HELD BY CUSTODIANS, AGAINST WHICH DEPOSITORY RECEIPTS HAVE BEEN ISSUED(1) Promoter and Promoter
Group0 0 0 0.00 0 0 0 0.00 0.00
(2) Public 0 0 0 0.00 0 0 0 0.00 0.00
GRAND TOTAL (A+B+C): 2377339620 39880820 2417220440 100.00 2388605882 28614558 2417220440 100.00 0.00

162
JSW Steel Limited | Integrated Report 2017-18
2. Shareholding of Promoters and Promoter Group:
Sl. No.
Name of the Share Holder Shareholding at the beginning of the Year 01.04.2017
Shareholding at the end of the Year 31.03.2018
% change in shareholding
No. of Shares held as on 01.04.2017
% of total Shares
of the Company
% of Shares pledged/
encumbered to total shares
No. of Shares held as on 31.03.2018
% of total Shares
of the Company
% of Shares pledged/
encumbered to total shares
1. JSW Techno Projects Management Limited
229326950 9.49 67.94 229326950 9.49 55.99 0.00
2. Jsw Holdings Limited 175794230 7.27 62.33 177306230 7.34 50.77 0.06
3. Vividh Finvest Private Limited 139866690 5.79 56.14 140726690 5.82 62.85 0.04
4. Sahyog Holdings Private Limited
109922360 4.55 43.56 110597360 4.58 55.95 0.03
5. JSW Power Trading Company Limited
70038350 2.90 0.00 70038350 2.90 12.79 0.00
6. Danta Enterprises Private Limited
60368250 2.50 63.70 60368250 2.50 70.23 0.00
7. Virtuous Tradecorp Private Limited
60368250 2.50 9.77 60368250 2.50 20.41 0.00
8. Nalwa Sons Investments Limited
45486370 1.88 0.00 45486370 1.88 0.00 0.00
9. Jsl Overseas Limited 21026090 0.87 0.00 21026090 0.87 0.00 0.00
10. Glebe Trading Private Limited 17157930 0.71 88.84 17157930 0.71 74.07 0.00
11. Jsw Logistics Infrastructure Private Limited
17125770 0.71 0.00 17125770 0.71 0.00 0.00
12. Beaufield Holdings Limited 16409910 0.68 0.00 16409910 0.68 0.00 0.00
13. Karnataka State Industrial And Infrastructure Development Corporation
9079520 0.38 0.00 9079520 0.38 0.00 0.00
14. Siddeshwari Tradex Private Limited
7024580 0.29 0.00 7024580 0.29 0.00 0.00
15. Mendeza Holdings Limited 4218090 0.17 0.00 4218090 0.17 0.00 0.00
16. Nacho Investments Limited 4207380 0.17 0.00 4207380 0.17 0.00 0.0017. Estrela Investment Company
Limited4160070 0.17 0.00 4160070 0.17 0.00 0.00
18. Parth Jindal 3500000 0.14 0.00 3500000 0.14 0.00 0.00
19. Tanvi Shete 3500000 0.14 0.00 3500000 0.14 0.00 0.00
20. Tarini Jindal Handa 3500000 0.14 39.03 3500000 0.14 45.63 0.00
21. Tarini Jindal Handa 1413890 0.06 0.00 1413890 0.06 0.00 0.00
22. Tanvi Shete 1383630 0.06 0.00 1383630 0.06 0.00 0.00
23. Urmila Bhuwalka 250000 0.01 100.00 260000 0.01 96.15 0.00
24. Arti Jindal 227550 0.01 0.00 227550 0.01 0.00 0.00
25. Deepika Jindal 0 0.00 0.00 148650 0.01 0.00 0.01
26. Nirmala Goyal 0 0.00 0.00 120000 0.00 0.00 0.00
27. Prithvi Raj Jindal 84580 0.00 0.00 84580 0.00 0.00 0.00
28. Savitri Devi Jindal 75300 0.00 0.00 75300 0.00 0.00 0.00
29. S K Jindal And Sons Huf. 58000 0.00 0.00 58000 0.00 0.00 0.00
30. Sminu Jindal 55970 0.00 0.00 55970 0.00 0.00 0.00
31. Tripti Jindal 50660 0.00 0.00 50660 0.00 0.00 0.00
32. P R Jindal Huf. 45550 0.00 0.00 45550 0.00 0.00 0.00
33. Naveen Jindal 27790 0.00 0.00 27790 0.00 0.00 0.00
34. Naveen Jindal 27200 0.00 0.00 27200 0.00 0.00 0.00
35. Parth Jindal 20000 0.00 0.00 20000 0.00 0.00 0.00
36. Hexa Tradex Limited 13620 0.00 0.00 13620 0.00 0.00 0.00
37. Aiyush Bhuwalka 14000 0.00 100.00 10000 0.00 0.00 0.00
38. Sangita Jindal 1000 0.00 0.00 1000 0.00 0.00 0.00
39. Reynold Traders Private Limited
1000 0.00 0.00 1000 0.00 0.00 0.00
40. Jsw Investments Private Limited
1000 0.00 0.00 1000 0.00 0.00 0.00

163
Better Everyday. In Pursuit of Excellence. Corporate Overview Statutory Reports Financial Statements
Sl. No.
Name of the Share Holder Shareholding at the beginning of the Year 01.04.2017
Shareholding at the end of the Year 31.03.2018
% change in shareholding
No. of Shares held as on 01.04.2017
% of total Shares
of the Company
% of Shares pledged/
encumbered to total shares
No. of Shares held as on 31.03.2018
% of total Shares
of the Company
% of Shares pledged/
encumbered to total shares
41. JSW Projects Limited 1000 0.00 0.00 1000 0.00 0.00 0.00
42. Sajjan Jindal 1000 0.00 0.00 1000 0.00 0.00 0.00
43. Tanvi Jindal Family Trust 0 0.00 0.00 100 0.00 0.00 0.00
44. Tarini Jindal Family Trust 0 0.00 0.00 100 0.00 0.00 0.00
45. Parth Jindal Family Trust 0 0.00 0.00 100 0.00 0.00 0.00
46. Sajjan Jindal Family Trust 0 0.00 0.00 100 0.00 0.00 0.00
47. Sangita Jindal Family Trust 0 0.00 0.00 100 0.00 0.00 0.00
48. Sajjan Jindal Lineage Trust 0 0.00 0.00 100 0.00 0.00 0.00
49. Nirmala Goyal 120000 0.00 0.00 0 0.00 0.00 0.00
50. R K Jindal & Sons Huf. 148650 0.01 0.00 0 0.00 0.00 -0.01
Total 1006102180 41.62 1009155780 41.75 0.13

164
JSW Steel Limited | Integrated Report 2017-18
3. Change in Promoters & Promoter Group Shareholding (please specify, if there is no change)
Sl. No.
Name of the Share Holder
Shareholding at the beginning of the year
Cumulative shareholding
during the year
REMARKS
No. of Shares
held as on 01.04.2017
% of total shares of the
Company
No. of Shares held as on 31.03.2018
% of total shares of the
Company
Date Sold Purchased No. of Shares at the end of
the year
1 JSW Techno Projects Management Ltd
229326950 9.49 229326950 9.49 01.04.2017 0 0 229326950
31.03.2018 0 0 229326950
2 JSW Holdings Limited 175794230 7.27 177306230 7.34 01.04.2017 0 0 175794230
10.11.2017 0 384980 176179210
17.11.2017 0 785020 176964230
24.11.2017 0 342000 177306230
31.03.2018 0 0 177306230
3 Vividh Finvest Private Limited
139866690 5.79 140726690 5.82 01.04.2017 0 0 139866690
09.03.2018 0 600000 140466690
16.03.2018 0 260000 140726690
31.03.2018 0 0 140726690
4 Sahyog Holdings Private Limited
109922360 4.55 110597360 4.58 01.04.2017 0 0 109922360
02.03.2018 0 200000 110122360
09.03.2018 0 475000 110597360
31.03.2018 0 0 110597360
5 JSW Power Trading Company Limited
70038350 2.90 70038350 2.90 01.04.2017 0 0 70038350
31.03.2018 0 0 70038350
6 Danta Enterprises Private Limited
60368250 2.50 60368250 2.50 01.04.2017 0 0 60368250
31.03.2018 0 0 60368250
7 Virtuous Tradecorp Private Limited
60368250 2.50 60368250 2.50 01.04.2017 0 0 60368250
31.03.2018 0 0 60368250
8 Nalwa Sons Investments Ltd
45486370 1.88 45486370 1.88 01.04.2017 0 0 45486370
31.03.2018 0 0 45486370
9 JSL Overseas Limited 21026090 0.87 21026090 0.87 01.04.2017 0 0 21026090
31.03.2018 0 0 21026090
10 Glebe Trading Private Limited
17157930 0.71 17157930 0.71 01.04.2017 0 0 17157930
31.03.2018 0 0 17157930
11 JSW Logistics Infrastructure Private Limited
17125770 0.71 17125770 0.71 01.04.2017 0 0 17125770
31.03.2018 0 0 17125770
12 Beaufield Holdings Limited
16409910 0.68 16409910 0.68 01.04.2017 0 0 16409910
31.03.2018 0 0 16409910
13 Karnataka State Industrial And Infrastructure Development Corprn
9079520 0.38 9079520 0.38 01.04.2017 0 0 9079520
31.03.2018 0 0 9079520
14 Siddeshwari Tradex Private Limited
7024580 0.29 7024580 0.29 01.04.2017 0 0 7024580
31.03.2018 0 0 7024580
15 Mendeza Holdings Limited
4218090 0.17 4218090 0.17 01.04.2017 0 0 4218090
31.03.2018 0 0 4218090
16 Nacho Investments Limited
4207380 0.17 4207380 0.17 01.04.2017 0 0 4207380
31.03.2018 0 0 4207380
17 Estrela Investment Company Limited
4160070 0.17 4160070 0.17 01.04.2017 0 0 4160070
31.03.2018 0 0 4160070

165
Better Everyday. In Pursuit of Excellence. Corporate Overview Statutory Reports Financial Statements
Sl. No.
Name of the Share Holder
Shareholding at the beginning of the year
Cumulative shareholding
during the year
REMARKS
No. of Shares
held as on 01.04.2017
% of total shares of the
Company
No. of Shares held as on 31.03.2018
% of total shares of the
Company
Date Sold Purchased No. of Shares at the end of
the year
18 Parth Jindal 3500000 0.14 3500000 0.14 01.04.2017 0 0 3500000
31.03.2018 0 0 3500000
19 Tanvi Shete 3500000 0.14 3500000 0.14 01.04.2017 0 0 3500000
31.03.2018 0 0 3500000
20 Tarini Jindal Handa 3500000 0.14 3500000 0.14 01.04.2017 0 0 3500000
31.03.2018 0 0 3500000
21 Tarini Jindal Handa 1413890 0.06 1413890 0.06 01.04.2017 0 0 1413890
31.03.2018 0 0 1413890
22 Tanvi Shete 1383630 0.06 1383630 0.06 01.04.2017 0 0 1383630
31.03.2018 0 0 1383630
23 Urmila Bhuwalka 250000 0.01 260000 0.01 01.04.2017 0 0 250000
06.10.2017 0 10000 260000
31.03.2018 0 0 260000
24 Arti Jindal 227550 0.01 227550 0.01 01.04.2017 0 0 227550
31.03.2018 0 0 227550
25 Deepika Jindal 0 0.00 148650 0.01 31.03.2017 0 0 0
02.06.2017 0 148650 148650
31.03.2018 0 0 148650
26 Nirmala Goyal 12000 0.00 120000 0.00 31.03.2017 0 0 12000
31.03.2018 0 0 120000
27 Prithvi Raj Jindal 84580 0.00 84580 0.00 01.04.2017 0 0 84580
31.03.2018 0 0 84580
28 Savitri Devi Jindal 75300 0.00 75300 0.00 01.04.2017 0 0 75300
31.03.2018 0 0 75300
29 S K Jindal And Sons Huf.
58000 0.00 58000 0.00 01.04.2017 0 0 58000
31.03.2018 0 0 58000
30 Sminu Jindal 55970 0.00 55970 0.00 01.04.2017 0 0 55970
31.03.2018 0 0 55970
31 Tripti Jindal 50660 0.00 50660 0.00 01.04.2017 0 0 50660
31.03.2018 0 0 50660
32 P R Jindal Huf. 45550 0.00 45550 0.00 01.04.2017 0 0 45550
31.03.2018 0 0 45550
33 Naveen Jindal 27790 0.00 27790 0.00 01.04.2017 0 0 27790
31.03.2018 0 0 27790
34 Naveen Jindal 27200 0.00 27200 0.00 01.04.2017 0 0 27200
31.03.2018 0 0 27200
35 Parth Jindal 20000 0.00 20000 0.00 01.04.2017 0 0 20000
31.03.2018 0 0 20000
36 Hexa Tradex Limited 13620 0.00 13620 0.00 01.04.2017 0 0 13620
31.03.2018 0 0 13620
37 Aiyush Bhuwalka 14000 0.00 10000 0.00 01.04.2017 0 0 10000
31.03.2018 0 0 10000
38 Sangita Jindal 1000 0.00 1000 0.00 01.04.2017 0 0 1000
31.03.2018 0 0 1000
39 Reynold Traders Private Limited
1000 0.00 1000 0.00 01.04.2017 0 0 1000
31.03.2018 0 0 1000

166
JSW Steel Limited | Integrated Report 2017-18
Sl. No.
Name of the Share Holder
Shareholding at the beginning of the year
Cumulative shareholding
during the year
REMARKS
No. of Shares
held as on 01.04.2017
% of total shares of the
Company
No. of Shares held as on 31.03.2018
% of total shares of the
Company
Date Sold Purchased No. of Shares at the end of
the year
40 JSW Investments Private Limited
1000 0.00 1000 0.00 01.04.2017 0 0 1000
31.03.2018 0 0 1000
41 JSW Projects Limited 1000 0.00 1000 0.00 01.04.2017 0 0 1000
31.03.2018 0 0 1000
42 Sajjan Jindal 1000 0.00 1000 0.00 01.04.2017 0 0 1000
31.03.2018 0 0 1000
43 Sajjan Jindal Family Trust
0 0.00 100 0.00 01.04.2017 0 0 100
31.03.2018 0 0 100
44 Sajjan Jindal Lineage Trust
0 0.00 100 0.00 01.04.2017 0 0 100
31.03.2018 0 0 100
45 Sangita Jindal Family Trust
0 0.00 100 0.00 01.04.2017 0 0 100
31.03.2018 0 0 100
46 Tarini Jindal Family Trust
0 0.00 100 0.00 01.04.2017 0 0 100
31.03.2018 0 0 100
47 Tanvi Jindal Family Trust
0 0.00 100 0.00 01.04.2017 0 0 100
31.03.2018 0 0 100
48 Parth Jindal Family Trust
0 0.00 100 0.00 01.04.2017 0 0 100
31.03.2018 0 0 100
49 R K Jindal & Sons Huf. 148650 0.01 0 0.00 31.03.2017 0 0 148650
02.06.2017 148650 0 0
31.03.2018 0 0 0
4. Shareholding Pattern of top ten Shareholders: (other than Directors, Promoters and Holders of GDRs and ADRs):
Sl. No.
Name of the Share Holder
Shareholding at the beginning of the year
Cumulative shareholding during
the year
Date During the year No. of Shares at the end of the
yearNo. of
Shares held as on 01.04.2017
% of total Shares
of the Company
No. of Shares
held as on 31/03/2018
% of Total Shares
of the Company
Sold Purchased
1 JFE Steel International Europe B.V.
362583070 15.00 362583070 15.00 01.04.2017 0 0 362583070
31.03.2018 0 0 362583070
2 Gagandeep Credit Capital Pvt. Ltd.
45982650 1.90 45982650 1.90 01.04.2017 0 0 45982650
31.03.2018 0 0 45982650
3 Lotus Global Investments Ltd.
41709650 1.73 41709650 1.73 01.04.2017 0 0 41709650
31.03.2018 0 0 41709650
4 Apms Investment Fund Ltd.
36885000 1.53 36885000 1.53 01.04.2017 0 0 36885000
31.03.2018 0 0 36885000
5 The Indiaman Fund (Mauritius) Limited
30512216 1.26 30772853 1.27 01.04.2017 0 0 30512216
28.04.2017 0 80000 30592216
26.05.2017 0 25000 30617216
03.11.2017 0 26000 30643216
10.11.2017 0 43383 30686599
17.11.2017 0 63401 30750000
08.12.2017 0 11000 30761000
19.01.2018 0 11853 30772853
31.03.2018 0 0 30772853
6 Shamyak Investment Private Limited
25333230 1.05 25333230 1.05 01.04.2017 0 0 25333230
31.03.2018 0 0 25333230

167
Better Everyday. In Pursuit of Excellence. Corporate Overview Statutory Reports Financial Statements
Sl. No.
Name of the Share Holder
Shareholding at the beginning of the year
Cumulative shareholding during
the year
Date During the year No. of Shares at the end of the
yearNo. of
Shares held as on 01.04.2017
% of total Shares
of the Company
No. of Shares
held as on 31/03/2018
% of Total Shares
of the Company
Sold Purchased
7 Nemish S Shah 23943930 0.99 23943930 0.99 01.04.2017 0 0 23943930
31.03.2018 0 0 23943930
8 Enam Securities Pvt. Ltd.
21725450 0.90 20847750 0.86 01.04.2017 0 0 21725450
28.04.2017 0 2327300 24052750
31.10.2017 1000000 0 23052750
30.03.2018 2205000 0 20847750
31.03.2018 0 0 20847750
9 Vanguard Emerging Markets Stock Index Fund
0 0.00 20438562 0.85 01.04.2017 0 0 0
23.03.2018 0 20530312 20530312
30.03.2018 91750 0 20438562
31.03.2018 0 0 20438562
10 Hypnos Fund Limited
19810000 0.82 19810000 0.82 01.04.2017 0 0 19810000
31.03.2018 0 0 19810000
5. Shareholding of Directors and Key Managerial Personnel:
Sl. No.
Name of the Directors and KMP Shareholding at the beginning of the year 01.04.2017
Cumulative Shareholding during the year 31.03.2018
No. of shares % of total shares of the
Company
No. of shares % of total shares of the
Company
1 Mr. Sajjan Jindal, Chairman & Managing Director 1000 0.00 1000 0.00
2 Mr. Seshagiri Rao M.V.S, Jt. Managing Director & Group CFO 223200 0.01 223200 0.01
3 Dr. Vinod Nowal, Dy. Managing Director 90730 0.00 120560 0.00
4 Mr. Jayant Acharya, Director (Commercial & Marketing) 112060 0.00 112060 0.00
5 Dr. Vijay Kelkar, Director Nil Nil Nil Nil
6 Dr. Malay Mukherjee Nil Nil Nil Nil
7 Mr. K. Vijayaraghavan Nil Nil Nil Nil
8 Mr. Seturaman Mahalingam Nil Nil Nil Nil
9 Mr. Hiroyuki Ogawa, Nominee Director (JFE Steel Corpn) Nil Nil Nil Nil
10 Dr. (Mrs.) Punita Kumar Sinha Nil Nil Nil Nil
11 Mr. N. Jayaram, IAS, Nominee Director (KSIIDC) Nil Nil Nil Nil
12 Mr. Haigreve Khaitan Nil Nil Nil Nil
13 Mr. Rajeev Pai, Chief Financial Officer Nil Nil Nil Nil
14 Mr. Lancy Varghese, Company Secretary Nil Nil Nil Nil

168
JSW Steel Limited | Integrated Report 2017-18
V. INDEBTEDNESS
Indebtedness of the Company including interest outstanding/accrued but not due for payment:- (` in crores)
Secured Loans excluding deposits
Unsecured Loans
Deposits Total Indebtedness
Indebtedness at the beginning of the financial year
i) Principal Amount 16,382 21,893 - 38,274
ii) Interest due but not paid - - - -
iii) Interest accrued but not due 138 214 - 352
Total (i + ii + iii) 16,520 22,107 - 38,626
Change in indebtedness during the financial year
* Addition 1,182 28,149 - 29,331
* Reduction 2,587 28,946 - 31,537
NET CHANGE -1,405 -797 - -2,202
Indebtedness at the end the financial year
i) Principal Amount 14,977 21,204 - 36,181
ii) Interest due but not paid - - - -
iii) Interest accrued but not due 114 207 - 321
Total (i + ii + iii) 15,091 21,411 - 36,502
VI. REMUNERATION OF DIRECTORS AND KEY MANAGERIAL PERSONNELA. Remuneration to Managing Director, Whole-time Directors and/or Manager:
(` in crores)
Sl. No.
Particulars of Remuneration Name of MD/ WTD/ Manager Total Amount
Mr. Sajjan Jindal
Mr. Seshagiri Rao
Dr. Vinod Nowal
Mr. Jayant Acharya
1 Gross salary
(a) Salary as per provisions contained in Section 17(1) of the Income-tax Act, 1961
9.89 4.85 3.57 3.04 21.35
(b) Value of perquisites u/s 17(2) Income-tax Act, 1961
1.18 0.22 0.17 0.15 1.72
(c) Profits in lieu of salary under Section 17(3) Income- tax Act, 1961
2 Stock Option -- 15.88 8.40 7.56 31.84
3 Sweat Equity
4 Commission - as % of profit
37.67
--
--
--
37.67
5 Others, please specify -- -- -- -- --
Total (A) 48.74 20.95 12.14 10.75 92.58
Ceiling as per the Act (@10% of profits calculated under Section 198 of the Companies Act, 2013) 753.41

169
Better Everyday. In Pursuit of Excellence. Corporate Overview Statutory Reports Financial Statements
B.
Rem
uner
atio
n to
oth
er d
irec
tors
: `
In L
akh
s
Sl.
No.
Part
icul
ars
of R
emun
erat
ion
Mr.
K.
Vija
yara
ghav
anD
r. Vi
jay
Kelk
arM
r. M
alay
M
ukhe
rjee
Mr.
Set
uram
an
Mah
alin
gam
Dr.
(Mrs
) P
unit
a Ku
mar
Sin
haM
r. H
aigr
eve
Khai
tan
Mr.
Uda
y C
hita
le *
Tota
l Am
ount
12
34
56
7
1In
dep
end
ent
Dir
ecto
rs
Fee
for a
tten
din
g B
oard
Com
mit
tee
mee
tin
gs
6.0
01.
60
5.0
04
.60
3.8
00
.80
0.0
02
1.8
0
Com
mis
sion
44
.00
43
.00
43
.50
41.
90
43
.00
39
.00
1.6
02
56
.00
Oth
ers,
ple
ase
spec
ify
Tota
l (1)
50
.00
44
.60
48
.50
46
.50
46
.80
39
.80
1.6
027
7.8
0
Mr.
Nav
een
Raj
Sin
gh/M
rs. P
. H
emal
atha
/Mr.
N.
Jaya
ram
(KS
IIDC
N
omin
ee)
Mr.
Hir
oyuk
i O
gaw
a/M
r. Ky
oich
i Ka
mey
ama/
M
r. H
irom
u O
ka
(JFE
Nom
inee
)
Tota
l Am
ount
2O
ther
Non
-Exe
cuti
ve D
irec
tors
Fee
for a
tten
din
g B
oard
Com
mit
tee
mee
tin
gs
0.2
02
.20
2.4
0
Com
mis
sion
31.
96
43
.00
74.9
6
Oth
ers,
ple
ase
spec
ify
Tota
l (2
)3
2.1
64
5.2
077
.36
Tota
l (B
)=(1
+2)
35
5.1
6
Tota
l Man
ager
ial R
emu
ner
atio
n (E
xclu
din
g S
itti
ng
Fee
s) -
` in
lakh
s (A
+ B
)9
5.8
9 c
rore
s
Ove
rall
Cei
ling
as
per
th
e Ac
t (@
11%
of
pro
fits
cal
cula
ted
un
der
Sec
tion
19
8 o
f th
e C
omp
anie
s Ac
t, 2
013
)
82
8.7
5 c
rore
s
*re
tire
d a
s In
dep
end
ent
Dir
ecto
r w.e
.f. 2
6.0
7.2
016

170
JSW Steel Limited | Integrated Report 2017-18
C. REMUNERATION TO KEY MANAGERIAL PERSONNEL OTHER THAN MD/ MANAGER/ WTD` In Crores
Sl. No.
Particulars of Remuneration Key Managerial Personnel
CS CFO Total
1 Gross salary(a) Salary as per provisions contained in Section 17(1) of the Income-tax
Act, 19610.66 1.60 2.26
(b) Value of perquisites u/s 17(2) Income-tax Act, 1961 0.02 0.09 0.11
(c) Profits in lieu of salary under Section 17(3) Income-tax Act, 1961
2 Stock Option -- -- --
3 Sweat Equity -- -- --
4 Commission
- as % of profit -- -- --
Total 0.68 1.69 2.37
VII. PENALTIES/ PUNISHMENT/ COMPOUNDING OF OFFENCES:Type Section of the
Companies ActBrief Description
Details of Penalty/ Punishment/ Compounding fees imposed
Authority [RD/ NCLT/ COURT]
Appeal made, if any (give Details)
A. COMPANY
Penalty
NIL Punishment
Compounding
B. DIRECTORS
Penalty
NIL Punishment
Compounding
C. OTHER OFFICERS IN DEFAULT
Penalty
NIL Punishment
Compounding

171
Better Everyday. In Pursuit of Excellence. Corporate Overview Statutory Reports Financial Statements
FORM NO.MR-3
SECRETARIAL AUDIT REPORTFOR THE FINANCIAL YEAR ENDED 31 March 2018
[Pursuant to Section 204(1) of the Companies Act, 2013 and Rule No.9 of the Companies (Appointment and Remuneration of Managerial Personnel) Rules, 2014]
To,The Members,JSW STEEL LIMITEDJSW Centre, Bandra-Kurla Complex,Bandra (East), Mumbai,Maharashtra - 400051
Annexure – C to Directors’ Report
We have conducted the Secretarial Audit of the compliance of applicable statutory provisions and the adherence to good corporate practices by JSW STEEL LIMITED bearing CIN:L27102MH1994PLC152925 (hereinafter called the Company). The Secretarial Audit was conducted in a manner that provided us a reasonable basis for evaluating the corporate conducts/statutory compliances and expressing my opinion thereon.
Based on our verification of the Company’s books, papers, minute books, forms and returns filed and other records maintained by the Company and also the information provided by the Company, its officers, agents and authorised representatives during the conduct of Secretarial Audit, We hereby report that in my opinion, the Company has, during the audit period covering the financial year ended on 31 March 2018 complied with the statutory provisions listed hereunder and also that the Company has proper Board-processes and compliance-mechanism in place to the extent, in the manner and subject to the reporting made hereinafter:
We have examined the books, papers, minute books, forms and returns filed and other records maintained by Company for the financial year ended on 31 March 2018 according to the provisions of:
i. The Companies Act, 2013 (the Act) and the rules made thereunder;
ii. The Securities Contract (Regulation) Act, 1956 (‘SCRA’) and the rules made thereunder;
iii. The Depositories Act, 1996 and the Regulations and Bye-laws framed thereunder;
iv. Foreign Exchange Management Act, 1999 and the rules and regulations made thereunder to the extent of Foreign Direct Investment, Overseas Direct Investment and External Commercial Borrowings;
v. The Regulations prescribed under the Securities and Exchange Board of India Act,1992 (‘SEBI Act’) as appropriately applicable for the period under review:
a) The Securities and Exchange Board of India (Substantial Acquisition of Shares and Takeovers) Regulations, 2011;
b) The Securities and Exchange Board of India (Prohibition of Insider Trading) Regulations, 2015;
c) The Securities and Exchange Board of India (Issue of Capital and Disclosure Requirements) Regulations, 2009;
d) Securities Exchange Board of India (Share Based Employee benefits) Regulations, 2014;
e) The Securities and Exchange Board of India (Issue and Listing of Debt Securities) Regulations, 2008;
f) The Securities and Exchange Board of India (Registrars to an Issue and Share Transfer Agents) Regulations, 1993 regarding the Companies Act and dealing with client;
g) The Securities and Exchange Board of India (Delisting of Equity Shares) Regulations, 2009;
h) The Securities and Exchange Board of India (Buyback of Securities) Regulations, 1998; and
vi. All other relevant applicable laws including those specifically applicable to the Company, a list of which has been provided by the management. The examination and reporting of these laws and rules are limited to whether there are adequate systems and processes in place to monitor and ensure compliance with those laws

172
JSW Steel Limited | Integrated Report 2017-18
We have also examined compliance with the applicable clauses of the following:
Secretarial Standards
The Secretarial Standards SS-1, SS-2 and SS-3 issued and notified by the Institute of Company Secretaries of India has been generally complied with by the Company during the financial year under review;
SEBI (Listing Obligations and Disclosure Requirements) Regulations, 2015
The Company has complied with the applicable clauses of the listing agreement entered by it with the Bombay Stock Exchange (BSE) and the National Stock Exchange (NSE) of India as also with the applicable clauses of the Securities and Exchange Board of India (Listing Obligations and Disclosures Requirements) Regulations, 2015.
During the period under review the Company has complied with the provisions of the Act, Rules, Regulations, Standards, etc. mentioned above subject to the following observation:
The Hon’ble Adjudicating Officer of the Securities and Exchange Board of India had passed an order dated 31 August 2017 (the 'Order') against the Company imposing a penalty of ` 2,50,000 (Rupees Two Lakh Fifty Thousand) for non-redressal of an investor grievance in a speedy manner. An appeal before the SEBI Appellate Tribunal (SAT) against the above mentioned order was filed by the Company on 16 October 2017. The Company without any admission of guilt/ wrongdoing on its part of violation of Circular No. CIR/OIAE/1/2014, dated 18 December 2014, also filed an application under the SEBI (Settlement of Administrative and Civil Proceedings) Regulations for settling the order of the Adjudicating Officer, SEBI dated 31 August 2017, by agreeing to pay an amount of ` 2,75,000 as settlement amount and ` 56,750/- (Rupees Fifty Six Thousand Seven Hundred and Fifty Only) as legal charges in the matter. SEBI has in principle agreed to accept the terms of the settlement. The Company has paid the settlement amount. Pursuant to the acceptance of the Company’s settlement application by SEBI, SAT has disposed of the Company’s appeal.
We further report that,
The Board of Directors of the Company is duly constituted with proper balance of Executive Directors, Non-Executive Directors and Independent Directors. The changes in the composition of the Board of Directors that took place during the period under review were carried out in compliance with the provisions of the Act.
Adequate notice is given to all Directors to schedule the Board Meetings, agenda and detailed notes on agenda were sent atleast seven days in advance, and a system exists for
seeking and obtaining further information and clarifications on the agenda items before the meeting and for meaningful participation at the meeting.
Majority decision has been carried through in the Board Meetings while there were no dissenting members’ views.
We further report that, there are adequate systems and processes in the Company commensurate with its size and operations to monitor and ensure compliance with applicable laws, rules, regulations and guidelines.
We further report that, during the audit period, except the events listed below no other events occurred which had any major bearing on the Company’s affairs in pursuance of the above referred laws, rules, regulations, guidelines, and standards and that the Company has complied with such of those relevant clauses thereto which are applicable:
The Company has fully redeemed the following Non-Convertible Debentures during the period under review -
1. 1750 10.40% secured Non-Convertible Debentures of ` 10,00,000 each
2. 5000 10.20% secured Non-Convertible Debentures of ` 10,00,000 each
3. 2000 10.20% secured Non-Convertible Debentures of ` 10,00,000 each
4. 3000 9.62% secured Non-Convertible Debentures of ` 10,00,000 each
5. 5,000 10.25% secured Non-Convertible Debentures of ` 10,00,000 each
6. 5000 10.10% secured Non-Convertible Debentures of ` 10,00,000 each
The Company has also partly redeemed 10% Cumulative Redeemable Preference Shares of face value of ` 10/- each to the extent of ` 139,51,74,535/- (` 69,75,87,267.5 + ` 69,75,87,267.5) being part redemption amount carrying a face value of ` 5/- per share leaving the face value of share post redemption as ` 5/-.
The Company entered into a Stock Purchase Agreement dated 28.03.2018 with JSM International Limited, Acero Junction Holdings Inc., Acero Junction Inc. for acquisition of 100% shares of Acero Junction Holdings Inc., a Delaware Corporation, for a cash consideration of US$80.85 million.
The Company has launched a new product namely JSW Everglow which aims to provide beautiful and innovative roofing and wall solutions for modern India.

173
Better Everyday. In Pursuit of Excellence. Corporate Overview Statutory Reports Financial Statements
The Company has raised US$500 million by allotment of fixed rate senior unsecured notes ('Notes') in accordance with regulation S of the U.S. Securities Act, 1933 and applicable Indian regulations.
The Company has obtained all the required clearances and obtained final commencement letter from the Govt. of Karnataka, Department of mines and Geology on 10.02.2018 for starting of operations in respect of one of the mines. Based on this letter, mining operations were started on 11.02.2018 in Tunga mines (ML No. 0004) which is of capacity 0.3 MTPA.
The Company has incorporated the following wholly owned subsidiaries during the year under review:
a) JSW Utkal Steel Limited b) Hasaud Steel Ltd. c) Creixent Special Steels Limited d) Milloret Steel Limited
For Company Secretaries
Place: MumbaiDate: 16 May 2018
S. SrinivasanSenior Partner
FCS: 2286CP. No. 748
This report is to be read with our letter of even date which is annexed and forms an integral part of this report.

174
JSW Steel Limited | Integrated Report 2017-18
To,The Members,JSW STEEL LIMITEDJSW Centre, Bandra-Kurla Complex,Bandra (East), Mumbai,Maharashtra - 400 051
Our Secretarial Audit report of even date is to be read along with this letter.
1. Maintenance of secretarial records is the responsibility of the management of the Company. Our responsibility is to express an opinion on these secretarial records based on our audit.
2. We have followed the audit practices and processes as were considered appropriate to obtain reasonable assurance about the correctness of the contents of the secretarial records. The verification was done on test basis to ensure that correct facts are reflected in secretarial records. We believe that the processes and practices, we followed provide a reasonable basis for our opinion.
3. We have not verified the correctness and appropriateness of financial records and Books of Account of the Company.
4. Where ever required, we have obtained the Management representation about the compliance of laws, rules and regulations and happening of events etc.
5. The compliance of the provisions of Corporate and other applicable laws, rules, regulations, standards, is the responsibility of management. Our examination was limited to the verification of procedures on test basis.
6. The Secretarial Audit report is neither an assurance as to the future viability of the Company nor of the efficacy or effectiveness with which the management has conducted the affairs of the Company.
Yours truly,
For Company Secretaries
Place : MumbaiDate : 16 May 2018
S. Srinivasan Senior Partner
FCS: 2286CP. No. 748
ANNEXURE TO SECRETARIAL AUDIT REPORT OF JSW STEEL LIMITED DATED 16.05.2018

175
Better Everyday. In Pursuit of Excellence. Corporate Overview Statutory Reports Financial Statements
Annexure – D to Directors’ Report
ANNUAL REPORT ON CORPORATE SOCIAL RESPONSIBILITY (CSR) ACTIVITIES
(Pursuant to Rule 9 of Companies (Corporate Social Responsibility Policy) Rules, 2014).
1. A Brief outline of the Company’s CSR policy, including overview of projects or programmes proposed to be undertaken and a reference to the web-link to the CSR policy and projects or programmes.
A brief outline of the Company’s CSR Policy has been given in the Director’s Report. Web link reference: www.jsw.in/foundation/about-jswfoundation.
2. The composition of the CSR Committee.
Dr. Vijay Kelkar (Chairman) Mr. K. Vijayaraghavan, Director
Mr. Seshagiri Rao M.V.S., Jt. MD & Group CFO Dr. (Mrs.) Punita Kumar Sinha, Director
Dr. Vinod Nowal, Dy. Managing Director Mr. N. Jayaram, IAS – Nominee Director (KSIIDC)
Mr. Jayant Acharya, Director (Commercial & Marketing)
3. Average net profit of the Company for last three financial years: ` 1,752 crores
4. Prescribed CSR Expenditure (two per cent of the amount as in item 3 above): ` 35 crores
5. Details of CSR spent during the financial year:
(a) Total amount to be spent for the financial year : ` 35 crores
(b) Total amount spent in the financial year : ` 53 crores
(c) Amount unspent, if any : NIL
(d) Manner in which the amount spent during the financial year is detailed below:
1 2 3 4 5 6 7 8Sr. No.
CSR projects or activities Sector in which the Initiatives were Covered
Projects of Programme (1) Local area or other (2) Specify the State and district where projects or Programmes was undertaken
Amount outlay
(budget) project or
programme wise (` in
crores)
Amount spent on the projects or programmes
Sub-heads: (1) Direct
expenditure on projects or
programmes (2) Overheads:
(` in crores)(as on 31
March 2018)
Cumulative expenditure
up to the reporting
period (` in crores)
(as on 31 March
2018)
Amount spent Direct or through implementing agency *
1 Malnourishment project, Mid-day meals, Leprosy project, General Health & Cataract Camps, Drinking Water Supply, Artificial Limb Replacement, Rural Transformation Programme etc., Jain Irrigation Project
Improving Living Conditions
Around our Direct Influence Zone (DIZ) at Vijayanagar, Dolvi, Vasind, Salem, Tarapur; also at Thane, Palghar & Gadchiroli, Salboni
17 16 16 Direct / Implementing agency
2 School Infrastructure development and Enhancement of Quality education; Nehru Science Centre Lecture Series, School for Differently- Abled. Vocational Training Institutes, IIT Monash
Promoting Social Development
Around our DIZ at Vijayanagar, Vasind, Dolvi, Kalmeshwar, Tarapur; also at Uttarakhand
19 17 17 Direct / Implementing agency
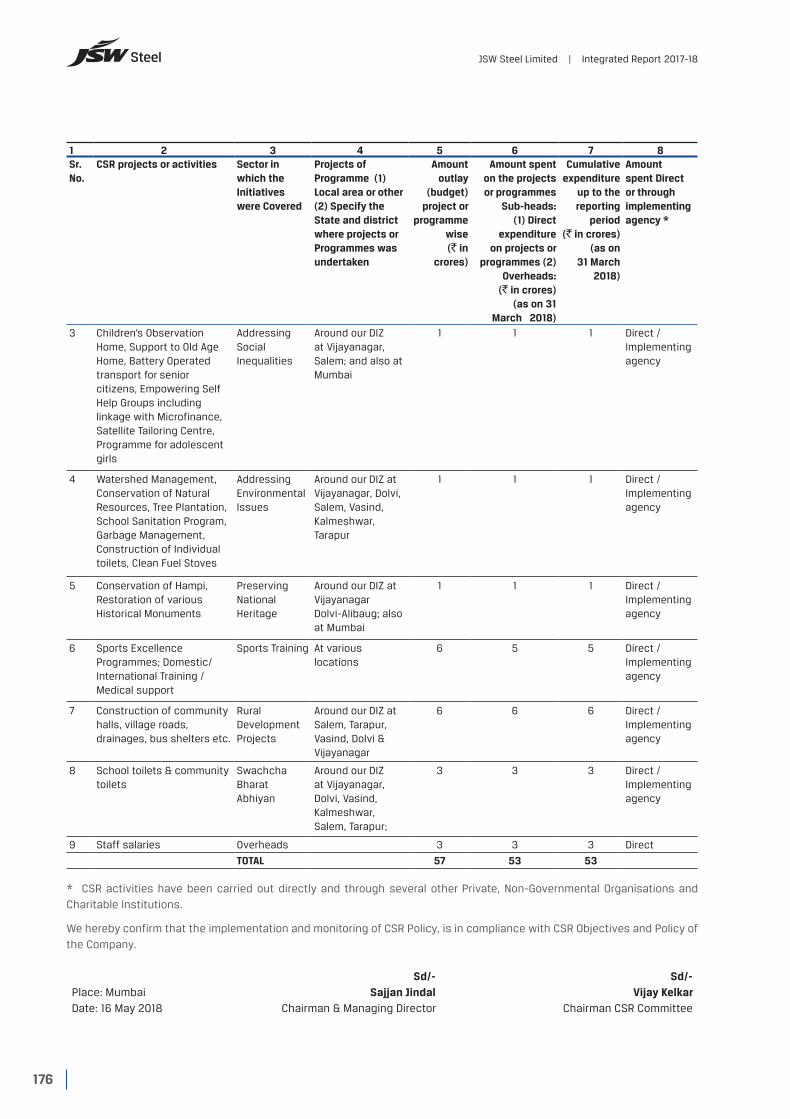
176
JSW Steel Limited | Integrated Report 2017-18
1 2 3 4 5 6 7 8Sr. No.
CSR projects or activities Sector in which the Initiatives were Covered
Projects of Programme (1) Local area or other (2) Specify the State and district where projects or Programmes was undertaken
Amount outlay
(budget) project or
programme wise (` in
crores)
Amount spent on the projects or programmes
Sub-heads: (1) Direct
expenditure on projects or
programmes (2) Overheads:
(` in crores)(as on 31
March 2018)
Cumulative expenditure
up to the reporting
period (` in crores)
(as on 31 March
2018)
Amount spent Direct or through implementing agency *
3 Children’s Observation Home, Support to Old Age Home, Battery Operated transport for senior citizens, Empowering Self Help Groups including linkage with Microfinance, Satellite Tailoring Centre, Programme for adolescent girls
Addressing Social Inequalities
Around our DIZ at Vijayanagar, Salem; and also at Mumbai
1 1 1 Direct / Implementing agency
4 Watershed Management, Conservation of Natural Resources, Tree Plantation, School Sanitation Program, Garbage Management, Construction of Individual toilets, Clean Fuel Stoves
Addressing Environmental Issues
Around our DIZ at Vijayanagar, Dolvi, Salem, Vasind, Kalmeshwar, Tarapur
1 1 1 Direct / Implementing agency
5 Conservation of Hampi, Restoration of various Historical Monuments
Preserving National Heritage
Around our DIZ at Vijayanagar Dolvi-Alibaug; also at Mumbai
1 1 1 Direct / Implementing agency
6 Sports Excellence Programmes; Domestic/ International Training / Medical support
Sports Training At various locations
6 5 5 Direct / Implementing agency
7 Construction of community halls, village roads, drainages, bus shelters etc.
Rural Development Projects
Around our DIZ at Salem, Tarapur, Vasind, Dolvi & Vijayanagar
6 6 6 Direct / Implementing agency
8 School toilets & community toilets
Swachcha Bharat Abhiyan
Around our DIZ at Vijayanagar, Dolvi, Vasind, Kalmeshwar, Salem, Tarapur;
3 3 3 Direct / Implementing agency
9 Staff salaries Overheads 3 3 3 Direct
TOTAL 57 53 53
* CSR activities have been carried out directly and through several other Private, Non-Governmental Organisations and Charitable Institutions.
We hereby confirm that the implementation and monitoring of CSR Policy, is in compliance with CSR Objectives and Policy of the Company.
Place: Mumbai Date: 16 May 2018
Sd/-Sajjan Jindal
Chairman & Managing Director
Sd/-Vijay Kelkar
Chairman CSR Committee

177
Better Everyday. In Pursuit of Excellence. Corporate Overview Statutory Reports Financial Statements
Annexure – E to Directors’ Report
FORM NO. AOC-2
(Pursuant to clause (h) of sub-section (3) of Section 134 of the Act and Rule 8(2) of the Companies (Accounts) Rules, 2014)
Form for disclosure of particulars of contracts/arrangements entered into by the Company with related parties referred to in sub-section (1) of Section 188 of the Companies Act, 2013 including certain arm’s length transactions
under third proviso thereto
1. Details of contracts or arrangements or transactions not at arm’s length basis:
(a) Name(s) of the related party and nature of relationship
NIL(All contracts or arrangements or transactions with related parties
are at arm’s length basis)
(b) Nature of contracts/ arrangements/ transactions
(c) Duration of the contracts/ arrangements/transactions
(d) Salient terms of the contracts or arrangements or transactions including the value, if any
(e) Justification for entering into such contracts or arrangements or transactions
(f) date(s) of approval by the Board
(g) Amount paid as advances, if any:
(h) Date on which the special resolution was passed in general meeting as required under first proviso to Section 188
2. Details of material contracts or arrangement or transactions at arm’s length basis:
(a) Name(s) of the related party and nature of relationship JSW Steel Coated Products Limited ('JSW Coated') and JSW International Trade Corp Pte Limited ('JITPL')
(b) Nature of contracts/ arrangements/ transactions Sale/purchase of steel products to/from JSW Coated, recovery/ reimbursement of expenses, Interest income and Procurement of Iron Ore, Coking Coal, Coke and other raw materials from JITPL
(c) Duration of the contracts/ arrangements/transactions Apr’17 to Mar’18
(d) Salient terms of the contracts or arrangements or transactions including the value, if any
Value of transactions with JSW Coated amounted to ` 9,973 crores and procured raw material from JITPL amounted to ` 16,369 crores during FY 2017-18
(e) Date(s) of approval by the Board, if any For JITPL – The Board approved transaction on 27 October 2016 and shareholders approved this transaction through Postal Ballot by passing resolution dated 17 December 2016.
For JSW Coated – Not applicable
(f) Amount paid as advances, if any NIL

178
JSW Steel Limited | Integrated Report 2017-18
Info
rmat
ion
as p
er S
ecti
on 1
97 o
f th
e C
ompa
nies
Act
, 20
13 r
ead
wit
h th
e ru
le 5
of
the
Com
pani
es (A
ppoi
ntm
ent
& R
emun
erat
ion
of m
anag
eria
l per
sonn
al)
Rul
es, 2
014
and
for
min
g pa
rt o
f th
e
Dir
ecto
rs' R
epor
t fo
r the
fin
anci
al y
ear e
nded
31
Mar
ch, 2
018
.
Sr.
No.
Nam
eAg
e in
Ye
ars
Qua
lific
atio
nD
ate
of
com
men
cem
ent
of E
mpl
oym
ent
Des
igna
tion
Rem
uner
atio
n (A
mt.
in `
)To
tal
Expe
rien
ce
(No.
of
Year
s)
Prev
ious
Em
ploy
men
t (D
esig
nati
on)
(A)
Empl
oyed
thr
ough
out
the
year
and
wer
e in
rec
eipt
of
rem
uner
atio
n of
not
less
tha
n `1
,02,
00
,00
0 p
er a
nnum
1Ji
nd
al S
ajja
n5
8B
E (M
ech
anic
al)
4 J
uly
19
92
Ch
airm
an &
Man
agin
g D
irec
tor
49
,58
,13
,39
83
6Ji
nd
al S
trip
s Lt
d. (
Jt. M
anag
ing
Dir
ecto
r)
2S
esh
agir
i Rao
M.V
.S.
60
B.C
om, C
AIIB
, AIC
WA
, LC
S, D
BF
1 S
epte
mb
er 1
997
Join
t M
anag
ing
Dir
ecto
r &
Gro
up
CFO
21,
09
,86
,15
83
9N
ich
olas
Pir
amal
(In
dia
) Lt
d. (
Sr.
Vice
P
resi
den
t)
3N
owal
Vin
od K
62
MB
A,P
h.D
(In
vent
ory
Man
agem
ent)
14 F
ebru
ary
198
4D
epu
ty M
anag
ing
Dir
ecto
r12
,24
,53
,15
63
9K.
M. S
ug
ar M
ills
Ltd
. (Fa
ctor
y M
anag
er)
4Ac
har
ya J
ayan
t5
5B
E (C
hem
ical
), M
BA
(Mar
keti
ng
),
MS
C
(Phy
sics
)
1 Ju
ly 1
99
9D
irec
tor -
Com
mer
cial
&
Mar
keti
ng
10,8
4,3
4,5
80
35
Essa
r Ste
el L
td. (
Jt. G
ener
al M
anag
er)
5M
ahes
hw
ari A
run
48
MB
A (
Mar
keti
ng
&
Fin
ance
)2
0 F
ebru
ary
20
03
Exec
uti
ve V
ice
Pre
sid
ent
- C
omm
erci
al3
,70
,27,
00
626
Mak
eti R
ollin
g M
ills
Ltd
. (M
anag
er -
Bu
sin
ess
Dev
elop
men
t)
6Ja
yara
man
R.
53
B.C
om.,
MB
A1
Oct
ober
19
90
Sr.
Vice
Pre
sid
ent
- C
orp
orat
e P
lan
nin
g &
Imp
orts
3,3
1,3
2,4
55
27In
dia
n M
arke
t R
esea
rch
Bu
reau
(Fi
eld
Su
rvey
or)
7C
hai
nan
i Gau
tam
55
B. S
c, M
MS
1 N
ovem
ber
20
16G
rou
p P
resi
den
t -
Hu
man
R
esou
rce
2,8
8,8
1,4
61
32
Ult
rate
ch C
emen
t Li
mit
ed (
Ch
ief
Hu
man
R
esou
rce
Off
icer
& C
orp
. Com
mu
nic
atio
n)
8La
l H. R
.6
3B
. Sc.
, PG
D In
Soc
ial
Wor
k (L
abou
r Wel
fare
),
LLB
8 A
pri
l 20
04
Sr.
Vice
Pre
sid
ent
- H
R &
Ad
min
.2
,87,
06
,117
41
SA
IL (
Jt. D
irec
tor -
Est
ate
Man
agem
ent)
(B)
Empl
oyed
for t
he p
art
of t
he y
ear a
nd w
ere
in r
ecei
pt o
f re
mun
erat
ion
aggr
egat
ing
to n
ot le
ss t
han
`8,5
0,0
00
per
mon
th
1R
ath
ore
Gaj
raj S
ing
h5
3B
E (M
etal
lurg
y)1
Oct
ober
20
17P
resi
den
t D
olvi
an
d S
alav
3,0
2,5
6,2
86
22
Ste
el P
roce
ssin
g C
ente
r Ltd
. (Ex
ecu
tive
Vic
e P
resi
den
t)
2S
ing
h S
han
kar P
rata
p5
4B
E (M
ech
anic
al)
1 N
ovem
ber
20
17S
r. Vi
ce P
resi
den
t -
Od
isa
Pro
ject
2,1
3,5
9,1
373
0JS
W P
roje
ct L
imit
ed (
Sr.
Vice
Pre
sid
ent)
Not
es:
1.R
emu
ner
atio
n s
how
n a
bov
e in
clu
des
Sal
ary,
Per
form
ance
Rew
ard
/ S
pec
ial A
llow
ance
, Hou
se R
ent
Allo
wan
ce /
Per
qu
isit
e fo
r Acc
omm
odat
ion
, Lea
ve T
rave
l Allo
wan
ce, M
edic
al
Rei
mb
urs
emen
t, B
onu
s, V
aria
ble
Pay
, Com
mis
sion
, ES
OP
per
qu
isit
e, m
onet
ary
valu
e of
per
qu
isit
es a
s p
er in
com
e ta
x ru
les
and
Com
pan
y's
Con
trib
uti
on t
o P
rovi
den
t Fu
nd
. Bu
t d
oes
not
in
clu
de
Actu
rial
Val
ud
atio
n o
f Le
ave
Enca
shm
ent,
Com
pan
y's
Con
trib
uti
on t
o G
ratu
ity
Fun
d.
2.
Non
e of
th
e em
plo
yees
is c
over
ed u
nd
er R
ule
5(3
)(vi
ii) o
f Th
e C
omp
anie
s (A
pp
oint
men
t an
d R
emu
ner
atio
n o
f M
anag
eria
l Per
son
nel
)Ru
les,
20
14 o
f S
ecti
on 1
97 o
f th
e C
omp
anie
s Ac
t,
20
13.
3.
The
nat
ure
of
emp
loym
ent
in a
ll ca
ses
is c
ontr
actu
al e
xcep
t in
cas
e of
Mr.
Saj
jan
Jin
dal
.
4.
Mr.
Saj
jan
Jin
dal
Is r
elat
ive
of M
rs.S
avit
ri D
evi J
ind
al, C
hai
rper
son
em
erit
us
of t
he
Com
pan
y.
Annexure – F to Directors’ Report

179
Better Everyday. In Pursuit of Excellence. Corporate Overview Statutory Reports Financial Statements
Info
rmat
ion
as
per
Sec
tion
19
7 of
th
e C
omp
anie
s Ac
t, 2
013
rea
d w
ith
th
e ru
le 5
of
the
Com
pan
ies
(Ap
poi
ntm
ent
& R
emu
ner
atio
n o
f m
anag
eria
l per
son
nal
) R
ule
s, 2
014
an
d fo
rmin
g p
art
of t
he
Dir
ecto
rs’ R
epor
t fo
r th
e fi
nan
cial
yea
r en
ded
31
Mar
ch 2
018
.
Sr.
No.
Nam
eAg
e in
Ye
ars
Qua
lific
atio
nD
ate
of c
omm
ence
men
t of
Em
ploy
men
tD
esig
nati
on R
emun
erat
ion
(Am
t. in
`)
Tota
l Exp
erie
nce
(No.
of
Year
s)Pr
evio
us E
mpl
oym
ent
(Des
igna
tion
)
B (
i)Em
plo
yed
th
rou
gh
out
the
year
an
d w
ere
in r
ecei
pt
of r
emu
ner
atio
n o
f n
ot le
ss t
han
` 1
.02
cro
res
per
an
nu
m (
Oth
er T
han
Top
10
)1
Agar
wal
Pra
kash
Ku
mar
39
B.C
om.,
ACA
.2
8 A
ug
ust
20
08
Dy.
Gen
eral
Man
ager
(T
axat
ion
)1,
03
,26
,997
17
Arc
elor
Mit
tal
2Ag
gar
wal
Ash
ok K
um
ar
59
B. S
c (E
ng
inee
rin
g)
2 J
un
e 19
98
Pre
sid
ent
- B
usi
nes
s D
evel
opm
ent
1,8
5,8
0,5
35
3
2Es
sar S
teel
Lim
ited
(Jt
. Gen
eral
M
anag
er)
3Ag
raw
al S
anja
y 5
4B
. Tec
h (
Met
allu
rgy)
28
Oct
ober
20
10S
r. Vi
ce P
resi
den
t -
Sal
es
& M
arke
tin
g1,
06
,03
,319
3
1Ji
nd
al S
teel
& P
ower
Ltd
. - G
M
(Sal
es &
Mar
keti
ng
)4
Agra
wal
Vin
eet
46
BE
(Ele
ctro
nic
s &
Te
leco
m),
MTE
CH
(M
anag
emen
t &
Sys
tem
s)
11 F
ebru
ary
20
11S
r.Vic
e P
resi
den
t &
Gro
up
Hea
d -
Dir
ect
Taxa
tion
1,4
7,5
4,7
54
2
1R
elia
nce
Pow
er L
td. (
Vice
Pre
sid
ent
- Ta
xati
on)
5A
shu
tosh
B G
ang
rad
e5
8B
.E. (
Mec
han
ical
)2
1 D
ecem
ber
19
92
Vice
Pre
sid
ent
- C
omm
erci
al &
Mar
keti
ng
1,9
8,9
2,6
57
33
Gri
nd
wel
l Nor
ton
Lim
ited
(P
rocu
ct
Eng
inee
r)6
Bak
shi R
ajiv
57
B. C
om,L
LB4
Mar
ch 2
013
Sr.
Vice
Pre
sid
ent
- Le
gal
&
Gro
up
Cou
nse
l Gen
eral
2,0
2,6
9,0
88
3
3G
odre
j In
du
stri
es L
imit
ed
(Exe
cuti
ve V
ice
Pre
sid
ent
- Le
gal
)7
Beh
era
Um
akan
ta5
6D
ip. I
n M
inin
g1
Oct
ober
20
07
Gen
eral
Man
ager
-
Com
mer
cial
1,0
2,9
2,8
90
3
4JS
W B
eng
al S
teel
Ltd
. (G
ener
al
Man
ager
)8
Bh
aler
ao R
avin
dra
54
BE
(Met
allu
rgy.
), D
ip. I
n M
ech
anic
al E
ng
g.
1 M
arch
19
89
Ass
ocia
te V
ice
Pre
sid
ent
- C
omm
erci
al1,
02
,42
,84
0
30
Met
allu
rgy
Ser
vice
s P
vt. L
td.
(Met
allu
rgic
al E
ng
inee
r)9
Ch
and
ra A
lok
52
B.E
.14
Mar
ch 2
00
0Ex
ecu
tive
Vic
e P
resi
den
t -
Op
erat
ion
s1,
37,3
7,9
45
3
0S
AIL
- B
hila
i (M
anag
er)
10C
hat
terj
ee A
jant
a5
0B
.A.,
Pos
t G
ratu
ate
in
Soc
iolo
gy
20
Oct
ober
20
15Vi
ce P
resi
den
t -
Hu
man
R
esou
rces
1,0
7,5
4,2
37
19Vo
daf
one
Ind
ia L
td. (
Ass
ocia
te V
ice
Pre
sid
ent
- H
R)
11C
hau
han
Rak
esh
53
PG
Dip
lom
a, B
.E.
18 J
uly
20
06
Vice
Pre
sid
ent
- S
ales
&
Mar
keti
ng
1,24
,81,
49
0
29
Glo
bal
Ste
el P
hili
pp
ines
(D
GM
- M
arke
tin
g)
12D
. Rav
ich
and
ar6
1B
E (M
ech
anic
al),
BE
(Ele
ctri
cal)
, Dip
lom
a (F
inan
ce)
18 N
ovem
ber
19
94
CEO
(S
alem
Wor
ks)
1,8
3,2
8,9
34
4
0B
hu
shan
Ste
el &
Str
ips
Ltd
. (G
ener
al M
anag
er)
13D
as D
eb K
um
ar5
6B
. Com
., IC
WA
15 J
uly
19
98
Vice
Pre
sid
ent
- Fi
nan
ce
and
Acc
ount
s1,
12,8
8,5
72
32
Lase
n &
Tou
rbo
Ltd
(Ju
nio
r Ex
ecu
tive
)14
Dix
it P
rave
en5
3B
. Sc.
,M. S
c., P
GD
(I
nd
ust
rial
), M
MM
30
Dec
emb
er 1
99
1S
r. Vi
ce P
resi
den
t -
Sal
es
& M
arke
tin
g2
,59
,80
,42
1 3
0R
oad
mas
ter S
teel
Str
ips
Lim
ited
(E
ng
inee
r - P
PC
)15
Dos
hi S
anje
ev4
9B
. Com
, CA
30
Sep
tem
ber
20
00
Ass
ocia
te V
ice
Pre
sid
ent
- Fi
nan
ce a
nd
Acc
ount
s1,
06
,34
,00
4
24S
V G
hat
alia
& A
ssoc
iate
s (M
anag
er)
16D
ua
Har
esh
K.
49
CA
,B.C
OM
,CIA
, CIS
A, C
ISS
P2
2 M
ay 2
00
8S
r. Vi
ce P
resi
den
t -
Inte
rnal
Au
dit
1,3
3,4
5,4
31
25
Pan
talo
on R
etai
l In
dia
Ltd
(C
hie
f In
tern
al A
ud
itor
)17
Gok
hal
e S
and
eep
Gop
al5
5B
E (E
lect
rica
l), M
BA
(Fin
ance
)2
5 A
ug
ust
20
08
Pre
sid
ent
- B
usi
nes
s D
evel
opm
ent
2,5
6,5
8,5
40
3
2M
um
bai
Inte
rnat
ion
al A
irp
ort
Pvt
. Lt
d. (
Dir
ecto
r - C
omm
erci
al)
18G
uro
n P
aram
jit
55
BA
, CP
L0
3 O
ctob
er 2
00
5Ex
ecu
tive
Pilo
t -
Avia
tion
1,3
5,2
1,77
8
28
Ori
ent
Flyi
ng
Sch
ool (
Ch
ief
Pilo
t &
C
FI)
19H
ukk
u S
hiv
54
B.S
c., P
G D
iplo
ma
18 O
ctob
er 2
011
Sr.
Vice
Pre
sid
ent
- S
ales
&
Mar
keti
ng
1,2
1,26
,93
8
30
TATA
Ste
el H
ead
Mar
keti
ng
-Gen
eral
En
gg
& P
roce
ss Im
pro
vem
ent(
Flat
P
rod
uct
s)2
0Ja
yram
San
jay
57
Dip
lom
a in
Exp
ort
Mg
t.,B
.A.(
Econ
omic
s), B
.E.
(Mec
han
ical
)
3 A
pri
l 20
06
Exec
uti
ve V
ice
Pre
sid
ent
- S
ales
& M
arke
tin
g2
,49
,79
,324
3
2Es
sar S
teel
Ltd
., (G
ener
al M
anag
er)
21
Jha
Pra
nab
46
B.S
c. M
BA
. MB
M14
Ju
ne
20
10Vi
ce P
resi
den
t -
Sh
ipp
ing
1,13
,08
,90
0
25
SIC
AL
Log
isti
c Lt
d(D
GM
)

180
JSW Steel Limited | Integrated Report 2017-18
Sr.
No.
Nam
eAg
e in
Ye
ars
Qua
lific
atio
nD
ate
of c
omm
ence
men
t of
Em
ploy
men
tD
esig
nati
on R
emun
erat
ion
(Am
t. in
`)
Tota
l Exp
erie
nce
(No.
of
Year
s)Pr
evio
us E
mpl
oym
ent
(Des
igna
tion
)
22
Kan
doi
Um
esh
Ram
lal
54
B.C
om.,
CA
.1
July
20
06
Ass
ocia
te V
ice
Pre
sid
ent
- S
hip
pin
g1,
28
,05
,177
3
1G
rasi
m In
dia
Ltd
. (D
GM
-Pu
rch
ase)
23
Kath
ariy
a S
un
il D
.5
8B
E 24
Ap
ril 1
99
5S
r. Vi
ce P
resi
den
t -
CM
D1,
38
,80
,70
8
33
Lecu
ture
r at
Eng
gin
eeri
ng
Col
lag
e 24
Katt
ikar
en J
ohn
A.
52
BE
(Civ
il)2
Ju
ne
20
08
Vice
Pre
sid
ent
- C
ivil
1,8
5,2
9,0
62
30
Lup
in G
rou
p L
td. (
Sr.
Gen
eral
M
anag
er)
25
Ked
ia P
awan
Ku
mar
58
B.C
om.,
ICW
A6
Jan
uar
y 2
012
Gro
up
Pre
sid
ent
- C
omm
erci
al S
trat
egy
1,6
3,8
5,7
72
34
Con
sult
ant
26Ko
le P
R5
7B
.Com
, CA
, LLB
1 O
ctob
er 1
98
8S
r.Vic
e P
resi
den
t -
Fin
ance
& A
ccou
nts
1,6
6,2
8,2
34
3
2B
DP
L G
rou
p (
Acco
unt
s Ex
ecu
tive
)
27M
itta
l San
jay
49
B.E
.2
Nov
emb
er 2
00
9A
ssoc
iate
Vic
e P
resi
den
t -
Sal
es a
nd
Mar
keti
ng
1,0
7,3
5,2
30
27
Tata
Ste
el L
td (
Hea
d E
PA, L
ong
pro
du
ct)
28
Moh
ta M
anoj
Ku
mar
47
B.C
om.,
AIC
WA
, CA
,1
Sep
tmb
er 2
015
Vice
Pre
sid
ent
- Fi
nan
ce
& A
ccou
nts
(Pro
ject
)1,
73,9
0,0
77
23
Adit
ya B
irla
Man
agem
ent
Cor
p.
Ltd
. (D
y. G
ener
al M
anag
er -
M
anag
emen
t S
ervi
ce D
ivis
ion
29
Mu
rug
an P
K
51
B.S
c. (
PC
M),
B.T
ech
(P
rod
uct
ion
En
gg
)17
Jan
uar
y 19
98
Exec
uti
ve V
ice
Pre
sid
ent
- -
Alli
ed S
ervi
ces
and
Min
es
2,2
3,6
6,3
18
27Es
sar S
teel
s Li
mit
ed (
Dy
Man
ager
)
30
N G
opal
akri
shn
a6
0B
.Sc.
, LLB
., D
PM
, MB
A, M
BL.
1 O
ctob
er 2
014
Vice
Pre
sid
ent
- Le
gal
1,27
,08
,710
3
3H
ind
ust
an Z
inc
Ltd
. (Vi
ce P
resi
den
t -
Leg
el)
31
Nay
ak R
anja
n4
6B
E (M
inin
g),
PG
Dip
lom
a in
B
usi
nes
s Fi
nan
ce2
1 Fe
bu
ary
20
11A
ssoc
iate
Vic
e P
resi
den
t -
Cor
por
ate
Str
ateg
y an
d D
evel
opm
ent
1,13
,15
,83
3
25
JSW
Infr
astr
uct
ure
Ltd
(A
ssoc
iate
Vi
ce P
resi
den
t)
32
Now
al S
ush
il5
1B
.Com
.,MB
A (
Mkt
g),
ED
M1
Jan
uar
y 19
89
Sr.
Vice
Pre
sid
ent
- Lo
gis
tic
1,4
2,6
8,6
43
3
1Ji
nd
al S
trip
s Lt
d. (
Mar
keti
ng
Ass
ista
nt)
33
P. R
ajas
hek
ar
60
BE
(Mec
han
ical
)13
Ju
ly 1
99
8P
resi
den
t -
Op
erat
ion
s1,
76,5
5,8
72
35
RIN
L (M
anag
er)
34
Pai
Raj
eev
M.
56
B. C
om, C
A, C
S (
Inte
r)1
Dea
cmb
er 2
00
0C
hie
f Fi
nan
cial
Off
icer
1,
67,0
2,8
29
3
4C
rom
pto
n G
reav
es L
td. (
Man
ager
-
Fin
ance
)3
5P
atid
ar V
ijayk
um
ar
58
B.E
.-EL
EC7
Jan
uar
y 19
92
Sr.
Vice
Pre
sid
ent
- P
roje
ct1,
61,
40
,48
3
35
Elec
trot
ech
En
gg
. (P
artn
er)
36
Pat
il S
adas
hiv
60
BA
, Dip
in H
um
an
Res
ourc
es2
9 A
pri
l 19
95
Sr.V
ice
Pre
sid
ent
- C
orp
orat
e R
elat
ion
s &
Ad
min
istr
atio
n
1,2
3,3
0,0
95
3
9S
pec
ial S
teel
s Lt
d. (
Dep
uty
M
anag
er -
Ad
min
istr
atio
n)
37P
rab
hak
aran
C
han
dra
seka
ran
43
B.S
c.,C
A, I
CW
A24
Nov
emb
er 2
014
Fin
anci
al C
ontr
olle
r1,
29
,44
,32
1 2
0S
esa
Ste
rlit
e Lt
d. (
Ass
ocia
te V
ice
Pre
sid
ent
- Fi
nan
ce)
38
Pra
sad
Gan
apat
hi
48
BE
(Mec
h. E
ng
g.)
13 A
pri
l 19
98
Ass
ocia
te V
ice
Pre
sid
ent
- O
per
atio
ns
1,2
0,3
5,0
58
27
Essa
r Ste
ek S
ura
t G
uja
rat
(Dep
uty
M
anag
er)
39
Ran
gan
ath
T5
7B
.Com
., C
A,IC
WA
,8
Ju
ne
20
00
Vice
Pre
sid
ent
- Fi
nan
ce
& A
ccou
nts
1,16
,13
,10
2 2
8P
un
jab
Nat
ion
al B
ank
- M
anag
er
(Fin
anci
al A
nal
yst)
40
Ran
ka B
alw
ant
51
CA
,B.C
om1
Jun
e 2
014
Vice
Pre
sid
ent
- P
rocu
rem
ent
& S
tore
s1,
81,
69
,54
2 2
8JS
W E
ner
gy
Lim
ited
(Vi
ce P
resi
den
t -C
omm
erci
al)
41
Red
dy
Bab
u 4
6B
E (M
ech
anic
al)
4 A
pri
l 20
07
Gen
eral
Man
ager
-
Log
isti
c C
entr
e of
Ex
cella
nce
1,3
5,2
1,3
13
24To
rren
t P
har
mac
euti
cals
Ltd
(AG
M)
42
Roy
Kin
shu
k 5
3M
BA
(M
arke
tin
g),
B.E
. (M
etal
lurg
y)11
Feb
uar
y 2
00
8Vi
ce P
resi
den
t -S
ales
&
Mar
keti
ng
1,12
,88
,90
8
29
Tata
Ste
el L
td. -
Hea
d, P
rod
uct
A
pp
licat
ion
Gro
up
43
Sam
uel
Saj
i 5
2B
. Sc.
,Dip
in M
arke
tin
g 15
Ap
ril 1
997
Vice
Pre
sid
ent
- S
ales
an
d M
arke
tin
g1,
37,3
9,0
84
2
9B
est
& C
rom
pto
n E
ng
g. L
td.
(Dep
uty
Man
ager
)4
4S
atya
Pra
kash
52
B. T
ech
.- E
lect
r., E
MB
A-
Op
erat
ion
16 M
arch
20
05
Vice
Pre
sid
ent
- O
per
atio
ns
1,0
8,8
8,5
99
2
9B
okar
o S
teel
Lim
ited
(S
r. M
anag
er)

181
Better Everyday. In Pursuit of Excellence. Corporate Overview Statutory Reports Financial Statements
Sr.
No.
Nam
eAg
e in
Ye
ars
Qua
lific
atio
nD
ate
of c
omm
ence
men
t of
Em
ploy
men
tD
esig
nati
on R
emun
erat
ion
(Am
t. in
`)
Tota
l Exp
erie
nce
(No.
of
Year
s)Pr
evio
us E
mpl
oym
ent
(Des
igna
tion
)
45
Sek
har
V. R
51
Dip
. Met
talu
rgy,
AM
IM
(Met
tallu
rgy)
24 N
ovem
ber
19
98
Vice
Pre
sid
ent
- S
teel
M
elti
ng
Sh
op -
I (B
OF)
1,3
5,5
4,2
74
29
Ras
htr
iya
Isp
at N
igam
Ltd
. (Ju
nio
r O
ffic
er -
Op
erat
ion
) 4
6S
eng
up
ta P
arth
a6
0B
. Tec
h (
Met
allu
rgy)
1 O
ctob
er 2
015
Pre
sid
ent
- C
orp
orat
e S
ervi
ces
1,8
3,5
0,8
34
3
2S
REI
Infr
a an
d F
inan
ce L
imit
ed
47
Sh
ah T
ush
ar V
50
B.C
om.,
ICW
A,
12 A
ug
est
199
1A
ssoc
iate
Vic
e P
resi
den
t -
Fin
ance
& A
ccou
nts
1,6
0,4
3,9
38
2
9Th
e B
omb
ay S
ilk M
ills
Ltd
. (C
ost
Acco
unt
ant)
48
Sh
arm
a Ku
mar
N
arin
der
52
BA
.1
Dec
emb
er 2
00
6A
ssis
tant
Gen
eral
M
anag
er -
Avi
atio
n1,
06
,32
,64
3
12O
rien
t Fl
igh
t S
choo
l, P
ond
ich
erry
(A
FI)
49
Sh
arm
a R
aj K
um
ar5
7D
ip (
Mec
han
ical
) /
BE
(Mec
han
ical
)2
5 A
pri
l 19
96
Sr.
Vice
Pre
sid
ent
- C
ust
omer
Ser
vice
1,0
4,3
9,8
28
3
8Kh
ema
Isp
at L
td. (
Wor
ks M
anag
er)
50
Sh
arm
a R
akes
h K
um
ar
53
B. S
c., M
.Sc.
, MB
A3
1 Ju
ly 1
997
Vice
Pre
sid
ent-
Sal
es &
M
arke
tin
g1,
37,1
7,10
7 3
0Ja
i Cor
p L
imit
ed -
Com
et S
teel
D
ivis
ion
51
Sh
roff
Vin
ay
54
BE
(Ch
emic
al)
22
Ap
ril 2
010
Exec
uti
ve V
ice
Pre
sid
ent
- R
etai
l1,
82
,15
,05
8
31
Rel
ian
ce In
du
stri
es L
td. (
Sr.
VP
-
SC
M &
Bu
sin
ess
Hea
d -
Log
isti
cs)
52
Sin
gh
An
il Ku
mar
5
2B
. Sc
(En
gin
eeri
ng
)1
Dec
mb
er 1
99
4Ex
ecu
tive
Vice
Pre
sid
ent
- Ad
min
istr
atio
n1,
67,2
1,9
27
30
BS
BK
Lim
ited
(Gen
eral
Man
ager
)
53
Sin
gh
Lok
end
ra R
aj5
4B
.Tec
h (
Met
allu
rgy)
12 J
anu
ary
20
08
Sr.
Vice
Pre
sid
ent
- Ir
on
Mak
ing
1,6
2,1
0,8
14
31
Krem
ikov
elsi
AD
glo
bal
ste
el
hol
din
g lt
d. S
ofia
, Bu
lgar
ia (
Gen
eral
M
anag
er)
54
Sin
gh
Sh
ash
ipal
48
B.E
. MM
S (
Sal
es &
M
arke
tin
g)
1 S
eptm
ber
19
95
Gen
eral
Man
ager
- S
ales
an
d M
arke
tin
g1,
02
,84
,26
0
22
Tig
htw
ell F
astn
ers
(Tra
inee
En
gin
eer)
55
Sin
gh
Vim
al4
7B
E (M
ech
anic
al)
24 N
ovem
ber
19
95
Ass
ocia
te V
ice
Pre
sid
ent
- C
omm
erci
al1,
55
,87,
337
2
3Ka
nor
ia C
hem
ical
s an
d In
du
stri
es
Ltd
(D
y. S
up
td.)
56
Sin
gh
al D
even
der
55
Dip
. In
Man
agem
ent
Stu
die
s1
Jan
uar
y 19
86
Ass
ocia
te V
ice
Pre
sid
ent
- C
omm
erci
al1,
32
,37,
114
3
2
57
Sin
ha
Dh
eera
j4
7B
E (E
lect
ron
ics
&
Com
mu
nic
atio
n),
MB
A (F
inan
ce)
5 J
uly
20
16C
hie
f In
form
atio
n O
ffic
er -
In
form
atio
n T
ech
nol
ogy
2,0
5,5
1,97
4
25
Ap
pol
lo T
yres
Lim
ited
(G
rou
p H
ead
- C
MS
, IT
& S
CM
)
58
Sri
ram
K S
N4
9C
A, I
CW
A, B
.Com
6 O
ctob
er 2
00
0Vi
ce P
resi
den
t -
MS
D1,
08
,21,
165
24
Ber
mac
o G
rou
p (
Sr.
Man
ager
-
Acco
unt
s &
Fin
ance
)5
9S
ure
ka R
aj K
um
ar
59
B. C
om.,
FCA
, FIC
WA
, CS
(I
nter
)1
Feb
uar
y 19
97S
r. Vi
ce P
resi
den
t -
Fin
ance
& A
ccou
nts
1,8
7,8
4,8
98
4
1B
alas
ore
Allo
ys L
imit
ed (
Gen
eral
M
anag
er -
Com
mer
cial
)6
0S
ure
nd
ran
ath
V.
Van
dak
ud
ri5
9B
.Com
., C
A.
19 A
pri
l 19
99
Vice
Pre
sid
ent
- Ta
xati
on1,
31,
45
,68
9
35
Rit
z P
riva
te L
td. (
Taxa
tion
Man
ager
)
61
Verm
a At
uly
a Ku
mar
5
5B
E -
Met
allu
rgy
1 D
ecem
ber
20
14S
r. Vi
ce P
resi
den
t- P
roje
ct1,
24,7
6,9
80
27
Elec
tron
ics
Ste
el L
td. (
CO
O)
62
Vin
ay P
rite
sh4
2B
.Sc.
(En
gg
), M
MS
(F
inan
ce)
15 O
ctob
er 2
012
Vice
Pre
sid
ent
-Fin
ance
&
Inve
stor
s R
elat
ion
s1,
34
,90
,178
16
Gol
dm
an S
ach
s, In
dia
(Ex
ecu
tive
D
irec
tor -
Glo
bal
Inve
stm
ent
Res
earc
h)
63
War
rier
Mad
hav
M. R
.6
0B
E (M
ech
), IC
WA
30
Sep
tmb
er 1
99
8S
r. Vi
ce P
resi
den
t -
F &
A,
Exci
se &
Insu
ran
ce1,
59
,03
,06
8
37Is
pat
Ind
ust
ries
, (G
M -
Cos
tin
g)
64
Yezd
egar
di D
eep
a4
7B
. Com
, CA
1 Ju
ly 1
99
5D
y. G
ener
al M
anag
er -
Fi
nan
ce &
Acc
ount
s1,
32
,91,
25
3
23
65
Yog
esw
ara
T.6
1B
E (F
ire
Eng
g.)
, Ph
. D. i
n En
viro
nm
ent
& S
cien
ce8
Mar
ch 1
99
9Vi
ce P
resi
den
t -
Fire
&
Saf
ety
1,4
3,2
7,15
9
26S
AIL
, Rou
rkel
a S
teel
Pla
nt

182
JSW Steel Limited | Integrated Report 2017-18
Sr.
No.
Nam
eAg
e in
Ye
ars
Qua
lific
atio
nD
ate
of c
omm
ence
men
t of
Em
ploy
men
tD
esig
nati
on R
emun
erat
ion
(Am
t. in
`)
Tota
l Exp
erie
nce
(No.
of
Year
s)Pr
evio
us E
mpl
oym
ent
(Des
igna
tion
)
B (
ii)Em
ploy
ed fo
r the
par
t of
the
yea
r and
wer
e in
rec
eipt
of
rem
uner
atio
n ag
greg
atin
g to
not
less
tha
n `.
8.5
Lac
s pe
r mon
th (
Oth
er T
han
Top
10)
1A
saw
ale
Su
dh
akar
S6
1B
. Tec
h (
Met
allu
rgy)
21
Nov
emb
er 2
011
Sr.
Vice
Pre
sid
ent
(Ste
el &
R
ollin
g M
ills)
84
,71,
40
9
36
Rem
i Met
als
(Pre
sid
ent)
2Ku
lkar
ni K
aust
ub
h
Su
dh
akar
44
B. C
om.,
MM
S.,
CFA
.6
Nov
emb
er 2
017
Gro
up
Hea
d-
M&
A &
S
trat
egic
Fin
anci
ng
1,0
6,4
9,6
57
21
Sta
nd
ard
Ch
arte
red
Ban
k (M
anag
ing
Dir
ecto
r)3
Nan
gal
ia R
am P
raka
sh6
0B
.Com
,LLB
, CS
,CA
,2
9 S
eptm
ber
20
11P
resi
den
t -
Cor
por
ate
Rel
atio
ns
1,2
2,4
3,9
53
3
6C
onsu
ltan
t
4R
ao B
NS
Pra
kash
52
B.E
.5
May
19
88
Vice
Pre
sid
ent
- O
per
atio
n1,
60
,58
,018
3
0JS
W S
teel
Coa
ted
Pro
du
ct L
imit
ed
(Vic
e P
resi
den
t)5
Sar
da
Pan
kaj
60
CA
, CS
, CW
A, C
ISA
04
Sep
tmb
er 2
00
6A
ssoc
iate
Vic
e P
resi
den
t -
Ris
k M
anag
emen
t5
9,4
6,5
09
3
5R
elia
nce
En
erg
y G
rou
p (
Add
itio
nal
Vi
ce P
resi
den
t -
F&A)
6S
hri
vast
ava
Nar
end
ra
Kum
ar5
4M
BA
1 O
ctob
er 2
017
Ass
ocia
te V
ice
Pre
sid
ent
- O
dis
sa P
roje
ct6
6,8
8,1
75
3JS
W In
fras
tru
ctu
re L
td (
Ass
ocia
te
Vice
Pre
sid
ent)
7Tr
ipat
hy B
edra
j4
7B
. Sc.
PG
Dip
lom
a in
B
usi
nes
s Ad
min
istr
atio
n14
Ap
ril 2
017
Vice
Pre
sid
ent
- S
teel
Fu
rnit
ure
Bu
sin
ess
1,18
,19
,915
2
0G
odre
j an
d B
oyce
(G
odre
j Int
erio
) (A
ssoc
iate
Vic
e P
resi
den
t -
Adve
rtis
ing
& S
ales
Pro
mot
ion
)N
otes
:
1.R
emu
ner
atio
n s
how
n a
bov
e in
clu
des
Sal
ary,
Per
form
ance
Rew
ard
/ S
pec
ial A
llow
ance
, Hou
se R
ent
Allo
wan
ce /
Per
qu
isit
e fo
r Acc
omm
odat
ion
, Lea
ve T
rave
l Allo
wan
ce, M
edic
al
Rei
mb
urs
emen
t, P
erq
uis
ite
for C
ar, B
onu
s, V
aria
ble
Pay
, Com
mis
sion
, mon
etar
y va
lue
of p
erq
uis
ites
as
per
inco
me
tax
rule
s an
d C
omp
any'
s C
ontr
ibu
tion
to
Pro
vid
ent
Fun
d.B
ut
doe
s n
ot in
clu
de
Actu
rial
Val
ud
atio
n o
f Le
ave
Enca
shm
ent,
Com
pan
y's
Con
trib
uti
on t
o G
ratu
ity
Fun
d.
2.
Non
e of
th
e em
ploy
ees
is c
over
ed u
nder
Rul
e 5
(3)(
viii)
of
The
Com
pani
es (A
ppoi
ntm
ent
and
Rem
uner
atio
n of
Man
ager
ial P
erso
nnel
) R
ules
, 20
14 o
f S
ecti
on 1
97 o
f th
e C
ompa
nies
Act
, 20
13.
3.
The
nat
ure
of
emp
loym
ent
in a
ll ca
ses
is c
ontr
actu
al.
DET
AILS
PER
TAIN
ING
TO
REM
UN
ERAT
ION
AS
REQ
UIR
ED U
ND
ER S
ECTI
ON
197
(12)
OF
THE
CO
MPA
NIE
S A
CT,
20
13 R
EAD
WIT
H R
ULE
5(1
) O
F TH
E C
OM
PAN
IES
(AP
PO
INTM
ENT
AND
REM
UN
ERAT
ION
O
F M
ANAG
ERIA
L P
ERS
ON
NEL
) R
ULE
S, 2
014
(i)
The
perc
enta
ge in
crea
se in
rem
uner
atio
n of
eac
h D
irect
or, C
hie
f Fi
nanc
ial O
ffic
er a
nd C
ompa
ny S
ecre
tary
dur
ing
the
finan
cial
yea
r 20
17-1
8, r
atio
of
the
rem
uner
atio
n of
eac
h D
irect
or
to t
he
med
ian
rem
uner
atio
n of
th
e em
ploy
ees
of t
he
Com
pany
for t
he
finan
cial
yea
r 20
17-1
8 a
nd t
he
com
paris
on o
f rem
uner
atio
n of
eac
h K
ey M
anag
eria
l Per
sonn
el (K
MP
) aga
inst
th
e pe
rfor
man
ce o
f th
e C
ompa
ny a
re a
s un
der:
Sr.
No.
Nam
e of
Dir
ecto
r/ K
MP
and
Des
igna
tion
Rem
un
erat
ion
of
Dir
ecto
r/ K
MP
for
Fi
nan
cial
yea
r 2
017
-18
(E
xclu
din
g E
SO
P p
erq
uis
ite)
(`
in c
rore
s)
% In
crea
se in
Rem
un
erat
ion
in
the
Fin
anci
al Y
ear
20
17-1
8R
atio
of
rem
un
erat
ion
of
each
Dir
ecto
r/ t
o m
edia
n re
mu
ner
atio
n o
f em
plo
yees
Com
par
ison
of
the
Rem
un
erat
ion
of t
he
KMP
ag
ain
st t
he
per
form
ance
of
the
Com
pan
y1.
Saj
jan
Jind
al4
9.5
810
%79
3:1
Prof
it b
efor
e ta
x (b
efor
e ex
cept
iona
l ite
ms)
incr
ease
d by
4
2% in
fin
anci
al y
ear 2
017
-18
Ch
airm
an &
Man
agin
g D
irect
or2.
Ses
hag
iri R
ao M
VS5
.22
10%
84
:1Jo
int
Man
agin
g D
irect
or &
Gro
up C
FO3
.D
r. Vi
nod
Now
al3
.85
10%
62:
1D
y. M
anag
ing
Dire
ctor
4.
Jay
ant
Ach
arya
3.2
88
%5
2:1
Dire
ctor
(C
omm
erci
al &
Mar
keti
ng)
5.
Raje
ev P
ai1.
69
8%
N.A
.C
hie
f Fi
nanc
ial O
ffic
er6
.La
ncy
Varg
hes
e0
.68
14.3
%N
.A.
Com
pany
Sec
reta
ry

183
Better Everyday. In Pursuit of Excellence. Corporate Overview Statutory Reports Financial Statements
(ii) The median remuneration of employees of the Company during the financial year was ` 6.25 lakhs.
(iii) In the Financial year, there was an increase of 9.46% in the median remuneration of employees;
(iv) There were 11,619 permanent employees on the rolls of Company as on 31 March 2018;
(v) Relation between average increased in remuneration and company performance: - The Profit before Tax (before exceptional items) for the financial year ended 31 March 2018 increased by 42% whereas the increase in median remuneration was 9.46%. The average increase in median remuneration was in line with the market trends.
(vi) Comparison of Remuneration of the Key Managerial Personnel(s) against the performance of the Company:
The total remuneration of Key Managerial Personnel increased by 283% from ̀ 33.99 crores to ̀ 96.14 crores which includes the profit linked commission to Chairman & Managing Director of ̀ 37.67 crores (Previous Year ̀ 8.67 crores) and ESOP perquisite of ` 31.84 Crores. (Previous Year ` 1.17 crores) on exercise of ESOP by key managerial personnel. Increase in Key Managerial Personnel remuneration excluding the profit linked commission to Chairman & Managing Director and ESOP perquisite on exercise of ESOP by key managerial personnel is 10%. (From ` 24.15 crores in 2016-17 to ` 26.63 crores in 2017-18). Whereas the Profit before Tax before exceptional items increased by 42% to ` 7309 crores in 2017-18 (` 5131 crores in 2016-17). Remuneration of the Key Managerial Personnel as % of Profit before tax (before exceptional items) is 1.32%.
a) Market capitalisation of the Company & Price Earnings ratio:
Date Market Price `
Face value of Share `
EPS in ` P/E Ratio Market Capitalisation `
crores
% Change
28 March 2018 288.05 1 19.25 14.96 69,31231 March 2017 188.20 1 14.89 12.64 45,492 52.36%
The Company has made initial public offer in the year 1995 for ` 10/- per share at par. Subsequent to sub-division of equity shares on 06/01/2017, the face value of share of the Company was reduced from ` 10/- to ` 1/-. The market price of the Company share as on March 28, 2018 is ` 288.05.
(vii) Average percentage increase made in the salaries of employees other than the managerial personnel in FY 2017-18 was 10.34%.
(viii) The key parameter for the variable component of remuneration in case of Chairman and Managing Director is linked with Company performance. In case of other key managerial personnel(s) the same is linked with Company performance and individual performance.
(ix) The ratio of the remuneration of the highest paid director to that of the employees who are not directors but receive remuneration in excess of the highest paid director during the year – Not Applicable: and
(x) It is hereby affirmed that the remuneration paid is as per the Remuneration Policy for Directors, Key Managerial Personnel and other Employees.

184
JSW Steel Limited | Integrated Report 2017-18
1. Company’s Governance Philosophy: Corporate Governance at JSW Steel Limited has been
a continuous journey and the business goals of the Company are aimed at the overall well- being and welfare of all the constituents of the system. The Company has laid a strong foundation for making Corporate Governance a way of life by constituting a Board with a balanced mix of experts of eminence and integrity, forming a core group of top level executives, inducting competent professionals across the organisation and putting in place appropriate systems, process and technology.
At the heart of Company’s Corporate Governance policy is the ideology of transparency and openness in the effective working of the management and Board. It is believed that the imperative for good Corporate Governance lies not merely in drafting a code of Corporate Governance but in practicing it.
Your Company confirms the compliance of Corporate Governance as contained in Chapter IV of the Securities and Exchange Board of India (Listing Obligations and Disclosure Requirements) Regulations, 2015 (“SEBI (LODR) Regulations”) as amended, the details of which are given below:
2. Board of Directors:2.1 Appointment and Tenure: The Directors of the Company (except Nominee
Directors) are appointed by the shareholders at General Meetings. All Executive Directors are subject to retirement by rotation and at every Annual General Meeting, 1/3rd of such Directors as are liable to retire by rotation, if eligible, generally offer themselves for re-election, in accordance with the provisions of Section 152 of the Companies Act, 2013 and that of the Articles of Association of the Company.
The Executive Directors on the Board serve in accordance with the terms of their contracts of service with the Company.
2.2 Board Membership Criteria: Matching the needs of the Company and enhancing
the competencies of the Board are the basis for the Nomination and Remuneration Committee to select a candidate for appointment to the Board. When recommending a candidate for appointment, the Nomination and Remuneration Committee:
i. assess the appointee against a range of criteria including qualification, age, experience, positive attributes, independence, relationships, diversity of gender, background, professional skills and personal qualities required to operate successfully in the position and has discretion to decide adequacy of such criteria for the concerned position;
ii. assess the appointee on the basis of merit, related skills and competencies. No discrimination is made on the basis of religion, caste, creed or gender.
2.3 Board Composition, Category of Directors, Meetings and attendance record of each Director:
The Company has a balanced mix of executive and non-executive Independent Directors. As at 31.03.2018, the Board of Directors comprises of 12 Directors, of which 8 are non-executive, including 1 woman director. The Chairman is executive and a Promoter of the Company. The number of Independent Directors is 6 which is in compliance with the stipulated one half of the total number of Directors. All Independent Directors are persons of eminence and bring a wide range of expertise and experience to the Board thereby ensuring the best interest of stakeholders and the Company. A brief profile of the Directors is available on the Company’s website www.jsw.in.
(Pursuant to Regulation 34 (3) and Schedule V (C) of the Securities and Exchange Board of India (Listing Obligations and Disclosure Requirements) Regulations, 2015).
Report on Corporate Governance for the year 2017-18

185
Better Everyday. In Pursuit of Excellence. Corporate Overview Statutory Reports Financial Statements
All Independent Directors meet with the criteria of independence as prescribed both under sub-section (6) of Section 149 of the Act and under Regulation 16 (1) (b) of the SEBI (LODR) Regulations.
No Director is related to any other Director on the Board in terms of the definition of “relative” as defined in Section 2(77) of the Companies Act, 2013. None of the Directors on the Board are Independent Directors of more than seven listed companies and none of the Whole-time Directors are Independent Directors of any listed Company.
None of the Directors on the Board is a member of more than 10 committees or Chairperson of more than 5 committees (as specified in Regulation 26 of SEBI (LODR) Regulations) across all the public Companies in which he/she is a Director. The necessary disclosures regarding committee positions in other public companies have been made by the Directors.
The information stipulated under Part A of Schedule II of SEBI (LODR) Regulations is being made available to the Board.
The details of composition of the Board as at 31.03.2018, the attendance record of the Directors at the Board Meetings held during financial year 2017-18 and at the last Annual General Meeting (AGM), as also the number of Directorships, Committee Chairmanships and Memberships held by them in other Public Companies and number of Board Meetings and dates on which held and number of shares and convertible instruments held by non-executive directors are given here below:
Category Name of Director Position Date of
Joining the
Board
No. of Board
MeetingsHeld
No. of Board
meetings attended
Attendance at last AGM
No. of Directorships
in other Indian Public
LimitedCos.
No. of Chairmanship(s)
of Committees in other Indian Public Limited
Cos. **
No. of Membership(s) of Committees in other Indian Public Limited
Cos. **
No. of Shares and convertible
instruments held by Non-
Executive Directors
Executive Directors
Mr. Sajjan Jindal Chairman & Managing Director
15.03.1994 8 7 Yes 2 - - NA
Mr. Seshagiri Rao M.V.S.
Jt. Managing Director & Group CFO
06.04.1999 8 8 Yes 1 - - NA
Dr. Vinod Nowal Dy. Managing Director
30.04.2007 8 6 Yes 1 - - NA
Mr. Jayant Acharya Director (Commercial & Marketing)
07.05.2009 8 8 Yes 2 - - NA
Independent Non- Executive
Dr. Vijay Kelkar Director 20.01.2010 8 5 No 4 1 2 -Mr. K. Vijayaraghavan Director 16.06.2008 8 8 Yes - - - -
Mr. Malay Mukherjee Director 29.07.2015 8 8 Yes 1 - 1 -Dr. (Mrs.) Punita Kumar Sinha
Director 28.10.2012 8 7 Yes 8 2 5 -
Mr. Haigreve Khaitan Director 30.09.2015 8 4 Yes 8 3 5 -Mr. Seturaman Mahalingam
Director 27.07.2016 8 7 Yes 7 2 4 -
Part of the yearNominee Director
Mr. Hiromu Oka (Ceased to be Director w.e.f. 17.05.2017)
Nominee of JFE Steel Corporation, Japan (Equity Investor & Foreign Collaborator
27.10.2016 0* 0* NA# - - - -
Mr. Hiroyuki Ogawa -do- 17.05.2017 8* 8* Yes - - - -Mr. Naveen Raj Singh (Ceased to be Director w.e.f. 20.04.2017)
Nominee of KSIIDC (Equity Investor)
20.09.2016 0* 0* NA# - - - -
Mrs. Hemalatha P IAS, (Ceased to be Director w.e.f. 11.09.2017)
-do- 20.04.2017 4* 0* No - - - -
Mr. Jayaram N, IAS -do- 31.10.2017 4* 1* NA# 12 2 1 -
Notes:
1. During the Financial Year 2017-18, eight Board Meetings were held and the gap between two meetings did not exceed four months. Board Meetings were held on 17.05.2017, 29.06.2017, 31.07.2017, 01.08.2017, 31.10.2017, 10.01.2018, 31.01.2018 & 05.03.2018.

186
JSW Steel Limited | Integrated Report 2017-18
2. * No. of Board Meetings indicated is with reference to date of join/cessation of the Director.
3. ** Only two Committees, namely, Audit Committee and Stakeholders’ Relationship Committee have been considered as per Regulation 26(1)(b) of the Securities and Exchange Board of India (Listing Obligations and Disclosure Requirements) Regulations, 2015.
4. # Not a Director at the time of last AGM.
2.4 Board Meetings, Board Committee Meetings and Procedures:
A. Institutionalised decision-making process:
The Board of Directors oversees the overall functioning of the Company. The Board provides and evaluates the strategic direction of the Company, management policies and their effectiveness and ensures that the long-term interest of the stakeholders are being served. The Chairman and Managing Director is assisted by the Executive Directors/Senior Managerial Personnel in overseeing the functional matters of the Company.
The Board has constituted Thirteen Standing Committees, namely, Audit Committee, Corporate Social Responsibility Committee, Stakeholders Relationship Committee, Nomination & Remuneration Committee, Project Review Committee, Finance Committee, Risk Management Committee, Business Responsibility/Sustainability Reporting Committee, Hedging Policy Review Committee, JSWSL ESOP Committee, Share Allotment Committee, Share/Debenture Transfer Committee and JSWSL Code of Conduct Implementation Committee. The Board constitutes additional functional committees, from time to time, depending on the business needs.
B. Scheduling and selection of Agenda Items for Board
Meetings:
i. A minimum of four Board Meetings are held every year. Dates for the Board Meetings in the ensuing quarter are decided well in advance and communicated to the Directors. The Agenda along with the explanatory notes are sent in advance to the Directors. Additional meetings of the Board are held when deemed necessary to address the specific needs of the Company. In case of business exigencies or urgency of matters, resolutions are passed by circulation.
ii. The meetings are usually held at the Company’s Registered Office at JSW Centre, Bandra-Kurla Complex, Bandra (E), Mumbai 400 051.
iii. All divisions/departments of the Company are advised to schedule their work plans well in advance, with regard to matters requiring
discussion/ approval/ decision at the Board/ Committee meetings. All such matters are communicated to the Company Secretary in advance so that the same can be included in the Agenda for the Board/Committee Meetings.
iv. In addition to items which are mandated to be placed before the Board for its noting and/or approval, information is provided on various significant issues.
v. The Board is given presentations covering Global Steel Scenario, Global/Indian Economy, Company’s Financials, Sales, Production, Business Strategy, Subsidiary’s performance, Competitor’s Performance and Risk Management practices before taking on record the Quarterly/ Half Yearly/ Nine Monthly/ Annual financial results of the Company.
The Board is also provided with Audit Committee observations on the Internal audit findings and matters required to be included in the Director’s Responsibility Statement to be included in the Board’s report in terms of clause (c) of sub-section 3 of Section 134 of the Companies Act, 2013.
C. Distribution of Board Agenda material:
Agenda and Notes on Agenda are circulated to the Directors, in advance, in the defined Agenda format. All material information is incorporated in the Agenda papers for facilitating meaningful and focused discussions at the meeting. Where it is not practical to attach any document to the Agenda, the same is tabled before the meeting with specific reference to this effect in the Agenda. In special and exceptional circumstances, additional or supplementary item(s) on the Agenda are considered.
D. Recording Minutes of proceedings at Board and Committee
Meetings:
The Company Secretary records the minutes of the proceedings of each Board and Committee meeting. Draft minutes are circulated to all the members of the Board/Committee for their comments. The final minutes are entered in the Minutes Book within 30 days from conclusion of the meeting and are signed by the Chairman of the meeting/Chairman of the next meeting. A copy of the signed Minutes certified by the Company Secretary are circulated to all members within fifteen days after those are signed.
E. Post-Meeting Follow-up Mechanism:
The Company has an effective post meeting follow-up, review and reporting process mechanism for the decisions taken by the Board/Committees. The important decisions taken at the Board/Committee meetings are communicated to the concerned functional heads

187
Better Everyday. In Pursuit of Excellence. Corporate Overview Statutory Reports Financial Statements
promptly. Action Taken Report on decisions of the previous meeting(s) is placed at the immediately succeeding meeting of the Board/Committee for noting by the Board/Committee members.
F. Compliance:
While preparing the Agenda, Notes on Agenda, Minutes etc. of the meeting(s), adequate care is taken to ensure adherence to all applicable laws and regulations including the Companies Act, 2013, read with the Rules made thereunder.
2.5 Strategy Meet: A strategy meet of the Board of Directors is generally
held at appropriate intervals to formulate, evaluate and approve the business strategy of the Company. The Functional Heads give a brief presentation to the Board covering their respective areas of responsibility. The meeting focuses on strategic goals, financial management policies, management assurances and control aspects and the growth plan of the Company.
2.6 Terms and conditions of appointment of Independent Directors:
The terms and conditions of appointment of Independent Directors were set out in the appointment letter issued to the Director at the time of his/her appointment/re-appointment as an Independent Non-Executive Director of the Company. The terms and conditions as mentioned in the appointment letter is disclosed on the Company’s website- http://www.jsw.in/investors/ investor-relations-steel.
2.7 Meetings of Independent Directors: The Independent Directors of the Company meet as
and when required before the Board Meeting without the presence of Executive Directors or management personnel. These meetings are conducted in an informal and flexible manner to enable the Independent Directors to discuss matters pertaining to the affairs of the Company and put forth their views to the Chairman and Managing Director.
During the year under review, the Independent Directors met on 21.03 2018, inter alia, to discuss:
• Evaluation of the performance of Non-Independent Directors and the Board of Directors as a whole;
• Evaluation of the performance of the Chairman of the Company, taking into account the views of the Executive and Non-Executive Directors;
• Evaluation of the quality, content and timelines of flow of information between the Management and the Board that is necessary for the Board to effectively and reasonably perform its duties.
All the Independent Directors were present at the Meeting.
2.8 Lead Independent Director: Mr. K. Vijayaraghavan is the Lead Independent Director
appointed by the Board in its meeting held on 31.01.2017.
2.9 Familiarisation programme for Independent Directors: The Company believes that the Board be continuously
empowered with the knowledge of the latest developments in the Company’s business and the external environment affecting the industry as a whole. To this end, the Directors were given presentations on the global business environment, as well as all business areas of the Company including business strategy, risks opportunities. Monthly updates on performance/developments giving highlights of performance of the Company during each month including the developments/events having impact on the business of the Company are also sent to all the Directors. The details of familiarisation programmes imparted to Independent Directors is disclosed on the Company’s website, http://www.jsw.in/investors/ investor-relations-steel.
2.10 Performance evaluation: Pursuant to the provisions of the Companies Act, 2013
and Regulation 17(10), 19(4) and Part D of Schedule II of the SEBI (LODR) Regulations, a Board Evaluation Policy has been framed and approved by the Nomination and Remuneration Committee (NRC) and by the Board.
The Board carried out an annual performance evaluation of its own performance, the Independent Directors individually as well as the evaluation of the working of the Committees of the Board. The performance evaluation of all the Directors was carried out by the Nomination and Remuneration Committee. The performance evaluation of the Chairman and the Non-Independent Directors was carried out by the Independent Directors.
The purpose of the Board evaluation is to achieve persistent and consistent improvement in the governance of the Company at the Board level with the participation of all concerned in an environment of harmony. The Board acknowledges its intention to establish and follow “best practices” in Board governance in order to fulfil its fiduciary obligation to the Company. The Board believes the evaluation will lead to a closer working relationship among Board members, greater efficiency in the use of the Board’s time, and increased effectiveness of the Board as a governing body.
A structured questionnaire was prepared after taking into consideration inputs received from the Directors, covering various aspects of the Board’s functioning such as adequacy of the composition of the Board and its Committees, Board culture, execution and performance of specific duties, obligations and governance. A separate exercise was carried out to evaluate the performance

188
JSW Steel Limited | Integrated Report 2017-18
of individual Directors including the Chairman of the Board, who were evaluated on parameters such as level of engagement and contribution, independence of judgement, safeguarding the interest of the Company and its minority shareholders etc.
The Directors expressed their satisfaction with the evaluation process.
3. Audit Committee: The Audit Committee comprises of three Non- Executive
Directors, all of whom are Independent Directors. Mr. K. Vijayaraghavan is the Chairman of the Audit Committee. The Members possess adequate knowledge of Accounts, Audit, Finance, etc. The composition of the Audit Committee meets the requirements as per the Section 177 of the Companies Act, 2013 and Regulation 18(1) of the SEBI (LODR) Regulations.
The Broad terms of reference of Audit Committee are: a) Overseeing the Company’s financial reporting
process and the disclosure of its financial information to ensure that the financial statements are correct, sufficient and credible.
b) Reviewing with the management the financial statements and auditor’s report thereon before submission to the Board, focusing primarily on:
1. Matters to be included in the Directors Responsibility Statement to be included in the Board’s report in terms of Clause (c) of sub-section 3 of Section 134 of the Companies Act, 2013.
2. Changes to any accounting policies and practices.
3. Major accounting entries based on the exercise of judgement by Management.
4. Significant adjustments if any, arising out of audit findings.
5. Compliance with respect to accounting standards, listing agreements and legal requirements concerning financial statements.
6. Disclosure of any related party transactions.
7. Modified opinion (s) in the draft audit report.
c) Re-commending to the Board, the appointment, re-appointment, remuneration and terms of appointment of Auditors of the Company.
d) To review reports of the Management Auditors and Internal Auditors and discussion on any significant findings and follow up there on.
e) Reviewing with the management, external and internal auditors, the adequacy of internal control
systems, and the Company’s statement on the same prior to endorsement by the Board.
f) Evaluation of the internal financial controls and risk management systems.
g) To review the adequacy of internal audit function, including the structure of the internal audit department, staffing and seniority of the official heading the department, reporting structure coverage and frequency of internal audit.
h) To approve transactions of the Company with related parties and subsequent modifications of the transactions with related parties.
i) In addition, the powers and role of the Audit Committee are as laid down under Regulation 18(3) and Part C of Schedule II of the SEBI (LODR) Regulations and Section 177 of the Companies Act, 2013.
Eight meetings of the Audit Committee were held during the financial year 2017-18, as against the minimum requirement of four meetings. The Committee meetings were held on 16.05.2017, 29.06.2017, 31.07.2017, 20.09.2017, 30.10.2017, 15.12.2017, 30.01.2018 and 21.03.2018.
The composition of the Committee as at 31.03.2018, name of members and Chairperson and the attendance of each member at the Committee Meetings are as given below:
Sl. No.
Name of the Members
Category No. of Meetings Attended
1. Mr. K. Vijayaraghavan Chairman
Non-Executive Independent Director
8/8
2. Mr. Malay Mukherjee Member
Non-Executive Independent Director
8/8
3. Mr. Mahalingam Seturaman Member
Non-Executive Independent Director
8/8
The Jt. Managing Director & Group CFO, Dy. Managing Director, Director (Commercial & Marketing), Chief Financial Officer, Accounts Heads of each Unit, Sr. Vice President (Internal Audit), Financial Controller, the Company Secretary and the representatives of the Statutory Auditors attend the Audit Committee meetings. The representatives of Management Auditors attend the Audit Committee Meeting whenever matters relating to management audit are considered. The representatives of the Cost Auditor attend the Audit Committee meeting when the Cost Audit Report is tabled for discussion. The Company Secretary is the Secretary of the Audit Committee.
189
Better Everyday. In Pursuit of Excellence. Corporate Overview Statutory Reports Financial Statements
Mr. K. Vijayaraghavan, the Chairman of the Audit Committee was present at the last Annual General Meeting held on 29.06.2017.
4. Nomination & Remuneration Committee: The Nomination & Remuneration Committee’s
constitution and terms of reference are in compliance with the provisions of the Companies Act, 2013 and Regulation 19 and Part D of the Schedule II of the SEBI (LODR) Regulations.
The terms of reference of the Committee inter alia, include the following:
Identifying persons who are qualified to become directors and who may be appointed in senior management in accordance with the criteria laid down, recommend to the Board their appointment and removal and carry out evaluation of every director’s performance.
Formulating criteria for determining qualifications, positive attributes and independence of a director and recommending to the Board a policy, relating to the remuneration of the directors, key managerial personnel and other employees.
Formulating criteria for evaluation of Independent Directors and the Board.
Devising a policy on Board diversity.
Whether to extend or continue the term of appointment of independent director on the basis of the report of performance evaluation of independent directors.
One meeting of Nomination and Remuneration Committee was held on 17.05.2017.
The composition of the Nomination & Remuneration Committee as at 31.03.2018 and the attendance of each member at the Committee Meetings are as given below:
Sl.No.
Name of the Members
Category No. of Meetings Attended
1. Dr. Vijay Kelkar Chairman
Non-Executive Independent Director
1/1
2. Mr. Sajjan Jindal Member
Executive Director
0/1
3. Mr. K. Vijayaraghavan Member
Non-Executive Independent Director
1/1
4. Mr. Mahalingam Seturaman Member
Non-Executive Independent Director
1/1
Dr. Vijay Kelkar, Chairman of Nomination & Remuneration Committee was unable to attend the last Annual General Meeting held on 29.06.2017 due to some pressing commitments.
4.1 Performance Evaluation Criteria for Independent Directors:
Board Evaluation Policy has been framed by the Nomination and Remuneration Committee (NRC) and approved by the Board in its meeting held on 30.01.2015 and subsequently amended by the Board in its meeting held on 29.01.2016. This policy has been framed in compliance with the provisions of Section 178 (2), 134(3)(p) and other applicable provisions, if any, of the Companies Act, 2013 and Regulation 17(10), 19(4) and Part D of Schedule II of the SEBI (LODR) Regulations, as amended from time to time,
The Company adopted the following criteria to carry out the evaluation of Independent Directors, which is in terms of the provisions of the Companies Act, 2013 and the SEBI (LODR) Regulations:
The Nomination and Remuneration Committee (NRC) shall carry out evaluation of every Director’s Performance.
In addition, performance evaluation of the Independent Directors shall be done by the entire Board, excluding the director being evaluated. This is to be done on an annual basis for determining whether to extend or continue the term of appointment of the independent director.
The Evaluation process of Independent Directors and the Board will consist of two parts:
– Board Member Self Evaluation; and
– Overall Board and Committee Evaluation.
In the Board Member Self Evaluation, each Board member is encouraged to be introspective about his/ her personal contribution, performance, conduct as director with reference to a questionnaire provided to them. Copies of the evaluation forms as applicable will be distributed to each Board Member. Board members shall complete the forms and return them to the Company Secretary or Board nominee or the consultant, as may be informed.
The Company Secretary or Board nominee or the consultant will tabulate the Forms. The Tabulated Report would be sent to all Board Members for evaluation and if any director disagrees with the self-evaluated results, he/she will suitably intimate the Chairman of the Board, else the same will be deemed to have been accepted.
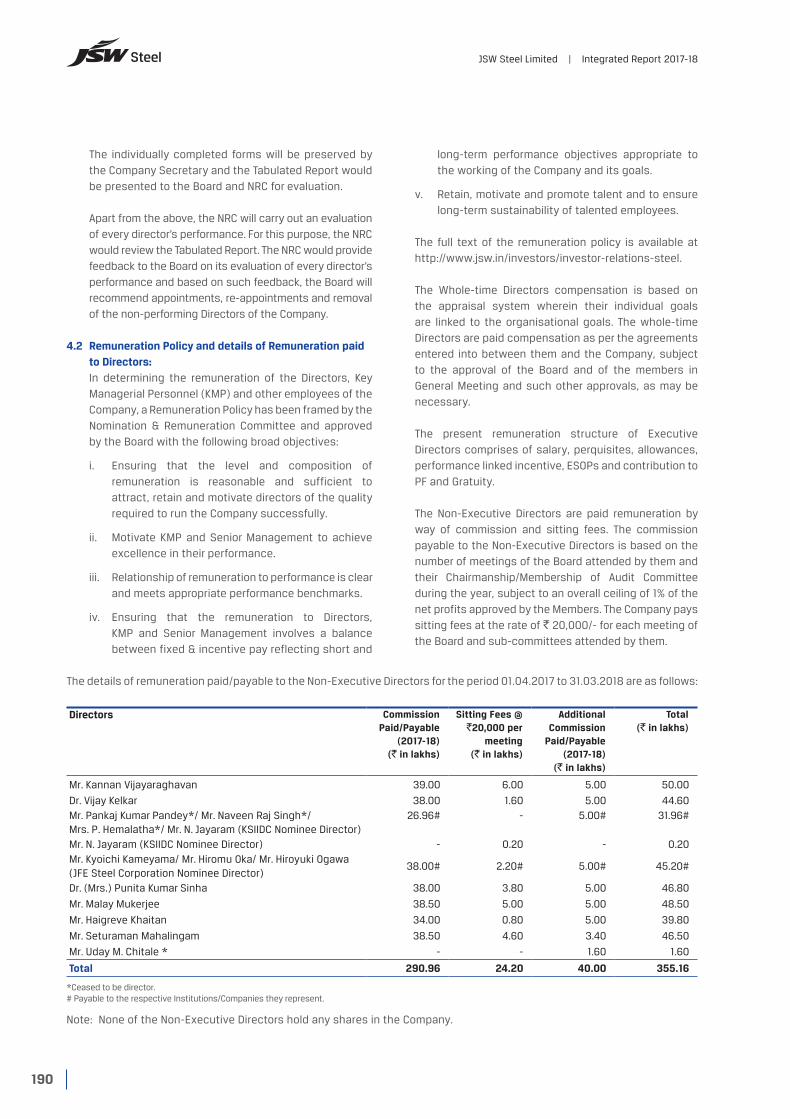
190
JSW Steel Limited | Integrated Report 2017-18
The individually completed forms will be preserved by the Company Secretary and the Tabulated Report would be presented to the Board and NRC for evaluation.
Apart from the above, the NRC will carry out an evaluation of every director’s performance. For this purpose, the NRC would review the Tabulated Report. The NRC would provide feedback to the Board on its evaluation of every director’s performance and based on such feedback, the Board will recommend appointments, re-appointments and removal of the non-performing Directors of the Company.
4.2 Remuneration Policy and details of Remuneration paid to Directors:
In determining the remuneration of the Directors, Key Managerial Personnel (KMP) and other employees of the Company, a Remuneration Policy has been framed by the Nomination & Remuneration Committee and approved by the Board with the following broad objectives:
i. Ensuring that the level and composition of remuneration is reasonable and sufficient to attract, retain and motivate directors of the quality required to run the Company successfully.
ii. Motivate KMP and Senior Management to achieve excellence in their performance.
iii. Relationship of remuneration to performance is clear and meets appropriate performance benchmarks.
iv. Ensuring that the remuneration to Directors, KMP and Senior Management involves a balance between fixed & incentive pay reflecting short and
long-term performance objectives appropriate to the working of the Company and its goals.
v. Retain, motivate and promote talent and to ensure long-term sustainability of talented employees.
The full text of the remuneration policy is available at http://www.jsw.in/investors/investor-relations-steel.
The Whole-time Directors compensation is based on the appraisal system wherein their individual goals are linked to the organisational goals. The whole-time Directors are paid compensation as per the agreements entered into between them and the Company, subject to the approval of the Board and of the members in General Meeting and such other approvals, as may be necessary.
The present remuneration structure of Executive Directors comprises of salary, perquisites, allowances, performance linked incentive, ESOPs and contribution to PF and Gratuity.
The Non-Executive Directors are paid remuneration by way of commission and sitting fees. The commission payable to the Non-Executive Directors is based on the number of meetings of the Board attended by them and their Chairmanship/Membership of Audit Committee during the year, subject to an overall ceiling of 1% of the net profits approved by the Members. The Company pays sitting fees at the rate of ` 20,000/- for each meeting of the Board and sub-committees attended by them.
The details of remuneration paid/payable to the Non-Executive Directors for the period 01.04.2017 to 31.03.2018 are as follows:
Directors Commission Paid/Payable
(2017-18) (` in lakhs)
Sitting Fees @ `20,000 per
meeting (` in lakhs)
Additional Commission
Paid/Payable (2017-18)
(` in lakhs)
Total (` in lakhs)
Mr. Kannan Vijayaraghavan 39.00 6.00 5.00 50.00
Dr. Vijay Kelkar 38.00 1.60 5.00 44.60Mr. Pankaj Kumar Pandey*/ Mr. Naveen Raj Singh*/ Mrs. P. Hemalatha*/ Mr. N. Jayaram (KSIIDC Nominee Director)
26.96# - 5.00# 31.96#
Mr. N. Jayaram (KSIIDC Nominee Director) - 0.20 - 0.20Mr. Kyoichi Kameyama/ Mr. Hiromu Oka/ Mr. Hiroyuki Ogawa (JFE Steel Corporation Nominee Director)
38.00# 2.20# 5.00# 45.20#
Dr. (Mrs.) Punita Kumar Sinha 38.00 3.80 5.00 46.80
Mr. Malay Mukerjee 38.50 5.00 5.00 48.50
Mr. Haigreve Khaitan 34.00 0.80 5.00 39.80
Mr. Seturaman Mahalingam 38.50 4.60 3.40 46.50
Mr. Uday M. Chitale * - - 1.60 1.60
Total 290.96 24.20 40.00 355.16
*Ceased to be director.# Payable to the respective Institutions/Companies they represent.
Note: None of the Non-Executive Directors hold any shares in the Company.

191
Better Everyday. In Pursuit of Excellence. Corporate Overview Statutory Reports Financial Statements
The details of Remuneration paid/payable to the Whole-time Directors for the financial year 2017-18 are as given below:
Name of Director and Designation
Salary including Provident Fund
(` in crores)
Perks (` in crores)
Profit linked commission (` in crores)
Total Period of contract Notice Period
Mr. Sajjan Jindal Chairman & Managing Director
10.73 1.18 37.67 49.58 From 07.07.2017 to 06.07.2022
NA
Mr. Seshagiri Rao M.V.S. Jt. Managing Director & Group CFO
5.00 16.10 - 21.10 From 06.04.2017 to 05.04.2020
3 months from either side or salary in lieu
thereof.
Dr. Vinod Nowal Dy. Managing Director
3.68 8.56 - 12.25 From 30.04.2017 to 29.04.2022
3 months from either side or salary in lieu
thereof.
Mr. Jayant Acharya Director (Commercial & Marketing)
3.14 7.71 - 10.85 From 07.05.2014 to 06.05.2019
3 months from either side or salary in lieu
thereof.
Note: The above figures exclude provision for leave encashment and contribution to the approved Group Gratuity Fund, which are actuarially determined for the Company as a whole. There is no separate provision for payment of severance fees.
5. Stakeholders Relationship Committee: The Stakeholders Relationship Committee comprises of
3 Non-Executive Directors, all of whom are Independent Directors.
The Stakeholders Relationship Committee’s constitution and terms of reference are in compliance with provisions of the Companies Act, 2013 and Regulation 20 and Part D of Schedule VI of the SEBI (LODR) Regulations.
The terms of reference of the Committee are as follows:
1) To review the reports submitted by the Registrars and Share Transfer Agents of the Company at Half yearly intervals.
2) To periodically interact with the Registrars and Share Transfer Agents to ascertain and look into the quality of the Company’s Shareholders/Investors grievance redressal system and to review the report on the functioning of the Investor grievances redressal system.
3) To follow-up on the implementation of suggestions for improvement, if any.
4) To periodically report to the Board about serious concerns if any.
5) To consider and resolve the grievances of the security holders of the Company.
The Stakeholders Relationship Committee met twice during the financial year 2017-18 on 20.09.2017 and on 21.03.2018. The composition of the Committee and the details of the meetings attended by the Members are as given below:
Sl.No.
Name of the Members Category No. of Meetings attended
1 Mr. K. Vijayaraghavan Chairman
Non-Executive Independent Director
2/2
2 Dr. (Mrs.) Punita Kumar Sinha Member
Non-Executive Independent Director
2/2
3 Mr. Mahalingam Seturaman Member
Non-Executive Independent Director
2/2
Mr. Lancy Varghese, Company Secretary is the Compliance Officer for complying with the requirements of SEBI Regulations and the Listing Agreement with the Stock Exchanges in India. His address and contact details are as given below:
Address : JSW Centre, Bandra-Kurla Complex, Bandra (East), Mumbai 400 051Phone : 022-42861000Fax : 022-42863000Email : [email protected]
Investor Grievance Redressal
Number of complaints received and resolved to the satisfaction of Shareholders/Investors during the year under review and their break-up is as under:
No. of Shareholders’ Complaints received during the year ended 31.03.2018
: 361
Number of complaints not solved to the satisfaction of Shareholders
: 0
No. of pending Complaints as on 31.03.2018 : 0

192
JSW Steel Limited | Integrated Report 2017-18
None of the Complaints were pending for a period exceeding 30 days. All requests for transfer of shares have been processed on time and there are no transfers pending for more than 15 days.
CATEGORY OF COMPLAINTS
Non-receipt of certificates Non-receipt of full paid stickers
Non-receipt of dividend warrantsSEBI Complaints/ Stock Exchange Complaints/DOCA, Court/ Advocate Notices
NO. OF COMPLAINTS RECEIVED
5000
4000
3000
2000
1000
0
20082009
20102011
20122013
20142015
20162017
2018
Note: Complaints pertaining to the years subsequent to 2007-08 include investor complaints received from shareholders of Southern Iron & Steel Co. Limited and JSW Ispat Steel Limited upon its merger with the Company in the financial years 2007-08 and 2013-14 respectively.
6. Risk Management Committee: The Risk Management Committee’s constitution and
terms of reference are in compliance with provisions of the Companies Act, 2013 and Regulation 21 of the SEBI (LODR) Regulations.
The terms of reference of the Committee are as follows:
1. To periodically review risk assessment and minimisation procedures to ensure that Executive Management controls risk through means of a properly defined framework.
2. To review major risks and proposed action plan.
The Risk Management Committee met twice during the financial year 2017-18 on 01.08.2017 and 15.12.2017. The composition of the Committee as on 31.03.2018 and the details of the meetings attended by the Members are as given below:
Sl. No.
Name of the Members Category No. of Meetings attended
1 Mr. Malay Mukherjee Chairman
Non-Executive Independent Director
2/2
2 Mr. Seshagiri Rao M.V.S., Member
Executive Director 0/2
3 Dr. Vinod Nowal, Member
Executive Director 2/2
4 Mr. Jayant Acharya Member
Executive Director 2/2
5 Dr. (Mrs.) Punita Kumar Sinha, Member
Non-Executive Independent Director
2/2
6 Mr. K. Vijayaraghavan, Member
Non-Executive Independent Director
2/2
The Risk Management Committee, a sub-committee of the Board has further constituted:
i. “Capex Risk Evaluation Committee” to evaluate the risks associated with capex proposals including mergers and acquisitions.
ii. Locational Committees namely (a) Corporate Locational Committee (b) Vijayanagar Locational Committee (c) Dolvi Locational Committee and (d) Salem Locational Committee to further review risk assessment at Location Level.
7. Other Major Committees of Directors: In addition to the above referred Committees, which
are constituted pursuant to the Corporate Governance Code, the Board has constituted the following major Committees of the Board and delegated thereto powers and responsibilities with respect to specific purposes. Time schedule for holding the meetings of these Committees are finalised in consultation with the Committee Members:

193
Better Everyday. In Pursuit of Excellence. Corporate Overview Statutory Reports Financial Statements
1. PROJECT REVIEW COMMITTEE:
Terms of reference of the Committee Composition Frequency of Meetings
1. To closely monitor the progress of Large Projects, in addition to ensuring a proper and effective co-ordination amongst the various project modules essentially with the objective of timely project completion within the budgeted project outlay.
2. To review new strategic initiatives
1. Mr. Malay Mukherjee, Chairman Non-Executive Independent Director.
2. Dr. Vinod Nowal, Member Executive Director
3. Mr. K. Vijayaraghavan, Member Non-Executive Independent Director
4. Mr. Hiroyuki Ogawa, Member Nominee Director (JFE Steel Corporation)
4 Meetings were held on 16.05.2017, 30.07.2017, 30.10.2017 & 30.01.2018
2. BUSINESS RESPONSIBILITY / SUSTAINABILITY REPORTING COMMITTEE:
Terms of reference of the Committee Composition Frequency of Meetings
1. Responsible for the adoption of
National Voluntary Guidelines on
Social, Environmental and Economic
Responsibilities of Business (NVGs) in
business practices of JSW Steel.
2. Responsible for the policies created
for or linked to the 9 key principles of
the ‘National Voluntary Guidelines on
Social, Environmental and Economic
Responsibilities of Business’.
3. Review the progress of initiatives under
the purview of business responsibility
(sustainability) policies mentioned above.
4. Review business responsibility reporting
disclosures on a pre-decided frequency
(monthly, quarterly, bi- annually).
5. Review the progress of business
responsibility initiatives at JSW Steel.
6. Review the annual business responsibility
report and present it to the Board for
approval.
1. Mr. Malay Mukherjee (Chairman)
DIN No. 02861065
Non-Executive Independent Director
Tel. No. +911141032905
2. Mr. Seshagiri Rao M.V.S. (Member)
DIN No. 00029136
Executive Director
Tel. No. 42861000
3. Dr. Vinod Nowal (Member)
DIN No. 00046144 Executive Director,
Tel No. 42861000
4. Mr. Jayant Acharya (Member),
DIN No. 00106543
Executive Director,
Tel No. 42861000
5. Mr. K. Vijayaraghavan (Member)
DIN No. 00544730
Non-Executive Independent Director,
Tel No. 040 - 30160232
6. Dr. (Mrs.) Punita Kumar Sinha (Member)
DIN No. 05229262
Non-Executive Independent Director
Tel. No. 091-9833363533
2 Meetings were held on 16.05.2017 & 15.12.2017.

194
JSW Steel Limited | Integrated Report 2017-18
3. CORPORATE SOCIAL RESPONSIBILITY (CSR) COMMITTEE:
Terms of reference of the Committee Composition Frequency of Meetings1. To formulate and recommend to the Board, a
Corporate Social Responsibility Policy (CSR Policy), which shall indicate a list of CSR projects or programmes which a Company plans to undertake falling within the purview of the Schedule VII of the Companies Act, 2013, as may be amended.
2. To recommend the amount of expenditure to be incurred on each of the activities to be undertaken by the Company, while ensuring that it does not include any expenditure on an item not in conformity or not in line with activities which fall within the purview of Schedule VII of the Companies Act, 2013.
3. To approve the Annual Report on CSR activities to be included in the Director’s Report forming part of the Company’s Annual Report and Attribute reasons for short comings in incurring expenditures.
4. To monitor the CSR policy of the Company from time to time; and
5. To institute a transparent monitoring mechanism for implementation of the CSR Projects or programmes or activities under taken by the Company.
1. Dr. Vijay Kelkar (Chairman) Non-Executive Independent Director
2. Mr. Seshagiri Rao M.V.S. (Member) Executive Director
3. Dr. Vinod Nowal (Member) Executive Director
4. Mr. Jayant Acharya (Member) Executive Director
5. Dr. (Mrs.) Punita Kumar Sinha (Member) Non-Executive Independent Director
6. Mr. K. Vijayaraghavan (Member) Non-Executive Independent Director
7. Mr. N. Jayaram IAS (Member) Nominee Director (KSIIDC)
2 meetings were held on 20.09.2017 and 21.03.2018
4. HEDGING POLICY REVIEW COMMITTEE:
Terms of reference of the Committee Composition Frequency of Meetings1. To take protective measures to hedge forex
losses.
2. To decide on all matters related to commodities hedging and to take measures to hedge commodity prices fluctuations.
1. Dr. (Mrs.) Punita Kumar Sinha (Chairperson) Non-Executive Independent Director
2. Mr. Seshagiri Rao M.V.S., (Member) Executive Director
3. Dr. Vijay Kelkar, (Member) Non-Executive Independent Director
4. Mr. Seturaman Mahalingam, (Member) Non-Executive Independent Director
Four meetings were held on 29.06.2017, 20.09.2017, 15.12.2017 & 09.03.2018

195
Better Everyday. In Pursuit of Excellence. Corporate Overview Statutory Reports Financial Statements
5. FINANCE COMMITTEE:
Terms of reference of the Committee Composition Frequency of Meetings
1. To approve availing of credit / financial facilities of any description from Banks/ financial Institutions/ Bodies Corporate within the limits approved by the Board.
2. To approve investments and dealings with any monies of the Company upon such security or without security in such manner as the committee may deem fit, and from time to time to vary or realise such investments within the frame work of the guidelines laid down by the Board.
3. To open new Branch Offices of the Company, to declare the same as such and to authorise personnel by way of Power of Attorney or otherwise, to register the aforesaid branches and to deal with various authorities such as the Central Excise, Profession Tax, Commercial Tax, State & Central Sales Tax, VAT Authorities and other Local Authorities.
4. To make loans to Individuals/ Bodies Corporate and/or to place deposits with other Companies/ firms upon such security or without security in such manner as the committee may deem fit within the limits approved by the Board.
5. To open Current Account(s), Collection Account(s), Operation Account(s), or any other Account(s) with Banks and also to close such accounts, which the ‘said Committee’ may consider necessary and expedient.
1. Mr. Seshagiri Rao M.V.S. (Chairman) Executive Director
2. Dr. Vinod Nowal, (Member) Executive Director
3. Mr. Jayant Acharya, (Member) Executive Director
Need based. Meetings were held on 05.04.2017, 28.04.2017, 18.05.2017, 29.06.2017, 24.07.2017, 02.08.2017, 11.09.2017, 15.09.2017, 13.10.2017, 01.11.2017, 27.11.2017, 11.12.2017, 11.01.2018, 23.01.2018, 07.02.2018, 15.02.2018,12.03.2018, 21.03.2018 and 26.03.2018

196
JSW Steel Limited | Integrated Report 2017-18
6. JSWSL ESOP COMMITTEE:
Terms of reference of the Committee Composition Frequency of Meetings
1. Determine the terms and conditions of grant, issue, re-issue, cancellation and withdrawal of Employee Stock Options from time to time.
2. Formulate, approve, evolve, decide upon and bring into effect, suspend, withdraw or revive any sub-scheme or plan for the purpose of grant of Options to the employees and to make any modifications, changes, variations, alterations or revisions in such sub-scheme or plan from time to time.
3. To issue any direction to the trustees of the JSW Steel Employees Welfare Trust to sell, transfer or otherwise dispose-off any Shares held by them.
4. To make necessary amendments to the JSW Steel Employees Welfare Trust Deed, if need be.
5. Lay down the procedure for making a fair and reasonable adjustment to the number of Options and to the Exercise Price in case of change in the Capital Structure and/or Corporate Action.
6. Lay down the method for satisfaction of any tax obligation arising in connection with the Options or such Shares.
7. Lay down the procedure for cashless exercise of Options, if any; and
8. Provide for the Grant, Vesting and Exercise of Options in case of Employees who are on long leave or whose services have been seconded to any other Company or who have joined Holding Company or a Subsidiary or an Associate Company at the instance of the Employer Company.
1. Mr. Malay Mukherjee (Chairman) Non-Executive Independent Director
2. Mr. Seshagiri Rao M.V.S Executive Director
3. Mr. K. Vijayaraghavan Non-Executive Independent Director
4. Mr. Seturaman Mahalingam Non-Executive Independent Director
Need based. Meeting was held on 16.05.2017

197
Better Everyday. In Pursuit of Excellence. Corporate Overview Statutory Reports Financial Statements
8. General Body Meetings:
a) Annual General Meetings: The details of date, time and venue of the Annual General Meetings (AGMs) of the Company held during the preceding
three years and the Special Resolutions passed there at, are as under:
AGM Date Time Venue Special Resolutions Passed
23rd AGM
29.06.2017 11.00 am Y. B. Chavan Auditorium, General Jagannathrao Bhonsle Marg, Nariman point, Mumbai - 400 021
1. Private placement of redeemable non-convertible debentures of ` 10,000 crores.
2. Consent for issue of NCD with convertible warrant upto ` 4000 crores and/or Specified Securities for an aggregate amount not exceeding ` 4,000 crores to QIB.
3. Authority to the Board of Directors for issue and allotment of Foreign Currency Denominated Bonds/ GDRs/ ADRs/ Warrants and/or other convertible instruments aggregating up to US$1 billion..
22nd AGM
26.07.2016 11.00 am Y.B. Chavan Auditorium, General Jagannathrao Bhonsle Marg, Nariman point, Mumbai - 400 021
1. Private Placement of redeemable non-convertible debentures of ` 10,000 crores.
2. Consent for Issue of Securities to Qualified Institutional Buyers for an aggregate amount not exceeding ` 4,000 crores.
3. Authority to the Board of Directors for issue and allotment of Foreign Currency Denominated Bonds aggregating up to US$2 billion..
4. Authority to the Board of Directors to give any loan, guarantee or provide security to any person or other body corporate and to acquire securities of any other Body Corporates upto a maximum aggregate amount of ` 15,000 crores.
5. Increase in borrowing powers of the Board to upto ` 60,000 crores.
6. Consent to hypothecate/mortgage and/or charge all or any part of the movable and/or immovable properties of the Company.
21st AGM 28.07.2015 11.00 am Y.B. Chavan Auditorium, General Jagannathrao Bhonsle Marg, Nariman point, Mumbai - 400 021
1. Private placement of redeemable non-convertible debentures of ` 10,000 crores.
2. Consent for Issue of Securities to Qualified Institutional Buyers for an aggregate amount not exceeding ` 4,000 crores.
b) Special Resolutions passed through Postal Ballot during 2017-18:
No special resolution was passed through Postal Ballot during the financial year 2017-18. None of the Business proposed to be transacted in the ensuing Annual General Meeting require passing a special resolution through Postal Ballot.
9. Disclosures: i. Related Party Transactions: All transactions
entered into with Related Parties as defined under the Companies Act, 2013, Regulation 23 of the SEBI (LODR) Regulations during the financial year were in the ordinary course of business and on arm’s length pricing basis and do not attract the provisions of
Section 188 of the Companies Act, 2013. There were no materially significant transactions with related parties during the financial year which were in conflict with the interest of the Company. Suitable disclosures as required by the Indian Accounting Standard (Ind AS 24) has been made in the notes to the Financial Statements.
The Board approved policy for related party transactions is available on the Company’s website http://www.jsw.in/investors/investor-relations-steel.
ii. The Hon’ble Adjudicating Officer of the Securities and Exchange Board of India had passed an order bearing No. RA/DPS/141/2017 dated 31.08.2017

198
JSW Steel Limited | Integrated Report 2017-18
against the Company imposing a penalty of ` 2,50,000 (Rupees Two Lakh Fifty Thousand) for non-redressal of an investor grievance in a speedy manner. An appeal before the SEBI Appellate Tribunal (SAT) against the abovementioned order was filed on 16.10.2017 by the Company. The Company also without any admission of guilt/wrongdoing on the part of the Company of violation of Circular No. CIR/OIAE/1/2014, dated 18.12.2014, filed an application under the SEBI (Settlement of Administrative and Civil Proceedings) Regulations for settling the order of the Adjudicating Officer, SEBI dated 31.08.2017, by paying an amount of `2,75,000 as settlement amount and `56,750/- as legal charges in the matter. SEBI has in principle agreed to accept the terms of the settlement and the Company has paid the settlement amount. Pursuant to the acceptance of the Company’s settlement application by SEBI, SAT has disposed of the Company’s appeal.
iii. The Company has laid down procedures to inform Board members about the risk assessment and minimisation procedures, which are periodically reviewed.
iv. Whistle Blower Policy/Vigil Mechanism: The Whistle Blower Policy/Vigil Mechanism has been formulated by the Company with a view to provide a mechanism for directors and employees of the Company to approach the Ethics Counsellor/ Chairman of the Audit Committee of the Board to report genuine concerns about unethical behaviour, actual or suspected fraud or violation of the Code of Conduct or ethics policy or any other unethical or improper activity including misuse or improper use of accounting policies and procedures resulting in misrepresentation of accounts and financial statements. The Company is committed to adhere to the highest standards of ethical, moral and legal conduct of business operations and in order to maintain these standards, the Company encourages its employees who have genuine concerns about suspected misconduct to come forward and express these concerns without fear of punishment or unfair treatment.
The Whistle Blower Policy/Vigil Mechanism also provides safeguards against victimisation or unfair treatment of the employees who avail of the mechanism and no personnel has been denied access to the Audit Committee.
The Whistle Blower Policy/Vigil Mechanism adopted by the Company in line with Section 177 of the Companies Act, 2013 and Regulation 22 of the Securities Exchange Board of India (Listing Obligations & Disclosure Requirements) Regulations
2015, which is a mandatory requirement, has been posted on the Company’s website http://www.jsw.in/investors/investor-relations-steel.
v. Subsidiary Monitoring Framework: All the Subsidiary Companies of the Company are Board managed with their Boards having the rights and obligations to manage such companies in the best interest of their stakeholders. As a majority shareholder, the Company nominates its representatives on the Boards of subsidiary companies and monitors the performance of such companies, inter alia, by the following means:
a) The financial statements along with the investments made by the unlisted subsidiaries are placed before the Audit Committee and the Company’s Board, quarterly.
b) A copy of the Minutes of the Meetings of the Board of Directors of the Company’s subsidiaries along with Exception Reports and quarterly Compliance Certificates issued by CEO/ CFO/ CS are tabled before the Company’s Board, quarterly.
c) A summary of the Minutes of the Meetings of the Board of Directors of the Company’s subsidiaries are circulated to the Company’s Board, quarterly.
d) A statement containing all significant transactions and arrangements entered into by the subsidiary companies is placed before the Company’s Board.
The Company does not have any material subsidiary whose net worth exceeds 20% of the consolidated net worth of the holding Company in the immediately preceding accounting year or has generated 20% of the consolidated income of the Company during the previous financial year. However, a policy for determination of Material Subsidiaries has been formulated and has been posted on the Company’s website http://www.jsw.in/investors/investor-relations-steel.
vi. Internal Controls: The Company has a formal system of internal control testing which examines both the design effectiveness and operational effectiveness to ensure reliability of financial and operational information and all statutory/regulatory compliances. The Company’s business processes are on SAP-ERP platforms and has a strong monitoring and reporting process resulting in financial discipline and accountability.
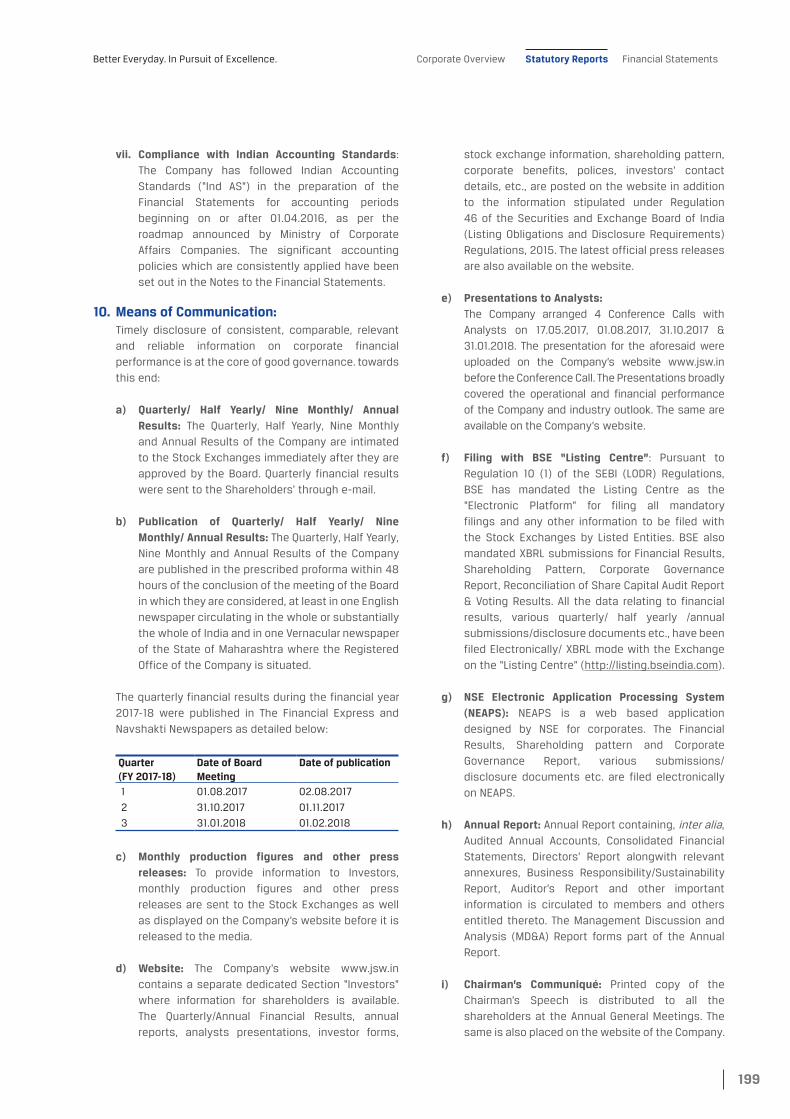
199
Better Everyday. In Pursuit of Excellence. Corporate Overview Statutory Reports Financial Statements
vii. Compliance with Indian Accounting Standards: The Company has followed Indian Accounting Standards (“Ind AS”) in the preparation of the Financial Statements for accounting periods beginning on or after 01.04.2016, as per the roadmap announced by Ministry of Corporate Affairs Companies. The significant accounting policies which are consistently applied have been set out in the Notes to the Financial Statements.
10. Means of Communication: Timely disclosure of consistent, comparable, relevant
and reliable information on corporate financial performance is at the core of good governance. towards this end:
a) Quarterly/ Half Yearly/ Nine Monthly/ Annual Results: The Quarterly, Half Yearly, Nine Monthly and Annual Results of the Company are intimated to the Stock Exchanges immediately after they are approved by the Board. Quarterly financial results were sent to the Shareholders’ through e-mail.
b) Publication of Quarterly/ Half Yearly/ Nine Monthly/ Annual Results: The Quarterly, Half Yearly, Nine Monthly and Annual Results of the Company are published in the prescribed proforma within 48 hours of the conclusion of the meeting of the Board in which they are considered, at least in one English newspaper circulating in the whole or substantially the whole of India and in one Vernacular newspaper of the State of Maharashtra where the Registered Office of the Company is situated.
The quarterly financial results during the financial year 2017-18 were published in The Financial Express and Navshakti Newspapers as detailed below:
Quarter (FY 2017-18)
Date of Board Meeting
Date of publication
1 01.08.2017 02.08.2017
2 31.10.2017 01.11.2017
3 31.01.2018 01.02.2018
c) Monthly production figures and other press releases: To provide information to Investors, monthly production figures and other press releases are sent to the Stock Exchanges as well as displayed on the Company’s website before it is released to the media.
d) Website: The Company’s website www.jsw.in contains a separate dedicated Section “Investors” where information for shareholders is available. The Quarterly/Annual Financial Results, annual reports, analysts presentations, investor forms,
stock exchange information, shareholding pattern, corporate benefits, polices, investors’ contact details, etc., are posted on the website in addition to the information stipulated under Regulation 46 of the Securities and Exchange Board of India (Listing Obligations and Disclosure Requirements) Regulations, 2015. The latest official press releases are also available on the website.
e) Presentations to Analysts: The Company arranged 4 Conference Calls with
Analysts on 17.05.2017, 01.08.2017, 31.10.2017 & 31.01.2018. The presentation for the aforesaid were uploaded on the Company’s website www.jsw.in before the Conference Call. The Presentations broadly covered the operational and financial performance of the Company and industry outlook. The same are available on the Company’s website.
f) Filing with BSE “Listing Centre”: Pursuant to Regulation 10 (1) of the SEBI (LODR) Regulations, BSE has mandated the Listing Centre as the “Electronic Platform” for filing all mandatory filings and any other information to be filed with the Stock Exchanges by Listed Entities. BSE also mandated XBRL submissions for Financial Results, Shareholding Pattern, Corporate Governance Report, Reconciliation of Share Capital Audit Report & Voting Results. All the data relating to financial results, various quarterly/ half yearly /annual submissions/disclosure documents etc., have been filed Electronically/ XBRL mode with the Exchange on the “Listing Centre” (http://listing.bseindia.com).
g) NSE Electronic Application Processing System (NEAPS): NEAPS is a web based application designed by NSE for corporates. The Financial Results, Shareholding pattern and Corporate Governance Report, various submissions/disclosure documents etc. are filed electronically on NEAPS.
h) Annual Report: Annual Report containing, inter alia, Audited Annual Accounts, Consolidated Financial Statements, Directors’ Report alongwith relevant annexures, Business Responsibility/Sustainability Report, Auditor’s Report and other important information is circulated to members and others entitled thereto. The Management Discussion and Analysis (MD&A) Report forms part of the Annual Report.
i) Chairman’s Communiqué: Printed copy of the Chairman’s Speech is distributed to all the shareholders at the Annual General Meetings. The same is also placed on the website of the Company.

200
JSW Steel Limited | Integrated Report 2017-18
11. General Shareholders Information:
i. Annual General Meeting:
Date and Time: 24.07.2018 at 11.00 a.m.
Venue: Y B Chavan Auditorium, General Jagannathrao Bhonsle Marg, Nariman Point, Mumbai 400 021, Maharashtra
Dates of Book closure: 10.07.2018 to 12.07.2018 (both days inclusive
Dividend Payment Date: 27.07. 2018
ii. Financial Calendar 2018-19:
First quarterly results: July 2018
Second quarterly results: October 2018
Third quarterly results: January 2019
Annual results for the year ending on 31.03.2018: May 2019
Annual General Meeting for the Year 2018: July 2019
iii. E-voting: Pursuant to the provisions of Section 108 of the Companies Act, 2013 read with Rule 20 of the Companies
(Management and Administration) Rules 2014 and Regulation 44 of the SEBI (Listing obligation and Disclosure Requirements) Regulation, 2015, members have been provided the facility to exercise their right to vote at General Meetings by electronic means, through e-Voting Services provided by Karvy Computershare Pvt. Ltd.,
iv. Corporate Identity Number (CIN): The CIN of the Company allotted by Ministry of Corporate Affairs, Government of India is L27102MH1994PLC152925.
v. Listing on Stock Exchanges: The Company’s Equity Shares, 10% Cumulative Redeemable Preference Shares & 0.01% Cumulative Redeemable
Preference shares are listed on the following Stock Exchanges in India:
BSE Limited (BSE)
Phiroze Jeejeebhoy Towers, Dalal Street, Mumbai - 400 001
National Stock Exchange of India Limited (NSE)
Exchange Plaza, Bandra-Kurla Complex, Bandra East, Mumbai - 400 051
The following Secured Redeemable Non-Convertible Debentures of the Company are listed on the BSE:
Sl. No. Description Face Value (as on issue date)
1. 10.34% Secured Redeemable Non-convertible Debentures ` 10 lakhs each
2. 10.60% Secured Redeemable Non-convertible Debentures ` 10 lakhs each
3. 10.60% Secured Redeemable Non-convertible Debentures ` 10 lakhs each
4. 10.02% Secured Redeemable Non-convertible Debentures ` 10 lakhs each
5. 10.02% Secured Redeemable Non-convertible Debentures ` 10 lakhs each
6. 10.40% Secured Redeemable Non-convertible Debentures ` 10 lakhs each
7. 10.50% Secured Redeemable Non-convertible Debentures. ` 10 lakhs each
8. 10.60% Secured Redeemable Non-convertible Debentures. ` 10 lakhs each
9. 9.65% Secured Redeemable Non-convertible Debentures. ` 10 lakhs each
10. 9.72% Secured Redeemable Non-convertible Debentures. ` 10 lakhs each
The Company has paid Annual Listing Fees as applicable, to the BSE and the NSE for the financial years 2017-18 and 2018-19.
The 4.75% Fixed Rate Senior Unsecured Foreign Currency Denominated Notes due 2019 (FCNs) aggregating to US$500 million and the 5.25% Fixed Rate Senior Unsecured Foreign Currency Denominated Notes due 2022 (FCNs) aggregating to US$500 million issued by the Company in the International Market have been listed on the Singapore Exchange Securities Trading Limited (the “SGX-ST”), 2 Shenton Way, #19-00 SGX Centre 1, Singapore 068804. The one time Listing fees has been paid by the Company to the SGX.

201
Better Everyday. In Pursuit of Excellence. Corporate Overview Statutory Reports Financial Statements
vi. Stock Code:
BSE Limited (BSE) National Stock Exchange of India Limited (NSE)
Equity Preference Debentures Equity Preference Debentures
500228 700085 (10% Cumulative Redeemable
Preference Shares)
949242949396950815950816
JSW STEEL JSWSTEEL P1 (10% Cumulative
Redeemable Preference Shares)
(N.A.)
717502 (0.01% Cumulative Redeemable
Preference Shares)
950820951446951447946501948841946364
JSWSTEEL P2 (0.01% Cumulative
Redeemable Preference Shares)
ISIN No. for Dematerialisation of listed Shares and Debentures:
Equity : INE019A01038
Preference: INE019A04016 (10% cumulative redeemable preference shares)INE019A04024 (0.01% cumulative redeemable preference shares)
Debentures: INE019A07258 – 10.02% NCDs of `10 lakhs each INE019A07266 – 10.02% NCDs of ` 10 lakhs each INE019A07324 – 10.40% NCDs of ` 10 lakhs each INE019A07340 – 10.50% NCDs of ` 10 lakhs each INE019A07357 – 10.60% NCDs of ` 10 lakhs eachINE019A07399 – 9.65% NCDs of ` 10 lakhs each INE019A07407 – 9.72% NCDs of ` 10 lakhs each INE019A07183 – 10.60% NCDs of ` 10 lakhs each INE019A07241 – 10.34% NCDs of ` 10 lakhs eachINE019A07167 – 10.60% NCDs of ` 10 lakhs each
FCNs: XS1133588233
XS1586341981
Debenture Trustees:
IDBI Trusteeship Services Limited Asian Building, Ground Floor, 17th R. Kamani Marg, Ballard Estate, Mumbai - 400 001.
Axis Trustee Services Limited
2nd Floor, Axis House, Bombay Dyeing Mills Compound Pandurang Budhkar Marg, Worli, Mumbai 400 025.
vii. Market Price Data: The monthly high/low market price of the shares and the quantities traded during the year 2017-18 on BSE Limited and
National Stock Exchange of India Limited are as under:
Month BSE LIMITED NATIONAL STOCK EXCHANGE OF INDIA LIMITED
Month’s High Price
(In ` per share)
Month’s Low Price
(In ` per share)
No. of Shares traded
Month’s High Price
(In ` per share)
Month’s Low Price
(In ` per share)
No. of Shares traded
Apr-17 207.00 185.35 1,05,10,767 207.00 185.20 11,25,52,188
May-17 209.35 184.30 1,59,64,478 209.45 184.10 15,88,80,473
Jun-17 208.85 189.45 1,19,89,586 208.80 189.30 11,03,20,197
Jul-17 221.90 203.50 83,87,286 221.95 203.50 9,15,20,056
Aug-17 260.65 215.20 80,50,775 260.30 215.20 9,73,45,345
Sep-17 271.80 229.25 1,04,08,136 271.80 229.50 9,11,47,312
Oct-17 269.50 244.95 74,27,366 269.65 244.25 6,70,14,803
Nov-17 277.00 253.25 70,05,717 274.50 253.10 5,40,88,347
Dec-17 275.40 237.90 36,89,833 275.60 237.60 5,05,50,274
Jan-18 300.00 261.70 81,82,606 300.45 261.70 9,33,36,937
Feb-18 320.50 275.00 1,04,60,325 320.45 265.60 12,86,91,745
Mar-18 318.00 275.00 92,78,770 317.80 276.35 10,48,87,606

202
JSW Steel Limited | Integrated Report 2017-18
viii. Performance of Share Price in comparison to S&P BSE 100:
ix. Performance of Share Price in comparison to Nifty Next 50:
100.00
125.00
150.00
175.00
200.00
225.00
250.00
275.00
300.00
325.00
Apr-17 Jun-17 Aug-17 Oct-17 Dec-17 Feb-18
JSW Share Price S & P BSE 100
100.00
125.00
150.00
175.00
200.00
225.00
250.00
275.00
300.00
325.00
Apr-17 Jun-17 Aug-17 Oct-17 Dec-17 Feb-18
JSW Share Price Nifty Next 50
x. Percentage Change in comparison to broad based indices – Sensex and Nifty as on 31.03.2018:
Financial Year
JSW Share Price
(%)
Sensex (%)
JSW Share Price
(%)
Nifty (%)
2017-18 53.05 11.30 53.25 10.24
2016-17 46.28 16.88 46.52 33.92
2015-16 41.08 -9.36 41.55 -3.50
2014-15 -12.35 24.88 -12.50 26.65
2013-14 154.39 118.00 154.09 117.97
2012-13 85.03 108.23 85.24 104.00
2011-12 86.09 89.50 86.01 93.66
xi. Registrar & Share Transfer Agents: Karvy Computershare Private Limited Karvy Selenium Tower B, Plot 31-32, Gachibowli,
Financial District Nanakramguda, Hyderabad – 500 032 Tel. No. 040 67161500 Fax. No. 040 23001153 E-mail: [email protected] Website: www.karvycomputershare.com
xii. Share Transfer/Transmission System: Requests for Transfer/Transmission of Shares held in
physical form can be lodged with Karvy Computershare Private Limited at the above mentioned address. The requests are normally processed within 15 days of receipt of the documents, if documents are found in
order. Shares under objection are returned within two weeks.
SEBI has vide its circular dated January 7, 2010 made it mandatory to furnish a copy of PAN Card in the following cases for transmission of shares in physical form:
a) Deletion of name of the deceased shareholder(s), where the shares are held in the name of two or more shareholders.
b) Transmission of shares to the legal heir(s), where deceased shareholder was the sole holder.
c) Transposition of shares in case of change in the order of names in which physical shares are held jointly in the names of two or more shareholders.
The Board has delegated the authority for approving transfers, transmissions etc. of the Company’s securities to the Share/Debenture Transfer Committee. The decisions of Share/ Debenture Transfer Committee are placed at the next Board Meeting. The Company obtains from a Company Secretary in Practice, a half yearly certificate of compliance with the share transfer formalities as required under the Regulation 40(9) of the SEBI (LODR Regulations) and files a copy of the certificate with the Stock Exchanges.

203
Better Everyday. In Pursuit of Excellence. Corporate Overview Statutory Reports Financial Statements
xiii. Distribution of Shareholding: The distribution of shareholding by size as on 31.03.2018 is given below:
Sl. No. No. of Equity Shares No. of Shareholders % of Shareholders No. of Shares held % of Shareholding
Category (Shares) No. of Holders % to Holders No. of Shares % to Equity
1 1 - 500 569296 93.72 43653380 1.81
2 501 - 1000 19383 3.19 15160365 0.63
3 1001 - 2000 9755 1.61 13833931 0.57
4 2001 - 3000 3925 0.65 9515896 0.39
5 3001 - 4000 1148 0.19 4058669 0.17
6 4001 - 5000 857 0.14 3971041 0.16
7 5001 - 10000 1386 0.23 9833025 0.41
8 10001 - 20000 613 0.10 8679958 0.36
9 20001 and above 1053 0.17 2308514175 95.50
TOTAL 607416 100.00 2417220440 100.00
xiv. Shareholding Pattern:
Category As on 31.03.2018 As on 31.03.2017
No. of Holders
No. of Shares
% of holding No. of Holders No. of Shares % of holding
Promoters 42 1009155180 41.75 42 1006102180 41.62
Promoters Trust 6 600 0.00 0 0 0.00
NRI 9266 30865014 1.28 9530 32172918 1.33
FII 542 480062536 19.86 470 482348965 19.95
OCB 2 9660 0.00 3 10660 0.00
FBC 3 362584730 15.00 3 362584730 15.00
IFI 7 8369980 0.35 7 7415017 0.31
IMF 86 58562246 2.42 91 25827246 1.07
Banks 29 240117 0.01 31 287711 0.01
Employees 744 381242 0.02 1419 409045 0.02Bodies Corporate
2473 199207352 8.24 2755 204949113 8.48
Public 588499 225104609 9.31 691875 260909824 10.79
Trust 19 313622 0.01 18 14422090 0.60
HUF 5679 19305731 0.80 6152 19745261 0.82Employees Welfare Trust
1 10988860 0.45 1 40 0.00
NBFC 15 25845 0.00 15 34930 0.00
I E P F 1 12027406 0.50 0 0 0.00
A I F 1 15000 0.00 0 0 0.00
Transit A/C 1 710 0.00 1 710 0.00
Total 607416 2417220440 100.00 712413 2417220440 100.00

204
JSW Steel Limited | Integrated Report 2017-18
xv. Top 10 Shareholders as on 31.03.2018:
Sl. No. Name Shares %
1 JFE STEEL INTERNATIONAL EUROPE B.V. 362583070 15.00
2 JSW TECHNO PROJECTS MANAGEMENT LTD 229326950 9.49
3 JSW HOLDINGS LIMITED 177306230 7.34
4 VIVIDH FINVEST PRIVATE LIMITED 140726690 5.82
5 SAHYOG HOLDINGS PRIVATE LIMITED 110597360 4.58
6 JSW POWER TRADING COMPANY LIMITED 70038350 2.90
7 VIRTUOUS TRADECORP PRIVATE LIMITED 60368250 2.50
8 DANTA ENTERPRISES PRIVATE LIMITED 60368250 2.50
9 GAGANDEEP CREDIT CAPITAL PVT LTD 45982650 1.90
10 NALWA SONS INVESTMENTS LTD 45486370 1.88
xvi. Geographical Distribution of Shareholders as on 31.03.2018:
Sl. No.
City Physical Holders Electronic Holders Total Shareholders
Cases Shares % Cases Shares % Cases Shares %
1 AGRA 1283 89690 0.00 1968 234606 0.01 3251 324296 0.01
2 AHMEDABAD 7248 741910 0.03 22208 153095480 6.33 29456 153837390 6.36
3 BENGALURU 5069 5351790 0.22 13377 21016519 0.87 18446 26368309 1.09
4 KOLKATA 7599 851360 0.04 15303 5700042 0.24 22902 6551402 0.27
5 CHANDIGARH 1322 121480 0.01 1959 330978 0.01 3281 452458 0.02
6 CHENNAI 4336 578850 0.02 9865 15035827 0.62 14201 15614677 0.65
7 COIMBATORE 3319 1039110 0.04 3326 1512068 0.06 6645 2551178 0.11
8 GANDHI NAGAR 2491 164050 0.01 8341 736530 0.03 10832 900580 0.04
9 GHAZIABAD 932 92200 0.00 2434 323213 0.01 3366 415413 0.02
10 HISSAR 1278 238530 0.01 1183 46216168 1.91 2461 46454698 1.92
11 HOWRAH 1048 122510 0.01 2359 375231 0.02 3407 497741 0.02
12 HYDERABAD 2969 351640 0.01 8232 2030866 0.08 11201 2382506 0.10
13 INDORE 1472 129080 0.01 3544 510268 0.02 5016 639348 0.03
14 JAIPUR 2871 239770 0.01 7740 1811713 0.07 10611 2051483 0.08
15 JAMNAGAR 1215 95230 0.00 2844 288705 0.01 4059 383935 0.02
16 KANPUR 2134 198320 0.01 3680 644645 0.03 5814 842965 0.03
17 LUCKNOW 1558 118950 0.00 2917 347052 0.01 4475 466002 0.02
18 MEHSANA 1691 96560 0.00 3717 417733 0.02 5408 514293 0.02
19 MUMBAI 21635 3802470 0.16 61626 2006972399 83.03 83261 2010774869 83.19
20 NEW DELHI 15989 1941570 0.08 26284 40825612 1.69 42273 42767182 1.77
21 PATNA 922 84730 0.00 2033 274642 0.01 2955 359372 0.01
22 PUNE 2964 325540 0.01 9759 4310589 0.18 12723 4636129 0.19
23 RAJKOT 1810 141690 0.01 6497 938245 0.04 8307 1079935 0.04
24 SURAT 2646 207970 0.01 10186 1356688 0.06 12832 1564658 0.06
25 THANE 1889 266540 0.01 8178 1245595 0.05 10067 1512135 0.06
26 VADODARA 3734 282460 0.01 10051 1438902 0.06 13785 1721362 0.07
27 OTHERS 85872 10940558 0.45 170509 80615566 3.34 256381 91556124 3.79
TOTAL: 187296 28614558 1.18 420120 2388605882 98.82 607416 2417220440 100.00
xvii. Corporate Benefits to Shareholders: a) Dividend declared for the last eight years:
Financial Year Dividend Declaration Date Dividend Rate (%)
2016-17 29.06.2017 225.00
2015-16 26.07.2016 75.00
2014-15 28.07.2015 110.00
2013-14 31.07.2014 110.00
2012-13 30.07.2013 100.00
2011-12 25.07.2012 75.00
2010-11 25.07.2011 122.50
2009-10 29.06.2010 95.00

205
Better Everyday. In Pursuit of Excellence. Corporate Overview Statutory Reports Financial Statements
b) Unclaimed Dividends:
The Ministry of Corporate Affairs (‘MCA’) has notified the provisions of Section 124 of the Companies Act, 2013 (‘Act, 2013) and the Investor Education and Protection Fund Authority (Accounting, Audit, Transfer and Refund) Rules, 2016 (“IEPF RULES”) w.e.f. 07.09.2016.
Under Section 124 (5) of the Companies Act, 2013, dividends that are unclaimed/un-paid for a period of seven years, are to be transferred statutorily to the Investor Education and Protection Fund (IEPF) administered by the Central Government. To ensure maximum disbursement of unclaimed dividend, the Company sends reminders to the concerned investors at appropriate intervals.
The unpaid/unclaimed dividends upto the financial year ended 31.03.1995 has been transferred to the General Revenue Account of the Central Government. Members, who have not claimed their dividend for the said period till date, may claim the amount from the Registrar of Companies, Maharashtra Mumbai. Apart from the above, the Company has transferred the unpaid dividends for the FY 2009-10 to the IEPF. The Members of the Company who have not yet encashed their dividend warrant(s) for the FY 2010-11 and thereafter, may write to the Company’s R&T Agent immediately.
Pursuant to Section 124 (5) of the Companies Act, 2013, the unpaid dividends that are due for transfer to the Investor Education and Protection Fund are as follows:
Financial Year Date of Declaration of Dividend
Percentage of Dividend Declared
Unclaimed Dividend Amount as on
31.03.2018
Due for transfer to IEPF
2010-2011 25.07.2011 122.50% 262,03,256.00 31.08.2018
2011-2012 25.07.2012 75% 142,48,265.00 31.08.2019
2012-2013 30.07.2013 100% 226,09,071.00 06.09.2020
2013-2014 31.07.2014 110% 236,28,446.00 07.09.2021
2014-2015 28.07.2015 110% 242,76,900.66 04.09.2022
2015-2016 26.07.2016 75% 182,14,844.00 05.09.2023
2016-2017 29.06.2017 225% 523,32,369.00 05.08.2024
Members who have not encashed their dividend warrants pertaining to the aforesaid years may approach the Company or its Registrar, for obtaining payments thereof atleast 20 days before they are due for transfer to the said fund.
c) Transfer of Shares to Investor Education and Protection
Fund:
Pursuant to the provisions of the Companies Act, 2013 read with the second proviso to Rule 6 of Investor Education and Protection Fund Authority (Accounting, Audit, transfer and refund) Rules, 2016 (“the rules”), all shares in respect of which dividend has not been en-cashed or claimed by the shareholders for seven consecutive years (seven years period completed by October 2017) or more should be transferred by the Company to the Demat Accounts opened with National Securities Depository Limited (NSDL) or Central Depository Services Limited (CDSL) by Investor Education and Protection Fund (IEPF) Authority by 31st October 2017.
Accordingly, 1,20,27,406 equity shares pertaining to 1,08,072 folios in respect of which dividend
has been not been paid or claimed for seven consecutive years or more by shareholders, has been transferred to the designated demat account of the IEPF Authority maintained with CDSL through SBI Cap Securities during 01.12.2017 to 16.12.2017.
Refund process guidelines to facilitate the Claimants
refund by IEPF Authority:
1) Any person, whose shares, unclaimed dividend, matured deposits, matured debentures, application money due for refund, or interest thereon, sale proceeds of fractional shares, redemption proceeds of preference shares, etc. has been transferred to the IEPF, may claim the shares under proviso to sub-section (6) of Section 124 or apply for refund under clause (a) of sub-section (3) of Section 125 or under proviso to sub-section (3) of Section 125, as the case may be, to the Authority by making an application in Form IEPF- 5 available online on website www.iepf.gov.in along with fee, as decided by the Authority from time to time, in consultation with the Central Government, under his own signature.

206
JSW Steel Limited | Integrated Report 2017-18
2) The claimant shall after making an application online in Form IEPF-5 under rule (1) send the same duly signed by him along with requisite documents as enumerated in Form IEPF-5 to the concerned Company at its Registered Office for verification of his claim.
3) The Company shall within fifteen days of receipt of claim form, send a verification report to the IEPF Authority in the format specified by the Authority along with all documents submitted by the claimant.
4) After verification of the entitlement of the claimant-(a) to the amount claimed, the Authority and then the Drawing and Disbursement Officer of the Authority shall present a bill to the Pay and Accounts Office for e-payment as per the guidelines. (b) to the shares claimed, the Authority shall issue a refund sanction order with the approval of the Competent Authority and shall either credit the shares which are lying with depository participant in IEPF suspense account (name of the Company) to the demat account of the claimant to the extent of the claimant’s entitlement or in case of the physical certificates, if any, cancel the duplicate certificate and transfer the shares in favour of the claimant.
d) Unclaimed shares:
As per Clause 5A(II) of the erstwhile Listing Agreement, the Company after sending three
reminders on June 23, 2011, August 25, 2011 and October 31, 2011 to the registered address of the shareholders of the Company and on 23.01.2014, 21.03.2014 and 02.05.2014 to the registered address of the shareholders of the erstwhile JSW Ispat Steel Limited who became shareholders of the Company consequent to the merger, requesting for correct particulars to dispatch the undelivered share certificates, for shares issued in physical form which remained unclaimed, transferred 707,359 shares to a dedicated demat account styled as “Unclaimed Suspense Account” opened with Stock Holding Corporation of India.
Any corporate benefits in terms of securities accruing on aforesaid shares viz. bonus shares, split, etc., shall be credited to the “Unclaimed Suspense Account” duly opened with Stock Holding Corporation of India Limited and dividend to the “Unclaimed Suspense Account” opened with Vijaya Bank.
As and when the rightful owner of such shares approaches the Company at a later date, the Company shall credit the shares lying in the “Unclaimed Suspense Account” to the rightful owner to the extent of his/her entitlement after proper verification of the identity of the rightful owner.
As per Schedule V (F) of the SEBI (LODR) Regulations, the Company reports the following details in respect of equity shares and Preference Shares lying in the suspense account:
JSW Steel Ltd. – Equity Shares Unclaimed Suspense Account
(Number of Equity shares disclosed in the table below are after sub-division of equity shares of ` 10/- face value into 10 equity shares of ` 1/- face value):
Description Number of Share Holders
Number of Equity Shares
Aggregate Number of shareholders and the outstanding shares in the suspense account lying as on 01.04.2017
50738 6561410
Number of Shareholders who approached issuer for transfer of shares from suspense account during the year ended 31.3.2018
290 72980
Number of shareholders to whom shares were transferred from suspense account during the year ended 31.3.2018
290 72980
Unclaimed Shares Transferred to IEPF on 16.12.2017 36467 4715140
Aggregate number of shareholders and the outstanding shares in the suspense account lying as at year ended 31.3.2018
13981 1773290

207
Better Everyday. In Pursuit of Excellence. Corporate Overview Statutory Reports Financial Statements
JSW Steel Ltd. – Preference Shares Unclaimed Suspense Account:
Description Number of Share Holders
Number of Equity Shares
Aggregate Number of shareholders and the outstanding shares in the suspense account lying as on 01.04.2017
25161 2710355
Number of Shareholders who approached issuer for transfer of shares from suspense account during the year ended 31.3.2018
103 8985
Number of shareholders to whom shares were transferred from suspense account during the year ended 31.3.2018
103 8985
Aggregate number of shareholders and the outstanding shares in the suspense account lying as at year ended 31.3.2018
25058 2701370
The voting rights on the shares outstanding in the suspense accounts as on 31 March 2018 shall remain frozen till the rightful owner of such shares claims the shares.
e) De-materialisation of Shares and Liquidity:
The Company has arrangements with both National Securities Depository Limited (NSDL) and Central Depository Services (India) Limited (CDSL) for demat facility. 238,86,05,882 Equity Shares aggregating to 98.82% of the total Equity Capital is held in dematerialised form as on 31.03.2018 of which 94.63% (228,73,30,729 Equity Shares) of total equity capital is held in NSDL & 4.19% (10,12,75,153 Equity Shares) of total equity capital is held in CDSL as on 31.3.2018.
DEMATERIALISATION OF SHARES
PHYSICAL NSDL CDSL
94.63%
4.19%
1.18%
f) Physical Share Purchase Scheme:
Having regard to the difficulties experienced by the shareholders in disposing off their shares held in physical form and to mitigate the hardship caused to them, the Company has in consultation with Karvy Computershare Private Limited framed a scheme for purchase of Equity Shares in physical mode at the prevailing market price.
The Resident Indian Shareholder holding shares in physical segment, interested in the Scheme may lodge/send the application form along with enclosures to Karvy Computershare Private Limited, Hyderabad.
The Equity Share in physical mode tendered by the shareholders under the scheme are sold by Karvy at the prevailing market price and the net sale proceeds thereof are distributed to the concerned shareholders. The shareholders who wish to avail benefit of the scheme may kindly contact Karvy.
g) National Electronic Clearing Service (NECS):
As per the directive from Securities and Exchange Board of India dated March 21, 2013, companies whose securities are listed on the Stock Exchanges shall use any Reserve Bank of India (RBI) approved electronic mode of payment such as ECS [LECS(Local ECS) / RECS (Regional ECS)/NECS (National ECS)]/ NEFT etc., for making cash payments to investors.
The Company will remit the dividend payment through National Electronic Clearing Service (NECS) to the shareholders having accounts with Branches of Banks covered under CBS (Core Banking Solution).
Equity Shareholders holding shares in physical form, who wish to avail the NECS facility, may send their NECS mandate in the format attached to the Company’s R & T Agents, in the event they have not done so earlier. Equity Shareholders holding shares in electronic mode may furnish their new Bank Account Number allotted to them by their bank after implementation of CBS, alongwith a photocopy of a cheque pertaining to the concerned account, or the NECS mandate to their Depositary Participant (DP), at the earliest.

208
JSW Steel Limited | Integrated Report 2017-18
h) Green Initiative for Paperless Communications:
The Ministry of Corporate Affairs (MCA) has taken a “Green Initiative in Corporate Governance” by allowing service of documents by a Company to its Members through electronic mode. The move of the ministry allows public at large to contribute to the green movement.
Keeping in view the underlying theme, the Company will continue to send various communications and documents like notice calling general meetings, audited financial statements, directors’ report, auditor’s report etc., in electronic form, to the email address provided by the Members to the Depositories or to the Company.
This is also an opportunity for every shareholder of JSW Steel Limited to contribute to this Corporate Social Responsibility initiative of the Company. To support this green initiative in full measure, members who have not registered their e-mail addresses so far, are requested to register their e-mail addresses, in respect of electronic holdings with the Depository through their concerned Depository Participant. Members who hold shares in physical form are requested to fill in the Registration form which can be obtained from Company’s Registrar Karvy Computershare Private Limited or downloaded from the Company’s website www.jsw.in under the Section “Investors”, and register the same with the Company’s Registrar.
i) Nomination Facility:
Pursuant to the provisions of the Companies Act, 2013, members are entitled to make nominations in respect of shares held by them. Members holding shares in physical form and intending to make/change the nomination in respect of their shares in the Company may submit their requests in Form No. 2B to the Company’s Registrar, Karvy Computershare Private Limited. Members holding shares in electronic form may submit their nomination requests to their respective Depository Participants directly. Form No. 2B can be obtained from Company’s Registrar, Karvy Computershare Private Limited or downloaded from the Company’s website www. jsw.in under the Section ‘Investors’
j) Outstanding GDRs/ADRs or Warrants or any Convertible
Instrument, conversion dates and likely impact on
equity:
There are no outstanding GDRs/ADRs or Warrants or any Convertible Instrument as on 31.3.2018.
k) Commodity Price Risk or Foreign Exchange Risk and
Hedging Activities:
A comprehensive financial and commodity risk management programme supports the achievement of an organisation’s objectives by enabling the identification and evaluation of risks, setting acceptable risk thresholds, identifying and mapping controls against these risks and implementing policies and procedures to manage and monitor the risks.
The Company has in place a Board approved policy which establishes the financial and commodity risk management framework and defines the procedures and controls for the effective management of the Company’s risks that arise due to imports of raw material, capex, debt servicing and exports of finished steel.
Currency Hedging and Commodity Hedging is as guided by Risk management policy approved by Board and the same is reviewed by Board committee of independent directors each quarter.
l) Registered Office:
JSW Centre, Bandra-Kurla Complex, Bandra (East), Mumbai - 400 051.
m) Plant Locations:
Vijayanagar: P.O. Vidyanagar, Toranagallu Village, Sandur Taluk, Dist. Bellary, Karnataka - 583 275
Dolvi: Geetapuram, Dolvi Village, Pen Taluk, Dist. Raigad, Maharashtra - 402 107
Salem: Pottaneri, M Kalipatti Village, Mecheri Post, Mettur Taluk, Salem Dist., Tamil Nadu - 636 453.
n) Address for Investor Correspondence:
1. Retail Investors
a) For Securities held in Physical form
Karvy Computershare Private Limited Karvy Selenium Tower B, Plot 31-32, Gachibowli, Financial District, Nanakramguda, Hyderabad - 500 008
Tel. No. 040 - 67161500 Fax. No. 040 - 23001153 E-mail: [email protected] Website: www.karvy.com
b) For Securities held in Demat form
The investor’s Depository Participant and/or Karvy Computershare Private Limited

209
Better Everyday. In Pursuit of Excellence. Corporate Overview Statutory Reports Financial Statements
c) JSW Steel Limited – Investor Relation Center
JSW Centre, Bandra-Kurla Complex, Bandra (East), Mumbai – 400 051 Phone No. 022 – 42861000 Fax No. 022 – 42863000
2. Institutional Investors:
Mr. Pritesh Vinay, Vice President (Capital Markets and Investor Relations),
JSW Centre, Bandra-Kurla Complex, Bandra (E), Mumbai – 400 051
Tel. No. 022 – 42861000 Fax No. 022 – 42863000
3. Designated exclusive e-mail ID for Investor servicing:
4. Toll Free Number of R & T Agent’s exclusive call
Centre: 1-800-3454001
5. Web-based Query Redressal System
Web-based Query Redressal System has been extended by the Registrars and Share Transfer Agent for redressal of Shareholders’ queries. The Shareholder can visit http://karisma.karvy. com and click on “investors” option for query registration after free identity registration.
After logging in, Shareholders can submit their query in the “QUERIES” option provided on the website, which would give the grievance registration number. For accessing the status/ response to their query, the same number can be used at the option “VIEW REPLY” after 24 hours. The Shareholders can continue to put additional queries relating to the case till they are satisfied.
xviii. Non-Compliance of any Requirement of Corporate
Governance:
There are no instances of non-compliance of any requirement of Corporate Governance Report as mentioned in sub-paras (2) to (10) of Para (C) of Schedule V. The Company has been regularly submitting the quarterly compliance report to the Stock Exchanges as required under Regulation 27 of the SEBI (LODR) Regulations 2015.
xix. Adoption of Discretionary Requirements:
The status of adoption of discretionary requirements of Regulation 27(1) as specified under Part E of Schedule II of the SEBI (LODR) Regulations 2015 is provided below:
i. Non-Executive Chairperson’s entitlement to maintain Chairman’s Office and reimbursement of expenses incurred: Not applicable as the Company does not have a Non-Executive Chairperson.
ii. Shareholders’ Rights: Quarterly financial results are sent to the Shareholders’ through e-mail. The Quarterly, Half Yearly, Nine Monthly and Annual financial performance including summary of significant events are published in the newspapers, communicated to the stock exchanges and also posted on the Company’s website.
iii. Modified Opinion in Auditors Report: The Company’s financial statement for the financial year 2017-18 does not contain any modified audit opinion.
iv. Separate posts of Chairman and Managing Director or CEO: The Chairman’s Office is not separate from that of the Managing Director.
v. Reporting of Internal Auditor: The Internal Auditor reports to the Audit Committee.
12. Corporate Ethics: The Company adheres to the highest standards of
business ethics, compliance with statutory and legal requirements and commitment to transparency in business dealings. A Code of Conduct for Board Members and Senior Management and JSWSL Code of Conduct to Regulate, Monitor and Report Trading by Insiders (formerly known as Code of Conduct for Prevention of Insider Trading) as detailed below has been adopted pursuant to Clause 49 (E) of the erstwhile Listing Agreement & the Securities Exchange Board of India (Prohibition of Insider Trading) Regulations, 2015, respectively:
a) Code of Conduct for Board Members and Senior
Management:
The Board of Directors of the Company adopted a revised Code of Conduct for Board Members and Senior Management at their meeting held on 21.10.2014. The Code Highlights Corporate Governance as the cornerstone for sustained management performance, for serving all the stakeholders and for instilling pride of association. The above Code supersedes the earlier Code of Conduct for Board Members and Senior Management approved by the Board in its meetings held on 28.1.2014, 24.10.2008 and 20.10.2005.
The Code is applicable to all Board of Directors and specified Senior Management Executives. The Code impresses upon Directors and Senior Management Executives to uphold the interest of the Company and its stakeholders and to endeavour to fulfil all the fiduciary obligations towards them. Another important principle on which the code is based

210
JSW Steel Limited | Integrated Report 2017-18
is that the Directors and Senior Management Executives shall act in accordance with the highest standards of honesty, integrity, fairness and ethical conduct and shall exercise utmost good faith, due care and integrity in performing their duties. The Code has been posted on the website of the Company www.jsw.in.
Declaration affirming compliance of Code of Conduct
The Company has received confirmations from all the Board of Directors as well as Senior Management Executives regarding compliance of the Code of Conduct during the year under review.
A declaration by the Jt. Managing Director and Group CFO affirming compliance of Board Members and Senior Management Personnel to the Code is also annexed herewith.
b) JSWSL Code of Conduct to Regulate, Monitor and
Report Trading by Insiders:
The Company adopted a Code of Conduct for Prevention of Insider Trading for its Management, Staff and Directors on 29 October, 2002. The Code (known as the “JSWSL Code of Conduct to Regulate, Monitor and Report Trading by Insiders”) lays down guidelines and procedures to be followed and disclosures to be made by Directors, Top Level Executives and Staff whilst dealing in shares of the Company.
Minor modifications were made to the Code in line with the amendments made to the “Securities and Exchange Board of India" (Prohibition of Insider Trading) (Amendment) Regulations, 2008, by SEBI. The amended code was adopted by the Board in its meeting held on 7.5.2009.
SEBI thereafter, to put in place a framework for prohibition of Insider Trading and to strengthen the legal framework, notified the “Securities Exchange Board of India" (Prohibition of Insider Trading) Regulations, 2015. In order to comply with the mandatory requirement of the Regulations, the Code of Conduct for prevention of Insider Trading was revised to bring it in line with the new 2015 Regulations. The new code “JSWSL Code of Conduct to Regulate, Monitor and Report Trading by Insiders” was adopted by the Board in its meeting held on 21.10.2015. This Code supersedes the earlier “JSWSL Code of Conduct for Prevention of Insider Trading”.
The policy and the procedures are periodically communicated to the employees who are considered as insiders of the Company. Trading window closure is intimated to all employees and to the Stock Exchange in advance, whenever required.
The Company Secretary has been appointed as the Compliance Officer and is responsible for adherence to the Code.
c) Reconciliation of Share Capital Audit Report:
Reconciliation of Share Capital Audit Report in terms of SEBI Circular No. CIR/MRD/DP/30/2010 dated 06.09.2010 and SEBI Directive no. D&CC/FITTC/CIR-16/2002 dated 31.12.2002, confirming that the total issued capital of the Company is in agreement with the total number of shares in physical form and the total number of dematerialised shares held with National Securities Depository Limited and Central Depository Services (India) Limited, is placed before the Board on a quarterly basis and is also submitted to the Stock Exchanges where the shares of the Company are listed.
d) Internal Checks and Balances:
Wide use of technology in the Company’s financial reporting processes ensures robustness and integrity. The Company deploys a robust system of internal controls to allow optimal use and protection of assets, facilitate accurate and timely compilation of financial statements and management reports and ensure compliance with statutory laws, regulations and Company policies. The Company has both external and internal audit systems in place. Auditors have access to all records and information of the Company. The Board and the management periodically review the findings and recommendations of the auditors and take necessary corrective actions whenever necessary. The Board recognises the work of the auditors as an independent check on the information received from the management on the operations and performance of the Company.
e) Legal Compliance of the Company’s Subsidiaries:
Periodical Management audit ensures that the Company‘s Subsidiaries conducts its business with high standards of legal, statutory and regulatory compliances. As per the report of the Management Auditors, there has been no material non-compliance with the applicable statutory requirements by the Company and its subsidiaries.

211
Better Everyday. In Pursuit of Excellence. Corporate Overview Statutory Reports Financial Statements
f) Human Rights Policy
In line with JSW’s heritage as a responsible corporate citizen and its commitment to respecting the economic, social, cultural, political and civil rights of individuals involved in and impacted by its operations, the Board of Directors in its meeting held on 20.01.2010 has approved a Formal Human Rights Policy for adoption by the Company and all its Subsidiaries as part of its global personnel policies, in line with the practice followed internationally by Companies of Repute. A few minor changes were made to the policy by the Board in its meeting held on 28.01.2013 to bring it in line with the requirements of Business responsibility reporting. JSW’s policy on human rights applies to all its businesses processes and is a part of its commitment to ethical and socially responsible behaviour across its value chain.
JSW contributes to the fulfilment of human rights through compliance with local human rights legislation wherever it has operations, as well as through its policies, programmes and grievance redressal mechanism. JSW upholds international human rights standards, does not condone human rights abuses and creates & nurtures a working environment where human rights are respected without prejudice.
Compliance Certificate by Auditors: The Company has obtained a certificate from the Statutory Auditors regarding compliance of conditions of Corporate Governance as stipulated under Schedule V (E) of the SEBI (LODR) Regulations which is annexed herewith.

212
JSW Steel Limited | Integrated Report 2017-18
Declaration Affirming Compliance of Code of Conduct
As provided under Regulation 26(3) of the Securities and Exchange Board of India (Listing Obligations & Disclosure Requirements) Regulations, 2015, the Board Members and the Senior Management Personnel have confirmed compliance with the Code of Conduct for the year ended 31.03.2018.
For JSW Steel Limited
Place: Mumbai Seshagiri Rao M.V.S.Date: 16 May 2018 Jt. Managing Director & Group CFO

213
Better Everyday. In Pursuit of Excellence. Corporate Overview Statutory Reports Financial Statements
Independent Auditor’s Report on compliance with the conditions of Corporate Governance
as per the provisions of Chapter IV of the Securities and Exchange Board of India (Listing Obligations and Disclosure Requirements)
Regulations, 2015
To,The Members of JSW Steel LimitedJSW Centre, Bandra-Kurla Complex,Bandra (East), Mumbai – 400 051.
1. The Corporate Governance Report prepared by JSW Steel Limited (hereinafter the “Company”), contains details as required by the provisions of Chapter IV of Securities and Exchange Board of India (Listing Obligations and Disclosure Requirements) Regulations, 2015, as amended (“the Listing Regulations”) (‘Applicable criteria’) with respect to Corporate Governance for the year ended March 31, 2018. This report is required by the Company for annual submission to the Stock Exchanges and to be sent to the Shareholders of the Company.
Management’s Responsibility2. The preparation of the Corporate Governance Report is the responsibility of the Management of the Company including
the preparation and maintenance of all relevant supporting records and documents. This responsibility also includes the design, implementation and maintenance of internal control relevant to the preparation and presentation of the Corporate Governance Report.
3. The Management along with the Board of Directors are also responsible for ensuring that the Company complies with the conditions of Corporate Governance as stipulated in the Listing Regulations, issued by the Securities and Exchange Board of India.
Auditor’s Responsibility4. Pursuant to the requirements of the Listing Regulations, our responsibility is to express a reasonable assurance in the
form of an opinion whether the Company has complied with the specific requirements of the Listing Regulations referred to in paragraph 3 above.
5. We conducted our examination of the Corporate Governance Report in accordance with the Guidance Note on Reports or Certificates for Special Purposes and the Guidance Note on Certification of Corporate Governance, both issued by the Institute of Chartered Accountants of India (“ICAI”). The Guidance Note on Reports or Certificates for Special Purposes requires that we comply with the ethical requirements of the Code of Ethics issued by the Institute of Chartered Accountants of India.
6. We have complied with the relevant applicable requirements of the Standard on Quality Control (SQC) 1, Quality Control for Firms that Perform Audits and Reviews of Historical Financial Information, and Other Assurance and Related Services Engagements.
7. The procedures selected depend on the auditor’s judgement, including the assessment of the risks associated in compliance of the Corporate Governance Report with the applicable criteria. Summary of key procedures performed include:
i. Reading and understanding of the information prepared by the Company and included in its Corporate Governance Report;
ii. Obtained and verified that the composition of the Board of Directors w.r.t executive and non-executive directors has been met throughout the reporting period;
iii. Obtained and read the Directors Register as on 31 March 2018 and verified that at least one women director was on the Board during the year;

214
JSW Steel Limited | Integrated Report 2017-18
iv. Obtained and read the minutes of the following meetings held from 1 April 2017 to 31 March 2018:
(a) Board of Directors meeting;
(b) Audit committee;
(c) Annual General meeting;
(d) Nomination and remuneration committee;
(e) Stakeholders Relationship Committee;
(f) Independent directors meeting (only attendance records provided); and
(g) Risk management committee;
v. Obtained necessary representations and declarations from the directors of the Company including the independent directors; and
vi. Performed necessary inquiries with the management and also obtained necessary specific representations from the management.
The above-mentioned procedures include examining evidence supporting the particulars in the Corporate Governance Report on a test basis. Further, our scope of work under this report did not involve us performing audit tests for the purposes of expressing an opinion on the fairness or accuracy of any of the financial information or the financial statements of the Company taken as a whole.
Opinion8. Based on the procedures performed by us as referred in paragraph 7 above, and according to the information and
explanations given to us, that we are of the opinion that the Company has complied with the conditions of Corporate Governance as stipulated in the Listing Regulations, as applicable for the year ended 31 March 2018, referred to in paragraph 1 above.
Other matters and Restriction on Use9. This report is neither an assurance as to the future viability of the Company nor the efficiency or effectiveness with
which the management has conducted the affairs of the Company.
10. This report is addressed to and provided to the members of the Company solely for the purpose of enabling it to comply with its obligations under the Listing Regulations with reference to compliance with the relevant regulations of Corporate Governance and should not be used by any other person or for any other purpose. Accordingly, we do not accept or assume any liability or any duty of care or for any other purpose or to any other party to whom it is shown or into whose hands it may come without our prior consent in writing. We have no responsibility to update this report for events and circumstances occurring after the date of this report.
For S R B C & CO LLPChartered AccountantsICAI Firm Registration Number: 324982E/E300003
per Vikram MehtaPartnerMembership Number: 105938
Place of Signature: MumbaiDate: 16 May, 2018

Better Everyday. In Pursuit of Excellence. Corporate Overview Statutory Reports Financial Statements
215
Financial Statements216 Standalone 301 Consolidated

216
JSW Steel Limited | Integrated Report 2017-18
To the Members of JSW Steel Limited
Report on the standalone Ind AS financial statementsWe have audited the accompanying standalone Ind AS financial statements of JSW Steel Limited (“the Company”), which comprise the Balance Sheet as at 31 March 2018, the Statement of Profit and Loss (including Other Comprehensive Income), the Statement of Cash Flow and the Statement of Changes in Equity for the year then ended, and a summary of significant accounting policies and other explanatory information (hereinafter referred to as “the standalone Ind AS financial statements”).
Management’s Responsibility for the standalone Ind AS financial statementsThe Company’s Board of Directors is responsible for the matters stated in Section 134(5) of the Companies Act, 2013 (“the Act”) with respect to the preparation of these standalone Ind AS financial statements that give a true and fair view of the financial position, financial performance including other comprehensive income, cash flows and changes in equity of the Company in accordance with accounting principles generally accepted in India, including the Indian Accounting Standards (Ind AS) specified under section 133 of the Act, read with the Companies (Indian Accounting Standards) Rules, 2015, as amended. This responsibility also includes maintenance of adequate accounting records in accordance with the provisions of the Act for safeguarding of the assets of the Company and for preventing and detecting frauds and other irregularities; selection and application of appropriate accounting policies; making judgments and estimates that are reasonable and prudent; and the design, implementation and maintenance of adequate internal financial control that were operating effectively for ensuring the accuracy and completeness of the accounting records, relevant to the preparation and presentation of the standalone Ind AS financial statements that give a true and fair view and are free from material misstatement, whether due to fraud or error.
Auditor’s ResponsibilityOur responsibility is to express an opinion on these standalone Ind AS financial statements based on our audit. We have taken into account the provisions of the Act, the accounting and auditing standards and matters which are required to be included in the audit report under the provisions of the Act and the Rules made thereunder. We conducted our audit of the standalone Ind AS financial statements in accordance with the Standards on Auditing, issued by the Institute of Chartered Accountants of India, as specified under Section 143(10) of the Act. Those Standards require that we comply with ethical requirements and plan and perform the audit to obtain reasonable assurance about whether the standalone Ind AS financial statements are free from material misstatement.
An audit involves performing procedures to obtain audit evidence about the amounts and disclosures in the standalone Ind AS financial statements. The procedures selected depend on the auditor’s judgment, including the assessment of the risks of material misstatement of the standalone Ind AS financial statements, whether due to fraud or error. In making those risk assessments, the auditor considers internal financial control relevant to the Company’s preparation of the standalone Ind AS financial statements that give a true and fair view in order to design audit procedures that are appropriate in the circumstances. An audit also includes evaluating the appropriateness of accounting policies used and the reasonableness of the accounting estimates made by the Company’s Directors, as well as evaluating the overall presentation of the standalone Ind AS financial statements. We believe that the audit evidence we have obtained is sufficient and appropriate to provide a basis for our audit opinion on the standalone Ind AS financial statements.
OpinionIn our opinion and to the best of our information and according to the explanations given to us, the standalone Ind AS financial statements give the information required by the Act in the manner so required and give a true and fair view in conformity with the accounting principles generally accepted in India, of the state of affairs of the Company as at 31 March 2018, its profit including other comprehensive income, its cash flows and the changes in equity for the year ended on that date.
Other MatterThe Ind AS financial statements of the Company for the year ended 31 March 2017, included in these standalone Ind AS financial statements, have been audited by the predecessor auditor who expressed an unmodified opinion on those statements on May 17, 2017.
Report on Other Legal and Regulatory Requirements1. As required by the Companies (Auditor’s report) Order,
2016 (“the Order”) issued by the Central Government of India in terms of sub-section (11) of section 143 of the Act, we give in the “Annexure 1” a statement on the matters specified in paragraphs 3 and 4 of the Order.
2. As required by section 143 (3) of the Act, we report that:
(a) We have sought and obtained all the information and explanations which to the best of our knowledge and belief were necessary for the purpose of our audit;
(b) In our opinion, proper books of account as required by law have been kept by the Company so far as it appears from our examination of those books;
Independent Auditor’s Report

Better Everyday. In Pursuit of Excellence. Corporate Overview Statutory Reports Financial Statements
217
(c) The Balance Sheet, the Statement of Profit and Loss (including Other Comprehensive Income), the Statement of Cash Flow and the Statement of Changes in Equity dealt with by this Report are in agreement with the books of account;
(d) In our opinion, the aforesaid standalone Ind AS financial statements comply with the Accounting Standards specified under section 133 of the Act, read with Companies (Indian Accounting Standards) Rules, 2015, as amended;
(e) On the basis of written representations received from the directors as on 31 March 2018, and taken on record by the Board of Directors, none of the directors is disqualified as on March 31, 2018, from being appointed as a director in terms of section 164 (2) of the Act;
(f) With respect to the adequacy of the internal financial controls over financial reporting of the Company with reference to these standalone Ind AS financial statements and the operating effectiveness of such controls, refer to our separate Report in “Annexure 2” to this report;
(g) With respect to the other matters to be included in the Auditor’s Report in accordance with Rule 11 of
the Companies (Audit and Auditors) Rules, 2014, in our opinion and to the best of our information and according to the explanations given to us:
i. The Company has disclosed the impact of pending litigations on its financial position in its standalone Ind AS financial statements – Refer Note No. 45 to the standalone Ind AS financial statements;
ii. The Company did not have any long-term contracts including derivative contracts for which there were any material foreseeable losses.
iii. There has been no delay in transferring amounts, required to be transferred, to the Investor Education and Protection Fund by the Company.
For S R B C & CO LLPChartered Accountants
ICAI Firm Registration Number: 324982E/E300003
per Vikram MehtaPartner
Membership No. 105938
Place of Signature: MumbaiDate: 16 May 2018

218
JSW Steel Limited | Integrated Report 2017-18
Annexure 1 referred to in paragraph 1 under the heading “Report on Other Legal and Regulatory Requirements” of our report of even date(i) (a) The Company has maintained proper records
showing full particulars, including quantitative details and situation of fixed assets.
(b) All fixed assets have not been physically verified by the management during the year but there is a regular programme of verification which, in our opinion, is reasonable having regard to the size of the Company and the nature of its assets. No material discrepancies were noticed on such verification.
(c) According to the information and explanations given by the management, the title deeds of immovable properties, included in property, plant and equipment are held in the name of the Company except the following:
Total Number of Cases
As at 31 March 2018(` in Crore)
Gross Block Net Block
Land located at Maharashtra
12 9 9
(ii) The inventory has been physically verified by the management during the year. In our opinion, the frequency of verification is reasonable. No material discrepancies were noticed on such physical verification. Inventories lying with third parties have been confirmed by them and no material discrepancies were noticed in respect of such confirmations.
(iii) According to the information and explanations given to us, the Company has not granted any loans, secured or unsecured to companies, firms, Limited Liability Partnerships or other parties covered in the register maintained under section 189 of the Companies Act, 2013. Accordingly, the provisions of clause 3(iii) (a), (b) and (c) of the Order are not applicable to the Company and hence not commented upon.
(iv) In our opinion and according to the information and explanations given to us, provisions of section 185 and 186 of the Companies Act 2013 in respect of loans and advances given, investments made and, guarantees, and securities given have been complied with by the Company.
(v) The Company has not accepted any deposits within the meaning of Sections 73 to 76 of the Act and the Companies (Acceptance of Deposits) Rules, 2014 (as amended). Accordingly, the provisions of clause 3(v) of the Order are not applicable.
(vi) We have broadly reviewed the books of account maintained by the Company pursuant to the rules made by the Central Government for the maintenance of cost records under section 148(1) of the Companies Act, 2013, related to the manufacture of its products, and are of the opinion that prima facie, the specified accounts and records have been made and maintained. We have not, however, made a detailed examination of the same.
(vii) (a) The Company is generally regular in depositing with appropriate authorities undisputed statutory dues including provident fund, employees’ state insurance, income-tax, sales-tax, service tax, duty of custom, duty of excise, value added tax, goods and service tax, cess and other statutory dues applicable to it.
(b) According to the information and explanations given to us, no undisputed amounts payable in respect of provident fund, employees’ state insurance, income-tax, service tax, sales-tax, duty of custom, duty of excise, value added tax, goods and service tax, cess and other statutory dues were outstanding, at the year end, for a period of more than six months from the date they became payable.
(c) According to the records of the Company, the dues of income-tax, sales- tax, service tax, duty of custom, duty of excise, value added tax and cess on account of any dispute, are as follows:
Annexure 1
Name of statue Nature of Dues
Amount
(` In Crores)*
Period Forum
The Central Excise Act, 1944 Excise Duty 0.04 2004-2005 Supreme Court of India
109 1995-2015 High Court
406 1997-2016Central Excise Service Tax Appellate Tribunal (CESTAT)
46 1998-2018 Asst. Commissioner/ Commissioner
The Custom Act, 1962 Custom Duty 2 2010-2011 Supreme Court of India
419 1995-2016Central Excise Service Tax Appellate Tribunal (CESTAT)
20 2014-2017 Commissioner
The Tamil Nadu Value Added Tax Act, 2006 VAT 1 2006-2012 Asst. Commissioner

Better Everyday. In Pursuit of Excellence. Corporate Overview Statutory Reports Financial Statements
219
Name of statue Nature of Dues
Amount
(` In Crores)*
Period Forum
The Karnataka Value Added Tax Act, 2003 VAT 1 2006-2008 Asst. Commissioner
The Central Sales Tax Act, 1956 CST 29 2011-2012 High Court
33 2012-2013 Commissioner
Chapter V of the Finance Act, 1994 Service Tax 3 2002-2004 High Court
145 2004-2017Central Excise Service Tax Appellate Tribunal (CESTAT)
33 2008-2018 Deputy Commissioner / Commissioner
Income Tax Act, 1961 Income Tax 74 2007-2012 Income Tax Appellate Tribunal (ITAT)
* Net of amounts paid under protest
(viii) In our opinion and according to the information and explanations given by the management, the Company has not defaulted in repayment of loans or borrowing to a financial institution, bank or government or dues to debenture holders.
(ix) In our opinion and according to information and explanations given by the management, monies raised by the Company by way of debt instruments in the nature of foreign currency bonds and term loans were applied for the purpose for which they were raised, though idle/surplus funds which were not required for immediate utilization have been gainfully invested in fixed deposits. The Company has not raised monies by way of initial public offer or further public offer.
(x) Based upon the audit procedures performed for the purpose of reporting the true and fair view of the standalone Ind AS financial statements and according to the information and explanations given by the management, we report that no fraud by the Company or no fraud on the Company by the officers and employees of the Company has been noticed or reported during the year.
(xi) According to the information and explanations given by the management, the managerial remuneration has been paid / provided in accordance with the requisite approvals mandated by the provisions of section 197 read with Schedule V to the Companies Act, 2013.
(xii) In our opinion, the Company is not a Nidhi Company. Therefore, the provisions of clause 3(xii) of the Order are not applicable to the Company and hence not commented upon.
(xiii) According to the information and explanations given by the management, transactions with the related parties are in compliance with section 177 and 188 of Companies Act, 2013 where applicable and the details have been disclosed in the notes to the standalone Ind AS financial statements, as required by the applicable accounting standards.
(xiv) According to the information and explanations given to us and on an overall examination of the balance sheet, the Company has not made any preferential allotment or private placement of shares or fully or partly convertible debentures during the year under review and hence, reporting requirements under clause 3(xiv) of the Order are not applicable to the Company and, not commented upon.
(xv) According to the information and explanations given by the management, the Company has not entered into any non-cash transactions with directors or persons connected with him as referred to in section 192 of Companies Act, 2013.
(xvi) According to the information and explanations given to us, the provisions of section 45-IA of the Reserve Bank of India Act, 1934 are not applicable to the Company.
For S R B C & CO LLPChartered Accountants
ICAI Firm Registration Number: 324982E/E300003
per Vikram MehtaPartner
Membership No. 105938
Place of Signature: MumbaiDate: 16 May 2018

220
JSW Steel Limited | Integrated Report 2017-18
Annexure 2 to the Independent Auditor’s Report of even date on the standalone Ind AS financial statements of JSW Steel LimitedReport on the Internal Financial Controls under Clause (i) of sub-section 3 of Section 143 of the Companies Act, 2013 (“the Act”)
We have audited the internal financial controls over financial reporting of JSW Steel Limited (“the Company”) as of March 31, 2018 in conjunction with our audit of the standalone Ind AS financial statements of the Company for the year ended on that date.
Management’s Responsibility for Internal Financial ControlsThe Company’s Management is responsible for establishing and maintaining internal financial controls based on the internal control over financial reporting criteria established by the Company considering the essential components of internal control stated in the Guidance Note on Audit of Internal Financial Controls Over Financial Reporting issued by the Institute of Chartered Accountants of India. These responsibilities include the design, implementation and maintenance of adequate internal financial controls that were operating effectively for ensuring the orderly and efficient conduct of its business, including adherence to the Company’s policies, the safeguarding of its assets, the prevention and detection of frauds and errors, the accuracy and completeness of the accounting records, and the timely preparation of reliable financial information, as required under the Companies Act, 2013.
Auditor’s ResponsibilityOur responsibility is to express an opinion on the Company’s internal financial controls over financial reporting with reference to these standalone Ind AS financial statements based on our audit. We conducted our audit in accordance with the Guidance Note on Audit of Internal Financial Controls Over Financial Reporting (the “Guidance Note”) and the Standards on Auditing as specified under section 143(10) of the Companies Act, 2013, to the extent applicable to an audit of internal financial controls and, both issued by the Institute of Chartered Accountants of India. Those Standards and the Guidance Note require that we comply with ethical requirements and plan and perform the audit to obtain reasonable assurance about whether adequate internal financial controls over financial reporting with reference to these standalone Ind AS financial statements was established and maintained and if such controls operated effectively in all material respects.
Our audit involves performing procedures to obtain audit evidence about the adequacy of the internal financial controls over financial reporting with reference to these standalone Ind AS financial statements and their operating effectiveness. Our audit of internal financial controls over financial reporting included obtaining an understanding of internal financial controls over financial reporting with reference to these standalone Ind AS financial statements, assessing the risk that a material weakness exists, and testing and evaluating the design and operating effectiveness of internal control based on the assessed risk. The procedures selected depend on the auditor’s judgement, including the assessment of the risks of material misstatement of the financial statements, whether due to fraud or error.
We believe that the audit evidence we have obtained is sufficient and appropriate to provide a basis for our audit opinion on the internal financial controls over financial reporting with reference to these standalone Ind AS financial statements.
Meaning of Internal Financial Controls Over Financial Reporting With Reference to these standalone Ind AS financial statementsA Company’s internal financial control over financial reporting with reference to these standalone Ind AS financial statements is a process designed to provide reasonable assurance regarding the reliability of financial reporting and the preparation of financial statements for external purposes in accordance with generally accepted accounting principles. A Company’s internal financial control over financial reporting with reference to these standalone Ind AS financial statements includes those policies and procedures that (1) pertain to the maintenance of records that, in reasonable detail, accurately and fairly reflect the transactions and dispositions of the assets of the Company; (2) provide reasonable assurance that transactions are recorded as necessary to permit preparation of financial statements in accordance with generally accepted accounting principles, and that receipts and expenditures of the Company are being made only in accordance with authorisations of management and directors of the Company; and (3) provide reasonable assurance regarding prevention or timely detection of unauthorised acquisition, use, or disposition of the Company’s assets that could have a material effect on the financial statements.
Annexure 2

Better Everyday. In Pursuit of Excellence. Corporate Overview Statutory Reports Financial Statements
221
Inherent Limitations of Internal Financial Controls Over Financial Reporting With Reference to these standalone Ind AS financial statementsBecause of the inherent limitations of internal financial controls over financial reporting with reference to these standalone Ind AS financial statements, including the possibility of collusion or improper management override of controls, material misstatements due to error or fraud may occur and not be detected. Also, projections of any evaluation of the internal financial controls over financial reporting with reference to these standalone Ind AS financial statements to future periods are subject to the risk that the internal financial control over financial reporting with reference to these standalone Ind AS financial statements may become inadequate because of changes in conditions, or that the degree of compliance with the policies or procedures may deteriorate.
Opinion
In our opinion, the Company has, in all material respects, adequate internal financial controls over financial reporting with reference to these standalone Ind AS financial statements and such internal financial controls over financial reporting with reference to these standalone Ind AS financial statements were operating effectively as at March 31, 2018, based on the internal control over financial reporting criteria established by the Company considering the essential components of internal control stated in the Guidance Note on Audit of Internal Financial Controls Over Financial Reporting issued by the Institute of Chartered Accountants of India.
For S R B C & CO LLPChartered Accountants
ICAI Firm Registration Number: 324982E/E300003
per Vikram MehtaPartner
Membership No. 105938
Place of Signature: MumbaiDate: 16 May 2018

222
JSW Steel Limited | Integrated Report 2017-18
Balance Sheet as at 31 March 2018
` in crores
Notes As at31 March 2018
As at31 March 2017
I AssetsNon-current assets(a) Property, plant and equipment 4 49,503 50,215(b) Capital work-in-progress 5 3,071 2,745(c) Intangible assets 6 65 51(d) Intangible assets under development 321 282(e) Investments in subsidiaries, associates and joint ventures 7 3,848 3,772(f) Financial assets (i) Investments 8 1,030 978 (ii) Loans 9 5,165 2,771 (iii) Other financial assets 10 746 648(g) Current tax assets (net) 250 303(h) Other non-current assets 11 2,299 1,396Total non-current assets 66,298 63,161Current assets(a) Inventories 12 10,082 9,270(b) Financial assets (i) Investments 13 - 300 (ii) Trade receivables 14 4,692 3,948 (iii) Cash and cash equivalents 15 451 712 (iv) Bank balances other than (iii) above 16 150 315 (v) Loans 9 158 121 (vi) Derivative Assets 17 147 434 (vii) Other financial assets 10 503 328(c) Other current assets 11 3,070 2,370Total current assets 19,253 17,798Total Assets 85,551 80,959
II Equity And LiabilitiesEquity(a) Equity share capital 18 302 301(b) Other equity 19 27,605 23,797Total equity 27,907 24,098Non-current liabilities(a) Financial liabilities (i) Borrowings 20 29,551 28,358 (ii) Other financial liabilities 21 698 969(b) Provisions 22 115 74(c) Deferred tax liabilities (net) 23 2,071 1,329(d) Other non-current liabilities 24 4 3Total non-current liabilities 32,439 30,733Current liabilities(a) Financial liabilities (i) Borrowings 25 2,172 4,875 (ii) Trade payables 26 13,988 11,604 (iii) Derivative Liabilities 27 90 382 (iv) Other financial liabilities 28 7,111 8,112(b) Provisions 22 111 132(c) Other current liabilities 29 1,381 989(d) Current tax liabilities (net) 352 34Total current liabilities 25,205 26,128Total liabilities 57,644 56,861Total equity and liabilities 85,551 80,959
See accompanying notes to the Standalone Financial Statements
As per our report of even date For and on behalf of the Board of Directors
For S R B C & CO LLP Sajjan JindalChartered Accountants Chairman & Managing DirectorICAI Firm Reg. No. 324982E/E300003 DIN 00017762
per Vikram Mehta Lancy Varghese Rajeev Pai Seshagiri Rao M.V.S.Partner Company Secretary Chief Financial Officer Jt. Managing Director & Group CFOMembership No. 105938 ICSI Membership No. FCS 9407 DIN 00029136
Place: MumbaiDate: 16 May 2018

Better Everyday. In Pursuit of Excellence. Corporate Overview Statutory Reports Financial Statements
223
Statement of Profit and Lossfor the year ended 31 March 2018
` in crores
Notes For the year ended31 March 2018
For the year ended31 March 2017
I Revenue from operations 30 66,234 56,913
II Other income 31 213 255
III Total income (I + II) 66,447 57,168
IV ExpensesCost of materials consumed 35,995 28,400
Purchases of stock-in-trade 1,063 945
Changes in inventories of finished goods and work-in-progress 32 412 (1,390)
Employee benefits expense 33 1,260 1,168
Finance costs 34 3,591 3,643
Depreciation and amortisation expense 35 3,054 3,025
Excise duty expense 1,259 4,623
Other expenses 36 12,504 11,623
Total expenses 59,138 52,037
V Profit before exceptional items and tax (III-IV) 7,309 5,131
VI Exceptional items 50 234 -
VII Profit before tax (V-VI) 7,075 5,131
VIII Tax expense / (benefit) 23
Current tax 1,578 (53)
Deferred tax 872 1,607
2,450 1,554
IX Profit for the year (VII-VIII) 4,625 3,577
X Other comprehensive incomeA i) Items that will not be reclassified to profit or loss
(a) Re-measurements of the defined benefit plans 41 (3) (16)
(b) Equity instruments through other comprehensive income
82 (63)
ii) Income tax relating to items that will not be reclassified to profit or loss
1 6
Total (A) 80 (73)
B i) Items that will be reclassified to profit or loss
(a) The effective portion of gains and loss on hedging instruments
(341) 300
(b) Changes in Foreign Currency Monetary Item translation difference account (FCMITDA)
(33) 297
ii) Income tax relating to items that will be reclassified to profit or loss
130 (207)
Total (B) (244) 390
Total Other comprehensive income / (loss) (A+B) (164) 317
XI Total comprehensive income (IX + X) 4,461 3,894
XII Earnings per equity share of ` 1 each 38
Basic (in `) 19.24 14.89
Diluted (in `) 19.14 14.80
See accompanying notes to the Standalone Financial Statements
As per our report of even date For and on behalf of the Board of Directors
For S R B C & CO LLP Sajjan JindalChartered Accountants Chairman & Managing DirectorICAI Firm Reg. No. 324982E/E300003 DIN 00017762
per Vikram Mehta Lancy Varghese Rajeev Pai Seshagiri Rao M.V.S.Partner Company Secretary Chief Financial Officer Jt. Managing Director & Group CFOMembership No. 105938 ICSI Membership No. FCS 9407 DIN 00029136
Place: MumbaiDate: 16 May 2018

224
JSW Steel Limited | Integrated Report 2017-18
Statement of Changes in Equity for the year ended 31 March 2018
A.
Equ
ity
shar
e ca
pit
al
` in
cro
res
As
at 0
1 A
pri
l 20
16M
ovem
ent
du
rin
g t
he
year
As
at 3
1 M
arch
20
17M
ovem
ent
du
rin
g t
he
year
As
at 3
1 M
arch
20
18
30
1@
30
1@
@3
02
@ =
0.4
3 c
rore
s@
@ =
0.3
2 cr
ores
B.
Oth
er e
qu
ity
` in
cro
res
Par
ticu
lars
Rese
rves
and
sur
plus
Ite
ms
of O
ther
Com
preh
ensi
ve In
com
e/(L
oss)
(O
CI)
T
otal
Cap
ital
re
serv
e S
ecur
itie
s pr
emiu
m
rese
rve
Cap
ital
re
dem
ptio
n re
serv
e
Deb
entu
re
rede
mpt
ion
rese
rve
Ret
aine
d ea
rnin
gs E
quit
y se
ttle
d sh
are
base
d pa
ymen
t re
serv
e
Gen
eral
re
serv
e E
quit
y in
stru
men
ts
thro
ugh
othe
r co
mpr
ehen
sive
in
com
e
Eff
ecti
ve
port
ion
of
cash
flow
he
dges
FCM
ITD
A
Op
enin
g b
alan
ce
as a
t 0
1 A
pri
l 20
163
,58
55
,417
104
33
(11)
-10
,417
416
40
(19
8)
20
,10
9
Pro
fit
for t
he
year
--
--
3,5
77-
-3
,577
Oth
er c
omp
reh
ensi
ve in
com
e fo
r th
e ye
ar,
net
of
inco
me
tax
--
--
(10
)-
-(6
3)
196
194
317
Div
iden
d in
clu
din
g d
ivid
end
dis
trib
uti
on t
ax-
--
-(2
18)
--
--
-(2
18)
Imp
act
of E
SO
P t
rust
con
solid
atio
n-
--
-(1
)-
--
--
(1)
Rec
ogn
itio
n o
f sh
are-
bas
ed p
aym
ents
--
--
-13
-13
Clo
sin
g b
alan
ce
as a
t 3
1 M
arch
20
173
,58
55
,417
104
33
3,3
37
1310
,417
35
32
36
(4)
23
,79
7
Pro
fit
for t
he
year
--
--
4,6
25
--
--
-4
,62
5O
ther
com
pre
hen
sive
inco
me
for t
he
year
, n
et o
f in
com
e ta
x-
--
-(2
)-
-8
2(2
23
)(2
1)(1
64
)
Div
iden
d in
clu
din
g d
ivid
end
dis
trib
uti
on t
ax-
--
-(6
55
)-
--
--
(65
5)
Imp
act
of E
SO
P t
rust
con
solid
atio
n-
--
-(2
6)
--
--
-(2
6)
Rec
ogn
itio
n o
f sh
are-
bas
ed p
aym
ents
--
--
-2
8-
--
-2
8Tr
ansf
er t
o C
apit
al r
edem
pti
on r
eser
ve-
-13
9-
--
(13
9)
--
--
Tran
sfer
fro
m D
eben
ture
red
emp
tion
res
erve
--
-(2
92
)2
92
--
--
--
Clo
sin
g b
alan
ce a
s at
31
Mar
ch 2
018
3,5
85
5,4
1714
914
17,
571
41
10,2
784
35
13(2
5)
27,6
05
See
acc
omp
anyi
ng
not
es t
o th
e S
tan
dal
one
Fin
anci
al S
tate
men
ts
As
per
ou
r rep
ort
of e
ven
dat
eFo
r an
d o
n b
ehal
f of
th
e B
oard
of
Dir
ecto
rs
For S
R B
C &
CO
LLP
Saj
jan
Jin
dal
Ch
arte
red
Acc
ount
ants
Ch
airm
an &
Man
agin
g D
irec
tor
ICA
I Fir
m R
eg. N
o. 3
249
82
E/E3
00
00
3D
IN 0
00
1776
2
per
Vik
ram
Meh
taLa
ncy
Var
gh
ese
Raj
eev
Pai
Ses
hag
iri R
ao M
.V.S
.P
artn
erC
omp
any
Sec
reta
ryC
hie
f Fi
nan
cial
Off
icer
Jt. M
anag
ing
Dir
ecto
r & G
rou
p C
FOM
emb
ersh
ip N
o. 1
05
93
8IC
SI M
emb
ersh
ip N
o. F
CS
94
07
DIN
00
02
913
6
Pla
ce: M
um
bai
Dat
e: 1
6 M
ay 2
018

Better Everyday. In Pursuit of Excellence. Corporate Overview Statutory Reports Financial Statements
225
` in crores
For the year ended31 March 2018
For the year ended31 March 2017
Cash flow from operating activitiesNet profit before tax 7,075 5,131Adjustments for:
Depreciation and amortisation expenses 3,054 3,025 Loss on sale of property, plant & equipment (net) 124 134 Gain on sale of financial investments designated as FVTPL (16) (6)Interest income (176) (216)Gain arising of financial instruments designated as FVTPL (9) (9)Loss arising from Financial instruments designated as FVTPL 30 - Dividend income (5) (18)Interest expense 3,442 3,522 Share based payment expense 28 13 Export obligation deferred income amortisation (67) (61)Unrealised exchange gain/(loss) 44 (77)Allowance for doubtful debts, loans & advances 381 37 Government grant income (Fair value gain on deferred government loan)
(53) -
6,777 6,344 Operating profit before working capital changes 13,852 11,475 Adjustments for:
(Increase) in inventories (812) (2,529)(Increase) in trade receivables (661) (1,437)(Increase) in other assets (1,339) (589)Increase trade payable and other liabilities 2,325 1,639Increase in provisions 16 25
(471) (2,891)Cash flow from operations 13,381 8,584 Income taxes paid (net of refund received) (1,207) (23)Net cash generated from operating activities (A) 12,174 8,561 Cash flow from investing activitiesPurchase of property, plant and equipment, intangible assets including under development
(3,776) (3,952)
Proceeds from sale of property, plant & equipment 7 25 Investment in subsidiaries and joint ventures including advances (175) (524)
Purchase of current investments (7,804) (2,784) Sale of current investments 8,120 2,490 Bank deposits not considered as cash and cash equivalents (net)
169 (184)
Loans to related parties (2,858) (1,494)Interest received 178 121 Dividend received 5 18 Net cash used in investing activities (B) (6,134) (6,284)Cash flow from financing activitiesProceeds from sale of treasury shares 49 57Payment for purchase of treasury shares (76) (55)Proceeds from non-current borrowings 5,571 3,995Repayment of non-current borrowings (4,774) (4,802)Proceeds from/Repayment of current borrowings (net) (2,703) 2,809Repayment of finance lease obligation (296) (322)Interest paid (3,417) (3,494)Dividend paid (including corporate dividend tax) (655) (218)Net cash used in financing activities (C) (6,301) (2,030)Net increase in cash and cash equivalents (A+B+C) (261) 247Cash and cash equivalents – opening balances 712 465Cash and cash equivalents – closing balances (note 15) 451 712
Notes: 1. The cash flow statement is prepared using the 'indirect method' set out in IND AS 7 – Statement of Cash Flows.2. The Company has acquired property, plant and equipment of ` 22 crores (previous year ` 1,092 crores) on finance lease.
Statement of Cash Flows for the year ended 31 March 2018

226
JSW Steel Limited | Integrated Report 2017-18
Reconciliations part of cash flows` in crores
Particulars 1 April 2017 Cash flows (net)
Foreign exchange
(Gain) /Loss
Changes in fair values
New leases
Other 31 March 2018
Borrowings other than finance lease obligation (including Current maturities of long-term borrowing included in other financial liabilities note 28)
28,541 797 89 (52) - 52 29,427
Finance Lease Obligations (including Current maturities)
4,857 (296) - - 22 (1) 4,582
Borrowings (Current) 4,875 (2,703) - - - - 2,172
Particulars 1 April 2016 Cash flows (net)
Foreign exchange
(Gain)/Loss
Changes in fair values
New leases
Other 31 March 2017
Borrowings other than finance lease obligation (including Current maturities of long-term borrowing included in other financial liabilities note 28)
29,500 (807) (247) - - 95 28,541
Finance Lease Obligations (including Current maturities)
4,088 (322) - - 1,092 (1) 4,857
Borrowings (Current) 2,070 2,809 (4) - - - 4,875
Other comprises of Upfront Fees Amortisation and Interest Cost accrual on preference shares
Statement of Cash Flows for the year ended 31 March 2018 (Continued)
See accompanying notes to the Standalone Financial Statements
As per our report of even date For and on behalf of the Board of Directors
For S R B C & CO LLP Sajjan JindalChartered Accountants Chairman & Managing DirectorICAI Firm Reg. No. 324982E/E300003 DIN 00017762
per Vikram Mehta Lancy Varghese Rajeev Pai Seshagiri Rao M.V.S.Partner Company Secretary Chief Financial Officer Jt. Managing Director & Group CFOMembership No. 105938 ICSI Membership No. FCS 9407 DIN 00029136
Place: MumbaiDate: 16 May 2018

Better Everyday. In Pursuit of Excellence. Corporate Overview Statutory Reports Financial Statements
227
Notes to the Standalone Financial Statements as at and for the year ended 31 March 2018
1. General Information
JSW Steel Limited ('the Company') is primarily engaged in the business of manufacture and sale of Iron and Steel Products.
The Company is an integrated manufacturer of diverse range of steel products with its manufacturing facilities located at Vijaynagar Works in Karnataka, Dolvi Works in Maharashtra and Salem works in Tamil Nadu.
JSW Steel Limited is a public limited Company incorporated in India on 15 March 1994 under the Companies Act, 1956 and listed on the Bombay Stock Exchange and National Stock Exchange. The registered office of the Company is JSW Centre, Bandra-Kurla Complex, Bandra (East), Mumbai – 400 051.
2. Significant Accounting policiesI. Statement of compliance Standalone Financial Statements have been prepared
in accordance with the accounting principles generally accepted in India including Indian Accounting Standards (Ind AS) prescribed under the Section 133 of the Companies Act, 2013 read with rule 3 of the Companies (Indian Accounting Standards) Rules, 2015 as amended.
Accordingly, the Company has prepared these Standalone Financial Statements which comprise the Balance Sheet as at 31 March, 2018, the Statement of Profit and Loss, the Statement of Cash Flows and the Statement of Changes in Equity for the year ended as on that date, and accounting policies and other explanatory information (together hereinafter referred to as 'Standalone Financial Statements' or 'financial statements').
These financial statements are approved for issue by the Board of Directors on May 16, 2018
II. Basis of preparation and presentation The Standalone Financial Statements have been
prepared on the historical cost basis except for certain financial instruments measured at fair values at the end of each reporting year, as explained in the accounting policies below.
Fair value is the price that would be received to sell an asset or paid to transfer a liability in an orderly transaction between market participants at the measurement date, regardless of whether that price is directly observable or estimated using another valuation technique. In estimating the fair value of an asset or a liability, the Company takes in to account the characteristics of the asset or liability if market participants would take those characteristics into account when pricing the asset or liability at the measurement date. Fair value
for measurement and/or disclosure purposes in these financial statements is determined on such a basis, except for share-based payment transactions that are within the scope of Ind AS 102, leasing transactions that are within the scope of Ind AS 17, and measurements that have some similarities to fair value but are not fair value, such as net realisable value in Ind AS 2 or value in use in Ind AS 36.
In addition, for financial reporting purposes, fair value measurements are categorised into Level 1, 2 or 3 based on the degree to which the inputs to the fair value measurements are observable and the significance of the inputs to the fair value measurements in its entirety, which are described as follows:
Level 1 inputs are quoted prices (unadjusted) in active markets for identical assets or liabilities that the entity can access at the measurement date;
Level 2 inputs are inputs, other than quoted prices included within level 1, that are observable for the asset or liability, either directly or indirectly; and
Level 3 inputs are unobservable inputs for the asset or liability.
The Financial Statement is presented in INR and all values are rounded to the nearest crores except when otherwise stated.
Current and non-current classification
The Company presents assets and liabilities in the balance sheet based on current / non-current classification.
An asset is classified as current when it satisfies any of the following criteria:
it is expected to be realised in, or is intended for sale or consumption in, the Company’s normal operating cycle. it is held primarily for the purpose of being traded;
it is expected to be realised within 12 months after the reporting date; or
it is cash or cash equivalent unless it is restricted from being exchanged or used to settle a liability for at least 12 months after the reporting date.
All other assets are classified as non-current.
A liability is classified as current when it satisfies any of the following criteria:
it is expected to be settled in the Company’s normal operating cycle;
it is held primarily for the purpose of being traded;

228
Notes to the Standalone Financial Statements as at and for the year ended 31 March 2018
JSW Steel Limited | Integrated Report 2017-18
it is due to be settled within 12 months after the reporting date; or the Company does not have an unconditional right to defer settlement of the liability for at least 12 months after the reporting date. Terms of a liability that could, at the option of the counterparty, result in its settlement by the issue of equity instruments do not affect its classification.
All other liabilities are classified as non-current.
Deferred tax assets and liabilities are classified as non-current only.
III. Revenue recognition Sale of Products
Revenue is measured at the fair value of the consideration received or receivable. The Company recognises revenues on sale of products, net of discounts, sales incentives, rebates granted, returns, sales taxes/GST and duties when the products are delivered to customer or when delivered to a carrier for export sale, which is when title and risk and rewards of ownership pass to the customer. Sale of products is presented gross of manufacturing taxes like excise duty wherever applicable. Export incentives are recognised as income as per the terms of the scheme in respect of the exports made and included as part of export turnover.
Dividend and interest income
Dividend income from investments is recognised when the shareholder’s right to receive payment has been established (provided that it is probable that the economic benefits will flow to the Company and the amount of income can be measured reliably).
Interest income from a financial asset is recognised when it is probable that the economic benefits will flow to the Company and the amount of income can be measured reliably. Interest income is accrued on a time basis, by reference to the principal outstanding and at the effective interest rate applicable, which is the rate that exactly discounts estimated future cash receipts through the expected life of the financial asset to that asset’s net carrying amount on initial recognition.
IV. Leases Leases are classified as finance leases whenever the
terms of the lease transfer substantially all the risks and rewards of ownership to the lessee. All other leases are classified as operating leases.
The Company as a lessor
Leases are classified as finance leases when substantially all of the risks and rewards of ownership transfer from the Company to the lessee. Amounts due from lessees under finance leases are recorded as
receivables at the Company’s net investment in the leases. Finance lease income is allocated to accounting periods so as to reflect a constant periodic rate of return on the net investment outstanding in respect of the lease.
Rental income from operating leases is recognised on straight-line basis over the term of the relevant lease. Initial direct cost incurred in negotiating and arranging an operating lease are added to the carrying amount of the leased asset and recognised on straight-line basis over the lease term.
The Company as a lessee
Assets held under finance leases are initially recognised as assets of the Company at their fair value at the inception of the lease or, if lower, at the present value of the minimum lease payments. The corresponding liability to the lessor is included in the Standalone balance sheet as a finance lease obligation.
Lease payments are apportioned between finance expenses and reduction of the lease obligation so as to achieve a constant rate of interest on the remaining balance of the liability. Finance expenses are recognised immediately in Statement of Profit and Loss, unless they are directly attributable to qualifying assets, in which case they are capitalised in accordance with the Company’s general policy on borrowing costs. Contingent rentals are recognised as expenses in the years in which they are incurred.
Lease payments under an operating lease shall be recognised as an expense on a straight-line basis over the term of the relevant lease. Where the rentals are structured solely to increase in line with expected general inflation to compensate for the lessor’s expected inflationary cost increases, such increases are recognised in the year in which such benefits accrue. Contingent rentals arising under operating leases are recognised as an expense in the year in which they are incurred.
Arrangements in the nature of lease
The Company enters into agreements, comprising a transaction or series of related transactions that does not take the legal form of a lease but conveys the right to use the asset in return for a payment or series of payments. In case of such arrangements, the Company applies the requirements of Ind AS 17 – Leases to the lease element of the arrangement. For the purpose of applying the requirements under Ind AS 17 – Leases, payments and other consideration required by the arrangement are separated at the inception of the arrangement into those for lease and those for other elements.

Better Everyday. In Pursuit of Excellence. Corporate Overview Statutory Reports Financial Statements
229
Notes to the Standalone Financial Statements as at and for the year ended 31 March 2018
V. Foreign currencies The functional currency of the Company is determined
on the basis of the primary economic environment in which it operates. The functional currency of the Company is Indian National Rupee (INR).
The transactions in currencies other than the entity’s functional currency (foreign currencies) are recognised at the rates of exchange prevailing at the dates of the transactions. At the end of each reporting year, monetary items denominated in foreign currencies are retranslated at the rates prevailing at that date. Non-monetary items carried at fair value that are denominated in foreign currencies are retranslated at the rates prevailing at the date when the fair value was determined. Non-monetary items that are measured in terms of historical cost in a foreign currency are not retranslated.
Exchange differences on monetary items are recognised in Statement of Profit and Loss in the year in which they arise except for:
exchange differences on foreign currency borrowings relating to assets under construction for future productive use, which are included in the cost of those assets when they are regarded as an adjustment to interest costs on those foreign currency borrowings;
exchange differences on transactions entered into in order to hedge certain foreign currency risks (see below the policy on hedge accounting in 2 (XVIII) (B) (g));
exchange difference arising on settlement / restatement of long-term foreign currency monetary items recognised in the financial statements for the year ended 31 March, 2016 prepared under previous GAAP, are capitalised as a part of the depreciable fixed assets to which the monetary item relates and depreciated over the remaining useful life of such assets. If such monetary items do not relate to acquisition of depreciable fixed assets, the exchange difference is amortised over the maturity year / upto the date of settlement of such monetary item, whichever is earlier and charged to the Statement of Profit and Loss. The un-amortised exchange difference is carried under other equity as 'Foreign currency monetary item translation difference account' net of tax effect thereon, where applicable.
VI. Borrowing costs Borrowing costs directly attributable to the acquisition,
construction or production of qualifying assets, which are assets that necessarily take a substantial period of time to get ready for their intended use or sale, are
added to the cost of those assets, until such time as the assets are substantially ready for their intended use or sale.
All other borrowing costs are recognised in the Statement of Profit and Loss in the year in which they are incurred.
The Company determines the amount of borrowing costs eligible for capitalisation as the actual borrowing costs incurred on that borrowing during the year less any interest income earned on temporary investment of specific borrowings pending their expenditure on qualifying assets, to the extent that an entity borrows funds specifically for the purpose of obtaining a qualifying asset. In case if the Company borrows generally and uses the funds for obtaining a qualifying asset, borrowing costs eligible for capitalisation are determined by applying a capitalisation rate to the expenditures on that asset.
Borrowing Cost includes exchange differences arising from foreign currency borrowings to the extent they are regarded as an adjustment to the finance cost.
VII. Government grants Government grants are not recognised until there is
reasonable assurance that the Company will comply with the conditions attached to them and that the grants will be received.
Government grants are recognised in the Statement of Profit and Loss on a systematic basis over the years in which the Company recognises as expenses the related costs for which the grants are intended to compensate or when performance obligations are met.
The benefit of a government loan at a below-market rate of interest and effect of this favorable interest is treated as a government grant. The Loan or assistance is initially recognised at fair value and the government grant is measured as the difference between proceeds received and the fair value of the loan based on prevailing market interest rates and recognised to the income statement immediately on fulfillment of the performance obligations. The loan is subsequently measured as per the accounting policy applicable to financial liabilities.
VIII. Employee benefits Retirement benefit costs and termination benefits
Payments to defined contribution retirement benefit plans are recognised as an expense when employees have rendered service entitling them to the contributions.

230
Notes to the Standalone Financial Statements as at and for the year ended 31 March 2018
JSW Steel Limited | Integrated Report 2017-18
For defined benefit retirement benefit plans, the cost of providing benefits is determined using the projected unit credit method, with actuarial valuations being carried out at the end of each annual reporting year. Re-measurement, comprising actuarial gains and losses, the effect of the changes to the asset ceiling (if applicable) and the return on plan assets (excluding interest), is reflected immediately in the statement of financial position with a charge or credit recognised in other comprehensive income in the year in which they occur. Re-measurement recognised in other comprehensive income is reflected immediately in retained earnings and will not be reclassified to profit or loss. Past service cost is recognised in profit or loss in the year of a plan amendment or when the Company recognises corresponding restructuring cost whichever is earlier. Net interest is calculated by applying the discount rate to the net defined benefit liability or asset. Defined benefit costs are categorised as follows:
service cost (including current service cost, past service cost, as well as gains and losses on curtailments and settlements);
net interest expense or income; and
re-measurement
The Company presents the first two components of defined benefit costs in profit or loss in the line item ‘Employee benefits expenses’. Curtailment gains and losses are accounted for as past service costs.
The retirement benefit obligation recognised in the statement of financial position represents the actual deficit or surplus in the Company’s defined benefit plans. Any surplus resulting from this calculation is limited to the present value of any economic benefits available in the form of refunds from the plans or reductions in future contributions to the plans.
A liability for a termination benefit is recognised at the earlier of when the entity can no longer withdraw the offer of the termination benefit and when the entity recognises any related restructuring costs.
Short-term and other long-term employee benefits
A liability is recognised for benefits accruing to employees in respect of wages and salaries, annual leave and sick leave in the year the related service is rendered at the undiscounted amount of the benefits expected to be paid in exchange for that service.
Liabilities recognised in respect of short-term employee benefits are measured at the undiscounted amount of the benefits expected to be paid in exchange for the related service.
Liabilities recognised in respect of other long-term employee benefits are measured at the present value of the estimated future cash outflows expected to be made by the Company in respect of services provided by employees up to the reporting date.
IX. Share-based payment arrangements Equity-settled share-based payments to employees
and others providing similar services are measured at the fair value of the equity instruments at the grant date. Details regarding the determination of the fair value of equity-settled share-based transactions are set out in note 39.
The fair value determined at the grant date of the equity-settled share-based payments is expensed on a straight-line basis over the vesting period, based on the Company’s estimate of equity instruments that will eventually vest, with a corresponding increase in equity. At the end of each reporting year, the Company revises its estimate of the number of equity instruments expected to vest. The impact of the revision of the original estimates, if any, is recognised in profit or loss such that the cumulative expense reflects the revised estimate, with a corresponding adjustment to the equity-settled employee benefits reserve.
The Company has created an Employee Benefit Trust for providing share-based payment to its employees. The Company uses the Trust as a vehicle for distributing shares to employees under the employee remuneration schemes. The Trust buys shares of the Company from the market, for giving shares to employees. The Company treats Trust as its extension and shared held by the Trust are treated as treasury shares.
Own equity instruments that are reacquired (treasury shares) are recognised at cost and deducted from Equity. No gain or loss is recognised in profit or loss on the purchase, sale, issue or cancellation of the Company’s own equity instruments. Any difference between the carrying amount and the consideration, if reissued, is recognised in capital reserve. Share options exercised during the reporting year are satisfied with treasury shares.
X. Taxes Income tax expense represents the sum of the tax
currently payable and deferred tax.
Current tax
Current tax is the amount of expected tax payable based on the taxable profit for the year as determined in accordance with the applicable tax rates and the provisions of the Income Tax Act, 1961

Better Everyday. In Pursuit of Excellence. Corporate Overview Statutory Reports Financial Statements
231
Notes to the Standalone Financial Statements as at and for the year ended 31 March 2018
Deferred tax
Deferred tax is recognised on temporary differences between the carrying amounts of assets and liabilities in the financial statements and the corresponding tax bases used in the computation of taxable profit. Deferred tax liabilities are recognised for all taxable temporary differences. Deferred tax assets are recognised for all deductible temporary differences to the extent that it is probable that taxable profits will be available against which those deductible temporary differences can be utilised. Such deferred tax assets and liabilities are not recognised if the temporary difference arises from the initial recognition (other than in a business combination) of assets and liabilities in a transaction that affects neither the taxable profit nor the accounting profit. In addition, deferred tax liabilities are not recognised if the temporary difference arises from the initial recognition of goodwill.
The carrying amount of deferred tax assets is reviewed at the end of each reporting year and reduced to the extent that it is no longer probable that sufficient taxable profits will be available to allow all or part of the asset to be recovered.
Minimum Alternate Tax (MAT) paid in accordance with the tax laws, which gives future economic benefits in the form of adjustment to future income tax liability, is considered as an deferred tax asset if there is convincing evidence that the Company will pay normal income tax. Accordingly, MAT is recognised as an asset in the Balance Sheet when it is probable that future economic benefit associated with it will flow to the Company.
Deferred tax assets and liabilities are measured at the tax rates that are expected to apply in the year in which the liability is settled or the asset realised, based on tax rates (and tax laws) that have been enacted or substantively enacted by the end of the reporting year.
Deferred tax assets and deferred tax liabilities are offset if a legally enforceable right exists to set off current tax assets against current tax liabilities and the deferred taxes relate to the same taxable entity and the same taxation authority.
Current and deferred tax for the year
Current and deferred tax are recognised in profit or loss, except when they are relating to items that are recognised in other comprehensive income or directly in equity, in which case, the current and deferred tax are also recognised in other comprehensive income or directly in equity respectively. Where current tax or deferred tax arises from the initial accounting for a business combination, the tax effect is included in the accounting for the business combination.
Deferred tax assets and liabilities are offset when they relate to income taxes levied by the same taxation authority and the relevant entity intends to settle its current tax assets and liabilities on a net basis.
XI. Property, plant and equipment The cost of property, plant and equipment comprises its
purchase price net of any trade discounts and rebates, any import duties and other taxes (other than those subsequently recoverable from the tax authorities), any directly attributable expenditure on making the asset ready for its intended use, including relevant borrowing costs for qualifying assets and any expected costs of decommissioning. Expenditure incurred after the property, plant and equipment have been put into operation, such as repairs and maintenance, are charged to the Statement of Profit and Loss in the year in which the costs are incurred. Major shut-down and overhaul expenditure is capitalised as the activities undertaken improves the economic benefits expected to arise from the asset.
An item of property, plant and equipment is derecognised upon disposal or when no future economic benefits are expected to arise from the continued use of the asset. Any gain or loss arising on the disposal or retirement of an item of property, plant and equipment is determined as the difference between the sales proceeds and the carrying amount of the asset and is recognised in Statement of Profit and Loss.
Assets in the course of construction are capitalised in the assets under construction account. At the point when an asset is operating at management’s intended use, the cost of construction is transferred to the appropriate category of property, plant and equipment and depreciation commences. Costs associated with the commissioning of an asset and any obligatory decommissioning costs are capitalised where the asset is available for use but incapable of operating at normal levels until a year of commissioning has been completed. Revenue generated from production during the trial period is capitalised.
Property, plant and equipment except freehold land held for use in the production, supply or administrative purposes, are stated in the balance sheet at cost less accumulated depreciation and accumulated impairment losses, if any.
The Company has elected to continue with the carrying value for all of its property, plant and equipment as recognised in the financial statements on transition to Ind AS, measured as per the previous GAAP and use that as its deemed cost as at the date of transition.

232
Notes to the Standalone Financial Statements as at and for the year ended 31 March 2018
JSW Steel Limited | Integrated Report 2017-18
Depreciable amount for assets is the cost of an asset, or other amount substituted for cost, less its estimated residual value. Depreciation is recognised so as to write off the cost of assets (other than freehold land and properties under construction) less their residual values over their useful lives, using straight-line method as per the useful life prescribed in Schedule II to the Companies Act, 2013 except in respect of following categories of assets, in whose case the life of the assets has been assessed as under based on technical advice, taking into account the nature of the asset, the estimated usage of the asset, the operating conditions of the asset, past history of replacement, anticipated technological changes, manufacturers warranties and maintenance support, etc.
Class of assets Years
Plant and equipment 8 to 40 years
Work-rolls (shown under Plant and equipment)
1-5 years
When significant parts of plant and equipment are required to be replaced at intervals, the Company depreciates them separately based on their specific useful lives.
Freehold land and leasehold land where the lease is convertible to freehold land under lease agreements at future dates at no additional cost, are not depreciated.
Assets held under finance leases are depreciated over their expected useful lives on the same basis as owned assets. However, when there is no reasonable certainty that ownership will be obtained by the end of the lease term, assets are depreciated over the shorter of the lease term and their useful lives.
Major overhaul costs are depreciated over the estimated life of the economic benefit derived from the overhaul. The carrying amount of the remaining previous overhaul cost is charged to the Statement of Profit and Loss if the next overhaul is undertaken earlier than the previously estimated life of the economic benefit.
The Company reviews the residual value, useful lives and depreciation method annually and, if expectations differ from previous estimates, the change is accounted for as a change in accounting estimate on a prospective basis.
XII. Intangible assets Intangible assets with finite useful lives that are
acquired separately are carried at cost less accumulated amortisation and accumulated impairment losses. Amortisation is recognised on a straight-line basis
over their estimated useful lives. The estimated useful life and amortisation method are reviewed at the end of each reporting year, with the effect of any changes in estimate being accounted for on a prospective basis. Intangible assets with indefinite useful lives that are acquired separately are carried at cost less accumulated impairment losses.
Useful lives of intangible assets
Estimated useful lives of the intangible assets are as follows:
Class of assets Years
Computer Software & Licenses 3-5 years
The Company has elected to continue with carrying value of all its intangible assets recognised ason transition date, measured as per the previous GAAP and use that carrying value as its deemed cost as of transition date.
XIII. Mining Assets Exploration and evaluation
Exploration and evaluation expenditure incurred after obtaining the mining right or the legal right to explore are capitalised as exploration and evaluation assets (intangible assets) and stated at cost less impairment. Exploration and evaluation assets are assessed for impairment indicators at least annually.
The Company measures its exploration and evaluation assets at cost and classifies as Property, plant and equipment or intangible assets according to the nature of the assets acquired and applies the classification consistently. To the extent that tangible asset is consumed in developing an intangible asset, the amount reflecting that consumption is capitalised as a part of the cost of the intangible asset.
Exploration expenditure includes all direct and allocated indirect expenditure associated with finding specific mineral resources which includes depreciation and applicable operating costs of related support equipment and facilities and other costs of exploration activities:
Acquisition costs - costs associated with acquisition of licenses and rights to explore, including related professional fees.
General exploration costs – costs of surveys and studies, rights of access to properties to conduct those studies (e.g. costs incurred for environment clearance, defense clearance, etc.), and salaries and other expenses of geologists, geophysical crews and other personnel conducting those studies.

Better Everyday. In Pursuit of Excellence. Corporate Overview Statutory Reports Financial Statements
233
Notes to the Standalone Financial Statements as at and for the year ended 31 March 2018
Costs of exploration drilling and equipping exploration – Expenditure incurred on the acquisition of a license interest is initially capitalised on a license-by-license basis. Costs are held, undepleted, within exploration and evaluation assets until such time as the exploration phase on the license area is complete or commercial reserves have been discovered.
Stripping cost
Developmental stripping costs in order to obtain access to quantities of mineral reserves that will be mined in future periods are capitalised as part of mining assets. Capitalisation of developmental stripping costs ends when the commercial production of the mineral reserves begins.
Production stripping costs are incurred to extract the ore in the form of inventories and/or to improve access to an additional component of an ore body or deeper levels of material. Production stripping costs are accounted for as inventories to the extent the benefit from production stripping activity is realised in the form of inventories.
Such costs are presented within mining assets. After initial recognition, stripping activity assets are carried at cost less accumulated amortisation and impairment. The expected useful life of the identified component of the ore body is used to depreciate or amortise the stripping asset.
Site restoration, rehabilitation and environmental costs:
Provision is made for costs associated with restoration and rehabilitation of mining sites as soon as the obligation to incur such costs arises. Such restoration and closure costs are typical of extractive industries and they are normally incurred at the end of the life of the mine. The costs are estimated on the basis of mine closure plans and the estimated discounted costs of dismantling and removing these facilities and the costs of restoration are capitalised. The provision for decommissioning assets is based on the current estimates of the costs for removing and decommissioning production facilities, the forecast timing of settlement of decommissioning liabilities and the appropriate discount rate. A corresponding provision is created on the liability side. The capitalised asset is charged to profit or loss over the life of the asset through depreciation over the life of the operation and the provision is increased each period via unwinding the discount on the provision. Management estimates are based on local legislation and/or other agreements. The actual costs and cash outflows may differ from estimates because of changes in laws and regulations, changes in prices, analysis of site conditions and changes in restoration technology. Details of such provisions are set out in note 22.
XIV. Impairment of Property, plant and equipment and intangible assets
At the end of each reporting year, the Company reviews the carrying amounts of its tangible and intangible assets to determine whether there is any indication that those assets have suffered an impairment loss. If any such indication exists, the recoverable amount of the asset is estimated in order to determine the extent of the impairment loss (if any). Where it is not possible to estimate the recoverable amount of an individual asset, the Company estimates the recoverable amount of the cash-generating unit to which the asset belongs. Where a reasonable and consistent basis of allocation can be identified, corporate assets are also allocated to individual cash-generating units, or otherwise they are allocated to the smallest group of cash-generating units for which a reasonable and consistent allocation basis can be identified.
Intangible assets with indefinite useful lives and intangible assets not yet available for use are tested for impairment at least annually, and whenever there is an indication that the asset may be impaired.
Recoverable amount is the higher of fair value less costs to sell and value in use. In assessing value in use, the estimated future cash flows are discounted to their present value using a pre-tax discount rate that reflects current market assessments of the time value of money and the risks specific to the asset for which the estimates of future cash flows have not been adjusted.
If the recoverable amount of an asset (or cash-generating unit) is estimated to be less than its carrying amount, the carrying amount of the asset (or cash-generating unit) is reduced to its recoverable amount. An impairment loss is recognised immediately in the Statement of Profit and Loss.
XV. Inventories Inventories are stated at the lower of cost and net
realisable value.
Cost of raw materials include cost of purchase and other costs incurred in bringing the inventories to their present location and condition. Cost of finished goods and work-in-progress include cost of direct materials and labor and a proportion of manufacturing overheads based on the normal operating capacity but excluding borrowing costs.
Costs of inventories are determined on weighted average basis. Net realisable value represents the estimated selling price for inventories less all estimated costs of completion and costs necessary to make the sale.

234
Notes to the Standalone Financial Statements as at and for the year ended 31 March 2018
JSW Steel Limited | Integrated Report 2017-18
XVI. Provisions Provisions are recognised when the Company has a
present obligation (legal or constructive), as a result of past events, and it is probable that an outflow of resources, that can be reliably estimated, will be required to settle such an obligation.
The amount recognised as a provision is the best estimate of the consideration required to settle the present obligation at the balance sheet date, taking into account the risks and uncertainties surrounding the obligation. When a provision is measured using the cash flows estimated to settle the present obligation, its carrying amount is the present value of those cash flows (when the effect of the time value of money is material).
When some or all of the economic benefits required to settle a provision are expected to be recovered from a third party, a receivable is recognised as an asset if it is virtually certain that reimbursement will be received and the amount of the receivable can be measured reliably.
Onerous contracts
Present obligations arising under onerous contracts are recognised and measured as provisions. An onerous contract is considered to exist where the Company has a contract under which the unavoidable costs of meeting the obligations under the contract exceed the economic benefits expected to be received from the contract.
XVII. Investment in subsidiaries, associates and joint ventures
Investment in subsidiaries, associates and joint ventures are shown at cost. Where the carrying amount of an investment in greater than its estimated recoverable amount, it is written down immediately to its recoverable amount and the difference is transferred to the Statement of Profit and Loss. On disposal of investment, the difference between the net disposal proceeds and the carrying amount is charged or credited to the Statement of Profit and Loss.
XVIII. Financial Instruments Financial assets and financial liabilities are recognised
when an entity becomes a party to the contractual provisions of the instrument.
Financial assets and financial liabilities are initially measured at fair value. Transaction costs that are directly attributable to the acquisition or issue of financial assets and financial liabilities (other than financial assets and financial liabilities at fair value through Statement of Profit and Loss (FVTPL)) are
added to or deducted from the fair value of the financial assets or financial liabilities, as appropriate, on initial recognition. Transaction costs directly attributable to the acquisition of financial assets or financial liabilities at fair value through profit and loss are recognised immediately in Statement of Profit and Loss.
A. Financial assets
a) Recognition and initial measurement
A financial asset is initially recognised at fair value and, for an item not at FVTPL, transaction costs that are directly attributable to its acquisition or issue. Purchases and sales of financial assets are recognised on the trade date, which is the date on which the Company becomes a party to the contractual provisions of the instrument.
b) Classification of financial assets
On initial recognition, a financial asset is measured at amortised cost, fair value through other comprehensive income (FVTOCI) or FVTPL.
A financial asset is measured at amortised cost if it meets both of the following conditions and is not designated at FVTPL:
The asset is held within a business model whose objective is to hold assets to collect contractual cash flows; and
The contractual terms of the financial asset give rise on specified dates to cash flows that are solely payments of principal and interest on the principal amount outstanding.
A debt instrument is classified as FVTOCI only if it meets both of the following conditions and is not recognised at FVTPL:
The asset is held within a business model whose objective is achieved by both collecting contractual cash flows and selling financial assets; and
The contractual terms of the financial asset give rise on specified dates to cash flows that are solely payments of principal and interest on the principal amount outstanding.
Debt instruments included within the FVTOCI category are measured initially as well as at each reporting date at fair value. Fair value movements are recognised in the Other Comprehensive Income (OCI). However, the Company recognises interest income, impairment losses & reversals and foreign exchange gain or loss in the Statement of Profit and Loss. On derecognition of the asset, cumulative gain or loss previously recognised in OCI is

Better Everyday. In Pursuit of Excellence. Corporate Overview Statutory Reports Financial Statements
235
Notes to the Standalone Financial Statements as at and for the year ended 31 March 2018
reclassified from the equity to Statement of Profit and Loss. Interest earned whilst holding FVTOCI debt instrument is reported as interest income using the EIR method.
All equity investments in scope of Ind AS 109 are measured at fair value. Equity instruments which are held for trading and contingent consideration recognised by an acquirer in a business combination to which Ind AS 103 applies are classified as at FVTPL. For all other equity instruments, the Company may make an irrevocable election to present in other comprehensive income subsequent changes in the fair value. The Company makes such election on an instrument-by-instrument basis. The classification is made on initial recognition and is irrevocable.
If the Company decides to classify an equity instrument as at FVTOCI, then all fair value changes on the instrument, excluding dividends, are recognised in the OCI. There is no recycling of the amounts from OCI to Statement of Profit and Loss, even on sale of investment. However, the Company may transfer the cumulative gain or loss within equity.
Equity instruments included within the FVTPL category are measured at fair value with all changes recognised in the Statement of Profit and Loss.
All other financial assets are classified as measured at FVTPL.
In addition, on initial recognition, the Company may irrevocably designate a financial asset that otherwise meets the requirements to be measured at amortised cost or at FVTOCI as at FVTPL if doing so eliminates or significantly reduces and accounting mismatch that would otherwise arise.
Financial assets at FVTPL are measured at fair value at the end of each reporting year, with any gains and losses arising on remeasurement recognised in statement of profit or loss. The net gain or loss recognised in statement of profit or loss incorporates any dividend or interest earned on the financial asset and is included in the ‘other income’ line item. Dividend on financial assets at FVTPL is recognised when:
The Company’s right to receive the dividends is established,
It is probable that the economic benefits associated with the dividends will flow to the entity,
The dividend does not represent a recovery of part of cost of the investment and the amount of dividend can be measured reliably.
c) Derecognition of financial assets
The Company derecognises a financial asset when the contractual rights to the cash flows from the asset expire, or when it transfers the financial asset and substantially all the risks and rewards of ownership of the asset to another party.
d) Impairment
The Company applies the expected credit loss model for recognising impairment loss on financial assets measured at amortised cost, debt instruments at FVTOCI, lease receivables, trade receivables, other contractual rights to receive cash or other financial asset, and financial guarantees not designated as at FVTPL.
Expected credit losses are the weighted average of credit losses with the respective risks of default occurring as the weights. Credit loss is the difference between all contractual cash flows that are due to the Company in accordance with the contract and all the cash flows that the Company expects to receive (i.e. all cash shortfalls), discounted at the original effective interest rate (or credit-adjusted effective interest rate for purchased or originated credit-impaired financial assets). The Company estimates cash flows by considering all contractual terms of the financial instrument (for example, prepayment, extension, call and similar options) through the expected life of that financial instrument.
The Company measures the loss allowance for a financial instrument at an amount equal to the lifetime expected credit losses if the credit risk on that financial instrument has increased significantly since initial recognition. If the credit risk on a financial instrument has not increased significantly since initial recognition, the Company measures the loss allowance for that financial instrument at an amount equal to 12-month expected credit losses. 12-month expected credit losses are portion of the life-time expected credit losses and represent the lifetime cash shortfalls that will result if default occurs within the 12 months after the reporting date and thus, are not cash shortfalls that are predicted over the next 12 months.
If the Company measured loss allowance for a financial instrument at lifetime expected credit loss model in the previous year, but determines at
236
Notes to the Standalone Financial Statements as at and for the year ended 31 March 2018
JSW Steel Limited | Integrated Report 2017-18
the end of a reporting year that the credit risk has not increased significantly since initial recognition due to improvement in credit quality as compared to the previous year, the Company again measures the loss allowance based on 12-month expected credit losses.
When making the assessment of whether there has been a significant increase in credit risk since initial recognition, the Company uses the change in the risk of a default occurring over the expected life of the financial instrument instead of the change in the amount of expected credit losses. To make that assessment, the Company compares the risk of a default occurring on the financial instrument as at the reporting date with the risk of a default occurring on the financial instrument as at the date of initial recognition and considers reasonable and supportable information, that is available without undue cost or effort, that is indicative of significant increases in credit risk since initial recognition.
For trade receivables or any contractual right to receive cash or another financial asset that result from transactions that are within the scope of Ind AS 11 and Ind AS 18, the Company always measures the loss allowance at an amount equal to lifetime expected credit losses.
Further, for the purpose of measuring lifetime expected credit loss allowance for trade receivables, the Company has used a practical expedient as permitted under Ind AS 109. This expected credit loss allowance is computed based on a provision matrix which takes into account historical credit loss experience and adjusted for forward-looking information.
The impairment requirements for the recognition and measurement of a loss allowance are equally applied to debt instruments at FVTOCI except that the loss allowance is recognised in other comprehensive income and is not reduced from the carrying amount in the balance sheet
e) Effective interest method
The effective interest method is a method of calculating the amortised cost of a debt instrument and of allocating interest income over the relevant year. The effective interest rate is the rate that exactly discounts estimated future cash receipts (including all fees and points paid or received that form an integral part of the effective interest rate, transaction costs and other premiums or discounts) through the expected life of the debt instrument, or, where appropriate, a shorter year, to the net carrying amount on initial recognition.
Income is recognised on an effective interest basis for debt instruments other than those financial assets classified as at FVTPL. Interest income is recognised in profit or loss and is included in the ‘Other income’ line item.
B. Financial liabilities and equity instruments
a) Classification as debt or equity
Debt and equity instruments issued by a Company are classified as either financial liabilities or as equity in accordance with the substance of the contractual arrangements and the definitions of a financial liability and an equity instrument.
b) Equity instruments
An equity instrument is any contract that evidences a residual interest in the assets of an entity after deducting all of its liabilities. Equity instruments issued by the Company are recognised at the proceeds received, net of direct issue costs.
Repurchase of the Company’s own equity instruments is recognised and deducted directly in equity. No gain or loss is recognised in Statement of Profit and Loss on the purchase, sale, issue or cancellation of the Company’s own equity instruments.
c) Financial liabilities
Financial liabilities are classified as either financial liabilities ‘at FVTPL’ or ‘other financial liabilities’.
Financial liabilities at FVTPL:
Financial liabilities are classified as at FVTPL when the financial liability is either held for trading or it is designated as at FVTPL.
A financial liability is classified as held for trading if:
It has been incurred principally for the purpose of repurchasing it in the near term; or
on initial recognition it is part of a portfolio of identified financial instruments that the Company manages together and has a recent actual pattern of short-term profit-taking; or
it is a derivative that is not designated and effective as a hedging instrument.
A financial liability other than a financial liability held for trading may be designated as at FVTPL upon initial recognition if:
such designation eliminates or significantly reduces a measurement or recognition inconsistency that would otherwise arise;
the financial liability forms part of a group of financial assets or financial liabilities or both,

Better Everyday. In Pursuit of Excellence. Corporate Overview Statutory Reports Financial Statements
237
Notes to the Standalone Financial Statements as at and for the year ended 31 March 2018
which is managed and its performance is evaluated on a fair value basis, in accordance with the Company’s documented risk management or investment strategy, and information about the grouping is provided internally on that basis; or
it forms part of a contract containing one or more embedded derivatives, and Ind AS 109 permits the entire combined contract to be designated as at FVTPL in accordance with Ind AS 109.
Financial liabilities at FVTPL are stated at fair value, with any gains or losses arising on remeasurement recognised in Statement of Profit and Loss. The net gain or loss recognised in Statement of Profit and Loss incorporates any interest paid on the financial liability and is included in the Statement of Profit and Loss. For Liabilities designated as FVTPL, fair value gains/losses attributable to changes in own credit risk are recognised in OCI.
The Company derecognises financial liabilities when, and only when, the Company’s obligations are discharged, cancelled or they expire. The difference between the carrying amount of the financial liability derecognised and the consideration paid and payable is recognised in Statement of Profit and Loss.
Other financial liabilities:
The Company enters into deferred payment arrangements (acceptances) whereby overseas lenders such as banks and other financial institutions make payments to supplier’s banks for import of raw materials and property, plant and equipment. The banks and financial institutions are subsequently repaid by the Company at a later date providing working capital benefits. These arrangements are in the nature of credit extended in normal operating cycle and these arrangements for raw materials are recognised as Acceptances (under trade payables) and arrangements for property, plant and equipment are recognised as other financial liabilities. Interest borne by the Company on such arrangements is accounted as finance cost. Other financial liabilities (including borrowings and trade and other payables) are subsequently measured at amortised cost using the effective interest method.
Derecognition of financial liabilities:
The Company derecognises financial liabilities when, and only when, the Company’s obligations are discharged, cancelled or have expired. An exchange between with a lender of debt instruments with substantially different terms is accounted for as an
extinguishment of the original financial liability and the recognition of a new financial liability. Similarly, a substantial modification of the terms of an existing financial liability (whether or not attributable to the financial difficulty of the debtor) is accounted for as an extinguishment of the original financial liability and the recognition of a new financial liability. The difference between the carrying amount of the financial liability derecognised and the consideration paid and payable is recognised in profit or loss.
d) Derivative financial instruments
The Company enters into a variety of derivative financial instruments to manage its exposure to interest rate, commodity price and foreign exchange rate risks, including foreign exchange forward contracts, commodity forward contracts, interest rate swaps and cross currency swaps.
Derivatives are initially recognised at fair value at the date the derivative contracts are entered into and are subsequently remeasured to their fair value at the end of each reporting year. The resulting gain or loss is recognised in Statement of Profit and Loss immediately unless the derivative is designated and effective as a hedging instrument, in which event the timing of the recognition in Statement of Profit and Loss depends on the nature of the hedge item.
e) Reclassification of financial assets
The Company determines classification of financial assets and liabilities on initial recognition. After initial recognition, no reclassification is made for financial assets which are equity instruments and financial liabilities. For financial assets which are debt instruments, a reclassification is made only if there is a change in the business model for managing those assets. Changes to the business model are expected to be infrequent. The Company’s senior management determines change in the business model as a result of external or internal changes which are significant to the Company’s operations. Such changes are evident to external parties. A change in the business model occurs when the Company either begins or ceases to perform an activity that is significant to its operations. If the Company reclassifies financial assets, it applies the reclassification prospectively from the reclassification date which is the first day of the immediately next reporting year following the change in business model. The Company does not restate any previously recognised gains, losses (including impairment gains or losses) or interest.

238
Notes to the Standalone Financial Statements as at and for the year ended 31 March 2018
JSW Steel Limited | Integrated Report 2017-18
Original classification
Revised classification
Accounting treatment
Amortised cost FVTPL Fair value is measured at reclassification date. Difference between previous amortised cost and fair value is recognised in Statement of Profit and Loss.
FVTPL Amortised Cost Fair value at reclassification date becomes its new gross carrying amount. EIR is calculated based on the new gross carrying amount.
Amortised cost FVTOCI Fair value is measured at reclassification date. Difference between previous amortised cost and fair value is recognised in OCI. No change in EIR due to reclassification.
FVTOCI Amortised cost Fair value at reclassification date becomes its new amortised cost carrying amount. However, cumulative gain or loss in OCI is adjusted against fair value. Consequently, the asset is measured as if it had always been measured at amortised cost.
FVTPL FVTOCI Fair value at reclassification date becomes its new carrying amount. No other adjustment is required.
FVTOCI FVTPL Assets continue to be measured at fair value. Cumulative gain or loss previously recognised in OCI is reclassified to Statement of Profit and Loss at the reclassification date.
f) Embedded derivatives
An embedded derivative is a component of a hybrid (combined) instrument that also includes a non-derivative host contract – with the effect that some of the cash flows of the combined instrument vary in a way similar to a stand-alone derivative. An embedded derivative causes some or all of the cash flows that otherwise would be required by the contract to be modified according to a specified interest rate, financial instrument price, commodity price, foreign exchange rate, index of prices or rates, credit rating or credit index, or other variable, provided in the case of a non-financial variable that the variable is not specific to a party to the contract. Reassessment only occurs if there is either a change in the terms of the contract that significantly modifies the cash flows that would otherwise be required or a reclassification of a financial asset out of the fair value through profit or loss.
If the hybrid contract contains a host that is a financial asset within the scope of Ind AS 109, the Company does not separate embedded derivatives. Rather, it applies the classification requirements contained in Ind AS 109 to the entire hybrid contract. Derivatives embedded in all other host contracts are accounted for as separate derivatives and recorded at fair value if their economic characteristics and risks are not closely related to those of the host contracts and the host contracts are not held for trading or designated at fair value though profit or loss. These embedded derivatives are measured at fair value with changes in fair value recognised in profit or loss, unless designated as effective
hedging instruments.
g) Hedge accounting
The Company designates certain hedging instruments, which include derivatives, embedded derivatives and non-derivatives in respect of foreign currency, interest rate and commodity risk, as either cash flow hedge, fair value hedge. Hedges of foreign currency risk on firm commitments are accounted for as cash flow hedges.
At the inception of the hedge relationship, the entity documents the relationship between the hedging instrument and the hedged item, along with its risk management objectives and its strategy for undertaking various hedge transactions. Furthermore, at the inception of the hedge and on an ongoing basis, the Company documents whether the hedging instrument is highly effective in offsetting changes in fair values or cash flows of the hedged item attributable to hedged risk.
(i) Fair value hedges
Changes in fair value of the designated portion of derivatives that qualify as fair value hedges are recognised in profit or loss immediately, together with any changes in the fair value of the hedged asset or liability that are attributable to the hedged risk. The change in the fair value of the designated portion of hedging instrument and the change in the hedged item attributable to hedged risk are recognised in profit or loss in the line item relating to the hedged item.

Better Everyday. In Pursuit of Excellence. Corporate Overview Statutory Reports Financial Statements
239
Notes to the Standalone Financial Statements as at and for the year ended 31 March 2018
Hedge accounting is discontinued when the hedging instrument expires or is sold, terminated, or exercised, or when it no longer qualifies for hedge accounting. For fair value hedges relating to items carried at amortised cost, the fair value adjustment to the carrying amount of the hedged item arising from the hedged risk is amortised to profit or loss from that date.
(ii) Cash flow hedges
The effective portion of changes in fair value of derivatives that are designated and qualify as cash flow hedges is recognised in other comprehensive income and accumulated under the heading of cash flow hedging reserve. The gain or loss relating to the ineffective portion is recognised immediately in profit or loss.
Amounts previously recognised in other comprehensive income and accumulated in equity relating to effective portion as described above are reclassified to profit or loss in the years when the hedged item affects profit or loss, in the same line as the recognised hedged item. However, when the hedged forecast transaction results in the recognition of a non-financial asset or a non-financial liability, such gains or losses are transferred from equity (but not as a reclassification adjustment) and included in the initial measurement of the cost of the non-financial asset or non-financial liability.
Hedge accounting is discontinued when the hedging instrument expires or is sold, terminated, or exercised, or when it no longer qualifies for hedge accounting. Any gain or loss recognised in other comprehensive income and accumulated in equity at that time remains in equity and is recognised when the forecast transaction is ultimately recognised in profit or loss. When a forecast transaction is no longer expected to occur, the gain or loss accumulated in equity is recognised immediately in profit or loss.
XIX. Cash and cash equivalents: Cash and cash equivalent in the Balance Sheet comprise
cash at banks and on hand and short-term deposits with an original maturity of three months or less, which are subject to insignificant risk of changes in value.
For the purpose of the Statement of cash flows, cash and cash equivalent consists of cash and short-term deposits, as defined above, net of outstanding bank overdrafts as they are considered an integral part of the Company’s cash management.
XX. Earnings per share: Basic earnings per share is computed by dividing the
profit / (loss) after tax by the weighted average number of equity shares outstanding during the year. The weighted average number of equity shares outstanding during the year is adjusted for treasury shares, bonus issue, bonus element in a rights issue to existing shareholders, share split and reverse share split (consolidation of shares).
Diluted earnings per share is computed by dividing the profit / (loss) after tax as adjusted for dividend, interest and other charges to expense or income (net of any attributable taxes) relating to the dilutive potential equity shares, by the weighted average number of equity shares considered for deriving basic earnings per share and the weighted average number of equity shares which could have been issued on the conversion of all dilutive potential equity shares including the treasury shares held by the Company to satisfy the exercise of the share options by the employees.
3. Key sources of estimation uncertainty and critical accounting judgements
In the course of applying the policies outlined in all notes under Section 2 above, the Company is required to make judgements, estimates and assumptions about the carrying amount of assets and liabilities that are not readily apparent from other sources. The estimates and associated assumptions are based on historical experience and other factors that are considered to be relevant. Actual results may differ from these estimates.
The estimates and underlying assumptions are reviewed on an ongoing basis. Revisions to accounting estimates are recognised in the year in which the estimate is revised if the revision affects only that year, or in the year of the revision and future year, if the revision affects current and future year.
A) Key sources of estimation uncertainty i) Useful lives of property, plant and equipment
Management reviews the useful lives of property, plant and equipment at least once a year. Such lives are dependent upon an assessment of both the technical lives of the assets and also their

240
Notes to the Standalone Financial Statements as at and for the year ended 31 March 2018
JSW Steel Limited | Integrated Report 2017-18
likely economic lives based on various internal and external factors including relative efficiency and operating costs. Accordingly depreciable lives are reviewed annually using the best information available to the Management.
ii) Impairment of investments in subsidiaries, joint-
ventures and associates
Determining whether the investments in subsidiaries, joint ventures and associates are impaired requires an estimate in the value in use of investments. In considering the value in use, the Directors have anticipated the future commodity prices, capacity utilisation of plants, operating margins, mineable resources and availability of infrastructure of mines, discount rates and other factors of the underlying businesses / operations of the investee companies as more fully described in note 51. Any subsequent changes to the cash flows due to changes in the above mentioned factors could impact the carrying value of investments.
iii) Contingencies
In the normal course of business, contingent liabilities may arise from litigation and other claims against the Company. Potential liabilities that are possible but not probable of crystalising or are very difficult to quantify reliably are treated as contingent liabilities. Such liabilities are disclosed in the notes but are not recognised.
iv) Fair value measurements
When the fair values of financial assets or financial liabilities recorded or disclosed in the financial statements cannot be measured based on quoted prices in active markets, their fair value is measured using valuation techniques including the DCF model. The inputs to these models are taken from observable markets where possible, but where this is not feasible, a degree of judgement is required in establishing fair values. Judgements include consideration of inputs such as liquidity risk, credit risk and volatility.
vi) Taxes
Deferred tax assets are recognised for unused tax losses to the extent that it is probable that taxable profit will be available against which the losses can be utilised. Significant management judgement is required to determine the amount of deferred tax assets that can be recognised, based upon the likely timing and the level of future taxable profits together with future tax planning strategies.
B) Critical accounting judgements i) Control over JSW Realty & Infrastructure Private Limited
(RIPL)
RIPL has developed a residential township in Vijaynagar, Karnataka on the land taken on lease from the Company for a year of 30 years and provides individual housing units on rent to the employees of the Company or other group companies. RIPL is not allowed to sub-let or assign its rights under the arrangement without prior written consent of the Company. Though the Company does not hold any ownership interest in RIPL, the Company has concluded that the Company has practical ability to direct the relevant activities of RIPL unilaterally, considering RIPL’s dependency on the Company for funding significant portion of its operation through subscription to 73.57% of preference share capital amounting to ` 199 crore issued by RIPL and significant portion of RIPL’s activities.
ii) Control over Dolvi Minerals & Metals Private Limited
(DMMPL) and Dolvi Coke Private Limited (DCPL)
DMMPL is an investment Company and is setting up recovery type coke oven plant and by-product plant ('Coke Plant') through its wholly owned subsidiary DCPL. Although, the Company owns only 40% of ownership interest, the Company has concluded that the Company has practical ability to direct the relevant activities of DMMPL unilaterally, considering
the relevant activities of DCPL are directed through the long-term take or pay arrangement entered into between the Company and DCPL,
Significant portion of DMMPL and DCPL activities either involve or are conducted on behalf of the Company, and
Return from Company’s involvement with DMMPL and in turn with DCPL is disproportionately greater than it voting rights considering the take or pay arrangement is at cost plus fixed margin basis.
iii) Separating payments of lease from the other payments
If an arrangement contains a lease, the parties to the arrangement shall apply the requirements of Ind AS 17 to the lease element. Therefore, the Company is required to separate payments and other consideration required by the arrangement into those for the lease and for other elements on the basis of their relative fair values.
However, Management has concluded that it is impracticable to separate both the elements reliably

Better Everyday. In Pursuit of Excellence. Corporate Overview Statutory Reports Financial Statements
241
Notes to the Standalone Financial Statements as at and for the year ended 31 March 2018
and has recognised an asset and a liability at an amount equal to the carrying value of the specified asset in the books of the lessor. Subsequently, the liability has been reduced as payments are made and an imputed finance charges on the liability recognised using the Company’s incremental borrowing rate of interest over the tenure of the arrangement. The total payments less payments made towards lease obligation and imputed finance charges have been considered to be the consideration for elements other than lease.
In case of arrangements which are identified to be in the nature of finance lease, the management concluded that it is impracticable to derive the relative fair values of lease and other elements of the arrangement and has accordingly determined the consideration for elements other than lease as a residual post appropriation of lease payments derived based on lessee’s incremental borrowing rate of interest on the lease obligation corresponding to the respective gross asset values in the books of lessor.

242
Notes to the Standalone Financial Statements as at and for the year ended 31 March 2018
JSW Steel Limited | Integrated Report 2017-18
4. Property, plant and equipment` in crores
Particulars Freehold land
Leasehold land
Buildings (Owned)
Buildings (On finance
lease)
Plant and equipment
(Owned)
Plant and equipment
(On finance lease)
Furniture and
fixtures
Vehicles and
aircrafts
Office equipment
Total
Cost/deemed cost
At 1 April 2016 929 168 5,756 157 37,510 4,562 70 119 33 49,304
Additions 22 - 531 21 5,194 1,071 8 9 15 6,871
Deductions - - - 248 - - 5 @ 253
Other adjustments (refer note c)
- - - 22 - - - - 22
At 31 March 2017 951 168 6,287 178 42,478 5,633 78 123 48 55,944
Additions 18 * 271 2 2,032 20 30 19 11 2,403
Deductions - - # 172 - - 7 ^ 179
Other adjustments (refer note c)
- - - 42 - - - - 42
At 31 March 2018 969 168 6,558 180 44,380 5,653 108 135 59 58,210
Accumulated depreciation
At 1 April 2016 - - 255 27 2,218 269 16 13 9 2,807
Depreciation - - 281 27 2,258 401 11 14 10 3,002
Deductions - - - 92 - @@ 2 ** 94
Other adjustments - - - 14 - - - - 14
At 31 March 2017 - - 536 54 4,398 670 27 25 19 5,729
Depreciation - 1 292 27 2,278 393 13 14 8 3,026
Deductions - - ## 45 - - 3 ^^ 48
At 31 March 2018 - 1 828 81 6,631 1,063 40 36 27 8,707
Net book value
At 31 March 2018 969 167 5,730 99 37,749 4,590 68 99 32 49,503
At 31 March 2017 951 168 5,751 124 38,080 4,963 51 98 29 50,215
Notes:` in crores
Description As at 31 March 2018
As at 31 March 2017
a) Freehold land which is yet to be registered in the Company’s name
Acre 19 27
Deemed cost 9 13
b) Freehold land and buildings which has been/agreed to be hypothecated/mortgaged to lenders of related parties
Deemed cost 288 270
c) Other adjustments comprises:
Borrowing cost ` in crores 23 26
Foreign exchange loss / (gain) ` in crores 19 (4)
d) For details of assets given on operating lease, refer note 48.
e) For details of assets given on finance lease, refer note 49.
f) Certain property, plant and equipment are pledged against borrowings, the details relating to which have been described in Note 20 and Note 25.

Better Everyday. In Pursuit of Excellence. Corporate Overview Statutory Reports Financial Statements
243
Notes to the Standalone Financial Statements as at and for the year ended 31 March 2018
g) Property, plant and equipment includes proportionate share (50%) of assets under joint operation as below:
` in crores
Particulars Buildings (Owned)
Plant and Equipment (Owned)
Cost/deemed cost
At 1 April 2016 459 7
Additions 6 -
At 31 March 2017 465 7
Additions - -
At 31 March 2018 465 7
Accumulated depreciation
At 1 April 2016 15 #
Depreciation 15 1
At 31 March 2017 30 1
Depreciation 16 1
At 31 March 2018 46 2
Net book value
At 31 March 2018 419 5
At 31 March 2017 435 6
# ` 0.38 crore
h) @ ` 0.31 crore * ` 0.08 crore # ` 0.28 crore ^ ` 0.01 crore @@ ` 0.08 crore
** ` 0.32 crore ## ` 0.04 crore ^^ ` 0.01 crore
5. Capital work-in-progress includes exchange fluctuation Loss of ̀ 54 crores (previous year gain ̀ 41 crores) and borrowing cost of ` 50 crores (previous year ` 48 crores).
6. Intangible assets` in crores
Particulars Computer software
License fees
Mining Assets
Total
Cost/deemed Cost
At 1 April 2016 61 22 - 83
Additions 12 - - 12
At 31 March 2017 73 22 - 95
Additions 20 4 18 42
At 31 March 2018 93 26 18 137
Accumulated amortisation
At 1 April 2016 17 4 - 21
Amortisation 19 4 - 23
At 31 March 2017 36 8 - 44
Amortisation 20 7 1 28
At 31 March 2018 56 15 1 72
Net book value
At 31 March 2018 37 11 17 65
At 31 March 2017 37 14 - 51

244
Notes to the Standalone Financial Statements as at and for the year ended 31 March 2018
JSW Steel Limited | Integrated Report 2017-18
7. Investments in subsidiaries, associates and joint venturesParticulars Paid-up value As at 31 March 2018 As at 31 March 2017
No. of shares ` in crores No. of shares ` in crores
A Investment in equity instruments
UnquotedSubsidiaries (at cost or deemed cost)
Amba River Coke Limited (refer note a) ` 10 each 93,18,98,670 932 93,18,98,670 932
JSW Bengal Steel Limited ` 10 each 44,79,15,000 445 44,29,15,000 440
JSW Jharkhand Steel Limited ` 10 each 8,37,85,953 84 8,00,11,053 80
JSW Natural Resources Limited USD 10 each 13,65,500 4 13,65,500 4
JSW Steel Processing Centres Limited ` 10 each 5,00,00,000 50 5,00,00,000 50
JSW Steel(Netherlands) B.V. Euro 1 each 7,07,625 4 7,07,625 4
Periama Holding LLC 0.1% Equity Interest in the capital
NA ## NA ##
JSW Steel Coated Products Limited ` 10 each 5,00,50,000 1,314 5,00,50,000 1,314
Arima Holdings Limited USD 100 each 50,390 *** 50,390 ***
Erebus Limited USD 100 each 2,15,420 ### 2,15,420 ###
Nippon Ispat Singapore (Pte) Limited SGD 1 each 7,84,502 - 7,84,502 -
Peddar Realty Private Limited ` 10 each 10,000 57 10,000 57
Lakeland Securities Limited USD 100 each 351 @@ 351 @@
JSW Steel (Salav) Limited (refer note b) ` 10 each 1,33,48,57,243 424 1,33,34,57,243 424
JSW Steel UK Limited GBP 1 each 5,55,200 3 5,55,200 3
JSW Industrial Gases Private Limited (formerly known as Jindal Praxair Oxygen Private Limited (JPOCPL)
` 10 each 9,20,83,826 267 9,20,83,826 267
Dolvi Minerals & Metals Private Limited (refer note c)
` 10 each 4,00,00,000 40 4,00,00,000 40
JSW Steel Utkal Limited ` 10 each 5,00,000 @@@ - -
Joint ventures (at cost or deemed cost)
Gourangdih Coal Limited ` 10 each 24,50,000 2 24,50,000 2
JSW MI Service Centre Private Limited ` 10 each 6,65,00,000 67 4,28,39,800 43
JSW Severfield Structures Limited ` 10 each 16,04,37,940 160 11,54,37,940 115
Rohne Coal Company Private Limited ` 10 each 4,90,000 “” 4,90,000 “”
JSW Vallabh Tinplate Private Limited ` 10 each 2,50,19,600 30 2,50,19,600 30
Vijayanagar Minerals Private Limited ` 10 each 4,000 @ 4,000 @
B Investment in limited liability partnership firm
Unquoted subsidiary (at cost or deemed cost)
Inversiones Eroush Limitada (unquoted) 5% Equity Interest in the capital
NA ^^^ NA ^^^
Total 3,884 3,807
Less: Aggregate amount of provision for impairment in the value of investments
(36) (35)
3,848 3,772
Unquoted
Aggregate carrying value 3,848 3,772
*** ` 0.25 crore ### ` 0.27 crore @@ ` 0.22 crore “” ` 0.49 crore ^^^ ` 0.01 crore @ ` 40,000 ## $1 @@@ ` 0.50 crore
Note:(a) 304,373,882 shares (as at 31 March 2017 304,373,882 shares) are pledged to the subsidiary’s banker.
(b) 400,605,365 shares (as at 31 March 2017 400,605,365 shares) are pledged to the subsidiary’s banker.
(c) 40,000,000 shares (as at 31 March 2017 40,000,000 shares) are pledged to the subsidiary’s banker.

Better Everyday. In Pursuit of Excellence. Corporate Overview Statutory Reports Financial Statements
245
Notes to the Standalone Financial Statements as at and for the year ended 31 March 2018
8. Investments (non-current)Particulars Paid-up value As at 31 March 2018 As at 31 March 2017
No. of shares ` in crores No. of shares ` in crores
A Investment in equity instrumentsQuoted – Others (at fair value through OCI)Fully paid-up
JSW Energy Limited ` 10 each 9,14,74,090 666 9,14,74,090 574
Unquoted Others
(at fair value through OCI) Toshiba JSW Power Systems Private Limited
` 10 each 1,10,00,000 - 1,10,00,000 11
MJSJ Coal Limited ` 10 each 1,04,61,000 9 1,04,61,000 9
SICOM Limited ` 10 each 6,00,000 5 6,00,000 5
Kalyani Mukand Limited ` 1 each 4,80,000 $ 4,80,000 $
Ispat Profiles India Limited ` 1 each 15,00,000 $ 15,00,000 $
14 25
B Investments in preference shares Terms
Unquoted – (at fair value through profit or loss)SubsidiariesJSW Steel (Netherlands) B.V. 5% redeemable,
non-cumulative of Euro 1 each
3,99,00,250 254 3,99,00,250 290
JSW Steel (Salav) Limited 0% redeemable, non-cumulative of ` 10 each
2,31,34,494 6 2,31,34,494 5
JSW Realty & Infrastructure Private Limited
10% redeemable, non-cumulative of ` 100 each
1,99,15,000 82 1,99,15,000 75
Joint ventures
Rohne Coal Company Private Limited
1% non-cumulative of ` 10 each
2,36,42,580 - 2,36,42,580 1
Rohne Coal Company Private Limited
1% Series-A non-cumulative of ` 10 each
71,52,530 7 71,52,530 7
Rohne Coal Company Private Limited
1% Series-B non-cumulative of ` 10 each
11,43,486 1 641,286 1
350 379
C Investments in Government securities (unquoted – Others) (at amortised cost)
National Savings Certificates ^^ ^^
(Pledged with commercial tax department)
1,030 978
Quoted
Aggregate book value 666 574
Aggregate market value 666 574
Unquoted
Aggregate carrying value 364 405
Investments at cost ^^ ^^
Investments at fair value through other comprehensive income
680 599
Investments at fair value through profit and loss
350 379
^^ ` 0.07 crore $ ` 1

246
Notes to the Standalone Financial Statements as at and for the year ended 31 March 2018
JSW Steel Limited | Integrated Report 2017-18
9. Loans (Unsecured)` in crores
Particulars As at 31 March 2018 As at 31 March 2017
Non-current Current Non-current Current
Loans
to related parties* 5,400 4 2,682 5to other body corporate 9 - 9 -
Security deposits 288 154 141 116
Less: Allowance for doubtful loans (Considered doubtful) (532) - (61) -Total 5,165 158 2,771 121
Note:
Considered good 5,165 158 2,771 121
Considered doubtful, provided:
Loans and advances to other body corporate 9 - 9 -Loans and advances to related parties 523 - 52 -
*for business purpose
Details of loans and advances in the nature of loans to subsidiaries:` in crores
Name of Company As at 31 March 2018 As at 31 March 2017
Maximum amount
outstanding during the year
Amount outstanding
Maximum amount
outstanding during the year
Amount outstanding
JSW Steel (Netherlands) B.V. 527 525 155 151
JSW Natural Resources Limited 190 115 100 95
Inversiones Eroush Limitada 694 694 675 660
Periama Holdings, LLC 3,988 3,988 5,073 1,551
JSW Steel UK Limited 10 10 - -
Arima Holding Ltd. # # - -
Lakeland Securities Limited # # - -
Erebus Limited # # - -
# ` 0.13 crores
10. Others financial assets (Unsecured)` in crores
Particulars As at 31 March 2018 As at 31 March 2017
Non-current Current Non-current Current
Export benefits and entitlements 1 53 2 105
Insurance claim receivable 43 - 43 -Advance towards equity share capital / preference shares 121 - 24 -Government grant income receivable - 234 - -
Interest receivable on loans to related parties 581 - 579 -Indirect tax recoverable - 184 - 191
Others - 32 # 32
Total 746 503 648 328
# ` 0.07 crore

Better Everyday. In Pursuit of Excellence. Corporate Overview Statutory Reports Financial Statements
247
Notes to the Standalone Financial Statements as at and for the year ended 31 March 2018
11. Other assets (Unsecured) ` in crores
Particulars As at 31 March 2018 As at 31 March 2017
Non–current Current Non-current Current
Capital advances 933 - 238 -
Less: Allowance for doubtful advances (3) - (3) -
Other Advances
Advance to suppliers 174 1,679 152 1,354
Export benefits and entitlements 56 106 66 191
Security deposits 33 51 32 69
Indirect tax balances/recoverable/credits 1,185 1,159 940 661
Prepayments and others 46 75 39 105
Less: Allowance for doubtful advances (125) - (68) (10)
Total 2,299 3,070 1,396 2,370
Other Assets constitute:
Capital advances
Considered good 930 - 235 -
Considered doubtful, provided 3 - 3 -
Other Advances
Considered good 1,369 3,070 1,161 2,370
Considered doubtful, provided
Advances to suppliers 121 - 61 9
Prepayment and others 2 - 7 1
Indirect tax balances/recoverable/credits 2 - - -
12. Inventories ` in crores
Particulars As at 31 March 2018
As at 31 March 2017
Raw materials (at cost) 4,918 3,590
Work-in-progress (at cost) 690 747
Semi-finished/ finished goods (at cost or net realisable value) 2,826 3,702
Production consumables and stores and spares (at cost) 1,648 1,231
Total 10,082 9,270
Inventories have been pledged as security against certain bank borrowings, details relating to which has been described in note 20 and note 25.
Details of Stock-in-transit` in crores
Particulars As at 31 March 2018
As at 31 March 2017
Raw materials 1,867 960
Production consumables and stores and spares 189 55
Total 2,056 1,015
13. Investments (Current) ` in crores
Particulars As at 31 March 2018
As at 31 March 2017
Mutual funds (Quoted) - 300
Total - 300
Quoted
Aggregate book value - 300
Aggregate market value - 300

248
Notes to the Standalone Financial Statements as at and for the year ended 31 March 2018
JSW Steel Limited | Integrated Report 2017-18
14. Trade receivables ` in crores
Particulars As at 31 March 2018
As at 31 March 2017
Secured, considered good 88 160
Unsecured, considered good 4,604 3,788
Doubtful 78 6
4,770 3,954
Less: Allowance for doubtful debts (78) (6)
Total 4,692 3,948
Ageing of receivables that are past due` in crores
Particulars As at 31 March 2018
As at 31 March 2017
60-90 days 149 129
90-180 days 58 37
>180 days 393 204
Total 600 370
The credit period on sales of goods ranges from 7 to 60 days with or without security.
Before accepting any new customer, the Company uses an external credit scoring system to assess the potential customer’s credit quality and defines credit limits by customer. Limits and scoring attributed to customers are reviewed once a year.
The Company does not generally hold any collateral or other credit enhancements over these balances nor does it have a legal right of offset against any amounts owed by the Company to the counterparty.
Trade receivables have been given as collateral towards borrowings details relating to which has been described in note 20 and note 25.
15. Cash and cash equivalents` in crores
Particulars As at 31 March 2018
As at 31 March 2017
Balances with Banks
In current accounts 188 354
In term deposit Accounts with maturity less than 3 months at inception 262 357
In margin money with maturity less than 3 months at inception - 1
Cheques on hand - #
Cash on hand @ ^
Total 451 712
# ` 0.01 crore @ ` 0.46 crore ^ ` 0.27 crore
16. Bank balance other than cash and cash equivalents` in crores
Particulars As at 31 March 2018
As at 31 March 2017
Earmarked balances in current accounts 26 21
Balances with Banks
In term deposit accounts
with maturity more than 3 months but less than 12 months at inception 122 293
with maturity more than 12 months at inception 1 #
In margin money 1 1
Total 150 315
# ` 0.04 crore
Earmarked bank balances are restricted in use and it relates to unclaimed dividend and balances with banks held as margin money for security against the guarantees.

Better Everyday. In Pursuit of Excellence. Corporate Overview Statutory Reports Financial Statements
249
Notes to the Standalone Financial Statements as at and for the year ended 31 March 2018
17. Derivative Assets` in crores
Particulars As at 31 March 2018
As at 31 March 2017
Forward contract 82 152
Commodity contract 8 263
Interest rate swap 37 17
Currency option 20 2
Total 147 434
18. Equity share capitalParticulars As at
31 March 2018As at
31 March 2017As at
31 March 2018As at
31 March 2017Share capital Number of Shares Amount (` in crores)
(a) Authorised
Equity shares of the par value of ` 1 each 60,15,00,00,000 60,15,00,00,000 6,015 6,015
(b) Issued and subscribed (i) Outstanding at the beginning of the
year, fully paid-up2,41,72,20,440 2,41,72,20,440 242 242
(ii) Less: Treasury shares held under ESOP Trust (refer note below)
(10,988,860) (1,42,35,750) (1) (2)
(iii) Outstanding at the end of the year, fully paid-up
2,40,62,31,580 2,40,29,84,690 241 240
(c) Equity shares forfeited (amount originally paid-up)
61 61
Total 302 301
Movement in treasury shares
Particulars As at 31 March 2018
As at 31 March 2017
As at 31 March 2018
As at 31 March 2017
Shares of ` 1 each fully paid-up held under ESOP Trust Number of shares Amount (` in crores)
Equity shares as at 1 April 1,42,35,750 1,84,88,170 2 2
Changes during the year (32,46,890) (42,52,420) @ #
Equity shares as at 31 March 1,09,88,860 1,42,35,750 1 2
@ ` 0.32 crore # ` 0.42 crore
a) RIGHTS, PREFERENCES AND RESTRICTIONS ATTACHED TO EQUITY SHARES
The Company has a single class of equity shares. Each shareholder is eligible for one vote per share held. The dividend proposed by the Board of Directors is subject to the approval of the shareholders. In the event of liquidation, the equity shareholders are eligible to receive the remaining assets of the Company after distribution of all preferential amounts, in proportion to their shareholding.
b) SHAREHOLDERS HOLDING MORE THAN 5% SHARE IN THE Company ARE SET OUT BELOW
Particulars As at 31 March 2018 As at 31 March 2017
No. of Shares % of shares No. of Shares % of shares
Equity shares
JFE Steel International Europe BV 36,25,83,070 15.00% 36,25,83,070 15.00%
JSW Holdings Limited 17,73,06,230 7.34% 17,57,94,230 7.27%
Vividh Finvest Private Limited (Formerly Vividh Consultancy & Advisory Services Private Limited)
14,07,26,690 5.82% 13,98,66,690 5.79%
JSW Techno Projects Management Ltd 22,93,26,950 9.49% 22,93,26,950 9.49%
c) NOTE FOR SHARES HELD UNDER ESOP TRUST:
For the details of shares reserved for issue under the Employee Stock Ownership Plan (ESOP) of the Company (refer note 39).
d) SHARES ALLOTTED AS FULLY PAID-UP PURSUANT TO CONTRACTS WITHOUT PAYMENT BEING RECEIVED IN CASH DURING THE YEAR OF
FIVE YEARS IMMEDIATELY PRECEDING THE DATE OF THE BALANCE SHEET ARE AS UNDER:
186,048,440 Equity shares fully paid-up to the shareholders of the erstwhile JSW Ispat Steel Limited pursuant to a Composite Scheme of Amalgamation and Arrangement was sanctioned by the Hon’ble Bombay High Court vide its Order dated 3 May 2013. The scheme was effective from 1 July 2012 being the appointed date. The Record Date fixed by the Company for the aforesaid allotments was 12 June 2013.

250
Notes to the Standalone Financial Statements as at and for the year ended 31 March 2018
JSW Steel Limited | Integrated Report 2017-18
19. Other equity` in crores
Particulars As at 31 March 2018
As at 31 March 2017
General reserve 10,278 10,417
Retained Earnings 7,571 3,337
Other Comprehensive Income:
Equity instruments through other comprehensive income 435 353
Effective portion of cash flow hedges 13 236
Foreign currency monetary item translation difference account (FCMITDA) (25) (4)
Other Reserves
Equity settled share based payment reserve 41 13
Capital reserve 3,585 3,585
Capital redemption reserve 149 10
Securities premium reserve 5,417 5,417
Debenture redemption reserve 141 433
Total 27,605 23,797
(i) General reserve Under the erstwhile Indian Companies Act, 1956, a general reserve was created through an annual transfer of net income
at a specified percentage in accordance with applicable regulations. The purpose of these transfers was to ensure that if a dividend distribution in a given year is more than 10.00% of the paid-up capital of the Company for that year, then the total dividend distribution is less than the total distributable reserves for that year.
Consequent to introduction of Companies Act, 2013, the requirement of mandatory transfer of a specified percentage of the net profit to general reserve has been withdrawn and the Company can optionally transfer any amount from the surplus of profit or loss to the General reserves.
(ii) Debenture redemption reserve The Indian Companies Act requires companies that issue debentures to create a debenture redemption reserve (DRR)
from annual profits until such debentures are redeemed. Companies are required to maintain 25% as a reserve of outstanding redeemable debentures. Accordingly, the Company creates DRR at 25% in the penultimate year to the year in which the repayment obligation arises on the Company. The amounts credited to the debenture redemption reserve will not be utilised except to redeem debentures.
(iii) Effective portion of cash flow hedges Effective portion of cash flow hedges represents the cumulative effective portion of gains or losses arising on changes
in fair value of hedging instruments entered into for cash flow hedges, which shall be reclassified to profit or loss only when the hedged transaction affects the profit or loss, or included as a basis adjustment to the non-financial hedged item, consistent with the Company accounting policies.
(iv) Foreign currency monetary item translation difference account (FCMITDA) The Company has continued with the policy adopted for accounting for exchange differences arising from translation
of long-term foreign currency monetary items recognised in the standalone financial statements prepared under previous GAAP for the year ended 31 March 2016. The reserve pertains to exchange differences relating to long-term foreign currency monetary items in so far as they do not relate to acquisition of depreciable capital assets, which are accumulated in 'Foreign Currency Monetary Item Translation Difference Account' and amortised in the Statement of Profit and Loss over the balance Year of such long-term foreign currency monetary item.
(v) Equity settled share based payment reserve The Company offers ESOP, under which options to subscribe for the Company’s share have been granted to certain
employees and senior management. The share based payment reserve is used to recognise the value of equity settled share based payments provided as part of the ESOP scheme.
(vi) Capital reserve Reserve is primarily created on amalgamation as per statutory requirement.
(vii) Capital redemption reserve Reserve is created for redemption of preference shares as per statutory requirement.
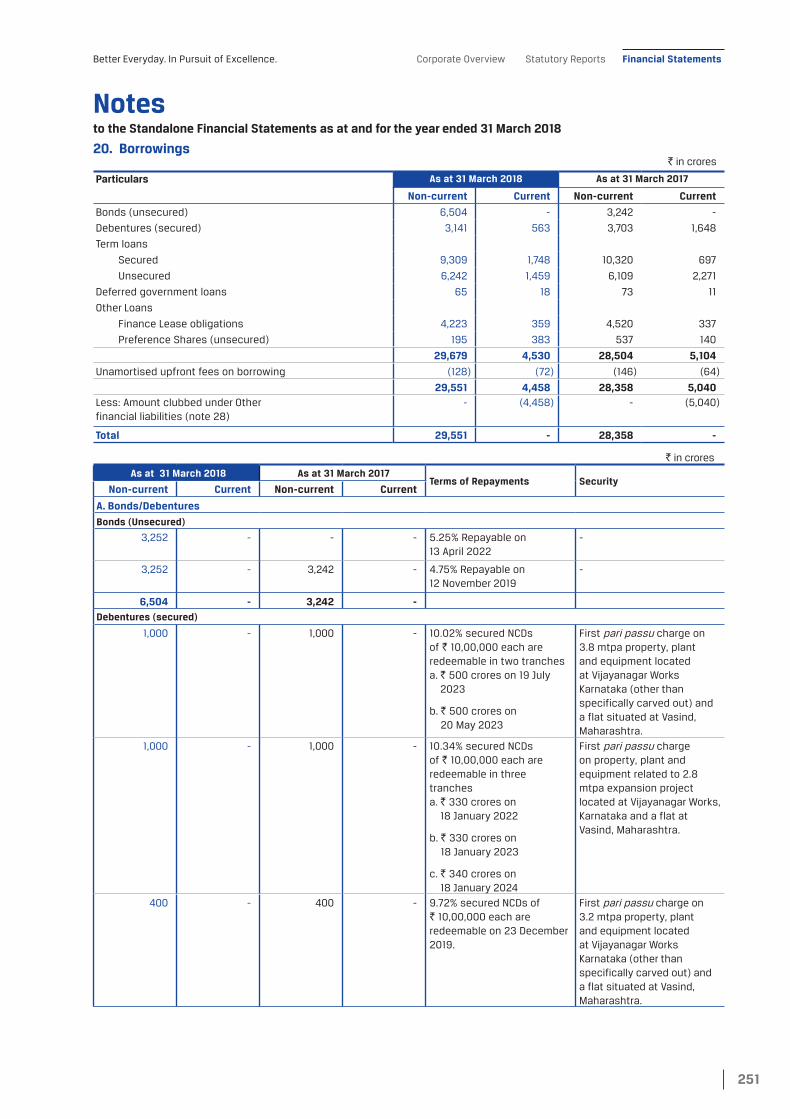
Better Everyday. In Pursuit of Excellence. Corporate Overview Statutory Reports Financial Statements
251
Notes to the Standalone Financial Statements as at and for the year ended 31 March 2018
20. Borrowings` in crores
Particulars As at 31 March 2018 As at 31 March 2017
Non-current Current Non-current Current
Bonds (unsecured) 6,504 - 3,242 -
Debentures (secured) 3,141 563 3,703 1,648
Term loans
Secured 9,309 1,748 10,320 697
Unsecured 6,242 1,459 6,109 2,271
Deferred government loans 65 18 73 11
Other Loans
Finance Lease obligations 4,223 359 4,520 337
Preference Shares (unsecured) 195 383 537 140
29,679 4,530 28,504 5,104
Unamortised upfront fees on borrowing (128) (72) (146) (64)
29,551 4,458 28,358 5,040Less: Amount clubbed under Other financial liabilities (note 28)
- (4,458) - (5,040)
Total 29,551 - 28,358 -
` in crores
As at 31 March 2018 As at 31 March 2017Terms of Repayments Security
Non-current Current Non-current Current
A. Bonds/Debentures
Bonds (Unsecured)
3,252 - - - 5.25% Repayable on 13 April 2022
-
3,252 - 3,242 - 4.75% Repayable on 12 November 2019
-
6,504 - 3,242 -Debentures (secured)
1,000 - 1,000 - 10.02% secured NCDs of ` 10,00,000 each are redeemable in two tranches a. ̀ 500 crores on 19 July
2023
b. ̀ 500 crores on 20 May 2023
First pari passu charge on 3.8 mtpa property, plant and equipment located at Vijayanagar Works Karnataka (other than specifically carved out) and a flat situated at Vasind, Maharashtra.
1,000 - 1,000 - 10.34% secured NCDs of ` 10,00,000 each are redeemable in three tranches a. ̀ 330 crores on
18 January 2022
b. ̀ 330 crores on 18 January 2023
c. ̀ 340 crores on 18 January 2024
First pari passu charge on property, plant and equipment related to 2.8 mtpa expansion project located at Vijayanagar Works, Karnataka and a flat at Vasind, Maharashtra.
400 - 400 - 9.72% secured NCDs of ` 10,00,000 each are redeemable on 23 December 2019.
First pari passu charge on 3.2 mtpa property, plant and equipment located at Vijayanagar Works Karnataka (other than specifically carved out) and a flat situated at Vasind, Maharashtra.

252
Notes to the Standalone Financial Statements as at and for the year ended 31 March 2018
JSW Steel Limited | Integrated Report 2017-18
` in crores
As at 31 March 2018 As at 31 March 2017Terms of Repayments Security
Non-current Current Non-current Current
250 - 250 - 10.40% secured NCDs of ` 10,00,000 each are redeemable on 19 August 2019 (with Put option excercisable on 19 August 2017).
First pari passu charge on 3.2 mtpa property, plant and equipment located at Vijayanagar Works Karnataka (other than specifically carved out) and a flat situated at Vasind, Maharashtra.
425 - 425 - 10.60% secured NCDs of ` 10,00,000 each are redeemable on 19 August 2019.
First pari passu charge on 3.2 mtpa property, plant and equipment located at Vijayanagar Works Karnataka (other than specifically carved out) and a flat situated at Vasind, Maharashtra.
- 300 300 - 9.665% secured NCDs of ` 10,00,000 each are redeemable on 23 December 2018.
First pari passu charge on 3.2 mtpa property, plant and equipment located at Vijayanagar Works Karnataka (other than specifically carved out) and a flat situated at Vasind, Maharashtra.
- 175 175 - 10.50% secured NCDs of ` 10,00,000 each are redeemable on 19 August 2018.
First pari passu charge on 3.2 mtpa property, plant and equipment located at Vijayanagar Works Karnataka (other than specifically carved out) and a flat situated at Vasind, Maharashtra.
- - - 167 10.25% secured NCDs of ` 3,33,333 each are redeemable in 1 equal annual instalment on 17 February 2018.
First pari passu first charge on all immovable properties and movable assets both present and future located at Salem Works in the State of Tamil Nadu.
- - - 300 9.62% secured NCDs of ` 10,00,000 each are redeemable on 23 December 2017.
First pari passu charge on 3.2 mtpa property, plant and equipment located at Vijayanagar Works Karnataka (other than specifically carved out) and a flat situated at Vasind, Maharashtra.
- - - 200 10.20% secured NCDs of ` 10,00,000 each are redeemable on 11 September 2017.
First pari passu charge on 3.8 mtpa property, plant and equipment located at Vijayanagar Works Karnataka (other than specifically carved out) and a flat situated at Vasind, Maharashtra.
- - - 500 10.20% secured NCDs of ` 10,00,000 each are redeemable on 5 September 2017.
First pari passu charge on 3.8 mtpa property, plant and equipment located at Vijayanagar Works Karnataka (other than specifically carved out) and a flat situated at Vasind, Maharashtra.

Better Everyday. In Pursuit of Excellence. Corporate Overview Statutory Reports Financial Statements
253
Notes to the Standalone Financial Statements as at and for the year ended 31 March 2018
` in crores
As at 31 March 2018 As at 31 March 2017Terms of Repayments Security
Non-current Current Non-current Current
- - - 175 10.40% secured NCDs of ` 10,00,000 each are redeemable on 19 August 2017.
First pari passu charge on 3.2 mtpa property, plant and equipment located at Vijayanagar Works Karnataka (other than specifically carved out) and a flat situated at Vasind, Maharashtra.
44 44 88 44 10.60% secured NCDs of ` 7,50,000 each are redeemable as 4 half yearly instalments of ` 21.875 crores each from 2 August 2018 to 2 February 2020.
First pari passu charge by way of legal mortgage on land situated in the State of Gujarat. First pari passu charge by way of equitable mortgage on property, plant and equipment of the new 5 mtpa Hot Strip Mill at Vijayanagar Works, Karnataka.
22 44 65 44 10.60% secured NCDs of ` 6,25,000 each are redeemable as 3 half yearly instalments of ` 21.875 crores each from 2 July 2018 to 2 July 2019.
First pari passu charge by way of legal mortgage on land situated in the State of Gujarat. First pari passu charge by way of equitable mortgage on property, plant and equipment of the new 5 mtpa Hot Strip Mill at Vijayanagar Works, Karnataka
- - - 125 10.10% secured NCDs of ` 2,50,000 each are redeemable as 4 quarterly instalments of ` 31.25 crores each from 15 June 2017 to 15 March 2018.
First pari passu charge on all immovable properties and movable assets both present and future located at Salem Works in the State of Tamil Nadu.
- - - 93 10.10% secured NCDs of ` 1,87,500 each are redeemable as 3 quarterly instalments of ` 31.25 crores each from 04 May 2017 to 4 November 2017.
First pari passu charge on all immovable properties and movable assets both present and future located at Salem Works in the State of Tamil Nadu.
3,141 563 3,703 1,648
B. Term loans
Rupee term loans from Banks (Secured) Weighted average interest rate as on 31 March 2018 is 8.82%
712 38 750 - 8 Quarterly instalments of ` 18.75 crores each from 31 October 2018 - 31 July 2020
16 Quarterly instalments of ` 37.50 crores each from 31 October 2020 – 31 July 2024
First charge on property, plant and equipment situated at Dolvi works, Maharashtra.
875 100 975 25 7 Quarterly instalment of ` 25 crore each from 30 June 2018 - 31 December 2019
16 Quarterly instalment of ` 50 crore each from 31 March 2020 – 31 December 2023
First charge on 3.2 mtpa expansion property, plant and equipment situated at Vijayanagar Works Karnataka.

254
Notes to the Standalone Financial Statements as at and for the year ended 31 March 2018
JSW Steel Limited | Integrated Report 2017-18
` in crores
As at 31 March 2018 As at 31 March 2017Terms of Repayments Security
Non-current Current Non-current Current
1,094 62 1,106 113 10 Quarterly instalments of ` 15.625 crores each from 30 April 2018 – 31 July 2020
04 Quarterly instalments of ` 62.50 crores each from 31 October 2020 – 31 July 2021
08 Quarterly instalments of ` 93.75 crores each from 31 October 2021 – 31 July 2023
First charge on property, plant and equipment situated at Dolvi works, Maharashtra.
962 75 1,037 50 3 quarterly instalments of ` 12.5 crores each from 30 June 2018 – 31 December 2018
12 quarterly instalments of ` 37.5 crores each from 31 March 2019 – 31 December 2021
4 quarterly instalments of ` 43.75 crores each from 31 March 2022 – 31 December 2022
2 quarterly instalments of ` 187.5 crores each from 31 March 2023 – 30 June 2023
First pari passu charge on 3.8 mtpa upstream assets (other than assets specifically carved out) at Vijayanagar Works, Karnataka.
1,600 150 1,750 100 2 Quarterly instalments of ` 25 crore each from 30 June 2018 – 30 September 2018
10 Quarterly instalments of ` 50 crore each from 31 December 2018 – 31 March 2021
4 Quarterly instalments of ` 125 crore each from 30 June 2021 – 31 March 2022
2 Quarterly instalments of ` 350 crore each from 30 June 2022- 30 September 2022.
First charge on property, plant and equipment situated at Dolvi works, Maharashtra.
650 150 800 50 12 quarterly instalments of ` 37.5 crores each from 30 June 2018 – 31 March 2018
4 quarterly instalments of ` 43.75 crores each from 30 June 2021 – 31 March 2022 2 quarterly instalments of ` 87.5 crores each from 30 June 2022 – 30 September 2022.
First pari passu charge on 3.8mtpa upstream assets (other than assets specifically carved out) at Vijayanagar Works, Karnataka.
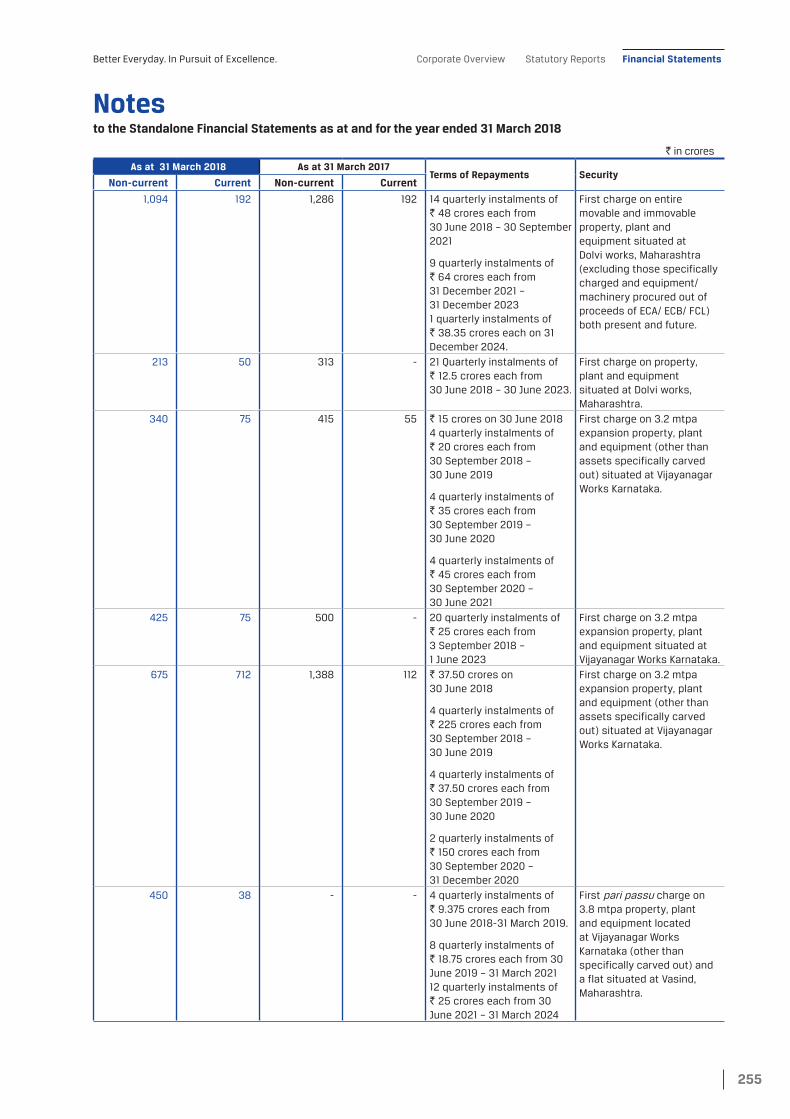
Better Everyday. In Pursuit of Excellence. Corporate Overview Statutory Reports Financial Statements
255
Notes to the Standalone Financial Statements as at and for the year ended 31 March 2018
` in crores
As at 31 March 2018 As at 31 March 2017Terms of Repayments Security
Non-current Current Non-current Current
1,094 192 1,286 192 14 quarterly instalments of ` 48 crores each from 30 June 2018 – 30 September 2021
9 quarterly instalments of ` 64 crores each from 31 December 2021 – 31 December 2023 1 quarterly instalments of ` 38.35 crores each on 31 December 2024.
First charge on entire movable and immovable property, plant and equipment situated at Dolvi works, Maharashtra (excluding those specifically charged and equipment/machinery procured out of proceeds of ECA/ ECB/ FCL) both present and future.
213 50 313 - 21 Quarterly instalments of ` 12.5 crores each from 30 June 2018 – 30 June 2023.
First charge on property, plant and equipment situated at Dolvi works, Maharashtra.
340 75 415 55 ` 15 crores on 30 June 2018 4 quarterly instalments of ` 20 crores each from 30 September 2018 – 30 June 2019
4 quarterly instalments of ` 35 crores each from 30 September 2019 – 30 June 2020
4 quarterly instalments of ` 45 crores each from 30 September 2020 – 30 June 2021
First charge on 3.2 mtpa expansion property, plant and equipment (other than assets specifically carved out) situated at Vijayanagar Works Karnataka.
425 75 500 - 20 quarterly instalments of ` 25 crores each from 3 September 2018 – 1 June 2023
First charge on 3.2 mtpa expansion property, plant and equipment situated at Vijayanagar Works Karnataka.
675 712 1,388 112 ` 37.50 crores on 30 June 2018
4 quarterly instalments of ` 225 crores each from 30 September 2018 – 30 June 2019
4 quarterly instalments of ` 37.50 crores each from 30 September 2019 – 30 June 2020
2 quarterly instalments of ` 150 crores each from 30 September 2020 – 31 December 2020
First charge on 3.2 mtpa expansion property, plant and equipment (other than assets specifically carved out) situated at Vijayanagar Works Karnataka.
450 38 - - 4 quarterly instalments of ` 9.375 crores each from 30 June 2018-31 March 2019.
8 quarterly instalments of ` 18.75 crores each from 30 June 2019 – 31 March 2021 12 quarterly instalments of ` 25 crores each from 30 June 2021 – 31 March 2024
First pari passu charge on 3.8 mtpa property, plant and equipment located at Vijayanagar Works Karnataka (other than specifically carved out) and a flat situated at Vasind, Maharashtra.

256
Notes to the Standalone Financial Statements as at and for the year ended 31 March 2018
JSW Steel Limited | Integrated Report 2017-18
` in crores
As at 31 March 2018 As at 31 March 2017Terms of Repayments Security
Non-current Current Non-current Current
219 31 - - 16 quarterly instalments of ` 15.625 crores each from 31 December 2018 – 1 June 2023
First pari passu charge on 3.8 mtpa property, plant and equipment located at Vijayanagar Works Karnataka (other than specifically carved out) and a flat situated at Vasind, Maharashtra.
9,309 1,748 10,320 697
Rupee term loans from Banks (Unsecured) Weighted average interest rate as on 31 March 2018 is 8.64%
- 250 250 - 2 quarterly instalments of ` 125 crores each from 30 June 2018 to 30 September 2018
- 400 - - ` 150 crores on 31 July 2018 and ` 250 crores 31 December 2018
- 250 - - ` 50 crores each from 15 November 2018 ` 200 crores each from 15 December 2018
- 900 250 -
Foreign currency term loans from Banks (Unsecured) Weighted average interest rate as on 31 March 2018 is 4.11%
634 188 819 187 7 half yearly instalments of ` 54.10 crores each from 31 May 2018 to 31 March 2021.
11 half yearly instalments of ` 34.57 crores each from 30 April 2018 to 30 April 2023
12 half yearly instalments of ` 5.26 crores each from 18 September 2018 to 18 March 2024.
-
62 12 74 12 12 half yearly instalments of ` 6.19 crores each from 28 August 2018 to 28 February 2024
-
116 19 131 18 12 half yearly instalments of ` 2.93 crores each from 31 July 2018 to 31 January 2024.
13 half yearly instalments of ` 1.04 crores each from 30 April 2018 to 30 April 2024
16 semi annual instalments of ` 1.97 crores each from 25 September 2018 to 25 March 2026
16 semi annual instalments of ` 1.96 crores each from 25 September 2018 to 25 March 2026.
17 semi annual installments of ` 1.375 crores each from 25 June 2018 to 25 June 2026.
-

Better Everyday. In Pursuit of Excellence. Corporate Overview Statutory Reports Financial Statements
257
Notes to the Standalone Financial Statements as at and for the year ended 31 March 2018
` in crores
As at 31 March 2018 As at 31 March 2017Terms of Repayments Security
Non-current Current Non-current Current
58 12 69 12 12 half yearly instalments of ` 5.80 crores each from 30 September 2018 to 31 March 2024
-
1,626 - 1,621 - Repayable on 20 March 2020 -
361 73 423 71 11 half yearly instalments of ` 15.91 crores each from 19 July 2018 to 19 July 2023 and 1 half yearly instalment of ` 15.90 crores on 19 January 2024.
-
11 half yearly instalments of ` 20.72 crores each from 19 July 2018 to 19 July 2023 and 1 half yearly instalment of ` 15.74 crores on 19 January 2024.
198 34 227 33 13 equal semi annual instalments of ` 5.59 crores each from 09 July 2018 to 9 July 2024 and 1 semi annual instalment of ` 4.92 crores on 09 January 2025
13 equal semi annual instalments of ` 11.22 crores each from 09 July 2018 to 9 July 2024 and 1 semi annual instalment of ` 8.13 crores on 09 January 2025
-
313 9 321 9 13 equal semi annual instalments of ` 2.97 crores each from 25 September 2018 to 25 September 2024 and 1 semi annual instalment of ` 2.51 crores on 25 March 2025
3 equal annual instalments of ` 86.73 from 13 August 2019 to 13 August 2021
14 equal semi annual instalments of ` 1.46 crores each from 25 September 2018 to 25 March 2025
-
- 85 80 80 1 yearly instalment of ` 84.72 crores on 26 July 2018.
- - - 363 1 half yearly instalments on 28 August 2017.
-
- - - 1,459 Repayable on 26 June 2017 -
48 10 49 8 12 equal semi annual instalments of ` 4.82 crores each from 15 June 2018 to 15 December 2023.
-
463 98 560 - Repayable in three tranches
a. ̀ 98.26 crores on 27 April 2018
b. ̀ 224.59 crores on 27 April 2020
c. ̀ 238.62 crores on 27 April 2021
-

258
Notes to the Standalone Financial Statements as at and for the year ended 31 March 2018
JSW Steel Limited | Integrated Report 2017-18
` in crores
As at 31 March 2018 As at 31 March 2017Terms of Repayments Security
Non-current Current Non-current Current
66 8 60 7 18 semi annual instalments of ` 4.132 crores each from 31 July 2018 to 31 January 2027
-
976 - 973 - 3 equal instalments of ` 325.22 crores each on 02 April 2020, 21 September 2020 and 21 March 2021
-
85 11 95 12 16 semi annual instalments of ` 4.07 crores each from 30 July 2018 to 31 January 2026
16 semi annual instalments of ` 1.904 crores each from 30 August 2018 to 28 February 2026
-
586 - 357 - Repayable in three tranchesa. ̀ 325 crores on
21 February 2022b. ̀ 33 crores on
6 March 2022c. ̀ 228 crores on
6 July 2022
-
650 - - - 4 annual instalments of ` 162.61 crores from 12 October 2021 to 12 November 2024
-
6,242 559 5,859 2,271
Total term loan-Unsecured
6,242 1,459 6,109 2,271
C. Deferred government loans (Unsecured)
65 18 73 11 42 varying monthly instalments starting from 30 April 2018 to 31 August 2021.
-
D. Financial lease obligations
4,223 359 4,520 337 Varying monthly instalments from 8 to 15 years (refer note 49)
-
E. Preference Shares (Unsecured)
- 140 140 140 10% CPRS Redeemable at par in 2 equal quarterly instalments starting from 15 June 2018
-
195 243 397 - 0.01% CPRS Redeemable at par in 8 quarterly instalments starting from 15 June 2018
-
195 383 537 140
F. Unamortised upfront fees on borrowing
(128) (72) (146) (64) - -
Total ` in crores
29,551 4,458 28,358 5,040 -
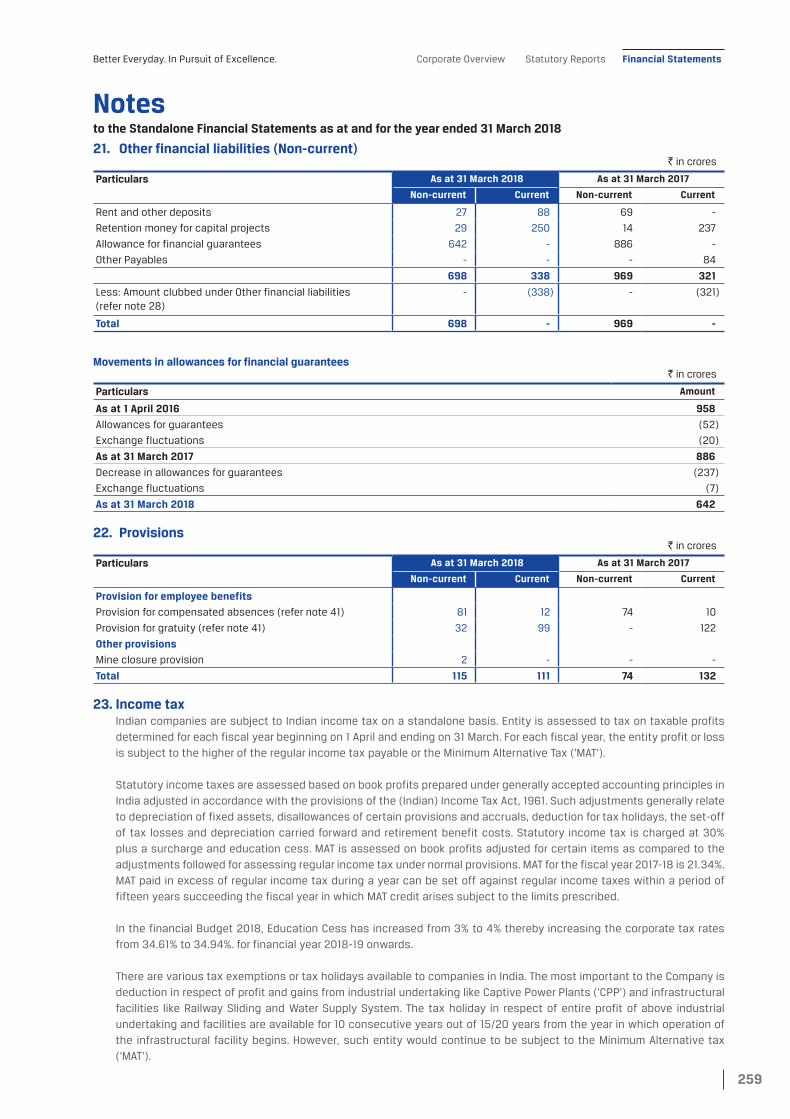
Better Everyday. In Pursuit of Excellence. Corporate Overview Statutory Reports Financial Statements
259
Notes to the Standalone Financial Statements as at and for the year ended 31 March 2018
21. Other financial liabilities (Non-current) ` in crores
Particulars As at 31 March 2018 As at 31 March 2017
Non-current Current Non-current Current
Rent and other deposits 27 88 69 -
Retention money for capital projects 29 250 14 237
Allowance for financial guarantees 642 - 886 -
Other Payables - - - 84
698 338 969 321
Less: Amount clubbed under Other financial liabilities (refer note 28)
- (338) - (321)
Total 698 - 969 -
Movements in allowances for financial guarantees ` in crores
Particulars Amount
As at 1 April 2016 958
Allowances for guarantees (52)
Exchange fluctuations (20)
As at 31 March 2017 886
Decrease in allowances for guarantees (237)
Exchange fluctuations (7)
As at 31 March 2018 642
22. Provisions ` in crores
Particulars As at 31 March 2018 As at 31 March 2017
Non-current Current Non-current Current
Provision for employee benefits
Provision for compensated absences (refer note 41) 81 12 74 10
Provision for gratuity (refer note 41) 32 99 - 122
Other provisions
Mine closure provision 2 - - -
Total 115 111 74 132
23. Income taxIndian companies are subject to Indian income tax on a standalone basis. Entity is assessed to tax on taxable profits determined for each fiscal year beginning on 1 April and ending on 31 March. For each fiscal year, the entity profit or loss is subject to the higher of the regular income tax payable or the Minimum Alternative Tax ('MAT').
Statutory income taxes are assessed based on book profits prepared under generally accepted accounting principles in India adjusted in accordance with the provisions of the (Indian) Income Tax Act, 1961. Such adjustments generally relate to depreciation of fixed assets, disallowances of certain provisions and accruals, deduction for tax holidays, the set-off of tax losses and depreciation carried forward and retirement benefit costs. Statutory income tax is charged at 30% plus a surcharge and education cess. MAT is assessed on book profits adjusted for certain items as compared to the adjustments followed for assessing regular income tax under normal provisions. MAT for the fiscal year 2017-18 is 21.34%. MAT paid in excess of regular income tax during a year can be set off against regular income taxes within a period of fifteen years succeeding the fiscal year in which MAT credit arises subject to the limits prescribed.
In the financial Budget 2018, Education Cess has increased from 3% to 4% thereby increasing the corporate tax rates from 34.61% to 34.94%. for financial year 2018-19 onwards.
There are various tax exemptions or tax holidays available to companies in India. The most important to the Company is deduction in respect of profit and gains from industrial undertaking like Captive Power Plants (‘CPP’) and infrastructural facilities like Railway Sliding and Water Supply System. The tax holiday in respect of entire profit of above industrial undertaking and facilities are available for 10 consecutive years out of 15/20 years from the year in which operation of the infrastructural facility begins. However, such entity would continue to be subject to the Minimum Alternative tax (‘MAT’).

260
Notes to the Standalone Financial Statements as at and for the year ended 31 March 2018
JSW Steel Limited | Integrated Report 2017-18
A. Income tax expense ` in crores
Particulars For the year ended 31 March 2018
For the year ended 31 March 2017
Current tax:
Current tax (MAT) 1,598 -
Tax refund / reversal pertaining to earlier years (20) (53)
1,578 (53)
Deferred tax:
Deferred tax 2,397 1,577
MAT credit entitlement (1,598) -
(Restoration)/reversal of MAT credit entitlement 20 (109)
Provision/(reversal) due to change in tax rate from 34.61% to 34.94% 39
Tax provision/(reversal) for earlier years 14 139
Total deferred tax 872 1,607
Total tax expense 2,450 1,554
A reconciliation of income tax expense applicable to accounting profit before tax at the statutory income tax rate to recognised income tax expense for the year indicated are as follows:
` in crores
Particulars For the year ended 31 March 2018
For the year ended 31 March 2017
Profit before tax 7,075 5,131
Enacted tax rate in India 34.61% 34.61%
Expected income tax expense at statutory tax rate 2,448 1,776
Expenses not deductible in determining taxable profit 154 17
Income exempt from taxation (228) (135)
Tax allowances and concession (1) (81)
Minimum alternate tax - (109)
Provision/(reversal) due to change in tax rate from 34.61% to 34.94% 63 86
Tax provision/(reversal) for earlier years 14 -
Tax expense for the year 2,450 1,554
Effective income tax rate 34.63% 30.30%
There are certain income-tax related legal proceedings which are pending against the Company. Potential liabilities, if any have been adequately provided for, and the Company does not currently estimate any probable material incremental tax liabilities in respect of these matters (refer note 45).
B. Deferred tax liabilities (net) Significant components of deferred tax assets/(liabilities) recognised in the financial statements are as follows:
` in crores
Deferred tax balance in relation to As at31 March 2017
Recognised / reversed
through profit and loss
Recognised in / reclassified
from other comprehensive
income
As at31 March 2018
Property, plant and equipment (9,514) (307) - (9,821)
Carried forward business loss/ unabsorbed depreciation 3,249 (2,135) - 1,114
Cash flow hedges / FCMITDA (123) - 130 7
Provisions for employee benefit / loans and advances and guarantees
292 112 1405
Finance Lease obligation 1,784 43 - 1,827
Others 238 (163) - 74
MAT credit entitlement(net of reversal) 2,745 1,578 - 4,323
Total (1,329) (872) 131 (2,071)

Better Everyday. In Pursuit of Excellence. Corporate Overview Statutory Reports Financial Statements
261
Notes to the Standalone Financial Statements as at and for the year ended 31 March 2018
` in crores
Deferred tax balance in relation to As at 31 March 2016
Recognised / reversed
through profit and loss
Recognised in / reclassified
from other comprehensive
income
As at 31 March 2017
Property, plant and equipment (8,411) (1,103) - (9,514)
Carried forward business loss/ unabsorbed depreciation 2,804 445 - 3,249
Cash flow hedges / FCMITDA 84 - (207) (123)
Provisions for employee benefit / loans and advances and guarantees
1,683 (1,396) 6 292
Finance Lease obligation 1,376 408 - 1,784
Others 308 (70) - 238
MAT credit entitlement(net of reversal) 2,636 109 - 2,745
Total 480 (1,607) (201) (1,329)
The Company expects to utilise the MAT credit within a period of 15 years.
Deferred tax asset on long-term capital losses of ` 203 crores expiring in fiscal year 2021-22 has not been recognised in the absence of reasonable certainty of its utilisation.
24. Other liabilities (Non-current) ` in crores
Particulars As at 31 March 2018
As at 31 March 2017
Employees Car Deposits 4 3
Total 4 3
25. Borrowings (current) ` in crores
Particulars As at 31 March 2018
As at 31 March 2017
Loan repayable on demand
Working capital loans from banks (secured)
Rupee loan 157 51
Foreign currency loan 96 -
Foreign currency loan from bank (unsecured) 662 103
Rupee loans from banks (unsecured) 24 405
Commercial papers (unsecured) 1,233 4,316
Total 2,172 4,875
Borrowing have been drawn at following rate of interest
Particulars Rates of interest
Cash Credit 8.45% p.a. to 9.45% p.a.
CP 7.12% p.a. to 7.25% p.a.
EPC 8.30% p.a.
PCFC 2.30% p.a. to 3.25% p.a.
Working capital loans of ` 253 crores (31 March 2017 ` 51 crores) are secured by:
i) pari passu first charge by way of hypothecation of stocks of raw materials, finished goods, work-in-process, consumables (stores and spares) and book debts / receivables of the Company, both present and future.
ii) pari passu second charge on movable properties and immovable properties forming part of the property, plant and equipments of the Company, both present and future except such properties as may be specifically excluded.

262
Notes to the Standalone Financial Statements as at and for the year ended 31 March 2018
JSW Steel Limited | Integrated Report 2017-18
26. Trade payables ` in crores
Particulars As at 31 March 2018
As at 31 March 2017
Acceptances 8,098 8,415
Other than acceptances 5,890 3,189
Total 13,988 11,604
Acceptances include credit availed by the Company from banks for payment to suppliers for raw materials purchased by the Company. The arrangements are interest-bearing and are payable within one year.
Payables Other than acceptances are normally settled within 1 to 180 days.
Disclosure pertaining to micro, small and medium enterprises (as per information available with the Company):
` in crores
Description As at 31 March 2018
As at 31 March 2017
Principal amount due outstanding as at end of year 10 1
Interest due on (1) above and unpaid as at end of year @ #
Interest paid to the supplier - -
Payments made to the supplier beyond the appointed day during the year - -
Interest due and payable for the year of delay - -
Interest accrued and remaining unpaid as at end of year - -
Amount of further interest remaining due and payable in succeeding year 1 1
@ ` 0.28 Crore # ` 0.13 Crore
27. Derivative Liabilities ` in crores
Particulars As at 31 March 2018
As at 31 March 2017
Forward contract 42 237
Commodity contract 45 39
Interest rate swap 2 #
Currency option 1 106
Total 90 382
# ` 0.19 Crore
28. Other financial liabilities (Current) ` in crores
Particulars As at 31 March 2018
As at 31 March 2017
Current maturities of long-term debt (refer note 20) 4,099 4,703
Current maturities of finance lease obligations (refer note 20) 359 337
Current dues of other long-term liabilities(refer note 21) 338 321
Payables for capital projects
Acceptances 670 1,015
Other than acceptances 508 661
Interest accrued but not due on borrowings 374 351
Payables to employees 152 138
Unclaimed matured debentures and accrued interest thereon # #
Unclaimed dividends 23 18
Unclaimed amount of sale proceeds of fractional shares 3 3
Others 585 565
Total 7,111 8,112
# ` 0.38 Crore
Acceptances include credit availed by the Company from Banks for payment to suppliers for capital items. The arrangements are interest-bearing and are payable within one year.

Better Everyday. In Pursuit of Excellence. Corporate Overview Statutory Reports Financial Statements
263
Notes to the Standalone Financial Statements as at and for the year ended 31 March 2018
29. Other current liabilities ` in crores
Particulars As at 31 March 2018
As at 31 March 2017
Advances from customers 280 260
Statutory liabilities 934 609
Export obligation deferred income * 167 120
Total 1,381 989
*Represents government assistance in the form of the duty benefit availed under Export Promotion Capital Goods (EPCG) Scheme and Special Economic Zone (SEZ) scheme on purchase of property, plant and equipments accounted for as government grant and being amortised over the useful life of such assets.
30. Revenue from operations` in crores
Particulars For the year ended 31 March 2018
For the year ended 31 March 2017
Sale of products
Domestic turnover 53,380 45,322
Export turnover 11,666 10,922
A 65,046 56,244
Other operating revenues
Government grant income (including gain on prepayment of deferred government loan)
1,001 511
Miscellaneous income 187 158
B 1,188 669
Total A+B 66,234 56,913
Product-wise turnover
Particulars For the year ended 31 March 2018
For the year ended 31 March 2017
Tonnes ` incrores
Tonnes ` incrores
MS slabs 360,187 1,133 212,350 621
Hot rolled coils/steel plates/sheets* 8,549,548 33,336 8,450,648 29,903
Galvanised coils/sheets 473,098 2,361 474,109 2,054
Cold rolled coils/sheets 2,145,068 9,588 2,048,189 8,232
Steel billets & blooms 542,900 1,779 527,085 1,489
Long rolled products 3,551,250 13,623 3,061,745 10,709
Others - 3,226 - 3,236
Total 65,046 56,244
* Includes Hot rolled coils converted into SAW Pipes on Jobwork basis – Sales – 89,820 tonnes (previous year: 1,76,254 tonnes) Value – ` 429 crores (previous year: ` 758 crores)
The Company’s unit at Dolvi in the State of Maharashtra was eligible for a deferral of VAT/CST collected on sale of finished goods under Package Scheme of Incentive (PSI) – 1993, which is accounted as a Government grant. The Government of Maharashtra vide its notification dated 14 February 2018 has announced the Industrial promotion Subsidy (IPS) schemes would be continued in the GST regime with the incentives being determined based on the State GST in place of the erstwhile VAT. However, the process of disbursing the incentives has not been notified yet. The Company believes that the process of disbursement of incentives would continue to remain unchanged and accordingly has recognised the government grant of ` 544 crores for the year.
The Company’s unit at Vijayanagar in the State of Karnataka was eligible for a deferral of VAT collected on sale of finished goods under The State Industrial policy 2009-14. The Government of Karnataka vide its notification dated 13 March 2018 has announced that the incentives schemes would be continued in the GST regime with the incentives being determined based on the SGST rate in place of the erstwhile VAT rate. Accordingly, the Company has recognised the government grant of ` 277 crores for the year.
Revenue from operations for periods up to 30 June 2017 includes excise duty, which is discontinued with effect from 1 July 2017 upon implementation of Goods and Service Tax (GST). In accordance with ‘Ind AS 18 - Revenue’, GST is not included in Revenue from operations. In view of the aforesaid change in indirect taxes, Revenue from operations for the year ended 31 March 2018 is not comparable to the year ended 31 March 2017.

264
Notes to the Standalone Financial Statements as at and for the year ended 31 March 2018
JSW Steel Limited | Integrated Report 2017-18
31. Other income ` in crores
Particulars For the year ended 31 March 2018
For the year ended 31 March 2017
Interest Income earned on financial assets that are not designated as FVTPL
Loans to related parties 105 129
Bank deposits 20 28
Other Interest income 51 59
Dividend income from non-current investments designated as FVTOCI 5 18
Gain on sale of current investments designated as FVTPL 16 6
Fair value gain arising from financial instruments designated as FVTPL 9 9
Guarantees/Standby letter of credit commission 7 6
Total 213 255
32. Changes in inventories of finished goods and work-in-progress ` in crores
Particulars For the year ended31 March 2018
For the year ended31 March 2017
Opening stock:
Semi-finished /finished goods 3,702 2,327
Work-in-progress 747 588
A 4,449 2,915
Closing stock:
Semi-finished /finished goods 2,826 3,702
Work-in-progress 690 747
B 3,516 4,449
C (A-B) 933 (1,534)
Excise duty on stock of finished goods (net) D (521) 144
C-D 412 (1,390)
33. Employee benefits expense ` in crores
Particulars For the year ended31 March 2018
For the year ended31 March 2017
Salaries and wages 1,091 1,009
Contribution to provident and other funds (refer note 41) 73 76
Expenses on employees stock ownership plan 26 12
Staff welfare expenses 70 71
Total 1,260 1,168
34. Finance costs ` in crores
Particulars For the year ended 31 March 2018
For the year ended 31 March 2017
Interest
Bonds and Debentures 810 968
Others 1,960 1,847
Dividend on redeemable preference shares 72 71
Interest on finance lease obligations 587 622
Unwinding of interest on financial liabilities carried at amortised cost 12 14
Exchange differences regarded as an adjustment to borrowing costs 22 -
Other borrowing costs 105 121
Interest on Income Tax 23 -
Total 3,591 3,643

Better Everyday. In Pursuit of Excellence. Corporate Overview Statutory Reports Financial Statements
265
Notes to the Standalone Financial Statements as at and for the year ended 31 March 2018
35. Depreciation and amortisation expense ` in crores
Particulars For the year ended 31 March 2018
For the year ended 31 March 2017
Depreciation of property, plant and equipment 3,026 3,002
Amortisation of intangible assets 28 23
Total 3,054 3,025
36. Other expenses ` in crores
Particulars For the year ended31 March 2018
For the year ended31 March 2017
Stores and spares consumed 2,636 2,364
Power and fuel 4,771 4,097
Rent 31 38
Repairs and maintenance
Plant and machinery 1,107 1,083
Buildings 25 20
Others 14 17
Insurance 52 71
Rates and taxes 44 72
Carriage and freight 1,930 2,045
Jobwork and processing charges 810 692
Commission on sales 41 33
Net loss/ (gain) on foreign currency transactions and translation # 88 493
Donations and contributions 3 -
CSR Expenditure 53 43
Miscellaneous expenses 601 420
Bad debts/ advance written-off - 1
Less: Allowances made in earlier years - (1)
Allowances for doubtful debts, loans and advances (net) 144 1
Fair value Loss arising from financial instruments designated as FVTPL 30 -
Loss on sale of property, plant and equipment (net) 124 134
Write off of investment loan & Advances - 5,243
Less: Provision for impairment/loss allowances recognised in earlier years - (5,243)
Total 12,504 11,623
# including hedging cost of ` 223 crores (previous year ` 316 crores)
Note:
a) Auditors remuneration (excluding tax) included in miscellaneous expenses: ` in crores
Particulars For the year ended 31 March 2018
For the year ended 31 March 2017
As audit fees (including limited reviews) 5 5
For tax audit fees # 1
For certification & other services 1 4
Out of pocket expenses @ *
Total 6 10
# ` 0.46 Crore @ ` 0.06 Crore * ` 0.09 Crore

266
Notes to the Standalone Financial Statements as at and for the year ended 31 March 2018
JSW Steel Limited | Integrated Report 2017-18
b) Corporate Social Responsibility (CSR) The Company has incurred an amount of ` 53 Crores (31 March 2017 ` 43 Crore) towards Corporate Social
Responsibility (CSR) as per Section 135 of the Companies Act, 2013 and is included in other expenses
` in crores
Particulars For the year ended 31 March 2018
For the year ended 31 March 2017
In- Cash Yet to be Paid in Cash
In- Cash Yet to be Paid in Cash
(a) Gross amount required to be spend by the Company during the year
35 - 37 -
(b) Amount spend on:
(i) Construction / acquisition of assets - - - -
(ii) On purposes other than (i) above (for CSR projects)
44 9 43 @
@ ` 0.30 crore
37. Research and development activitiesDetails of expenditure incurred in respect of research and development activities under taken during the year is as follows
Particulars For the year Ended 31 March 2018
For the year Ended 31 March 2017
Manufacturing and other expenditure 25 18
Depreciation expenses 12 11
Capital expenditure (including capital work-in-progress) 16 1
38. Earnings per share (EPS)Particulars For the year ended
31 March 2018For the year ended
31 March 2017
Profit/(Loss) attributable to equity shareholders (` in crores) (A) 4,625 3,577
Weighted average number of equity shares for basic EPS (B) 2,40,41,52,929 2,40,25,84,542
Effect of dilution:
Weighted average number of treasury shares held through ESOP trust 1,30,67,511 1,46,35,898
Weighted average number of equity shares adjusted for the effect of dilution (C) 2,41,72,20,440 2,41,72,20,440
Basic EPS (Amount in `) (A/B) 19.24 14.89
Diluted EPS (Amount in `) (A/C) 19.14 14.80
39. Employee share based payment plans
ESOP SCHEME 2012 The Company offered equity based share option scheme for permanent employees of the Company and its subsidiaries
in the grade of L8 and above including any director except to any employee who is a promoter or a director who either himself or through relatives or through anybody directly or indirectly holds more than 10% of the outstanding equity shares of the Company.
The grant is determined as percentage of Total Fixed Pay. The grant was at such price as determined by the ESOP Committee and be specified in the Grant. The option shall not be transferable and can be exercised only by the employees of the Company.
The Employees Stock Ownership Plan was effective from 26 July 2012. The eligible employees could exercise the option anytime between the vesting period till 30 September 2017.
The number of options granted to each eligible employee is determined by dividing the Award Value (amount equivalent to percentage of Annual Fix Pay) by the Fair Value of option provided. The Fair Value of option on the date of each grant is determined by using Black Scholes model.
The details of an employee share based payments plan operated through a trust for ESOP 2012 are as follows:

Better Everyday. In Pursuit of Excellence. Corporate Overview Statutory Reports Financial Statements
267
Notes to the Standalone Financial Statements as at and for the year ended 31 March 2018
Option series Options granted
Options vested
Grant date Vesting period Exercise price
Fair value at grant date
Method of settlement
Initial grant - 26 July 2012
31,357,440 26,318,680 26 July 2012 30 Sep 2013 till 30 Sep 2017
70 36.81 Equity
1st Subsequent grant - 26 July 2012
16,024,800 12,430,410 26 July 2012 30 Sep 2014 till 30 Sep 2017
70 33.23 Equity
ESOP SCHEME 2016 The Board of Directors of the Company at its meeting held on 29 January 2016, formulated the JSWSL EMPLOYEES
STOCK OWNERSHIP PLAN 2016 ('ESOP Plan'). At the said meeting, the Board authorised the ESOP Committee for the superintendence of the ESOP Plan.
During the year, ESOP 2016 is the primary arrangement under which shared plan service incentives are provided to certain specified employees of the Company and it’s subsidiaries in India.
Three grants would be made under ESOP plan 2016 to eligible employees on the rolls of the Company as at 1 April 2016, 1 April 2017 and 1 April 2018.
The maximum value and share options that can be awarded to eligible employees is calculated by reference to certain percentage of individuals fixed salary compensation. 50% of the grant would vest at the end of the third year and 50% of the grant would vest at the end of the fourth year with a vesting condition that the employee is in continuous employment with the Company till the date of vesting.
The exercise price would be determined by the ESOP committee as a certain discount to the primary market price on the date of grant.
A total of 28,687,000 options would be available for grant to the eligible employees of the Company and a total of 3,163,000 options would be available for grant to the eligible employees of the Indian subsidiaries of the Company under the ESOP Plan.
These options are equity settled and are accounted for in accordance with the requirement applying to equity settled transactions.
The details of an employee share based payments plan operated through a trust for ESOP 2016 are as follows:
Option series Options granted
Options vested
Grant date Vesting period Exercise price
Fair value at grant date
Method of settlement
1st Grant- 17 May 2016
68,04,820 NIL 17 May 2016 17 May 2016 till 31 March 2019 (for 50% of the grant) and 17 May 2016 to 31 March 2020 (for remaining 50% of the grant)
103.65 67.48 Equity
2nd Grant- 16 May 2017
47,00,461 NIL 16 May 2017 16 May 2017 till 31 March, 2020 for 50% of the options granted and upto 31 March, 2021 for remaining 50% of the options granted
161.36 104.04 Equity

268
Notes to the Standalone Financial Statements as at and for the year ended 31 March 2018
JSW Steel Limited | Integrated Report 2017-18
The outstanding position as at 31 March 2018 is summarised below:
Particulars ESOP 2012 ESOP 2016
Initial Grant (Junior Manager & Above)
1st Subsequent Grant (Junior
Manager & Above)
1st Grant (L-16 and above Grade)
2nd Grant (L-16 and above Grade)
Date of grant 26 July 2012 26 July 2012 17 May 2016 16 May 2017
Share Price on date of grant 66.97 66.97 129.56 201.70
Outstanding as on 1 April 2016 55,54,480 68,99,410 - -
Granted during the period - - 68,04,820 -
Forfeited/Lapsed during the period 14,200 69,990 2,24,650 -
Exercised during the period 24,98,180 40,28,540 - -
Outstanding as on 31 March 2017 30,42,100 28,00,880 65,80,170 -
Transfer in 28,120 18,320 - -
Transfer Out - - - -
Granted during the period - - - 47,00,461
Forfeited during the period - - 1,26,640 70,405
Lapsed during the period 83,450 60,530 - -
Exercised during the period 29,86,770 27,58,670 - -
Outstanding as on 31 March 2018 - - 64,53,530 46,30,056
Vesting Period 30 September 2013 till 30 September 2017
30 September 2014 till 30 September 2017
17 May 2016 till 31 March 2019 (for 50% of the grant) and 17 May 2016 to 31 March 2020 (for remaining 50% of the grant)
16 May 2017 till 31 March, 2020 for 50% of the options granted and upto 31 March, 2021 for remaining 50% of the options granted
Weighted average remaining contract life - - 30 months 42 months
Exercise price 70 70 103.65 161.36
Weighted average share price on exercise date
230.40 235.34 Not applicable Not applicable
A description of the method and significant assumptions used during the year to estimate the fair value of options including the following information:
The fair value of options has been calculated by using Black Schole’s Method. The assumptions used in the above are:
The fair value of options has been calculated by using Black Schole’s Method. The assumptions used in the above are:
The fair value of options has been calculated by using Black Schole’s Method. The assumptions used in the above are:
The fair value of options has been calculated by using Black Schole’s Method. The assumptions used in the above are:
Weighted-average values of share price Not applicable Not applicable Not applicable Not applicable
Weighted-average exercise price 70 70 Not applicable Not applicable
Expected volatility Volatility was calculated using standard deviation of daily change in stock price.
Volatility was calculated using standard deviation of daily change in stock price.
Volatility was calculated using standard deviation of daily change in stock price.
Volatility was calculated using standard deviation of daily change in stock price.
The volatility used for valuation is 61.58%
The volatility used for valuation is 60.79%
The volatility used for valuation is 39.23 % for options with 3 year vesting and 39.62 % with 4 years vesting
The volatility used for valuation is 39.23 % for options with 3 year vesting and 39.62 % with 4 years vesting

Better Everyday. In Pursuit of Excellence. Corporate Overview Statutory Reports Financial Statements
269
Notes to the Standalone Financial Statements as at and for the year ended 31 March 2018
Particulars ESOP 2012 ESOP 2016
Initial Grant (Junior Manager & Above)
1st Subsequent Grant (Junior
Manager & Above)
1st Grant (L-16 and above Grade)
2nd Grant (L-16 and above Grade)
Expected option life The expected option life is assumed to be the full term of the option program.
The expected option life is assumed to be the full term of the option program.
The expected option life is assumed to be mid-way between the option vesting and expiry. Since the vesting period and contractual term of each tranche is different, the expected life for each tranche will be different. The expected option life is calculated as (Year to Vesting + Contractual Option Term)/2
The expected option life is assumed to be mid-way between the option vesting and expiry. Since the vesting period and contractual term of each tranche is different, the expected life for each tranche will be different. The expected option life is calculated as (Year to Vesting + Contractual Option Term)/2
Expected dividends ` 0.75 per share ` 0.75 per share ` 1.10 per share ` 0.75 per share
Risk-free interest rate Zero Coupon sovereign bond yields were utilised with maturity equal to expected term of option.
Zero Coupon sovereign bond yields were utilised with maturity equal to expected term of option.
Zero coupon sovereign bond yields were utilised with maturity equal to expected term of the option
Zero coupon sovereign bond yields were utilised with maturity equal to expected term of the option
The rate used for calculation is 8.03%
The rate used for calculation is 7.99%
The rate used for calculation is 7.36% (for 3 years vesting) & 7.44%(for 4 years vesting)
The rate used for calculation is 6.87% (for 3 years vesting) & 6.96%(for 4 years vesting)
The method used and the assumptions made to incorporate the effects of expected early exercise
Black-Scholes Options pricing model
Black-Scholes Options pricing model
Black-Scholes Options pricing model
Black-Scholes Options pricing model
How expected volatility was determined, including an explanation of the extent to which expected volatility was based on historical volatility
The following factors have been considered:(a) Share price(b) Exercise prices(c) Historical volatility(d) Expected option life(e) Dividend Yield
The following factors have been considered:(a) Share price(b) Exercise prices(c) Historical volatility(d) Expected option life(e) Dividend Yield
Whether and how any other features of the option grant were incorporated into the measurement of fair value, such as a market condition
Split of shares adjustment:
The number of shares options granted, number of option vested, exercise price, fair value of grant etc. has been adjusted to reflect the sub-division of face value of equity shares of the Company in previous year.

270
Notes to the Standalone Financial Statements as at and for the year ended 31 March 2018
JSW Steel Limited | Integrated Report 2017-18
40. Segment reporting
The Company is in the business of manufacturing steel products having similar economic characteristics, primarily with operations in India and regularly reviewed by the Chief Operating Decision Maker for assessment of Company’s performance and resource allocation.
The information relating to revenue from external customers and location of non-current assets of its single reportable segment has been disclosed as below
a) Revenue from operations ` in crores
Particulars For the year ended 31 March 2018
For the year ended 31 March 2017
Domestic 54,568 45,991
Export 11,666 10,922
Total 66,234 56,913
Revenue from operations have been allocated on the basis of location of customers.
b) Non-current assets All non-current assets other than financial instruments of the Company are located in India.
c) Customer contributing more than 10% of Revenue` in crores
Particulars For the year ended 31 March 2018
For the year ended 31 March 2017
JSW Steel Coated Products Limited 9,793 6,767
41. Employee benefitsa) Defined contribution plan The Company operates defined contribution retirement benefit plans for all qualifying employees. The assets of the plans
are held separately from those of the Company in funds under the control of trustees.
Company’s contribution to provident fund & family pension scheme recognised in statement of profit and loss of ` 42 crores (31 March 2017: ` 39 crores) (included in note 33).
b) Defined benefit plans The Company sponsors funded defined benefit plans for all qualifying employees. The level of benefits provided depends
on the member’s length of service and salary at retirement age.
The gratuity plan is covered by The Payment of Gratuity Act, 1972. Under the gratuity plan, the eligible employees are entitled to post-retirement benefit at the rate of 15 days salary for each year of service until the retirement age of 58, 60 and 62, without any payment ceiling. The vesting period for gratuity as payable under The Payment of Gratuity Act, 1972 is 5 years.
The fund has the form of a trust and it is governed by the Board of trustees. The Board of trustees is responsible for the administration of the plan assets and for defining the investment strategy.
Under the compensated absences plan, leave encashment is payable to all eligible employees on separation from the Company due to death, retirement, superannuation or resignation. At the rate of daily salary, as per current accumulation of leave days.
The plans in India typically expose the Company to actuarial risks such as: investment risk, interest rate risk, longevity risk and salary risk.

Better Everyday. In Pursuit of Excellence. Corporate Overview Statutory Reports Financial Statements
271
Notes to the Standalone Financial Statements as at and for the year ended 31 March 2018
Investment risk The present value of the defined benefit plan liability is calculated using a discount rate determined by reference to government bond yields; if the return on plan asset is below this rate, it will create a plan deficit. Currently the plan has a relatively balanced investment in Government securities and debt instruments.
Interest risk A decrease in the bond interest rate will increase the plan liability; however, this will be partially offset by an increase in the value of the plan’s debt investments.
Longevity risk The present value of the defined benefit plan liability is calculated by reference to the best estimate of the mortality of plan participants both during and after their employment. An increase in the life expectancy of the plan participants will increase the plan’s liability.
Salary risk The present value of the defined benefit plan liability is calculated by reference to the future salaries of plan participants. As such, an increase in the salary of the plan participants will increase the plan’s liability.
No other post-retirement benefits are provided to these employees.
The most recent actuarial valuation of the plan assets and the present value of the defined benefit obligation were carried out at 31 March 2018 by M/S. K. A. Pandit, Consultants & Actuaries. The present value of the defined benefit obligation, and the related current service cost and past service cost, were measured using the projected unit credit method.
(i) Gratuity (funded): ` in crores
Current Year Previous Year
a) Liability recognised in the balance sheet
i) Present value of obligation
Opening balance 175 143
Service cost 13 11
Interest cost 13 12
Actuarial loss on obligation 3 17
Benefits paid (7) (7)
Liability in * 2
Liability transfer (1) (3)
Closing balance 196 175
Less:
ii) Fair value of plan assets
Opening balance 53 50
Expected return on plan assets less loss on investments 4 4
Actuarial (loss)/gain on plan assets * *
Employers’ contribution 13 4
Asset transfer * *
Benefits paid (5) (5)
Closing balance 65 53
Amount recognised in balance sheet(refer note 22) 131 122
b) Expenses during the year
Service cost 13 11
Interest cost 13 12
Expected return on plan assets (4) (4)
Component of defined benefit cost recognised in statement of profit and loss
22 19
Remeasurement of net defined benefit liability
- Actuarial (gain)/loss on defined benefit obligation 3 17
- Return on plan assets (excluding interest income) * (1)
Component of defined benefit cost recognised in other comprehensive income
3 16
Total 25 35

272
Notes to the Standalone Financial Statements as at and for the year ended 31 March 2018
JSW Steel Limited | Integrated Report 2017-18
Current Year Previous Year
c) Actual return on plan assets 4 5
d) Break up of plan assets:
(i) ICICI Prudential Life Insurance Co. Limited
Balanced fund 2 4
Debt fund * 1
Short-term debt fund * *
(ii) HDFC Standard Life Insurance Co. Limited
Defensive managed fund * *
Secure managed fund 6 6
Stable managed fund * *
(iii) SBI Life Insurance Co. Limited – Cap assured fund 48 33
(iv) LIC of India – Insurer managed fund 9 9
(v) Asset Fund Transfer
Total 65 53
* represents amounts below ` 50 lakhs
e) Principal actuarial assumptions:
Particulars Valuation as at 31 March 2018
Valuation as at 31 March 2017
Discount rate 7.85% 7.52%Expected rate(s) of salary increase 6% p.a. 6% p.a.Expected return on plan assets 7.85% 7.52%Attrition rate 2% p.a. 2% p.a.Mortality rate during employment Indian assured lives mortality (2006-2008)
f) Experience adjustments:
` in crores
Particulars 2017-18 2016-17 2015-16 2014-15 2013-14
Defined benefit obligation 196 175 143 126 90
Plan assets 65 53 50 40 40
Surplus / (deficit) (131) (122) (93) (85) (50)
Experience adjustments on plan liabilities – Loss/(gain)
3 17 3 23 4
Experience adjustments on plan assets – Gain/(loss)
* * * * (1)
* represents amounts below ` 50 lakhs
g) The Company expects to contribute ` 32 crores (previous year ` 29 crores) to its gratuity plan for the next year.
h) In assessing the Company’s post retirement liabilities, the Company monitors mortality assumptions and uses up-to-date mortality tables, the base being the Indian assured lives mortality (2006-08) ultimate.
i) Expected return on plan assets is based on expectation of the average long-term rate of return expected on investments of the fund during the estimated term of the obligations after considering several applicable factors such as the composition of plan assets, investment strategy, market scenario, etc.
j) The estimates of future salary increase, considered in actuarial valuation, take account of inflation, seniority, promotion and other relevant factors, such as supply and demand in the employment market.
k) The discount rate is based on the prevailing market yields of Government of India securities as at the balance sheet date for the estimated term of the obligations.
The amount included in the financial statements arising from the entity’s obligation in respect of its defined benefit plan is as follows:

Better Everyday. In Pursuit of Excellence. Corporate Overview Statutory Reports Financial Statements
273
Notes to the Standalone Financial Statements as at and for the year ended 31 March 2018
` in crores
Particulars As at 31 March 2018
As at 31 March 2017
Defined benefit obligation 196 175
Plan assets 65 53
- net liability/(asset) arising from defined benefit obligation 131 122
Sensitivity Analysis:
Significant actuarial assumptions for the determination of the defined benefit obligation are discount rate, expected salary increase and mortality. The sensitivity analyses below have been determined based on reasonably possible changes of the respective assumptions occurring at the end of the reporting year, while holding all other assumptions constant.
` in crores
Particulars As at 31 March 2018 As at 31 March 2017
Increase Decrease Increase Decrease
Discount rate (1% movement) (16) 18 (15) 17
Future salary growth (1% movement) 18 (16) 17 (15)
Attrition rate (1% movement) 3 (3) 2 (2)
The sensitivity analysis presented above may not be representative of the actual change in the defined benefit obligation as it is unlikely that the change in assumptions would occur in isolation of one another as some of the assumptions may be correlated.
Furthermore, in presenting the above sensitivity analysis, the present value of the defined benefit obligation has been calculated using the projected unit credit method at the end of the reporting year, which is the same as that applied in calculating the defined benefit obligation recognised in the balance sheet.
There was no change in the methods and assumptions used in preparing the sensitivity analysis from prior years.
Fund Allocation 73.27% 9.25% 3.98% 13.49%
Category of assets average percentage allocation fund wise:
SBI HDFC ICICI LIC
Government securities - 34.22% 23.66% 20%
Debt 86.77% 60.22% 52.58% Balance invested in approved investments as specified in schedule 1 of IRDA guidelines
Equity 7.23% 0.16% 15.83%
Others 6.00% 5.40% 7.94%
Maturity analysis of projected benefit obligation ` in crores
Particulars Less than a year
Between 1 to 5 years
Over 5 years Total
As at 31 March 2018
Projected benefit payable 15 56 398 469
As at 31 March 2017
Projected benefit payable 12 41 366 419
Each year an Asset-Liability-Matching study is performed in which the consequences of the strategic investment policies are analysed in terms of risk and return profiles.

274
Notes to the Standalone Financial Statements as at and for the year ended 31 March 2018
JSW Steel Limited | Integrated Report 2017-18
(ii) Provident fund:
The Company makes monthly contributions to provident fund managed by trust for qualifying employees. Under the scheme, the Company is required to contribute a specified percentage of the payroll costs to fund the benefits.
As per Ind AS 19 on 'Employee Benefits', employer established provident fund trusts are treated as defined benefit plans, since the Company is obliged to meet interest shortfall, if any, with respect to covered employees. According to the defined benefit obligation of interest rate guarantee on exempted provident fund in respect of employees of the Company as at 31 March 2018 is 8.55% and hence no provision is required to be provided for in the books of accounts towards the guarantee given for notified interest rates.
Actuarial assumptions made to determine interest rate guarantee on exempt provident fund liabilities are as follows:
Particulars As at 31 March 2018
As at 31 March 2017
Discount rate 7.85% 7.52%Rate of return on assets 8.88% 8.70%Guaranteed rate of return 8.55% 8.65%
(iii) Compensated Absenses
Particulars As at 31 March 2018
As at 31 March 2017
Present value of unfunded obligation (` in crores) 92 85Expense recognised in Statement of profit and loss (` in crores) 17 21Discount rate (p.a) 7.85% 7.52%Salary escalation rate (p.a) 6.00% 6.00%
42. Financial Instruments
42.1 Capital risk management The Company being in a capital intensive industry, its objective is to maintain a strong credit rating, healthy capital ratios and
establish a capital structure that would maximise the return to stakeholders through optimum mix of debt and equity.
The Company’s capital requirement is mainly to fund its capacity expansion, repayment of principal and interest on its borrowings and strategic acquisitions. The principal source of funding of the Company has been, and is expected to continue to be, cash generated from its operations supplemented by funding from bank borrowings and the capital markets. The Company is not subject to any externally imposed capital requirements.
The Company regularly considers other financing and refinancing opportunities to diversify its debt profile, reduce interest cost and elongate the maturity of its debt portfolio, and closely monitors its judicious allocation amongst competing capital expansion projects and strategic acquisitions, to capture market opportunities at minimum risk.
The Company monitors its capital using gearing ratio, which is net debt, divided to total equity. Net debt includes, interest bearing loans and borrowings less cash and cash equivalents, bank balances other than cash and cash equivalents and current investments.
Particulars As at 31 March 2018
As at 31 March 2017
Long-term borrowings 29,551 28,358Current maturities of long-term debt and finance lease obligations 4,458 5,040Short-term borrowings 2,172 4,875Less: Cash and cash equivalent (451) (712)Less: Bank balances other than cash and cash equivalents (150) (315)Less: Current investments - (300)Net debt 35,580 36,946Total equity 27,907 24,098Gearing ratio 1.27 1.53
(i) Equity includes all capital and reserves of the Company that are managed as capital.
(ii) Debt is defined as long and Short-term borrowings (excluding derivatives and financial guarantee contracts), as described in notes 20 and 25.

Better Everyday. In Pursuit of Excellence. Corporate Overview Statutory Reports Financial Statements
275
Notes to the Standalone Financial Statements as at and for the year ended 31 March 201842.2 Categories of financial instruments
The accounting classification of each category of financial instruments, and their carrying amounts, are set out below:
As at 31 March 2018` in crores
Particulars Amortised cost Fair value through other
comprehensive income
Fair value through profit
and loss
Total carrying value
Total fair value
Financial assets
Investments @ 680 350 1,030 1,030
Trade receivables 4,692 - - 4,692 4,692
Cash and cash equivalents 451 - - 451 451Bank balances other than cash and cash equivalents
150 - - 150 150
Loans 5,323 - - 5,323 5,323
Derivative Assets - - 147 147 147
Other financial assets 1,249 - - 1,249 1,249
Total 11,865 680 497 13,042 13,042
Financial liabilities
Long-term Borrowings # 34,009 - - 34,009 34,709
Short-term Borrowings 2,172 - - 2,172 2,172
Trade payables 13,988 - - 13,988 13,988
Derivative liabilities - - 90 90 90
Other financial liabilities 3,351 - - 3,351 3,352
Total 53,520 - 90 53,610 54,311
# including current maturities of long-term debt and finance lease obligations @ ` 0.07 Crore
As at 31 March 2017` in crores
Particulars Amortised cost Fair value through other
comprehensive income
Fair value through profit
and loss
Total carrying value
Total fair value
Financial assets
Investments @ 598 680 1,278 1,278
Trade receivables 3,948 - - 3,948 3,948
Cash and cash equivalents 712 - - 712 712Bank balances other than cash and cash equivalents
315 - - 315 315
Loans 2,892 - - 2,892 2,891
Derivative Assets - - 434 434 434
Other financial assets 976 - - 976 976
Total 8,843 598 1,114 10,555 10,554
Financial liabilities
Long-term borrowings # 33,398 - - 33,398 33,480
Short-term borrowings 4,875 - - 4,875 4,875
Trade payables 11,604 - - 11,604 11,604
Derivative liabilities - - 382 382 382
Other financial liabilities 4,041 - - 4,041 4,039
Total 53,918 - 382 54,300 54,380
# including current maturities of long-term debt and finance lease obligations @ ` 0.07 Crore

276
Notes to the Standalone Financial Statements as at and for the year ended 31 March 2018
JSW Steel Limited | Integrated Report 2017-18
42.3 Financial risk management The Company has a Risk Management Committee established by its Board of Directors for overseeing the Risk Management
Framework and developing and monitoring the Company’s risk management policies. The risk management policies are established to ensure timely identification and evaluation of risks, setting acceptable risk thresholds, identifying and mapping controls against these risks, monitor the risks and their limits, improve risk awareness and transparency. Risk management policies and systems are reviewed regularly to reflect changes in the market conditions and the Company’s activities to provide reliable information to the Management and the Board to evaluate the adequacy of the risk management framework in relation to the risk faced by the Company.
The risk management policies aims to mitigate the following risks arising from the financial instruments:
- Market risk
- Credit risk; and
- Liquidity risk
42.4 Market risk Market risk is the risk that the fair value of future cash flows of a financial instrument will fluctuate because of changes
in the market prices. The Company is exposed in the ordinary course of its business to risks related to changes in foreign currency exchange rates, commodity prices and interest rates.
The Company seeks to minimise the effects of these risks by using derivative financial instruments to hedge risk exposures. The use of financial derivatives is governed by the Company’s policies approved by the Board of Directors, which provide written principles on foreign exchange risk, interest rate risk, credit risk, the use of financial derivatives and non-derivative financial instruments, and the investment of excess liquidity. Compliance with policies and exposure limits is reviewed by the Management and the internal auditors on a continuous basis. The Company does not enter into or trade financial instruments, including derivatives for speculative purposes.
42.5 Foreign currency risk management The Company’s functional currency is Indian Rupees (INR). The Company undertakes transactions denominated in
foreign currencies; consequently, exposure to exchange rate fluctuations arise. Volatility in exchange rates affects the Company’s revenue from export markets and the costs of imports, primarily in relation to raw materials. The Company is exposed to exchange rate risk under its trade and debt portfolio.
Adverse movements in the exchange rate between the Rupee and any relevant foreign currency result’s in increase in the Company’s overall debt position in Rupee terms without the Company having incurred additional debt and favourable movements in the exchange rates will conversely result in reduction in the Company’s receivables in foreign currency. In order to hedge exchange rate risk, the Company has a policy to hedge cash flows up to a specific tenure using forward exchange contracts and options. At any point in time, the Company hedges its estimated foreign currency exposure in respect of forecast sales over the following 6 months. In respect of imports and other payables, the Company hedges its payables as when the exposure arises. Short-term exposures are hedged progressively based on their maturity.
All hedging activities are carried out in accordance with the Company’s internal risk management policies, as approved by the Board of Directors, and in accordance with the applicable regulations where the Company operates.

Better Everyday. In Pursuit of Excellence. Corporate Overview Statutory Reports Financial Statements
277
Notes to the Standalone Financial Statements as at and for the year ended 31 March 2018
The carrying amounts of the Company’s monetary assets and monetary liabilities at the end of the reporting year are as follows:
Currency exposure as at 31 March 2018` in crores
Particulars USD EURO INR JPY Other Total
Financial assets
Non-current investments - 254 776 - - 1,030
Current investments - - - - - -
Loans 4,807 - 506 - 10 5,323
Trade receivables 124 97 4,471 - - 4,692
Cash and cash equivalents - - 451 - - 451
Bank balances other than cash and cash equivalents
- - 150 - - 150
Derivative assets 147 - - - - 147
Other financial assets 701 - 548 - - 1,249
Total financial assets 5,770 351 6,911 - 10 13,042
Financial liabilities
Long-term borrowings 12,281 110 16,911 249 - 29,551
Short-term borrowings 758 - 1,414 - - 2,172
Trade payables 10,457 21 3,454 54 2 13,988
Derivative liabilities 86 4 - - - 90
Other financial liabilities 1,973 85 5,600 143 8 7,809
Total financial liabilities 25,555 220 27,379 446 10 53,610
Currency exposure as at 31 March 2017` in crores
Particulars USD EURO INR JPY Other Total
Financial assets
Non-current investments - 290 688 - - 978
Current investments - - 300 - - 300
Loans 2,410 - 482 - - 2,892
Trade receivables 444 129 3,375 - - 3,948
Cash and cash equivalents @ - 712 712
Bank balances other than cash and cash equivalents
- - 315 - - 315
Derivative Assets 434 - - - - 434
Other financial assets 633 1 342 - - 976
Total financial assets 3,921 420 6,214 - - 10,555
Financial liabilities
Long-term borrowings 8,520 104 19,376 358 - 28,358
Short-term borrowings 103 - 4,772 - - 4,875
Trade payables 8,573 8 3,023 # * 11,604
Derivative liabilities 382 - - - - 382
Other financial liabilities 4,149 129 4,649 147 7 9,081
Total financial liabilities 21,727 241 31,820 505 7 54,300
@ ` 0.04 Crore # ` 0.03 Crore * ` 0.06 Crore
The following table details the Company’s sensitivity to a 1% increase and decrease in the INR against the relevant foreign currencies net of hedge accounting impact. 1% is the sensitivity rate used when reporting foreign currency risk internally to key management personnel and represents management’s assessment of the reasonably possible change in foreign exchange rates. The sensitivity analysis includes only outstanding foreign currency denominated monetary items and adjusts their translation at the year-end for a 1% change in foreign currency rates, with all other variables held constant. A positive number below indicates an increase in profit or equity where INR strengthens 1% against the relevant currency. For a 1% weakening of INR against the relevant currency, there would be a comparable impact on profit or equity, and the balances below would be negative.

278
Notes to the Standalone Financial Statements as at and for the year ended 31 March 2018
JSW Steel Limited | Integrated Report 2017-18
` in crores
Particulars Increase Decrease
31 March 2018 31 March 2017 31 March 2018 31 March 2017
Receivable
USD/INR 57 36 (57) (36)
Payable
USD/INR 99 82 (99) (82)
The forward exchange contracts entered into by the Company and outstanding are as under:
As at Nature No. of Contracts
Type US$ Equivalent (Millions)
INR Equivalent (crores)
MTM (` in crores)
31 March 2018 Assets 42 Buy 463 3,015 20
37 Sell 443 2,879 25
Liabilities 60 Buy 670 4,358 (24)
31 Sell 339 2,205 (17)
31 March 2017 Assets 0 Buy - - -
55 Sell 472 3,058 137
Liabilities 91 Buy 770 4,992 (233)
13 Sell 55 354 (3)
Currency options to hedge against fluctuations in changes in exchange rate:
As at Nature No. of Contracts
US$ equivalent (Million)
INR equivalent (Crores)
MTM of Option (` in crores)
31 March 2018 Assets 25 471 3,063 20
Liabilities 3 61 397 (1)
31 March 2017 Assets 2 60 389 2
Liabilities 32 743 4,816 (106)
Unhedged currency risk position: I) Amounts receivable in foreign currency
As at 31 March 2018 As at 31 March 2017
US$ equivalent INR Equivalent US$ equivalent INR Equivalent
(Millions) (crores) (Millions) (crores)
Trade receivables 34 221 88 573
Balances with banks
- in Fixed deposit account - - - -
- in Current account - - 0.01 #
Advances/Loans to subsidiaries 848 5,518 4,461 2,989
# ` 0.05 Crore
II) Amounts payable in foreign currency
As at 31 March 2018 As at 31 March 2017
US$ equivalent INR Equivalent US$ equivalent INR Equivalent
(Millions) (crores) (Millions) (crores)
Loans payable 2,134 13,881 1,731 11,224
Acceptances - - - -
Trade payables 8 52 0.56 4
Payable for capital projects 79 514 98 637
Interest accrued but not due on borrowings 32 206 22 137
Other provisions 99 642 136 884
42.6 Commodity price risk:
The Company’s revenue is exposed to the market risk of price fluctuations related to the sale of its steel products. Market forces generally determine prices for the steel products sold by the Company. These prices may be influenced by factors such as supply and demand, production costs (including the costs of raw material inputs) and global and regional economic conditions and growth. Adverse changes in any of these factors may reduce the revenue that the Company earns from the sale of its steel products.

Better Everyday. In Pursuit of Excellence. Corporate Overview Statutory Reports Financial Statements
279
Notes to the Standalone Financial Statements as at and for the year ended 31 March 2018
The Company is subject to fluctuations in prices for the purchase of iron ore, coking coal, ferro alloys, zinc, scrap and other raw material inputs. The Company purchased primarily all of its iron ore and coal requirements at prevailing market rates during the year ended 31 March 2018.
The Company aims to sell the products at prevailing market prices. Similarly the Company procures key raw materials like iron ore and coal based on prevailing market rates as the selling prices of steel prices and the prices of input raw materials move in the same direction.
Commodity hedging is used primarily as a risk management tool to secure the future cash flows in case of volatility by entering into commodity forward contracts.
Hedging commodity is based on its procurement schedule and price risk. Commodity hedging is undertaken as a risk offsetting exercise and, depending upon market conditions hedges, may extend beyond the financial year. The Company is presently hedging maximum up to 25 % of its consumption.
The following table details the Company’s sensitivity to a 5% movement in the input price of iron ore and coking coal. The sensitivity analysis includes only 5% change in commodity prices for quantity sold or consumed during the year, with all other variables held constant. A positive number below indicates an increase in profit or equity where the commodity prices decrease by 5% and vice-versa.
` in crores
Commodity Increase for the year ended Decrease for the year ended
31 March 2018 31 March 2017 31 March 2018 31 March 2017
Iron ore lumps/fines 598 342 (598) (342)
Coal/Coke 1,027 745 (1,027) (745)
The commodity forward and option contracts entered into by the Company and outstanding at the year-end are as under:
As at Nature No. of Contracts
Commodity Name
Quantity (Iron Ore, Coking
Coal - MT) (Brent Crude
- Mio Barrels)
US$ Equivalent of notional
value (Millions)
INR equivalent
(Crores)
MTM of Commodity
contract (` in crores)
31 March 2018 Assets 5 BRENT CRUDE 1,68,750 10 68 6
3 IRON ORE 1,16,000 7 47 1
Liabilities 44 IRON ORE 13,46,000 92 601 (43)
31 March 2017 Assets 4 BRENT CRUDE 66,996 3 23 1
32 IRON ORE 9,72,000 33 214 228
Liabilities 13 BRENT CRUDE 1,66,500 9 61 (3)
4 COKING COAL 1,80,000 35 229 (26)
8 IRON ORE 1,71,000 13 86 (4)
42.7 Interest rate risk
Interest rate risk is the risk that the fair value or future cash flows of a financial instrument will fluctuate because of changes in market interest rates. The Company is exposed to interest rate risk because funds are borrowed at both fixed and floating interest rates. Interest rate risk is measured by using the cash flow sensitivity for changes in variable interest rate. The borrowings of the Company are principally denominated in rupees and US dollars with a mix of fixed and floating rates of interest. The Company hedges its US dollar interest rate risk through interest rate swaps to reduce the floating interest rate risk. The Company hedges up to 20% of interest risk in US dollars. The Company has exposure to interest rate risk, arising principally on changes in base lending rate and LIBOR rates. The Company uses a mix of interest rate sensitive financial instruments to manage the liquidity and fund requirements for its day to day operations like non-convertible bonds and Short-term loans. The risk is managed by the Company by maintaining an appropriate mix between fixed and floating rate borrowings, and by the use of interest rate swap contracts. Hedging activities are evaluated regularly to align with interest rate views and defined risk appetite, ensuring the most cost-effective hedging strategies are applied.

280
Notes to the Standalone Financial Statements as at and for the year ended 31 March 2018
JSW Steel Limited | Integrated Report 2017-18
The following table provides a break-up of the Company’s fixed and floating rate borrowings:
` in crores
Particulars As at 31 March 2018
As at 31 March 2017
Fixed rate borrowings 17,349 15,036
Floating rate borrowings 16,860 18,572
Total borrowings 34,209 33,608
Total Net borrowings 34,009 33,398
Add: Upfront fees 200 210
Total borrowings 34,209 33,608
The sensitivity analyses below have been determined based on the exposure to interest rates for floating rate liabilities, after the impact of hedge accounting, assuming the amount of the liability outstanding at the year-end was outstanding for the whole year.
If interest rates had been 100 basis points higher / lower and all other variables were held constant, the Company’s profit for the year ended 31 March 2018 would decrease / increase by ` 145 crores (for the year ended 31 March 2017: decrease/ increase by ` 179 crores). This is mainly attributable to the Company’s exposure to interest rates on its variable rate borrowings
The following table details the nominal amounts and remaining terms of interest rate swap contracts outstanding at the year-end.
As at Nature No. of Contracts US$ Equivalent of notional value
(Millions)
MTM of IRS (` in crores)
31 March 2018 Assets 14 237 37
Liabilities 5 128 (2)
31 March 2017 Assets 5 90 17
Liabilities 2 20 (#)
# ` 0.19 Crore
42.8 Credit risk management:
Credit risk refers to the risk that counterparty will default on its contractual obligations resulting in financial loss to the Company. The Company has adopted a policy of only dealing with creditworthy counterparties and obtaining sufficient collateral, where appropriate, as a means of mitigating the risk of financial loss from defaults.
The Company is exposed to credit risk for trade receivables, cash and cash equivalents, investments, other bank balances, loans, other financial assets, financial guarantees and derivative financial instruments.
Moreover, given the diverse nature of the Company’s business trade receivables are spread over a number of customers with no significant concentration of credit risk. No single customer (other than the Group Companies) accounted for 10% or more of the trade receivables in any of the years presented. The history of trade receivables shows a negligible provision for bad and doubtful debts. Therefore, the Company does not expect any material risk on account of non-performance by any of the Company’s counterparties.
Movements in allowances for bad and doubtful debts ` in crores
Particulars Amount
As at 1 April 2016 6Additional Allowance -
As at 31 March 2017 6Additional Allowance 72
As at 31 March 2018 78

Better Everyday. In Pursuit of Excellence. Corporate Overview Statutory Reports Financial Statements
281
Notes to the Standalone Financial Statements as at and for the year ended 31 March 2018
For current investments, counterparty limits are in place to limit the amount of credit exposure to any one counterparty. This, therefore, results in diversification of credit risk for Company’s mutual fund and bond investments. For derivative and financial instruments, the Company attempts to limit the credit risk by only dealing with reputable banks and financial institutions.
The carrying value of financial assets represents the maximum credit risk. The maximum exposure to credit risk was ` 13,042 crore as at 31 March 2018 and ` 10,555 crore as at 31 March 2017, being the total carrying value of trade receivables, balances with bank, bank deposits, Current investments and other financial assets.
In respect of financial guarantees provided by the Company to banks and financial institutions, the maximum exposure which the Company is exposed to is the maximum amount which the Company would have to pay if the guarantee is called upon. Based on the expectation at the end of the reporting period, the Company considers that it is more likely than not that such an amount will not be payable under the guarantees provided.
Receivables are deemed to be past due or impaired with reference to the Company’s normal terms and conditions of business. These terms and conditions are determined on a case to case basis with reference to the customer’s credit quality and prevailing market conditions. The Company based on past experiences does not expect any material loss on its receivables and hence no provision is deemed necessary on account of ECL.
The credit quality of the Company’s customers is monitored on an ongoing basis and assessed for impairment where indicators of such impairment exist. The Company uses simplified approach for impairment of financial assets. If credit risk has not increased significantly, 12-month expected credit loss is used to provide for impairment loss. However, if credit risk has increased significantly, lifetime expected credit loss is used. The solvency of the debtor and their ability to repay the receivable is considered in assessing receivables for impairment. Where receivables have been impaired, the Company actively seeks to recover the amounts in question and enforce compliance with credit terms.
42.9 Liquidity risk management Liquidity risk refers to the risk of financial distress or extraordinary high financing costs arising due to shortage of
liquid funds in a situation where business conditions unexpectedly deteriorate and requiring financing. The Company requires funds both for Short-term operational needs as well as for long-term capital expenditure growth projects. The Company generates sufficient cash flow for operations, which together with the available cash and cash equivalents and Short-term investments provide liquidity in the short-term and long-term. The Company has established an appropriate liquidity risk management framework for the management of the Company’s short, medium and long-term funding and liquidity management requirements. The Company manages liquidity risk by maintaining adequate reserves, banking facilities and reserve borrowing facilities, by continuously monitoring forecast and actual cash flows, and by matching the maturity profiles of financial assets and liabilities.
The following tables detail the Company’s remaining contractual maturity for its non-derivative financial liabilities with agreed repayment Years and its non-derivative financial assets. The tables have been drawn up based on the undiscounted cash flows of financial liabilities based on the earliest date on which the Company can be required to pay. The tables include both interest and principal cash flows.
To the extent that interest flows are floating rate, the undiscounted amount is derived from interest rate curves at the end of the reporting year. The contractual maturity is based on the earliest date on which the Company may be required to pay.

282
Notes to the Standalone Financial Statements as at and for the year ended 31 March 2018
JSW Steel Limited | Integrated Report 2017-18
Liquidity exposure as at 31 March 2018 ` in crores
Particulars < 1 year 1-5 years > 5 years Total
Financial assets
Non-current investments - # 1,030 1,030
Current investments - - - -
Loans 158 4,996 169 5,323
Trade receivables 4,692 - - 4,692
Cash and cash equivalents 451 - - 451
Bank balances other than cash and cash equivalents 150 - - 150
Derivative assets 147 - - 147
Other financial assets 271 978 - 1,249
Total financial assets 5,869 5,974 1,199 13,042
Financial liabilities
Long-term borrowings - 24,350 5,201 29,551
Short-term borrowings 2,172 - - 2,172
Trade payables 13,988 - - 13,988
Derivative liabilities 90 - - 90
Other financial liabilities 7,080 716 13 7,809
Total financial liabilities 23,330 25,066 5,214 53,610
Interest payout liability 1,560 4,777 304 6,641
# ` 0.08 Crore
Liquidity exposure as at 31 March 2017` in crores
Particulars < 1 year 1-5 years > 5 years Total
Financial assets
Non-current investments - - 978 978
Current investments 300 - - 300
Loans 121 2,719 52 2,892
Trade receivables 3,948 - - 3,948
Cash and cash equivalents 712 - - 712
Bank balances other than cash and cash equivalents 315 - - 315
Derivative Assets 434 - - 434
Other financial assets 328 624 24 976
Total financial assets 6,158 3,343 1,054 10,555
Financial liabilities
Long-term borrowings - 22,610 5,748 28,358
Short-term borrowings 4,875 - - 4,875
Trade payables 11,604 - - 11,604
Derivative Liabilities 382 - - 382
Other financial liabilities 8,112 941 28 9,081
Total financial liabilities 24,973 23,551 5,776 54,300
Interest payout liability 1,823 6,516 449 8,788
The amount of guarantees/standby letter of credit given on behalf of subsidiaries included in Note 46 represents the maximum amount the Company could be forced to settle for the full guaranteed amount. Based on the expectation at the end of the reporting year, the Company considers that it is more likely than not that such an amount will not be payable under the arrangement.
Collateral
The Company has pledged part of its trade receivables, Short-term investments and cash and cash equivalents in order to fulfil certain collateral requirements for the banking facilities extended to the Company. There is obligation to return the securities to the Company once these banking facilities are surrendered. (Refer note 20 and 25).

Better Everyday. In Pursuit of Excellence. Corporate Overview Statutory Reports Financial Statements
283
Notes to the Standalone Financial Statements as at and for the year ended 31 March 2018
43. Level-wise disclosure of financial instruments` in crores
Particulars As at 31 March 2018
As at 31 March 2017
Level Valuation techniques and key inputs
Quoted investments in equity shares measured at FVTOCI
666 574 1 Quoted bid prices in an active market
Unquoted investments in equity shares measured at FVTOCI
9 9 3 Net Asset value of share arrived has been considered as fair value
Unquoted investments in equity shares measured at FVTOCI
5 16 3 Cost is approximate estimate of fair value,
Quoted investments in Mutual Fund measured at FVPTL
- 300 1 Quoted bid prices in an active market
Non-current investments in unquoted preference shares measured at FVTPL
350 379 3 Discounted cash flow - Future cash flows are based on terms of Preference Shares discounted at a rate that reflects market risks
Derivative Assets 147 434
2
Inputs other than quoted prices included within level 1 that are observable for asset or liability, either directly (i.e. as prices) or indirectly (derived from prices).
Derivative Liabilities 90 382
The carrying amounts of trade receivables, trade payables, capital creditors, cash and cash equivalents, other bank balances, other financial assets and other financial liabilities (other than those specifically disclosed) are considered to be the same as their fair values, due to their Short-term nature.
Sensitivity Analysis of Level 3:
Particulars Valuation technique Significant unobservable inputs
Change Sensitivity of the input to fair value
Investments in unquoted Preference shares
DCF method Discounting Rate of 9.1 %
0.50% 0.50% Increase (decrease) in the discount would decrease (increase) the fair value by `4 crores (` 4 crores)
Reconciliation of Level 3 fair value measurement` in crores
Particulars Amount
Balance as at 1 April 2016 739
Additions made during the period 1
Allowance for loss (343)
Gain recognised in the statement of profit and loss 7
Balance as at 31 March 2017 404
Additions made during the period -
Allowance for loss (48)
Gain recognised in the statement of profit and loss 7
Balance as at 31 March 2018 364
Details of Financial assets/ liabilities measured at amortised cost but fair value disclosed in category wise` in crores
Particulars As at 31 March 2018
As at 31 March 2017
Level Valuation techniques and key inputs
Loans Discounted cash flow on observable Future cash flows are based on terms of discounted at a rate that reflects market risks
Carrying value 5,323 2,8922
Fair value 5,323 2,891
Long-term Borrowing Discounted cash flow on observable Future cash flows are based on terms of discounted at a rate that reflects market risks
Carrying value 34,009 33,3982
Fair value 34,709 33,480

284
Notes to the Standalone Financial Statements as at and for the year ended 31 March 2018
JSW Steel Limited | Integrated Report 2017-18
44. Related party disclosuresA Relationships1 Subsidiaries
JSW Steel (Netherlands) B.V.
JSW Steel (UK) Limited
JSW Steel Service Centre (UK) Limited (ceased w.e.f. 18.10.2016)
JSW Steel Holding (USA) Inc. (ceased w.e.f. 28.03.2017)
JSW Steel (USA) Inc.
Periama Holdings, LLC (w.e.f. 23.01.2017)
Periama Holdings, LLC (ceased w.e.f. 16.03.2017)
Purest Energy, LLC
Meadow Creek Minerals, LLC
Hutchinson Minerals, LLC
R.C. Minerals, LLC
Keenan Minerals, LLC
Peace Leasing, LLC
Prime Coal, LLC
Planck Holdings, LLC
Rolling S Augering, LLC
Periama Handling, LLC
Lower Hutchinson Minerals, LLC
Caretta Minerals, LLC
JSW Panama Holdings Corporation
Inversiones Eurosh Limitada
Santa Fe Mining
Santa Fe Puerto S.A.
JSW Natural Resources Limited
JSW Natural Resources Mozambique Limitada
JSW ADMS Carvo Lda
JSW Steel East Africa Limited (ceased w.e.f. 08.04.2016)
Nippon Ispat Singapore (PTE) Limited
Erebus Limited
Arima Holding Limited
Lakeland Securities Limited
JSW Steel Processing Centres Limited
JSW Bengal Steel Limited
JSW Natural Resources India Limited
JSW Energy (Bengal) Limited
JSW Natural Resource Bengal Limited
Barbil Beneficiation Company Limited (ceased w.e.f. 27.01.2017)
Barbil Iron Ore Company Limited (ceased w.e.f. 19.10.2016)
JSW Jharkhand Steel Limited
Amba River Coke Limited
JSW Steel Coated Products Limited
Peddar Realty Private Limited
JSW Steel (Salav) Limited
Dolvi Minerals & Metals Private Limited
Dolvi Coke Projects Limited
JSW Industrial Gases Private Limited (w.e.f. 16.08.2016)(formerly JSW Praxair Oxygen Private Limited)
JSW Realty & Infrastructure Private Limited
JSW Steel Italy S.R.L.(w.e.f. 30.01.2017)
JSW Utkal Steel Limited (w.e.f. 16.11.2017)
Hasaud Steel Limited (w.e.f. 13.02.2018)
Creixent Special Steels Limited (w.e.f. 27.02.2018)
Milloret Steel Limited (w.e.f. 08.03.2018)

Better Everyday. In Pursuit of Excellence. Corporate Overview Statutory Reports Financial Statements
285
Notes to the Standalone Financial Statements as at and for the year ended 31 March 2018
2 Associate
JSW Industrial Gases Private Limited (ceased w.e.f. 15.08.2016)(formerly JSW Praxair Oxygen Private Limited)
3 Joint Ventures
Vijayanagar Minerals Private Limited
Rohne Coal Company Private Limited
JSW Severfield Structures Limited
Gourangdih Coal Limited
GEO Steel LLC
JSW Structural Metal Decking Limited
JSW MI Steel Service Centre Private Limited
JSW Vallabh Tin Plate Private Limited
AcciaItalia S.p.A. (w.e.f. 30.11.2016)
4 Key Management Personnel
Mr. Sajjan Jindal
Mr. Seshagiri Rao M.V.S.
Dr. Vinod Nowal
Mr. Jayant Acharya
Mr. Rajeev Pai
Mr. Lancy Varghese
5 Other Related Parties
JSW Energy Limited
Raj West Power Limited
JSW Power Trading Company Limited*
Himachal Baspa Power Company Limited
Jindal Stainless Limited
JSL Architecture Limited
JSL Lifestyle Limited
Jindal Saw Limited
Jindal Saw USA LLC
Jindal Tubular (India) Limited
Jindal Fittings Limited
Jindal Steel & Power Limited
M/s. Shadeed Iron & Steel Co. LLC
Jindal Power Limited
India Flysafe Aviation Limited
JSW Infrastructure Limited
JSW Jaigarh Port Limited
South West Port Limited
JSW Dharamatar Port Private Limited
JSW Paradip Terminal Private Limited
JSW Cement Limited
South West Mining Limited
JSW Projects Limited
JSW IP Holdings Private Limited
JSOFT Solutions Limited
Reynold Traders Private Limited
JSW Techno Projects Management Limited
JSW Global Business Solutions Limited (formerly Sapphire Technologies Limited)
Jindal Industries Private Limited
JSW Foundation
Jindal Technologies & Management Services Private Limited
Epsilon Carbon Private Limited (formerly AVH Private Limited)
JSW International Trade Corp PTE Limited

286
Notes to the Standalone Financial Statements as at and for the year ended 31 March 2018
JSW Steel Limited | Integrated Report 2017-18
Heal Institute Private Limited (ceased w.e.f. 19.10.2016)
Jindal Education Trust
JSW Paints Private Limited
Toshiba JSW Power System Private Limited
MJSJ Coal Limited
O P Jindal Foundation
JSW Bengaluru Football Club Private Limited
Jindal Rail Infrastructure Limited
Khaitan & Company#
Vinar Systems Private Limited ##
6 Post-Employment Benefit Entity
JSW Steel EPF Trust
Jindal Steel Group Gratuity Trust
JSW Steel Limited Employee Gratuity Fund
* amalgamated with JSW Green Energy Limited during the year. # Mr. Haigreve Khaitan is a partner in Khaitan & Company. ## Mr. Haigreve Khaitan is a director in Vinar Systems Private Limited.

Better Everyday. In Pursuit of Excellence. Corporate Overview Statutory Reports Financial Statements
287
Notes to the Standalone Financial Statements as at and for the year ended 31 March 2018
B. T
ran
sact
ion
s w
ith
Rel
ated
Par
ties
for
yea
r en
ded
` in
cro
res
Part
icul
ars
Sub
sidi
arie
sAs
soci
ate
Join
t Ve
ntur
esO
ther
Rel
ated
Par
ties
Tota
lFY
20
17-1
8FY
20
16-1
7FY
20
17-1
8FY
20
16-1
7FY
20
17-1
8FY
20
16-1
7FY
20
17-1
8FY
20
16-1
7FY
20
17-1
8FY
20
16-1
7
Pu
rch
ase
of g
ood
s/ p
ower
& f
uel
/ se
rvic
es
Am
ba
Riv
er C
oke
Lim
ited
4,4
05
4,1
25-
--
--
-4
,40
54
,125
JSW
En
erg
y Li
mit
ed-
--
--
-2,
015
1,97
42,
015
1,97
4
JSW
Inte
rnat
ion
al T
rad
ecor
p P
TE L
imit
ed-
--
--
-16
,36
96
,027
16,3
69
6,0
27
Oth
ers
1,07
875
2-
53
30
211,
55
91,
33
42,
667
2,16
0
Tota
l5
,48
34
,877
-5
33
02
119
,94
39
,33
52
5,4
56
14,2
86
Rei
mb
urs
emen
t of
exp
ense
s in
curr
ed o
n o
ur
beh
alf
by
JSW
Ste
el (
Sal
av)
Lim
ited
2-
--
--
--
2-
JSW
En
erg
y Li
mit
ed-
--
--
-3
23
2
JSW
Glo
bal
Bu
sin
ess
Sol
uti
ons
Lim
ited
--
--
--
-3
-3
Oth
ers
**
--
--
**
*1
Tota
l3
*-
--
-3
56
6
Sal
es o
f g
ood
s /
pow
er &
fu
el
Am
ba
Riv
er C
oke
Lim
ited
1,28
61,
40
9-
--
--
-1,
286
1,4
09
JSW
Ste
el C
oate
d P
rod
uct
s Li
mit
ed9
,79
36
,767
--
--
--
9,7
93
6,7
67
Oth
ers
36
321
-3
547
425
2,22
51,
205
2,8
08
1,9
54
Tota
l11
,115
8,4
97
-3
54
74
25
2,2
25
1,2
05
13,8
87
10,1
30
Oth
er in
com
e/ in
tere
st in
com
e/ d
ivid
end
inco
me
JSW
Ste
el H
old
ing
(U
SA)
Inc.
-4
6-
--
--
--
46
Inve
rsio
nes
Eu
rosh
Lim
itad
a-
40
--
--
--
-4
0
JSW
Ste
el C
oate
d P
rod
uct
s Li
mit
ed3
26
--
--
--
32
6
Am
ba
Riv
er C
oke
Lim
ited
58
21-
--
--
-5
821
JSW
Ste
el (
Sal
av)
Lim
ited
2524
--
--
--
2524
JSW
En
erg
y Li
mit
ed-
--
--
-5
225
22
Oth
ers
516
-11
35
2515
33
47
Tota
l12
015
3-
113
53
03
715
32
06
Pu
rch
ase
of a
sset
s
JSW
Sev
erfi
eld
Str
uct
ure
s Li
mit
ed-
--
-13
64
5-
-13
64
5
Jin
dal
Ste
el &
Pow
er L
imit
ed-
--
--
-25
4725
47
JSW
Cem
ent
Lim
ited
--
--
--
4722
4722
Oth
ers
27
--
--
614
821
Tota
l2
7-
-13
64
578
83
216
135

288
Notes to the Standalone Financial Statements as at and for the year ended 31 March 2018
JSW Steel Limited | Integrated Report 2017-18
B. T
ran
sact
ion
s w
ith
Rel
ated
Par
ties
for
yea
r en
ded
` in
cro
res
Part
icul
ars
Sub
sidi
arie
sAs
soci
ate
Join
t Ve
ntur
esO
ther
Rel
ated
Par
ties
Tota
lFY
20
17-1
8FY
20
16-1
7FY
20
17-1
8FY
20
16-1
7FY
20
17-1
8FY
20
16-1
7FY
20
17-1
8FY
20
16-1
7FY
20
17-1
8FY
20
16-1
7
Adva
nce
giv
en/(
rece
ived
bac
k)
JSW
Ste
el (
Sal
av)
Lim
ited
-6
6-
--
--
--
66
JSW
Glo
bal
Bu
sin
ess
Sol
uti
ons
Lim
ited
--
--
--
-28
-28
Ind
ia F
lysa
fe A
viat
ion
Lim
ited
--
214
-21
4-
Oth
ers
(2)
(3)
--
--
--
(2)
(3)
Tota
l(2
)6
3-
--
-2
142
82
129
1
Leas
e d
epos
it r
ecei
ved
JSW
Pai
nts
Pri
vate
Lim
ited
--
--
--
-4
-4
Epsi
lon
Car
bon
Pri
vate
Lim
ited
--
--
--
-2
-2
Tota
l-
--
--
--
6-
6
Leas
e an
d o
ther
ad
van
ces
refu
nd
ed
JSW
Infr
astr
uct
ure
Lim
ited
--
--
--
48
474
847
Tota
l-
--
--
-4
84
74
84
7
Loan
giv
en
JSW
Ste
el (
Net
her
lan
ds)
B.V
.37
49
4-
--
--
-37
49
4
Per
iam
a H
old
ing
s, L
LC2,
419
--
--
--
-2,
419
-
JSW
Ste
el H
old
ing
(U
SA)
Inc.
-1,
35
0-
--
--
--
1,3
50
Oth
ers
65
50
--
--
--
65
50
Tota
l2
,85
81,
49
4-
--
--
-2
,85
81,
49
4
Pro
visi
on f
or lo
ans
and
ad
van
ces
mad
e d
uri
ng
th
e ye
ar
JSW
Ste
el (
Net
her
lan
ds)
B.V
.22
--
--
--
-22
-
Inve
rsio
nes
Eu
rosh
Lim
itad
a19
7-
--
--
--
197
-
Tota
l2
19-
--
--
--
219
-
Don
atio
n/
CS
R e
xpen
ses
JSW
Fou
nd
atio
n-
--
--
-11
311
3
Tota
l-
--
--
-11
311
3
Rec
over
y of
exp
ense
s in
curr
ed b
y u
s on
th
eir
beh
alf
JSW
Ste
el C
oate
d P
rod
uct
s Li
mit
ed6
85
1-
--
--
-6
85
1
Am
ba
Riv
er C
oke
Lim
ited
2675
--
--
--
2675
Dol
vi C
oke
Pro
ject
s Li
mit
ed57
*-
--
--
-57
*
Oth
ers
245
--
33
36
256
33
3
Tota
l17
513
1-
-3
33
62
52
1416
0

Better Everyday. In Pursuit of Excellence. Corporate Overview Statutory Reports Financial Statements
289
Notes to the Standalone Financial Statements as at and for the year ended 31 March 2018
B. T
ran
sact
ion
s w
ith
Rel
ated
Par
ties
for
yea
r en
ded
` in
cro
res
Part
icul
ars
Sub
sidi
arie
sAs
soci
ate
Join
t Ve
ntur
esO
ther
Rel
ated
Par
ties
Tota
lFY
20
17-1
8FY
20
16-1
7FY
20
17-1
8FY
20
16-1
7FY
20
17-1
8FY
20
16-1
7FY
20
17-1
8FY
20
16-1
7FY
20
17-1
8FY
20
16-1
7
Inve
stm
ents
/ s
har
e ap
plic
atio
n m
oney
giv
en
du
rin
g t
he
per
iod
JSW
Ste
el (
Sal
av)
Lim
ited
-25
0-
--
--
--
250
JSW
Ind
ust
rial
Gas
es P
riva
te L
imit
ed-
240
--
--
--
-24
0
JSW
Sev
erfi
eld
Str
uct
ure
s Li
mit
ed-
--
-4
5-
--
45
-
Oth
ers
109
--
124
--
113
3
Tota
l10
49
9-
-4
624
--
56
52
3
Inte
rest
exp
ense
s
Am
ba
Riv
er C
oke
Lim
ited
-5
--
--
--
-5
JSW
Ste
el C
oate
d P
rod
uct
s Li
mit
ed-
20-
--
--
--
20
JSW
Ind
ust
rial
Gas
es P
riva
te L
imit
ed-
--
--
--
--
-
JSW
En
erg
y Li
mit
ed-
--
--
-*
-*
-
Tota
l-
25
--
--
*-
*2
5
Gu
aran
tees
an
d c
olla
tera
ls p
rovi
ded
by
the
Com
pan
y on
beh
alf:
JSW
Ste
el (
Net
her
lan
ds)
B.V
.-
741
--
--
--
-74
1
JSW
Ste
el (
UK)
Lim
ited
-6
2-
--
--
--
62
Tota
l-
80
3-
--
--
--
80
3
Gu
aran
tees
an
d c
olla
tera
ls r
elea
sed
JSW
Ste
el (
Net
her
lan
ds)
B.V
.19
5-
--
--
--
195
-
JSW
Ste
el H
old
ing
(U
SA)
Inc.
-6
60
--
--
--
-6
60
Per
iam
a H
old
ing
s, L
LC25
8-
--
--
--
258
-
Tota
l4
53
66
0-
--
--
-4
53
66
0
Adju
stm
ent
of r
ecei
vab
le/(
pay
able
)
Dol
vi C
oke
Pro
ject
s Li
mit
ed11
377
--
--
--
113
77
Tota
l11
377
--
--
--
113
77
Fin
ance
leas
e in
tere
st c
ost
Am
ba
Riv
er C
oke
Lim
ited
299
316
--
--
--
299
316
JSW
Ste
el (
Sal
av)
Lim
ited
7479
--
--
--
7479
JSW
Pro
ject
s Li
mit
ed-
--
--
-17
719
717
719
7
JSW
Tec
hn
o P
roje
cts
Man
agem
ent
Lim
ited
--
--
--
2513
2513
Tota
l3
733
95
--
--
20
22
1057
56
05

290
Notes to the Standalone Financial Statements as at and for the year ended 31 March 2018
JSW Steel Limited | Integrated Report 2017-18
B. T
ran
sact
ion
s w
ith
Rel
ated
Par
ties
for
yea
r en
ded
` in
cro
res
Part
icul
ars
Sub
sidi
arie
sAs
soci
ate
Join
t Ve
ntur
esO
ther
Rel
ated
Par
ties
Tota
lFY
20
17-1
8FY
20
16-1
7FY
20
17-1
8FY
20
16-1
7FY
20
17-1
8FY
20
16-1
7FY
20
17-1
8FY
20
16-1
7FY
20
17-1
8FY
20
16-1
7
Fin
ance
leas
e ob
ligat
ion
s re
pay
men
t
Am
ba
Riv
er C
oke
Lim
ited
44
82
--
--
--
44
82
JSW
Ste
el (
Sal
av)
Lim
ited
53
48
--
--
--
53
48
JSW
Pro
ject
s Li
mit
ed-
--
--
-18
317
618
317
6
JSW
Tec
hn
o P
roje
cts
Man
agem
ent
Lim
ited
--
--
--
42
42
Tota
l9
713
0-
--
-18
717
82
84
30
8
*Le
ss t
han
` 5
0 la
khs
Not
es:
1.
The
Com
pan
y m
akes
mon
thly
con
trib
uti
ons
to p
rovi
den
t fu
nd
man
aged
by
JSW
Ste
el E
PF
Tru
st fo
r qu
alif
yin
g V
ijaya
nag
ar e
mp
loye
es. U
nd
er t
he
sch
eme,
th
e C
omp
any
is re
qu
ired
to
con
trib
ute
a s
pec
ifie
d p
erce
ntag
e of
th
e p
ayro
ll co
sts
to f
un
d t
he
ben
efit
s. D
uri
ng
th
e ye
ar, t
he
Com
pan
y co
ntri
bu
ted
` 1
7 cr
ores
(FY
20
16-1
7: `
17
cror
es).
2.
The
Com
pan
y m
aint
ain
s g
ratu
ity
tru
st f
or t
he
pu
rpos
e of
ad
min
iste
rin
g t
he
gra
tuit
y p
aym
ent
to it
s em
plo
yees
(JS
W S
teel
Gro
up
Gra
tuit
y Tr
ust
an
d J
SW
Ste
el L
imit
ed E
mp
loye
e G
ratu
ity
Fun
d).
Du
rin
g t
he
year
, th
e C
omp
any
cont
rib
ute
d `
13
cro
res
(FY
20
16-1
7: `
2 c
rore
s).
3.
In v
iew
of
the
un
cert
aint
y in
volv
ed in
col
lect
abili
ty, r
even
ue
as in
tere
st in
com
e of
` 2
98
cro
res
has
not
bee
n r
ecog
nis
ed o
n lo
an p
rovi
ded
to
cert
ain
ove
rsea
s su
bsi
dia
ries
.

Better Everyday. In Pursuit of Excellence. Corporate Overview Statutory Reports Financial Statements
291
Notes to the Standalone Financial Statements as at and for the year ended 31 March 2018Compensation to key management personnel
` in crores
Nature of transaction FY 2017-18 FY 2016-17
Short-term employee benefits 96 34
Post-employment benefits - -
Other long-term benefits - -
Termination benefits - -
Share-based payment - -
Total compensation to key management personnel 96 34
Notes:
1. As the future liability for gratuity is provided on an actuarial basis for the Company as a whole, the amount pertaining to individual is not ascertainable and therefore not included above.
2. The Company has accrued ` 2 crores (FY 2016-17: ` 1 crores) in respect of employee stock options granted to Key Managerial Personnel. The same has not been considered as managerial remuneration of the current year as defined under Section 2(78) of the Companies Act, 2013 as the options have not been exercised.
Terms and conditions
Sales:
The sales to related parties are made on terms equivalent to those that prevail in arm’s length transactions and in the ordinary course of business. Sales transactions are based on prevailing price lists and memorandum of understanding signed with related parties. For the year ended 31 March 2018, the Company has not recorded any impairment of receivables relating to amounts owed by related parties.
Purchases:
The purchases from related parties are made on terms equivalent to those that prevail in arm’s length transactions and in the ordinary course of business. Purchase transactions are based on normal commercial terms and conditions and market rates.
Loans to overseas subsidiaries:
The Company had given loans to subsidiaries for general corporate purposes. The loan balances as at 31 March, 2018 was ` 5,404 crores (As on 31 March, 2017: ` 2,689 crores). These loans are unsecured and carry an interest rate ranging from LIBOR + 400-530 basis points and repayable within a period of three years.
Guarantees to Subsidiaries:
Guarantees provided to the lenders of the subsidiaries are for availing term loans and working capital facilities from the lender banks.

292
Notes to the Standalone Financial Statements as at and for the year ended 31 March 2018
JSW Steel Limited | Integrated Report 2017-18
C. A
mou
nt d
ue
to/
from
rel
ated
par
ties
` in
cro
res
Part
icul
ars
Sub
sidi
arie
sAs
soci
ate
Join
t Ve
ntur
esO
ther
Rel
ated
Par
ties
Tota
lA
s at
3
1 M
arch
20
18A
s at
3
1 M
arch
20
17A
s at
3
1 M
arch
20
18A
s at
3
1 M
arch
20
17A
s at
3
1 M
arch
20
18A
s at
3
1 M
arch
20
17A
s at
3
1 M
arch
20
18A
s at
3
1 M
arch
20
17A
s at
3
1 M
arch
20
18A
s at
3
1 M
arch
20
17
Part
y’s
Nam
e
Trad
e p
ayab
les
JSW
En
erg
y Li
mit
ed-
--
--
-15
53
34
155
33
4
JSW
Inte
rnat
ion
al T
rad
e C
orp
PTE
Lim
ited
--
--
--
2,0
104
51
2,0
104
51
Oth
ers
60
129
--
**
249
163
30
929
2
Tota
l6
012
9-
-*
*2
,414
94
82
,474
1,0
77Ad
van
ce r
ecei
ved
fro
m
cust
omer
sJS
W S
aw L
imit
ed-
--
--
--
*-
*
JSW
Jai
gar
h P
ort
Lim
ited
--
--
--
25-
25-
JSW
Pow
er T
rad
ing
Com
pan
y Li
mit
ed-
--
--
--
*-
*
Jin
dal
Saw
US
A L
LC-
--
--
-*
**
*
JSW
Ind
ust
ries
Pri
vate
Lim
ited
--
--
--
-*
-*
Oth
ers
--
--
**
2*
2*
Tota
l-
--
-*
*27
127
2Le
ase
& o
ther
dep
osit
re
ceiv
edA
mb
a R
iver
Cok
e Li
mit
ed6
6-
--
--
-6
6
JSW
Sev
erfi
eld
Str
uct
ure
s Li
mit
ed-
--
-13
12-
-13
12
JSW
En
erg
y Li
mit
ed-
--
--
-11
1111
11
Jin
dal
Saw
Lim
ited
--
--
--
55
55
Oth
ers
44
--
--
1111
1515
Tota
l10
10-
-13
1227
275
04
9
Leas
e &
oth
er d
epos
it g
iven
JSW
En
erg
y Li
mit
ed-
--
--
-*
**
*
Tota
l-
--
--
-*
**
*
Trad
e re
ceiv
able
s
JSW
Ste
el C
oate
d P
rod
uct
s Li
mit
ed4
473
18-
--
--
-4
473
18
JSW
Ste
el It
aly
S.R
.L.
-13
0-
--
--
--
130
Ped
dar
Rea
lty
Pri
vate
Lim
ited
155
--
--
--
-15
5-
JSW
Val
lab
h T
in P
late
Pri
vate
Li
mit
ed-
--
-57
68
--
576
8
Oth
ers
911
--
1223
141
81
162
115
Tota
l6
114
59
--
69
91
141
81
82
16
31

Better Everyday. In Pursuit of Excellence. Corporate Overview Statutory Reports Financial Statements
293
Notes to the Standalone Financial Statements as at and for the year ended 31 March 2018
C. A
mou
nt d
ue
to/
from
rel
ated
par
ties
` in
cro
res
Part
icul
ars
Sub
sidi
arie
sAs
soci
ate
Join
t Ve
ntur
esO
ther
Rel
ated
Par
ties
Tota
lA
s at
3
1 M
arch
20
18A
s at
3
1 M
arch
20
17A
s at
3
1 M
arch
20
18A
s at
3
1 M
arch
20
17A
s at
3
1 M
arch
20
18A
s at
3
1 M
arch
20
17A
s at
3
1 M
arch
20
18A
s at
3
1 M
arch
20
17A
s at
3
1 M
arch
20
18A
s at
3
1 M
arch
20
17
Sh
are
app
licat
ion
mon
ey
giv
en
JSW
Jh
arkh
and
Ste
el L
imit
ed1
*-
--
--
-1
*
Gou
ran
gd
ih C
oal L
imit
ed-
--
-*
*-
-*
*
JSW
MI S
teel
Ser
vice
Cen
tre
Pri
vate
Lim
ited
--
--
-24
--
-24
Oth
ers
*-
--
-*
--
**
Tota
l1
*-
-*
24-
-1
24
Cap
ital
/ r
even
ue
adva
nce
Am
ba
Riv
er C
oke
Lim
ited
36
919
6-
--
--
-3
69
196
JSW
Ste
el (
Sal
av)
Lim
ited
244
151
--
--
--
244
151
JSW
Cem
ent
Lim
ited
--
--
--
38
733
873
Ind
ia F
lysa
fe A
viat
ion
Lim
ited
--
--
--
214
-21
4-
Oth
ers
373
8-
-28
1811
010
217
515
8
Tota
l6
50
38
5-
-2
818
36
217
51,
04
057
8
Loan
an
d a
dva
nce
s g
iven
Inve
rsio
nes
Ero
ush
Lim
itad
a6
94
66
0-
--
--
-6
94
66
0
JSW
Ste
el H
old
ing
(U
SA)
Inc.
-1,
55
1-
--
--
--
1,5
51
Per
iam
a H
old
ing
s, L
LC3
,98
8-
--
--
--
3,9
88
-
Oth
ers
722
478
--
**
**
722
478
Tota
l5
,40
42
,68
9-
-*
**
*5
,40
42
,68
9
Inte
rest
rec
eiva
ble
Inve
rsio
nes
Ero
ush
Lim
itad
a18
118
0-
--
--
-18
118
0
Per
iam
a H
old
ing
s, L
LC37
237
1-
--
--
-37
237
1
Oth
ers
2828
--
--
--
2828
Tota
l5
81
579
--
--
--
58
157
9
Allo
wan
ces
for
loan
s an
d ad
van
ces
giv
en
JSW
Ste
el (
Net
her
lan
ds)
B.V
.3
225
2-
--
--
-3
225
2
Inve
rsio
nes
Ero
ush
Lim
itad
a19
7-
--
--
--
197
-
Oth
ers
43
--
--
--
43
Tota
l5
23
55
--
--
--
52
35
5

294
Notes to the Standalone Financial Statements as at and for the year ended 31 March 2018
JSW Steel Limited | Integrated Report 2017-18
C. A
mou
nt d
ue
to/
from
rel
ated
par
ties
` in
cro
res
Part
icul
ars
Sub
sidi
arie
sAs
soci
ate
Join
t Ve
ntur
esO
ther
Rel
ated
Par
ties
Tota
lA
s at
3
1 M
arch
20
18A
s at
3
1 M
arch
20
17A
s at
3
1 M
arch
20
18A
s at
3
1 M
arch
20
17A
s at
3
1 M
arch
20
18A
s at
3
1 M
arch
20
17A
s at
3
1 M
arch
20
18A
s at
3
1 M
arch
20
17A
s at
3
1 M
arch
20
18A
s at
3
1 M
arch
20
17
Inve
stm
ents
hel
d b
y th
e C
omp
any
Am
ba
Riv
er C
oke
Lim
ited
93
29
32
--
--
--
93
29
32
JSW
Ste
el C
oate
d P
rod
uct
s Li
mit
ed1,
314
1,3
14-
--
--
-1,
314
1,3
14
JSW
En
erg
y Li
mit
ed-
--
--
-6
66
574
66
657
4
Oth
ers
1,722
1,74
1-
-26
819
99
201,
99
91,
96
0
Tota
l3
,96
83
,98
7-
-26
819
96
755
94
4,9
114
,78
0
Loan
s/ a
dva
nce
s/ d
epos
its
take
nD
olvi
Cok
e P
roje
cts
Lim
ited
--
--
--
--
--
JSW
Infr
astr
uct
ure
Lim
ited
--
--
--
51
875
187
Tota
l-
--
--
-5
18
75
18
7
Gu
aran
tees
an
d c
olla
tera
ls
pro
vid
ed b
y th
e C
omp
any
on
beh
alf:
JSW
Ste
el (
Net
her
lan
ds)
B.V
.6
44
1,6
15-
--
--
-6
44
1,6
15
Per
iam
a H
old
ing
s, L
LC1,
626
3,1
77-
--
--
-1,
626
3,1
77
Oth
ers
212
38
6-
--
--
-21
23
86
Less
: Los
s al
low
ance
ag
ain
st
afor
esai
d
(64
2)(8
86
)-
--
--
-(6
42)
(88
6)
Tota
l1,
84
04
,29
2-
--
--
-1,
84
04
,29
2
Fin
ance
leas
e ob
ligat
ion
s
Am
ba
Riv
er C
oke
Lim
ited
2,11
22,
138
--
--
--
2,11
22,
138
JSW
Ste
el (
Sal
av)
Lim
ited
69
073
9-
--
--
-6
90
739
JSW
Pro
ject
s Li
mit
ed-
--
--
-1,
48
41,
66
61,
48
41,
66
6
JSW
Tec
hn
o P
roje
cts
Man
agem
ent
Lim
ited
--
--
--
173
177
173
177
Tota
l2
,80
22
,877
--
--
1,6
571,
84
34
,45
94
,72
0
*Les
s th
an `
50
lakh
s
Not
es:
The
Com
pan
y m
aint
ain
s g
ratu
ity
tru
st f
or t
he
pu
rpos
e of
ad
min
iste
rin
g t
he
gra
tuit
y p
aym
ent
to i
ts e
mp
loye
es (
JSW
Ste
el G
rou
p G
ratu
ity
Tru
st a
nd
JS
W S
teel
Lim
ited
Em
plo
yee
Gra
tuit
y Fu
nd
). A
s on
31
Mar
ch 2
018
, th
e fa
ir va
lue
of p
lan
ass
ets
was
as
` 6
5 c
rore
s (3
1 M
arch
20
17: `
53
cro
res)
.

Better Everyday. In Pursuit of Excellence. Corporate Overview Statutory Reports Financial Statements
295
Notes to the Standalone Financial Statements as at and for the year ended 31 March 2018
45. Contingent liabilities:
(i) Disputed claims/levies (excluding interest, if any) in respect of: ` in crores
Particulars As at 31 March 2018
As at 31 March 2017
Excise Duty 414 307
Custom Duty 514 575
Income Tax 18 169
Sales Tax/ VAT/ Special Entry tax 156 156
Service Tax 593 457
Miscellaneous # #
Levies by local authorities 320 10
Claims by suppliers and other parties 42 94
Total 2,057 1,768
# ` 0.05 crore
a) Excise duty cases includes disputes pertaining to availment of CENVAT credit, valuation methodologies, classification of gases under chapter heading.
b) Customs duty cases includes disputes pertaining to import of Iron ore fines and lumps under wrong heading, utilisation of SHIS licences for clearance of imported equipment, payment of customs duty on Steam Coal through Krishnapatnam Port and anti-dumping duty on Met Coke used in Corex.
c) Sales Tax/ VAT/ Special Entry tax cases includes disputes pertaining to demand of special entry tax in Karnataka and demand of cess by department of transport in Goa.
d) Service Tax cases includes disputes pertaining to availment of service tax credit on ineligible services, KKC amount paid but no credit not availed, denial of credit distributed as an ISD, service tax on railway freight not taken as per prescribed documents.
e) Income Tax cases includes disputes pertaining to deduction u/s 80-IA and other matters.
f) Levies by local authorities cases includes disputes pertaining to uninterrupted power charges by Karnataka Power Transmission Company Ltd., payment of water charges, belated payment surcharge, enhanced compensation and claims for the set off of renewable power obligations against the power generated in its captive power plants.
g) Miscellaneous cases includes provident fund relating to contractors.
h) Claims by Suppliers and other parties includes quality claims issues raised by suppliers and others.
i) There are several other cases which has been determined as remote by the Company and hence not been disclosed above.
(ii) Forest Development Tax/Fee: ` in crores
Particulars As at 31 March 2018
As at 31 March 2017
Claims related to Forest Development Tax/Fee 1,799 1,300
Amount paid under protest 919 726
In response to a petition filed by the iron ore mine owners and purchasers (including JSW Steel Limited [the Company]) contesting the levy of Forest Development Tax (FDT) on iron ore on the ground that the State does not have jurisdiction to legislate in the field of major minerals which is a central subject, the Honourable High Court of Karnataka vide its judgement dated 3 December 2015 directed refund of the entire amount of FDT collected by Karnataka State Government on sale of iron ore by private lease operators and National Mineral Development Corporation Limited (NMDC). The Karnataka State Government has filed an appeal before the Supreme Court of India ('SCI'). SCI has not granted stay on the judgement but stayed refund of FDT amounting to ` 1,517 crores. The matter is yet to be heard by SCI. Based on merits of the case and supported by a legal opinion, the Company has not recognised provision for FDT of ` 1,043 crores and treated it as a contingent liability.

296
Notes to the Standalone Financial Statements as at and for the year ended 31 March 2018
JSW Steel Limited | Integrated Report 2017-18
The State of Karnataka on 27 July 2016, has amended Section 98-A of the Forest Act retrospectively substituting the levy as Forest Development Fee (FDF) instead of FDT. In response to the writ petition filed by the Company and others, the Honourable High Court of Karnataka has vide its order dated 4 October 2017, held that the amendment is ultra-vires the Constitution of India and directed the State Government to refund the FDF collected. The State Government has filed an appeal before the SCI, and based on merits of the case duly supported by a legal opinion and a favorable order from the High Court, the Company has not recognised provision for FDF amount of ` 756 crores (including paid under protest - ` 255 crores) pertaining to the private lease operators & NMDC and treated it as contingent liability.
46. Financial guaranteesThe Company has issued financial guarantees to banks on behalf of and in respect of loan facilities availed by its group companies.
Refer below for details of financial guarantees issued: ` in crores
Particulars As at 31 March 2018
As at 31 March 2017
Guarantees 638 1,992
Standby letter of credit facility 1,717 3,060
Less: Loss allowance against aforesaid (642) (886)
Total 1,713 4,166
47. Commitments ` in crores
Particulars As at 31 March 2018
As at 31 March 2017
Estimated amount of contracts remaining to be executed on capital account and not provided for (net of advances)
9,801 4,517
Other commitments:
(a) The Company from time to time provides need based support to subsidiaries and joint ventures entity towards capital and other requirements.
(b) The Company has imported capital goods under the export promotion capital goods scheme to utilise the benefit of a zero or concessional customs duty rate. These benefits are subject to future exports within the stipulated year. Such export obligations at year end aggregate to
` in crores
Particulars As at 31 March 2018
As at 31 March 2017
Export promotion capital goods scheme 4,455 2,450
48. Operating leasea) As lessor:
i. The Company has entered into lease arrangements, for renting the following:
Category of Asset Area Period
Land at Vijayanagar 717 acres 8 months to 30 years
Land at Dolvi along with certain buildings 218 acres 3 years to 20 years
Land at Palwal 6 acres 15 years
Office Premises 1,885 sq. feet 24 months
Office Premises 33,930 sq. feet 5 years
Houses 14,11,027 sq. feet (2,279 Houses)
120 months

Better Everyday. In Pursuit of Excellence. Corporate Overview Statutory Reports Financial Statements
297
Notes to the Standalone Financial Statements as at and for the year ended 31 March 2018
The agreements are renewable & cancellable by mutual consent of both parties. The rent paid on above is based on mutually agreed rates.
ii. Disclosure in respect of assets (building) given on operating lease:
` in crores
Particulars As at 31 March 2018
As at 31 March 2017
Gross carrying amount of assets 360 181
Accumulated depreciation 12 30
Depreciation for the year 5 2
b) As lessee: (i) Lease rentals charged to profit and loss for right to use following assets are:
` in crores
Particulars For the year ended 31 March 2018
For the year ended 31 March 2017
Office premises, residential flats etc. 22 29
Total: 22 29
The agreements are executed for a period of 11 to 180 months with a renewable clause and also provide for termination at will by either party giving a prior notice period of 1 to 3 months.
(ii) The agreements for certain plant and equipment is on non-cancellable basis for a period of 10-15 years, which are renewable on expiry of the lease period at mutually acceptable terms.
Lease rentals charged to profit and loss for right to use these assets are
` in crores
Particulars For the year ended 31 March 2018
For the year ended 31 March 2017
Property, plant and equipment 9 9
Total 9 9
Future minimum rentals payable under non-cancellable operating leases are as follows:
` in crores
Particulars As at 31 March 2018
As at 31 March 2017
Not later than one year 6 6
Later than one year but not later than five years 11 17
Later than five years - -
Total 17 23
49. The Company has evaluated certain arrangements for purchase or processing of raw materials based on facts and circumstances existing at the date of transition to Ind AS and have identified them in the nature of lease as the fufilment of the arrangements depend upon a specific asset and the Company has committed to obtain substantially all the production capacity of the asset. After separating lease payments from the other elements in these arrangements, the Company has recognised plant and equipment and building as Assets taken under finance leases (refer note 4). In the arrangements for processing of raw materials, the Company also has an option to purchase the said assets at the end of the lease term.

298
Notes to the Standalone Financial Statements as at and for the year ended 31 March 2018
JSW Steel Limited | Integrated Report 2017-18
The minimum lease payments and the present value of minimum lease payments as at 31 March 2018 in respect of aforesaid plant and equipment acquired under the finance leases are as follows:
` in crores
As at 31 March 2018 As at 31 March 2017
Minimum lease payments
Present value of minimum lease
payments
Minimum lease payments
Present value of minimum lease
payments
Not later than 1 year 916 362 934 337
Later than one year but not later than five years 3,864 2,142 3,621 1,761
Later than five years 3,111 2,078 3,634 2,760
Total 7,891 4,582 8,189 4,858
Less: Future finance charges 3,309 3,331
Total: 4,582 4,858
50. During the year a subsidiary of the Company has surrendered one of its iron ore mine in Chile considering its economic viability and accordingly the Company has reassessed the recoverability of the loans given to and investments made in subsidiaries and recognised an impairment provision of ` 234 crores which has been disclosed as an exceptional item.
51. In assessing the carrying amounts of Investments in and loans / advances (net of impairment loss / loss allowance) to certain subsidiaries and a Joint Venture and financial guarantees to certain subsidiaries (listed below), the Company considered various factors as detailed there against and concluded they are recoverable.
(a) Investments aggregating to ` 259 crores (` 295 crores as at 31 March 2017) in equity and preference shares of NBV, loans of ` 209 crores (` 105 crores as at 31 March 2017), ` 4,361 crores (` 1,922 crores as at 31 March 2017) and ` 678 crores (` 840 crores as at 31 March 2017) to JSW Steel (Netherlands) B.V., Periama Holdings LLC and JSW Panama Holdings Corporation respectively and the financial guarantees of ` 1,626 crores (` 3,177 crores as at 31 March 2017) and ` 85 crores (` 199 crores as at 31 March 2017) on behalf of PHL and JSU respectively – Estimate of values of the businesses and assets by independent external valuers based on cash flow projections/implied multiple approach. In making the said projections, reliance has been placed on estimates of future prices of iron ore and coal, mineable resources, and assumptions relating to operational performance including significant improvement in capacity utilisation and margins based on forecasts of demand in local markets, and availability of infrastructure facilities for mines.
(b) Equity shares of JSW Steel Bengal Limited, a subsidiary (carrying amount: ` 442 crores (` 438 crores as at 31 March 2017)) - Evaluation of the status of its integrated Steel Complex (including power plant) to be implemented in phases at Salboni of district Paschim Medinipur in West Bengal by the said subsidiary, and the projections relating to the said complex considering estimates in respect of future raw material prices, foreign exchange rates, operating margins, etc. and the plans for commencing construction of the said complex.
(c) Equity shares of JSW Jharkhand Steel Limited, a subsidiary (carrying amount: ` 84 crores as at 31 March 2018; ` 80 crores as at 31 March 2017) - Evaluation of the status of its integrated Steel Complex to be implemented in phases at Ranchi, Jharkhand by the said subsidiary, and the projections relating to the said complex considering estimates in respect of future raw material prices, foreign exchange rates, operating margins, etc. and the plans for commencing construction of the said complex.
(d) Equity shares of Peddar Realty Private Limited (PRPL) (carrying amount of investments: ` 24 crores as at 31 March 2018; ` 24 crores as at 31 March 2017, and loans of ` 155 crores as at 31 March 2018; ` 157 crores as at 31 March 2017) -Valuation by an independent valuer of the residential complex in which PRPL holds interest.
(e) Investment of ` 4 crores (` 4 crores as at 31 March 2017) and loan of ` 137 crores (` 117 crores as at 31 March 2017) relating to JSW Natural Resources Mozambique Limitada and JSW ADMS Carvo Limitada (step down subsidiaries) - Assessment of minable reserves by independent experts and cash flow projections based on the plans to commence operations after mining lease arrangements are in place for which application has been submitted to regulatory authorities, and infrastructure is developed.

Better Everyday. In Pursuit of Excellence. Corporate Overview Statutory Reports Financial Statements
299
Notes to the Standalone Financial Statements as at and for the year ended 31 March 2018
(f) Equity shares of JSW Severfield Structures Limited, a joint venture (carrying amount: ` 160 crores as at 31 March 2018; ` 115 crores as at 31 March 2017) - Cash flow projections approved by the said JV which are based on estimates and assumptions relating to order book, capacity utilisation, operational performance, market prices of materials, inflation, terminal value, etc.
52. Previous year figures have been re-grouped /re-classified wherever necessary.
53. Subsequent Events On 16 May 2018 the board of directors recommended a final dividend of ` 3.20 per equity share (total dividend ` 774
crores) be paid to shareholders for financial year 2017-18, which is subject to approval by the shareholders at the Annual General Meeting to be held on 24 July 2018.
54. Standards issued but not yet effective In March 2018, the Ministry of Corporate Affairs issued the Companies (Indian Accounting Standards) Amendment
Rules, 2018, notifying Ind AS 115 ‘Revenue from Contracts with Customers’ (New Revenue Standard), which replaces Ind AS 11 ‘Construction Contracts’ and Ind AS 18 ‘Revenue’. The core principle of the New Revenue Standard is that an entity should recognise revenue to depict the transfer of promised goods or services to customers in an amount that reflects the consideration to which the entity expects to be entitled in exchange for those goods or services. Some of the key changes introduced by the New Revenue Standard include additional guidance for multiple-element arrangements, measurement approaches for variable consideration, adjustments for time value of money etc. Significant additional disclosures in relation to revenue are also prescribed. The New Revenue Standard also provides two broad alternative transition options – Retrospective Method and Cumulative Effect Method – with certain practical expedients available under the Retrospective Method. The Company is in the process of evaluating the impact of the New Revenue Standard on the present and future arrangements and shall determine the appropriate transition option once the said evaluation has been completed.
Also Appendix B to Ind AS 21, foreign currency transactions and advance consideration was notified along with the same notification which clarifies the date of the transaction for the purpose of determining the exchange rate to use on initial recognition of the related asset, expense or income, when an entity has received or paid advance consideration in a foreign currency. The Company is in the process of evaluating the effect of amendment on its financial statements.
Other amendments Following amendments to other Ind ASs which are issued but are not effective in FY 2017-18
a) Amendments to Ind AS 112 Disclosure of Interests in Other Entities: Clarification of the scope of disclosure requirements in Ind AS 112.
b) Amendments to Ind AS 12 Recognition of Deferred Tax Assets for Unrealised Losses.
c) Transfers of Investment Property — Amendments to Ind AS 40.
d) Ind AS 28 Investments in Associates and Joint Ventures – Clarification that measuring investees at fair value through profit or loss is an investment-by-investment choice.
The Company is in the process of evaluating the effect of these amendments on the financial statements.

300
Notes to the Standalone Financial Statements as at and for the year ended 31 March 2018
JSW Steel Limited | Integrated Report 2017-18
55. Additional information
A) C.I.F. value of imports:` in crores
Particulars For the year ended 31 March 2018
For the year ended 31 March 2017
- Capital goods 557 527
- Raw materials (including power and fuel) 19,837 14,814
- Stores & spare parts 683 1,065
B) Expenditure in foreign currency:` in crores
Particulars For the year ended 31 March 2018
For the year ended 31 March 2017
Interest and finance charges 877 748
Ocean freight 550 378
Technical know-how 19 14
Commission on sales 31 25
Legal & professional fees 6 9
Others 57 15
C) Earnings in foreign currency:` in crores
Particulars For the year ended 31 March 2018
For the year ended 31 March 2017
F.O.B. value of exports 10,938 10,051
Interest income - 98
As per our report of even date For and on behalf of the Board of Directors
For S R B C & CO LLP Sajjan JindalChartered Accountants Chairman & Managing DirectorICAI Firm Reg. No. 324982E/E300003 DIN 00017762
per Vikram Mehta Lancy Varghese Rajeev Pai Seshagiri Rao M.V.S.Partner Company Secretary Chief Financial Officer Jt. Managing Director & Group CFOMembership No. 105938 ICSI Membership No. FCS 9407 DIN 00029136
Place: MumbaiDate: 16 May 2018

301
Better Everyday. In Pursuit of Excellence. Corporate Overview Statutory Reports Financial Statements
To the Members of JSW Steel Limited
Report on the consolidated Ind AS financial statementsWe have audited the accompanying consolidated Ind AS financial statements of JSW Steel Limited (hereinafter referred to as “the Holding Company”), its subsidiaries (the Holding Company and its subsidiaries together referred to as “the Group”) its joint ventures, comprising of the Consolidated Balance Sheet as at March 31, 2018, the Consolidated Statement of Profit and Loss (including Other Comprehensive Income), the Consolidated Statement of Cash Flows, the Consolidated Statement of Changes in Equity for the year then ended, and a summary of significant accounting policies and other explanatory information (hereinafter referred to as “the consolidated Ind AS financial statements”).
Management’s Responsibility for the consolidated Ind AS financial statementsThe Holding Company’s Board of Directors is responsible for the preparation of these consolidated Ind AS financial statements in terms of the requirement of the Companies Act, 2013 (“the Act”) that give a true and fair view of the consolidated financial position, consolidated financial performance including other comprehensive income, consolidated cash flows and consolidated statement of changes in equity of the Group including its Joint Ventures in accordance with accounting principles generally accepted in India, including the Accounting Standards specified under Section 133 of the Act, read with the Companies (Indian Accounting Standard) Rules, 2015, as amended. The respective Board of Directors of the companies included in the Group and of its joint ventures are responsible for maintenance of adequate accounting records in accordance with the provisions of the Act for safeguarding of the assets of the Group and of its joint ventures and for preventing and detecting frauds and other irregularities; the selection and application of appropriate accounting policies; making judgments and estimates that are reasonable and prudent; and the design, implementation and maintenance of adequate internal financial controls, that were operating effectively for ensuring the accuracy and completeness of the accounting records, relevant to the preparation and presentation of the consolidated Ind AS financial statements that give a true and fair view and are free from material misstatement, whether due to fraud or error, which have been used for the purpose of preparation of the consolidated Ind AS financial statements by the Directors of the Holding Company, as aforesaid.
Auditor’s ResponsibilityOur responsibility is to express an opinion on these consolidated Ind AS financial statements based on our audit. While conducting the audit, we have taken into account the provisions of the Act, the accounting and auditing standards and matters which are required to be included in the audit
report under the provisions of the Act and the Rules made thereunder. We conducted our audit in accordance with the Standards on Auditing, issued by the Institute of Chartered Accountants of India, as specified under Section 143(10) of the Act. Those Standards require that we comply with ethical requirements and plan and perform the audit to obtain reasonable assurance about whether the consolidated Ind AS financial statements are free from material misstatement.
An audit involves performing procedures to obtain audit evidence about the amounts and disclosures in the consolidated Ind AS financial statements. The procedures selected depend on the auditor’s judgment, including the assessment of the risks of material misstatement of the consolidated Ind AS financial statements, whether due to fraud or error. In making those risk assessments, the auditor considers internal financial control relevant to the Holding Company’s preparation of the consolidated Ind AS financial statements that give a true and fair view in order to design audit procedures that are appropriate in the circumstances. An audit also includes evaluating the appropriateness of accounting policies used and the reasonableness of the accounting estimates made by the Holding Company’s Board of Directors, as well as evaluating the overall presentation of the consolidated Ind AS financial statements. We believe that the audit evidence obtained by us and the audit evidence obtained by the other auditors in terms of their reports referred to in sub-paragraph (a) of the Other Matters paragraph below, is sufficient and appropriate to provide a basis for our audit opinion on the consolidated Ind AS financial statements.
OpinionIn our opinion and to the best of our information and according to the explanations given to us and based on the consideration of reports of other auditors on separate financial statements and on the other financial information of the subsidiaries and joint ventures, the aforesaid consolidated Ind AS financial statements give the information required by the Act in the manner so required and give a true and fair view in conformity with the accounting principles generally accepted in India of the consolidated state of affairs of the Group, its joint ventures as at 31 March 2018, their consolidated profit including other comprehensive income, their consolidated cash flows and consolidated statement of changes in equity for the year ended on that date.
Other Matter(a) We did not audit the financial statements and other
financial information, in respect of 40 subsidiaries, whose financial statements include total assets of ` 16,500 crore and net assets of ` 191 crore as at 31 March 2018, and total revenues of ` 8,720 crore and net cash outflows of ` 113 crore for the year ended on that date. These financial statement and other financial information have been audited by other auditors, whose
Independent Auditor’s Report

302
JSW Steel Limited | Integrated Report 2017-18
reports have been furnished to us by the management. The consolidated Ind AS financial statements also include the Group’s share of net profit of ` 56 crore for the year ended 31 March 2018, as considered in the consolidated Ind AS financial statements, in respect of 7 joint ventures, whose financial statements, other financial information have been audited by other auditors and whose reports have been furnished to us by the Management. Our opinion on the consolidated Ind AS financial statements, in so far as it relates to the amounts and disclosures included in respect of these subsidiaries, and joint ventures, and our report in terms of sub-sections (3) of Section 143 of the Act, in so far as it relates to the aforesaid subsidiaries and joint ventures, is based solely on the reports of such other auditors.
Certain of these subsidiaries and joint ventures are located outside India whose financial statements and other financial information have been prepared in accordance with accounting principles generally accepted in their respective countries and which have been audited by other auditors under generally accepted auditing standards applicable in their respective countries. The Company’s management has converted the financial statements of such subsidiaries and joint ventures located outside India from accounting principles generally accepted in their respective countries to accounting principles generally accepted in India. We have audited these conversion adjustments made by the Company’s management. Our opinion in so far as it relates to the balances and affairs of such subsidiaries and joint ventures located outside India is based on the report of other auditors and the conversion adjustments prepared by the management of the Company and audited by us.
(b) The accompanying consolidated Ind AS financial statements include unaudited financial statements and other unaudited financial information in respect of 4 subsidiaries, whose financial statements and other financial information reflect total assets of ` Nil and net assets of ` (-) 3 crore as at 31 March 2018, and total revenues of ` Nil and net cash inflows of ` 0.03 crore for the year ended on that date. These unaudited financial statements and other unaudited financial information have been furnished to us by the management. The consolidated Ind AS financial statements also include the Group’s share of net loss of ` 14 Crores for the year ended 31 March 2018, as considered in the consolidated Ind AS financial statements, in respect of 2 joint ventures, whose financial statements, other financial information have not been audited and whose unaudited financial statements, other unaudited financial information have been furnished to us by the Management. Our opinion, in so far as it relates amounts and disclosures included in respect of these subsidiaries and joint ventures
and our report in terms of sub-sections (3) of Section 143 of the Act in so far as it relates to the aforesaid subsidiaries and joint ventures, is based solely on such unaudited financial statement and other unaudited financial information. In our opinion and according to the information and explanations given to us by the Management, these financial statements and other financial information are not material to the Group.
(c) The consolidated Ind AS financial statements of the Company for the year ended March 31, 2017, included in these consolidated Ind AS financial statements, have been audited by the predecessor auditor who expressed an unmodified opinion on those statements on May 17, 2017.
Our opinion above on the consolidated Ind AS financial statements, and our report on Other Legal and Regulatory Requirements below, is not modified in respect of the above matters with respect to our reliance on the work done and the reports of the other auditors and the financial statements and other financial information certified by the Management.
Report on Other Legal and Regulatory RequirementsAs required by section 143 (3) of the Act, based on our audit and on the consideration of report of the other auditors on separate financial statements and the other financial information of subsidiaries and joint ventures, as noted in the ‘other matter’ paragraph we report, to the extent applicable, that:
(a) We / the other auditors whose reports we have relied upon have sought and obtained all the information and explanations which to the best of our knowledge and belief were necessary for the purpose of our audit of the aforesaid consolidated Ind AS financial statements;
(b) In our opinion proper books of account as required by law relating to preparation of the aforesaid consolidation of the financial statements have been kept so far as it appears from our examination of those books and reports of the other auditors;
(c) The Consolidated Balance Sheet, the Consolidated Statement of Profit and Loss (including Other Comprehensive Income), the Consolidated Statement of Cash Flows and the Consolidated Statement of Changes in Equity dealt with by this Report are in agreement with the books of account maintained for the purpose of preparation of the consolidated Ind AS financial statements;
(d) In our opinion, the aforesaid consolidated Ind AS financial statements comply with the Accounting Standards specified under section 133 of the Act,

303
Better Everyday. In Pursuit of Excellence. Corporate Overview Statutory Reports Financial Statements
read with Companies (Indian Accounting Standard) Rules, 2015, as amended;
(e) On the basis of the written representations received from the directors of the Holding Company as on 31 March 2018 taken on record by the Board of Directors of the Holding Company and the reports of the statutory auditors who are appointed under Section 139 of the Act, of its subsidiary companies and joint ventures incorporated in India, none of the directors of the Group’s companies, its joint ventures incorporated in India is disqualified as on March 31, 2018 from being appointed as a director in terms of Section 164 (2) of the Act.
(f) With respect to the adequacy and the operating effectiveness of the internal financial controls over financial reporting with reference to these consolidated Ind AS financial statements of the Holding Company and its subsidiary companies and joint ventures incorporated in India, refer to our separate report in “Annexure 1” to this report;
(g) With respect to the other matters to be included in the Auditor’s Report in accordance with Rule 11 of the Companies (Audit and Auditors) Rules, 2014, in our opinion and to the best of our information and according to the explanations given to us and based on the consideration of the report of the other auditors on separate financial statements as also the other financial
information of the subsidiaries and joint ventures, as noted in the ‘Other matter’ paragraph:
i. The consolidated Ind AS financial statements disclose the impact of pending litigations on its consolidated financial position of the Group, its joint ventures– Refer Note 43 to the consolidated Ind AS financial statements;
ii. The Group, its joint ventures did not have any material foreseeable losses in long-term contracts including derivative contracts during the year ended 31 March 2018.
iii. There has been no delay in transferring amounts, required to be transferred, to the Investor Education and Protection Fund by the Holding Company, its subsidiaries and joint ventures incorporated in India during the year ended 31 March 2018.
For S R B C & CO LLPChartered Accountants
ICAI Firm Registration Number: 324982E/E300003
per Vikram MehtaPartner
Membership No. 105938
Place of Signature: MumbaiDate: 16 May 2018
Independent Auditor’s Report
304
JSW Steel Limited | Integrated Report 2017-18
Annexure 1
Annexure 1 to the Independent Auditor’s Report of even date on the consolidated Ind AS financial statements of JSW Steel Limited
Report on the Internal Financial Controls under Clause (i) of sub-section 3 of Section 143 of the Companies Act, 2013 (“the Act”)In conjunction with our audit of the consolidated Ind AS financial statements of JSW Steel Limited as of and for the year ended 31 March 2018, we have audited the internal financial controls over financial reporting of JSW Steel Limited (hereinafter referred to as the “Holding Company”) and its subsidiary companies and joint ventures, which are companies incorporated in India, as of that date.
Management’s Responsibility for Internal Financial ControlsThe respective Board of Directors of the Holding Company, its subsidiary companies and joint ventures, which are companies incorporated in India, are responsible for establishing and maintaining internal financial controls based on the internal control over financial reporting criteria established by the Holding Company considering the essential components of internal control stated in the Guidance Note on Audit of Internal Financial Controls Over Financial Reporting issued by the Institute of Chartered Accountants of India. These responsibilities include the design, implementation and maintenance of adequate internal financial controls that were operating effectively for ensuring the orderly and efficient conduct of its business, including adherence to the respective Company’s policies, the safeguarding of its assets, the prevention and detection of frauds and errors, the accuracy and completeness of the accounting records, and the timely preparation of reliable financial information, as required under the Act.
Auditor’s ResponsibilityOur responsibility is to express an opinion on the Company’s internal financial controls over financial reporting with reference to these consolidated Ind AS financial statements based on our audit. We conducted our audit in accordance with the Guidance Note on Audit of Internal Financial Controls Over Financial Reporting (the “Guidance Note”) and the Standards on Auditing, both, issued by Institute of Chartered Accountants of India, and deemed to be prescribed under section 143(10) of the Act, to the extent applicable to an audit of internal financial controls. Those Standards and the Guidance Note require that we comply with ethical requirements and plan and perform the audit to obtain reasonable assurance about whether adequate internal financial controls over financial reporting with reference to these consolidated Ind AS financial statements was established and maintained and if such controls operated effectively in all material respects.
Our audit involves performing procedures to obtain audit evidence about the adequacy of the internal financial controls over financial reporting with reference to these
consolidated Ind AS financial statements and their operating effectiveness. Our audit of internal financial controls over financial reporting included obtaining an understanding of internal financial controls over financial reporting with reference to these consolidated Ind AS financial statements, assessing the risk that a material weakness exists, and testing and evaluating the design and operating effectiveness of internal control based on the assessed risk. The procedures selected depend on the auditor’s judgement, including the assessment of the risks of material misstatement of the financial statements, whether due to fraud or error.
We believe that the audit evidence we have obtained and the audit evidence obtained by the other auditors in terms of their reports referred to in the Other Matters paragraph below, is sufficient and appropriate to provide a basis for our audit opinion on the internal financial controls over financial reporting with reference to these consolidated Ind AS financial statements.
Meaning of Internal Financial Controls Over Financial Reporting With Reference to these consolidated Ind AS financial statementsA Company’s internal financial control over financial reporting with reference to these consolidated Ind AS financial statements is a process designed to provide reasonable assurance regarding the reliability of financial reporting and the preparation of financial statements for external purposes in accordance with generally accepted accounting principles. A Company’s internal financial control over financial reporting with reference to these consolidated Ind AS financial statements includes those policies and procedures that (1) pertain to the maintenance of records that, in reasonable detail, accurately and fairly reflect the transactions and dispositions of the assets of the Company; (2) provide reasonable assurance that transactions are recorded as necessary to permit preparation of financial statements in accordance with generally accepted accounting principles, and that receipts and expenditures of the Company are being made only in accordance with authorisations of management and directors of the Company; and (3) provide reasonable assurance regarding prevention or timely detection of unauthorised acquisition, use, or disposition of the Company’s assets that could have a material effect on the financial statements.
Inherent Limitations of Internal Financial Controls Over Financial Reporting With Reference to these consolidated Ind AS financial statementsBecause of the inherent limitations of internal financial controls over financial reporting with reference to these consolidated Ind AS financial statements, including the possibility of collusion or improper management override of controls, material misstatements due to error or fraud may occur and not be detected. Also, projections of any evaluation

305
Better Everyday. In Pursuit of Excellence. Corporate Overview Statutory Reports Financial Statements
of the internal financial controls over financial reporting with reference to these consolidated Ind AS financial statements to future periods are subject to the risk that the internal financial control over financial reporting with reference to these consolidated Ind AS financial statements may become inadequate because of changes in conditions, or that the degree of compliance with the policies or procedures may deteriorate.
OpinionIn our opinion, the Holding Company, its subsidiary companies and joint ventures, which are companies incorporated in India, have, maintained in all material respects, adequate internal financial controls over financial reporting with reference to these consolidated Ind AS financial statements and such internal financial controls over financial reporting with reference to these consolidated Ind AS financial statements were operating effectively as at 31 March 2018, based on the internal control over financial reporting criteria established by the Holding Company considering the essential components of internal control stated in the
Guidance Note on Audit of Internal Financial Controls Over Financial Reporting issued by the Institute of Chartered Accountants of India.
Other MattersOur report under Section 143(3)(i) of the Act on the adequacy and operating effectiveness of the internal financial controls over financial reporting with reference to these consolidated Ind AS financial statements of the Holding Company, insofar as it relates to these 13 subsidiary companies and 7 jointly joint ventures, which are companies incorporated in India, is based on the corresponding reports of the auditors of such subsidiary and joint ventures incorporated in India.
For S R B C & CO LLPChartered Accountants
ICAI Firm Registration Number: 324982E/E300003
per Vikram MehtaPartner
Membership No. 105938
Place of Signature: MumbaiDate: 16 May 2018

306
JSW Steel Limited | Integrated Report 2017-18
Consolidated Balance Sheetas at 31 March 2018
` in crores
Notes As at31 March 2018
As at31 March 2017
I Assets(1) Non-current assets
(a) Property, plant and equipment 4 57,054 57,786(b) Capital work-in-progress 5 5,629 4,081(c) Goodwill 6 707 872(d) Other intangible assets 7 87 72(e) Intangible assets under development 321 282(f) Investments in joint ventures 8 360 252(g) Financial assets (i) Investments 9 797 814 (ii) Loans 10 378 121 (iii) Other financial assets 11 293 252(h) Current tax assets (net) 271 305(i) Deferred tax assets (net) 23 48 84(j) Other non-current assets 12 2,881 1,892Total non-current assets 68,826 66,813
(2) Current assets(a) Inventories 13 12,594 11,395(b) Financial assets (i) Investments 14 312 300 (ii) Trade receivables 15 4,704 4,149 (iii) Cash and cash equivalents 16(a) 582 917 (iv) Bank balances other than (iii) above 16(b) 481 568 (v) Loans 10 230 174 (vi) Derivative assets 17 151 491 (vii) Other financial assets 11 530 285(c) Current tax assets (net) 6 18(d) Other current assets 12 3,599 2,968(e) Assets classified as held for sale 3 11Total current assets 23,192 21,276 Total Assets 92,018 88,089
II Equity And Liabilities(1) Equity
(a) Equity share capital 18 302 301(b) Other equity 19 27,696 22,346Equity attributable to owners of the Company 27,998 22,647Non-controlling interests (464) (246)Total equity 27,534 22,401
Liabilities(2) Non-current liabilities
(a) Financial liabilities (i) Borrowings 20 31,723 32,416 (ii) Other financial liabilities 21 919 486(b) Provisions 22 138 97(c) Deferred tax liabilities (net) 23 2,604 3,074(d) Other non-current liabilities 24 136 55Total non-current liabilities 35,520 36,128
(3) Current liabilities(a) Financial liabilities (i) Borrowings 25 2,177 4,881 (ii) Trade payables 26 15,944 13,348 (iii) Derivative Liabilities 27 96 418 (iv) Other financial liabilities 28 8,615 9,457(b) Other current liabilities 29 1,564 1,209(c) Provisions 22 184 202(d) Current tax liabilities (net) 384 45Total current liabilities 28,964 29,560Total liabilities 64,484 65,688TOTAL – EQUITY AND LIABILITIES 92,018 88,089
See accompanying notes to the Consolidated Financial Statements
As per our report of even date For and on behalf of the Board of Directors
For S R B C & CO LLP Sajjan JindalChartered Accountants Chairman & Managing DirectorICAI Firm Reg. No. 324982E/E300003 DIN 00017762
per Vikram Mehta Lancy Varghese Rajeev Pai Seshagiri Rao M.V.S.Partner Company Secretary Chief Financial Officer Jt. Managing Director & Group CFOMembership No. 105938 ICSI Membership No. FCS 9407 DIN 00029136
Place: MumbaiDate: 16 May 2018

307
Better Everyday. In Pursuit of Excellence. Corporate Overview Statutory Reports Financial Statements
Consolidated Statement of Profit and Loss for the year ended 31 March 2018
` in crores
Notes For the year ended31 March 2018
For the year ended31 March 2017
I Revenue from operations 30 71,503 60,536II Other income 31 167 152III Total income (I + II) 71,670 60,688IV Expenses
Cost of materials consumed 38,779 29,749Purchases of stock-in-trade 2 -Changes in inventories of finished goods, work-in-progress and stock-in-trade
32 244 (1,486)
Employee benefits expense 33 1,843 1,700Finance costs 34 3,701 3,768Depreciation and amortisation expense 35 3,387 3,430Excise duty expense 1,278 4,932Other expenses 36 14,563 13,467Total expenses 63,797 55,560
V Profit before exceptional items and tax (III - IV) 7,873 5,128VI Exceptional items 47 264 -VII Profit before tax (V - VI) 7,609 5,128VIII Tax expense/(benefit) 23
Current tax 1,826 152Deferred tax (288) 1,522
1,538 1,674IX Profit for the year (VII - VIII) 6,071 3,454X Share of (loss) / profit from an associate - (9)XI Share of profit / (loss) from joint ventures (net) 42 22XII Total Profit for the year (IX + X + XI) 6,113 3,467XIII Other comprehensive income / (loss)A i) Items that will not be reclassified to profit or loss
(a) Re-measurements losses of the defined benefit plans 40 (5) (20) (b) Equity instruments through other comprehensive
income92 (68)
ii) Income tax relating to items that will not be reclassified to profit or loss 2 7
Total (A) 89 (81)B i) Items that will be reclassified to profit or loss
(a) The effective portion of gain/(loss) on hedging instruments
(401) 347
(b) Changes in Foreign currency monetary item translation difference account (FCMITDA)
(33) 297
(c) Foreign currency translation reserve (FCTR) 9 30ii) Income tax relating to items that will be reclassified to
profit or loss 150 (223)
Total (B) (275) 451Total Other comprehensive income/(loss) (A+B) (186) 370
XIV Total comprehensive income/(loss) (XII + XIII) 5,927 3,837Total Profit/(loss) for the year attributable to: - Owners of the Company 6,214 3,523- Non-controlling interests (101) (56)
6,113 3,467Other comprehensive income/(loss) for the year attributable to:- Owners of the Company (184) 365- Non-controlling interests (2) 5
(186) 370Total comprehensive income/(loss) for the year attributable to:- Owners of the Company 6,030 3,888- Non-controlling interests (103) (51)
5,927 3,837XV Earnings per equity share of ` 1 each 37
Basic (in `) 25.85 14.66Diluted (in `) 25.71 14.58
See accompanying notes to the Consolidated Financial Statements
As per our report of even date For and on behalf of the Board of Directors
For S R B C & CO LLP Sajjan JindalChartered Accountants Chairman & Managing DirectorICAI Firm Reg. No. 324982E/E300003 DIN 00017762
per Vikram Mehta Lancy Varghese Rajeev Pai Seshagiri Rao M.V.S.Partner Company Secretary Chief Financial Officer Jt. Managing Director & Group CFOMembership No. 105938 ICSI Membership No. FCS 9407 DIN 00029136
Place: MumbaiDate: 16 May 2018

308
JSW Steel Limited | Integrated Report 2017-18
Consolidated Statement of Changes in Equity for the year ended 31 March 2018
A.
Equ
ity
shar
e ca
pit
al
` in
cro
res
As
at 1
Ap
ril 2
016
Mov
emen
t d
uri
ng
20
16-1
7A
s at
31
Mar
ch 2
017
M
ovem
ent
du
rin
g 2
017
-18
As
at 3
1 M
arch
20
18
30
1@
30
1@
@3
02
@ =
0.4
3 c
rore
s@
@ =
0.3
2 cr
ores
B.
Oth
er e
qu
ity
` in
cro
res
Par
ticu
lars
Res
erve
s an
d s
urp
lus
Oth
er c
omp
reh
ensi
ve in
com
e/(l
oss)
Attr
ibut
a-bl
e to
ow
n-er
s of
the
pa
rent
Non
-con
-tr
ollin
g in
tere
stCa
pita
l re
serv
eSe
curi
ties
pr
emiu
m
rese
rve
Capi
tal
rede
mpt
ion
rese
rve
Deb
entu
re
rede
mpt
ion
rese
rve
Reta
ined
ea
rnin
gsEq
uity
set
-tl
ed s
hare
ba
sed
paym
ent
rese
rve
Gen
eral
re
serv
eCa
pita
l re
serv
e on
ba
rgai
n pu
rcha
se
FCTR
Equi
ty in
-st
rum
ents
th
roug
h ot
her c
om-
preh
ensi
ve
inco
me
Effe
ctiv
e po
rtio
n of
ca
sh fl
ow
hedg
es
FCM
ITD
A T
otal
Bal
ance
as
at 1
Ap
ril 2
016
3,5
85
5,4
1710
43
3(1
,55
5)
-10
,42
06
10(5
57)
45
44
6(1
98
)18
,66
5(1
95
)18
,470
Pro
fit
for t
he
year
--
--
3,5
23
--
--
--
-3
,52
3(5
6)
3,4
67
Oth
er c
omp
reh
ensi
ve in
com
e fo
r th
e ye
ar, n
et o
f in
com
e ta
x (r
efer
not
e 2
3)
--
--
(13
)-
--
25
(68
)2
2719
43
65
53
70
Div
iden
ds
incl
ud
ing
div
iden
d d
istr
ibu
tion
tax
--
--
(218
)-
--
--
--
(218
)-
(218
)
Imp
act
of E
SO
P t
rust
con
solid
atio
n-
--
-(1
)-
--
--
--
(1)
-(1
)R
ecog
nit
ion
of
shar
e-b
ased
pay
men
ts-
--
--
13-
--
--
-13
-13
Oth
ers
--
--
(1)
--
(5)
5-
--
(1)
-(1
)B
alan
ce a
s at
31
Mar
ch 2
017
3,5
85
5,4
1710
43
31,
735
1310
,42
06
05
(527
)3
86
273
(4)
22
,34
6(2
46
)2
2,1
00
Pro
fit
for t
he
year
--
--
6,2
14-
--
--
--
6,2
14(1
01)
6,1
13O
ther
com
pre
hen
sive
inco
me
for t
he
year
, net
of
inco
me
tax
(ref
er n
ote
23
)-
--
-(2
)-
--
109
2(2
63
)(2
1)(1
84
)(2
)(1
86
)
Div
iden
d in
clu
din
g d
ivid
end
dis
trib
uti
on t
ax-
--
-(6
55
)-
--
--
--
(65
5)
-(6
55
)
Imp
act
of E
SO
P t
rust
con
solid
atio
n-
--
-(2
7)-
--
--
--
(27)
-(2
7)R
ecog
nit
ion
of
shar
e-b
ased
pay
men
ts-
--
--
28
--
--
--
28
-2
8Tr
ansf
er b
etw
een
th
e re
serv
es-
-13
9(2
92
)2
92
-(1
39
)-
--
--
--
-Ac
qu
isit
ion
of
NC
I-
--
-(3
0)
--
--
--
-(3
0)
(16
5)
(19
5)
Equ
ity
com
pon
ent
of c
omp
oun
d fi
nan
cial
inst
rum
ents
--
--
--
--
--
--
-3
53
5
Sh
are
app
licat
ion
mon
ey p
end
ing
allo
tmen
t-
--
--
--
--
--
--
1515
Oth
ers
--
--
1-
-4
(1)
--
-4
-4
Bal
ance
as
at 3
1 M
arch
20
183
,58
55
,417
149
141
7,5
28
41
10,2
81
60
9(5
18)
478
10(2
5)
27,6
96
(46
4)
27,2
32
See
acc
omp
anyi
ng
not
es t
o th
e C
onso
lidat
ed F
inan
cial
Sta
tem
ents
As
per
ou
r rep
ort
of e
ven
dat
eFo
r an
d o
n b
ehal
f of
th
e B
oard
of
Dir
ecto
rs
For S
R B
C &
CO
LLP
Saj
jan
Jin
dal
Ch
arte
red
Acc
ount
ants
Ch
airm
an &
Man
agin
g D
irec
tor
ICA
I Fir
m R
eg. N
o. 3
249
82
E/E3
00
00
3D
IN 0
00
1776
2
per
Vik
ram
Meh
taLa
ncy
Var
gh
ese
Raj
eev
Pai
Ses
hag
iri R
ao M
.V.S
.P
artn
erC
omp
any
Sec
reta
ryC
hie
f Fi
nan
cial
Off
icer
Jt. M
anag
ing
Dir
ecto
r & G
rou
p C
FOM
emb
ersh
ip N
o. 1
05
93
8IC
SI M
emb
ersh
ip N
o. F
CS
94
07
DIN
00
02
913
6
Pla
ce: M
um
bai
Dat
e: 1
6 M
ay 2
018

309
Better Everyday. In Pursuit of Excellence. Corporate Overview Statutory Reports Financial Statements
` in croresFor the year ended
31 March 2018For the year ended
31 March 2017
A. Cash flow from operating activitiesNet profit before tax 7,609 5,128
Adjustments for:
Depreciation and amortisation expense 3,387 3,430
Loss on sale of property, plant and equipment 122 134
Gain on sale of current investments designated as FVTPL (19) (6)
Export obligation deferred income amortisation (68) (82)
Fair value gain on deferral sales tax / VAT Loan (53) -
Interest income (120) (96)
Dividend income (5) (20)
Interest expense 3,500 3,546
Unrealised exchange gains / (loss) 31 (119)
Fair value gain on financial instruments designated as FVTPL (3) (15)
Share based payment expense 28 13
Fair value loss on financial instrument designated as FVTPL 111 -Allowances for doubtful receivable and advances 136 1
Impairment of property plant and equipment, goodwill and investments
264 80
7,311 6,866
Operating profit before working capital changes 14,920 11,994
Adjustments for:
Increase in inventories (1,199) (3,065)
Increase in trade receivables (640) (1,352)
Increase in other assets (1,793) (1,027)
Increase in trade payable and other liabilities 2,514 1,561
Increase in provisions 17 14
(1,101) (3,869)
Cash flow from operations 13,819 8,125
Income taxes paid (net of refund received) (1,440) (237)
Net cash generated from operating activities 12,379 7,888
B. Cash flow from investing activitiesPayments for property, plant and equipment and intangibles (including capital advances)
(4,736) (4,435)
Proceeds from sale of property, plant and equipment 60 45
Net cash outflow for acquisition of a subsidiary / acquisition of NCI
(315) (110)
Investment in joint ventures (46) (37)
Purchase of current investments (8,111) (2,784)
Sale of current investments 8,120 2,490
Bank deposits not considered as cash and cash equivalents (net)
373 (381)
Interest received 121 98
Dividend received 5 20
Net cash used in investing activities (4,529) (5,094)
C. Cash flow from financing activitiesProceeds of sale of treasury shares 49 57
Payment for purchase of treasury shares (76) (55)
Proceeds from issue of non-convertible preference share capital
- 50
Proceeds from non-current borrowings 6,209 4,560
Repayment of non-current borrowings (7,298) (5,890)
Proceeds from / repayment of current borrowings (net) (2,703) 2,541
Repayment of finance lease obligations (200) (186)
Interest paid (3,511) (3,569)
Consolidated Statement of Cash Flowsfor the year ended 31 March 2018

310
JSW Steel Limited | Integrated Report 2017-18
` in croresFor the year ended
31 March 2018For the year ended
31 March 2017
Dividend paid (including corporate dividend tax) (655) (218)
Net cash used in financing activities (8,185) (2,710)
Net (decrease) / increase in cash and cash equivalents (A+B+C)
(335) 84
Cash and cash equivalents at the beginning of year 917 833
Add: Translation adjustment in cash and cash equivalents @ @
Cash and cash equivalents at the end of year 582 917
@ - ` (0.22) crores (previous year – ` 0.45 crores)
Reconciliations forming part of cash flow statement` in crores
Particulars 1 April 2017 Cash flows (net)
Foreign exchange
difference
Changes in fair values
New leases Others 31 March 2018
Borrowings (non-current) other than finance lease obligations (including current maturities of long-term borrowing included in other financial liabilities note 28)
36,472 (1,089) 93 (52) - 11 35,435
Finance Lease Obligations (including Current maturities)
1,981 (200) - - - - 1,781
Borrowings (Current) 4,881 (2,703) (1) - - - 2,177
` in crores
Particulars 1 April 2016 Cash flows (net)
Foreign exchange
difference
Changes in fair values
New leases Others 31 March 2017
Borrowings (non-current) other than finance lease obligation (including current maturities of long-term borrowing included in other financial liabilities note 28)
37,975 (1,330) (340) - - 167 36,472
Finance Lease Obligations (including Current maturities)
1,887 (186) - - 280 - 1,981
Borrowings (Current) 2,343 2,541 (3) - - - 4,881
Other comprises of upfront fees amortisation and interest cost accrual on preference shares.Notes:1. The cash flow statement is prepared using the 'indirect method' set out in IND AS 7 - Statement of Cash Flows.2. The group has acquired property, plant and equipment of Nil crores (previous year ` 280 crores) on finance lease.
Consolidated Statement of Cash Flows for the year ended 31 March 2018 (Continued)
See accompanying notes to the Consolidated Financial Statements
As per our report of even date For and on behalf of the Board of Directors
For S R B C & CO LLP Sajjan JindalChartered Accountants Chairman & Managing DirectorICAI Firm Reg. No. 324982E/E300003 DIN 00017762
per Vikram Mehta Lancy Varghese Rajeev Pai Seshagiri Rao M.V.S.Partner Company Secretary Chief Financial Officer Jt. Managing Director & Group CFOMembership No. 105938 ICSI Membership No. FCS 9407 DIN 00029136
Place: MumbaiDate: 16 May 2018

311
Notes to the Consolidated Financial Statements as at and for the year ended 31 March 2018
Better Everyday. In Pursuit of Excellence. Corporate Overview Statutory Reports Financial Statements
1. General Information
JSW Steel Limited ('the Company' or ‘the Parent’) is primarily engaged in the business of manufacture and sale of Iron and Steel Products.
The Parent and its subsidiaries (together referred to as 'the Group') are manufacturer of diverse range of steel products with is manufacturing facilities located in states of Karnataka, Maharashtra and Tamil Nadu in India and also in the United States of America.
JSW Steel Limited is a public limited Company incorporated in India on 15th March, 1994 under the Companies Act, 1956 and listed on the Bombay Stock Exchange and National Stock Exchange. The registered office of the Company is JSW Centre, Bandra-Kurla Complex, Bandra (East), Mumbai – 400 051.
2. Significant Accounting policiesI. Statement of compliance Consolidated Financial Statements have been prepared
in accordance with the accounting principles generally accepted in India including Indian Accounting Standards (Ind AS) prescribed under the Section 133 of the Companies Act, 2013 read with Rule 3 of the Companies (Indian Accounting Standards) Rules, 2015 and the Companies (Accounting Standards) Amendment Rules, 2016. The aforesaid financial statements have been approved by the Board of Directors in the meeting held on 16 May 2018.
Accordingly, the Company has prepared these Consolidated Financial Statements which comprise the Consolidated Balance Sheet as at 31 March 2018, the Consolidated Statement of Profit and Loss, the Consolidated Statement of Cash Flows and the Consolidated Statement of Changes in Equity for the year ended 31 March 2018 and a summary of the significant accounting policies and other explanatory information (together hereinafter referred to as 'Consolidated Financial Statements' or 'financial statements').
II. Basis of preparation and presentation The Consolidated Financial Statements have been
prepared on the historical cost basis except for certain financial instruments measured at fair values at the end of each reporting period, as explained in the accounting policies below.
Fair value is the price that would be received to sell an asset or paid to transfer a liability in an orderly transaction between market participants at the measurement date, regardless of whether that price is directly observable or estimated using another valuation technique. In estimating the fair value of an asset or a liability, the group takes in to account the characteristics of the
asset or liability if market participants would take those characteristics into account when pricing the asset or liability at the measurement date. Fair value for measurement and/or disclosure purposes in these consolidated financial statements is determined on such a basis, except for share-based payment transactions that are within the scope of Ind AS 102, leasing transactions that are within the scope of Ind AS 17, and measurements that have some similarities to fair value but are not fair value, such as net realisable value in Ind AS 2 or value in use in Ind AS 36.
In addition, for financial reporting purposes, fair value measurements are categorised into Level 1, 2 or 3 based on the degree to which the inputs to the fair value measurements are observable and the significance of the inputs to the fair value measurements in its entirety, which are described as follows:
Level 1 inputs are quoted prices (unadjusted) in active markets for identical assets or liabilities that the entity can access at the measurement date;
Level 2 inputs are inputs, that are quoted prices included within level 1, that are observable for the asset or liability, either directly or indirectly; and
Level 3 inputs are unobservable inputs for the asset or liability.
The Financial Statement is presented in INR and all values are rounded to the nearest crores except when otherwise stated.
Current and non-current classification
The Group presents assets and liabilities in the balance sheet based on current / non-current classification.
An asset is classified as current when it satisfies any of the following criteria:
it is expected to be realised in, or is intended for sale or consumption in, the Group’s normal operating cycle. it is held primarily for the purpose of being traded;
it is expected to be realised within 12 months after the reporting date; or
it is cash or cash equivalent unless it is restricted from being exchanged or used to settle a liability for at least 12 months after the reporting date.
All other assets are classified as non-current.
A liability is classified as current when it satisfies any of the following criteria
it is expected to be settled in the Company’s normal operating cycle;

312
Notes to the Consolidated Financial Statements as at and for the year ended 31 March 2018
JSW Steel Limited | Integrated Report 2017-18
it is held primarily for the purpose of being traded;
it is due to be settled within 12 months after the reporting date; or the Group does not have an unconditional right to defer settlement of the liability for at least 12 months after the reporting date. Terms of a liability that could, at the option of the counterparty, result in its settlement by the issue of equity instruments do not affect its classification.
All other liabilities are classified as non-current.
Deferred tax assets and liabilities are classified as non-current only.
III. Basis of consolidation The Consolidated Financial Statements incorporate
the financial statements of the Company and entities (including special purpose entities) controlled by the Company and its subsidiaries. Control is achieved where the Company:
has power over the investee;
is exposed to, or has rights, to variable returns from its involvement with the investee; and
has the ability to use its power to affect its returns
The Company reassess whether or not it controls an investee if facts and circumstances indicate that there are changes to one or more of the three elements of control listed above.
When the Company has less than majority of the voting rights of an investee, it has power over the investee when the voting rights are sufficient to give it the practical ability to direct the relevant activities of the investee unilaterally. The Company considers all relevant facts and circumstances in assessing whether or not the Company’s voting rights in an investee are sufficient to give it power, including:
the size of the Company’s holding of voting rights relative to the size and dispersion of holdings of the other vote holders;
potential voting rights held by the Company, other vote holders or other parties;
rights arising from other contractual arrangements; and
any additional facts and circumstances that indicate that the Company has, or does not have, the current ability to direct the relevant activities at the time that decisions need to be made, including voting patterns at previous shareholders’ meetings.
Consolidation of a subsidiary begins when the Company obtains control over the subsidiary and ceases when the Company loses control of the subsidiary.
Specifically, income and expenses of a subsidiary acquired or disposed of during the year are included in the consolidated statement of profit or loss and other comprehensive income from the date the Company gains control until the date when the Company ceases to control the subsidiary.
Profit or loss and each component of other comprehensive income are attributed to the owners of the Company and to the non-controlling interests. Total comprehensive income of subsidiaries is attributed to the owners of the Company and to the non-controlling interests even if this results in the non-controlling interests having a deficit balance.
When necessary, adjustments are made to the financial statements of subsidiaries to bring their accounting policies in line with the Group’s accounting policies.
All intragroup assets and liabilities, equity, income, expenses and cash flows relating to transactions between members of the Group are eliminated in full on consolidation.
IV. Business combinations Acquisitions of businesses are accounted for using the
acquisition method. The consideration transferred in a business combination is measured at fair value, which is calculated as the sum of the acquisition-date fair values of the assets transferred by the Group, liabilities incurred by the Group to the former owners of the acquiree and the equity interests issued by the Group in exchange for control of the acquiree. Acquisition-related costs are generally recognised in Statement of Profit and Loss as incurred.
At the acquisition date, the identifiable assets acquired and the liabilities assumed are recognised at their fair value at the acquisition date, except that:
deferred tax assets or liabilities and liabilities or assets related to employee benefit arrangements are recognised and measured in accordance with Ind AS 12 Income Taxes and Ind AS 19 Employee Benefits respectively;
liabilities or equity instruments related to share-based payment arrangements of the acquiree or share-based payment arrangements of the Group entered into to replace share-based payment arrangements of the acquiree are measured in accordance with Ind AS 102 Share-based Payments at the acquisition date; and
assets (or disposal groups) that are classified as held for sale in accordance with Ind AS 105 Non-current Assets Held for Sale and Discontinued Operations are measured in accordance with that Standard.

313
Notes to the Consolidated Financial Statements as at and for the year ended 31 March 2018
Better Everyday. In Pursuit of Excellence. Corporate Overview Statutory Reports Financial Statements
Goodwill is measured as the excess of the sum of the consideration transferred, the amount of any non-controlling interests in the acquiree, and the fair value of the acquirer's previously held equity interest in the acquiree (if any) over the net of the acquisition-date amounts of the identifiable assets acquired and the liabilities assumed.
In case of bargain purchase, before recognising gain in respect thereof, the Group determines whether there exists clear evidence of the underlying reasons for classifying the business combination as a bargain purchase. Thereafter, the group reassesses whether it has correctly identified all of the assets acquired and all of the liabilities assumed and recognises any additional assets or liabilities that are identified in that reassessment. The Group then reviews the procedures used to measure the amounts that Ind AS requires for the purposes of calculating the bargain purchase. If the gain remains after this reassessment and review, the Group recognises it in other comprehensive income and accumulates the same in equity as capital reserve. This gain is attributed to the acquirer. If there does not exist clear evidence of the underlying reasons for classifying the business combination as a bargain purchase, the Group recognises the gain, after reassessing and reviewing, directly in equity as capital reserve.
Non-controlling interests that are present ownership interests and entitle their holders to a proportionate share of the entity's net assets in the event of liquidation may be initially measured either at fair value or at the non-controlling interests' proportionate share of the recognised amounts of the acquiree's identifiable net assets. The choice of measurement basis is made on a transaction-by-transaction basis. Other types of non-controlling interests are measured at fair value or, when applicable, on the basis specified in another Ind AS.
When a business combination is achieved in stages, the Group's previously held equity interest in the acquiree is remeasured to fair value at the acquisition date (i.e. the date when the Group obtains control) and the resulting gain or loss, if any, is recognised in the Consolidated Statement of Profit and Loss.
Business combinations involving entities or businesses under common control shall be accounted for using the pooling of interest method.
V. Goodwill Goodwill arising on an acquisition of a business is carried
at cost as established at the date of acquisition of the business less accumulated impairment losses, if any.
For the purposes of impairment testing, goodwill is allocated to each of the Group's cash-generating units
(or groups of cash-generating units) that is expected to benefit from the synergies of the combination.
A cash-generating unit to which goodwill has been allocated is tested for impairment annually, or more frequently when there is indication that the unit may be impaired. If the recoverable amount of the cash-generating unit is less than its carrying amount, the impairment loss is allocated first to reduce the carrying amount of any goodwill allocated to the unit and then to the other assets of the unit pro rata based on the carrying amount of each asset in the unit. Any impairment loss for goodwill is recognised directly in the consolidated Statement of Profit and Loss. An impairment loss recognised for goodwill is not reversed in subsequent periods.
On disposal of the relevant cash-generating unit, the attributable amount of goodwill is included in the determination of the profit or loss on disposal.
The Group’s policy for goodwill arising on the acquisition of an associate and a joint venture is described at note 2(VI) below.
VI. Investment in associates and joint ventures An associate is an entity over which the Group has
significant influence. Significant influence is the power to participate in the financial and operating policy decisions of the investee but is not control or joint control over those policies.
A joint venture is a joint arrangement whereby the parties that have joint control of the arrangement have rights to the net assets of the joint arrangement. Joint control is the contractually agreed sharing of control of an arrangement, which exists only when decisions about the relevant activities require unanimous consent of the parties sharing control.
The results and assets and liabilities of associates or joint ventures are incorporated in these consolidated financial statements using the equity method of accounting, except when the investment, or a portion thereof, is classified as held for sale, in which case it is accounted for in accordance with Ind AS 105 – Non-current Assets Held for Sale and Discontinued Operations. Under the equity method, an investment in an associate or a joint venture is initially recognised in the consolidated statement of financial position at cost and adjusted thereafter to recognise the Group’s share of the profit or loss and other comprehensive income of the associate or joint venture. When the Group’s share of losses of an associate or a joint venture exceeds the Group’s interest in that associate or joint venture (which includes any long-term interests that, in substance, form part of the Group’s net investment in the associate

314
Notes to the Consolidated Financial Statements as at and for the year ended 31 March 2018
JSW Steel Limited | Integrated Report 2017-18
or joint venture), the Group discontinues recognising its share of further losses. Additional losses are recognised only to the extent that the Group has incurred legal or constructive obligations or made payments on behalf of the associate or joint venture.
An investment in an associate or a joint venture is accounted for using the equity method from the date on which the investee becomes an associate or a joint venture. On acquisition of the investment in an associate or a joint venture, any excess of the cost of the investment over the Group’s share of the net fair value of the identifiable assets and liabilities of the investee is recognised as goodwill, which is included within the carrying amount of the investment. Any excess of the Group’s share of the net fair value of the identifiable assets and liabilities over the cost of the investment, after reassessment, is recognised immediately in profit or loss in the period in which the investment is acquired.
After application of the equity method of accounting, the Group determines whether there is any objective evidence of impairment as a result of one or more events that occurred after the initial recognition of the net investment in an associate or a joint venture and that event (or events) has an impact on the estimated future cash flows from the net investment that can be reliably estimated. If there exists such an objective evidence of impairment, then it is necessary to recognise impairment loss with respect to the Group’s investment in an associate or a joint venture.
The Group discontinues the use of the equity method from the date when the investment ceases to be an associate or a joint venture, or when the investment is classified as held for sale.
When a group entity transacts with an associate or a joint venture of the Group, profits and losses resulting from the transactions with the associate or joint venture are recognised in the Group’s consolidated financial statements only to the extent of interests in the associate or joint venture that are not related to the Group.
VII. Revenue recognition Sale of goods
Revenue is measured at the fair value of the consideration received or receivable. The Group recognises revenues on sale of products, net of discounts, sales incentives, rebates granted, returns, sales taxes/GST and duties when the products are delivered to customer or when delivered to a carrier for export sale, which is when significant risks and rewards of ownership pass to the customer. Sale of products is presented gross of manufacturing taxes like excise duty
wherever applicable. Export incentives are recognised as income as per the terms of the scheme in respect of the exports made and included as part of turnover.
Revenue from sale of by-products are included in revenue.
Revenue from sale of power is recognised when delivered and measured based on the bilateral contractual arrangements.
Construction contracts
When the outcome of a construction contract can be estimated reliably, revenue and costs are recognised by reference to the stage of completion of the contract activity at the end of the reporting period, measured based on the proportion of contract costs incurred for work performed to date relative to the estimated total contract costs, except where this would not be representative of the stage of completion. Variations in contract work, claims and incentives payments are included to the extent that the amount can be measured reliably and its receipt is considered probable.
When the outcome of a construction contract cannot be estimated reliably, contract revenue is recognised to the extent of contract cost incurred that it is probable will be recoverable. Contract costs are recognised as an expense in the period in which they are incurred.
When it is probable that total contract costs will exceed total contract revenue, the expected loss is recognised as an expense immediately.
Dividend and interest income
Dividend income from investments is recognised when the shareholder’s right to receive payment has been established (provided that it is probable that the economic benefits will flow to the Group and the amount of income can be measured reliably).
Interest income from a financial asset is recognised when it is probable that the economic benefits will flow to the Group and the amount of income can be measured reliably. Interest income is accrued on a time basis, by reference to the principal outstanding and at the effective interest rate applicable, which is the rate that exactly discounts estimated future cash receipts through the expected life of the financial asset to that asset’s net carrying amount on initial recognition.
VIII. Leases Leases are classified as finance leases whenever the
terms of the lease transfer substantially all the risks and rewards of ownership to the lessee. All other leases are classified as operating leases.

315
Notes to the Consolidated Financial Statements as at and for the year ended 31 March 2018
Better Everyday. In Pursuit of Excellence. Corporate Overview Statutory Reports Financial Statements
The Group as a lessor
Leases are classified as finance leases when substantially all of the risks and rewards of ownership transfer from the Group to the lessee. Amounts due from lessees under finance leases are recorded as receivables at the Group’s net investment in the leases. Finance lease income is allocated to accounting periods so as to reflect a constant periodic rate of return on the net investment outstanding in respect of the lease.
Rental income from operating leases is recognised on straight-line basis over the term of the relevant lease. Initial direct cost incurred in negotiating and arranging an operating lease are added to the carrying amount of the leased asset and recognised on straight-line basis over the lease term.
The Group as a lessee
Assets held under finance leases are initially recognised as assets of the Group at their fair value at the inception of the lease or, if lower, at the present value of the minimum lease payments. The corresponding liability to the lessor is included in the consolidated balance sheet as a finance lease obligation.
Lease payments are apportioned between finance expenses and reduction of the lease obligation so as to achieve a constant rate of interest on the remaining balance of the liability. Finance expenses are recognised immediately in Consolidated Statement of Profit and Loss, unless they are directly attributable to qualifying assets, in which case they are capitalised in accordance with the Group's general policy on borrowing costs. Contingent rentals are recognised as expenses in the periods in which they are incurred.
Lease payments under an operating lease shall be recognised as an expense on a straight-line basis over the term of the relevant lease. Where the rentals are structured solely to increase in line with expected general inflation to compensate for the lessor’s expected inflationary cost increases, such increases are recognised in the year in which such benefits accrue. Contingent rentals arising under operating leases are recognised as an expense in the period in which they are incurred.
Arrangements in the nature of lease
The Group enters into agreements, comprising a transaction or series of related transactions that does not take the legal form of a lease but conveys the right to use the asset in return for a payment or series of payments. In case of such arrangements, the Group applies the requirements of Ind AS 17 – Leases to the lease element of the arrangement. For the purpose of applying the requirements under Ind AS 17 – Leases, payments and other consideration required by the
arrangement are separated at the inception of the arrangement into those for lease and those for other elements.
IX. Foreign currencies The functional currency of the Company and its
subsidiaries is determined on the basis of the primary economic environment in which it operates. The functional currency of the Company is Indian National Rupee (INR).
In preparing the financial statements of each individual group entity, transactions in currencies other than the entity's functional currency (foreign currencies) are recognised at the rates of exchange prevailing at the dates of the transactions. At the end of each reporting period, monetary items denominated in foreign currencies are retranslated at the rates prevailing at that date. Non-monetary items carried at fair value that are denominated in foreign currencies are retranslated at the rates prevailing at the date when the fair value was determined. Non-monetary items that are measured in terms of historical cost in a foreign currency are not retranslated.
Exchange differences on monetary items are recognised in Statement of Profit and Loss in the period in which they arise except for:
exchange differences on foreign currency borrowings relating to assets under construction for future productive use, which are included in the cost of those assets when they are regarded as an adjustment to interest costs on those foreign currency borrowings;
exchange differences on transactions entered into in order to hedge certain foreign currency risks (see below the policy on hedge accounting in 2 (XX) (B) (g));
exchange differences on monetary items receivable from or payable to a foreign operation for which settlement is neither planned nor likely to occur (therefore forming part of the net investment in the foreign operation), which are recognised initially in other comprehensive income and reclassified from equity to Statement of Profit and Loss on repayment of the monetary items; and
exchange difference arising on settlement / restatement of long-term foreign currency monetary items recognised in the financial statements for the year ended 31 March 2016 prepared under previous GAAP, are capitalised as a part of the depreciable fixed assets to which the monetary item relates and depreciated over the remaining useful life of such assets. If such monetary items do not relate to acquisition of depreciable fixed assets, the

316
Notes to the Consolidated Financial Statements as at and for the year ended 31 March 2018
JSW Steel Limited | Integrated Report 2017-18
exchange difference is amortised over the maturity period / upto the date of settlement of such monetary item, whichever is earlier and charged to the Statement of Profit and Loss. The un-amortised exchange difference is carried under other equity as 'Foreign currency monetary item translation difference account' net of tax effect thereon, where applicable.
For the purposes of presenting these consolidated financial statements, the assets and liabilities of the Group’s foreign operations are translated into INR using exchange rates prevailing at the end of each reporting period. Income and expense items are translated at the average exchange rates for the period, unless exchange rates fluctuate significantly during that period, in which case the exchange rates at the dates of the transactions are used. Exchange differences arising, if any, are recognised in other comprehensive income and accumulated in equity (and attributed to non-controlling interests as appropriate).
Goodwill, capital reserve on bargain purchase and fair value adjustments to identifiable assets acquired and liabilities assumed through acquisition of a foreign operation are treated as assets and liabilities of the foreign operation and translated at the rate of exchange prevailing at the end of each reporting period. Exchange differences arising are recognised in other comprehensive income.
X. Borrowing costs Borrowing costs directly attributable to the acquisition,
construction or production of qualifying assets, which are assets that necessarily take a substantial period of time to get ready for their intended use, are added to the cost of those assets, until such time as the assets are substantially ready for their intended use.
All other borrowing costs are recognised in the Consolidated Statement of Profit and Loss in the period in which they are incurred.
The Group determines the amount of borrowing costs eligible for capitalisation as the actual borrowing costs incurred on that borrowing during the period less any interest income earned on temporary investment of specific borrowings pending their expenditure on qualifying assets, to the extent that an entity borrows funds specifically for the purpose of obtaining a qualifying asset. In case if the Company borrows generally and uses the funds for obtaining a qualifying asset, borrowing costs eligible for capitalisation are determined by applying a capitalisation rate to the expenditures on that asset.
Borrowing Cost includes exchange differences arising from foreign currency borrowings to the extent they are regarded as an adjustment to the finance cost.
XI. Government grants Government grants are not recognised until there is
reasonable assurance that the Group will comply with the conditions attached to them and that the grants will be received.
Government grants are recognised in the Consolidated Statement of Profit and Loss on a systematic basis over the periods in which the Group recognises as expenses the related costs for which the grants are intended to compensate or when performance obligations are met.
Government grants relating to tangible fixed assets are treated as deferred income and released to the Consolidated Statement of profit and loss over the expected useful lives of the assets concerned.
The benefit of a government loan at a below-market rate of interest and effect of this favourable interest is treated as a government grant. The Loan or assistance is initially recognised at fair value and the government grant is measured as the difference between proceeds received and the fair value of the loan based on prevailing market interest rates and recognised to the income statement immediately on fulfilment of the performance obligations. The loan is subsequently measured as per the accounting policy applicable to financial liabilities.
XII. Employee benefits Retirement benefit costs and termination benefits
Payments to defined contribution retirement benefit plans are recognised as an expense when employees have rendered service entitling them to the contributions.
For defined benefit retirement benefit plans, the cost of providing benefits is determined using the projected unit credit method, with actuarial valuations being carried out at the end of each annual reporting period. Remeasurement, comprising actuarial gains and losses, the effect of the changes to the asset ceiling (if applicable) and the return on plan assets (excluding interest), is reflected immediately in the statement of financial position with a charge or credit recognised in other comprehensive income in the period in which they occur. Remeasurement recognised in other comprehensive income is reflected immediately in retained earnings and will not be reclassified to profit or loss. Past service cost is recognised in profit or loss in the period of a plan amendment or when the Company

317
Notes to the Consolidated Financial Statements as at and for the year ended 31 March 2018
Better Everyday. In Pursuit of Excellence. Corporate Overview Statutory Reports Financial Statements
recognises corresponding restructuring cost whichever is earlier. Net interest is calculated by applying the discount rate to the net defined benefit liability or asset. Defined benefit costs are categorised as follows:
1. service cost (including current service cost, past service cost, as well as gains and losses on curtailments and settlements);
2. net interest expense or income; and
3. remeasurement.
The Group presents the first two components of defined benefit costs in profit or loss in the line item ‘Employee benefits expenses’. Curtailment gains and losses are accounted for as past service costs.
The retirement benefit obligation recognised in the consolidated statement of financial position represents the actual deficit or surplus in the Group’s defined benefit plans. Any surplus resulting from this calculation is limited to the present value of any economic benefits available in the form of refunds from the plans or reductions in future contributions to the plans.
A liability for a termination benefit is recognised at the earlier of when the entity can no longer withdraw the offer of the termination benefit and when the entity recognises any related restructuring costs.
Short-term and other long-term employee benefits
A liability is recognised for benefits accruing to employees in respect of wages and salaries, annual leave and sick leave in the period the related service is rendered at the undiscounted amount of the benefits expected to be paid in exchange for that service.
Liabilities recognised in respect of short-term employee benefits are measured at the undiscounted amount of the benefits expected to be paid in exchange for the related service.
Liabilities recognised in respect of other long-term employee benefits are measured at the present value of the estimated future cash outflows expected to be made by the Group in respect of services provided by employees up to the reporting date.
XIII. Share-based payment arrangements Equity-settled share-based payments to employees
and others providing similar services are measured at the fair value of the equity instruments at the grant date. Details regarding the determination of the fair value of equity-settled share-based transactions are set out in note 38.
The fair value determined at the grant date of the equity-settled share-based payments is expensed on a straight-line basis over the vesting period, based on the Group’s estimate of equity instruments that will eventually vest, with a corresponding increase in equity. At the end of each reporting period, the Group revises its estimate of the number of equity instruments expected to vest. The impact of the revision of the original estimates, if any, is recognised in profit or loss such that the cumulative expense reflects the revised estimate, with a corresponding adjustment to the equity-settled employee benefits reserve.
The Company has created an Employee Benefit Trust for providing share-based payment to its employees. The Company uses the Trust as a vehicle for distributing shares to employees under the employee remuneration schemes. The Trust buys shares of the Company from the market, for giving shares to employees. The Company treats Trust as its extension and shared held by the Trust are treated as treasury shares.
Own equity instruments that are reacquired (treasury shares) are recognised at cost and deducted from Equity. No gain or loss is recognised in profit or loss on the purchase, sale, issue or cancellation of the Company’s own equity instruments. Share options exercised during the reporting period are satisfied with treasury shares.
XIV. Taxes Income tax expense represents the sum of the tax
currently payable and deferred tax.
Current tax
Current tax is the amount of expected tax payable based on the taxable profit for the period as determined in accordance with the applicable tax rates and the provisions of the Income Tax Act, 1961 and other applicable tax laws in the countries where the Group operates and generates taxable income.
Deferred tax
Deferred tax is recognised on temporary differences between the carrying amounts of assets and liabilities in the consolidated financial statements and the corresponding tax bases used in the computation of taxable profit. Deferred tax liabilities are recognised for all taxable temporary differences. Deferred tax assets are recognised for all deductible temporary differences to the extent that it is probable that taxable profits will be available against which those deductible temporary differences can be utilised. Such deferred tax assets and liabilities are not recognised if the temporary

318
Notes to the Consolidated Financial Statements as at and for the year ended 31 March 2018
JSW Steel Limited | Integrated Report 2017-18
difference arises from the initial recognition (other than in a business combination) of assets and liabilities in a transaction that affects neither the taxable profit nor the accounting profit. In addition, deferred tax liabilities are not recognised if the temporary difference arises from the initial recognition of goodwill.
Deferred tax liabilities are recognised for taxable temporary differences associated with investments in subsidiaries and associates, and interests in joint ventures, except where the Group is able to control the reversal of the temporary difference and it is probable that the temporary difference will not reverse in the foreseeable future. Deferred tax assets arising from deductible temporary differences associated with such investments and interests are only recognised to the extent that it is probable that there will be sufficient taxable profits against which to utilise the benefits of the temporary differences and they are expected to reverse in the foreseeable future.
The carrying amount of deferred tax assets is reviewed at the end of each reporting period and reduced to the extent that it is no longer probable that sufficient taxable profits will be available to allow all or part of the asset to be recovered.
Minimum Alternate Tax (MAT) paid in accordance with the tax laws, which gives future economic benefits in the form of adjustment to future income tax liability, is considered as an deferred tax asset if there is convincing evidence that the Group will pay normal income tax. Accordingly, MAT is recognised as an asset in the Balance Sheet when it is probable that future economic benefit associated with it will flow to the Group.
Deferred tax assets and liabilities are measured at the tax rates that are expected to apply in the period in which the liability is settled or the asset realised, based on tax rates (and tax laws) that have been enacted or substantively enacted by the end of the reporting period.
Deferred tax assets and deferred tax liabilities are offset if a legally enforceable right exists to set off current tax assets against current tax liabilities and the deferred taxes relate to the same taxable entity and the same taxation authority.
Current and deferred tax for the year
Current and deferred tax are recognised in profit or loss, except when they are relate to items that are recognised in other comprehensive income or directly in equity, in which case, the current and deferred tax
are also recognised in other comprehensive income or directly in equity respectively. Where current tax or deferred tax arises from the initial accounting for a business combination, the tax effect is included in the accounting for the business combination.
Deferred tax assets and liabilities are offset when they relate to income taxes levied by the same taxation authority and the relevant entity intends to settle its current tax assets and liabilities on a net basis.
XV. Property, plant and equipment The cost of property, plant and equipment comprises its
purchase price net of any trade discounts and rebates, any import duties and other taxes (other than those subsequently recoverable from the tax authorities), any directly attributable expenditure on making the asset ready for its intended use, including relevant borrowing costs for qualifying assets and any expected costs of decommissioning. Expenditure incurred after the property, plant and equipment have been put into operation, such as repairs and maintenance, are charged to the Statement of Profit and Loss in the period in which the costs are incurred. Major shut-down and overhaul expenditure is capitalised as the activities undertaken improves the economic benefits expected to arise from the asset.
An item of property, plant and equipment is derecognised upon disposal or when no future economic benefits are expected to arise from the continued use of the asset. Any gain or loss arising on the disposal or retirement of an item of property, plant and equipment is determined as the difference between the sales proceeds and the carrying amount of the asset and is recognised in Statement of Profit and Loss.
Assets in the course of construction are capitalised in the assets under construction account. At the point when an asset is operating at management’s intended use, the cost of construction is transferred to the appropriate category of property, plant and equipment and depreciation commences. Costs associated with the commissioning of an asset and any obligatory decommissioning costs are capitalised where the asset is available for use but incapable of operating at normal levels until a period of commissioning has been completed. Revenue generated from production during the trial period is capitalised.
Property, plant and equipment except freehold land held for use in the production, supply or administrative purposes, are stated in the consolidated balance sheet at cost less accumulated depreciation and accumulated impairment losses, if any.

319
Notes to the Consolidated Financial Statements as at and for the year ended 31 March 2018
Better Everyday. In Pursuit of Excellence. Corporate Overview Statutory Reports Financial Statements
The Group has elected to continue with the carrying value for all of its property, plant and equipment as recognised in the financial statements on transition to Ind AS measured as per the previous GAAP and use that as its deemed cost as at the date of transition.
Depreciation commences when the assets are ready for their intended use. Depreciable amount for assets is the cost of an asset, or other amount substituted for cost, less its estimated residual value. Depreciation is recognised so as to write off the cost of assets (other than freehold land and properties under construction) less their residual values over their useful lives, using straight-line method as per the useful life prescribed in Schedule II to the Companies Act, 2013 except in respect of following categories of assets located in India, in whose case the life of the assets has been assessed as under based on technical advice, taking into account the nature of the asset, the estimated usage of the asset, the operating conditions of the asset, past history of replacement, anticipated technological changes, manufacturers warranties and maintenance support, etc.
Class of assets Years
Plant and machinery 8 to 40 years
Work-rolls 1 to 5 years
When significant parts of plant and equipment are required to be replaced at intervals, the Group depreciates them separately based on estimate of their specific useful lives.
Freehold land and leasehold land where the lease is convertible to freehold land under lease agreements at future dates at no additional cost, are not depreciated.
Assets held under finance leases are depreciated over their expected useful lives on the same basis as owned assets. However, when there is no reasonable certainty that ownership will be obtained by the end of the lease term, assets are depreciated over the shorter of the lease term and their useful lives.
Major overhaul costs are depreciated over the estimated life of the economic benefit derived from the overhaul. The carrying amount of the remaining previous overhaul cost is charged to the Statement of Profit and Loss if the next overhaul is undertaken earlier than the previously estimated life of the economic benefit.
The Group reviews the residual value, useful lives and depreciation method annually and, if expectations differ from previous estimates, the change is accounted for as a change in accounting estimate on a prospective basis.
Depreciation on the property, plant and equipment of the Company's foreign subsidiaries and jointly controlled entities has been provided on straight-line method as per the estimated useful life of such assets as follows:
Class of assets Years
Buildings 15 to 50 years
Plant and machinery 3 to 30 years
Furniture and fixtures 3 to 10 years
Vehicles and aircrafts 4 to 5 years
Office equipment 3 to 10 years
XVI. Intangible assets Intangible assets with finite useful lives that are
acquired separately are carried at cost less accumulated amortisation and accumulated impairment losses. Amortisation is recognised on a straight-line basis over their estimated useful lives. The estimated useful life and amortisation method are reviewed at the end of each reporting period, with the effect of any changes in estimate being accounted for on a prospective basis. Intangible assets with indefinite useful lives that are acquired separately are carried at cost less accumulated impairment losses.
Useful lives of intangible assets
Estimated useful lives of the intangible assets are as follows:
Class of assets Years
Computer software 3 to 5 years
Licenses Over the period of license
The Group has elected to continue with carrying value of all its intangible assets recognised as on transition date measured as per the previous GAAP and use that carrying value as its deemed cost as of transition date.
XVII. Mining Assets Exploration and evaluation
Exploration and evaluation expenditure incurred after obtaining the mining right or the legal right to explore are capitalised as exploration and evaluation assets (intangible assets) and stated at cost less impairment. Exploration and evaluation assets are assessed for impairment indicators at least annually.
The Company measures its exploration and evaluation assets at cost and classifies as Property, plant and equipment or intangible assets according to the nature of the assets acquired and applies the classification consistently. To the extent that tangible asset is consumed in developing an intangible asset, the amount reflecting that consumption is capitalised as a part of the cost of the intangible asset.

320
Notes to the Consolidated Financial Statements as at and for the year ended 31 March 2018
JSW Steel Limited | Integrated Report 2017-18
Exploration expenditure includes all direct and allocated indirect expenditure associated with finding specific mineral resources which includes depreciation and applicable operating costs of related support equipment and facilities and other costs of exploration activities:
Acquisition costs – costs associated with acquisition of licenses and rights to explore, including related professional fees. General exploration costs - costs of surveys and studies, rights of access to properties to conduct those studies (e.g. costs incurred for environment clearance, defense clearance, etc.), and salaries and other expenses of geologists, geophysical crews and other personnel conducting those studies.
Costs of exploration drilling and equipping exploration – Expenditure incurred on the acquisition of a license interest is initially capitalised on a license-by-license basis. Costs are held, undepleted, within exploration and evaluation assets until such time as the exploration phase on the license area is complete or commercial reserves have been discovered.
Stripping cost
Developmental stripping costs in order to obtain access to quantities of mineral reserves that will be mined in future periods are capitalised as part of mining assets. Capitalisation of developmental stripping costs ends when the commercial production of the mineral reserves begins.
Production stripping costs are incurred to extract the ore in the form of inventories and/or to improve access to an additional component of an ore body or deeper levels of material. Production stripping costs are accounted for as inventories to the extent the benefit from production stripping activity is realised in the form of inventories.
Such costs are presented within mining assets. After initial recognition, stripping activity assets are carried at cost less accumulated amortisation and impairment. The expected useful life of the identified component of the ore body is used to depreciate or amortise the stripping asset.
Site restoration, rehabilitation and environmental costs:
Provision is made for costs associated with restoration and rehabilitation of mining sites as soon as the obligation to incur such costs arises. Such restoration and closure costs are typical of extractive industries and they are normally incurred at the end of the life of the mine. The costs are estimated on the basis of mine closure plans and the estimated discounted costs of dismantling and removing these facilities and the costs of restoration are capitalised The
provision for decommissioning assets is based on the current estimates of the costs for removing and decommissioning production facilities, the forecast timing of settlement of decommissioning liabilities and the appropriate discount rate. A corresponding provision is created on the liability side. The capitalised asset is charged to profit or loss over the life of the asset through depreciation over the life of the operation and the provision is increased each period via unwinding the discount on the provision. Management estimates are based on local legislation and/or other agreements. The actual costs and cash outflows may differ from estimates because of changes in laws and regulations, changes in prices, analysis of site conditions and changes in restoration technology. Details of such provisions are set out in note 22.
XVIII. Impairment of Property, plant and equipment and intangible assets other than goodwill
At the end of each reporting period, the Group reviews the carrying amounts of its tangible and intangible assets to determine whether there is any indication that those assets have suffered an impairment loss. If any such indication exists, the recoverable amount of the asset is estimated in order to determine the extent of the impairment loss (if any). Where it is not possible to estimate the recoverable amount of an individual asset, the Group estimates the recoverable amount of the cash-generating unit to which the asset belongs. Where a reasonable and consistent basis of allocation can be identified, corporate assets are also allocated to individual cash-generating units, or otherwise they are allocated to the smallest group of cash-generating units for which a reasonable and consistent allocation basis can be identified.
Intangible assets with indefinite useful lives and intangible assets not yet available for use are tested for impairment at least annually, and whenever there is an indication that the asset may be impaired.
Recoverable amount is the higher of fair value less costs to sell and value in use. In assessing value in use, the estimated future cash flows are discounted to their present value using a pre-tax discount rate that reflects current market assessments of the time value of money and the risks specific to the asset for which the estimates of future cash flows have not been adjusted.
If the recoverable amount of an asset (or cash-generating unit) is estimated to be less than its carrying amount, the carrying amount of the asset (or cash-generating unit) is reduced to its recoverable amount. An impairment loss is recognised immediately in the Consolidated Statement of Profit and Loss, unless the

321
Notes to the Consolidated Financial Statements as at and for the year ended 31 March 2018
Better Everyday. In Pursuit of Excellence. Corporate Overview Statutory Reports Financial Statements
relevant asset is carried at a revalued amount, in which case the impairment loss is treated as a revaluation decrease to the extent of revaluation reserve.
Any reversal of the previously recognised impairment loss is limited to the extent that the asset’s carrying amount does not exceed the carrying amount that would have been determined if no impairment loss had previously been recognised.
XIX. Inventories Inventories are stated at the lower of cost and net
realisable value.
Cost of raw materials include cost of purchase and other costs incurred in bringing the inventories to their present location and condition. Cost of finished goods and work-in-progress include cost of direct materials and labour and a proportion of manufacturing overheads based on the normal operating capacity but excluding borrowing costs.
Costs of inventories are determined on weighted average basis. Net realisable value represents the estimated selling price for inventories less all estimated costs of completion and costs necessary to make the sale.
XX. Provisions Provisions are recognised when the Group has a present
obligation (legal or constructive), as a result of past events, and it is probable that an outflow of resources, that can be reliably estimated, will be required to settle such an obligation.
The amount recognised as a provision is the best estimate of the consideration required to settle the present obligation at the balance sheet date, taking into account the risks and uncertainties surrounding the obligation. When a provision is measured using the cash flows estimated to settle the present obligation, its carrying amount is the present value of those cash flows (when the effect of the time value of money is material).
When some or all of the economic benefits required to settle a provision are expected to be recovered from a third party, a receivable is recognised as an asset if it is virtually certain that reimbursement will be received and the amount of the receivable can be measured reliably.
Onerous contracts
Present obligations arising under onerous contracts are recognised and measured as provisions. An onerous contract is considered to exist where the Group has a contract under which the unavoidable costs of meeting
the obligations under the contract exceed the economic benefits expected to be received from the contract.
XXI. Financial Instruments Financial assets and financial liabilities are recognised
when a Group entity becomes a party to the contractual provisions of the instrument.
Financial assets and financial liabilities are initially measured at fair value. Transaction costs that are directly attributable to the acquisition or issue of financial assets and financial liabilities (other than financial assets and financial liabilities at fair value through Statement of Profit and Loss (FVTPL)) are added to or deducted from the fair value of the financial assets or financial liabilities, as appropriate, on initial recognition. Transaction costs directly attributable to the acquisition of financial assets or financial liabilities at fair value through profit and loss are recognised immediately in Consolidated Statement of Profit and Loss.
A. Financial assets
a) Recognition and initial measurement
A financial asset is initially recognised at fair value and, for an item not at FVTPL, transaction costs that are directly attributable to its acquisition or issue. Purchases and sales of financial assets are recognised on the trade date, which is the date on which the Group becomes a party to the contractual provisions of the instrument.
b) Classification of financial assets
On initial recognition, a financial asset is classified to be measured at amortised cost, fair value through other comprehensive income (FVTOCI) or FVTPL.
A financial asset is measured at amortised cost if it meets both of the following conditions and is not designated at FVTPL:
The asset is held within a business model whose objective is to hold assets to collect contractual cash flows; and
The contractual terms of the financial asset give rise on specified dates to cash flows that are solely payments of principal and interest on the principal amount outstanding.
A debt instrument is classified as FVTOCI only if it meets both the of the following conditions and is not recognised at FVTPL:
The asset is held within a business model whose objective is achieved by both collecting contractual cash flows and selling financial assets; and

322
Notes to the Consolidated Financial Statements as at and for the year ended 31 March 2018
JSW Steel Limited | Integrated Report 2017-18
The contractual terms of the financial asset give rise on specified dates to cash flows that are solely payments of principal and interest on the principal amount outstanding.
Debt instruments included within the FVTOCI category are measured initially as well as at each reporting date at fair value. Fair value movements are recognised in the Other Comprehensive Income (OCI). However, the Group recognises interest income, impairment losses & reversals and foreign exchange gain or loss in the Consolidated Statement of Profit and Loss. On derecognition of the asset, cumulative gain or loss previously recognised in OCI is reclassified from the equity to Consolidated Statement of Profit and Loss. Interest earned whilst holding FVTOCI debt instrument is reported as interest income using the EIR method.
All equity investments in scope of Ind AS 109 are measured at fair value. Equity instruments which are held for trading and contingent consideration recognised by an acquirer in a business combination to which Ind AS 103 applies are classified as at FVTPL. For all other equity instruments, the Group may make an irrevocable election to present in other comprehensive income subsequent changes in the fair value. The Group makes such election on an instrument-by-instrument basis. The classification is made on initial recognition and is irrevocable.
If the Group decides to classify an equity instrument as at FVTOCI, then all fair value changes on the instrument, excluding dividends, are recognised in the OCI. There is no recycling of the amounts from OCI to Consolidated Statement of Profit and Loss, even on sale of investment. However, the Group may transfer the cumulative gain or loss within equity.
Equity instruments included within the FVTPL category are measured at fair value with all changes recognised in the Consolidated Statement of Profit and Loss.
All other financial assets are classified as measured at FVTPL.
In addition, on initial recognition, the Group may irrevocably designate a financial asset that otherwise meets the requirements to be measured at amortised cost or at FVTOCI as at FVTPL if doing so eliminates or significantly reduces and accounting mismatch that would otherwise arise.
Financial assets at FVTPL are measured at fair value at the end of each reporting period, with any gains and losses arising on remeasurement recognised
in consolidated statement of profit or loss. The net gain or loss recognised in consolidated statement of profit or loss incorporates any dividend or interest earned on the financial asset and is included in the ‘other income’ line item. Dividend on financial assets at FVTPL is recognised when:
The Group’s right to receive the dividends is established,
It is probable that the economic benefits associated with the dividends will flow to the entity,
The dividend does not represent a recovery of part of cost of the investment and the amount of dividend can be measured reliably.
c) Derecognition of financial assets
The Group derecognises a financial asset when the contractual rights to the cash flows from the asset expire, or when it transfers the financial asset and substantially all the risks and rewards of ownership of the asset to another party. If the Group neither transfers nor retains substantially all the risks and rewards of ownership and continues to control the transferred asset, the Group recognises its retained interest in the asset and an associated liability for amounts it may have to pay. If the Group retains substantially all the risks and rewards of ownership of a transferred financial asset, the Group continues to recognise the financial asset and also recognises a collateralised borrowing for the proceeds received.
On derecognition of a financial asset in its entirety, the difference between the asset’s carrying amount and the sum of the consideration received and receivable and the cumulative gain or loss that had been recognised in other comprehensive income and accumulated in equity is recognised in profit or loss if such gain or loss would have otherwise been recognised in profit or loss on disposal of that financial asset.
On derecognition of a financial asset other than in its entirety (e.g. when the Group retains an option to repurchase part of a transferred asset), the Group allocates the previous carrying amount of the financial asset between the part it continues to recognise under continuing involvement, and the part it no longer recognises on the basis of the relative fair values of those parts on the date of the transfer. The difference between the carrying amount allocated to the part that is no longer recognised and the sum of the consideration received for the part no longer recognised and any cumulative gain or loss allocated to it that had been recognised in other comprehensive

323
Notes to the Consolidated Financial Statements as at and for the year ended 31 March 2018
Better Everyday. In Pursuit of Excellence. Corporate Overview Statutory Reports Financial Statements
income is recognised in profit or loss if such gain or loss would have otherwise been recognised in profit or loss on disposal of that financial asset. A cumulative gain or loss that had been recognised in other comprehensive income is allocated between the part that continues to be recognised and the part that is no longer recognised on the basis of the relative fair values of those parts.
d) Impairment
The Group applies the expected credit loss model for recognising impairment loss on financial assets measured at amortised cost, debt instruments at FVTOCI, lease receivables, trade receivables, other contractual rights to receive cash or other financial asset, and financial guarantees not designated as at FVTPL.
Expected credit losses are the weighted average of credit losses with the respective risks of default occurring as the weights. Credit loss is the difference between all contractual cash flows that are due to the Group in accordance with the contract and all the cash flows that the Group expects to receive (i.e. all cash shortfalls), discounted at the original effective interest rate (or credit-adjusted effective interest rate for purchased or originated credit-impaired financial assets). The Group estimates cash flows by considering all contractual terms of the financial instrument (for example, prepayment, extension, call and similar options) through the expected life of that financial instrument.
The Group measures the loss allowance for a financial instrument at an amount equal to the lifetime expected credit losses if the credit risk on that financial instrument has increased significantly since initial recognition. If the credit risk on a financial instrument has not increased significantly since initial recognition, the Group measures the loss allowance for that financial instrument at an amount equal to 12-month expected credit losses. 12-month expected credit losses are portion of the life-time expected credit losses and represent the lifetime cash shortfalls that will result if default occurs within the 12 months after the reporting date and thus, are not cash shortfalls that are predicted over the next 12 months.
If the Group measured loss allowance for a financial instrument at lifetime expected credit loss model in the previous period, but determines at the end of a reporting period that the credit risk has not increased significantly since initial recognition due to improvement in credit quality as compared to the previous period, The Group again measures the loss allowance based on 12-month expected credit losses.
When making the assessment of whether there has been a significant increase in credit risk since initial recognition, the Group uses the change in the risk of a default occurring over the expected life of the financial instrument instead of the change in the amount of expected credit losses. To make that assessment, the Group compares the risk of a default occurring on the financial instrument as at the reporting date with the risk of a default occurring on the financial instrument as at the date of initial recognition and considers reasonable and supportable information, that is available without undue cost or effort, that is indicative of significant increases in credit risk since initial recognition.
For trade receivables or any contractual right to receive cash or another financial asset that result from transactions that are within the scope of Ind AS 11 and Ind AS 18, The Group always measures the loss allowance at an amount equal to lifetime expected credit losses.
Further, for the purpose of measuring lifetime expected credit loss allowance for trade receivables, the Group has used a practical expedient as permitted under Ind AS 109. This expected credit loss allowance is computed based on a provision matrix which takes into account historical credit loss experience and adjusted for forward-looking information.
The impairment requirements for the recognition and measurement of a loss allowance are equally applied to debt instruments at FVTOCI except that the loss allowance is recognised in other comprehensive income and is not reduced from the carrying amount in the balance sheet.
e) Effective interest method
The effective interest method is a method of calculating the amortised cost of a debt instrument and of allocating interest income over the relevant period. The effective interest rate is the rate that exactly discounts estimated future cash receipts (including all fees and points paid or received that form an integral part of the effective interest rate, transaction costs and other premiums or discounts) through the expected life of the debt instrument, or, where appropriate, a shorter period, to the net carrying amount on initial recognition.
Income is recognised on an effective interest basis for debt instruments other than those financial assets classified as at FVTPL. Interest income is recognised in profit or loss and is included in the ‘Other income’ line item.
324
Notes to the Consolidated Financial Statements as at and for the year ended 31 March 2018
JSW Steel Limited | Integrated Report 2017-18
B. Financial liabilities and equity instruments
a) Classification as debt or equity
Debt and equity instruments issued by a group entity are classified as either financial liabilities or as equity in accordance with the substance of the contractual arrangements and the definitions of a financial liability and an equity instrument.
b) Equity instruments
An equity instrument is any contract that evidences a residual interest in the assets of an entity after deducting all of its liabilities. Equity instruments issued by the Group are recognised at the proceeds received, net of direct issue costs.
Repurchase of the Group's own equity instruments is recognised and deducted directly in equity. No gain or loss is recognised in Consolidated Statement of Profit and Loss on the purchase, sale, issue or cancellation of the Group's own equity instruments.
c) Financial liabilities
Financial liabilities are classified as either financial liabilities ‘at FVTPL' or ‘other financial liabilities'.
Financial liabilities at FVTPL:
Financial liabilities are classified as at FVTPL when the financial liability is either held for trading or it is designated as at FVTPL.
A financial liability is classified as held for trading if:
It has been incurred principally for the purpose of repurchasing it in the near term; or
on initial recognition it is part of a portfolio of identified financial instruments that the Group manages together and has a recent actual pattern of short-term profit-taking; or
it is a derivative that is not designated and effective as a hedging instrument.
A financial liability other than a financial liability held for trading may be designated as at FVTPL upon initial recognition if:
such designation eliminates or significantly reduces a measurement or recognition inconsistency that would otherwise arise;
the financial liability forms part of a group of financial assets or financial liabilities or both, which is managed and its performance is evaluated on a fair value basis, in accordance with the Group’s documented risk management or investment strategy, and information about the grouping is provided internally on that basis; or
it forms part of a contract containing one or more embedded derivatives, and Ind AS 109 permits the entire combined contract to be designated as at FVTPL in accordance with Ind AS 109.
Financial liabilities at FVTPL are stated at fair value, with any gains or losses arising on remeasurement recognised in Consolidated Statement of Profit and Loss. The net gain or loss recognised in Consolidated Statement of Profit and Loss incorporates any interest paid on the financial liability and is included in the Consolidated Statement of Profit and Loss. For liabilities designated at FVTPL, fair value gains/losses attributable to changes in own credit risk are recognised in OCI.
The Group derecognises financial liabilities when, and only when, the Group's obligations are discharged, cancelled or they expire. The difference between the carrying amount of the financial liability derecognised and the consideration paid and payable is recognised in Consolidated Statement of Profit and Loss.
Other financial liabilities:
The Group enters into deferred payment arrangements (acceptances) whereby overseas lenders such as banks and other financial institutions make payments to supplier’s banks for import of raw materials and property, plant and equipment. The banks and financial institutions are subsequently repaid by the Group at a later date providing working capital benefits. These arrangements are in the nature of credit extended in normal operating cycle and these arrangements for raw materials are recognised as Acceptances (under trade payables) and arrangements for property, plant and equipment are recognised as other financial liabilities. Interest borne by the Group on such arrangements is accounted as finance cost. Other financial liabilities (including borrowings and trade and other payables) are subsequently measured at amortised cost using the effective interest method.
Derecognition of financial liabilities:
The Group derecognises financial liabilities when, and only when, the Group’s obligations are discharged, cancelled or have expired. An exchange between with a lender of debt instruments with substantially different terms is accounted for as an extinguishment of the original financial liability and the recognition of a new financial liability. Similarly, a substantial modification of the terms of an existing financial liability (whether or not attributable to the financial difficulty of the debtor) is accounted for as an extinguishment of the original financial liability and the recognition of a new financial

325
Notes to the Consolidated Financial Statements as at and for the year ended 31 March 2018
Better Everyday. In Pursuit of Excellence. Corporate Overview Statutory Reports Financial Statements
liability. The difference between the carrying amount of the financial liability derecognised and the consideration paid and payable is recognised in profit or loss.
d) Derivative financial instruments
The Group enters into a variety of derivative financial instruments to manage its exposure to interest rate, commodity price and foreign exchange rate risks, including foreign exchange forward contracts, commodity foreign exchange options, forward contracts, interest rate swaps and cross currency swaps.
Derivatives are initially recognised at fair value at the date the derivative contracts are entered into and are subsequently remeasured to their fair value at the end of each reporting period. The resulting gain or loss is recognised in Consolidated Statement of Profit and Loss immediately unless the derivative is designated and effective as a hedging instrument, in which event the timing of the recognition in Consolidated Statement of Profit and Loss depends on the nature of the hedge item.
e) Reclassification of financial assets
The Group determines classification of financial assets and liabilities on initial recognition. After initial recognition, no reclassification is made for financial assets which are equity instruments and financial liabilities. For financial assets which are debt instruments, a reclassification is made only if there is a change in the business model for managing those assets. Changes to the business model are expected to be infrequent. Group’s senior management determines change in the business model as a result of external or internal changes which are significant to the Group’s operations. Such changes are evident to external parties. A change in the business model occurs when the Group either begins or ceases to perform an activity that is significant to its operations. If the Group reclassifies financial assets, it applies the reclassification prospectively from the reclassification date which is the first day of the immediately next reporting period following the change in business model. The Group does not restate any previously recognised gains, losses (including impairment gains or losses) or interest.
The following table shows various reclassification and how they are accounted for:
Original classification
Revised classification
Accounting treatment
Amortised cost FVTPL Fair value is measured at reclassification date. Difference between previous amortised cost and fair value is recognised in Consolidated Statement of Profit and Loss.
FVTPL Amortised Cost Fair value at reclassification date becomes its new gross carrying amount. EIR is calculated based on the new gross carrying amount.
Amortised cost FVTOCI Fair value is measured at reclassification date. Difference between previous amortised cost and fair value is recognised in OCI. No change in EIR due to reclassification.
FVTOCI Amortised cost Fair value at reclassification date becomes its new amortised cost carrying amount. However, cumulative gain or loss in OCI is adjusted against fair value. Consequently, the asset is measured as if it had always been measured at amortised cost.
FVTPL FVTOCI Fair value at reclassification date becomes its new carrying amount. No other adjustment is required.
FVTOCI FVTPL Assets continue to be measured at fair value. Cumulative gain or loss previously recognised in OCI is reclassified to Consolidated Statement of Profit and Loss at the reclassification date.
f) Embedded derivatives
An embedded derivative is a component of a hybrid (combined) instrument that also includes a non-derivative host contract – with the effect that some of the cash flows of the combined instrument vary in a way similar to a stand-alone derivative. An embedded derivative causes some or all of the cash flows that otherwise would be required by the contract to be modified according to a specified interest rate, financial instrument price,
commodity price, foreign exchange rate, index of prices or rates, credit rating or credit index, or other variable, provided in the case of a non-financial variable that the variable is not specific to a party to the contract. Reassessment only occurs if there is either a change in the terms of the contract that significantly modifies the cash flows that would otherwise be required or a reclassification of a financial asset out of the fair value through profit or loss.
326
Notes to the Consolidated Financial Statements as at and for the year ended 31 March 2018
JSW Steel Limited | Integrated Report 2017-18
If the hybrid contract contains a host that is a financial asset within the scope of Ind AS 109, the Group does not separate embedded derivatives. Rather, it applies the classification requirements contained in Ind AS 109 to the entire hybrid contract. Derivatives embedded in all other host contracts are accounted for as separate derivatives and recorded at fair value if their economic characteristics and risks are not closely related to those of the host contracts and the host contracts are not held for trading or designated at fair value though profit or loss. These embedded derivatives are measured at fair value with changes in fair value recognised in profit or loss, unless designated as effective hedging instruments.
g) Hedge accounting
The Group designates certain hedging instruments, which include derivatives, embedded derivatives and non-derivatives in respect of foreign currency, interest rate and commodity risk, as either cash flow hedge, fair value hedge or hedges of net investments in foreign operations. Hedges of foreign currency risk on firm commitments are accounted for as cash flow hedges.
At the inception of the hedge relationship, the entity documents the relationship between the hedging instrument and the hedged item, along with its risk management objectives and its strategy for undertaking various hedge transactions. Furthermore, at the inception of the hedge and on an ongoing basis, the Group documents whether the hedging instrument is highly effective in offsetting changes in fair values or cash flows of the hedged item attributable to hedged risk.
(i) Fair value hedges
Changes in fair value of the designated portion of derivatives that qualify as fair value hedges are recognised in profit or loss immediately, together with any changes in the fair value of the hedged asset or liability that are attributable to the hedged risk. The change in the fair value of the designated portion of hedging instrument and the change in the hedged item attributable to hedged risk are recognised in profit or loss in the line item relating to the hedged item.
Hedge accounting is discontinued when the hedging instrument expires or is sold, terminated, or exercised, or when it no longer qualifies for hedge accounting. For fair value hedges relating to items carried at amortised cost, the fair value adjustment to the carrying amount of the hedged item arising from the
hedged risk is amortised to profit or loss from that date.
(ii) Cash flow hedges
The effective portion of changes in fair value of derivatives that are designated and qualify as cash flow hedges is recognised in other comprehensive income and accumulated under the heading of cash flow hedging reserve. The gain or loss relating to the ineffective portion is recosnised immediately in profit or loss.
Amounts previously recognised in other comprehensive income and accumulated in equity relating to effective portion as described above are reclassified to profit or loss in the periods when the hedged item affects profit or loss, in the same line as the recognised hedged item. However, when the hedged forecast transaction results in the recognition of a non-financial asset or a non-financial liability, such gains or losses are transferred from equity (but not as a reclassification adjustment) and included in the initial measurement of the cost of the non-financial asset or non-financial liability.
Hedge accounting is discontinued when the hedging instrument expires or is sold, terminated, or exercised, or when it no longer qualifies for hedge accounting. Any gain or loss recognised in other comprehensive income and accumulated in equity at that time remains in equity and is recognised when the forecast transaction is ultimately recognised in profit or loss. When a forecast transaction is no longer expected to occur, the gain or loss accumulated in equity is recognised immediately in profit or loss.
(iii) Hedges of net investments in a foreign operation
Hedges of net investments in a foreign operation, including a hedge of a monetary item that is accounted for as part of the net investment, are accounted for in a way similar to cash flow hedges. Gains or losses on the hedging instrument relating to the effective portion of the hedge are recognised in other comprehensive income and accumulated under the heading of foreign currency translation reserve. The gains or losses relating to the ineffective portion are recognised immediately in the profit or loss.
Gains and losses on the hedging instrument relating to the effective portion of the hedge accumulated in the foreign currency translation

327
Notes to the Consolidated Financial Statements as at and for the year ended 31 March 2018
Better Everyday. In Pursuit of Excellence. Corporate Overview Statutory Reports Financial Statements
reserve are reclassified to Consolidated Statement of Profit and Loss on the disposal of the foreign operation.
XXII. Cash and cash equivalents: Cash and cash equivalent in the Balance Sheet
comprise cash at banks and on hand and short-term deposits with an original maturity of three months or less, which are subject to insignificant risk of changes in value.
XXIII. Earnings per share: Basic earnings per share is computed by dividing the
profit / (loss) after tax by the weighted average number of equity shares outstanding during the year. The weighted average number of equity shares outstanding during the year is adjusted for treasury shares, bonus issue, bonus element in a rights issue to existing shareholders, share split and reverse share split (consolidation of shares).
Diluted earnings per share is computed by dividing the profit / (loss) after tax as adjusted for dividend, interest and other charges to expense or income (net of any attributable taxes) relating to the dilutive potential equity shares, by the weighted average number of equity shares considered for deriving basic earnings per share and the weighted average number of equity shares which could have been issued on the conversion of all dilutive potential equity shares including the treasury shares held by the Company to satisfy the exercise of the share options by the employees.
3. Key sources of estimation uncertainty and critical accounting judgements
In the course of applying the policies outlined in all notes under Section 2 above, the Company is required to make judgements, estimates and assumptions about the carrying amount of assets and liabilities that are not readily apparent from other sources. The estimates and associated assumptions are based on historical experience and other factors that are considered to be relevant. Actual results may differ from these estimates.
The estimates and underlying assumptions are reviewed on an ongoing basis. Revisions to accounting estimates are recognised in the period in which the estimate is revised if the revision affects only that period, or in the period of the revision and future period, if the revision affects current and future period.
A) Key sources of estimation uncertainty i) Useful lives of property, plant and equipment
Management reviews the useful lives of property, plant and equipment at least once a year. Such lives are dependent upon an assessment of both the technical lives of the assets and also their
likely economic lives based on various internal and external factors including relative efficiency and operating costs. Accordingly, depreciable lives are reviewed annually using the best information available to the Management.
ii) Impairment of property plant and equipment
Determining whether the property, plant and equipment are impaired requires an estimate in the value in use of plant and equipment. The value in use calculation requires the Management to estimate the future cash flows expected to arise from the property, plant and equipment and a suitable discount rate in order to calculate present value. When the actual cash flows are less than expected, a material impairment loss may arise.
iii) Impairment of investments in joint ventures and
associate
Determining whether the investments in joint ventures and associate are impaired requires an estimate in the value in use of investments. In considering the value in use, the Management have anticipated the future commodity prices, capacity utilisation of plants, operating margins, mineable resources and availability of infrastructure of mines, discount rates and other factors of the underlying businesses / operations of the investee companies. Any subsequent changes to the cash flows due to changes in the above mentioned factors could impact the carrying value of investments.
iv) Contingencies
In the normal course of business, contingent liabilities may arise from litigation and other claims against the Company. Potential liabilities that are possible but not probable of crystalising or are very difficult to quantify reliably are treated as contingent liabilities. Such liabilities are disclosed in the notes but are not recognised.
v) Fair value measurements
When the fair values of financial assets or financial liabilities recorded or disclosed in the financial statements cannot be measured based on quoted prices in active markets, their fair value is measured using valuation techniques including the DCF model. The inputs to these models are taken from observable markets where possible, but where this is not feasible, a degree of judgement is required in establishing fair values. Judgements include consideration of inputs such as liquidity risk, credit risk and volatility. Information about the valuation techniques and inputs used in determining the fair value of various assets and liabilities are disclosed in note 41.

328
Notes to the Consolidated Financial Statements as at and for the year ended 31 March 2018
JSW Steel Limited | Integrated Report 2017-18
vi) Taxes
Deferred tax assets are recognised for unused tax losses to the extent that it is probable that taxable profit will be available against which the losses can be utilised. Significant management judgement is required to determine the amount of deferred tax assets that can be recognised, based upon the likely timing and the level of future taxable profits together with future tax planning strategies.
vii) Goodwill
Determining whether the goodwill acquired in business combinations are impaired, requires an estimate of recoverable amount of the Group’s cash Generating unit (or groups of cash generating units). In considering the recoverable value of cash generating unit, the management have anticipated the future benefits to arise from commodity prices, capacity utilisation of plants, mineable resources and availability of infrastructure of mines, discount rates and other factors of the underlying unit. If the recoverable amount of cash generating unit is less than its carrying amount, the impairment loss is allocated first to reduce the carrying amount of any goodwill allocated to the unit and then to the other assets of the unit pro rata based on the carrying amount of each asset in the unit. Any Impairment loss for goodwill is recognised directly in the consolidated statement of profit and loss.
B) Critical accounting judgements i) Control over JSW Realty & Infrastructure Private Limited
(RIPL)
RIPL has developed a residential township in Vijayanagar, Karnataka on the land taken on lease from the Company for a period of 30 years and provides individual housing units on rent to the employees of the Company or other group companies. RIPL is not allowed to sub-let or assign its rights under the arrangement without prior written consent of the Company. Though the Company does not hold any ownership interest in RIPL, the Company has concluded that it has practical ability to direct the relevant activities of RIPL unilaterally, considering RIPL’s dependency on the Company for funding significant portion of its operation through subscription to 73.57% of preference share capital amounting to ` 199 crore issued by RIPL and significant portion of RIPL’s activities either involve or are conducted on behalf of the Company on the land provided on long-term lease by the Company.
ii) Control over Dolvi Minerals & Metals Private Limited
(DMMPL) and Dolvi Coke Private Limited (DCPL)
DMMPL is an investment Company and is setting up 3 MTPA recovery type coke oven plant and by-product plant ('Coke Plant') through its wholly owned subsidiary DCPL. Although, the Company owns only 40% of ownership interest, the Company has concluded that it has practical ability to direct the relevant activities of DMMPL unilaterally, considering
the relevant activities of DCPL are directed through the long-term take or pay arrangement entered into between the Company and DCPL,
significant portion of DMMPL and DCPL activities either involve or are conducted on behalf of the Company, and
return from Company’s involvement with DMMPL and in turn with DCPL is disproportionately greater than it voting rights considering the take or pay arrangement.
iii) Assessment of control over JSW Projects Limited
(JSWPL)
JSWPL operates Direct Reduced Iron Processing Plant (DRI), Coal Dry Quenching Plant (CDQ) and two thermal power plants. Although the long-term take or pay arrangements entered into by the Company with JSWPL for processing of DRI and CDQ have been identified to be the arrangements in the nature of lease, the Company has concluded that it does not have any ownership interest, voting right or representation in the Board of Directors of JSWPL to direct its relevant activities unilaterally and accordingly it is not controlled by the Company.
iv) Arrangements in the nature of lease
The Company has entered into long-term arrangements with third parties to facilitate continuous supply of gases to its steel plant at Vijaynagar. These arrangements involve setting up of gas plants by the vendor/ supplier in the Company’s premises to supply minimum specified gas quantities to the Company on take or pay basis. Based on assessment of the terms of the arrangements, review of past trends and confirmations received from the counter parties, the Company has concluded that these arrangements are not in the nature of lease considering more than insignificant amount of output from these plants are being also supplied by the vendor / suppliers to third parties on consistent basis.

329
Notes to the Consolidated Financial Statements as at and for the year ended 31 March 2018
Better Everyday. In Pursuit of Excellence. Corporate Overview Statutory Reports Financial Statements
v) Separating payments of lease from the other payments
If an arrangement contains a lease, the parties to the arrangement shall apply the requirements of Ind AS 17 to the lease element. Therefore, the Company is required to separate payments and other consideration required by the arrangement into those for the lease and for other elements on the basis of their relative fair values.
However, the Company has concluded that it is impracticable to separate both the elements reliably and has recognised an asset and a liability at an amount equal to the carrying value of the specified asset in the books of the lessor. Subsequently, the liability has been reduced as payments are made and an imputed finance charges on the liability recognised using the Company’s incremental borrowing rate of interest over the tenure of the arrangement, where it is impracticable to determine the interest rate implicit in the lease. The total payments less payments made towards lease obligation and imputed finance charges have been considered to be the consideration for elements other than lease.
In case of arrangements which are identified to be in the nature of finance lease, the Company concluded that it is impracticable to derive the relative fair values of lease and other elements of the arrangement and has accordingly determined the consideration for elements other than lease as a residual post appropriation of lease payments derived based on lessee’s incremental borrowing rate of interest on the lease obligation corresponding to the respective gross asset values in the books of lessor.
in the nature of finance lease, the Company concluded that it is impracticable to derive the relative fair values of lease and other elements of the arrangement and has accordingly determined the consideration for elements other than lease as a residual post appropriation of lease payments derived based on lessee’s incremental borrowing rate of interest on the lease obligation corresponding to the respective gross asset values in the books of lessor.

330
Notes to the Consolidated Financial Statements as at and for the year ended 31 March 2018
JSW Steel Limited | Integrated Report 2017-184
. Pr
oper
ty, p
lant
and
equ
ipm
ent
` in
cro
res
Part
icul
ars
Free
hol
d la
nd
Leas
ehol
d la
nd
Bu
ildin
gs
(ow
ned
)B
uild
ing
s (o
n f
inan
ce
leas
e)
Pla
nt a
nd
equ
ipm
ents
(o
wn
ed)
Pla
nt a
nd
equ
ipm
ents
(o
n f
inan
ce
leas
e)
Furn
itu
re
and
fix
ture
sVe
hic
les
and
airc
raft
sO
ffic
e eq
uip
men
tsM
inin
g de
velo
pmen
t an
d p
roje
cts
Tota
l
Cos
t /
dee
med
cos
t
At 1
Ap
ril 2
016
1,3
81
709
7,6
61
-4
6,1
31
2,5
02
81
125
41
913
59
,54
4
Add
itio
ns
22
15
57
95
,29
227
08
1116
16
,18
7
Acq
uir
ed p
urs
uan
t to
bu
sin
ess
com
bin
atio
ns
@-
3-
159
-@
@@
@@
@@
@@
-16
2
Ded
uct
ion
s1
-18
-24
4-
-5
#-
268
Oth
er a
dju
stm
ents
(re
fer n
ote
e b
elow
)-
--
-2
2-
--
--
22
Ass
ets
tran
sfer
to
hel
d f
or s
ale
--
--
(89
)-
--
--
(89
)
Tran
slat
ion
res
erve
-$
(43
)-
(95
)-
(1)
$$
(1)
(27)
(167
)
At 3
1 M
arch
20
171,
40
271
08
,16
09
51,
176
2,7
728
813
15
68
87
65
,39
1
Add
itio
ns
242
275
-2
,39
2-
31
22
135
12
,810
Ded
uct
ion
s-
12
-3
27-
##
9#
##
-3
39
Oth
er a
dju
stm
ents
(re
fer n
ote
e b
elow
)-
--
-4
2-
--
--
42
Tran
slat
ion
res
erve
$$
$-
21
-16
--
$$
$$
$$
$$
44
1
At 3
1 M
arch
20
181,
426
711
8,4
54
95
3,2
99
2,7
7211
914
46
99
42
67,
94
5
Accu
mu
late
d d
epre
ciat
ion
an
d im
pai
rmen
t
At 1
Ap
ril 2
016
47
43
6-
3,2
96
151
1715
105
104
,44
6
Dep
reci
atio
n-
93
63
&2
,84
216
710
1510
-3
,416
Dis
pos
als
--
1-
85
--
3*
-8
9
Oth
er a
dju
stm
ents
--
--
14-
--
--
14
Ass
ets
tran
sfer
to
hel
d f
or s
ale
--
--
(78
)-
--
--
(78
)
Tran
slat
ion
res
erve
^^^
(5)
-(8
7)-
^^^
^^^^
-(1
2)
(10
4)
At 3
1 M
arch
20
174
1679
3&
5,9
02
318
2727
20
49
87,
60
5
Dep
reci
atio
n-
93
69
12
,68
916
92
015
977
3,3
58
Dis
pos
als
-*
*-
-15
2-
**
*4
**
**
-15
6
Imp
airm
ent
--
--
76-
--
--
76
Tran
slat
ion
res
erve
^^^^
^-
1-
5-
^^^^
^^-
^^^^
^^^
28
At 3
1 M
arch
20
184
25
1,16
31
8,5
20
48
74
73
82
957
710
,89
1
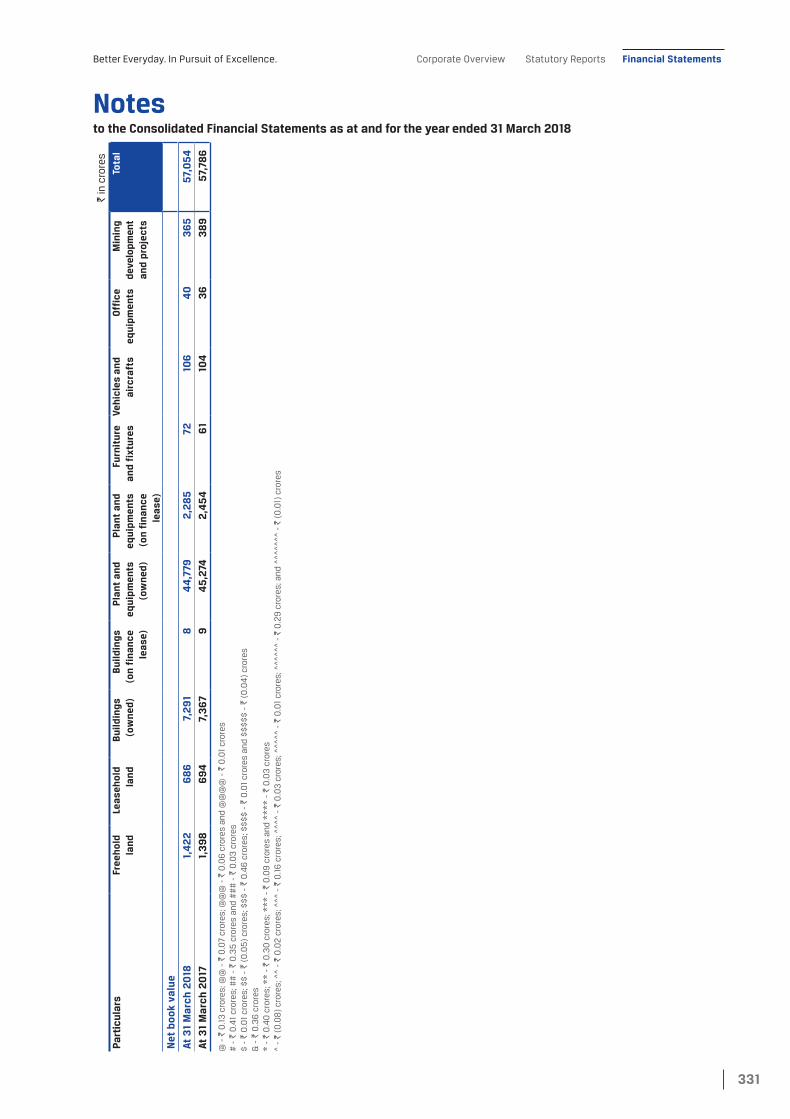
331
Notes to the Consolidated Financial Statements as at and for the year ended 31 March 2018
Better Everyday. In Pursuit of Excellence. Corporate Overview Statutory Reports Financial Statements
` in
cro
res
Part
icul
ars
Free
hol
d la
nd
Leas
ehol
d la
nd
Bu
ildin
gs
(ow
ned
)B
uild
ing
s (o
n f
inan
ce
leas
e)
Pla
nt a
nd
equ
ipm
ents
(o
wn
ed)
Pla
nt a
nd
equ
ipm
ents
(o
n f
inan
ce
leas
e)
Furn
itu
re
and
fix
ture
sVe
hic
les
and
airc
raft
sO
ffic
e eq
uip
men
tsM
inin
g de
velo
pmen
t an
d p
roje
cts
Tota
l
Net
boo
k va
lue
At 3
1 M
arch
20
181,
42
26
86
7,2
91
84
4,7
792
,28
572
106
40
36
557
,05
4
At 3
1 M
arch
20
171,
39
86
94
7,3
67
94
5,2
742
,45
46
110
43
63
89
57,7
86
@ -
` 0
.13
cro
res;
@@
- `
0.0
7 cr
ores
; @@
@ -
` 0
.06
cro
res
and
@@
@@
- `
0.0
1 cr
ores
# -
` 0
.41
cror
es; #
# -
` 0
.35
cro
res
and
##
# -
` 0
.03
cro
res
$ -
` 0
.01
cror
es; $
$ -
` (0
.05
) cr
ores
; $$$
- `
0.4
6 c
rore
s; $
$$$
- `
0.0
1 cr
ores
and
$$$
$$ -
` (
0.0
4)
cror
es&
- `
0.3
6 c
rore
s*
- `
0.4
0 c
rore
s; *
* -
` 0
.30
cro
res;
***
- `
0.0
9 c
rore
s an
d **
** -
` 0
.03
cro
res
^ -
` (0
.08
) cr
ores
; ^^
- `
0.0
2 cr
ores
; ^^^
- `
0.1
6 c
rore
s; ^
^^^
- `
0.0
3 c
rore
s; ^
^^^^
- `
0.0
1 cr
ores
; ^^^
^^^
- `
0.2
9 c
rore
s; a
nd ^
^^^^
^^ -
` (
0.0
1) c
rore
s

332
Notes to the Consolidated Financial Statements as at and for the year ended 31 March 2018
JSW Steel Limited | Integrated Report 2017-18
Notes:` in crores
Description As at 31 March 2018
As at 31 March 2017
a) Freehold land which is yet to be registered in the name group entities
Acre 29 206
Deemed cost 19 82
b) Freehold land and buildings which has been/agreed to be hypothecated/mortgaged to lenders of related parties
Deemed cost 64 43
c) Leasehold land which is yet to be registered in the name of group entities
Acre 21 454
Deemed cost 14 287
Carrying amount 13 279
d) Buildings include roads not owned by the Group Deemed cost - 2
Carrying amount - 1
e) Other adjustments comprises:
Borrowing cost 23 26
Foreign exchange loss / (gain) 19 (4)
f) For details of assets given on operating lease, (refer note 45).
g) For details of assets given on finance lease, (refer note 46).
h) Certain property, plant and equipments are pledged against borrowings, the details relating to which have been described in Note 20 and 25.
i) Property, plant and equipments includes proportionate share (50%) of assets under joint operation as below:
` in crores
Particulars Buildings (Owned) Plant and Equipment (Owned)
Cost/deemed cost
At 31 March 2016 459 7
Additions 6 -
At 31 March 2017 465 7
Additions - -
At 31 March 2018 465 7
Accumulated depreciation
At 31 March 2016 15 @
Depreciation expense 15 @
At 31 March 2017 30 1
Depreciation expense 16 @
At 31 March 2018 46 1
Net book value
At 31 March 2018 419 6
At 31 March 2017 435 6
@@ - ` 0.38 crores
5. Capital work-in-progress includes exchange fluctuation of ` 57 crores (previous year ` 41 crores) and borrowing cost of ` 78 crores (previous year ` 128 crores).

333
Notes to the Consolidated Financial Statements as at and for the year ended 31 March 2018
Better Everyday. In Pursuit of Excellence. Corporate Overview Statutory Reports Financial Statements
6. Goodwill`in crores
Particulars As at 31 March 2018
As at 31 March 2017
Cost / deemed cost
Balance at the beginning of the year 1,637 1,673
Translation reserve 5 (36)
Balance at the end of the year (a) 1,642 1,637
Accumulated amortisation and impairment
Balance at the beginning of the year 765 718
Impairment (refer note 47) 166 64
Translation reserve 4 (17)
Balance at the end of the year (b) 935 765
Net book value (a-b) 707 872
Allocation of goodwill to Cash Generating Units (CGU’s)
` in crores
CGU As at 31 March 2018
As at 31 March 2017
Coal mines at West Virginia, USA 229 229
Iron ore mines at Chile 443 608
Others 35 35
Total 707 872
Alawest coal mines at West Virginia, USA
The recoverable amount of Alawest coal mines is determined based on a value in use calculation which uses cash flow projections based on financial budgets approved by the directors covering the mining lease concession period, and a post-tax discount rate of 13.7% per annum.
Cash flow projections during the budget period are based on estimated coal extraction schedule and future prices of coal determined based on the average of coal prices published in various analyst reports. The projections do not consider growth rate in the coal prices from the year 2024-25 onwards.
Considering past trend of movement in coal prices, the management believes that the following changes in these key estimates would result into carrying amount exceeding the recoverable amount:
a) Decrease in coal prices by 1% would result into carrying amount exceeding the recoverable amount by `26 crores.
b) Decrease in extraction schedule by 5% would result into carrying amount exceeding the recoverable amount by `34 crores.
Iron ore mines at Chile (Bellavista and Vinita):
The recoverable amount of Bellavista iron ore mine is determined based on a value in use calculation which uses cash flow projections based on financial budgets approved by the directors covering the mining lease concession period, and a post-tax discount rate of 14.8% per annum. Recoverable amount of Vinita mine has been determined through implied multiple of Bellavista reserve.
Cash flow projections during the budget period are based on estimated iron ore extraction schedule and future prices of iron ore determined based on the average of iron ore prices published in various analyst reports. The projections do not consider growth rate in the iron ore production schedule and iron ore prices from the year 2023-24 onwards.
Considering past trend of movement in iron ore prices, the management believes that the following changes in these key estimates would result into carrying amount exceeding the recoverable amount.
a) Decrease in iron ore prices by 1% would result into carrying amount exceeding the recoverable amount by `12 crores.
b) Decrease in extraction schedule by 5% would result into carrying amount exceeding the recoverable amount by `128 crores.

334
Notes to the Consolidated Financial Statements as at and for the year ended 31 March 2018
JSW Steel Limited | Integrated Report 2017-18
7. Other Intangible assets` in crores
Particulars Computer software
Licences Mining concession
Port concession
Total
Cost / deemed cost
At 1 April 2016 69 34 5 1 109
Additions 13 - - - 13
Translation reserve - (2) @ @@ (2)
At 31 March 2017 82 32 5 1 120
Additions 23 4 18 - 45
Translation reserve - @@@ @@@@ - @@@@@
At 31 March 2018 105 36 23 1 165
Accumulated amortisation and impairment
At 1 April 2016 19 4 - - 23
Amortisation 21 4 - - 25
At 31 March 2017 40 8 - - 48
Amortisation 22 6 1 - 29
Translation reserve - 1 - - 1
At 31 March 2018 62 15 1 - 78
Net book value
At 31 March 2018 43 21 22 1 87
At 31 March 2017 42 24 5 1 72
@- ` (0.11) crores; @@ - ` 0.02 crores; @@@ - ` 0.29 crores; @@@@ - ` 0.02 crores; @@@@@ - ` 0.31 crores
8. Investments in joint venturesParticulars Paid-up value As at 31 March 2018 As at 31 March 2017
No. of shares ` in crores No. of shares ` in crores
Investment in equity shares accounted for using equity method
Joint ventures
Gourangdih Coal Limited
Equity shares ` 10 each 2,450,000 2 2,450,000 2
Add: Share of profit/(loss) (net) @ @
2 2
JSW MI Service Centre Private Limited
Equity shares ` 10 each 66,500,000 67 42,839,800 43
Add: Share of profit/(loss) (net) 7 2
74 45
JSW Severfield Structures Limited
Equity shares ` 10 each 160,437,940 160 115,437,940 115
Add: Share of profit/(loss) (net) (79) (84)
81 31
Rohne Coal Company Private Limited
Equity shares ` 10 each 490,000 @@ 490,000 @@
Add: Share of profit/(loss) (net) @@@ @@@
- -
JSW Vallabh Tinplate Private Limited
Equity shares ` 10 each 25,019,600 30 25,019,600 30
Add: Share of profit/(loss) (net) 1 2
31 32
Vijayanagar Minerals Private Limited
Equity shares ` 10 each 4,000 @@@@ 4,000 @@@@
Add: Share of profit/(loss) (net) 2 2
2 2

335
Notes to the Consolidated Financial Statements as at and for the year ended 31 March 2018
Better Everyday. In Pursuit of Excellence. Corporate Overview Statutory Reports Financial Statements
Particulars Paid-up value As at 31 March 2018 As at 31 March 2017No. of shares ` in crores No. of shares ` in crores
AcciaItalia S.P.A.
Equity shares Euro 3 each 17,675 12 17,675 12
Add: Share of profit/(loss) (net) (12) @@@@@
- 12
Geo Steel LLC
Investment 26 26
Add: Share of profit/(loss) (net) 144 102
170 128
Total 360 252
Unquoted
Aggregate book value 360 252
@ - ` 0.13 crores (previous year 0.12 crores)@@ - ` 0.49 crores@@@ - ` (0.49) crores @@@@ - ` 40,000/-@@@@@ - ` (0.22) crores
9. Investments (non-current)Particulars Paid-up value As at 31 March 2018 As at 31 March 2017
No. of shares ` in crores No. of shares ` in crores
A Investment in equity instruments
Fully paid-up
Quoted
(at fair value through other comprehensive income)
JSW Energy Limited ` 10 each 10,16,05,500 740 10,16,05,500 637
Unquoted
(at fair value through other comprehensive income)
Tarapur Environment Protection Society
` 100 each 2,44,885 4 2,44,885 4
Toshiba JSW Power Systems Private Limited
` 10 each 1,10,00,000 - 1,10,00,000 11
MJSJ Coal Limited ` 10 each 1,04,61,000 9 1,04,61,000 9
SICOM Limited ` 10 each 6,00,000 5 6,00,000 5
Kalyani Mukand Limited ` 1 each 4,80,000 $ 4,80,000 $
Ispat Profiles India Limited ` 1 each 15,00,000 $ 15,00,000 $
B Investments in preference shares
Fully paid-up
Unquoted
(at fair value through profit or loss)
Joint ventures
Rohne Coal Company Private Limited
1% non-cumulative preference shares
` 10 each 2,36,42,580 - 2,36,42,580 1
1% Series-A non-cumulative preference shares
` 10 each 71,52,530 7 71,52,530 7
1% Series-B non-cumulative preference shares
` 10 each 11,26,686 1 6,41,286 1
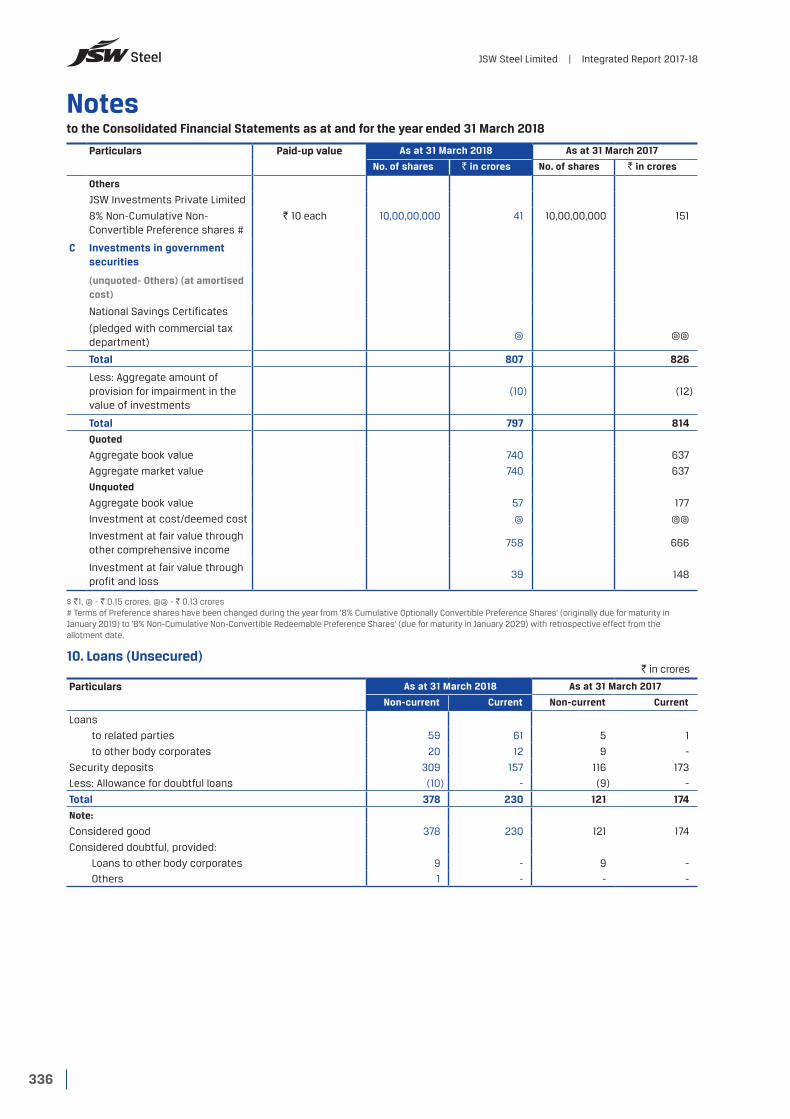
336
Notes to the Consolidated Financial Statements as at and for the year ended 31 March 2018
JSW Steel Limited | Integrated Report 2017-18
Particulars Paid-up value As at 31 March 2018 As at 31 March 2017
No. of shares ` in crores No. of shares ` in crores
Others
JSW Investments Private Limited
8% Non-Cumulative Non-Convertible Preference shares #
` 10 each 10,00,00,000 41 10,00,00,000 151
C Investments in government securities
(unquoted- Others) (at amortised cost)
National Savings Certificates
(pledged with commercial tax department)
@ @@
Total 807 826
Less: Aggregate amount of provision for impairment in the value of investments
(10) (12)
Total 797 814
Quoted
Aggregate book value 740 637
Aggregate market value 740 637
Unquoted
Aggregate book value 57 177
Investment at cost/deemed cost @ @@
Investment at fair value through other comprehensive income
758 666
Investment at fair value through profit and loss
39 148
$ `1, @ - ` 0.15 crores, @@ - ` 0.13 crores# Terms of Preference shares have been changed during the year from '8% Cumulative Optionally Convertible Preference Shares' (originally due for maturity in January 2019) to '8% Non-Cumulative Non-Convertible Redeemable Preference Shares' (due for maturity in January 2029) with retrospective effect from the allotment date.
10. Loans (Unsecured)` in crores
Particulars As at 31 March 2018 As at 31 March 2017
Non-current Current Non-current Current
Loans
to related parties 59 61 5 1
to other body corporates 20 12 9 -
Security deposits 309 157 116 173
Less: Allowance for doubtful loans (10) - (9) -
Total 378 230 121 174
Note:
Considered good 378 230 121 174
Considered doubtful, provided:
Loans to other body corporates 9 - 9 -
Others 1 - - -

337
Notes to the Consolidated Financial Statements as at and for the year ended 31 March 2018
Better Everyday. In Pursuit of Excellence. Corporate Overview Statutory Reports Financial Statements
11. Others financial assets (Unsecured)` in crores
Particulars As at 31 March 2018 As at 31 March 2017
Non-current Current Non-current Current
Export benefits and entitlements 1 57 67 39
Insurance claim receivable 45 - 44 -
Advance towards equity and preference shares 121 - 24 -
Receivable for coal block development expenditure 117 - 117 -
Government grant income receivable - 234 - -
Indirect tax balances/ recoverable /credits - 184 - 191
Others 11 131 - 130
Less: Allowance for doubtful advances (2) (76) - (75)Total 293 530 252 285
Notes:
Considered good 293 530 252 285
Considered doubtful, provided 2 76 - 75
12. Other assets (Unsecured) ` in crores
Particulars As at 31 March 2018 As at 31 March 2017
Non-current Current Non-current Current
Capital advances 1,186 - 497 -
Less: Allowances for doubtful advances (9) - (9) -
(A) 1,177 - 488 -
Other advances
Advances to suppliers 174 1,133 152 1,080
Export benefits and entitlements 81 161 - 356
Advance coal royalty 46 - 60 -
Royalty for mining companies 23 - 35 -
Security deposits 34 51 32 69
Indirect tax balances/ recoverable /credits 1,322 2,150 1,058 1,323
Prepayments and others 146 104 133 151
Less: Allowances for doubtful advances (122) - (66) (11)
(B) 1,704 3,599 1,404 2,968
Total (A+B) 2,881 3,599 1,892 2,968
Notes:
Capital advances
Considered good 1,177 - 488 -
Considered doubtful 9 - 9 -
Other advances
Considered good 1,704 3,599 1,404 2,968
Considered doubtful, provided
Advance to suppliers 121 - 62 10
Security deposits - - 1 -
Others 1 - 3 1

338
Notes to the Consolidated Financial Statements as at and for the year ended 31 March 2018
JSW Steel Limited | Integrated Report 2017-18
13. Inventories ` in crores
Particulars As at 31 March 2018
As at 31 March 2017
Raw materials (at cost) 6,263 4,703
Work-in-progress (at cost) 773 775
Semi-finished/ finished goods (at cost or net realisable value) 3,700 4,499
Production consumables and stores and spares (at cost) 1,858 1,418
Total 12,594 11,395
Notes:
Details of stock-in-transit
Raw materials 2,232 1,084
Semi-finished / finished goods - 3
Production consumables and stores and spares 191 57
Total 2,423 1,144
Inventories have been pledged as security against certain bank borrowings, the details relating to which has been described in note 20 and 25.
14. Investments (Current) ` in crores
Particulars As at 31 March 2018
As at 31 March 2017
Mutual funds (Quoted) 312 300
Total 312 300
Quoted
Aggregate book value 312 300
Aggregate market value 312 300
15. Trade receivables ` in crores
Particulars As at 31 March 2018
As at 31 March 2017
Secured, considered good 88 160
Unsecured, considered good 4,616 3,989
Doubtful 96 33
4,800 4,182
Allowance for doubtful debts (96) (33)
Total 4,704 4,149
Ageing of receivables that are past due but not impaired` in crores
Particulars As at 31 March 2018
As at 31 March 2017
60 – 90 days 150 146
>90 <180 days 61 38
>180 days 241 210
Total 452 394
The credit period on sales of goods ranges from 7 to 60 days with or without security.
Before accepting any new customer, the Group uses an external credit scoring system to assess the potential customer's credit quality and defines credit limits by customer. Limits and scoring attributed to customers are reviewed once a year.
Trade receivable have been given as collateral towards borrowings, the details relating to which has been described in notes 20 and 25.

339
Notes to the Consolidated Financial Statements as at and for the year ended 31 March 2018
Better Everyday. In Pursuit of Excellence. Corporate Overview Statutory Reports Financial Statements
16. (a) Cash and cash equivalents` in crores
Particulars As at 31 March 2018
As at 31 March 2017
Balances with banks
In current accounts 237 404
In term deposit accounts with maturity less than 3 months at inception 344 513
Cheques on hand - #
Cash on hand 1 @
Total 582 917
# - ` 0.01 crores@ - ` 0.44 crores
16. (b) Bank balance other than cash and cash equivalents` in crores
Particulars As at 31 March 2018
As at 31 March 2017
Earmarked balances In current account 26 21
Balance with banks
In term deposit accounts
with maturity more than 3 months but less than 12 months at inception 146 534
with maturity more than 12 months at inception 20 6
In margin money 289 7
Total 481 568
Earmarked bank balance are restricted in use and it relates to unclaimed dividend. Balance with banks held as margin money for security against the guarantee.
17. Derivative Assets` in crores
Particulars As at 31 March 2018
As at 31 March 2017
Forward contract 84 209
Commodity contract 9 263
Interest rate swaps 37 17
Currency options 21 2
Total 151 491
18. Equity share capitalParticulars As at
31 March 2018As at
31 March 2017As at
31 March 2018As at
31 March 2017Share capital Number of Shares Amount (` in crores)
(a) Authorised
Equity shares of the par value of ` 1 each 60,15,00,00,000 60,15,00,00,000 6,015 6,015
(b) Issued and subscribed (i) Outstanding at the beginning of the
year, fully paid-up2,41,72,20,440 2,41,72,20,440 242 242
(ii) Less: Treasury shares held under ESOP Trust
(1,09,88,860) (1,42,35,750) (1) (2)
(iii) Outstanding at the end of the year, fully paid-up
2,40,62,31,580 2,40,29,84,690 241 240
(c) Equity shares forfeited (amount originally paid-up)
61 61
Total 302 301

340
Notes to the Consolidated Financial Statements as at and for the year ended 31 March 2018
JSW Steel Limited | Integrated Report 2017-18
Movement in treasury shares
Particulars As at 31 March 2018
As at 31 March 2017
As at 31 March 2018
As at 31 March 2017
Shares of `1 each fully paid-up held under ESOP Trust Number of shares Amount (` in crores)
Equity shares as at 1 April 1,42,35,750 1,84,88,170 2 2
Changes during the year (32,46,890) (42,52,420) @ @
Equity shares as at 31 March 1,09,88,860 1,42,35,750 1 2
@ - ` (0.32) crores (previous year – ` (0.43) crores)
a) RIGHTS, PREFERENCES AND RESTRICTIONS ATTACHED TO EQUITY SHARES
The Company has a single class of equity shares. Each shareholder is eligible for one vote per share held. The dividend proposed by the Board of Directors is subject to the approval of the shareholders. In the event of liquidation, the equity shareholders are eligible to receive the remaining assets of the Company after distribution of all preferential amounts, in proportion to their shareholding.
b) SHAREHOLDERS HOLDING MORE THAN 5% SHARE IN THE Company ARE SET OUT BELOW
Particulars As at 31 March 2018 As at 31 March 2017
No. of Shares % of shares No. of Shares % of shares
Equity shares
JFE Steel International Europe BV 36,25,83,070 15.00% 36,25,83,070 15.00%
JSW Holdings Limited 17,73,06,230 7.34% 17,57,94,230 7.27%
Vividh Finvest Private Limited (formerly known as Vividh Consultancy and Advisory Services Private Limited)
14,07,26,690 5.82% 13,98,66,690 5.79%
JSW Techno Projects Management Limited 22,93,26,950 9.49% 22,93,26,950 9.49%
c) NOTE FOR SHARES HELD UNDER ESOP TRUST:
For the details of shares reserved for issue under the employee stock ownership plan (ESOP) of the Company. (refer note 38)
d) SHARES ALLOTTED AS FULLY PAID-UP PURSUANT TO CONTRACTS WITHOUT PAYMENT BEING RECEIVED IN CASH DURING THE PERIOD OF
FIVE YEARS IMMEDIATELY PRECEDING THE DATE OF THE BALANCE SHEET ARE AS UNDER
186,048,440 Equity shares fully paid-up to the shareholders of the erstwhile JSW Ispat Steel Limited pursuant to a Composite Scheme of Amalgamation and Arrangement was sanctioned by the Hon’ble Bombay High Court vide its Order dated 3 May 2013. The scheme was effective from 1 July 2012 being the appointed date. The Record Date fixed by the Company for the aforesaid allotments was 12 June 2013.
19. Other equity` in crores
Particulars As at 31 March 2018
As at 31 March 2017
General reserve (refer note (i) below) 10,281 10,420
Retained earnings 7,528 1,735
Other comprehensive income
Equity instruments through other comprehensive income 478 386
Effective portion of cash flow hedges (refer note (ii) below) 10 273
Foreign currency translation reserve (refer note (iii) below) (518) (527)Foreign currency monetary item translation difference account (FCMITDA) (refer note (iv) below)
(25) (4)
Other reserves
Capital reserve (refer note (v) below) 3,585 3,585
Capital redemption reserve (refer note (vi) below) 149 10
Capital reserve on bargain purchase 609 605
Securities premium reserve 5,417 5,417
Debenture redemption reserve (refer note (vii) below) 141 433
Equity settled share based payment reserve (refer note (viii) below) 41 13
Total 27,696 22,346
341
Notes to the Consolidated Financial Statements as at and for the year ended 31 March 2018
Better Everyday. In Pursuit of Excellence. Corporate Overview Statutory Reports Financial Statements
(i) General reserve Under the erstwhile Indian Companies Act, 1956, a general reserve was created through an annual transfer of net income
at a specified percentage in accordance with applicable regulations. The purpose of these transfers was to ensure that if a dividend distribution in a given year is more than 10.0% of the paid-up capital of the Company for that year, then the total dividend distribution is less than the total distributable results for that year.
Consequent to introduction of Companies Act, 2013, the requirement to mandatory transfer a specified percentage of the net profit to general reserve has been withdrawn and the Company can optionally transfer any amount from the surplus of profit or loss account to the General reserves.
(ii) Effective portion of cash flow hedges Effective portion of cash flow hedges represents the cumulative effective portion of gains or losses arising on changes
in fair value of hedging instruments entered into for cash flow hedges, which shall be reclassified to profit or loss only when the hedged transaction affects the profit or loss, or included as a basis adjustment to the non-financial hedged item, consistent with the Company accounting policy.
(iii) Foreign currency translation reserve Exchange differences relating to the translation of the results and net assets of the Group’s foreign operations from
their functional currencies to the Group’s presentation currency (i.e. Currency Units) are recognised directly in other comprehensive income and accumulated in the foreign currency translation reserve. Gains and losses on hedging instruments that are designated as hedging instruments for hedges of net investments in foreign operations are included in the foreign currency translation reserve. Exchange differences previously accumulated in the foreign currency translation reserve (in respect of translating both the net assets of foreign operations and hedges of foreign operations) are reclassified to profit or loss on the disposal of the foreign operation.
(iv) Foreign currency monetary item translation difference account (FCMITDA) The Group has continued with the policy adopted for accounting for exchange differences arising from translation
of long-term foreign currency monetary items recognised in the consolidated financial statements prepared under previous GAAP for the year ended 31 March, 2016. The reserve pertains to exchange differences relating to long-term foreign currency monetary items in so far as they do not relate to acquisition of depreciable capital assets, which are accumulated in 'Foreign Currency Monetary Item Translation Difference Account' and amortised in the Statement of Profit and Loss over the balance period of such long-term foreign currency monetary items.
(v) Capital reserve Reserve is created primarily on amalgamation as per statutory requirement.
(vi) Capital redemption reserve Reserve is created on redemption of preference shares as per statutory requirement.
(vii) Debenture redemption reserve The Indian Companies Act requires companies that issue debentures to create a debenture redemption reserve (DRR)
from annual profits until such debentures are redeemed. Companies are required to maintain 25% as a reserve of outstanding redeemable debentures. Accordingly, the Company creates DRR at 25% in the penultimate year to the year in which the repayment obligation arises on the Company. The amounts credited to the debenture redemption reserve will not be utilised except to redeem debentures.
(viii) Equity settled share based payment reserve The Group offers ESOP under which options to subscribe for the Company’s share have been granted to certain employees
and senior management. The share based payment reserve is used to recognise the value of equity settled share based payments provided as part of the ESOP scheme.

342
Notes to the Consolidated Financial Statements as at and for the year ended 31 March 2018
JSW Steel Limited | Integrated Report 2017-18
20. Borrowings` in crores
Particulars As at 31 March 2018 As at 31 March 2017
Non-current Current Non-current Current
Bonds (unsecured) 6,504 - 3,242 -
Debentures (secured) 4,141 563 4,703 1,648
Term loans:
Secured 12,905 2,815 16,084 1,414
Unsecured 6,475 1,570 6,109 2,692
Deferred government loans 77 21 88 15
Other loans:
Finance lease obligations 1,560 221 1,781 200
Preference shares (unsecured) 208 383 595 140
Unamortised upfront fees on borrowing (147) (80) (186) (72)
Total 31,723 5,493 32,416 6,037Less: Amount clubbed under Other financial liabilities (refer note 28)
- (5,493) - (6,037)
Total 31,723 - 32,416 -
Details of security and terms of repayment
` in crores
As at 31 March 2018 As at 31 March 2017Terms of Repayments Security
Non-current Current Non-current Current
Bonds (Unsecured)
3,252 - 3,242 - 5.25% Repayable on 12 November 2019
3,252 - - - 4.75% Repayable on 13 April 2022
6,504 - 3,242 -
Debentures (secured)
1,000 - 1,000 - 10.02% secured NCDs of ` 10,00,000 each are redeemable in two tranches:
a. ̀ 500 crores on 19 July 2023
b. ̀ 500 crores on 20 May 2023
First pari passu charge on 3.8 mtpa property, plant and equipment located at Vijayanagar Works, Karnataka (other than specifically carved out) and a flat situated at Vasind, Maharashtra.
180 - 180 - 8.75% Secured NCDs of ` 10,00,000 each is redeemable on 10 February 2022.
Secured/to be secured by way of first ranking charge on all movable and immovable property, plant and equipment both present and future and on lease hold rights over immovable property of pellet project situated at Village JuiBapuji, Taluka Alibaug, District Raigad, Maharashtra.
120 - 120 - 8.65% Secured NCDs of ` 10,00,000 each aggregating ` 120 crores is redeemable on 12 May 2020.
Secured by way of first ranking charge on all movable and immovable property, plant and equipment both present and future and on lease hold rights over immovable propoerty of pellet project situated at Village JuiBapuji, Taluka Alibaug, District Raigad, Maharashtra.

343
Notes to the Consolidated Financial Statements as at and for the year ended 31 March 2018
Better Everyday. In Pursuit of Excellence. Corporate Overview Statutory Reports Financial Statements
` in crores
As at 31 March 2018 As at 31 March 2017Terms of Repayments Security
Non-current Current Non-current Current
1,000 - 1,000 - 10.34% secured NCDs of ` 10,00,000 each are redeemable in three tranches:
a) ̀ 330 crores on 18 January 2022
b) ̀ 330 crores on 18 January 2023
c) ̀ 340 crores on 18 January 2024
First pari passu charge on property, plant and equipment related to 2.8 mtpa expansion project located at Vijayanagar Works, Karnataka and a flat at Vasind, Maharashtra.
400 - 400 - 9.72% secured NCDs of ` 10,00,000 each are redeemable on 23 December 2019.
First pari passu charge on 3.2 mtpa property, plant and equipment located at Vijayanagar Works, Karnataka (other than specifically carved out) and a flat situated at Vasind, Maharashtra.
700 - 700 - Secured zero coupon NCDs shall be redeemed at a premium of 12.15% p.a. accrued quarterly on 22 October 2019.
Secured by way of pledge of 40,000,000 equity shares of a subsidiary, held by JSW Steel Limited.
250 - 250 - 10.40% secured NCDs of ` 10,00,000 each are redeemable on 19 August 2019.
First pari passu charge on 3.2 mtpa property, plant and equipment located at Vijayanagar Works, Karnataka (other than specifically carved out) and a flat situated at Vasind, Maharashtra.
425 - 425 - 10.60% secured NCDs of ` 10,00,000 each are redeemable on 19 August 2019.
First pari passu charge on 3.2 mtpa property, plant and equipment located at Vijayanagar Works, Karnataka (other than specifically carved out) and a flat situated at Vasind, Maharashtra.
- 300 300 - 9.665% secured NCDs of ` 10,00,000 each are redeemable on 23 December 2018.
First pari passu charge on 3.2 mtpa property, plant and equipment located at Vijayanagar Works, Karnataka (other than specifically carved out) and a flat situated at Vasind, Maharashtra.
- 175 175 - 10.50% secured NCDs of ` 10,00,000 each are redeemable on 19 August 2018.
First pari passu charge on 3.2 mtpa property, plant and equipment located at Vijayanagar Works, Karnataka (other than specifically carved out) and a flat situated at Vasind, Maharashtra.
- - - 167 10.25% secured NCDs of ` 3,33,333 each are redeemed on 17 February 2018.
Pari passu first charge on all immovable properties and movable assets both present and future located at Salem Works in the State of Tamil Nadu.
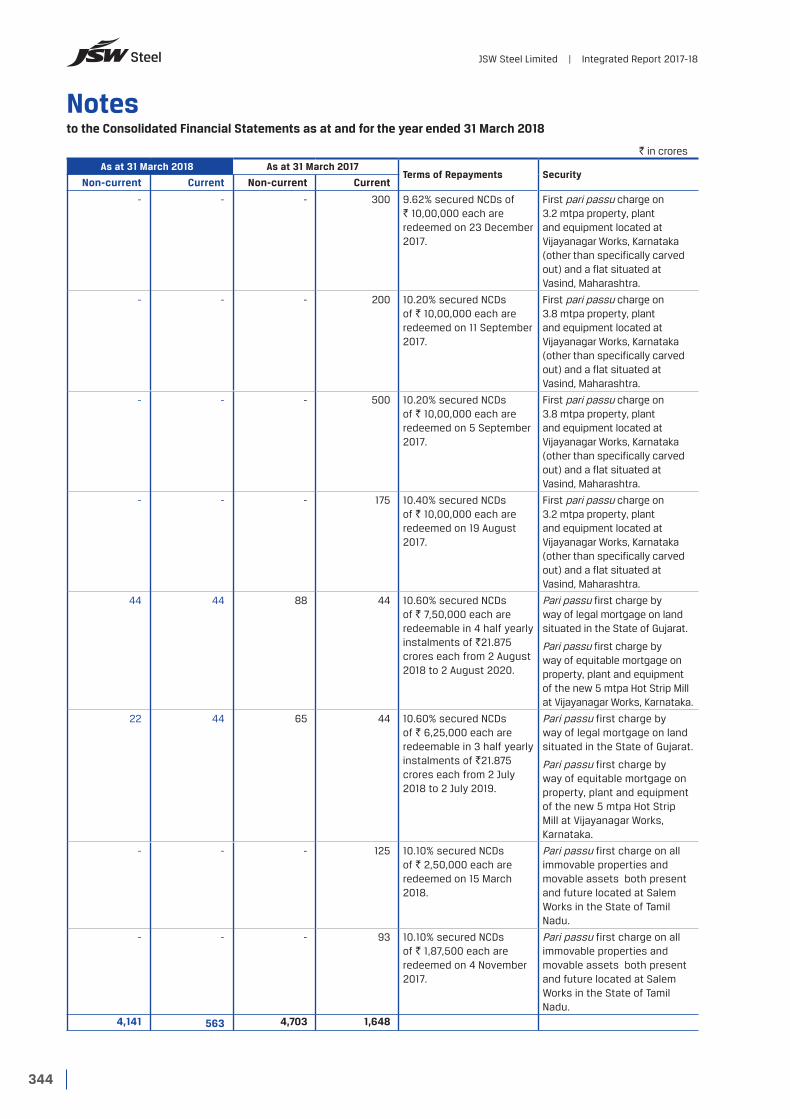
344
Notes to the Consolidated Financial Statements as at and for the year ended 31 March 2018
JSW Steel Limited | Integrated Report 2017-18
` in crores
As at 31 March 2018 As at 31 March 2017Terms of Repayments Security
Non-current Current Non-current Current
- - - 300 9.62% secured NCDs of ` 10,00,000 each are redeemed on 23 December 2017.
First pari passu charge on 3.2 mtpa property, plant and equipment located at Vijayanagar Works, Karnataka (other than specifically carved out) and a flat situated at Vasind, Maharashtra.
- - - 200 10.20% secured NCDs of ` 10,00,000 each are redeemed on 11 September 2017.
First pari passu charge on 3.8 mtpa property, plant and equipment located at Vijayanagar Works, Karnataka (other than specifically carved out) and a flat situated at Vasind, Maharashtra.
- - - 500 10.20% secured NCDs of ` 10,00,000 each are redeemed on 5 September 2017.
First pari passu charge on 3.8 mtpa property, plant and equipment located at Vijayanagar Works, Karnataka (other than specifically carved out) and a flat situated at Vasind, Maharashtra.
- - - 175 10.40% secured NCDs of ` 10,00,000 each are redeemed on 19 August 2017.
First pari passu charge on 3.2 mtpa property, plant and equipment located at Vijayanagar Works, Karnataka (other than specifically carved out) and a flat situated at Vasind, Maharashtra.
44 44 88 44 10.60% secured NCDs of ` 7,50,000 each are redeemable in 4 half yearly instalments of `21.875 crores each from 2 August 2018 to 2 August 2020.
Pari passu first charge by way of legal mortgage on land situated in the State of Gujarat.
Pari passu first charge by way of equitable mortgage on property, plant and equipment of the new 5 mtpa Hot Strip Mill at Vijayanagar Works, Karnataka.
22 44 65 44 10.60% secured NCDs of ` 6,25,000 each are redeemable in 3 half yearly instalments of `21.875 crores each from 2 July 2018 to 2 July 2019.
Pari passu first charge by way of legal mortgage on land situated in the State of Gujarat.
Pari passu first charge by way of equitable mortgage on property, plant and equipment of the new 5 mtpa Hot Strip Mill at Vijayanagar Works, Karnataka.
- - - 125 10.10% secured NCDs of ` 2,50,000 each are redeemed on 15 March 2018.
Pari passu first charge on all immovable properties and movable assets both present and future located at Salem Works in the State of Tamil Nadu.
- - - 93 10.10% secured NCDs of ` 1,87,500 each are redeemed on 4 November 2017.
Pari passu first charge on all immovable properties and movable assets both present and future located at Salem Works in the State of Tamil Nadu.
4,141 563 4,703 1,648

345
Notes to the Consolidated Financial Statements as at and for the year ended 31 March 2018
Better Everyday. In Pursuit of Excellence. Corporate Overview Statutory Reports Financial Statements
` in crores
As at 31 March 2018 As at 31 March 2017Terms of Repayments Security
Non-current Current Non-current CurrentTerm loans – secured Weighted average interest rate as on 31 March 2018 is 8.18%
712 38 750 - 8 Quarterly instalments of ` 18.75 crores each from 31 October 2018 – 31 July 2020.
16 Quarterly instalments of ` 37.50 crores each from 31 October 2020 – 31 July 2024.
First charge on property, plant and equipment situated at Dolvi works, Maharashtra.
875 100 975 25 7 Quarterly instalment of ` 25 crore each from 30 June 2018 – 31 December 2019.
16 Quarterly instalment of ` 50 crore each from 31 March 2020 – 31 December 2023.
First charge on 3.2 mtpa expansion property, plant and equipment situated at Vijayanagar Works Karnataka.
1,094 62 1,106 113 10 Quarterly instalments of ` 15.625 crores each from 30 April 2018 – 31 July 2020
4 Quarterly instalments of ` 62.50 crores each from 31 October 2020 – 31 July 2021
8 Quarterly instalments of ` 93.75 crores each from 31 October 2021 – 31 July 2023
First charge on property, plant and equipment situated at Dolvi works, Maharashtra.
962 75 1,037 50 3 quarterly instalments of ` 12.5 crores each from 30 July 2018 – 31 December 2018
12 quarterly instalments of ` 37.5 crores each from 31 March 2019 – 31 December 2021
4 quarterly instalments of ` 43.75 crores each from 31 March 2022 – 31 December 2022
2 quarterly instalments of ` 187.5 crores each from 31 March 2023 – 30 June 2023
First pari passu charge on 3.8 mtpa upstream assets (other than assets specifically carved out) at Vijayanagar Works, Karnataka.
1,600 150 1,750 100 2 Quarterly instalments of ` 25 crore each from 30 June 2018 – 30 September 2018
10 Quarterly instalments of ` 50 crore each from 31 December 2018 – 31 March 2021
4 Quarterly instalments of ` 125 crore each from 30 June 2021 – 31 March 2022
2 Quarterly instalments of ` 350 crore each from 30 June 2022- 30 September 2022.
First charge on property, plant and equipment situated at Dolvi works, Maharashtra.
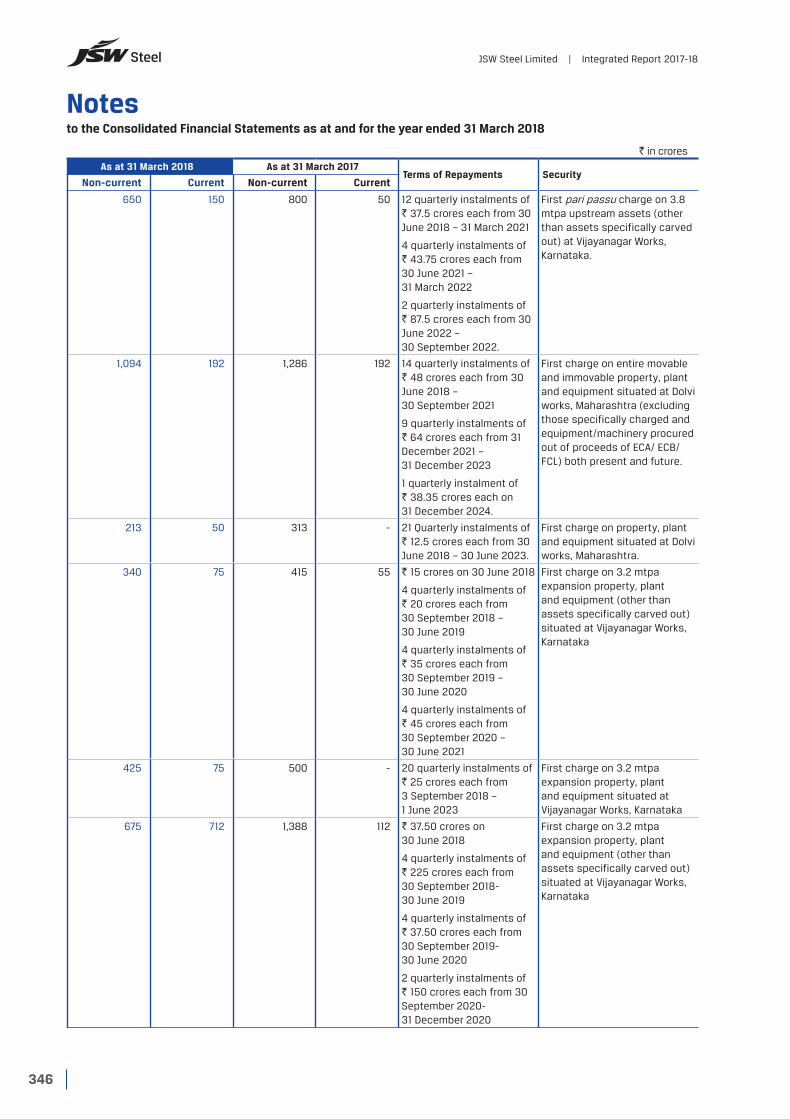
346
Notes to the Consolidated Financial Statements as at and for the year ended 31 March 2018
JSW Steel Limited | Integrated Report 2017-18
` in crores
As at 31 March 2018 As at 31 March 2017Terms of Repayments Security
Non-current Current Non-current Current
650 150 800 50 12 quarterly instalments of ` 37.5 crores each from 30 June 2018 – 31 March 2021
4 quarterly instalments of ` 43.75 crores each from 30 June 2021 – 31 March 2022
2 quarterly instalments of ` 87.5 crores each from 30 June 2022 – 30 September 2022.
First pari passu charge on 3.8 mtpa upstream assets (other than assets specifically carved out) at Vijayanagar Works, Karnataka.
1,094 192 1,286 192 14 quarterly instalments of ` 48 crores each from 30 June 2018 – 30 September 2021
9 quarterly instalments of ` 64 crores each from 31 December 2021 – 31 December 2023
1 quarterly instalment of ` 38.35 crores each on 31 December 2024.
First charge on entire movable and immovable property, plant and equipment situated at Dolvi works, Maharashtra (excluding those specifically charged and equipment/machinery procured out of proceeds of ECA/ ECB/FCL) both present and future.
213 50 313 - 21 Quarterly instalments of ` 12.5 crores each from 30 June 2018 – 30 June 2023.
First charge on property, plant and equipment situated at Dolvi works, Maharashtra.
340 75 415 55 ` 15 crores on 30 June 2018
4 quarterly instalments of ` 20 crores each from 30 September 2018 – 30 June 2019
4 quarterly instalments of ` 35 crores each from 30 September 2019 – 30 June 2020
4 quarterly instalments of ` 45 crores each from 30 September 2020 – 30 June 2021
First charge on 3.2 mtpa expansion property, plant and equipment (other than assets specifically carved out) situated at Vijayanagar Works, Karnataka
425 75 500 - 20 quarterly instalments of ` 25 crores each from 3 September 2018 – 1 June 2023
First charge on 3.2 mtpa expansion property, plant and equipment situated at Vijayanagar Works, Karnataka
675 712 1,388 112 ` 37.50 crores on 30 June 2018
4 quarterly instalments of ` 225 crores each from 30 September 2018- 30 June 2019
4 quarterly instalments of ` 37.50 crores each from 30 September 2019- 30 June 2020
2 quarterly instalments of ` 150 crores each from 30 September 2020- 31 December 2020
First charge on 3.2 mtpa expansion property, plant and equipment (other than assets specifically carved out) situated at Vijayanagar Works, Karnataka

347
Notes to the Consolidated Financial Statements as at and for the year ended 31 March 2018
Better Everyday. In Pursuit of Excellence. Corporate Overview Statutory Reports Financial Statements
` in crores
As at 31 March 2018 As at 31 March 2017Terms of Repayments Security
Non-current Current Non-current Current
450 38 - - 4 quarterly instalments of ` 9.375 crores each from 30 June 2018-31 March 2019
8 quarterly instalments of ` 18.75 crores each from 30 June 2019-31 March 2021
12 quarterly instalments of ` 25 crores each from 30 June 2021-31 March 2024
First pari passu charge on 3.8 mtpa property, plant and equipment located at Vijayanagar Works Karnataka (other than specifically carved out) and a flat situated at Vasind, Maharashtra.
219 31 - - 16 quarterly instalments of ` 15.625 crores each from 31 December 2018 to 30 September 2022
First pari passu charge on 3.8 mtpa property, plant and equipment located at Vijayanagar Works Karnataka (other than specifically carved out) and a flat situated at Vasind, Maharashtra.
650 100 750 100 Repayable in 10 quarterly instalments of ` 25 crores each from 30 June 2018 to 30 September 2020
12 quarterly instalments of ` 30 crores each from 31 December 2020 to 30 September 2023
4 quarterly instalments of ` 35 crores each from 31 December 2023 to 30 September 2024
First charge on entire immovable and movable property, plant and equipment of the respective entity both present and future
77 35 81 18 Repayable in equal monthly instalment in 10 Years
Secured by way of equitable mortgage by deposit of title deeds of project assets and by way of mortgage of Phase III of JSW township at Basapur village site, extention of mortgage of phase I & II of housing colony at torangallu, assignment of receivables from the property financed and comfort letter from the parent for loan repayment.
213 58 271 118 16 quarterly instalments of ` 14.57 from 30 July 2018 to 31 March 2022.
4 quarterly instalments of ` 9.65 crores from 30 June 2022 to 31 March 2023.
First ranking charge / mortgage / collateral on all movable and immovable property, plant and equipment both present and future and on lease hold rights over immovable property of coke oven project situated at Village JuiBapuji, Taluka Alibag, District Raigad, Maharashtra.
300 86 386 86 18 quarterly instalments of ` 21.428 crores from 30 June 2018 to 30 September 2022.
First ranking charge / mortgage / security interest on all movable and immovable property, plant and equipment both present and future and on lease hold rights over immovable property of pellet project situated at Village JuiBapuji Taluka Ali bag, District Raigad, Maharashtra.

348
Notes to the Consolidated Financial Statements as at and for the year ended 31 March 2018
JSW Steel Limited | Integrated Report 2017-18
` in crores
As at 31 March 2018 As at 31 March 2017Terms of Repayments Security
Non-current Current Non-current Current
553 85 638 85 4 quarterly instalments of `21.25 crore each from 30 April 2018 to 31 January 2019.
4 quarterly instalments of `23.91 crore each from 30 April 2019 to 31 January 2020.
12 quarterly instalments of `26.56 crore each from 30 April 2020 to 31 January 2023.
2 quarterly instalments of `69.06 crore each from 30 April 2023 to 31 July 2023.
First charge by way of legal mortgage on 2400sq. feet land at Toranagallu village in the state of Karnataka. First charge on the entire property, plant and equipment of the Company situated at Vasind, Tarapur and Kalmeshwar both present and future.
260 - - - 7 equal six-monthly instalments of principal payable from 31 July 2019 to 31 July 2022.
First pari-passu charge over all of the property, plant and equipment (other than specifically carved out assets) consisting of land and building with all other erections and structures thereon as well as plant and machineries along with spares tools and accessories both present and future.
- - 73 145 Prepaid on 17 April 2017 Secured by all assets of the Company
134 79 212 - ` 35 crores on 24 May 2018
` 178 crores is repayable in 16 quarterly instalments of ` 11 crores from 30 June 2018 to 31 March 2022.
First ranking charge / mortgage on all movable and immovable property, plant and equipment both present and future and on lease hold rights over immovable property of coke oven project situated at Village JuiBapuji, Taluka Alibag, District Raigad, Maharashtra.
312 104 415 52 Repayable in 3 instalments
USD 16 mio (equivalent ` 104.07 crores) in March 2019.
USD 24 mio each (equivalent ` 156.11 crores) in March 2020 and March 2021
Secured by CRM 1 assets at Vijayanagar both present and future.
867 434 2,594 - 3 equal annual instalments of USD 66.67 mio each (equivalent ` 433.64 crores) from October 2018 to October 2020.
Secured through an unconditional and irrevocable standby letter of credit to the bank based on the guarantee by JSW Steel Limited, India.
- - 259 - Prepaid on 17 April 2017 Secured by a guarantee issued by ultimate parent JSW Steel Limited. The loan is further secured by second charge on assets of Company’s 90% subsidiary.
- 85 85 113 3 quarterly instalments of USD 4.375 mio
Secured by first charge on all the assets of the respective entity.

349
Notes to the Consolidated Financial Statements as at and for the year ended 31 March 2018
Better Everyday. In Pursuit of Excellence. Corporate Overview Statutory Reports Financial Statements
` in crores
As at 31 March 2018 As at 31 March 2017Terms of Repayments Security
Non-current Current Non-current Current
3 1 - - 42 varing instalments commencing from April 2018 to September 2021
Secured against equipments for its Preparation plant
227 - - - 28 equal quarterly instalment of USD 1.25 mio (equivalent ` 8.13 crore) each from 30 September 2019 to 30 June 2026.
First pari-passu charge on 1.5 MTPA coke oven plant at Dolvi
12,905 2,815 16,084 1,414 Total secured
Term loans – unsecured Weighted average interest rate as on 31 March 2018- 4.66%
- 250 250 - 2 quarterly instalments of ` 125 crores each from 30 June 2018 to 30 September 2018
- 400 - - ` 150 crores on 31 July 2018 and `250 crores 31 December 2018
- 250 - - ` 50 crores on 15 November 2018, ` 200 crores each from 15 December 2018
- 75 - - 3 monthly instalments of ` 25 crore each from 15 October 2018 to 15 December 2018
634 188 819 187 7 half yearly instalments of ` 54.10 crores each from 31 May 2018 to 31 March 2021.
11 half yearly instalments of ` 34.57 crores each from 30 April 2018 to 30 April 2023
12 half yearly instalments of ` 5.26 crores each from 18 September 2018 to 18 March 2024.
62 12 74 12 12 half yearly instalments of ` 6.19 crores each from 28 August 2018 to 28 February 2024
116 19 131 18 12 half yearly instalments of ` 2.93 crores each from 31 July 2018 to 31 January 2024.
13 half yearly instalments of ` 1.04 crores each from 30 April 2018 to 30 April 2024
16 semi-annual instalments of `1.97 crores each from 25 September 2018 to 25 March 2026
16 semi-annual instalments of `1.96 crores each from 25 September 2018 to 25 March 2026.
17 semi-annual instalments of `1.375 crores each from 25 June 2018 to 25 June 2026.

350
Notes to the Consolidated Financial Statements as at and for the year ended 31 March 2018
JSW Steel Limited | Integrated Report 2017-18
` in crores
As at 31 March 2018 As at 31 March 2017Terms of Repayments Security
Non-current Current Non-current Current
58 12 69 12 12 half yearly instalments of ` 5.80 crores each from 30 September 2018 to 31 March 2024
1,626 - 1,621 - Repayable on 20 March 2020
361 73 423 71 11 half yearly instalments of ` 15.91 crores each from 19 July 2018 to 19 July 2023 and 1 half yearly instalment of ` 15.90 crores on 19 January 2024.
3.39% 11 half yearly instalments of ` 20.72 crores each from 19 July 2018 to 19 July 2023 and 1 half yearly instalment of ` 15.74 crores on 19 January 2024.
198 34 227 33 13 equal semi-annual instalments of ` 5.59 crores each from 9 July 2018 to 9 July 2024 and 1 semi-annual instalment of ` 4.92 crores on 9 January 2025
13 equal semi-annual instalments of ` 11.22 crores each from 9 July 2018 to 9 July 2024 and 1 semi-annual instalment of ` 8.13 crores on 9 January 2025
313 9 321 9 13 equal semi-annual instalments of `2.97 crores each from 25 September 2018 to 25 September 2024 and 1 semi-annual instalment of ` 2.51 crores on 25 March 2025
3 equal annual instalments of ` 86.73 from 13 August 2019 to 13 August 2021
14 equal semi-annual instalments of ` 1.46 crores each from 25 September 2018 to 25 March 2025
- 85 80 80 1 yearly instalment of ` 85 crores on 26 July 2018.
- - - 363 Repaid on 28 August 2017.
- - - 1,459 Repaid on 26 June 2017
48 10 49 8 12 equal semi-annual instalments of ` 4.82 crores each from 15 June 2018 to 15 December 2023.

351
Notes to the Consolidated Financial Statements as at and for the year ended 31 March 2018
Better Everyday. In Pursuit of Excellence. Corporate Overview Statutory Reports Financial Statements
` in crores
As at 31 March 2018 As at 31 March 2017Terms of Repayments Security
Non-current Current Non-current Current
463 98 560 - Repayable in 3 tranches:
a) ̀ 98 crores on 27 April 2018
b) ̀ 225 crores on 27 April 2020
c) ̀ 238 crores on 27 April 2021
66 8 60 7 18 semi-annual instalments of `4.132 crores each from 31 July 2018 to 31 January 2027
976 - 973 - 3 equal instalments of ` 325.22 crores each on 2 April 2020, 21 September 2020 and 21 March 2021
586 - 357 - Repayable in 3 tranches:
a) ̀ 325 crores on 21 February 2022
b) ̀ 33 crores on 6 March 2022
c) ̀ 228 crores on 3 July 2022
650 - - - 4 annual instalments of `162.61 crores from 12.10.2021 to 12.11.2024
85 11 95 12 16 semi-annual instalments of `4.07 crores each from 30 July 2018 to 31 January 2026
16 semi-annual instalments of `1.904 crores each from 30 August 2018 to 28 February 2026
33 - - - Repayable in 3 equal annual repayments of $1.67 million (equivalent ` 11 crores each) from 28 March 2023 to 28 March 2025
194 34 - 421 Repayable in 3 tranches:
USD 5 mio is repayable on 9 March 2019
USD 5 mio is repayable on 9 March 2020
USD 25 mio is repayable on 9 March 2021
6 2 - - 5 equal annual instalments of USD 0.24 mio each
6,475 1,570 6,109 2,692 Total unsecured

352
Notes to the Consolidated Financial Statements as at and for the year ended 31 March 2018
JSW Steel Limited | Integrated Report 2017-18
` in crores
As at 31 March 2018 As at 31 March 2017Terms of Repayments Security
Non-current Current Non-current Current
Deferred government loans (unsecured)
65 18 73 12 42 varying monthly instalments starting from 30 April 2018 to 31 August 2021.
1 1 2 2 5 equal annual instalments till June 2019
11 2 13 1 6 equal annual instalments starting after 12 years of disbursement till July 2031
77 21 88 15 Total
Finance lease obligations
1,560 221 1,781 200 Refer note 46
Preference shares (unsecured)
- 140 140 140 10% CRPS, Redeemable at par in 2 quarterly instalments starting from 15 June 2018
195 243 397 - 0.01% CRPS, Redeemable at par in 8 quarterly instalments starting from 15 June 2018
13 - 58 - 10% non-cumulative, Redeemable at their face value after 15 years from the date of allotment at 20% per annum pn or before 31 March of each year starting from the 16th year and ending on or before 31 March of the 20th year.
208 383 595 140

353
Notes to the Consolidated Financial Statements as at and for the year ended 31 March 2018
Better Everyday. In Pursuit of Excellence. Corporate Overview Statutory Reports Financial Statements
21. Other financial liabilities (Non-current) ` in crores
Particulars As at 31 March 2018 As at 31 March 2017
Non-current Current Non-current Current
Rent and other deposits 22 98 63 -
Retention money for capital projects 30 378 14 283
Premium on redemption of debentures 355 - 236 -
Acceptance for capital projects 505 - 169 -
Other payables 7 - 4 105
Total 919 476 486 388
Less: Amount clubbed under Other financial liabilities (refer note 28)
- (476) - (388)
Total 919 - 486 -
Acceptance for capital projects include credit availed by the group from banks for payment to suppliers for capital items purchased by the Group and these arrangements are interest-bearing.
22. Provisions ` in crores
Particulars As at 31 March 2018 As at 31 March 2017
Non-current Current Non-current Current
Provision for employee benefits
Provision for compensated absences (refer note 40) 87 33 80 30
Provision for gratuity (refer note 40) 36 139 4 161
Other provisions
Provision for contingency 2 - 2 -
Mine closure provision 12 - 9 -
Others 1 12 2 11
Total 138 184 97 202
` in crores
Particulars As at 31 March 2018
As at 31 March 2017
Provision for contingency
Balance as at the beginning of the year 2 15
Utilisation during the year - (13)
Balance as at the end of the year 2 2
Mine closure provision
Balance as at the beginning of the year 9 10
Created during the year 3 -
Movement on account of exchange rate variation - (1)
Balance as at the end of the year 12 9
Others
Balance as at the beginning of the year 13 13
Movement during the year - -
Balance as at the end of the year 13 13
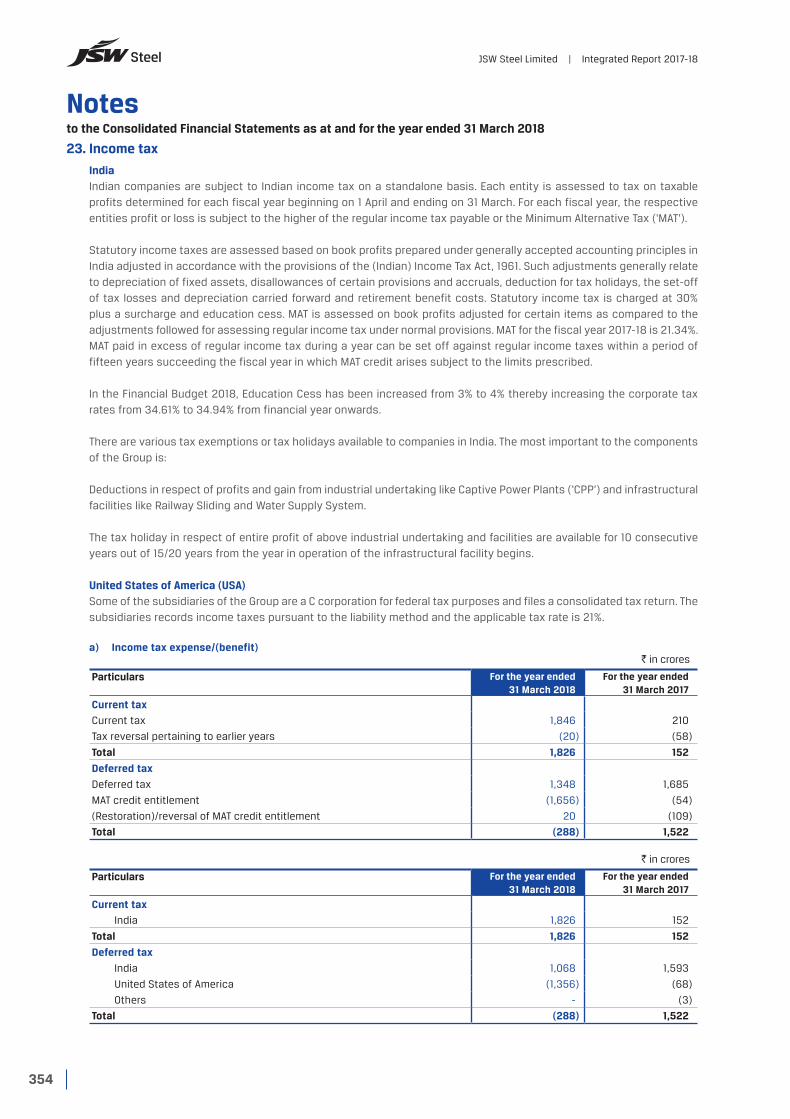
354
Notes to the Consolidated Financial Statements as at and for the year ended 31 March 2018
JSW Steel Limited | Integrated Report 2017-18
23. Income tax
IndiaIndian companies are subject to Indian income tax on a standalone basis. Each entity is assessed to tax on taxable profits determined for each fiscal year beginning on 1 April and ending on 31 March. For each fiscal year, the respective entities profit or loss is subject to the higher of the regular income tax payable or the Minimum Alternative Tax ('MAT').
Statutory income taxes are assessed based on book profits prepared under generally accepted accounting principles in India adjusted in accordance with the provisions of the (Indian) Income Tax Act, 1961. Such adjustments generally relate to depreciation of fixed assets, disallowances of certain provisions and accruals, deduction for tax holidays, the set-off of tax losses and depreciation carried forward and retirement benefit costs. Statutory income tax is charged at 30% plus a surcharge and education cess. MAT is assessed on book profits adjusted for certain items as compared to the adjustments followed for assessing regular income tax under normal provisions. MAT for the fiscal year 2017-18 is 21.34%. MAT paid in excess of regular income tax during a year can be set off against regular income taxes within a period of fifteen years succeeding the fiscal year in which MAT credit arises subject to the limits prescribed.
In the Financial Budget 2018, Education Cess has been increased from 3% to 4% thereby increasing the corporate tax rates from 34.61% to 34.94% from financial year onwards.
There are various tax exemptions or tax holidays available to companies in India. The most important to the components of the Group is:
Deductions in respect of profits and gain from industrial undertaking like Captive Power Plants (‘CPP’) and infrastructural facilities like Railway Sliding and Water Supply System.
The tax holiday in respect of entire profit of above industrial undertaking and facilities are available for 10 consecutive years out of 15/20 years from the year in operation of the infrastructural facility begins.
United States of America (USA)Some of the subsidiaries of the Group are a C corporation for federal tax purposes and files a consolidated tax return. The subsidiaries records income taxes pursuant to the liability method and the applicable tax rate is 21%.
a) Income tax expense/(benefit) ` in crores
Particulars For the year ended 31 March 2018
For the year ended 31 March 2017
Current tax
Current tax 1,846 210
Tax reversal pertaining to earlier years (20) (58)
Total 1,826 152
Deferred tax
Deferred tax 1,348 1,685
MAT credit entitlement (1,656) (54)
(Restoration)/reversal of MAT credit entitlement 20 (109)
Total (288) 1,522
` in crores
Particulars For the year ended 31 March 2018
For the year ended 31 March 2017
Current tax
India 1,826 152
Total 1,826 152
Deferred tax
India 1,068 1,593
United States of America (1,356) (68)
Others - (3)
Total (288) 1,522

355
Notes to the Consolidated Financial Statements as at and for the year ended 31 March 2018
Better Everyday. In Pursuit of Excellence. Corporate Overview Statutory Reports Financial Statements
A reconciliation of income tax expense applicable to accounting profit / (loss) before tax at the statutory income tax rate to recognised income tax expense for the year indicated are as follows:
` in crores
Particulars For the year ended 31 March 2018
For the year ended 31 March 2017
Profit before tax 7,609 5,128
Enacted tax rate in India 34.608% 34.608%
Expected income tax expense at statutory tax rate 2,634 1,775
Expenses not deductible in determining taxable profits 175 40
Income exempt from taxation (232) (138)
Tax holiday and similar concessions (9) (100)
Effect of different tax rates of subsidiaries in other jurisdictions 120 85Effect on opening deferred taxes resulting from tax rate changes (refer note below)
(572) -
Minimum alternate tax - (109)
Deferred tax assets not recognised (51) 70
Dividend distribution tax 46 (16)Effect of recognition of deferred tax assets on unused tax losses (refer note below)
(729) -
Others 156 67
Total 1,538 1,674
Effective tax rate 20.22% 32.65%
There are certain income-tax related legal proceedings which are pending against the Group. Potential liabilities, if any have been adequately provided for, and the Group does not currently estimate any probable material incremental tax liabilities in respect of these matters (refer note 43).
In view of the improving operational performance of components based in the United States of America (USA), the Group during the year ended 31 March 2018 has recognised a deferred tax asset amount to ` 729 crores on the unused tax losses to the extent the components has sufficient taxable temporary differences.
Pursuant to the enactment of Tax Cuts and Jobs Act by the USA on 22 December 2017, the corporate income tax rate for components of Group based in USA has been reduced to 21% resulting in a reversal of deferred tax liabilities amounting to ` 572 crores during the year.
b) Deferred tax assets / (liabilities) The following is the analysis of deferred tax assets / (liabilities) balances presented in the balance sheet:
` in crores
Particulars As at31 March 2018
As at 31 March 2017
Deferred tax liabilities (2,604) (3,074)
Deferred tax assets 48 84
Total (2,556) (2,990)

356
Notes to the Consolidated Financial Statements as at and for the year ended 31 March 2018
JSW Steel Limited | Integrated Report 2017-18
Significant component of deferred tax assets / (liabilities) and movement during the year are as under:
` in crores
Deferred tax balance in relation to
As at 31 March 2017
Acquired pursuant to
business combination
For the year ended 31 March 2018 As at31 March 2018Recognised
/ reversed through profit
and loss
Recognised in / reclassified
from OCI
Others
Property, plant and equipment
(11,325) - 562 - 1 (10,762)
Carried forward business loss/ unabsorbed depreciation
4,300 - (1,984) - 5 2,321
Expense deductible on payment basis
325 - 116 2 - 443
Minimum alternate tax (MAT) credit
2,837 - 1,636 - - 4,473
Cashflow hedges / FCMITDA
(142) - 11 150 - 19
Finance lease obligations
744 - (32) - - 712
Others 271 - (21) - (12) 238
Total (2,990) - 288 152 (6) (2,556)
` in crores
Deferred tax balance in relation to
As at 1 April 2016
Acquired pursuant to
business combination
For the year ended 31 March 2017 As at31 March 2017Recognised
/ reversed through profit
and loss
Recognised in / reclassified
from OCI
Others
Property, plant and equipment
(10,158) (42) (1,154) - 29 (11,325)
Carried forward business loss/ unabsorbed depreciation
3,565 - 735 - - 4,300
Expense deductible on payment basis
1,708 - (1,390) 7 - 325
Minimum alternate tax (MAT) credit
2,674 - 163 - - 2,837
Cashflow hedges / FCMITDA
81 - - (223) - (142)
Finance lease obligations
572 - 172 - - 744
Others 318 2 (48) - (1) 271
Total (1,240) (40) (1,522) (216) 28 (2,990)
The Group offsets deferred tax assets and liabilities if and only if it has a legally enforceable right to set off current tax assets and current tax liabilities and relates to income taxes levied by the same tax authority.
Deferred tax assets on carry forward business loss/ unabsorbed depreciation have been recognised to the extent of deferred tax liabilities on taxable temporary differences available. It is expected that any reversals of the deferred tax liability would be offset against the reversal of the deferred tax asset at respective entities.
The deferred tax liabilities on temporary differences associated with investment in subsidiaries which have not been recognised aggregate to ` 216 crores (31 March 2017: ` 146 crores), where the Group is able to control the reversal of the temporary difference and it is probable that the temporary difference will not reverse in the foreseeable future.
The Group expects to utilise the MAT credit within a period of 15 years.

357
Notes to the Consolidated Financial Statements as at and for the year ended 31 March 2018
Better Everyday. In Pursuit of Excellence. Corporate Overview Statutory Reports Financial Statements
Expiry schedule of losses on which deferred tax assets is not recognised is as under
` in crores
Expiry of losses (as per local tax laws)
2018-19 2019-20 2020-21 2021-22 2022-23 Beyond 5 years
Indefinite Total
I. Business losses 64 70 76 76 83 308 303 980II. Unabsorbed depreciation - - - - - - 60 60
III. Long-term capital losses - - - 203 3 - - 206IV. Short-term capital losses - - - - @ - - @
Total 64 70 76 279 86 308 363 1,246
@ - ` 0.07 crores
24. Other non-current liabilities ` in crores
Particulars As at 31 March 2018
As at 31 March 2017
Deposits for township property 13 17
Share warrants 14 14
Export obligation deferred income* 101 21
Other payables 8 3
Total 136 55
* Represents government assistance in the form of the duty benefit availed under Export Promotion Capital Goods (EPCG) Scheme and Special Economic Zone (SEZ) scheme on purchase of property, plant and equipment accounted for as government grant and being amortised over the useful life of such assets.
25. Borrowings (current) ` in crores
Particulars As at 31 March 2018 As at 31 March 2017
Loan repayable on demand
Working capital loans from banks (secured)
Rupee loans 162 57
Foreign currency loans 96 -
Foreign currency loans from bank (unsecured) 662 103
Rupee term loans from banks (unsecured) 24 405
Commercial papers (unsecured) 1,233 4,316
Total 2,177 4,881
Borrowing have been drawn at following rate of interest
Particulars Rates of interest
Working capital loans from banks 8.45% p.a. to 9.45% p.a.
Commercial Papers 7.12% p.a. to 7.25% p.a.
EPC 8.30% p.a.
PCFC 2.30% p.a. to 3.25% p.a
Working capital loans of ` 258 crores (31 March 2017 – ` 57 crores) are secured by:
i) pari passu first charge by way of hypothecation of stocks of raw materials, finished goods, work-in-process, consumables (stores and spares) and book debts / receivables of the Company and the respective subsidiary, both present and future.
ii) pari passu second charge on movable properties and immovable properties forming part of the property, plant and equipment of the Company and the respective subsidiary, both present and future except such properties as may be specifically excluded.

358
Notes to the Consolidated Financial Statements as at and for the year ended 31 March 2018
JSW Steel Limited | Integrated Report 2017-18
26. Trade payables ` in crores
Particulars As at 31 March 2018
As at 31 March 2017
Acceptances 9,033 9,502
Other than acceptances 6,911 3,846
Total 15,944 13,348
Acceptances include credit availed by the Group from banks for payment to suppliers for raw materials purchased by the Group. The arrangements are interest-bearing and are payable within one year.
Other than acceptances payables are normally settled with 1 to 180 days.
27. Derivative Liabilities ` in crores
Particulars As at 31 March 2018
As at 31 March 2017
Forward contract 45 273
Commodity contract 45 39
Interest rate swaps 5 @
Currency options 1 106
Total 96 418
@ - ` 0.19 crores
28. Other financial liabilities (Current) ` in crores
Particulars As at 31 March 2018
As at 31 March 2017
Current maturities of long-term borrowings (refer note 20) 5,272 5,837
Current maturities of finance lease obligations (refer note 20) 221 200
Current dues of other financial liabilities (refer note 21) 476 388
Payables for capital projects
Acceptances 716 1,015
Other than acceptances 633 771
Interest accrued but not due on borrowings 431 437
Payables to employees 152 138
Unclaimed matured debentures and accrued interest thereon @ @
Unclaimed dividends 23 18
Unclaimed amount of sale proceeds of fractional shares 3 3
Others (includes forward contract payable, dharmada payable etc.) 688 650
Total 8,615 9,457
@ - ` 0.38 crores
Acceptance includes credit availed by the group from banks for payment to suppliers for capital items. The arrangements are interest-bearing and are payable within one year.
29. Other current liabilities ` in crores
Particulars As at 31 March 2018
As at 31 March 2017
Advances from customers 370 377
Statutory liabilities 1,012 670
Export obligation deferred income * 167 156
Others 15 6
Total 1,564 1,209
* Represents government assistance in the form of the duty benefit availed under Export Promotion Capital Goods (EPCG) Scheme and Special Economic Zone (SEZ) scheme on purchase of property, plant and equipment accounted for as government grant and being amortised over the useful life of such assets.

359
Notes to the Consolidated Financial Statements as at and for the year ended 31 March 2018
Better Everyday. In Pursuit of Excellence. Corporate Overview Statutory Reports Financial Statements
30. Revenue from operations` in crores
Particulars For the year ended 31 March 2018
For the year ended 31 March 2017
Sale of products (a) 70,091 59,560
Other operating revenues
Government grant income (including gain on prepayment of deferred government loan)
1,157778
Miscellaneous income 255 198
Total (b) 1,412 976
Total (a+b) 71,503 60,536
(i) Revenue from operations for periods up to 30 June 2017 includes excise duty, which is discontinued effectively 1 July 2017 upon implementation of Goods and Service Tax (GST). In accordance with 'Ind AS 18 - Revenue', GST is not included in Revenue from operations. In view of the aforesaid change in indirect taxes, Revenue from operations for the year ended 31 March 2018 is not comparable to the year ended 31 March 2017.
(ii) The Group units in the State of Maharashtra is eligible for a deferral of VAT / CST collected on sale of finished goods under Package Scheme of Incentive (PSI) – 1993 and refund of VAT/CST on sales under PSI 2007, which is accounted as a government grant. The Government of Maharashtra vide its notification dated 14 February 2018 has announced that the Industrial promotion Subsidy (IPS) schemes would be continued in the GST regime with the incentives being determined based on the State GST in place of the erstwhile VAT. However, the process of disbursing the incentives has not been notified yet. The Group believes that the process of disbursement of incentives would continue to remain unchanged and accordingly has recognised the government grant of ` 620 crores for the year ended 31 March 2018.
(iii) The Group’s unit at Vijayanagar in the State of Karnataka is eligible for VAT/CST incentive on sale of finished goods under Industrial policy 2009-14. The Government of Karnataka vide its notification dated 13 March 2018 has announced that the incentives schemes would be continued in the GST regime with the incentives being determined based on the SGST rate in place of the erstwhile VAT rate. Since the Group has started receiving the grant during the quarter, the Group has recognised an amount of ` 277 crores as government grant income for the year ended 31 March 2018 including an amount of ` 104 crores in relation to earlier years.
31. Other income ` in crores
Particulars For the year ended 31 March 2018
For the year ended 31 March 2017
Interest income earned on financial assets that are not designated as FVTPL
Loans to related parties 15 5
Bank deposits 47 42
Others 58 50
Dividend income from non-current investments designated as FVTOCI 5 20
Gain on sale of current investments designated as FVTPL 19 6
Fair value gain on financial instruments designated as FVTPL 3 9
Miscellaneous income (insurance claim received, rent income etc.) 20 20
Total 167 152
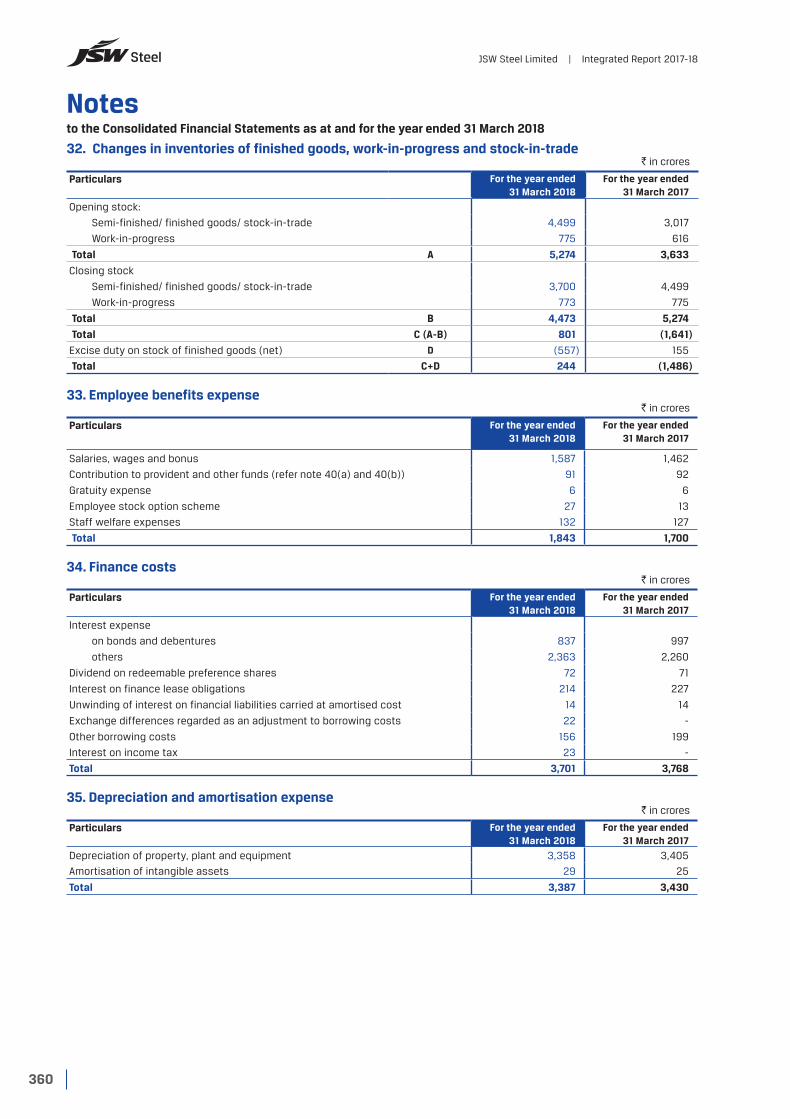
360
Notes to the Consolidated Financial Statements as at and for the year ended 31 March 2018
JSW Steel Limited | Integrated Report 2017-18
32. Changes in inventories of finished goods, work-in-progress and stock-in-trade ` in crores
Particulars For the year ended31 March 2018
For the year ended31 March 2017
Opening stock:
Semi-finished/ finished goods/ stock-in-trade 4,499 3,017
Work-in-progress 775 616
Total A 5,274 3,633
Closing stock
Semi-finished/ finished goods/ stock-in-trade 3,700 4,499
Work-in-progress 773 775
Total B 4,473 5,274
Total C (A-B) 801 (1,641)
Excise duty on stock of finished goods (net) D (557) 155
Total C+D 244 (1,486)
33. Employee benefits expense ` in crores
Particulars For the year ended31 March 2018
For the year ended31 March 2017
Salaries, wages and bonus 1,587 1,462
Contribution to provident and other funds (refer note 40(a) and 40(b)) 91 92
Gratuity expense 6 6
Employee stock option scheme 27 13
Staff welfare expenses 132 127
Total 1,843 1,700
34. Finance costs ` in crores
Particulars For the year ended 31 March 2018
For the year ended 31 March 2017
Interest expense
on bonds and debentures 837 997
others 2,363 2,260
Dividend on redeemable preference shares 72 71
Interest on finance lease obligations 214 227
Unwinding of interest on financial liabilities carried at amortised cost 14 14
Exchange differences regarded as an adjustment to borrowing costs 22 -
Other borrowing costs 156 199
Interest on income tax 23 -
Total 3,701 3,768
35. Depreciation and amortisation expense ` in crores
Particulars For the year ended 31 March 2018
For the year ended 31 March 2017
Depreciation of property, plant and equipment 3,358 3,405
Amortisation of intangible assets 29 25
Total 3,387 3,430

361
Notes to the Consolidated Financial Statements as at and for the year ended 31 March 2018
Better Everyday. In Pursuit of Excellence. Corporate Overview Statutory Reports Financial Statements
36. Other expenses ` in crores
Particulars For the year ended31 March 2018
For the year ended31 March 2017
Stores and spares consumed 3,033 2,724
Power and fuel 5,697 4,883
Rent 56 61
Repairs and maintenance
Plant and equipment 1,197 1,177
Buildings 33 30
Others 57 41
Insurance 81 104
Rates and taxes 70 102
Carriage and freight 2,172 2,278
Jobwork and processing charges 769 637
Commission on sales 70 56
Net loss / (gain) on foreign currency transactions and translation # 56 559
Donations and contributions 3 -
Fair value loss on financial instruments designated as FVTPL 111 -
Miscellaneous expenses 900 680
Bad debts / advances written off - 1
Less: Allowance made in earlier years - (1)
Allowance for doubtful debts and advances 136 1
Loss on sale of plant and equipment (net) 122 134
Total 14,563 13,467
# including hedging cost of ` 250 crores (previous year ` 365 crores).
37. Earnings per share (EPS)Particulars For the year ended
31 March 2018For the year ended
31 March 2017
Profit attributable to equity shareholders (A) (` in crores) 6,214 3,523
Weighted average number of equity shares for basic EPS (B) 2,404,152,929 2,402,584,542
Effect of dilution:
Weighted average number treasury shares held through ESOP trust 13,067,511 14,635,898
Weighted average number of equity shares adjusted for the effect of dilution(C) 2,417,220,440 2,417,220,440
Earnings per share of `1 each
Basic (`) (A / B) 25.85 14.66
Diluted (`) (A / B) 25.71 14.58

362
Notes to the Consolidated Financial Statements as at and for the year ended 31 March 2018
JSW Steel Limited | Integrated Report 2017-18
38. Employee share based payment plans
ESOP SCHEME 2012 The Company offered equity based share option scheme for permanent employees of the Company and its subsidiaries
in the grade of L8 and above including any director except to any employee who is a promoter or a director who either himself or through relatives or through anybody directly or indirectly holds more than 10% of the outstanding equity shares of the Company.
The grant is determined as percentage of Total Fixed Pay. The grant was at such price as determined by the ESOP Committee and be specified in the Grant. The option shall not be transferable and can be exercised only by the employees of the Company.
The Employees Stock Ownership Plan was effective from 26 July 2012. The eligible employees can exercise the option anytime between the vesting period till 30 September 2017.
The number of options granted to each eligible employees is determined by dividing the Award Value (amount equivalent to percentage of Annual Fix Pay) by the Fair Value of option provided. The Fair Value of option on the date of each grant is determined by using Black Scholes model.
The details of an employee share based payments plan operated through a trust for ESOP 2012 are as follows:
Option series Options granted
Options vested
Grant date Vesting period Exercise price
Fair value at grant date
Method of settlement
Initial grant - 26 July 2012
31,357,440 26,318,680 26 July 2012 30 September 2013 till 30 September
2017
70 36.81 Equity
1st Subsequent grant - 26 July 2012
16,024,800 12,430,410 26 July 2012 30 September 2014 till 30 September
2017
70 33.23 Equity
ESOP SCHEME 2016 The Board of Directors of the Company at its meeting held on 29 January 2016, formulated the JSWSL EMPLOYEES
STOCK OWNERSHIP PLAN 2016 ('ESOP Plan'). At the said meeting, the Board authorised the ESOP Committee for the superintendence of the ESOP Plan.
During the year, ESOP 2016 is the primary arrangement under which shared plan service incentives are provided to certain specified employees of the Company and it’s subsidiaries in India.
Three grants would be made under ESOP plan 2016 to eligible employees on the rolls of the Company as at 1 April 2016, 1 April 2017 and 1 April 2018.
The maximum value and share options that can be awarded to eligible employees is calculated by reference to certain percentage of individuals fixed salary compensation. 50% of the grant would vest at the end of the third year and 50% of the grant would vest at the end of the fourth year with a vesting condition that the employee is in continuous employment with the Company till the date of vesting.
The exercise price would be determined by the ESOP committee as a certain discount to the primary market price on the date of grant.
A total of 28,687,000 options would be available for grant to the eligible employees of the Company and a total of 3,163,000 options would be available for grant to the eligible employees of the Indian subsidiaries of the Company under the ESOP Plan.
These options are equity settled and are accounted for in accordance with the requirement applying to equity settled transactions.

363
Notes to the Consolidated Financial Statements as at and for the year ended 31 March 2018
Better Everyday. In Pursuit of Excellence. Corporate Overview Statutory Reports Financial Statements
The details of an employee share based payments plan operated through a trust for ESOP 2016 are as follows:
Option series Options granted
Options vested
Grant date Vesting period Exercise price
Fair value at grant date
Method of settlement
1st Grant- 17 May 2016
7,436,850 NIL 17 May 2016 17 May 2016 till 31 March 2019 (for 50% of the grant) and 17 May 2016 to 31 March 2020 (for remaining 50% of the grant)
103.65 67.48 Equity
2nd Grant- 16 May 2017
5,118,977 NIL 16 May 2017 16 May 2017 till 31 March, 2020 (for 50% of the grant) and 16 May 2017 to 31 March, 2021 (for remaining 50% of the grant)
161.36 104.04 Equity
The outstanding position as at 31 March 2018 is summarised below:
Particulars ESOP 2012 ESOP 2016
Initial Grant (Junior Manager & Above)
1st Subsequent Grant (Junior Manager &
Above)
1st Grant (L-16 and above Grade)
2nd Grant (L-16 and above Grade)
Date of grant 26 July 2012 26 July 2012 17 May 2016 16 May 2017
Share Price on date of grant 66.97 66.97 129.56 201.70
Outstanding as on 1 April 2016 6,332,620 8,221,570 - -Granted during the year - - 7,436,850 -
Transfer out 29,890 32,760 - -
Forfeited / lapsed during the year 14,200 69,990 224,650 -
Exercised during the year 3,171,030 4,776,990 - -
Outstanding as on 31 March 2017 3,117,500 3,341,830 7,212,200 -Granted during the year - - - 5,118,977
Transfer in 28,120 18,320 283,280 163,812
Transfer out - - 596,700 301,513
Forfeited / lapsed during the year 83,450 60,530 126,640 70,405
Exercised during the year 3,062,170 3,299,620 - -
Outstanding as on 31 March 2018 - - 6,772,140 4,910,871
Vesting Period 30 September 2013 till 30 September 2017
30 September 2014 till 30 September 2017
17 May 2016 till 31 March 2019 (for 50% of the grant) and 17 May 2016 to 31 March 2020 (for remaining 50% of the grant)
16 May 2017 till 31 March 2020 for 50% of the options granted and upto 31 March 2021 for remaining 50% of the options granted
Weighted average remaining contract life
Not Applicable Not Applicable 30 months 42 months
Exercise Price 70 70 103.65 161.36
Weighted average share price on exercise date
231.27 234.70 Not Applicable Not Applicable
A description of the method and significant assumptions used during the year to estimate the fair value of options including the following information:
The fair value of options has been calculated by using Black Schole’s Method. The assumptions used in the above are:
The fair value of options has been calculated by using Black Schole’s Method. The assumptions used in the above are:
The fair value of options has been calculated by using Black Schole’s Method. The assumptions used in the above are:
The fair value of options has been calculated by using Black Schole’s Method. The assumptions used in the above are:
Weighted-average values of share price
Not applicable Not applicable Not applicable Not applicable
Weighted-average exercise prices 70 70 Not applicable Not applicable

364
Notes to the Consolidated Financial Statements as at and for the year ended 31 March 2018
JSW Steel Limited | Integrated Report 2017-18
Particulars ESOP 2012 ESOP 2016
Initial Grant (Junior Manager & Above)
1st Subsequent Grant (Junior Manager &
Above)
1st Grant (L-16 and above Grade)
2nd Grant (L-16 and above Grade)
Expected volatility Volatility was calculated using standard deviation of daily change in stock price.
Volatility was calculated using standard deviation of daily change in stock price.
Volatility was calculated using standard deviation of daily change in stock price.
Volatility was calculated using standard deviation of daily change in stock price.
The volatility used for valuation is 61.58%
The volatility used for valuation is 60.79%
The volatility used for valuation is 39.23 % for options with 3 year vesting and 39.62 % with 4 years vesting
The volatility used for valuation is 39.23 % for options with 3 year vesting and 39.62 % with 4 years vesting
Expected option life The expected option life is assumed to be the full term of the option program.
The expected option life is assumed to be the full term of the option program.
The expected option life is assumed to be midway between the option vesting and expiry. Since the vesting period and contractual term of each tranche is different, the expected life for each tranche will be different. The expected option life is calculated as (Year to Vesting + Contractual Option Term)/2
The expected option life is assumed to be mid-way between the option vesting and expiry. Since the vesting period and contractual term of each tranche is different, the expected life for each tranche will be different. The expected option life is calculated as (Year to Vesting + Contractual Option Term)/2
Expected dividends ` 0.75 per share `0.75 per share `1.10 per share `0.75 per share
Risk-free interest rate
Zero Coupon sovereign bond yields were utilised with maturity equal to expected term of option.
Zero Coupon sovereign bond yields were utilised with maturity equal to expected term of option.
Zero coupon sovereign bond yields were utilised with maturity equal to expected term of the option
Zero coupon sovereign bond yields were utilised with maturity equal to expected term of the option
The rate used for calculation is 8.03%
The rate used for calculation is 7.99%
The rate used for calculation is 7.36% (for 3 years vesting) & 7.44%(for 4 years vesting)
The rate used for calculation is 6.87% (for 3 years vesting) & 6.96%(for 4 years vesting)
The method used and the assumptions made to incorporate the effects of expected early exercise;
Black-Scholes Options pricing model Black-Scholes Options pricing model
How expected volatility was determined, including an explanation of the extent to which expected volatility was based on historical volatility; and
The following factors have been considered:a) Share price b) Exercise prices c) Historical volatility d) Expected option lifee) Dividend Yield
The following factors have been considered:a) Share price b) Exercise prices c) Historical volatility d) Expected option life e) Dividend YieldWhether and how any other
features of the option grant were incorporated into the measurement of fair value, such as a market condition.
Split of shares adjustment:
The number of options granted, number of options vested, exercise price, fair value of the grant etc. has been adjusted to reflect the sub-division of face value of equity shares of the Company.

365
Notes to the Consolidated Financial Statements as at and for the year ended 31 March 2018
Better Everyday. In Pursuit of Excellence. Corporate Overview Statutory Reports Financial Statements
39. Segment reporting
The Group is in the business of manufacturing steel products having similar economic characteristics, primarily with operations in India and regularly reviewed by the Chief Operating Decision Maker for assessment of Group’s performance and resource allocation. The information relating to revenue from external customers and location of non-current assets of its single reportable segment has been disclosed below:
Information about geographical revenue and non-current assets
a) Revenue from operations
` in crores
Particulars For the year ended 31 March 2018 For the year ended 31 March 2017
Within India Outside India Total Within India Outside India Total
Revenue from operations 54,034 17,469 71,503 44,896 15,640 60,536
Revenue from operations has been allocated on the basis of location of customers.
b) Non-current assets
` in crores
Particulars As at 31 March 2018 As at 31 March 2017
Within India Outside India Total Within India Outside India Total
(a) Property, plant and equipment
52,558 4,496 57,054 53,317 4,469 57,786
(b) Capital work-in-progress
5,611 18 5,629 3,847 234 4,081
(c) Goodwill 28 679 707 28 844 872
(d) Other intangible assets
71 16 87 56 16 72
(e) Intangible assets under development
321 - 321 282 - 282
(f) Investment in joint ventures
190 170 360 112 140 252
(g) Other non-current assets
2,811 70 2,881 1,797 95 1,892
(h) Current tax assets (net)
271 - 271 305 - 305
(i) Financial assets 1,468 1,187
(j) Deferred tax assets (net)
48 84
Total non-current assets
68,826 66,813
Non-current assets have been allocated on the basis of their physical location.
40. Employee benefitsa) Defined contribution plan The Group operates defined contribution retirement benefit plans for all qualifying employees. The assets of the plans
are held separately from those of the Group in funds under the control of trustees. Where employees leave the plans prior to full vesting of the contributions, the contributions payable by the Group are reduced by the amount of forfeited contributions.
Group's contribution to provident fund and 401 (K) plan recognised in the Consolidated Statement of Profit and Loss of ` 59 crores (previous year: ` 54 crores) (included in note 33).

366
Notes to the Consolidated Financial Statements as at and for the year ended 31 March 2018
JSW Steel Limited | Integrated Report 2017-18
b) Defined benefit plans The Group sponsors funded defined benefit plans for qualifying employees. The defined benefit plans are administered
by a separate Fund that is legally separated from the entity.
The gratuity plan is covered by The Payment of Gratuity Act, 1972. Under the gratuity plan, the eligible employees are entitled to post-retirement benefit at the rate of 15 days salary for each year of service until the retirement age of 58, 60 and 62, without any payment ceiling. The vesting period for gratuity as payable under The Payment of Gratuity Act, 1972 is 5 years.
Under the Compensated absences plan, leave encashment is payable to all eligible employees on separation from the Company due to death, retirement, superannuation or resignation. At the rate of daily salary, as per current accumulation of leave days.
The plans in India typically expose the Group to actuarial risks such as: investment risk, interest rate risk, longevity risk and salary risk.
Investment risk The present value of the defined benefit plan liability is calculated using a discount rate determined by reference to government bond yields; if the return on plan asset is below this rate, it will create a plan deficit. Currently the plan has a relatively balanced investment in equity securities and debt instruments.
Interest risk A decrease in the bond interest rate will increase the plan liability; however, this will be partially offset by an increase in the return on the plan’s debt investments.
Longevity risk The present value of the defined benefit plan liability is calculated by reference to the best estimate of the mortality of plan participants both during and after their employment. An increase in the life expectancy of the plan participants will increase the plan’s liability.
Salary risk The present value of the defined benefit plan liability is calculated by reference to the future salaries of plan participants. As such, an increase in the salary of the plan participants will increase the plan’s liability.
No other post-retirement benefits are provided to these employees.
The most recent actuarial valuation of the plan assets and the present value of the defined benefit obligation were carried out at 31 March 2018 by M/S. K. A. Pandit, Consultants & Actuaries. The present value of the defined benefit obligation, and the related current service cost and past service cost, were measured using the projected unit credit method.
(i) Gratuity
` in crores
Particulars Current year Previous year
Funded Unfunded Funded Unfunded
a) Liability recognised in the balance sheet
i) Present value of obligation
Opening balance 239 4 204 4
Service cost 16 @ 12 1
Interest cost 18 @ 17 @
Actuarial loss / (gain) on obligation 5 @ 20 @
Benefits paid (11) @ (15) @
Experience adjustments - - 2 -
Acquired pursuant to business combination
- - 1 -
Liability In @ @ 2 @
Liability transfer (2) (1) (4) -
Closing balance 265 5 239 4

367
Notes to the Consolidated Financial Statements as at and for the year ended 31 March 2018
Better Everyday. In Pursuit of Excellence. Corporate Overview Statutory Reports Financial Statements
` in crores
Particulars Current year Previous year
Funded Unfunded Funded Unfunded
Less:
ii) Fair value of plan assets
Opening balance 80 - 77 -
Expected return on plan assets less loss on investments
6 - 7 -
Actuarial (loss)/gain on plan assets @ - @ -
Acquired pursuant to business combination
- - @ -
Employers' contribution 18 - 7 -
Asset transfer - - - -
Benefits paid (9) - (12) -
Closing balance 95 - 80 -
Amount recognised in Balance Sheet* 170 5 159 4
*includes ` 0.06 crores (as at 31 March 2017 ` 0.94 crores) being excess of fair value of plan assets over present value of obligation disclosed under other current assets (Note-11)
@ Less than ` 50 lakhs
` in crores
Particulars Current year Previous year
Funded Unfunded Funded Unfunded
b) Expenses during the year
Service cost 16 @ 12 1
Interest cost 18 @ 17 @
Expected return on plan assets (6) - (7) -
Component of defined benefit cost recognised in statement of profit & loss (a)
28 1 22 1
Remeasurement of net defined benefit liability
- Actuarial (gain)/loss on defined benefit obligation
5 @ 20 @
- Return on plan assets (excluding interest income)
- - @ -
Component of defined benefit cost recognised in other comprehensive income (b)
5 @ 20 @
Total (a+b) 33 1 42 1
c) Actual return on plan assets 6 5
d) Break up of plan assets:
(i) ICICI Prudential Life Insurance Co. Ltd.
Balanced Fund 3 4
Debt Fund - 1
Short-term Debt Fund - -
Endowment Plan - -
(ii) HDFC Standard Life Insurance Co. Ltd.
Defensive Managed Fund 2 2
Secure Managed Fund 23 19
Stable Managed Fund @ 0
(iii) SBI Life Insurance Co. Ltd. – Cap Assured Fund
48 33
(iv) LIC of India – Insurer Managed Fund 18 19
(v) Bajaj Allianz Fund 2 2
@ Less than ` 50 lakhs

368
Notes to the Consolidated Financial Statements as at and for the year ended 31 March 2018
JSW Steel Limited | Integrated Report 2017-18
The fair values of the above equity and debt instruments are determined based on quoted market prices in active markets
e) Principal actuarial assumptions:` in crores
Particulars Current year Previous year
Funded Unfunded Funded Unfunded
Discount rate 7.51%-7.85% 7.56%-7.88% 7.20%-7.99% 7.27%-8.01%Expected return on plan assets 7.51%-7.85% - 7.20%-7.99% -Expected rate of increase in salaries 6.00% 6.00% 6.00% 6.00%Attrition rate 2.00% 2.00% 2.00% 2.00%
Based on India’s standards mortality table with modifications to reflect expected changes in mortality.
f) Experience adjustments:
` in crores
Particulars 2017-18 2016-17 2015-16 2014-15 2013-14
Defined benefit obligation 270 243 208 183 171
Plan assets 95 80 77 67 54
Surplus / (deficit) (175) (163) (131) (116) (117)
Experience adjustments on plan liabilities – loss/(gain)
5 20 6 33 4
Experience adjustments on plan assets – gain/(loss)
@ @ @ 1 (1)
@ Less than ` 50 lakhs
g) The Group expects to contribute ` 37 crores (previous year ` 67 crores) to its gratuity plan for the next year.
h) In assessing the Group’s post retirement liabilities, the Group monitors mortality assumptions and uses up-to-date mortality tables, the base being the Indian assured lives mortality (2006-08) ultimate.
i) Expected return on plan assets is based on expectation of the average long-term rate of return expected on investments of the fund during the estimated term of the obligations after considering several applicable factors such as the composition of plan assets, investment strategy, market scenario, etc.
j) The estimates of future salary increase, considered in actuarial valuation, take account of inflation, seniority, promotion and other relevant factors, such as supply and demand in the employment market.
k) The discount rate is based on the prevailing market yields of Government of India securities as at the balance sheet date for the estimated term of the obligations.
The amount included in the financial statements arising from the entity’s obligation in respect of its defined benefit plan is as follows:
` in crores
Particulars As at 31 March 2018
As at 31 March 2017
Defined benefit obligation 270 243
Plan assets 95 80
Net liability arising from defined benefit obligation 175 163

369
Notes to the Consolidated Financial Statements as at and for the year ended 31 March 2018
Better Everyday. In Pursuit of Excellence. Corporate Overview Statutory Reports Financial Statements
Sensitivity Analysis:
Significant actuarial assumptions for the determination of the defined benefit obligation are discount rate, expected salary increase and mortality. The sensitivity analyses below have been determined based on reasonably possible changes of the respective assumptions occurring at the end of the reporting period, while holding all other assumptions constant.
` in crores
Particulars As at 31 March 2018 As at 31 March 2017
Increase Decrease Increase Decrease
Discount rate (1% movement) (20) 24 (19) 22
Future salary growth (1% movement) 24 (21) 22 (19)
Attrition rate (1% movement) 3 (3) 2 (3)
The sensitivity analysis presented above may not be representative of the actual change in the defined benefit obligation as it is unlikely that the change in assumptions would occur in isolation of one another as some of the assumptions may be correlated.
Furthermore, in presenting the above sensitivity analysis, the present value of the defined benefit obligation has been calculated using the projected unit credit method at the end of the reporting period, which is the same as that applied in calculating the defined benefit obligation recognised in the balance sheet.
There was no change in the methods and assumptions used in preparing the sensitivity analysis from prior years.
Category of assets average percentage allocation fund wise
SBI HDFC ICICI Bajaj Allianz LIC
Government securities - 32.86% 23.66% 52.00% 20%
Debt 86.77% 58.73% 52.58% 12.80% Balance invested in approved invest-ments as specified in Schedule I of IRDA guidelines
Equity 7.23% 2.12% 15.83% 18.40%
Others 6.00% 6.29% 7.94% 16.80%
Maturity analysis of projected benefit obligation ` in crores
Particulars Less than a year
Between 1 to 5 years
Over 5 years Total
As at 31 March 2018
Projected benefit payable 22 83 488 593
As at 31 March 2017
Projected benefit payable 16 64 449 529
Each year an Asset-Liability-Matching study is performed in which the consequences of the strategic investment policies are analysed in terms of risk and return profiles.
(ii) Provident fund:
The Company makes monthly contributions to provident fund managed by trust for qualifying employees. Under the scheme, the Company is required to contribute a specified percentage of the payroll costs to fund the benefits.
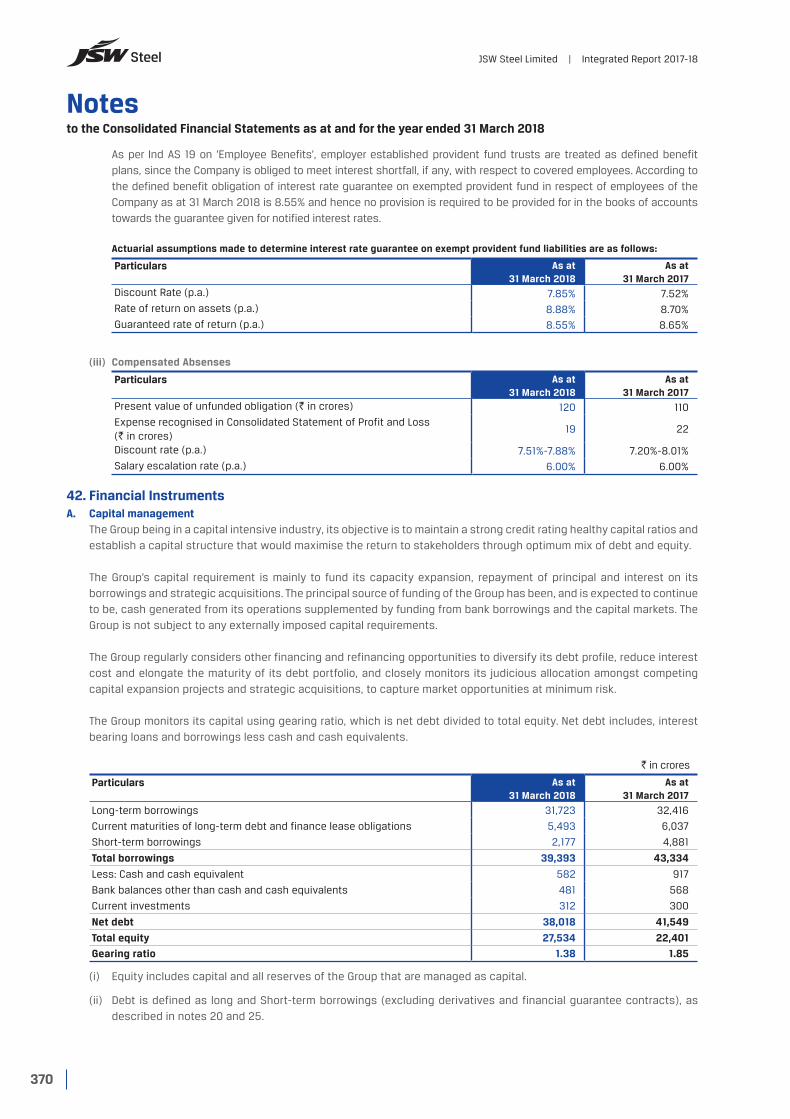
370
Notes to the Consolidated Financial Statements as at and for the year ended 31 March 2018
JSW Steel Limited | Integrated Report 2017-18
As per Ind AS 19 on 'Employee Benefits', employer established provident fund trusts are treated as defined benefit plans, since the Company is obliged to meet interest shortfall, if any, with respect to covered employees. According to the defined benefit obligation of interest rate guarantee on exempted provident fund in respect of employees of the Company as at 31 March 2018 is 8.55% and hence no provision is required to be provided for in the books of accounts towards the guarantee given for notified interest rates.
Actuarial assumptions made to determine interest rate guarantee on exempt provident fund liabilities are as follows:
Particulars As at 31 March 2018
As at 31 March 2017
Discount Rate (p.a.) 7.85% 7.52%Rate of return on assets (p.a.) 8.88% 8.70%Guaranteed rate of return (p.a.) 8.55% 8.65%
(iii) Compensated Absenses
Particulars As at 31 March 2018
As at 31 March 2017
Present value of unfunded obligation (` in crores) 120 110Expense recognised in Consolidated Statement of Profit and Loss (` in crores)
19 22
Discount rate (p.a.) 7.51%-7.88% 7.20%-8.01%Salary escalation rate (p.a.) 6.00% 6.00%
42. Financial InstrumentsA. Capital management The Group being in a capital intensive industry, its objective is to maintain a strong credit rating healthy capital ratios and
establish a capital structure that would maximise the return to stakeholders through optimum mix of debt and equity.
The Group’s capital requirement is mainly to fund its capacity expansion, repayment of principal and interest on its borrowings and strategic acquisitions. The principal source of funding of the Group has been, and is expected to continue to be, cash generated from its operations supplemented by funding from bank borrowings and the capital markets. The Group is not subject to any externally imposed capital requirements.
The Group regularly considers other financing and refinancing opportunities to diversify its debt profile, reduce interest cost and elongate the maturity of its debt portfolio, and closely monitors its judicious allocation amongst competing capital expansion projects and strategic acquisitions, to capture market opportunities at minimum risk.
The Group monitors its capital using gearing ratio, which is net debt divided to total equity. Net debt includes, interest bearing loans and borrowings less cash and cash equivalents.
` in crores
Particulars As at 31 March 2018
As at 31 March 2017
Long-term borrowings 31,723 32,416
Current maturities of long-term debt and finance lease obligations 5,493 6,037
Short-term borrowings 2,177 4,881
Total borrowings 39,393 43,334
Less: Cash and cash equivalent 582 917
Bank balances other than cash and cash equivalents 481 568
Current investments 312 300
Net debt 38,018 41,549
Total equity 27,534 22,401
Gearing ratio 1.38 1.85
(i) Equity includes capital and all reserves of the Group that are managed as capital.
(ii) Debt is defined as long and Short-term borrowings (excluding derivatives and financial guarantee contracts), as described in notes 20 and 25.

371
Notes to the Consolidated Financial Statements as at and for the year ended 31 March 2018
Better Everyday. In Pursuit of Excellence. Corporate Overview Statutory Reports Financial Statements
B. Categories of financial instruments
As at 31 March 2018` in crores
Particulars Amortised cost Fair value through other
comprehensive income
Fair value through profit
and loss
Total carrying value
Fair value
Financial assets
Loans 608 - - 608 608
Other financial assets 823 - - 823 823
Trade receivables 4,704 - - 4,704 4,704
Cash and cash equivalents 582 - - 582 582Bank balances other than cash and cash equivalents
481 - - 481 481
Derivative assets - - 151 151 151
Investments - 758 351 1,109 1,109
Total financial assets 7,198 758 502 8,458 8,458
Financial liabilities
Long-term borrowings* 37,216 - - 37,216 37,677
Short-term borrowings 2,177 - - 2,177 2,177
Trade payables 15,944 - - 15,944 15,944
Derivative liabilities - - 96 96 96
Other financial liabilities 4,041 - - 4,041 3,987
Total financial liabilities 59,378 - 96 59,474 59,881
As at 31 March 2017
` in crores
Particulars Amortised cost Fair value through other
comprehensive income
Fair value through profit
and loss
Total carrying value
Fair value
Financial assets
Loans 295 - - 295 294
Other financial assets 537 - - 537 537
Trade receivables 4,149 - - 4,149 4,149
Cash and cash equivalents 917 - - 917 917Bank balances other than cash and cash equivalents
568 - - 568 568
Derivative assets - 491 491 491
Investments - 666 448 1,114 1,114
Total financial assets 6,466 666 939 8,071 8,070
Financial liabilities
Long-term borrowings* 38,453 - - 38,453 38,910
Short-term borrowings 4,881 - - 4,881 4,881
Trade payables 13,348 - - 13,348 13,348
Derivative liabilities - 418 418 418
Other financial liabilities 3,906 - - 3,906 3,850
Total financial liabilities 60,588 - 418 61,006 61,407
* including current maturities of long-term borrowings
C. Financial risk management The Group has a Risk Management Committee established by its Board of Directors for overseeing the Risk Management
Framework and developing and monitoring the Company’s risk management policies. The risk management policies are established to ensure timely identification and evaluation of risks, setting acceptable risk thresholds, identifying and mapping controls against these risks, monitor the risks and their limits, improve risk awareness and transparency. Risk management policies and systems are reviewed regularly to reflect changes in the market conditions and the Group’s activities to provide reliable information to the Management and the Board to evaluate the adequacy of the risk management framework in relation to the risk faced by the Group.

372
Notes to the Consolidated Financial Statements as at and for the year ended 31 March 2018
JSW Steel Limited | Integrated Report 2017-18
The risk management policies aims to mitigate the following risks arising from the financial instruments:
- Market risk
- Credit risk; and
- Liquidity risk
D. Market risk Market risk is the risk that the fair value of future cash flows of a financial instrument will fluctuate because of changes
in the market prices. The Group is exposed in the ordinary course of its business to risks related to changes in foreign currency exchange rates, commodity prices and interest rates.
The Group seeks to minimise the effects of these risks by using derivative financial instruments to hedge risk exposures. The use of financial derivatives is governed by the Group’s policies approved by the Board of Directors, which provide written principles on foreign exchange risk, interest rate risk, credit risk, the use of financial derivatives and non-derivative financial instruments, and the investment of excess liquidity. Compliance with policies and exposure limits is reviewed by the Management and the internal auditors on a continuous basis. The Group does not enter into or trade financial instruments, including derivatives for speculative purposes.
E. Financial currency risk management The Group’s functional currency is Indian Rupees (INR). The Group undertakes transactions denominated in foreign
currencies; consequently, exposure to exchange rate fluctuations arise. Volatility in exchange rates affects the Group’s revenue from export markets and the costs of imports, primarily in relation to raw materials. The Group is exposed to exchange rate risk under its trade and debt portfolio.
Adverse movements in the exchange rate between the Rupee and any relevant foreign currency result’s in increase in the Group’s overall debt position in Rupee terms without the Group having incurred additional debt and favourable movements in the exchange rates will conversely result in reduction in the Group’s receivables in foreign currency. In order to hedge exchange rate risk, the Group has a policy to hedge cash flows up to a specific tenure using forward exchange contracts and hedges. At any point in time, the Group hedges its estimated foreign currency exposure in respect of forecast sales over the following 6 months. In respect of imports and other payables, the Company hedges its payables as when the exposure arises. Short-term exposures are hedged progressively based on their maturity. Long-term exposures are hedged on a case to case basis.
All hedging activities are carried out in accordance with the Company’s internal risk management policies, as approved by the Board of Directors, and in accordance with the applicable regulations where the Company operates.
The forward exchange contracts entered into by the Group and outstanding are as under:
As at Nature No. of Contracts Type US$ Equivalent (millions)
INR Equivalent (crores)
MTM (` in crores)
31 March 2018
Assets 49 Buy 540 3,521 21
44 Sell 500 3,248 27
Liabilities 63 Buy 697 4,531 (25)
34 Sell 379 2,465 (20)
31 March 2017
Assets - Buy - - -
74 Sell 607 3,935 194
Liabilities 125 Buy 883 5,721 (270)
13 Sell 55 354 (3)
Currency options to hedge against fluctuations in changes in exchange rate:
As at Nature No. of Contracts US$ Equivalent (millions)
INR Equivalent (crores)
MTM of Options (` in crores)
31 March 2018Assets 26 480 3,123 21
Liabilities 3 61 397 (1)
31 March 2017Assets 2 60 389 2
Liabilities 32 743 4,816 (106)
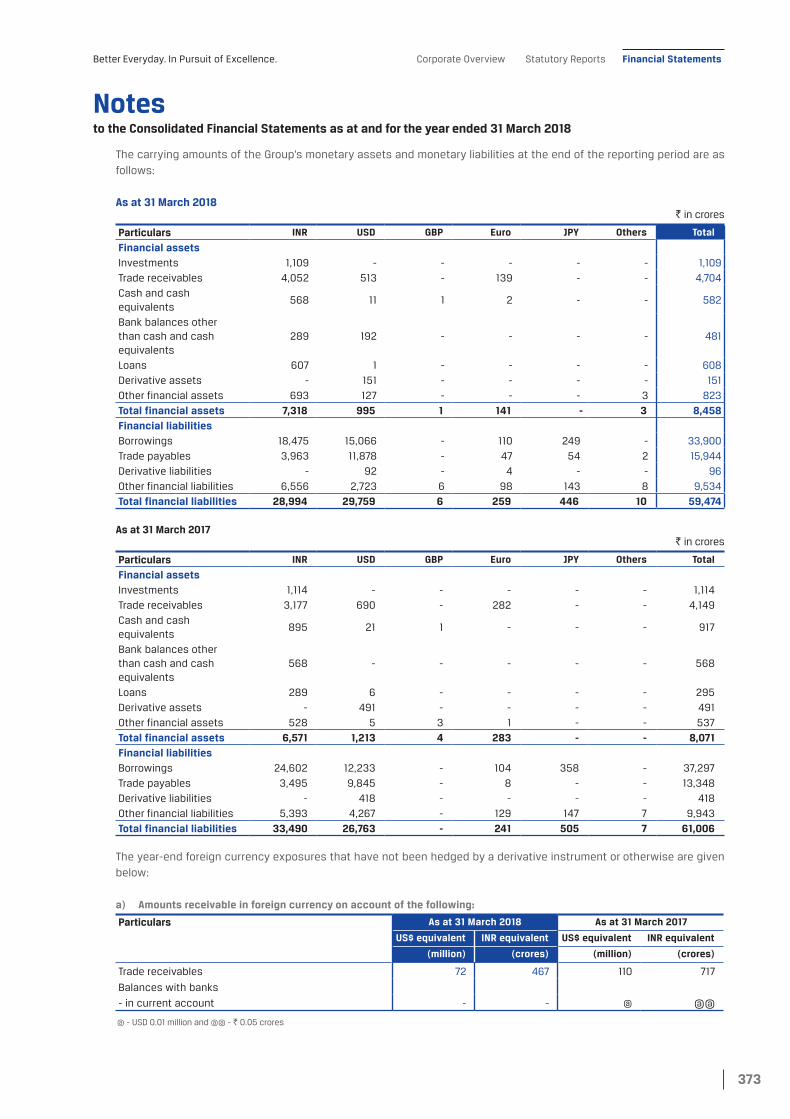
373
Notes to the Consolidated Financial Statements as at and for the year ended 31 March 2018
Better Everyday. In Pursuit of Excellence. Corporate Overview Statutory Reports Financial Statements
The carrying amounts of the Group’s monetary assets and monetary liabilities at the end of the reporting period are as follows:
As at 31 March 2018` in crores
Particulars INR USD GBP Euro JPY Others Total
Financial assetsInvestments 1,109 - - - - - 1,109
Trade receivables 4,052 513 - 139 - - 4,704
Cash and cash equivalents
568 11 1 2 - - 582
Bank balances other than cash and cash equivalents
289 192 - - - - 481
Loans 607 1 - - - - 608
Derivative assets - 151 - - - - 151
Other financial assets 693 127 - - - 3 823
Total financial assets 7,318 995 1 141 - 3 8,458Financial liabilitiesBorrowings 18,475 15,066 - 110 249 - 33,900
Trade payables 3,963 11,878 - 47 54 2 15,944
Derivative liabilities - 92 - 4 - - 96
Other financial liabilities 6,556 2,723 6 98 143 8 9,534
Total financial liabilities 28,994 29,759 6 259 446 10 59,474
As at 31 March 2017` in crores
Particulars INR USD GBP Euro JPY Others Total
Financial assetsInvestments 1,114 - - - - - 1,114
Trade receivables 3,177 690 - 282 - - 4,149
Cash and cash equivalents
895 21 1 - - - 917
Bank balances other than cash and cash equivalents
568 - - - - - 568
Loans 289 6 - - - - 295
Derivative assets - 491 - - - - 491
Other financial assets 528 5 3 1 - - 537
Total financial assets 6,571 1,213 4 283 - - 8,071 Financial liabilitiesBorrowings 24,602 12,233 - 104 358 - 37,297
Trade payables 3,495 9,845 - 8 - - 13,348
Derivative liabilities - 418 - - - - 418
Other financial liabilities 5,393 4,267 - 129 147 7 9,943
Total financial liabilities 33,490 26,763 - 241 505 7 61,006
The year-end foreign currency exposures that have not been hedged by a derivative instrument or otherwise are given below:
a) Amounts receivable in foreign currency on account of the following:
Particulars As at 31 March 2018 As at 31 March 2017
US$ equivalent INR equivalent US$ equivalent INR equivalent
(million) (crores) (million) (crores)
Trade receivables 72 467 110 717
Balances with banks
- in current account - - @ @@
@ - USD 0.01 million and @@ - ` 0.05 crores

374
Notes to the Consolidated Financial Statements as at and for the year ended 31 March 2018
JSW Steel Limited | Integrated Report 2017-18
b) Amounts payable in foreign currency on account of the following:
Particulars As at 31 March 2018 As at 31 March 2017
US$ equivalent INR equivalent US$ equivalent INR equivalent
(million) (crores) (million) (crores)
Borrowings 2,254 14,614 1,764 11,435
Acceptances 12 81 104 673
Trade payables 42 272 20 128
Payables for capital projects 176 1,140 100 650
Interest accrued but not due on borrowings 33 217 21 137
The following table details the Company’s sensitivity to a 1% increase and decrease in the INR against the relevant foreign currencies net of hedge accounting impact. The sensitivity analysis includes only outstanding foreign currency denominated monetary items and adjusts their translation at the year-end for a 1% change in foreign currency rates, with all other variables held constant. A positive number below indicates an increase in profit or equity where INR strengthens 1% against the relevant currency. For a 1% weakening of INR against the relevant currency, there would be a comparable impact on profit or equity, and the balances below would be negative.
Impact on Profit / (loss) for the year for a 1% change:` in crores
Particulars Increase Decrease
31 March 2018 31 March 2017 31 March 2018 31 March 2017
USD / INR (208) (143) 208 143
YEN / INR (4) (5) 4 5
EURO / INR (1) 1 1 (1)
F. Commodity price risk:
The Group’s revenue is exposed to the market risk of price fluctuations related to the sale of its steel products. Market forces generally determine prices for the steel products sold by the Group. These prices may be influenced by factors such as supply and demand, production costs (including the costs of raw material inputs) and global and regional economic conditions and growth. Adverse changes in any of these factors may reduce the revenue that the Group earns from the sale of its steel products.
The Group is subject to fluctuations in prices for the purchase of iron ore, coking coal, ferro alloys, zinc, scrap and other raw material inputs. The Group purchased primarily all of its iron ore and coal requirements in the open market at prevailing price during the year ended 31 March 2018.
The Group aims to sell the products at prevailing market prices. Similarly, the Group procures key raw materials like iron ore and coal based on prevailing market rates as the selling prices of steel prices and the prices of input raw materials move in the same direction.
Commodity hedging is used primarily as a risk management tool to secure the future cash flows in case of volatility by entering into commodity forward contracts.
Hedging commodity is based on its procurement schedule and price risk. Commodity hedging is undertaken as a risk offsetting exercise and, depending upon market conditions hedges, may extend beyond the financial year. The Group is presently hedging maximum up to 25 per cent of its consumption.
The following table details the Group’s sensitivity to a 5% movement in the input price of iron ore and coking coal net of hedge accounting impact. The sensitivity analysis includes only 5% change in commodity prices for quantity sold or consumed during the year, with all other variables held constant. A positive number below indicates an increase in profit or equity where the commodity prices decrease by 5%. For a 5% reduction in commodity prices, there would be a comparable impact on profit or equity, and the balances below would be negative.

375
Notes to the Consolidated Financial Statements as at and for the year ended 31 March 2018
Better Everyday. In Pursuit of Excellence. Corporate Overview Statutory Reports Financial Statements
Impact on Profit / (loss) for the year for a 5% change: ` in crores
Particulars Increase for the year ended Decrease for the year ended
31 March 2018 31 March 2017 31 March 2018 31 March 2017
Iron ore (554) (382) 554 382
Coal/Coke (1,012) (757) 1,012 757
The commodity forward contracts entered into by the Group and outstanding at the year-end are as under:
As at Nature No. of Contracts
Commodity Name
Quantity (Iron Ore,
Coking Coal, Zinc - MT)
(Brent Crude - Mio Barrels)
US$ Equivalent of notional
value (million)
INR equivalent
(crores)
MTM of Commodity
contract (` in crores)
31 March 2018 Assets 5 Brent Crude 168,750 10 68 6
4 Iron Ore 126,000 8 51 2
1 Zinc 1,000 3 21 @
Liabilities 44 Iron Ore 1,346,000 92 601 (43)
31 March 2017 Assets 4 Brent Crude 66,996 3 23 1
32 Iron Ore 972,000 33 214 228
Liabilities 13 Brent Crude 166,500 9 61 (3)
4 Coking Coal 180,000 35 229 (26)
8 Iron ore 171,000 13 86 (4)
@ - ` 0.25 crores
G. Interest rate risk
Interest rate risk is the risk that the fair value or future cash flows of a financial instrument will fluctuate because of changes in market interest rates. The Group is exposed to interest rate risk because funds are borrowed at both fixed and floating interest rates. Interest rate risk is measured by using the cash flow sensitivity for changes in variable interest rate. The borrowings of the Group are principally denominated in rupees and US dollars with a mix of fixed and floating rates of interest. The Group hedges its US dollar interest rate risk through interest rate swaps to reduce the floating interest rate risk. The Group hedges up to 20% of interest risk in US dollars. The Group has exposure to interest rate risk, arising principally on changes in base lending rate and LIBOR rates. The Group uses a mix of interest rate sensitive financial instruments to manage the liquidity and fund requirements for its day to day operations like non-convertible bonds and Short-term loans. The risk is managed by the Group by maintaining an appropriate mix between fixed and floating rate borrowings, and by the use of interest rate swap contracts. Hedging activities are evaluated regularly to align with interest rate views and defined risk appetite, ensuring the most cost-effective hedging strategies are applied.
The following table provides a break-up of the Group’s fixed and floating rate borrowings: ` in crores
Particulars As at 31 March 2018
As at 31 March 2017
Fixed rate borrowings 17,691 17,334
Floating rate borrowings 21,929 26,258
Total borrowings 39,620 43,592
Total borrowings 39,393 43,334
Add: Upfront fees 227 258
Total gross borrowings 39,620 43,592
The sensitivity analyses below have been determined based on the exposure to interest rates for floating rate liabilities, after the impact of hedge accounting, assuming the amount of the liability outstanding at the year-end was outstanding for the whole year.

376
Notes to the Consolidated Financial Statements as at and for the year ended 31 March 2018
JSW Steel Limited | Integrated Report 2017-18
If interest rates had been 100 basis points higher / lower and all other variables were held constant, the group’s profit for the year ended 31 March 2018 would decrease / increase by ` 193 crores (for the year ended 31 March 2017: decrease / increase by ` 263 crores). This is mainly attributable to the group’s exposure to interest rates on its variable rate borrowings.
The following table detail the nominal amounts and remaining terms of interest rate swap contracts outstanding at the year-end.
As at Nature No. of Contracts US$ Equivalent of notional value
(Millions)
MTM of IRS (` in crores)
31 March 2018 Assets 14 237 37
Liabilities 6 168 (5)
31 March 2017 Assets 5 90 17
Liabilities 2 20 @
@ - ` (0.19) crores
H. Credit risk management
Credit risk refers to the risk that counterparty will default on its contractual obligations resulting in financial loss to the Group. The Group has adopted a policy of only dealing with creditworthy counterparties and obtaining sufficient collateral, where appropriate, as a means of mitigating the risk of financial loss from defaults.
The Group is exposed to credit risk for trade receivables, cash and cash equivalents, investments, other bank balances, loans, other financial assets, financial guarantees and derivative financial instruments.
Moreover, given the diverse nature of the Group’s business trade receivables are spread over a number of customers with no significant concentration of credit risk. No single customer accounted for 10% or more of the trade receivables in any of the years presented. The history of trade receivables shows a negligible provision for bad and doubtful debts. Therefore, the Group does not expect any material risk on account of non-performance by any of the Group’s counterparties.
Movements in allowances for bad and doubtful debts ` in crores
Particulars Amount
As at 1 April 2016 37Movement during the year (4)
As at 31 March 2017 33Movement during the year 63
As at 31 March 2018 96
For current investments, counterparty limits are in place to limit the amount of credit exposure to any one counterparty. This, therefore, results in diversification of credit risk for Group’s mutual fund and bond investments. For derivative and financial instruments, the Company attempts to limit the credit risk by only dealing with reputable banks and financial institutions.
The carrying value of financial assets represents the maximum credit risk. The maximum exposure to credit risk was ` 8,458 crores as at 31 March 2018 and, ` 8,071 crores as at 31 March 2017, being the total carrying value of trade receivables, balances with bank, bank deposits, current investments and other financial assets.
In respect of financial guarantees provided by the Group to banks and financial institutions, the maximum exposure which the Group is exposed to is the maximum amount which the Group would have to pay if the guarantee is called upon. Based on the expectation at the end of the reporting period, the Group considers that it is more likely than not that such an amount will not be payable under the guarantees provided.
Receivables are deemed to be past due or impaired with reference to the Group’s normal terms and conditions of business. These terms and conditions are determined on a case to case basis with reference to the customer’s credit quality and prevailing market conditions. The Group based on past experiences does not expect any material loss on its receivables and hence no provision is deemed necessary on account of ECL.

377
Notes to the Consolidated Financial Statements as at and for the year ended 31 March 2018
Better Everyday. In Pursuit of Excellence. Corporate Overview Statutory Reports Financial Statements
The credit quality of the Group’s is monitored on an ongoing basis and assessed for impairment where indicators of such impairment exist. The Group uses simplified approach for impairment of financial assets. If credit risk has not increased significantly, 12-month expected credit loss is used to provide for impairment loss. However, if credit risk has increased significantly, lifetime expected credit loss is used. The solvency of the debtor and their ability to repay the receivable is considered in assessing receivables for impairment. Where receivables have been impaired, the Group actively seeks to recover the amounts in question and enforce compliance with credit terms.
I. Liquidity risk management Liquidity risk refers to the risk of financial distress or extraordinary high financing costs arising due to shortage of liquid
funds in a situation where business conditions unexpectedly deteriorate and requiring financing. The Group requires funds both for Short-term operational needs as well as for long-term capital expenditure growth projects The Group generates sufficient cash flow for operations, which together with the available cash and cash equivalents and Short-term investments provide liquidity in the short-term and long-term. The Group has established an appropriate liquidity risk management framework for the management of the Company’s short, medium and long-term funding and liquidity management requirements. The Company manages liquidity risk by maintaining adequate reserves, banking facilities and reserve borrowing facilities, by continuously monitoring forecast and actual cash flows, and by matching the maturity profiles of financial assets and liabilities.
The following tables detail the Company’s remaining contractual maturity for its non-derivative financial liabilities with agreed repayment periods and its non-derivative financial assets. The tables have been drawn up based on the undiscounted cash flows of financial liabilities based on the earliest date on which the Company can be required to pay. The tables include both interest and principal cash flows.
To the extent that interest flows are floating rate, the undiscounted amount is derived from interest rate curves at the end of the reporting period. The contractual maturity is based on the earliest date on which the group may be required to pay.
As at 31 March 2018 ` in crores
Particulars < 1 year 1-5 years > 5 years Total
Financial assets
Investments 312 - 797 1,109
Trade receivables 4,704 - - 4,704
Cash and cash equivalents 582 - - 582
Bank balances other than cash and cash equivalents 481 - - 481
Loans 230 190 188 608
Derivative assets 151 - - 151
Other financial assets 530 290 3 823
Total 6,990 480 988 8,458
Financial liabilities
Long-term borrowings - 27,906 3,817 31,723
Short-term borrowings 2,177 - - 2,177
Trade payables 15,944 - - 15,944
Derivative liabilities 96 - - 96
Other financial liabilities 8,615 746 173 9,534
Total 26,832 28,652 3,990 59,474

378
Notes to the Consolidated Financial Statements as at and for the year ended 31 March 2018
JSW Steel Limited | Integrated Report 2017-18
As at 31 March 2017` in crores
Particulars < 1 year 1-5 years > 5 years Total
Financial assets
Investments 300 - 814 1,114
Trade receivables 4,149 - - 4,149
Cash and cash equivalents 917 - - 917
Bank balances other than cash and cash equivalents 568 - - 568
Loans 174 68 53 295
Derivative assets 491 - - 491
Other financial assets 285 228 24 537
Total 6,884 296 891 8,071
Financial liabilities
Long-term borrowings - 27,785 4,631 32,416
Short-term borrowings 4,881 - - 4,881
Trade payables (including acceptances) 13,348 - - 13,348
Derivative liabilities 418 - - 418
Other financial liabilities 9,457 458 28 9,943
Total 28,104 28,243 4,659 61,006
The amount of guarantees given included in Note 43(a) represents the maximum amount the group could be forced to settle for the full guaranteed amount. Based on the expectation at the end of the reporting period, the group considers that it is more likely than not that such an amount will not be payable under the arrangement.
Collateral
The Group has pledged part of its trade receivables, Short-term investments and cash and cash equivalents in order to fulfil certain collateral requirements for the banking facilities extended to the Group. There is obligation to return the securities to the Group once these banking facilities are surrendered (refer note 20 and 25).
J. Level-wise disclosure of financial instruments` in crores
Particulars As at 31 March 2018
As at 31 March 2017
Level Valuation techniques and key inputs
Quoted investments in the equity shares measured at FVTOCI
740 637 I Quoted bid prices in an active market.
Quoted investments in the equity shares measured at FVTPL
312 300 I Quoted bid prices in an active market.
Derivative assets 151 491 II Inputs other than quoted prices included within level 1 that are observable for asset or liability, either directly (i.e. as prices) or indirectly (derived from prices).
Derivative liabilities 96 418 II Inputs other than quoted prices included within level 1 that are observable for asset or liability, either directly (i.e. as prices) or indirectly (derived from prices).
Unquoted investments in the equity shares measured at FVOCI
13 13 III Net asset value of share arrived has been considered as fair value.
Unquoted investments in the equity shares measured at FVTOCI
5 16 III Cost is approximate estimate of fair value.
Non-current investments in unquoted Preference shares measured at FVTPL
49 160 III Discounted cash flow- Future cash flows are based on terms of Preference Shares dis-counted at a rate that reflects market risks.
The carrying amounts of trade receivables, trade payables, capital creditors, cash and cash equivalents, other bank balances, other financial assets and other financial liabilities (other than those specifically disclosed) are considered to be the same as their fair values, due to their Short-term nature.

379
Notes to the Consolidated Financial Statements as at and for the year ended 31 March 2018
Better Everyday. In Pursuit of Excellence. Corporate Overview Statutory Reports Financial Statements
Sensitivity analysis of Level III:
Particulars Valuation technique
Significant unobservable inputs
Change Sensitivity of the input to fair value
Investments in unquoted Preference shares
DCF method Discounting Rate 8.40% 0.50% 0.50% Increase / (decrease) in the discount would decrease / (increase) the fair value by ` 2 crores / (` 2 crores)
Reconciliation of Level III fair value measurement:` in crores
Particulars As at 31 March 2018
As at 31 March 2017
Opening balance 189 179
Purchases / (sale) (net) @@ 1
Gain / (loss) recognised in the Consolidated statement of Profit and Loss (111) 9
Gain / (loss) recognised in the Other comprehensive income (11) -
Closing balance 67 189
@@ - ` 0.49 crores
Details of financial assets / liabilities measured at amortised but fair value disclosed in category wise` in crores
Particulars As at 31 March 2018
As at 31 March 2017
Level Valuation techniques and key inputs
Long-term borrowings
IIDiscounted cash flow method - Future cash flows are discounted by using rates which reflect market risks.
Carrying value 37,216 38,453
Fair value 37,677 38,910
Premium payable on redemption of debentures
301 182 IIDiscounted cash flow method - Future cash flows are discounted by using rates which reflect market risks.
Loans – financial assets
IIDiscounted cash flow method - Future cash flows are discounted by using rates which reflect market risks.
Carrying value 608 295
Fair value 608 294

380
Notes to the Consolidated Financial Statements as at and for the year ended 31 March 2018
JSW Steel Limited | Integrated Report 2017-18
42. Related party disclosuresA List of related parties1 Joint ventures
Vijayanagar Minerals Private Limited
Rohne Coal Company Private Limited
JSW Severfield Structures Limited
Gourangdih Coal Limited
Geo Steel LLC
JSW Structural Metal Decking Limited
JSW MI Steel Service Center Private Limited
JSW Vallabh Tinplate Private Limited
AcciaItalia S.p.A. (w.e.f. 30 November 2016)
2 Associate
JSW Industrial Gases Private Limited (ceased w.e.f. 15 August 2016) (formerly JSW Praxair Oxygen Private Limited)
3 Key management personnel
Mr. Sajjan Jindal
Mr. Seshagiri Rao M. V. S.
Dr. Vinod Nowal
Mr. Jayant Acharya
Mr. Rajeev Pai
Mr. Lancy Varghese
4 Other related parties
JSW Energy Limited
Raj West Power Limited
JSW Power Trading Company Limited *
Himachal Baspa Power Company Limited
Jindal Stainless Limited
JSL Architecture Limited
JSL Lifestyle Limited
Jindal Saw Limited
Jindal Saw USA LLC
Jindal Tubular (India) Limited
Jindal Fittings Limited
Jindal Steel & Power Limited
M/S. Shadeed Iron & Steel Co. LLC
Jindal Power Limited
India Flysafe Aviation Limited
JSW Infrastructure Limited
JSW Jaigarh Port Limited
South West Port Limited
JSW Dharamatar Port Private Limited
JSW Paradip Terminal Private Limited
JSW Cement Limited
South West Mining Limited
JSW Projects Limited
JSW IP Holdings Private Limited
JSOFT Solutions Limited
Reynold Traders Private Limited
JSW Techno Projects Management Limited
JSW Global Business Solutions Limited (formerly Sapphire Technologies Limited)
Jindal Industries Private Limited
JSW Foundation
Jindal Technologies & Management Services Private Limited

381
Notes to the Consolidated Financial Statements as at and for the year ended 31 March 2018
Better Everyday. In Pursuit of Excellence. Corporate Overview Statutory Reports Financial Statements
A List of related parties Epsilon Carbon Private Limited (formerly AVH Private Limited)
JSW International Trade Corp PTE Limited
Heal Institute Private Limited (ceased w.e.f. 19 October 2016)
Jindal Education Trust
JSW Paints Private Limited
Toshiba JSW Power System Private Limited
MJSJ Coal Limited
O P Jindal Foundation
JSW Bengaluru Football Club Private Limited
Jindal Rail Infrastructure Limited
Khaitan & Company#
Vinar Systems Private Limited ##
St. James Investment Limited
Jindal Stainless Steelway Limited
JSW Investment Private Limited
Tranquil Homes & Holdings Private Limited
Windsor Residency Private Limited
5 Post-employment benefits entities
JSW Steel EPF Trust
JSW Steel Group Gratuity Trust
JSW Steel Limited Employee Gratuity Fund
* amalgamated with JSW Green Energy Limited during the year
# Mr. Haigreve Khaitan is a partner in Khaitan & Company
## Mr. Haigreve Khaitan is a director in Vinar Systems Private Limited

382
Notes to the Consolidated Financial Statements as at and for the year ended 31 March 2018
JSW Steel Limited | Integrated Report 2017-18
B. T
ran
sact
ion
s w
ith
Rel
ated
Par
ties
` in
cro
res
Part
icul
ars
Asso
ciat
esJo
int
Vent
ures
Oth
er R
elat
ed P
arti
esTo
tal
FY 2
017
-18
FY 2
016
-17
FY 2
017
-18
FY 2
016
-17
FY 2
017
-18
FY 2
016
-17
FY 2
017
-18
FY 2
016
-17
Part
y's
Nam
eP
urc
has
e of
goo
ds/
pow
er &
fu
el/
serv
ices
JSW
En
erg
y Li
mit
ed
--
--
2,26
92,
182
2,26
92,
182
JSW
Inte
rnat
ion
al T
rad
ecor
p P
TE L
imit
ed-
--
-17
,972
6,6
59
17,9
726
,65
9
Oth
ers
-5
311
622
1,8
161,
48
41,
93
21,
55
9
Tota
l-
53
116
22
22
,057
10,3
25
22
,173
10,4
00
Rei
mb
urs
emen
t of
exp
ense
s in
curr
ed o
n o
ur
beh
alf
by
JSW
En
erg
y Li
mit
ed
--
--
32
32
JSW
Glo
bal
Bu
sin
ess
Sol
uti
ons
Lim
ited
--
--
-3
-3
Oth
ers
--
--
@@
@@
Tota
l-
--
-3
53
5
Sal
es o
f g
ood
s/ p
ower
an
d f
uel
JSW
Val
lab
h T
in P
late
Pri
vate
Lim
ited
--
33
227
3-
-3
32
273
Jin
dal
Saw
Lim
ited
--
--
792
7179
271
JSW
En
erg
y Li
mit
ed
--
--
412
38
04
123
80
Jin
dal
Ind
ust
ries
Pri
vate
Lim
ited
--
--
45
828
74
58
287
Epsi
lon
Car
bon
Pri
vate
Lim
ited
--
--
319
246
319
246
Oth
ers
-3
219
152
321
30
15
40
45
6
Tota
l-
35
51
42
52
,30
21,
28
52
,85
31,
713
Oth
er in
com
e/ in
tere
st in
com
e/ d
ivid
end
inco
me
JSW
Ind
ust
rial
Gas
es P
riva
te L
imit
ed-
11-
--
--
11
JSW
En
erg
y Li
mit
ed
--
--
624
624
JSW
Pro
ject
s Li
mit
ed-
--
-3
63
6
JSW
Glo
bal
Bu
sin
ess
Sol
uti
ons
Lim
ited
--
--
75
75
JSW
Tec
hn
o P
roje
cts
Man
agem
ent
Lim
ited
--
--
131
131
Ind
ia F
lysa
fe A
viat
ion
Lim
ited
--
--
14-
14-
Oth
ers
--
36
54
810
Tota
l-
113
64
84
05
157
Pu
rch
ase
of a
sset
s
JSW
Sev
erfi
eld
Str
uct
ure
s Li
mit
ed-
-13
64
5-
-13
64
5
Jin
dal
Ste
el &
Pow
er L
imit
ed
--
--
2547
2547
JSW
Cem
ent
Lim
ited
--
--
51
255
125
Oth
ers
--
--
613
613
Tota
l-
-13
64
58
28
52
1813
0

383
Notes to the Consolidated Financial Statements as at and for the year ended 31 March 2018
Better Everyday. In Pursuit of Excellence. Corporate Overview Statutory Reports Financial Statements
B. T
ran
sact
ion
s w
ith
Rel
ated
Par
ties
` in
cro
res
Part
icul
ars
Asso
ciat
esJo
int
Vent
ures
Oth
er R
elat
ed P
arti
esTo
tal
FY 2
017
-18
FY 2
016
-17
FY 2
017
-18
FY 2
016
-17
FY 2
017
-18
FY 2
016
-17
FY 2
017
-18
FY 2
016
-17
Adva
nce
giv
en /
(re
ceiv
ed b
ack)
JSW
Glo
bal
Bu
sin
ess
Sol
uti
ons
Lim
ited
--
--
429
429
Ind
ia F
lysa
fe A
viat
ion
Lim
ited
--
--
214
-21
4-
Oth
ers
--
--
@@
@@
Tota
l-
--
-2
182
92
182
9
Leas
e d
epos
it r
ecei
ved
JSW
Pai
nts
Pri
vate
Lim
ited
--
--
-4
-4
Epsi
lon
Car
bon
Pri
vate
Lim
ited
--
--
-2
-2
Tota
l-
--
--
6-
6
Leas
e an
d o
ther
ad
van
ces
refu
nd
ed
JSW
Infr
astr
uct
ure
Lim
ited
--
--
48
474
847
Tota
l-
--
-4
84
74
84
7
Loan
giv
en r
ecei
ved
bac
k
JSW
Pro
ject
s Li
mit
ed-
--
-3
00
-3
00
-
Tota
l-
--
-3
00
-3
00
-
Loan
giv
en
JSW
Tec
hn
o P
roje
cts
Man
agem
ent
Lim
ited
--
--
447
-4
47-
JSW
Pro
ject
s Li
mit
ed-
--
-3
00
-3
00
-
Tota
l-
--
-74
7-
747
-
Don
atio
n/
CS
R e
xpen
ses
JSW
Fou
nd
atio
n-
--
-11
311
3
Tota
l-
--
-11
311
3
Rec
over
y of
exp
ense
s in
curr
ed b
y u
s on
th
eir
beh
alf
JSof
t S
olu
tion
s Li
mit
ed-
--
--
4-
4
JSW
Cem
ent
Lim
ited
--
--
179
179
JSW
Jai
gar
h P
ort
Lim
ited
--
--
5-
5-
JSW
Infr
astr
uct
ure
Lim
ited
--
--
64
64
Oth
ers
--
34
710
1014
Tota
l-
-3
43
527
38
31

384
Notes to the Consolidated Financial Statements as at and for the year ended 31 March 2018
JSW Steel Limited | Integrated Report 2017-18
B. T
ran
sact
ion
s w
ith
Rel
ated
Par
ties
` in
cro
res
Part
icul
ars
Asso
ciat
esJo
int
Vent
ures
Oth
er R
elat
ed P
arti
esTo
tal
FY 2
017
-18
FY 2
016
-17
FY 2
017
-18
FY 2
016
-17
FY 2
017
-18
FY 2
016
-17
FY 2
017
-18
FY 2
016
-17
Inve
stm
ents
/ s
har
e ap
plic
atio
n m
oney
giv
en d
uri
ng
th
e ye
ar
JSW
Sev
erfi
eld
Str
uct
ure
s Li
mit
ed-
-4
5-
--
45
-
JSW
MI S
teel
Ser
vice
Cen
tre
Pri
vate
Lim
ited
-
--
24-
--
24
Acci
atal
ia S
.p.A
--
-13
--
-13
Oth
ers
--
@1
--
@1
Tota
l-
-4
53
8-
-4
53
8
Fin
ance
leas
e in
tere
st c
ost
JSW
Pro
ject
s Li
mit
ed
--
--
177
197
177
197
JSW
Tec
hn
o P
roje
cts
Man
agem
ent
Lim
ited
--
--
2513
2513
Tota
l-
--
-2
02
210
20
22
10
Fin
ance
leas
e ob
ligat
ion
s re
pay
men
t
JSW
Pro
ject
s Li
mit
ed
--
--
183
176
183
176
JSW
Tec
hn
o P
roje
cts
Man
agem
ent
Lim
ited
--
--
42
42
Tota
l-
--
-18
717
818
717
8
@ -
less
th
an `
50
lakh
s
The
gro
up
has
cre
ated
pro
visi
on o
f `
7 cr
ores
(p
revi
ous
year
– N
il) t
owar
ds
dou
btf
ul r
ecei
vab
le f
rom
oth
er r
elat
ed p
arti
es.
Not
es:
1.
The
Gro
up
mak
es m
onth
ly c
ontr
ibu
tion
s to
pro
vid
ent
fun
d m
anag
ed b
y JS
W S
teel
EP
F Tr
ust
for
qu
alif
yin
g V
ijaya
nag
ar e
mp
loye
es. U
nd
er t
he
sch
eme,
th
e G
rou
p is
req
uir
ed t
o co
ntri
bu
te a
sp
ecif
ied
per
cent
age
of t
he
pay
roll
cost
s to
fu
nd
th
e b
enef
its.
Du
rin
g t
he
year
, th
e G
rou
p c
ontr
ibu
ted
` 1
7 cr
ores
(p
revi
ous
year
` 1
7 cr
ores
).
2.
The
Gro
up
mai
ntai
ns
gra
tuit
y tr
ust
for
th
e p
urp
ose
of a
dm
inis
teri
ng
th
e g
ratu
ity
pay
men
t to
its
emp
loye
es (
JSW
Ste
el G
rou
p G
ratu
ity
Tru
st a
nd
JS
W S
teel
Lim
ited
Em
plo
yee
Gra
tuit
y Fu
nd
). D
uri
ng
th
e ye
ar, t
he
Gro
up
con
trib
ute
d `
18
cro
res
(pre
viou
s ye
ar `
6 c
rore
s.
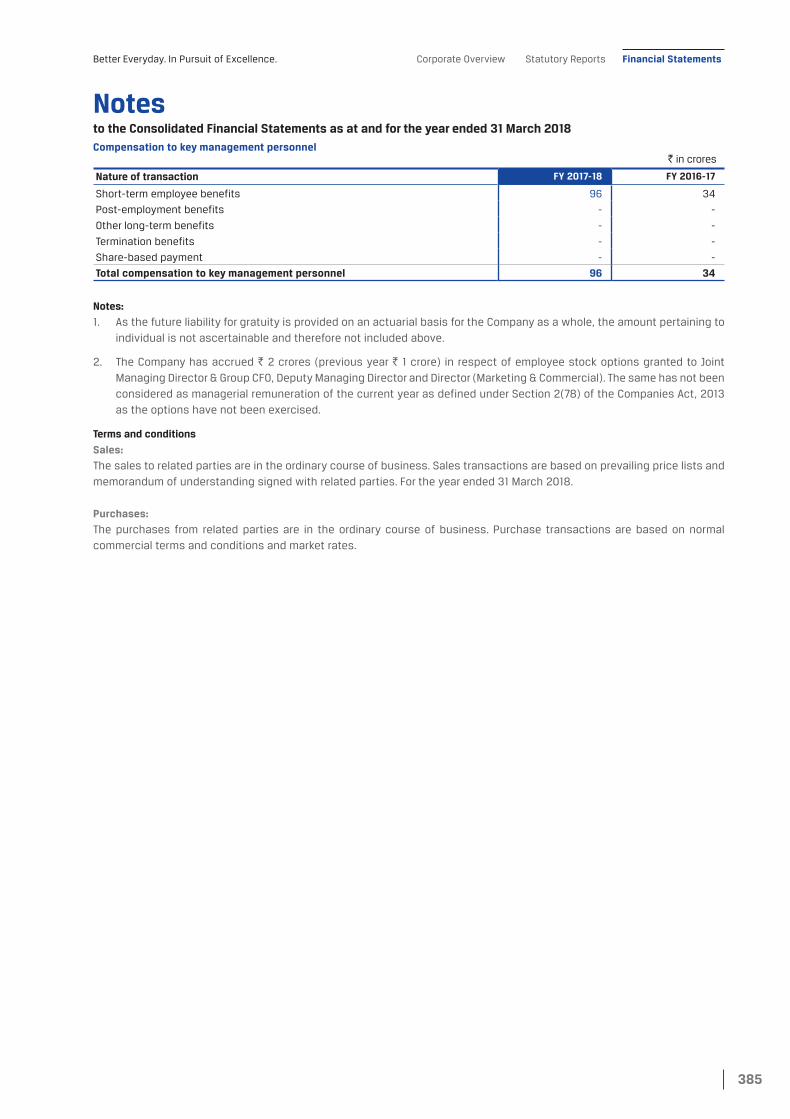
385
Notes to the Consolidated Financial Statements as at and for the year ended 31 March 2018
Better Everyday. In Pursuit of Excellence. Corporate Overview Statutory Reports Financial Statements
Compensation to key management personnel ` in crores
Nature of transaction FY 2017-18 FY 2016-17
Short-term employee benefits 96 34
Post-employment benefits - -
Other long-term benefits - -
Termination benefits - -
Share-based payment - -
Total compensation to key management personnel 96 34
Notes:
1. As the future liability for gratuity is provided on an actuarial basis for the Company as a whole, the amount pertaining to individual is not ascertainable and therefore not included above.
2. The Company has accrued ` 2 crores (previous year ` 1 crore) in respect of employee stock options granted to Joint Managing Director & Group CFO, Deputy Managing Director and Director (Marketing & Commercial). The same has not been considered as managerial remuneration of the current year as defined under Section 2(78) of the Companies Act, 2013 as the options have not been exercised.
Terms and conditions
Sales:
The sales to related parties are in the ordinary course of business. Sales transactions are based on prevailing price lists and memorandum of understanding signed with related parties. For the year ended 31 March 2018.
Purchases:
The purchases from related parties are in the ordinary course of business. Purchase transactions are based on normal commercial terms and conditions and market rates.

386
Notes to the Consolidated Financial Statements as at and for the year ended 31 March 2018
JSW Steel Limited | Integrated Report 2017-18
C. A
mou
nt d
ue
to/
from
rel
ated
par
ties
` in
cro
res
Part
icul
ars
Asso
ciat
eJo
int
Vent
ures
Oth
er R
elat
ed P
arti
esTo
tal
As
at
31
Mar
ch 2
018
As
at
31
Mar
ch 2
017
As
at
31
Mar
ch 2
018
As
at
31
Mar
ch 2
017
As
at
31
Mar
ch 2
018
As
at
31
Mar
ch 2
017
As
at
31
Mar
ch 2
018
As
at
31
Mar
ch 2
017
Part
y's
Nam
eTr
ade
pay
able
s
JSW
En
erg
y Li
mit
ed-
--
-18
43
55
184
35
5
JSW
Inte
rnat
ion
al T
rad
e C
orp
PTE
Lim
ited
--
--
2,3
155
46
2,3
155
46
Oth
ers
--
7@
30
119
73
08
197
Tota
l-
-7
@2
,80
01,
09
82
,80
71,
09
8
Not
es p
ayab
le
St.
Jam
es In
vest
men
t Li
mit
ed-
--
--
22-
22
Tota
l-
--
--
22
-2
2
Adva
nce
rec
eive
d f
rom
cu
stom
ers
JSW
En
erg
y Li
mit
ed-
--
-2
-2
-
JSW
Jai
gar
h P
ort
Lim
ited
--
--
25-
25-
Tota
l-
--
-27
-27
-
Leas
e an
d o
ther
dep
osit
rec
eive
d
JSW
Sev
erfi
eld
Str
uct
ure
s Li
mit
ed-
-13
12-
-13
12
JSW
En
erg
y Li
mit
ed-
--
-11
1111
11
JSW
Jai
gar
h P
ort
Lim
ited
--
--
44
44
Jin
dal
Saw
Lim
ited
--
--
55
55
JSW
Pai
nts
Pri
vate
Lim
ited
--
--
44
44
Oth
ers
--
--
43
43
Tota
l-
-13
122
827
41
39
Trad
e re
ceiv
able
s
JSW
Sev
erfi
eld
Str
uct
ure
s Li
mit
ed-
-8
21-
-8
21
JSW
Val
lab
h T
in P
late
Pri
vate
Lim
ited
--
576
8-
-57
68
Jin
dal
Ind
ust
ries
Pri
vate
Lim
ited
--
--
25-
25-
Jin
dal
Saw
Lim
ited
--
--
25-
25-
Epsi
lon
Car
bon
Pri
vate
Lim
ited
--
--
746
474
64
Oth
ers
--
43
2927
33
30
Tota
l-
-6
99
215
39
12
22
183
Sh
are
app
licat
ion
mon
ey g
iven
Gou
ran
gd
ih C
oal L
imit
ed-
-@
@-
-@
@
JSW
MI S
teel
Ser
vice
Cen
tre
Pri
vate
Lim
ited
--
-24
--
-24
Oth
ers
--
-@
--
-@
Tota
l-
-@
24-
-@
24

387
Notes to the Consolidated Financial Statements as at and for the year ended 31 March 2018
Better Everyday. In Pursuit of Excellence. Corporate Overview Statutory Reports Financial Statements
C. A
mou
nt d
ue
to/
from
rel
ated
par
ties
` in
cro
res
Part
icul
ars
Asso
ciat
eJo
int
Vent
ures
Oth
er R
elat
ed P
arti
esTo
tal
As
at
31
Mar
ch 2
018
As
at
31
Mar
ch 2
017
As
at
31
Mar
ch 2
018
As
at
31
Mar
ch 2
017
As
at
31
Mar
ch 2
018
As
at
31
Mar
ch 2
017
As
at
31
Mar
ch 2
018
As
at
31
Mar
ch 2
017
Cap
ital
/ r
even
ue
adva
nce
JSW
Pro
ject
s Li
mit
ed-
--
-4
94
94
94
9
JSW
Cem
ent
Lim
ited
--
--
38
733
873
Ind
ia F
lysa
fe A
viat
ion
Lim
ited
--
--
214
-21
4-
Oth
ers
--
2824
65
60
93
84
Tota
l-
-2
824
36
618
23
94
20
6
Loan
s an
d a
dva
nce
s g
iven
JSW
Glo
bal
Bu
sin
ess
Sol
uti
ons
Lim
ited
--
--
75
75
JSW
Tec
hn
o P
roje
cts
Man
agem
ent
Lim
ited
--
--
112
-11
2-
Oth
ers
--
@@
@-
@@
Tota
l-
-@
@11
95
119
5
Inve
stm
ents
hel
d b
y th
e G
rou
p
JSW
Inve
stm
ent
Pri
vate
Lim
ited
--
--
41
151
41
151
JSW
Sev
erfi
eld
Str
uct
ure
s Li
mit
ed-
-16
011
5-
-16
011
5
JSW
En
erg
y Li
mit
ed-
--
-74
06
3774
06
37
Oth
ers
--
146
122
920
155
142
Tota
l-
-3
06
23
779
08
08
1,0
96
1,0
45
Loan
s/ a
dva
nce
s/ d
epos
its
take
nJS
W In
fras
tru
ctu
re L
imit
ed-
--
-5
187
51
87
Tota
l-
--
-5
18
75
18
7
Fin
ance
leas
e ob
ligat
ion
s
JSW
Pro
ject
s Li
mit
ed-
--
-1,
48
41,
66
61,
48
41,
66
6
JSW
Tec
hn
o P
roje
cts
Man
agem
ent
Lim
ited
--
--
173
177
173
177
Tota
l-
--
-1,
657
1,8
43
1,6
571,
84
3
@ -
less
th
an `
50
lakh
s
The
Gro
up
mai
ntai
ns
gra
tuit
y tr
ust
for
th
e p
urp
ose
of a
dm
inis
teri
ng
th
e g
ratu
ity
pay
men
t to
its
emp
loye
es (
JSW
Ste
el G
rou
p G
ratu
ity
Tru
st a
nd
JS
W S
teel
Lim
ited
Em
plo
yee
Gra
tuit
y Fu
nd
). A
s on
31
Mar
ch 2
018
, th
e fa
ir va
lue
of p
lan
ass
ets
was
as
` 8
5 c
rore
s (A
s at
31
Mar
ch 2
017
: ` 7
0 c
rore
s).

388
Notes to the Consolidated Financial Statements as at and for the year ended 31 March 2018
JSW Steel Limited | Integrated Report 2017-18
43. Contingent liabilities: ` in crores
Particulars As at 31 March 2018
As at 31 March 2017
(i) Guarantees 10 927
(ii) Disputed claims/levies (excluding interest, if any), in respect of:
Excise duty 432 338
Custom duty 798 582
Income tax 26 176
Sales tax / Special entry tax 271 262
Service tax 656 513
Miscellaneous 4 11
Levies by local authorities 371 61
Claim by suppliers and other parties 64 378
a) Excise duty cases includes disputes pertaining to availment of CENVAT credit, valuation methodologies, classification of gases under chapter heading.
b) Customs duty cases includes disputes pertaining to import of Iron ore fines and lumps under wrong heading, utilisation of SHIS licences for clearance of imported equipment, payment of customs duty on Steam Coal through Krishnapatnam Port and anti-dumping duty on Met Coke used in Corex.
c) Sales Tax/ VAT/ Special Entry Tax cases includes disputes pertaining to demand of special entry tax in Karnataka and demand of cess by department of transport in Goa.
d) Service Tax cases includes disputes pertaining to availment of service tax credit on ineligible services, KKC amount paid but no credit not availed, denial of credit distributed as an ISD, service tax on railway freight not taken as per prescribed documents.
e) Income Tax cases includes disputes pertaining to deduction u/s 80-IA and other matters.
f) Levies by local authorities cases includes disputes pertaining to uninterrupted power charges by Karnataka Power Transmission Company Ltd., payment of water charges, belated payment surcharge, enhanced compensation and claims for the set off of renewable power obligations against the power generated in its captive power plants.
g) Miscellaneous cases includes Provident fund relating to contractors.
h) Claims by Suppliers and other parties includes Quality Claims issues raised by suppliers and others.
i) There are several other cases which has been determined as remote by the Group and hence not been disclosed above.
(iii) Claims related to Forest Development Tax / Fee 1,799 1,300
Amount paid under protest 919 726
In response to a petition filed by the iron ore mine owners and purchasers (including JSW Steel Limited [the Company]) contesting the levy of Forest Development Tax (FDT) on iron ore on the ground that the State does not have jurisdiction to legislate in the field of major minerals which is a central subject, the Honourable High Court of Karnataka vide its judgement dated 3 December 2015 directed refund of the entire amount of FDT collected by Karnataka State Government on sale of iron ore by private lease operators and National Mineral Development Corporation Limited (NMDC). The Karnataka State Government has filed an appeal before the Supreme Court of India ('SCI'). SCI has not granted stay on the judgement but stayed refund of FDT amounting to ` 1,517 crores. The matter is yet to be heard by SCI. Based on merits of the case and supported by a legal opinion, the Company has not recognised provision for FDT of ` 1,043 crores and treated it as a contingent liability.

389
Notes to the Consolidated Financial Statements as at and for the year ended 31 March 2018
Better Everyday. In Pursuit of Excellence. Corporate Overview Statutory Reports Financial Statements
The State of Karnataka on 27 July 2016, has amended Section 98-A of the Forest Act retrospectively substituting the levy as Forest Development Fee (FDF) instead of FDT. In response to the writ petition filed by the Company and others, the Honourable High Court of Karnataka has vide its order dated 4 October 2017, held that the amendment is ultra-vires the Constitution of India and directed the State Government to refund the FDF collected. The State Government has filed an appeal before the SCI and the SCI has admitted the appeal and stayed the refund of FDF. Based on merits of the case duly supported by a legal opinion and a favourable order from the High Court, the Company has not recognised provision for FDF amount of `756 crores (including paid under protest - `255 crores) pertaining to the private lease operators & NMDC and treated it as contingent liability.
44. Commitments ` in crores
Particulars As at 31 March 2018
As at 31 March 2017
Capital commitments
Estimated amount of contracts remaining to be executed on capital account and not provided for (net of advances)
12,664 6,459
Other commitments
a) The Group has imported capital goods under the export promotion capital goods scheme to utilise the benefit of a zero or concessional customs duty rate. These benefits are subject to future exports. Such export obligations at year end aggregate to
5,133 3,127
b) The Group has imported Hot Rolled Coils during the year under Advance License Scheme to utilise the benefit of a zero customs duty rate. This benefit is subject to future exports to be fulfilled over a period of 18 months. Balance export obligation to be fulfilled as at year end
- 4
45. Operating leasea) As lessor:
i. The Group has entered into lease arrangements, for renting the following:
Category of Asset Area Period
Land at Vijaynagar 481 acres 8 months to 30 years
Land at Palwal 5,497 acres 15 years
Office Premises 1,885 sq. feet 24 months
Office Premises 33,930 sq. feet 5 years
Land at Dolvi along with certain buildings 33 acres 3 to 15 years
Land 6 acres 25 years
The agreements are renewable and cancellable by mutual consent of both parties. The rent paid on above is based on mutually agreed rates.
ii. Disclosure in respect of assets given on operating lease:
` in crores
Particulars As at 31 March 2018
As at 31 March 2017
Gross carrying amount of assets 156 45
Accumulated depreciation 5 3
Depreciation for the year 3 1
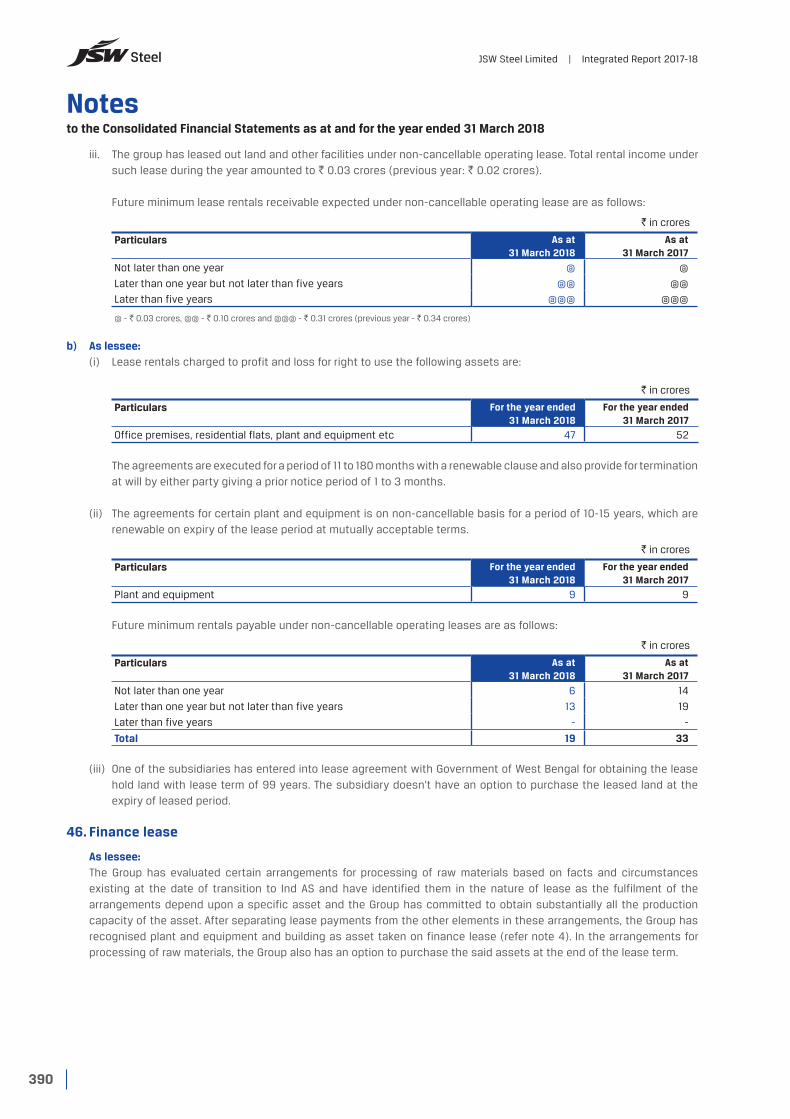
390
Notes to the Consolidated Financial Statements as at and for the year ended 31 March 2018
JSW Steel Limited | Integrated Report 2017-18
iii. The group has leased out land and other facilities under non-cancellable operating lease. Total rental income under such lease during the year amounted to ` 0.03 crores (previous year: ` 0.02 crores).
Future minimum lease rentals receivable expected under non-cancellable operating lease are as follows:
` in crores
Particulars As at 31 March 2018
As at 31 March 2017
Not later than one year @ @
Later than one year but not later than five years @@ @@
Later than five years @@@ @@@
@ - ` 0.03 crores, @@ - ` 0.10 crores and @@@ - ` 0.31 crores (previous year - ` 0.34 crores)
b) As lessee: (i) Lease rentals charged to profit and loss for right to use the following assets are:
` in crores
Particulars For the year ended 31 March 2018
For the year ended 31 March 2017
Office premises, residential flats, plant and equipment etc 47 52
The agreements are executed for a period of 11 to 180 months with a renewable clause and also provide for termination at will by either party giving a prior notice period of 1 to 3 months.
(ii) The agreements for certain plant and equipment is on non-cancellable basis for a period of 10-15 years, which are renewable on expiry of the lease period at mutually acceptable terms.
` in crores
Particulars For the year ended 31 March 2018
For the year ended 31 March 2017
Plant and equipment 9 9
Future minimum rentals payable under non-cancellable operating leases are as follows:
` in crores
Particulars As at 31 March 2018
As at 31 March 2017
Not later than one year 6 14
Later than one year but not later than five years 13 19
Later than five years - -
Total 19 33
(iii) One of the subsidiaries has entered into lease agreement with Government of West Bengal for obtaining the lease hold land with lease term of 99 years. The subsidiary doesn't have an option to purchase the leased land at the expiry of leased period.
46. Finance lease
As lessee: The Group has evaluated certain arrangements for processing of raw materials based on facts and circumstances
existing at the date of transition to Ind AS and have identified them in the nature of lease as the fulfilment of the arrangements depend upon a specific asset and the Group has committed to obtain substantially all the production capacity of the asset. After separating lease payments from the other elements in these arrangements, the Group has recognised plant and equipment and building as asset taken on finance lease (refer note 4). In the arrangements for processing of raw materials, the Group also has an option to purchase the said assets at the end of the lease term.

391
Notes to the Consolidated Financial Statements as at and for the year ended 31 March 2018
Better Everyday. In Pursuit of Excellence. Corporate Overview Statutory Reports Financial Statements
The minimum lease payments and the present value of minimum lease payments as at 31 March 2018 in respect of aforesaid plant and equipment acquired under the finance leases are as follows:
` in crores
Particulars Minimum lease payments Present value of minimum lease payments
As at 31 March 2018
As at 31 March 2017
As at 31 March 2018
As at 31 March 2017
Not later than one year 419 411 221 200
Later than one year but not later than five years 1,875 1,646 1,380 1,062
Later than five years 322 874 180 719
Total 2,616 2,931 1,781 1,981
Less: future finance charges 835 950
Present value of minimum lease payments 1,781 1,981
47. During the year, the Group has surrendered one of its iron ore mines in Chile considering its economic viability and accordingly has reassessed the recoverability of the carrying amounts of Property, Plant and Equipment, Goodwill and advances pertaining to the said iron ore mine and recognised an impairment provision of ` 264 crores which has been disclosed as an exceptional item in the consolidated financial statements.
The provision of ̀ 264 crores includes ̀ 76 crores towards Property, Plant and Equipment, ̀ 166 crores towards Goodwill and ` 22 crores towards Advances.
48. In assessing the carrying amounts of Goodwill, PPE, Capital work-in-progress (CWIP), Leasehold land, Inventories and Advances aggregating to ` 5,777 crores relating to certain businesses (listed below), the Company considered various factors as detailed there against, and concluded that they are recoverable.
i. PPE (including CWIP) of `3,776 crores (` 3,952 crores as at 31 March 2017) relating to steel operations at USA - Estimate of values of the businesses and assets by independent external valuers based on cash flow projections. In making the projections, reliance has been placed on estimates of future prices of steel, and assumptions relating to operational performance including significant improvement in capacity utilisation and margins based on forecasts of demand in local markets.
ii. Goodwill, PPE and CWIP of ` 443 crores (` 608 crores as at 31 March 2017), ` 131 crores (` 208 crores as at 31 March 2017) and ` 8 crores (` 8 crores as at 31 March 2017) respectively relating to iron ore mines at Chile - Estimate of values of the assets by independent external valuers based on cash flow projections / implied multiple approach. In making the said projections, reliance has been placed on estimates of future prices of iron ore, mineable resources, assumptions relating to operational performance and availability of infrastructure facilities for mines.
iii. Goodwill, PPE and CWIP of ` 229 crores (` 229 crores as at 31 March 2017), ` 394 crores (` 120 crores as at 31 March 2017) and ` Nil crores (` 222 crores as at 31 March 2017) respectively relating to coal mines at West Virginia, USA - Estimate of values of the businesses and assets by independent external valuers based on cash flow projections. In making the said projections, reliance has been placed on estimates of future prices of coal, mineable resources, and assumptions relating to operational performance, and availability of infrastructure facilities for mines.
iv. Integrated Steel Complex at Salboni, Bengal [PPE ` 117 crores (` 119 crores as at 31 March 2017), CWIP ` 146 crores (` 144 crores as at 31 March 2017), leasehold land ` 75 crores (` 75 crores as at 31 March 2017) and advances ` 148 crores (` 149 crores as at 31 March 2017)] - Evaluation of current status of the integrated Steel Complex (including power plant) to be implemented in phases at Salboni of district Paschim Medinipur in West Bengal, and the projections relating to the said complex considering estimates for the future prices of raw materials, foreign exchange rates, operating margins, etc. and the plans for commencing construction of the said complex.
v. Integrated Steel Complex at Ranchi, Jharkhand [PPE ` 45 crores (` 45 crores as at 31 March 2017), CWIP ` 31 crores (` 31 crores as at 31 March 2017) and Advances ̀ 1 crore (` 1 crore as at 31 March 2017)] - Evaluation of current status of the integrated Steel Complex to be implemented in phases at Ranchi, Jharkhand and the projections relating to the said complex considering estimates for the future prices of raw materials, foreign exchange rates, operating margins, etc. and the plans for commencing construction of the said complex.

392
Notes to the Consolidated Financial Statements as at and for the year ended 31 March 2018
JSW Steel Limited | Integrated Report 2017-18
vi. Goodwill ` 24 crores (` 24 crores as at 31 March 2017) and Inventories ` 121 crores (` 121 crores as at 31 March 2017) relating to interest in a real estate property – Valuation of the property by an independent expert.
vii. PPE ` 81 crores including mining development and projects ` 71 crores (` 79 crores including mining development and projects ` 69 crores as at 31 March 2017) and goodwill ` 7 crores (` 7 crores as at 31 March 2017) relating to coal mines at Mozambique - Assessment of minable reserves by independent experts and cash flow projections based on plans to commence operations after mining lease arrangements are in place for which application has been submitted to regulatory authorities and infrastructure is developed.
49. Research and development activities The manufacturing and other expenses include ` 29 crores (previous year – ` 21 crores) in respect of research and
development activities undertaken during the year. Depreciation expenditure includes ` 12 crores (previous year – ` 11 crores) in respect of research and development activities undertaken during the year.
50. Joint ventures Details of the Group’s material joint ventures are as follows:
Name of the Joint venture Place of incorporation and operation
Proportion of ownership interest and voting power held
by the Group
Principal activity
31 March 2018 31 March 2017
JSW Severfield Structures Limited India 50% 50% Design, fabrication and erection of structural steel works
JSW Structural Metal Decking Limited India 33.33% 33.33% Metal Deckings
Rohne Coal Company Private Limited India 49% 49% Coal mining Company
JSW MI Steel Service Center Private Limited
India 50% 50% Steel service centre
JSW Vallabh Tinplate Private Limited India 50% 50% Steel plant
Vijayanagar Minerals Private Limited India 40% 40% Supply of iron ore
Gourangdih Coal Limited India 50% 50% Coal mining Company
AcciaItalia S.p.A. (w.e.f. 30 November 2016)
Italy 35% 35% Trading in steel products
Geo Steel LLC Georgia 49% 49% Manufacturing of TMT rebar
The above joint ventures are accounted using the equity method in these consolidated financial statements.
Summarised financial information in respect of the Group’s, material joint ventures is set out below. The summarised financial information below represents amounts shown in joint ventures financial statements prepared in accordance with Indian GAAP (adjusted by the Group for equity accounting purposes).
a) Financial information of ‘JSW Severfield Structures Limited’
` in crores
Particulars As at 31 March 2018
As at 31 March 2017
Current assets 419 363
Non-current assets 207 218
Current liabilities 459 468
Non-current liabilities 1 50

393
Notes to the Consolidated Financial Statements as at and for the year ended 31 March 2018
Better Everyday. In Pursuit of Excellence. Corporate Overview Statutory Reports Financial Statements
The above amount of assets and liabilities include the following:
` in crores
Particulars As at 31 March 2018
As at 31 March 2017
Cash and cash equivalents @ 25
Current financial liabilities (excluding trade and other payables and provisions)
74 201
Non-current financial liabilities (excluding trade and other payables and provisions)
- 46
@ - ` 0.27 crores
` in crores
Particulars For the year ended 31 March 2018
For the year ended 31 March 2017
Revenue 411 391
Profit / (loss) for the year 11 3
Other comprehensive income for the year @ @
Total comprehensive income for the year 11 3
Dividends received from the joint venture during the year - -
@ - ` (0.10) crores (previous year – ` (0.09) crores)
The above profit / (loss) for the year include the following:
` in crores
Particulars For the year ended 31 March 2018
For the year ended 31 March 2017
Depreciation and amortisation 15 15
Interest income 3 2
Interest expense 27 37
Income tax expense (income) @ @
@ - ` 0.12 crores (previous year ` 0.24 crores)
Reconciliation of the above summarised financial information to the carrying amount of the interest in the joint venture recognised in the consolidated financial statements:
` in crores
Particulars As at 31 March 2018
As at 31 March 2017
Net assets of the joint venture 163 63
Proportion of the Group’s ownership interest in the joint venture 50% 50%
Other adjustments - -
Carrying amount of the Group’s interest in the joint venture 81 31
b) Financial information of ‘JSW MI Steel Service Center Private Limited’
` in crores
Particulars As at 31 March 2018
As at 31 March 2017
Current assets 109 193
Non-current assets 198 112
Current liabilities 40 30
Non-current liabilities 119 136

394
Notes to the Consolidated Financial Statements as at and for the year ended 31 March 2018
JSW Steel Limited | Integrated Report 2017-18
The above amount of assets and liabilities include the following:
` in crores
Particulars As at 31 March 2018
As at 31 March 2017
Cash and cash equivalents 45 103
Current financial liabilities (excluding trade and other payables and provisions)
32 17
Non-current financial liabilities (excluding trade and other payables and provisions)
119 135
` in crores
Particulars For the year ended 31 March 2018
For the year ended 31 March 2017
Revenue 159 50
Profit / (loss) for the year 12 @
Other comprehensive income for the year (2) @@
Total comprehensive income for the year 10 @@@
Dividends received from the joint venture during the year - -
@ - ` 0.24 crores; @@ - ` (0.04) crores; @@@ - ` 0.20 crores
The above profit / (loss) for the year include the following:
` in crores
Particulars For the year ended 31 March 2018
For the year ended 31 March 2017
Depreciation and amortisation 4 4
Interest income 7 4
Interest expense 3 2
Income tax expense (income) 3 -
Reconciliation of the above summarised financial information to the carrying amount of the interest in the joint venture recognised in the consolidated financial statements:
` in crores
Particulars As at 31 March 2018
As at 31 March 2017
Net assets of the joint venture 148 138
Proportion of the Group’s ownership interest in the joint venture 50% 50%
Other adjustments - (48)
Carrying amount of the Group’s interest in the joint venture 74 45
c) Financial information of ‘JSW Vallabh Tinplate Private Limited’
` in crores
Particulars As at 31 March 2018
As at 31 March 2017
Current assets 109 139
Non-current assets 187 197
Current liabilities 170 181
Non-current liabilities 64 91
The above amount of assets and liabilities include the following:
` in crores
Particulars As at 31 March 2018
As at 31 March 2017
Cash and cash equivalents @ @
Current financial liabilities (excluding trade and other payables and provisions)
75 73
Non-current financial liabilities (excluding trade and other payables and provisions)
63 85
@ - ` 0.23 crores (previous year – ` 0.43 crores)

395
Notes to the Consolidated Financial Statements as at and for the year ended 31 March 2018
Better Everyday. In Pursuit of Excellence. Corporate Overview Statutory Reports Financial Statements
` in crores
Particulars For the year ended 31 March 2018
For the year ended 31 March 2017
Revenue 551 482
Profit / (loss) for the year (2) (3)
Other comprehensive income for the year @@ @@
Total comprehensive income for the year (2) (3)
Dividends received from the joint venture during the year - -
@@ - ` 0.17 crores (previous year ` (0.02 crores))
The above profit / (loss) for the year include the following:
` in crores
Particulars For the year ended 31 March 2018
For the year ended 31 March 2017
Depreciation and amortisation 12 13
Interest income @ -
Interest expense 18 17
Income tax expense (income) (1) (1)
@ - ` 0.37 crores
Reconciliation of the above summarised financial information to the carrying amount of the interest in the joint venture recognised in the consolidated financial statements:
` in crores
Particulars As at 31 March 2018
As at 31 March 2017
Net assets of the joint venture 62 64
Proportion of the Group’s ownership interest in the joint venture 50% 50%
Other adjustments - -
Carrying amount of the Group’s interest in the joint venture 31 32
d) Financial information of ‘AcciaItalia S.p.A.’
` in crores
Particulars As at 31 March 2018
As at 31 March 2017
Current assets 9 1,158
Non-current assets - 19
Current liabilities 9 1,143
Non-current liabilities - -
The above amount of assets and liabilities include the following:
` in crores
Particulars As at 31 March 2018
As at 31 March 2017
Cash and cash equivalents 1 -
Current financial liabilities (excluding trade and other payables and provisions)
- -
Non-current financial liabilities (excluding trade and other payables and provisions)
- -
` in crores
Particulars For the year ended 31 March 2018
For the year ended 31 March 2017
Revenue - -
Profit / (loss) for the year (39) @
Other comprehensive income for the year - -
Total comprehensive income for the year (39) @
Dividends received from the joint venture during the year - -
@ - ` 0.41 crores
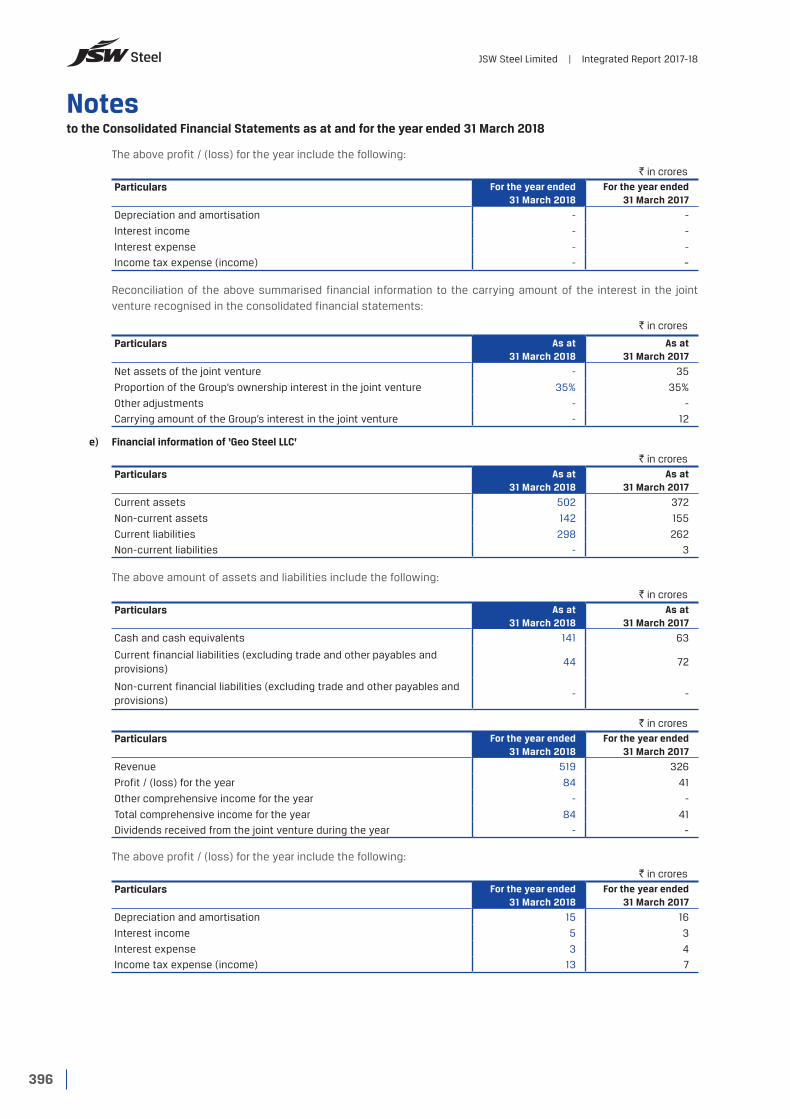
396
Notes to the Consolidated Financial Statements as at and for the year ended 31 March 2018
JSW Steel Limited | Integrated Report 2017-18
The above profit / (loss) for the year include the following:
` in crores
Particulars For the year ended 31 March 2018
For the year ended 31 March 2017
Depreciation and amortisation - -
Interest income - -
Interest expense - -
Income tax expense (income) - -
Reconciliation of the above summarised financial information to the carrying amount of the interest in the joint venture recognised in the consolidated financial statements:
` in crores
Particulars As at 31 March 2018
As at 31 March 2017
Net assets of the joint venture - 35
Proportion of the Group’s ownership interest in the joint venture 35% 35%
Other adjustments - -
Carrying amount of the Group’s interest in the joint venture - 12
e) Financial information of ‘Geo Steel LLC’
` in crores
Particulars As at 31 March 2018
As at 31 March 2017
Current assets 502 372
Non-current assets 142 155
Current liabilities 298 262
Non-current liabilities - 3
The above amount of assets and liabilities include the following:
` in crores
Particulars As at 31 March 2018
As at 31 March 2017
Cash and cash equivalents 141 63
Current financial liabilities (excluding trade and other payables and provisions)
44 72
Non-current financial liabilities (excluding trade and other payables and provisions)
- -
` in crores
Particulars For the year ended 31 March 2018
For the year ended 31 March 2017
Revenue 519 326
Profit / (loss) for the year 84 41
Other comprehensive income for the year - -
Total comprehensive income for the year 84 41
Dividends received from the joint venture during the year - -
The above profit / (loss) for the year include the following:
` in crores
Particulars For the year ended 31 March 2018
For the year ended 31 March 2017
Depreciation and amortisation 15 16
Interest income 5 3
Interest expense 3 4
Income tax expense (income) 13 7

397
Notes to the Consolidated Financial Statements as at and for the year ended 31 March 2018
Better Everyday. In Pursuit of Excellence. Corporate Overview Statutory Reports Financial Statements
Reconciliation of the above summarised financial information to the carrying amount of the interest in the joint venture recognised in the consolidated financial statements:
` in crores
Particulars As at 31 March 2018
As at 31 March 2017
Net assets of the joint venture 347 262
Proportion of the Group’s ownership interest in the joint venture 49% 49%
Other adjustments - -
Carrying amount of the Group’s interest in the joint venture 170 128
f) Aggregate information of joint ventures that are not individually material
` in crores
Particulars As at 31 March 2018
As at 31 March 2017
Aggregate carrying amount of the Group’s interest in these joint ventures 4 4
Profit / (loss) from continuing operations @ @@
Post tax profit / (loss) from continuing operations @ @@
Other comprehensive income - -
Total comprehensive income @ @@
@ - ` (0.08) crores; @@ ` (0.12) crores
51. SubsidiariesDetails of the Group’s subsidiaries at the end of reporting period are as follows:
Name of the subsidiary Place of incorporation and operation
Proportion of ownership interest and voting power held
by the Group
Principal activity
31 March 2018 31 March 2017
JSW Steel (Netherlands) B.V. Netherlands 100% 100% Acquisition and investment in steel related & allied businesses and trading in steel products
JSW Steel Italy S.R.L. (w.e.f. 30 January 2017)
Italy 100% 100% Trading in steel products
JSW Steel (UK) Limited United Kingdom 100% 100% Investment in steel related and steel allied businesses
Periama Holdings, LLC (w.e.f 23 January 2017)
United States of America
100% 100% Holding Company of JSW Steel (USA) Inc. and West Virginia operations
JSW Steel (USA) Inc. United States of America
90% 90% Manufacturing plates, pipes and double jointing
Purest Energy, LLC United States of America
100% 100% Holding Company
Meadow Creek Minerals, LLC United States of America
100% 100% Mining Company
Hutchinson Minerals, LLC United States of America
100% 100% Mining Company
R.C. Minerals, LLC United States of America
100% 100% Mining Company
Keenan Minerals, LLC United States of America
100% 100% Mining Company
Peace Leasing, LLC United States of America
100% 100% Mining Company
Prime Coal, LLC United States of America
100% 100% Management Company
Planck Holdings, LLC United States of America
100% 100% Holding Company
Rolling S Augering, LLC United States of America
100% 100% Mining Company
Periama Handling, LLC United States of America
100% 100% Coal loading Company

398
Notes to the Consolidated Financial Statements as at and for the year ended 31 March 2018
JSW Steel Limited | Integrated Report 2017-18
Name of the subsidiary Place of incorporation and operation
Proportion of ownership interest and voting power held
by the Group
Principal activity
31 March 2018 31 March 2017
Lower Hutchinson Minerals, LLC United States of America
100% 100% Mining Company
Caretta Minerals, LLC United States of America
100% 100% Mining Company
JSW Panama Holdings Corporation Republic of Panama
100% 100% Holding Company for Chile based companies and trading in iron ore
Inversiones Eroush Limitada Chile 100% 100% Holding Company (LLP) of Santa Fe Mining
Santa Fe Mining Chile 70% 70% Mining Company
Santa Fe Puerto S.A. Chile 70% 70% Port Company
JSW Natural Resources Limited Republic of Mauritius
100% 100% Holding Company of JSW Natural Resources Mozambique Limitada and JSW Mali Resources SA
JSW Natural Resources Mozambique Limitada
Mozambique 100% 100% Mining Company
JSW ADMS Carvao Limitada Mozambique 100% 100% Mining Company
JSW Steel Processing Centres Limited India 100% 100% Steel service center
JSW Bengal Steel Limited India 98.68% 98.66% Steel plant
JSW Natural Resources India Limited India 98.68% 98.66% Mining related Company
JSW Energy (Bengal) Limited India 98.68% 98.66% Power plant
JSW Natural Resource Bengal Limited India 98.68% 98.66% Mining related Company
JSW Jharkhand Steel Limited India 100% 100% Steel plant and mining
JSW Steel Coated Products Limited India 100% 100% Steel plant
Amba River Coke Limited India 100% 100% Coke oven and Pellet plant
Nippon Ispat Singapore (PTE) Limited Singapore 100% 100% Mining Company
Erebus Limited Mauritius 100% 100% Mining Company
Arima Holdings Limited Mauritius 100% 100% Mining Company
Lakeland Securities Limited Mauritius 100% 100% Mining Company
Peddar Realty Private Limited India 100% 100% Real estate
Dolvi Minerals & Metals Private Limited India 40% 40% Trading in steel and allied products
Dolvi Coke Private Limited India 40% 40% Coke oven plant
JSW Realty & Infrastructure Private Limited
India 0% 0% Construction and development of residential township
JSW Industrial Gases Private Limited (formerly known as JSW Praxair Oxygen Private Limited) (w.e.f. 16 August 2016)
India 100% 100% Production of gaseous and liquid form of oxygen, nitrogen, argon and other products recoverable from separation of air
JSW Steel (Salav) Limited India 100% 99.90% Steel plant
JSW Utkal Steel Limited (w.e.f. 16 November 2017)
India 100% - Steel plant
Hasaud Steel Limited (w.e.f. 13 February 2018)
India 100% - Investment in steel related activities
Milloret Steel Limited (w.e.f. 8 March 2018)
India 100% - Investment in steel related activities
Creixent Special Steels Limited (w.e.f. 27 February 2018)
India 100% - Investment in steel related activities

399
Notes to the Consolidated Financial Statements as at and for the year ended 31 March 2018
Better Everyday. In Pursuit of Excellence. Corporate Overview Statutory Reports Financial Statements
Non-controlling interest
a) Financial information of ‘JSW Steel (USA) Inc.’
` in crores
Particulars As at 31 March 2018
As at 31 March 2017
Non-current assets 3,776 3,952
Current assets 803 518
Non-current liabilities 3,478 3,846
Current liabilities 571 749
Equity attributable to owners of the Company 860 103
Non-controlling interest (330) (228)
` in crores
Particulars For the year ended 31 March 2018
For the year ended 31 March 2017
Revenue 1,470 925
Expenses 1,761 1,352
Profit/ (loss) for the year 651 (362)
Profit / (loss) attributable to owners of the Company 586 (326)
Profit / (loss) attributable to the non-controlling interest 65 (36)
Profit / (loss) for the year 651 (362)
Other comprehensive income attributable to owners of the Company - -
Other comprehensive income attributable to the non-controlling interests - -
Other comprehensive income for the year - -
Total comprehensive income attributable to the owners of the Company 586 (326)
Total comprehensive income attributable to the non-controlling interests 65 (36)
Total comprehensive income for the year 651 (362)
` in crores
Particulars For the year ended 31 March 2018
For the year ended 31 March 2017
Net cash inflow / (outflow) from operating activities (229) (581)
Net cash inflow / (outflow) from investing activities (24) (8)
Net cash inflow / (outflow) from financing activities 241 585
Net cash inflow / (outflow) (12) (4)
b) Financial information of ‘Santa Fe Mining’
` in crores
Particulars As at 31 March 2018
As at 31 March 2017
Non-current assets 162 252
Current assets 20 1
Non-current liabilities 10 -
Current liabilities 363 332
Equity attributable to owners of the Company (134) (55)
Non-controlling interest (57) (24)

400
Notes to the Consolidated Financial Statements as at and for the year ended 31 March 2018
JSW Steel Limited | Integrated Report 2017-18
` in crores
Particulars For the year ended 31 March 2018
For the year ended 31 March 2017
Revenue - -
Expenses 111 57
Profit / (loss) for the year (111) (53)
Profit / (loss) attributable to owners of the Company (78) (37)
Profit / (loss) attributable to the non-controlling interest (33) (16)
Profit / (loss) for the year (111) (53)
Other comprehensive income attributable to owners of the Company - -
Other comprehensive income attributable to the non-controlling interests - -
Other comprehensive income for the year - -
Total comprehensive income attributable to the owners of the Company (78) (37)
Total comprehensive income attributable to the non-controlling interests (33) (16)
Total comprehensive income for the year (111) (53)
` in crores
Particulars For the year ended 31 March 2018
For the year ended 31 March 2017
Net cash inflow / (outflow) from operating activities (17) (50)
Net cash inflow / (outflow) from investing activities (19) -
Net cash inflow / (outflow) from financing activities 36 49
Net cash inflow / (outflow) - @
@ - ` (0.34) crores
c) Financial information of ‘JSW Realty Infrastructure & Private Limited’
` in crores
Particulars As at 31 March 2018
As at 31 March 2017
Non-current assets 366 414
Current assets 10 11
Non-current liabilities 299 356
Current liabilities 49 89
Equity attributable to owners of the Company - -
Non-controlling interest 28 (20)
` in crores
Particulars For the year ended 31 March 2018
For the year ended 31 March 2017
Revenue 30 27
Expenses 145 29
Profit/ (loss) for the year (91) (11)
Profit / (loss) attributable to owners of the Company - -
Profit / (loss) attributable to the non-controlling interest (91) (11)
Profit / (loss) for the year (91) (11)
Other comprehensive income attributable to owners of the Company - -
Other comprehensive income attributable to the non-controlling interests - -
Other comprehensive income for the year - -
Total comprehensive income attributable to the owners of the Company - -
Total comprehensive income attributable to the non-controlling interests (91) (11)
Total comprehensive income for the year (91) (11)

401
Notes to the Consolidated Financial Statements as at and for the year ended 31 March 2018
Better Everyday. In Pursuit of Excellence. Corporate Overview Statutory Reports Financial Statements
` in crores
Particulars For the year ended 31 March 2018
For the year ended 31 March 2017
Net cash inflow / (outflow) from operating activities 39 (8)
Net cash inflow / (outflow) from investing activities (72) (31)
Net cash inflow / (outflow) from financing activities 34 41
Net cash inflow / (outflow) 1 2
d) Consolidated Financial information of ‘Dolvi Minerals and Metals Private Limited’
` in crores
Particulars As at 31 March 2018
As at 31 March 2017
Non-current assets 1,883 1,031
Current assets 277 250
Non-current liabilities 1,925 1,118
Current liabilities 280 127
Equity attributable to owners of the Company (18) 16
Non-controlling interest (27) 20
` in crores
Particulars For the year ended 31 March 2018
For the year ended 31 March 2017
Revenue 15 26
Expenses 19 57
Profit/ (loss) for the year (78) (24)
Profit / (loss) attributable to owners of the Company (31) (10)
Profit / (loss) attributable to the non-controlling interest (47) (14)
Profit / (loss) for the year (78) (24)
Other comprehensive income attributable to owners of the Company @ @
Other comprehensive income attributable to the non-controlling interests @@ @@
Other comprehensive income for the year (1) @@@
Total comprehensive income attributable to the owners of the Company (32) (9)
Total comprehensive income attributable to the non-controlling interests (47) (14)
Total comprehensive income for the year (79) (24)
@ - ` (0.25) crores (previous year – ` 0.07 crores); @@ - ` (0.37) crores (previous year – ` 0.10 crores);
@@@ - ` 0.17 crores
` in crores
Particulars For the year ended 31 March 2018
For the year ended 31 March 2017
Net cash inflow / (outflow) from operating activities (81) (7)
Net cash inflow / (outflow) from investing activities (205) (282)
Net cash inflow / (outflow) from financing activities 306 (7)
Net cash inflow / (outflow) 20 (296)
52. Subsequent eventsOn 16 May 2018 the board of directors recommended a final dividend of ` 3.20 per equity share (total dividend ` 774 crores) be paid to shareholders for financial year 2017-18, which is subject to approval by the shareholders at the Annual General Meeting to be held on 24 July 2018.
53. Previous year figures have been re-grouped / re-classified wherever necessary.

402
Notes to the Consolidated Financial Statements as at and for the year ended 31 March 2018
JSW Steel Limited | Integrated Report 2017-1854
. Dis
clos
ure
of a
ddit
iona
l inf
orm
atio
n pe
rtai
ning
to
the
Pare
nt C
ompa
ny, S
ubsi
diar
ies
and
Join
t ve
ntur
es a
s pe
r Sch
edul
e III
of
Com
pani
es
Act,
20
13`
in c
rore
s
Nam
e of
ent
ity
in t
he g
roup
Net
Ass
ets,
i.e.
tot
al a
sset
s m
inu
s to
tal l
iab
iliti
esS
har
e in
pro
fit
or lo
ssS
har
e in
oth
er c
omp
reh
ensi
ve
inco
me
Sh
are
in t
otal
com
pre
hen
sive
in
com
e
As
% o
f co
nso
lidat
ed
net
ass
ets
Am
ount
As
% o
f co
nso
lidat
ed
pro
fit
or lo
ss
Am
ount
As
% o
f co
nso
lidat
ed
oth
er
com
pre
hen
sive
in
com
e
Am
ount
As
% o
f to
tal
com
pre
hen
sive
in
com
e
Am
ount
PAR
ENT
Com
pan
y
JSW
Ste
el L
imit
ed6
4.9
517
,88
279
.40
4,8
54
87.6
3(1
63
)79
.15
4,6
91
SU
BS
IDIA
RIE
S
IND
IAN
JSW
Ste
el P
roce
ssin
g C
entr
es L
imit
ed0
.63
173
0.4
729
-@
0.4
929
JSW
Ben
gal
Ste
el –
Gro
up
1.45
39
9(0
.15
)(9
)-
@(0
.15
)(9
)
Am
ba
Riv
er C
oke
Lim
ited
6.3
41,7
46
3.0
918
9(3
.23
)6
3.2
919
5
JSW
Ste
el C
oate
d P
rod
uct
s Li
mit
ed7.
06
1,9
44
5.0
13
06
19.3
5(3
6)
4.5
627
0
JSW
Ste
el S
alav
Lim
ited
2.26
621
1.0
16
2-
@1.
05
62
JSW
Jh
arkh
and
Ste
el L
imit
ed0
.28
77(0
.07)
(4)
-@
(0.0
7)(4
)
Ped
dar
Rea
lty
Pri
vate
Lim
ited
0.5
314
5(0
.20
)(1
2)-
-(0
.20
)(1
2)
Dol
vi M
iner
als
and
Met
als
Pri
vate
Lim
ited
- G
rou
p0
.39
108
(0.4
6)
(28
)0
.54
(1)
(0.4
9)
(29
)
JSW
Rea
lty
Infr
astr
uct
ure
Pri
vate
Lim
ited
0.7
821
6-
--
--
-
JSW
Ind
ust
rial
Gas
es P
riva
te L
imit
ed1.
283
52
0.4
729
-@
0.4
929
JSW
Utk
al S
teel
Lim
ited
0.0
616
(0.0
3)
(2)
--
(0.0
3)
(2)
Has
aud
Ste
el L
imit
ed-
@-
--
--
-
Mill
oret
Ste
el L
imit
ed-
--
--
--
-
Cre
ixen
t S
pec
ial S
teel
s Li
mit
ed-
@-
--
--
-
FOR
EIG
N
JSW
Ste
el (
Net
her
lan
ds)
B.V
.(2
.34
)(6
45
)(0
.41)
(25
)-
-(0
.42)
(25
)
Per
iam
a H
old
ing
LLC
– G
rou
p13
.39
3,6
86
17.0
01,
03
9-
-17
.53
1,0
39
JSW
Pan
ama
Hol
din
gs
Cor
por
atio
n -
Gro
up
2.4
467
2(3
.80
)(2
32)
--
(3.9
1)(2
32)
JSW
Ste
el U
K Li
mit
ed0
.51
141
(0.2
6)
(16
)-
-(0
.27)
(16
)
JSW
Nat
ura
l Res
ourc
es L
imit
ed -
Gro
up
0.3
810
5-
@-
--
@
Ari
ma
Hol
din
g L
imit
ed-
--
@-
--
@
Lake
lan
d S
ecu
riti
es L
imit
ed-
@-
@-
--
@
Ereb
us
Lim
ited
-@
-@
--
-@
Nip
pon
Isp
at S
ing
apor
e (P
TE)
Lim
ited
-@
--
--
--
JSW
Ste
el It
aly
S.R
.L.
-@
(0.1
3)
(8)
--
(0.1
3)
(8)

403
Notes to the Consolidated Financial Statements as at and for the year ended 31 March 2018
Better Everyday. In Pursuit of Excellence. Corporate Overview Statutory Reports Financial Statements
` in
cro
res
Nam
e of
ent
ity
in t
he g
roup
Net
Ass
ets,
i.e.
tot
al a
sset
s m
inu
s to
tal l
iab
iliti
esS
har
e in
pro
fit
or lo
ssS
har
e in
oth
er c
omp
reh
ensi
ve
inco
me
Sh
are
in t
otal
com
pre
hen
sive
in
com
e
As
% o
f co
nso
lidat
ed
net
ass
ets
Am
ount
As
% o
f co
nso
lidat
ed
pro
fit
or lo
ss
Am
ount
As
% o
f co
nso
lidat
ed
oth
er
com
pre
hen
sive
in
com
e
Am
ount
As
% o
f to
tal
com
pre
hen
sive
in
com
e
Am
ount
NO
N-C
ON
TRO
LLIN
G IN
TER
EST
IN A
LL
SU
BS
IDIA
RIE
S(1
.69
)(4
64
)(1
.65
)(1
01)
1.0
8(2
)(1
.74
)(1
03
)
JOIN
T V
ENTU
RES
(in
vest
men
t as
per
th
e eq
uit
y m
eth
od)
IND
IAN
Vija
yan
agar
Min
eral
s P
riva
te L
imit
ed0
.01
2-
@-
--
@
Roh
ne
Coa
l Com
pan
y P
riva
te L
imit
ed-
--
--
--
-
JSW
Sev
erfi
eld
Str
uct
ure
s Li
mit
ed -
Gro
up
0.2
98
10
.16
10-
-0
.17
10
Gou
ran
gd
ih C
oal L
imit
ed0
.01
2-
@-
--
@
JSW
MI S
teel
Ser
vice
Cen
ter P
riva
te L
imit
ed0
.27
740
.08
5-
-0
.08
5
JSW
Val
lab
h T
inp
late
Pri
vate
Lim
ited
0.1
13
1(0
.02)
(1)
--
(0.0
2)(1
)
FOR
EIG
N
Geo
Ste
el L
LC0
.62
170
0.6
74
1-
-0
.69
41
Acci
aIta
lia S
.p.A
.-
-(0
.21)
(13
)-
-(0
.22)
(13
)
Fore
ign
cu
rren
cy t
ran
slat
ion
res
erve
--
--
(5.3
8)
100
.17
10
Tota
l10
0.0
027
,53
410
0.0
06
,113
100
.00
(18
6)
100
.00
5,9
27
@ -
Les
s th
an `
50
lakh
s
Not
e: T
he
bal
ance
s an
d a
mou
nts
pre
sent
ed a
bov
e ar
e n
et o
f in
terC
omp
any
elim
inat
ion
s an
d c
onso
lidat
ion
ad
just
men
ts.

404
Notes to the Consolidated Financial Statements as at and for the year ended 31 March 2018
JSW Steel Limited | Integrated Report 2017-18
55. Standards issued but not yet effective
In March 2018, the Ministry of Corporate Affairs issued the Companies (Indian Accounting Standards) Amendment Rules, 2018, notifying Ind AS 115 ‘Revenue from Contracts with Customers’ (New Revenue Standard), which replaces Ind AS 11 ‘Construction Contracts’ and Ind AS 18 ‘Revenue’. The core principle of the New Revenue Standard is that an entity should recognise revenue to depict the transfer of promised goods or services to customers in an amount that reflects the consideration to which the entity expects to be entitled in exchange for those goods or services. Some of the key changes introduced by the New Revenue Standard include additional guidance for multiple-element arrangements, measurement approaches for variable consideration, adjustments for time value of money etc. Significant additional disclosures in relation to revenue are also prescribed. The New Revenue Standard also provides two broad alternative transition options – Retrospective Method and Cumulative Effect Method – with certain practical expedients available under the Retrospective Method. The Group is in the process of evaluating the impact of the New Revenue Standard on the present and future arrangements and shall determine the appropriate transition option once the said evaluation has been completed.
Also Appendix B to Ind AS 21, foreign currency transactions and advance consideration was notified along with the same notification which clarifies the date of the transaction for the purpose of determining the exchange rate to use on initial recognition of the related asset, expense or income, when an entity has received or paid advance consideration in a foreign currency. The Group is in the process of evaluating the effect of amendment on its financial statements.
Other amendments Following amendments to other Ind ASs which are issued but are not effective in FY 2017-18
a) Amendments to Ind AS 112 Disclosure of Interests in Other Entities: Clarification of the scope of disclosure requirements in Ind AS 112.
b) Amendments to Ind AS 12 Recognition of Deferred Tax Assets for Unrealised Losses.
c) Transfers of Investment Property — Amendments to Ind AS 40.
d) Ind AS 28 Investments in Associates and Joint Ventures – Clarification that measuring investees at fair value through profit or loss is an investment-by-investment choice.
The Group is in the process of evaluating the effect of these amendments on the financial statements.
As per our report of even date For and on behalf of the Board of Directors
For S R B C & CO LLP Sajjan JindalChartered Accountants Chairman & Managing DirectorICAI Firm Reg. No. 324982E/E300003 DIN 00017762
per Vikram Mehta Lancy Varghese Rajeev Pai Seshagiri Rao M.V.S.Partner Company Secretary Chief Financial Officer Jt. Managing Director & Group CFOMembership No. 105938 ICSI Membership No. FCS 9407 DIN 00029136
Place: MumbaiDate: 16 May 2018

405
Better Everyday. In Pursuit of Excellence. Corporate Overview Statutory Reports Financial Statements
Form
AO
C-I
(In
form
atio
n o
f S
ub
sid
iari
es, J
Vs a
nd
Ass
ocia
tes
as r
equ
ired
un
der
fir
st p
rovi
so t
o su
b-s
ecti
on (
3)
of s
ecti
on 1
29
of
the
Com
pan
ies
Act,
20
13 r
ead
wit
h r
ule
5 o
f C
omp
anie
s (A
ccou
nts)
R
ule
s, 2
014
)Pa
rt A
: Sub
sidi
arie
s`
in c
rore
s
Nam
e of
the
Sub
sidi
ary
JSW
Ste
el
(Net
herl
and
s)
B.V
.
JSW
Ste
el
Ital
y S
.R.L
.JS
W S
teel
(U
K) L
imit
edPe
riam
a H
old
ing
s LL
CJS
W S
teel
(U
SA)
Inc.
Pri
me
Coa
l LL
CP
lan
ck
Hol
din
gs
LLC
Rol
ling
S
Aug
erin
g L
LCPe
riam
a H
and
ling
LLC
Car
etta
M
iner
als
LLC
AR
epor
tin
g C
urr
ency
US
DEU
RO
GB
PU
SD
US
DU
SD
US
DU
SD
US
DU
SD
BEx
chan
ge
rate
65
.04
80
.62
92.
286
5.0
46
5.0
46
5.0
46
5.0
46
5.0
46
5.0
46
5.0
4
CS
har
e C
apit
al29
7.9
30
.16
139
.23
93
.34
5,2
23.0
40
.68
48
3.6
228
.70
26.0
35
27.1
6
DR
eser
ves
and
Su
rplu
s(1
,13
3.9
7)(9
.67)
(10
6.0
5)
(19
3.9
3)
(4,6
90
.61)
(80
.39
)(7
8.8
6)
(67.
69
)(6
2.9
3)
(19
1.8
0)
ETo
tal A
sset
s37
1.97
2.67
140
.74
5,8
14.3
04
,59
8.1
30
.44
58
8.0
30
.03
-72
9.2
3
FTo
tal L
iab
iliti
es1,
208
.01
12.1
810
7.5
65
,914
.89
4,0
65
.70
80
.15
183
.27
39
.02
36
.90
39
3.8
7
GIn
vest
men
t19
2.5
5-
-1,
83
5.5
6-
-5
29.5
0-
--
HTu
rnov
er-
160
.62
--
1,5
26.2
7-
--
-5
9.0
5
IP
rofi
ts /
(Lo
sses
) b
efor
e Ta
xes
(78
.78
)(9
.51)
(36
.47)
(170
.70
)(2
91.
17)
(0.6
2)(8
.69
)0
.32
(0.0
5)
(6.0
5)
JP
rovi
sion
for
Tax
atio
n-
--
3.1
7(1
19.8
6)
--
--
-
KP
rofi
ts /
(Lo
sses
) af
ter T
axes
(78
.78
)(9
.51)
(36
.47)
(173
.87)
(171
.31)
(0.6
2)(8
.69
)0
.32
(0.0
5)
(6.0
5)
LP
rop
osed
Div
iden
d-
--
--
--
--
-
M%
of
shar
ehol
din
g10
0.0
0%
100
.00
%10
0.0
0%
100
.00
%9
0.0
0%
100
.00
%10
0.0
0%
100
.00
%10
0.0
0%
100
.00
%
` in
cro
res
Nam
e of
the
Sub
sidi
ary
Low
er
Hu
tch
inso
n M
iner
als
LLC
Mea
dow
C
reek
M
iner
als
LLC
Keen
an
Min
eral
s LL
CH
utc
hin
son
Min
eral
s LL
CPe
ace
Leas
ing
LLC
R.C
. Min
eral
s LL
CP
ure
st
Ener
gy
LLC
JSW
Pan
ama
hol
din
gs
Cor
por
atio
n
Inve
rsio
nes
Eu
rosh
Li
mit
ada
San
ta F
e M
inin
g
AR
epor
tin
g C
urr
ency
US
DU
SD
US
DU
SD
US
DU
SD
US
DU
SD
US
DU
SD
BEx
chan
ge
rate
65
.04
65
.04
65
.04
65
.04
65
.04
65
.04
65
.04
65
.04
65
.04
65
.04
CS
har
e C
apit
al10
.54
26.4
33
.50
33
.22
-5
0.2
58
0.3
30
.65
0.2
912
.79
DR
eser
ves
and
Su
rplu
s(1
9.9
6)
(71.
22)
(7.5
0)
(47.
98
)(0
.19
)(6
0.3
3)
(14
1.3
3)
36
.38
(579
.32)
(20
3.9
4)
ETo
tal A
sset
s0
.09
0.1
3-
0.0
1-
--
37.0
43
68
.89
181.
62
FTo
tal L
iab
iliti
es9
.51
44
.92
4.0
014
.77
0.1
910
.08
61.
00
0.0
19
47.9
237
2.77
GIn
vest
men
t-
--
--
--
0.2
78
.95
-
HTu
rnov
er-
--
--
--
--
-
IP
rofi
ts /
(Lo
sses
) b
efor
e Ta
xes
(0.2
1)0
.01
-(0
.05
)-
--
1.19
(33
.04
)(1
12.3
0)
JP
rovi
sion
for
Tax
atio
n-
--
--
--
--
-
KP
rofi
ts /
(Lo
sses
) af
ter T
axes
(0.2
1)0
.01
-(0
.05
)-
--
1.19
(33
.04
)(1
12.3
0)
LP
rop
osed
Div
iden
d-
--
--
--
--
-
M%
of
shar
ehol
din
g10
0.0
0%
100
.00
%10
0.0
0%
100
.00
%10
0.0
0%
100
.00
%10
0.0
0%
100
.00
%10
0.0
0%
70.0
0%

406
JSW Steel Limited | Integrated Report 2017-18
Form
AO
C-I
(C
onti
nued
)`
in c
rore
s
Nam
e of
the
Sub
sidi
ary
San
ta F
e P
uer
to S
.A.
JSW
Nat
ura
l R
esou
rces
Li
mit
ed
JSW
Nat
ura
l R
esou
rces
M
ozam
biq
ue
Lda
JSW
AD
MS
C
arvo
Ld
aN
ipp
on Is
pat
S
ing
apor
e (P
TE)
Lim
ited
Ari
ma
Hol
din
gs
Lim
ited
Ereb
us
Lim
ited
Lake
lan
d S
ecu
riti
es
Lim
ited
JSW
Ste
el
Pro
cess
ing
Cen
tres
Li
mit
ed
JSW
Ben
gal
S
teel
Lim
ited
AR
epor
tin
g C
urr
ency
US
DU
SD
US
DU
SD
SG
DU
SD
US
DU
SD
INR
INR
BEx
chan
ge
rate
65
.04
65
.04
65
.04
65
.04
49
.66
65
.04
65
.04
65
.04
1.0
01.
00
CS
har
e C
apit
al0
.32
88
.82
122.
34
-3
.90
32.
7814
0.1
20
.23
50
.00
45
3.9
2
DR
eser
ves
and
Su
rplu
s(1
1.6
4)
(37.
57)
(97.
77)
0.4
1(8
.77)
(32.
92)
(14
0.2
6)
(0.3
7)14
3.7
6(6
.60
)
ETo
tal A
sset
s-
195
.11
96
.84
75.4
9-
0.0
60
.06
0.0
621
9.0
34
69
.10
FTo
tal L
iab
iliti
es11
.32
143
.86
72.2
775
.08
4.8
70
.20
0.2
00
.20
25.2
721
.78
GIn
vest
men
t-
122.
34
6.9
6-
--
--
-13
6.5
2
HTu
rnov
er-
--
--
--
-5
6.3
5-
IP
rofi
ts /
(Lo
sses
) b
efor
e Ta
xes
-(6
.58
)0
.02
(0.0
3)
-(0
.06
)(0
.06
)(0
.06
)3
4.0
4(7
.16
)
JP
rovi
sion
for
Tax
atio
n-
--
--
--
-12
.99
0.2
6
KP
rofi
ts /
(Lo
sses
) af
ter T
axes
-(6
.58
)0
.02
(0.0
3)
-(0
.06
)(0
.06
)(0
.06
)21
.05
(7.4
2)
LP
rop
osed
Div
iden
d-
--
--
--
-15
0.0
0%
-
M%
of
shar
ehol
din
g70
.00
%10
0.0
0%
100
.00
%10
0.0
0%
100
.00
%10
0.0
0%
100
.00
%10
0.0
0%
100
.00
%9
8.6
8%
` in
cro
res
Nam
e of
the
Sub
sidi
ary
JSW
Nat
ura
l R
esou
rces
In
dia
Lim
ited
JSW
En
erg
y (B
eng
al)
Lim
ited
JSW
Nat
ura
l R
esou
rces
B
eng
al
Lim
ited
Am
ba
Riv
er
Cok
e Li
mit
edJS
W
Jhar
khan
d S
teel
Lim
ited
Ped
dar
R
ealt
y P
riva
te
Lim
ited
JSW
Ste
el
Coa
ted
Pro
du
cts
Lim
ited
JSW
Ste
el
(Sal
av)
Lim
ited
Dol
vi
Min
eral
s &
Met
als
Pri
vate
Li
mit
ed
Dol
vi C
oke
Pro
ject
s Li
mit
ed
AR
epor
tin
g C
urr
ency
INR
INR
INR
INR
INR
INR
INR
INR
INR
INR
BEx
chan
ge
rate
1.0
01.
00
1.0
01.
00
1.0
01.
00
1.0
01.
00
1.0
01.
00
CS
har
e C
apit
al10
7.0
629
.46
63
.94
93
1.9
08
3.7
90
.01
50
.05
1,3
34
.86
100
.01
750
.30
DR
eser
ves
and
Su
rplu
s(4
.58
)(6
.01)
(3.4
7)57
9.7
4(6
.82)
(34
.14
)1,
66
2.9
8(9
61.
28)
(270
.49
)(1
4.8
5)
ETo
tal A
sset
s10
2.67
98
.88
60
.68
3,8
08
.91
77.9
812
2.4
24
,687
.61
1,4
80
.15
90
0.0
21,7
95
.15
FTo
tal L
iab
iliti
es0
.19
75.4
30
.21
2,29
7.27
1.0
115
6.5
52,
974
.58
1,10
6.5
71,
070
.50
1,0
59
.70
GIn
vest
men
t-
63
.94
-4
1.9
2-
-3
5.8
4-
--
HTu
rnov
er-
--
4,6
68
.19
--
12,5
34
.01
1,3
23.4
414
.82
-
IP
rofi
ts /
(Lo
sses
) b
efor
e Ta
xes
(0.2
6)
(0.1
0)
(0.4
6)
261.
90
(3.6
0)
(11.
04
)4
19.9
347
.56
(10
8.8
5)
(2.6
8)
JP
rovi
sion
for
Tax
atio
n-
--
93
.12
0.0
10
.52
144
.89
12.6
0-
0.0
8
KP
rofi
ts /
(Lo
sses
) af
ter T
axes
(0.2
6)
(0.1
0)
(0.4
6)
168
.78
(3.6
1)(1
1.5
6)
275
.04
34
.96
(10
8.8
5)
(2.7
6)
LP
rop
osed
Div
iden
d-
--
--
--
--
-
M%
of
shar
ehol
din
g9
8.6
8%
98
.68
%9
8.6
8%
100
.00
%10
0.0
0%
100
.00
%10
0.0
0%
100
.00
%4
0.0
0%
40
.00
%

407
Better Everyday. In Pursuit of Excellence. Corporate Overview Statutory Reports Financial Statements
Form
AO
C-I
(C
onti
nued
)`
in c
rore
s
Nam
e of
the
Sub
sidi
ary
JSW
Rea
lty
&
Infr
astr
uct
ure
P
vt L
td.
JSW
Ind
ust
rial
G
ases
Pri
vate
Li
mit
ed
JSW
Utk
al S
teel
Li
mit
edH
asau
d S
teel
Li
mit
edM
illor
et S
teel
Li
mit
edC
reix
ent
Sp
ecia
l Ste
els
Lim
ited
AR
epor
tin
g C
urr
ency
INR
INR
INR
INR
INR
INR
BEx
chan
ge
rate
1.0
01.
00
1.0
01.
00
1.0
01.
00
CS
har
e C
apit
al0
.01
92.
08
0.5
0-
--
DR
eser
ves
and
Su
rplu
s3
2.19
278
.19
(2.0
3)
0.0
1-
0.0
2
ETo
tal A
sset
s3
86
.28
419
.11
16.0
30
.01
-0
.02
FTo
tal L
iab
iliti
es3
54
.08
48
.84
17.5
6-
--
GIn
vest
men
t-
208
.87
--
--
HTu
rnov
er3
0.4
05
51.
85
--
--
IP
rofi
ts /
(Lo
sses
) b
efor
e Ta
xes
(84
.12)
49
.24
(2.0
3)
--
-
JP
rovi
sion
for
Tax
atio
n5
.62
16.5
6-
--
-
KP
rofi
ts /
(Lo
sses
) af
ter T
axes
(89
.74
)3
2.6
8(2
.03
)-
--
LP
rop
osed
Div
iden
d-
135
.00
%-
--
-
M%
of
shar
ehol
din
g0
.00
%10
0.0
0%
100
.00
%10
0.0
0%
100
.00
%10
0.0
0%
Not
e: T
he
fin
anci
al s
tate
men
ts o
f su
bsi
dia
ries
are
con
vert
ed in
to In
dia
n R
up
ees
on t
he
bas
is o
f ex
chan
ge
rate
as
on c
losi
ng
day
of
the
fin
anci
al y
ear.
Addi
tion
al d
iscl
osur
e N
ame
of s
ubsi
diar
ies
Su
bsi
dia
ries
yet
to
com
men
ce o
per
atio
n J
SW
Ben
gal
Ste
el L
imit
ed
JS
W N
atu
ral R
esou
rces
Ind
ia L
imit
ed
J
SW
En
erg
y (B
eng
al)
Lim
ited
J
SW
Nat
ura
l Res
ourc
es B
eng
al L
imit
ed
J
SW
Jh
arkh
and
Ste
el L
imit
ed
Inve
rsio
nes
Eu
rosh
Lim
itad
a
San
ta F
e P
uer
to S
.A.
JS
W N
atu
ral R
esou
rces
Moz
amb
iqu
e Ld
a
JS
W A
DM
S C
arvo
Ld
a
Dol
vi C
oke
Pro
ject
s Li
mit
ed
J
SW
Utk
al S
teel
Lim
ited
Has
aud
Ste
el L
imit
ed
M
illor
et S
teel
Lim
ited
C
reix
ent
Sp
ecia
l Ste
els
Lim
ited
Su
bsi
dia
ries
liq
uid
ated
or
sold
du
rin
g t
he
year
Non
e

408
JSW Steel Limited | Integrated Report 2017-18
Form
AO
C-I
(C
onti
nued
)Pa
rt B
: Ass
ocia
tes
and
Join
t Ve
ntur
es`
in c
rore
s
Nam
e of
Ass
ocia
tes/
Join
t Ve
ntur
esJo
int
vent
ure
s
Vija
ynag
ar
Min
eral
s P
riva
te L
imit
ed
Roh
ne
Coa
l C
omp
any
Pri
vate
Lim
ited
JSW
Sev
erfi
eld
Str
uct
ure
s Li
mit
ed
JSW
Str
uct
ura
l M
etal
Dec
kin
g Li
mit
ed
Gou
ran
gd
ih
Coa
l Lim
ited
JSW
MI S
ervi
ce
cent
re P
riva
te
Lim
ited
JSW
Val
lab
h Ti
np
late
P
riva
te L
imit
ed
Geo
Ste
el L
LCAc
ciai
talia
S
.P.A
.
1.
Late
st a
ud
ited
Bal
ance
Sh
eet
Dat
e3
1 M
arch
20
183
1 M
arch
20
183
1 M
arch
20
183
1 M
arch
20
183
1 M
arch
20
163
1 M
arch
20
183
1 M
arch
20
183
1 D
ecem
ber
2017
31
Dec
embe
r 20
17
2.
Sh
ares
of
Ass
ocia
te/J
oint
Ve
ntu
res
hel
d b
y th
e C
omp
any
on
the
year
en
d
Nu
mb
er o
f sh
ares
4,0
00
49
0,0
00
160
,437
,94
04
,48
2,9
252,
45
0,0
00
66
,50
0,0
00
25,0
19,6
00
-17
,675
A
mou
nt o
f In
vest
men
t-
0.4
916
0.4
44
.48
2.4
56
6.5
03
0.0
025
.94
12.3
2
Ex
ten
d o
f H
old
ing
%4
0.0
0%
49
.00
%5
0.0
0%
33
.33
%5
0.0
0%
50
.00
%5
0.0
0%
49
.00
%3
5.0
0%
3.
Des
crip
tion
of
how
th
ere
is
sig
nif
ican
t in
flu
ence
Jo
int
Vent
ure
Ag
reem
ent
4.
Rea
son
why
th
e as
soci
ate/
join
t ve
ntu
re is
not
con
solid
ated
NA
NA
NA
NA
NA
NA
NA
NA
NA
5.
Net
wor
th a
ttri
bu
tab
le t
o S
har
ehol
din
g a
s p
er la
test
au
dit
ed
Bal
ance
Sh
eet
1.9
11.
55
83
.16
2.6
51.7
274
.11
31.
02
167.
85
0.6
9
6.
Pro
fit
/ Lo
ss f
or t
he
year
i.
Con
sid
ered
in C
onso
lidat
ion
(0.0
7)-
5.0
70
.03
(0.0
1)5
.47
(1.0
5)
41.
15(1
3.1
8)
ii.
Not
Con
sid
ered
in C
onso
lidat
ion
-(0
.29
)-
--
--
--
Addi
tion
al d
iscl
osur
e N
ame
of a
ssoc
iate
s an
d Jo
int
Vent
ures
Ass
ocia
tes
an
d J
oint
Ven
ture
s ye
t to
com
men
ce o
per
atio
nR
ohn
e C
oal C
omp
any
Pri
vate
Lim
ited
Gou
ran
gd
ih C
oal L
imit
ed
Ass
ocia
tes
and
Joi
nt V
entu
res
liqu
idat
ed o
r sol
d d
uri
ng
th
e ye
ar N
one
For a
nd
on
beh
alf
of t
he
Boa
rd o
f D
irec
tors
Saj
jan
Jin
dal
Ch
airm
an &
Man
agin
g D
irec
tor
DIN
00
017
762
Lan
cy V
arg
hes
eR
ajee
v Pa
iS
esh
agir
i Rao
M.V
.S.
Com
pan
y S
ecre
tary
Ch
ief
Fin
anci
al O
ffic
erJt
. Man
agin
g D
irec
tor &
Gro
up
CFO
ICS
I Mem
ber
ship
No.
FC
S 9
40
7D
IN 0
00
29
136
Pla
ce: M
um
bai
Dat
e: 1
6 M
ay 2
018

409
Better Everyday. In Pursuit of Excellence. Corporate Overview Statutory Reports Financial Statements
Financial Highlights (Standalone)
2013-14(IGAAP)
2014-15(IGAAP)
2015-16(IND-AS)
2016-17(IND-AS)
2017-18(IND-AS)
REVENUE ACCOUNTS (` in crores)
Gross Turnover 48,527 49,658 40,354 56,244 65,046
Net Turnover 44,529 45,352 36,202 51,621 63,787
Operating EBIDTA 8,783 8,872 6,369 11,544 13,741
Depreciation and Amortization 2,726 2,785 2,847 3,025 3,054
Finance Costs 2,740 2,909 3,219 3,643 3,591
Exceptional Items 1,692 396 5,860 - 234
Profit Before Taxes 1,955 3,249 (5,239) 5,131 7,075
Provision for Taxation 621 1,082 (1,710) 1,554 2,450
Profit after Taxes 1,335 2,166 (3,530) 3,577 4,625
CAPITAL ACCOUNTS (` in crores)
Net Fixed Asset 37,295 38,569 46,560 50,266 49,568
Debt* 27,184 28,134 35,658 38,273 36,181
Net Debt* 26,651 26,339 35,059 36,946 35,580
Equity Capital 242 242 240 240 241
Other Equity (Reserve & Surplus) 23,217 24,657 20,109 23,797 27,605
Shareholders' Funds 24,284 25,725 20,410 24,098 27,907
RATIOS
Book Value Per Share (`) 97.30 103.26 84.44 99.69 115.45
Market price Per Share (`) 103.61 90.66 128.33 188.20 288.15
Earning per Share (Diluted) (`) 5.39 8.82 (14.75) 14.80 19.14
Market Capitalisation (` in crores) 25,044 21,913 31,019 45,492 69,652
Equity Dividend per Share (`) 1.10 1.10 0.75 2.25 3.20
Fixed Assets Turnover Ratio 1.19 1.18 0.78 1.03 1.29
Operating EBIDTA Margin 19.4% 19.2% 17.4% 22.1% 21.1%
Interest Service Coverage Ratio 2.47 3.40 2.17 3.38 4.05
Net Debt Equity Ratio 1.10 1.02 1.71 1.53 1.27
Net Debt to EBIDTA 3.03 2.97 5.50 3.20 2.59
* Excluding Acceptance

410
JSW Steel Limited | Integrated Report 2017-18
Financial Highlights (Consolidated)
2013-14(IGAAP)
2014-15(IGAAP)
2015-16(IND-AS)
2016-17(IND-AS)
2017-18(IND-AS)
REVENUE ACCOUNTS (` in crores)
Gross Turnover 54,621 56,572 45,288 59,560 70,091
Net Turnover 50,409 52,051 40,858 54,628 68,813
Operating EBIDTA 9,165 9,402 6,401 12,174 14,794
Depreciation and Amortization 3,183 3,434 3,323 3,430 3,387
Finance Costs 3,048 3,493 3,601 3,768 3,701
Exceptional Items 1,713 47 2,125 - 264
Profit Before Taxes 1,308 2,539 (2,468) 5,128 7,609
Provision for Taxation 920 819 (1,966) 1,674 1,538
Profit after Taxes 452 1,797 (481) 3,467 6,113
CAPITAL ACCOUNTS (` in crores)
Net Fixed Asset 45,484 50,591 55,185 57,858 57,141
Debt* 34,762 37,990 42,204 43,334 39,393
Net Debt* 34,014 35,808 41,184 41,549 38,019
Equity Capital 242 242 240 240 241
Other Equity (Reserve & Surplus) 20,871 21,987 18,665 22,346 27,696
Shareholders' Funds 21,938 23,054 18,771 22,401 27,534
RATIOS
Book Value Per Share (`) 87.60 92.21 77.65 92.67 113.91
Market price Per Share (`) 103.61 90.66 128.33 188.20 288.15
Earning per Share (Diluted) (`) 1.74 7.29 (1.40) 14.58 25.71
Market Capitalisation (` in crores) 25,044 21,913 31,019 45,492 69,652
Equity Dividend per Share (`) 1.10 1.10 0.75 2.25 3.20
Fixed Assets Turnover Ratio 1.11 1.03 0.74 0.94 1.20
Operating EBIDTA Margin 17.9% 17.7% 15.4% 21.9% 21.1%
Interest Service Coverage Ratio 2.01 1.75 1.84 3.34 4.15
Net Debt Equity Ratio 1.54 1.55 2.18 1.85 1.38
Net Debt to EBIDTA 3.71 3.81 6.39 3.41 2.57
* Excluding Acceptance

Notes

Notes


If undelivered, please return to:
JSW Steel LimitedJSW Centre,Bandra-Kurla Complex,Bandra (E), Mumbai - 400 051
Tel: 022 4286 1000Fax: 022 4286 3000
CIN: L27102MH1994PLC152925
www.jsw.in